UNITED STATES
SECURITIES AND EXCHANGE COMMISSION
Washington, D.C. 20549
FORM N-CSR
CERTIFIED SHAREHOLDER REPORT OF REGISTERED
MANAGEMENT INVESTMENT COMPANIES
Investment Company Act file number | 811-04015 |
|
Eaton Vance Mutual Funds Trust |
(Exact name of registrant as specified in charter) |
|
The Eaton Vance Building, 255 State Street, Boston, Massachusetts | | 02109 |
(Address of principal executive offices) | | (Zip code) |
|
Alan R. Dynner The Eaton Vance Building, 255 State Street, Boston, Massachusetts 02109 |
(Name and address of agent for service) |
|
Registrant’s telephone number, including area code: | (617) 482-8260 | |
|
Date of fiscal year end: | October 31 | |
|
Date of reporting period: | October 31, 2005 | |
| | | | | | | | |
Item 1. Reports to Stockholders

Annual Report October 31, 2005


EATON VANCE
TAX-MANAGED
EQUITY ASSET
ALLOCATION
FUND
IMPORTANT NOTICES REGARDING PRIVACY,
DELIVERY OF SHAREHOLDER DOCUMENTS,
PORTFOLIO HOLDINGS AND PROXY VOTING
Privacy. The Eaton Vance organization is committed to ensuring your financial privacy. Each of the financial institutions identified below has in effect the following policy ("Privacy Policy") with respect to nonpublic personal information about its customers:
• Only such information received from you, through application forms or otherwise, and information about your Eaton Vance fund transactions will be collected. This may include information such as name, address, social security number, tax status, account balances and transactions.
• None of such information about you (or former customers) will be disclosed to anyone, except as permitted by law (which includes disclosure to employees necessary to service your account). In the normal course of servicing a customer's account, Eaton Vance may share information with unaffiliated third parties that perform various required services such as transfer agents, custodians and broker/dealers.
• Policies and procedures (including physical, electronic and procedural safeguards) are in place that are designed to protect the confidentiality of such information.
• We reserve the right to change our Privacy Policy at any time upon proper notification to you. Customers may want to review our Policy periodically for changes by accessing the link on our homepage: www.eatonvance.com.
Our pledge of privacy applies to the following entities within the Eaton Vance organization: the Eaton Vance Family of Funds, Eaton Vance Management, Eaton Vance Investment Counsel, Boston Management and Research, and Eaton Vance Distributors, Inc.
In addition, our Privacy Policy only applies to those Eaton Vance customers who are individuals and who have a direct relationship with us. If a customer's account (i.e., fund shares) is held in the name of a third-party financial adviser/ broker-dealer, it is likely that only such adviser's privacy policies apply to the customer. This notice supersedes all previously issued privacy disclosures.
For more information about Eaton Vance's Privacy Policy, please call 1-800-262-1122.
Delivery of Shareholder Documents. The Securities and Exchange Commission (the "SEC") permits funds to deliver only one copy of shareholder documents, including prospectuses, proxy statements and shareholder reports, to fund investors with multiple accounts at the same residential or post office box address. This practice is often called "householding" and it helps eliminate duplicate mailings to shareholders.
Eaton Vance, or your financial adviser, may household the mailing of your documents indefinitely unless you instruct Eaton Vance, or your financial adviser, otherwise.
If you would prefer that your Eaton Vance documents not be householded, please contact Eaton Vance at 1-800-262-1122, or contact your financial adviser.
Your instructions that householding not apply to delivery of your Eaton Vance documents will be effective within 30 days of receipt by Eaton Vance or your financial adviser.
Portfolio Holdings. The Fund and its underlying Portfolio (if applicable) will file a schedule of its portfolio holdings on Form N-Q with the SEC for the first and third quarters of each fiscal year. The Form N-Q will be available on the Eaton Vance website www.eatonvance.com, by calling Eaton Vance at 1-800-262-1122 or in the EDGAR database on the SEC's website at www.sec.gov. Form N-Q may also be reviewed and copied at the SEC's public reference room in Washington, D.C. (call 1-800-732-0330 for information on the operation of the public reference room).
Proxy Voting. From time to time, funds are required to vote proxies related to the securities held by the funds. The Eaton Vance Funds or their underlying Portfolios (if applicable) vote proxies according to a set of policies and procedures approved by the Funds' and Portfolios' Boards. You may obtain a description of these policies and procedures and information on how the Funds or Portfolios voted proxies relating to portfolio securities during the most recent 12 month period ended June 30, without charge, upon request, by calling 1-800-262-1122. This description is also available on the SEC's website at www.sec.gov.
Eaton Vance Tax-Managed Equity Asset Allocation Fund as of October 31, 2005
MANAGEMENT’S DISCUSSION OF FUND PERFORMANCE

Duncan W. Richardson, CFA
Portfolio Manager
The Fund
Performance for the Past Year
• For the year ended October 31, 2005, the Fund’s Class A shares had a total return of 12.14%. This return was the result of an increase in net asset value (NAV) per share to $12.10 on October 31, 2005, from $10.79 on October 31, 2004.(1)
• The Fund’s Class B shares had a total return of 11.32% for the same period, the result of an increase in NAV per share to $11.80 from $10.60.(1)
• The Fund’s Class C shares had a total return of 11.34% for the same period, the result of an increase in NAV per share to $11.78 from $10.58.(1)
• For comparison, the Russell 3000 Index, a broadbased, unmanaged market index of 3000 U.S. stocks, had a total return of 10.60% during the same period.(2)
See pages 3 and 4 for more performance information, including after-tax returns.
Management Discussion
• Although business spending and corporate earnings growth remained healthy during the year ended October 31, 2005, the spike in energy costs, exacerbated by two catastrophic Gulf Coast hurricanes, and higher short-term interest rates dampened activity. Equity market leadership during this period can be characterized as commodity-driven, defensive and interest rate sensitive. On average, higher-yielding investments outperformed more aggressive stocks, and small- and mid-cap stocks continued to lead large-cap holdings.
• In this environment, the Fund outperformed its benchmark, the Russell 3000 Index.(2) The Fund’s performance is a function of both the performance of the underlying Portfolios, and its asset allocation among the Portfolios. The Fund benefited from its continued emphasis of small- and mid-cap investments, as well as an overweight exposure to international securities, which on average outpaced domestic investments.
• In February of this year, management decided to gradually reallocate approximately 2.5% of the Fund’s assets from Tax-Managed Small-Cap Value Portfolio into Tax-Managed Multi-Cap Opportunity Portfolio. This shift added to the Fund’s performance, as mid-cap growth stocks (characterized by the Russell Mid-Cap Growth Index) on average outperformed small-cap value investments (Russell 2000 Value) in the ensuing period.(2) The Fund retains its emphasis of growth stocks over value. Although the value-style continued to dominate growth during the last year, the performance gap between the two is narrowing.
• Returns among investment classes and styles continue to be unpredictable, validating the benefits of a strategy that emphasizes broad diversification and continuous rebalancing. We believe that through careful asset allocation and the ongoing research supporting each Portfolio, the Fund can provide a solid investment vehicle for tax-sensitive investors seeking broad equity exposure with moderate volatility and high-tax efficiency.
The views expressed throughout this report are those of the portfolio manager and are current only through the end of the period of the report as stated on the cover. These views are subject to change at any time based upon market or other conditions, and the investment adviser disclaims any responsibility to update such views. These views may not be relied on as investment advice and, because investment decisions for a fund are based on many factors, may not be relied on as an indication of trading intent on behalf of any Eaton Vance fund.
Past performance is no guarantee of future results. Returns are historical and are calculated by determining the percentage change in net asset value or offering price (as applicable) with all distributions reinvested. Investment return and principal value will fluctuate so that shares, when redeemed, may be worth more or less than their original cost. Performance is for stated time period only; due to market volatility, the Fund’s current performance may be lower or higher than the quoted return. For performance as of the most recent month end, please refer to www.eatonvance.com.
(1) These returns do not include the 5.75% maximum sales charge for Class A shares or the applicable contingent deferred sales charge (CDSC) for Class B and Class C shares. If sales charges were deducted, the returns would be lower.
(2) It is not possible to invest directly in an Index. The Indexes’ total return does not reflect commissions or expenses that would have been incurred if an investor individually purchased or sold the securities represented in an Index.
Fund shares are not insured by the FDIC and are not deposits or other obligations of, or guaranteed by, any depository institution. Shares are subject to investment risks, including possible loss of principal invested.
2
Eaton Vance Tax-Managed Equity Asset Allocation Fund as of October 31, 2005
FUND PERFORMANCE
The line graphs and table set forth below provide information about the Fund’s performance. The line graphs compare the performance of Class A, Class B, and Class C of the Fund with that of the Russell 3000 Index, a broad-based, unmanaged market index of 3000 U.S. stocks. The lines on the graph represent the total returns of a hypothetical investment of $10,000 in each of Class A, Class B, and Class C of the Fund and the Russell 3000 Index. Class A total returns are presented at net asset value and maximum public offering price. The table includes the total returns of each Class of the Fund at net asset value and public offering price. The performance presented below does not reflect the deduction of taxes, if any, that a shareholder would pay on distributions or redemptions of Fund shares.
Performance * | | Class A | | Class B | | Class C | |
Average Annual Total Returns (at net asset value) | | | | | | | |
One Year | | 12.14 | % | 11.32 | % | 11.34 | % |
Life of Fund† | | 5.33 | % | 4.61 | % | 4.56 | % |
SEC Average Annual Total Returns (including sales charge or applicable CDSC) | | | | | |
One Year | | 5.68 | % | 6.32 | % | 10.34 | % |
Life of Fund† | | 3.65 | % | 3.88 | % | 4.56 | % |
†Inception Dates – Class A: 3/4/02; Class B: 3/4/02; Class C: 3/4/02
* Average annual total returns do not include the 5.75% maximum sales charge for Class A shares or the applicable contingent deferred sales charge (CDSC) for Class B and Class C shares. If sales charges were deducted, the returns would be lower. SEC average annual total returns for Class A reflect the maximum 5.75% sales charge. SEC returns for Class B shares reflect the applicable CDSC based on the following schedule: 5% - 1st and 2nd years; 4% - 3rd year; 3% - 4th year; 2% - 5th year; 1% - 6th year. SEC 1-year return for Class C reflects a 1% CDSC.
Past performance is no guarantee of future results. Returns are historical and are calculated by determining the percentage change in net asset value or offering price (as applicable) with all distributions reinvested. Investment return and principal value will fluctuate so that shares, when redeemed, may be worth more or less than their original cost. Performance is for the stated time period only; due to market volatility, the Fund’s current performance may be lower or higher than the quoted return. For performance as of the most recent month-end, please refer to www.eatonvance.com.
Current Target Allocations †† By total Investments
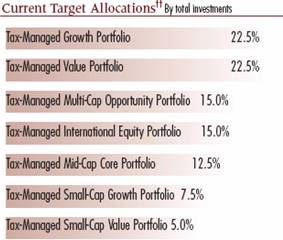
†† Fund information may not be representative of the Fund’s current or future investments and may change due to active management. You may obtain free copies of each of the Portfolios’ most recent financial statements by contacting Eaton Vance Distributors, Inc. at 1-800-225-6265 or from the EDGAR database on the Securities and Exchange Commission’s website (www.sec.gov).
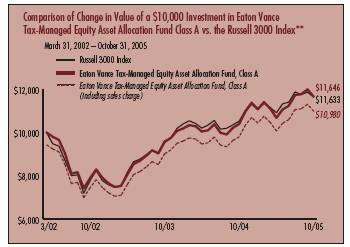
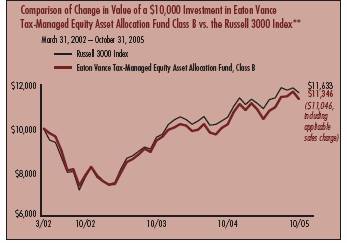
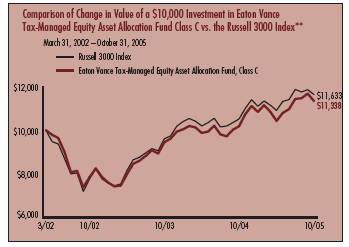
**Source: Thomson Financial. Class A, Class B, and Class C of the Fund commenced investment operations on 3/4/02. It is not possible to invest directly in an Index. The Index’s total returns do not reflect commissions or expenses that would have been incurred if an investor individually purchased or sold the securities represented in the Index.
3
“Return Before Taxes” does not take into consideration shareholder taxes. It is most relevant to tax-free or tax-deferred shareholder accounts. “Return After Taxes on Distributions” reflects the impact of federal income taxes due on Fund distributions of dividends and capital gains. It is most relevant to taxpaying shareholders who continue to hold their shares. “Return After Taxes on Distributions and Sale of Fund Shares” also reflects the impact of taxes on capital gain or loss realized upon a sale of shares. It is most relevant to taxpaying shareholders who sell their shares.
Average Annual Total Returns
(For the periods ended October 31, 2005)
Returns at Net Asset Value (NAV) (Class A)
| | One Year | | Life of Fund | |
| | | | | |
Return Before Taxes | | 12.14 | % | 5.33 | % |
Return After Taxes on Distributions | | 12.14 | % | 5.33 | % |
Return After Taxes on Distributions and Sale of Fund Shares | | 7.89 | % | 4.58 | % |
Returns at Public Offering Price (POP) (Class A)
| | One Year | | Life of Fund | |
| | | | | |
Return Before Taxes | | 5.68 | % | 3.65 | % |
Return After Taxes on Distributions | | 5.68 | % | 3.65 | % |
Return After Taxes on Distributions and Sale of Fund Shares | | 3.69 | % | 3.12 | % |
Average Annual Total Returns
(For the periods ended October 31, 2005)
Returns at Net Asset Value (NAV) (Class C)
| | One Year | | Life of Fund | |
| | | | | |
Return Before Taxes | | 11.34 | % | 4.56 | % |
Return After Taxes on Distributions | | 11.34 | % | 4.56 | % |
Return After Taxes on Distributions and Sale of Fund Shares | | 7.37 | % | 3.91 | % |
Returns at Public Offering Price (POP) (Class C)
| | One Year | | Life of Fund | |
| | | | | |
Return Before Taxes | | 10.34 | % | 4.56 | % |
Return After Taxes on Distributions | | 10.34 | % | 4.56 | % |
Return After Taxes on Distributions and Sale of Fund Shares | | 6.72 | % | 3.91 | % |
Average Annual Total Returns
(For the periods ended October 31, 2005)
Returns at Net Asset Value (NAV) (Class B)
| | One Year | | Life of Fund | |
| | | | | |
Return Before Taxes | | 11.32 | % | 4.61 | % |
Return After Taxes on Distributions | | 11.32 | % | 4.61 | % |
Return After Taxes on Distributions and Sale of Fund Shares | | 7.36 | % | 3.96 | % |
Returns at Public Offering Price (POP) (Class B)
| | One Year | | Life of Fund | |
| | | | | |
Return Before Taxes | | 6.32 | % | 3.88 | % |
Return After Taxes on Distributions | | 6.32 | % | 3.88 | % |
Return After Taxes on Distributions and Sale of Fund Shares | | 4.11 | % | 3.32 | % |
Class A, Class B, and Class C of the Fund commenced investment operations on 3/4/02. Returns at Public Offering Price (POP) reflect the deduction of the maximum initial sales charge or applicable CDSC, while Returns at Net Asset Value (NAV) do not.
After-tax returns are calculated using the highest historical individual federal income tax rate and do not reflect the impact of state and local taxes. Actual after-tax returns depend on a shareholder’s tax situation and may differ from those shown. After-tax returns are not relevant for shareholders who hold shares in tax-deferred accounts or to shares held by non-taxable entities. Return After Taxes on Distributions for a period may be the same as Return Before Taxes for that period because no distributions were paid during that period, or because the taxable portion of distributions made during the period was insignificant. Also, Return After Taxes on Distributions and Sale of Fund Shares for a period may be greater than Return After Taxes on Distributions for the same period because of realized losses on the sale of Fund shares.
Past performance is no guarantee of future results. Returns are historical and are calculated by determining the percentage change in net asset value or offering price (as applicable) with all distributions reinvested. Investment return and principal value will fluctuate so that shares, when redeemed, may be worth more or less than their original cost. Performance is for the stated time period only; due to market volatility, the Fund’s current performance may be lower or higher than the quoted return. For performance as of the most recent month-end, please refer to www.eatonvance.com.
4
Eaton Vance Tax-Managed Equity Asset Allocation Fund as of October 31, 2005
FUND EXPENSES
Example: As a shareholder of the Fund, you incur two types of costs: (1) transaction costs, including sales charges (loads) on purchases and redemption fees (if applicable); and (2) ongoing costs, including management fees; distribution or service fees; and other Fund expenses. This Example is intended to help you understand your ongoing costs (in dollars) of investing in the Fund and to compare these costs with the ongoing costs of investing in other mutual funds. The Example is based on an investment of $1,000 invested at the beginning of the period and held for the entire period (May 1, 2005 – October 31, 2005).
Actual Expenses: The first section of the table below provides information about actual account values and actual expenses. You may use the information in this line, together with the amount you invested, to estimate the expenses that you paid over the period. Simply divide your account value by $1,000 (for example, an $8,600 account value divided by $1,000 = 8.6), then multiply the result by the number under the heading entitled ���Expenses Paid During Period” to estimate the expenses you paid on your account during this period.
Hypothetical Example for Comparison Purposes: The second section of the table below provides information about hypothetical account values and hypothetical expenses based on the actual Fund expense ratio and an assumed rate of return of 5% per year (before expenses), which is not the actual return of the Fund. The hypothetical account values and expenses may not be used to estimate the actual ending account balance or expenses you paid for the period. You may use this information to compare the ongoing costs of investing in your Fund and other funds. To do so, compare this 5% hypothetical example with the 5% hypothetical examples that appear in the shareholder reports of the other funds.
Please note that the expenses shown in the table are meant to highlight your ongoing costs only and do not reflect any transactional costs, such as sales charges (loads) or redemption fees (if applicable). Therefore, the second section of the table is useful in comparing ongoing costs only, and will not help you determine the relative total costs of owning different funds. In addition, if these transactional costs were included, your costs would have been higher.
Eaton Vance Tax-Managed Equity Asset Allocation Fund
| | Beginning Account Value | | Ending Account Value | | Expenses Paid During Period* | |
| | (5/1/05) | | (10/31/05) | | (5/1/05 – 10/31/05) | |
| | | | | | | |
Actual | | | | | | | |
Class A | | $ | 1,000.00 | | $ | 1,091.10 | | $ | 7.48 | |
Class B | | $ | 1,000.00 | | $ | 1,087.60 | | $ | 11.42 | |
Class C | | $ | 1,000.00 | | $ | 1,087.70 | | $ | 11.42 | |
| | | | | | | |
Hypothetical | | | | | | | |
(5% return per year before expenses) | | | | | | | |
Class A | | $ | 1,000.00 | | $ | 1,018.00 | | $ | 7.22 | |
Class B | | $ | 1,000.00 | | $ | 1,014.30 | | $ | 11.02 | |
Class C | | $ | 1,000.00 | | $ | 1,014.30 | | $ | 11.02 | |
| | | | | | | | | | | | | | |
* Expenses are equal to the Fund’s annualized expense ratio of 1.42% for Class A shares, 2.17% for Class B shares, and 2.17% for Class C shares multiplied by the average account value over the period, multiplied by 184/365 (to reflect the one-half year period). The example assumes that the $1,000 was invested at the net asset value per share determined at the close of business on April 30, 2005. The Example reflects the expenses of both the Fund and the Portfolios. |
5
Eaton Vance Tax-Managed Equity Asset Allocation Fund as of October 31, 2005
FINANCIAL STATEMENTS
Statement of Assets and Liabilities
As of October 31, 2005
| Assets | |
Investment in Tax-Managed Growth Portfolio, at value
(identified cost, $91,081,914) | | $ | 101,919,134 | | |
Investment in Tax-Managed Value Portfolio, at value
(identified cost, $72,430,704) | | | 96,061,658 | | |
Investment in Tax-Managed Multi-Cap Opportunity Portfolio, at value
(identified cost, $70,984,091) | | | 77,697,258 | | |
Investment in Tax-Managed International Equity Portfolio, at value
(identified cost, $56,249,210) | | | 75,197,189 | | |
Investment in Tax-Managed Mid-Cap Core Portfolio, at value
(identified cost, $39,488,864) | | | 49,686,529 | | |
Investment in Tax-Managed Small-Cap Growth Portfolio, at value
(identified cost, $25,844,982) | | | 29,555,291 | | |
Investment in Tax-Managed Small-Cap Value Portfolio, at value
(identified cost, $13,027,680) | | | 21,504,952 | | |
| Receivable for Fund shares sold | | | 630,028 | | |
| Total assets | | $ | 452,252,039 | | |
| Liabilities | |
| Payable for Fund shares redeemed | | $ | 456,881 | | |
| Payable to affiliate for distribution and service fees | | | 272,231 | | |
| Payable to affiliate for investment adviser fee | | | 44,991 | | |
| Payable to affiliate for Trustees' fees | | | 36 | | |
| Other accrued expenses | | | 204,293 | | |
| Total liabilities | | $ | 978,432 | | |
| Net Assets | | $ | 451,273,607 | | |
| Sources of Net Assets | |
| Paid-in capital | | $ | 358,175,587 | | |
Accumulated net realized gain from Portfolios (computed on the basis of
identified cost) | | | 9,820,936 | | |
| Accumulated undistributed net investment income | | | 762,518 | | |
Net unrealized appreciation from Portfolios (computed on the basis of
identified cost) | | | 82,514,566 | | |
| Total | | $ | 451,273,607 | | |
| Class A Shares | |
| Net Assets | | $ | 169,704,471 | | |
| Shares Outstanding | | | 14,024,039 | | |
Net Asset Value and Redemption Price Per Share
(net assets ÷ shares of beneficial interest outstanding) | | $ | 12.10 | | |
Maximum Offering Price Per Share
(100 ÷ 94.25 of $12.10) | | $ | 12.84 | | |
| Class B Shares | |
| Net Assets | | $ | 123,431,453 | | |
| Shares Outstanding | | | 10,460,587 | | |
Net Asset Value, Offering Price and Redemption Price Per Share
(net assets ÷ shares of beneficial interest outstanding) | | $ | 11.80 | | |
| Class C Shares | |
| Net Assets | | $ | 158,137,683 | | |
| Shares Outstanding | | | 13,425,957 | | |
Net Asset Value, Offering Price and Redemption Price Per Share
(net assets ÷ shares of beneficial interest outstanding) | | $ | 11.78 | | |
| On sales of $50,000 or more, the offering price of Class A shares is reduced. | |
Statement of Operations
For the Year Ended
October 31, 2005
| Investment Income | |
| Dividends allocated from Portfolios (net of foreign taxes, $226,503) | | $ | 6,505,210 | | |
| Interest allocated from Portfolios | | | 225,678 | | |
| Expenses allocated from Portfolios | | | (3,299,615 | ) | |
| Net investment income from Portfolios | | $ | 3,431,273 | | |
| Expenses | |
| Investment adviser fee | | $ | 458,984 | | |
| Administration fee | | | 635,803 | | |
| Trustees' fees and expenses | | | 2,944 | | |
Distribution and service fees
Class A | | | 391,568 | | |
| Class B | | | 1,208,275 | | |
| Class C | | | 1,464,140 | | |
| Transfer and dividend disbursing agent fees | | | 354,743 | | |
| Registration fees | | | 88,055 | | |
| Legal and accounting services | | | 74,357 | | |
| Printing and postage | | | 45,859 | | |
| Custodian fee | | | 41,939 | | |
| Miscellaneous | | | 18,309 | | |
| Total expenses | | $ | 4,784,976 | | |
| Net investment loss | | $ | (1,353,703 | ) | |
Realized and Unrealized
Gain (Loss) from Portfolios | |
Net realized gain (loss) —
Investment transactions (identified cost basis) | | $ | 14,145,652 | | |
| Securities sold short | | | (155,770 | ) | |
| Foreign currency transactions | | | (139,967 | ) | |
| Net realized gain | | $ | 13,849,915 | | |
Change in unrealized appreciation (depreciation) —
Investments (identified cost basis) | | $ | 31,874,780 | | |
| Securities sold short | | | 21,974 | | |
| Foreign currency | | | (8,518 | ) | |
| Net change in unrealized appreciation (depreciation) | | $ | 31,888,236 | | |
| Net realized and unrealized gain | | $ | 45,738,151 | | |
| Net increase in net assets from operations | | $ | 44,384,448 | | |
See notes to financial statements
6
Eaton Vance Tax-Managed Equity Asset Allocation Fund as of October 31, 2005
FINANCIAL STATEMENTS CONT'D
Statements of Changes in Net Assets
Increase (Decrease)
in Net Assets | | Year Ended
October 31, 2005 | | Year Ended
October 31, 2004 | |
From operations —
Net investment loss | | $ | (1,353,703 | ) | | $ | (1,524,011 | ) | |
Net realized gain from investments,
securities sold short, foreign
currency and payment by
affiliate transactions | | | 13,849,915 | | | | 4,855,983 | | |
Net change in unrealized appreciation
(depreciation) of investments,
securities sold short and foreign currency | | | 31,888,236 | | | | 19,560,424 | | |
| Net increase in net assets from operations | | $ | 44,384,448 | | | $ | 22,892,396 | | |
Transactions in shares of beneficial interest —
Proceeds from sale of shares | |
| Class A | | $ | 42,975,393 | | | $ | 60,067,487 | | |
| Class B | | | 20,001,051 | | | | 35,938,466 | | |
| Class C | | | 37,613,007 | | | | 46,557,647 | | |
| Cost of shares redeemed | |
| Class A | | | (26,271,557 | ) | | | (17,852,992 | ) | |
| Class B | | | (16,721,504 | ) | | | (12,602,084 | ) | |
| Class C | | | (19,027,014 | ) | | | (14,442,434 | ) | |
| Net asset value of shares exchanged | |
| Class A | | | 1,863,233 | | | | 589,553 | | |
| Class B | | | (1,863,233 | ) | | | (589,553 | ) | |
Net increase in net assets from Fund
share transactions | | $ | 38,569,376 | | | $ | 97,666,090 | | |
| Net increase in net assets | | $ | 82,953,824 | | | $ | 120,558,486 | | |
| Net Assets | |
| At beginning of year | | $ | 368,319,783 | | | $ | 247,761,297 | | |
| At end of year | | $ | 451,273,607 | | | $ | 368,319,783 | | |
Accumulated undistributed
net investment income
included in net assets | |
| At end of year | | $ | 762,518 | | | $ | 575,663 | | |
See notes to financial statements
7
Eaton Vance Tax-Managed Equity Asset Allocation Fund as of October 31, 2005
FINANCIAL STATEMENTS CONT'D
Financial Highlights
| | | Class A | |
| | | Year Ended October 31, | | Period Ended | |
| | | 2005 | | 2004 | | 2003 | | October 31, 2002(1) | |
| Net asset value — Beginning of year | | $ | 10.790 | | | $ | 9.930 | | | $ | 8.190 | | | $ | 10.000 | | |
| Income (loss) from operations | |
| Net investment income (loss)(2) | | $ | 0.018 | | | $ | 0.002 | | | $ | (0.012 | ) | | $ | (0.024 | ) | |
| Net realized and unrealized gain (loss) | | | 1.292 | | | | 0.858 | | | | 1.752 | | | | (1.786 | ) | |
| Total income (loss) from operations | | $ | 1.310 | | | $ | 0.860 | | | $ | 1.740 | | | $ | (1.810 | ) | |
| Net asset value — End of year | | $ | 12.100 | | | $ | 10.790 | | | $ | 9.930 | | | $ | 8.190 | | |
| Total Return(3) | | | 12.14 | % | | | 8.66 | %(4) | | | 21.25 | % | | | (18.10 | )% | |
| Ratios/Supplemental Data† | |
| Net assets, end of year (000's omitted) | | $ | 169,704 | | | $ | 134,070 | | | $ | 82,868 | | | $ | 38,528 | | |
| Ratios (As a percentage of average daily net assets): | |
| Net expenses(5) | | | 1.43 | % | | | 1.46 | % | | | 1.52 | % | | | 1.55 | %(6) | |
| Net investment income (loss) | | | 0.15 | % | | | 0.02 | % | | | (0.14 | )% | | | (0.43 | )%(6) | |
| Portfolio Turnover of the Tax-Managed Growth Portfolio | | | 1 | % | | | 4 | % | | | 19 | % | | | 21 | % | |
| Portfolio Turnover of the Tax-Managed Value Portfolio | | | 40 | % | | | 44 | % | | | 76 | % | | | 213 | % | |
| Portfolio Turnover of the Tax-Managed Multi-Cap Opportunity Portfolio | | | 217 | % | | | 239 | % | | | 224 | % | | | 225 | % | |
| Portfolio Turnover of the Tax-Managed International Equity Portfolio | | | 39 | % | | | 62 | % | | | 100 | % | | | 128 | % | |
| Portfolio Turnover of the Tax-Managed Mid-Cap Core Portfolio | | | 53 | % | | | 42 | % | | | 50 | % | | | 13 | % | |
| Portfolio Turnover of the Tax-Managed Small-Cap Growth Portfolio | | | 223 | % | | | 282 | % | | | 248 | % | | | 131 | % | |
| Portfolio Turnover of the Tax-Managed Small-Cap Value Portfolio | | | 24 | % | | | 12 | % | | | 21 | % | | | 5 | % | |
| † | | The operating expenses of the Portfolios may reflect a reduction of their investment adviser fee. The operating expenses of the Fund reflect an allocation of expenses to the Administrator for the period from the start of business, March 4, 2002, to October 31, 2002. Had such actions not been taken, the ratios and net investment income (loss) per share would have been as follows: | | | |
| Ratios (As a percentage of average daily net assets): | |
| Expenses(5) | | | 1.44 | % | | | 1.47 | % | | | | | | | 1.77 | %(6) | |
| Net investment income (loss) | | | 0.14 | % | | | 0.01 | % | | | | | | | (0.65 | )%(6) | |
| Net investment income (loss) per share(2) | | $ | 0.017 | | | $ | 0.001 | | | | | | | $ | (0.036 | ) | |
(1) For the period from the start of business, March 4, 2002, to October 31, 2002.
(2) Net investment income (loss) per share was computed using average shares outstanding.
(3) Returns are historical and are calculated by determining the percentage change in net asset value with all distributions reinvested. Total return is not computed on an annualized basis.
(4) The effect of the net increase from payments by affiliate and net gains (losses), realized through the Fund's investment in Tax-Managed Small-Cap Growth Portfolio (the Portfolio) on the disposal of investments purchased which did not meet the Portfolio's investment guidelines amounted to less than $0.01 per share and had no effect on total return for the year ended October 31, 2004.
(5) Includes the Fund's share of the Portfolios' allocated expenses.
(6) Annualized.
See notes to financial statements
8
Eaton Vance Tax-Managed Equity Asset Allocation Fund as of October 31, 2005
FINANCIAL STATEMENTS CONT'D
Financial Highlights
| | | Class B | |
| | | Year Ended October 31, | | Period Ended | |
| | | 2005 | | 2004 | | 2003 | | October 31, 2002(1) | |
| Net asset value — Beginning of year | | $ | 10.600 | | | $ | 9.830 | | | $ | 8.170 | | | $ | 10.000 | | |
| Income (loss) from operations | |
| Net investment loss(2) | | $ | (0.068 | ) | | $ | (0.076 | ) | | $ | (0.077 | ) | | $ | (0.065 | ) | |
| Net realized and unrealized gain (loss) | | | 1.268 | | | | 0.846 | | | | 1.737 | | | | (1.765 | ) | |
| Total income (loss) from operations | | $ | 1.200 | | | $ | 0.770 | | | $ | 1.660 | | | $ | (1.830 | ) | |
| Net asset value — End of year | | $ | 11.800 | | | $ | 10.600 | | | $ | 9.830 | | | $ | 8.170 | | |
| Total Return(3) | | | 11.32 | % | | | 7.83 | %(4) | | | 20.32 | % | | | (18.30 | )% | |
| Ratios/Supplemental Data† | |
| Net assets, end of year (000's omitted) | | $ | 123,431 | | | $ | 109,471 | | | $ | 79,854 | | | $ | 31,101 | | |
| Ratios (As a percentage of average daily net assets): | |
| Net expenses(5) | | | 2.18 | % | | | 2.21 | % | | | 2.27 | % | | | 2.30 | %(6) | |
| Net investment loss | | | (0.59 | )% | | | (0.73 | )% | | | (0.88 | )% | | | (1.17 | )%(6) | |
| Portfolio Turnover of the Tax-Managed Growth Portfolio | | | 1 | % | | | 4 | % | | | 19 | % | | | 21 | % | |
| Portfolio Turnover of the Tax-Managed Value Portfolio | | | 40 | % | | | 44 | % | | | 76 | % | | | 213 | % | |
| Portfolio Turnover of the Tax-Managed Multi-Cap Opportunity Portfolio | | | 217 | % | | | 239 | % | | | 224 | % | | | 225 | % | |
| Portfolio Turnover of the Tax-Managed International Equity Portfolio | | | 39 | % | | | 62 | % | | | 100 | % | | | 128 | % | |
| Portfolio Turnover of the Tax-Managed Mid-Cap Core Portfolio | | | 53 | % | | | 42 | % | | | 50 | % | | | 13 | % | |
| Portfolio Turnover of the Tax-Managed Small-Cap Growth Portfolio | | | 223 | % | | | 282 | % | | | 248 | % | | | 131 | % | |
| Portfolio Turnover of the Tax-Managed Small-Cap Value Portfolio | | | 24 | % | | | 12 | % | | | 21 | % | | | 5 | % | |
| † | | The operating expenses of the Portfolios may reflect a reduction of their investment adviser fee. The operating expenses of the Fund reflect an allocation of expenses to the Administrator for the period from the start of business, March 4, 2002, to October 31, 2002. Had such actions not been taken, the ratios and net investment loss per share would have been as follows: | | | |
| Ratios (As a percentage of average daily net assets): | |
| Expenses(5) | | | 2.19 | % | | | 2.22 | % | | | | | | | 2.52 | %(6) | |
| Net investment loss | | | (0.60 | )% | | | (0.74 | )% | | | | | | | (1.39 | )%(6) | |
| Net investment loss per share(2) | | $ | (0.069 | ) | | $ | (0.077 | ) | | | | | | $ | (0.077 | ) | |
(1) For the period from the start of business, March 4, 2002, to October 31, 2002.
(2) Net investment loss per share was computed using average shares outstanding.
(3) Returns are historical and are calculated by determining the percentage change in net asset value with all distributions reinvested. Total return is not computed on an annualized basis.
(4) The effect of the net increase from payments by affiliate and net gains (losses), realized through the Fund's investment in Tax-Managed Small-Cap Growth Portfolio (the Portfolio) on the disposal of investments purchased which did not meet the Portfolio's investment guidelines amounted to less than $0.01 per share and had no effect on total return for the year ended October 31, 2004.
(5) Includes the Fund's share of the Portfolios' allocated expenses.
(6) Annualized.
See notes to financial statements
9
Eaton Vance Tax-Managed Equity Asset Allocation Fund as of October 31, 2005
FINANCIAL STATEMENTS CONT'D
Financial Highlights
| | | Class C | |
| | | Year Ended October 31, | | Period Ended | |
| | | 2005 | | 2004 | | 2003 | | October 31, 2002(1) | |
| Net asset value — Beginning of year | | $ | 10.580 | | | $ | 9.810 | | | $ | 8.150 | | | $ | 10.000 | | |
| Income (loss) from operations | |
| Net investment loss(2) | | $ | (0.068 | ) | | $ | (0.076 | ) | | $ | (0.076 | ) | | $ | (0.065 | ) | |
| Net realized and unrealized gain (loss) | | | 1.268 | | | | 0.846 | | | | 1.736 | | | | (1.785 | ) | |
| Total income (loss) from operations | | $ | 1.200 | | | $ | 0.770 | | | $ | 1.660 | | | $ | (1.850 | ) | |
| Net asset value — End of year | | $ | 11.780 | | | $ | 10.580 | | | $ | 9.810 | | | $ | 8.150 | | |
| Total Return(3) | | | 11.34 | % | | | 7.85 | %(4) | | | 20.37 | % | | | (18.50 | )% | |
| Ratios/Supplemental Data† | |
| Net assets, end of year (000's omitted) | | $ | 158,138 | | | $ | 124,779 | | | $ | 85,040 | | | $ | 31,903 | | |
| Ratios (As a percentage of average daily net assets): | |
| Net expenses(5) | | | 2.18 | % | | | 2.21 | % | | | 2.27 | % | | | 2.30 | %(6) | |
| Net investment loss | | | (0.59 | )% | | | (0.73 | )% | | | (0.88 | )% | | | (1.17 | )%(6) | |
| Portfolio Turnover of the Tax-Managed Growth Portfolio | | | 1 | % | | | 4 | % | | | 19 | % | | | 21 | % | |
| Portfolio Turnover of the Tax-Managed Value Portfolio | | | 40 | % | | | 44 | % | | | 76 | % | | | 213 | % | |
| Portfolio Turnover of the Tax-Managed Multi-Cap Opportunity Portfolio | | | 217 | % | | | 239 | % | | | 224 | % | | | 225 | % | |
| Portfolio Turnover of the Tax-Managed International Equity Portfolio | | | 39 | % | | | 62 | % | | | 100 | % | | | 128 | % | |
| Portfolio Turnover of the Tax-Managed Mid-Cap Core Portfolio | | | 53 | % | | | 42 | % | | | 50 | % | | | 13 | % | |
| Portfolio Turnover of the Tax-Managed Small-Cap Growth Portfolio | | | 223 | % | | | 282 | % | | | 248 | % | | | 131 | % | |
| Portfolio Turnover of the Tax-Managed Small-Cap Value Portfolio | | | 24 | % | | | 12 | % | | | 21 | % | | | 5 | % | |
| † | | The operating expenses of the Portfolios may reflect a reduction of their investment adviser fee. The operating expenses of the Fund reflect an allocation of expenses to the Administrator for the period from the start of business, March 4, 2002, to October 31, 2002. Had such actions not been taken, the ratios and net investment loss per share would have been as follows: | | | |
| Ratios (As a percentage of average daily net assets): | |
| Expenses(5) | | | 2.19 | % | | | 2.22 | % | | | | | | | 2.52 | %(6) | |
| Net investment loss | | | (0.60 | )% | | | (0.74 | )% | | | | | | | (1.39 | )%(6) | |
| Net investment loss per share(2) | | $ | (0.069 | ) | | $ | (0.077 | ) | | | | | | $ | (0.077 | ) | |
(1) For the period from the start of business, March 4, 2002, to October 31, 2002.
(2) Net investment loss per share was computed using average shares outstanding.
(3) Returns are historical and are calculated by determining the percentage change in net asset value with all distributions reinvested. Total return is not computed on an annualized basis.
(4) The effect of the net increase from payments by affiliate and net gains (losses), realized through the Fund's investment in Tax-Managed Small-Cap Growth Portfolio (the Portfolio) on the disposal of investments purchased which did not meet the Portfolio's investment guidelines amounted to less than $ 0.01 per share and had no effect on total return for the year ended October 31, 2004.
(5) Includes the Fund's share of the Portfolios' allocated expenses.
(6) Annualized.
See notes to financial statements
10
Eaton Vance Tax-Managed Equity Asset Allocation Fund as of October 31, 2005
NOTES TO FINANCIAL STATEMENTS
1 Significant Accounting Policies
Eaton Vance Tax-Managed Equity Asset Allocation Fund (the Fund) is a diversified series of Eaton Vance Mutual Funds Trust (the Trust). The Trust is an entity of the type commonly known as a Massachusetts business trust and is registered under the Investment Company Act of 1940, as amended, as an open-end management investment company. The Fund offers three classes of shares. Class A shares are generally sold subject to a sales charge imposed at time of purchase. Class B and Class C shares are sold at net asset value and are generally subject to a contingent deferred sales charge (see Note 6). Class B shares held for eight years will automatically convert to Class A shares. Each class represents a pro-rata interest in the Fund, but votes separately on class-specific matters and (as noted below) is subject to different expenses. Realized and unrealized gains and losses and net investment income and losses, other than class-specifi c expenses, are allocated daily to each class of shares based on the relative net assets of each class to the total net assets of the Fund. Each class of shares differs in its distribution plan and certain other class-specific expenses. The Fund currently invests all of its investable assets in the following seven tax-managed equity portfolios managed by Eaton Vance or its affiliates: Tax-Managed Growth Portfolio, Tax-Managed Value Portfolio, Tax-Managed Multi-Cap Opportunity Portfolio, Tax-Managed International Equity Portfolio, Tax-Managed Mid-Cap Core Portfolio, Tax-Managed Small-Cap Growth Portfolio and Tax-Managed Small-Cap Value Portfolio (the Portfolios). Each Portfolio is organized as a New York Trust. The investment objectives and policies of the Portfolios together are the same as those of the Fund. The value of the Fund's investment in each Portfolio reflects the Fund's proportionate interest in the net assets of the Tax-Managed Growth Portfolio, Tax-Managed Value Portfolio, Tax-Managed Multi-Cap Opportunity Portfolio, Tax-Managed International Equity Portfolio, Tax-Managed Mid-Cap Core Portfolio, Tax-Managed Small-Cap Growth Portfolio and Tax-Managed Small-Cap Value Portfolio (0.6%, 10.2%, 57.2%, 49.6%, 65.3%, 19.3%, and 42.3%, respectively, at October 31, 2005). The performance of the Fund is directly affected by the performance of the Portfolios. A copy of each Portfolio's financial statements is available on the EDGAR Database on the Securities and Exchange Commission's website (www.sec.gov), at the Commission's public reference room in Washington, DC or upon request from the Fund's principal underwriter, Eaton Vance Distributors Inc. (EVD), by calling 1-800-225-6265.
The following is a summary of significant accounting policies consistently followed by the Fund in the preparation of its financial statements. The policies are in conformity with accounting principles generally accepted in the United States of America.
A Investment Valuation — The valuation policy of each Portfolio is as follows: Securities listed on a U.S. securities exchange generally are valued at the last sale price on the day of valuation or, if no sales took place on such date, at the mean between the closing bid and asked prices therefore on the exchange where such securities are principally traded. Equity securities listed on the NASDAQ National Market System generally are valued at the official NASDAQ closing price. Unlisted or listed securities for which closing sales prices or closing quotations are not available are valued at the mean between the latest available bid and asked prices or, in the case of preferred equity securities that are not listed or traded in the over-the-counter market, by an independent pricing service. Exchange-traded options are valued at the last sale price for the day of valuation as quoted on the principal exchange or board of trade on which the options are traded or, in the absence of sales on such date, at the mean between the latest bid and asked prices therefore. Futures positions on securities and currencies generally are valued at closing settlement prices. Short-term debt securities with a remaining maturity of 60 days or less are valued at amortized cost. If short-term debt securities were acquired with a remaining maturity of more than 60 days, their amortized cost value will be based on their value on the sixty-first day prior to maturity. Other fixed income and debt securities, including listed securities and securities for which price quotations are available, will normally be valued on the basis of valuations furnished by a pricing service. Foreign securities and currencies are valued in U.S. dollars, based on foreign currency exchange rate quotations and supplied by an i ndependent quotation service. The daily valuation of exchange-traded foreign securities generally is determined as of the close of trading on the principal exchange on which such securities trade. Events occurring after the close of trading on foreign exchanges may result in adjustments to the valuation of foreign securities to more accurately reflect their fair value as of the close of regular trading on the New York Stock Exchange. When valuing foreign equity securities that meet certain criteria, the Trustees have approved the use of a fair value service that values such securities to reflect market trading that occurs after the close of the applicable foreign markets of comparable securities or other instruments that have a strong correlation to the fair-valued securities. Investments held by the Portfolios for which valuations or market quotations are unavailable are valued at fair value using
11
Eaton Vance Tax-Managed Equity Asset Allocation Fund as of October 31, 2005
NOTES TO FINANCIAL STATEMENTS CONT'D
methods determined in good faith by or at the direction of the Trustees of the Portfolios considering relevant factors, data and information including the market value of freely tradable securities of the same class in the principal market on which such securities are normally traded.
B Income — The Fund's net investment income or loss consists of the Fund's pro-rata share of the net investment income or loss of the Portfolios, less all actual and accrued expenses of the Fund, determined in accordance with accounting principles generally accepted in the United States of America.
C Expenses — The majority of expenses of the Trust are directly identifiable to an individual fund. Expenses which are not readily identifiable to a specific fund are allocated taking into consideration, among other things, the nature and type of expense and the relative size of the fund.
D Federal Taxes — The Fund's policy is to comply with the provisions of the Internal Revenue Code applicable to regulated investment companies and to distribute to shareholders each year all of its taxable income, including any net realized gain on investments. Accordingly, no provision for federal income or excise tax is necessary.
E Expense Reduction — Investors Bank & Trust Company (IBT) serves as custodian to the Fund. Pursuant to the custodian agreement, IBT receives a fee reduced by credits which are determined based on the average daily cash balance the Fund maintains with IBT. All credit balances used to reduce the Fund's custodian fees are reported as a reduction of total expenses in the Statement of Operations.
F Other — Investment transactions are accounted for on a trade-date basis. Dividends to shareholders are recorded on the ex-dividend date.
G Indemnifications — Under the Trust's organizational documents, its officers and Trustees may be indemnified against certain liabilities and expenses arising out of the performance of their duties to the Fund, and shareholders are indemnified against personal liability for obligations of the Trust. Additionally, in the normal course of business, the Fund enters into agreements with service providers that may contain indemnification clauses. The Fund's maximum exposure under these arrangements is unknown as this would involve future claims that may be made against the Fund that have not yet occurred.
H Use of Estimates — The preparation of the financial statements in conformity with accounting principles generally accepted in the United States of America requires management to make estimates and assumptions that affect the reported amounts of assets and liabilities at the date of the financial statements and the reported amounts of income and expense during the reporting period. Actual results could differ from those estimates.
2 Distributions to Shareholders
It is the present policy of the Fund to make at least one distribution annually (normally in December) of all or substantially all of its net investment income, if any, and at least one distribution annually of all or substantially all of its net realized capital gains, if any (reduced by available capital loss carryforwards from prior year, if any). Shareholders may reinvest all distributions in shares of the same class of the Fund at the net asset value as of the close of business on the ex-dividend date. Distributions are paid in the form of additional shares of the same class of the Fund or, at the election of the shareholder, in cash. The Fund distinguishes between distributions on a tax basis and a financial reporting basis. Accounting principles generally accepted in the United States of America require that only distributions in excess of tax basis earnings and profits be reported in the financial statements as a return of capital. Permanent differences between book and tax accounting relating to distributions are reclassified to paid-in capital.
During the year ended October 31, 2005, accumulated paid-in capital was decreased by $1,034,482, net investment loss was decreased by $1,540,558, and accumulated net realized gain was decreased by $506,076 primarily due to differences between book and tax accounting treatment of net operating losses, foreign currency gains and losses, passive foreign investment companies and real estate investment trusts. This change had no effect on net assets or the net asset value per share.
As of October 31, 2005, the components of distributable earnings on a tax basis were as follows:
| Undistributed capital gains | | $ | 11,906,848 | | |
| Unrealized appreciation | | $ | 80,144,283 | | |
| Other temporary differences | | $ | 1,046,889 | | |
3 Shares of Beneficial Interest
The Fund's Declaration of Trust permits the Trustees to issue an unlimited number of full and fractional shares of beneficial interest (without par value). Such shares may be
12
Eaton Vance Tax-Managed Equity Asset Allocation Fund as of October 31, 2005
NOTES TO FINANCIAL STATEMENTS CONT'D
issued in a number of different series (such as the Fund) and classes. Transactions in Fund shares were as follows:
| | | Year Ended October 31, | |
| Class A | | 2005 | | 2004 | |
| Sales | | | 3,682,231 | | | | 5,725,932 | | |
| Redemptions | | | (2,239,692 | ) | | | (1,703,864 | ) | |
| Exchange from Class B shares | | | 157,175 | | | | 56,477 | | |
| Net increase | | | 1,599,714 | | | | 4,078,545 | | |
| | | Year Ended October 31, | |
| Class B | | 2005 | | 2004 | |
| Sales | | | 1,754,278 | | | | 3,476,531 | | |
| Redemptions | | | (1,458,508 | ) | | | (1,219,817 | ) | |
| Exchange to Class A shares | | | (160,784 | ) | | | (57,280 | ) | |
| Net increase | | | 134,986 | | | | 2,199,434 | | |
| | | Year Ended October 31, | |
| Class C | | 2005 | | 2004 | |
| Sales | | | 3,298,523 | | | | 4,526,216 | | |
| Redemptions | | | (1,663,691 | ) | | | (1,404,403 | ) | |
| Net increase | | | 1,634,832 | | | | 3,121,813 | | |
4 Transactions with Affiliates
The investment adviser fee is earned by Eaton Vance Management (EVM), as compensation for management and investment advisory services rendered to the Fund. Under the advisory agreement, EVM receives a monthly advisory fee in the amount of 0.80% (annually) of average daily net assets of the Fund up to $500 million and at reduced rates as daily net assets exceed that level. The advisory fee payable by the Fund is reduced by the Fund's allocable portion of the advisory fees paid by the Portfolios in which it invests. The Fund's allocated portion of the advisory fees paid by the Portfolios totaled $2,940,052 for the year ended October 31, 2005. For the year ended October 31, 2005, the advisory fee paid directly by the Fund amounted to $458,984.
An administrative fee is earned by EVM for managing and administering the business affairs of the Fund. Under the administration agreement, EVM earns a fee in the amount of 0.15% per annum of the average daily net assets of the Fund. For the year ended October 31, 2005, the administration fee amounted to $635,803.
Except for Trustees of the Fund and the Portfolios who are not members of EVM's organization, officers and Trustees of the Fund and Portfolios receive remuneration for their services to the Fund out of the investment adviser and sub-advisory fees. Trustees of the Fund who are not affiliated with EVM may elect to defer receipt of all or a percentage of their annual fees in accordance with the terms of the Trustees Deferred Compensation Plan. For the year ended October 31, 2005, no significant amounts have been deferred. Certain officers and Trustees of the Fund and Portfolios are officers of the above organization.
EVM serves as the sub-transfer agent of the Fund and receives from the transfer agent an aggregate fee based upon the actual expenses incurred by EVM in the performance of those activities. During the year ended October 31, 2005, EVM earned $28,899 in sub-transfer agent fees.
The Fund was informed that EVD, a subsidiary of EVM and the Fund's principal underwriter, received $184,348, as its portion of the sales charge on sales of Class A for the year ended October 31, 2005.
5 Distribution and Service Plans
The Fund has in effect distribution plans for Class B shares (Class B Plan) and Class C shares (Class C Plan), pursuant to Rule 12b-1 under the Investment Company Act of 1940 and a service plan for Class A shares (Class A Plan) (collectively, the Plans). The Class B and Class C Plans require the Fund to pay EVD amounts equal to 1/365 of 0.75% of the Fund's average daily net assets attributable to Class B and Class C shares for providing ongoing distribution services and facilities to the Fund. The Fund will automatically discontinue payments to EVD during any period in which there are no outstanding Uncovered Distribution Charges, which are equivalent to the sum of (i) 6.25% of the aggregate amount received by the Fund for the Class B and Class C shares sold, plus (ii) interest calculated by applying the rate of 1% over the prevailing prime rate to the outstanding balance of Uncovered Distribution Charges of EVD of each respecti ve class, reduced by the aggregate amount of contingent deferred sales charges (see Note 6) and daily amounts theretofore paid to EVD by each respective class. The Fund paid or accrued $906,206, and $1,098,105 for Class B and Class C shares, respectively, to or payable to EVD for the year ended October 31, 2005, representing 0.75% of the average daily net assets for Class B and Class C shares, respectively. At October 31, 2005, the amount of Uncovered Distribution Charges of EVD calculated under the Plans was
13
Eaton Vance Tax-Managed Equity Asset Allocation Fund as of October 31, 2005
NOTES TO FINANCIAL STATEMENTS CONT'D
approximately $3,635,000, and $5,683,000 for Class B and Class C shares, respectively.
The Plans authorize the Fund to make payments of service fees to EVD, investment dealers and other persons in amounts equal to 0.25% of the Fund's average daily net assets attributable to Class A, Class B and Class C shares for each fiscal year. Service fee payments are made for personal services and/or the maintenance of shareholder accounts. Service fees are separate and distinct from the sales commissions and distribution fees payable by the Fund to EVD and, as such, are not subject to automatic discontinuance when there are no outstanding Uncovered Distribution Charges of EVD. Service fees paid or accrued for the year ended October 31, 2005 amounted to $391,568, $302,069 and $366,035 for Class A, Class B, and Class C shares, respectively.
6 Contingent Deferred Sales Charge
A contingent deferred sales charge (CDSC) generally is imposed on redemptions of Class B shares made within six years of purchase and on redemptions of Class C shares made within one year of purchase. Generally, the CDSC is based upon the lower of the net asset value at date of redemption or date of purchase. No charge is levied on shares acquired by reinvestment of dividends or capital gain distributions. Class A shares may be subject to a 1% CDSC if redeemed within one year of purchase (depending upon the circumstances of purchase). The Class B CDSC is imposed at declining rates that begin at 5% in the case of redemptions in the first and second year after purchase, declining one percentage point each subsequent year. Class C shares will be subject to a 1% CDSC if redeemed within one year of purchase.
No CDSC is levied on shares which have been sold to EVM or its affiliates or to their respective employees or clients and may be waived under certain other limited conditions. CDSC on Class B and Class C redemptions are paid to EVD to reduce the amount of Uncovered Distribution Charges calculated under the Class B and Class C Plans, respectively (see Note 5). CDSC assessed on Class B and Class C shares when no Uncovered Distribution Charges exist for the respective classes will be credited to the Fund. EVD received approximately $288,000 and $21,000 of CDSC paid by shareholders for Class B and Class C shares, respectively, for the year ended October 31, 2005. EVD did not receive any CDSC for Class A shares for the year ended October 31, 2005.
7 Investment Transactions
For the year ended October 31, 2005, increases and decreases in the Fund's investment in the Portfolios were as follows:
| Portfolio | | Contributions | | Withdrawals | |
| Tax-Managed Growth Portfolio | | $ | 16,485,063 | | | $ | — | | |
| Tax-Managed Value Portfolio | | | 1,438,853 | | | | — | | |
| Tax-Managed Multi-Cap Opportunity Portfolio | | | 27,437,227 | | | | — | | |
| Tax-Managed International Equity Portfolio | | | — | | | | 563,288 | | |
| Tax-Managed Mid-Cap Core Portfolio | | | 419,840 | | | | — | | |
| Tax-Managed Small-Cap Growth Portfolio | | | — | | | | — | | |
| Tax-Managed Small-Cap Value Portfolio | | | — | | | | 11,582,095 | | |
14
Eaton Vance Tax-Managed Equity Asset Allocation Fund as of October 31, 2005
REPORT OF INDEPENDENT REGISTERED PUBLIC ACCOUNTING FIRM
To the Trustees of Eaton Vance Mutual Funds Trust and Shareholders of Eaton Vance Tax-Managed Equity Asset Allocation Fund:
We have audited the accompanying statement of assets and liabilities of Eaton Vance Tax-Managed Equity Asset Allocation Fund (the Fund) (one of the series of Eaton Vance Mutual Funds Trust) as of October 31, 2005, the related statement of operations for the year then ended, the statement of changes in net assets for each of the two years in the period then ended and the financial highlights for each of the three years in the period then ended, and for the period from the start of business, March 4, 2002 to October 31, 2002. These financial statements and financial highlights are the responsibility of the Fund's management. Our responsibility is to express an opinion on these financial statements and financial highlights based on our audits.
We conducted our audits in accordance with standards of the Public Company Accounting Oversight Board (United States). Those standards require that we plan and perform the audits to obtain reasonable assurance about whether the financial statements and financial highlights are free of material misstatement. The Fund is not required to have, nor were we engaged to perform, an audit of its internal control over financial reporting. An audit includes consideration of internal control over financial reporting as a basis for designing audit procedures that are appropriate in the circumstances, but not for the purpose of expressing an opinion of the Fund's internal control over financial reporting. Accordingly, we express no such opinion. An audit also includes examining, on a test basis, evidence supporting the amounts and disclosures in the financial statements, assessing the accounting principles used and significant estimates made by management, as well as evaluating the overall financial statement presentation. We believe that our audits provide a reasonable basis for our opinion.
In our opinion, such financial statements and financial highlights referred to above present fairly, in all material respects, the financial position of Eaton Vance Tax-Managed Equity Asset Allocation Fund as of October 31, 2005, the results of its operations for the year then ended, the changes in its net assets for each of the two years in the period then ended and the financial highlights for each of the three years in the period then ended, and for the period from the start of business, March 4, 2002 to October 31, 2002, in conformity with accounting principles generally accepted in the United States of America.
DELOITTE & TOUCHE LLP
Boston, Massachusetts
December 19, 2005
15
Eaton Vance Tax-Managed Equity Asset Allocation Fund
BOARD OF TRUSTEES' ANNUAL APPROVAL OF THE INVESTMENT ADVISORY AGREEMENT
The investment advisory agreement between Tax-Managed Equity Asset Allocation Fund (the "Fund") and its investment adviser, Eaton Vance Management ("Eaton Vance"), provides that the advisory agreement will continue in effect from year to year so long as its continuance is approved at least annually (i) by a vote of a majority of the noninterested Trustees of the Fund cast in person at a meeting called for the purpose of voting on such approval and (ii) by the Trustees of the Fund or by vote of a majority of the outstanding interests of the Fund.
In considering the annual approval of the investment advisory agreement between the Fund and its investment adviser, the Special Committee of the Board of Trustees considered information that had been provided throughout the year at regular Board meetings, as well as information furnished for a series of meetings held in February and March in preparation for a Board meeting held on March 21, 2005 to specifically consider the renewal of the investment advisory agreement. Such information included, among other things, the following:
• An independent report comparing the advisory fees of the Fund with those of comparable funds;
• An independent report comparing the expense ratio of the Fund to those of comparable funds;
• Information regarding Fund investment performance in comparison to relevant peer groups of funds and appropriate indices;
• The economic outlook and the general investment outlook in relevant investment markets;
• Eaton Vance's results and financial condition and the overall organization of the investment adviser;
• The procedures and processes used to determine the fair value of Fund assets and actions taken to monitor and test the effectiveness of such procedures and processes;
• The allocation of brokerage and the benefits received by the investment adviser as the result of brokerage allocation;
• Eaton Vance's management of the relationship with the custodian, subcustodians and fund accountants;
• The resources devoted to compliance efforts undertaken by Eaton Vance on behalf of the funds they manage and the record of compliance with the investment policies and restrictions and with policies on personal securities transactions;
• The quality, nature, cost and character of the administrative and other non-investment management services provided by Eaton Vance and its affiliates; and
• The terms of the advisory agreement and the reasonableness and appropriateness of the particular fee paid by the Fund for the services described therein.
The Special Committee also considered the nature, extent and quality of the management services provided by the investment adviser. In so doing, the Special Committee considered their management capabilities with respect to the types of investments held by the Fund, including information relating to the education, experience and number of investment professionals and other personnel who provide services under the investment advisory agreement. The Special Committee specifically noted the investment adviser's in-house equity research capabilities and experience in managing funds that seek to maximize after-tax returns. The Special Committee evaluated the level of skill required to manage the Fund and concluded that the human resources available at the investment adviser were appropriate to fulfill effectively its duties on behalf of the Fund.
16
Eaton Vance Tax-Managed Equity Asset Allocation Fund
BOARD OF TRUSTEES' ANNUAL APPROVAL OF THE INVESTMENT ADVISORY AGREEMENT CONT'D
In its review of comparative information with respect to investment performance, the Special Committee concluded that the Fund has performed within a range that the Special Committee deemed competitive. With respect to its review of investment advisory fees, the Special Committee concluded that the fees paid by the Fund are within the range of those paid by comparable funds within the mutual fund industry. In reviewing the information regarding the expense ratio of the Fund, the Special Committee concluded that, in light of the asset size of the Fund, the Fund's expense ratio is reasonable.
In addition to the factors mentioned above, the Special Committee reviewed the level of profits of the investment adviser in providing investment management services for the Fund and for all Eaton Vance funds as a group. The Special Committee also reviewed the implementation of a soft dollar reimbursement program pursuant to which the Fund may receive reimbursement payments in respect of third party research services obtained by the investment adviser as a result of soft dollar credits generated through trading on behalf of the Fund. The Special Committee also reviewed the benefits to Eaton Vance and its affiliates in providing administration services for the Fund and for all Eaton Vance funds as a group. In addition, the Special Committee considered the fiduciary duty assumed by the investment adviser in connection with the services rendered to the Fund and the business reputation of the investment adviser and its financial res ources. The Trustees concluded that in light of the services rendered, the profits realized by the investment adviser are not unreasonable. The Special Committee also considered the extent to which the investment adviser appears to be realizing benefits from economies of scale in managing the Fund, and concluded that the fee breakpoints which are in place will allow for an equitable sharing of such benefits, when realized, with the Fund and its shareholders.
The Special Committee did not consider any single factor as controlling in determining whether or not to renew the investment advisory agreement. Nor are the items described herein all the matters considered by the Special Committee. In assessing the information provided by Eaton Vance and its affiliates, the Special Committee also took into consideration the benefits to shareholders of investing in a fund that is a part of a large family of funds which provides a large variety of shareholder services.
Based on its consideration of the foregoing factors and conclusions, and such other factors and conclusions as it deemed relevant, and assisted by independent counsel, the Special Committee concluded that the renewal of the investment advisory agreement, including the fee structure, is in the interests of shareholders.
17
Eaton Vance Tax-Managed Equity Asset Allocation Fund
MANAGEMENT AND ORGANIZATION
Fund Management. The Trustees of Eaton Vance Mutual Funds Trust (the Trust) are responsible for the overall management and supervision of the Trust's affairs. The Trustees and officers of the Trust are listed below. Except as indicated, each individual has held the office shown or other offices in the same company for the last five years. Trustees and officers of the Trust hold indefinite terms of office. The "noninterested Trustees" consist of those Trustees who are not "interested persons" of the Trust, as that term is defined under the 1940 Act. The business address of each Trustee and officer is The Eaton Vance Building, 255 State Street, Boston, Massachusetts 02109. As used below, "EVC" refers to Eaton Vance Corp., "EV" refers to Eaton Vance, Inc., "EVM" refers to Eaton Vance Management, "BMR" refers to Boston Management and Research and "EVD" refers to Eaton Vance Distributors, Inc. EVC and EV are the corporate parent and trustee, respectively, of EVM and BMR. EVD is the Fund's principal underwriter a wholly-owned subsidiary of EVM. Each officer affiliated with Eaton Vance may hold a position with other Eaton Vance affiliates that is comparable to its position with EVM listed below.
Name and
Date of Birth | | Position
with the
Trust | | Term of
Office and
Length of
Service | | Principal Occupation(s)
During Past Five Years | | Number of Portfolios
in Fund Complex
Overseen By
Trustee(1) | | Other Directorships Held | |
| Interested Trustee | |
|
James B. Hawkes
11/9/41 | | Trustee | | Since 1991 | | Chairman, President and Chief Executive Officer of BMR, EVC, EVM and EV; Director of EV; Vice President and Director of EVD. Trustee and/or officer of 161 registered investment companies in the Eaton Vance Fund Complex. Mr. Hawkes is an interested person because of his positions with BMR, EVM, EVC and EV, which are affiliates of the Trust. | | | 161 | | | Director of EVC | |
|
| Noninterested Trustee(s) | |
|
Benjamin C. Esty
1/2/63 | | Trustee | | Since 2005 | | Professor, Harvard University Graduate School of Business Administration (since 2003). Formerly, Associate Professor, Harvard University Graduate School of Business Administration (2000-2003). | | | 152 | | | None | |
|
Samuel L. Hayes, III
2/23/35 | | Trustee | | Trustee since 1986 and Chairman of the Board since 2005 | | Jacob H. Schiff Professor of Investment Banking Emeritus, Harvard University Graduate School of Business Administration. | | | 161 | | | Director of Tiffany & Co. (specialty retailer) and Telect, Inc. (telecommunication services company) | |
|
William H. Park
9/19/47 | | Trustee | | Since 2003 | | President and Chief Executive Officer, Prizm Capital Management, LLC (investment management firm) (since 2002). Executive Vice President and Chief Financial Officer, United Asset Management Corporation (a holding company owning institutional investment management firms) (1982-2001). | | | 161 | | | None | |
|
Ronald A. Pearlman
7/10/40 | | Trustee | | Since 2003 | | Professor of Law, Georgetown University Law Center (since 1999). Tax Partner Covington & Burling, Washington, DC (1991-2000). | | | 161 | | | None | |
|
Norton H. Reamer
9/21/35 | | Trustee | | Since 1986 | | President, Chief Executive Officer and a Director of Asset Management Finance Corp. (a specialty finance company serving the investment management industry) (since October 2003). President, Unicorn Corporation (an investment and financial advisory services company) (since September 2000). Formerly, Chairman, Hellman, Jordan Management Co., Inc. (an investment management company) (2000-2003). Formerly, Advisory Director of Berkshire Capital Corporation (investment banking firm) (2002-2003). Formerly Chairman of the Board, United Asset Management Corporation (a holding company owning institutional investment management firms) and Chairman, President and Director, UAM Funds (mutual funds) (1980-2000). | | | 161 | | | None | |
|
18
Eaton Vance Tax-Managed Equity Asset Allocation Fund
MANAGEMENT AND ORGANIZATION CONT'D
Name and
Date of Birth | | Position
with the
Trust | | Term of
Office and
Length of
Service | | Principal Occupation(s)
During Past Five Years | | Number of Portfolios
in Fund Complex
Overseen By
Trustee(1) | | Other Directorships Held | |
| Noninterested Trustee(s) (continued) | |
|
Lynn A. Stout
9/14/57 | | Trustee | | Since 1998 | | Professor of Law, University of California at Los Angeles School of Law (since July 2001). Formerly, Professor of Law, Georgetown University Law Center. | | | 161 | | | None | |
|
Ralph F. Verni
1/26/43 | | Trustee | | Since 2005 | | Consultant and private investor (since 2000). Formerly, President and Chief Executive Officer, Redwood Investment Systems, Inc. (software developer) (2000). Formerly, President and Chief Executive Officer, State Street Research & Management (investment advisor), SSRM Holdings (parent of State Street Research & management), and SSR Realty (institutional realty manager) (1992-2000). | | | 152 | | | Director of W.P. Carey & Company LLC (manager of real estate investment trusts) | |
|
| Principal Officers who are not Trustees | |
|
Name and
Date of Birth | | Position
with the
Trust | | Term of
Office and
Length of
Service | | Principal Occupation(s)
During Past Five Years | |
Thomas E. Faust Jr.
5/31/58 | | President | | Since 2002 | | Executive Vice President of EVM, BMR, EVC and EV; Chief Investment Officer of EVM and BMR and Director of EVC. Chief Executive Officer of Belair Capital Fund LLC, Belcrest Capital Fund LLC, Belmar Capital Fund LLC, Belport Capital Fund LLC and Belrose Capital Fund LLC (private investment companies sponsored by EVM). Officer of 65 registered investment companies managed by EVM or BMR. | |
|
William H. Ahern, Jr.
7/28/59 | | Vice President | | Since 1995 | | Vice President of EVM and BMR. Officer of 70 registered investment companies managed by EVM or BMR. | |
|
Cynthia J. Clemson
3/2/63 | | Vice President | | Since 2004 | | Vice President of EVM and BMR. Officer of 85 registered investment companies managed by EVM or BMR. | |
|
Kevin S. Dyer
2/21/75 | | Vice President | | Since 2005 | | Assistant Vice President of EVM and BMR. Officer of 24 registered investment companies managed by EVM or BMR. | |
|
Aamer Khan
6/7/60 | | Vice President | | Since 2005 | | Vice President of EVM and BMR. Officer of 27 registered investment companies managed by EVM or BMR. | |
|
Michael R. Mach
7/15/47 | | Vice President | | Since 1999 | | Vice President of EVM and BMR. Officer of 32 registered investment companies managed by EVM or BMR. | |
|
Robert B. MacIntosh
1/22/57 | | Vice President | | Since 1998 | | Vice President of EVM and BMR. Officer of 85 registered investment companies managed by EVM or BMR. | |
|
Duncan W. Richardson
10/26/57 | | Vice President | | Since 2001 | | Senior Vice President and Chief Equity Investment Officer of EVM and BMR. Officer of 51 registered investment companies managed by EVM or BMR. | |
|
Walter A. Row, III
7/20/57 | | Vice President | | Since 2001 | | Director of Equity Research and a Vice President of EVM and BMR. Officer of 31 registered investment companies managed by EVM or BMR. | |
|
Judith A. Saryan
8/21/54 | | Vice President | | Since 2003 | | Vice President of EVM and BMR. Officer of 33 registered investment companies managed by EVM or BMR. | |
|
Susan Schiff
3/13/61 | | Vice President | | Since 2002 | | Vice President of EVM and BMR. Officer of 29 registered investment companies managed by EVM or BMR. | |
|
Barbara E. Campbell
6/19/57 | | Treasurer | | Since 2005(2) | | Vice President of EVM and BMR. Officer of 161 registered investment companies managed by EVM or BMR. | |
|
19
Eaton Vance Tax-Managed Equity Asset Allocation Fund
MANAGEMENT AND ORGANIZATION CONT'D
Name and
Date of Birth | | Position
with the
Trust | | Term of
Office and
Length of
Service | | Principal Occupation(s)
During Past Five Years | |
| Principal Officers who are not Trustees (continued) | |
|
Alan R. Dynner
10/10/40 | | Secretary | | Since 1997 | | Vice President, Secretary and Chief Legal Officer of BMR, EVM, EVD, EV and EVC. Officer of 161 registered investment companies managed by EVM or BMR. | |
|
Paul M. O'Neil
7/11/53 | | Chief Compliance Officer | | Since 2004 | | Vice President of EVM and BMR. Officer of 161 registered investment companies managed by EVM or BMR. | |
|
(1) Includes both master and feeder funds in a master-feeder structure.
(2) Prior to 2005, Ms. Campbell served as Assistant Treasurer of the Trust since 1995.
The SAI for the Fund includes additional information about the Trustees and officers of the Fund and can be obtained without charge by calling 1-800-225-6265.
20
This Page Intentionally Left Blank
Investment Adviser of Eaton Vance Tax-Managed Equity Asset Allocation Fund
Eaton Vance Management
The Eaton Vance Building
255 State Street
Boston, MA 02109
Administrator of Eaton Vance Tax-Managed Equity Asset Allocation Fund
Eaton Vance Management
The Eaton Vance Building
255 State Street
Boston, MA 02109
Principal Underwriter
Eaton Vance Distributors, Inc.
The Eaton Vance Building
255 State Street
Boston, MA 02109
(617) 482-8260
Custodian
Investors Bank & Trust Company
200 Clarendon Street
Boston, MA 02116
Transfer Agent
PFPC Inc.
Attn: Eaton Vance Funds
P.O. Box 9653
Providence, RI 02940-9653
(800) 262-1122
Independent Registered Public Accounting Firm
Deloitte & Touche LLP
200 Berkeley Street
Boston, MA 02116-5022
Eaton Vance Tax-Managed Equity Asset Allocation Fund
The Eaton Vance Building
255 State Street
Boston, MA 02109
This report must be preceded or accompanied by a current prospectus. Before investing, investors should consider carefully the Fund's investment objective, risks, and charges and expenses. The Fund's current prospectus contains this and other information about the Fund and is available through your financial advisor. Please read the prospectus carefully before you invest or send money. For further information please call 1-800-225-6265.
1299-12/05 TMEAASRC

Annual Report October 31, 2005


EATON VANCE
DIVERSIFIED
INCOME
FUND
IMPORTANT NOTICES REGARDING PRIVACY,
DELIVERY OF SHAREHOLDER DOCUMENTS,
PORTFOLIO HOLDINGS AND PROXY VOTING
Privacy. The Eaton Vance organization is committed to ensuring your financial privacy. Each of the financial institutions identified below has in effect the following policy ("Privacy Policy") with respect to nonpublic personal information about its customers:
• Only such information received from you, through application forms or otherwise, and information about your Eaton Vance fund transactions will be collected. This may include information such as name, address, social security number, tax status, account balances and transactions.
• None of such information about you (or former customers) will be disclosed to anyone, except as permitted by law (which includes disclosure to employees necessary to service your account). In the normal course of servicing a customer's account, Eaton Vance may share information with unaffiliated third parties that perform various required services such as transfer agents, custodians and broker/dealers.
• Policies and procedures (including physical, electronic and procedural safeguards) are in place that are designed to protect the confidentiality of such information.
• We reserve the right to change our Privacy Policy at any time upon proper notification to you. Customers may want to review our Policy periodically for changes by accessing the link on our homepage: www.eatonvance.com.
Our pledge of privacy applies to the following entities within the Eaton Vance organization: the Eaton Vance Family of Funds, Eaton Vance Management, Eaton Vance Investment Counsel, Boston Management and Research, and Eaton Vance Distributors, Inc.
In addition, our Privacy Policy only applies to those Eaton Vance customers who are individuals and who have a direct relationship with us. If a customer's account (i.e. fund shares) is held in the name of a third-party financial adviser/ broker-dealer, it is likely that only such adviser's privacy policies apply to the customer. This notice supersedes all previously issued privacy disclosures.
For more information about Eaton Vance's Privacy Policy, please call 1-800-262-1122.
Delivery of Shareholder Documents. The Securities and Exchange Commission (the "SEC") permits funds to deliver only one copy of shareholder documents, including prospectuses, proxy statements and shareholder reports, to fund investors with multiple accounts at the same residential or post office box address. This practice is often called "householding" and it helps eliminate duplicate mailings to shareholders.
Eaton Vance, or your financial adviser, may household the mailing of your documents indefinitely unless you instruct Eaton Vance, or your financial adviser, otherwise.
If you would prefer that your Eaton Vance documents not be householded, please contact Eaton Vance at 1-800-262-1122, or contact your financial adviser.
Your instructions that householding not apply to delivery of your Eaton Vance documents will be effective within 30 days of receipt by Eaton Vance or your financial adviser.
Portfolio Holdings. Each Eaton Vance Fund and its underlying Portfolio (if applicable) will file a schedule of its portfolio holdings on Form N-Q with the SEC for the first and third quarters of each fiscal year. The Form N-Q will be available on the Eaton Vance website www.eatonvance.com, by calling Eaton Vance at 1-800-262-1122 or in the EDGAR database on the SEC's website at www.sec.gov. Form N-Q may also be reviewed and copied at the SEC's public reference room in Washington, D.C. (call 1-800-732-0330 for information on the operation of the public reference room).
Proxy Voting. From time to time, funds are required to vote proxies related to the securities held by the funds. The Eaton Vance Funds or their underlying Portfolios (if applicable) vote proxies according to a set of policies and procedures approved by the Funds' and Portfolios' Boards. You may obtain a description of these policies and procedures and information on how the Funds or Portfolios voted proxies relating to Portfolio securities during the most recent 12 month period ended June 30, without charge, upon request, by calling 1-800-262-1122. This description is also available on the SEC's website at www.sec.gov.
Eaton Vance Diversified Income Fund as of October 31, 2005
MANAGEMENT’S DISCUSSION OF FUND PERFORMANCE
The Fund
Performance for the Period Since Inception on December 7, 2004
• The Fund’s Class A shares had a total return of 3.29% during the period from inception on December 7, 2004 through October 31, 2005.(1) This return resulted from a decrease in net asset value per share (NAV) to $9.76 on October 31, 2005 from $10.00 on December 7, 2004, and the reinvestment of $0.562 in dividends.
• The Fund’s Class B shares had a total return of 2.49% during the period from inception on December 7, 2004 through October 31, 2005.(1) This return resulted from a decrease in NAV to $9.75 on October 31, 2005 from $10.00 on December 7, 2004, and the reinvestment of $0.495 in dividends.
• The Fund’s Class C shares had a total return of 2.49% during the period from inception on December 7, 2004 through October 31, 2005.(1) This return resulted from a decrease in NAV to $9.75 on October 31, 2005 from $10.00 on December 7, 2004, and the reinvestment of $0.495 in dividends.
• In comparison, the Lehman Intermediate Government Bond Index – an unmanaged index of U.S. government bonds with maturities between one and 10 years – had a total return of 0.66% during the period from December 31, 2004 through October 31, 2005.(2) The Merrill Lynch U.S. High Yield Master II Index – an unmanaged index of below-investment-grade U.S. dollar- denominated corporate bonds publicly issued in the U.S. domestic market – had a total return of 1.32% during the same period.(2) The S&P/LSTA Leveraged Loan Index – an unmanaged index of U.S. dollar denominated leveraged loans – had a total return of 4.09% during the same period.(2)
Management Discussion
• The Fund’s investment objective is to provide a high level of current income. The Fund may, as a secondary objective, also seek capital appreciation to the extent consistent with its primary objective of high current income. The Fund is structured as a “fund-of-funds” and, accordingly, currently pursues its objectives by investing its assets in three registered investment companies (each, a “Portfolio”) managed by Eaton Vance Management or its affiliates: Boston Income Portfolio, which normally invests primarily in high-yield, high-risk corporate bonds; Floating Rate Portfolio, which normally invests primarily in interests in senior floating-rate loans; and Government Obligations Portfolio, which normally invests primarily in U.S. Government-issued or mortgage-backed securities (MBSs).
• The Portfolio’s high-yield investments were buffeted by a market setback in March 2005 that was sparked by a downgrade of Ford and General Motors corporate debt, as well as concerns about rising energy costs and high valuations. Spreads on highyield bonds rose to 425 basis points (4.25%) above Treasuries. Conditions improved during the summer and into the fall, however, and spreads narrowed to approximately 3.60% over Treasuries at October 31,2005. Performance benefited from solid contributions in the telecom sector, particularly wireless companies, while paper and packaging, which were underweighted, detracted from absolute returns.
• The loan market performed well, as short-term interest rates rose throughout the fiscal year. The London Inter-Bank Offered Rate (LIBOR) – the benchmark over which loan interest rates are set – kept pace with the Federal Reserve’s rate hikes, rising significantly during the period. Yield spreads narrowed to just below their historical range. The loan market outperformed the high-yield bond market during the fiscal year. In the wake of Hurricanes Katrina and Rita, management identified approximately 10 companies that were directly impacted by the storms and reduced exposure to the hardest-hit companies, generally at prices above par.
• Within the MBS segment, the Portfolio’s investments remained focused on seasoned MBSs. Yield spreads on seasoned MBSs narrowed significantly relative to Treasuries, partially offsetting the Federal Reserve rate hikes and helping the Fund’s MBS holdings to make a positive contribution to its relative returns. In spite of significant tightening, spreads remain above their historical lows. Prepayment rates fell to near 25% by October 31, 2005, well below their peak around 50% in December 2003. The decline in prepayment rates was welcome news to MBS investors.
The views expressed throughout this report are those of the portfolio managers and are current only through the end of the period of the report as stated on the cover. These views are subject to change at any time based upon market or other conditions, and the investment adviser disclaims any responsibility to update such views. These views may not be relied on as investment advice and, because investment decisions for a fund are based on many factors, may not be relied on as an indication of trading intent on behalf of any Eaton Vance fund.
Shares of the Fund are not insured by the FDIC and are not deposits or other obligations of, or guaranteed by, any depository institution. Shares are subject to investment risks, including possible loss of principal invested. Yield will vary.
(1) These returns do not include the 4.75% maximum sales charge for the Fund’s Class A shares or the applicable contingent deferred sales charges (CDSC) for Class B shares and Class C shares. If sales charges were deducted, returns would be lower.
(2) It is not possible to invest directly in an Index. The Indices’ total returns do not reflect the commissions or expenses that would have been incurred if an investor individually purchased or sold the securities represented in the Indexes. Index returns are available as of month-end only.
Past performance is no guarantee of future results. Returns are historical and are calculated by determining the percentage change in net asset value or offering price (as applicable) with all distributions reinvested. Investment return and principal value will fluctuate so that shares, when redeemed, may be worth more or less than their original cost. Performance is for the stated time period only; due to market volatility, the Fund’s current performance may be lower or higher than the quoted return. For performance as of the most recent month-end, please refer to www.eatonvance.com.
2
Eaton Vance Diversified Income Fund as of October 31, 2005
FUND PERFORMANCE
The line graph and table set forth below provide information about the Fund’s performance. The line graph compares the performance of Class A of the Fund with that of the Lehman Intermediate Government Bond Index, an unmanaged index of U.S. government bonds with maturities between one and 10 years; the Merrill Lynch U.S. High Yield Master II Index, an unmanaged index of below-investment-grade U.S. dollar-denominated corporate bonds publicly issued in the U.S. domestic market; and the S&P/LSTA Leveraged Loan Index, an unmanaged index of U.S. dollar-denominated leveraged loans. The lines on the graph represent the total returns of a hypothetical investment of $10,000 in each of Class A and the Lehman Intermediate Government Bond Index, the Merrill Lynch U.S. High Yield Master II Index and the S&P/LSTA Leveraged Loan Index. Class A total returns are presented at net asset value and maximum public offering price (POP). The table includes the total returns of each Class of the Fund at net asset value and public offering price. The performance presented below does not reflect the deduction of taxes, if any, that a shareholder would pay on distributions or redemptions of Fund shares.
Performance(1) | | Class A | | Class B | | Class C | |
| | | | | | | |
Average Annual Total Returns (at net asset value) | | | | | | | |
Life of Fund† | | 3.29 | % | 2.49 | % | 2.49 | % |
| | | | | | | |
SEC Average Annual Total Returns (including sales charge or applicable CDSC) | | | | | | | |
Life of Fund† | | -1.63 | % | -2.38 | % | 1.52 | % |
†Inception dates: Class A: 12/7/04; Class B: 12/7/04; Class C: 12/7/04
(1) Average Annual Total Returns do not include the 4.75% maximum sales charge for Class A shares or the applicable contingent deferred sales charges (CDSC) for Class B or Class C shares. If sales charges were deducted, returns would be lower. SEC returns for Class A reflect the maximum 4.75% sales charge. SEC returns for Class B reflect applicable CDSC based on the following schedule: 5% - 1st and 2nd years; 4% - 3rd year; 3% - 4th year; 2% - 5th year; 1% - 6th year. SEC 1-year return for Class C reflects a 1% CDSC.
Past performance is no guarantee of future results. Returns are historical and are calculated by determining the percentage change in net asset value or offering price (as applicable) with all distributions reinvested. Investment return and principal value will fluctuate so that shares, when redeemed, may be worth more or less than their original cost. Performance is for the stated time period only; due to market volatility, the Fund’s current performance may be lower or higher than the quoted return. For performance as of the most recent month-end, please refer to www.eatonvance.com.
Diversification by Sectors(2)
By Total Investments
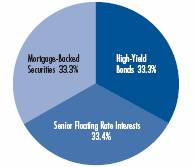
(2) As of October 31, 2005. Sectors are shown as a percentage of the Fund’s total investments. Fund allocations as a percentage of the Fund’s net assets amounted to 110% as of 10/31/05. Fund statistics may not be representative of the Portfolio’s current or future investments and are subject to change due to active management.
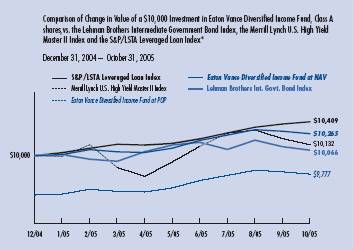
* Source: Thomson Financial. Class A of the Fund commenced investment operations on 12/7/04.
A $10,000 hypothetical investment on 12/7/04 at net asset value in Class B shares and Class C shares, respectively, would have been valued at $10,249 ($9,761 after deduction of the applicable CDSC) and $10,249 ($10,151after deduction of the applicable CDSC), respectively, on 10/31/05. It is not possible to invest directly in an Index. The Indices’ total returns do not reflect commissions or expenses that would have been incurred if an investor individually purchased or sold the securities represented in the Indices. Index returns are available as of month-end only.
3
Eaton Vance Diversified Income Fund as of October 31, 2005
FUND EXPENSES
Example: As a shareholder of the Fund, you incur two types of costs: (1) transaction costs, including sales charges (loads) on purchases and redemption fees (if applicable); and (2) ongoing costs, including management fees; distribution or service fees; and other Fund expenses. This Example is intended to help you understand your ongoing costs (in dollars) of investing in the Fund and to compare these costs with the ongoing costs of investing in other mutual funds. The Example is based on an investment of $1,000 invested at the beginning of the period and held for the entire period (May 1, 2005 – October 31, 2005).
Actual Expenses: The first section of the table below provides information about actual account values and actual expenses. You may use the information in this line, together with the amount you invested, to estimate the expenses that you paid over the period. Simply divide your account value by $1,000 (for example, an $8,600 account value divided by $1,000 = 8.6), then multiply the result by the number in the first line under the heading entitled “Expenses Paid During Period” to estimate the expenses you paid on your account during this period.
Hypothetical Example for Comparison Purposes: The second section of the table below provides information about hypothetical account values and hypothetical expenses based on the Fund’s actual expense ratios and an assumed rate of return of 5% per year before expenses, which is not the actual return of the Fund. The hypothetical account values and expenses may not be used to estimate the actual ending account balance or expenses you paid for the period. You may use this information to compare the ongoing costs of investing in the Fund and other funds. To do so, compare this 5% hypothetical example with the 5% hypothetical examples that appear in the shareholder reports of the other funds.
Please note that the expenses shown in the table are meant to highlight your ongoing costs only and do not reflect any transactional costs, such as sales charges (loads) or redemption fees (if applicable). Therefore, the second section of the table is useful in comparing ongoing costs only, and will not help you determine the relative total costs of owning different funds. In addition, if these transactional costs were included, your costs would have been higher.
Eaton Vance Diversified Income Fund
| | Beginning Account Value | | Ending Account Value | | Expenses Paid During Period* | |
| | (5/1/05) | | (10/31/05) | | (5/1/05 – 10/31/05) | |
| | | | | | | |
Actual | | | | | | | |
Class A | | $ | 1,000.00 | | $ | 1,022.60 | | $ | 5.88 | |
Class B | | $ | 1,000.00 | | $ | 1,018.70 | | $ | 9.77 | |
Class C | | $ | 1,000.00 | | $ | 1,018.70 | | $ | 9.77 | |
| | | | | | | |
Hypothetical | | | | | | | |
(5% return before expenses) | | | | | | | |
Class A | | $ | 1,000.00 | | $ | 1,022.10 | | $ | 5.88 | |
Class B | | $ | 1,000.00 | | $ | 1,018.30 | | $ | 9.76 | |
Class C | | $ | 1,000.00 | | $ | 1,018.30 | | $ | 9.76 | |
* Expenses are equal to the Fund’s annualized expense ratio of 1.04% for Class A shares, 1.73% for Class B shares and 1.73% for Class C shares, multiplied by the average account value over the period, multiplied by 184/365 (to reflect the one-half-year period). The example assumes that the $1,000 was invested at the net asset value per share determined at the close of business on April 30, 2005. The Example reflects the expenses of the Fund and the Portfolios.
4
Eaton Vance Diversified Income Fund as of October 31, 2005
FINANCIAL STATEMENTS
Statement of Assets and Liabilities
As of October 31, 2005
| Assets | |
Investment in Boston Income Portfolio, at value
(identified cost, $66,370,730) | | $ | 65,559,779 | | |
Investment in Floating Rate Portfolio, at value
(identified cost, $65,774,006) | | | 65,782,696 | | |
Investment in Government Obligations Portfolio, at value
(identified cost, $65,992,454) | | | 65,660,740 | | |
| Receivable for Fund shares sold | | | 2,310,548 | | |
| Receivable from the Administrator | | | 26,533 | | |
| Prepaid expenses | | | 27,076 | | |
| Total assets | | $ | 199,367,372 | | |
| Liabilities | |
| Dividends payable | | $ | 301,033 | | |
| Payable for Fund shares redeemed | | | 278,703 | | |
| Payable to affiliate for distribution and service fees | | | 111,112 | | |
| Payable to affiliate for Trustees' fees | | | 226 | | |
| Accrued expenses | | | 85,899 | | |
| Total liabilities | | $ | 776,973 | | |
| Net Assets | | $ | 198,590,399 | | |
| Sources of Net Assets | |
| Paid-in capital | | $ | 200,906,329 | | |
Accumulated net realized loss from Portfolios
(computed on the basis of identified cost) | | | (1,215,453 | ) | |
| Undistributed net investment income | | | 33,498 | | |
Net unrealized depreciation from Portfolios
(computed on the basis of identified cost) | | | (1,133,975 | ) | |
| Total | | $ | 198,590,399 | | |
| Class A Shares | |
| Net Assets | | $ | 86,857,537 | | |
| Shares Outstanding | | | 8,899,479 | | |
Net Asset Value and Redemption Price Per Share
(net assets ÷ shares of beneficial interest outstanding) | | $ | 9.76 | | |
Maximum Offering Price Per Share
(100 ÷ 95.25 of $9.76) | | $ | 10.25 | | |
| Class B Shares | |
| Net Assets | | $ | 21,926,472 | | |
| Shares Outstanding | | | 2,248,674 | | |
Net Asset Value, Offering Price and Redemption Price Per Share
(net assets ÷ shares of beneficial interest outstanding) | | $ | 9.75 | | |
| Class C Shares | |
| Net Assets | | $ | 89,806,390 | | |
| Shares Outstanding | | | 9,208,517 | | |
Net Asset Value, Offering Price and Redemption Price Per Share
(net assets ÷ shares of beneficial interest outstanding) | | $ | 9.75 | | |
| On sales of $25,000 or more, the offering price of Class A shares is reduced. | |
Statement of Operations
For the Period Ended
October 31, 2005(1)
| Investment Income | |
| Interest and other income allocated from Portfolios | | $ | 5,053,245 | | |
| Dividends allocated from Portfolios | | | 16,159 | | |
| Security lending income allocated from Portfolios | | | 54,770 | | |
| Expenses allocated from Portfolios | | | (552,294 | ) | |
| Net investment income from Portfolios | | $ | 4,571,880 | | |
| Expenses | |
| Trustees' fees and expenses | | $ | 1,160 | | |
| Distribution and service fees | | | | | |
| Class A | | | 96,069 | | |
| Class B | | | 94,376 | | |
| Class C | | | 371,111 | | |
| Registration fees | | | 89,398 | | |
| Transfer and dividend disbursing agent fees | | | 60,587 | | |
| Custodian fee | | | 52,010 | | |
| Legal and accounting services | | | 37,694 | | |
| Printing and postage | | | 14,555 | | |
| Miscellaneous | | | 5,882 | | |
| Total expenses | | $ | 822,842 | | |
Deduct —
Allocation of expenses to the Administrator | | $ | 26,533 | | |
| Total expense reductions | | $ | 26,533 | | |
| Net expenses | | $ | 796,309 | | |
| Net investment income | | $ | 3,775,571 | | |
Realized and Unrealized
Gain (Loss) from Portfolios | |
Net realized gain (loss) —
Investment transactions (identified cost basis) | | $ | (665,404 | ) | |
| Financial futures contracts | | | 19,597 | | |
| Swap contracts | | | 4,169 | | |
Foreign currency and forward foreign currency exchange
contract transactions | | | 47,164 | | |
| Net realized loss | | $ | (594,474 | ) | |
Change in unrealized appreciation (depreciation) —
Investments (identified cost basis) | | $ | (1,229,039 | ) | |
| Financial futures contracts | | | 43,885 | | |
| Swap contracts | | | 14,554 | | |
| Foreign currency and forward foreign currency exchange contracts | | | 36,625 | | |
| Net change in unrealized appreciation (depreciation) | | $ | (1,133,975 | ) | |
| Net realized and unrealized loss | | $ | (1,728,449 | ) | |
| Net increase in net assets from operations | | $ | 2,047,122 | | |
(1) For the period from the start of business, December 07, 2004, to October 31, 2005.
See notes to financial statements
5
Eaton Vance Diversified Income Fund as of October 31, 2005
FINANCIAL STATEMENTS CONT'D
Statement of Changes in Net Assets
Increase (Decrease)
in Net Assets | | Period Ended
October 31, 2005(1) | |
From operations —
Net investment income | | $ | 3,775,571 | | |
Net realized loss from investments transactions, financial futures
contracts, swap contracts, and foreign currency and forward
foreign currency exchange contract transactions | | | (594,474 | ) | |
Net change in unrealized depreciation from investments, financial
futures contracts, swap contracts, and foreign currency and
forward foreign currency exchange contract | | | (1,133,975 | ) | |
| Net increase in net assets from operations | | $ | 2,047,122 | | |
Distributions to shareholders —
From net investment income
Class A | | $ | (2,369,812 | ) | |
| Class B | | | (512,591 | ) | |
| Class C | | | (2,006,640 | ) | |
| Total distributions to shareholders | | $ | (4,889,043 | ) | |
Transactions in shares of beneficial interest —
Proceeds from sale of shares
Class A | | $ | 98,157,284 | | |
| Class B | | | 23,479,760 | | |
| Class C | | | 92,621,826 | | |
Net asset value of shares issued to
shareholders in payment of
distributions declared
Class A | | | 1,714,177 | | |
| Class B | | | 303,413 | | |
| Class C | | | 1,295,084 | | |
Cost of shares redeemed
Class A | | | (11,713,909 | ) | |
| Class B | | | (1,540,982 | ) | |
| Class C | | | (2,884,333 | ) | |
| Net increase in net assets from Fund share transactions | | $ | 201,432,320 | | |
| Net increase in net assets | | $ | 198,590,399 | | |
| Net Assets | |
| At beginning of period | | $ | — | | |
| At end of period | | $ | 198,590,399 | | |
Undistributed net investment
income included in net assets | |
| At end of period | | $ | 33,498 | | |
(1) For the period from the start of business, December 7, 2004, to October 31, 2005.
See notes to financial statements
6
Eaton Vance Diversified Income Fund as of October 31, 2005
FINANCIAL STATEMENTS CONT'D
Financial Highlights
| | | Class A | |
| | | Period Ended
October 31, 2005(1)(2) | |
| Net asset value — Beginning of period | | $ | 10.000 | | |
| Income (loss) from operations | |
| Net investment income | | $ | 0.430 | | |
| Net realized and unrealized loss | | | (0.108 | ) | |
| Total income from operations | | $ | 0.322 | | |
| Less distributions | |
| From net investment income | | $ | (0.562 | ) | |
| Total distributions | | $ | (0.562 | ) | |
| Net asset value — End of period | | $ | 9.760 | | |
| Total Return(3) | | | 3.29 | % | |
| Ratios/Supplemental Data† | |
| Net assets, end of period (000's omitted) | | $ | 86,858 | | |
| Ratios (As a percentage of average daily net assets): | |
| Net expenses(4) | | | 1.17 | %(5) | |
| Net expenses after custodian fee reduction(4) | | | 1.17 | %(5) | |
| Net investment income | | | 4.84 | %(5) | |
| Portfolio Turnover of the Boston Income Portfolio | | | 71 | % | |
| Portfolio Turnover of the Floating Rate Portfolio | | | 57 | % | |
| Portfolio Turnover of the Government Obligations Portfolio | | | 30 | % | |
† The operating expenses of the Portfolios may reflect reductions of their investment adviser fee. The operating expenses of the Fund reflect an allocation of expenses to the
Administrator. Had such action not been taken, the ratios and net investment income per share would have been as follows:
| Ratios (As a percentage of average daily net assets): | |
| Expenses(4) | | | 1.20 | %(5) | |
| Expenses after custodian fee reduction(4) | | | 1.20 | %(5) | |
| Net investment income | | | 4.81 | %(5) | |
| Net investment income per share | | $ | 0.427 | | |
(1) For the period from the commencement of operations, December 7, 2004, to October 31, 2005.
(2) Net investment income per share was computed using average shares outstanding.
(3) Returns are historical and are calculated by determining the percentage change in net asset value with all distributions reinvested. Total return is not computed on an annualized basis.
(4) Includes the Fund's share of the Portfolios' allocated expenses.
(5) Annualized.
See notes to financial statements
7
Eaton Vance Diversified Income Fund as of October 31, 2005
FINANCIAL STATEMENTS CONT'D
Financial Highlights
| | | Class B | |
| | | Period Ended
October 31, 2005(1)(2) | |
| Net asset value — Beginning of period | | $ | 10.000 | | |
| Income (loss) from operations | |
| Net investment income | | $ | 0.365 | | |
| Net realized and unrealized loss | | | (0.120 | ) | |
| Total income from operations | | $ | 0.245 | | |
| Less distributions | |
| From net investment income | | $ | (0.495 | ) | |
| Total distributions | | $ | (0.495 | ) | |
| Net asset value — End of period | | $ | 9.750 | | |
| Total Return(3) | | | 2.49 | % | |
| Ratios/Supplemental Data† | |
| Net assets, end of period (000's omitted) | | $ | 21,926 | | |
| Ratios (As a percentage of average daily net assets): | |
| Net expenses(4) | | | 1.92 | %(5) | |
| Net expenses after custodian fee reduction(4) | | | 1.92 | %(5) | |
| Net investment income | | | 4.11 | %(5) | |
| Portfolio Turnover of the Boston Income Portfolio | | | 71 | % | |
| Portfolio Turnover of the Floating Rate Portfolio | | | 57 | % | |
| Portfolio Turnover of the Government Obligations Portfolio | | | 30 | % | |
† The operating expenses of the Portfolios may reflect reductions of their investment adviser fee. The operating expenses of the Fund reflect an allocation of expenses to the
Administrator. Had such action not been taken, the ratios and net investment income per share would have been as follows:
| Ratios (As a percentage of average daily net assets): | |
| Expenses(4) | | | 1.95 | %(5) | |
| Expenses after custodian fee reduction(4) | | | 1.95 | %(5) | |
| Net investment income | | | 4.08 | %(5) | |
| Net investment income per share | | $ | 0.362 | | |
(1) For the period from the commencement of operations, December 7, 2004, to October 31, 2005.
(2) Net investment income per share was computed using average shares outstanding.
(3) Returns are historical and are calculated by determining the percentage change in net asset value with all distributions reinvested. Total return is not computed on an annualized basis.
(4) Includes the Fund's share of the Portfolios' allocated expenses.
(5) Annualized.
See notes to financial statements
8
Eaton Vance Diversified Income Fund as of October 31, 2005
FINANCIAL STATEMENTS CONT'D
Financial Highlights
| | | Class C | |
| | | Period Ended
October 31, 2005(1)(2) | |
| Net asset value — Beginning of period | | $ | 10.000 | | |
| Income (loss) from operations | |
| Net investment income | | $ | 0.362 | | |
| Net realized and unrealized loss | | | (0.117 | ) | |
| Total income from operations | | $ | 0.245 | | |
| Less distributions | |
| From net investment income | | $ | (0.495 | ) | |
| Total distributions | | $ | (0.495 | ) | |
| Net asset value — End of period | | $ | 9.750 | | |
| Total Return(3) | | | 2.49 | % | |
| Ratios/Supplemental Data† | |
| Net assets, end of period (000's omitted) | | $ | 89,806 | | |
| Ratios (As a percentage of average daily net assets): | |
| Net expenses(4) | | | 1.92 | %(5) | |
| Net expenses after custodian fee reduction(4) | | | 1.92 | %(5) | |
| Net investment income | | | 4.08 | %(5) | |
| Portfolio Turnover of the Boston Income Portfolio | | | 71 | % | |
| Portfolio Turnover of the Floating Rate Portfolio | | | 57 | % | |
| Portfolio Turnover of the Government Obligations Portfolio | | | 30 | % | |
† The operating expenses of the Portfolios may reflect reductions of their investment adviser fee. The operating expenses of the Fund reflect an allocation of expenses to the
Administrator. Had such action not been taken, the ratios and net investment income per share would have been as follows:
| Ratios (As a percentage of average daily net assets): | |
| Expenses(4) | | | 1.95 | %(5) | |
| Expenses after custodian fee reduction(4) | | | 1.95 | %(5) | |
| Net investment income | | | 4.05 | %(5) | |
| Net investment income per share | | $ | 0.359 | | |
(1) For the period from the commencement of operations, December 7, 2004, to October 31, 2005.
(2) Net investment income per share was computed using average shares outstanding.
(3) Returns are historical and are calculated by determining the percentage change in net asset value with all distributions reinvested. Total return is not computed on an annualized basis.
(4) Includes the Fund's share of the Portfolios' allocated expenses.
(5) Annualized.
See notes to financial statements
9
Eaton Vance Diversified Income Fund as of October 31, 2005
NOTES TO FINANCIAL STATEMENTS
1 Significant Accounting Policies
Eaton Vance Diversified Income Fund (the Fund) is a diversified series of Eaton Vance Mutual Funds Trust (the Trust). The Trust is an entity of the type commonly known as a Massachusetts business trust and is registered under the Investment Company Act of 1940, as amended, as an open-end management investment company. The Fund was organized under the laws of the Commonwealth of Massachusetts by an Agreement and Declaration of Trust dated December 7, 2004. The Fund offers three classes of shares. Class A shares are generally sold subject to a sales charge imposed at time of purchase. Class B and Class C shares are sold at net asset value and are generally subject to a contingent deferred sales charge (see Note 6). Class B shares held for eight years will automatically convert to Class A shares. Each class represents a pro rata interest in the Fund, but votes separately on class-specific matters and (as noted below) is subject to different expenses. Realized and unrealized gains and losses and net investment income and losses, other than class-specific expenses, are allocated daily to each class of shares based on the relative net assets of each class to the total net assets of the Fund. Each class of shares differs in its distribution plan and certain other class-specific expenses. The Fund currently invests all of its investable assets in the following three registered investment companies (each, a Portfolio) managed by Eaton Vance or its affiliates: Boston Income Portfolio, Floating Rate Portfolio, and Government Obligations Portfolio (the Portfolios). Each Portfolio is organized as a New York Trust. The investment objectives and policies of the Portfolios together are the same as those of the Fund. The value of the Fund's investment in each Portfolio reflects the Fund's proportionate interest in the net assets of the Boston Income Portfolio, Floating Rate Portfolio, and Government Obligations Portfolio (3.9%, 1.0%, and 7.6%, resp ectively, at October 31, 2005. The performance of the Fund is directly affected by the performance of the Portfolios. A copy of each Portfolio's financial statements is available on the EDGAR Database on the Securities and Exchange Commission's website (www.sec.gov), at the Commission's public reference room in Washington, DC or upon request from the Fund's principal underwriter, Eaton Vance Distributors Inc. (EVD), by calling 1-800-225-6265.
The following is a summary of significant accounting policies consistently followed by the Fund in the preparation of its financial statements. The policies are in conformity with accounting principles generally accepted in the United States of America.
A Investment Valuation — Boston Income Portfolio's valuation policies are as follows: Investments listed on securities exchanges or NASDAQ are valued at closing sale prices. Listed or unlisted investments for which closing sale prices are not available are valued at the mean between the latest bid and asked prices. Fixed income investments and senior floating-rate loan interests (other than short-term obligations), including listed investments and investments for which quotations are available, will normally be valued on the basis of market valuations furnished by a pricing service. Short-term obligations, maturing in sixty days o r less, are valued at amortized cost, which approximates value. Investments for which there is no quotation or valuation are valued at fair value using methods determined in good faith by or at the direction of the Trustees. Floating Rate Portfolio's valuation policies are as follows: The Portfolio's investments are primarily in interests in senior floating rate loans (Senior Loans). Certain Senior Loans are deemed to be liquid because reliable market quotations are readily available for them. Liquid Senior Loans are valued on the basis of prices furnished by a pricing service. Other Senior Loans are valued at fair value by the Fund's investment adviser under procedures approved by the Trustees. In connection with determining the fair value of a Senior Loan, the investment adviser makes an assessment of the likelihood that the borrower will make a full repayment of the Senior Loan. The primary factors considered by the investment adviser when making this assessment are (i) the creditworthiness of the borrowe r, (ii) the value of the collateral backing the Senior Loan, and (iii) the priority of the Senior Loan versus other creditors of the borrower. If, based on its assessment, the investment adviser believes there is a reasonable likelihood that the borrower will make a full repayment of the Senior Loan, the investment adviser will determine the fair value of the Senior Loan using a Matrix pricing approach that considers the yield on the Senior Loan relative to yields on other loan interests issued by companies of comparable credit quality. If, based on its assessment, the investment adviser believes there is not a reasonable likelihood that the borrower will make a full repayment of the Senior Loan, the investment adviser will determine the fair value of the Senior Loan using analyses that include but are not limited to (i) a comparison of the value of the borrower's outstanding equity and debt to that of comparable public companies; (ii) a discounted cash flow analysis; or (iii) when the investment adviser bel ieves it is likely that a borrower will be liquidated or sold, an analysis of the terms of such liquidation or sale. In certain cases, the investment adviser will use a combination of analytical methods to determine fair value, such as when only a portion of a borrower's assets are likely to be sold. In conducting its assessment and analyses for purposes of determining fair value of a Senior Loan, the investment adviser will use its discretion and judgment in considering and appraising such factors, data and information and the
10
Eaton Vance Diversified Income Fund as of October 31, 2005
NOTES TO FINANCIAL STATEMENTS CONT'D
relative weight to be given thereto as it deems relevant, including without limitation, some or all of the following: (i) the fundamental characteristics of and fundamental analytical data relating to the Senior Loan, including the cost, size, current interest rate, maturity and base lending rate of the Senior Loan, the terms and conditions of the Senior Loan and any related agreements, and the position of the Senior Loan in the Borrower's debt structure; (ii) the nature, adequacy and value of the collateral securing the Senior Loan, including the Portfolio's rights, remedies and interests with respect to the collateral; (iii) the creditworthiness of the Borrower, based on an evaluation of its financial condition, financial statements and information about the Borrower's business, cash flows, capital structure and future prospects; (iv) information relating to the market for the Senior Loan including price quotations for and tra ding in the Senior Loan and interests in similar Senior Loans and the market environment and investor attitudes towards the Senior Loan and interests in similar Senior Loans; (v) the experience, reputation, stability and financial condition of the Agent and any intermediate participants in the Senior Loan; and (vi) general economic and market conditions affecting the fair value of the Senior Loan. Other portfolio securities (other than short-term obligations, but including listed issues) may be valued on the basis of prices furnished by one or more pricing services which determine prices for normal, institutional-size trading units of such securities which may use market information, transactions for comparable securities and various relationships between securities which are generally recognized by institutional traders. The value of interest rate swaps will be based on dealer quotations. Short-term obligations which mature in sixty days or less are valued at amortized cost, if their original term to maturi ty when acquired by the Portfolio was 60 days or less or are valued at amortized cost using their value on the 61st day prior to maturity, if their original term to maturity when acquired by the Portfolio was more then 60 days, unless in each case this is determined not to represent fair value. OTC options are valued at the mean between the bid and the asked price provided by dealers. Financial futures contracts listed on the commodity exchanges and exchange traded options are valued at closing settlement prices. Repurchase agreements are valued at cost plus accrued interest. Other portfolio securities for which there are no quotations or valuations are valued at fair value as determined in good faith by or at the direction of the Trustees. Government Obligations Portfolio's valuation policies are as follows: Debt securities (including collateralized mortgage obligations and certain mortgage backed securities ("MBS") normally are valued by independent pricing services. The pricing services consider various f actors relating to bonds or loans and/or market transactions to determine market value. Most seasoned MBS are valued by the investment adviser's matrix pricing system. The matrix pricing system also considers various factors relating to bonds and market transactions to determine market value. Options are valued at last sale price on a U.S. exchange or board of trade or, in the absence of a sale, at the mean between the last bid and asked price. Financial futures contracts listed on commodity exchanges are valued at closing settlement prices. Securities for which there is no such quotation or valuation are valued at fair value using methods determined in good faith by or at the direction of the Trustees. Short-term obligations having remaining maturities of 60 days or less are valued at amortized cost, which approximates value.
B Income — The Fund's net investment income or loss consists of the Fund's pro-rata share of the net investment income or loss of the Portfolios, less all actual and accrued expenses of the Fund, determined in accordance with accounting principles generally accepted in the United States of America.
C Expenses — The majority of expenses of the Trust are directly identifiable to an individual fund. Expenses which are not readily identifiable to a specific fund are allocated taking into consideration, among other things, the nature and type of expense and the relative size of the fund.
D Federal Taxes — The Fund's policy is to comply with the provisions of the Internal Revenue Code applicable to regulated investment companies and to distribute to shareholders each year all of its taxable income, including any net realized gain on investments. Accordingly, no provision for federal income or excise tax is necessary. At October 31, 2005, the Fund, for federal income tax purposes, had a capital loss carryover of $1,151,435 which will reduce the taxable income arising from future net realized gain on investments, if any, to the extent permitted by the Internal Revenue Code and thus will reduce the amount of distributions to shareholders which would otherwise be necessary to relieve the F und of any liability for federal income or excise tax. Such capital loss carryover will expire on October 31, 2013.
E Expense Reduction — Investors Bank & Trust Company (IBT) serves as custodian to the Fund. Pursuant to the custodian agreement, IBT receives a fee reduced by credits which are determined based on the average daily cash balance the Fund maintains with IBT. All credit balances used to reduce the Fund's custodian fees are reported as a reduction of total expenses in the Statement of Operations.
F Indemnifications — Under the Trust's organizational documents, its officers and Trustees may be indemnified against certain liabilities and expenses arising out of the performance of their duties to the Fund, and
11
Eaton Vance Diversified Income Fund as of October 31, 2005
NOTES TO FINANCIAL STATEMENTS CONT'D
shareholders are indemnified against personal liability for obligations of the Trust. Additionally, in the normal course of business, the Fund enters into agreements with service providers that may contain indemnification clauses. The Fund's maximum exposure under these arrangements is unknown as this would involve future claims that may be made against the Fund that have not yet occurred.
G Use of Estimates — The preparation of the financial statements in conformity with accounting principles generally accepted in the United States of America requires management to make estimates and assumptions that affect the reported amounts of assets and liabilities at the date of the financial statements and the reported amounts of income and expense during the reporting period. Actual results could differ from those estimates.
2 Distributions to Shareholders
The Fund declares dividends daily to shareholders of record at the time of declaration. Distributions are paid monthly. Distributions of allocated realized capital gains, if any, are made at least annually. Shareholders may reinvest all distributions in shares of the same class of the Fund at the net asset value as of the close of business on the ex-dividend date. Distributions are paid in the form of additional shares of the same class of the Fund or, at the election of the shareholder, in cash. The Fund distinguishes between distributions on a tax basis and a financial reporting basis. Accounting principles generally accepted in the United States of America require that only distributions in excess of tax basis earnings and profits be reported in the financial statements as a return of capital. Differences between book and tax accounting relating to distributions primarily relate to the different treatment for pay down gains/l osses on mortgage-backed securities by the Portfolios and premium amortization. Permanent differences between book and tax accounting relating to distributions are reclassified to paid-in capital.
The tax character of distributions paid for the period from the start of business, December 7, 2004 to October 31, 2005, was as follows:
Distributions declared from:
| Ordinary income: | | $ | 4,889,043 | | |
For the period from the start of business, December 7, 2004 to October 31, 2005, accumulated paid-in-capital was decreased by $525,991, accumulated distributions in excess of net investment income was decreased by $1,146,970, resulting in undistributed net investment income, and accumulated net realized loss was increased by $620,979 12primarily due to differences between book and tax accounting for amortization/accretion, paydown losses and foreign currency transactions. This change had no effect on the net assets or the net asset value per share.
As of October 31, 2005 the components of distributable earnings (accumulated losses) on a tax basis were as follows:
| Undistributed ordinary income | | $ | 334,531 | | |
| Capital loss carryforwards | | $ | (1,151,435 | ) | |
The differences between components of distributable earnings (accumulated losses) on a tax basis and the amounts reflected in the statement of assets and liabilities are primarily due to differences in book and tax policies for financial future contracts, the timing of recognizing distributions and wash sales.
3 Shares of Beneficial Interest
The Fund's Declaration of Trust permits the Trustees to issue an unlimited number of full and fractional shares of beneficial interest (without par value). Such shares may be issued in a number of different series (such as the Fund) and classes. Transactions in Fund shares for the period from the start of business, December 7, 2004 to October 31, 2005, were as follows:
| Class A | | Period Ended
October 31, 2005 | |
| Sales | | | 9,912,542 | | |
Issued to shareholders electing to receive
payments of distributions in Fund shares | | | 173,874 | | |
| Redemptions | | | (1,186,937 | ) | |
| Net increase | | | 8,899,479 | | |
| Class B | | Period Ended
October 31, 2005 | |
| Sales | | | 2,374,101 | | |
Issued to shareholders electing to receive
payments of distributions in Fund shares | | | 30,814 | | |
| Redemptions | | | (156,241 | ) | |
| Net increase | | | 2,248,674 | | |
| Class C | | Period Ended
October 31, 2005 | |
| Sales | | | 9,369,671 | | |
Issued to shareholders electing to receive
payments of distributions in Fund shares | | | 131,513 | | |
| Redemptions | | | (292,667 | ) | |
| Net increase | | | 9,208,517 | | |
12
Eaton Vance Diversified Income Fund as of October 31, 2005
NOTES TO FINANCIAL STATEMENTS CONT'D
4 Investment Advisor Fee and other Transactions with Affiliates
Eaton Vance Management (EVM) serves as the investment adviser and administrator of the Fund, providing the Fund with investment advisory services (relating to the investment of the Fund's assets in the Portfolios). EVM does not receive a fee for serving as the Fund's investment adviser and administrator. To enhance the net income of the Fund, EVM was allocated $26,533 of the Fund's operating expenses for the period from the start of business, December 7, 2004 to October 31, 2005. The Portfolios have engaged Boston Management & Research (BMR), a subsidiary of EVM, to render investment advisory services and the Fund is allocated its share of the investment advisory fee paid by each Portfolio in which it invests.
Except for Trustees of the Fund and the Portfolios who are not members of EVM's organization, officers and Trustees receive remuneration for their services to the Fund out of the investment adviser fee. Trustees of the Fund who are not affiliated with EVM may elect to defer receipt of all or a percentage of their annual fees in accordance with the terms of the Trustees Deferred Compensation Plan. For the period from the start of business, December 7, 2004 to October 31, 2005, no significant amounts have been deferred. Certain officers and Trustees of the Fund and Portfolios are officers of the above organization.
EVM serves as the sub-transfer agent of the Fund and receives from the transfer agent an aggregate fee based upon the actual expenses incurred by EVM in the performance of those activities. For the period from the start of business, December 7, 2004 to October 31, 2005, EVM earned $3,798 in sub-transfer agent fees.
The Fund was informed that Eaton Vance Distributors, Inc. (EVD), a subsidiary of EVM and the Funds principal underwriter, received $115,174 as its portion of the sales charge on sales of Class A for the period from the start of business, December 7, 2004 to October 31, 2005.
5 Distribution and Service Plans
The Fund has in effect distribution plans for Class B shares (Class B Plan) and Class C shares (Class C Plan), pursuant to Rule 12b-1 under the Investment Company Act of 1940 and a service plan for Class A shares (Class A Plan) (collectively, the Plans). The Class B and Class C Plans require the Fund to pay EVD amounts equal to 1/365 of 0.75% of the Fund's average daily net assets attributable to Class B and Class C shares for providing ongoing distribution services and facilities to the Fund. The Fund will automatically discontinue payments to EVD during any period in which there are no outstanding Uncovered Distribution Charges, which are equivalent to the sum of (i) 6.25% of the aggregate amount received by the Fund for the Class B and Class C shares sold, plus (ii) interest calculated by applying the rate of 1% over the prevailing prime rate to the outst anding balance of Uncovered Distribution Charges of EVD of each respective class, reduced by the aggregate amount of contingent deferred sales charges (see Note 6) and daily amounts theretofore paid to EVD by each respective class. The Fund paid or accrued $70,907, and $278,708 for Class B and Class C shares, respectively, to or payable to EVD for the period from the start of business, December 7, 2004 to October 31, 2005, representing 0.75% (annualized) of the average daily net assets for Class B and Class C shares, respectively. At October 31, 2005, the amount of Uncovered Distribution Charges of EVD calculated under the Plans was approximately $960,000, and $4,947,000 for Class B and Class C shares, respectively.
The Plans authorize the Fund to make payments of service fees to EVD, investment dealers and other persons in amounts equal to 0.25% of the Fund's average daily net assets attributable to Class A, Class B and Class C shares for each fiscal year. Service fee payments are made for personal services and/or the maintenance of shareholder accounts. Service fees are separate and distinct from the sales commissions and distribution fees payable by the Fund to EVD and, as such, are not subject to automatic discontinuance when there are no outstanding Uncovered Distribution Charges of EVD. Service fees paid or accrued for the period from the start of business, December 7, 2004 to October 31, 2005, amounted to $96,069, $23,469 and $92,403 for Class A, Class B, and Class C shares, respectively.
6 Contingent Deferred Sales Charge
A contingent deferred sales charge (CDSC) generally is imposed on redemptions of Class B shares made within six years of purchase and on redemptions of Class C shares made within one year of purchase. Generally, the CDSC is based upon the lower of the net asset value at date of redemption or date of purchase. No charge is levied on shares acquired by reinvestment of dividends or capital gain distributions. Class A shares purchased at net asset value in amounts of $1 million or more (other than shares purchased in a single transaction of $5 million or more) are subject to a 1% CDSC if redeemed within one year of purchase (depending upon the circumstances of purchase). The Class B CDSC is imposed at declining rates that begin at 5% in the case of redemptions in the first and second
13
Eaton Vance Diversified Income Fund as of October 31, 2005
NOTES TO FINANCIAL STATEMENTS CONT'D
year after purchase, declining one percentage point each subsequent year. Class C shares will be subject to a 1% CDSC if redeemed within one year of purchase.
No CDSC is levied on shares which have been sold to EVM or its affiliates or to their respective employees or clients and may be waived under certain other limited conditions. CDSC on Class B and Class C redemptions are paid to EVD to reduce the amount of Uncovered Distribution Charges calculated under the Class B and Class C Plans, respectively (see Note 5). CDSC assessed on Class B and Class C shares when no Uncovered Distribution Charges exist for the respective classes will be credited to the Fund. EVD received approximately $31,000 and $13,000 of CDSC paid by shareholders for Class B and Class C shares, respectively, for the period from the start of business, December 7, 2004 to October 31, 2005. There was no CDSC received on Class A shares.
7 Investment Transactions
For the period from the start of business, December 7, 2004 to October 31, 2005, increases and decreases in the Fund's investment in the Portfolios were as follows:
| Portfolio | | Contributions | | Withdrawals | |
| Boston Income Portfolio | | $ | 69,680,979 | | | $ | 5,001,249 | | |
| Floating Rate Portfolio | | | 68,508,882 | | | | 4,115,197 | | |
| Government Obligations Portfolio | | | 69,342,922 | | | | 4,256,553 | | |
8 Investment in Portfolios
For the period from the start of business, December 7, 2004 to October 31, 2005, the Fund was allocated net investment income and realized and unrealized gain (loss) from the Portfolios as follows:
| | | Boston
Income
Portfolio | | Floating
Rate
Portfolio | | Government
Obligations
Portfolio | | Total | |
| Interest income | | $ | 2,411,305 | | | $ | 1,586,025 | | | $ | 1,055,915 | | | $ | 5,053,245 | | |
| Dividend income | | | 16,141 | | | | 18 | | | | — | | | | 16,159 | | |
| Security lending income | | | — | | | | — | | | | 54,770 | | | | 54,770 | | |
| Expenses | | | (184,416 | ) | | | (152,212 | ) | | | (215,666 | ) | | | (552,294 | ) | |
| Net investment income | | $ | 2,243,030 | | | $ | 1,433,831 | | | $ | 895,019 | | | $ | 4,571,880 | | |
| Net realized gain (loss) — | |
Investment transactions
(identified cost basis) | | $ | (567,562 | ) | | $ | (89,311 | ) | | $ | (8,531 | ) | | $ | (665,404 | ) | |
| Financial futures contracts | | | — | | | | — | | | | 19,597 | | | | 19,597 | | |
| Swap contracts | | | (704 | ) | | | 4,873 | | | | — | | | | 4,169 | | |
Foreign currency and
forward foreign
currency exchange
contract transactions | | | 16,236 | | | | 30,928 | | | | — | | | | 47,164 | | |
| Net realized gain (loss) | | $ | (552,030 | ) | | $ | (53,510 | ) | | $ | 11,066 | | | $ | (594,474 | ) | |
Change in unrealized
appreciation (depreciation) | |
| Investments | | $ | (824,948 | ) | | $ | (28,492 | ) | | $ | (375,599 | ) | | $ | (1,229,039 | ) | |
| Financial futures contracts | | | — | | | | — | | | | 43,885 | | | | 43,885 | | |
| Swap contracts | | | 14,752 | | | | (198 | ) | | | — | | | | 14,554 | | |
Foreign currency and
forward foreign
currency exchange
contracts | | | (755 | ) | | | 37,380 | | | | — | | | | 36,625 | | |
Net change in unrealized
appreciation (depreciation) | | $ | (810,951 | ) | | $ | 8,690 | | | $ | (331,714 | ) | | $ | (1,133,975 | ) | |
14
Diversified Income Fund as of October 31, 2005
REPORT OF INDEPENDENT REGISTERED PUBLIC ACCOUNTING FIRM
To the Trustees and Investors
of Diversified Income Fund:
In our opinion, the accompanying statement of assets and liabilities, and the related statements of operations and of changes in net assets and the financial highlights present fairly, in all material respects, the financial position of Diversified Income Fund (the "Fund") at October 31, 2005, and the results of its operations, the changes in its net assets, and the financial highlights for the period from December 7, 2004, the commencement of operations, to October 31, 2005, in conformity with accounting principles generally accepted in the United States of America. These financial statements and financial highlights (hereafter referred to as "financial statements") are the responsibility of the Fund's management; our responsibility is to express an opinion on these financial statements based on our audits. We conducted our audits of these financial statements in accordance with standards of the Public Company Accounting Oversi ght Board (United States). Those standards require that we plan and perform the audit to obtain reasonable assurance about whether the financial statements are free of material misstatement. An audit includes examining, on a test basis, evidence supporting the amounts and disclosures in the financial statements, assessing the accounting principles used and significant estimates made by management, and evaluating the overall financial statement presentation. We believe that our audits provide a reasonable basis for our opinion.
PricewaterhouseCoopers LLP
Boston, Massachusetts
December 23, 2005
15
Eaton Vance Diversified Income Fund as of October 31, 2005
FEDERAL TAX INFORMATION
The Form 1099-DIV you receive in January 2006 will show the tax status of all distributions paid to your account in calendar 2005. Shareholders are advised to consult their own tax adviser with respect to the tax consequences of their investment in the Fund.
16
Diversified Income Fund
BOARD OF TRUSTEES' ANNUAL APPROVAL OF THE INVESTMENT ADVISORY AGREEMENTS
The Eaton Vance Diversified Income Fund (the "Fund") is a fund of funds which invests in three Portfolios for which Boston Management and Research ("BMR") serves as investment adviser: Boston Income Portfolio; Floating Rate Portfolio; and Government Obligations Portfolio (together, the "Portfolios"). Eaton Vance Management ("Eaton Vance") serves as the investment adviser to the Fund.
The investment advisory agreement between the Fund and Eaton Vance was approved by the Board of Trustees on November 15, 2004 in connection with the organization of the Fund. In considering the approval of the Fund's investment advisory agreement with Eaton Vance, the Special Committee of the Board of Trustees noted that the agreement relates to Eaton Vance's management of the ongoing allocation of the Fund's assets among the Portfolios and that Eaton Vance is not charging an advisory fee for such services. It was further noted that, since the Fund intends to invest approximately equally in the three Portfolios and will rebalance its assets whenever allocations exceed plus or minus three percent of the Fund's pre-determined fixed allocation percentages, it is not anticipated that Eaton Vance will regularly engage in significant active allocation of Fund assets.
The investment advisory agreements between BMR and each Portfolio were approved on March 21, 2005 in connection with the annual review of investment advisory agreements. In considering the approval of the Portfolios' investment advisory agreements, the Special Committee of the Board of Trustees considered information that had been provided throughout the year at regular Board meetings, as well as information furnished for a series of meetings held in February and March in preparation for a Board meeting held on March 21, 2005 to specifically consider the renewal of the investment advisory agreements with the Portfolios. Such information included, among other things, the following:
• An independent report comparing the advisory fees of each Portfolio with those of comparable funds;
• An independent report comparing the expense ratios of Eaton Vance funds that invest solely in the Portfolios to those of comparable funds;
• Information regarding investment performance (including on a risk-adjusted basis) of other Eaton Vance funds that invest solely in the Portfolios in comparison to relevant peer groups of funds and appropriate indices;
• The economic outlook and the general investment outlook in relevant investment markets;
• Eaton Vance's results and financial condition and the overall organization of the investment adviser;
• The procedures and processes used to determine the fair value of Portfolio assets including in particular the valuation of senior loan portfolios and actions taken to monitor and test the effectiveness of such procedures and processes;
• Eaton Vance's management of the relationship with the custodian, subcustodians and fund accountants;
• The resources devoted to compliance efforts undertaken by Eaton Vance on behalf of the funds it manages and the record of compliance with the investment policies and restrictions and with policies on personal securities transactions;
• The quality, nature, cost and character of the administrative and other non-investment management services provided by Eaton Vance and its affiliates; and
• The terms of the advisory agreements and the reasonableness and appropriateness of the particular fee paid by each Portfolio for the services described therein.
The Special Committee also considered the investment adviser's portfolio management capabilities, including information relating to the education, experience, and number of investment professionals and other personnel who provide services under the investment advisory agreements. The Special Committee noted the benefits of the investment adviser's extensive in-house research capabilities and the other resources available to the investment adviser. The Special Committee noted the experience of the 26 bank loan investment professionals and other personnel who would provide services under the Floating Rate Portfolio's investment advisory agreement, including four portfolio managers and 15 analysts. Many of these portfolio managers and analysts have previous experience working for commercial banks and other lending institutions. In addition, for High Income Portfolio, the Special Committee considered the investment adviser's high-yi eld portfolio management team, including portfolio managers who perform their own investment and credit analysis and analysts who evaluate issuers' financial resources, operating history and sensitivity to economic conditions. The Special Committee also took into account the time and attention to be devoted by senior management to each Portfolio and the other funds in the complex. The Special Committee evaluated the level of skill required to manage the Portfolios and concluded that the human resources available to the investment adviser were appropriate to fulfill its duties on behalf of each Portfolio.
17
Diversified Income Fund
BOARD OF TRUSTEES' ANNUAL APPROVAL OF THE INVESTMENT ADVISORY AGREEMENTS CONT'D
With respect to its review of investment advisory fees, the Special Committee concluded that the fees paid by each Portfolio are within the range of those paid by comparable funds within the mutual fund industry. In its review of comparative information with respect to investment performance, the Special Committee concluded that each Portfolio had performed within a range that the Special Committee deemed competitive. In reviewing the information regarding expense ratios, the Special Committee concluded that the expense ratios of each Portfolio are reasonable.
In addition to the factors mentioned above, the Special Committee reviewed the level of the investment adviser's profits in providing investment management services for the Portfolios and for all Eaton Vance funds as a group. The Special Committee also reviewed the benefits to Eaton Vance and its affiliates in providing administration services for the Fund and for all Eaton Vance funds as a group. In addition, the Special Committee considered the fiduciary duty assumed by the investment adviser in connection with the services rendered to the Portfolios and the business reputation of the investment adviser and its financial resources. The Trustees concluded that in light of the services rendered, the profits realized by the investment adviser are not unreasonable. The Special Committee also considered the extent to which the investment adviser appears to be realizing benefits from managing each of the Portfolios, noting in partic ular that the assets of Boston Income Portfolio increased materially in 2004. The Special Committee requested, and the investment adviser agreed to implement, advisory fee breakpoints for Boston Income Portfolio. The Special Committee concluded that the fee breakpoints which are now in place for each Portfolio will allow for an equitable sharing of such benefits, when realized, with such Portfolios and the shareholders of the Fund.
The Special Committee did not consider any single factor as controlling in determining whether or not to renew the investment advisory agreements. Nor are the items described herein all the matters considered by the Special Committee. In assessing the information provided by Eaton Vance and its affiliates, the Special Committee also took into consideration the benefits to shareholders of investing in a fund that is a part of a large family of funds which provides a large variety of shareholder services.
Based on its consideration of the foregoing factors and conclusions, and such other factors and conclusions as it deemed relevant, and assisted by independent counsel, the Special Committee concluded that the renewal of each of the investment advisory agreements with the Portfolios, including the fee structures, is in the interests of shareholders.
18
Eaton Vance Diversified Income Fund
MANAGEMENT AND ORGANIZATION
Fund Management. The Trustees of Eaton Vance Mutual Funds Trust (the Trust), Boston Income Portfolio (BIP), Floating Rate Portfolio (FRP) and Government Obligations Portfolio (GOP) (the Portfolios) are responsible for the overall management and supervision of the Trust's and Portfolios' affairs. The Trustees and officers of the Trust and the Portfolios are listed below. Except as indicated, each individual has held the office shown or other offices in the same company for the last five years. Trustees and officers of the Trust and the Portfolios hold indefinite terms of office. The "noninterested Trustees" consist of those Trustees who are not "interested persons" of the Trust and the Portfolios, as that term is defined under the 1940 Act. The business address of each Trustee and officer is The Eaton Vance Building, 255 State Street, Boston, Massachusetts 02 109. As used below, "EVC" refers to Eaton Vance Corp., "EV" refers to Eaton Vance, Inc., "EVM" refers to Eaton Vance Management, "BMR" refers to Boston Management and Research and "EVD" refers to Eaton Vance Distributors, Inc. EVC and EV are the corporate parent and trustee, respectively, of EVM and BMR. EVD is the Fund's principal underwriter, the Portfolio's placement agent and a wholly-owned subsidiary of EVM. Each officer affiliated with Eaton Vance may hold a position with other Eaton Vance affiliates that is comparable to its position with EVM listed below.
Name and
Date of Birth | | Position(s)
with the
Fund | | Term of
Office and
Length of
Service | | Principal Occupation(s)
During Past Five Years | | Number of Portfolios
in Fund Complex
Overseen By
Trustee(1) | | Other Directorships Held | |
| Interested Trustee | | | | | | | | | | | | | |
|
James B. Hawkes
11/9/41 | | Trustee | | Trustee of the Trust since 1991; of GOP since 1992; of FRP since 2000 and of BIP since 2001 | | Chairman, President and Chief Executive Officer of BMR, EVC, EVM and EV; Director of EV; Vice President and Director of EVD. Trustee and/or officer of 161 registered investment companies in the Eaton Vance Fund Complex. Mr. Hawkes is an interested person because of his positions with BMR, EVM, EVC and EV, which are affiliates of the Trust and the Portfolio. | | | 161 | | | Director of EVC | |
|
| Noninterested Trustee(s) | | | | | | | | | | | | | |
|
Benjamin C. Esty
1/2/63 | | Trustee | | Since 2005 | | Professor, Harvard University Graduate School of Business Administration (since 2003). Formerly, Associate Professor, Harvard University Graduate School of Business Administration (2000-2003). | | | 152 | | | None | |
|
Samuel L. Hayes, III
2/23/35 | | Trustee | | Trustee of the Trust since 1986; of GOP since 1993; of FRP since 2000 and of BIP since 2001 | | Jacob H. Schiff Professor of Investment Banking Emeritus, Harvard University Graduate School of Business Administration. | | | 161 | | | Director of Tiffany & Co. (specialty retailer) and Telect, Inc. (telecommunication services company) | |
|
William H. Park
9/19/47 | | Trustee | | Since 2003 | | President and Chief Executive Officer, Prizm Capital Management, LLC (investment management firm) (since 2002). Executive Vice President and Chief Financial Officer, United Asset Management Corporation (a holding company owning institutional investment management firms) (1982-2001). | | | 161 | | | None | |
|
Ronald A. Pearlman
7/10/40 | | Trustee | | Since 2003 | | Professor of Law, Georgetown University Law Center (since 1999). Tax Partner Covington & Burling, Washington, DC (1991-2000). | | | 161 | | | None | |
|
Norton H. Reamer
9/21/35 | | Trustee | | Trustee of the Trust since 1986; of GOP since 1993; of FRP since 2000 and of BIP since 2001 | | President, Chief Executive Officer and a Director of Asset Management Finance Corp. (a specialty finance company serving the investment management industry) (since October 2003). President, Unicorn Corporation (an investment and financial advisory services company) (since September 2000). Formerly, Chairman, Hellman, Jordan Management Co., Inc. (an investment management company) (2000-2003). Formerly, Advisory Director of Berkshire Capital Corporation (investment banking firm) (2002-2003). Formerly Chairman of the Board, United Asset Management Corporation (a holding company owning institutional investment management firms) and Chairman, President and Director, UAM Funds (mutual funds) (1980-2000). | | | 161 | | | None | |
|
19
Eaton Vance Diversified Income Fund
MANAGEMENT AND ORGANIZATION CONT'D
Name and
Date of Birth | | Position(s)
with the
Fund | | Term of
Office and
Length of
Service | | Principal Occupation(s)
During Past Five Years | | Number of Portfolios
in Fund Complex
Overseen By
Trustee(1) | | Other Directorships Held | |
| Noninterested Trustee(s) (continued) | | | | | | | | | | | |
|
Lynn A. Stout
9/14/57 | | Trustee | | Trustee of the Trust and GOP since 1998; of FRP since 2000 and of BIP since 2001 | | Professor of Law, University of California at Los Angeles School of Law (since July 2001). Formerly, Professor of Law, Georgetown University Law Center. | | | 161 | | | None | |
|
Ralph F. Verni
1/26/43 | | Trustee | | Since 2005 | | Consultant and private investor (since 2000). Formerly, President and Chief Executive Officer, Redwood Investment Systems, Inc. (software developer) (2000). Formerly, President and Chief Executive Officer, State Street Research & Management (investment advisor), SSRM Holdings (parent of State Street Research & Management), and SSR Realty (institutional realty manager) (1992-2000). | | | 152 | | | Director of W.P. Carey & Company LLC (manager of real estate investment trusts) | |
|
| Principal Officers who are not Trustees | | | | | | | | | | | |
|
Name and
Date of Birth | | Position(s)
with the
Fund | | Term of
Office and
Length of
Service | | Principal Occupation(s)
During Past Five Years | |
Thomas E. Faust Jr.
5/31/58 | | President of the Trust | | Since 2002 | | Executive Vice President of EVM, BMR, EVC and EV; Chief Investment Officer of EVM and BMR and Director of EVC. Chief Executive Officer of Belair Capital Fund LLC, Belcrest Capital Fund LLC, Belmar Capital Fund LLC, Belport Capital Fund LLC and Belrose Capital Fund LLC (private investment companies sponsored by EVM). Officer of 65 registered investment companies managed by EVM or BMR. | |
|
William H. Ahern, Jr.
7/28/59 | | Vice President of the Trust | | Since 1995 | | Vice President of EVM and BMR. Officer of 70 registered investment companies managed by EVM or BMR. | |
|
Cynthia J. Clemson
3/2/63 | | Vice President of the Trust | | Since 2005 | | Vice President of EVM and BMR. Officer of 85 registered investment companies managed by EVM or BMR. | |
|
Kevin S. Dyer
2/21/75 | | Vice President of the Trust | | Since 2005 | | Assistant Vice President of EVM and BMR. Officer of 24 registered investment companies managed by EVM or BMR. | |
|
Thomas P. Huggins
3/7/66 | | Vice President of BIP | | Since 2001 | | Vice President of EVM and BMR. Officer of 4 registered investment companies managed by EVM or BMR. | |
|
Aamer Khan
6/7/60 | | Vice President of the Trust | | Since 2005 | | Vice President of EVM and BMR. Officer of 27 registered investment companies managed by EVM or BMR. | |
|
Michael R. Mach
7/15/47 | | Vice President of the Trust | | Since 1999 | | Vice President of EVM and BMR. Officer of 32 registered investment companies managed by EVM or BMR. | |
|
Robert B. MacIntosh
1/22/57 | | Vice President of the Trust | | Since 1998 | | Vice President of EVM and BMR. Officer of 85 registered investment companies managed by EVM or BMR. | |
|
Scott H. Page
11/30/59 | | Vice President of FRP | | Since 2000 | | Vice President of EVM and BMR. Officer of 14 registered investment companies managed by EVM or BMR. | |
|
Duncan W. Richardson
10/26/57 | | Vice President of the Trust | | Since 2001 | | Senior Vice President and Chief Equity Investment Officer of EVM and BMR. Officer of 51 registered investment companies managed by EVM or BMR. | |
|
Walter A. Row, III
7/20/57 | | Vice President of the Trust | | Since 2001 | | Director of Equity Research and a Vice President of EVM and BMR. Officer of 31 registered investment companies managed by EVM or BMR. | |
|
Judith A. Saryan
8/21/54 | | Vice President of the Trust | | Since 2003 | | Vice President of EVM and BMR. Officer of 33 registered investment companies managed by EVM or BMR. | |
|
20
Eaton Vance Diversified Income Fund
MANAGEMENT AND ORGANIZATION CONT'D
Name and
Date of Birth | | Position(s)
with the
Fund | | Term of
Office and
Length of
Service | | Principal Occupation(s)
During Past Five Years | |
| Principal Officers who are not Trustees (continued) | |
|
Susan Schiff
3/31/61 | | Vice President of the Trust and GOP | | Vice President of the Trust since 2002 and of GOP since 1993 | | Vice President of EVM and BMR. Officer of 29 registered investment companies managed by EVM or BMR. | |
|
Payson F. Swaffield
8/13/56 | | President of FRP | | Since 2002(2) | | Vice President of EVM and BMR. Officer of 14 registered investment companies managed by EVM or BMR. | |
|
Mark S. Venezia
5/23/49 | | President of GOP | | Since 2002(2) | | Vice President of EVM and BMR. Officer of 5 registered investment companies managed by EVM or BMR. | |
|
Michael W. Weilheimer
2/11/61 | | President of BIP | | Since 2002(2) | | Vice President of EVM and BMR. Officer of 9 registered investment companies managed by EVM or BMR. | |
|
Barbara E. Campbell
6/19/57 | | Treasurer | | Treasurer of the Trust since 2005(3); of the Portfolios since 2002(2) | | Vice President of EVM and BMR. Officer of 161 registered investment companies managed by EVM or BMR. | |
|
Alan R. Dynner
10/10/40 | | Secretary | | Secretary of the Trust and GOP since 1997; of FRP since 2000 and of BIP since 2001 | | Vice President, Secretary and Chief Legal Officer of BMR, EVM, EVD, EV and EVC. Officer of 161 registered investment companies managed by EVM or BMR. | |
|
Paul M. O'Neil
7/11/53 | | Chief Compliance Officer | | Since 2004 | | Vice President of EVM and BMR. Officer of 161 registered investment companies managed by EVM or BMR. | |
|
(1) Includes both master and feeder funds in a master-feeder structure.
(2) Prior to 2002, Mr. Swaffield served as Vice President of FRP since 2000, Mr. Venezia served as Vice President of GOP since 1993, Mr. Weilheimer served as Vice President of BIP since 2001, and Ms. Campbell served as Assistant Treasurer of GOP since 1998, of FAP since 2000 and of BIP since 2001.
(3) Prior to 2005, Ms. Campbell served as Assistant Treasurer of the Trust since 1995.
The SAI for the Fund includes additional information about the Trustees and officers of the Fund and the Portfolio and can be obtained without charge by calling 1-800-225-6265.
21
Investment Adviser of Eaton Vance Diversified Income Fund
Eaton Vance Management
The Eaton Vance Building
255 State Street
Boston, MA 02109
Administrator of Eaton Vance Diversified Income Fund
Eaton Vance Management
The Eaton Vance Building
255 State Street
Boston, MA 02109
Principal Underwriter
Eaton Vance Distributors, Inc.
The Eaton Vance Building
255 State Street
Boston, MA 02109
(617) 482-8260
Custodian
Investors Bank & Trust Company
200 Clarendon Street
Boston, MA 02116
Transfer Agent
PFPC Inc.
Attn: Eaton Vance Funds
P.O. Box 9653
Providence, RI 02940-9653
(800) 262-1122
PricewaterhouseCoopers LLP
125 High Street
Boston, MA 02110-1707
Eaton Vance Diversified Income Fund
The Eaton Vance Building
255 State Street
Boston, MA 02109
This report must be preceded or accompanied by a current prospectus. Before investing, investors should consider carefully the Fund's investment
objective(s), risks, and charges and expenses. The Fund's current prospectus contains this and other information about the Fund and is available
through your financial advisor. Please read the prospectus carefully before you invest or send money. For further information please call 1-800-225-6265.
2320-12/05 DISRC
[GRAPHIC at top left: Eaton Vance logo]
[GRAPHIC at top right: Newspaper & adding machine]
Annual Report October 31, 2005
[GRAPHIC at center left: New York Stock Exchange flag]
EATON VANCE EQUITY RESEARCH FUND
IMPORTANT NOTICES REGARDING PRIVACY,
DELIVERY OF SHAREHOLDER DOCUMENTS,
PORTFOLIO HOLDINGS AND PROXY VOTING
Privacy. The Eaton Vance organization is committed to ensuring your financial privacy. Each of the financial institutions identified below has in effect the following policy (“Privacy Policy”) with respect to nonpublic personal information about its customers:
* Only such information received from you, through application forms or otherwise, and information about your Eaton Vance fund transactions will be collected. This may include information such as name, address, social security number, tax status, account balances and transactions.
* None of such information about you (or former customers) will be disclosed to anyone, except as permitted by law (which includes disclosure to employees necessary to service your account). In the normal course of servicing a customer’s account, Eaton Vance may share information with unaffiliated third parties that perform various required services such as transfer agents, custodians and broker/dealers.
* Policies and procedures (including physical, electronic and procedural safeguards) are in place that are designed to protect the confidentiality of such information.
* We reserve the right to change our Privacy Policy at any time upon proper notification to you. Customers may want to review our Policy periodically for changes by accessing the link on our homepage: www.eatonvance.com.
Our pledge of privacy applies to the following entities within the Eaton Vance organization: the Eaton Vance Family of Funds, Eaton Vance Management, Eaton Vance Investment Counsel, Boston Management and Research, and Eaton Vance Distributors, Inc.
In addition, our Privacy Policy only applies to those Eaton Vance customers who are individuals and who have a direct relationship with us. If a customer’s account (i.e., fund shares) is held in the name of a third-party
1
financial adviser/ broker-dealer, it is likely that only such adviser’s privacy policies apply to the customer. This notice supersedes all previously issued privacy disclosures.
For more information about Eaton Vance’s Privacy Policy, please call 1-800-262-1122.
Delivery of Shareholder Documents. The Securities and Exchange Commission (the “SEC”) permits funds to deliver only one copy of shareholder documents, including prospectuses, proxy statements and shareholder reports, to fund investors with multiple accounts at the same residential or post office box address. This practice is often called “householding” and it helps eliminate duplicate mailings to shareholders.
Eaton Vance, or your financial adviser, may household the mailing of your documents indefinitely unless you instruct Eaton Vance, or your financial adviser, otherwise.
If you would prefer that your Eaton Vance documents not be householded, please contact Eaton Vance at 1-800-262-1122, or contact your financial adviser.
Your instructions that householding not apply to delivery of your Eaton Vance documents will be effective within 30 days of receipt by Eaton Vance or your financial adviser.
Portfolio Holdings. Each Eaton Vance Fund and its underlying Portfolio (if applicable) will file a schedule of its portfolio holdings on Form N-Q with the SEC for the first and third quarters of each fiscal year. The Form N-Q will be available on the Eaton Vance website www.eatonvance.com, by calling Eaton Vance at 1-800-262-1122 or in the EDGAR database on the SEC’s website at www.sec.gov. Form N-Q may also be reviewed and copied at the SEC’s public reference room in Washington, D.C. (call 1-800-732-0330 for information on the operation of the public reference room).
Proxy Voting. From time to time, funds are required to vote proxies related to the securities held by the funds. The Eaton Vance Funds or their underlying Portfolios (if applicable) vote proxies according to a set of policies and procedures approved by the Funds’ and Portfolios’ Boards. You may obtain a description of these policies and procedures and information on how the Funds or Portfolios voted proxies relating to Portfolio securities during the 12 month period ended June 30, without charge, upon request, by calling 1-800-262-1122. This description is also available on the SEC’s website at www.sec.gov.
2
Eaton Vance Equity Research Fund as of October 31, 2005
MANAGEMENT’S DISCUSSION OF FUND PERFORMANCE

Walter Row | |
Investment Team Leader | |
The Fund
Performance for the Past Year
• During the year ended October 31,2005, the Fund’s Class A shareshad a total return of 12.74%. This return was the result of an increase in net asset value (NAV) per share to $12.15 on October 31, 2005, from $10.81 on October 31, 2004, and the reinvestment of $0.035 per share in dividend income.(1) Effective June 13, 2005, the Fund’s outstanding shares were classified as Class A shares.
• For comparison, the Fund’s benchmark, the Standard & Poor’s 500 Index (the S&P 500) – a broad-based, unmanaged market index of common stocks commonly used as a measure of U.S. stock market performance – had a total return of 8.72% during the period.(2)
Management Discussion
• Although markets remained choppy during the 12 months ended October 31, 2005, U.S. equities generally ended the period with positive returns. Increased market volatility was a reflection of investor anxiety over rising interest rates, inflation fears and recordlevel oil prices, as well as the effects of a damaging hurricane season in the South.
• Despite these headwinds, the U.S. economy proved resilient during the year. The negative effects of higher interest rates and energy prices were offset by improvements in employment and capital spending among those corporations that benefited from higher cash flows. In addition, corporate earnings generally were strong across a range of industry sectors. The effects of the hurricanes were largely regional, and did not have a significant effect on the broader national economy.
• For the 12-month period ended October 31, 2005, the leading economic sectors within the S&P 500 were energy and utilities.(2) The lagging sectors were telecom services and financials. On the back of strong performance in energy and utilities, the value style of investing outperformed the growth style during the period, while small-capitalization companies generally outperformed large-cap companies.
• The Fund’s returns were positive during the period and outpaced those of the S&P 500.(2) The investment objective of the Fund is to achieve long-term capital appreciation by investing in a diversified portfolio of equity securities. The Fund generally maintains investments in all or substantially all of the market sectors represented in the S&P 500.(2) The Fund’s holdings are selected by a team of equity research analysts, with each analyst responsible for investments in his or her area of research coverage. Allocations among market sectors are determined by the analysts under the direction of the investment team leader, using the market sector weightings of the S&P 500 as a benchmark.(2) Because the sector weightings of the Fund are generally similar to those of its benchmark over time, stock selection is normally the primary driver of the Fund’s relative performance.
• In selecting and managing the Fund’s securities portfolio, the team of equity research analysts makes investment judgments primarily on the basis of fundamental research analysis. Fundamental research involves consideration of the various company-specific and general business, economic and market factors that may influence the future performance of individual companies and their stock prices.
• The Fund’s positive performance during the period was driven primarily by stock selections in the financial and consumer discretionary sectors. Representation in regional bank stocks, consumer lending, and specialty retailing helped drive the performance of the Fund during this time period. Additionally, avoiding a significantly underperforming stock in its benchmark, that of an online auction company, helped the Fund’s relative performance. The Fund was adversely affected by negative performance in certain information technology and industrial stocks held.
The views expressed throughout this report are those of the investment team and are current only through the end of the period of the report as stated on the cover. These views are subject to change at any time based upon market or other conditions, and the investment adviser disclaims any responsibility to update such views. These views may not be relied on as investment advice and, because investment decisions for a fund are based on many factors, may not be relied on as an indication of trading intent on behalf of any Eaton Vance fund.
Past performance is no guarantee of future results. Returns are historical and are calculated by determining the percentage change in net asset value or offering price (as applicable) with all distributions reinvested. Investment return and principal value will fluctuate so that shares, when redeemed, may be worth more or less than their original cost. Performance is for stated time period only; due to market volatility, the Fund’s current performance may be lower or higher than the quoted return. For performance as of the most recent month end, please refer to www.eatonvance.com.
(1) These returns do not include the 5.75% maximum sales charge. If the sales charge were deducted, the returns would be lower.
(2) It is not possible to invest directly in an Index. The Index’s total return does not reflect commissions or expenses that would have been incurred if an investor individually purchased or sold the securities represented in the Index.
Fund shares are not insured by the FDIC and are not deposits or other obligations of, or guaranteed by, any depository institution. Shares are subject to investment risks, including possible loss of principal invested.
2
Eaton Vance Equity Research Fund as of October 31, 2005
FUND PERFORMANCE
The line graph and table set forth below provide information about the Fund’s performance. The line graph compares the performance of Class A of the Fund with that of the S&P 500 Index, a broad-based, unmanaged market index of common stocks commonly used as a measure of U.S. stock market performance. Effective June 13, 2005, the Fund’s outstanding shares were classified as Class A shares. From inception, the Fund’s expenses were voluntarily subsidized to limit Annual Fund Operating Expenses to 1.40%. Absent the subsidy, Fund performance would have been lower. Prior to August 26, 2005, the Fund was not actively marketed and had few shareholders. The Fund will not change its objective, principal policies or portfolio management structure during its fiscal year ending October 31, 2006. The lines on the graph represent the total returns of a hypothetical investment of $10,000 in each of Class A and the S&P 500 Index. Class A total returns are presented at net asset value and maximum public offering price. The table includes the total returns of Class A shares of the Fund at net asset value and maximum public offering price. The performance presented below does not reflect the deduction of taxes, if any, that a shareholder would pay on distributions or redemptions of Fund shares.
Performance* | | | |
Average Annual Total Returns (at net asset value) | | | |
One Year | | 12.74 | % |
Life of Fund† | | 5.09 | |
SEC Average Annual Total Returns (including sales charge) | | | |
One Year | | 6.25 | % |
Life of Fund† | | 3.55 | |
† Inception Date – 11/01/01
* Average Annual Total Returns do not include the 5.75% maximum sales charge for Class A. If the sales charge was deducted, the returns would be lower. SEC Average Annual Total Returns for Class A reflect the maximum 5.75% sales charge.
Past performance is no guarantee of future results. Returns are historical and are calculated by determining the percentage change in net asset value or offering price (as applicable) with all distributions reinvested. Investment return and principal value will fluctuate so that shares, when redeemed, may be worth more or less than their original cost. Performance is for the stated time period only; due to market volatility, the Fund’s current performance may be lower or higher than the quoted return. For performance as of the most recent month end, please refer to www.eatonvance.com.
Common Stock Investments by Sector†
By net assets
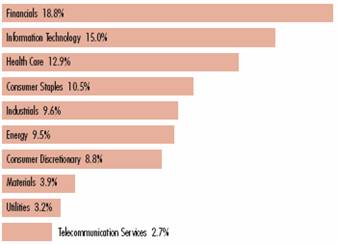
†As of October 31, 2005. Fund information may not be representative of the Fund’s current or future investments and are subject to change due to active management.
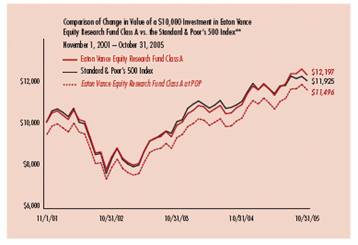
**Source: Thomson Financial. Class A of the Fund commenced investment operations on 11/1/01.
It is not possible to invest directly in an Index. The Index’s total returns do not reflect commissions or expenses that would have been incurred if an investor individually purchased or sold the securities represented in the Index.
3
Eaton Vance Equity Research Fund as of October 31, 2005
FUND EXPENSES
Example: As a shareholder of the Fund, you incur two types of costs: (1) transaction costs, including sales charges (loads) on purchases and redemption fees (if applicable); and (2) ongoing costs, including management fees; distribution or service fees; and other Fund expenses. This Example is intended to help you understand your ongoing costs (in dollars) of investing in the Fund and to compare these costs with the ongoing costs of investing in other mutual funds. The Example is based on an investment of $1,000 invested at the beginning of the period and held for the entire period (May 1, 2005 – October 31, 2005).
Actual Expenses: The first section of the table below provides information about actual account values and actual expenses. You may use the information in this section, together with the amount you invested, to estimate the expenses that you paid over the period. Simply divide your account value by $1,000 (for example, an $8,600 account value divided by $1,000 = 8.6), then multiply the result by the number in the first section under the heading entitled “Expenses Paid During Period” to estimate the expenses you paid on your account during this period.
Hypothetical Example for Comparison Purposes: The second section of the table below provides information about hypothetical account values and hypothetical expenses based on the actual Fund expense ratio and an assumed rate of return of 5% per year (before expenses), which is not the actual return of the Fund. The hypothetical account values and expenses may not be used to estimate the actual ending account balance or expenses you paid for the period. You may use this information to compare the ongoing costs of investing in your Fund and other funds. To do so, compare this 5% hypothetical example with the 5% hypothetical examples that appear in the shareholder reports of the other funds.
Please note that the expenses shown in the table are meant to highlight your ongoing costs only and do not reflect any transactional costs, such as sales charges (loads) or redemption fees (if applicable). Therefore, the second section of the table is useful in comparing ongoing costs only, and will not help you determine the relative total costs of owning different funds. In addition, if these transactional costs were included, your costs would have been higher.
Eaton Vance Equity Research Fund
| | Beginning Account Value | | Ending Account Value | | Expenses Paid During Period* | |
| | (5/1/05) | | (10/31/05) | | (5/1/05 – 10/31/05) | |
Actual | | | | | | | |
Class A | | $ | 1,000.00 | | $ | 1,083.80 | | $ | 5.94 | |
| | | | | | | |
Hypothetical | | | | | | | |
(5% return before expenses) | | | | | | | |
Class A | | $ | 1,000.00 | | $ | 1,019.50 | | $ | 5.75 | |
* Expenses are equal to the Fund’s annualized expense ratio of 1.13% for Class A shares, multiplied by the average account value over the period, multiplied by 184/365 (to reflect the one-half-year period). The Example assumes that the $1,000 was invested at the net asset value per share determined at the close of business on April 30, 2005. |
4
Eaton Vance Equity Research Fund as of October 31, 2005
PORTFOLIO OF INVESTMENTS
Common Stocks — 94.9%
Security | | Shares | | Value | |
Aerospace and Defense — 2.9% | | | | | |
General Dynamics Corp. | | 113 | | $ | 13,142 | |
Lockheed Martin Corp. | | 175 | | 10,598 | |
Northrop Grumman Corp. | | 187 | | 10,033 | |
United Technologies Corp. | | 335 | | 17,179 | |
| | | | $ | 50,952 | |
| | | | | |
Air Freight & Logistics — 0.7% | | | | | |
FedEx Corp. | | 123 | | $ | 11,307 | |
| | | | | |
Auto Components — 0.6% | | | | | |
Borg-Warner, Inc. | | 176 | | $ | 10,206 | |
| | | | | |
Banks — 4.9% | | | | | |
Anglo Irish Bank Corp. plc | | 600 | | $ | 8,131 | |
Bank of America Corp. | | 547 | | 23,926 | |
Bank of Nova Scotia (The) | | 275 | | 10,004 | |
BNP Paribas S.A. | | 60 | | 4,548 | |
HBOS plc | | 275 | | 4,063 | |
KBC Group N.V. | | 60 | | 4,887 | |
Marshall and Ilsley Corp. | | 90 | | 3,866 | |
National City Corp. | | 135 | | 4,351 | |
Standard Chartered plc | | 205 | | 4,306 | |
SunTrust Banks, Inc. | | 105 | | 7,610 | |
Wells Fargo & Co. | | 152 | | 9,150 | |
Western Alliance Bancorp.(1) | | 7 | | 195 | |
| | | | $ | 85,037 | |
| | | | | |
Beverages — 1.6% | | | | | |
Anheuser-Busch Cos., Inc. | | 195 | | $ | 8,046 | |
PepsiCo, Inc. | | 335 | | 19,792 | |
| | | | $ | 27,838 | |
| | | | | |
Biotechnology — 2.6% | | | | | |
Abgenix, Inc.(1) | | 238 | | $ | 2,475 | |
Amgen, Inc.(1) | | 276 | | 20,910 | |
CV Therapeutics, Inc.(1) | | 238 | | 5,964 | |
Genzyme Corp.(1) | | 155 | | 11,206 | |
MedImmune Inc.(1) | | 131 | | 4,582 | |
| | | | $ | 45,137 | |
| | | | | |
Chemicals — 1.4% | | | | | |
Ecolab Inc. | | 410 | | $ | 13,563 | |
Monsanto Co. | | 170 | | 10,712 | |
| | | | $ | 24,275 | |
| | | | | |
Commercial Services & Supplies — 0.5% | | | | | |
Cendant Corp. | | 300 | | $ | 5,226 | |
PHH Corp.(1) | | 15 | | 422 | |
Resources Connection, Inc. (1) | | 135 | | 3,854 | |
| | | | $ | 9,502 | |
| | | | | |
Communications Equipment — 2.2% | | | | | |
Cisco Systems, Inc.(1) | | 590 | | $ | 10,295 | |
Corning, Inc.(1) | | 1,392 | | 27,965 | |
| | | | $ | 38,260 | |
| | | | | |
Computers & Business Equipment — 2.0% | | | | | |
Apple Computer, Inc.(1) | | 135 | | $ | 7,775 | |
Dell, Inc.(1) | | 182 | | 5,802 | |
International Business Machines Corp. | | 256 | | 20,961 | |
| | | | $ | 34,538 | |
| | | | | |
Consumer Finance — 1.5% | | | | | |
Student Loan Corp. | | 119 | | $ | 26,085 | |
| | | | | |
Electrical Equipment — 1.3% | | | | | |
Emerson Electric Co. | | 305 | | $ | 21,213 | |
GrafTech International, Ltd.(1) | | 254 | | 1,245 | |
| | | | $ | 22,458 | |
See notes to financial statements
1
Security | | Shares | | Value | |
Electronics - Semiconductors — 5.8% | | | | | |
Advanced Micro Devices, Inc.(1) | | 285 | | $ | 6,618 | |
Analog Devices, Inc. | | 363 | | 12,625 | |
Applied Materials, Inc. | | 476 | | 7,797 | |
ASML Holding N.V.(1) | | 690 | | 11,716 | |
Broadcom Corp., Class A (1) | | 70 | | 2,972 | |
Intel Corp. | | 500 | | 11,750 | |
Linear Technology Corp. | | 250 | | 8,303 | |
Marvell Technology Group, Ltd.(1) | | 142 | | 6,590 | |
Maxim Integrated Products, Inc. | | 257 | | 8,913 | |
Microchip Technology, Inc. | | 260 | | 7,844 | |
Silicon Laboratories, Inc.(1) | | 142 | | 4,568 | |
Texas Instruments Inc. | | 269 | | 7,680 | |
Varian Semiconductor Equipment Associates, Inc.(1) | | 95 | | 3,593 | |
| | | | $ | 100,969 | |
| | | | | |
Energy Equipment & Services — 4.1% | | | | | |
Halliburton Co. | | 433 | | $ | 25,590 | |
Nabors Industries Ltd.(1) | | 300 | | 20,589 | |
Transocean Inc.(1) | | 418 | | 24,031 | |
| | | | $ | 70,210 | |
| | | | | |
Financial Services - Diversified — 1.8% | | | | | |
Citigroup, Inc. | | 686 | | $ | 31,405 | |
| | | | | |
Food Products — 1.7% | | | | | |
Nestle SA, ADR | | 401 | | $ | 29,816 | |
| | | | | |
Health Care Equipment & Supplies — 1.8% | | | | | |
Baxter International, Inc. | | 196 | | $ | 7,493 | |
Immucor, Inc.(1) | | 25 | | 648 | |
Medtronic, Inc. | | 199 | | 11,275 | |
Thoratec Corp.(1) | | 202 | | 3,996 | |
Zimmer Holdings, Inc.(1) | | 128 | | 8,163 | |
| | | | $ | 31,575 | |
| | | | | |
Health Care Services — 4.1% | | | | | |
Aetna, Inc. | | 140 | | $ | 12,398 | |
AmerisourceBergen Corp. | | 102 | | 7,780 | |
Caremark Rx, Inc.(1) | | 457 | | 23,947 | |
Emdeon Corp.(1) | | 321 | | 2,953 | |
HCA Inc. | | 163 | | 7,855 | |
WellPoint, Inc.(1) | | 220 | | 16,430 | |
| | | | $ | 71,363 | |
| | | | | |
Hotels, Restaurants & Leisure — 1.4% | | | | | |
Carnival Corp. | | 232 | | $ | 11,523 | |
McDonald’s Corp. | | 254 | | 8,026 | |
Starwood Hotels & Resorts Worldwide, Inc. | | 70 | | 4,090 | |
| | | | $ | 23,639 | |
| | | | | |
Household Durables — 0.6% | | | | | |
D. R. Horton, Inc. | | 225 | | $ | 6,905 | |
Ryland Group, Inc., (The) | | 57 | | 3,836 | |
| | | | $ | 10,741 | |
| | | | | |
Household Products — 2.3% | | | | | |
Procter & Gamble Co. | | 702 | | $ | 39,305 | |
| | | | | |
Industrial Conglomerates — 2.5% | | | | | |
General Electric Co. | | 1,291 | | $ | 43,778 | |
| | | | | |
Insurance — 4.5% | | | | | |
AFLAC Inc. | | 248 | | $ | 11,849 | |
Allstate Corp., (The) | | 293 | | 15,467 | |
Berkshire Hathaway, Inc., Class B (1) | | 5 | | 14,075 | |
First American Corp., (The) | | 195 | | 8,545 | |
MetLife, Inc. | | 159 | | 7,856 | |
Progressive Corp. | | 111 | | 12,855 | |
Stewart Information Services Corp. | | 95 | | 4,838 | |
XL Capital Ltd., Class A | | 36 | | 2,306 | |
| | | | $ | 77,791 | |
See notes to financial statements
2
Security | | Shares | | Value | |
Internet Software & Services — 0.6% | | | | | |
Google Inc., Class A(1) | | 28 | | $ | 10,420 | |
| | | | | |
Investment Services — 3.9% | | | | | |
Affiliated Managers Group, Inc.(1) | | 111 | | $ | 8,519 | |
Goldman Sachs Group, Inc. | | 124 | | 15,670 | |
Legg Mason, Inc. | | 96 | | 10,302 | |
Lehman Brothers Holdings Inc. | | 127 | | 15,198 | |
Merrill Lynch & Co., Inc. | | 273 | | 17,674 | |
| | | | $ | 67,363 | |
| | | | | |
IT Consulting & Services — 1.3% | | | | | |
CheckFree Corp.(1) | | 100 | | $ | 4,250 | |
Euronet Worldwide, Inc.(1) | | 140 | | 3,934 | |
MoneyGram International, Inc. | | 195 | | 4,739 | |
Paychex, Inc. | | 240 | | 9,302 | |
| | | | $ | 22,225 | |
| | | | | |
Machinery — 1.7% | | | | | |
Danaher Corp. | | 272 | | $ | 14,171 | |
Deere & Co. | | 239 | | 14,503 | |
| | | | $ | 28,674 | |
| | | | | |
Media — 2.9% | | | | | |
Getty Images, Inc.(1) | | 100 | | $ | 8,301 | |
McGraw-Hill Companies, Inc., (The) | | 354 | | 17,325 | |
Omnicom Group, Inc. | | 67 | | 5,558 | |
Time Warner Inc. | | 725 | | 12,927 | |
Viacom, Inc., Class B | | 194 | | 6,008 | |
| | | | $ | 50,119 | |
| | | | | |
Metals & Mining — 2.0% | | | | | |
Alcan Inc. | | 95 | | $ | 3,011 | |
Companhia Vale do Rio Doce, ADR | | 258 | | 10,663 | |
Goldcorp Inc. | | 390 | | 7,784 | |
Inco Ltd. | | 134 | | 5,389 | |
Novelis Inc. | | 19 | | 374 | |
Teck Cominco Ltd., Class B | | 184 | | $ | 7,762 | |
| | | | $ | 34,983 | |
| | | | | |
Oil & Gas — 5.4% | | | | | |
Amerada Hess Corp. | | 101 | | $ | 12,635 | |
Marathon Oil Corp. | | 135 | | 8,122 | |
Suncor Energy Inc. | | 430 | | 23,061 | |
Total SA, ADR | | 129 | | 16,257 | |
Valero Energy Corp. | | 80 | | 8,419 | |
Williams Cos., Inc. (The) | | 1,095 | | 24,419 | |
| | | | $ | 92,913 | |
| | | | | |
Paper & Forest Products — 0.5% | | | | | |
Georgia-Pacific Corp. | | 135 | | $ | 4,392 | |
Weyerhaeuser Co. | | 65 | | 4,117 | |
| | | | $ | 8,509 | |
| | | | | |
Personal Products — 0.6% | | | | | |
Estee Lauder Cos., Class A | | 319 | | $ | 10,581 | |
| | | | | |
Pharmaceuticals — 4.4% | | | | | |
Johnson & Johnson Co. | | 322 | | $ | 20,164 | |
King Pharmaceuticals, Inc.(1) | | 232 | | 3,580 | |
Lilly (Eli) & Co. | | 82 | | 4,083 | |
Penwest Pharmaceuticals Co.(1) | | 250 | | 3,965 | |
Pfizer, Inc. | | 1,065 | | 23,153 | |
Sepracor, Inc.(1) | | 125 | | 7,031 | |
Wyeth | | 329 | | 14,660 | |
| | | | $ | 76,636 | |
| | | | | |
Real Estate — 0.5% | | | | | |
Boston Properties, Inc. | | 60 | | $ | 4,153 | |
Simon Property Group, Inc. | | 51 | | 3,653 | |
| | | | $ | 7,806 | |
See notes to financial statements
3
Security | | Shares | | Value | |
Retail - Food & Staples — 2.8% | | | | | |
Walgreen Co. | | 390 | | $ | 17,718 | |
Wal-Mart Stores, Inc. | | 634 | | 29,995 | |
| | | | $ | 47,713 | |
| | | | | |
Retail - Multiline — 0.9% | | | | | |
Federated Department Stores, Inc. | | 125 | | $ | 7,671 | |
Target Corp. | | 139 | | 7,741 | |
| | | | $ | 15,412 | |
| | | | | |
Retail - Specialty — 1.7% | | | | | |
Bed Bath & Beyond Inc.(1) | | 185 | | $ | 7,496 | |
Best Buy Co., Inc. | | 165 | | 7,303 | |
Home Depot, Inc. | | 347 | | 14,241 | |
| | | | $ | 29,040 | |
| | | | | |
Software Services — 3.1% | | | | | |
Magma Design Automation, Inc.(1) | | 320 | | $ | 2,778 | |
Microsoft Corp. | | 1,097 | | 28,193 | |
Oracle Corp.(1) | | 1,139 | | 14,443 | |
Symantec Corp.(1) | | 360 | | 8,586 | |
| | | | $ | 54,000 | |
| | | | | |
Telecommunication Services - Diversified — 1.0% | | | | | |
Verizon Communications Inc. | | 535 | | $ | 16,858 | |
| | | | | |
Telecommunication Services - Wireless — 1.7% | | | | | |
Vodafone Group plc, ADS | | 1,120 | | $ | 29,411 | |
| | | | | |
Textiles, Apparel & Luxury Goods — 0.7% | | | | | |
Nike Inc., Class B | | 95 | | $ | 7,985 | |
Polo Ralph Lauren Corp., Class A | | 95 | | 4,674 | |
| | | | $ | 12,659 | |
| | | | | |
Thrifts & Mortgage Finance — 1.7% | | | | | |
Countrywide Financial Corp. | | 630 | | $ | 20,015 | |
Doral Financial Corp. | | 142 | | 1,216 | |
IndyMac Bancorp, Inc. | | 110 | | $ | 4,106 | |
Northern Rock plc | | 255 | | 3,588 | |
R & G Financial Corp., Class B | | 116 | | 1,137 | |
| | | | $ | 30,062 | |
| | | | | |
Tobacco — 1.5% | | | | | |
Altria Group, Inc. | | 342 | | $ | 25,667 | |
| | | | | |
Utilities - Gas — 0.6% | | | | | |
Questar Corp. | | 130 | | $ | 10,238 | |
| | | | | |
Utilities - Electric — 2.6% | | | | | |
Exelon Corp. | | 210 | | $ | 10,926 | |
TXU Corp. | | 334 | | 33,651 | |
| | | | $ | 44,577 | |
| | | | | |
Total Common Stocks
(identified cost $1,438,901) | | | | $ | 1,642,053 | |
| | | | | |
Total Investments — 94.9%
(identified cost $1,438,901) | | | | $ | 1,642,053 | |
| | | | | |
Other Assets, Less Liabilities — 5.1% | | | | $ | 88,292 | |
| | | | | |
Net Assets — 100.0% | | | | $ | 1,730,345 | |
(1) Non-income producing security.
ADR - American Depository Receipt
ADS - American Depository Share
See notes to financial statements
4
Eaton Vance Equity Research Fund as of October 31, 2005
FINANCIAL STATEMENTS
Statement of Assets and Liabilities
As of October 31, 2005 | | | |
Assets | | | |
Investments, at value (identified cost, $1,438,901) | | $ | 1,642,053 | |
Cash | | 36,420 | |
Foreign currency, at value (identified cost, $43) | | 42 | |
Receivable for investments sold | | 13,382 | |
Dividends receivable | | 722 | |
Tax reclaim receivable | | 49 | |
Receivable from the Adviser | | 76,214 | |
Total assets | | $ | 1,768,882 | |
| | | |
Liabilities | | | |
Payable to affiliate for service fees | | $ | 360 | |
Payable for investments purchased | | 14,335 | |
Accrued expenses | | 23,842 | |
Total liabilities | | $ | 38,537 | |
Net Assets | | $ | 1,730,345 | |
| | | |
Sources of Net Assets | | | |
Paid-in capital | | $ | 1,447,576 | |
Accumulated net realized gain (computed on the basis of identified cost) | | 78,059 | |
Accumulated undistributed net investment income | | 1,637 | |
Net unrealized appreciation (computed on the basis of identified cost) | | 203,073 | |
Total | | $ | 1,730,345 | |
| | | |
Class A Shares | | | |
Net Assets | | $ | 1,730,345 | |
Shares Outstanding | | 142,384 | |
Net Asset Value and Redemption Price Per Share (net assets shares of beneficial interest outstanding) | | $ | 12.15 | |
Maximum Offering Price Per Share (100 [DIV] 94.25 of $12.15) | | $ | 12.89 | |
Statement of Operations | | | |
For the Year Ended | | | |
October 31, 2005 | | | |
Investment Income | | | |
Dividends (net of foreign taxes, $336) | | $ | 24,536 | |
Interest | | 424 | |
Total investment income | | $ | 24,960 | |
Expenses— | | | |
Investment adviser fee | | $ | 10,085 | |
Administration fee | | 2,334 | |
Service fees - Class A | | 3,890 | |
Custodian fee | | 8,742 | |
Legal and accounting services | | 33,316 | |
Printing and postage | | 6,932 | |
Registration fees | | 35,366 | |
Transfer and dividend disbursing agent fees | | 568 | |
Miscellaneous | | 6,934 | |
Total expenses | | $ | 108,167 | |
Deduct— | | | |
Waiver and reimbursement of expenses by the Adviser and/or Administrator | | $ | 88,633 | |
Reduction of custodian fee | | 8 | |
Total expense reductions | | $ | 88,641 | |
Net expenses | | $ | 19,526 | |
Net investment income | | $ | 5,434 | |
| | | |
Realized and Unrealized Gain (Loss) | | | |
Net realized gain (loss)— | | | |
Investment transactions (identified cost basis) | | $ | 100,529 | |
Foreign currency transactions | | 27 | |
Net realized gain | | $ | 100,556 | |
Change in unrealized appreciation (depreciation)— | | | |
Investments (identified cost basis) | | $ | 76,613 | |
Foreign currency | | (79 | ) |
Net change in unrealized appreciation (depreciation) | | $ | 76,534 | |
Net realized and unrealized gain | | $ | 177,090 | |
Net increase in net assets from operations | | $ | 182,524 | |
See notes to financial statements
5
Statements of Changes in Net Assets
Increase (Decrease) | | Year Ended | | Year Ended | |
in Net Assets | | October 31, 2005 | | October 31, 2004 | |
From operations— | | | | | |
Net investment income | | $ | 5,434 | | $ | 724 | |
Net realized gain (loss) on investments and foreign currency transactions | | 100,556 | | 48,772 | |
Net change in unrealized appreciation (depreciation) from investments | | 76,534 | | 43,797 | |
Net increase in net assets from operations | | $ | 182,524 | | $ | 93,293 | |
| | | | | |
Distributions to Shareholders: | | | | | |
From net investment income | | $ | (4,361 | ) | $ | (811 | ) |
| | | | | |
Total distributions to shareholders | | $ | (4,361 | ) | $ | (811 | ) |
Transactions in shares of beneficial interest— | | | | | |
Proceeds from sale of share | | $ | 784,868 | | $ | 410,096 | |
Net asset value of shares issued to shareholders in payment of distributions declared | | 4,361 | | 811 | |
Cost of shares redeemed | | (532,825 | ) | (156,590 | ) |
Net increase in net assets from Fund share transactions | | $ | 256,404 | | $ | 254,317 | |
Net increase in net assets | | $ | 434,567 | | $ | 346,799 | |
| | | | | |
Net Assets | | | | | |
At beginning of year | | $ | 1,295,778 | | $ | 948,979 | |
At end of year | | $ | 1,730,345 | | $ | 1,295,778 | |
| | | | | |
Accumulated undistributed net investment income included in net assets | | | | | |
At end of year | | $ | 1,637 | | $ | 537 | |
See notes to financial statements
6
Financial Highlights
| | Class A | |
| | Year Ended October 31, | |
| | 2005(1) | | 2004(1) | | 2003(1) | | 2002(1)(3) | |
Net asset value— Beginning of year | | $ | 10.810 | | $ | 9.860 | | $ | 8.400 | | $ | 10.000 | |
| | | | | | | | | |
Income (loss) from operations | | | | | | | | | |
Net investment income (loss) | | $ | 0.041 | | $ | 0.007 | | $ | 0.007 | | $ | (0.001 | ) |
Net realized and unrealized gain (loss) | | 1.334 | | 0.952 | | 1.453 | | (1.599 | ) |
Total income (loss) from operations | | $ | 1.375 | | $ | 0.959 | | $ | 1.460 | | $ | (1.600 | ) |
| | | | | | | | | |
Less distributions | | | | | | | | | |
From net investment income | | $ | (0.035 | ) | $ | (0.009 | ) | $ | — | | $ | — | |
Total distributions | | $ | (0.035 | ) | $ | (0.009 | ) | $ | — | | $ | — | |
Net asset value— End of year | | $ | 12.150 | | $ | 10.810 | | $ | 9.860 | | $ | 8.400 | |
Total Return(2) | | 12.74 | % | 9.73 | % | 17.38 | % | (16.00 | )% |
| | | | | | | | | |
Ratios/Supplemental Data + | | | | | | | | | |
Net assets, end of period (000’s omitted) | | $ | 1,730 | | $ | 1,296 | | $ | 949 | | $ | 686 | |
Ratios (As a percentage of average daily net assets): | | | | | | | | | |
Net expenses | | 1.25 | % | 1.40 | % | 1.40 | % | 1.45 | % |
Net expenses after custodian fee reduction | | 1.25 | % | 1.40 | % | 1.40 | % | 1.40 | % |
Net investment income (loss) | | 0.35 | % | 0.07 | % | 0.08 | % | (0.01 | )% |
| | | | | | | | | |
Portfolio Turnover | | 93 | % | 70 | % | 64 | % | 90 | % |
+ The operating expenses of the Fund reflect a waiver of the investment adviser fee, a waiver of the administration fee, and an allocation of expenses to the Adviser. Had such actions not been taken, the ratios and the net investment loss per share would have been as follows:
Ratios (As a percentage of average daily net assets): | | | | | | | | | |
Expenses | | 6.95 | % | 5.67 | % | 6.67 | % | 7.22 | % |
Expenses after custodian fee reduction | | 6.95 | % | 5.67 | % | 6.67 | % | 7.17 | % |
Net investment loss | | (5.34 | )% | (4.20 | )% | (5.19 | )% | (5.78 | )% |
Net investment loss per share | | $ | (0.627 | ) | $ | (0.441 | ) | $ | (0.461 | ) | $ | (0.552 | ) |
| | | | | | | | | | | | | |
(1) Net investment income (loss) per share was computed using average shares outstanding.
(2) Returns are historical and are calculated by determining the percentage change in net asset value with all distributions reinvested. Total return is not computed on an annualized basis. Total return would have been lower had certain expenses not been reduced during the periods shown.
(3) Class A commenced operations on November 1, 2001.
See notes to financial statements
7
Eaton Vance Equity Research Fund as of October 31, 2005
NOTES TO FINANCIAL STATEMENTS
1 Significant Accounting Policies
Eaton Vance Equity Research Fund (the Fund) is a diversified series of Eaton Vance Mutual Funds Trust (the Trust) and commenced operations on November 1, 2001. The Trust is an entity of the type commonly known as a Massachusetts business trust and is registered under the Investment Company Act of 1940, as amended, as an open-end management investment company. Effective June 13, 2005, the Fund’s outstanding shares were classified as Class A shares. Class A shares are generally sold subject to a sales charge imposed at time of purchase. The Fund’s investment objective is to achieve long-term capital appreciation by investing in a diversified portfolio of equity securities. The following is a summary of significant accounting policies consistently followed by the Fund in the preparation of its financial statements. The policies are in conformity with accounting principles generally accepted in the United States of America.
A Investment Valuations — Securities listed on a U.S. securities exchange generally are valued at the last sale price on the day of valuation or, if no sales took place on such date, at the mean between the closing bid and asked prices therefore on the exchange where such securities are principally traded. Equity securities listed on the NASDAQ National Market System generally are valued at the official NASDAQ closing price. Unlisted or listed securities for which closing sales prices or closing quotations are not available are valued at the mean between the latest available bid and asked prices or, in the case of preferred equity securities that are not listed or traded in the over-the-counter market, by an independent pricing service. Exchange-traded options are valued at the last sale price for the day of valuation as quoted on the principal exchange or board of trade on which the options are traded or, in the absence of sales on such date, at the mean between the latest bid and asked prices therefore. Futures positions on securities and currencies generally are valued at closing settlement prices. Short-term debt securities with a remaining maturity of 60 days or less are valued at amortized cost. If short-term debt securities were acquired with a remaining maturity of more than 60 days, their amortized cost value will be based on their value on the sixty-first day prior to maturity. Other fixed income and debt securities, including listed securities and securities for which price quotations are available, will normally be valued on the basis of valuations furnished by a pricing service. Foreign securities and currencies are valued in U.S. dollars, based on foreign currency exchange rate quotations supplied by an independent quotation service. The daily valuation of exchange traded foreign securities generally is determined as of the close of trading on the principal exchange on which such securities trade. Events occurring after the close of trading on foreign exchanges may result in adjustments to the valuation of foreign securities to more accurately reflect their fair value as of the close of regular trading on the New York Stock Exchange. When valuing foreign equity securities that meet certain criteria, the Trustees have approved the use of a fair value service that values such securities to reflect market trading that occurs after the close of the applicable foreign markets of comparable securities or other instruments that have a strong correlation to the fair valued securities. Investments held by the Fund for which valuations or market quotations are unavailable are valued at fair value using methods determined in good faith by or at the direction of the Trustees of the Fund considering relevant factors, data and information including the market value of freely tradable securities of the same class in the principal market on which such securities are normally traded.
B Income — Interest income is determined on the basis of interest accrued, adjusted for amortization of premium or accretion of discount. Dividend income is recorded on the ex-dividend date for dividends received in cash and/or securities. However, if the ex-dividend date has passed, certain dividends from foreign securities are recorded as the Fund is informed of the ex-dividend date.
C Federal Taxes — The Fund’s policy is to comply with the provisions of the Internal Revenue Code applicable to regulated investment companies and to distribute to shareholders each year all of its taxable income, including any net realized gain on investments. Accordingly, no provision for federal income or excise tax is necessary. During the year ended October 31, 2005, capital loss carryovers of $21,262 were utilized to offset realized gains.
D Expenses — The majority of expenses of the Trust are directly identifiable to an individual fund. Expenses which are not readily identifiable to a specific fund are allocated taking into consideration, among other things, the nature and type of expense and the relative size of the funds.
E Expense Reduction — Investors Bank & Trust Company (IBT) serves as custodian to the Fund. Pursuant to the custodian agreement, IBT receives a fee reduced by credits which are determined based on the average daily cash balance the Fund maintains with IBT. All credit balances used to reduce the Fund’s custodian fees are reported as a reduction of total expenses in the Statement of Operations. All credit balances used to reduce the Fund’s custodian fee are reported as a reduction of expenses on the Statement of Operations.
F Use of Estimates — The preparation of financial statements in conformity with accounting principles generally accepted in the United States of America requires management to make estimates and assumptions that affect the reported amounts of assets and liabilities at the date of the financial statements and the reported amounts of income and expense during the reporting period. Actual results could differ from those estimates.
8
G Indemnifications — Under the Trust’s organizational documents, its officers and Trustees may be indemnified against certain liabilities and expenses arising out of the performance of their duties to the Fund and shareholders are indemnified against personal liability for obligations of the Trust. Additionally, in the normal course of business, the Fund enters into agreements with service providers that may contain indemnification clauses. The Fund’s maximum exposure under these arrangements is unknown as this would involve future claims that may be made against the Fund that have not yet occurred.
H Other — Investment transactions are accounted for on a trade date basis. Realized gains and losses are computed on the specific identification of the securities sold.
2 Distributions to Shareholders
It is the present policy of the Fund to distribute annually substantially all of the net investment income of the Fund and to distribute, at least annually, substantially all of its net realized capital gains, if any. Distributions are paid in the form of additional shares of the Fund or, at the election of the shareholder, in cash. Shareholders may reinvest distributions in additional shares of the Fund at the net asset value as of the ex-dividend date. The Fund distinguishes between distributions on a tax basis and a financial reporting basis. Permanent differences between book and tax accounting relating to distributions are reclassified to paid-in capital.
The tax character of distributions paid during the years ended October 31, 2005 and October 31, 2004 was as follows:
| | Year Ended | | Year Ended | |
| | October 31, 2005 | | October 31, 2004 | |
Distributions declared from: | | | | | |
Ordinary income | | $ | 4,361 | | $ | 811 | |
| | | | | | | |
During the year ended October 31, 2005, accumulated undistributed net investment income was increased by $27 and accumulated net realized gain was decreased by $27 primarily due to differences between book and tax accounting for foreign currency gains. These changes had no effect on the net assets or the net asset value per share.
As of October 31, 2005, the components of distributable earnings (accumulated losses) on a tax basis were as follows:
Accumulated undistributed net investment income | | $ | 1,637 | |
| | | |
Accumulated undistributed net realized gain | | $ | 88,528 | |
| | | |
Unrealized gain | | $ | 192,604 | |
The differences between components of distributable earnings (accumulated losses) on a tax basis and the amounts reflected in the statement of assets and liabilities are primarily due to wash sales.
3 Shares of Beneficial Interest
The Fund’s Declaration of Trust permits the Trustees to issue an unlimited number of full and fractional shares of beneficial interest (without par value). Transactions in shares of beneficial interest were as follows:
| | Year Ended | | Year Ended | |
Class A | | October 31, 2005 | | October 31, 2004 | |
Sales | | 69,579 | | 38,762 | |
| | | | | |
Issued to shareholders electing to receive payments of distributions in Fund shares | | 378 | | 79 | |
| | | | | |
Redemptions | | (47,423 | ) | (15,238 | ) |
Net increase | | 22,534 | | 23,603 | |
At October 31, 2005, Eaton Vance Management (EVM) and an EVM retirement plan owned 30% and 54%, respectively, of the outstanding shares of the Fund.
4 Investment Adviser Fee and Other Transactions with Affiliates
The investment adviser fee is earned by EVM as compensation for management and investment advisory services rendered to the Fund. EVM receives a monthly advisory fee equal to 0.65% (annually) of the average daily net assets of the Fund up to $500 million and at reduced rates as daily net assets exceed that level. For the year ended October 31, 2005, the fee amounted to $10,085, all of which was waived. An administrative fee is earned by EVM as compensation for administering certain business affairs of the Fund. The fee is equal to 0.15% (annually) of the average daily net assets of the Fund. For the year ended October 31, 2005, the fee amounted to $2,334, all of which was waived. Eaton Vance has contractually agreed to limit net annual Fund operating expenses to 1.40% for Class A. The expense limitation will continue for at least one year, beginning on August 26, 2005. There is no guarantee the expense limitation will continue beyond such date. For the year ended October 31, 2005, EVM has voluntarily agreed to further limit net annual Fund operating expenses to 1.25% for Class A. This voluntary expense reduction could be terminated at any time. Pursuant to this voluntary expense reduction, EVM was allocated $76,214 of the Fund’s operating expenses. EVM serves as the sub-transfer agent of the Fund and receives an aggregate fee based on the actual expenses incurred by EVM in the performance of those services. For the year ended October 31, 2005, EVM earned $56 in sub-transfer agent fees from the Fund.
Except as to Trustees of the Fund who are not members of EVM’s organization, officers and Trustees receive remuneration for their services to the Fund out of such investment adviser fee. Trustees of the Fund who are not affiliated with
9
the Investment Adviser may elect to defer receipt of all or a percentage of their annual fees in accordance with the terms of the Trustees Deferred Compensation Plan. For the year ended October 31, 2005, no significant amounts have been deferred. Certain officers and Trustees of the Fund are officers of the above organization. The Fund did not pay any Trustees fees during the year ended October 31, 2005.
5 Service Plan
The Trust has in effect a Service Plan (The Plan) for the Fund. The Plan authorizes the Fund to make payments of service fees to Eaton Vance Distributor’s, Inc. (EVD), investment dealers and other persons in amounts equal to 0.25% (annually) of the Fund’s average daily net assets. Service fee payments are made for personal services and/or the maintenance of shareholder accounts. Service fees accrued or paid for the year ended October 31, 2005 amounted to $3,890.
6 Investment Transactions
Purchases and sales of investments, other than short-term obligations, aggregated $1,593,864 and $1,393,491, respectively, for the year ended October 31, 2005.
7 Federal Income Tax Basis of Unrealized Appreciation (Depreciation)
The cost and unrealized appreciation (depreciation) in value of the investments owned at October 31, 2005, as computed on a federal income tax basis, were as follows:
Aggregate cost | | $ | 1,449,370 | |
Gross unrealized appreciation | | $ | 243,317 | |
Gross unrealized depreciation | | (50,634 | ) |
Net unrealized appreciation | | $ | 192,683 | |
The net unrealized depreciation on foreign currency at October 31, 2005 was $79.
10
Eaton Vance Equity Research Fund
REPORT OF INDEPENDENT REGISTERED PUBLIC ACCOUNTING FIRM
To the Trustees and Shareholders of
Eaton Vance Equity Research Fund:
In our opinion, the accompanying statement of assets and liabilities, including the portfolio of investments, and the related statements of operations and of changes in net assets and the financial highlights present fairly, in all material respects, the financial position of Eaton Vance Equity Research Fund, a series of Eaton Vance Mutual Funds Trust (the “Fund”), at October 31, 2005, and the results of its operations, the changes in its net assets and the financial highlights for each of the periods indicated, in conformity with accounting principles generally accepted in the United States of America. These financial statements and financial highlights (hereafter referred to as “financial statements”) are the responsibility of the Fund’s management; our responsibility is to express an opinion on these financial statements based on our audits. We conducted our audits of these financial statements in accordance with the standards of the Public Company Accounting Oversight Board (United States). Those standards require that we plan and perform the audit to obtain reasonable assurance about whether the financial statements are free of material misstatement. An audit includes examining, on a test basis, evidence supporting the amounts and disclosures in the financial statements, assessing the accounting principles used and significant estimates made by management, and evaluating the overall financial statement presentation. We believe that our audits, which included confirmation of securities at October 31, 2005 by correspondence with the custodian and brokers, provide a reasonable basis for our opinion.
PricewaterhouseCoopers LLP
Boston, Massachusetts
December 22, 2005
11
Eaton Vance Equity Research Fund as of October 31, 2005
FEDERAL TAX INFORMATION (Unaudited)
The Form 1099-DIV you receive in January 2006 will show the tax status of all distributions paid to your account in calendar 2005. Shareholders are advised to consult their own tax adviser with respect to the tax consequences of their investment in the Fund. As required by the Internal Revenue Code regulations, shareholders must be notified within 60 days of the Fund’s fiscal year end regarding the status of qualified dividend income for individuals and the dividends received deduction for corporations.
Qualified Dividend Income. The Fund designates approximately $24,245, or up to the maximum amount of such dividends allowable pursuant to the Internal Revenue Code, as qualified dividend income eligible for the reduced tax rate of 15%.
Dividends Received Deduction. Corporate shareholders are generally entitled to take the dividends received deduction on the portion of the Fund’s dividend distribution that qualifies under tax law. For the Fund’s fiscal year 2005 ordinary income dividends, 100% qualifies for the corporate dividends received deduction.
12
The investment advisory agreement between Eaton Vance Equity Research Fund (the “Fund”) and its investment adviser, Eaton Vance Management (“Eaton Vance”), provides that the agreement will continue in effect from year to year so long as its continuance is approved at least annually (i) by a vote of a majority of the noninterested Trustees of the Fund cast in person at a meeting called for the purpose of voting on such approval and (ii) by the Trustees of the Fund or by vote of a majority of the outstanding interests of the Fund.
In considering the annual approval of the investment advisory agreement, the Special Committee of the Board of Trustees considered information that had been provided throughout the year at regular Board meetings, as well as information furnished for a series of meetings held in February and March in preparation for a Board meeting held on March 21, 2005 to specifically consider the renewal of the investment advisory agreement. Such information included, among other things, the following:
* An independent report comparing the advisory fees of the Fund with those of comparable funds;
* An independent report comparing the expense ratio of the Fund to those of comparable funds;
* Information regarding Fund investment performance;
* The economic outlook and the general investment outlook in relevant investment markets;
* Eaton Vance’s results and financial condition and the overall organization of the investment adviser;
* The procedures and processes used to determine the fair value of Fund assets and actions taken to monitor and test the effectiveness of such procedures and processes;
* The allocation of brokerage and the benefits received by the investment adviser as the result of brokerage allocation;
* Eaton Vance’s management of the relationship with the custodian, subcustodians and fund accountants;
* The resources devoted to compliance efforts undertaken by Eaton Vance on behalf of the funds it manages and the record of compliance with the investment policies and restrictions and with policies on personal securities transactions;
* The quality, nature, cost and character of the administrative and other non-investment management services provided by Eaton Vance and its affiliates; and
* The terms of the advisory agreement and the reasonableness and appropriateness of the particular fee paid by the Fund for the services described therein.
The Special Committee also considered the nature, extent and quality of the management services provided by the investment adviser. In so doing, the Special Committee considered the investment adviser’s management capabilities with respect to the types of investments held by the Fund, including information relating to the education, experience and number of investment professionals and other personnel who provide services under the investment advisory agreement. The Special Committee specifically noted the
investment adviser’s in-house equity research capabilities. The Special Committee also took into account the time and attention to be devoted by senior management to the Fund and the other funds in the complex. The Special Committee evaluated the level of skill required to manage the Fund and concluded that the human resources available at the investment adviser were appropriate to fulfill effectively its duties on behalf of the Fund.
In its review of Fund investment performance, the Special Committee concluded that the Fund has performed within a range that the Special Committee deemed competitive. With respect to its review of investment advisory fees, the Special Committee concluded that the fees paid by the Fund are within the range of those paid by comparable funds within the mutual fund industry. In reviewing the information regarding the expense ratio of the Fund, the Special Committee concluded that the Fund’s expense ratio is within a range that is competitive with comparable funds.
In addition to the factors mentioned above, the Special Committee reviewed the level of the investment adviser’s profits in providing investment management services for the Fund and for all Eaton Vance funds as a group, as well as the investment adviser’s implementation of a soft dollar reimbursement program. Pursuant to the soft dollar reimbursement program, the Fund may receive reimbursement payments in respect of third party research services obtained by the investment adviser as a result of soft dollar credits generated through trading on behalf of the Fund. The Special Committee also reviewed the benefits to Eaton Vance and its affiliates in providing administration services for the Fund and for all Eaton Vance funds as a group. In addition, the Special Committee considered the fiduciary duty assumed by the investment adviser in connection with the services rendered to the Fund and the business reputation of the investment adviser and its financial resources. The Special Committee further considered voluntary fee waivers by and an expense allocation to Eaton Vance. The Trustees concluded that in light of the services rendered, the profits realized by the investment adviser are not unreasonable. The Special Committee also considered the extent to which the investment adviser appears to be realizing benefits from economies of scale in managing the Fund, and concluded that the fee breakpoints which are in place will allow for an equitable sharing of such benefits, when realized, with the shareholders of the Fund.
13
The Special Committee did not consider any single factor as controlling in determining whether or not to approve the investment advisory agreement. Nor are the items described herein all the matters considered by the Special Committee. In assessing the information provided by Eaton Vance and its affiliates, the Special Committee also took into consideration the benefits to shareholders of investing in a fund that is a part of a large family of funds which provides a large variety of shareholder services.
Based on its consideration of the foregoing factors and conclusions, and such other factors and conclusions as it deemed relevant, and assisted by independent counsel, the Special Committee concluded that the approval of the investment advisory agreement, including the fee structure, is in the interests of shareholders.
14
Eaton Vance Equity Research Fund
MANAGEMENT AND ORGANIZATION
Fund Management
The Trustees of Eaton Vance Mutual Funds Trust (the Trust), are responsible for the overall management and supervision of the Trust’s affairs. The Trustees and officers of the Trust are listed below. Except as indicated, each individual has held the office shown or other offices in the same company for the last five years. Trustees and officers of the Trust hold indefinite terms of office. The “noninterested Trustees” consist of those Trustees who are not “interested persons” of the Trust, as that term is defined under the 1940 Act. The business address of each Trustee and officer is The Eaton Vance Building, 255 State Street, Boston, Massachusetts, 02109. As used below, “EVC” means Eaton Vance Corporation, “EV” means Eaton Vance, Inc., “EVM” means Eaton Vance Management, “BMR” means Boston Management and Research and “EVD” means Eaton Vance Distributors, Inc. EVC and EV are the corporate parent and trustee, respectively, of EVM and BMR. EVD is the Fund’s principal underwriter and a wholly-owned subsidiary of EVM. Each officer affiliated with Eaton Vance may hold a position with other Eaton Vance affiliates that is comparable to its position with EVM listed below.
| | | | | | | | Number of | | | |
| | | | Term of | | | | Portfolios in | | | |
| | Position(s) | | Office and | | | | Fund Complex | | Other | |
Name and | | with the | | Length of | | Principal Occupation(s) | | Overseen | | Directorships | |
Date of Birth | | Trust | | Service | | During Past Five Years | | By Trustee(1) | | Held | |
Interested Trustee | | | | | | | | | | | |
James B. Hawkes
11/9/41 | | Trustee | | Since 1991 | | Chairman, President and Chief Executive Officer of BMR, EVC, EVM and EV; Director of EV; Vice President and Director of EVD. Trustee and/or officer of 161 registered investment companies in the Eaton Vance Fund Complex. Mr. Hawkes is an interested person because of his positions with BMR, EVM, EVC and EV, which are affiliates of the Trust. | | 161 | | Director of EVC | |
15
| | | | | | | | Number of | | | |
| | | | Term of | | | | Portfolios in | | | |
| | Position(s) | | Office and | | | | Fund Complex | | Other | |
Name and | | with the | | Length of | | Principal Occupation(s) | | Overseen | | Directorships | |
Date of Birth | | Trust | | Service | | During Past Five Years | | By Trustee(1) | | Held | |
Noninterested Trustees | | | | | | | | | |
Benjamin C. Esty
1/26/63 | | Trustee | | Since 2005 | | Professor, Harvard University Graduate School of Business Administration (since 2003). Formerly, Associate Professor, Harvard University Graduate School of Business Administration. (2000-2003). | | 152 | | None | |
Samuel L. Hayes, III
2/23/35 | | Trustee | | Trustee since since 1986
and Chairman
of the Board
since 2005 | | Jacob H. Schiff Professor of Investment Banking Emeritus, Harvard University Graduate School of Business Administration. Director of Yakima Products, Inc. (manufacturer of automotive accessories) (since 2001) and Director of Telect, Inc. (telecommunications services company) (since 2000). | | 161 | | Director of Tiffany & Co. (specialty retailer) | |
William H. Park
9/19/47 | | Trustee | | Since 2003 | | President and Chief Executive Officer, Prizm Capital Management, LLC (investment management firm) (since 2002). Executive Vice President and Chief Financial Officer, United Asset Management Corporation (a holding company owning institutional investment management firms) (1982-2001). | | 161 | | None | |
Ronald A. Pearlman
7/10/40 | | Trustee | | Since 2003 | | Professor of Law, Georgetown University Law Center (since 1999). Tax Partner, Covington & Burling, Washington, DC (1991-2000). | | 161 | | None | |
16
| | | | | | | | Number of | | | |
| | | | Term of | | | | Portfolios in | | | |
| | Position(s) | | Office and | | | | Fund Complex | | Other | |
Name and | | with the | | Length of | | Principal Occupation(s) | | Overseen | | Directorships | |
Date of Birth | | Trust | | Service | | During Past Five Years | | By Trustee(1) | | Held | |
Norton H. Reamer
9/21/35 | | Trustee | | Since 1986 | | President, Chief Executive Officer and a Director of Asset Management Finance Corp. (a specialty finance company serving the investment management industry) (since October 2003). President, Unicorn Corporation (an investment and financial advisory services company) (since September 2000). Formerly, Chairman, Hellman, Jordan Management Co., Inc. (an investment management company) (2000-2003). Formerly, Advisory Director, Berkshire Capital Corporation (investment banking firm) (2002-2003). Formerly, Chairman of the Board, United Asset Management Corporation (a holding company owning institutional investment management firms) and Chairman, President and Director, UAM Funds (mutual funds). | | 161 | | None | |
Lynn A. Stout
9/14/57 | | Trustee | | Since 1998 | | Professor of Law, University of California at Los Angeles School of Law (since July 2001). Formerly, Professor of Law, Georgetown University Law Center. | | 161 | | None | |
Ralph F. Verni
1/26/43 | | Trustee | | Since 2005 | | Consultant and private investor (since 2000). Formerly, President and Chief Executive Officer, Redwood Investment Systems, Inc. (software developer) (2000). Formerly, President and Chief Executive Officer, State Street Research & Management (investment advisor), SSRM Holdings (parent of State Street Research & Management), and SSR Realty (institutional realty manager) (1992-2000). | | 152 | | Director of W.P. Carey & Company LLC (manager of real estate investment trusts) | |
17
| | | | Term of | | | |
| | Position(s) | | Office and | | | |
Name and | | with the | | Length of | | Principal Occupation(s) | |
Date of Birth | | Trust | | Service | | During Past Five Years | |
Principal Officers Who Are Not Trustees | | | | | | | |
Thomas E. Faust Jr.
5/31/58 | | President | | Since 2002 | | Executive Vice President of EVM, BMR, EVC and EV; Chief Investment Officer of EVM and BMR and Director of EVC. Chief Executive Officer of Belair Capital Fund LLC, Belcrest Capital Fund LLC, Belmar Capital Fund LLC, Belport Capital Fund LLC and Belrose Capital Fund LLC (private investment companies sponsored by EVM). Officer of 65 registered investment companies managed by EVM or BMR. | |
William H. Ahern, Jr.
7/28/59 | | Vice President | | Since 1995 | | Vice President of EVM and BMR. Officer of 70 registered investment companies managed by EVM or BMR. | |
Cynthia J. Clemson
8/20/63 | | Vice President | | Since 2005 | | Vice President of EVM and BMR. Officer of 85 registered investment companies managed by EVM or BMR. | |
Kevin S. Dyer
2/21/75 | | Vice President | | Since 2005 | | Asssistant Vice President of EVM and BMR. Officer of 24 registered companies managed by EVM or BMR. | |
Aamer Khan
6/7/60 | | Vice President | | Since 2005 | | Vice President of EVM and BMR. Officer of 27 registered investment companies managed by EVM or BMR. | |
Michael R. Mach
7/15/47 | | Vice President | | Since 1999 | | Vice President of EVM and BMR. Officer of 32 investment companies managed by EVM or BMR. | |
Robert B. MacIntosh
1/22/57 | | Vice President | | Since 1998 | | Vice President of EVM and BMR. Officer of 85 registered investment companies managed by EVM or BMR. | |
Duncan W. Richardson
10/26/57 | | Vice President | | Since 2001 | | Senior Vice President and Chief Equity Investment Officer of Eaton Vance and BMR. Officer of 51 registered investment companies managed by EVM or BMR. | |
18
| | | | Term of | | | |
| | Position(s) | | Office and | | | |
Name and | | with the | | Length of | | Principal Occupation(s) | |
Date of Birth | | Trust | | Service | | During Past Five Years | |
Walter A. Row, III
7/20/57 | | Vice President | | Since 2001 | | Director of Equity Research and a Vice President of EVM and BMR. Officer of 31 registered investment companies managed by EVM or BMR. | |
Judith A. Saryan
3/31/61 | | Vice President | | Since 2003 | | Vice President of EVM and BMR. Officer of 33 registered investment companies managed by EVM or BMR. | |
Susan Schiff
3/31/61 | | Vice President | | Since 2003 | | Vice President of EVM and BMR. Officer of 29 registered investment companies managed by EVM or BMR. | |
Barbara E. Campbell
6/19/57 | | Treasurer | | Since 2005(2) | | Vice President of EVM and BMR. Officer of 161 registered investment companies managed by EVM or BMR. | |
Alan R. Dynner
10/10/40 | | Secretary | | Since 1997 | | Vice President, Secretary and Chief Legal Officer of BMR, EVM, EVD, EV and EVC. Officer of 161 registered investment companies managed by EVM or BMR. | |
Paul M. O’Neil
7/1/53 | | Chief
Compliance
Officer | | Since 2004 | | Vice President of EVM and BMR. Officer of 161 registered investment companies managed by EVM or BMR. | |
(1) Includes both master and feeder funds in a master-feeder structure.
(2) Prior to 2005, Ms. Campbell served as Assistant Treasurer since 1995.
The SAI for the Fund includes additional information about the Trustees and officers of the Fund and can be obtained without charge on Eaton Vance’s website at www.eatonvance.com or by calling 1-800-225-6265.
19
THIS PAGE INTENTIONALLY LEFT BLANK.
THIS PAGE INTENTIONALLY LEFT BLANK.
Investment Adviser and Administrator of Eaton Vance Equity Research Fund
Eaton Vance Management
The Eaton Vance Building
255 State Street
Boston, MA 02109
Principal Underwriter
Eaton Vance Distributors, Inc.
The Eaton Vance Building
255 State Street
Boston, MA 02109
(617) 482-8260
Custodian
Investors Bank & Trust Company
200 Clarendon Street
Boston, MA 02116
Transfer Agent
PFPC Inc.
Attn: Eaton Vance Funds
P.O. Box 9653
Providence, RI 02940-9653
(800) 262-1122
Independent Registered Public Accounting Firm
PricewaterhouseCoopers LLP
125 High Street
Boston, MA 02110
Eaton Vance Equity Research Fund
The Eaton Vance Building
255 State Street
Boston, MA 02109
This report must be preceded or accompanied by a current prospectus. Before investing, investors should consider carefully the Fund’s investment objective(s), risks, and charges and expenses. The Fund’s current prospectus contains this and other information about the Fund and is available through your financial advisor. Please read the prospectus carefully before you invest or send money. For further information please call 1-800-225-6265.


Annual Report October 31, 2005

| EATON VANCE
FLOATING-RATE
FUND | |
IMPORTANT NOTICES REGARDING PRIVACY,
DELIVERY OF SHAREHOLDER DOCUMENTS,
PORTFOLIO HOLDINGS AND PROXY VOTING
Privacy. The Eaton Vance organization is committed to ensuring your financial privacy. Each of the financial institutions
identified below has in effect the following policy (“Privacy Policy”) with respect to nonpublic personal information about
its customers:
• Only such information received from you, through application forms or otherwise, and information about your Eaton Vancefund transactions will be collected. This may include information such as name, address, social security number, tax status, account balances and transactions.
• None of such information about you (or former customers) will be disclosed to anyone, except as permitted by law (whichincludes disclosure to employees necessary to service your account). In the normal course of servicing a customer’s account, Eaton Vance may share information with unaffiliated third parties that perform various required services such as transfer agents, custodians and broker/dealers.
• Policies and procedures (including physical, electronic and procedural safeguards) are in place that are designed to protectthe confidentiality of such information.
• We reserve the right to change our Privacy Policy at any time upon proper notification to you. Customers may want toreview our Policy periodically for changes by accessing the link on our homepage: www.eatonvance.com.
Our pledge of privacy applies to the following entities within the Eaton Vance organization: the Eaton Vance Family of
Funds, Eaton Vance Management, Eaton Vance Investment Counsel, Boston Management and Research, and Eaton Vance
Distributors, Inc.
In addition, our Privacy Policy only applies to those Eaton Vance customers who are individuals and who have a direct
relationship with us. If a customer’s account (i.e., fund shares) is held in the name of a third-party financial adviser/
broker-dealer, it is likely that only such adviser’s privacy policies apply to the customer. This notice supersedes all previously
issued privacy disclosures.
For more information about Eaton Vance’s Privacy Policy, please call 1-800-262-1122.
Delivery of Shareholder Documents. The Securities and Exchange Commission (the “SEC”) permits funds to deliver only
one copy of shareholder documents, including prospectuses, proxy statements and shareholder reports, to fund investors with
multiple accounts at the same residential or post office box address. This practice is often called “householding” and it helps
eliminate duplicate mailings to shareholders.
Eaton Vance, or your financial adviser, may household the mailing of your documents indefinitely unless you
instruct Eaton Vance, or your financial adviser, otherwise.
If you would prefer that your Eaton Vance documents not be householded, please contact Eaton Vance at
1-800-262-1122, or contact your financial adviser.
Your instructions that householding not apply to delivery of your Eaton Vance documents will be effective within 30 days
of receipt by Eaton Vance or your financial adviser.
Portfolio Holdings. Each Eaton Vance Fund and its underlying Portfolio (if applicable) will file a schedule of its portfolio
holdings on Form N-Q with the SEC for the first and third quarters of each fiscal year. The Form N-Q will be available
on the Eaton Vance website www.eatonvance.com, by calling Eaton Vance at 1-800-262-1122 or in the EDGAR database
on the SEC’s website at www.sec.gov. Form N-Q may also be reviewed and copied at the SEC’s public reference room in
Washington, D.C. (call 1-800-732-0330 for information on the operation of the public reference room).
Proxy Voting. From time to time, funds are required to vote proxies related to the securities held by the funds. The Eaton
Vance Funds or their underlying Portfolios (if applicable) vote proxies according to a set of policies and procedures approved
by the Funds’ and Portfolios’ Boards. You may obtain a description of these policies and procedures and information on
how the Funds or Portfolios voted proxies relating to portfolio securities during the most recent 12 month period ended
June 30, without charge, upon request, by calling 1-800-262-1122. This description is also available on the SEC’s website
at www.sec.gov.
Eaton Vance Floating-Rate Fund as of October 31, 2005
MANAGEMENT’S DISCUSSION OF FUND PERFORMANCE
The Fund
Performance for the Past Year
• The Fund’s Class A shares distributed $0.427 in income dividends during the year ended October 31, 2005. Based on the Class A most recent distribution and a $10.22 net asset value on October 31, 2005, the Fund had a distribution rate of 5.18%.(1) The Class A SEC 30-day yield at October 31, 2005 was 5.13%.(2)
• The Fund’s Class B shares distributed $0.339 in income dividends during the year ended October 31, 2005. Based on the Class B most recent distribution and a $9.87 net asset value on October 31, 2005, the Fund had a distribution rate of 4.43%.(1) The Class B SEC 30-day yield at October 31, 2005 was 4.49%.(2 )
• The Fund’s Class C shares distributed $0.339 in income dividends during the year ended October 31, 2005. Based on the Class C most recent distribution and a $9.87 net asset value on October 31, 2005, the Fund had a distribution rate of 4.43%.(1) The Class C SEC 30-day yield at October 31, 2005 was 4.49%.(2)
• The Fund’s Class I shares distributed $0.438 in income dividends during the year ended October 31, 2005. Based on the Class I most recent distribution and a $9.88 net asset value on October 31, 2005, the Fund had a distribution rate of 5.43%.(1) The Class I SEC 30-day yield at October 31, 2005 was 5.50%.(2)
• The Fund’s Advisers Class shares distributed $0.413 in income dividends during the year ended October 31, 2005. Based on the Adviser Class most recent distribution and a $9.88 net asset value on October 31, 2005, the Fund had a distribution rate of 5.18%.(1) The Advisers Class SEC 30-day yield at October 31, 2005 was 5.24%.(2)
The Fund’s Investments
• Floating Rate Portfolio’s investments included 481 borrowers at October 31, 2005 with an average loan size of just 0.20% of total investments, and no industry constituting more than 8.0% of total investments. Building and development (including manufacturers of building products and companies that manage/own apartments, shopping malls and commercial office buildings, among others), health care, publishing, leisure goods/activities/movies and chemicals/ plastics were the largest industry weightings.
• The loan market performed well, as short-term interest rates rose throughout the fiscal year. The London Inter-Bank Offered Rate (LIBOR) – the benchmark over which loan interest rates are typically set – kept pace with the Federal Reserve’s rate hikes, rising 175 basis points (1.75%) over the period. Yield spreads narrowed to just below their historical range, although there were signs that downward pressures were mitigating.
• In the wake of Hurricanes Katrina and Rita, management identified approximately 10 companies that were directly impacted by the storms. While these loans suffered very little price impact, management nonetheless selectively reduced exposure to the hardest- hit companies, generally at prices above par. The hurricanes had little initial overall impact on the Portfolio.
• The Portfolio expanded its investment universe to include European loans during the fiscal year, a move that, in management’s view, has helped the Portfolio diversify further. Management employed a hedging strategy to hedge the currency risk.
• For the year ended October 31, 2005, the Fund’s Class I shares had a total return of 4.52% versus the 5.03% total return of the S&P/LSTA Leveraged Loan Index – an unmanaged index of U.S. dollar-denominated leveraged loans.(3) The Fund’s underperformance versus the Index was attributed to the Portfolio’s lower relative weightings in the riskier segments of the market, such as the auto and auto parts sector.
The views expressed in this report are those of the portfolio managers and are current only through the end of the period of the report as stated on the cover. These views are subject to change at any time based upon market or other conditions, and the investment adviser disclaims any responsibility to update such views. These views may not be relied on as investment advice and, because investment decisions for a fund are based on many factors, may not be relied on as an indication of trading intent on behalf of any Eaton Vance fund.
Fund shares are not insured by the FDIC and are not deposits or other obligations of, or guaranteed by, any depository institution. Shares are subject to investment risks, including possible loss of principal invested.
(1) The Fund’s distribution rate represents actual distributions paid to shareholders and is calculated daily by dividing the last distribution per share (annualized) by the net asset value.
(2) The Fund’s SEC yield is calculated by dividing the net investment income per share for the 30-day period by the offering price at the end of the period and annualizing the result.
(3) It is not possible to invest directly in an Index. The Index’s total return does not reflect the commissions or expenses that would have been incurred if an investor individually purchased or sold the securities represented in the Index.
Past performance is no guarantee of future results. Returns are historical and are calculated by determining the percentage change in net asset value or offering price (as applicable) with all distributions reinvested. Investment return and principal value will fluctuate so that shares, when redeemed, may be worth more or less than their original cost. Performance is for the stated time period only; due to market volatility, the Fund’s current performance may be lower or higher than the quoted return. For performance as of the most recent month end, please refer to www.eatonvance.com.
2
Eaton Vance Floating-Rate Fund as of October 31, 2005
FUND PERFORMANCE
The line graph and table set forth below provide information about the Fund’s performance. The line graph compares the performance of Class B of the Fund with that of the S&P/LSTA leveraged Loan Index, an unmanaged loan market index. The lines on the graph represent the total returns of a hypothetical investment of $10,000 in Class B of the Fund and the S&P/LSTA leveraged Loan Index. The table includes the total returns of each Class of the Fund at net asset value and public offering price. The performance presented below does not reflect the deduction of taxes, if any, that a shareholder would pay on Fund distributions or the redemption of Fund shares.
Performance (1) | | Class A | | Class B | | Class C | | Class I | | Advisers
Class | |
Average Annual Total Returns (at net asset value) | | | | | | | | | | | |
One Year | | 4.36 | % | 3.48 | % | 3.48 | % | 4.52 | % | 4.26 | % |
Life of Fund† | | 4.37 | | 3.10 | | 3.11 | | 4.17 | | 3.88 | |
SEC Average Annual Total Returns (including sales charge or applicable CDSC) | | | | | | | | | | | |
One Year | | 1.97 | % | -1.52 | % | 2.48 | % | 4.52 | % | 4.26 | % |
Life of Fund† | | 3.42 | | 2.73 | | 3.11 | | 4.17 | | 3.88 | |
† Inception Dates – Class A: 5/5/03; Class B: 2/5/01; Class C: 2/1/01; Class I: 1/30/01; Advisers Class: 2/7/01
(1) Average Annual Total Returns at net asset value do not include the 2.25% maximum sales change for Class A shares or the applicable contingent deferred sales charges (CDSC) for Class B or Class C shares. If sales charges were deducted, returns would be lower. SEC Average Annual Total Returns for Class A reflect the maximum 2.25% sales charge. SEC returns for Class B reflect applicable CDSC based on the following schedule: 5% - 1st and 2nd years; 4% - 3rd year; 3% - 4th year; 2% - 5th year; 1% - 6th year. 1-year SEC returns for Class C reflect 1% CDSC. Advisers Class and Class 1 are offered to certain investors at net asset value. Class A, Advisers Class and Class I shares redeemed or exchanged within 90 days of settlement of purchase are subject to a 1% redemption fee.
Past performance is no guarantee of future results. Returns are historical and are calculated by determining the percentage change in net asset value or offering price (as applicable) with all distributions reinvested. Investment return and principal value will fluctuate so that shares, when redeemed, may be worth more or less than their original cost. Performance is for the stated time period only; due to market volatility, the Fund's current performance may be lower or higher than the quoted return. For performance as of the most recent month end, please refer to www.eatonvance.com.
Diversification by Industries (2)
By total investments
Building & Development | | 7.3 | % |
Healthcare | | 6.4 | |
Publishing | | 5.5 | |
Chemicals & Plastics | | 5.2 | |
Leisure Goods/Activities/Movies | | 4.8 | |
Radio & Television | | 4.6 | |
Telecommunications | | 4.2 | |
Lodging & Casinos | | 4.1 | |
Cable & Satellite Television | | 4.1 | |
Business Equip. & Services | | 3.9 | |
Automotive | | 3.9 | |
Oil & Gas | | 3.8 | |
Containers & Glass Products | | 3.7 | |
Retailers (Except Food & Drug) | | 3.1 | |
Utilities | | 2.6 | |
Conglomerates | | 2.5 | |
Electronics/Electrical | | 2.3 | |
Financial Intermediaries | | 2.2 | |
Nonferrous Metals/Minerals | | 2.1 | |
Food Products | | 2.1 | % |
Food Service | | 2.0 | |
Aerospace & Defense | | 1.9 | |
Forest Products | | 1.8 | |
Food/Drug Retailers | | 1.7 | |
Ecological Services & Equip. | | 1.3 | |
Beverage & Tobacco | | 1.3 | |
Industrial Equipment | | 1.2 | |
Home Furnishings | | 1.2 | |
Insurance | | 0.9 | |
Equipment Leasing | | 0.8 | |
Cosmetics/Toiletries | | 0.7 | |
Drugs | | 0.6 | |
Rail Industries | | 0.5 | |
Clothing/Textiles | | 0.4 | |
Surface Transport | | 0.3 | |
Air Transport | | 0.2 | |
Real Estate | | 0.2 | |
Farming/Agriculture | | 0.2 | |
(2) Reflects the Fund's investments in Floating Rate Portfolio as of October 31, 2005. Industries are shown as a percentage of the Portfolio's total investments. Statistics may not be representative of current or future investments and are subject to change due to active management.
Comparison of Change in Value of a $10,000 Investment in Eaton Vance Floating-Rate Class B vs. the S&P/LSTA Leveraged Loan Index*
February 28, 2001 – October 31, 2005
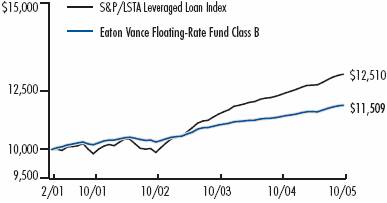
* Sources: Thomson Financial; Bloomberg, L.P. Class B of the Fund commenced operations on 2/5/01.
The investment in Class B shares would have been valued at $11,312 after the deduction of the applicable CDSC. A $10,000 hypothetical investment at net asset value in Class A on 5/5/03, Class C on 2/1/01, Class I on 1/30/01 and Advisers Class on 2/7/01 would have been valued at $11,125, $11,565, $12,140 and $11,974, respectively, on 10/31/05. A $10,000 hypothetical investment in Class A shares of the Fund at maximum offering price would have been valued at $10,875. It is not possible to invest directly in an Index. The Index's total return does not reflect the expenses that would have been incurred if an investor individually purchased or sold the securities represented in the Index.
Fund Allocations (3)
By total investments
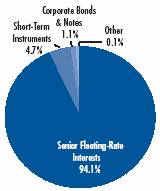
(3) Reflects the Fund's investment in Floating Rate Portfolio as of October 31, 2005. Allocations are shown as a percentage of the Fund's total investments. Statistics may not be representative of current or future investments and are subject to change due to active management.
3
Eaton Vance Floating-Rate Fund as of October 31, 2005
FUND EXPENSES
Example: As a shareholder of the Fund, you incur two types of costs: (1) transaction costs, including sales charges (loads) on purchases and redemption fees (if applicable); and (2) ongoing costs, including management fees; distribution or service fees; and other Fund expenses. This Example is intended to help you understand your ongoing costs (in dollars) of investing in the Fund and to compare these costs with the ongoing costs of investing in other mutual funds. The Example is based on an investment of $1,000 invested at the beginning of the period and held for the entire period (May 1, 2005 – October 31, 2005).
Actual Expenses: The first section of the table below provides information about actual account values and actual expenses. You may use the information in this section, together with the amount you invested, to estimate the expenses that you paid over the period. Simply divide your account value by $1,000 (for example, an $8,600 account value divided by $1,000 = 8.6), then multiply the result by the number in the first line under the heading entitled “Expenses Paid During Period” to estimate the expenses you paid on your account during this period.
Hypothetical Example for Comparison Purposes: The second section of the table below provides information about hypothetical account values and hypothetical expenses based on the Fund's actual expense ratios and an assumed rate of return of 5% per year before expenses, which is not the actual return of the Fund. The hypothetical account values and expenses may not be used to estimate the actual ending account balance or expenses you paid for the period. You may use this information to compare the ongoing costs of investing in the Fund and other funds. To do so, compare this 5% hypothetical example with the 5% hypothetical examples that appear in the shareholder reports of the other funds.
Please note that the expenses shown in the table are meant to highlight your ongoing costs only and do not reflect any transactional costs, such as sales charges (loads) or redemption fees (if applicable). Therefore, the second section of the table is useful in comparing ongoing costs only, and will not help you determine the relative total costs of owning different funds. In addition, if these transactional costs were included, your costs would have been higher.
Eaton Vance Floating-Rate Fund |
| | Beginning Account Value
(5/1/05) | | Ending Account Value
(10/31/05) | | Expenses Paid During Period*
(5/1/05 — 10/31/05) | |
Actual | | | | | | | |
Class A | | $ | 1,000.00 | | $ | 1,023.70 | | $ | 5.20 | |
Class B | | $ | 1,000.00 | | $ | 1,018.80 | | $ | 9.06 | |
Class C | | $ | 1,000.00 | | $ | 1,018.80 | | $ | 9.06 | |
Class I | | $ | 1,000.00 | | $ | 1,024.00 | | $ | 3.93 | |
Advisers Class | | $ | 1,000.00 | | $ | 1,022.60 | | $ | 5.25 | |
| | | | | | | |
Hypothetical | | | | | | | |
(5% return before expenses) | | | | | | | |
Class A | | $ | 1,000.00 | | $ | 1,020.10 | | $ | 5.19 | |
Class B | | $ | 1,000.00 | | $ | 1,016.20 | | $ | 9.05 | |
Class C | | $ | 1,000.00 | | $ | 1,016.20 | | $ | 9.05 | |
Class I | | $ | 1,000.00 | | $ | 1,021.30 | | $ | 3.92 | |
Advisers Class | | $ | 1,000.00 | | $ | 1,020.00 | | $ | 5.24 | |
* Expenses are equal to the Fund’s annualized expense ratio of 1.02% for Class A shares, 1.78% for Class B shares, 1.78% for Class C shares, 0.77% for Class I shares and 1.03% for Advisers Class shares multiplied by the average account value over the period, multiplied by 184/365 (to reflect the one-half-year period). The example assumes that the $1,000 was invested at the net asset value per share determined at the close of business on April 30, 2005. The Example reflects the expenses of both the Fund and the Portfolio. |
4
Eaton Vance Floating-Rate Fund as of October 31, 2005
FINANCIAL STATEMENTS
Statement of Assets and Liabilities
As of October 31, 2005 | | | |
Assets | | | |
Investment in Floating-Rate Portfolio, at value (identified cost, $4,367,308,299) | | $ | 4,391,126,222 | |
Receivable for Fund shares sold | | 34,014,365 | |
Total assets | | $ | 4,425,140,587 | |
| | | |
Liabilities | | | |
Payable for Fund shares redeemed | | $ | 16,356,635 | |
Dividends payable | | 5,895,697 | |
Payable to affiliate for distribution and service fees | | 1,796,994 | |
Payable to affiliate for administration fee | | 555,189 | |
Payable to affiliate for Trustees’ fees | | 311 | |
Accrued expenses | | 736,892 | |
Total liabilities | | $ | 25,341,718 | |
Net Assets | | $ | 4,399,798,869 | |
| | | |
Sources of Net Assets | | | |
Paid-in capital | | $ | 4,402,530,824 | |
Accumulated net realized loss from Portfolio (computed on the basis of identified cost) | | (27,614,905 | ) |
Accumulated undistributed net investment income | | 1,065,027 | |
Net unrealized appreciation from Portfolio (computed on the basis of identified cost) | | 23,817,923 | |
Total | | $ | 4,399,798,869 | |
| | | |
Advisers Shares | | | |
Net Assets | | $ | 1,021,525,548 | |
Shares Outstanding | | 103,394,108 | |
Net Asset Value, Offering Price and Redemption Price Per Share
(net assets ÷ shares of beneficial interest outstanding) | | $ | 9.88 | |
| | | |
Class A Shares | | | |
Net Assets | | $ | 1,521,459,504 | |
Shares Outstanding | | 148,919,430 | |
Net Asset Value and Redemption Price Per Share
(net assets ÷ shares of beneficial interest outstanding) | | $ | 10.22 | |
Maximum Offering Price Per Share (100 ÷ 97.75 of $10.22) | | $ | 10.46 | |
| | | |
Class B Shares | | | |
Net Assets | | $ | 264,403,418 | |
Shares Outstanding | | 26,781,095 | |
Net Asset Value, Offering Price and Redemption Price Per Share
(net assets ÷ shares of beneficial interest outstanding) | | $ | 9.87 | |
| | | |
Class C Shares | | | |
Net Assets | | $ | 1,220,712,648 | |
Shares Outstanding | | 123,629,520 | |
Net Asset Value, Offering Price and Redemption Price Per Share
(net assets ÷ shares of beneficial interest outstanding) | | $ | 9.87 | |
| | | |
Institutional Shares | | | |
Net Assets | | $ | 371,697,751 | |
Shares Outstanding | | 37,620,706 | |
Net Asset Value, Offering Price and Redemption Price Per Share
(net assets ÷ shares of beneficial interest outstanding) | | $ | 9.88 | |
On sales of $100,000 or more, the offering price of Class A shares is reduced.
Statement of Operations
For the Year Ended
October 31, 2005 | | | |
| | | |
Investment Income | | | |
Interest allocated from Portfolio | | $ | 216,274,926 | |
Dividends allocated from Portfolio | | 1,661 | |
Expenses allocated from Portfolio | | (22,461,986 | ) |
Net investment income from Portfolio | | $ | 193,814,601 | |
| | | |
Expenses | | | |
Administration fee | | $ | 6,206,999 | |
Trustees’ fees and expenses | | 3,263 | |
Distribution and service fees | | | |
Advisers | | 2,304,052 | |
Class A | | 3,393,981 | |
Class B | | 2,832,723 | |
Class C | | 12,524,064 | |
Transfer and dividend disbursing agent fees | | 2,649,432 | |
Printing and postage | | 428,495 | |
Registration fees | | 370,591 | |
Legal and accounting services | | 114,679 | |
Custodian fee | | 31,284 | |
Miscellaneous | | 50,630 | |
Total expenses | | $ | 30,910,193 | |
| | | |
Net investment income | | $ | 162,904,408 | |
| | | |
Realized and Unrealized Gain (Loss) from Portfolio | | | |
Net realized gain (loss) — | | | |
Investment transactions (identified cost basis) | | $ | (7,376,860 | ) |
Swap contracts | | 602,436 | |
Foreign currency and forward foreign currency exchange contract transactions | | 2,861,341 | |
Net realized loss | | $ | (3,913,083 | ) |
Change in unrealized appreciation (depreciation) — | | | |
Investments (identified cost basis) | | $ | 540,379 | |
Swap contracts | | 233,588 | |
Foreign currency and forward foreign currency exchange contracts | | 2,606,816 | |
Net change in unrealized appreciation (depreciation) | | $ | 3,380,783 | |
| | | |
Net realized and unrealized loss | | $ | (532,300 | ) |
| | | |
Net increase in net assets from operations | | $ | 162,372,108 | |
See notes to financial statements
5
Statements of Changes in Net Assets
Increase (Decrease)
in Net Assets | | Year Ended
October 31, 2005 | | Year Ended
October 31, 2004 | |
| | | | | |
From operations — | | | | | |
Net investment income | | $ | 162,904,408 | | $ | 65,259,669 | |
Net realized loss from investment transactions, swaps contracts and foreign currency transactions | | (3,913,083 | ) | (3,677,449 | ) |
Net change in unrealized appreciation (depreciation) from investments, swaps contracts, and foreign currency and forward foreign currency exchange contracts | | 3,380,783 | | 17,210,780 | |
Net increase in net assets from operations | | $ | 162,372,108 | | $ | 78,793,000 | |
Distributions to shareholders — | | | | | |
From net investment income | | | | | |
Advisers | | $ | (39,001,842 | ) | $ | (14,467,538 | ) |
Class A | | (57,324,898 | ) | (20,072,809 | ) |
Class B | | (9,668,329 | ) | (5,593,222 | ) |
Class C | | (42,958,112 | ) | (19,941,893 | ) |
Institutional | | (14,430,342 | ) | (5,449,485 | ) |
Total distributions to shareholders | | $ | (163,383,523 | ) | $ | (65,524,947 | ) |
Transactions in shares of beneficial interest — | | | | | |
Proceeds from sale of shares | | | | | |
Advisers | | $ | 747,625,730 | | $ | 753,074,132 | |
Class A | | 972,878,427 | | 1,131,262,241 | |
Class B | | 30,913,245 | | 111,294,564 | |
Class C | | 376,985,189 | | 741,095,811 | |
Institutional | | 194,042,649 | | 208,953,399 | |
Net asset value of shares issued to shareholders in payment of distributions declared | | | | | |
Advisers | | 26,241,048 | | 9,932,496 | |
Class A | | 38,568,305 | | 11,853,279 | |
Class B | | 6,058,271 | | 3,418,305 | |
Class C | | 26,630,813 | | 12,288,099 | |
Institutional | | 11,171,692 | | 4,334,209 | |
Cost of shares redeemed | | | | | |
Advisers | | (534,004,863 | ) | (255,026,292 | ) |
Class A | | (649,174,855 | ) | (267,561,815 | ) |
Class B | | (66,392,552 | ) | (62,757,558 | ) |
Class C | | (410,788,362 | ) | (255,430,226 | ) |
Institutional | | (104,184,545 | ) | (41,913,653 | ) |
Net asset value of shares exchanged | | | | | |
Class A | | 4,410,804 | | 2,903,385 | |
Class B | | (4,410,804 | ) | (2,903,385 | ) |
Redemption Fees | | 224,908 | | 280,993 | |
Net increase in net assets from Fund share transactions | | $ | 666,795,100 | | $ | 2,105,097,984 | |
Net increase in net assets | | $ | 665,783,685 | | $ | 2,118,366,037 | |
| | Year Ended | | Year Ended | |
Net Assets | | October 31, 2005 | | October 31, 2004 | |
At beginning of year | | $ | 3,734,015,184 | | $ | 1,615,649,147 | |
At end of year | | $ | 4,399,798,869 | | $ | 3,734,015,184 | |
| |
Accumulated undistributed (distributions in excess of) net investment income included in net assets |
| | | | | |
At end of year | | $ | 1,065,027 | | $ | (82,182 | ) |
See notes to financial statements
6
Financial Highlights
| | Class A | |
| | Year Ended October 31, | |
| | 2005(1) | | 2004(1) | | 2003(1)(2) | |
Net asset value — Beginning of year | | $ | 10.210 | | $ | 10.150 | | $ | 10.000 | |
| | | | | | | |
Income (loss) from operations | | | | | | | |
Net investment income | | $ | 0.430 | | $ | 0.282 | | $ | 0.138 | |
Net realized and unrealized gain | | 0.006 | (3) | 0.060 | | 0.169 | |
Total income from operations | | $ | 0.436 | | $ | 0.342 | | $ | 0.307 | |
| | | | | | | |
Less distributions | | | | | | | |
From net investment income | | $ | (0.427 | ) | $ | (0.282 | ) | $ | (0.157 | ) |
Total distributions | | $ | (0.427 | ) | $ | (0.282 | ) | $ | (0.157 | ) |
Redemption fees | | $ | 0.001 | | $ | 0.000 | (4) | $ | — | |
Net asset value — End of year | | $ | 10.220 | | $ | 10.210 | | $ | 10.150 | |
Total Return(5) | | 4.36 | % | 3.40 | % | 3.09 | % |
| | | | | | | |
Ratios/Supplemental Data | | | | | | | |
Net assets, end of year (000’s omitted) | | $ | 1,521,460 | | $ | 1,155,058 | | $ | 273,365 | |
Ratios (As a percentage of average daily net assets): | | | | | | | |
Net expenses(6) | | 1.03 | % | 1.05 | % | 1.09% | (7) |
Net expenses after custodian fee reduction(6) | | 1.03 | % | 1.05 | % | 1.09% | (7) |
Net investment income | | 4.21 | % | 2.76 | % | 2.81% | (7) |
Portfolio turnover of the Portfolio | | 57 | % | 67 | % | 64 | % |
(1) Net investment income per share was computed using average shares outstanding.
(2) For the period from the start of business, May 5, 2003, to October 31, 2003.
(3) The per share amount is not in accord with the net realized and unrealized gain (loss) for the period because of the timing of sales of Fund shares and the amount of the per share realized and unrealized gains and losses at such time.
(4) Amount represents less than $0.0005 per share.
(5) Returns are historical and are calculated by determining the percentage change in net asset value with all distributions reinvested. Total return is not computed on an annualized basis.
(6) Includes the Fund’s share of the Portfolio’s allocated expenses.
(7) Annualized.
See notes to financial statements
7
| | Advisers | |
| | Year Ended October 31, | |
| | 2005(1) | | 2004(1) | | 2003(1) | | 2002(1) | | 2001(2) | |
Net asset value — Beginning of year | | $ | 9.880 | | $ | 9.820 | | $ | 9.560 | | $ | 9.820 | | $ | 10.000 | |
| | | | | | | | | | | |
Income (loss) from operations | | | | | | | | | | | |
Net investment income | | $ | 0.417 | | $ | 0.274 | | $ | 0.331 | | $ | 0.413 | | $ | 0.441 | |
Net realized and unrealized gain (loss) | | (0.005 | ) | 0.058 | | 0.283 | | (0.256 | ) | (0.181 | ) |
Total income from operations | | $ | 0.412 | | $ | 0.332 | | $ | 0.614 | | $ | 0.157 | | $ | 0.260 | |
| | | | | | | | | | | |
Less distributions | | | | | | | | | | | |
From net investment income | | $ | (0.413 | ) | $ | (0.272 | ) | $ | (0.354 | ) | $ | (0.415 | ) | $ | (0.440 | ) |
From net realized gain | | — | | — | | — | | (0.002 | ) | — | |
Total distributions | | $ | (0.413 | ) | $ | (0.272 | ) | $ | (0.354 | ) | $ | (0.417 | ) | $ | (0.440 | ) |
Redemption fees | | $ | 0.001 | | $ | 0.000 | (3) | $ | — | | $ | — | | $ | — | |
| | | | | | | | | | | |
Net asset value — End of year | | $ | 9.880 | | $ | 9.880 | | $ | 9.820 | | $ | 9.560 | | $ | 9.820 | |
Total Return(4) | | 4.26 | % | 3.43 | % | 6.54 | % | 1.56 | % | 2.62 | % |
| | | | | | | | | | | |
Ratios/Supplemental Data† | | | | | | | | | | | |
Net assets, end of year (000’s omitted) | | $ | 1,021,526 | | $ | 782,259 | | $ | 271,723 | | $ | 70,694 | | $ | 54,425 | |
Ratios (As a percentage of average daily net assets): | | | | | | | | | | | |
Net expenses(5) | | 1.03 | % | 1.05 | % | 1.09 | % | 1.13 | % | 1.14 | %(6) |
Net expenses after custodian fee reduction(5) | | 1.03 | % | 1.05 | % | 1.09 | % | 1.13 | % | 1.14 | %(6) |
Net investment income | | 4.21 | % | 2.78 | % | 3.40 | % | 4.22 | % | 5.37 | %(6) |
Portfolio Turnover of the Portfolio | | 57 | % | 67 | % | 64 | % | 76 | % | 52 | % |
† The operating expenses of the Fund and the Portfolio may reflect a reduction of the investment adviser fee/adminstration fee, a reduction in the distribution and service fees, and an allocation of expenses to the Investment Adviser/Administrator. Had such actions not been taken, the ratios and net investment income per share would have been as follows:
Ratios (As a percentage of average daily net assets): | | | | | | | | | |
Expenses(5) | | | | | | | | | | 1.23 | %(6) |
Expenses after custodian fee reduction(5) | | | | | | | | | 1.23 | %(6) |
Net investment income | | | | | | | | | | 5.28 | %(6) |
Net investment income per share | | | | | | | | | | $ | 0.434 | |
| | | | | | | | | | | | |
(1) Net investment income per share was computed using average shares outstanding.
(2) For the period from the start of business, February 7, 2001, to October 31, 2001.
(3) Amount represents less than $0.0005 per share.
(4) Returns are historical and are calculated by determining the percentage change in net asset value with all distributions reinvested. Total return is not computed on an annualized basis.
(5) Includes the Fund’s share of the Portfolio’s allocated expenses.
(6) Annualized.
See notes to financial statements
8
| | Class B | |
| | Year Ended October 31, | |
| | 2005(1) | | 2004(1) | | 2003(1) | | 2002(1) | | 2001(2) | |
Net asset value — Beginning of year | | $ | 9.870 | | $ | 9.810 | | $ | 9.560 | | $ | 9.810 | | $ | 10.000 | |
| | | | | | | | | | | |
Income (loss) from operations | | | | | | | | | | | |
Net investment income | | $ | 0.336 | | $ | 0.198 | | $ | 0.278 | | $ | 0.339 | | $ | 0.398 | |
Net realized and unrealized gain (loss) | | 0.002 | (3) | 0.060 | | 0.253 | | (0.246 | ) | (0.191 | ) |
Total income from operations | | $ | 0.338 | | $ | 0.258 | | $ | 0.531 | | $ | 0.093 | | $ | 0.207 | |
| | | | | | | | | | | |
Less distributions | | | | | | | | | | | |
From net investment income | | $ | (0.339 | ) | $ | (0.198 | ) | $ | (0.281 | ) | $ | (0.341 | ) | $ | (0.397 | ) |
From net realized gain | | — | | — | | — | | (0.002 | ) | — | |
Total distributions | | $ | (0.339 | ) | $ | (0.198 | ) | $ | (0.281 | ) | $ | (0.343 | ) | $ | (0.397 | ) |
Redemption fees | | $ | 0.001 | | $ | 0.000 | (4) | $ | — | | $ | — | | $ | — | |
| | | | | | | | | | | |
Net asset value — End of year | | $ | 9.870 | | $ | 9.870 | | $ | 9.810 | | $ | 9.560 | | $ | 9.810 | |
Total Return(5) | | 3.48 | % | 2.65 | % | 5.63 | % | 0.91 | % | 2.08 | % |
| | | | | | | | | | | |
Ratios/Supplemental Data† | | | | | | | | | | | |
Net assets, end of year (000’s omitted) | | $ | 264,403 | | $ | 298,187 | | $ | 247,494 | | $ | 203,683 | | $ | 196,237 | |
Ratios (As a percentage of average daily net assets): | | | | | | | | | | | |
Net expenses(6) | | 1.78 | % | 1.80 | % | 1.84 | % | 1.89 | % | 1.84 | %(7) |
Net expenses after custodian fee
reduction(6) | | 1.78 | % | 1.80 | % | 1.84 | % | 1.89 | % | 1.84 | %(7) |
Net investment income | | 3.40 | % | 2.01 | % | 2.87 | % | 3.47 | % | 4.86 | %(7) |
Portfolio Turnover of the Portfolio | | 57 | % | 67 | % | 64 | % | 76 | % | 52 | % |
† The operating expenses of the Fund and the Portfolio may reflect a reduction of the investment adviser fee/adminstration fee, a reduction in the distribution and service fees, and an allocation of expenses to the Investment Adviser/Administrator. Had such actions not been taken, the ratios and net investment income per share would have been as follows:
Ratios (As a percentage of average daily net assets): | | | | | | | | | |
Expenses(6) | | | | | | | | | | 1.97 | %(7) |
Expenses after custodian fee reduction(6) | | | | | | | | | 1.97 | %(7) |
Net investment income | | | | | | | | | | 4.73 | %(7) |
Net investment income per share | | | | | | | | | | $ | 0.387 | |
| | | | | | | | | | | | |
(1) Net investment income per share was computed using average shares outstanding.
(2) For the period from the start of business, February 5, 2001, to October 31, 2001.
(3) The per share amount is not in accord with the net realized and unrealized gain (loss) for the period because of the timing of sales of Fund shares and the amount of the per share realized and unrealized gains and losses at such time.
(4) Amount represents less than $0.0005 per share.
(5) Returns are historical and are calculated by determining the percentage change in net asset value with all distributions reinvested. Total return is not computed on an annualized basis.
(6) Includes the Fund’s share of the Portfolio’s allocated expenses.
(7) Annualized.
See notes to financial statements
9
| | Class C | |
| | Year Ended October 31, | |
| | 2005(1) | | 2004(1) | | 2003(1) | | 2002(1) | | 2001(2) | |
Net asset value — Beginning of year | | $ | 9.870 | | $ | 9.810 | | $ | 9.560 | | $ | 9.820 | | $ | 10.000 | |
| | | | | | | | | | | |
Income (loss) from operations | | | | | | | | | | | |
Net investment income | | $ | 0.338 | | $ | 0.198 | | $ | 0.275 | | $ | 0.339 | | $ | 0.405 | |
Net realized and unrealized gain (loss) | | (0.000 | )(3) | 0.060 | | 0.256 | | (0.256 | ) | (0.181 | ) |
Total income from operations | | $ | 0.338 | | $ | 0.258 | | $ | 0.531 | | $ | 0.083 | | $ | 0.224 | |
| | | | | | | | | | | |
Less distributions | | | | | | | | | | | |
From net investment income | | $ | (0.339 | ) | $ | (0.198 | ) | $ | (0.281 | ) | $ | (0.341 | ) | $ | (0.404 | ) |
From net realized gain | | — | | — | | — | | (0.002 | ) | — | |
Total distributions | | $ | (0.339 | ) | $ | (0.198 | ) | $ | (0.281 | ) | $ | (0.343 | ) | $ | (0.404 | ) |
Redemption fees | | $ | 0.001 | | $ | 0.000 | (4) | $ | — | | $ | — | | $ | — | |
| | | | | | | | | | | |
Net asset value — End of year | | $ | 9.870 | | $ | 9.870 | | $ | 9.810 | | $ | 9.560 | | $ | 9.820 | |
Total Return(5) | | 3.48 | % | 2.65 | % | 5.63 | % | 0.80 | % | 2.25 | % |
| | | | | | | | | | | |
Ratios/Supplemental Data† | | | | | | | | | | | |
Net assets, end of year (000’s omitted) | | $ | 1,220,713 | | $ | 1,227,737 | | $ | 724,521 | | $ | 521,312 | | $ | 526,520 | |
Ratios (As a percentage of average daily net assets): | | | | | | | | | | | |
Net expenses(6) | | 1.78 | % | 1.80 | % | 1.84 | % | 1.89 | % | 1.87 | %(7) |
Net expenses after custodian fee reduction(6) | | 1.78 | % | 1.80 | % | 1.84 | % | 1.89 | % | 1.87 | %(7) |
Net investment income | | 3.42 | % | 2.01 | % | 2.84 | % | 3.46 | % | 4.77 | %(7) |
Portfolio Turnover of the Portfolio | | 57 | % | 67 | % | 64 | % | 76 | % | 52 | % |
† The operating expenses of the Fund and the Portfolio may reflect a reduction of the investment adviser fee/adminstration fee, a reduction in the distribution and service fees, and an allocation of expenses to the Investment Adviser/Administrator. Had such actions not been taken, the ratios and net investment income per share would have been as follows:
Ratios (As a percentage of average daily net assets): | | | | | | | | | |
Expenses(6) | | | | | | | | | | 1.97 | %(7) |
Expenses after custodian fee reduction(6) | | | | | | | | 1.97 | %(7) |
Net investment income | | | | | | | | | | 4.67 | %(7) |
Net investment income per share | | | | | | | | | | $ | 0.397 | |
| | | | | | | | | | | | |
(1) Net investment income per share was computed using average shares outstanding.
(2) For the period from the start of business February 1, 2001, to October 31, 2001.
(3) Amount represents less than $0.0005 per share.
(4) Amount represents less than $0.0005 per share.
(5) Returns are historical and are calculated by determining the percentage change in net asset value with all distributions reinvested. Total return is not computed on an annualized basis.
(6) Includes the Fund’s share of the Portfolio’s allocated expenses.
(7) Annualized.
See notes to financial statements
10
| | Institutional | |
| | Year Ended October 31, | |
| | 2005(1) | | 2004(1) | | 2003(1) | | 2002(1) | | 2001(2) | |
Net asset value — Beginning of year | | $ | 9.880 | | $ | 9.820 | | $ | 9.560 | | $ | 9.820 | | $ | 10.000 | |
| | | | | | | | | | | |
Income (loss) from operations | | | | | | | | | | | |
Net investment income | | $ | 0.440 | | $ | 0.299 | | $ | 0.359 | | $ | 0.437 | | $ | 0.480 | |
Net realized and unrealized gain (loss) | | (0.003 | ) | 0.058 | | 0.279 | | (0.255 | ) | (0.181 | ) |
Total income from operations | | $ | 0.437 | | $ | 0.357 | | $ | 0.638 | | $ | 0.182 | | $ | 0.299 | |
| | | | | | | | | | | |
Less distributions | | | | | | | | | | | |
From net investment income | | $ | (0.438 | ) | $ | (0.297 | ) | $ | (0.378 | ) | $ | (0.440 | ) | $ | (0.479 | ) |
From net realized gain | | — | | — | | — | | (0.002 | ) | — | |
Total distributions | | $ | (0.438 | ) | $ | (0.297 | ) | $ | (0.378 | ) | $ | (0.442 | ) | $ | (0.479 | ) |
Redemption fees | | $ | 0.001 | | $ | 0.000 | (3) | $ | — | | $ | — | | $ | — | |
| | | | | | | | | | | |
Net asset value — End of year | | $ | 9.880 | | $ | 9.880 | | $ | 9.820 | | $ | 9.560 | | $ | 9.820 | |
Total Return(4) | | 4.52 | % | 3.69 | % | 6.79 | % | 1.82 | % | 3.02 | % |
| | | | | | | | | | | |
Ratios/Supplemental Data† | | | | | | | | | | | |
Net assets, end of year (000’s omitted) | | $ | 371,698 | | $ | 270,774 | | $ | 98,545 | | $ | 31,661 | | $ | 20,833 | |
Ratios (As a percentage of average daily net assets): | | | | | | | | | | | |
Net expenses(5) | | 0.78 | % | 0.80 | % | 0.84 | % | 0.89 | % | 0.87 | %(6) |
Net expenses after custodian fee reduction(5) | | 0.78 | % | 0.80 | % | 0.84 | % | 0.89 | % | 0.87 | %(6) |
Net investment income | | 4.45 | % | 3.03 | % | 3.69 | % | 4.46 | % | 5.98 | %(6) |
Portfolio Turnover of the Portfolio | | 57 | % | 67 | % | 64 | % | 76 | % | 52 | % |
† The operating expenses of the Fund and the Portfolio may reflect a reduction of the investment adviser fee/adminstration fee, a reduction in the distribution and service fees, and an allocation of expenses to the Investment Adviser/Administrator. Had such actions not been taken, the ratios and net investment income per share would have been as follows:
Ratios (As a percentage of average daily net assets): | | | | | | | | | |
Expenses(5) | | | | | | | | | | 0.96 | %(6) |
Expenses after custodian fee reduction(5) | | | | | | | | | | 0.96 | %(6) |
Net investment income | | | | | | | | | | 5.89 | %(6) |
Net investment income per share | | | | | | | | | | $ | 0.473 | |
| | | | | | | | | | | | |
(1) Net investment income per share was computed using average shares outstanding.
(2) For the period from the start of business January 30, 2001, to October 31, 2001.
(3) Amount represents less than $0.0005 per share.
(4) Returns are historical and are calculated by determining the percentage change in net asset value with all distributions reinvested. Total return is not computed on an annualized basis.
(5) Includes the Fund’s share of the Portfolio’s allocated expenses.
(6) Annualized.
See notes to financial statements
11
Eaton Vance Floating-Rate Fund as of October 31, 2005
NOTES TO FINANCIAL STATEMENTS
1 Significant Accounting Policies
Eaton Vance Floating-Rate Fund (the Fund) is a series of Eaton Vance Mutual Funds Trust (the Trust). The Trust is an entity of the type commonly known as a Massachusetts business trust and is registered under the Investment Company Act of 1940, as amended, as an open-end management investment company. The Fund offers five classes of shares. The Advisers and Institutional Classes of shares are generally sold at net asset value per share and assess a redemption fee of 1% for shares redeemed or exchanged within three months of purchase. Class A shares are generally sold subject to a sales charge imposed at time of the settlement of purchase and assess a redemption fee of 1% for shares redeemed or exchanged within three months of the settlement of purchase. Class B and Class C shares are sold at net asset value and are generally subject to a contingent deferred sales charge (see Note 6). Class B shares held for eight years will automatically convert to Class A shares. Each class represents a pro rata interest in the Fund, but votes separately on class-specific matters and (as noted below) is subject to different expenses. Realized and unrealized gains and losses are allocated daily to each class of shares based on the relative net assets of each class to the total net assets of the Fund. Net investment income, other than class specific expenses, is allocated daily to each class of shares based upon the ratio of the value of each class’ paid shares to the total value of all paid shares. Each class of shares differs in its distribution plan and certain other class specific expenses. The Fund invests all of its investable assets in interests in Floating Rate Portfolio (the Portfolio), a New York trust having the same investment objective as the Fund. The value of the Fund’s investment in the Portfolio reflects the Fund’s proportionate interest in the net assets of the Portfolio (approximately 67.5% at October 31, 2005). The performance of the Fund is directly affected by the performance of the Portfolio. The financial statements of the Portfolio, including the portfolio of investments, are included elsewhere in this report and should be read in conjunction with the Fund’s financial statements.
The following is a summary of significant accounting policies consistently followed by the Fund in the preparation of its financial statements. The policies are in conformity with accounting principles generally accepted in the United States of America.
A Investment Valuation — Valuation of securities by the Portfolio is discussed in Note 1A of the Portfolio’s Notes to Financial Statements which are included elsewhere in this report.
B Income — The Fund’s net investment income consists of the Fund’s pro-rata share of the net investment income of the Portfolio, less all actual and accrued expenses of the Fund determined in accordance with accounting principles generally accepted in the United States of America.
C Federal Taxes — The Fund’s policy is to comply with the provisions of the Internal Revenue Code applicable to regulated investment companies and to distribute to shareholders each year all of its taxable income, including any net realized gain on investments. Accordingly, no provision for federal income or excise tax is necessary. At October 31, 2005, the Fund, for federal income tax purposes, had a capital loss carryover of $28,093,787, which will reduce the Fund’s taxable income arising from future net realized gains on investments, if any, to the extent permitted by Internal Revenue Code, and thus will reduce the amount of the distributions to shareholders which would otherwise be necessary to relieve the Fund of any liability for federal income or excise tax. Such capital loss carryover will expire on October 31, 2010 ($8,217,006), October 31, 2011 ($8,406,344), October 31, 2012 ($4,215,434) and October 31, 2013 ($7,255,003).
D Use of Estimates — The preparation of the financial statements in conformity with accounting principles generally accepted in the United States of America requires management to make estimates and assumptions that affect the reported amounts of assets and liabilities at the date of the financial statements and the reported amounts of income and expense during the reporting period. Actual results could differ from those estimates.
E Expenses — The majority of expenses of the Trust are directly identifiable to an individual fund. Expenses which are not readily identifiable to a specific fund are allocated taking into consideration, among other things, the nature and type of expense and the relative size of the fund.
F Indemnifications — Under the Trust’s organizational documents, its officers and Trustees may be indemnified against certain liabilities and expenses arising out of the performance of their duties to the Fund, and shareholders are indemnified against personal liability for obligations of the Trust. Additionally, in the normal course of business, the Fund enters into agreements with service providers that
12
may contain indemnification clauses. The Fund’s maximum exposure under these arrangements is unknown as this would involve future claims that may be made against the Fund that have not yet occurred.
2 Distributions to Shareholders
The net income of the Fund is determined daily and substantially all of the net income so determined is declared as a dividend to shareholders of record at the time of declaration. Distributions are paid monthly. Distributions of allocated realized capital gains, if any, are made at least annually. Shareholders may reinvest capital gain distributions in additional shares of the Fund at the net asset value as of the ex-dividend date. Distributions are paid in the form of additional shares or, at the election of the shareholder, in cash. The Fund distinguishes between distributions on a tax basis and a financial reporting basis. Accounting principles generally accepted in the United States of America require that only distributions in excess of tax basis earnings and profits be reported in the financial statements as a return of capital. Permanent differences between book and tax accounting relating to distributions are reclassified to paid-in capital. These differences are primarily related to swaps and foreign currency transactions.
The tax character of distributions paid for the years ended October 31, 2005 and October 31, 2004 was as follows:
| | Year Ended October 31, | |
| | 2005 | | 2004 | |
Distributions declared from: | | | | | |
| | | | | |
Ordinary income | | $ | 163,383,523 | | $ | 65,524,947 | |
| | | | | | | |
During the year ended October 31, 2005, accumulated distributions in excess of net investment income was decreased by $1,626,324, paid in capital was increased by $1,627,669 and accumulated net realized loss was increased by $3,253,993 primarily due to differences between book and tax accounting. This change had no effect on the net assets or the net asset value per share.
As of October 31, 2005, the components of distributable earnings (accumulated losses) on a tax basis were as follows:
Undistributed income | | $ | 6,960,724 | |
Capital loss carryforwards | | $ | (28,093,787 | ) |
Unrealized gain | | $ | 24,296,805 | |
Other temporary differences | | $ | (5,895,697 | ) |
3 Shares of Beneficial Interest
The Trust’s Declaration of Trust permits the Trustees to issue an unlimited number of full and fractional shares of beneficial interest (without par value). Transactions in Fund shares were as follows:
| | Year Ended October 31, | |
Advisers | | 2005 | | 2004 | |
Sales | | 75,588,907 | | 76,360,423 | |
Issued to shareholders electing to receive payments of distributions in Fund shares | | 2,654,296 | | 1,006,599 | |
Redemptions | | (54,037,669 | ) | (25,856,362 | ) |
Net increase | | 24,205,534 | | 51,510,660 | |
| | | | | |
| | Year Ended October 31, | |
Class A | | 2005 | | 2004 | |
Sales | | 95,138,078 | | 110,925,334 | |
Issued to shareholders electing to receive
payments of distributions in Fund shares | | 3,772,581 | | 1,161,805 | |
Redemptions | | (63,501,201 | ) | (26,222,434 | ) |
Exchange from Class B shares | | 431,412 | | 284,724 | |
Net increase | | 35,840,870 | | 86,149,429 | |
| | | | | |
| | Year Ended October 31, | |
Class B | | 2005 | | 2004 | |
Sales | | 3,128,445 | | 11,296,429 | |
Issued to shareholders electing to receive
payments of distributions in Fund shares | | 613,276 | | 346,805 | |
Redemptions | | (6,720,684 | ) | (6,368,539 | ) |
Exchange to Class A shares | | (446,088 | ) | (294,443 | ) |
Net increase (decrease) | | (3,425,051 | ) | 4,980,252 | |
| | | | | |
| | Year Ended October 31, | |
Class C | | 2005 | | 2004 | |
Sales | | 38,149,013 | | 75,185,623 | |
Issued to shareholders electing to receive payments of distributions in Fund shares | | 2,695,648 | | 1,246,323 | |
Redemptions | | (41,576,308 | ) | (25,909,861 | ) |
Net increase (decrease) | | (731,647 | ) | 50,522,085 | |
| | | | | |
| | Year Ended October 31, | |
Institutional | | 2005 | | 2004 | |
Sales | | 19,621,704 | | 21,185,133 | |
Issued to shareholders electing to receive payments of distributions in Fund shares | | 1,129,870 | | 439,198 | |
Redemptions | | (10,541,404 | ) | (4,248,955 | ) |
Net increase | | 10,210,170 | | 17,375,376 | |
Redemptions or exchanges of Advisers Class, Class A and Institutional Class shares made within three months of purchase are subject to a redemption fee equal to 1.00% of the amount redeemed. For the year ended October 31, 2005 the fund received $224,908 in redemption fees.
13
4 Transactions with Affiliates
The Fund is authorized to pay Eaton Vance Management, (EVM), a fee as compensation for administrative services necessary to conduct the Fund’s business. The fee is computed at the annual rate of 0.15% (annually) of the Fund’s average daily net assets. For the year ended October 31, 2005, the fee amounted to $6,206,999. The Portfolio has engaged Boston Management and Research, (BMR), a subsidiary of EVM, to render investment advisory services. See Note 2 of the Portfolio’s Notes to Financial Statements which are included elsewhere in this report. Except as to Trustees of the Fund and the Portfolio who are not members of EVM’s or BMR’s organization, officers and Trustees receive remuneration for their services to the Fund out of such investment adviser fee. EVM serves as the sub-transfer agent of the Fund and receives from the transfer agent an aggregate fee based upon the actual expenses incurred by EVM in the performance of those services. During the year ended October 31, 2005, EVM earned $156,390 in sub-transfer agent fees. Certain officers and Trustees of the Fund and of the Portfolio are officers of the above organizations. The Fund was informed that Eaton Vance Distributors, Inc. (EVD), a principal underwriter, received $160,756 from the Fund as its portion of the sales charge on sales of Class A shares for the year ended October 31, 2005.
5 Distribution and Service Plans
The Fund has in effect distribution plans for Class B shares (Class B Plan) and Class C shares (Class C Plan) pursuant to Rule 12b-1 under the Investment Company Act of 1940 and a service plan for the Advisers shares (Advisers Plan) and Class A shares (Class A Plan) (collectively, the Plans). The Class B and Class C Plans require the Fund to pay Eaton Vance Distributors, Inc. (EVD), amounts equal to 0.75% of the Fund’s average daily net assets attributable to Class B and Class C shares, for providing ongoing distribution services and facilities to the Fund. The Fund will automatically discontinue payments to EVD during any period in which there are no outstanding Uncovered Distribution Charges, which are equivalent to the sum of (i) 6.25% of the aggregate amount received by the Fund for Class B and Class C shares sold, respectively, plus (ii) interest calculated by applying the rate of 1% over the prevailing prime rate to the outstanding balance of Uncovered Distribution Charges of EVD of each respective class, reduced by the aggregate amount of contingent deferred sales charges (see Note 6) and daily amounts theretofore paid to EVD by each respective class. For the year ended October 31, 2005, the Fund paid or accrued $2,124,542 and $9,393,048, respectively, to or payable to EVD representing 0.75% of average daily net assets of Class B and Class C shares, respectively. At October 31, 2005, the amount of Uncovered Distribution Charges of EVD calculated under the Plan was approximately $12,739,000 and $107,234,000 for Class B and Class C shares, respectively.
The Plans authorize the Fund to make payments of service fees to EVD, investment dealers and other persons in amounts equal to 0.25% of the Fund’s average daily net assets attributable to the Advisers Class, Class A, Class B, and Class C shares for each fiscal year. Service fee payments will be made for personal services and/or the maintenance of shareholder accounts. Service fees are separate and distinct from the sales commissions and distribution fees payable by the Fund to EVD, and, as such are not subject to automatic discontinuance when there are no outstanding Uncovered Distribution Charges of EVD. Service fee payments for the year ended October 31, 2005 amounted to $2,304,052, $3,393,981 $708,181, and $3,131,016 for Advisers Class, Class A, Class B, and Class C shares, respectively.
6 Contingent Deferred Sales Charge
A contingent deferred sales charge (CDSC) generally is imposed on redemptions of Class B shares made within six years of purchase and on redemptions of Class C shares made within one year of purchase. Generally, the CDSC is based on the lower of the net asset value at the date of redemption or date of purchase. No charge is levied on shares acquired by reinvestment of dividends or capital gains distributions. Class A shares purchased at net asset value in amounts of $1 million or more (other than shares purchased in a single transaction of $5 million or more) are subject to a 1.00% CDSC if redeemed within one year of purchase. Class B CDSC is imposed at declining rates that begin at 5% in the case of redemptions in the first and second years of redemption after purchase, declining one percentage point each subsequent year. Class C shares will be subject to a 1% CDSC if redeemed within one year of purchase. No CDSC is levied on shares which have been sold to EVM or its affiliates or to their respective employees or clients and may be waived under certain other limited conditions. CDSC charges are paid to EVD to reduce the amount of Uncovered Distribution Charges calculated under each Class’ Distribution Plan. CDSC charges received when no Uncovered Distribution Charges exist will be credited to the Fund. The Fund has been informed that EVD
14
received approximately $428,000, $976,000, and $636,000 of CDSC paid by shareholders of Class A, Class B, and Class C shares, respectively, for the year ended October 31, 2005.
7 Investment Transactions
Increases and decreases in the Fund’s investment in the Floating Rate Portfolio for the year ended October 31, 2005, aggregated $2,309,758,858 and $1,844,074,698, respectively.
15
Eaton Vance Floating-Rate Fund as of October 31, 2005
REPORT OF INDEPENDENT REGISTERED PUBLIC ACCOUNTING FIRM
To the Trustees and Shareholders of Eaton Vance Floating Rate Fund:
We have audited the accompanying statement of assets and liabilities of Eaton Vance Floating-Rate Fund (the Fund) as of October 31, 2005, the related statement of operations for the year then ended, the statements of changes in net assets for each of the two years in the period then ended and financial highlights for each of the four years in the period then ended and for the period from the start of business, January 30, 2001, to October 31, 2001. These financial statements and financial highlights are the responsibility of the Fund’s management. Our responsibility is to express an opinion on these financial statements and financial highlights based on our audits.
We conducted our audits in accordance with the standards of the Public Company Accounting Oversight Board (United States). Those standards require that we plan and perform the audit to obtain reasonable assurance about whether the financial statements and financial highlights are free of material misstatement. The Fund is not required to have, nor were we engaged to perform, an audit of its internal control over financial reporting. Our audit included consideration of internal control over financial reporting as a basis for designing audit procedures that are appropriate in the circumstances, but not for the purpose of expressing an opinion on the effectiveness of the Fund’s internal control over financial reporting. Accordingly, we express no such opinion. An audit also includes examining, on a test basis, evidence supporting the amounts and disclosures in the financial statements, assessing the accounting principles used and significant estimates made by management, as well as evaluating the overall financial statement presentation. We believe that our audits provide a reasonable basis for our opinion.
In our opinion, such financial statements and financial highlights referred to above present fairly, in all material respects, the financial position of the Eaton Vance Floating-Rate Fund as of October 31, 2005, the results of its operations for the year then ended, the changes in its net assets for each of the two years in the period then ended and the financial highlights for each of the four years in the period then ended and for the period from the start of business, January 30, 2001 to October 31, 2001, in conformity with accounting principles generally accepted in the United States of America.
DELOITTE & TOUCHE LLP
Boston, Massachusetts
December 19, 2005
16
Eaton Vance Floating-Rate Fund as of October 31, 2005
FEDERAL TAX INFORMATION (Unaudited)
The Form 1099-DIV you receive in January 2006 will show the tax status of all distributions paid to your account in calendar 2005. Shareholders are advised to consult their own tax advisor with respect to the tax consequences of their investment in the Fund.
17
Floating Rate Portfolio as of October 31, 2005
PORTFOLIO OF INVESTMENTS
Senior, Floating Rate Interests — 96.8% (1)
Principal | | | | | |
Amount | | Borrower/Tranche Description | | Value | |
| | | | | |
Aerospace and Defense — 1.9% | | | |
| | | | | |
| | Alliant Techsystems, Inc. | | | |
$ | 4,189,500 | | Term Loan, 5.23%, Maturing March 31, 2009 | | $ | 4,214,377 | |
| | CACI International, Inc. | | | |
9,288,575 | | Term Loan, 5.23%, Maturing May 3, 2011 | | 9,395,003 | |
| | Ceradyne, Inc. | | | |
7,647,700 | | Term Loan, 6.00%, Maturing August 18, 2011 | | 7,685,939 | |
| | Delta Air Lines, Inc. | | | |
8,800,000 | | Term Loan, 10.39%, Maturing March 16, 2008 | | 9,128,170 | |
| | Dresser Rand Group, Inc. | | | |
787,623 | | Term Loan, 4.44%, Maturing October 29, 2011 | | EUR | 952,220 | |
7,736,979 | | Term Loan, 6.08%, Maturing October 29, 2011 | | 7,867,540 | |
| | DRS Technologies, Inc. | | | |
7,547,338 | | Term Loan, 5.77%, Maturing November 4, 2010 | | 7,606,305 | |
| | Hexcel Corp. | | | |
10,960,222 | | Term Loan, 5.81%, Maturing March 1, 2012 | | 11,076,675 | |
| | K&F Industries, Inc. | | | |
9,992,100 | | Term Loan, 6.38%, Maturing November 18, 2012 | | 10,110,757 | |
| | Mid-Western Aircraft Systems, Inc. | | | |
6,364,050 | | Term Loan, 6.41%, Maturing December 31, 2011 | | 6,453,942 | |
| | Standard Aero Holdings, Inc. | | | |
9,364,354 | | Term Loan, 6.25%, Maturing August 24, 2012 | | 9,484,339 | |
| | Transdigm, Inc. | | | |
16,632,230 | | Term Loan, 6.19%, Maturing July 22, 2010 | | 16,895,568 | |
| | Vought Aircraft Industries, Inc. | | | |
4,000,000 | | Term Loan, 6.09%, Maturing December 22, 2010 | | 4,050,624 | |
7,620,824 | | Term Loan, 6.59%, Maturing December 22, 2011 | | 7,707,510 | |
| | Wam Aquisition, S.A. | | | |
4,714,710 | | Term Loan, 6.77%, Maturing April 8, 2013 | | 4,730,966 | |
4,714,710 | | Term Loan, 7.27%, Maturing April 8, 2014 | | 4,747,930 | |
| | Wyle Laboratories, Inc. | | | |
4,492,425 | | Term Loan, 6.46%, Maturing January 28, 2011 | | 4,557,004 | |
| | | | $ | 126,664,869 | |
| | | | | |
Air Transport — 0.2% | | | |
| | | | | |
| | United Airlines, Inc. | | | |
$ | 16,055,570 | | DIP Loan, 7.96%, Maturing December 31, 2006 | | $ | 16,251,255 | |
| | | | $ | 16,251,255 | |
Automotive — 4.0% | | | |
| | | | | |
| | AA Acquisitions Co., Ltd. | | | |
$ | 1,500,000 | | Term Loan, 7.36%, Maturing June 25, 2012 | | GBP | 2,680,989 | |
1,500,000 | | Term Loan, 7.86%, Maturing June 25, 2013 | | GBP | 2,690,137 | |
| | Accuride Corp. | | | |
14,611,155 | | Term Loan, 6.18%, Maturing January 31, 2012 | | 14,724,392 | |
| | Affina Group, Inc. | | | |
5,741,171 | | Term Loan, 6.40%, Maturing November 30, 2011 | | 5,752,831 | |
| | Collins & Aikman Products Co. | | | |
7,008,070 | | Term Loan, 10.25%, Maturing August 31, 2011 | | 6,741,511 | |
| | CSA Acquisition Corp. | | | |
4,698,665 | | Term Loan, 6.06%, Maturing December 23, 2011 | | 4,728,032 | |
3,990,512 | | Term Loan, 6.06%, Maturing December 23, 2011 | | 4,015,452 | |
| | Dayco Products, LLC | | | |
12,559,598 | | Term Loan, 7.04%, Maturing June 23, 2011 | | 12,708,744 | |
| | Dura Operating Corp. | | | |
2,500,000 | | Revolving Loan, 0.00%, Maturing May 3, 2011(2) | | 2,462,500 | |
3,718,000 | | Term Loan, 7.44%, Maturing May 3, 2011 | | 3,741,237 | |
| | Exide Technologies, Inc. | | | |
3,892,568 | | Term Loan, 9.37%, Maturing May 5, 2010 | | 3,921,762 | |
2,995,782 | | Term Loan, 9.37%, Maturing May 5, 2010 | | 3,014,506 | |
| | Federal-Mogul Corp. | | | |
4,995,670 | | Revolving Loan, 5.83%, Maturing December 9, 2006(2) | | 4,679,280 | |
4,108,827 | | Term Loan, 6.33%, Maturing December 9, 2006 | | 3,870,429 | |
6,000,000 | | Term Loan, 6.58%, Maturing December 9, 2006 | | 5,659,374 | |
5,137,364 | | Term Loan, 7.83%, Maturing December 9, 2006 | | 5,150,207 | |
12,795,732 | | Revolving Loan, 7.83%, Maturing December 9, 2006(2) | | 12,835,719 | |
| | Goodyear Tire & Rubber Co. | | | |
13,000,000 | | Revolving Loan, 0.00%, Maturing April 30, 2010(2) | | 12,951,250 | |
5,890,000 | | Term Loan, 3.50%, Maturing April 30, 2010 | | 5,942,592 | |
19,720,000 | | Term Loan, 7.06%, Maturing April 30, 2010 | | 19,915,149 | |
1,000,000 | | Term Loan, 7.81%, Maturing March 1, 2011 | | 994,250 | |
| | HLI Operating Co., Inc. | | | |
9,067,291 | | Term Loan, 7.15%, Maturing June 3, 2009 | | 9,055,150 | |
| | Insurance Auto Auctions, Inc. | | | |
2,485,000 | | Term Loan, 6.45%, Maturing May 19, 2012 | | 2,519,169 | |
| | Key Automotive Group | | | |
5,159,645 | | Term Loan, 6.86%, Maturing June 29, 2010 | | 5,159,645 | |
| | Keystone Automotive Operations, Inc. | | | |
11,573,952 | | Term Loan, 5.80%, Maturing October 30, 2009 | | 11,675,224 | |
| | Plastech Engineered Products, Inc. | | | |
2,430,911 | | Term Loan, 8.77%, Maturing March 31, 2010 | | 2,321,520 | |
| | | | | | | | |
See notes to financial statements
18
Principal | | | | | |
Amount | | Borrower/Tranche Description | | Value | |
| | | | | |
Automotive (continued) | | | |
| | | | | |
| | R.J. Tower Corp. | | | |
$ | 6,120,000 | | DIP Revolving Loan, 5.45%, Maturing February 2, 2007(2) | | $ | 6,108,525 | |
1,000,000 | | DIP Revolving Loan, 7.25%, Maturing February 2, 2007 | | 1,018,958 | |
| | Speedy 1, Ltd. | | | |
1,978,627 | | Term Loan, 4.52%, Maturing August 31, 2013 | | EUR | 2,400,451 | |
1,978,627 | | Term Loan, 5.02%, Maturing August 31, 2014 | | EUR | 2,411,163 | |
| | Tenneco Automotive, Inc. | | | |
11,860,733 | | Term Loan, 6.08%, Maturing December 12, 2009 | | 12,059,033 | |
4,505,755 | | Term Loan, 6.11%, Maturing December 12, 2010 | | 4,581,087 | |
| | The Goodyear Dunlop Tires | | | |
1,000,000 | | Term Loan, 4.52%, Maturing April 30, 2010 | | EUR | 1,201,742 | |
| | TI Automotive, Ltd. | | | |
7,547,855 | | Term Loan, 6.91%, Maturing June 30, 2011 | | 7,425,202 | |
| | Trimas Corp. | | | |
8,447,689 | | Term Loan, 7.69%, Maturing December 31, 2009 | | 8,539,203 | |
| | TRW Automotive, Inc. | | | |
13,994,250 | | Term Loan, 4.94%, Maturing October 31, 2010 | | 14,100,956 | |
21,104,942 | | Term Loan, 5.25%, Maturing June 30, 2012 | | 21,331,377 | |
| | United Components, Inc. | | | |
7,108,157 | | Term Loan, 6.26%, Maturing June 30, 2010 | | 7,223,665 | |
| | | | $ | 258,312,413 | |
| | | | | |
Beverage and Tobacco — 1.3% | | | |
| | | | | |
| | Alliance One International, Inc. | | | |
$ | 5,522,250 | | Term Loan, 6.73%, Maturing May 13, 2010 | | $ | 5,522,250 | |
| | Constellation Brands, Inc. | | | |
30,902,710 | | Term Loan, 5.66%, Maturing November 30, 2011 | | 31,275,489 | |
| | Culligan International Co. | | | |
7,573,500 | | Term Loan, 6.47%, Maturing September 30, 2011 | | 7,671,327 | |
| | National Dairy Holdings, L.P. | | | |
8,427,650 | | Term Loan, 6.08%, Maturing March 15, 2012 | | 8,496,125 | |
| | National Distribution Company | | | |
5,380,000 | | Term Loan, 10.56%, Maturing June 22, 2010 | | 5,393,450 | |
| | Southern Wine & Spirits of America, Inc. | | | |
23,450,375 | | Term Loan, 5.53%, Maturing May 31, 2012 | | 23,694,657 | |
| | Sunny Delight Beverages Co. | | | |
1,811,640 | | Term Loan, 8.25%, Maturing August 20, 2010 | | 1,827,491 | |
| | | | $ | 83,880,789 | |
| | | | | |
Building and Development — 7.5% | | | |
| | | | | |
| | 401 North Wabash Venture, LLC | | | |
$ | 9,500,000 | | Term Loan, 7.87%, Maturing May 7, 2008(2) | | $ | 9,595,000 | |
| | Biomed Realty, L.P. | | | |
21,175,000 | | Term Loan, 6.11%, Maturing May 31, 2010 | | 21,201,469 | |
| | Contech Construction Products, Inc. | | | |
2,279,540 | | Term Loan, 6.15%, Maturing December 7, 2010 | | 2,315,871 | |
| | DMB/CHII, LLC | | | |
409,692 | | Term Loan, 6.44%, Maturing March 3, 2007 | | 410,716 | |
| | Empire Hawkeye Partners, L.P. | | | |
12,000,000 | | Term Loan, 5.54%, Maturing December 1, 2009(2) | | 12,015,000 | |
| | Formica Corp. | | | |
3,724,771 | | Term Loan, 9.03%, Maturing June 10, 2010 | | 3,743,395 | |
2,584,057 | | Term Loan, 9.03%, Maturing June 10, 2010 | | 2,596,977 | |
1,321,506 | | Term Loan, 9.03%, Maturing June 10, 2010 | | 1,328,114 | |
1,066,353 | | Term Loan, 9.03%, Maturing June 10, 2010 | | 1,071,685 | |
| | FT-FIN Acquisition, LLC | | | |
7,140,190 | | Term Loan, 8.56%, Maturing November 17, 2007 | | 7,158,041 | |
| | General Growth Properties, Inc. | | | |
5,108,024 | | Term Loan, 5.61%, Maturing November 12, 2007 | | 5,134,627 | |
53,827,782 | | Term Loan, 6.09%, Maturing November 12, 2008 | | 54,484,912 | |
| | Hovstone Holdings, LLC | | | |
8,520,000 | | Term Loan, 6.29%, Maturing February 28, 2009 | | 8,541,300 | |
| | Kyle Acquisition Group, LLC | | | |
3,531,157 | | Term Loan, 6.06%, Maturing July 20, 2008 | | 3,575,297 | |
3,268,843 | | Term Loan, 6.06%, Maturing July 20, 2010 | | 3,309,703 | |
| | Landsource Communities, LLC | | | |
18,000,000 | | Term Loan, 6.50%, Maturing March 31, 2010 | | 18,163,134 | |
| | Lion Gables Realty Limited | | | |
11,904,579 | | Term Loan, 5.63%, Maturing September 30, 2006 | | 11,968,566 | |
| | LNR Property Corp. | | | |
33,711,829 | | Term Loan, 6.73%, Maturing February 3, 2008 | | 33,985,738 | |
| | LNR Property Holdings | | | |
5,650,000 | | Term Loan, 8.23%, Maturing March 8, 2008 | | 5,674,719 | |
| | Longyear Holdings, Inc. | | | |
3,758,580 | | Term Loan, 6.53%, Maturing July 28, 2012 | | 3,763,278 | |
939,645 | | Term Loan, 6.53%, Maturing July 28, 2012 | | 940,820 | |
| | MAAX Corp. | | | |
6,670,586 | | Term Loan, 6.75%, Maturing June 4, 2011 | | 6,637,233 | |
| | Mueller Group, Inc. | | | |
17,625,000 | | Term Loan, 6.40%, Maturing October 3, 2012 | | 17,881,514 | |
| | | | | | | | |
See notes to financial statements
19
Principal | | | | | |
Amount | | Borrower/Tranche Description | | Value | |
| | | | | |
Building and Development (continued) | | | |
| | | | | |
| | NCI Building Systems, Inc. | | | |
$ | 9,016,184 | | Term Loan, 4.93%, Maturing June 18, 2010 | | $ | 9,064,087 | |
| | Newkirk Master, L.P. | | | |
29,062,620 | | Term Loan, 6.02%, Maturing August 11, 2008 | | 29,498,559 | |
| | Newkirk Tender Holdings, LLC | | | |
5,401,619 | | Term Loan, 8.59%, Maturing May 25, 2006 | | 5,415,123 | |
2,333,333 | | Term Loan, 10.09%, Maturing May 25, 2006 | | 2,339,167 | |
| | Nortek, Inc. | | | |
21,324,588 | | Term Loan, 5.92%, Maturing August 27, 2011 | | 21,575,152 | |
| | Panolam Industries Holdings, Inc. | | | |
4,525,000 | | Term Loan, 6.77%, Maturing September 30, 2012 | | 4,592,875 | |
| | Ply Gem Industries, Inc. | | | |
8,872,592 | | Term Loan, 6.16%, Maturing February 12, 2011 | | 8,933,591 | |
1,303,717 | | Term Loan, 6.16%, Maturing February 12, 2011 | | 1,312,680 | |
3,345,832 | | Term Loan, 6.64%, Maturing February 12, 2011 | | 3,368,835 | |
| | Shea Mountain House, LLC | | | |
3,000,000 | | Term Loan, 5.80%, Maturing May 11, 2010 | | 3,033,750 | |
| | South Edge, LLC | | | |
4,455,357 | | Term Loan, 5.31%, Maturing October 31, 2007 | | 4,475,776 | |
10,794,643 | | Term Loan, 5.56%, Maturing October 31, 2009 | | 10,911,581 | |
| | St. Marys Cement, Inc. | | | |
16,138,408 | | Term Loan, 6.02%, Maturing December 4, 2010 | | 16,420,830 | |
| | Stile Acquisition Corp. | | | |
19,854,933 | | Term Loan, 6.20%, Maturing April 6, 2013 | | 19,804,164 | |
| | Stile U.S. Acquisition Corp. | | | |
19,885,367 | | Term Loan, 6.20%, Maturing April 6, 2013 | | 19,834,520 | |
| | Sugarloaf Mills, L.P. | | | |
12,000,000 | | Term Loan, 5.79%, Maturing April 7, 2007 | | 12,060,000 | |
5,975,000 | | Term Loan, 6.94%, Maturing April 7, 2007 | | 5,975,000 | |
| | Sunstone Hotel Partnership, LLC | | | |
10,000,000 | | Revolving Loan, 0.00%, Maturing October 26, 2007(2) | | 9,900,000 | |
3,710,247 | | Term Loan, 6.33%, Maturing October 26, 2008 | | 3,710,247 | |
| | TE / Tousa Senior, LLC | | | |
3,000,000 | | Revolving Loan, 0.00%, Maturing July 29, 2008(2)(3) | | 2,985,000 | |
7,350,000 | | Term Loan, 6.56%, Maturing August 1, 2008 | | 7,469,437 | |
| | The Woodlands Community Property Co. | | | |
9,888,000 | | Term Loan, 6.11%, Maturing November 30, 2007 | | 9,949,800 | |
4,090,000 | | Term Loan, 8.11%, Maturing November 30, 2007 | | 4,151,350 | |
| | Tousa/Kolter, LLC | | | |
12,620,000 | | Term Loan, 6.11%, Maturing January 7, 2008(2) | | 12,683,100 | |
| | Tower Financing, LLC | | | |
7,300,000 | | Term Loan, 7.54%, Maturing July 9, 2008 | | 7,309,125 | |
| | Trustreet Properties, Inc. | | | |
$ | 5,700,000 | | Term Loan, 5.86%, Maturing April 8, 2010 | | $ | 5,753,437 | |
| | Whitehall Street Real Estate, L.P. | | | |
7,737,500 | | Term Loan, 7.83%, Maturing September 11, 2006(3) | | 7,867,490 | |
| | | | $ | 485,891,785 | |
| | | | | |
Business Equipment and Services — 4.0% | | | |
| | | | | |
| | Acco Brands Corp. | | | |
$ | 4,435,000 | | Term Loan, 5.73%, Maturing August 17, 2012 | | $ | 4,490,992 | |
| | Affinion Group, Inc. | | | |
16,100,000 | | Term Loan, 6.91%, Maturing October 17, 2012 | | 16,002,724 | |
| | Allied Security Holdings, LLC | | | |
8,075,000 | | Term Loan, 7.78%, Maturing June 30, 2010 | | 8,186,031 | |
| | Baker & Taylor, Inc. | | | |
10,800,000 | | Revolving Loan, 5.66%, Maturing May 6, 2011(2) | | 10,746,000 | |
4,650,000 | | Term Loan, 10.65%, Maturing May 6, 2011 | | 4,708,125 | |
| | Buhrmann US, Inc. | | | |
10,888,664 | | Term Loan, 6.30%, Maturing December 31, 2010 | | 11,099,632 | |
| | DynCorp International, LLC | | | |
8,094,325 | | Term Loan, 6.75%, Maturing February 11, 2011 | | 8,128,054 | |
| | Global Imaging Systems, Inc. | | | |
8,564,697 | | Term Loan, 5.38%, Maturing May 10, 2010 | | 8,628,932 | |
| | Info USA, Inc. | | | |
4,510,417 | | Term Loan, 6.53%, Maturing March 25, 2009 | | 4,521,693 | |
2,673,750 | | Term Loan, 6.78%, Maturing June 4, 2010 | | 2,680,434 | |
| | Iron Mountain, Inc. | | | |
19,916,913 | | Term Loan, 5.63%, Maturing April 2, 2011 | | 20,125,423 | |
25,308,750 | | Term Loan, 5.72%, Maturing April 2, 2011 | | 25,553,941 | |
| | Language Line, Inc. | | | |
11,975,572 | | Term Loan, 8.45%, Maturing June 11, 2011 | | 12,084,849 | |
| | Mitchell International, Inc. | | | |
5,468,560 | | Term Loan, 6.15%, Maturing August 11, 2011 | | 5,521,540 | |
| | Protection One, Inc. | | | |
7,182,354 | | Term Loan, 6.91%, Maturing April 18, 2011 | | 7,269,892 | |
| | Sungard Data Systems, Inc. | | | |
89,121,638 | | Term Loan, 6.28%, Maturing February 11, 2013 | | 90,007,774 | |
| | Transaction Network Services, Inc. | | | |
5,672,859 | | Term Loan, 5.85%, Maturing May 4, 2012 | | 5,729,588 | |
| | US Investigations Services, Inc. | | | |
5,100,000 | | Term Loan, 6.57%, Maturing October 14, 2012 | | 5,157,375 | |
See notes to financial statements
20
Principal | | | | | |
Amount | | Borrower/Tranche Description | | Value | |
| | | | | |
Business Equipment and Services (continued) | | | |
| | | | | |
| | Western Inventory Services | | | |
$ | 1,726,191 | | Term Loan, 6.97%, Maturing March 31, 2011 | | $ | 1,741,295 | |
1,514,203 | | Term Loan, 6.99%, Maturing March 31, 2011 | | 1,527,452 | |
1,000,000 | | Term Loan, 10.77%, Maturing October 14, 2011 | | 1,010,000 | |
| | Williams Scotsman, Inc. | | | |
5,250,000 | | Term Loan, 6.66%, Maturing June 27, 2010 | | 5,318,906 | |
| | | | $ | 260,240,652 | |
| | | | | |
Cable and Satellite Television — 4.2% | | | |
| | | | | |
| | Adelphia Communications Corp. | | | |
$ | 21,356,806 | | DIP Loan, 6.31%, Maturing March 31, 2006 | | $ | 21,463,590 | |
| | Atlantic Broadband Finance, LLC | | | |
9,948,328 | | Term Loan, 6.52%, Maturing September 1, 2011 | | 10,122,424 | |
| | Bragg Communications, Inc. | | | |
7,647,018 | | Term Loan, 5.86%, Maturing August 31, 2011 | | 7,756,944 | |
| | Bresnan Communications, LLC | | | |
3,312,528 | | Term Loan, 7.57%, Maturing September 30, 2009 | | 3,360,146 | |
3,000,000 | | Term Loan, 7.48%, Maturing September 30, 2010 | | 3,045,000 | |
| | Canadian Cable Acquisition Co., Inc. | | | |
6,618,150 | | Term Loan, 7.02%, Maturing July 30, 2011 | | 6,686,403 | |
| | Cebridge Connections, Inc. | | | |
5,220,500 | | Term Loan, 7.04%, Maturing February 23, 2009 | | 5,253,128 | |
| | Charter Communications Operating, LLC | | | |
11,985,100 | | Term Loan, 7.25%, Maturing April 27, 2010 | | 11,983,098 | |
60,502,905 | | Term Loan, 7.50%, Maturing April 27, 2011 | | 60,732,332 | |
| | EWT Elektro & Nachrichtentech | | | |
3,500,000 | | Term Loan, 5.12%, Maturing November 30, 2012 | | EUR | 4,197,365 | |
| | Iesy Hessen GmbH and Co., KG | | | |
8,900,000 | | Term Loan, 4.88%, Maturing February 14, 2013 | | EUR | 10,719,745 | |
4,600,000 | | Term Loan, 5.38%, Maturing February 14, 2014 | | EUR | 5,566,124 | |
| | Insight Midwest Holdings, LLC | | | |
23,987,812 | | Term Loan, 6.06%, Maturing December 31, 2009 | | 24,355,137 | |
| | Kabel Deutschland GmbH | | | |
4,555,169 | | Term Loan, 4.40%, Maturing March 29, 2011 | | EUR | 5,480,767 | |
| | MCC Iowa, LLC | | | |
2,398,250 | | Term Loan, 5.35%, Maturing March 31, 2010 | | 2,398,749 | |
9,872,900 | | Term Loan, 6.03%, Maturing February 3, 2014 | | 10,027,164 | |
| | Mediacom Illinois, LLC | | | |
2,000,000 | | Term Loan, 5.27%, Maturing September 30, 2012 | | 2,000,358 | |
16,326,625 | | Term Loan, 6.28%, Maturing March 31, 2013 | | 16,599,590 | |
| | NTL, Inc. | | | |
$ | 11,300,000 | | Term Loan, 7.14%, Maturing April 13, 2012 | | $ | 11,357,438 | |
| | UGS Corp. | | | |
26,696,123 | | Term Loan, 6.08%, Maturing March 31, 2012 | | 27,121,606 | |
| | UPC Broadband Holdings B.V. | | | |
7,000,000 | | Term Loan, 4.67%, Maturing September 30, 2012 | | EUR | 8,336,250 | |
13,090,000 | | Term Loan, 6.55%, Maturing September 30, 2012 | | 13,217,497 | |
| | | | $ | 271,780,855 | |
| | | | | |
Chemicals and Plastics — 5.3% | | | |
| | | | | |
| | Basell Af S.A.R.L. | | | |
$ | 961,538 | | Term Loan, 4.62%, Maturing August 1, 2013 | | EUR | 1,161,545 | |
538,462 | | Term Loan, 4.62%, Maturing August 1, 2013 | | EUR | 650,800 | |
833,333 | | Term Loan, 6.58%, Maturing August 1, 2013 | | 847,657 | |
166,667 | | Term Loan, 6.58%, Maturing August 1, 2013 | | 169,462 | |
961,538 | | Term Loan, 5.24%, Maturing August 1, 2014 | | EUR | 1,165,719 | |
538,462 | | Term Loan, 5.24%, Maturing August 1, 2014 | | EUR | 653,179 | |
833,333 | | Term Loan, 7.24%, Maturing August 1, 2014 | | 848,698 | |
166,667 | | Term Loan, 7.24%, Maturing August 1, 2014 | | 169,670 | |
| | Brenntag AG | | | |
16,680,000 | | Term Loan, 6.81%, Maturing February 27, 2012 | | 16,761,315 | |
1,423,099 | | Term Loan, 5.41%, Maturing December 9, 2012 | | EUR | 1,714,809 | |
| | Celanese AG | | | |
7,250,000 | | Term Loan, 3.89%, Maturing June 4, 2011 | | 7,319,100 | |
| | Celanese Holdings, LLC | | | |
25,260,088 | | Term Loan, 6.31%, Maturing April 6, 2011 | | 25,657,934 | |
| | Gentek, Inc. | | | |
5,266,997 | | Term Loan, 6.61%, Maturing February 25, 2011 | | 5,309,133 | |
| | Hercules, Inc. | | | |
8,501,262 | | Term Loan, 5.86%, Maturing October 8, 2010 | | 8,609,653 | |
| | Hexion Specialty Chemicals, Inc. | | | |
3,437,726 | | Term Loan, 3.16%, Maturing May 31, 2012 | | 3,484,995 | |
6,787,180 | | Term Loan, 6.38%, Maturing May 31, 2012 | | 6,880,504 | |
9,372,773 | | Term Loan, 6.56%, Maturing May 31, 2012 | | 9,501,649 | |
| | Huntsman, LLC | | | |
3,892,000 | | Term Loan, 4.12%, Maturing August 16, 2012 | | EUR | 4,719,914 | |
32,351,421 | | Term Loan, 5.72%, Maturing August 16, 2012 | | 32,562,287 | |
| | Innophos, Inc. | | | |
13,206,741 | | Term Loan, 6.21%, Maturing August 13, 2010 | | 13,369,078 | |
| | Invista B.V. | | | |
14,803,412 | | Term Loan, 6.31%, Maturing April 29, 2011 | | 15,053,219 | |
6,422,707 | | Term Loan, 6.31%, Maturing April 29, 2011 | | 6,531,090 | |
| | | | | | | | |
See notes to financial statements
21
Principal | | | | | |
Amount | | Borrower/Tranche Description | | Value | |
| | | | | |
Chemicals and Plastics (continued) | | | |
| | | | | |
| | ISP Chemco, Inc. | | | |
$ | 12,484,875 | | Term Loan, 5.83%, Maturing March 27, 2011 | | $ | 12,640,936 | |
| | Kraton Polymer | | | |
10,705,611 | | Term Loan, 6.42%, Maturing December 23, 2010 | | 10,879,577 | |
| | Mosaic Co. | | | |
12,034,525 | | Term Loan, 5.23%, Maturing February 21, 2012 | | 12,179,312 | |
| | Nalco Co. | | | |
1,072,971 | | Term Loan, 6.52%, Maturing November 4, 2009 | | 1,088,227 | |
33,306,320 | | Term Loan, 5.81%, Maturing November 4, 2010 | | 33,845,249 | |
| | PQ Corp. | | | |
8,452,525 | | Term Loan, 6.06%, Maturing February 11, 2012 | | 8,521,202 | |
| | Professional Paint, Inc. | | | |
3,217,013 | | Term Loan, 7.18%, Maturing September 30, 2011 | | 3,241,140 | |
| | Rockwood Specialties Group, Inc. | | | |
3,362,530 | | Term Loan, 4.69%, Maturing July 30, 2011 | | EUR | 4,027,470 | |
25,795,375 | | Term Loan, 6.47%, Maturing December 10, 2012 | | 26,238,746 | |
| | Sigmakalon (BC) Holdco B.V. | | | |
141,929 | | Term Loan, 4.87%, Maturing September 9, 2013 | | EUR | 169,996 | |
2,778,106 | | Term Loan, 4.87%, Maturing September 9, 2013 | | EUR | 3,327,476 | |
5,079,965 | | Term Loan, 4.87%, Maturing September 9, 2013 | | EUR | 6,084,528 | |
1,725,707 | | Term Loan, 5.37%, Maturing September 9, 2014 | | EUR | 2,066,966 | |
483,547 | | Term Loan, 5.37%, Maturing September 9, 2014 | | EUR | 579,169 | |
422,542 | | Term Loan, 5.37%, Maturing September 9, 2014 | | EUR | 506,099 | |
5,368,204 | | Term Loan, 5.37%, Maturing September 9, 2014 | | EUR | 6,429,766 | |
| | Solo Cup Co. | | | |
19,719,841 | | Term Loan, 6.44%, Maturing February 27, 2011 | | 19,808,580 | |
| | TPG Spring Lux III S.A.R.L. | | | |
2,545,551 | | Term Loan, 5.37%, Maturing June 27, 2013 | | EUR | 3,045,123 | |
2,545,551 | | Term Loan, 5.37%, Maturing June 27, 2014 | | EUR | 3,060,367 | |
| | TPG Spring UK, Ltd. | | | | |
6,167,890 | | Term Loan, 4.87%, Maturing June 27, 2013 | | EUR | 7,378,356 | |
6,167,890 | | Term Loan, 5.37%, Maturing June 27, 2013 | | EUR | 7,415,294 | |
| | Wavin Holdings B.V. | | | | |
1,850,000 | | Term Loan, 4.65%, Maturing September 9, 2013 | | EUR | 2,238,827 | |
1,850,000 | | Term Loan, 5.15%, Maturing September 9, 2014 | | EUR | 2,247,136 | |
| | Wellman, Inc. | | | |
6,250,000 | | Term Loan, 7.71%, Maturing February 10, 2009 | | 6,369,794 | |
| | Westlake Chemical Corp. | | | |
284,375 | | Term Loan, 6.35%, Maturing July 31, 2010 | | 287,219 | |
| | | | $ | 346,817,965 | |
| | | |
Clothing/Textiles — 0.4% | | | |
| | | | | |
| | Propex Fabrics, Inc. | | | |
$ | 11,108,529 | | Term Loan, 6.28%, Maturing December 31, 2011 | | $ | 11,136,301 | |
| | SI Corp. | | | |
3,000,000 | | Revolving Loan, 7.75%, Maturing December 2, 2009(2) | | 2,902,500 | |
| | St. John Knits International, Inc. | | | |
4,554,952 | | Term Loan, 6.56%, Maturing March 23, 2012 | | 4,623,277 | |
| | The William Carter Co. | | | |
5,953,125 | | Term Loan, 5.72%, Maturing July 14, 2012 | | 6,033,123 | |
| | | | $ | 24,695,201 | |
| | | | | |
Conglomerates — 2.6% | | | |
| | | | | |
| | Amsted Industries, Inc. | | | |
$ | 18,927,807 | | Term Loan, 6.62%, Maturing October 15, 2010 | | $ | 19,195,957 | |
| | Blount, Inc. | | | |
6,568,739 | | Term Loan, 6.57%, Maturing August 9, 2010 | | 6,665,220 | |
| | Euramax International, Inc. | | | |
4,897,725 | | Term Loan, 6.38%, Maturing June 28, 2012 | | 4,862,741 | |
1,104,375 | | Term Loan, 7.34%, Maturing June 29, 2012 | | GBP | 1,968,867 | |
| | Goodman Global Holdings, Inc. | | | |
10,455,988 | | Term Loan, 6.38%, Maturing December 23, 2011 | | 10,619,362 | |
| | Jarden Corp. | | | |
8,977,500 | | Term Loan, 5.69%, Maturing January 24, 2012 | | 9,023,510 | |
22,054,847 | | Term Loan, 6.02%, Maturing January 24, 2012 | | 22,249,790 | |
| | Johnson Diversey, Inc. | | | |
20,970,413 | | Term Loan, 5.46%, Maturing November 3, 2009 | | 21,212,894 | |
| | Penn Engineering & Manufacturing Corp. | | | |
3,265,444 | | Term Loan, 6.52%, Maturing May 25, 2011 | | 3,306,262 | |
| | Platinum 100, Ltd. | | | |
1,000,000 | | Term Loan, 7.37%, Maturing January 15, 2013 | | GBP | 1,784,837 | |
1,000,000 | | Term Loan, 7.87%, Maturing January 15, 2014 | | GBP | 1,791,573 | |
| | Polymer Group, Inc. | | | |
13,031,667 | | Term Loan, 7.25%, Maturing April 27, 2010 | | 13,237,997 | |
2,500,000 | | Term Loan, 10.25%, Maturing April 27, 2011 | | 2,556,250 | |
| | PP Acquisition Corp. | | | |
18,538,819 | | Term Loan, 6.34%, Maturing November 12, 2011 | | 18,580,531 | |
| | Rexnord Corp. | | | |
15,542,450 | | Term Loan, 6.15%, Maturing December 31, 2011 | | 15,743,212 | |
| | Roper Industries, Inc. | | | |
9,778,360 | | Term Loan, 4.85%, Maturing December 13, 2009 | | 9,817,063 | |
| | Walter Industries, Inc. | | | |
3,775,000 | | Term Loan, 6.04%, Maturing October 3, 2012 | | 3,826,906 | |
| | | | $ | 166,442,972 | |
| | | | | | | | | |
See notes to financial statements
22
Principal | | | | | |
Amount | | Borrower/Tranche Description | | Value | |
| | | | | |
Containers and Glass Products — 3.8% | | | |
| | | | | |
| | Berry Plastics Corp. | | | |
$ | 28,746,569 | | Term Loan, 5.86%, Maturing December 2, 2011 | | $ | 29,105,901 | |
| | BWAY Corp. | | | |
8,392,908 | | Term Loan, 6.31%, Maturing June 30, 2011 | | 8,518,801 | |
| | Consolidated Container Holding | | | |
5,554,688 | | Term Loan, 7.50%, Maturing December 15, 2008 | | 5,627,593 | |
| | Dr. Pepper/Seven Up Bottling | | | |
24,626,684 | | Term Loan, 6.16%, Maturing December 19, 2010 | | 25,005,319 | |
| | Graham Packaging Holdings Co. | | | |
30,504,488 | | Term Loan, 6.56%, Maturing October 7, 2011 | | 30,923,924 | |
1,500,000 | | Term Loan, 8.25%, Maturing April 7, 2012 | | 1,530,000 | |
| | Graphic Packaging International, Inc. | | | |
10,500,000 | | Revolving Loan, 0.00%, Maturing August 8, 2007(2) | | 10,263,751 | |
39,048,604 | | Term Loan, 6.52%, Maturing August 8, 2010 | | 39,458,615 | |
| | IPG (US), Inc. | | | |
10,444,500 | | Term Loan, 6.12%, Maturing July 28, 2011 | | 10,596,812 | |
| | Kranson Industries, Inc. | | | |
4,098,125 | | Term Loan, 6.78%, Maturing July 30, 2011 | | 4,159,597 | |
| | Owens-Illinois, Inc. | | | |
3,772,178 | | Term Loan, 5.67%, Maturing April 1, 2007 | | 3,801,254 | |
5,000,000 | | Revolving Loan, 6.85%, Maturing April 1, 2007(2) | | 4,995,315 | |
6,619,164 | | Term Loan, 3.87%, Maturing April 1, 2008 | | EUR | 8,002,430 | |
4,073,548 | | Term Loan, 5.78%, Maturing April 1, 2008 | | 4,112,585 | |
725,064 | | Term Loan, 5.87%, Maturing April 1, 2008 | | 731,861 | |
| | Picnal Acquisition, Inc. | | | |
1,708,273 | | Term Loan, 7.36%, Maturing June 30, 2011 | | GBP | 3,012,225 | |
199,727 | | Term Loan, 7.36%, Maturing June 30, 2011 | | GBP | 352,462 | |
1,991,413 | | Term Loan, 7.86%, Maturing June 30, 2012 | | GBP | 3,525,888 | |
265,366 | | Term Loan, 7.86%, Maturing June 30, 2012 | | GBP | 470,116 | |
| | Pregis Corp. | | | |
2,000,000 | | Term Loan, 6.37%, Maturing October 12, 2011 | | 2,015,626 | |
| | Smurfit-Stone Container Corp. | | | |
3,225,483 | | Term Loan, 2.10%, Maturing November 1, 2010 | | 3,266,811 | |
28,164,779 | | Term Loan, 5.72%, Maturing November 1, 2011 | | 28,525,654 | |
10,649,736 | | Term Loan, 5.88%, Maturing November 1, 2011 | | 10,786,191 | |
| | U.S. Can Corp. | | | |
7,828,281 | | Term Loan, 7.65%, Maturing January 15, 2010 | | 7,867,423 | |
| | | | $ | 246,656,154 | |
| | | | | |
Cosmetics/Toiletries — 0.7% | | | |
| | | | | |
| | American Safety Razor Co. | | | |
$ | 4,586,950 | | Term Loan, 6.61%, Maturing February 28, 2012 | | $ | 4,658,621 | |
| | Church & Dwight Co., Inc. | | | |
20,769,124 | | Term Loan, 5.82%, Maturing May 30, 2011 | | 21,011,437 | |
| | Prestige Brands, Inc. | | | |
15,751,790 | | Term Loan, 6.32%, Maturing April 7, 2011 | | 15,968,377 | |
| | Revlon Consumer Products Corp. | | | |
6,837,500 | | Term Loan, 9.86%, Maturing July 9, 2010 | | 7,063,992 | |
| | | | $ | 48,702,427 | |
| | | | | |
Drugs — 0.6% | | | |
| | | | | |
| | Warner Chilcott Corp. | | | |
$ | 767,621 | | Term Loan, 0.00%, Maturing January 31, 2006(2) | | $ | 772,131 | |
153,535 | | Term Loan, 0.00%, Maturing June 30, 2006(2) | | 154,437 | |
23,398,587 | | Term Loan, 6.61%, Maturing January 18, 2012 | | 23,513,498 | |
9,428,528 | | Term Loan, 6.77%, Maturing January 18, 2012 | | 9,474,832 | |
4,355,617 | | Term Loan, 6.77%, Maturing January 18, 2012 | | 4,377,008 | |
| | | | $ | 38,291,906 | |
| | | | | |
Ecological Services and Equipment — 1.3% | | | |
| | | | | |
| | Alderwoods Group, Inc. | | | |
$ | 5,095,897 | | Term Loan, 5.84%, Maturing September 29, 2009 | | $ | 5,170,746 | |
| | Allied Waste Industries, Inc. | | | |
9,204,558 | | Term Loan, 4.02%, Maturing January 15, 2012 | | 9,265,280 | |
26,129,174 | | Term Loan, 6.04%, Maturing January 15, 2012 | | 26,302,881 | |
| | Envirocare of Utah, LLC | | | |
11,051,364 | | Term Loan, 6.95%, Maturing April 15, 2010 | | 11,267,783 | |
| | Environmental Systems, Inc. | | | |
6,602,243 | | Term Loan, 7.49%, Maturing December 12, 2008 | | 6,728,102 | |
1,000,000 | | Term Loan, 13.98%, Maturing December 12, 2010 | | 1,020,000 | |
| | IESI Corp. | | | |
9,267,647 | | Term Loan, 6.09%, Maturing January 20, 2012 | | 9,389,285 | |
| | Sensus Metering Systems, Inc. | | | |
1,342,257 | | Term Loan, 6.44%, Maturing December 17, 2010 | | 1,358,197 | |
8,603,328 | | Term Loan, 6.45%, Maturing December 17, 2010 | | 8,705,492 | |
| | Synagro Technologies, Inc. | | | |
1,172,857 | | Term Loan, 0.00%, Maturing June 21, 2012(2) | | 1,177,255 | |
7,037,143 | | Term Loan, 6.17%, Maturing June 21, 2012 | | 7,085,523 | |
| | | | $ | 87,470,544 | |
| | | | | | | | |
See notes to financial statements
23
Principal | | | | | |
Amount | | Borrower/Tranche Description | | Value | |
| | | | | |
Electronics/Electrical — 2.3% | | | |
| | | | | |
| | AMI Semiconductor, Inc. | | | |
$ | 7,785,892 | | Term Loan, 5.58%, Maturing April 1, 2012 | | $ | 7,831,307 | |
| | Aspect Software, Inc. | | | |
4,350,000 | | Term Loan, 6.56%, Maturing September 22, 2010 | | 4,379,906 | |
| | Communications & Power, Inc. | | | |
6,842,205 | | Term Loan, 6.03%, Maturing July 23, 2010 | | 6,944,839 | |
| | Enersys Capital, Inc. | | | |
8,394,818 | | Term Loan, 5.86%, Maturing March 17, 2011 | | 8,473,519 | |
| | Fairchild Semiconductor Corp. | | | |
17,531,216 | | Term Loan, 5.60%, Maturing December 31, 2010 | | 17,662,700 | |
| | Invensys International Holding Ltd. | | | |
10,889,479 | | Term Loan, 7.79%, Maturing September 4, 2009 | | 10,998,374 | |
| | Panavision, Inc. | | | |
3,094,077 | | Term Loan, 10.39%, Maturing January 12, 2007 | | 3,161,760 | |
| | Rayovac Corp. | | | |
31,745,475 | | Term Loan, 6.00%, Maturing February 7, 2012 | | 32,016,645 | |
| | Securityco, Inc. | | | |
12,604,428 | | Term Loan, 7.31%, Maturing June 28, 2010 | | 12,698,961 | |
| | Spectrum Brands, Inc. | | | |
10,000,000 | | Term Loan, 4.43%, Maturing February 7, 2012 | | EUR | 12,049,868 | |
| | SSA Global Technologies, Inc. | | | |
2,942,625 | | Term Loan, 5.97%, Maturing September 22, 2011 | | 2,961,016 | |
| | Telcordia Technologies, Inc. | | | |
15,278,225 | | Term Loan, 6.36%, Maturing September 15, 2012 | | 15,154,089 | |
| | United Online, Inc. | | | |
1,402,917 | | Term Loan, 7.03%, Maturing December 13, 2008 | | 1,409,931 | |
| | Vertafore, Inc. | | | |
6,457,795 | | Term Loan, 6.57%, Maturing December 22, 2010 | | 6,530,445 | |
| | Viasystems, Inc. | | | |
8,435,006 | | Term Loan, 8.38%, Maturing September 30, 2009 | | 8,550,988 | |
| | | | $ | 150,824,348 | |
| | | | | |
Equipment Leasing — 0.8% | | | |
| | | | | |
| | Ashtead Group, PLC | | | |
$ | 5,125,000 | | Term Loan, 6.06%, Maturing November 12, 2009 | | $ | 5,180,519 | |
| | Carey International, Inc. | | | |
2,992,500 | | Term Loan, 7.69%, Maturing May 2, 2011 | | 2,932,650 | |
| | Maxim Crane Works, L.P. | | | |
11,547,145 | | Term Loan, 6.87%, Maturing January 28, 2010 | | 11,720,352 | |
976,995 | | Term Loan, 9.63%, Maturing January 28, 2012 | | 1,001,420 | |
| | United Rentals, Inc. | | | |
$ | 5,212,716 | | Term Loan, 2.87%, Maturing February 14, 2011 | | $ | 5,264,191 | |
25,504,750 | | Term Loan, 6.32%, Maturing February 14, 2011 | | 25,756,609 | |
| | | | $ | 51,855,741 | |
| | | | | |
Farming/Agriculture — 0.2% | | | |
| | | | | |
| | Central Garden & Pet Co. | | | |
$ | 11,276,669 | | Term Loan, 5.78%, Maturing May 19, 2009 | | $ | 11,438,771 | |
| | | | $ | 11,438,771 | |
| | | | | |
Financial Intermediaries — 2.1% | | | |
| | | | | |
| | AIMCO Properties, L.P. | | | |
$ | 8,875,000 | | Term Loan, 5.72%, Maturing November 2, 2009 | | $ | 8,958,203 | |
29,843,750 | | Term Loan, 5.89%, Maturing November 2, 2009 | | 30,244,790 | |
| | Blitz F04-506 GmbH | | | |
1,500,000 | | Term Loan, 5.11%, Maturing June 30, 2014 | | EUR | 1,825,820 | |
| | Coinstar, Inc. | | | |
7,076,865 | | Term Loan, 6.10%, Maturing July 7, 2011 | | 7,209,556 | |
| | Corrections Corp. of America | | | |
5,912,037 | | Term Loan, 5.84%, Maturing March 31, 2008 | | 5,985,937 | |
| | Fidelity National Information Solutions, Inc. | | | |
45,872,350 | | Term Loan, 5.69%, Maturing March 9, 2013 | | 46,083,271 | |
| | Geo Group, Inc. | | | |
5,680,963 | | Term Loan, 6.06%, Maturing September 14, 2011 | | 5,737,773 | |
| | The Macerich Partnership, L.P. | | | |
8,865,985 | | Term Loan, 5.66%, Maturing April 25, 2006 | | 8,882,608 | |
10,900,000 | | Revolving Loan, 5.39%, Maturing July 30, 2007(2) | | 10,900,000 | |
11,280,000 | | Term Loan, 5.63%, Maturing April 25, 2010 | | 11,364,600 | |
| | | | $ | 137,192,558 | |
| | | | | |
Food Products — 2.1% | | | |
| | | | | |
| | Acosta Sales Co., Inc. | | | |
$ | 9,555,207 | | Term Loan, 5.98%, Maturing August 13, 2010 | | $ | 9,674,647 | |
| | American Seafoods Holdings, LLC | | | |
4,125,000 | | Term Loan, 5.84%, Maturing September 30, 2012 | | 4,184,297 | |
| | Chiquita Brands, LLC | | | |
4,713,188 | | Term Loan, 6.57%, Maturing June 28, 2012 | | 4,785,361 | |
| | Del Monte Corp. | | | |
5,472,500 | | Term Loan, 5.73%, Maturing February 8, 2012 | | 5,558,008 | |
| | Dole Food Company, Inc. | | | |
11,360,627 | | Term Loan, 5.59%, Maturing April 18, 2012 | | 11,468,553 | |
| | | | | | | | |
See notes to financial statements
24
Principal | | | | | |
Amount | | Borrower/Tranche Description | | Value | |
| | | | | |
Food Products (continued) | | | |
| | | | | |
| | Herbalife International, Inc. | | | |
$ | 5,212,357 | | Term Loan, 5.93%, Maturing December 21, 2010 | | $ | 5,285,658 | |
| | Interstate Brands Corp. | | | |
1,875,000 | | Term Loan, 7.95%, Maturing July 19, 2006 | | 1,886,719 | |
8,250,000 | | Revolving Loan, 0.00%, Maturing September 22, 2006(2) | | 8,255,156 | |
1,972,066 | | Term Loan, 7.81%, Maturing July 19, 2007 | | 1,987,843 | |
6,046,139 | | Term Loan, 8.18%, Maturing July 19, 2007 | | 6,105,089 | |
| | Merisant Co. | | | |
13,904,938 | | Term Loan, 7.49%, Maturing January 11, 2010 | | 13,731,126 | |
| | Michael Foods, Inc. | | | |
12,829,879 | | Term Loan, 5.19%, Maturing November 21, 2010 | | 13,046,383 | |
6,200,000 | | Term Loan, 6.59%, Maturing November 20, 2011 | | 6,289,125 | |
| | Nash-Finch Co. | | | |
6,300,000 | | Term Loan, 6.31%, Maturing November 12, 2010 | | 6,339,375 | |
| | Pinnacle Foods Holdings Corp. | | | |
1,000,000 | | Revolving Loan, 0.00%, Maturing November 25, 2009(2) | | 980,000 | |
21,488,142 | | Term Loan, 7.31%, Maturing November 25, 2010 | | 21,783,604 | |
| | Reddy Ice Group, Inc. | | | |
13,335,000 | | Term Loan, 5.87%, Maturing August 9, 2012 | | 13,476,684 | |
| | United Biscuits, Ltd. | | | |
1,547,559 | | Term Loan, 9.05%, Maturing January 14, 2011 | | GBP | 2,797,782 | |
| | | | $ | 137,635,410 | |
| | | | | |
Food Service — 2.1% | | | |
| | | | | |
| | AFC Enterprises, Inc. | | | |
$ | 4,937,625 | | Term Loan, 6.31%, Maturing May 11, 2011 | | $ | 4,999,345 | |
| | Buffets, Inc. | | | |
227,273 | | Term Loan, 6.78%, Maturing June 28, 2009 | | 229,545 | |
10,538,418 | | Term Loan, 7.16%, Maturing June 28, 2009 | | 10,643,802 | |
| | Burger King Corp. | | | |
6,284,250 | | Term Loan, 5.83%, Maturing June 30, 2012 | | 6,357,191 | |
| | Carrols Corp. | | | |
12,022,015 | | Term Loan, 6.56%, Maturing December 31, 2010 | | 12,202,345 | |
| | CKE Restaurants, Inc. | | | |
3,586,522 | | Term Loan, 6.00%, Maturing May 1, 2010 | | 3,613,421 | |
| | Denny’s, Inc. | | | |
8,704,283 | | Term Loan, 7.30%, Maturing September 21, 2009 | | 8,837,572 | |
| | Domino’s, Inc. | | | |
6,592,593 | | Revolving Loan, 0.00%, Maturing June 25, 2009(2) | | 6,526,667 | |
30,424,098 | | Term Loan, 5.81%, Maturing June 25, 2010 | | 30,950,192 | |
| | Gate Gourmet Borrower, LLC | | | |
$ | 7,947,871 | | Term Loan, 11.39%, Maturing December 31, 2008 | | $ | 7,957,806 | |
| | Jack in the Box, Inc. | | | |
12,744,833 | | Term Loan, 5.57%, Maturing January 8, 2011 | | 12,868,305 | |
| | Landry’s Restaurants, Inc. | | | |
7,994,588 | | Term Loan, 5.95%, Maturing December 28, 2010 | | 8,082,032 | |
| | Maine Beverage Co., LLC | | | |
3,850,000 | | Term Loan, 5.77%, Maturing June 30, 2010 | | 3,840,375 | |
| | Weight Watchers International, Inc. | | | |
2,000,000 | | Revolving Loan, 5.80%, Maturing March 31, 2009(2) | | 2,000,000 | |
12,122,185 | | Term Loan, 5.64%, Maturing March 31, 2010 | | 12,298,962 | |
4,504,500 | | Term Loan, 5.67%, Maturing March 31, 2010 | | 4,557,054 | |
| | | | $ | 135,964,614 | |
| | | | | |
Food/Drug Retailers — 1.7% | | | |
| | | | | |
| | Cumberland Farms, Inc. | | | |
$ | 10,397,873 | | Term Loan, 6.30%, Maturing September 8, 2008 | | $ | 10,456,361 | |
| | General Nutrition Centers, Inc. | | | |
4,412,775 | | Term Loan, 6.80%, Maturing December 7, 2009 | | 4,477,126 | |
7,000,000 | | Revolving Loan, 0.00%, Maturing December 15, 2009(2) | | 6,864,375 | |
| | Giant Eagle, Inc. | | | |
5,019,565 | | Term Loan, 5.75%, Maturing August 6, 2009 | | 5,104,270 | |
13,274,448 | | Term Loan, 5.92%, Maturing August 6, 2009 | | 13,498,454 | |
| | Roundy’s, Inc. | | | |
9,838,342 | | Term Loan, 6.00%, Maturing June 6, 2009 | | 9,920,325 | |
| | The Jean Coutu Group (PJC), Inc. | | | |
29,656,703 | | Term Loan, 6.50%, Maturing July 30, 2011 | | 30,025,099 | |
| | The Pantry, Inc. | | | |
8,178,074 | | Term Loan, 6.34%, Maturing March 12, 2011 | | 8,310,968 | |
| | Winn-Dixie Stores, Inc. | | | |
23,000,000 | | DIP Loan, 5.81%, Maturing February 23, 2007(2) | | 22,942,500 | |
| | | | $ | 111,599,478 | |
| | | | | |
Forest Products — 1.9% | | | |
| | | | | |
| | Appleton Papers, Inc. | | | |
$ | 13,079,846 | | Term Loan, 6.03%, Maturing June 11, 2010 | | $ | 13,239,263 | |
| | Boise Cascade Holdings, LLC | | | |
18,567,856 | | Term Loan, 5.79%, Maturing October 29, 2011 | | 18,847,656 | |
| | Buckeye Technologies, Inc. | | | |
10,270,574 | | Term Loan, 5.89%, Maturing April 15, 2010 | | 10,328,346 | |
| | | | | | | | |
See notes to financial statements
25
Principal | | | | | |
Amount | | Borrower/Tranche Description | | Value | |
| | | | | |
Forest Products (continued) | | | |
| | | | | |
| | Escanaba Timber, LLC | | | |
$ | 4,000,000 | | Term Loan, 6.75%, Maturing May 2, 2008 | | $ | 4,005,000 | |
| | Koch Cellulose, LLC | | | |
2,909,025 | | Term Loan, 5.36%, Maturing May 7, 2011 | | 2,945,993 | |
9,531,704 | | Term Loan, 5.77%, Maturing May 7, 2011 | | 9,648,867 | |
| | NewPage Corp. | | | |
10,000,000 | | Revolving Loan, 6.00%, Maturing May 2, 2010(2) | | 9,900,000 | |
17,705,625 | | Term Loan, 6.79%, Maturing May 2, 2011 | | 17,882,681 | |
| | RLC Industries Co. | | | |
21,228,525 | | Term Loan, 5.52%, Maturing February 24, 2010 | | 21,361,203 | |
| | Xerium Technologies, Inc. | | | |
2,000,000 | | Term Loan, 4.40%, Maturing May 18, 2012 | | EUR | 2,413,466 | |
10,264,295 | | Term Loan, 6.02%, Maturing May 18, 2012 | | 10,408,642 | |
| | | | $ | 120,981,117 | |
| | | | | |
Healthcare — 6.6% | | | |
| | | | | |
| | Alliance Imaging, Inc. | | | |
$ | 10,299,093 | | Term Loan, 6.41%, Maturing December 29, 2011 | | $ | 10,414,958 | |
| | AMN Healthcare, Inc. | | | |
3,194,288 | | Term Loan, 7.02%, Maturing October 2, 2008 | | 3,200,277 | |
| | AMR HoldCo, Inc. | | | |
9,308,225 | | Term Loan, 6.28%, Maturing February 10, 2012 | | 9,389,672 | |
| | Carl Zeiss Topco GMBH | | | |
3,140,000 | | Term Loan, 6.95%, Maturing February 28, 2013 | | 3,159,625 | |
6,280,000 | | Term Loan, 7.45%, Maturing February 28, 2014 | | 6,327,100 | |
375,000 | | Term Loan, 9.70%, Maturing August 31, 2014 | | 381,563 | |
| | Colgate Medical, Ltd. | | | |
3,129,342 | | Term Loan, 6.01%, Maturing December 30, 2008 | | 3,160,635 | |
| | Community Health Systems, Inc. | | | |
44,293,205 | | Term Loan, 5.61%, Maturing August 19, 2011 | | 44,906,843 | |
| | Concentra Operating Corp. | | | |
16,550,000 | | Term Loan, 6.05%, Maturing September 30, 2011 | | 16,762,055 | |
| | Conmed Corp. | | | |
4,478,475 | | Term Loan, 6.28%, Maturing December 31, 2007 | | 4,538,186 | |
| | CRC Health Corp. | | | |
2,493,750 | | Term Loan, 6.81%, Maturing May 12, 2011 | | 2,499,984 | |
| | Davita Inc. | | | |
50,185,784 | | Term Loan, 6.38%, Maturing October 5, 2012 | | 50,987,352 | |
| | Encore Medical IHC, Inc. | | | |
8,388,367 | | Term Loan, 6.62%, Maturing October 4, 2010 | | 8,482,736 | |
| | Envision Worldwide, Inc. | | | |
7,792,886 | | Term Loan, 9.01%, Maturing September 30, 2010 | | 7,831,851 | |
| | FHC Health Systems, Inc. | | | |
$ | 2,321,429 | | Term Loan, 9.87%, Maturing December 18, 2009 | | $ | 2,379,464 | |
1,625,000 | | Term Loan, 11.87%, Maturing December 18, 2009 | | 1,657,500 | |
3,250,000 | | Term Loan, 12.87%, Maturing February 7, 2011 | | 3,298,750 | |
| | Fisher Scientific International, Inc. | | | |
18,123,100 | | Term Loan, 5.52%, Maturing August 2, 2011 | | 18,259,023 | |
| | Genoa Healthcare Group, LLC | | | |
2,400,000 | | Term Loan, 7.23%, Maturing August 12, 2012 | | 2,434,500 | |
| | Hanger Orthopedic Group, Inc. | | | |
7,000,000 | | Revolving Loan, 0.00%, Maturing September 30, 2008(2) | | 6,877,500 | |
4,662,382 | | Term Loan, 7.75%, Maturing September 30, 2009 | | 4,738,146 | |
| | Healthcare Partners, LLC | | | |
4,689,750 | | Term Loan, 5.82%, Maturing March 2, 2011 | | 4,732,253 | |
| | Healthsouth Corp. | | | |
9,127,125 | | Term Loan, 6.53%, Maturing June 14, 2007 | | 9,181,322 | |
2,520,000 | | Term Loan, 3.55%, Maturing March 21, 2010 | | 2,534,964 | |
| | Iasis Healthcare, LLC | | | |
11,988,250 | | Term Loan, 6.30%, Maturing June 16, 2011 | | 12,166,827 | |
| | Kinetic Concepts, Inc. | | | |
10,812,119 | | Term Loan, 5.78%, Maturing August 11, 2010 | | 10,942,762 | |
| | Knowledge Learning Corp. | | | |
29,214,677 | | Term Loan, 6.59%, Maturing January 7, 2012 | | 29,372,932 | |
| | Leiner Health Products, Inc. | | | |
8,245,625 | | Term Loan, 7.70%, Maturing May 27, 2011 | | 8,240,471 | |
| | Lifecare Holdings, Inc. | | | |
9,250,000 | | Term Loan, 6.13%, Maturing August 11, 2012 | | 8,747,031 | |
| | Lifepoint Hospitals, Inc. | | | |
32,638,678 | | Term Loan, 5.44%, Maturing April 15, 2012 | | 32,880,563 | |
| | Magellan Health Services, Inc. | | | |
3,679,054 | | Term Loan, 3.76%, Maturing August 15, 2008 | | 3,720,443 | |
5,012,711 | | Term Loan, 5.87%, Maturing August 15, 2008 | | 5,069,104 | |
| | Medcath Holdings Corp. | | | |
3,742,600 | | Term Loan, 6.29%, Maturing July 2, 2011 | | 3,774,180 | |
| | National Mentor, Inc. | | | |
5,999,234 | | Term Loan, 6.25%, Maturing September 30, 2011 | | 6,074,225 | |
| | Renal Advantage, Inc. | | | |
2,350,000 | | Term Loan, 6.44%, Maturing October 5, 2012 | | 2,377,173 | |
| | Select Medical Holding Corp. | | | |
9,900,250 | | Term Loan, 5.57%, Maturing February 24, 2012 | | 9,918,130 | |
| | Sirona Dental Services GmbH | | | |
1,180,000 | | Term Loan, 4.61%, Maturing June 30, 2013 | | EUR | 1,430,865 | |
| | | | | | | | | |
See notes to financial statements
26
Principal | | | | | |
Amount | | Borrower/Tranche Description | | Value | |
| | | | | |
Healthcare (continued) | | | |
| | | | | |
| | Sirona Dental Systems GmbH | | | |
$ | 320,000 | | Term Loan, 4.61%, Maturing June 30, 2013 | | EUR | 388,031 | |
| | Sunrise Medical Holdings, Inc. | | | |
7,236,913 | | Term Loan, 7.12%, Maturing May 13, 2010 | | 7,245,959 | |
| | Sybron Dental Management, Inc. | | | |
5,062,957 | | Term Loan, 5.79%, Maturing June 6, 2009 | | 5,107,258 | |
| | Talecris Biotherapeutics, Inc. | | | |
7,596,825 | | Term Loan, 7.08%, Maturing March 31, 2010 | | 7,615,817 | |
| | Team Health, Inc. | | | |
6,413,663 | | Term Loan, 6.77%, Maturing March 23, 2011 | | 6,429,697 | |
| | The Cooper Companies, Inc. | | | |
5,472,500 | | Term Loan, 5.50%, Maturing November 15, 2009 | | 5,513,544 | |
| | Vanguard Health Holding Co., LLC | | | |
15,098,700 | | Term Loan, 6.21%, Maturing September 23, 2011 | | 15,315,744 | |
| | Ventiv Health, Inc. | | | |
3,650,000 | | Term Loan, 5.58%, Maturing October 5, 2011 | | 3,684,219 | |
| | VWR International, Inc. | | | |
3,000,000 | | Term Loan, 4.94%, Maturing April 7, 2011 | | EUR | 3,629,930 | |
9,432,967 | | Term Loan, 6.69%, Maturing April 7, 2011 | | 9,580,357 | |
| | | | $ | 427,361,521 | |
| | | | | |
Home Furnishings — 1.2% | | | |
| | | | | |
| | Interline Brands, Inc. | | | |
$ | 3,020,652 | | Term Loan, 6.27%, Maturing December 31, 2010 | | $ | 3,047,083 | |
| | Knoll, Inc. | | | |
10,355,000 | | Term Loan, 5.88%, Maturing October 3, 2012 | | 10,510,325 | |
| | National Bedding Company, LLC | | | |
4,802,962 | | Term Loan, 5.98%, Maturing August 31, 2011 | | 4,835,983 | |
| | Oreck Corp. | | | |
3,867,019 | | Term Loan, 6.78%, Maturing February 2, 2012 | | 3,881,520 | |
| | Sanitec Ltd. Oy | | | |
4,478,261 | | Term Loan, 4.89%, Maturing April 7, 2013 | | EUR | 5,228,282 | |
4,478,261 | | Term Loan, 5.39%, Maturing April 7, 2014 | | EUR | 5,251,733 | |
| | Sealy Mattress Co. | | | |
5,000,000 | | Revolving Loan, 0.00%, Maturing April 6, 2012(2) | | 4,900,000 | |
18,950,002 | | Term Loan, 5.73%, Maturing April 6, 2012 | | 19,145,434 | |
| | Simmons Co. | | | |
21,842,308 | | Term Loan, 5.96%, Maturing December 19, 2011 | | 22,106,229 | |
| | | | $ | 78,906,589 | |
| | | | | |
Industrial Equipment — 1.3% | | | |
| | | | | |
| | Alliance Laundry Holdings, LLC | | | |
$ | 4,160,750 | | Term Loan, 6.14%, Maturing January 27, 2012 | | $ | 4,221,863 | |
| | Colfax Corp. | | | |
2,033,359 | | Term Loan, 6.31%, Maturing May 30, 2009 | | 2,054,115 | |
| | Douglas Dynamics Holdings, Inc. | | | |
4,774,992 | | Term Loan, 6.02%, Maturing December 16, 2010 | | 4,834,679 | |
| | Flowserve Corp. | | | |
14,715,000 | | Term Loan, 5.81%, Maturing August 10, 2012 | | 14,931,134 | |
| | Gleason Corp. | | | |
6,705,953 | | Term Loan, 6.74%, Maturing July 27, 2011 | | 6,789,778 | |
746,250 | | Term Loan, 9.42%, Maturing January 31, 2012 | | 759,309 | |
| | GSCP Athena (Finnish) Holdings | | | |
7,000,000 | | Term Loan, 4.62%, Maturing August 31, 2013 | | EUR | 8,408,950 | |
6,391,304 | | Term Loan, 5.12%, Maturing August 31, 2014 | | EUR | 7,745,133 | |
| | Heating Finance PLC (Baxi) | | | |
3,253,597 | | Term Loan, 0.00%, Maturing December 27, 2010(2) | | EUR | 3,906,738 | |
3,246,560 | | Term Loan, 6.61%, Maturing December 27, 2010 | | GBP | 5,749,137 | |
| | Itron, Inc. | | | |
1,388,602 | | Term Loan, 5.85%, Maturing December 17, 2010 | | 1,399,884 | |
| | Mainline, L.P. | | | |
7,720,000 | | Term Loan, 6.30%, Maturing December 17, 2011 | | 7,835,800 | |
| | MTD Products, Inc. | | | |
10,882,461 | | Term Loan, 5.63%, Maturing June 1, 2010 | | 10,984,485 | |
| | Pirelli Kabel UND Systems Hold | | | |
608,696 | | Term Loan, 5.12%, Maturing August 31, 2014 | | EUR | 734,858 | |
| | Terex Corp. | | | |
1,593,087 | | Term Loan, 6.41%, Maturing June 30, 2009 | | 1,615,987 | |
| | | | $ | 81,971,850 | |
| | | | | |
Insurance — 0.9% | | | |
| | | | | |
| | Alliant Resources Group, Inc. | | | |
$ | 6,665,625 | | Term Loan, 7.58%, Maturing August 31, 2011 | | $ | 6,715,617 | |
| | CCC Information Services Group, Inc. | | | |
8,134,007 | | Term Loan, 6.83%, Maturing August 20, 2010 | | 8,154,342 | |
| | Conseco, Inc. | | | |
17,207,161 | | Term Loan, 5.97%, Maturing June 22, 2010 | | 17,433,005 | |
| | Hilb, Rogal & Hobbs Co. | | | |
13,735,113 | | Term Loan, 6.31%, Maturing June 30, 2007 | | 13,898,217 | |
| | U.S.I. Holdings Corp. | | | |
6,827,727 | | Term Loan, 6.74%, Maturing August 11, 2008 | | 6,857,598 | |
7,726,613 | | Term Loan, 6.74%, Maturing August 11, 2008 | | 7,760,416 | |
| | | | $ | 60,819,195 | |
| | | | | | | | | | |
See notes to financial statements
27
Principal | | | | | |
Amount | | Borrower/Tranche Description | | Value | |
| | | | | |
Leisure Goods/Activities/Movies — 4.9% | | | |
| | | | | |
| | 24 Hour Fitness Worldwide, Inc. | | | |
$ | 11,530,000 | | Term Loan, 6.78%, Maturing June 8, 2012 | | $ | 11,724,569 | |
| | Alliance Atlantis Communications, Inc. | | | |
6,568,990 | | Term Loan, 5.83%, Maturing December 31, 2011 | | 6,628,525 | |
| | AMF Bowling Worldwide, Inc. | | | |
5,253,343 | | Term Loan, 6.76%, Maturing August 27, 2009 | | 5,300,954 | |
| | Carmike Cinemas, Inc. | | | |
7,015,000 | | Term Loan, 0.00%, Maturing May 19, 2012(2) | | 6,966,772 | |
10,493,700 | | Term Loan, 6.39%, Maturing May 19, 2012 | | 10,519,934 | |
| | Cinemark, Inc. | | | |
20,194,969 | | Term Loan, 5.43%, Maturing March 31, 2011 | | 20,457,503 | |
| | Fender Musical Instruments Co. | | | |
2,487,500 | | Term Loan, 6.47%, Maturing March 30, 2012 | | 2,512,375 | |
| | Lions Gate Entertainment, Inc. | | | |
1,022,500 | | Revolving Loan, 0.00%, Maturing December 31, 2008(2) | | 1,007,163 | |
| | Loews Cineplex Entertainment Corp. | | | |
29,105,800 | | Term Loan, 6.17%, Maturing July 30, 2011 | | 29,296,821 | |
| | Metro-Goldwyn-Mayer Holdings, Inc. | | | |
4,076,923 | | Term Loan, 6.27%, Maturing April 8, 2011 | | 4,113,444 | |
63,315,000 | | Term Loan, 6.27%, Maturing April 8, 2012 | | 63,928,396 | |
| | New England Sports Ventures | | | |
10,585,000 | | Term Loan, 4.96%, Maturing February 27, 2007 | | 10,585,000 | |
| | Red Football, Ltd. | | | |
4,048,025 | | Term Loan, 7.35%, Maturing May 11, 2012 | | GBP | 7,237,676 | |
2,750,000 | | Term Loan, 7.85%, Maturing May 11, 2013 | | GBP | 4,941,210 | |
2,750,000 | | Term Loan, 8.35%, Maturing May 11, 2014 | | GBP | 4,965,551 | |
| | Regal Cinemas Corp. | | | |
44,324,940 | | Term Loan, 6.02%, Maturing November 10, 2010 | | 44,840,927 | |
| | Riddell Bell Holdings, Inc. | | | |
2,475,000 | | Term Loan, 6.16%, Maturing September 30, 2011 | | 2,515,219 | |
| | Six Flags Theme Parks, Inc. | | | |
3,275,000 | | Revolving Loan, 6.72%, Maturing June 30, 2008(2) | | 3,240,884 | |
25,779,133 | | Term Loan, 6.71%, Maturing June 30, 2009 | | 26,096,757 | |
| | Universal City Development Partners, Ltd. | | | |
15,408,563 | | Term Loan, 6.01%, Maturing June 9, 2011 | | 15,623,635 | |
| | WMG Acquisition Corp. | | | |
4,390,000 | | Revolving Loan, 0.00%, Maturing February 28, 2010(2) | | 4,276,137 | |
30,280,828 | | Term Loan, 5.85%, Maturing February 28, 2011 | | 30,624,637 | |
| | Yankees Holdings & YankeeNets, LLC | | | |
2,935,429 | | Term Loan, 6.36%, Maturing June 25, 2007 | | 2,964,783 | |
| | | | $ | 320,368,872 | |
| | | | | |
Lodging and Casinos — 4.2% | | | |
| | | | | |
| | Alliance Gaming Corp. | | | |
$ | 14,625,852 | | Term Loan, 6.77%, Maturing September 5, 2009 | | $ | 14,625,852 | |
| | Ameristar Casinos, Inc. | | | |
6,262,299 | | Term Loan, 6.06%, Maturing December 31, 2006 | | 6,301,438 | |
2,893,524 | | Term Loan, 6.06%, Maturing December 31, 2006 | | 2,911,609 | |
| | Aztar Corp. | | | |
1,975,000 | | Term Loan, 5.41%, Maturing July 27, 2009 | | 1,983,641 | |
| | Boyd Gaming Corp. | | | |
25,156,563 | | Term Loan, 5.61%, Maturing June 30, 2011 | | 25,486,742 | |
| | CCM Merger, Inc. | | | |
8,184,488 | | Term Loan, 5.93%, Maturing April 25, 2012 | | 8,263,779 | |
3,000,000 | | Term Loan, 0.00%, Maturing April 25, 2012(2) | | 3,030,000 | |
| | Choctaw Resort Development Enterprise | | | |
4,417,617 | | Term Loan, 5.92%, Maturing November 4, 2011 | | 4,470,077 | |
| | CNL Resort Hotel, L.P. | | | |
7,700,000 | | Term Loan, 7.44%, Maturing August 18, 2006 | | 7,719,250 | |
| | Globalcash Access, LLC | | | |
3,441,658 | | Term Loan, 6.33%, Maturing March 10, 2010 | | 3,494,360 | |
| | Green Valley Ranch Gaming, LLC | | | |
2,504,936 | | Term Loan, 6.02%, Maturing December 17, 2011 | | 2,540,944 | |
| | Herbst Gaming, Inc. | | | |
3,213,850 | | Term Loan, 6.20%, Maturing January 31, 2011 | | 3,256,032 | |
| | Isle of Capri Blackhawk, LLC | | | |
250,000 | | Term Loan, 6.19%, Maturing October 24, 2011 | | 252,344 | |
| | Isle of Capri Casinos, Inc. | | | |
4,987,500 | | Term Loan, 5.49%, Maturing February 4, 2012 | | 5,003,086 | |
15,507,813 | | Term Loan, 5.84%, Maturing February 4, 2012 | | 15,689,549 | |
| | Marina District Finance Co., Inc. | | | |
15,631,875 | | Term Loan, 5.91%, Maturing October 14, 2011 | | 15,762,135 | |
| | MGM Mirage | | | |
6,821,429 | | Term Loan, 5.13%, Maturing April 25, 2010 | | 6,848,837 | |
17,678,571 | | Revolving Loan, 5.35%, Maturing April 25, 2010(2) | | 17,236,607 | |
| | Penn National Gaming, Inc. | | | |
48,074,667 | | Term Loan, 6.08%, Maturing October 3, 2012 | | 48,735,694 | |
| | Pinnacle Entertainment, Inc. | | | |
2,500,000 | | Revolving Loan, 0.00%, Maturing December 18, 2008(2) | | 2,506,250 | |
4,302,116 | | Term Loan, 7.04%, Maturing August 27, 2010 | | 4,355,892 | |
240,000 | | Term Loan, 7.09%, Maturing August 27, 2010 | | 242,700 | |
| | Resorts International Holdings, LLC | | | |
10,488,632 | | Term Loan, 6.53%, Maturing April 26, 2012 | | 10,506,987 | |
3,500,000 | | Term Loan, 10.27%, Maturing April 26, 2013 | | 3,470,471 | |
| | | | | | | | |
See notes to financial statements
28
Principal | | | | | |
Amount | | Borrower/Tranche Description | | Value | |
| | | | | |
Lodging and Casinos (continued) | | | |
| | | | | |
| | Trump Entertainment Resorts Holdings, L.P. | | | |
$ | 5,475,000 | | Term Loan, 0.00%, Maturing May 20, 2012(2) | | $ | 5,538,877 | |
5,461,313 | | Term Loan, 6.14%, Maturing May 20, 2012 | | 5,525,030 | |
| | Venetian Casino Resort, LLC | | | |
24,400,219 | | Term Loan, 5.77%, Maturing June 15, 2011 | | 24,630,874 | |
5,947,617 | | Term Loan, 5.77%, Maturing June 15, 2011 | | 6,003,839 | |
| | Wyndham International, Inc. | | | |
7,000,000 | | Revolving Loan, 0.00%, Maturing May 10, 2011(2) | | 6,965,000 | |
| | Wynn Las Vegas, LLC | | | |
10,725,000 | | Term Loan, 6.19%, Maturing December 14, 2011 | | 10,852,359 | |
| | | | $ | 274,210,255 | |
| | | | | |
Nonferrous Metals/Minerals — 2.2% | | | |
| | | | | |
| | Carmeuse Lime, Inc. | | | |
$ | 6,873,750 | | Term Loan, 6.00%, Maturing May 2, 2011 | | $ | 6,925,303 | |
| | CII Carbon, LLC | | | |
3,640,875 | | Term Loan, 6.19%, Maturing August 23, 2012 | | 3,656,804 | |
| | Compass Minerals Group, Inc. | | | |
472,264 | | Term Loan, 6.47%, Maturing November 28, 2009 | | 474,232 | |
| | Foundation Coal Corp. | | | |
13,500,000 | | Revolving Loan, 0.00%, Maturing July 30, 2009(2) | | 13,432,500 | |
10,950,000 | | Term Loan, 5.85%, Maturing July 30, 2011 | | 11,145,425 | |
| | ICG, LLC | | | |
10,349,125 | | Term Loan, 6.69%, Maturing November 5, 2010 | | 10,418,123 | |
| | International Mill Service, Inc. | | | |
15,557,438 | | Term Loan, 6.84%, Maturing December 31, 2010 | | 15,713,012 | |
3,000,000 | | Term Loan, 10.09%, Maturing October 26, 2011 | | 3,045,000 | |
| | Murray Energy Corp. | | | |
10,905,200 | | Term Loan, 6.86%, Maturing January 28, 2010 | | 10,980,173 | |
| | Novelis, Inc. | | | |
11,460,607 | | Term Loan, 5.46%, Maturing January 6, 2012 | | 11,597,595 | |
16,817,168 | | Term Loan, 5.46%, Maturing January 6, 2012 | | 17,018,184 | |
| | Severstal North America, Inc. | | | |
15,200,000 | | Revolving Loan, 5.61%, Maturing April 7, 2007(2) | | 15,162,000 | |
| | Stillwater Mining Co. | | | |
4,360,000 | | Revolving Loan, 4.08%, Maturing June 30, 2007(2) | | 4,316,400 | |
6,664,628 | | Term Loan, 7.38%, Maturing June 30, 2007 | | 6,797,920 | |
| | Trout Coal Holdings, LLC | | | |
13,106,569 | | Term Loan, 6.55%, Maturing March 23, 2011 | | 13,180,293 | |
| | | | $ | 143,862,964 | |
| | | | | |
Oil and Gas — 3.9% | | | |
| | | | | |
| | Coffeyville Resources, LLC | | | |
$ | 1,600,000 | | Term Loan, 3.87%, Maturing June 24, 2011 | | $ | 1,628,000 | |
2,394,000 | | Term Loan, 6.57%, Maturing June 24, 2012 | | 2,435,895 | |
| | Columbia Natural Resources, LLC | | | |
41,250,000 | | Revolving Loan, 5.65%, Maturing January 19, 2010(2) | | 41,198,438 | |
| | Dresser, Inc. | | | |
5,485,881 | | Term Loan, 6.59%, Maturing March 31, 2007 | | 5,540,740 | |
| | Dynegy Holdings, Inc. | | | |
5,000,000 | | Revolving Loan, 0.00%, Maturing May 28, 2009(2) | | 4,983,750 | |
| | El Paso Corp. | | | |
10,000,000 | | Revolving Loan, 0.00%, Maturing November 23, 2007(2) | | 9,925,000 | |
13,019,875 | | Term Loan, 5.27%, Maturing November 23, 2009 | | 13,116,626 | |
22,077,069 | | Term Loan, 6.81%, Maturing November 23, 2009 | | 22,268,720 | |
| | Epco Holdings, Inc. | | | |
4,333,334 | | Revolving Loan, 6.26%, Maturing August 18, 2008(2) | | 4,257,501 | |
8,666,666 | | Term Loan, 6.42%, Maturing August 18, 2008 | | 8,751,530 | |
9,155,000 | | Term Loan, 6.42%, Maturing August 18, 2010 | | 9,285,788 | |
| | Kerr-McGee Corp. | | | |
11,462,500 | | Term Loan, 6.26%, Maturing May 24, 2007 | | 11,495,248 | |
29,695,575 | | Term Loan, 6.51%, Maturing May 24, 2011 | | 29,832,917 | |
| | Key Energy Services, Inc. | | | |
8,570,000 | | Term Loan, 7.01%, Maturing June 30, 2012(2) | | 8,703,906 | |
| | LB Pacific, L.P. | | | |
8,049,550 | | Term Loan, 6.80%, Maturing March 3, 2012 | | 8,200,479 | |
| | Lyondell-Citgo Refining, L.P. | | | |
13,548,525 | | Term Loan, 5.51%, Maturing May 21, 2007 | | 13,751,753 | |
| | Sprague Energy Corp. | | | |
4,022,727 | | Term Loan, 0.00%, Maturing October 5, 2010(2) | | 4,012,670 | |
2,681,818 | | Term Loan, 0.00%, Maturing October 5, 2010(2) | | 2,675,114 | |
22,795,455 | | Revolving Loan, 5.75%, Maturing October 5, 2010(2) | | 22,738,466 | |
| | Universal Compression, Inc. | | | |
8,019,700 | | Term Loan, 5.59%, Maturing February 15, 2012 | | 8,119,946 | |
| | Williams Production RMT Co. | | | |
19,921,942 | | Term Loan, 6.20%, Maturing May 30, 2008 | | 20,189,653 | |
| | | | $ | 253,112,140 | |
See notes to financial statements
29
Principal | | | | | |
Amount | | Borrower/Tranche Description | | Value | |
| | | | | |
Publishing — 5.6% | | | |
| | | | | |
| | American Media Operations, Inc. | | | |
$ | 38,438 | | Term Loan, 7.06%, Maturing April 1, 2006 | | $ | 38,630 | |
3,188,859 | | Term Loan, 6.81%, Maturing April 1, 2007 | | 3,227,390 | |
18,124,920 | | Term Loan, 6.81%, Maturing April 1, 2008 | | 18,343,923 | |
| | CBD Media, LLC | | | |
9,145,905 | | Term Loan, 6.44%, Maturing December 31, 2009 | | 9,283,094 | |
| | Dex Media East, LLC | | | |
9,653,395 | | Term Loan, 5.78%, Maturing May 8, 2009 | | 9,709,955 | |
| | Dex Media West, LLC | | | |
17,239,889 | | Term Loan, 5.75%, Maturing March 9, 2010 | | 17,342,845 | |
| | Freedom Communications | | | |
12,062,317 | | Term Loan, 5.38%, Maturing May 18, 2012 | | 12,173,894 | |
| | Herald Media, Inc. | | | |
4,128,016 | | Term Loan, 6.78%, Maturing July 22, 2011 | | 4,156,396 | |
748,750 | | Term Loan, 9.78%, Maturing January 22, 2012 | | 758,577 | |
| | Journal Register Co. | | | |
34,349,600 | | Term Loan, 5.69%, Maturing August 12, 2012 | | 34,666,269 | |
| | Liberty Group Operating, Inc. | | | |
9,958,271 | | Term Loan, 6.19%, Maturing February 28, 2012 | | 10,059,925 | |
| | Medianews Group, Inc. | | | |
12,286,984 | | Term Loan, 5.34%, Maturing August 25, 2010 | | 12,330,505 | |
| | Merrill Communications, LLC | | | |
16,658,948 | | Term Loan, 6.58%, Maturing February 9, 2009 | | 16,882,811 | |
| | Morris Publishing Group, LLC | | | |
4,042,500 | | Term Loan, 5.56%, Maturing September 30, 2010 | | 4,086,717 | |
6,252,750 | | Term Loan, 5.81%, Maturing March 31, 2011 | | 6,284,014 | |
| | Nebraska Book Co., Inc. | | | |
11,362,074 | | Term Loan, 6.70%, Maturing March 4, 2011 | | 11,461,493 | |
| | Newspaper Holdings, Inc. | | | |
5,181,818 | | Revolving Loan, 5.81%, Maturing August 24, 2011(2) | | 5,149,432 | |
11,628,182 | | Term Loan, 5.81%, Maturing August 24, 2011 | | 11,628,182 | |
| | R.H. Donnelley Corp. | | | |
2,543,448 | | Term Loan, 5.81%, Maturing December 31, 2009 | | 2,561,067 | |
40,365,560 | | Term Loan, 5.70%, Maturing June 30, 2011 | | 40,683,842 | |
| | Retos Cartera, SA | | | |
1,000,000 | | Term Loan, 4.65%, Maturing March 15, 2013 | | EUR | 1,208,979 | |
1,000,000 | | Term Loan, 5.15%, Maturing March 15, 2014 | | EUR | 1,212,722 | |
| | Seat Pagine Gialle Spa | | | |
14,750,000 | | Term Loan, 4.49%, Maturing May 25, 2012 | | EUR | 17,836,149 | |
| | Siegwerk Druckfarben AG | | | |
2,625,000 | | Term Loan, 4.88%, Maturing September 8, 2013 | | EUR | 3,175,535 | |
2,625,000 | | Term Loan, 5.38%, Maturing September 8, 2014 | | EUR | 3,188,636 | |
| | Source Media, Inc. | | | |
$ | 12,337,641 | | Term Loan, 6.27%, Maturing November 8, 2011 | | $ | 12,514,994 | |
| | SP Newsprint Co. | | | |
8,463,065 | | Term Loan, 4.03%, Maturing January 9, 2010 | | 8,600,590 | |
3,449,125 | | Term Loan, 6.53%, Maturing January 9, 2010 | | 3,505,173 | |
| | Springer Science+Business Media | | | |
3,650,000 | | Term Loan, 5.99%, Maturing May 5, 2010 | | 3,654,336 | |
3,097,232 | | Term Loan, 7.12%, Maturing September 15, 2011 | | 3,121,914 | |
3,355,335 | | Term Loan, 7.62%, Maturing May 5, 2012 | | 3,406,715 | |
3,097,232 | | Term Loan, 7.62%, Maturing May 5, 2012 | | 3,133,529 | |
| | Sun Media Corp. | | | |
9,153,085 | | Term Loan, 6.24%, Maturing February 7, 2009 | | 9,256,058 | |
| | World Directories ACQI Corp. | | | |
1,500,000 | | Term Loan, 4.88%, Maturing November 29, 2012 | | EUR | 1,808,262 | |
7,006,198 | | Term Loan, 5.38%, Maturing November 29, 2013 | | EUR | 8,473,685 | |
| | Xerox Corp. | | | |
12,750,000 | | Term Loan, 5.83%, Maturing September 30, 2008 | | 12,877,500 | |
| | Xsys US, Inc. | | | |
254,462 | | Term Loan, 4.72%, Maturing September 27, 2013 | | EUR | 308,211 | |
2,495,538 | | Term Loan, 4.72%, Maturing September 27, 2013 | | EUR | 3,022,657 | |
7,701,575 | | Term Loan, 6.77%, Maturing September 27, 2013 | | 7,768,963 | |
2,750,000 | | Term Loan, 5.22%, Maturing September 27, 2014 | | EUR | 3,347,337 | |
7,866,565 | | Term Loan, 7.27%, Maturing September 27, 2014 | | 7,984,563 | |
| | YBR Acquisition BV | | | |
6,000,000 | | Term Loan, 4.68%, Maturing June 30, 2013 | | EUR | 7,280,737 | |
6,000,000 | | Term Loan, 5.18%, Maturing June 30, 2014 | | EUR | 7,316,130 | |
| | | | $ | 364,832,336 | |
| | | | | |
Radio and Television — 4.3% | | | |
| | | | | |
| | Adams Outdoor Advertising, L.P. | | | |
$ | 18,202,821 | | Term Loan, 6.20%, Maturing November 18, 2012 | | $ | 18,475,863 | |
| | ALM Media Holdings, Inc. | | | |
8,009,750 | | Term Loan, 6.52%, Maturing March 5, 2010 | | 8,023,102 | |
| | Block Communications, Inc. | | | |
4,860,012 | | Term Loan, 6.27%, Maturing November 30, 2009 | | 4,905,575 | |
| | DirecTV Holdings, LLC | | | |
27,680,000 | | Term Loan, 5.43%, Maturing April 13, 2013 | | 27,956,800 | |
| | Emmis Operating Co. | | | |
34,836,750 | | Term Loan, 5.72%, Maturing November 10, 2011 | | 35,121,993 | |
| | Entravision Communications Corp. | | | |
9,100,000 | | Term Loan, 5.55%, Maturing September 29, 2013 | | 9,179,625 | |
| | Gray Television, Inc. | | | |
5,416,425 | | Term Loan, 5.35%, Maturing December 31, 2012 | | 5,445,202 | |
| | | | | | | | |
See notes to financial statements
30
Principal | | | | | |
Amount | | Borrower/Tranche Description | | Value | |
| | | | | |
Radio and Television (continued) | | | |
| | | | | |
| | Hanley-Wood, LLC | | | |
$ | 1,014,570 | | Term Loan, 1.13%, Maturing August 1, 2012(2) | | $ | 1,018,374 | |
8,560,430 | | Term Loan, 6.14%, Maturing August 1, 2012 | | 8,592,532 | |
| | NEP Supershooters, L.P. | | | |
5,049,000 | | Term Loan, 7.88%, Maturing February 3, 2011 | | 5,118,424 | |
2,977,500 | | Term Loan, 8.02%, Maturing February 3, 2011 | | 3,012,858 | |
| | Nexstar Broadcasting, Inc. | | | |
12,782,232 | | Term Loan, 5.77%, Maturing October 1, 2012 | | 12,872,769 | |
13,011,676 | | Term Loan, 5.77%, Maturing October 1, 2012 | | 13,103,838 | |
| | PanAmSat Corp. | | | |
1,386,365 | | Term Loan, 5.78%, Maturing August 20, 2010 | | 1,401,568 | |
724,889 | | Term Loan, 5.78%, Maturing August 20, 2010 | | 732,838 | |
27,189,439 | | Term Loan, 5.86%, Maturing August 20, 2011 | | 27,571,804 | |
| | Patriot Media and Communications CNJ, Inc. | | | |
500,000 | | Term Loan, 6.31%, Maturing February 6, 2013 | | 507,032 | |
| | Rainbow National Services, LLC | | | |
5,000,000 | | Revolving Loan, 0.00%, Maturing March 31, 2010(2) | | 4,987,500 | |
15,124,585 | | Term Loan, 6.63%, Maturing March 31, 2012 | | 15,280,565 | |
| | Raycom TV Broadcasting, Inc. | | | |
18,350,000 | | Term Loan, 6.06%, Maturing February 24, 2012 | | 18,487,625 | |
| | Spanish Broadcasting System | | | |
12,412,625 | | Term Loan, 6.03%, Maturing June 10, 2012 | | 12,598,814 | |
| | Susquehanna Media Co. | | | |
16,716,000 | | Term Loan, 5.98%, Maturing March 31, 2012 | | 16,815,260 | |
| | TDF SA | | | |
4,151,899 | | Term Loan, 4.42%, Maturing March 11, 2013 | | EUR | 5,038,321 | |
4,151,899 | | Term Loan, 5.17%, Maturing March 11, 2014 | | EUR | 5,055,736 | |
4,661,720 | | Term Loan, 5.79%, Maturing March 11, 2015 | | EUR | 5,690,015 | |
| | Telewest Global Finance, LLC | | | |
2,915,000 | | Term Loan, 6.15%, Maturing December 22, 2012 | | 2,940,506 | |
2,225,000 | | Term Loan, 6.90%, Maturing December 22, 2013 | | 2,233,807 | |
| | Young Broadcasting, Inc. | | | |
8,563,538 | | Term Loan, 5.77%, Maturing November 3, 2012 | | 8,636,687 | |
| | | | $ | 280,805,033 | |
| | | | | |
Rail Industries — 0.6% | | | |
| | | | | |
| | Kansas City Southern Industries, Inc. | | | |
$ | 14,263,342 | | Term Loan, 5.34%, Maturing March 30, 2008 | | $ | 14,410,439 | |
| | Railamerica, Inc. | | | |
2,268,664 | | Term Loan, 5.88%, Maturing September 29, 2011 | | 2,308,365 | |
19,191,665 | | Term Loan, 5.90%, Maturing September 29, 2011 | | 19,527,519 | |
| | | | $ | 36,246,323 | |
| | | | | |
Retailers (Except Food and Drug) — 3.2% | | | |
| | | | | |
| | Advance Stores Company, Inc. | | | |
$ | 9,519,494 | | Term Loan, 5.38%, Maturing September 30, 2010 | | $ | 9,656,336 | |
11,094,511 | | Term Loan, 5.91%, Maturing September 30, 2010 | | 11,253,995 | |
| | Alimentation Couche-Tard, Inc. | | | |
5,483,087 | | Term Loan, 5.69%, Maturing December 17, 2010 | | 5,551,625 | |
| | American Achievement Corp. | | | |
8,144,796 | | Term Loan, 6.52%, Maturing March 25, 2011 | | 8,185,520 | |
| | Amscan Holdings, Inc. | | | |
7,702,500 | | Term Loan, 6.72%, Maturing April 30, 2012 | | 7,750,641 | |
| | Coinmach Laundry Corp. | | | |
15,373,563 | | Term Loan, 6.97%, Maturing July 25, 2009 | | 15,594,558 | |
| | FTD, Inc. | | | |
7,863,164 | | Term Loan, 6.19%, Maturing February 28, 2011 | | 7,976,197 | |
| | Harbor Freight Tools USA, Inc. | | | |
16,612,399 | | Term Loan, 6.30%, Maturing July 15, 2010 | | 16,828,360 | |
| | Home Interiors & Gifts, Inc. | | | |
3,796,255 | | Term Loan, 9.09%, Maturing March 31, 2011 | | 3,487,809 | |
| | Josten’s Corp. | | | |
4,000,000 | | Revolving Loan, 0.00%, Maturing October 4, 2009(2) | | 3,895,000 | |
1,200,000 | | Term Loan, 6.44%, Maturing October 4, 2010 | | 1,206,750 | |
26,387,131 | | Term Loan, 5.94%, Maturing October 4, 2011 | | 26,828,298 | |
| | Mapco Express, Inc. | | | |
4,025,910 | | Term Loan, 8.50%, Maturing April 28, 2011 | | 4,078,750 | |
| | Movie Gallery, Inc. | | | |
7,750,575 | | Term Loan, 7.83%, Maturing April 27, 2011 | | 7,596,370 | |
| | Musicland Group, Inc. | | | |
12,000,000 | | Revolving Loan, 8.47%, Maturing August 11, 2008(2) | | 12,030,000 | |
| | Neiman Marcus Group, Inc. | | | |
6,750,000 | | Term Loan, 6.48%, Maturing April 5, 2013 | | 6,793,875 | |
| | Oriental Trading Co., Inc. | | | |
11,541,620 | | Term Loan, 6.31%, Maturing August 4, 2010 | | 11,606,542 | |
| | Petro Stopping Center, L.P. | | | |
531,250 | | Term Loan, 5.94%, Maturing February 9, 2007 | | 537,891 | |
| | Rent-A-Center, Inc. | | | |
18,359,675 | | Term Loan, 5.46%, Maturing June 30, 2010 | | 18,586,876 | |
| | Savers, Inc. | | | |
3,719,443 | | Term Loan, 7.65%, Maturing August 4, 2009 | | 3,751,988 | |
| | Stewert Enterprises, Inc. | | | |
3,686,173 | | Term Loan, 5.60%, Maturing November 19, 2011 | | 3,734,554 | |
| | Travelcenters of America, Inc. | | | |
21,210,000 | | Term Loan, 5.71%, Maturing November 30, 2008 | | 21,461,869 | |
| | | | $ | 208,393,804 | |
| | | | | | | | |
See notes to financial statements
31
Principal | | | | | |
Amount | | Borrower/Tranche Description | | Value | |
| | | | | |
Surface Transport — 0.3% | | | |
| | | | | |
| | Horizon Lines, LLC | | | |
$ | 5,826,250 | | Term Loan, 6.27%, Maturing July 7, 2011 | | $ | 5,917,285 | |
| | Sirva Worldwide, Inc. | | | |
10,658,823 | | Term Loan, 7.53%, Maturing December 1, 2010 | | 10,248,459 | |
| | Transport Industries, L.P. | | | |
642,857 | | Term Loan, 0.00%, Maturing September 30, 2011(2) | | 648,884 | |
3,357,143 | | Term Loan, 6.56%, Maturing September 30, 2011 | | 3,388,616 | |
| | | | $ | 20,203,244 | |
| | | | | |
Telecommunications — 4.0% | | | |
| | | | | |
| | AAT Communications Corp. | | | |
$ | 2,600,000 | | Term Loan, 5.61%, Maturing July 29, 2012 | | $ | 2,636,564 | |
| | Alaska Communications Systems Holdings, Inc. | | | |
17,150,000 | | Term Loan, 6.02%, Maturing February 11, 2012 | | 17,398,675 | |
| | Cellular South, Inc. | | | |
6,292,551 | | Term Loan, 5.94%, Maturing May 4, 2011 | | 6,359,409 | |
| | Centennial Cellular Operating Co., LLC | | | |
3,247,159 | | Revolving Loan, 0.00%, Maturing February 9, 2010(2) | | 3,157,862 | |
1,252,841 | | Revolving Loan, 0.00%, Maturing February 9, 2010(2) | | 1,218,388 | |
17,351,532 | | Term Loan, 6.34%, Maturing February 9, 2011 | | 17,489,407 | |
| | Cincinnati Bell, Inc. | | | |
4,425,000 | | Term Loan, 5.38%, Maturing August 31, 2012 | | 4,455,422 | |
| | Consolidated Communications, Inc. | | | |
17,442,901 | | Term Loan, 6.17%, Maturing July 27, 2015 | | 17,682,741 | |
| | D&E Communications, Inc. | | | |
5,716,273 | | Term Loan, 5.86%, Maturing December 31, 2011 | | 5,766,290 | |
| | Fairpoint Communications, Inc. | | | |
21,785,000 | | Term Loan, 5.81%, Maturing February 8, 2012 | | 22,032,804 | |
| | Hawaiian Telcom Communications, Inc. | | | |
5,175,000 | | Term Loan, 6.28%, Maturing October 31, 2012 | | 5,238,880 | |
| | Intelsat, Ltd. | | | |
14,596,827 | | Term Loan, 5.81%, Maturing July 28, 2011 | | 14,748,882 | |
| | Iowa Telecommunications Services | | | |
7,998,000 | | Term Loan, 5.71%, Maturing November 23, 2011 | | 8,089,225 | |
| | IPC Acquisition Corp. | | | |
2,711,691 | | Term Loan, 6.83%, Maturing August 5, 2011 | | 2,727,508 | |
| | Madison River Capital, LLC | | | |
3,660,000 | | Term Loan, 6.59%, Maturing July 29, 2012 | | 3,714,139 | |
| | Nextel Partners Operation Corp. | | | |
24,265,000 | | Term Loan, 5.37%, Maturing May 31, 2012 | | 24,398,967 | |
| | NTelos, Inc. | | | |
$ | 11,210,287 | | Term Loan, 6.53%, Maturing February 18, 2011 | | $ | 11,308,378 | |
| | Qwest Corp. | | | |
14,756,000 | | Term Loan, 8.53%, Maturing June 4, 2007 | | 15,238,639 | |
| | Satbirds Finance SARL | | | |
3,000,000 | | Term Loan, 4.59%, Maturing April 4, 2012 | | EUR | 3,576,800 | |
3,500,000 | | Term Loan, 5.09%, Maturing April 4, 2013 | | EUR | 4,193,173 | |
3,500,000 | | Term Loan, 5.09%, Maturing April 4, 2013 | | EUR | 4,193,173 | |
| | SBA Senior Finance, Inc. | | | |
13,157,687 | | Term Loan, 7.88%, Maturing October 31, 2008 | | 13,209,765 | |
| | Stratos Global Corp. | | | |
5,042,000 | | Term Loan, 6.27%, Maturing December 3, 2010 | | 5,059,334 | |
| | Syniverse Holdings, Inc. | | | |
3,724,487 | | Term Loan, 6.03%, Maturing February 15, 2012 | | 3,768,715 | |
| | Triton PCS, Inc. | | | |
15,101,795 | | Term Loan, 7.34%, Maturing November 18, 2009 | | 15,255,169 | |
| | Valor Telecom Enterprise, LLC | | | |
6,300,000 | | Revolving Loan, 0.00%, Maturing February 14, 2011(2) | | 6,385,497 | |
14,838,333 | | Term Loan, 5.80%, Maturing February 14, 2012 | | 15,039,704 | |
| | Westcom Corp. | | | |
4,794,219 | | Term Loan, 6.99%, Maturing December 17, 2010 | | 4,827,179 | |
| | Winstar Communications, Inc. | | | |
127,026 | | DIP Loan, 0.00%, Maturing December 31, 2005(3)(4) | | 47,000 | |
| | | | $ | 259,217,689 | |
| | | | | |
Utilities — 2.6% | | | |
| | | | | |
| | Allegheny Energy Supply Co., LLC | | | |
$ | 17,380,600 | | Term Loan, 5.79%, Maturing March 8, 2011 | | $ | 17,589,167 | |
| | Cellnet Technology, Inc. | | | |
4,004,963 | | Term Loan, 7.17%, Maturing April 26, 2012 | | 4,035,000 | |
| | Cogentrix Delaware Holdings, Inc. | | | |
17,747,944 | | Term Loan, 5.78%, Maturing April 14, 2012 | | 17,990,132 | |
| | Covanta Energy Corp. | | | |
7,214,634 | | Term Loan, 3.86%, Maturing June 24, 2012 | | 7,318,345 | |
5,820,777 | | Term Loan, 6.96%, Maturing June 24, 2012 | | 5,904,451 | |
| | Energy Transfer Company, L.P. | | | |
12,100,000 | | Term Loan, 6.81%, Maturing June 16, 2012 | | 12,216,463 | |
| | KGen, LLC | | | |
5,800,850 | | Term Loan, 6.65%, Maturing August 5, 2011 | | 5,793,599 | |
| | | | | | | | |
See notes to financial statements
32
Principal | | | | | |
Amount | | Borrower/Tranche Description | | Value | |
| | | | | |
Utilities (continued) | | | |
| | | | | |
| | La Paloma Generating Co., LLC | | | |
$ | 344,262 | | Term Loan, 5.75%, Maturing August 16, 2012 | | $ | 347,447 | |
2,100,000 | | Term Loan, 5.77%, Maturing August 16, 2012 | | 2,119,425 | |
167,250 | | Term Loan, 5.77%, Maturing August 16, 2012 | | 168,798 | |
| | NRG Energy, Inc. | | | |
750,000 | | Revolving Loan, 0.00%, Maturing June 23, 2009(2) | | 747,188 | |
11,971,890 | | Term Loan, 3.92%, Maturing December 24, 2011 | | 12,056,687 | |
15,450,133 | | Term Loan, 5.90%, Maturing December 24, 2011 | | 15,559,567 | |
| | Pike Electric, Inc. | | | |
7,075,532 | | Term Loan, 6.19%, Maturing July 1, 2012 | | 7,163,976 | |
3,597,125 | | Term Loan, 6.25%, Maturing December 10, 2012 | | 3,642,090 | |
| | Plains Resources, Inc. | | | |
11,497,742 | | Term Loan, 5.85%, Maturing July 23, 2010 | | 11,677,394 | |
| | Reliant Energy, Inc. | | | |
10,461,528 | | Term Loan, 6.11%, Maturing December 22, 2010 | | 10,507,297 | |
| | Texas Genco, LLC | | | |
11,829,864 | | Term Loan, 5.88%, Maturing December 14, 2011 | | 11,889,013 | |
23,917,017 | | Term Loan, 5.88%, Maturing December 14, 2011 | | 24,036,602 | |
| | | | $ | 170,762,641 | |
| | | | | |
Total Senior, Floating Rate Interests
(identified cost, $6,272,515,034) | | $ | 6,300,666,280 | |
| | | | | | | |
Corporate Bonds & Notes — 1.1%
Principal | | | | | |
Amount | | | | | |
(000’s omitted) | | Security | | Value | |
| | | | | |
Financial Intermediaries — 0.1% | | | |
| | | | | |
| | Alzette, Variable Rate | | | |
$ | 1,180 | | 8.691%, 12/15/20(5) | | $ | 1,212,096 | |
| | Avalon Capital Ltd. 3, Series 1A, Class D, Variable Rate | | | |
1,140 | | 5.78%, 2/24/19(5) | | 1,143,762 | |
| | Babson Ltd., Series 2005-1A, Class C1, Variable Rate | | | |
1,500 | | 6.10%, 4/15/19(5) | | 1,500,000 | |
| | Bryant Park CDO Ltd., Series 2005-1A, Class C, Variable Rate | | | |
1,500 | | 6.20%, 1/15/19(5) | | 1,500,000 | |
| | Carlyle High Yield Partners, Series 2004-6A, Class C, Variable Rate | | | |
1,500 | | 6.23%, 8/11/16(5) | | 1,500,000 | |
| | Centurion CDO 8 Ltd., Series 2005 8A, Class D, Variable Rate | | | |
1,000 | | 9.29%, 3/8/17 | | 1,000,000 | |
| | Stanfield Vantage Ltd., Series 2005-1A, Class D, Variable Rate | | | |
1,500 | | 5.97%, 3/21/17(5) | | 1,509,600 | |
| | | | $ | 9,365,458 | |
| | | | | |
Radio and Television — 0.4% | | | |
| | | | | |
| | Echostar DBS Corp., Sr. Notes, Variable Rate | | | |
$ | 5,000 | | 7.304%, 10/1/08 | | $ | 5,125,000 | |
| | Emmis Communications Corp., Sr. Notes, Class A, Variable Rate | | | |
3,500 | | 9.745%, 6/15/12 | | 3,526,250 | |
| | Paxson Communications Corp., Variable Rate | | | |
17,250 | | 6.90%, 1/15/10(5) | | 17,293,125 | |
| | | | $ | 25,944,375 | |
| | | | | |
Real Estate — 0.2% | | | | |
| | | | | |
| | Assemblies of God, Variable Rate | | | |
$ | 11,935 | | 5.94%, 6/15/29(5) | | $ | 11,935,217 | |
| | | | $ | 11,935,217 | |
| | | | | |
Telecommunications — 0.4% | | | |
| | | | | |
| | Qwest Corp., Sr. Notes, Variable Rate | | | |
$ | 5,850 | | 7.12%, 6/15/13(5) | | $ | 6,201,000 | |
| | Rogers Wireless, Inc., Variable Rate | | | |
6,589 | | 6.995%, 12/15/10 | | 6,852,560 | |
| | Rural Cellular Corp., Variable Rate | | | |
11,000 | | 8.37%, 3/15/10 | | 11,302,500 | |
| | | | $ | 24,356,060 | |
| | | | | |
Total Corporate Bonds & Notes
(identified cost, $70,686,960) | | $ | 71,601,110 | |
Common Stocks — 0.1%
Shares | | Security | | Value | |
105,145 | | Hayes Lemmerz International(6) | | $ | 411,117 | |
25 | | Knowledge Universe, Inc.(3)(6)(7) | | 41,601 | |
86,020 | | Maxim Crane Works, Holdings(6) | | 2,774,132 | |
| | | | | |
Total Common Stocks
(identified cost, $2,574,911) | | $ | 3,226,850 | |
Preferred Stocks — 0.0%
Shares | | Security | | Value | |
350 | | Hayes Lemmerz International(3)(6)(7) | | $ | 5,912 | |
| | | | | |
Total Preferred Stocks
(identified cost, $17,500) | | $ | 5,912 | |
See notes to financial statements
33
Closed-End Investment Companies — 0.0%
Shares | | Security | | Value | |
4,000 | | Pioneer Floating Rate Trust | | $ | 70,120 | |
| | | | | |
Total Closed-End Investment Companies
(identified cost, $72,148) | | $ | 70,120 | |
Commercial Paper — 4.8%
Principal | | Maturity | | | | | | | |
Amount | | Date | | Borrower | | Rate | | Value | |
$ | 24,088,000 | | 11/02/05 | | Abbey National North America, LLC | | 3.93 | % | $ | 24,085,370 | |
52,000,000 | | 11/02/05 | | AIG Funding, Inc. | | 3.88 | % | 51,994,396 | |
64,122,000 | | 11/01/05 | | General Electric Capital Corp | | 4.02 | % | 64,122,000 | |
20,000,000 | | 11/03/05 | | HSBC Finance Corp. | | 3.81 | % | 19,995,767 | |
25,000,000 | | 11/01/05 | | MetLife Funding, Inc. | | 3.86 | % | 25,000,000 | |
63,936,000 | | 11/01/05 | | Prudential Financial, Inc. | | 4.02 | % | 63,936,000 | |
64,735,000 | | 11/01/05 | | UBS Finance Delaware, LLC | | 4.05 | % | 64,735,000 | |
| | | | | | | | | |
Total Commercial Paper
(at amortized cost) | | | | | | $ | 313,868,533 | |
| | | | | | | | | | | |
Short-Term Investments — 0.0%
Principal | | Maturity | | | | | | | |
Amount | | Date | | Borrower | | Rate | | Value | |
$ | 2,000,000 | | 11/01/05 | | Investors Bank and Trust Company Time Deposit | | 4.03 | % | $ | 2,000,000 | |
| | | | | | | | | |
Total Short-Term Investments
(at amortized cost) | | $ | 2,000,000 | |
| | | | | | | | | |
Total Investments — 102.8%
(identified cost, $6,661,735,086) | | $ | 6,691,438,805 | |
| | | | | | | | | |
Less Unfunded Loan Commitments — (4.2)% | | $ | (277,042,438 | ) |
| | | | | | | | | |
Net Investments — 98.6%
(identified cost, $6,384,692,648) | | $ | 6,414,396,367 | |
| | | | | | | | | |
Other Assets, Less Liabilities — 1.4% | | $ | 91,661,616 | |
| | | | | | | | | |
Net Assets — 100.0% | | $ | 6,506,057,983 | |
| | | | | | | | | | | |
EUR – Euro
GBP – British Pound
(1) Senior floating-rate interests often require prepayments from excess cash flows or permit the borrower to repay at its election. The degree to which borrowers repay, whether as a contractual requirement or at their election, cannot be predicted with accuracy. As a result, the actual remaining maturity may be substantially less than the stated maturities shown. However, it is anticipated that the senior floating-rate interests will have an expected average life of approximately two to three years. The stated interest rate represents the weighted average interest rate of all contracts within the senior loan facility. Senior Loans typically have rates of interest which are redetermined either daily, monthly, quarterly or semi-annually by reference to a base lending rate, plus a premium. These base lending rates are primarily the London-Interbank Offered Rate (“LIBOR”), and secondarily the prime rate offered by one or more major United States banks (the “Prime Rate”) and the certificate of deposit (“CD”) rate or other base lending rates used by commercial lenders.
(2) Unfunded loan commitments. See Note 1E for description.
(3) Security valued at fair value using methods determined in good faith by or at the direction of the Trustees.
(4) Defaulted security.
(5) Security exempt from registration under Rule 144A of the Securities Act of 1933. These securities may be sold in transactions exempt from registration, normally to qualified institutional buyers. At October 31, 2005, the aggregate value of the securities is $43,794,800 or 0.7% of the Portfolio’s net assets.
(6) Non-income producing security.
(7) Restricted security.
See notes to financial statements
34
Floating Rate Portfolio as of October 31, 2005
FINANCIAL STATEMENTS
Statement of Assets and Liabilities
As of October 31, 2005
Assets | | | |
Investments, at value
(identified cost, $6,384,692,648) | | $ | 6,414,396,367 | |
Foreign currency, at value
(identified cost, $1,007,596) | | 1,007,293 | |
Receivable for investments sold | | 17,654,312 | |
Receivable for open swap contracts | | 353,034 | |
Interest and dividends receivable | | 33,544,770 | |
Receivable for open forward foreign currency contracts | | 3,914,831 | |
Cash collateral segregated to cover open swap contracts | | 55,300,000 | |
Prepaid expenses | | 646,656 | |
Total assets | | $ | 6,526,817,263 | |
| | | |
Liabilities | | | |
Due to bank | | $ | 17,655,978 | |
Payable to affiliate for investment advisory fees | | 2,808,982 | |
Payable to affiliate for Trustees’ fees | | 2,788 | |
Accrued expenses | | 291,532 | |
Total liabilities | | $ | 20,759,280 | |
Net Assets applicable to investors’ interest in Portfolio | | $ | 6,506,057,983 | |
| | | |
Sources of Net Assets | | | |
Net proceeds from capital contributions and withdrawals | | $ | 6,472,242,145 | |
Net unrealized appreciation (computed on the basis of identified cost) | | 33,815,838 | |
Total | | $ | 6,506,057,983 | |
Statement of Operations
For the Year Ended October 31, 2005
Investment Income | | | |
Interest | | $ | 319,674,483 | |
Dividends | | 2,453 | |
Total investment income | | $ | 319,676,936 | |
| | | |
Expenses | | | |
Investment adviser fee | | $ | 31,396,020 | |
Trustees’ fees and expenses | | 29,572 | |
Custodian fee | | 963,532 | |
Legal and accounting services | | 465,535 | |
Miscellaneous | | 396,834 | |
Total expenses | | $ | 33,251,493 | |
Deduct — | | | |
Reduction of custodian fee | | $ | 53,996 | |
Total expense reductions | | $ | 53,996 | |
| | | |
Net expenses | | $ | 33,197,497 | |
| | | |
Net investment income | | $ | 286,479,439 | |
| | | |
Realized and Unrealized Gain (Loss) | | | |
Net realized gain (loss) — | | | |
Investment transactions (identified cost basis) | | $ | (11,369,424 | ) |
Swap contracts | | 890,313 | |
Foreign currency and forward foreign currency exchange contract transactions | | 4,218,283 | |
Net realized loss | | $ | (6,260,828 | ) |
Change in unrealized appreciation (depreciation) — | | | |
Investments (identified cost basis) | | $ | 1,024,421 | |
Swap contracts | | 337,588 | |
Foreign currency and forward foreign currency exchange contracts | | 3,873,151 | |
Net change in unrealized appreciation (depreciation) | | $ | 5,235,160 | |
| | | |
Net realized and unrealized loss | | $ | (1,025,668 | ) |
| | | |
Net increase in net assets from operations | | $ | 285,453,771 | |
See notes to financial statements
35
Statements of Changes in Net Assets
| | Year Ended
October 31, 2005 | | Year Ended October 31, 2004 | |
Increase (Decrease) in Net Assets | | | | | |
From operations — | | | | | |
Net investment income | | $ | 286,479,439 | | $ | 124,003,812 | |
Net realized loss from investment transactions, swap contracts, and foreign currency transactions | | (6,260,828 | ) | (6,500,801 | ) |
Net change in unrealized appreciation (depreciation) from investments, swap contracts, and foreign currency transactions | | 5,235,160 | | 25,631,911 | |
Net increase in net assets from operations | | $ | 285,453,771 | | $ | 143,134,922 | |
Capital transactions — | | | | | |
Contributions | | $ | 2,972,303,225 | | $ | 4,091,382,871 | |
Withdrawals | | (2,141,337,314 | ) | (1,062,753,539 | ) |
Net increase in net assets from capital transactions | | $ | 830,965,911 | | $ | 3,028,629,332 | |
| | | | | |
Net increase in net assets | | $ | 1,116,419,682 | | $ | 3,171,764,254 | |
| | | | | |
Net Assets | | | | | |
At beginning of year | | $ | 5,389,638,301 | | $ | 2,217,874,047 | |
At end of year | | $ | 6,506,057,983 | | $ | 5,389,638,301 | |
See notes to financial statements
36
Supplementary Data
| | Year Ended October 31, | |
| | 2005 | | 2004 | | 2003 | | 2002 | | 2001 | |
Ratios/Supplementary Data† | | | | | | | | | | | |
Ratios (As a percentage of average daily net assets): | | | | | | | | | | | |
Net expenses | | 0.54 | % | 0.56 | % | 0.61 | % | 0.62 | % | 0.57 | % |
Net expenses after custodian fee reduction | | 0.54 | % | 0.56 | % | 0.61 | % | 0.62 | % | 0.57 | % |
Net investment income | | 4.68 | % | 3.27 | % | 4.05 | % | 4.72 | % | 6.45 | % |
Portfolio Turnover | | 57 | % | 67 | % | 64 | % | 76 | % | 52 | % |
Total Return(1) | | 4.77 | % | 3.93 | % | 6.91 | % | 2.19 | % | — | |
Net assets, end of year (000’s omitted) | | $ | 6,506,058 | | $ | 5,389,638 | | $ | 2,217,874 | | $ | 1,326,128 | | $ | 1,387,728 | |
| | | | | | | | | | | | | | | | |
† The operating expenses of the Portfolio may reflect a reduction of the investment adviser fee and an allocation of expenses to the Investment Adviser. Had such actions not been taken, the ratios would have been as follows:
Ratios (As a percentage of average daily net assets): | | | |
Expenses | | 0.61 | % |
Expenses after custodian fee reduction | | 0.61 | % |
Net investment income | | 6.41 | % |
(1) Total return is required to be disclosed for the fiscal years beginning December 15, 2000.
See notes to financial statements
37
Floating Rate Portfolio as of October 31, 2005
NOTES TO FINANCIAL STATEMENTS
1 Significant Accounting Policies
Floating Rate Portfolio (the Portfolio) is registered under the Investment Company Act of 1940 as an open-end management investment company. The Portfolio was organized as a trust under the laws of the State of New York on June 19, 2000. The Portfolio’s investment objective is to provide a high level of current income. The Portfolio normally primarily invests in interests of senior floating rate loans. The Declaration of Trust permits the Trustees to issue interests in the Portfolio. At October 31, 2005, the Eaton Vance Floating-Rate Fund, Eaton Vance Floating-Rate & High Income Fund and Eaton Vance Medallion Floating-Rate Income Fund held an approximate 67.5.%, 25.8% and 2.4% interest in the Portfolio, respectively. The following is a summary of significant accounting policies of the Portfolio. The policies are in conformity with accounting principles generally accepted in the United States of America.
A Investment Valuation — The Portfolio’s investments are primarily in interests in senior floating rate loans (Senior Loans). Certain Senior Loans are deemed to be liquid because reliable market quotations are readily available for them. Liquid Senior Loans are valued on the basis of prices furnished by a pricing service. Other Senior Loans are valued at fair value by the Fund’s investment adviser under procedures approved by the Trustees. In connection with determining the fair value of a Senior Loan, the investment adviser makes an assessment of the likelihood that the borrower will make a full repayment of the Senior Loan. The primary factors considered by the investment adviser when making this assessment are (i) the creditworthiness of the borrower, (ii) the value of the collateral backing the Senior Loan, and (iii) the priority of the Senior Loan versus other creditors of the borrower. If, based on its assessment, the investment adviser believes there is a reasonable likelihood that the borrower will make a full repayment of the Senior Loan, the investment adviser will determine the fair value of the Senior Loan using a matrix pricing approach that considers the yield on the Senior Loan relative to yields on other loan interests issued by companies of comparable credit quality. If, based on its assessment, the investment adviser believes there is not a reasonable likelihood that the borrower will make a full repayment of the Senior Loan, the investment adviser will determine the fair value of the Senior Loan using analyses that include but are not limited to (i) a comparison of the value of the borrower’s outstanding equity and debt to that of comparable public companies; (ii) a discounted cash flow analysis; or (iii) when the investment adviser believes it is likely that a borrower will be liquidated or sold, an analysis of the terms of such liquidation or sale. In certain cases, the investment adviser will use a combination of analytical methods to determine fair value, such as when only a portion of a borrower’s assets are likely to be sold. In conducting its assessment and analyses for purposes of determining fair value of a Senior Loan, the investment adviser will use its discretion and judgment in considering and appraising such factors, data and information and the relative weight to be given thereto as it deems relevant, including without limitation, some or all of the following: (i) the fundamental characteristics of and fundamental analytical data relating to the Senior Loan, including the cost, size, current interest rate, maturity and base lending rate of the Senior Loan, the terms and conditions of the Senior Loan and any related agreements, and the position of the Senior Loan in the Borrower’s debt structure; (ii) the nature, adequacy and value of the collateral securing the Senior Loan, including the Portfolio’s rights, remedies and interests with respect to the collateral; (iii) the creditworthiness of the Borrower, based on an evaluation of, among other things, its financial condition, financial statements and information about the Borrower’s business, cash flows, capital structure and future prospects; (iv) information relating to the market for the Senior Loan including price quotations for and trading in the Senior Loan, interests in similar Senior Loans and the market environment, investor attitudes towards the Senior Loan and interests in similar Senior Loans; (v) the experience, reputation, stability and financial condition of the Agent and any intermediate participants in the Senior Loan; and (vi) general economic and market conditions affecting the fair value of the Senior Loan.
Other portfolio securities (other than short-term obligations, but including listed issues) may be valued on the basis of prices furnished by one or more pricing services which determine prices for normal, institutional-size trading units of such securities which may use market information, transactions for comparable securities and various relationships between securities which are generally recognized by institutional traders. The value of interest rate swaps will be based on dealer quotations. Short-term obligations which mature in sixty days or less are valued at amortized cost. If short-term debt securities were acquired with a remaining maturity of more than 60 days, their amortized cost value will be based on their value on the sixty-first day prior to maturity. Over the counter options are valued at the mean between the bid and the asked price provided by dealers. Marketable securities listed on the NASDAQ National Market System are valued at the NASDAQ official closing price. Financial futures contracts listed on the commodity exchanges and options thereon are
38
valued at closing settlement prices. Repurchase agreements are valued at cost plus accrued interest. Other portfolio securities for which there are no quotations or valuations are valued at fair value as determined in good faith by or at the direction of the Trustees.
B Foreign Currency Translation — Investment valuations, other assets, and liabilities initially expressed in foreign currencies are converted each business day into U.S. dollars based upon current exchange rates. Purchases and sales of foreign investment securities and income and expenses are converted into U.S. dollars based upon currency exchange rates prevailing on the respective dates of such transactions. Recognized gains or losses on investment transactions attributable to changes in foreign currency exchange rates are recorded for financial statement purposes as net realized gains and losses on investments. That portion of unrealized gains and losses on investments that results from fluctuations in foreign currency exchange rates is not separately disclosed.
C Income — Interest income from Senior Loans is recorded on the accrual basis at the then-current interest rate, while all other interest income is determined on the basis of interest accrued, adjusted for amortization of premium or discount when required. Fees associated with amendments are paid/recognized immediately.
D Income Taxes — The Portfolio has elected to be treated as a partnership for federal tax purposes. No provision is made by the Portfolio for federal or state taxes on any taxable income of the Portfolio because each investor in the Portfolio is ultimately responsible for the payment of any taxes. Since at least one of the Portfolio’s investors is a regulated investment company that invests all or substantially all of its assets in the Portfolio, the Portfolio normally must satisfy the applicable source of income and diversification requirements (under the Internal Revenue Code) in order for its investors to satisfy them. The Portfolio will allocate at least annually among its investors each investor’s distributive share of the Portfolio’s net investment income, net realized capital gains, and any other items of income, gain, loss, deduction or credit.
E Forward Foreign Currency Exchange Contracts — The Portfolio may enter into forward foreign currency exchange contracts for the purchase or sale of a specific foreign currency at a fixed price on a future date. Risks may arise upon entering these contracts from the potential inability of counterparties to meet the terms of their contracts and from movements in the value of a foreign currency relative to the U.S. dollar. The Portfolio will enter into forward contracts for hedging purposes as well as non-hedging purposes. The forward foreign currency exchange contracts are adjusted by the daily exchange rate of the underlying currency and any gains or losses are recorded for financial statement purposes as unrealized until such time as the contracts have been closed.
F Interest Rate Swaps — The Portfolio may use interest rate swaps for risk management purposes and not as a speculative investment. Pursuant to these agreements the Portfolio receives quarterly payments at a rate equal to a predetermined three-month LIBOR. In exchange, the Portfolio makes semi-annual payments at a predetermined fixed rate of interest. During the term of the outstanding swap agreement, changes in the underlying value of the swap are recorded as unrealized gains and losses. The value of the swap is determined by changes in the relationship between two rates of interest. The Portfolio is exposed to credit loss in the event of nonperformance by the swap counterparty. The Portfolio does not anticipate non-performance by the counterparty. Risk may also arise from the unanticipated movements in value of interest rates.
G Credit Default Swaps — The Portfolio may enter into credit default swap contracts for risk management purposes, including diversification. When the Portfolio is the buyer of a credit default swap contract, the Portfolio is entitled to receive the par (or other agreed-upon) value of a referenced debt obligation from the counterparty to the contract in the event of a default by a third party, such as a U.S. or foreign corporate issuer, on the debt obligation. In return, the Portfolio would pay the counterparty a periodic stream of payments over the term of the contract provided that no event of default has occurred. If no default occurs, the Portfolio would have made a stream of payments and received no benefit from the contract reducing exposure to the credit by the notional amount of the contract upon default of the referenced debt obligation. As the seller, the Portfolio would effectively add leverage to its portfolio because, in addition to its total net assets, the Portfolio would be subject to investment exposure on the notional amount of the swap. The Portfolio will segregate assets in the form
39
of cash and cash equivalents in an amount equal to the aggregate market value of the credit default swaps of which it is the seller, marked to market on a daily basis. These transactions involve certain risks, including the risk that the seller may be unable to fulfill the transaction.
H Expense Reduction — Investors Bank & Trust (IBT) serves as custodian of the Portfolio. Pursuant to the custodian agreement, IBT receives a fee reduced by credits which are determined based on the average daily cash balance the Portfolio maintains with IBT. All credit balances used to reduce the Portfolio’s custodian fees are reported as a reduction of total expenses in the Statement of Operations.
I Use of Estimates — The preparation of the financial statements in conformity with accounting principles generally accepted in the United States of America requires management to make estimates and assumptions that affect the reported amounts of assets and liabilities at the date of the financial statements and the reported amounts of income and expense during the reporting period. Actual results could differ from those estimates.
J Indemnifications — Under the Portfolio’s organizational documents, its officers and Trustees may be indemnified against certain liabilities and expenses arising out of the performance of their duties to the Portfolio. Interestholders in the Portfolio are jointly and severally liable for the liabilities and obligations of the Portfolio in the event that the Portfolio fails to satisfy such liabilities and obligations; provided, however, that, to the extent assets are available in the Portfolio, the Portfolio may, under certain circumstances, indemnify interestholders from and against any claim or liability to which such holder may become subject by reason of being or having been an interestholder in the Portfolio. Additionally, in the normal course of business, the Portfolio enters into agreements with service providers that may contain indemnification clauses. The Portfolio’s maximum exposure under these arrangements is unknown as this would involve future claims that may be made against the Portfolio that have not yet occurred.
K Other — Investment transactions are accounted foron a trade date basis.
2 Investment Adviser Fee and Other Transactions with Affiliates
The investment adviser fee is earned by BMR, as compensation for management and investment advisory services rendered to the Portfolio. The fee is equivalent to 0.575% of the Portfolio’s average daily net assets up to $1 billion and at reduced rates as daily net assets exceed that level. For the year ended October 31, 2005, the fee was equivalent to 0.512% of the Portfolio’s average net assets for such period and amounted to $31,396,020.
Except as to Trustees of the Portfolio who are not members of EVM’s or BMR’s organization, officers and Trustees receive remuneration for their services to the Portfolio out of such investment adviser fee. Trustees of the Portfolio that are not affiliated with the Investment Adviser may elect to defer receipt of all or a portion of their annual fees in accordance with the terms of the Trustees Deferred Compensation Plan. For the year ended October 31, 2005, no significant amounts have been deferred. Certain officers and Trustees of the Portfolio are officers of the above organizations.
3 Investments
The Portfolio invests primarily in Senior Loans. The ability of the issuers of the Senior Loans to meet their obligations may be affected by economic developments in a specific industry. The cost of purchases and the proceeds from principal repayments and sales of Senior Loans for the year ended October 31, 2005 aggregated $5,051,408,553, $2,782,628,052 and $481,855,558, respectively.
4 Line of Credit
The Portfolio participates with other portfolios managed by BMR in a $500 million unsecured line of credit agreement with a group of banks to permit the Portfolio to invest in accordance with its investment practices. Interest is charged under the credit agreement at the bank’s base rate or at an amount above LIBOR. In addition, a fee computed at the annual rate of 0.09% of the daily unused portion of the line of credit is allocated among the participating portfolios at the end of each quarter. As of October 31, 2005, the Portfolio had no borrowings outstanding. The Portfolio did not have any significant borrowings or allocated fees during the year ended October 31, 2005.
5 Overdraft Advances
Pursuant to the custodian agreement between the Portfolio and IBT, IBT may, in its discretion, advance funds to the Portfolio to make properly authorized payments. When such payments result in an overdraft by the Portfolio, the Portfolio is obligated to repay IBT at the current rate of interest charged by IBT for secured loans (currently a rate above the federal funds rate). This
40
obligation is payable on demand to IBT. IBT has a lien on the Portfolio’s assets to the extent of any overdraft. At October 31, 2005, payment due to IBT pursuant to the foregoing arrangement was $17,655,978.
6 Federal Income Tax Unrealized Appreciation (Depreciation)
The cost and unrealized appreciation/depreciation in the value of the investments owned at October 31, 2005, as computed on a federal income tax basis, were as follows:
Aggregate cost | | $ | 6,384,700,888 | |
Gross unrealized appreciation | | $ | 43,261,532 | |
Gross unrealized depreciation | | (13,566,053 | ) |
Net unrealized appreciation | | $ | 29,695,479 | |
7 Financial Instruments
The Portfolio may trade in financial instruments with off-balance sheet risk in the normal course of its investing activities and to assist in managing exposure to various market risks. These financial instruments include written options, financial futures contracts, forward foreign currency contracts, credit default swaps, and interest rate swaps and may involve, to a varying degree, elements of risk in excess of the amounts recognized for financial statement purposes. The notional or contractual amounts of these instruments represent the investment the Portfolio has in particular classes of financial instruments and does not necessarily represent the amounts potentially subject to risk. The measurement of the risks associated with these instruments is meaningful only when all related and offsetting transactions are considered.
Forward Foreign Currency Exchange Contracts
Sales
| | | | | | Net | |
Settlement | | | | | | Unrealized | |
Date | | Deliver | | In Exchange For | | Appreciation | |
11/30/05 | | Euro
2,997,394 | | United States Dollar
3,632,842 | | $ | 37,285 | |
11/30/05 | | Euro
3,711,239 | | United States Dollar
4,498,022 | | 46,165 | |
11/30/05 | | Euro
193,529,968 | | United States Dollar
235,649,831 | | 3,498,875 | |
11/30/05 | | British Pound
24,946,510 | | United States Dollar
44,479,628 | | 332,506 | |
| | | | | | $ | 3,914,831 | |
| | | | | | | | | |
Credit Default Swaps
| | | | | | Net | |
| | | | | | Unrealized | |
Notional | | Expiration | | | | Appreciation | |
Amount | | Date | | Description | | (Depreciation) | |
2,400,000 USD | | 9/20/2008 | | Agreement with Credit Suisse/First Boston dated 1/10/04 whereby the Portfolio will receive 2.45% per year times the notional amount. The Portfolio makes a payment only upon a default event on underlying loan assets (47 in total, each representing 2.13% of the notional value of the swap). | | $ | (41,632 | ) |
| | | | | | | |
1,200,000 USD | | 9/20/2008 | | Agreement with Credit Suisse/First Boston dated 2/13/04 whereby the Portfolio will receive 2.45% per year times the notional amount. The Portfolio makes a payment only upon a default event on underlying loan assets (47 in total, each representing 2.13% of the notional value of the swap). | | (14,504 | ) |
| | | | | | | |
1,200,000 USD | | 9/20/2008 | | Agreement with Credit Suisse/First Boston dated 3/23/04 whereby the Portfolio will receive 2.45% per year times the notional amount. The Portfolio makes a payment only upon a default event on underlying loan assets (39 in total, each representing 2.56% of the notional value of the swap). | | 5,597 | |
| | | | | | | |
10,000,000 USD | | 12/20/2009 | | Agreement with Lehman Brothers dated 10/28/2004 whereby the Portfolio will receive 2.35% per year times the notional amount. The Portfolio makes a payment of the notional amount only upon a default event on the reference entity, a Revolving Credit Agreement issued by Crown Americas, Inc. | | 241,072 | |
| | | | | | | |
5,000,000 USD | | 3/20/2010 | | Agreement with Lehman Brothers dated 12/21/2004 whereby the Portfolio will receive 2.7% per year times the notional amount. The Portfolio makes a payment of the notional amount only upon a default event on the reference entity, a Revolving Credit Agreement issued by Six Flags Theme Parks. | | 134,996 | |
| | | | | | | |
3,000,000 USD | | 3/20/2011 | | Agreement with Lehman Brothers dated 3/3/2005 whereby the Portfolio will receive 1.85% per year times the notional amount. The Portfolio makes a payment of the notional amount only upon a default event on the reference entity, a Revolving Credit Agreement issued by Syniverse Technologies, Inc. | | 18,982 | |
| | | | | | | |
6,500,000 USD | | 3/20/2010 | | Agreement with Lehman Brothers dated 3/16/2005 whereby the Portfolio will receive 2.2% per year times the notional amount. The Portfolio makes a payment of the notional amount only upon a default event on the reference entity, a Revolving Credit Agreement issued by Inergy, L.P. | | (45,059 | ) |
| | | | | | | | |
41
| | | | | | Net | |
| | | | | | Unrealized | |
Notional | | Expiration | | | | Appreciation | |
Amount | | Date | | Description | | (Depreciation) | |
3,000,000 USD | | 6/20/2010 | | Agreement with Lehman Brothers dated 4/1/2005 whereby the Portfolio will receive 2% per year times the notional amount. The Portfolio makes a payment of the notional amount only upon a default event on the reference entity, a Revolving Credit Agreement issued by Pinnacle Entertainment, Inc. | | $ | (79,503 | ) |
| | | | | | | |
3,000,000 USD | | 3/20/2010 | | Agreement with Lehman Brothers dated 5/19/2005 whereby the Portfolio will receive 2.4% per year times the notional amount. The Portfolio makes a payment of the notional amount only upon a default event on the reference entity, a Revolving Credit Agreement issued by Inergy, L.P. | | (53 | ) |
| | | | | | | |
3,000,000 USD | | 6/20/2010 | | Agreement with Lehman Brothers dated 5/19/2005 whereby the Portfolio will receive 3.25% per year times the notional amount. The Portfolio makes a payment of the notional amount only upon a default event on the reference entity, a Revolving Credit Agreement issued by Rural Cellular Corp. | | (68 | ) |
| | | | | | | |
3,000,000 USD | | 6/20/2011 | | Agreement with Lehman Brothers dated 6/2/2005 whereby the Portfolio will receive 2.3% per year times the notional amount. The Portfolio makes a payment of the notional amount only upon a default event on the reference entity, a Revolving Credit Agreement issued by Syniverse Technologies, Inc. | | 78,703 | |
| | | | | | | |
7,000,000 USD | | 9/21/2009 | | Agreement with Lehman Brothers dated 7/9/2005 whereby the Portfolio will receive 2.15% per year times the notional amount. The Portfolio makes a payment of the notional amount only upon a default event on the reference entity, a Revolving Credit Agreement issued by CSG Systems, Inc. | | (515 | ) |
| | | | | | | |
2,000,000 USD | | 9/20/2010 | | Agreement with Lehman Brothers dated 7/9/2005 whereby the Portfolio will receive 1.95% per year times the notional amount. The Portfolio makes a payment of the notional amount only upon a default event on the reference entity, a Revolving Credit Agreement issued by Pinnacle Entertainment, Inc. | | (58,740 | ) |
| | | | | | | |
5,000,000 USD | | 12/20/2010 | | Agreement with Lehman Brothers dated 10/26/2005 whereby the Portfolio will receive 2.15% per year times the notional amount. The Portfolio makes a payment of the notional amount only upon a default event on the reference entity, a Revolving Credit Agreement issued by EPCO Holdings, Inc. | | (308 | ) |
| | | | | | | | |
8 Restricted Securities
At October 31, 2005, the Portfolio owned the following securities (representing less than 0.1% of net assets) which were restricted as to public resale and not registered under the Securities Act of 1933 (excluding Rule 144A securities). The Portfolio has various registration rights (exercisable under a variety of circumstances) with respect to these securities. The fair value of these securities is determined based on valuations provided by brokers when available, or if not available, they are valued at fair value using methods determined in good faith by or at the direction of the Trustees.
Restricted Securities
| | Date of | | Shares/ | | | | | |
Description | | Acquisition | | Face | | Cost | | Fair Value | |
Common Stocks | | | | | | | | | |
Knowledge Universe, Inc. | | 10/23/04 | | 25 | | $ | 25,000 | | $ | 41,601 | |
| | | | | | $ | 25,000 | | $ | 41,601 | |
Preferred Stocks | | | | | | | | | |
Hayes Lemmerz International | | 6/23/03 | | 350 | | $ | 17,500 | | $ | 5,912 | |
| | | | | | $ | 17,500 | | $ | 5,912 | |
| | | | | | $ | 42,500 | | $ | 47,513 | |
42
Floating Rate Portfolio as of October 31, 2005
REPORT OF INDEPENDENT REGISTERED PUBLIC ACCOUNTING FIRM
To the Trustees and Investors of Floating Rate Portfolio:
We have audited the accompanying statement of assets and liabilities of Floating Rate Portfolio (the “Portfolio”), including the portfolio of investments as of October 31, 2005, the related statement of operations for the year then ended, the statements of changes in net assets for each of the two years in the period then ended, and the supplementary data for each of the five years in the period then ended. These financial statements and supplementary data are the responsibility of the Portfolio’s management. Our responsibility is to express an opinion on these financial statements and supplementary data based on our audits.
We conducted our audits in accordance with standards of the Public Company Accounting Oversight Board (United States). Those standards require that we plan and perform the audit to obtain reasonable assurance about whether the financial statements and supplementary data are free of material misstatement. The Portfolio is not required to have, nor were we engaged to perform, an audit of its internal control over financial reporting. Our audit included consideration of internal control over financial reporting as a basis for designing audit procedures that are appropriate in the circumstances, but not for the purpose of expressing an opinion on the effectiveness of the Portfolio’s internal control over financial reporting. Accordingly, we express no such opinion. An audit also includes examining, on a test basis, evidence supporting the amounts and disclosures in the financial statements, assessing the accounting principles used and significant estimates made by management, as well as evaluating the overall financial statement presentation. Our procedures included confirmation of securities and Senior Loans owned as of October 31, 2005 by correspondence with the custodian and selling or agent banks; where replies were not received from selling or agent banks, we performed other auditing procedures. We believe that our audits provide a reasonable basis for our opinion.
In our opinion, the financial statements and supplementary data referred to above present fairly, in all material respects, the financial position of Floating-Rate Portfolio as of October 31, 2005, the results of its operations for the year then ended, the changes in its net assets for each of the two years in the period then ended, and the supplementary data for each of the five years in the period then ended, in conformity with accounting principles generally accepted in the United States of America.
DELOITTE & TOUCHE LLP
Boston, Massachusetts
December 19, 2005
43
Eaton Vance Floating-Rate Fund as of October 31, 2005
BOARD OF TRUSTEES’ ANNUAL APPROVAL OF THE INVESTMENT ADVISORY AGREEMENT
The investment advisory agreement between Floating Rate Portfolio (the “Portfolio”) and its investment adviser, Boston Management and Research, provides that the advisory agreement will continue in effect from year to year so long as its continuance is approved at least annually (i) by a vote of a majority of the noninterested Trustees of the Portfolio cast in person at a meeting called for the purpose of voting on such approval and (ii) by the Trustees of the Portfolio or by vote of a majority of the outstanding interests of the Portfolio.
In considering the annual approval of the investment advisory agreement between the Portfolio and the investment adviser, the Special Committee of the Board of Trustees considered information that had been provided throughout the year at regular Board meetings, as well as information furnished for a series of meetings held in February and March in preparation for a Board meeting held on March 21, 2005 to specifically consider the renewal of the investment advisory agreement. Such information included, among other things, the following:
• An independent report comparing the advisory fees of the Portfolio with those of comparable funds;
• An independent report comparing the expense ratio of the Eaton Vance Floating-Rate Fund to those of comparable funds;
• Information regarding Fund investment performance (including on a risk-adjusted basis) in comparison to relevant peer groups of funds and appropriate indices;
• The economic outlook and the general investment outlook in relevant investment markets;
• Eaton Vance Management’s (“Eaton Vance”) results and financial condition and the overall organization of the investment adviser;
• The procedures and processes used to determine the fair value of Fund assets, including, in particular, the valuation of senior loan portfolios and actions taken to monitor and test the effectiveness of such procedures and processes;
• Eaton Vance’s management of the relationship with the custodian, subcustodians and fund accountants;
• The resources devoted to compliance efforts undertaken by Eaton Vance on behalf of the funds it manages and the record of compliance with the investment policies and restrictions and with policies on personal securities transactions;
• The quality, nature, cost and character of the administrative and other non-investment management services provided by Eaton Vance and its affiliates; and
• The terms of the advisory agreement and the reasonableness and appropriateness of the particular fee paid by the Portfolio for the services described therein.
The Special Committee also considered the investment adviser’s portfolio management capabilities, including information relating to the education, experience, and number of investment professionals and other personnel who provide services under the investment advisory agreement. Specifically, the Special Committee considered the investment adviser’s experience in managing senior loan portfolios. The Special Committee noted the experience of the 26 bank loan investment professionals and other personnel who would provide services under the investment advisory agreement, including four portfolio managers and 15 analysts. Many of these portfolio managers and analysts have previous experience working for commercial banks and other lending institutions. The Special Committee also took into account the time and attention to be devoted by senior management to the Portfolio and the other funds in the complex. The Special Committee evaluated the level of skill required to manage the Portfolio and concluded that the human resources available at the investment adviser were appropriate to fulfill its duties on behalf of the Portfolio.
In its review of comparative information with respect to the Fund’s investment performance (including on a risk-adjusted basis), the Special Committee concluded that the Fund has performed within a range that the Special Committee deemed competitive. With respect to its review of investment advisory fees, the Special Committee concluded that the fees paid by the Portfolio are within the range of those paid by comparable funds within the mutual fund industry. In reviewing the information regarding the expense ratio of the Fund, the Special Committee concluded that the Fund’s expense ratio is within a range that is competitive with comparable funds.
In addition to the factors mentioned above, the Special Committee reviewed the level of the investment adviser’s profits in providing investment management services for the Portfolio and for all Eaton Vance funds as a group. The Special Committee also reviewed the benefits to Eaton Vance and its affiliates in providing administration services for the Fund and for all Eaton Vance funds as a group. In addition, the Special Committee considered the fiduciary duty assumed by the investment adviser in connection with the services rendered to the Fund and Portfolio and the business reputation of the investment adviser and its financial resources. The Trustees concluded that in light of the services rendered, the profits realized by the investment adviser are not unreasonable. The Special Committee also considered the extent to which the investment adviser appears to be realizing benefits
44
from economies of scale in managing the Portfolio, and concluded that the fee breakpoints which are in place will allow for an equitable sharing of such benefits, when realized, with the Portfolio and the shareholders of the Fund.
The Special Committee did not consider any single factor as controlling in determining whether or not to renew the investment advisory agreement. Nor are the items described herein all the matters considered by the Special Committee. In assessing the information provided by Eaton Vance and its affiliates, the Special Committee also took into consideration the benefits to shareholders of investing in a fund that is a part of a large family of funds which provides a large variety of shareholder services.
Based on its consideration of the foregoing factors and conclusions, and such other factors and conclusions as it deemed relevant, and assisted by independent counsel, the Special Committee concluded that the renewal of the investment advisory agreement, including the fee structure, is in the interests of shareholders.
45
Eaton Vance Floating-Rate Fund
MANAGEMENT AND ORGANIZATION
Fund Management. The Trustees of Eaton Vance Mutual Funds Trust (the Trust), and Floating Rate Portfolio (the Portfolio) are responsible for the overall management and supervision of the Trust’s and Portfolio’s affairs. The Trustees and officers of the Trust and the Portfolio are listed below. Except as indicated, each individual has held the office shown or other offices in the same company for the last five years. Trustees and officers of the Trust and the Portfolio hold indefinite terms of office. The “noninterested Trustees” consist of those Trustees who are not “interested persons” of the Trust and the Portfolio, as that term is defined under the 1940 Act. The business address of each Trustee and officer is The Eaton Vance Building, 255 State Street, Boston, Massachusetts 02109. As used below, “EVC” refers to Eaton Vance Corp., “EV” refers to Eaton Vance, Inc., “EVM” refers to Eaton Vance Management, “BMR” refers to Boston Management and Research and “EVD” refers to Eaton Vance Distributors, Inc. EVC and EV are the corporate parent and trustee, respectively, of EVM and BMR. EVD is the Fund’s principal underwriter, the Portfolio’s placement agent and a wholly-owned subsidiary of EVM. Each officer affiliated with Eaton Vance may hold a position with other Eaton Vance affiliates that is comparable to its position with EVM listed below.
Name and Date of Birth | | Position(s) with
the Trust and the
Portfolio | | Term of Office and
Length of Service | | Principal Occupation(s) During Past Five Years | | Number of Portfolios in
Fund Complex Overseen
By Trustee(1) | | Other Directorships
Held |
Interested Trustee | | | | | | | | | | |
| | | | | | | | | | |
James B. Hawkes
11/9/41 | | Trustee | | Trustee of the Trust since 1991; of the Portfolio since 2000 | | Chairman, President and Chief Executive Officer of BMR, EVC, EVM and EV; Director of EV; Vice President and Director of EVD. Trustee and/or officer of 161 registered investment companies in the Eaton Vance Fund Complex. Mr. Hawkes is an interested person because of his positions with BMR, EVM, EVC and EV, which are affiliates of the Trust and the Portfolio. | | 161 | | Director of EVC |
Noninterested Trustee(s) | | | | | | | | | | |
| | | | | | | | | | |
Benjamin C. Esty
1/2/63 | | Trustee | | Since 2005 | | Professor, Harvard University Graduate School of Business Administration (since 2003). Formerly, Associate Professor, Harvard University Graduate School of Business Administration (2000-2003). | | 152 | | None |
| | | | | | | | | | |
Samuel L. Hayes, III
2/23/35 | | Trustee | | Trustee of the Trust since 1986; of the Portfolio since 2000 and Chairman of the Board since 2005 | | Jacob H. Schiff Professor of Investment Banking Emeritus, Harvard University Graduate School of Business Administration. | | 161 | | Director of Tiffany & Co. (specialty retailer) and Telect, Inc. (telecommunication services company) |
| | | | | | | | | | |
William H. Park
9/19/47 | | Trustee | | Since 2003 | | President and Chief Executive Officer, Prizm Capital Management, LLC (investment management firm) (since 2002). Executive Vice President and Chief Financial Officer, United Asset Management Corporation (a holding company owning institutional investment management firms) (1982- 2001). | | 161 | | None |
46
Name and Date of Birth | | Position(s) with
the Trust and the
Portfolio | | Term of Office and
Length of Service | | Principal Occupation(s) During Past Five Years | | Number of Portfolios in
Fund Complex Overseen
By Trustee(1) | | Other Directorships
Held |
Noninterested Trustee | | | | | | | | | | |
Ronald A. Pearlman
7/10/40 | | Trustee | | Since 2003 | | Professor of Law, Georgetown University Law Center (since 1999). Tax Partner Covington & Burling, Washington, DC (1991-2000). | | 161 | | None |
| | | | | | | | | | |
Norton H. Reamer
9/21/35 | | Trustee | | Trustee of the Trust since 1986; of the Portfolio since 2000 | | President, Chief Executive Officer and a Director of Asset Management Finance Corp. (a specialty finance company serving the investment management industry) (since October 2003). President, Unicorn Corporation (an investment and financial advisory services company) (since September 2000). Formerly, Chairman, Hellman, Jordan Management Co., Inc. (an investment management company) (2000-2003). Formerly, Advisory Director of Berkshire Capital Corporation (investment banking firm) (2002-2003). Formerly Chairman of the Board, United Asset Management Corporation (a holding company owning institutional investment management firms) and Chairman, President and Director, UAM Funds (mutual funds) (1980-2000). | | 161 | | None |
| | | | | | | | | | |
Lynn A. Stout
9/14/57 | | Trustee | | Trustee of the Trust since 1998; of the Portfolio since 2000 | | Professor of Law, University of California at Los Angeles School of Law (since July 2001). Formerly, Professor of Law, Georgetown University Law Center. | | 161 | | None |
| | | | | | | | | | |
Ralph F. Verni
1/26/43 | | Trustee | | Since 2005 | | Consultant and private investor (since 2000). Formerly, President and Chief Executive Officer, Redwood Investment Systems, Inc. (software developer) (2000). Formerly, President and Chief Executive Officer, State Street Research & Management (investment advisor), SSRM Holdings (parent of State Street Research & Management), and SSR Realty (institutional realty manager) (1992- 2000). | | 152 | | Director of Carey & Company LLC (manager of real estate investment trusts) |
47
Principal Officers who are not Trustees
Name and Date of Birth | | Position(s) with
the Trust and the
Portfolio | | Term of Office and
Length of Service | | Principal Occupation(s) During Past Five Years |
| | | | | | |
Thomas E. Faust Jr.
5/31/58 | | President of the Trust | | Since 2002 | | Executive Vice President of EVM, BMR, EVC and EV; Chief Investment Officer of EVM and BMR and Director of EVC. Chief Executive Officer of Belair Capital Fund LLC, Belcrest Capital Fund LLC, Belmar Capital Fund LLC, Belport Capital Fund LLC and Belrose Capital Fund LLC (private investment companies sponsored by EVM). Officer of 65 registered investment companies managed by EVM or BMR. |
| | | | | | |
William H. Ahern, Jr.
7/28/59 | | Vice President of the Trust | | Since 1995 | | Vice President of EVM and BMR. Officer of 70 registered investment companies managed by EVM or BMR. |
| | | | | | |
Cynthia J. Clemson
3/2/63 | | Vice President of the Trust | | Since 2005 | | Vice President of EVM and BMR. Officer of 85 registered investment companies managed by EVM or BMR. |
| | | | | | |
Kevin S. Dyer
2/21/75 | | Vice President of the Trust | | Since 2005 | | Assistant Vice President of EVM and BMR. Officer of 24 registered investment companies managed by EVM or BMR. |
| | | | | | |
Aamer Khan
6/7/60 | | Vice President of the Trust | | Since 2005 | | Vice President of EVM and BMR. Officer of 27 registered investment companies managed by EVM or BMR. |
| | | | | | |
Michael R. Mach
7/15/47 | | Vice President of the Trust | | Since 1999 | | Vice President of EVM and BMR. Officer of 32 registered investment companies managed by EVM or BMR. |
| | | | | | |
Robert B. MacIntosh
1/22/57 | | Vice President of the Trust | | Since 1998 | | Vice President of EVM and BMR. Officer of 85 registered investment companies managed by EVM or BMR. |
| | | | | | |
Scott H. Page
11/30/59 | | Vice President of the Portfolio | | Since 2000 | | Vice President of EVM and BMR. Officer of 14 registered investment companies managed by EVM or BMR. |
| | | | | | |
Duncan W. Richardson
10/26/57 | | Vice President of the Trust | | Since 2001 | | Senior Vice President and Chief Equity Investment Officer of EVM and BMR. Officer of 51 registered investment companies managed by EVM or BMR. |
| | | | | | |
Walter A. Row, III 7/20/57 | | Vice President of the Trust | | Since 2001 | | Director of Equity Research and a Vice President of EVM and BMR. Officer of 31 registered investment companies managed by EVM or BMR. |
| | | | | | |
Judith A. Saryan
8/21/54 | | Vice President of the Trust | | Since 2003 | | Vice President of EVM and BMR. Officer of 33 registered investment companies managed by EVM or BMR. |
| | | | | | |
Susan Schiff
3/31/61 | | Vice President of the Trust | | Since 2002 | | Vice President of EVM and BMR. Officer of 29 registered investment companies managed by EVM or BMR. |
| | | | | | |
Payson F. Swaffield
8/13/56 | | President of the Portfolio | | Since 2002(2) | | Vice President of EVM and BMR. Officer of 14 registered investment companies managed by EVM or BMR. |
| | | | | | |
Barbara E. Campbell
6/19/57 | | Treasurer of the Trust | | Treasurer of the Trust since 2005(3); and of the Portfolio since 2002(2). | | Vice President of EVM and BMR. Officer of 161 registered investment companies managed by EVM or BMR. |
| | | | | | |
Alan R. Dynner
10/10/40 | | Secretary | | Secretary of the Trust since 1997; of the Portfolio since 2000 | | Vice President, Secretary and Chief Legal Officer of BMR, EVM, EVD, EV and EVC. Officer of 161 registered investment companies managed by EVM or BMR. |
48
Name and Date of Birth | | Position(s) with
the Trust and the
Portfolio | | Term of Office and
Length of Service | | Principal Occupation(s) During Past Five Years |
| | | | | | |
Paul M. O’Neil
7/11/53 | | Chief Compliance Officer | | Since 2004 | | Vice President of EVM and BMR. Officer of 161 registered investment companies managed by EVM or BMR. |
(1) Includes both master and feeder funds in a master-feeder structure.
(2) Prior to 2002, Mr. Swaffield served as Vice President of the Portfolio since 2000 and Ms. Campbell served as Assistant Treasurer of the Portfolio since 2000.
(3) Prior to 2005, Ms. Campbell served as Assistant Treasurer of the Trust since 1995.
The SAI for the Fund includes additional information about the Trustees and officers of the Fund and the Portfolio and can be obtained without charge by calling 1-800-225-6265.
49
Investment Adviser of Floating Rate Portfolio
Boston Management and Research
The Eaton Vance Building
255 State Street
Boston, MA 02109
Administrator of Eaton Vance Floating-Rate Fund
Eaton Vance Management
The Eaton Vance Building
255 State Street
Boston, MA 02109
Principal Underwriter
Eaton Vance Distributors, Inc.
The Eaton Vance Building
255 State Street
Boston, MA 02109
(617) 482-8260
Custodian
Investors Bank & Trust Company
200 Clarendon Street
Boston, MA 02116
Transfer Agent
PFPC Inc.
Attn: Eaton Vance Funds
P.O. Box 9653
Providence, RI 02940-9653
(800) 262-1122
Independent Registered Public Accounting Firm
Deloitte & Touche LLP
200 Berkeley Street
Boston, MA 02116-5022
Eaton Vance Floating-Rate Fund
The Eaton Vance Building
255 State Street
Boston, MA 02109
This report must be preceded or accompanied by a current prospectus. Before investing, investors should consider carefully the Fund’s investment objective(s), risks, and charges and expenses. The Fund’s current prospectus contains this and other information about the Fund and is available through your financial advisor. Please read the prospectus carefully before you invest or send money. For further information please call 1-800-225-6265.
Annual Report October 31, 2005

| EATON VANCE FLOATING-RATE & HIGH INCOME FUND | |
IMPORTANT NOTICES REGARDING PRIVACY,
DELIVERY OF SHAREHOLDER DOCUMENTS,
PORTFOLIO HOLDINGS AND PROXY VOTING
Privacy. The Eaton Vance organization is committed to ensuring your financial privacy. Each of the financial institutions identified below has in effect the following policy (“Privacy Policy”) with respect to nonpublic personal information about its customers:
• Only such information received from you, through application forms or otherwise, and information about your Eaton Vance fund transactions will be collected. This may include information such as name, address, social security number, tax status, account balances and transactions.
• None of such information about you (or former customers) will be disclosed to anyone, except as permitted by law (which includes disclosure to employees necessary to service your account). In the normal course of servicing a customer’s account, Eaton Vance may share information with unaffiliated third parties that perform various required services such as transfer agents, custodians and broker/dealers.
• Policies and procedures (including physical, electronic and procedural safeguards) are in place that are designed to protect the confidentiality of such information.
• We reserve the right to change our Privacy Policy at any time upon proper notification to you. Customers may want to review our Policy periodically for changes by accessing the link on our homepage: www.eatonvance.com.
Our pledge of privacy applies to the following entities within the Eaton Vance organization: the Eaton Vance Family of Funds, Eaton Vance Management, Eaton Vance Investment Counsel, Boston Management and Research, and Eaton Vance Distributors, Inc.
In addition, our Privacy Policy only applies to those Eaton Vance customers who are individuals and who have a direct relationship with us. If a customer’s account (i.e., fund shares) is held in the name of a third-party financial adviser/broker-dealer, it is likely that only such adviser’s privacy policies apply to the customer. This notice supersedes all previously issued privacy disclosures.
For more information about Eaton Vance’s Privacy Policy, please call 1-800-262-1122.
Delivery of Shareholder Documents. The Securities and Exchange Commission (the “SEC”) permits funds to deliver only one copy of shareholder documents, including prospectuses, proxy statements and shareholder reports, to fund investors with multiple accounts at the same residential or post office box address. This practice is often called “householding” and it helps eliminate duplicate mailings to shareholders.
Eaton Vance, or your financial adviser, may household the mailing of your documents indefinitely unless you instruct Eaton Vance, or your financial adviser, otherwise.
If you would prefer that your Eaton Vance documents not be householded, please contact Eaton Vance at 1-800-262-1122, or contact your financial adviser.
Your instructions that householding not apply to delivery of your Eaton Vance documents will be effective within 30 days of receipt by Eaton Vance or your financial adviser.
Portfolio Holdings. Each Eaton Vance Fund and its underlying Portfolio (if applicable) will file a schedule of its portfolio holdings on Form N-Q with the SEC for the first and third quarters of each fiscal year. The Form N-Q will be available on the Eaton Vance website www.eatonvance.com, by calling Eaton Vance at 1-800-262-1122 or in the EDGAR database on the SEC’s website at www.sec.gov. Form N-Q may also be reviewed and copied at the SEC’s public reference room in Washington, D.C. (call 1-800-732-0330 for information on the operation of the public reference room).
Proxy Voting. From time to time, funds are required to vote proxies related to the securities held by the funds. The Eaton Vance Funds or their underlying Portfolios (if applicable) vote proxies according to a set of policies and procedures approved by the Funds’ and Portfolios’ Boards. You may obtain a description of these policies and procedures and information on how the Funds or Portfolios voted proxies relating to portfolio securities during the 12 month period ended June 30, without charge, upon request, by calling
1-800-262-1122. This description is also available on the SEC’s website at www.sec.gov.
Eaton Vance Floating-Rate & High Income Fund as of October 31, 2005
MANAGEMENT’ S DISCUSSION OF FUND PERFORMANCE
The Fund
Performance for the Past Year
• The Fund’s Class A shares distributed $0.479 in income dividends during the year ended October 31, 2005. Based on the Class A most recent distribution and a $10.29 net asset value on October 31, 2005, the Fund had a distribution rate of 5.56%.(1) The Class A SEC 30-day yield at October 31, 2005 was 5.23%.(2)
• The Fund’s Class B shares distributed $0.377 in income dividends during the year ended October 31, 2005. Based on the Class B most recent distribution and a $9.68 net asset value on October 31, 2005, the Class B had a distribution rate of 4.81%.(1) The Class B SEC 30-day yield at October 31, 2005 was 4.73%.(2)
• The Fund’s Class C shares distributed $0.377 in income dividends during the year ended October 31, 2005. Based on the Class C most recent distribution and a $9.68 net asset value on October 31, 2005, the Class C had a distribution rate of 4.81%.(1) The Class C SEC 30-day yield at October 31, 2005 was 4.73%.(2)
• The Fund’s Class I shares distributed $0.475 in income dividends during the year ended October 31, 2005. Based on the Class I most recent distribution and a $9.69 net asset value on October 31, 2005, the Class I had a distribution rate of 5.81%.(1) The Class I SEC 30-day yield at October 31, 2005 was 5.73%.(2)
• The Fund’s Advisers Class shares distributed $0.451 in income dividends during the year ended October 31, 2005. Based on the Adviser Class most recent distribution and a $9.68 net asset value on October 31, 2005, the Advisers Class had a distribution rate of 5.56%.(1) The Advisers Class SEC 30-day yield at October 31, 2005 was 5.48%.(2)
The Fund’s Investments
• Floating Rate Portfolio’s investments included 481 borrowers at October 31, 2005, with an average loan size of just 0.20% of total investments and no industry constituting more than 8.0% of total investments. Building and development (including manufacturers of building products companies that manage/own apartments, shopping malls and commercial office buildings, among others), health care, publishing, leisure goods/activities/movies and chemicals/plastics were the largest industry weightings.
• The loan market performed well, as short-term interest rates rose throughout the fiscal year. The London Inter-Bank Offered Rate (LIBOR) – the benchmark over which loan interest rates are typically set – kept pace with the Federal Reserve’s rate hikes, rising 175 basis points (1.75%) over the period. Yield spreads narrowed to just below their historical range, although there were signs that downward pressures were mitigating.
• In the wake of Hurricanes Katrina and Rita, management identified approximately 10 companies that were directly impacted by the storms. While these loans suffered very little price impact, management nonetheless selectively reduced exposure to the hardest-hit companies, generally at prices above par. The hurricanes had little initial overall impact on the Floating Rate Portfolio.
• The Floating Rate Portfolio expanded its investment universe to include European loans during the fiscal year, a move that, in management’s view, has helped the Portfolio diversify further. Management employed a hedging strategy to hedge the currency risk.
• The Fund’s investment in High Income Portfolio again provided a yield enhancement. The Fund reduced its high-yield bond exposure early in the fiscal year, a move that limited its exposure to the continuing volatility within the high-yield market. High Income Portfolio maintained a relatively short duration, which insulated the Fund from some of that market volatility.
• For the year ended October 31, 2005, the Fund’s Class I shares had a total return of 4.78% versus the 5.03% total return of the S&P/LSTA Leveraged Loan Index – an unmanaged index of U.S. dollar-denominated leveraged loans.(3) The Fund’s slight underperformance versus the Index was attributed to the Portfolio’s lower relative weightings in the riskier segments of the market, such as the auto and auto parts sector.
The views expressed in this report are those of the portfolio managers and are current only through the end of the period of the report as stated on the cover. These views are subject to change at any time based upon market or other conditions, and the investment adviser disclaims any responsibility to update such views. These views may not be relied on as investment advice and, because investment decisions for a fund are based on many factors, may not be relied on as an indication of trading intent on behalf of any Eaton Vance fund.
Fund shares are not insured by the FDIC and are not deposits or other obligations of, or guaranteed by, any depository institution. Shares are subject to investment risks, including possible loss of principal invested.
(1) The Fund’s distribution rate represents actual distributions paid to shareholders and is calculated daily by dividing the last distribution per share (annualized) by the net asset value.
(2) The Fund’s SEC yield is calculated by dividing the net investment income per share for the 30-day period by the offering price at the end of the period and annualizing the result.
(3) It is not possible to invest directly in an Index. The Index’s total return does not reflect the commissions or expenses that would have been incurred if an investor individually purchased or sold the securities represented in the Index.
Past performance is no guarantee of future results. Returns are historical and are calculated by determining the percentage change in net asset value or offering price (as applicable) with all distributions reinvested. Investment return and principal value will fluctuate so that shares, when redeemed, may be worth more or less than their original cost. Performance is for the stated time period only; due to market volatility, the Fund’s current performance may be lower or higher than the quoted return. For performance as of the most recent month end, please refer to www.eatonvance.com.
2
FUND PERFORMANCE
The line graph and table set forth below provide information about the Fund’s performance. The line graph compares the performance of Class B of the Fund with that of the S&P/LSTA leveraged Loan Index, an unmanaged loan market index. The lines on the graph represent the total returns of a hypothetical investment of $10,000 in Class B of the Fund and the S&P/LSTA leveraged Loan Index. The table includes the total returns of each Class of the Fund at net asset value and public offering price. The performance presented below does not reflect the deduction of taxes, if any, that a shareholder would pay on Fund distributions or the redemption of Fund shares.
Performance(1)
| | Class A | | Class B | | Class C | | Class I | | Advisers
Class | |
Average Annual Total Returns (at net asset value) | | | | | | | | | | | |
One Year | | 4.43 | % | 3.74 | % | 3.74 | % | 4.78 | % | 4.42 | % |
Five Years | | N.A. | | 3.86 | | 3.86 | | 4.86 | | 4.61 | |
Life of Fund† | | 5.39 | | 3.85 | | 3.85 | | 4.81 | | 4.56 | |
| | | | | | | | | | | |
SEC Average Annual Total Returns (including sales charge or applicable CDSC) | | | | | | | | | | | |
One Year | | 2.06 | % | -1.25 | % | 2.74 | % | 4.78 | % | 4.42 | % |
Five Years | | N.A. | | 3.52 | | 3.86 | | 4.86 | | 4.61 | |
Life of Fund† | | 4.43 | | 3.68 | | 3.85 | | 4.81 | | 4.56 | |
† Inception Dates – Class A: 5/7/03; Class B: 9/5/00; Class C: 9/5/00; Class I: 9/15/00; Advisers Class: 9/7/00
(1) Average Annual Total Returns at net asset value do not include the 2.25% maximum sales charge for Class A shares or the applicable contingent deferred sales charges (CDSC) for Class B or Class C shares. If sales charges were deducted, returns would be lower. SEC Average Annual Total Returns for Class A reflect the maximum 2.25% sales charge. SEC returns for Class B reflect applicable CDSC based on the following schedule: 5% - 1st and 2nd years; 4% - 3rd year; 3% - 4th year; 2% - 5th year; 1% - 6th year. 1-year SEC returns for Class C reflect 1% CDSC. Advisers Class and Class I are offered to certain investors at net asset value. Class A, Advisers Class and Class I shares redeemed or exchanged within 90 days of settlement of purchase are subject to a 1% redemption fee.
Past performance is no guarantee of future results. Returns are historical and are calculated by determining the percentage change in net asset value or offering price (as applicable) with all distributions reinvested. Investment return and principal value will fluctuate so that shares, when redeemed, may be worth more or less than their original cost. Performance is for the stated time period only; due to market volatility, the Fund’s current performance may be lower or higher than the quoted return. For performance as of the most recent month end, please refer to www.eatonvance.com.
Diversification of Floating Rate Portfolio by Industries(2)
By total investments
Building & Development | | 7.3 | % |
Healthcare | | 6.4 | |
Publishing | | 5.5 | |
Chemicals & Plastics | | 5.2 | |
Leisure Goods/Activities/Movies | | 4.8 | |
Radio & Television | | 4.6 | |
Telecommunications | | 4.2 | |
Lodging & Casinos | | 4.1 | |
Cable & Satellite Television | | 4.1 | |
Business Equip. & Services | | 3.9 | |
Automotive | | 3.9 | |
Oil & Gas | | 3.8 | |
Containers & Glass Products | | 3.7 | |
Retailers (Except Food & Drug) | | 3.1 | |
Utilities | | 2.6 | |
Conglomerates | | 2.5 | |
Electronics/Electrical | | 2.3 | |
Financial Intermediaries | | 2.2 | |
Nonferrous Metals/Minerals | | 2.1 | |
Food Products | | 2.1 | % |
Food Service | | 2.0 | |
Aerospace & Defense | | 1.9 | |
Forest Products | | 1.8 | |
Food/Drug Retailers | | 1.7 | |
Ecological Services & Equip. | | 1.3 | |
Beverage & Tobacco | | 1.3 | |
Industrial Equipment | | 1.2 | |
Home Furnishings | | 1.2 | |
Insurance | | 0.9 | |
Equipment Leasing | | 0.8 | |
Cosmetics/Toiletries | | 0.7 | |
Drugs | | 0.6 | |
Rail Industries | | 0.5 | |
Clothing/Textiles | | 0.4 | |
Surface Transport | | 0.3 | |
Air Transport | | 0.2 | |
Real Estate | | 0.2 | |
Farming/Agriculture | | 0.2 | |
(2) Reflects the Fund’s investments in Floating Rate Portfolio as of October 31, 2005. Industries are shown as a percentage of the Floating Rate Portfolio’s total investments. Statistics may not be representative of current or future investments and are subject to change due to active management.
Comparison of Change in Value of a $10,000 Investment in Eaton Vance Floating-Rate & High Income Fund Class B vs. the S&P/LSTA Leveraged Loan Index.*
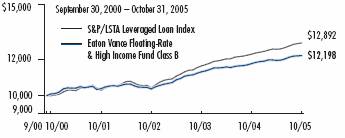
* Sources: Thomson Financial; Bloomberg, L.P. Class B of the Fund commenced operations on 9/5/00.
The investment in Class B shares would have been valued at $12,101 after the deduction of the applicable CDSC. A $10,000 hypothetical investment at net asset value in Class A on 5/7/03, Class C on 9/5/00, Class I on 9/15/00 and Advisers Class on 9/7/00 would have been valued at $11,407, $12,201, $12,723 and $12,583, respectively, on 10/31/05. A $10,000 hypothetical investment in Class A shares of the Fund at maximum offering price would have been valued at $11,151. It is not possible to invest directly in an Index. The Index’s total return does not reflect the expenses that would have been incurred if an investor individually purchased or sold the securities represented in the Index.
Fund Allocation(3)
By total investments
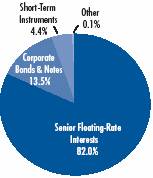
(3) Reflects the Fund’s investments in Floating Rate Portfolio and High Income Portfolio as of October 31, 2005. Allocations are shown as a percentage of the Portfolio’s total investments. Statistics may not be representative of current or future investments and are subject to change due to active management.
3
FUND EXPENSES
Example: As a shareholder of the Fund, you incur two types of costs: (1) transaction costs, including sales charges (loads) on purchases and redemption fees (if applicable); and (2) ongoing costs, including management fees; distribution or service fees; and other Fund expenses. This Example is intended to help you understand your ongoing costs (in dollars) of investing in the Fund and to compare these costs with the ongoing costs of investing in other mutual funds. The Example is based on an investment of $1,000 invested at the beginning of the period and held for the entire period (May 1, 2005 – October 31, 2005).
Actual Expenses: The first section of the table below provides information about actual account values and actual expenses. You may use the information in this section, together with the amount you invested, to estimate the expenses that you paid over the period. Simply divide your account value by $1,000 (for example, an $8,600 account value divided by $1,000 = 8.6), then multiply the result by the number in the first line under the heading entitled “Expenses Paid During Period” to estimate the expenses you paid on your account during this period.
Hypothetical Example for Comparison Purposes: The second section of the table below provides information about hypothetical account values and hypothetical expenses based on the Fund’s actual expense ratios and an assumed rate of return of 5% per year before expenses, which is not the actual return of the Fund. The hypothetical account values and expenses may not be used to estimate the actual ending account balance or expenses you paid for the period. You may use this information to compare the ongoing costs of investing in the Fund and other funds. To do so, compare this 5% hypothetical example with the 5% hypothetical examples that appear in the shareholder reports of the other funds.
Please note that the expenses shown in the table are meant to highlight your ongoing costs only and do not reflect any transactional costs, such as sales charges (loads) or redemption fees (if applicable). Therefore, the second section of the table is useful in comparing ongoing costs only, and will not help you determine the relative total costs of owning different funds. In addition, if these transactional costs were included, your costs would have been higher.
Eaton Vance Floating-Rate & High Income Fund
| | Beginning Account Value | | Ending Account Value | | Expenses Paid During Period* | |
| | (5/1/05) | | (10/31/05) | | (5/1/05 – 10/31/05) | |
| | | | | | | |
Actual | | | | | | | |
Class A | | $ | 1,000.00 | | $ | 1,024.90 | | $ | 5.31 | |
Class B | | $ | 1,000.00 | | $ | 1,022.00 | | $ | 9.17 | |
Class C | | $ | 1,000.00 | | $ | 1,022.00 | | $ | 9.12 | |
Class I | | $ | 1,000.00 | | $ | 1,027.10 | | $ | 4.04 | |
Advisers Class | | $ | 1,000.00 | | $ | 1,024.80 | | $ | 5.31 | |
| | | | | | | |
Hypothetical | | | | | | | |
(5% return before expenses) | | | | | | | |
Class A | | $ | 1,000.00 | | $ | 1,020.00 | | $ | 5.30 | |
Class B | | $ | 1,000.00 | | $ | 1,016.10 | | $ | 9.15 | |
Class C | | $ | 1,000.00 | | $ | 1,016.20 | | $ | 9.10 | |
Class I | | $ | 1,000.00 | | $ | 1,021.20 | | $ | 4.02 | |
Advisers Class | | $ | 1,000.00 | | $ | 1,020.00 | | $ | 5.30 | |
| | | | | | | | | | | |
* Expenses are equal to the Fund’s annualized expense ratio of 1.04% for Class A shares, 1.80% for Class B shares, 1.79% for Class C shares, 0.79% for Class I shares and 1.04% for Advisers shares multiplied by the average account value over the period, multiplied by 184/365 (to reflect the one-half-year period). The example assumes that the $1,000 was invested at the net asset value per share determined at the close of business on April 30, 2005. The Example reflects the expenses of both the Fund and the Portfolios.
4
Eaton Vance Floating-Rate & High Income Fund as of October 31, 2005
FINANCIAL STATEMENTS
Statement of Assets and Liabilities
As of October 31, 2005
Assets | | | |
Investment in Floating Rate Portfolio, at value (identified cost, $1,671,037,983) | | $ | 1,678,951,615 | |
Investment in High Income Portfolio, at value (identified cost, $240,712,497) | | 241,138,992 | |
Receivable for Fund shares sold | | 7,244,389 | |
Total assets | | $ | 1,927,334,996 | |
| | | |
Liabilities | | | |
Payable for Fund shares redeemed | | $ | 11,918,641 | |
Dividends payable | | 2,373,447 | |
Payable to affiliate for distribution and service fees | | 839,378 | |
Payable to affiliate for administration fee | | 243,963 | |
Payable to affiliate for Trustees’ fees | | 311 | |
Accrued expenses | | 399,687 | |
Total liabilities | | $ | 15,775,427 | |
Net Assets | | $ | 1,911,559,569 | |
| | | |
Sources of Net Assets | | | |
Paid-in capital | | $ | 1,934,397,079 | |
Accumulated net realized loss from Portfolio (computed on the basis of identified cost) | | (31,516,466 | ) |
Accumulated undistributed net investment income | | 338,829 | |
Net unrealized appreciation from Portfolios (computed on the basis of identified cost) | | 8,340,127 | |
Total | | $ | 1,911,559,569 | |
| | | |
Advisers Shares | | | |
Net Assets | | $ | 710,286,205 | |
Shares Outstanding | | 73,362,274 | |
Net Asset Value, Offering Price and Redemption Price Per Share
(net assets ÷ shares of beneficial interest outstanding) | | $ | 9.68 | |
| | | |
Class A Shares | | | |
Net Assets | | $ | 474,435,135 | |
Shares Outstanding | | 46,084,255 | |
Net Asset Value and Redemption Price Per Share
(net assets ÷ shares of beneficial interest outstanding) | | $ | 10.29 | |
Maximum Offering Price Per Share
(100 ÷ 97.75 of $10.29) | | $ | 10.53 | |
| | | |
Class B Shares | | | |
Net Assets | | $ | 163,795,132 | |
Shares Outstanding | | 16,924,575 | |
Net Asset Value, Offering Price and Redemption Price Per Share
(net assets ÷ shares of beneficial interest outstanding) | | $ | 9.68 | |
| | | |
Class C Shares | | | |
Net Assets | | $ | 525,842,672 | |
Shares Outstanding | | 54,346,845 | |
Net Asset Value, Offering Price and Redemption Price Per Share
(net assets ÷ shares of beneficial interest outstanding) | | $ | 9.68 | |
| | | |
Institutional Shares | | | |
Net Assets | | $ | 37,200,425 | |
Shares Outstanding | | 3,840,469 | |
Net Asset Value, Offering Price and Redemption Price Per Share
(net assets ÷ shares of beneficial interest outstanding) | | $ | 9.69 | |
On sales of $100,000 or more, the offering price of Class A shares is reduced.
Statement of Operations
For the Year Ended October 31, 2005
Investment Income | | | |
Interest allocated from Portfolios | | $ | 104,454,715 | |
Dividends allocated from Portfolios (Note 8) | | 90,086 | |
Miscellaneous income allocated from Portfolio (Note 8) | | 413,220 | |
Expenses allocated from Portfolios | | (10,149,380 | ) |
Net investment income from Portfolios | | $ | 94,808,641 | |
| | | |
Expenses | | | |
Administration fee | | $ | 2,780,151 | |
Trustees’ fees and expenses | | 3,263 | |
Distribution and service fees | | | |
Advisers | | 1,548,419 | |
Class A | | 1,195,083 | |
Class B | | 1,755,247 | |
Class C | | 5,444,879 | |
Transfer and dividend disbursing agent fees | | 1,254,900 | |
Printing and postage | | 280,740 | |
Registration fees | | 205,892 | |
Legal and accounting services | | 63,653 | |
Custodian fee | | 33,320 | |
Miscellaneous | | 24,700 | |
Total expenses | | $ | 14,590,247 | |
Net investment income | | $ | 80,218,394 | |
| | | |
Realized and Unrealized Gain (Loss) from Portfolios | | | |
Net realized gain (loss) — | | | |
Investment transactions (identified cost basis) | | $ | (2,540,528 | ) |
Swap contracts | | 232,072 | |
Foreign currency and forward foreign currency exchange contract transactions | | 1,145,326 | |
Net realized loss | | $ | (1,163,130 | ) |
Change in unrealized appreciation (depreciation) — | | | |
Investments (identified cost basis) | | $ | (5,433,823 | ) |
Swap contracts | | 139,970 | |
Foreign currency and forward foreign currency exchange contracts | | 1,006,323 | |
Net change in unrealized appreciation (depreciation) | | $ | (4,287,530 | ) |
Net realized and unrealized loss | | $ | (5,450,660 | ) |
Net increase in net assets from operations | | $ | 74,767,734 | |
See notes to financial statements
5
Statements of Changes in Net Assets
| | Year Ended
October 31, 2005 | | Year Ended
October 31, 2004 | |
Increase (Decrease) in Net Assets | | | | | |
From operations — | | | | | |
Net investment income | | $ | 80,218,394 | | $ | 33,396,121 | |
Net realized loss from investment transactions, swap contracts, and foreign currency transactions | | (1,163,130 | ) | (1,258,898 | ) |
Net change in unrealized appreciation (depreciation) from investments, swaps contracts, and foreign currency | | (4,287,530 | ) | 11,236,784 | |
Net increase in net assets from operations | | $ | 74,767,734 | | $ | 43,374,007 | |
Distributions to shareholders — | | | | | |
From net investment income | | | | | |
Advisers | | $ | (29,088,136 | ) | $ | (8,508,736 | ) |
Class A | | (22,151,961 | ) | (8,161,845 | ) |
Class B | | (6,796,120 | ) | (5,016,477 | ) |
Class C | | (21,148,762 | ) | (11,731,160 | ) |
Institutional | | (1,774,593 | ) | (383,651 | ) |
Total distributions to shareholders | | $ | (80,959,572 | ) | $ | (33,801,869 | ) |
Transactions in shares of beneficial interest — | | | | | |
Proceeds from sale of shares | | | | | |
Advisers | | $ | 497,649,282 | | $ | 476,534,349 | |
Class A | | 310,332,995 | | 448,467,252 | |
Class B | | 16,819,856 | | 51,686,906 | |
Class C | | 172,756,357 | | 297,151,276 | |
Institutional | | 31,368,361 | | 25,154,520 | |
Net asset value of shares issued to shareholders in payment of distributions declared | | | | | |
Advisers | | 20,738,789 | | 6,812,134 | |
Class A | | 16,645,366 | | 5,768,281 | |
Class B | | 4,314,073 | | 3,038,792 | |
Class C | | 14,359,632 | | 7,820,760 | |
Institutional | | 1,499,535 | | 305,432 | |
Cost of shares redeemed | | | | | |
Advisers | | (279,958,379 | ) | (79,563,049 | ) |
Class A | | (283,905,387 | ) | (65,830,754 | ) |
Class B | | (37,221,398 | ) | (34,024,936 | ) |
Class C | | (173,248,556 | ) | (98,569,752 | ) |
Institutional | | (19,115,507 | ) | (5,307,655 | ) |
Net asset value of shares exchanged | | | | | |
Class A | | 1,763,637 | | 1,838,607 | |
Class B | | (1,763,637 | ) | (1,838,607 | ) |
Redemption Fees | | 119,705 | | 87,827 | |
Net increase in net assets from Fund share transactions | | $ | 293,154,724 | | $ | 1,039,531,383 | |
Net increase in net assets | | $ | 286,962,886 | | $ | 1,049,103,521 | |
| | | | | |
Net Assets | | | | | |
At beginning of year | | $ | 1,624,596,683 | | $ | 575,493,162 | |
At end of year | | $ | 1,911,559,569 | | $ | 1,624,596,683 | |
| | | | | |
Accumulated undistributed (distributions in excess of) net investment income included in net assets | | | | | |
At end of year | | $ | 338,829 | | $ | (119,482 | ) |
See notes to financial statements
6
Financial Highlights
| | Class A | |
| | Year Ended October 31, | |
| | 2005(1) | | 2004(1) | | 2003(1)(2) | |
Net asset value — Beginning of year | | $ | 10.320 | | $ | 10.220 | | $ | 10.000 | |
| | | | | | | |
Income (loss) from operations | | | | | | | |
Net investment income | | $ | 0.475 | | $ | 0.363 | | $ | 0.179 | |
Net realized and unrealized gain (loss) | | (0.027 | ) | 0.109 | | 0.241 | |
Total income from operations | | $ | 0.448 | | $ | 0.472 | | $ | 0.420 | |
| | | | | | | |
Less distributions | | | | | | | |
From net investment income | | $ | (0.479 | ) | $ | (0.372 | ) | $ | (0.200 | ) |
Total distributions | | $ | (0.479 | ) | $ | (0.372 | ) | $ | (0.200 | ) |
Redemption fees | | $ | 0.001 | | $ | 0.000 | (3) | $ | — | |
Net asset value — End of period | | $ | 10.290 | | $ | 10.320 | | $ | 10.220 | |
Total Return(4) | | 4.43 | % | 4.69 | % | 4.23 | % |
| | | | | | | |
Ratios/Supplemental Data | | | | | | | |
Net assets, end of year (000’s omitted) | | $ | 474,435 | | $ | 431,257 | | $ | 39,128 | |
Ratios (As a percentage of average daily net assets): | | | | | | | |
Net expenses(5) | | 1.05 | % | 1.07 | % | 1.12 | (6)% |
Net expenses after custodian fee reduction(5) | | 1.05 | % | 1.07 | % | 1.12 | (6)% |
Net investment income | | 4.60 | % | 3.52 | % | 3.68 | (6)% |
Portfolio turnover of the Floating-Rate Portfolio | | 57 | % | 67 | % | 64 | % |
Portfolio turnover of the High Income Portfolio | | 62 | % | 80 | % | 118 | % |
(1) Net investment income per share was computed using average shares outstanding.
(2) For the period from the start of business, May 7, 2003, to October 31, 2003.
(3) Amounts represent less than $0.005 per share.
(4) Returns are historical and are calculated by determining the percentage change in net asset value with all distributions reinvested. Total return is not computed on an annualized basis.
(5) Includes the Fund’s share of the Portfolios’ allocated expenses.
(6) Annualized.
See notes to financial statements
7
| | Advisers | |
| | Year Ended October 31, | |
| | 2005(1) | | 2004(1) | | 2003(1) | | 2002(1)(2) | | 2001 | |
Net asset value — Beginning of year | | $ | 9.710 | | $ | 9.610 | | $ | 9.140 | | $ | 9.550 | | $ | 9.930 | |
| | | | | | | | | | | |
Income (loss) from operations | | | | | | | | | | | |
Net investment income | | $ | 0.451 | | $ | 0.347 | | $ | 0.407 | | $ | 0.472 | | $ | 0.725 | |
Net realized and unrealized gain (loss) | | (0.031 | ) | 0.103 | | 0.486 | | (0.408 | ) | (0.383 | ) |
Total income from operations | | $ | 0.420 | | $ | 0.450 | | $ | 0.893 | | $ | 0.064 | | $ | 0.342 | |
| | | | | | | | | | | |
Less distributions | | | | | | | | | | | |
From net investment income | | $ | (0.451 | ) | $ | (0.350 | ) | $ | (0.423 | ) | $ | (0.474 | ) | $ | (0.722 | ) |
Total distributions | | $ | (0.451 | ) | $ | (0.350 | ) | $ | (0.423 | ) | $ | (0.474 | ) | $ | (0.722 | ) |
Redemption fees | | $ | 0.001 | | $ | 0.00 | (3) | $ | 0.00 | (3) | $ | — | | $ | — | |
| | | | | | | | | | | |
Net asset value — End of year | | $ | 9.680 | | $ | 9.710 | | $ | 9.610 | | $ | 9.140 | | $ | 9.550 | |
Total Return(4) | | 4.42 | % | 4.76 | % | 9.98 | % | 0.62 | % | 3.49 | % |
| | | | | | | | | | | |
Ratios/Supplemental Data† | | | | | | | | | | | |
Net assets, end of year (000’s omitted) | | $ | 710,286 | | $ | 474,219 | | $ | 68,258 | | $ | 30,960 | | $ | 33,773 | |
Ratios (As a percentage of average daily net assets): | | | | | | | | | | | |
Net expenses(5) | | 1.05 | % | 1.06 | % | 1.12 | % | 1.15 | % | 1.03 | % |
Net expenses after custodian fee reduction(5) | | 1.05 | % | 1.06 | % | 1.12 | % | 1.15 | % | 1.03 | % |
Net investment income | | 4.65 | % | 3.59 | % | 4.32 | % | 4.98 | % | 6.94 | % |
Portfolio Turnover of the Floating-Rate Portfolio | | 57 | % | 67 | % | 64 | % | 76 | % | 52 | % |
Portfolio Turnover of the High Income Portfolio | | 62 | % | 80 | % | 118 | % | 88 | % | 83 | % |
† The operating expenses of the Fund and the Portfolio may reflect a reduction of the investment adviser fee/administration fee, a reduction in the distribution and service fees, and an allocation of expenses to the Investment Adviser/Administrator. Had such actions not been taken, the ratios and net investment income per share would have been as follows:
Ratios (As a percentage of average daily net assets): | | | | | | | | | |
Expenses(5) | | | | | | | | | | 1.16 | % |
Expenses after custodian fee reduction(5) | | | | | | | | 1.16 | % |
Net investment income | | | | | | | | | | 6.81 | % |
Net investment income per share | | | | | | | | | | $ | 0.711 | |
| | | | | | | | | | | | |
(1) Net investment income per share was computed using average shares outstanding.
(2) The Fund, through its investment in the High Income Portfolio, has adopted the provisions of the revised AICPA Audit and Accounting Guide for Invetment Companies and began using the interest method to amortize premiums on fixed-income securities the efect of this change for the year ended october 31, 2002 was to decrease net investment income per share by $0.003, decrease net realized and unrealized losses per share by $0.003, and decrease the ratio of net investment income to average net assets from $5.01 to 4.98%. Per share data and ratios for the periods prior to November 1, 2001 have not been restated to reflect this change in presentation.
(3) Amounts represent less than $0.0005 per share.
(4) Returns are historical and are calculated by determining the percentage change in net asset value with all distributions reinvested. Total return is not computed on an annualized basis.
(5) Includes the Fund’s share of the Portfolios’ allocated expenses.
See notes to financial statements
8
| | Class B | |
| | Year Ended October 31, | |
| | 2005(1) | | 2004(1) | | 2003(1) | | 2002(1)(2) | | 2001 | |
Net asset value — Beginning of year | | $ | 9.700 | | $ | 9.600 | | $ | 9.140 | | $ | 9.550 | | $ | 9.930 | |
| | | | | | | | | | | |
Income (loss) from operations | | | | | | | | | | | |
Net investment income | | $ | 0.373 | | $ | 0.275 | | $ | 0.348 | | $ | 0.400 | | $ | 0.664 | |
Net realized and unrealized gain (loss) | | (0.017 | ) | 0.102 | | 0.465 | | (0.407 | ) | (0.382 | ) |
Total income (loss) from operations | | $ | 0.356 | | $ | 0.377 | | $ | 0.813 | | $ | (0.007 | ) | $ | 0.282 | |
| | | | | | | | | | | |
Less distributions | | | | | | | | | | | |
From net investment income | | $ | (0.377 | ) | $ | (0.277 | ) | $ | (0.353 | ) | $ | (0.403 | ) | $ | (0.662 | ) |
Total distributions | | $ | (0.377 | ) | $ | (0.277 | ) | $ | (0.353 | ) | $ | (0.403 | ) | $ | (0.662 | ) |
Redemption fees | | $ | 0.001 | | $ | 0.00 | (3) | $ | — | | $ | — | | $ | — | |
| | | | | | | | | | | |
Net asset value — End of year | | $ | 9.680 | | $ | 9.700 | | $ | 9.600 | | $ | 9.140 | | $ | 9.550 | |
Total Return(4) | | 3.74 | % | 3.98 | % | 9.05 | % | (0.13 | )% | 2.86 | % |
| | | | | | | | | | | |
Ratios/Supplemental Data† | | | | | | | | | | | |
Net assets, end of year (000’s omitted) | | $ | 163,795 | | $ | 182,045 | | $ | 161,457 | | $ | 165,834 | | $ | 202,557 | |
Ratios (As a percentage of average daily net assets): | | | | | | | | | | | |
Net expenses(5) | | 1.80 | % | 1.82 | % | 1.87 | % | 1.90 | % | 1.71 | % |
Net expenses after custodian fee reduction(5) | | 1.80 | % | 1.82 | % | 1.87 | % | 1.90 | % | 1.71 | % |
Net investment income | | 3.84 | % | 2.84 | % | 3.71 | % | 4.22 | % | 6.18 | % |
Portfolio Turnover of the Floating-Rate Portfolio | | 57 | % | 67 | % | 64 | % | 76 | % | 52 | % |
Portfolio Turnover of the High Income Portfolio | | 62 | % | 80 | % | 118 | % | 88 | % | 83 | % |
† The operating expenses of the Fund and the Portfolio may reflect a reduction of the investment adviser fee/administration fee, a reduction in the distribution and service fees, and an allocation of expenses to the Investment Adviser/Administrator. Had such actions not been taken, the ratios and net investment income per share would have been as follows:
Ratios (As a percentage of average daily net assets): | | | | | | | | | |
Expenses(5) | | | | | | | | | | 1.92 | % |
Expenses after custodian fee reduction(5) | | | | | | | | 1.92 | % |
Net investment income | | | | | | | | | | 5.97 | % |
Net investment income per share | | | | | | | | | | $ | 0.641 | |
| | | | | | | | | | | | |
(1) Net investment income per share was computed using average shares outstanding.
(2) The Fund, through its investment in the High Income Portfolio, has adopted the provisions of the revised AICPA Audit and Accounting Guide for Investment Companies and began using the interest method to amortize premiums on fixed-income securities. The effect of this change for the year ended October 31, 2002 was to decrease net investment income per share by $0.003, decrease net realized and unrealized losses per share by $0.003, and decrease the ratio of net investment income to average net assets from 4.25% to 4.22%. Per share data and ratios for the periods prior to November 1, 2001 have not been restated to reflect this change in presentation.
(3) Amounts represent less than $0.0005 per share.
(4) Returns are historical and are calculated by determining the percentage change in net asset value with all distributions reinvested. Total return is not computed on an annualized basis.
(5) Includes the Fund’s share of the Portfolios’ allocated expenses.
See notes to financial statements
9
| | Class C | |
| | Year Ended October 31, | |
| | 2005(1) | | 2004(1) | | 2003(1) | | 2002(1)(2) | | 2001 | |
Net asset value — Beginning of year | | $ | 9.700 | | $ | 9.600 | | $ | 9.140 | | $ | 9.540 | | $ | 9.930 | |
| | | | | | | | | | | |
Income (loss) from operations | | | | | | | | | | | |
Net investment income | | $ | 0.374 | | $ | 0.273 | | $ | 0.346 | | $ | 0.401 | | $ | 0.665 | |
Net realized and unrealized gain (loss) | | (0.018 | ) | 0.104 | | 0.467 | | (0.398 | ) | (0.393 | ) |
Total income from operations | | $ | 0.356 | | $ | 0.377 | | $ | 0.813 | | $ | 0.003 | | $ | 0.272 | |
| | | | | | | | | | | |
| | | | | | | | | | | |
Less distributions | | | | | | | | | | | |
From net investment income | | $ | (0.377 | ) | $ | (0.277 | ) | $ | (0.353 | ) | $ | (0.403 | ) | $ | (0.662 | ) |
Total distributions | | $ | (0.377 | ) | $ | (0.277 | ) | $ | (0.353 | ) | $ | (0.403 | ) | $ | (0.662 | ) |
Redemption fees | | $ | 0.001 | | $ | 0.00 | (3) | $ | — | | $ | — | | $ | — | |
| | | | | | | | | | | |
Net asset value — End of year | | $ | 9.680 | | $ | 9.700 | | $ | 9.600 | | $ | 9.140 | | $ | 9.540 | |
Total Return(4) | | 3.74 | % | 3.98 | % | 9.06 | % | (0.03 | )% | 2.75 | % |
| | | | | | | | | | | |
Ratios/Supplemental Data† | | | | | | | | | | | |
Net assets, end of year (000’s omitted) | | $ | 525,843 | | $ | 513,459 | | $ | 303,297 | | $ | 279,061 | | $ | 376,884 | |
Ratios (As a percentage of average daily net assets): | | | | | | | | | | | |
Net expenses(5) | | 1.80 | % | 1.82 | % | 1.87 | % | 1.91 | % | 1.66 | % |
Net expenses after custodian fee reduction(5) | | 1.80 | % | 1.82 | % | 1.87 | % | 1.91 | % | 1.66 | % |
Net investment income | | 3.85 | % | 2.83 | % | 3.69 | % | 4.23 | % | 6.35 | % |
Portfolio Turnover of the Floating-Rate Portfolio | | 57 | % | 67 | % | 64 | % | 76 | % | 52 | % |
Portfolio Turnover of the High Income Portfolio | | 62 | % | 80 | % | 118 | % | 88 | % | 83 | % |
† The operating expenses of the Fund and the Portfolio may reflect a reduction of the investment adviser fee/administration fee, and an allocation of expenses to the Investment Adviser/Administrator. Had such actions not been taken, the ratios and net investment income per share would have been as follows:
Ratios (As a percentage of average daily net assets): | | | | | | | | | |
Expenses(5) | | | | | | | | | | 1.89 | % |
Expenses after custodian fee reduction(5) | | | | | | | | 1.89 | % |
Net investment income | | | | | | | | | | 6.12 | % |
Net investment income per share | | | | | | | | | | $ | 0.641 | |
| | | | | | | | | | | | |
(1) Net investment income per share was computed using average shares outstanding.
(2) The Fund, through its investment in the High Income Portfolio, has adopted the provisions of the revised AICPA Audit and Accounting Guide for Investment Companies and began using the interest method to amortize premiums on fixed-income securities. The effect of this change for the year ended October 31, 2002 was to decrease net investment income per share by $0.003, decrease net realized and unrealized losses per share by $0.003, and decrease the ratio of net investment income to average net assets from 4.26% to 4.23%. Per share data and ratios for the periods prior to November 1, 2001 have not been restated to reflect this change in presentation.
(3) Amounts represent less than $0.0005 per share.
(4) Returns are historical and are calculated by determining the percentage change in net asset value with all distributions reinvested. Total return is not computed on an annualized basis.
(5) Includes the Fund’s share of the Portfolios’ allocated expenses.
See notes to financial statements
10
| | Institutional | |
| | Year Ended October 31, | |
| | 2005(1) | | 2004(1) | | 2003(1) | | 2002(1)(2) | | 2001 | |
Net asset value — Beginning of year | | $ | 9.710 | | $ | 9.610 | | $ | 9.150 | | $ | 9.550 | | $ | 9.940 | |
| | | | | | | | | | | |
Income (loss) from operations | | | | | | | | | | | |
Net investment income | | $ | 0.474 | | $ | 0.373 | | $ | 0.432 | | $ | 0.500 | | $ | 0.750 | |
Net realized and unrealized gain (loss) | | (0.020 | ) | 0.102 | | 0.476 | | (0.402 | ) | (0.398 | ) |
Total income from operations | | $ | 0.454 | | $ | 0.475 | | $ | 0.908 | | $ | 0.098 | | $ | 0.352 | |
| | | | | | | | | | | |
Less distributions | | | | | | | | | | | |
From net investment income | | $ | (0.475 | ) | $ | (0.375 | ) | $ | (0.448 | ) | $ | (0.498 | ) | $ | (0.742 | ) |
Total distributions | | $ | (0.475 | ) | $ | (0.375 | ) | $ | (0.448 | ) | $ | (0.498 | ) | $ | (0.742 | ) |
Redemption fees | | $ | 0.001 | | $ | 0.00 | (3) | $ | — | | $ | — | | $ | — | |
| | | | | | | | | | | |
Net asset value — End of year | | $ | 9.690 | | $ | 9.710 | | $ | 9.610 | | $ | 9.150 | | $ | 9.550 | |
Total Return(4) | | 4.78 | % | 5.02 | % | 10.14 | % | 0.98 | % | 3.58 | % |
| | | | | | | | | | | |
Ratios/Supplemental Data† | | | | | | | | | | | |
Net assets, end of year (000’s omitted) | | $ | 37,200 | | $ | 23,618 | | $ | 3,355 | | $ | 1,681 | | $ | 7,440 | |
Ratios (As a percentage of average daily net assets): | | | | | | | | | | | |
Net expenses(5) | | 0.80 | % | 0.82 | % | 0.87 | % | 0.94 | % | 0.58 | % |
Net expenses after custodian fee reduction(5) | | 0.80 | % | 0.82 | % | 0.87 | % | 0.94 | % | 0.58 | % |
Net investment income | | 4.88 | % | 3.85 | % | 4.59 | % | 5.24 | % | 7.95 | % |
Portfolio Turnover of the Floating-Rate Portfolio | | 57 | % | 67 | % | 64 | % | 76 | % | 52 | % |
Portfolio Turnover of the High Income Portfolio | | 62 | % | 80 | % | 118 | % | 88 | % | 83 | % |
† The operating expenses of the Fund and the Portfolio may reflect a reduction of the investment adviser fee/administration fee, a reduction in the distribution and service fees and an allocation of expenses to the Invesment Adviser/Administrator. Had such actions not been taken, the ratios and net investment income per share would have been as follows:
Ratios (As a percentage of average daily net assets): | | | | | | | | | |
Expenses(5) | | | | | | | | | | 0.71 | % |
Expenses after custodian fee reduction(5) | | | | | | | | 0.71 | % |
Net investment income | | | | | | | | | | 7.82 | % |
Net investment income per share | | | | | | | | | | $ | 0.738 | |
| | | | | | | | | | | | |
(1) Net investment income per share was computed using average shares outstanding.
(2) The Fund, through its investment in the High Income Portfolio, has adopted the provisions of the revised AICPA Audit and Accounting Guide for Investment Companies and began using the interest method to amortize premiums on fixed-income securities. The effect of this change for the year ended October 31, 2002 was to decrease net investment income per share by $0.003, decrease net realized and unrealized losses per share by $0.003, and decrease the ratio of net investment income to average net assets from 5.27% to 5.24%. Per share data and ratios for the periods prior to November 1, 2001 have not been restated to reflect this change in presentation.
(3) Amounts represent less than $0.0005 per share.
(4) Returns are historical and are calculated by determining the percentage change in net asset value with all distributions reinvested. Total return is not computed on an annualized basis.
(5) Includes the Fund’s share of the Portfolios’ allocated expenses.
See notes to financial statements
11
Eaton Vance Floating-Rate & High Income Fund as of October 31, 2005
NOTES TO FINANCIAL STATEMENTS
1 Significant Accounting Policies
Eaton Vance Floating-Rate & High Income Fund (the Fund) is a series of Eaton Vance Mutual Funds Trust (the Trust). The Trust is an entity of the type commonly known as a Massachusetts business trust and is registered under the Investment Company Act of 1940, as amended, as an open-end management investment company. The Fund offers five classes of shares. The Advisers and Institutional Classes of shares are generally sold at net asset value per share and assess a redemption fee of 1% for shares redeemed or exchanged within three months of purchase. Class A shares are generally sold subject to a sales charge imposed at time of purchase and assess a redemption fee of 1% for shares redeemed or exchanged within three months of purchase. Class B and Class C shares are sold at net asset value and are generally subject to a contingent deferred sales charge (see Note 6). Class B shares held for eight years will automatically convert to Class A shares. Each class represents a pro rata interest in the Fund, but votes separately on class-specific matters and (as noted below) is subject to different expenses. Realized and unrealized gains and losses are allocated daily to each class of shares based on the relative net assets of each class to the total net assets of the Fund. Net investment income, other than class specific expenses, is allocated daily to each class of shares based upon the ratio of the value of each class’ paid shares to the total value of all paid shares. Each class of shares differs in its distribution plan and certain other class specific expenses. The Fund invests all of its investable assets in interests in two Portfolios, Floating Rate Portfolio and High Income Portfolio (the Portfolios), New York trusts having the same investment objectives as the Fund. The value of the Fund’s investment in the Portfolios reflects the Fund’s proportionate interest in the net assets of the Floating Rate Portfolio and the High Income Portfolio (25.8% and 21.7% at October 31, 2005, respectively). The performance of the Fund is directly affected by the performance of the Portfolios. The financial statements of the Floating Rate Portfolio, including the portfolio of investments, are included elsewhere in this report and should be read in conjunction with the Fund’s financial statements. See Note 8 for further information on the results of operations of High Income Portfolio. A copy of the financial statements of High Income Portfolio is available on the EDGAR Database on The Securities and Exchange Commission’s website (www.sec.gov), at the Commission’s public reference room in Washington, D.C. or upon request from the Fund’s principal underwriter, Eaton Vance Distributors, Inc. (EVD), by calling 1-800-225-6265.
The following is a summary of significant accounting policies consistently followed by the Fund in the preparation of its financial statements. The policies are in conformity with accounting principles generally accepted in the United States of America.
A Investment Valuation — Valuation of securities by the Floating Rate Portfolio is discussed in Note 1A of the Portfolio’s Notes to Financial Statements, which are included elsewhere in this report. High Income Portfolio’s valuation policies are as follows: fixed income investments (other than short-term obligations), including listed investments and investments for which price quotations are available, will normally be valued on the basis of market valuations furnished by a pricing service. Other investments listed on securities exchanges are valued at closing sale prices on the exchange where such securities are principally traded. Marketable securities listed in the NASDAQ National Market system are valued at the NASDAQ official closing price. Listed or unlisted investments for which closing sale prices are not available are valued at the mean between the latest bid and asked prices. Financial futures contracts listed on commodity exchanges are valued at closing settlement prices. Short-term obligations, maturing in sixty days or less, are valued at amortized cost, which approximates value. Investments for which there are no quotations or valuations are valued at fair value using methods determined in good faith by or at the direction of the Trustees.
B Income — The Fund’s net investment income consists of the Fund’s pro rata share of the net investment income of the Portfolios, less all actual and accrued expenses of the Fund determined in accordance with accounting principles generally accepted in the United States of America.
C Federal Taxes — The Fund’s policy is to comply with the provisions of the Internal Revenue Code applicable to regulated investment companies and to distribute to shareholders each year all of its taxable income, including any net realized gain on investments. Accordingly, no provision for Federal income or excise tax is necessary. At October 31, 2005, the Fund, for federal income tax purposes, had a capital loss carryover of $31,111,429 which will reduce the Fund’s taxable income arising from future net realized gains on investments, if any, to the extent permitted by the Internal Revenue Code, and thus will reduce the amount of the distributions to shareholders which would otherwise be necessary to relieve the Fund of any liability for federal income or excise tax. Such
12
capital loss carryover will expire on October 31, 2008 ($9,059), October 31, 2009 ($7,397,085), October 31, 2010 ($16,168,986), October 31, 2011 ($2,993,864), October 31, 2012 ($2,290,023) and October 31, 2013 ($2,252,412).
D Use of Estimates — The preparation of the financial statements in conformity with accounting principles generally accepted in the United States of America requires management to make estimates and assumptions that affect the reported amounts of assets and liabilities at the date of the financial statements and the reported amounts of income and expense during the reporting period. Actual results could differ from those estimates.
E Expenses — The majority of expenses of the Trust are directly identifiable to an individual fund. Expenses which are not readily identifiable to a specific fund are allocated taking into consideration, among other things, the nature and type of expense and the relative size of the fund.
F Indemnifications — Under the Trust’s organizational documents, its officers and Trustees may be indemnified against certain liabilities and expenses arising out of the performance of their duties to the Fund, and shareholders are indemnified against personal liability for obligations of the Trust. Additionally, in the normal course of business, the Fund enters into agreements with service providers that may contain indemnification clauses. The Fund’s maximum exposure under these arrangements is unknown as this would involve future claims that may be made against the Fund that have not yet occurred.
2 Distributions to Shareholders
The net income of the Fund is determined daily and substantially all of the net income so determined is declared as a dividend to shareholders of record at the time of declaration. Distributions are paid monthly. Distributions of allocated realized capital gains, if any, are made at least annually. Shareholders may reinvest capital gain distributions in additional shares of the Fund at the net asset value as of the ex-dividend date. Distributions are paid in the form of additional shares or, at the election of the shareholder, in cash. The Fund distinguishes between distributions on a tax basis and a financial reporting basis. Accounting principles generally accepted in the United States of America require that only distributions in excess of tax basis earnings and profits be reported in the financial statements as a return of capital. Permanent differences between book and tax accounting relating to distributions are reclassified to paid-in capital.
The tax character of distributions paid for the period from the years ended October 31, 2005 and October 31, 2004 was as follows:
| | Year Ended October 31, | |
| | 2005 | | 2004 | |
Distributions declared from: | | | | | |
| | | | | |
Ordinary income | | $ | 80,959,572 | | $ | 33,801,869 | |
| | | | | | | |
During the year ended October 31, 2005, accumulated distributions in excess of net investment income was decreased by $1,199,489, and accumulated net realized loss was increased by $1,286,373 and paid in capital was increased by $86,884 primarily due to differences between book and tax accounting. This change had no effect on the net assets or the net asset value per share.
As of October 31, 2005, the components of distributable earnings (accumulated losses) on a tax basis were as follows:
Undistributed income | | $ | 2,720,327 | |
Capital loss carryforwards | | $ | (31,111,429 | ) |
Unrealized gain | | $ | 7,935,090 | |
Other temporary differences | | $ | (2,381,498 | ) |
3 Shares of Beneficial Interest
The Trust’s Declaration of Trust permits the Trustees to issue an unlimited number of full and fractional shares of beneficial interest (without par value). Transactions in Fund shares were as follows:
| | Year Ended October 31, | |
Advisers | | 2005 | | 2004 | |
Sales | | 51,182,623 | | 49,274,671 | |
Issued to shareholders electing to receive payments of distributions in Fund shares | | 2,135,355 | | 703,812 | |
Redemptions | | (28,816,968 | ) | (8,222,041 | ) |
Net increase | | 24,501,010 | | 41,756,442 | |
| | | | | |
| | Year Ended October 31, | |
Class A | | 2005 | | 2004 | |
Sales | | 30,010,219 | | 43,621,913 | |
Issued to shareholders electing to receive payments of distributions in Fund shares | | 1,611,517 | | 560,535 | |
Redemptions | | (27,503,909 | ) | (6,396,729 | ) |
Exchange from Class B shares | | 170,680 | | 179,651 | |
Net increase | | 4,288,507 | | 37,965,370 | |
13
| | Year Ended October 31, | |
Class B | | 2005 | | 2004 | |
Sales | | 1,730,075 | | 5,347,185 | |
Issued to shareholders electing to receive payments of distributions in Fund shares | | 444,269 | | 314,193 | |
Redemptions | | (3,832,405 | ) | (3,518,733 | ) |
Exchange to Class A shares | | (181,411 | ) | (189,925 | ) |
Net increase (decrease) | | (1,839,472 | ) | 1,952,720 | |
| | | | | |
| | Year Ended October 31, | |
Class C | | 2005 | | 2004 | |
Sales | | 17,775,075 | | 30,739,947 | |
Issued to shareholders electing to receive payments of distributions in Fund shares | | 1,479,069 | | 808,641 | |
Redemptions | | (17,848,184 | ) | (10,194,182 | ) |
Net increase | | 1,405,960 | | 21,354,406 | |
| | | | | |
| | Year Ended October 31, | |
Institutional | | 2005 | | 2004 | |
Sales | | 3,222,632 | | 2,600,023 | |
Issued to shareholders electing to receive payments of distributions in Fund shares | | 154,291 | | 31,534 | |
Redemptions | | (1,969,142 | ) | (547,877 | ) |
Net increase | | 1,407,781 | | 2,083,680 | |
Redemptions or exchanges of Advisers, Class A and Institutional Class shares made within three months of purchase are subject to a redemption fee equal to 1.00% of the amount redeemed. For the year ended October 31, 2005 the Fund received $119,705 in redemption fees.
4 Transactions with Affiliates
The Fund is authorized to pay Eaton Vance Management, (EVM), a fee as compensation for administrative services necessary to conduct the Fund’s business. The fee is computed at the annual rate of 0.15% of the Fund’s average daily net assets. For the year ended October 31, 2005, the fee amounted to $2,780,151. The Portfolios have engaged Boston Management and Research, (BMR), a subsidiary of EVM, to render investment advisory services. See Note 2 of each of the Portfolio’s Notes to Financial Statements. Except as to Trustees of the Fund and the Portfolios who are not members of EVM’s or BMR’s organization, officers and Trustees receive remuneration for their services to the Fund out of such investment adviser fee. EVM serves as the sub-transfer agent of the Fund and receives from the transfer agent an aggregate fee based upon the actual expenses incurred by EVM in the performance of those services. During the year ended October 31, 2005, EVM earned $68,011 in sub-transfer agent fees. Certain officers and Trustees of the Fund and of the Portfolios are officers of the above organizations. The Fund was informed that EVD, a subsidiary of EVM and the Fund’s principal underwriter, received $94,371 from the Fund as its portion of the sales charge on sales of Class A shares for the year ended October 31, 2005.
5 Distribution and Service Plans
The Fund has in effect distribution plans for Class B shares (Class B Plan) and Class C shares (Class C Plan) pursuant to Rule 12b-1 under the Investment Company Act of 1940 and a service plan for the Advisers shares (Advisers Plan) and Class A shares (Class A Plan) (collectively, the Plans). The Class B and Class C Plans require the Fund to pay Eaton Vance Distributors, Inc. (EVD), amounts equal to 0.75% of the Fund’s average daily net assets attributable to Class B and Class C shares, for providing ongoing distribution services and facilities to the Fund. The Fund will automatically discontinue payments to EVD during any period in which there are no outstanding Uncovered Distribution Charges, which are equivalent to the sum of (i) 6.25% of the aggregate amount received by the Fund for Class B and Class C shares sold, plus (ii) interest calculated by applying the rate of 1% over the prevailing prime rate to the outstanding balance of Uncovered Distribution Charges of EVD of each respective class, reduced by the aggregate amount of contingent deferred sales charges (see Note 6) and daily amounts theretofore paid to EVD by each respective class. For the year ended October 31, 2005, the Fund paid or accrued $1,316,435 and $4,083,659, respectively, to or payable to EVD representing 0.75% of average daily net assets of Class B and Class C shares, respectively. At October 31, 2005, the amount of Uncovered Distribution Charges of EVD calculated under the Plan was approximately $8,276,000 and $46,000,000 for Class B and Class C shares, respectively.
The Plans authorize the Fund to make payments of service fees to EVD, investment dealers and other persons in amounts equal to 0.25% of the Fund’s average daily net assets attributable to the Advisers Class, Class A, Class B, and Class C shares for each fiscal year. Service fee payments will be made for personal services and/or the maintenance of shareholder accounts. Service fees are separate and distinct from the sales commissions and distribution fees payable by the Fund to EVD, and, as such are not subject to automatic discontinuance where there are no outstanding Uncovered Distribution Charges of EVD. Service fee payments for the year ended October 31, 2005
14
amounted to $1,548,419, $1,195,083, $438,812, and $1,361,220 for Advisers Class, Class A, Class B, and Class C shares, respectively.
6 Contingent Deferred Sales Charge
A contingent deferred sales charge (CDSC) generally is imposed on redemptions of Class B shares made within six years of purchase and on redemptions of Class C shares made within one year of purchase. Generally, the CDSC is based on the lower of the net asset value at the date of redemption or date of purchase. No charge is levied on shares acquired by reinvestment of dividends or capital gains distributions. Class A shares purchased at net asset value in amounts of $1 million or more (other than shares purchased in a single transaction of $5 million or more) are subject to a 1.00% CDSC if redeemed within one year of purchase. Class B CDSC is imposed at declining rates that begin at 5% in the case of redemptions in the first and second years of redemption after purchase, declining one percentage point each subsequent year. Class C shares will be subject to a 1% CDSC if redeemed within one year of purchase. No CDSC is levied on shares which have been sold to EVM or its affiliates or to their respective employees or clients and may be waived under certain other limited conditions. CDSC charges are paid to EVD to reduce the amount of Uncovered Distribution Charges calculated under each Class’ Distribution Plan. CDSC charges received when no Uncovered Distribution Charges exist will be credited to the Fund. The Fund has been informed that EVD received approximately $115,000, $570,000, and $271,000 of CDSC paid by shareholders of Class A, Class B, and Class C shares, respectively, for the year ended October 31, 2005.
7 Investment Transactions
Increases and decreases in the Fund’s investment in the Floating Rate Portfolio for the year ended October 31, 2005, aggregated $406,210,672 and $168,166,296, respectively. Increases and decreases in the Fund’s investment in the High Income Portfolio for the year ended October 31, 2005, aggregated $60,355,775 and $88,936,180, respectively.
8 Investment in Portfolios
For the year ended October 31, 2005, the Fund was allocated net investment income and realized and unrealized gain (loss) from the Portfolios as follows:
| | Floating
Rate
Portfolio | | High
Income
Portfolio | | Total | |
Dividend income | | $ | 642 | | $ | 89,444 | | $ | 90,086 | |
Interest income | | 84,447,254 | | 20,007,461 | | 104,454,715 | |
Miscellaneous income | | — | | 413,220 | | 413,220 | |
Expenses | | (8,778,254 | ) | (1,371,126 | ) | (10,149,380 | ) |
Net investment income | | $ | 75,669,642 | | $ | 19,138,999 | | $ | 94,808,641 | |
Net realized gain (loss) — | | | | | | | |
Investments (identified cost basis) | | $ | (3,341,913 | ) | $ | 801,385 | | $ | (2,540,528 | ) |
Swap contracts | | 234,707 | | (2,635 | ) | 232,072 | |
Foreign currency, and forward foreign currency exchange contracts | | 1,102,692 | | 42,634 | | 1,145,326 | |
Net realized gain (loss) on investments | | $ | (2,004,514 | ) | $ | 841,384 | | $ | (1,163,130 | ) |
Change in unrealized appreciation (depreciation) — | | $ | 468,362 | | $ | (5,902,185 | ) | $ | (5,433,823 | ) |
Investment transactions | | | | | | | |
Swap contracts | | 84,752 | | 55,218 | | 139,970 | |
Foreign currency and forward foreign currency exchange contracts | | 1,011,576 | | (5,253 | ) | 1,006,323 | |
Net change in unrealized appreciation (depreciation) | | $ | 1,564,690 | | $ | (5,852,220 | ) | $ | (4,287,530 | ) |
| | | | | | | | | | | |
15
Eaton Vance Floating-Rate & High Income Fund as of October 31, 2005
REPORT OF INDEPENDENT REGISTERED PUBLIC ACCOUNTING FIRM
To the Trustees and Shareholders of Eaton Vance
Floating-Rate & High Income Fund:
We have audited the accompanying statement of assets and liabilities of Eaton Vance Floating-Rate & High Income Fund (the Fund) as of October 31, 2005, the related statement of operations for the year then ended, the statements of changes in net assets for each of the two years in the period then ended, and the financial highlights for each of the five years in the period then ended. These financial statements and financial highlights are the responsibility of the Fund’s management. Our responsibility is to express an opinion on these financial statements and financial highlights based on our audits.
We conducted our audits in accordance with the standards of the Public Company Accounting Oversight Board (United States). Those standards require that we plan and perform the audits to obtain reasonable assurance about whether the financial statements and financial highlights are free of material misstatement. The Fund is not required to have, nor were we engaged to perform, an audit of its internal control over financial reporting. Our audit included consideration of internal control over financial reporting as a basis for designing audit procedures that are appropriate in the circumstances, but not for the purpose of expressing an opinion on the effectiveness of the Fund’s internal control over financial reporting. Accordingly, we express no such opinion. An audit also includes examining, on a test basis, evidence supporting the amounts and disclosures in the financial statements, assessing the accounting principles used and significant estimates made by management, as well as evaluating the overall financial statement presentation. We believe that our audits provide a reasonable basis for our opinion.
In our opinion, such financial statements and financial highlights referred to above present fairly, in all material respects, the financial position of the Eaton Vance Floating-Rate & High Income Fund as of October 31, 2005, the results of its operations for the year then ended, the changes in its net assets for each of the two years in the period then ended and the financial highlights for each of the five years in the period then ended, in conformity with accounting principles generally accepted in the United States of America.
DELOITTE & TOUCHE LLP
Boston, Massachusetts
December 19, 2005
16
Eaton Vance Floating-Rate & High Income Fund as of October 31, 2005
FEDERAL TAX INFORMATION (Unaudited)
The Form 1099-DIV you receive in January 2006 will show the tax status of all distributions paid to your account in calendar 2005. Shareholders are advised to consult their own tax adviser with respect to the tax consequences of their investment in the Fund.
17
Floating Rate Portfolio as of October 31, 2005
PORTFOLIO OF INVESTMENTS
Senior, Floating Rate Interests — 96.8% (1)
Principal | | | | | |
Amount | | Borrower/Tranche Description | | Value | |
| | | | | |
Aerospace and Defense — 1.9% | | | |
| | | | | |
| | Alliant Techsystems, Inc. | | | |
$ | 4,189,500 | | Term Loan, 5.23%, Maturing March 31, 2009 | | $ | 4,214,377 | |
| | CACI International, Inc. | | | |
9,288,575 | | Term Loan, 5.23%, Maturing May 3, 2011 | | 9,395,003 | |
| | Ceradyne, Inc. | | | |
7,647,700 | | Term Loan, 6.00%, Maturing August 18, 2011 | | 7,685,939 | |
| | Delta Air Lines, Inc. | | | |
8,800,000 | | Term Loan, 10.39%, Maturing March 16, 2008 | | 9,128,170 | |
| | Dresser Rand Group, Inc. | | | |
787,623 | | Term Loan, 4.44%, Maturing October 29, 2011 | | EUR | 952,220 | |
7,736,979 | | Term Loan, 6.08%, Maturing October 29, 2011 | | 7,867,540 | |
| | DRS Technologies, Inc. | | | |
7,547,338 | | Term Loan, 5.77%, Maturing November 4, 2010 | | 7,606,305 | |
| | Hexcel Corp. | | | |
10,960,222 | | Term Loan, 5.81%, Maturing March 1, 2012 | | 11,076,675 | |
| | K&F Industries, Inc. | | | |
9,992,100 | | Term Loan, 6.38%, Maturing November 18, 2012 | | 10,110,757 | |
| | Mid-Western Aircraft Systems, Inc. | | | |
6,364,050 | | Term Loan, 6.41%, Maturing December 31, 2011 | | 6,453,942 | |
| | Standard Aero Holdings, Inc. | | | |
9,364,354 | | Term Loan, 6.25%, Maturing August 24, 2012 | | 9,484,339 | |
| | Transdigm, Inc. | | | |
16,632,230 | | Term Loan, 6.19%, Maturing July 22, 2010 | | 16,895,568 | |
| | Vought Aircraft Industries, Inc. | | | |
4,000,000 | | Term Loan, 6.09%, Maturing December 22, 2010 | | 4,050,624 | |
7,620,824 | | Term Loan, 6.59%, Maturing December 22, 2011 | | 7,707,510 | |
| | Wam Aquisition, S.A. | | | |
4,714,710 | | Term Loan, 6.77%, Maturing April 8, 2013 | | 4,730,966 | |
4,714,710 | | Term Loan, 7.27%, Maturing April 8, 2014 | | 4,747,930 | |
| | Wyle Laboratories, Inc. | | | |
4,492,425 | | Term Loan, 6.46%, Maturing January 28, 2011 | | 4,557,004 | |
| | | | $ | 126,664,869 | |
| | | | | |
Air Transport — 0.2% | | | |
| | | | | |
| | United Airlines, Inc. | | | |
$ | 16,055,570 | | DIP Loan, 7.96%, Maturing December 31, 2006 | | $ | 16,251,255 | |
| | | | $ | 16,251,255 | |
Automotive — 4.0% | | | |
| | | | | |
| | AA Acquisitions Co., Ltd. | | | |
$ | 1,500,000 | | Term Loan, 7.36%, Maturing June 25, 2012 | | GBP | 2,680,989 | |
1,500,000 | | Term Loan, 7.86%, Maturing June 25, 2013 | | GBP | 2,690,137 | |
| | Accuride Corp. | | | |
14,611,155 | | Term Loan, 6.18%, Maturing January 31, 2012 | | 14,724,392 | |
| | Affina Group, Inc. | | | |
5,741,171 | | Term Loan, 6.40%, Maturing November 30, 2011 | | 5,752,831 | |
| | Collins & Aikman Products Co. | | | |
7,008,070 | | Term Loan, 10.25%, Maturing August 31, 2011 | | 6,741,511 | |
| | CSA Acquisition Corp. | | | |
4,698,665 | | Term Loan, 6.06%, Maturing December 23, 2011 | | 4,728,032 | |
3,990,512 | | Term Loan, 6.06%, Maturing December 23, 2011 | | 4,015,452 | |
| | Dayco Products, LLC | | | |
12,559,598 | | Term Loan, 7.04%, Maturing June 23, 2011 | | 12,708,744 | |
| | Dura Operating Corp. | | | |
2,500,000 | | Revolving Loan, 0.00%, Maturing May 3, 2011(2) | | 2,462,500 | |
3,718,000 | | Term Loan, 7.44%, Maturing May 3, 2011 | | 3,741,237 | |
| | Exide Technologies, Inc. | | | |
3,892,568 | | Term Loan, 9.37%, Maturing May 5, 2010 | | 3,921,762 | |
2,995,782 | | Term Loan, 9.37%, Maturing May 5, 2010 | | 3,014,506 | |
| | Federal-Mogul Corp. | | | |
4,995,670 | | Revolving Loan, 5.83%, Maturing December 9, 2006(2) | | 4,679,280 | |
4,108,827 | | Term Loan, 6.33%, Maturing December 9, 2006 | | 3,870,429 | |
6,000,000 | | Term Loan, 6.58%, Maturing December 9, 2006 | | 5,659,374 | |
5,137,364 | | Term Loan, 7.83%, Maturing December 9, 2006 | | 5,150,207 | |
12,795,732 | | Revolving Loan, 7.83%, Maturing December 9, 2006(2) | | 12,835,719 | |
| | Goodyear Tire & Rubber Co. | | | |
13,000,000 | | Revolving Loan, 0.00%, Maturing April 30, 2010(2) | | 12,951,250 | |
5,890,000 | | Term Loan, 3.50%, Maturing April 30, 2010 | | 5,942,592 | |
19,720,000 | | Term Loan, 7.06%, Maturing April 30, 2010 | | 19,915,149 | |
1,000,000 | | Term Loan, 7.81%, Maturing March 1, 2011 | | 994,250 | |
| | HLI Operating Co., Inc. | | | |
9,067,291 | | Term Loan, 7.15%, Maturing June 3, 2009 | | 9,055,150 | |
| | Insurance Auto Auctions, Inc. | | | |
2,485,000 | | Term Loan, 6.45%, Maturing May 19, 2012 | | 2,519,169 | |
| | Key Automotive Group | | | |
5,159,645 | | Term Loan, 6.86%, Maturing June 29, 2010 | | 5,159,645 | |
| | Keystone Automotive Operations, Inc. | | | |
11,573,952 | | Term Loan, 5.80%, Maturing October 30, 2009 | | 11,675,224 | |
| | Plastech Engineered Products, Inc. | | | |
2,430,911 | | Term Loan, 8.77%, Maturing March 31, 2010 | | 2,321,520 | |
| | | | | | | | |
See notes to financial statements
18
Principal | | | | | |
Amount | | Borrower/Tranche Description | | Value | |
| | | | | |
Automotive (continued) | | | |
| | | | | |
| | R.J. Tower Corp. | | | |
$ | 6,120,000 | | DIP Revolving Loan, 5.45%, Maturing February 2, 2007(2) | | $ | 6,108,525 | |
1,000,000 | | DIP Revolving Loan, 7.25%, Maturing February 2, 2007 | | 1,018,958 | |
| | Speedy 1, Ltd. | | | |
1,978,627 | | Term Loan, 4.52%, Maturing August 31, 2013 | | EUR | 2,400,451 | |
1,978,627 | | Term Loan, 5.02%, Maturing August 31, 2014 | | EUR | 2,411,163 | |
| | Tenneco Automotive, Inc. | | | |
11,860,733 | | Term Loan, 6.08%, Maturing December 12, 2009 | | 12,059,033 | |
4,505,755 | | Term Loan, 6.11%, Maturing December 12, 2010 | | 4,581,087 | |
| | The Goodyear Dunlop Tires | | | |
1,000,000 | | Term Loan, 4.52%, Maturing April 30, 2010 | | EUR | 1,201,742 | |
| | TI Automotive, Ltd. | | | |
7,547,855 | | Term Loan, 6.91%, Maturing June 30, 2011 | | 7,425,202 | |
| | Trimas Corp. | | | |
8,447,689 | | Term Loan, 7.69%, Maturing December 31, 2009 | | 8,539,203 | |
| | TRW Automotive, Inc. | | | |
13,994,250 | | Term Loan, 4.94%, Maturing October 31, 2010 | | 14,100,956 | |
21,104,942 | | Term Loan, 5.25%, Maturing June 30, 2012 | | 21,331,377 | |
| | United Components, Inc. | | | |
7,108,157 | | Term Loan, 6.26%, Maturing June 30, 2010 | | 7,223,665 | |
| | | | $ | 258,312,413 | |
| | | | | |
Beverage and Tobacco — 1.3% | | | |
| | | | | |
| | Alliance One International, Inc. | | | |
$ | 5,522,250 | | Term Loan, 6.73%, Maturing May 13, 2010 | | $ | 5,522,250 | |
| | Constellation Brands, Inc. | | | |
30,902,710 | | Term Loan, 5.66%, Maturing November 30, 2011 | | 31,275,489 | |
| | Culligan International Co. | | | |
7,573,500 | | Term Loan, 6.47%, Maturing September 30, 2011 | | 7,671,327 | |
| | National Dairy Holdings, L.P. | | | |
8,427,650 | | Term Loan, 6.08%, Maturing March 15, 2012 | | 8,496,125 | |
| | National Distribution Company | | | |
5,380,000 | | Term Loan, 10.56%, Maturing June 22, 2010 | | 5,393,450 | |
| | Southern Wine & Spirits of America, Inc. | | | |
23,450,375 | | Term Loan, 5.53%, Maturing May 31, 2012 | | 23,694,657 | |
| | Sunny Delight Beverages Co. | | | |
1,811,640 | | Term Loan, 8.25%, Maturing August 20, 2010 | | 1,827,491 | |
| | | | $ | 83,880,789 | |
| | | | | |
Building and Development — 7.5% | | | |
| | | | | |
| | 401 North Wabash Venture, LLC | | | |
$ | 9,500,000 | | Term Loan, 7.87%, Maturing May 7, 2008(2) | | $ | 9,595,000 | |
| | Biomed Realty, L.P. | | | |
21,175,000 | | Term Loan, 6.11%, Maturing May 31, 2010 | | 21,201,469 | |
| | Contech Construction Products, Inc. | | | |
2,279,540 | | Term Loan, 6.15%, Maturing December 7, 2010 | | 2,315,871 | |
| | DMB/CHII, LLC | | | |
409,692 | | Term Loan, 6.44%, Maturing March 3, 2007 | | 410,716 | |
| | Empire Hawkeye Partners, L.P. | | | |
12,000,000 | | Term Loan, 5.54%, Maturing December 1, 2009(2) | | 12,015,000 | |
| | Formica Corp. | | | |
3,724,771 | | Term Loan, 9.03%, Maturing June 10, 2010 | | 3,743,395 | |
2,584,057 | | Term Loan, 9.03%, Maturing June 10, 2010 | | 2,596,977 | |
1,321,506 | | Term Loan, 9.03%, Maturing June 10, 2010 | | 1,328,114 | |
1,066,353 | | Term Loan, 9.03%, Maturing June 10, 2010 | | 1,071,685 | |
| | FT-FIN Acquisition, LLC | | | |
7,140,190 | | Term Loan, 8.56%, Maturing November 17, 2007 | | 7,158,041 | |
| | General Growth Properties, Inc. | | | |
5,108,024 | | Term Loan, 5.61%, Maturing November 12, 2007 | | 5,134,627 | |
53,827,782 | | Term Loan, 6.09%, Maturing November 12, 2008 | | 54,484,912 | |
| | Hovstone Holdings, LLC | | | |
8,520,000 | | Term Loan, 6.29%, Maturing February 28, 2009 | | 8,541,300 | |
| | Kyle Acquisition Group, LLC | | | |
3,531,157 | | Term Loan, 6.06%, Maturing July 20, 2008 | | 3,575,297 | |
3,268,843 | | Term Loan, 6.06%, Maturing July 20, 2010 | | 3,309,703 | |
| | Landsource Communities, LLC | | | |
18,000,000 | | Term Loan, 6.50%, Maturing March 31, 2010 | | 18,163,134 | |
| | Lion Gables Realty Limited | | | |
11,904,579 | | Term Loan, 5.63%, Maturing September 30, 2006 | | 11,968,566 | |
| | LNR Property Corp. | | | |
33,711,829 | | Term Loan, 6.73%, Maturing February 3, 2008 | | 33,985,738 | |
| | LNR Property Holdings | | | |
5,650,000 | | Term Loan, 8.23%, Maturing March 8, 2008 | | 5,674,719 | |
| | Longyear Holdings, Inc. | | | |
3,758,580 | | Term Loan, 6.53%, Maturing July 28, 2012 | | 3,763,278 | |
939,645 | | Term Loan, 6.53%, Maturing July 28, 2012 | | 940,820 | |
| | MAAX Corp. | | | |
6,670,586 | | Term Loan, 6.75%, Maturing June 4, 2011 | | 6,637,233 | |
| | Mueller Group, Inc. | | | |
17,625,000 | | Term Loan, 6.40%, Maturing October 3, 2012 | | 17,881,514 | |
| | | | | | | | |
See notes to financial statements
19
Principal | | | | | |
Amount | | Borrower/Tranche Description | | Value | |
| | | | | |
Building and Development (continued) | | | |
| | | | | |
| | NCI Building Systems, Inc. | | | |
$ | 9,016,184 | | Term Loan, 4.93%, Maturing June 18, 2010 | | $ | 9,064,087 | |
| | Newkirk Master, L.P. | | | |
29,062,620 | | Term Loan, 6.02%, Maturing August 11, 2008 | | 29,498,559 | |
| | Newkirk Tender Holdings, LLC | | | |
5,401,619 | | Term Loan, 8.59%, Maturing May 25, 2006 | | 5,415,123 | |
2,333,333 | | Term Loan, 10.09%, Maturing May 25, 2006 | | 2,339,167 | |
| | Nortek, Inc. | | | |
21,324,588 | | Term Loan, 5.92%, Maturing August 27, 2011 | | 21,575,152 | |
| | Panolam Industries Holdings, Inc. | | | |
4,525,000 | | Term Loan, 6.77%, Maturing September 30, 2012 | | 4,592,875 | |
| | Ply Gem Industries, Inc. | | | |
8,872,592 | | Term Loan, 6.16%, Maturing February 12, 2011 | | 8,933,591 | |
1,303,717 | | Term Loan, 6.16%, Maturing February 12, 2011 | | 1,312,680 | |
3,345,832 | | Term Loan, 6.64%, Maturing February 12, 2011 | | 3,368,835 | |
| | Shea Mountain House, LLC | | | |
3,000,000 | | Term Loan, 5.80%, Maturing May 11, 2010 | | 3,033,750 | |
| | South Edge, LLC | | | |
4,455,357 | | Term Loan, 5.31%, Maturing October 31, 2007 | | 4,475,776 | |
10,794,643 | | Term Loan, 5.56%, Maturing October 31, 2009 | | 10,911,581 | |
| | St. Marys Cement, Inc. | | | |
16,138,408 | | Term Loan, 6.02%, Maturing December 4, 2010 | | 16,420,830 | |
| | Stile Acquisition Corp. | | | |
19,854,933 | | Term Loan, 6.20%, Maturing April 6, 2013 | | 19,804,164 | |
| | Stile U.S. Acquisition Corp. | | | |
19,885,367 | | Term Loan, 6.20%, Maturing April 6, 2013 | | 19,834,520 | |
| | Sugarloaf Mills, L.P. | | | |
12,000,000 | | Term Loan, 5.79%, Maturing April 7, 2007 | | 12,060,000 | |
5,975,000 | | Term Loan, 6.94%, Maturing April 7, 2007 | | 5,975,000 | |
| | Sunstone Hotel Partnership, LLC | | | |
10,000,000 | | Revolving Loan, 0.00%, Maturing October 26, 2007(2) | | 9,900,000 | |
3,710,247 | | Term Loan, 6.33%, Maturing October 26, 2008 | | 3,710,247 | |
| | TE / Tousa Senior, LLC | | | |
3,000,000 | | Revolving Loan, 0.00%, Maturing July 29, 2008(2)(3) | | 2,985,000 | |
7,350,000 | | Term Loan, 6.56%, Maturing August 1, 2008 | | 7,469,437 | |
| | The Woodlands Community Property Co. | | | |
9,888,000 | | Term Loan, 6.11%, Maturing November 30, 2007 | | 9,949,800 | |
4,090,000 | | Term Loan, 8.11%, Maturing November 30, 2007 | | 4,151,350 | |
| | Tousa/Kolter, LLC | | | |
12,620,000 | | Term Loan, 6.11%, Maturing January 7, 2008(2) | | 12,683,100 | |
| | Tower Financing, LLC | | | |
7,300,000 | | Term Loan, 7.54%, Maturing July 9, 2008 | | 7,309,125 | |
| | Trustreet Properties, Inc. | | | |
$ | 5,700,000 | | Term Loan, 5.86%, Maturing April 8, 2010 | | $ | 5,753,437 | |
| | Whitehall Street Real Estate, L.P. | | | |
7,737,500 | | Term Loan, 7.83%, Maturing September 11, 2006(3) | | 7,867,490 | |
| | | | $ | 485,891,785 | |
| | | | | |
Business Equipment and Services — 4.0% | | | |
| | | | | |
| | Acco Brands Corp. | | | |
$ | 4,435,000 | | Term Loan, 5.73%, Maturing August 17, 2012 | | $ | 4,490,992 | |
| | Affinion Group, Inc. | | | |
16,100,000 | | Term Loan, 6.91%, Maturing October 17, 2012 | | 16,002,724 | |
| | Allied Security Holdings, LLC | | | |
8,075,000 | | Term Loan, 7.78%, Maturing June 30, 2010 | | 8,186,031 | |
| | Baker & Taylor, Inc. | | | |
10,800,000 | | Revolving Loan, 5.66%, Maturing May 6, 2011(2) | | 10,746,000 | |
4,650,000 | | Term Loan, 10.65%, Maturing May 6, 2011 | | 4,708,125 | |
| | Buhrmann US, Inc. | | | |
10,888,664 | | Term Loan, 6.30%, Maturing December 31, 2010 | | 11,099,632 | |
| | DynCorp International, LLC | | | |
8,094,325 | | Term Loan, 6.75%, Maturing February 11, 2011 | | 8,128,054 | |
| | Global Imaging Systems, Inc. | | | |
8,564,697 | | Term Loan, 5.38%, Maturing May 10, 2010 | | 8,628,932 | |
| | Info USA, Inc. | | | |
4,510,417 | | Term Loan, 6.53%, Maturing March 25, 2009 | | 4,521,693 | |
2,673,750 | | Term Loan, 6.78%, Maturing June 4, 2010 | | 2,680,434 | |
| | Iron Mountain, Inc. | | | |
19,916,913 | | Term Loan, 5.63%, Maturing April 2, 2011 | | 20,125,423 | |
25,308,750 | | Term Loan, 5.72%, Maturing April 2, 2011 | | 25,553,941 | |
| | Language Line, Inc. | | | |
11,975,572 | | Term Loan, 8.45%, Maturing June 11, 2011 | | 12,084,849 | |
| | Mitchell International, Inc. | | | |
5,468,560 | | Term Loan, 6.15%, Maturing August 11, 2011 | | 5,521,540 | |
| | Protection One, Inc. | | | |
7,182,354 | | Term Loan, 6.91%, Maturing April 18, 2011 | | 7,269,892 | |
| | Sungard Data Systems, Inc. | | | |
89,121,638 | | Term Loan, 6.28%, Maturing February 11, 2013 | | 90,007,774 | |
| | Transaction Network Services, Inc. | | | |
5,672,859 | | Term Loan, 5.85%, Maturing May 4, 2012 | | 5,729,588 | |
| | US Investigations Services, Inc. | | | |
5,100,000 | | Term Loan, 6.57%, Maturing October 14, 2012 | | 5,157,375 | |
See notes to financial statements
20
Principal | | | | | |
Amount | | Borrower/Tranche Description | | Value | |
| | | | | |
Business Equipment and Services (continued) | | | |
| | | | | |
| | Western Inventory Services | | | |
$ | 1,726,191 | | Term Loan, 6.97%, Maturing March 31, 2011 | | $ | 1,741,295 | |
1,514,203 | | Term Loan, 6.99%, Maturing March 31, 2011 | | 1,527,452 | |
1,000,000 | | Term Loan, 10.77%, Maturing October 14, 2011 | | 1,010,000 | |
| | Williams Scotsman, Inc. | | | |
5,250,000 | | Term Loan, 6.66%, Maturing June 27, 2010 | | 5,318,906 | |
| | | | $ | 260,240,652 | |
| | | | | |
Cable and Satellite Television — 4.2% | | | |
| | | | | |
| | Adelphia Communications Corp. | | | |
$ | 21,356,806 | | DIP Loan, 6.31%, Maturing March 31, 2006 | | $ | 21,463,590 | |
| | Atlantic Broadband Finance, LLC | | | |
9,948,328 | | Term Loan, 6.52%, Maturing September 1, 2011 | | 10,122,424 | |
| | Bragg Communications, Inc. | | | |
7,647,018 | | Term Loan, 5.86%, Maturing August 31, 2011 | | 7,756,944 | |
| | Bresnan Communications, LLC | | | |
3,312,528 | | Term Loan, 7.57%, Maturing September 30, 2009 | | 3,360,146 | |
3,000,000 | | Term Loan, 7.48%, Maturing September 30, 2010 | | 3,045,000 | |
| | Canadian Cable Acquisition Co., Inc. | | | |
6,618,150 | | Term Loan, 7.02%, Maturing July 30, 2011 | | 6,686,403 | |
| | Cebridge Connections, Inc. | | | |
5,220,500 | | Term Loan, 7.04%, Maturing February 23, 2009 | | 5,253,128 | |
| | Charter Communications Operating, LLC | | | |
11,985,100 | | Term Loan, 7.25%, Maturing April 27, 2010 | | 11,983,098 | |
60,502,905 | | Term Loan, 7.50%, Maturing April 27, 2011 | | 60,732,332 | |
| | EWT Elektro & Nachrichtentech | | | |
3,500,000 | | Term Loan, 5.12%, Maturing November 30, 2012 | | EUR | 4,197,365 | |
| | Iesy Hessen GmbH and Co., KG | | | |
8,900,000 | | Term Loan, 4.88%, Maturing February 14, 2013 | | EUR | 10,719,745 | |
4,600,000 | | Term Loan, 5.38%, Maturing February 14, 2014 | | EUR | 5,566,124 | |
| | Insight Midwest Holdings, LLC | | | |
23,987,812 | | Term Loan, 6.06%, Maturing December 31, 2009 | | 24,355,137 | |
| | Kabel Deutschland GmbH | | | |
4,555,169 | | Term Loan, 4.40%, Maturing March 29, 2011 | | EUR | 5,480,767 | |
| | MCC Iowa, LLC | | | |
2,398,250 | | Term Loan, 5.35%, Maturing March 31, 2010 | | 2,398,749 | |
9,872,900 | | Term Loan, 6.03%, Maturing February 3, 2014 | | 10,027,164 | |
| | Mediacom Illinois, LLC | | | |
2,000,000 | | Term Loan, 5.27%, Maturing September 30, 2012 | | 2,000,358 | |
16,326,625 | | Term Loan, 6.28%, Maturing March 31, 2013 | | 16,599,590 | |
| | NTL, Inc. | | | |
$ | 11,300,000 | | Term Loan, 7.14%, Maturing April 13, 2012 | | $ | 11,357,438 | |
| | UGS Corp. | | | |
26,696,123 | | Term Loan, 6.08%, Maturing March 31, 2012 | | 27,121,606 | |
| | UPC Broadband Holdings B.V. | | | |
7,000,000 | | Term Loan, 4.67%, Maturing September 30, 2012 | | EUR | 8,336,250 | |
13,090,000 | | Term Loan, 6.55%, Maturing September 30, 2012 | | 13,217,497 | |
| | | | $ | 271,780,855 | |
| | | | | |
Chemicals and Plastics — 5.3% | | | |
| | | | | |
| | Basell Af S.A.R.L. | | | |
$ | 961,538 | | Term Loan, 4.62%, Maturing August 1, 2013 | | EUR | 1,161,545 | |
538,462 | | Term Loan, 4.62%, Maturing August 1, 2013 | | EUR | 650,800 | |
833,333 | | Term Loan, 6.58%, Maturing August 1, 2013 | | 847,657 | |
166,667 | | Term Loan, 6.58%, Maturing August 1, 2013 | | 169,462 | |
961,538 | | Term Loan, 5.24%, Maturing August 1, 2014 | | EUR | 1,165,719 | |
538,462 | | Term Loan, 5.24%, Maturing August 1, 2014 | | EUR | 653,179 | |
833,333 | | Term Loan, 7.24%, Maturing August 1, 2014 | | 848,698 | |
166,667 | | Term Loan, 7.24%, Maturing August 1, 2014 | | 169,670 | |
| | Brenntag AG | | | |
16,680,000 | | Term Loan, 6.81%, Maturing February 27, 2012 | | 16,761,315 | |
1,423,099 | | Term Loan, 5.41%, Maturing December 9, 2012 | | EUR | 1,714,809 | |
| | Celanese AG | | | |
7,250,000 | | Term Loan, 3.89%, Maturing June 4, 2011 | | 7,319,100 | |
| | Celanese Holdings, LLC | | | |
25,260,088 | | Term Loan, 6.31%, Maturing April 6, 2011 | | 25,657,934 | |
| | Gentek, Inc. | | | |
5,266,997 | | Term Loan, 6.61%, Maturing February 25, 2011 | | 5,309,133 | |
| | Hercules, Inc. | | | |
8,501,262 | | Term Loan, 5.86%, Maturing October 8, 2010 | | 8,609,653 | |
| | Hexion Specialty Chemicals, Inc. | | | |
3,437,726 | | Term Loan, 3.16%, Maturing May 31, 2012 | | 3,484,995 | |
6,787,180 | | Term Loan, 6.38%, Maturing May 31, 2012 | | 6,880,504 | |
9,372,773 | | Term Loan, 6.56%, Maturing May 31, 2012 | | 9,501,649 | |
| | Huntsman, LLC | | | |
3,892,000 | | Term Loan, 4.12%, Maturing August 16, 2012 | | EUR | 4,719,914 | |
32,351,421 | | Term Loan, 5.72%, Maturing August 16, 2012 | | 32,562,287 | |
| | Innophos, Inc. | | | |
13,206,741 | | Term Loan, 6.21%, Maturing August 13, 2010 | | 13,369,078 | |
| | Invista B.V. | | | |
14,803,412 | | Term Loan, 6.31%, Maturing April 29, 2011 | | 15,053,219 | |
6,422,707 | | Term Loan, 6.31%, Maturing April 29, 2011 | | 6,531,090 | |
| | | | | | | | |
See notes to financial statements
21
Principal | | | | | |
Amount | | Borrower/Tranche Description | | Value | |
| | | | | |
Chemicals and Plastics (continued) | | | |
| | | | | |
| | ISP Chemco, Inc. | | | |
$ | 12,484,875 | | Term Loan, 5.83%, Maturing March 27, 2011 | | $ | 12,640,936 | |
| | Kraton Polymer | | | |
10,705,611 | | Term Loan, 6.42%, Maturing December 23, 2010 | | 10,879,577 | |
| | Mosaic Co. | | | |
12,034,525 | | Term Loan, 5.23%, Maturing February 21, 2012 | | 12,179,312 | |
| | Nalco Co. | | | |
1,072,971 | | Term Loan, 6.52%, Maturing November 4, 2009 | | 1,088,227 | |
33,306,320 | | Term Loan, 5.81%, Maturing November 4, 2010 | | 33,845,249 | |
| | PQ Corp. | | | |
8,452,525 | | Term Loan, 6.06%, Maturing February 11, 2012 | | 8,521,202 | |
| | Professional Paint, Inc. | | | |
3,217,013 | | Term Loan, 7.18%, Maturing September 30, 2011 | | 3,241,140 | |
| | Rockwood Specialties Group, Inc. | | | |
3,362,530 | | Term Loan, 4.69%, Maturing July 30, 2011 | | EUR | 4,027,470 | |
25,795,375 | | Term Loan, 6.47%, Maturing December 10, 2012 | | 26,238,746 | |
| | Sigmakalon (BC) Holdco B.V. | | | |
141,929 | | Term Loan, 4.87%, Maturing September 9, 2013 | | EUR | 169,996 | |
2,778,106 | | Term Loan, 4.87%, Maturing September 9, 2013 | | EUR | 3,327,476 | |
5,079,965 | | Term Loan, 4.87%, Maturing September 9, 2013 | | EUR | 6,084,528 | |
1,725,707 | | Term Loan, 5.37%, Maturing September 9, 2014 | | EUR | 2,066,966 | |
483,547 | | Term Loan, 5.37%, Maturing September 9, 2014 | | EUR | 579,169 | |
422,542 | | Term Loan, 5.37%, Maturing September 9, 2014 | | EUR | 506,099 | |
5,368,204 | | Term Loan, 5.37%, Maturing September 9, 2014 | | EUR | 6,429,766 | |
| | Solo Cup Co. | | | |
19,719,841 | | Term Loan, 6.44%, Maturing February 27, 2011 | | 19,808,580 | |
| | TPG Spring Lux III S.A.R.L. | | | |
2,545,551 | | Term Loan, 5.37%, Maturing June 27, 2013 | | EUR | 3,045,123 | |
2,545,551 | | Term Loan, 5.37%, Maturing June 27, 2014 | | EUR | 3,060,367 | |
| | TPG Spring UK, Ltd. | | | | |
6,167,890 | | Term Loan, 4.87%, Maturing June 27, 2013 | | EUR | 7,378,356 | |
6,167,890 | | Term Loan, 5.37%, Maturing June 27, 2013 | | EUR | 7,415,294 | |
| | Wavin Holdings B.V. | | | | |
1,850,000 | | Term Loan, 4.65%, Maturing September 9, 2013 | | EUR | 2,238,827 | |
1,850,000 | | Term Loan, 5.15%, Maturing September 9, 2014 | | EUR | 2,247,136 | |
| | Wellman, Inc. | | | |
6,250,000 | | Term Loan, 7.71%, Maturing February 10, 2009 | | 6,369,794 | |
| | Westlake Chemical Corp. | | | |
284,375 | | Term Loan, 6.35%, Maturing July 31, 2010 | | 287,219 | |
| | | | $ | 346,817,965 | |
| | | |
Clothing/Textiles — 0.4% | | | |
| | | | | |
| | Propex Fabrics, Inc. | | | |
$ | 11,108,529 | | Term Loan, 6.28%, Maturing December 31, 2011 | | $ | 11,136,301 | |
| | SI Corp. | | | |
3,000,000 | | Revolving Loan, 7.75%, Maturing December 2, 2009(2) | | 2,902,500 | |
| | St. John Knits International, Inc. | | | |
4,554,952 | | Term Loan, 6.56%, Maturing March 23, 2012 | | 4,623,277 | |
| | The William Carter Co. | | | |
5,953,125 | | Term Loan, 5.72%, Maturing July 14, 2012 | | 6,033,123 | |
| | | | $ | 24,695,201 | |
| | | | | |
Conglomerates — 2.6% | | | |
| | | | | |
| | Amsted Industries, Inc. | | | |
$ | 18,927,807 | | Term Loan, 6.62%, Maturing October 15, 2010 | | $ | 19,195,957 | |
| | Blount, Inc. | | | |
6,568,739 | | Term Loan, 6.57%, Maturing August 9, 2010 | | 6,665,220 | |
| | Euramax International, Inc. | | | |
4,897,725 | | Term Loan, 6.38%, Maturing June 28, 2012 | | 4,862,741 | |
1,104,375 | | Term Loan, 7.34%, Maturing June 29, 2012 | | GBP | 1,968,867 | |
| | Goodman Global Holdings, Inc. | | | |
10,455,988 | | Term Loan, 6.38%, Maturing December 23, 2011 | | 10,619,362 | |
| | Jarden Corp. | | | |
8,977,500 | | Term Loan, 5.69%, Maturing January 24, 2012 | | 9,023,510 | |
22,054,847 | | Term Loan, 6.02%, Maturing January 24, 2012 | | 22,249,790 | |
| | Johnson Diversey, Inc. | | | |
20,970,413 | | Term Loan, 5.46%, Maturing November 3, 2009 | | 21,212,894 | |
| | Penn Engineering & Manufacturing Corp. | | | |
3,265,444 | | Term Loan, 6.52%, Maturing May 25, 2011 | | 3,306,262 | |
| | Platinum 100, Ltd. | | | |
1,000,000 | | Term Loan, 7.37%, Maturing January 15, 2013 | | GBP | 1,784,837 | |
1,000,000 | | Term Loan, 7.87%, Maturing January 15, 2014 | | GBP | 1,791,573 | |
| | Polymer Group, Inc. | | | |
13,031,667 | | Term Loan, 7.25%, Maturing April 27, 2010 | | 13,237,997 | |
2,500,000 | | Term Loan, 10.25%, Maturing April 27, 2011 | | 2,556,250 | |
| | PP Acquisition Corp. | | | |
18,538,819 | | Term Loan, 6.34%, Maturing November 12, 2011 | | 18,580,531 | |
| | Rexnord Corp. | | | |
15,542,450 | | Term Loan, 6.15%, Maturing December 31, 2011 | | 15,743,212 | |
| | Roper Industries, Inc. | | | |
9,778,360 | | Term Loan, 4.85%, Maturing December 13, 2009 | | 9,817,063 | |
| | Walter Industries, Inc. | | | |
3,775,000 | | Term Loan, 6.04%, Maturing October 3, 2012 | | 3,826,906 | |
| | | | $ | 166,442,972 | |
| | | | | | | | | |
See notes to financial statements
22
Principal | | | | | |
Amount | | Borrower/Tranche Description | | Value | |
| | | | | |
Containers and Glass Products — 3.8% | | | |
| | | | | |
| | Berry Plastics Corp. | | | |
$ | 28,746,569 | | Term Loan, 5.86%, Maturing December 2, 2011 | | $ | 29,105,901 | |
| | BWAY Corp. | | | |
8,392,908 | | Term Loan, 6.31%, Maturing June 30, 2011 | | 8,518,801 | |
| | Consolidated Container Holding | | | |
5,554,688 | | Term Loan, 7.50%, Maturing December 15, 2008 | | 5,627,593 | |
| | Dr. Pepper/Seven Up Bottling | | | |
24,626,684 | | Term Loan, 6.16%, Maturing December 19, 2010 | | 25,005,319 | |
| | Graham Packaging Holdings Co. | | | |
30,504,488 | | Term Loan, 6.56%, Maturing October 7, 2011 | | 30,923,924 | |
1,500,000 | | Term Loan, 8.25%, Maturing April 7, 2012 | | 1,530,000 | |
| | Graphic Packaging International, Inc. | | | |
10,500,000 | | Revolving Loan, 0.00%, Maturing August 8, 2007(2) | | 10,263,751 | |
39,048,604 | | Term Loan, 6.52%, Maturing August 8, 2010 | | 39,458,615 | |
| | IPG (US), Inc. | | | |
10,444,500 | | Term Loan, 6.12%, Maturing July 28, 2011 | | 10,596,812 | |
| | Kranson Industries, Inc. | | | |
4,098,125 | | Term Loan, 6.78%, Maturing July 30, 2011 | | 4,159,597 | |
| | Owens-Illinois, Inc. | | | |
3,772,178 | | Term Loan, 5.67%, Maturing April 1, 2007 | | 3,801,254 | |
5,000,000 | | Revolving Loan, 6.85%, Maturing April 1, 2007(2) | | 4,995,315 | |
6,619,164 | | Term Loan, 3.87%, Maturing April 1, 2008 | | EUR | 8,002,430 | |
4,073,548 | | Term Loan, 5.78%, Maturing April 1, 2008 | | 4,112,585 | |
725,064 | | Term Loan, 5.87%, Maturing April 1, 2008 | | 731,861 | |
| | Picnal Acquisition, Inc. | | | |
1,708,273 | | Term Loan, 7.36%, Maturing June 30, 2011 | | GBP | 3,012,225 | |
199,727 | | Term Loan, 7.36%, Maturing June 30, 2011 | | GBP | 352,462 | |
1,991,413 | | Term Loan, 7.86%, Maturing June 30, 2012 | | GBP | 3,525,888 | |
265,366 | | Term Loan, 7.86%, Maturing June 30, 2012 | | GBP | 470,116 | |
| | Pregis Corp. | | | |
2,000,000 | | Term Loan, 6.37%, Maturing October 12, 2011 | | 2,015,626 | |
| | Smurfit-Stone Container Corp. | | | |
3,225,483 | | Term Loan, 2.10%, Maturing November 1, 2010 | | 3,266,811 | |
28,164,779 | | Term Loan, 5.72%, Maturing November 1, 2011 | | 28,525,654 | |
10,649,736 | | Term Loan, 5.88%, Maturing November 1, 2011 | | 10,786,191 | |
| | U.S. Can Corp. | | | |
7,828,281 | | Term Loan, 7.65%, Maturing January 15, 2010 | | 7,867,423 | |
| | | | $ | 246,656,154 | |
| | | | | |
Cosmetics/Toiletries — 0.7% | | | |
| | | | | |
| | American Safety Razor Co. | | | |
$ | 4,586,950 | | Term Loan, 6.61%, Maturing February 28, 2012 | | $ | 4,658,621 | |
| | Church & Dwight Co., Inc. | | | |
20,769,124 | | Term Loan, 5.82%, Maturing May 30, 2011 | | 21,011,437 | |
| | Prestige Brands, Inc. | | | |
15,751,790 | | Term Loan, 6.32%, Maturing April 7, 2011 | | 15,968,377 | |
| | Revlon Consumer Products Corp. | | | |
6,837,500 | | Term Loan, 9.86%, Maturing July 9, 2010 | | 7,063,992 | |
| | | | $ | 48,702,427 | |
| | | | | |
Drugs — 0.6% | | | |
| | | | | |
| | Warner Chilcott Corp. | | | |
$ | 767,621 | | Term Loan, 0.00%, Maturing January 31, 2006(2) | | $ | 772,131 | |
153,535 | | Term Loan, 0.00%, Maturing June 30, 2006(2) | | 154,437 | |
23,398,587 | | Term Loan, 6.61%, Maturing January 18, 2012 | | 23,513,498 | |
9,428,528 | | Term Loan, 6.77%, Maturing January 18, 2012 | | 9,474,832 | |
4,355,617 | | Term Loan, 6.77%, Maturing January 18, 2012 | | 4,377,008 | |
| | | | $ | 38,291,906 | |
| | | | | |
Ecological Services and Equipment — 1.3% | | | |
| | | | | |
| | Alderwoods Group, Inc. | | | |
$ | 5,095,897 | | Term Loan, 5.84%, Maturing September 29, 2009 | | $ | 5,170,746 | |
| | Allied Waste Industries, Inc. | | | |
9,204,558 | | Term Loan, 4.02%, Maturing January 15, 2012 | | 9,265,280 | |
26,129,174 | | Term Loan, 6.04%, Maturing January 15, 2012 | | 26,302,881 | |
| | Envirocare of Utah, LLC | | | |
11,051,364 | | Term Loan, 6.95%, Maturing April 15, 2010 | | 11,267,783 | |
| | Environmental Systems, Inc. | | | |
6,602,243 | | Term Loan, 7.49%, Maturing December 12, 2008 | | 6,728,102 | |
1,000,000 | | Term Loan, 13.98%, Maturing December 12, 2010 | | 1,020,000 | |
| | IESI Corp. | | | |
9,267,647 | | Term Loan, 6.09%, Maturing January 20, 2012 | | 9,389,285 | |
| | Sensus Metering Systems, Inc. | | | |
1,342,257 | | Term Loan, 6.44%, Maturing December 17, 2010 | | 1,358,197 | |
8,603,328 | | Term Loan, 6.45%, Maturing December 17, 2010 | | 8,705,492 | |
| | Synagro Technologies, Inc. | | | |
1,172,857 | | Term Loan, 0.00%, Maturing June 21, 2012(2) | | 1,177,255 | |
7,037,143 | | Term Loan, 6.17%, Maturing June 21, 2012 | | 7,085,523 | |
| | | | $ | 87,470,544 | |
| | | | | | | | |
See notes to financial statements
23
Principal | | | | | |
Amount | | Borrower/Tranche Description | | Value | |
| | | | | |
Electronics/Electrical — 2.3% | | | |
| | | | | |
| | AMI Semiconductor, Inc. | | | |
$ | 7,785,892 | | Term Loan, 5.58%, Maturing April 1, 2012 | | $ | 7,831,307 | |
| | Aspect Software, Inc. | | | |
4,350,000 | | Term Loan, 6.56%, Maturing September 22, 2010 | | 4,379,906 | |
| | Communications & Power, Inc. | | | |
6,842,205 | | Term Loan, 6.03%, Maturing July 23, 2010 | | 6,944,839 | |
| | Enersys Capital, Inc. | | | |
8,394,818 | | Term Loan, 5.86%, Maturing March 17, 2011 | | 8,473,519 | |
| | Fairchild Semiconductor Corp. | | | |
17,531,216 | | Term Loan, 5.60%, Maturing December 31, 2010 | | 17,662,700 | |
| | Invensys International Holding Ltd. | | | |
10,889,479 | | Term Loan, 7.79%, Maturing September 4, 2009 | | 10,998,374 | |
| | Panavision, Inc. | | | |
3,094,077 | | Term Loan, 10.39%, Maturing January 12, 2007 | | 3,161,760 | |
| | Rayovac Corp. | | | |
31,745,475 | | Term Loan, 6.00%, Maturing February 7, 2012 | | 32,016,645 | |
| | Securityco, Inc. | | | |
12,604,428 | | Term Loan, 7.31%, Maturing June 28, 2010 | | 12,698,961 | |
| | Spectrum Brands, Inc. | | | |
10,000,000 | | Term Loan, 4.43%, Maturing February 7, 2012 | | EUR | 12,049,868 | |
| | SSA Global Technologies, Inc. | | | |
2,942,625 | | Term Loan, 5.97%, Maturing September 22, 2011 | | 2,961,016 | |
| | Telcordia Technologies, Inc. | | | |
15,278,225 | | Term Loan, 6.36%, Maturing September 15, 2012 | | 15,154,089 | |
| | United Online, Inc. | | | |
1,402,917 | | Term Loan, 7.03%, Maturing December 13, 2008 | | 1,409,931 | |
| | Vertafore, Inc. | | | |
6,457,795 | | Term Loan, 6.57%, Maturing December 22, 2010 | | 6,530,445 | |
| | Viasystems, Inc. | | | |
8,435,006 | | Term Loan, 8.38%, Maturing September 30, 2009 | | 8,550,988 | |
| | | | $ | 150,824,348 | |
| | | | | |
Equipment Leasing — 0.8% | | | |
| | | | | |
| | Ashtead Group, PLC | | | |
$ | 5,125,000 | | Term Loan, 6.06%, Maturing November 12, 2009 | | $ | 5,180,519 | |
| | Carey International, Inc. | | | |
2,992,500 | | Term Loan, 7.69%, Maturing May 2, 2011 | | 2,932,650 | |
| | Maxim Crane Works, L.P. | | | |
11,547,145 | | Term Loan, 6.87%, Maturing January 28, 2010 | | 11,720,352 | |
976,995 | | Term Loan, 9.63%, Maturing January 28, 2012 | | 1,001,420 | |
| | United Rentals, Inc. | | | |
$ | 5,212,716 | | Term Loan, 2.87%, Maturing February 14, 2011 | | $ | 5,264,191 | |
25,504,750 | | Term Loan, 6.32%, Maturing February 14, 2011 | | 25,756,609 | |
| | | | $ | 51,855,741 | |
| | | | | |
Farming/Agriculture — 0.2% | | | |
| | | | | |
| | Central Garden & Pet Co. | | | |
$ | 11,276,669 | | Term Loan, 5.78%, Maturing May 19, 2009 | | $ | 11,438,771 | |
| | | | $ | 11,438,771 | |
| | | | | |
Financial Intermediaries — 2.1% | | | |
| | | | | |
| | AIMCO Properties, L.P. | | | |
$ | 8,875,000 | | Term Loan, 5.72%, Maturing November 2, 2009 | | $ | 8,958,203 | |
29,843,750 | | Term Loan, 5.89%, Maturing November 2, 2009 | | 30,244,790 | |
| | Blitz F04-506 GmbH | | | |
1,500,000 | | Term Loan, 5.11%, Maturing June 30, 2014 | | EUR | 1,825,820 | |
| | Coinstar, Inc. | | | |
7,076,865 | | Term Loan, 6.10%, Maturing July 7, 2011 | | 7,209,556 | |
| | Corrections Corp. of America | | | |
5,912,037 | | Term Loan, 5.84%, Maturing March 31, 2008 | | 5,985,937 | |
| | Fidelity National Information Solutions, Inc. | | | |
45,872,350 | | Term Loan, 5.69%, Maturing March 9, 2013 | | 46,083,271 | |
| | Geo Group, Inc. | | | |
5,680,963 | | Term Loan, 6.06%, Maturing September 14, 2011 | | 5,737,773 | |
| | The Macerich Partnership, L.P. | | | |
8,865,985 | | Term Loan, 5.66%, Maturing April 25, 2006 | | 8,882,608 | |
10,900,000 | | Revolving Loan, 5.39%, Maturing July 30, 2007(2) | | 10,900,000 | |
11,280,000 | | Term Loan, 5.63%, Maturing April 25, 2010 | | 11,364,600 | |
| | | | $ | 137,192,558 | |
| | | | | |
Food Products — 2.1% | | | |
| | | | | |
| | Acosta Sales Co., Inc. | | | |
$ | 9,555,207 | | Term Loan, 5.98%, Maturing August 13, 2010 | | $ | 9,674,647 | |
| | American Seafoods Holdings, LLC | | | |
4,125,000 | | Term Loan, 5.84%, Maturing September 30, 2012 | | 4,184,297 | |
| | Chiquita Brands, LLC | | | |
4,713,188 | | Term Loan, 6.57%, Maturing June 28, 2012 | | 4,785,361 | |
| | Del Monte Corp. | | | |
5,472,500 | | Term Loan, 5.73%, Maturing February 8, 2012 | | 5,558,008 | |
| | Dole Food Company, Inc. | | | |
11,360,627 | | Term Loan, 5.59%, Maturing April 18, 2012 | | 11,468,553 | |
| | | | | | | | |
See notes to financial statements
24
Principal | | | | | |
Amount | | Borrower/Tranche Description | | Value | |
| | | | | |
Food Products (continued) | | | |
| | | | | |
| | Herbalife International, Inc. | | | |
$ | 5,212,357 | | Term Loan, 5.93%, Maturing December 21, 2010 | | $ | 5,285,658 | |
| | Interstate Brands Corp. | | | |
1,875,000 | | Term Loan, 7.95%, Maturing July 19, 2006 | | 1,886,719 | |
8,250,000 | | Revolving Loan, 0.00%, Maturing September 22, 2006(2) | | 8,255,156 | |
1,972,066 | | Term Loan, 7.81%, Maturing July 19, 2007 | | 1,987,843 | |
6,046,139 | | Term Loan, 8.18%, Maturing July 19, 2007 | | 6,105,089 | |
| | Merisant Co. | | | |
13,904,938 | | Term Loan, 7.49%, Maturing January 11, 2010 | | 13,731,126 | |
| | Michael Foods, Inc. | | | |
12,829,879 | | Term Loan, 5.19%, Maturing November 21, 2010 | | 13,046,383 | |
6,200,000 | | Term Loan, 6.59%, Maturing November 20, 2011 | | 6,289,125 | |
| | Nash-Finch Co. | | | |
6,300,000 | | Term Loan, 6.31%, Maturing November 12, 2010 | | 6,339,375 | |
| | Pinnacle Foods Holdings Corp. | | | |
1,000,000 | | Revolving Loan, 0.00%, Maturing November 25, 2009(2) | | 980,000 | |
21,488,142 | | Term Loan, 7.31%, Maturing November 25, 2010 | | 21,783,604 | |
| | Reddy Ice Group, Inc. | | | |
13,335,000 | | Term Loan, 5.87%, Maturing August 9, 2012 | | 13,476,684 | |
| | United Biscuits, Ltd. | | | |
1,547,559 | | Term Loan, 9.05%, Maturing January 14, 2011 | | GBP | 2,797,782 | |
| | | | $ | 137,635,410 | |
| | | | | |
Food Service — 2.1% | | | |
| | | | | |
| | AFC Enterprises, Inc. | | | |
$ | 4,937,625 | | Term Loan, 6.31%, Maturing May 11, 2011 | | $ | 4,999,345 | |
| | Buffets, Inc. | | | |
227,273 | | Term Loan, 6.78%, Maturing June 28, 2009 | | 229,545 | |
10,538,418 | | Term Loan, 7.16%, Maturing June 28, 2009 | | 10,643,802 | |
| | Burger King Corp. | | | |
6,284,250 | | Term Loan, 5.83%, Maturing June 30, 2012 | | 6,357,191 | |
| | Carrols Corp. | | | |
12,022,015 | | Term Loan, 6.56%, Maturing December 31, 2010 | | 12,202,345 | |
| | CKE Restaurants, Inc. | | | |
3,586,522 | | Term Loan, 6.00%, Maturing May 1, 2010 | | 3,613,421 | |
| | Denny’s, Inc. | | | |
8,704,283 | | Term Loan, 7.30%, Maturing September 21, 2009 | | 8,837,572 | |
| | Domino’s, Inc. | | | |
6,592,593 | | Revolving Loan, 0.00%, Maturing June 25, 2009(2) | | 6,526,667 | |
30,424,098 | | Term Loan, 5.81%, Maturing June 25, 2010 | | 30,950,192 | |
| | Gate Gourmet Borrower, LLC | | | |
$ | 7,947,871 | | Term Loan, 11.39%, Maturing December 31, 2008 | | $ | 7,957,806 | |
| | Jack in the Box, Inc. | | | |
12,744,833 | | Term Loan, 5.57%, Maturing January 8, 2011 | | 12,868,305 | |
| | Landry’s Restaurants, Inc. | | | |
7,994,588 | | Term Loan, 5.95%, Maturing December 28, 2010 | | 8,082,032 | |
| | Maine Beverage Co., LLC | | | |
3,850,000 | | Term Loan, 5.77%, Maturing June 30, 2010 | | 3,840,375 | |
| | Weight Watchers International, Inc. | | | |
2,000,000 | | Revolving Loan, 5.80%, Maturing March 31, 2009(2) | | 2,000,000 | |
12,122,185 | | Term Loan, 5.64%, Maturing March 31, 2010 | | 12,298,962 | |
4,504,500 | | Term Loan, 5.67%, Maturing March 31, 2010 | | 4,557,054 | |
| | | | $ | 135,964,614 | |
| | | | | |
Food/Drug Retailers — 1.7% | | | |
�� | | | | | |
| | Cumberland Farms, Inc. | | | |
$ | 10,397,873 | | Term Loan, 6.30%, Maturing September 8, 2008 | | $ | 10,456,361 | |
| | General Nutrition Centers, Inc. | | | |
4,412,775 | | Term Loan, 6.80%, Maturing December 7, 2009 | | 4,477,126 | |
7,000,000 | | Revolving Loan, 0.00%, Maturing December 15, 2009(2) | | 6,864,375 | |
| | Giant Eagle, Inc. | | | |
5,019,565 | | Term Loan, 5.75%, Maturing August 6, 2009 | | 5,104,270 | |
13,274,448 | | Term Loan, 5.92%, Maturing August 6, 2009 | | 13,498,454 | |
| | Roundy’s, Inc. | | | |
9,838,342 | | Term Loan, 6.00%, Maturing June 6, 2009 | | 9,920,325 | |
| | The Jean Coutu Group (PJC), Inc. | | | |
29,656,703 | | Term Loan, 6.50%, Maturing July 30, 2011 | | 30,025,099 | |
| | The Pantry, Inc. | | | |
8,178,074 | | Term Loan, 6.34%, Maturing March 12, 2011 | | 8,310,968 | |
| | Winn-Dixie Stores, Inc. | | | |
23,000,000 | | DIP Loan, 5.81%, Maturing February 23, 2007(2) | | 22,942,500 | |
| | | | $ | 111,599,478 | |
| | | | | |
Forest Products — 1.9% | | | |
| | | | | |
| | Appleton Papers, Inc. | | | |
$ | 13,079,846 | | Term Loan, 6.03%, Maturing June 11, 2010 | | $ | 13,239,263 | |
| | Boise Cascade Holdings, LLC | | | |
18,567,856 | | Term Loan, 5.79%, Maturing October 29, 2011 | | 18,847,656 | |
| | Buckeye Technologies, Inc. | | | |
10,270,574 | | Term Loan, 5.89%, Maturing April 15, 2010 | | 10,328,346 | |
| | | | | | | | |
See notes to financial statements
25
Principal | | | | | |
Amount | | Borrower/Tranche Description | | Value | |
| | | | | |
Forest Products (continued) | | | |
| | | | | |
| | Escanaba Timber, LLC | | | |
$ | 4,000,000 | | Term Loan, 6.75%, Maturing May 2, 2008 | | $ | 4,005,000 | |
| | Koch Cellulose, LLC | | | |
2,909,025 | | Term Loan, 5.36%, Maturing May 7, 2011 | | 2,945,993 | |
9,531,704 | | Term Loan, 5.77%, Maturing May 7, 2011 | | 9,648,867 | |
| | NewPage Corp. | | | |
10,000,000 | | Revolving Loan, 6.00%, Maturing May 2, 2010(2) | | 9,900,000 | |
17,705,625 | | Term Loan, 6.79%, Maturing May 2, 2011 | | 17,882,681 | |
| | RLC Industries Co. | | | |
21,228,525 | | Term Loan, 5.52%, Maturing February 24, 2010 | | 21,361,203 | |
| | Xerium Technologies, Inc. | | | |
2,000,000 | | Term Loan, 4.40%, Maturing May 18, 2012 | | EUR | 2,413,466 | |
10,264,295 | | Term Loan, 6.02%, Maturing May 18, 2012 | | 10,408,642 | |
| | | | $ | 120,981,117 | |
| | | | | |
Healthcare — 6.6% | | | |
| | | | | |
| | Alliance Imaging, Inc. | | | |
$ | 10,299,093 | | Term Loan, 6.41%, Maturing December 29, 2011 | | $ | 10,414,958 | |
| | AMN Healthcare, Inc. | | | |
3,194,288 | | Term Loan, 7.02%, Maturing October 2, 2008 | | 3,200,277 | |
| | AMR HoldCo, Inc. | | | |
9,308,225 | | Term Loan, 6.28%, Maturing February 10, 2012 | | 9,389,672 | |
| | Carl Zeiss Topco GMBH | | | |
3,140,000 | | Term Loan, 6.95%, Maturing February 28, 2013 | | 3,159,625 | |
6,280,000 | | Term Loan, 7.45%, Maturing February 28, 2014 | | 6,327,100 | |
375,000 | | Term Loan, 9.70%, Maturing August 31, 2014 | | 381,563 | |
| | Colgate Medical, Ltd. | | | |
3,129,342 | | Term Loan, 6.01%, Maturing December 30, 2008 | | 3,160,635 | |
| | Community Health Systems, Inc. | | | |
44,293,205 | | Term Loan, 5.61%, Maturing August 19, 2011 | | 44,906,843 | |
| | Concentra Operating Corp. | | | |
16,550,000 | | Term Loan, 6.05%, Maturing September 30, 2011 | | 16,762,055 | |
| | Conmed Corp. | | | |
4,478,475 | | Term Loan, 6.28%, Maturing December 31, 2007 | | 4,538,186 | |
| | CRC Health Corp. | | | |
2,493,750 | | Term Loan, 6.81%, Maturing May 12, 2011 | | 2,499,984 | |
| | Davita Inc. | | | |
50,185,784 | | Term Loan, 6.38%, Maturing October 5, 2012 | | 50,987,352 | |
| | Encore Medical IHC, Inc. | | | |
8,388,367 | | Term Loan, 6.62%, Maturing October 4, 2010 | | 8,482,736 | |
| | Envision Worldwide, Inc. | | | |
7,792,886 | | Term Loan, 9.01%, Maturing September 30, 2010 | | 7,831,851 | |
| | FHC Health Systems, Inc. | | | |
$ | 2,321,429 | | Term Loan, 9.87%, Maturing December 18, 2009 | | $ | 2,379,464 | |
1,625,000 | | Term Loan, 11.87%, Maturing December 18, 2009 | | 1,657,500 | |
3,250,000 | | Term Loan, 12.87%, Maturing February 7, 2011 | | 3,298,750 | |
| | Fisher Scientific International, Inc. | | | |
18,123,100 | | Term Loan, 5.52%, Maturing August 2, 2011 | | 18,259,023 | |
| | Genoa Healthcare Group, LLC | | | |
2,400,000 | | Term Loan, 7.23%, Maturing August 12, 2012 | | 2,434,500 | |
| | Hanger Orthopedic Group, Inc. | | | |
7,000,000 | | Revolving Loan, 0.00%, Maturing September 30, 2008(2) | | 6,877,500 | |
4,662,382 | | Term Loan, 7.75%, Maturing September 30, 2009 | | 4,738,146 | |
| | Healthcare Partners, LLC | | | |
4,689,750 | | Term Loan, 5.82%, Maturing March 2, 2011 | | 4,732,253 | |
| | Healthsouth Corp. | | | |
9,127,125 | | Term Loan, 6.53%, Maturing June 14, 2007 | | 9,181,322 | |
2,520,000 | | Term Loan, 3.55%, Maturing March 21, 2010 | | 2,534,964 | |
| | Iasis Healthcare, LLC | | | |
11,988,250 | | Term Loan, 6.30%, Maturing June 16, 2011 | | 12,166,827 | |
| | Kinetic Concepts, Inc. | | | |
10,812,119 | | Term Loan, 5.78%, Maturing August 11, 2010 | | 10,942,762 | |
| | Knowledge Learning Corp. | | | |
29,214,677 | | Term Loan, 6.59%, Maturing January 7, 2012 | | 29,372,932 | |
| | Leiner Health Products, Inc. | | | |
8,245,625 | | Term Loan, 7.70%, Maturing May 27, 2011 | | 8,240,471 | |
| | Lifecare Holdings, Inc. | | | |
9,250,000 | | Term Loan, 6.13%, Maturing August 11, 2012 | | 8,747,031 | |
| | Lifepoint Hospitals, Inc. | | | |
32,638,678 | | Term Loan, 5.44%, Maturing April 15, 2012 | | 32,880,563 | |
| | Magellan Health Services, Inc. | | | |
3,679,054 | | Term Loan, 3.76%, Maturing August 15, 2008 | | 3,720,443 | |
5,012,711 | | Term Loan, 5.87%, Maturing August 15, 2008 | | 5,069,104 | |
| | Medcath Holdings Corp. | | | |
3,742,600 | | Term Loan, 6.29%, Maturing July 2, 2011 | | 3,774,180 | |
| | National Mentor, Inc. | | | |
5,999,234 | | Term Loan, 6.25%, Maturing September 30, 2011 | | 6,074,225 | |
| | Renal Advantage, Inc. | | | |
2,350,000 | | Term Loan, 6.44%, Maturing October 5, 2012 | | 2,377,173 | |
| | Select Medical Holding Corp. | | | |
9,900,250 | | Term Loan, 5.57%, Maturing February 24, 2012 | | 9,918,130 | |
| | Sirona Dental Services GmbH | | | |
1,180,000 | | Term Loan, 4.61%, Maturing June 30, 2013 | | EUR | 1,430,865 | |
| | | | | | | | | |
See notes to financial statements
26
Principal | | | | | |
Amount | | Borrower/Tranche Description | | Value | |
| | | | | |
Healthcare (continued) | | | |
| | | | | |
| | Sirona Dental Systems GmbH | | | |
$ | 320,000 | | Term Loan, 4.61%, Maturing June 30, 2013 | | EUR | 388,031 | |
| | Sunrise Medical Holdings, Inc. | | | |
7,236,913 | | Term Loan, 7.12%, Maturing May 13, 2010 | | 7,245,959 | |
| | Sybron Dental Management, Inc. | | | |
5,062,957 | | Term Loan, 5.79%, Maturing June 6, 2009 | | 5,107,258 | |
| | Talecris Biotherapeutics, Inc. | | | |
7,596,825 | | Term Loan, 7.08%, Maturing March 31, 2010 | | 7,615,817 | |
| | Team Health, Inc. | | | |
6,413,663 | | Term Loan, 6.77%, Maturing March 23, 2011 | | 6,429,697 | |
| | The Cooper Companies, Inc. | | | |
5,472,500 | | Term Loan, 5.50%, Maturing November 15, 2009 | | 5,513,544 | |
| | Vanguard Health Holding Co., LLC | | | |
15,098,700 | | Term Loan, 6.21%, Maturing September 23, 2011 | | 15,315,744 | |
| | Ventiv Health, Inc. | | | |
3,650,000 | | Term Loan, 5.58%, Maturing October 5, 2011 | | 3,684,219 | |
| | VWR International, Inc. | | | |
3,000,000 | | Term Loan, 4.94%, Maturing April 7, 2011 | | EUR | 3,629,930 | |
9,432,967 | | Term Loan, 6.69%, Maturing April 7, 2011 | | 9,580,357 | |
| | | | $ | 427,361,521 | |
| | | | | |
Home Furnishings — 1.2% | | | |
| | | | | |
| | Interline Brands, Inc. | | | |
$ | 3,020,652 | | Term Loan, 6.27%, Maturing December 31, 2010 | | $ | 3,047,083 | |
| | Knoll, Inc. | | | |
10,355,000 | | Term Loan, 5.88%, Maturing October 3, 2012 | | 10,510,325 | |
| | National Bedding Company, LLC | | | |
4,802,962 | | Term Loan, 5.98%, Maturing August 31, 2011 | | 4,835,983 | |
| | Oreck Corp. | | | |
3,867,019 | | Term Loan, 6.78%, Maturing February 2, 2012 | | 3,881,520 | |
| | Sanitec Ltd. Oy | | | |
4,478,261 | | Term Loan, 4.89%, Maturing April 7, 2013 | | EUR | 5,228,282 | |
4,478,261 | | Term Loan, 5.39%, Maturing April 7, 2014 | | EUR | 5,251,733 | |
| | Sealy Mattress Co. | | | |
5,000,000 | | Revolving Loan, 0.00%, Maturing April 6, 2012(2) | | 4,900,000 | |
18,950,002 | | Term Loan, 5.73%, Maturing April 6, 2012 | | 19,145,434 | |
| | Simmons Co. | | | |
21,842,308 | | Term Loan, 5.96%, Maturing December 19, 2011 | | 22,106,229 | |
| | | | $ | 78,906,589 | |
| | | | | |
Industrial Equipment — 1.3% | | | |
| | | | | |
| | Alliance Laundry Holdings, LLC | | | |
$ | 4,160,750 | | Term Loan, 6.14%, Maturing January 27, 2012 | | $ | 4,221,863 | |
| | Colfax Corp. | | | |
2,033,359 | | Term Loan, 6.31%, Maturing May 30, 2009 | | 2,054,115 | |
| | Douglas Dynamics Holdings, Inc. | | | |
4,774,992 | | Term Loan, 6.02%, Maturing December 16, 2010 | | 4,834,679 | |
| | Flowserve Corp. | | | |
14,715,000 | | Term Loan, 5.81%, Maturing August 10, 2012 | | 14,931,134 | |
| | Gleason Corp. | | | |
6,705,953 | | Term Loan, 6.74%, Maturing July 27, 2011 | | 6,789,778 | |
746,250 | | Term Loan, 9.42%, Maturing January 31, 2012 | | 759,309 | |
| | GSCP Athena (Finnish) Holdings | | | |
7,000,000 | | Term Loan, 4.62%, Maturing August 31, 2013 | | EUR | 8,408,950 | |
6,391,304 | | Term Loan, 5.12%, Maturing August 31, 2014 | | EUR | 7,745,133 | |
| | Heating Finance PLC (Baxi) | | | |
3,253,597 | | Term Loan, 0.00%, Maturing December 27, 2010(2) | | EUR | 3,906,738 | |
3,246,560 | | Term Loan, 6.61%, Maturing December 27, 2010 | | GBP | 5,749,137 | |
| | Itron, Inc. | | | |
1,388,602 | | Term Loan, 5.85%, Maturing December 17, 2010 | | 1,399,884 | |
| | Mainline, L.P. | | | |
7,720,000 | | Term Loan, 6.30%, Maturing December 17, 2011 | | 7,835,800 | |
| | MTD Products, Inc. | | | |
10,882,461 | | Term Loan, 5.63%, Maturing June 1, 2010 | | 10,984,485 | |
| | Pirelli Kabel UND Systems Hold | | | |
608,696 | | Term Loan, 5.12%, Maturing August 31, 2014 | | EUR | 734,858 | |
| | Terex Corp. | | | |
1,593,087 | | Term Loan, 6.41%, Maturing June 30, 2009 | | 1,615,987 | |
| | | | $ | 81,971,850 | |
| | | | | |
Insurance — 0.9% | | | |
| | | | | |
| | Alliant Resources Group, Inc. | | | |
$ | 6,665,625 | | Term Loan, 7.58%, Maturing August 31, 2011 | | $ | 6,715,617 | |
| | CCC Information Services Group, Inc. | | | |
8,134,007 | | Term Loan, 6.83%, Maturing August 20, 2010 | | 8,154,342 | |
| | Conseco, Inc. | | | |
17,207,161 | | Term Loan, 5.97%, Maturing June 22, 2010 | | 17,433,005 | |
| | Hilb, Rogal & Hobbs Co. | | | |
13,735,113 | | Term Loan, 6.31%, Maturing June 30, 2007 | | 13,898,217 | |
| | U.S.I. Holdings Corp. | | | |
6,827,727 | | Term Loan, 6.74%, Maturing August 11, 2008 | | 6,857,598 | |
7,726,613 | | Term Loan, 6.74%, Maturing August 11, 2008 | | 7,760,416 | |
| | | | $ | 60,819,195 | |
| | | | | | | | | | |
See notes to financial statements
27
Principal | | | | | |
Amount | | Borrower/Tranche Description | | Value | |
| | | | | |
Leisure Goods/Activities/Movies — 4.9% | | | |
| | | | | |
| | 24 Hour Fitness Worldwide, Inc. | | | |
$ | 11,530,000 | | Term Loan, 6.78%, Maturing June 8, 2012 | | $ | 11,724,569 | |
| | Alliance Atlantis Communications, Inc. | | | |
6,568,990 | | Term Loan, 5.83%, Maturing December 31, 2011 | | 6,628,525 | |
| | AMF Bowling Worldwide, Inc. | | | |
5,253,343 | | Term Loan, 6.76%, Maturing August 27, 2009 | | 5,300,954 | |
| | Carmike Cinemas, Inc. | | | |
7,015,000 | | Term Loan, 0.00%, Maturing May 19, 2012(2) | | 6,966,772 | |
10,493,700 | | Term Loan, 6.39%, Maturing May 19, 2012 | | 10,519,934 | |
| | Cinemark, Inc. | | | |
20,194,969 | | Term Loan, 5.43%, Maturing March 31, 2011 | | 20,457,503 | |
| | Fender Musical Instruments Co. | | | |
2,487,500 | | Term Loan, 6.47%, Maturing March 30, 2012 | | 2,512,375 | |
| | Lions Gate Entertainment, Inc. | | | |
1,022,500 | | Revolving Loan, 0.00%, Maturing December 31, 2008(2) | | 1,007,163 | |
| | Loews Cineplex Entertainment Corp. | | | |
29,105,800 | | Term Loan, 6.17%, Maturing July 30, 2011 | | 29,296,821 | |
| | Metro-Goldwyn-Mayer Holdings, Inc. | | | |
4,076,923 | | Term Loan, 6.27%, Maturing April 8, 2011 | | 4,113,444 | |
63,315,000 | | Term Loan, 6.27%, Maturing April 8, 2012 | | 63,928,396 | |
| | New England Sports Ventures | | | |
10,585,000 | | Term Loan, 4.96%, Maturing February 27, 2007 | | 10,585,000 | |
| | Red Football, Ltd. | | | |
4,048,025 | | Term Loan, 7.35%, Maturing May 11, 2012 | | GBP | 7,237,676 | |
2,750,000 | | Term Loan, 7.85%, Maturing May 11, 2013 | | GBP | 4,941,210 | |
2,750,000 | | Term Loan, 8.35%, Maturing May 11, 2014 | | GBP | 4,965,551 | |
| | Regal Cinemas Corp. | | | |
44,324,940 | | Term Loan, 6.02%, Maturing November 10, 2010 | | 44,840,927 | |
| | Riddell Bell Holdings, Inc. | | | |
2,475,000 | | Term Loan, 6.16%, Maturing September 30, 2011 | | 2,515,219 | |
| | Six Flags Theme Parks, Inc. | | | |
3,275,000 | | Revolving Loan, 6.72%, Maturing June 30, 2008(2) | | 3,240,884 | |
25,779,133 | | Term Loan, 6.71%, Maturing June 30, 2009 | | 26,096,757 | |
| | Universal City Development Partners, Ltd. | | | |
15,408,563 | | Term Loan, 6.01%, Maturing June 9, 2011 | | 15,623,635 | |
| | WMG Acquisition Corp. | | | |
4,390,000 | | Revolving Loan, 0.00%, Maturing February 28, 2010(2) | | 4,276,137 | |
30,280,828 | | Term Loan, 5.85%, Maturing February 28, 2011 | | 30,624,637 | |
| | Yankees Holdings & YankeeNets, LLC | | | |
2,935,429 | | Term Loan, 6.36%, Maturing June 25, 2007 | | 2,964,783 | |
| | | | $ | 320,368,872 | |
| | | | | |
Lodging and Casinos — 4.2% | | | |
| | | | | |
| | Alliance Gaming Corp. | | | |
$ | 14,625,852 | | Term Loan, 6.77%, Maturing September 5, 2009 | | $ | 14,625,852 | |
| | Ameristar Casinos, Inc. | | | |
6,262,299 | | Term Loan, 6.06%, Maturing December 31, 2006 | | 6,301,438 | |
2,893,524 | | Term Loan, 6.06%, Maturing December 31, 2006 | | 2,911,609 | |
| | Aztar Corp. | | | |
1,975,000 | | Term Loan, 5.41%, Maturing July 27, 2009 | | 1,983,641 | |
| | Boyd Gaming Corp. | | | |
25,156,563 | | Term Loan, 5.61%, Maturing June 30, 2011 | | 25,486,742 | |
| | CCM Merger, Inc. | | | |
8,184,488 | | Term Loan, 5.93%, Maturing April 25, 2012 | | 8,263,779 | |
3,000,000 | | Term Loan, 0.00%, Maturing April 25, 2012(2) | | 3,030,000 | |
| | Choctaw Resort Development Enterprise | | | |
4,417,617 | | Term Loan, 5.92%, Maturing November 4, 2011 | | 4,470,077 | |
| | CNL Resort Hotel, L.P. | | | |
7,700,000 | | Term Loan, 7.44%, Maturing August 18, 2006 | | 7,719,250 | |
| | Globalcash Access, LLC | | | |
3,441,658 | | Term Loan, 6.33%, Maturing March 10, 2010 | | 3,494,360 | |
| | Green Valley Ranch Gaming, LLC | | | |
2,504,936 | | Term Loan, 6.02%, Maturing December 17, 2011 | | 2,540,944 | |
| | Herbst Gaming, Inc. | | | |
3,213,850 | | Term Loan, 6.20%, Maturing January 31, 2011 | | 3,256,032 | |
| | Isle of Capri Blackhawk, LLC | | | |
250,000 | | Term Loan, 6.19%, Maturing October 24, 2011 | | 252,344 | |
| | Isle of Capri Casinos, Inc. | | | |
4,987,500 | | Term Loan, 5.49%, Maturing February 4, 2012 | | 5,003,086 | |
15,507,813 | | Term Loan, 5.84%, Maturing February 4, 2012 | | 15,689,549 | |
| | Marina District Finance Co., Inc. | | | |
15,631,875 | | Term Loan, 5.91%, Maturing October 14, 2011 | | 15,762,135 | |
| | MGM Mirage | | | |
6,821,429 | | Term Loan, 5.13%, Maturing April 25, 2010 | | 6,848,837 | |
17,678,571 | | Revolving Loan, 5.35%, Maturing April 25, 2010(2) | | 17,236,607 | |
| | Penn National Gaming, Inc. | | | |
48,074,667 | | Term Loan, 6.08%, Maturing October 3, 2012 | | 48,735,694 | |
| | Pinnacle Entertainment, Inc. | | | |
2,500,000 | | Revolving Loan, 0.00%, Maturing December 18, 2008(2) | | 2,506,250 | |
4,302,116 | | Term Loan, 7.04%, Maturing August 27, 2010 | | 4,355,892 | |
240,000 | | Term Loan, 7.09%, Maturing August 27, 2010 | | 242,700 | |
| | Resorts International Holdings, LLC | | | |
10,488,632 | | Term Loan, 6.53%, Maturing April 26, 2012 | | 10,506,987 | |
3,500,000 | | Term Loan, 10.27%, Maturing April 26, 2013 | | 3,470,471 | |
| | | | | | | | |
See notes to financial statements
28
Principal | | | | | |
Amount | | Borrower/Tranche Description | | Value | |
| | | | | |
Lodging and Casinos (continued) | | | |
| | | | | |
| | Trump Entertainment Resorts Holdings, L.P. | | | |
$ | 5,475,000 | | Term Loan, 0.00%, Maturing May 20, 2012(2) | | $ | 5,538,877 | |
5,461,313 | | Term Loan, 6.14%, Maturing May 20, 2012 | | 5,525,030 | |
| | Venetian Casino Resort, LLC | | | |
24,400,219 | | Term Loan, 5.77%, Maturing June 15, 2011 | | 24,630,874 | |
5,947,617 | | Term Loan, 5.77%, Maturing June 15, 2011 | | 6,003,839 | |
| | Wyndham International, Inc. | | | |
7,000,000 | | Revolving Loan, 0.00%, Maturing May 10, 2011(2) | | 6,965,000 | |
| | Wynn Las Vegas, LLC | | | |
10,725,000 | | Term Loan, 6.19%, Maturing December 14, 2011 | | 10,852,359 | |
| | | | $ | 274,210,255 | |
| | | | | |
Nonferrous Metals/Minerals — 2.2% | | | |
| | | | | |
| | Carmeuse Lime, Inc. | | | |
$ | 6,873,750 | | Term Loan, 6.00%, Maturing May 2, 2011 | | $ | 6,925,303 | |
| | CII Carbon, LLC | | | |
3,640,875 | | Term Loan, 6.19%, Maturing August 23, 2012 | | 3,656,804 | |
| | Compass Minerals Group, Inc. | | | |
472,264 | | Term Loan, 6.47%, Maturing November 28, 2009 | | 474,232 | |
| | Foundation Coal Corp. | | | |
13,500,000 | | Revolving Loan, 0.00%, Maturing July 30, 2009(2) | | 13,432,500 | |
10,950,000 | | Term Loan, 5.85%, Maturing July 30, 2011 | | 11,145,425 | |
| | ICG, LLC | | | |
10,349,125 | | Term Loan, 6.69%, Maturing November 5, 2010 | | 10,418,123 | |
| | International Mill Service, Inc. | | | |
15,557,438 | | Term Loan, 6.84%, Maturing December 31, 2010 | | 15,713,012 | |
3,000,000 | | Term Loan, 10.09%, Maturing October 26, 2011 | | 3,045,000 | |
| | Murray Energy Corp. | | | |
10,905,200 | | Term Loan, 6.86%, Maturing January 28, 2010 | | 10,980,173 | |
| | Novelis, Inc. | | | |
11,460,607 | | Term Loan, 5.46%, Maturing January 6, 2012 | | 11,597,595 | |
16,817,168 | | Term Loan, 5.46%, Maturing January 6, 2012 | | 17,018,184 | |
| | Severstal North America, Inc. | | | |
15,200,000 | | Revolving Loan, 5.61%, Maturing April 7, 2007(2) | | 15,162,000 | |
| | Stillwater Mining Co. | | | |
4,360,000 | | Revolving Loan, 4.08%, Maturing June 30, 2007(2) | | 4,316,400 | |
6,664,628 | | Term Loan, 7.38%, Maturing June 30, 2007 | | 6,797,920 | |
| | Trout Coal Holdings, LLC | | | |
13,106,569 | | Term Loan, 6.55%, Maturing March 23, 2011 | | 13,180,293 | |
| | | | $ | 143,862,964 | |
| | | | | |
Oil and Gas — 3.9% | | | |
| | | | | |
| | Coffeyville Resources, LLC | | | |
$ | 1,600,000 | | Term Loan, 3.87%, Maturing June 24, 2011 | | $ | 1,628,000 | |
2,394,000 | | Term Loan, 6.57%, Maturing June 24, 2012 | | 2,435,895 | |
| | Columbia Natural Resources, LLC | | | |
41,250,000 | | Revolving Loan, 5.65%, Maturing January 19, 2010(2) | | 41,198,438 | |
| | Dresser, Inc. | | | |
5,485,881 | | Term Loan, 6.59%, Maturing March 31, 2007 | | 5,540,740 | |
| | Dynegy Holdings, Inc. | | | |
5,000,000 | | Revolving Loan, 0.00%, Maturing May 28, 2009(2) | | 4,983,750 | |
| | El Paso Corp. | | | |
10,000,000 | | Revolving Loan, 0.00%, Maturing November 23, 2007(2) | | 9,925,000 | |
13,019,875 | | Term Loan, 5.27%, Maturing November 23, 2009 | | 13,116,626 | |
22,077,069 | | Term Loan, 6.81%, Maturing November 23, 2009 | | 22,268,720 | |
| | Epco Holdings, Inc. | | | |
4,333,334 | | Revolving Loan, 6.26%, Maturing August 18, 2008(2) | | 4,257,501 | |
8,666,666 | | Term Loan, 6.42%, Maturing August 18, 2008 | | 8,751,530 | |
9,155,000 | | Term Loan, 6.42%, Maturing August 18, 2010 | | 9,285,788 | |
| | Kerr-McGee Corp. | | | |
11,462,500 | | Term Loan, 6.26%, Maturing May 24, 2007 | | 11,495,248 | |
29,695,575 | | Term Loan, 6.51%, Maturing May 24, 2011 | | 29,832,917 | |
| | Key Energy Services, Inc. | | | |
8,570,000 | | Term Loan, 7.01%, Maturing June 30, 2012(2) | | 8,703,906 | |
| | LB Pacific, L.P. | | | |
8,049,550 | | Term Loan, 6.80%, Maturing March 3, 2012 | | 8,200,479 | |
| | Lyondell-Citgo Refining, L.P. | | | |
13,548,525 | | Term Loan, 5.51%, Maturing May 21, 2007 | | 13,751,753 | |
| | Sprague Energy Corp. | | | |
4,022,727 | | Term Loan, 0.00%, Maturing October 5, 2010(2) | | 4,012,670 | |
2,681,818 | | Term Loan, 0.00%, Maturing October 5, 2010(2) | | 2,675,114 | |
22,795,455 | | Revolving Loan, 5.75%, Maturing October 5, 2010(2) | | 22,738,466 | |
| | Universal Compression, Inc. | | | |
8,019,700 | | Term Loan, 5.59%, Maturing February 15, 2012 | | 8,119,946 | |
| | Williams Production RMT Co. | | | |
19,921,942 | | Term Loan, 6.20%, Maturing May 30, 2008 | | 20,189,653 | |
| | | | $ | 253,112,140 | |
See notes to financial statements
29
Principal | | | | | |
Amount | | Borrower/Tranche Description | | Value | |
| | | | | |
Publishing — 5.6% | | | |
| | | | | |
| | American Media Operations, Inc. | | | |
$ | 38,438 | | Term Loan, 7.06%, Maturing April 1, 2006 | | $ | 38,630 | |
3,188,859 | | Term Loan, 6.81%, Maturing April 1, 2007 | | 3,227,390 | |
18,124,920 | | Term Loan, 6.81%, Maturing April 1, 2008 | | 18,343,923 | |
| | CBD Media, LLC | | | |
9,145,905 | | Term Loan, 6.44%, Maturing December 31, 2009 | | 9,283,094 | |
| | Dex Media East, LLC | | | |
9,653,395 | | Term Loan, 5.78%, Maturing May 8, 2009 | | 9,709,955 | |
| | Dex Media West, LLC | | | |
17,239,889 | | Term Loan, 5.75%, Maturing March 9, 2010 | | 17,342,845 | |
| | Freedom Communications | | | |
12,062,317 | | Term Loan, 5.38%, Maturing May 18, 2012 | | 12,173,894 | |
| | Herald Media, Inc. | | | |
4,128,016 | | Term Loan, 6.78%, Maturing July 22, 2011 | | 4,156,396 | |
748,750 | | Term Loan, 9.78%, Maturing January 22, 2012 | | 758,577 | |
| | Journal Register Co. | | | |
34,349,600 | | Term Loan, 5.69%, Maturing August 12, 2012 | | 34,666,269 | |
| | Liberty Group Operating, Inc. | | | |
9,958,271 | | Term Loan, 6.19%, Maturing February 28, 2012 | | 10,059,925 | |
| | Medianews Group, Inc. | | | |
12,286,984 | | Term Loan, 5.34%, Maturing August 25, 2010 | | 12,330,505 | |
| | Merrill Communications, LLC | | | |
16,658,948 | | Term Loan, 6.58%, Maturing February 9, 2009 | | 16,882,811 | |
| | Morris Publishing Group, LLC | | | |
4,042,500 | | Term Loan, 5.56%, Maturing September 30, 2010 | | 4,086,717 | |
6,252,750 | | Term Loan, 5.81%, Maturing March 31, 2011 | | 6,284,014 | |
| | Nebraska Book Co., Inc. | | | |
11,362,074 | | Term Loan, 6.70%, Maturing March 4, 2011 | | 11,461,493 | |
| | Newspaper Holdings, Inc. | | | |
5,181,818 | | Revolving Loan, 5.81%, Maturing August 24, 2011(2) | | 5,149,432 | |
11,628,182 | | Term Loan, 5.81%, Maturing August 24, 2011 | | 11,628,182 | |
| | R.H. Donnelley Corp. | | | |
2,543,448 | | Term Loan, 5.81%, Maturing December 31, 2009 | | 2,561,067 | |
40,365,560 | | Term Loan, 5.70%, Maturing June 30, 2011 | | 40,683,842 | |
| | Retos Cartera, SA | | | |
1,000,000 | | Term Loan, 4.65%, Maturing March 15, 2013 | | EUR | 1,208,979 | |
1,000,000 | | Term Loan, 5.15%, Maturing March 15, 2014 | | EUR | 1,212,722 | |
| | Seat Pagine Gialle Spa | | | |
14,750,000 | | Term Loan, 4.49%, Maturing May 25, 2012 | | EUR | 17,836,149 | |
| | Siegwerk Druckfarben AG | | | |
2,625,000 | | Term Loan, 4.88%, Maturing September 8, 2013 | | EUR | 3,175,535 | |
2,625,000 | | Term Loan, 5.38%, Maturing September 8, 2014 | | EUR | 3,188,636 | |
| | Source Media, Inc. | | | |
$ | 12,337,641 | | Term Loan, 6.27%, Maturing November 8, 2011 | | $ | 12,514,994 | |
| | SP Newsprint Co. | | | |
8,463,065 | | Term Loan, 4.03%, Maturing January 9, 2010 | | 8,600,590 | |
3,449,125 | | Term Loan, 6.53%, Maturing January 9, 2010 | | 3,505,173 | |
| | Springer Science+Business Media | | | |
3,650,000 | | Term Loan, 5.99%, Maturing May 5, 2010 | | 3,654,336 | |
3,097,232 | | Term Loan, 7.12%, Maturing September 15, 2011 | | 3,121,914 | |
3,355,335 | | Term Loan, 7.62%, Maturing May 5, 2012 | | 3,406,715 | |
3,097,232 | | Term Loan, 7.62%, Maturing May 5, 2012 | | 3,133,529 | |
| | Sun Media Corp. | | | |
9,153,085 | | Term Loan, 6.24%, Maturing February 7, 2009 | | 9,256,058 | |
| | World Directories ACQI Corp. | | | |
1,500,000 | | Term Loan, 4.88%, Maturing November 29, 2012 | | EUR | 1,808,262 | |
7,006,198 | | Term Loan, 5.38%, Maturing November 29, 2013 | | EUR | 8,473,685 | |
| | Xerox Corp. | | | |
12,750,000 | | Term Loan, 5.83%, Maturing September 30, 2008 | | 12,877,500 | |
| | Xsys US, Inc. | | | |
254,462 | | Term Loan, 4.72%, Maturing September 27, 2013 | | EUR | 308,211 | |
2,495,538 | | Term Loan, 4.72%, Maturing September 27, 2013 | | EUR | 3,022,657 | |
7,701,575 | | Term Loan, 6.77%, Maturing September 27, 2013 | | 7,768,963 | |
2,750,000 | | Term Loan, 5.22%, Maturing September 27, 2014 | | EUR | 3,347,337 | |
7,866,565 | | Term Loan, 7.27%, Maturing September 27, 2014 | | 7,984,563 | |
| | YBR Acquisition BV | | | |
6,000,000 | | Term Loan, 4.68%, Maturing June 30, 2013 | | EUR | 7,280,737 | |
6,000,000 | | Term Loan, 5.18%, Maturing June 30, 2014 | | EUR | 7,316,130 | |
| | | | $ | 364,832,336 | |
| | | | | |
Radio and Television — 4.3% | | | |
| | | | | |
| | Adams Outdoor Advertising, L.P. | | | |
$ | 18,202,821 | | Term Loan, 6.20%, Maturing November 18, 2012 | | $ | 18,475,863 | |
| | ALM Media Holdings, Inc. | | | |
8,009,750 | | Term Loan, 6.52%, Maturing March 5, 2010 | | 8,023,102 | |
| | Block Communications, Inc. | | | |
4,860,012 | | Term Loan, 6.27%, Maturing November 30, 2009 | | 4,905,575 | |
| | DirecTV Holdings, LLC | | | |
27,680,000 | | Term Loan, 5.43%, Maturing April 13, 2013 | | 27,956,800 | |
| | Emmis Operating Co. | | | |
34,836,750 | | Term Loan, 5.72%, Maturing November 10, 2011 | | 35,121,993 | |
| | Entravision Communications Corp. | | | |
9,100,000 | | Term Loan, 5.55%, Maturing September 29, 2013 | | 9,179,625 | |
| | Gray Television, Inc. | | | |
5,416,425 | | Term Loan, 5.35%, Maturing December 31, 2012 | | 5,445,202 | |
| | | | | | | | |
See notes to financial statements
30
Principal | | | | | |
Amount | | Borrower/Tranche Description | | Value | |
| | | | | |
Radio and Television (continued) | | | |
| | | | | |
| | Hanley-Wood, LLC | | | |
$ | 1,014,570 | | Term Loan, 1.13%, Maturing August 1, 2012(2) | | $ | 1,018,374 | |
8,560,430 | | Term Loan, 6.14%, Maturing August 1, 2012 | | 8,592,532 | |
| | NEP Supershooters, L.P. | | | |
5,049,000 | | Term Loan, 7.88%, Maturing February 3, 2011 | | 5,118,424 | |
2,977,500 | | Term Loan, 8.02%, Maturing February 3, 2011 | | 3,012,858 | |
| | Nexstar Broadcasting, Inc. | | | |
12,782,232 | | Term Loan, 5.77%, Maturing October 1, 2012 | | 12,872,769 | |
13,011,676 | | Term Loan, 5.77%, Maturing October 1, 2012 | | 13,103,838 | |
| | PanAmSat Corp. | | | |
1,386,365 | | Term Loan, 5.78%, Maturing August 20, 2010 | | 1,401,568 | |
724,889 | | Term Loan, 5.78%, Maturing August 20, 2010 | | 732,838 | |
27,189,439 | | Term Loan, 5.86%, Maturing August 20, 2011 | | 27,571,804 | |
| | Patriot Media and Communications CNJ, Inc. | | | |
500,000 | | Term Loan, 6.31%, Maturing February 6, 2013 | | 507,032 | |
| | Rainbow National Services, LLC | | | |
5,000,000 | | Revolving Loan, 0.00%, Maturing March 31, 2010(2) | | 4,987,500 | |
15,124,585 | | Term Loan, 6.63%, Maturing March 31, 2012 | | 15,280,565 | |
| | Raycom TV Broadcasting, Inc. | | | |
18,350,000 | | Term Loan, 6.06%, Maturing February 24, 2012 | | 18,487,625 | |
| | Spanish Broadcasting System | | | |
12,412,625 | | Term Loan, 6.03%, Maturing June 10, 2012 | | 12,598,814 | |
| | Susquehanna Media Co. | | | |
16,716,000 | | Term Loan, 5.98%, Maturing March 31, 2012 | | 16,815,260 | |
| | TDF SA | | | |
4,151,899 | | Term Loan, 4.42%, Maturing March 11, 2013 | | EUR | 5,038,321 | |
4,151,899 | | Term Loan, 5.17%, Maturing March 11, 2014 | | EUR | 5,055,736 | |
4,661,720 | | Term Loan, 5.79%, Maturing March 11, 2015 | | EUR | 5,690,015 | |
| | Telewest Global Finance, LLC | | | |
2,915,000 | | Term Loan, 6.15%, Maturing December 22, 2012 | | 2,940,506 | |
2,225,000 | | Term Loan, 6.90%, Maturing December 22, 2013 | | 2,233,807 | |
| | Young Broadcasting, Inc. | | | |
8,563,538 | | Term Loan, 5.77%, Maturing November 3, 2012 | | 8,636,687 | |
| | | | $ | 280,805,033 | |
| | | | | |
Rail Industries — 0.6% | | | |
| | | | | |
| | Kansas City Southern Industries, Inc. | | | |
$ | 14,263,342 | | Term Loan, 5.34%, Maturing March 30, 2008 | | $ | 14,410,439 | |
| | Railamerica, Inc. | | | |
2,268,664 | | Term Loan, 5.88%, Maturing September 29, 2011 | | 2,308,365 | |
19,191,665 | | Term Loan, 5.90%, Maturing September 29, 2011 | | 19,527,519 | |
| | | | $ | 36,246,323 | |
| | | | | |
Retailers (Except Food and Drug) — 3.2% | | | |
| | | | | |
| | Advance Stores Company, Inc. | | | |
$ | 9,519,494 | | Term Loan, 5.38%, Maturing September 30, 2010 | | $ | 9,656,336 | |
11,094,511 | | Term Loan, 5.91%, Maturing September 30, 2010 | | 11,253,995 | |
| | Alimentation Couche-Tard, Inc. | | | |
5,483,087 | | Term Loan, 5.69%, Maturing December 17, 2010 | | 5,551,625 | |
| | American Achievement Corp. | | | |
8,144,796 | | Term Loan, 6.52%, Maturing March 25, 2011 | | 8,185,520 | |
| | Amscan Holdings, Inc. | | | |
7,702,500 | | Term Loan, 6.72%, Maturing April 30, 2012 | | 7,750,641 | |
| | Coinmach Laundry Corp. | | | |
15,373,563 | | Term Loan, 6.97%, Maturing July 25, 2009 | | 15,594,558 | |
| | FTD, Inc. | | | |
7,863,164 | | Term Loan, 6.19%, Maturing February 28, 2011 | | 7,976,197 | |
| | Harbor Freight Tools USA, Inc. | | | |
16,612,399 | | Term Loan, 6.30%, Maturing July 15, 2010 | | 16,828,360 | |
| | Home Interiors & Gifts, Inc. | | | |
3,796,255 | | Term Loan, 9.09%, Maturing March 31, 2011 | | 3,487,809 | |
| | Josten’s Corp. | | | |
4,000,000 | | Revolving Loan, 0.00%, Maturing October 4, 2009(2) | | 3,895,000 | |
1,200,000 | | Term Loan, 6.44%, Maturing October 4, 2010 | | 1,206,750 | |
26,387,131 | | Term Loan, 5.94%, Maturing October 4, 2011 | | 26,828,298 | |
| | Mapco Express, Inc. | | | |
4,025,910 | | Term Loan, 8.50%, Maturing April 28, 2011 | | 4,078,750 | |
| | Movie Gallery, Inc. | | | |
7,750,575 | | Term Loan, 7.83%, Maturing April 27, 2011 | | 7,596,370 | |
| | Musicland Group, Inc. | | | |
12,000,000 | | Revolving Loan, 8.47%, Maturing August 11, 2008(2) | | 12,030,000 | |
| | Neiman Marcus Group, Inc. | | | |
6,750,000 | | Term Loan, 6.48%, Maturing April 5, 2013 | | 6,793,875 | |
| | Oriental Trading Co., Inc. | | | |
11,541,620 | | Term Loan, 6.31%, Maturing August 4, 2010 | | 11,606,542 | |
| | Petro Stopping Center, L.P. | | | |
531,250 | | Term Loan, 5.94%, Maturing February 9, 2007 | | 537,891 | |
| | Rent-A-Center, Inc. | | | |
18,359,675 | | Term Loan, 5.46%, Maturing June 30, 2010 | | 18,586,876 | |
| | Savers, Inc. | | | |
3,719,443 | | Term Loan, 7.65%, Maturing August 4, 2009 | | 3,751,988 | |
| | Stewert Enterprises, Inc. | | | |
3,686,173 | | Term Loan, 5.60%, Maturing November 19, 2011 | | 3,734,554 | |
| | Travelcenters of America, Inc. | | | |
21,210,000 | | Term Loan, 5.71%, Maturing November 30, 2008 | | 21,461,869 | |
| | | | $ | 208,393,804 | |
| | | | | | | | |
See notes to financial statements
31
Principal | | | | | |
Amount | | Borrower/Tranche Description | | Value | |
| | | | | |
Surface Transport — 0.3% | | | |
| | | | | |
| | Horizon Lines, LLC | | | |
$ | 5,826,250 | | Term Loan, 6.27%, Maturing July 7, 2011 | | $ | 5,917,285 | |
| | Sirva Worldwide, Inc. | | | |
10,658,823 | | Term Loan, 7.53%, Maturing December 1, 2010 | | 10,248,459 | |
| | Transport Industries, L.P. | | | |
642,857 | | Term Loan, 0.00%, Maturing September 30, 2011(2) | | 648,884 | |
3,357,143 | | Term Loan, 6.56%, Maturing September 30, 2011 | | 3,388,616 | |
| | | | $ | 20,203,244 | |
| | | | | |
Telecommunications — 4.0% | | | |
| | | | | |
| | AAT Communications Corp. | | | |
$ | 2,600,000 | | Term Loan, 5.61%, Maturing July 29, 2012 | | $ | 2,636,564 | |
| | Alaska Communications Systems Holdings, Inc. | | | |
17,150,000 | | Term Loan, 6.02%, Maturing February 11, 2012 | | 17,398,675 | |
| | Cellular South, Inc. | | | |
6,292,551 | | Term Loan, 5.94%, Maturing May 4, 2011 | | 6,359,409 | |
| | Centennial Cellular Operating Co., LLC | | | |
3,247,159 | | Revolving Loan, 0.00%, Maturing February 9, 2010(2) | | 3,157,862 | |
1,252,841 | | Revolving Loan, 0.00%, Maturing February 9, 2010(2) | | 1,218,388 | |
17,351,532 | | Term Loan, 6.34%, Maturing February 9, 2011 | | 17,489,407 | |
| | Cincinnati Bell, Inc. | | | |
4,425,000 | | Term Loan, 5.38%, Maturing August 31, 2012 | | 4,455,422 | |
| | Consolidated Communications, Inc. | | | |
17,442,901 | | Term Loan, 6.17%, Maturing July 27, 2015 | | 17,682,741 | |
| | D&E Communications, Inc. | | | |
5,716,273 | | Term Loan, 5.86%, Maturing December 31, 2011 | | 5,766,290 | |
| | Fairpoint Communications, Inc. | | | |
21,785,000 | | Term Loan, 5.81%, Maturing February 8, 2012 | | 22,032,804 | |
| | Hawaiian Telcom Communications, Inc. | | | |
5,175,000 | | Term Loan, 6.28%, Maturing October 31, 2012 | | 5,238,880 | |
| | Intelsat, Ltd. | | | |
14,596,827 | | Term Loan, 5.81%, Maturing July 28, 2011 | | 14,748,882 | |
| | Iowa Telecommunications Services | | | |
7,998,000 | | Term Loan, 5.71%, Maturing November 23, 2011 | | 8,089,225 | |
| | IPC Acquisition Corp. | | | |
2,711,691 | | Term Loan, 6.83%, Maturing August 5, 2011 | | 2,727,508 | |
| | Madison River Capital, LLC | | | |
3,660,000 | | Term Loan, 6.59%, Maturing July 29, 2012 | | 3,714,139 | |
| | Nextel Partners Operation Corp. | | | |
24,265,000 | | Term Loan, 5.37%, Maturing May 31, 2012 | | 24,398,967 | |
| | NTelos, Inc. | | | |
$ | 11,210,287 | | Term Loan, 6.53%, Maturing February 18, 2011 | | $ | 11,308,378 | |
| | Qwest Corp. | | | |
14,756,000 | | Term Loan, 8.53%, Maturing June 4, 2007 | | 15,238,639 | |
| | Satbirds Finance SARL | | | |
3,000,000 | | Term Loan, 4.59%, Maturing April 4, 2012 | | EUR | 3,576,800 | |
3,500,000 | | Term Loan, 5.09%, Maturing April 4, 2013 | | EUR | 4,193,173 | |
3,500,000 | | Term Loan, 5.09%, Maturing April 4, 2013 | | EUR | 4,193,173 | |
| | SBA Senior Finance, Inc. | | | |
13,157,687 | | Term Loan, 7.88%, Maturing October 31, 2008 | | 13,209,765 | |
| | Stratos Global Corp. | | | |
5,042,000 | | Term Loan, 6.27%, Maturing December 3, 2010 | | 5,059,334 | |
| | Syniverse Holdings, Inc. | | | |
3,724,487 | | Term Loan, 6.03%, Maturing February 15, 2012 | | 3,768,715 | |
| | Triton PCS, Inc. | | | |
15,101,795 | | Term Loan, 7.34%, Maturing November 18, 2009 | | 15,255,169 | |
| | Valor Telecom Enterprise, LLC | | | |
6,300,000 | | Revolving Loan, 0.00%, Maturing February 14, 2011(2) | | 6,385,497 | |
14,838,333 | | Term Loan, 5.80%, Maturing February 14, 2012 | | 15,039,704 | |
| | Westcom Corp. | | | |
4,794,219 | | Term Loan, 6.99%, Maturing December 17, 2010 | | 4,827,179 | |
| | Winstar Communications, Inc. | | | |
127,026 | | DIP Loan, 0.00%, Maturing December 31, 2005(3)(4) | | 47,000 | |
| | | | $ | 259,217,689 | |
| | | | | |
Utilities — 2.6% | | | |
| | | | | |
| | Allegheny Energy Supply Co., LLC | | | |
$ | 17,380,600 | | Term Loan, 5.79%, Maturing March 8, 2011 | | $ | 17,589,167 | |
| | Cellnet Technology, Inc. | | | |
4,004,963 | | Term Loan, 7.17%, Maturing April 26, 2012 | | 4,035,000 | |
| | Cogentrix Delaware Holdings, Inc. | | | |
17,747,944 | | Term Loan, 5.78%, Maturing April 14, 2012 | | 17,990,132 | |
| | Covanta Energy Corp. | �� | | |
7,214,634 | | Term Loan, 3.86%, Maturing June 24, 2012 | | 7,318,345 | |
5,820,777 | | Term Loan, 6.96%, Maturing June 24, 2012 | | 5,904,451 | |
| | Energy Transfer Company, L.P. | | | |
12,100,000 | | Term Loan, 6.81%, Maturing June 16, 2012 | | 12,216,463 | |
| | KGen, LLC | | | |
5,800,850 | | Term Loan, 6.65%, Maturing August 5, 2011 | | 5,793,599 | |
| | | | | | | | |
See notes to financial statements
32
Principal | | | | | |
Amount | | Borrower/Tranche Description | | Value | |
| | | | | |
Utilities (continued) | | | |
| | | | | |
| | La Paloma Generating Co., LLC | | | |
$ | 344,262 | | Term Loan, 5.75%, Maturing August 16, 2012 | | $ | 347,447 | |
2,100,000 | | Term Loan, 5.77%, Maturing August 16, 2012 | | 2,119,425 | |
167,250 | | Term Loan, 5.77%, Maturing August 16, 2012 | | 168,798 | |
| | NRG Energy, Inc. | | | |
750,000 | | Revolving Loan, 0.00%, Maturing June 23, 2009(2) | | 747,188 | |
11,971,890 | | Term Loan, 3.92%, Maturing December 24, 2011 | | 12,056,687 | |
15,450,133 | | Term Loan, 5.90%, Maturing December 24, 2011 | | 15,559,567 | |
| | Pike Electric, Inc. | | | |
7,075,532 | | Term Loan, 6.19%, Maturing July 1, 2012 | | 7,163,976 | |
3,597,125 | | Term Loan, 6.25%, Maturing December 10, 2012 | | 3,642,090 | |
| | Plains Resources, Inc. | | | |
11,497,742 | | Term Loan, 5.85%, Maturing July 23, 2010 | | 11,677,394 | |
| | Reliant Energy, Inc. | | | |
10,461,528 | | Term Loan, 6.11%, Maturing December 22, 2010 | | 10,507,297 | |
| | Texas Genco, LLC | | | |
11,829,864 | | Term Loan, 5.88%, Maturing December 14, 2011 | | 11,889,013 | |
23,917,017 | | Term Loan, 5.88%, Maturing December 14, 2011 | | 24,036,602 | |
| | | | $ | 170,762,641 | |
| | | | | |
Total Senior, Floating Rate Interests
(identified cost, $6,272,515,034) | | $ | 6,300,666,280 | |
| | | | | | | |
Corporate Bonds & Notes — 1.1%
Principal | | | | | |
Amount | | | | | |
(000’s omitted) | | Security | | Value | |
| | | | | |
Financial Intermediaries — 0.1% | | | |
| | | | | |
| | Alzette, Variable Rate | | | |
$ | 1,180 | | 8.691%, 12/15/20(5) | | $ | 1,212,096 | |
| | Avalon Capital Ltd. 3, Series 1A, Class D, Variable Rate | | | |
1,140 | | 5.78%, 2/24/19(5) | | 1,143,762 | |
| | Babson Ltd., Series 2005-1A, Class C1, Variable Rate | | | |
1,500 | | 6.10%, 4/15/19(5) | | 1,500,000 | |
| | Bryant Park CDO Ltd., Series 2005-1A, Class C, Variable Rate | | | |
1,500 | | 6.20%, 1/15/19(5) | | 1,500,000 | |
| | Carlyle High Yield Partners, Series 2004-6A, Class C, Variable Rate | | | |
1,500 | | 6.23%, 8/11/16(5) | | 1,500,000 | |
| | Centurion CDO 8 Ltd., Series 2005 8A, Class D, Variable Rate | | | |
1,000 | | 9.29%, 3/8/17 | | 1,000,000 | |
| | Stanfield Vantage Ltd., Series 2005-1A, Class D, Variable Rate | | | |
1,500 | | 5.97%, 3/21/17(5) | | 1,509,600 | |
| | | | $ | 9,365,458 | |
| | | | | |
Radio and Television — 0.4% | | | |
| | | | | |
| | Echostar DBS Corp., Sr. Notes, Variable Rate | | | |
$ | 5,000 | | 7.304%, 10/1/08 | | $ | 5,125,000 | |
| | Emmis Communications Corp., Sr. Notes, Class A, Variable Rate | | | |
3,500 | | 9.745%, 6/15/12 | | 3,526,250 | |
| | Paxson Communications Corp., Variable Rate | | | |
17,250 | | 6.90%, 1/15/10(5) | | 17,293,125 | |
| | | | $ | 25,944,375 | |
| | | | | |
Real Estate — 0.2% | | | | |
| | | | | |
| | Assemblies of God, Variable Rate | | | |
$ | 11,935 | | 5.94%, 6/15/29(5) | | $ | 11,935,217 | |
| | | | $ | 11,935,217 | |
| | | | | |
Telecommunications — 0.4% | | | |
| | | | | |
| | Qwest Corp., Sr. Notes, Variable Rate | | | |
$ | 5,850 | | 7.12%, 6/15/13(5) | | $ | 6,201,000 | |
| | Rogers Wireless, Inc., Variable Rate | | | |
6,589 | | 6.995%, 12/15/10 | | 6,852,560 | |
| | Rural Cellular Corp., Variable Rate | | | |
11,000 | | 8.37%, 3/15/10 | | 11,302,500 | |
| | | | $ | 24,356,060 | |
| | | | | |
Total Corporate Bonds & Notes
(identified cost, $70,686,960) | | $ | 71,601,110 | |
Common Stocks — 0.1%
Shares | | Security | | Value | |
105,145 | | Hayes Lemmerz International(6) | | $ | 411,117 | |
25 | | Knowledge Universe, Inc.(3)(6)(7) | | 41,601 | |
86,020 | | Maxim Crane Works, Holdings(6) | | 2,774,132 | |
| | | | | |
Total Common Stocks
(identified cost, $2,574,911) | | $ | 3,226,850 | |
Preferred Stocks — 0.0%
Shares | | Security | | Value | |
350 | | Hayes Lemmerz International(3)(6)(7) | | $ | 5,912 | |
| | | | | |
Total Preferred Stocks
(identified cost, $17,500) | | $ | 5,912 | |
See notes to financial statements
33
Closed-End Investment Companies — 0.0%
Shares | | Security | | Value | |
4,000 | | Pioneer Floating Rate Trust | | $ | 70,120 | |
| | | | | |
Total Closed-End Investment Companies
(identified cost, $72,148) | | $ | 70,120 | |
Commercial Paper — 4.8%
Principal | | Maturity | | | | | | | |
Amount | | Date | | Borrower | | Rate | | Value | |
$ | 24,088,000 | | 11/02/05 | | Abbey National North America, LLC | | 3.93 | % | $ | 24,085,370 | |
52,000,000 | | 11/02/05 | | AIG Funding, Inc. | | 3.88 | % | 51,994,396 | |
64,122,000 | | 11/01/05 | | General Electric Capital Corp | | 4.02 | % | 64,122,000 | |
20,000,000 | | 11/03/05 | | HSBC Finance Corp. | | 3.81 | % | 19,995,767 | |
25,000,000 | | 11/01/05 | | MetLife Funding, Inc. | | 3.86 | % | 25,000,000 | |
63,936,000 | | 11/01/05 | | Prudential Financial, Inc. | | 4.02 | % | 63,936,000 | |
64,735,000 | | 11/01/05 | | UBS Finance Delaware, LLC | | 4.05 | % | 64,735,000 | |
| | | | | | | | | |
Total Commercial Paper
(at amortized cost) | | | | | | $ | 313,868,533 | |
| | | | | | | | | | | |
Short-Term Investments — 0.0%
Principal | | Maturity | | | | | | | |
Amount | | Date | | Borrower | | Rate | | Value | |
$ | 2,000,000 | | 11/01/05 | | Investors Bank and Trust Company Time Deposit | | 4.03 | % | $ | 2,000,000 | |
| | | | | | | | | |
Total Short-Term Investments
(at amortized cost) | | $ | 2,000,000 | |
| | | | | | | | | |
Total Investments — 102.8%
(identified cost, $6,661,735,086) | | $ | 6,691,438,805 | |
| | | | | | | | | |
Less Unfunded Loan Commitments — (4.2)% | | $ | (277,042,438 | ) |
| | | | | | | | | |
Net Investments — 98.6%
(identified cost, $6,384,692,648) | | $ | 6,414,396,367 | |
| | | | | | | | | |
Other Assets, Less Liabilities — 1.4% | | $ | 91,661,616 | |
| | | | | | | | | |
Net Assets — 100.0% | | $ | 6,506,057,983 | |
| | | | | | | | | | | |
EUR – Euro
GBP – British Pound
(1) Senior floating-rate interests often require prepayments from excess cash flows or permit the borrower to repay at its election. The degree to which borrowers repay, whether as a contractual requirement or at their election, cannot be predicted with accuracy. As a result, the actual remaining maturity may be substantially less than the stated maturities shown. However, it is anticipated that the senior floating-rate interests will have an expected average life of approximately two to three years. The stated interest rate represents the weighted average interest rate of all contracts within the senior loan facility. Senior Loans typically have rates of interest which are redetermined either daily, monthly, quarterly or semi-annually by reference to a base lending rate, plus a premium. These base lending rates are primarily the London-Interbank Offered Rate (“LIBOR”), and secondarily the prime rate offered by one or more major United States banks (the “Prime Rate”) and the certificate of deposit (“CD”) rate or other base lending rates used by commercial lenders.
(2) Unfunded loan commitments. See Note 1E for description.
(3) Security valued at fair value using methods determined in good faith by or at the direction of the Trustees.
(4) Defaulted security.
(5) Security exempt from registration under Rule 144A of the Securities Act of 1933. These securities may be sold in transactions exempt from registration, normally to qualified institutional buyers. At October 31, 2005, the aggregate value of the securities is $43,794,800 or 0.7% of the Portfolio’s net assets.
(6) Non-income producing security.
(7) Restricted security.
See notes to financial statements
34
Floating Rate Portfolio as of October 31, 2005
FINANCIAL STATEMENTS
Statement of Assets and Liabilities
As of October 31, 2005
Assets | | | |
Investments, at value
(identified cost, $6,384,692,648) | | $ | 6,414,396,367 | |
Foreign currency, at value
(identified cost, $1,007,596) | | 1,007,293 | |
Receivable for investments sold | | 17,654,312 | |
Receivable for open swap contracts | | 353,034 | |
Interest and dividends receivable | | 33,544,770 | |
Receivable for open forward foreign currency contracts | | 3,914,831 | |
Cash collateral segregated to cover open swap contracts | | 55,300,000 | |
Prepaid expenses | | 646,656 | |
Total assets | | $ | 6,526,817,263 | |
| | | |
Liabilities | | | |
Due to bank | | $ | 17,655,978 | |
Payable to affiliate for investment advisory fees | | 2,808,982 | |
Payable to affiliate for Trustees’ fees | | 2,788 | |
Accrued expenses | | 291,532 | |
Total liabilities | | $ | 20,759,280 | |
Net Assets applicable to investors’ interest in Portfolio | | $ | 6,506,057,983 | |
| | | |
Sources of Net Assets | | | |
Net proceeds from capital contributions and withdrawals | | $ | 6,472,242,145 | |
Net unrealized appreciation (computed on the basis of identified cost) | | 33,815,838 | |
Total | | $ | 6,506,057,983 | |
Statement of Operations
For the Year Ended October 31, 2005
Investment Income | | | |
Interest | | $ | 319,674,483 | |
Dividends | | 2,453 | |
Total investment income | | $ | 319,676,936 | |
| | | |
Expenses | | | |
Investment adviser fee | | $ | 31,396,020 | |
Trustees’ fees and expenses | | 29,572 | |
Custodian fee | | 963,532 | |
Legal and accounting services | | 465,535 | |
Miscellaneous | | 396,834 | |
Total expenses | | $ | 33,251,493 | |
Deduct — | | | |
Reduction of custodian fee | | $ | 53,996 | |
Total expense reductions | | $ | 53,996 | |
| | | |
Net expenses | | $ | 33,197,497 | |
| | | |
Net investment income | | $ | 286,479,439 | |
| | | |
Realized and Unrealized Gain (Loss) | | | |
Net realized gain (loss) — | | | |
Investment transactions (identified cost basis) | | $ | (11,369,424 | ) |
Swap contracts | | 890,313 | |
Foreign currency and forward foreign currency exchange contract transactions | | 4,218,283 | |
Net realized loss | | $ | (6,260,828 | ) |
Change in unrealized appreciation (depreciation) — | | | |
Investments (identified cost basis) | | $ | 1,024,421 | |
Swap contracts | | 337,588 | |
Foreign currency and forward foreign currency exchange contracts | | 3,873,151 | |
Net change in unrealized appreciation (depreciation) | | $ | 5,235,160 | |
| | | |
Net realized and unrealized loss | | $ | (1,025,668 | ) |
| | | |
Net increase in net assets from operations | | $ | 285,453,771 | |
See notes to financial statements
35
Statements of Changes in Net Assets
| | Year Ended
October 31, 2005 | | Year Ended October 31, 2004 | |
Increase (Decrease) in Net Assets | | | | | |
From operations — | | | | | |
Net investment income | | $ | 286,479,439 | | $ | 124,003,812 | |
Net realized loss from investment transactions, swap contracts, and foreign currency transactions | | (6,260,828 | ) | (6,500,801 | ) |
Net change in unrealized appreciation (depreciation) from investments, swap contracts, and foreign currency transactions | | 5,235,160 | | 25,631,911 | |
Net increase in net assets from operations | | $ | 285,453,771 | | $ | 143,134,922 | |
Capital transactions — | | | | | |
Contributions | | $ | 2,972,303,225 | | $ | 4,091,382,871 | |
Withdrawals | | (2,141,337,314 | ) | (1,062,753,539 | ) |
Net increase in net assets from capital transactions | | $ | 830,965,911 | | $ | 3,028,629,332 | |
| | | | | |
Net increase in net assets | | $ | 1,116,419,682 | | $ | 3,171,764,254 | |
| | | | | |
Net Assets | | | | | |
At beginning of year | | $ | 5,389,638,301 | | $ | 2,217,874,047 | |
At end of year | | $ | 6,506,057,983 | | $ | 5,389,638,301 | |
See notes to financial statements
36
Supplementary Data
| | Year Ended October 31, | |
| | 2005 | | 2004 | | 2003 | | 2002 | | 2001 | |
Ratios/Supplementary Data† | | | | | | | | | | | |
Ratios (As a percentage of average daily net assets): | | | | | | | | | | | |
Net expenses | | 0.54 | % | 0.56 | % | 0.61 | % | 0.62 | % | 0.57 | % |
Net expenses after custodian fee reduction | | 0.54 | % | 0.56 | % | 0.61 | % | 0.62 | % | 0.57 | % |
Net investment income | | 4.68 | % | 3.27 | % | 4.05 | % | 4.72 | % | 6.45 | % |
Portfolio Turnover | | 57 | % | 67 | % | 64 | % | 76 | % | 52 | % |
Total Return(1) | | 4.77 | % | 3.93 | % | 6.91 | % | 2.19 | % | — | |
Net assets, end of year (000’s omitted) | | $ | 6,506,058 | | $ | 5,389,638 | | $ | 2,217,874 | | $ | 1,326,128 | | $ | 1,387,728 | |
| | | | | | | | | | | | | | | | |
† The operating expenses of the Portfolio may reflect a reduction of the investment adviser fee and an allocation of expenses to the Investment Adviser. Had such actions not been taken, the ratios would have been as follows:
Ratios (As a percentage of average daily net assets): | | | |
Expenses | | 0.61 | % |
Expenses after custodian fee reduction | | 0.61 | % |
Net investment income | | 6.41 | % |
(1) Total return is required to be disclosed for the fiscal years beginning December 15, 2000.
See notes to financial statements
37
Floating Rate Portfolio as of October 31, 2005
NOTES TO FINANCIAL STATEMENTS
1 Significant Accounting Policies
Floating Rate Portfolio (the Portfolio) is registered under the Investment Company Act of 1940 as an open-end management investment company. The Portfolio was organized as a trust under the laws of the State of New York on June 19, 2000. The Portfolio’s investment objective is to provide a high level of current income. The Portfolio normally primarily invests in interests of senior floating rate loans. The Declaration of Trust permits the Trustees to issue interests in the Portfolio. At October 31, 2005, the Eaton Vance Floating-Rate Fund, Eaton Vance Floating-Rate & High Income Fund and Eaton Vance Medallion Floating-Rate Income Fund held an approximate 67.5.%, 25.8% and 2.4% interest in the Portfolio, respectively. The following is a summary of significant accounting policies of the Portfolio. The policies are in conformity with accounting principles generally accepted in the United States of America.
A Investment Valuation — The Portfolio’s investments are primarily in interests in senior floating rate loans (Senior Loans). Certain Senior Loans are deemed to be liquid because reliable market quotations are readily available for them. Liquid Senior Loans are valued on the basis of prices furnished by a pricing service. Other Senior Loans are valued at fair value by the Fund’s investment adviser under procedures approved by the Trustees. In connection with determining the fair value of a Senior Loan, the investment adviser makes an assessment of the likelihood that the borrower will make a full repayment of the Senior Loan. The primary factors considered by the investment adviser when making this assessment are (i) the creditworthiness of the borrower, (ii) the value of the collateral backing the Senior Loan, and (iii) the priority of the Senior Loan versus other creditors of the borrower. If, based on its assessment, the investment adviser believes there is a reasonable likelihood that the borrower will make a full repayment of the Senior Loan, the investment adviser will determine the fair value of the Senior Loan using a matrix pricing approach that considers the yield on the Senior Loan relative to yields on other loan interests issued by companies of comparable credit quality. If, based on its assessment, the investment adviser believes there is not a reasonable likelihood that the borrower will make a full repayment of the Senior Loan, the investment adviser will determine the fair value of the Senior Loan using analyses that include but are not limited to (i) a comparison of the value of the borrower’s outstanding equity and debt to that of comparable public companies; (ii) a discounted cash flow analysis; or (iii) when the investment adviser believes it is likely that a borrower will be liquidated or sold, an analysis of the terms of such liquidation or sale. In certain cases, the investment adviser will use a combination of analytical methods to determine fair value, such as when only a portion of a borrower’s assets are likely to be sold. In conducting its assessment and analyses for purposes of determining fair value of a Senior Loan, the investment adviser will use its discretion and judgment in considering and appraising such factors, data and information and the relative weight to be given thereto as it deems relevant, including without limitation, some or all of the following: (i) the fundamental characteristics of and fundamental analytical data relating to the Senior Loan, including the cost, size, current interest rate, maturity and base lending rate of the Senior Loan, the terms and conditions of the Senior Loan and any related agreements, and the position of the Senior Loan in the Borrower’s debt structure; (ii) the nature, adequacy and value of the collateral securing the Senior Loan, including the Portfolio’s rights, remedies and interests with respect to the collateral; (iii) the creditworthiness of the Borrower, based on an evaluation of, among other things, its financial condition, financial statements and information about the Borrower’s business, cash flows, capital structure and future prospects; (iv) information relating to the market for the Senior Loan including price quotations for and trading in the Senior Loan, interests in similar Senior Loans and the market environment, investor attitudes towards the Senior Loan and interests in similar Senior Loans; (v) the experience, reputation, stability and financial condition of the Agent and any intermediate participants in the Senior Loan; and (vi) general economic and market conditions affecting the fair value of the Senior Loan.
Other portfolio securities (other than short-term obligations, but including listed issues) may be valued on the basis of prices furnished by one or more pricing services which determine prices for normal, institutional-size trading units of such securities which may use market information, transactions for comparable securities and various relationships between securities which are generally recognized by institutional traders. The value of interest rate swaps will be based on dealer quotations. Short-term obligations which mature in sixty days or less are valued at amortized cost. If short-term debt securities were acquired with a remaining maturity of more than 60 days, their amortized cost value will be based on their value on the sixty-first day prior to maturity. Over the counter options are valued at the mean between the bid and the asked price provided by dealers. Marketable securities listed on the NASDAQ National Market System are valued at the NASDAQ official closing price. Financial futures contracts listed on the commodity exchanges and options thereon are
38
valued at closing settlement prices. Repurchase agreements are valued at cost plus accrued interest. Other portfolio securities for which there are no quotations or valuations are valued at fair value as determined in good faith by or at the direction of the Trustees.
B Foreign Currency Translation — Investment valuations, other assets, and liabilities initially expressed in foreign currencies are converted each business day into U.S. dollars based upon current exchange rates. Purchases and sales of foreign investment securities and income and expenses are converted into U.S. dollars based upon currency exchange rates prevailing on the respective dates of such transactions. Recognized gains or losses on investment transactions attributable to changes in foreign currency exchange rates are recorded for financial statement purposes as net realized gains and losses on investments. That portion of unrealized gains and losses on investments that results from fluctuations in foreign currency exchange rates is not separately disclosed.
C Income — Interest income from Senior Loans is recorded on the accrual basis at the then-current interest rate, while all other interest income is determined on the basis of interest accrued, adjusted for amortization of premium or discount when required. Fees associated with amendments are paid/recognized immediately.
D Income Taxes — The Portfolio has elected to be treated as a partnership for federal tax purposes. No provision is made by the Portfolio for federal or state taxes on any taxable income of the Portfolio because each investor in the Portfolio is ultimately responsible for the payment of any taxes. Since at least one of the Portfolio’s investors is a regulated investment company that invests all or substantially all of its assets in the Portfolio, the Portfolio normally must satisfy the applicable source of income and diversification requirements (under the Internal Revenue Code) in order for its investors to satisfy them. The Portfolio will allocate at least annually among its investors each investor’s distributive share of the Portfolio’s net investment income, net realized capital gains, and any other items of income, gain, loss, deduction or credit.
E Forward Foreign Currency Exchange Contracts — The Portfolio may enter into forward foreign currency exchange contracts for the purchase or sale of a specific foreign currency at a fixed price on a future date. Risks may arise upon entering these contracts from the potential inability of counterparties to meet the terms of their contracts and from movements in the value of a foreign currency relative to the U.S. dollar. The Portfolio will enter into forward contracts for hedging purposes as well as non-hedging purposes. The forward foreign currency exchange contracts are adjusted by the daily exchange rate of the underlying currency and any gains or losses are recorded for financial statement purposes as unrealized until such time as the contracts have been closed.
F Interest Rate Swaps — The Portfolio may use interest rate swaps for risk management purposes and not as a speculative investment. Pursuant to these agreements the Portfolio receives quarterly payments at a rate equal to a predetermined three-month LIBOR. In exchange, the Portfolio makes semi-annual payments at a predetermined fixed rate of interest. During the term of the outstanding swap agreement, changes in the underlying value of the swap are recorded as unrealized gains and losses. The value of the swap is determined by changes in the relationship between two rates of interest. The Portfolio is exposed to credit loss in the event of nonperformance by the swap counterparty. The Portfolio does not anticipate non-performance by the counterparty. Risk may also arise from the unanticipated movements in value of interest rates.
G Credit Default Swaps — The Portfolio may enter into credit default swap contracts for risk management purposes, including diversification. When the Portfolio is the buyer of a credit default swap contract, the Portfolio is entitled to receive the par (or other agreed-upon) value of a referenced debt obligation from the counterparty to the contract in the event of a default by a third party, such as a U.S. or foreign corporate issuer, on the debt obligation. In return, the Portfolio would pay the counterparty a periodic stream of payments over the term of the contract provided that no event of default has occurred. If no default occurs, the Portfolio would have made a stream of payments and received no benefit from the contract reducing exposure to the credit by the notional amount of the contract upon default of the referenced debt obligation. As the seller, the Portfolio would effectively add leverage to its portfolio because, in addition to its total net assets, the Portfolio would be subject to investment exposure on the notional amount of the swap. The Portfolio will segregate assets in the form
39
of cash and cash equivalents in an amount equal to the aggregate market value of the credit default swaps of which it is the seller, marked to market on a daily basis. These transactions involve certain risks, including the risk that the seller may be unable to fulfill the transaction.
H Expense Reduction — Investors Bank & Trust (IBT) serves as custodian of the Portfolio. Pursuant to the custodian agreement, IBT receives a fee reduced by credits which are determined based on the average daily cash balance the Portfolio maintains with IBT. All credit balances used to reduce the Portfolio’s custodian fees are reported as a reduction of total expenses in the Statement of Operations.
I Use of Estimates — The preparation of the financial statements in conformity with accounting principles generally accepted in the United States of America requires management to make estimates and assumptions that affect the reported amounts of assets and liabilities at the date of the financial statements and the reported amounts of income and expense during the reporting period. Actual results could differ from those estimates.
J Indemnifications — Under the Portfolio’s organizational documents, its officers and Trustees may be indemnified against certain liabilities and expenses arising out of the performance of their duties to the Portfolio. Interestholders in the Portfolio are jointly and severally liable for the liabilities and obligations of the Portfolio in the event that the Portfolio fails to satisfy such liabilities and obligations; provided, however, that, to the extent assets are available in the Portfolio, the Portfolio may, under certain circumstances, indemnify interestholders from and against any claim or liability to which such holder may become subject by reason of being or having been an interestholder in the Portfolio. Additionally, in the normal course of business, the Portfolio enters into agreements with service providers that may contain indemnification clauses. The Portfolio’s maximum exposure under these arrangements is unknown as this would involve future claims that may be made against the Portfolio that have not yet occurred.
K Other — Investment transactions are accounted foron a trade date basis.
2 Investment Adviser Fee and Other Transactions with Affiliates
The investment adviser fee is earned by BMR, as compensation for management and investment advisory services rendered to the Portfolio. The fee is equivalent to 0.575% of the Portfolio’s average daily net assets up to $1 billion and at reduced rates as daily net assets exceed that level. For the year ended October 31, 2005, the fee was equivalent to 0.512% of the Portfolio’s average net assets for such period and amounted to $31,396,020.
Except as to Trustees of the Portfolio who are not members of EVM’s or BMR’s organization, officers and Trustees receive remuneration for their services to the Portfolio out of such investment adviser fee. Trustees of the Portfolio that are not affiliated with the Investment Adviser may elect to defer receipt of all or a portion of their annual fees in accordance with the terms of the Trustees Deferred Compensation Plan. For the year ended October 31, 2005, no significant amounts have been deferred. Certain officers and Trustees of the Portfolio are officers of the above organizations.
3 Investments
The Portfolio invests primarily in Senior Loans. The ability of the issuers of the Senior Loans to meet their obligations may be affected by economic developments in a specific industry. The cost of purchases and the proceeds from principal repayments and sales of Senior Loans for the year ended October 31, 2005 aggregated $5,051,408,553, $2,782,628,052 and $481,855,558, respectively.
4 Line of Credit
The Portfolio participates with other portfolios managed by BMR in a $500 million unsecured line of credit agreement with a group of banks to permit the Portfolio to invest in accordance with its investment practices. Interest is charged under the credit agreement at the bank’s base rate or at an amount above LIBOR. In addition, a fee computed at the annual rate of 0.09% of the daily unused portion of the line of credit is allocated among the participating portfolios at the end of each quarter. As of October 31, 2005, the Portfolio had no borrowings outstanding. The Portfolio did not have any significant borrowings or allocated fees during the year ended October 31, 2005.
5 Overdraft Advances
Pursuant to the custodian agreement between the Portfolio and IBT, IBT may, in its discretion, advance funds to the Portfolio to make properly authorized payments. When such payments result in an overdraft by the Portfolio, the Portfolio is obligated to repay IBT at the current rate of interest charged by IBT for secured loans (currently a rate above the federal funds rate). This
40
obligation is payable on demand to IBT. IBT has a lien on the Portfolio’s assets to the extent of any overdraft. At October 31, 2005, payment due to IBT pursuant to the foregoing arrangement was $17,655,978.
6 Federal Income Tax Unrealized Appreciation (Depreciation)
The cost and unrealized appreciation/depreciation in the value of the investments owned at October 31, 2005, as computed on a federal income tax basis, were as follows:
Aggregate cost | | $ | 6,384,700,888 | |
Gross unrealized appreciation | | $ | 43,261,532 | |
Gross unrealized depreciation | | (13,566,053 | ) |
Net unrealized appreciation | | $ | 29,695,479 | |
7 Financial Instruments
The Portfolio may trade in financial instruments with off-balance sheet risk in the normal course of its investing activities and to assist in managing exposure to various market risks. These financial instruments include written options, financial futures contracts, forward foreign currency contracts, credit default swaps, and interest rate swaps and may involve, to a varying degree, elements of risk in excess of the amounts recognized for financial statement purposes. The notional or contractual amounts of these instruments represent the investment the Portfolio has in particular classes of financial instruments and does not necessarily represent the amounts potentially subject to risk. The measurement of the risks associated with these instruments is meaningful only when all related and offsetting transactions are considered.
Forward Foreign Currency Exchange Contracts
Sales
| | | | | | Net | |
Settlement | | | | | | Unrealized | |
Date | | Deliver | | In Exchange For | | Appreciation | |
11/30/05 | | Euro
2,997,394 | | United States Dollar
3,632,842 | | $ | 37,285 | |
11/30/05 | | Euro
3,711,239 | | United States Dollar
4,498,022 | | 46,165 | |
11/30/05 | | Euro
193,529,968 | | United States Dollar
235,649,831 | | 3,498,875 | |
11/30/05 | | British Pound
24,946,510 | | United States Dollar
44,479,628 | | 332,506 | |
| | | | | | $ | 3,914,831 | |
| | | | | | | | | |
Credit Default Swaps
| | | | | | Net | |
| | | | | | Unrealized | |
Notional | | Expiration | | | | Appreciation | |
Amount | | Date | | Description | | (Depreciation) | |
2,400,000 USD | | 9/20/2008 | | Agreement with Credit Suisse/First Boston dated 1/10/04 whereby the Portfolio will receive 2.45% per year times the notional amount. The Portfolio makes a payment only upon a default event on underlying loan assets (47 in total, each representing 2.13% of the notional value of the swap). | | $ | (41,632 | ) |
| | | | | | | |
1,200,000 USD | | 9/20/2008 | | Agreement with Credit Suisse/First Boston dated 2/13/04 whereby the Portfolio will receive 2.45% per year times the notional amount. The Portfolio makes a payment only upon a default event on underlying loan assets (47 in total, each representing 2.13% of the notional value of the swap). | | (14,504 | ) |
| | | | | | | |
1,200,000 USD | | 9/20/2008 | | Agreement with Credit Suisse/First Boston dated 3/23/04 whereby the Portfolio will receive 2.45% per year times the notional amount. The Portfolio makes a payment only upon a default event on underlying loan assets (39 in total, each representing 2.56% of the notional value of the swap). | | 5,597 | |
| | | | | | | |
10,000,000 USD | | 12/20/2009 | | Agreement with Lehman Brothers dated 10/28/2004 whereby the Portfolio will receive 2.35% per year times the notional amount. The Portfolio makes a payment of the notional amount only upon a default event on the reference entity, a Revolving Credit Agreement issued by Crown Americas, Inc. | | 241,072 | |
| | | | | | | |
5,000,000 USD | | 3/20/2010 | | Agreement with Lehman Brothers dated 12/21/2004 whereby the Portfolio will receive 2.7% per year times the notional amount. The Portfolio makes a payment of the notional amount only upon a default event on the reference entity, a Revolving Credit Agreement issued by Six Flags Theme Parks. | | 134,996 | |
| | | | | | �� | |
3,000,000 USD | | 3/20/2011 | | Agreement with Lehman Brothers dated 3/3/2005 whereby the Portfolio will receive 1.85% per year times the notional amount. The Portfolio makes a payment of the notional amount only upon a default event on the reference entity, a Revolving Credit Agreement issued by Syniverse Technologies, Inc. | | 18,982 | |
| | | | | | | |
6,500,000 USD | | 3/20/2010 | | Agreement with Lehman Brothers dated 3/16/2005 whereby the Portfolio will receive 2.2% per year times the notional amount. The Portfolio makes a payment of the notional amount only upon a default event on the reference entity, a Revolving Credit Agreement issued by Inergy, L.P. | | (45,059 | ) |
| | | | | | | | |
41
| | | | | | Net | |
| | | | | | Unrealized | |
Notional | | Expiration | | | | Appreciation | |
Amount | | Date | | Description | | (Depreciation) | |
3,000,000 USD | | 6/20/2010 | | Agreement with Lehman Brothers dated 4/1/2005 whereby the Portfolio will receive 2% per year times the notional amount. The Portfolio makes a payment of the notional amount only upon a default event on the reference entity, a Revolving Credit Agreement issued by Pinnacle Entertainment, Inc. | | $ | (79,503 | ) |
| | | | | | | |
3,000,000 USD | | 3/20/2010 | | Agreement with Lehman Brothers dated 5/19/2005 whereby the Portfolio will receive 2.4% per year times the notional amount. The Portfolio makes a payment of the notional amount only upon a default event on the reference entity, a Revolving Credit Agreement issued by Inergy, L.P. | | (53 | ) |
| | | | | | | |
3,000,000 USD | | 6/20/2010 | | Agreement with Lehman Brothers dated 5/19/2005 whereby the Portfolio will receive 3.25% per year times the notional amount. The Portfolio makes a payment of the notional amount only upon a default event on the reference entity, a Revolving Credit Agreement issued by Rural Cellular Corp. | | (68 | ) |
| | | | | | | |
3,000,000 USD | | 6/20/2011 | | Agreement with Lehman Brothers dated 6/2/2005 whereby the Portfolio will receive 2.3% per year times the notional amount. The Portfolio makes a payment of the notional amount only upon a default event on the reference entity, a Revolving Credit Agreement issued by Syniverse Technologies, Inc. | | 78,703 | |
| | | | | | | |
7,000,000 USD | | 9/21/2009 | | Agreement with Lehman Brothers dated 7/9/2005 whereby the Portfolio will receive 2.15% per year times the notional amount. The Portfolio makes a payment of the notional amount only upon a default event on the reference entity, a Revolving Credit Agreement issued by CSG Systems, Inc. | | (515 | ) |
| | | | | | | |
2,000,000 USD | | 9/20/2010 | | Agreement with Lehman Brothers dated 7/9/2005 whereby the Portfolio will receive 1.95% per year times the notional amount. The Portfolio makes a payment of the notional amount only upon a default event on the reference entity, a Revolving Credit Agreement issued by Pinnacle Entertainment, Inc. | | (58,740 | ) |
| | | | | | | |
5,000,000 USD | | 12/20/2010 | | Agreement with Lehman Brothers dated 10/26/2005 whereby the Portfolio will receive 2.15% per year times the notional amount. The Portfolio makes a payment of the notional amount only upon a default event on the reference entity, a Revolving Credit Agreement issued by EPCO Holdings, Inc. | | (308 | ) |
| | | | | | | | |
8 Restricted Securities
At October 31, 2005, the Portfolio owned the following securities (representing less than 0.1% of net assets) which were restricted as to public resale and not registered under the Securities Act of 1933 (excluding Rule 144A securities). The Portfolio has various registration rights (exercisable under a variety of circumstances) with respect to these securities. The fair value of these securities is determined based on valuations provided by brokers when available, or if not available, they are valued at fair value using methods determined in good faith by or at the direction of the Trustees.
Restricted Securities
| | Date of | | Shares/ | | | | | |
Description | | Acquisition | | Face | | Cost | | Fair Value | |
Common Stocks | | | | | | | | | |
Knowledge Universe, Inc. | | 10/23/04 | | 25 | | $ | 25,000 | | $ | 41,601 | |
| | | | | | $ | 25,000 | | $ | 41,601 | |
Preferred Stocks | | | | | | | | | |
Hayes Lemmerz International | | 6/23/03 | | 350 | | $ | 17,500 | | $ | 5,912 | |
| | | | | | $ | 17,500 | | $ | 5,912 | |
| | | | | | $ | 42,500 | | $ | 47,513 | |
42
Floating Rate Portfolio as of October 31, 2005
REPORT OF INDEPENDENT REGISTERED PUBLIC ACCOUNTING FIRM
To the Trustees and Investors of Floating Rate Portfolio:
We have audited the accompanying statement of assets and liabilities of Floating Rate Portfolio (the “Portfolio”), including the portfolio of investments as of October 31, 2005, the related statement of operations for the year then ended, the statements of changes in net assets for each of the two years in the period then ended, and the supplementary data for each of the five years in the period then ended. These financial statements and supplementary data are the responsibility of the Portfolio’s management. Our responsibility is to express an opinion on these financial statements and supplementary data based on our audits.
We conducted our audits in accordance with standards of the Public Company Accounting Oversight Board (United States). Those standards require that we plan and perform the audit to obtain reasonable assurance about whether the financial statements and supplementary data are free of material misstatement. The Portfolio is not required to have, nor were we engaged to perform, an audit of its internal control over financial reporting. Our audit included consideration of internal control over financial reporting as a basis for designing audit procedures that are appropriate in the circumstances, but not for the purpose of expressing an opinion on the effectiveness of the Portfolio’s internal control over financial reporting. Accordingly, we express no such opinion. An audit also includes examining, on a test basis, evidence supporting the amounts and disclosures in the financial statements, assessing the accounting principles used and significant estimates made by management, as well as evaluating the overall financial statement presentation. Our procedures included confirmation of securities and Senior Loans owned as of October 31, 2005 by correspondence with the custodian and selling or agent banks; where replies were not received from selling or agent banks, we performed other auditing procedures. We believe that our audits provide a reasonable basis for our opinion.
In our opinion, the financial statements and supplementary data referred to above present fairly, in all material respects, the financial position of Floating-Rate Portfolio as of October 31, 2005, the results of its operations for the year then ended, the changes in its net assets for each of the two years in the period then ended, and the supplementary data for each of the five years in the period then ended, in conformity with accounting principles generally accepted in the United States of America.
DELOITTE & TOUCHE LLP
Boston, Massachusetts
December 19, 2005
43
Eaton Vance Floating-Rate & High Income Fund as of October 31, 2005
BOARD OF TRUSTEES’ ANNUAL APPROVAL OF THE INVESTMENT ADVISORY AGREEMENTS
The Eaton Vance Floating-Rate & High Income Fund (the “Fund”) is a fund of funds that invests in two Portfolios, Floating Rate Portfolio and High Income Portfolio (together, the “Portfolios”), for which Boston Management and Research serves as investment adviser. The investment advisory agreements between the investment adviser and the Portfolios each provides that the advisory agreement will continue in effect from year to year so long as its continuance is approved at least annually (i) by a vote of a majority of the noninterested Trustees of the Portfolio cast in person at a meeting called for the purpose of voting on such approval and (ii) by the Trustees of the Portfolio or by vote of a majority of the outstanding interests of the Portfolio.
In considering the annual approval of the investment advisory agreements between the Portfolios and the investment adviser, the Special Committee of the Board of Trustees considered information that had been provided throughout the year at regular Board meetings, as well as information furnished for a series of meetings held in February and March in preparation for a Board meeting held on March 21, 2005 to specifically consider the renewal of the investment advisory agreements. Such information included, among other things, the following:
• An independent report comparing the advisory fees of each Portfolio with those of comparable funds;
• An independent report comparing the expense ratio of the Fund to those of comparable funds;
• Information regarding Fund investment performance (including on a risk-adjusted basis) in comparison to relevant peer groups of funds and appropriate indices;
• The economic outlook and the general investment outlook in relevant investment markets;
• Eaton Vance Management’s (“Eaton Vance”) results and financial condition and the overall organization of the investment adviser;
• The procedures and processes used to determine the fair value of Fund assets, including, in particular, the valuation of senior loan portfolios and actions taken to monitor and test the effectiveness of such procedures and processes;
• Eaton Vance’s management of the relationship with the custodian, subcustodians and fund accountants;
• The resources devoted to compliance efforts undertaken by Eaton Vance on behalf of the funds it manages and the record of compliance with the investment policies and restrictions and with policies on personal securities transactions;
• The quality, nature, cost and character of the administrative and other non-investment management services provided by Eaton Vance and its affiliates; and
• The terms of the advisory agreements and the reasonableness and appropriateness of the particular fee paid by each Portfolio for the services described therein.
The Special Committee also considered the investment adviser’s portfolio management capabilities, including information relating to the education, experience, and number of investment professionals and other personnel who provide services under the investment advisory agreements. Specifically, the Special Committee considered the investment adviser’s experience in managing senior loan portfolios. The Special Committee noted the experience of the 26 bank loan investment professionals and other personnel who would provide services under the Floating Rate Portfolio’s investment advisory agreement, including four portfolio managers and 15 analysts. Many of these portfolio managers and analysts have previous experience working for commercial banks and other lending institutions. In addition, for High Income Portfolio, the Special Committee considered the investment adviser’s high-yield portfolio management team, including portfolio managers who perform their own investment and credit analysis and analysts who evaluate issuers’ financial resources, operating history and sensitivity to economic conditions. The Special Committee also took into account the time and attention to be devoted by senior management to the Portfolios and the other funds in the complex. The Special Committee evaluated the level of skill required to manage the Portfolios and concluded that the human resources available at the investment adviser were appropriate to fulfill its duties on behalf of the Portfolios.
In its review of comparative information with respect to the Fund’s investment performance (including on a risk-adjusted basis), the Special Committee concluded that the Fund has performed within a range that the Special Committee deemed competitive. With respect to its review of investment advisory fees, the Special Committee concluded that the fees paid by each Portfolio are within the range of those paid by comparable funds within the mutual fund industry. In reviewing the information regarding the expense ratio of the Fund, the Special Committee concluded that the Fund’s expense ratio is within a range that is competitive with comparable funds.
In addition to the factors mentioned above, the Special Committee reviewed the level of the investment adviser’s profits in providing investment management services for the Portfolios and for all Eaton Vance funds as a group. The Special Committee also reviewed the benefits to Eaton Vance and its affiliates in providing administration services for the Fund and for all Eaton Vance funds as a group. In addition, the Special Committee considered the fiduciary duty assumed by the investment adviser in connection with the services rendered to the Fund and Portfolios and the business reputation of the investment adviser and its financial resources. The Trustees concluded that in light of the services rendered, the profits realized by the investment adviser are not unreasonable. The Special Committee also considered the extent to which the investment adviser appears to be realizing benefits
44
from managing each Portfolio, and concluded that the fee breakpoints which are in place will allow for an equitable sharing of such benefits, when realized, with each Portfolio and the shareholders of the Fund.
The Special Committee did not consider any single factor as controlling in determining whether or not to renew the investment advisory agreements. Nor are the items described herein all the matters considered by the Special Committee. In assessing the information provided by Eaton Vance and its affiliates, the Special Committee also took into consideration the benefits to shareholders of investing in a fund that is a part of a large family of funds which provides a large variety of shareholder services.
Based on its consideration of the foregoing factors and conclusions, and such other factors and conclusions as it deemed relevant, and assisted by independent counsel, the Special Committee concluded that the renewal of the investment advisory agreements, including the fee structures, is in the interests of shareholders.
45
Eaton Vance Floating-Rate & High Income Fund
MANAGEMENT AND ORGANIZATION
Fund Management. The Trustees of Eaton Vance Mutual Funds Trust (the Trust), Floating Rate Portfolio and High Income Portfolio (the Portfolios) are responsible for the overall management and supervision of the Trust’s and Portfolios’ affairs. The Trustees and officers of the Trust and the Portfolios are listed below. Except as indicated, each individual has held the office shown or other offices in the same company for the last five years. Trustees and officers of the Trust and the Portfolios hold indefinite terms of office. The “noninterested Trustees” consist of those Trustees who are not “interested persons” of the Trust and the Portfolios, as that term is defined under the 1940 Act. The business address of each Trustee and officer is The Eaton Vance Building, 255 State Street, Boston, Massachusetts 02109. As used below, “EVC” refers to Eaton Vance Corp., “EV” refers to Eaton Vance, Inc., “EVM” refers to Eaton Vance Management, “BMR” refers to Boston Management and Research and “EVD” refers to Eaton Vance Distributors, Inc. EVC and EV are the corporate parent and trustee, respectively, of EVM and BMR. EVD is the Fund’s principal underwriter, the Portfolios’ placement agent and a wholly-owned subsidiary of EVM. Each officer affiliated with Eaton Vance may hold a position with other Eaton Vance affiliates that is comparable to its position with EVM listed below.
Name and Date of Birth | | Position(s) with
the Trust and
the Portfolios | | Term of Office and
Length of Service | | Principal Occupation(s) During Past Five Years | | Number of Portfolios in
Fund Complex Overseen
By Trustee(1) | | Other Directorships
Held |
| | | | | | | | | | |
Interested Trustees | | | | | | | | | | |
| | | | | | | | | | |
James B. Hawkes
11/9/41 | | Trustee | | Trustee of the Trust since 1991; of Floating-Rate Portfolio since 2000; of High Income Portfolio since 1992 | | Chairman, President and Chief Executive Officer of BMR, EVC, EVM and EV; Director of EV; Vice President and Director of EVD. Trustee and/or officer of 161 registered investment companies in the Eaton Vance Fund Complex. Mr. Hawkes is an interested person because of his positions with BMR, EVM, EVC and EV, which are affiliates of the Trust and the Portfolios. | | 161 | | Director of EVC |
Noninterested Trustee(s) | | | | | | | | | | |
| | | | | | | | | | |
Benjamin C. Esty
1/2/63 | | Trustee | | Since 2005 | | Professor, Harvard University Graduate School of Business Administration (since 2003). Formerly, Associate Professor, Harvard University Graduate School of Business Administration (2000-2003). | | 152 | | None |
| | | | | | | | | | |
Samuel L. Hayes, III
2/23/35 | | Trustee | | Trustee of the Trust since 1986; of Floating Rate Portfolio since 2000; of High Income Portfolio since 1993 and Chairman of the Board since 2005 | | Jacob H. Schiff Professor of Investment Banking Emeritus, Harvard University Graduate School of Business Administration. | | 161 | | Director of Tiffany & Co. (specialty retailer) and Telect, Inc. (telecommunication services company) |
46
Name and Date of Birth | | Position(s) with
the Trust and
the Portfolios | | Term of Office and
Length of Service | | Principal Occupation(s) During Past Five Years | | Number of Portfolios in
Fund Complex Overseen
By Trustee(1) | | Other Directorships
Held |
| | | | | | | | | | |
William H. Park
9/19/47 | | Trustee | | Since 2003 | | President and Chief Executive Officer, Prizm Capital Management, LLC (investment management firm) (since 2002). Executive Vice President and Chief Financial Officer, United Asset Management Corporation (a holding company owning institutional investment management firms) (1982-2001). | | 161 | | None |
| | | | | | | | | | |
Ronald A. Pearlman
7/10/40 | | Trustee | | Since 2003 | | Professor of Law, Georgetown University Law Center (since 1999). Tax Partner Covington & Burling, Washington, DC (1991-2000). | | 161 | | None |
| | | | | | | | | | |
Norton H. Reamer
9/21/35 | | Trustee | | Trustee of the Trust since 1986; of Floating Rate Portfolio since 2000; of High Income Portfolio since 1993 | | President, Chief Executive Officer and a Director of Asset Management Finance Corp. (a specialty finance company serving the investment management industry) (since October 2003). President, Unicorn Corporation (an investment and financial advisory services company) (since September 2000). Formerly, Chairman, Hellman, Jordan Management Co., Inc. (an investment management company) (2000-2003). Formerly, Advisory Director of Berkshire Capital Corporation (investment banking firm) (2002-2003). Formerly Chairman of the Board, United Asset Management Corporation (a holding company owning institutional investment management firms) and Chairman, President and Director, UAM Funds (mutual funds) (1980-2000). | | 161 | | None |
| | | | | | | | | | |
Lynn A. Stout
9/14/57 | | Trustee | | Trustee of the Trust and High Income Portfolio since 1998; of Floating Rate Portfolio since 2000 | | Professor of Law, University of California at Los Angeles School of Law (since July 2001). Formerly, Professor of Law, Georgetown University Law Center. | | 161 | | None |
| | | | | | | | | | |
Ralph F. Verni
1/26/43 | | Trustee | | Since 2005 | | Consultant and private investor (since 2000). Formerly, President and Chief Executive Officer, Redwood Investment Systems, Inc. (software developer) (2000). Formerly, President and Chief Executive Officer, State Street Research & Management (investment advisor), SSRM Holdings (parent of State Street Research & Management), and SSR Realty (institutional realty manager) (1992-2000). | | 152 | | Director of W.P. Carey & Company LLC (manager of real estate investment trusts) |
47
Principal Officers who are not Trustees
Name and Date of Birth | | Position(s) with
the Trust and
the Portfolios | | Term of Office and
Length of Service | | Principal Occupation(s) During Past Five Years |
| | | | | | |
Thomas E. Faust Jr.
5/31/58 | | President of the Trust | | Since 2002 | | Executive Vice President of EVM, BMR, EVC and EV; Chief Investment Officer of EVM and BMR and Director of EVC. Chief Executive Officer of Belair Capital Fund LLC, Belcrest Capital Fund LLC, Belmar Capital Fund LLC, Belport Capital Fund LLC and Belrose Capital Fund LLC (private investment companies sponsored by EVM). Officer of 65 registered investment companies managed by EVM or BMR. |
| | | | | | |
William H. Ahern, Jr.
7/28/59 | | Vice President of the Trust | | Since 1995 | | Vice President of EVM and BMR. Officer of 70 registered investment companies managed by EVM or BMR. |
| | | | | | |
Cynthia J. Clemson
3/2/63 | | Vice President of the Trust | | Since 2005 | | Vice President of EVM and BMR. Officer of 85 registered investment companies managed by EVM or BMR. |
| | | | | | |
Kevin S. Dyer
2/21/75 | | Vice President of the Trust | | Since 2005 | | Assistant Vice President of EVM and BMR. Officer of 24 registered investment companies managed by EVM or BMR. |
| | | | | | |
Thomas P. Huggins
3/7/66 | | Vice President of High Income Portfolio | | Since 2000 | | Vice President of EVM and BMR. Officer of 4 registered investment companies managed by EVM or BMR. |
| | | | | | |
Aamer Khan
6/7/60 | | Vice President of the Trust | | Since 2005 | | Vice President of EVM and BMR. Officer of 27 registered investment companies managed by EVM or BMR. |
| | | | | | |
Michael R. Mach
7/14/47 | | Vice President of the Trust | | Since 1999 | | Vice President of EVM and BMR. Officer of 32 registered investment companies managed by EVM or BMR. |
| | | | | | |
Robert B. MacIntosh
1/22/57 | | Vice President of the Trust | | Since 1998 | | Vice President of EVM and BMR. Officer of 85 registered investment companies managed by EVM or BMR. |
| | | | | | |
Scott H. Page
11/30/59 | | Vice President of Floating Rate Portfolio | | Since 2000 | | Vice President of EVM and BMR. Officer of 14 registered investment companies managed by EVM or BMR. |
| | | | | | |
Duncan W. Richardson
10/26/57 | | Vice President of the Trust | | Since 2001 | | Senior Vice President and Chief Equity Investment Officer of EVM and BMR. Officer of 51 registered investment companies managed by EVM or BMR. |
| | | | | | |
Walter A. Row, III
7/20/57 | | Vice President of the Trust | | Since 2001 | | Director of Equity Research and a Vice President of EVM and BMR. Officer of 31 registered investment companies managed by EVM or BMR. |
| | | | | | |
Judith A. Saryan
8/21/54 | | Vice President of the Trust | | Since 2003 | | Vice President of EVM and BMR. Officer of 33 registered investment companies managed by EVM or BMR. |
| | | | | | |
Susan Schiff
3/31/61 | | Vice President of the Trust | | Since 2002 | | Vice President of EVM and BMR. Officer of 29 registered investment companies managed by EVM or BMR. |
| | | | | | |
Payson F. Swaffield
8/13/56 | | President of Floating Rate Portfolio | | Since 2002(2) | | Vice President of EVM and BMR. Officer of 14 registered investment companies managed by EVM or BMR. |
| | | | | | |
Michael W. Weilheimer
2/11/61 | | President of High Income Portfolio | | Since 2002(2) | | Vice President of EVM and BMR. Officer of 9 registered investment companies managed by EVM or BMR. |
48
Name and Date of Birth | | Position(s) with
the Trust and
the Portfolios | | Term of Office and
Length of Service | | Principal Occupation(s) During Past Five Years |
| | | | | | |
Barbara E. Campbell
6/19/57 | | Treasurer of the Trust since 2005(3), of the Portfolio since 2002(3) | | Since 2002(2) | | Vice President of EVM and BMR. Officer of 161 registered investment companies managed by EVM or BMR. |
| | | | | | |
Alan R. Dynner
10/10/40 | | Secretary | | Secretary of the Trust and High Income Portfolio since 1997; of Floating Rate Portfolio since 2000 | | Vice President, Secretary and Chief Legal Officer of BMR, EVM, EVD, EV and EVC. Officer of 161 registered investment companies managed by EVM or BMR. |
| | | | | | |
Paul M. O’Neil
7/11/53 | | Chief Compliance Officer | | Since 2004 | | Vice President of EVM and BMR. Officer of 161 registered investment companies managed by EVM or BMR. |
(1) Includes both master and feeder funds in a master-feeder structure.
(2) Prior to 2002, Mr. Swaffield served as Vice President of Floating Rate Portfolio since 2000, Mr. Weilheimer served as Vice President of High Income Portfolio since 1995 and Ms. Campbell served as Assistant Treasurer of Floating Rate Portfolio since 2000 and High Income Portfolio since 1993.
(3) Prior to 2005, Ms. Campbell served as Assistant Treasurer of the Trust since 1995. The SAI for the Fund includes additional information about the Trustees and officers of the Fund and the Portfolios and can be obtained without charge by calling 1-800-225-6265.
The SAI for the Fund includes additional information about the Trustees and officers of the Fund and the Portfolios and can be obtained without charge by calling 1-800-225-6265.
49
Investment Adviser of Floating Rate Portfolio
Boston Management and Research
The Eaton Vance Building
255 State Street
Boston, MA 02109
Administrator of Eaton Vance Floating-Rate & High Income Fund
Eaton Vance Management
The Eaton Vance Building
255 State Street
Boston, MA 02109
Principal Underwriter
Eaton Vance Distributors, Inc.
The Eaton Vance Building
255 State Street
Boston, MA 02109
(617) 482-8260
Custodian
Investors Bank & Trust Company
200 Clarendon Street
Boston, MA 02116
Transfer Agent
PFPC Inc.
Attn: Eaton Vance Funds
P.O. Box 9653
Providence, RI 02940-9653
(800) 262-1122
Independent Registered Public Accounting Firm
Deloitte & Touche LLP
200 Berkeley Street
Boston, MA 02116-5022
Eaton Vance Floating-Rate & High Income Fund
The Eaton Vance Building
255 State Street
Boston, MA 02109
This report must be preceded or accompanied by a current prospectus. Before investing, investors should consider carefully the Fund’s investment objective(s), risks, and charges and expenses. The Fund’s current prospectus contains this and other information about the Fund and is available through your financial advisor. Please read the prospectus carefully before you invest or send money. For further information please call 1-800-225-6265.

Annual Report October 31, 2005


EATON VANCE
GOVERNMENT
OBLIGATIONS
FUND
IMPORTANT NOTICES REGARDING PRIVACY,
DELIVERY OF SHAREHOLDER DOCUMENTS,
PORTFOLIO HOLDINGS AND PROXY VOTING
Privacy. The Eaton Vance organization is committed to ensuring your financial privacy. Each of the financial institutions identified below has in effect the following policy ("Privacy Policy") with respect to nonpublic personal information about its customers:
• Only such information received from you, through application forms or otherwise, and information about your Eaton Vance fund transactions will be collected. This may include information such as name, address, social security number, tax status, account balances and transactions.
• None of such information about you (or former customers) will be disclosed to anyone, except as permitted by law (which includes disclosure to employees necessary to service your account). In the normal course of servicing a customer's account, Eaton Vance may share information with unaffiliated third parties that perform various required services such as transfer agents, custodians and broker/dealers.
• Policies and procedures (including physical, electronic and procedural safeguards) are in place that are designed to protect the confidentiality of such information.
• We reserve the right to change our Privacy Policy at any time upon proper notification to you. Customers may want to review our Policy periodically for changes by accessing the link on our homepage: www.eatonvance.com.
Our pledge of privacy applies to the following entities within the Eaton Vance organization: the Eaton Vance Family of Funds, Eaton Vance Management, Eaton Vance Investment Counsel, Boston Management and Research, and Eaton Vance Distributors, Inc.
In addition, our Privacy Policy only applies to those Eaton Vance customers who are individuals and who have a direct relationship with us. If a customer's account (i.e., fund shares) is held in the name of a third-party financial adviser/broker-dealer, it is likely that only such adviser's privacy policies apply to the customer. This notice supersedes all previously issued privacy disclosures.
For more information about Eaton Vance's Privacy Policy, please call 1-800-262-1122.
Delivery of Shareholder Documents. The Securities and Exchange Commission (the "SEC") permits funds to deliver only one copy of shareholder documents, including prospectuses, proxy statements and shareholder reports, to fund investors with multiple accounts at the same residential or post office box address. This practice is often called "householding" and it helps eliminate duplicate mailings to shareholders.
Eaton Vance, or your financial adviser, may household the mailing of your documents indefinitely unless you instruct Eaton Vance, or your financial adviser, otherwise.
If you would prefer that your Eaton Vance documents not be householded, please contact Eaton Vance at 1-800-262-1122, or contact your financial adviser.
Your instructions that householding not apply to delivery of your Eaton Vance documents will be effective within 30 days of receipt by Eaton Vance or your financial adviser.
Portfolio Holdings. The Fund and its underlying Portfolio (if applicable) will file a schedule of its portfolio holdings on Form N-Q with the SEC for the first and third quarters of each fiscal year. The Form N-Q will be available on the Eaton Vance website www.eatonvance.com, by calling Eaton Vance at 1-800-262-1122 or in the EDGAR database on the SEC's website at www.sec.gov. Form N-Q may also be reviewed and copied at the SEC's public reference room in Washington, D.C. (call 1-800-732-0330 for information on the operation of the public reference room).
Proxy Voting. From time to time, funds are required to vote proxies related to the securities held by the funds. The Eaton Vance Funds or their underlying Portfolios (if applicable) vote proxies according to a set of policies and procedures approved by the Funds' and Portfolios' Boards. You may obtain a description of these policies and procedures and information on how the Fund or Portfolio voted proxies relating to portfolio securities during the 12 month period ended June 30, without charge, upon request, by calling 1-800-262-1122. This description is also available on the SEC's website at www.sec.gov.
Eaton Vance Government Obligations Fund as of October 31 , 2005
MANAGEMENT’S DISCUSSION OF FUND PERFORMANCE

Susan Schiff
Portfolio Manager
The Fund
Performance for the Past Year
• The Fund’s Class A shares had a total return of 2.03% during the year ended October 31, 2005.(1) This return resulted from a decrease in net asset value (NAV) per share to $7.34 on October 31, 2005 from $7.74 on October 31, 2004, and the reinvestment of $0.550 in dividend payments during the year. The Class A NAVs and dividends have been restated to reflect the effects of a stock split effective on November 11, 2005.
• The Fund’s Class B shares had a total return of 1.15% during the year ended October 31, 2005.(1) This return resulted from a decrease in NAV per share to $7.34 on October 31, 2005 from $7.74 on October 31, 2004, and the reinvestment of $0.487 in dividend payments during the year.
• The Fund’s Class C shares had a total return of 1.16% during the year ended October 31, 2005.(1) This return resulted from a decrease in NAV per share to $7.34 on October 31, 2005 from $7.73 on October 31, 2004, and the reinvestment of $0.478 in dividend payments during the year.
• The Fund’s Class R shares had a total return of -0.12% during the period since inception on August 12, 2005 through October 31, 2005.(1) This return resulted from a decrease in NAV per share to $7.32 on October 31, 2005 from $7.43 on August 12, 2005, and the reinvestment of $0.102 in dividends.
• In comparison, the Lehman Brothers Intermediate Government Bond Index – a broad-based, unmanaged market index of intermediate maturity U.S. Government bonds – had a total return of 0.27% during the year ended October 31, 2005.(2) For comparision with the Fund’s peer group, the Lipper Short-Intermediate U.S. Government Funds Classification had an average total return of 0.08% during the same period.(2)
Recent Fund Developments
• The Fund currently invests its assets in a separate registered investment company with the same objective and policies as the Fund (Portfolio). The Portfolio’s outperformance of its benchmark Index was due predominantly to the spread tightening in mortgagebacked securities (MBS) during the fiscal year. Five year Treasury bond yields rose by 120 basis points (1.20%) during the period, reflecting the continuing actions of the Federal Reserve to raise interest rates. However, spreads on seasoned MBS – the Portfolio’s current focus when investing in MBS – narrowed by 80 basis points (0.80%) relative to Treasuries, partially offsetting the rate hike, and accounting for the Fund’s positive performance. MBS spreads were around 105 basis points (1.05%) at October 31, 2005 versus 185 basis points (1.85%) a year earlier.
• Prepayment rates for the Portfolio’s seasoned MBS declined further during the fiscal year, as homeowners were less inclined to refinance mortgages in a rising rate environment. Prepayment rates fell to near 25% by October 31, 2005, well below their peak around 50% in December 2003. The decline in prepayment rates was welcome news to investors in mortgage securities. In view of the relative stability in the long-end of the yield curve, management believes that, given historical norms, there may be room for a further decline in prepayment rates.
• The Portfolio’s duration was 3.0 years at October 31, 2005, slightly higher than on October 31, 2004. Duration is an indicator – stated in years – that measures cash flows and expected maturity of a fixed income security or portfolio, and is used to determine price sensitivity to changes in interest rates. Thus, if rates increase in response to a stronger economy, a shorter duration can limit the Portfolio’s interest rate exposure. Conversely, a longer duration will provide more exposure to changing interest rates.
• Given the strong environment for MBS, no segment of the Portfolio performed poorly during the period. Some issues that curtailed performance during the refinancing wave in 2003 made a significant comeback during the year ended October 31, 2005.
The views expressed throughout this report are those of the portfolio manager and are current only through the end of the period of the report as stated on the cover. These views are subject to change at any time based upon market or other conditions, and the investment adviser disclaims any responsibility to update such views. These views may not be relied on as investment advice and, because investment decisions for a fund are based on many factors, may not be relied on as an indication of trading intent on behalf of any Eaton Vance fund.
Fund shares are not insured by the FDIC and are not deposits or other obligations of, or guaranteed by, any depository institution. Shares are subject to investment risks, including possible loss of principal invested.
(1) These returns do not include the 4.75% maximum sales charge for the Fund’s Class A shares or the applicable contingent deferred sales charges (CDSC) for Class B shares and Class C shares. If sales charges were deducted, returns would be lower. Class R shares are offered to certain investors at net asset value.(2). It is not possible to invest directly in an Index or a Lipper Classification. The Index’s and Classification’s total returns do not reflect the commissions or expenses that would have been incurred if an investor individually purchased or sold the securities represented in the Index.
Past performance is no guarantee of future results. Returns are historical and are calculated by determining the percentage change in net asset value or offering price (as applicable) with all distributions reinvested. Investment return and principal value will fluctuate so that shares, when redeemed, may be worth more or less than their original cost. Performance is for the stated time period only; due to market volatility, the Fund’s current performance may be lower or higher than the quoted return. For performance as of the most recent month-end, please refer to www.eatonvance.com.
2
Eaton Vance Government Obligations Fund as of October 31 , 2005
FUND PERFORMANCE
The line graph and table set forth below provide information about the Fund’s performance. The line graph compares the performance of Class A of the Fund with that of the Lehman Brothers Intermediate Government Bond Index, a broad-based, unmanaged market index of intermediate-maturity, U.S. government bonds. The lines on the graph represent the total returns of a hypothetical investment of $10,000 in Class A of the Fund and in the Lehman Brothers Intermediate Government Bond Index. The chart also offers a comparison with the Lipper Short-Intermediate U.S. Government Funds Classification, the Fund’s peer Classification. Class A total returns are presented at net asset value and public offering price. The table includes the total returns of each Class of the Fund at net asset value and public offering price. The performance presented below does not reflect the deduction of taxes, if any, that a shareholder would pay on Fund distributions or the redemption of Fund shares.
Performance (1) | | Class A | | Class B | | Class C | | Class R | |
Average Annual Total Returns (at net asset value) | | | | | | | | | |
One Year | | 2.03 | % | 1.15 | % | 1.16 | % | N.A. | |
Five Years | | 4.54 | | 3.75 | | 3.75 | | N.A. | |
Ten Years | | 4.89 | | 4.11 | | 4.04 | | N.A. | |
Life of Fund† | | 7.32 | | 4.18 | | 4.07 | | -0.12 | |
| | | | | | | | | |
SEC Average Annual Total Returns (including sales change or applicable CDSC) | | | | | | | | | |
One Year | | -2.84 | % | -3.59 | % | 0.22 | % | N.A. | |
Five Years | | 3.54 | | 3.44 | | 3.75 | | N.A. | |
Ten Years | | 4.38 | | 4.11 | | 4.04 | | N.A. | |
Life of Fund† | | 7.08 | | 4.18 | | 4.07 | | -0.12 | |
† Inception Dates – Class A: 8/24/84; Class B: 11/1/93; Class C: 11/1/93; Class R: 8/12/05
(1) Average Annual Total Returns do not include the 4.75% maximum sales charge for Class A shares or the applicable contingent deferred sales charges (CDSC) for Class B or Class C shares. If sales charges were deducted, returns would be lower. Class R shares are offered to certain investors at net asset value. SEC Average Annual Total Returns for Class A reflect the maximum 4.75% sales charge. SEC Average Annual Total Returns for Class B reflect applicable CDSC based on the following schedule: 5% - 1st and 2nd years; 4% - 3rd year; 3% - 4th year; 2% - 5th year; 1% - 6th year. SEC 1-year return for Class C reflects a 1% CDSC.
Past performance is no guarantee of future results. Returns are historical and are calculated by determining the percentage change in net asset value or offering price (as applicable) with all distributions reinvested. Investment return and principal value will fluctuate so that shares, when redeemed, may be worth more or less than their original cost. Performance is for the stated time period only; due to market volatility, the Fund’s current performance may be lower or higher than the quoted return. For performance as of the most recent month-end, please refer to www.eatonvance.com.
Diversification by Sectors(2)
By total investments
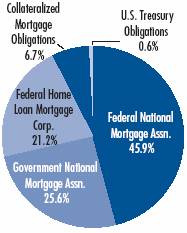
(2) Reflects the Portfolio’s investments as of October 31, 2005. Portfolio information may not be representative of the Portfolio’s current or future investments and may change due to active management.
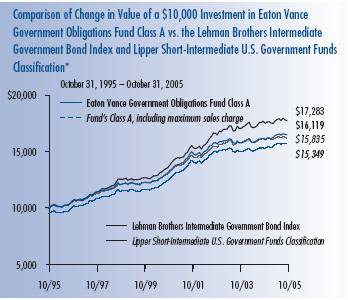
* Sources: Thomson Financial; Bloomberg, L.P. Class A of the Fund commenced operations on 8/24/84.
A $10,000 hypothetical investment at net asset value in Class B shares on 10/31/95, Class C shares on 10/31/95 and Class R shares on 8/12/05 would have been valued at $14,958, $14,863 and $9,989, respectively, on 10/31/05. The Index’s and Classification’s total returns do not reflect the commissions or expenses that would have been incurred if an investor individually purchased or sold the securities represented in the Index or Classification. It is not possible to invest directly in an Index or Classification.
3
Eaton Vance Government Obligations Fund as of October 31, 2005
FUND EXPENSES
Example: As a shareholder of the Fund, you incur two types of costs: (1) transaction costs, including sales charges (loads) on purchases and redemption fees (if applicable); and (2) ongoing costs, including management fees; distribution or service fees; and other Fund expenses. This Example is intended to help you understand your ongoing costs (in dollars) of investing in the Fund and to compare these costs with the ongoing costs of investing in other mutual funds. The Example is based on an investment of $1,000 invested at the beginning of the period and held for the entire period (May 1, 2005 – October 31, 2005).
Actual Expenses: The first section of the table below provides information about actual account values and actual expenses. You may use the information in this section, together with the amount you invested, to estimate the expenses that you paid over the period. Simply divide your account value by $1,000 (for example, an $8,600 account value divided by $1,000 = 8.6), then multiply the result by the number in the first line under the heading entitled “Expenses Paid During Period” to estimate the expenses you paid on your account during this period.
Hypothetical Example for Comparison Purposes: The second section of the table below provides information about hypothetical account values and hypothetical expenses based on the Fund’s actual expense ratios and an assumed rate of return of 5% per year before expenses, which is not the actual return of the Fund. The hypothetical account values and expenses may not be used to estimate the actual ending account balance or expenses you paid for the period. You may use this information to compare the ongoing costs of investing in the Fund and other funds. To do so, compare this 5% hypothetical example with the 5% hypothetical examples that appear in the shareholder reports of the other funds.
Please note that the expenses shown in the table are meant to highlight your ongoing costs only and do not reflect any transactional costs, such as sales charges (loads) or redemption fees (if applicable). Therefore, the second section of the table is useful in comparing ongoing costs only, and will not help you determine the relative total costs of owning different funds. In addition, if these transactional costs were included, your costs would have been higher.
| | Eaton Vance Government Obligations Fund | |
| | Beginning Account Value | | Ending Account Value | | Expenses Paid During Period | |
| | (5/1/05) | | (10/31/05) | | (5/1/05 – 10/31/05) | |
Actual* | | | | | | | |
Class A | | $ | 1,000.00 | | $ | 1,004.20 | | $ | 5.96 | |
Class B | | $ | 1,000.00 | | $ | 1,000.90 | | $ | 9.73 | |
Class C | | $ | 1,000.00 | | $ | 1,002.20 | | $ | 9.69 | |
Class R | | $ | 1,000.00 | | $ | 998.60 | | $ | 3.17 | |
* Class R shares had not commenced operations as of May 1, 2005. Actual expenses are equal to the Fund's annualized expense ratio of 1.18% for Class A shares, 1.93% for Class B shares, 1.92% for Class C shares and 1.43% for Class R shares multiplied by the average account value over the period, multiplied by 184/365 (to reflect the one-half-year period; 81/365 for Class R to reflect the period from commencement of operations on August 12, 2005 to October 31, 2005). The example assumes that the $1,000 was invested at the net asset value per share determined at the close of business on April 30, 2005 (August 11, 2005 for Class R). The Example reflects the expenses of both the Fund and the Portfolio.
Hypothetical** | | | | | | | |
(5% return before expenses) | | | | | | | |
Class A | | $ | 1,000.00 | | $ | 1,019.30 | | $ | 6.01 | |
Class B | | $ | 1,000.00 | | $ | 1,015.50 | | $ | 9.80 | |
Class C | | $ | 1,000.00 | | $ | 1,015.50 | | $ | 9.75 | |
Class R | | $ | 1,000.00 | | $ | 1,018.00 | | $ | 7.27 | |
** Hypothetical expenses are equal to the Fund’s annualized expense ratio of 1.18% for Class A shares, 1.93% for Class B shares, 1.92% for Class C shares and 1.43% for Class R shares multiplied by the average account value over the period, multiplied by 184/365 (to reflect the one-half-year period). The example assumes that the $1,000 was invested at the net asset value per share determined at the close of business on April 30, 2005. The Example reflects the expenses of both the Fund and the Portfolio.
4
Eaton Vance Government Obligations Fund as of October 31, 2005
FINANCIAL STATEMENTS
Statement of Assets and Liabilities
As of October 31, 2005
| Assets | |
Investment in Government Obligations Portfolio, at value
(identified cost, $771,028,787) | | $ | 769,512,738 | | |
| Receivable for Fund shares sold | | | 1,058,374 | | |
| Total assets | | $ | 770,571,112 | | |
| Liabilities | |
| Payable for Fund shares redeemed | | $ | 2,691,868 | | |
| Dividends payable | | | 1,936,789 | | |
| Payable to affiliate for distribution and service fees | | | 469,977 | | |
| Payable to affiliate for Trustees' fees | | | 311 | | |
| Accrued expenses | | | 245,873 | | |
| Total liabilities | | $ | 5,344,818 | | |
| Net Assets | | $ | 765,226,294 | | |
| Sources of Net Assets | |
| Paid-in capital | | $ | 986,267,821 | | |
Accumulated net realized loss from Portfolio (computed on
the basis of identified cost) | | | (217,588,689 | ) | |
| Accumulated distributions in excess of net investment income | | | (1,936,789 | ) | |
Net unrealized depreciation from Portfolio (computed on the basis of
identified cost) | | | (1,516,049 | ) | |
| Total | | $ | 765,226,294 | | |
| Class A Shares | |
| Net Assets | | $ | 291,931,357 | | |
| Shares Outstanding | | | 39,756,306 | (1) | |
Net Asset Value and Redemption Price Per Share
(net assets ÷ shares of beneficial interest outstanding) | | $ | 7.34 | | |
Maximum Offering Price Per Share
(100 ÷ 95.25 of $7.34) | | $ | 7.71 | | |
| Class B Shares | |
| Net Assets | | $ | 291,078,932 | | |
| Shares Outstanding | | | 39,633,283 | | |
Net Asset Value, Offering Price and Redemption Price Per Share (Note 7)
(net assets ÷ shares of beneficial interest outstanding) | | $ | 7.34 | | |
| Class C Shares | |
| Net Assets | | $ | 182,213,964 | | |
| Shares Outstanding | | | 24,838,782 | | |
Net Asset Value, Offering Price and Redemption Price Per Share (Note 7)
(net assets ÷ shares of beneficial interest outstanding) | | $ | 7.34 | | |
| Class R Shares | |
| Net Assets | | $ | 2,041 | | |
| Shares Outstanding | | | 279 | | |
Net Asset Value, Offering Price and Redemption Price Per Share
(net assets ÷ shares of beneficial interest outstanding) | | $ | 7.32 | | |
| On sales of $25,000 or more, the offering price of Class A shares is reduced. | |
(1) Shares outstanding have been restated to reflect the effect of a stock split effective November 11, 2005 (Note 9).
Statement of Operations
For the Year Ended
October 31, 2005
| Investment Income | |
| Interest allocated from Portfolio | | $ | 31,978,190 | | |
| Security lending income allocated from Portfolio | | | 2,624,812 | | |
| Expenses allocated from Portfolio | | | (6,679,397 | ) | |
| Net investment income from Portfolio | | $ | 27,923,605 | | |
| Expenses | |
| Trustees' fees and expenses | | $ | 3,246 | | |
Distribution and service fees
Class A | | | 775,821 | | |
| Class B | | | 3,351,389 | | |
| Class C | | | 2,202,917 | | |
| Class R | | | 2 | | |
| Transfer and dividend disbursing agent fees | | | 971,743 | | |
| Printing and postage | | | 170,623 | | |
| Legal and accounting services | | | 58,105 | | |
| Registration fees | | | 43,481 | | |
| Custodian fee | | | 27,522 | | |
| Miscellaneous | | | 57,435 | | |
| Total expenses | | $ | 7,662,284 | | |
| Net investment income | | $ | 20,261,321 | | |
Realized and Unrealized
Gain (Loss) from Portfolio | |
Net realized gain (loss) —
Investment transactions (identified cost basis) | | $ | 73,641 | | |
| Financial futures contracts | | | 170,391 | | |
| Net realized gain | | $ | 244,032 | | |
Change in unrealized appreciation (depreciation) —
Investments (identified cost basis) | | $ | (12,209,252 | ) | |
| Financial futures contracts | | | 1,935,259 | | |
| Net change in unrealized appreciation (depreciation) | | $ | (10,273,993 | ) | |
| Net realized and unrealized loss | | $ | (10,029,961 | ) | |
| Net increase in net assets from operations | | $ | 10,231,360 | | |
See notes to financial statements
5
Eaton Vance Government Obligations Fund as of October 31, 2005
FINANCIAL STATEMENTS CONT'D
Statements of Changes in Net Assets
| Increase (Decrease) in Net Assets | | Year Ended
October 31, 2005 | | Period Ended
October 31, 2004(1) | | Year Ended
December 31, 2003 | |
From operations —
Net investment income | | $ | 20,261,321 | | | $ | 27,275,388 | | | $ | 23,602,159 | | |
| Net realized gain (loss) from investment transactions and financial futures contracts | | | 244,032 | | | | (5,978,757 | ) | | | (6,833,832 | ) | |
| Net change in unrealized appreciation (depreciation) from investments and financial futures contracts | | | (10,273,993 | ) | | | (5,134,128 | ) | | | (32,650,257 | ) | |
| Net increase (decrease) in net assets from operations | | $ | 10,231,360 | | | $ | 16,162,503 | | | $ | (15,881,930 | ) | |
Distributions to shareholders —
From net investment income | |
| Class A | | $ | (21,581,086 | ) | | $ | (22,877,236 | ) | | $ | (34,620,580 | ) | |
| Class B | | | (20,634,084 | ) | | | (23,337,831 | ) | | | (36,850,819 | ) | |
| Class C | | | (13,604,205 | ) | | | (17,455,753 | ) | | | (31,409,859 | ) | |
| Class R | | | (23 | ) | | | — | | | | — | | |
| Tax return of capital | |
| Class A | | | (115,024 | ) | | | — | | | | (251,788 | ) | |
| Class B | | | (143,932 | ) | | | — | | | | (267,683 | ) | |
| Class C | | | (94,653 | ) | | | — | | | | (228,475 | ) | |
| Class R | | | (1 | ) | | | — | | | | — | | |
| Total distributions to shareholders | | $ | (56,173,008 | ) | | $ | (63,670,820 | ) | | $ | (103,629,204 | ) | |
Transactions in shares of beneficial interest —
Proceeds from sale of shares | |
| Class A | | $ | 52,685,718 | | | $ | 59,326,321 | | | $ | 340,265,998 | | |
| Class B | | | 14,632,405 | | | | 24,182,938 | | | | 237,654,294 | | |
| Class C | | | 28,073,452 | | | | 27,483,957 | | | | 310,242,531 | | |
| Class R | | | 2,045 | | | | — | | | | — | | |
| Net asset value of shares issued to shareholders in payment of distributions declared | |
| Class A | | | 12,638,811 | | | | 12,940,413 | | | | 19,628,532 | | |
| Class B | | | 11,588,822 | | | | 12,330,542 | | | | 18,519,333 | | |
| Class C | | | 7,056,869 | | | | 8,955,280 | | | | 16,268,812 | | |
| Class R | | | 24 | | | | — | | | | — | | |
| Cost of shares redeemed | |
| Class A | | | (116,893,744 | ) | | | (170,491,093 | ) | | | (362,386,019 | ) | |
| Class B | | | (102,325,855 | ) | | | (150,428,848 | ) | | | (239,728,258 | ) | |
| Class C | | | (113,209,077 | ) | | | (187,801,480 | ) | | | (323,939,061 | ) | |
| Net asset value of shares exchanged | |
| Class A | | | 5,995,992 | | | | 33,395,407 | | | | — | | |
| Class B | | | (5,995,992 | ) | | | (33,395,407 | ) | | | — | | |
| Net increase (decrease) in net assets from Fund share transactions | | $ | (205,750,530 | ) | | $ | (363,501,970 | ) | | $ | 16,526,162 | | |
| Net decrease in net assets | | $ | (251,692,178 | ) | | $ | (411,010,287 | ) | | $ | (102,984,972 | ) | |
| Net Assets | |
| At beginning of year | | $ | 1,016,918,472 | | | $ | 1,427,928,759 | | | $ | 1,530,913,731 | | |
| At end of year | | $ | 765,226,294 | | | $ | 1,016,918,472 | | | $ | 1,427,928,759 | | |
Accumulated distributions in excess of
net investment income included in net assets | |
| At end of year | | $ | (1,936,789 | ) | | $ | (28,693 | ) | | $ | (3,463,671 | ) | |
(1) For the ten months ended October 31, 2004.
See notes to financial statements
6
Eaton Vance Government Obligations Fund as of October 31, 2005
FINANCIAL STATEMENTS CONT'D
Financial Highlights
| | | Class A | |
| | | Year Ended | | Period Ended | | Year Ended December 31, | |
| | | October 31, 2005(1)(2) | | October 31, 2004(1)(2)(3) | | 2003(1)(2) | | 2002(1)(2) | | 2001(1)(2)(4) | | 2000(1)(2) | |
| Net asset value — Beginning of year | | $ | 7.740 | | | $ | 8.050 | | | $ | 8.620 | | | $ | 8.580 | | | $ | 8.460 | | | $ | 8.370 | | |
| Income (loss) from operations | |
| Net investment income | | $ | 0.212 | | | $ | 0.215 | | | $ | 0.159 | | | $ | 0.346 | | | $ | 0.473 | | | $ | 0.618 | | |
| Net realized and unrealized gain (loss) | | | (0.090 | ) | | | (0.065 | ) | | | (0.177 | ) | | | 0.298 | | | | 0.268 | | | | 0.105 | | |
| Total income (loss) from operations | | $ | 0.122 | | | $ | 0.150 | | | $ | (0.018 | ) | | $ | 0.644 | | | $ | 0.741 | | | $ | 0.723 | | |
| Less distributions | |
| From net investment income | | $ | (0.519 | ) | | $ | (0.460 | ) | | $ | (0.548 | ) | | $ | (0.581 | ) | | $ | (0.621 | ) | | $ | (0.619 | ) | |
| From tax return of capital | | | (0.003 | ) | | | — | | | | (0.004 | ) | | | (0.023 | ) | | | — | | | | (0.014 | ) | |
| Total distributions | | $ | (0.522 | ) | | $ | (0.460 | ) | | $ | (0.552 | ) | | $ | (0.604 | ) | | $ | (0.621 | ) | | $ | (0.633 | ) | |
| Net asset value — End of year | | $ | 7.340 | | | $ | 7.740 | | | $ | 8.050 | | | $ | 8.620 | | | $ | 8.580 | | | $ | 8.460 | | |
| Total Return(5) | | | 2.03 | %(6) | | | 1.91 | % | | | (0.35 | )% | | | 7.84 | % | | | 9.06 | % | | | 9.12 | % | |
| Ratios/Supplemental Data | |
| Net assets, end of year (000's omitted) | | $ | 291,931 | | | $ | 354,083 | | | $ | 435,022 | | | $ | 474,595 | | | $ | 291,249 | | | $ | 183,657 | | |
| Ratios (As a percentage of average daily net assets): | |
| Expenses(7) | | | 1.18 | % | | | 1.13 | %(9) | | | 1.06 | % | | | 1.11 | % | | | 1.25 | % | | | 1.21 | % | |
| Expenses after custodian fee reduction(7) | | | 1.18 | % | | | 1.13 | %(9) | | | 1.06 | % | | | 1.11 | % | | | 1.25 | % | | | 1.21 | % | |
| Interest expense(7) | | | 0.00 | %(8) | | | 0.00 | %(8)(9) | | | 0.01 | % | | | 0.00 | %(8) | | | 0.02 | % | | | 0.02 | % | |
| Net investment income | | | 2.82 | % | | | 3.27 | %(9) | | | 1.90 | % | | | 4.03 | % | | | 5.50 | % | | | 7.44 | % | |
| Portfolio Turnover of the Portfolio | | | 30 | % | | | 5 | % | | | 67 | % | | | 41 | % | | | 21 | % | | | 22 | % | |
(1) Net investment income per share was computed using average shares outstanding.
(2) Per share data have been restated to reflect the effects of a 1.1594595-for-1 stock split effective on November 11, 2005.
(3) For the ten-month period ended October 31, 2004.
(4) The Fund, through its investment in the Portfolio, adopted the provisions of the revised AICPA and Accounting Guide for Investment Companies and began amortizing market premium on fixed-income securities. Additionally, the Portfolio reclassified net losses realized on prepayments received on mortgage-backed securities that were previously included in realized gains/losses to interest income. The effect of these changes on net investment income per share and on the ratio of net investment income to average net assets for the year ended December 31, 2001 was a decrease of $0.139 per share and 1.61%, respectively. Per share data and ratios for the periods prior to January 1, 2001 have not been restated to reflect this change in presentation.
(5) Returns are historical and are calculated by determining the percentage change in net asset value with all distributions reinvested. Total return is not computed on an annualized basis.
(6) Total return reflects an increase of 0.31% due to the change in the timing of the payment and reinvestment of distributions.
(7) Includes the Fund's share of the Portfolio's allocated expenses.
(8) Represents less than 0.01%.
(9) Annualized.
See notes to financial statements
7
Eaton Vance Government Obligations Fund as of October 31, 2005
FINANCIAL STATEMENTS CONT'D
Financial Highlights
| | | Class B | |
| | | Year Ended | | Period Ended | | Year Ended December 31, | |
| | | October 31, 2005(1) | | October 31, 2004(1)(2) | | 2003(1) | | 2002(1) | | 2001(1)(3) | | 2000(1) | |
| Net asset value — Beginning of period | | $ | 7.740 | | | $ | 8.040 | | | $ | 8.610 | | | $ | 8.570 | | | $ | 8.450 | | | $ | 8.350 | | |
| Income (loss) from operations | |
| Net investment income | | $ | 0.156 | | | $ | 0.166 | | | $ | 0.096 | | | $ | 0.282 | | | $ | 0.409 | | | $ | 0.557 | | |
| Net realized and unrealized gain (loss) | | | (0.094 | ) | | | (0.060 | ) | | | (0.179 | ) | | | 0.297 | | | | 0.266 | | | | 0.109 | | |
| Total income (loss) from operations | | $ | 0.062 | | | $ | 0.106 | | | $ | (0.083 | ) | | $ | 0.579 | | | $ | 0.675 | | | $ | 0.666 | | |
| Less distributions | |
| From net investment income | | $ | (0.459 | ) | | $ | (0.406 | ) | | $ | (0.483 | ) | | $ | (0.512 | ) | | $ | (0.555 | ) | | $ | (0.550 | ) | |
| From tax return of capital | | | (0.003 | ) | | | — | | | | (0.004 | ) | | | (0.027 | ) | | | — | | | | (0.016 | ) | |
| Total distributions | | $ | (0.462 | ) | | $ | (0.406 | ) | | $ | (0.487 | ) | | $ | (0.539 | ) | | $ | (0.555 | ) | | $ | (0.566 | ) | |
| Net asset value — End of period | | $ | 7.340 | | | $ | 7.740 | | | $ | 8.040 | | | $ | 8.610 | | | $ | 8.570 | | | $ | 8.450 | | |
| Total Return(4) | | | 1.15 | %(5) | | | 1.35 | % | | | (1.03 | )% | | | 7.00 | % | | | 8.23 | % | | | 8.33 | % | |
| Ratios/Supplemental Data | |
| Net assets, end of period (000's omitted) | | $ | 291,079 | | | $ | 390,836 | | | $ | 555,947 | | | $ | 583,804 | | | $ | 240,472 | | | $ | 120,557 | | |
| Ratios (As a percentage of average daily net assets): | |
| Expenses(6) | | | 1.93 | % | | | 1.88 | %(8) | | | 1.81 | % | | | 1.86 | % | | | 1.99 | % | | | 1.95 | % | |
| Expenses after custodian fee reduction(6) | | | 1.93 | % | | | 1.88 | %(8) | | | 1.81 | % | | | 1.86 | % | | | 1.99 | % | | | 1.95 | % | |
| Interest expense(6) | | | 0.00 | %(7) | | | 0.00 | %(7)(8) | | | 0.01 | % | | | 0.00 | %(7) | | | 0.02 | % | | | 0.02 | % | |
| Net investment income | | | 2.07 | % | | | 2.52 | %(8) | | | 1.15 | % | | | 3.29 | % | | | 4.75 | % | | | 6.72 | % | |
| Portfolio Turnover of the Portfolio | | | 30 | % | | | 5 | % | | | 67 | % | | | 41 | % | | | 21 | % | | | 22 | % | |
(1) Net investment income per share was computed using average shares outstanding.
(2) For the ten-month period ended October 31, 2004.
(3) The Fund, through its investment in the Portolio, adopted the provisions of the revised AICPA Audit and Accounting Guide for Investment Companies and began amortizing market premium on fixed-income securities. Additionally, the Portfolio reclassified net losses realized on prepayments received on mortgage-backed securities that were previously included in realized gains/losses to interest income. The effect of these changes on net investment income per share and on the ratio of net investment income to average net assets for the year ended December 31, 2001 was a decrease of $0.138 per share and 1.61%, respectively. Per share data and ratios for the periods prior to January 1, 2001 have not been restated to reflect this change in presentation.
(4) Returns are historical and are calculated by determining the percentage change in net asset value with all distributions reinvested. Total return in not computed on an annualized basis.
(5) Total return reflects an increase of 0.24% due to the change in the timing of the payment and reinvestment of distributions.
(6) Includes the Fund's share of the Portfolio's allocated expenses.
(7) Represents less than 0.01%.
(8) Annualized.
See notes to financial statements
8
Eaton Vance Government Obligations Fund as of October 31, 2005
FINANCIAL STATEMENTS CONT'D
Financial Highlights
| | | Class C | |
| | | Year Ended | | Period Ended | | Year Ended December 31, | |
| | | October 31, 2005(1) | | October 31, 2004(1)(2) | | 2003(1) | | 2002(1) | | 2001(1)(3) | | 2000(1) | |
| Net asset value — Beginning of period | | $ | 7.730 | | | $ | 8.040 | | | $ | 8.610 | | | $ | 8.570 | | | $ | 8.450 | | | $ | 8.360 | | |
| Income (loss) from operations | |
| Net investment income | | $ | 0.157 | | | $ | 0.166 | | | $ | 0.096 | | | $ | 0.282 | | | $ | 0.392 | | | $ | 0.551 | | |
| Net realized and unrealized gain (loss) | | | (0.085 | ) | | | (0.070 | ) | | | (0.179 | ) | | | 0.297 | | | | 0.283 | | | | 0.105 | | |
| Total income (loss) from operations | | $ | 0.072 | | | $ | 0.096 | | | $ | (0.083 | ) | | $ | 0.579 | | | $ | 0.675 | | | $ | 0.656 | | |
| Less distributions | |
| From net investment income | | $ | (0.459 | ) | | $ | (0.406 | ) | | $ | (0.483 | ) | | $ | (0.512 | ) | | $ | (0.555 | ) | | $ | (0.550 | ) | |
| From tax return of capital | | | (0.003 | ) | | | — | | | | (0.004 | ) | | | (0.027 | ) | | | — | | | | (0.016 | ) | |
| Total distributions | | $ | (0.462 | ) | | $ | (0.406 | ) | | $ | (0.487 | ) | | $ | (0.539 | ) | | $ | (0.555 | ) | | $ | (0.566 | ) | |
| Net asset value — End of period | | $ | 7.340 | | | $ | 7.730 | | | $ | 8.040 | | | $ | 8.610 | | | $ | 8.570 | | | $ | 8.450 | | |
| Total Return(4) | | | 1.16 | %(5) | | | 1.22 | % | | | (1.02 | )% | | | 6.99 | % | | | 8.18 | % | | | 8.19 | % | |
| Ratios/Supplemental Data | |
| Net assets, end of period (000's omitted) | | $ | 182,214 | | | $ | 272,000 | | | $ | 436,960 | | | $ | 472,515 | | | $ | 133,176 | | | $ | 32,837 | | |
| Ratios (As a percentage of average daily net assets): | |
| Expenses(6) | | | 1.93 | % | | | 1.88 | %(8) | | | 1.81 | % | | | 1.85 | % | | | 1.99 | % | | | 2.04 | % | |
| Expenses after custodian fee reduction(6) | | | 1.93 | % | | | 1.88 | %(8) | | | 1.81 | % | | | 1.85 | % | | | 1.99 | % | | | 2.04 | % | |
| Interest expense(6) | | | 0.00 | %(7) | | | 0.00 | %(7)(8) | | | 0.01 | % | | | 0.00 | %(7) | | | 0.02 | % | | | 0.02 | % | |
| Net investment income | | | 2.08 | % | | | 2.52 | %(8) | | | 1.15 | % | | | 3.29 | % | | | 4.55 | % | | | 6.64 | % | |
| Portfolio Turnover of the Portfolio | | | 30 | % | | | 5 | % | | | 67 | % | | | 41 | % | | | 21 | % | | | 22 | % | |
(1) Net investment income per share was computed using average shares outstanding.
(2) For the ten-month period ended October 31, 2004.
(3) The Fund, through its investment in the Portfolio, adopted the provisions of the revised AICPA Audit and Accounting Guide for Investment Companies and began amortizing market premium on fixed-income securities. Additionally, the Portfolio reclassified net losses realized on prepayments received on mortgage-backed securities that were previously included in realized gains/losses to interest income. The effect of these changes on net investment income per share and on the ratio of net investment income to average net assets for the year ended December 31, 2001 was a decrease of $0.139 per share and 1.61%, respectively. Per share data and ratios for the periods prior to January 1, 2001 have not been restated to reflect this change in presentation.
(4) Returns are historical and are calculated by determining the percentage change in net asset value with all distributions reinvested. Total return is not computed on an annualized basis.
(5) Total return reflects an increase of 0.11% due to the change in the timing of the payment and reinvestment of distributions.
(6) Includes the Fund's share of the Portfolio's allocated expenses.
(7) Represents less than 0.01%.
(8) Annualized.
See notes to financial statements
9
Eaton Vance Government Obligations Fund as of October 31, 2005
FINANCIAL STATEMENTS CONT'D
Financial Highlights
| | | Class R | |
| | | Period Ended
October 31, 2005(1)(2) | |
| Net asset value — Beginning of period | | $ | 7.430 | | |
| Income (loss) from operations | |
| Net investment income | | $ | 0.083 | | |
| Net realized and unrealized loss | | | (0.091 | ) | |
| Total loss from operations | | $ | (0.008 | ) | |
| Less distributions | |
| From net investment income | | $ | (0.099 | ) | |
| Tax return of capital | | | (0.003 | ) | |
| Total distributions | | $ | (0.102 | ) | |
| Net asset value — End of year | | $ | 7.320 | | |
| Total Return(3) | | | (0.12 | )% | |
| Ratios/Supplemental Data | |
| Net assets, end of period (000's omitted) | | $ | 2 | | |
| Ratios (As a percentage of average daily net assets): | |
| Expenses(4) | | | 1.43 | %(6) | |
| Expenses after custodian fee reduction(4) | | | 1.43 | %(6) | |
| Interest expense(4) | | | 0.00 | %(5)(6) | |
| Net investment income | | | 4.57 | %(6) | |
| Portfolio Turnover of the Portfolio | | | 30 | % | |
(1) Net investment income per share was computed using average shares outstanding.
(2) For the period from the commencement of operations, August 12, 2005, to October 31, 2005.
(3) Returns are historical and are calculated by determining the percentage change in net asset value with all distributions reinvested. Total return is not computed on an annualized basis.
(4) Includes the Fund's share of the Portfolio's allocated expenses.
(5) Represents less than 0.01%.
(6) Annualized.
See notes to financial statements
10
Eaton Vance Government Obligations Fund as of October 31, 2005
NOTES TO FINANCIAL STATEMENTS
1 Significant Accounting Policies
Eaton Vance Government Obligations Fund (the Fund) is a diversified entity of the type commonly known as a Massachusetts business trust and is registered under the Investment Company Act of 1940, as amended, as an open-end management investment company. The Fund is a series of Eaton Vance Mutual Funds Trust. The Fund offers four classes of shares. Class A shares are generally sold subject to a initial sales charge imposed at time of purchase. Class B and Class C shares are sold at net asset value and are subject to a contingent deferred sales charge (see Note 7). Class R shares are offered at net asset value and are not subject to an initial sales charge. The Trustees have adopted a conversion feature pursuant to which Class B shares of the Fund automatically convert to Class A shares eight years after their purchase as described in the Fund's prospectus. Each class represents a pro rata interest in the Fund, but votes separatel y on class-specific matters and (as noted below) is subject to different expenses. Realized and unrealized gains and losses are allocated daily to each class of shares based on the relative net assets of each class to the total net assets of the Fund. Net investment income, other than class-specific expenses, is allocated daily to each class based upon the ratio of the value of each class' paid shares to the total value of all paid shares. Each class of shares differs in its distribution plan and certain other class-specific expenses. The Fund invests all of its investable assets in interests in the Government Obligations Portfolio (the Portfolio), a New York Trust, having the same investment objective and policies as the Fund. The value of the Fund's investment in the Portfolio reflects the Fund's proportionate interest in the net assets of the Portfolio (88.8% at October 31, 2005). The performance of the Fund is directly affected by the performance of the Portfolio. The financial statements of the Portfoli o, including the portfolio of investments, are included elsewhere in this report and should be read in conjunction with the Fund's financial statements.
The following is a summary of significant accounting policies consistently followed by the Fund in the preparation of its financial statements. The policies are in conformity with accounting principles generally accepted in the United States of America.
A Investment Valuation — Valuation of securities by the Portfolio is discussed in Note 1A of the Portfolio's Notes to Financial Statements which are included elsewhere in this report.
B Income — The Fund's net investment income consists of the Fund's pro rata share of the net investment income of the Portfolio, less all actual and accrued expenses of the Fund.
C Federal Taxes — The Fund's policy is to comply with the provisions of the Internal Revenue Code applicable to regulated investment companies and to distribute to shareholders each year all of its taxable income, including any net realized gain on investments. Accordingly, no provision for federal income or excise tax is necessary. At October 31, 2005, the Fund, for federal income tax purposes, had a capital loss carryover of $214,103,892 which will reduce the Fund's taxable income arising from future net realized gain on investments, if any, to the extent permitted by the Internal Revenue Code and thus will reduce the amount of distributions to shareholders which would otherwise be necessary to relieve the Fund of any liability for federal income tax or excise tax. Such capital loss carryovers will expire on October 31, 2006 ($3,525,680), October 31, 2007 ($16,400,527), October 31, 2008 ($4,071,870), October 31, 2010 ($21,056,795), October 31, 2011 ($78,339,789), October 31, 2012 ($67,101,638), and October 31, 2013 ($23,607,593). During the year ended October 31, 2005, capital loss carryforwards in the amount of $4,786,337 expired.
D Expense Reduction — Investors Bank & Trust Company (IBT) serves as custodian to the Fund and the Portfolio. Pursuant to the respective custodian agreements, IBT receives a fee reduced by credits which are determined based on the average daily cash balances the Fund or the Portfolio maintains with IBT. All credit balances used to reduce the Fund's custodian fees are reported as a reduction of total expenses in the Statement of Operations. For the year ended October 31, 2005, there were no credits earned by the Fund. During the year ended October 31, 2005, capital loss carry-forwards in the amount of $4,786,337 expired.
E Other — Investment transactions are accounted for on a trade-date basis.
F Expenses — The majority of expenses of the Trust are directly identifiable to an individual fund. Expenses which are not readily identifiable to a specific fund are allocated taking into consideration, among other things, the nature and type of expense and the relative size of the fund.
G Use of Estimates — The preparation of the financial statements in conformity with accounting principles
11
Eaton Vance Government Obligations Fund as of October 31, 2005
NOTES TO FINANCIAL STATEMENTS CONT'D
generally accepted in the United States of America requires management to make estimates and assumptions that affect the reported amounts of assets and liabilities at the date of the financial statements and the reported amounts of income and expense during the reporting period. Actual results could differ from those estimates.
H Indemnifications — Under the Trust's organizational documents, its officers and Trustees are indemnified against certain liabilities and expenses arising out of the performance of their duties to the Fund and shareholders are indemnified against personal liability for the obligations of the Trust. Additionally, in the normal course of business, the Fund enters into agreements with the service providers that may contain indemnification clauses. The Fund's maximum exposure under these arrangements is unknown as this would involve future claims that may be made against the Fund that have not yet occurred.
2 Distributions to Shareholders
The Fund declares dividends daily to shareholders of record at the time of declaration. Distributions are paid monthly. Distributions are paid in the form of additional shares or, at the election of the shareholder, in cash. Distributions of allocated realized capital gains, if any, are made at least annually. Shareholders may reinvest capital gain distributions in additional shares of the Fund at the net asset value as of the ex-dividend date. The Fund distinguishes between distributions on a tax basis and a financial reporting basis. Accounting principles generally accepted in the United States of America require that only distributions in excess of tax basis earnings and profits be reported in the financial statements as a return of capital. Permanent differences between book and tax accounting relating to distributions are reclassified to paid-in capital.
The tax character of the distributions declared for the year ended December 31, 2003, the period from January 1, 2004 to October 31, 2004 and the year ended October 31, 2005 was as follows:
| | | 10/31/05 | | 10/31/04 | | 12/31/03 | |
| Distributions declared from: | |
| Ordinary Income | | $ | 55,819,398 | | | $ | 63,670,820 | | | $ | 102,881,344 | | |
| Tax return of capital | | $ | 353,610 | | | $ | — | | | $ | 747,860 | | |
During the year ended October 31, 2005, accumulated undistributed net investment loss was decreased by $34,003,591, accumulated net realized loss was increased by $20,777,273 and paid-in-capital was decreased by $13,226,318 due to differences between book and tax accounting for paydown gains/losses on mortgage-backed securities, expired capital loss carryforwards, return of capital, mixed straddle adjustments and premium amortization. This change had no effect on net assets or net asset value per share.
At October 31, 2005, the components of distributable earnings (accumulated loss) on a tax basis were as follows:
| Capital loss carryforwards | | $ | (214,103,892 | ) | |
The differences between components of distributable earnings (accumulated loss) on a tax basis and the amounts reflected in the statement of assets and liabilities are primarily due to differences in book and tax policies for mixed straddle accounts and futures, and the timing of recognizing distributions to shareholders.
3 Shares of Beneficial Interest
The Fund's Declaration of Trust permits the Trustees to issue an unlimited number of full and fractional shares of beneficial interest (without par value). Such shares may be issued in a number of different series (such as the Fund) and classes. Transactions in Fund shares were as follows:
| Class A | | Year Ended
October 31,
2005(1) | | Period Ended
October 31,
2004(1)(2) | | Year Ended
December 31,
2003(1) | |
| Sales | | | 6,998,330 | | | | 7,387,062 | | | | 40,246,636 | | |
Issued to shareholders electing
to receive payments of
distributions in Fund shares | | | 1,677,716 | | | | 1,643,264 | | | | 2,354,361 | | |
| Redemptions | | | (15,470,971 | ) | | | (21,588,594 | ) | | | (43,596,938 | ) | |
| Exchange from Class B shares | | | 799,022 | | | | 4,277,827 | | | | — | | |
| Net increase (decrease) | | | (5,995,903 | ) | | | (8,280,441 | ) | | | (995,941 | ) | |
| Class B | | Year Ended
October 31,
2005 | | Period Ended
October 31,
2004(2) | | Year Ended
December 31,
2003 | |
| Sales | | | 1,940,075 | | | | 3,067,546 | | | | 28,099,509 | | |
Issued to shareholders electing
to receive payments of
distributions in Fund shares | | | 1,537,815 | | | | 1,565,493 | | | | 2,223,770 | | |
| Redemptions | | | (13,563,248 | ) | | | (18,961,798 | ) | | | (28,980,488 | ) | |
| Exchange to Class A shares | | | (798,427 | ) | | | (4,264,548 | ) | | | — | | |
| Net increase (decrease) | | | (10,883,785 | ) | | | (18,593,307 | ) | | | 1,342,791 | | |
12
Eaton Vance Government Obligations Fund as of October 31, 2005
NOTES TO FINANCIAL STATEMENTS CONT'D
| Class C | | Year Ended
October 31,
2005 | | Period Ended
October 31,
2004(2) | | Year Ended
December 31,
2003 | |
| Sales | | | 3,724,161 | | | | 3,480,694 | | | | 36,700,073 | | |
Issued to shareholders electing
to receive payments of
distributions in Fund shares | | | 937,421 | | | | 1,137,242 | | | | 1,955,754 | | |
| Redemptions | | | (15,017,783 | ) | | | (23,799,107 | ) | | | (39,180,872 | ) | |
| Net increase (decrease) | | | (10,356,201 | ) | | | (19,181,171 | ) | | | (525,045 | ) | |
| Class R | | | | | | Period Ended
October 31,
2005(3) | |
| Sales | | | | | | | | | | | 276 | | |
Issued to shareholders electing
to receive payments of
distributions in Fund shares | | | | | | | | | | | 3 | | |
| Net increase (decrease) | | | | | | | | | | | 279 | | |
(1) Transactions have been restated to reflect the effects of a 1.1594595-for-1 stock split effective November 11, 2005.
(2) For the ten-months ended October 31, 2004.
(3) For the period from August 12, 2005, commencement of operations, to October 31, 2005
4 Investment Transactions
Increases and decreases in the Fund's investment in the Portfolio for the year ended October 31, 2005 aggregated $95,814,956, and $365,924,035, respectively.
5 Transactions with Affiliates
Eaton Vance Management (EVM) serves as the administrator of the Fund, but receives no compensation. The Portfolio has engaged Boston Management and Research (BMR), a subsidiary of EVM, to render investment advisory services. See Note 3 of the Portfolio's Notes to Financial Statements which are included elsewhere in this report. Certain officers and Trustees of the Fund and Portfolio are officers of the above organizations. Except as to Trustees of the Fund and the Portfolio who are not members of EVM's or BMR's organization, officers and Trustees receive remuneration for their services to the Fund out of the investment adviser fee earned by BMR. EVM serves as the sub-transfer agent of the Fund and receives from the transfer agent an aggregate fee based upon the actual expenses incurred by EVM in the performance of those services. For the year ended October 31, 2005, EVM earned $67,807 in sub-transfer agent fees. The Fund was inf ormed that Eaton Vance Distributors, Inc. (EVD), a subsidiary of EVM and the Fund's principal underwriter, received $47,618 as its portion of the sales charge on sales of Class A shares for the year ended October 31, 2005.
6 Distribution and Service Plans
The Fund has in effect distribution plans for Class B shares (Class B Plan), Class C shares (Class C Plan), and Class R shares (Class R Plan) pursuant to Rule 12b-1 under the Investment Company Act of 1940 and a service plan for Class A shares (Class A Plan) (collectively, the Plans). The Class B and Class C Plans require the Fund to pay EVD amounts equal to 1/365 of 0.75% (annualized) of the Fund's average daily net assets attributable to Class B and Class C shares for providing ongoing distribution services and facilities to the Fund. The Fund will automatically discontinue payments to EVD during any period in which there are no outstanding Uncovered Distribution Charges, which are equivalent to the sum of (i) 5% and 6.25% of the aggregate amount received by the Fund for the Class B and Class C shares sold, respectively, plus (ii) interest calculated by applying the rate of 1% over the prevailing prime rate to the outstanding balance of Uncovered Distribution Charges of EVD of each respective class, reduced by the aggregate amount of contingent deferred sales charges (see Note 7) and daily amounts theretofore paid to EVD by each respective class. The Class R Plan requires that the Class R shares will pay a monthly distribution fee to EVD in an amount equal to 0.25% on an annual basis of the average daily net assets attributable to Class R shares. Although there is no present intention to do so, Class R shares could pay distribution fees up to 0.50% annually upon Trustee approval. The Fund paid or accrued $2,513,542, $1,652,188, and $1 for Class B, Class C and Class R shares, respectively, to or payable to EVD for the year ended October 31, 2005, representing 0.75%, 0.75% and 0.25% of the average daily net assets for Class B, Class C and Class R shares, respectively. At October 31, 2005, the amounts of Uncovered Distribution Charges of EVD calculated under the Plans were approximately $15,877,000 and $55,125,000 for Class B and Cl ass C shares, respectively.
The Plans authorize the Fund to make payments of service fees to EVD, investment dealers and other persons in amounts not exceeding 0.25% (annualized) of the Fund's average daily net assets attributable to Class A, Class B, Class C, and Class R shares for each fiscal year. Service fee payments will be made for personal services and/or the maintenance of shareholder accounts. Service fees are separate and distinct from the sales commissions and distribution fees payable by the Fund to EVD and, as such are not subject to automatic discontinuance when there are
13
Eaton Vance Government Obligations Fund as of October 31, 2005
NOTES TO FINANCIAL STATEMENTS CONT'D
no outstanding Uncovered Distribution Charges of EVD. Service fees for the year ended October 31, 2005 amounted to $775,821, $837,847, $550,729 and $1 for Class A, Class B, Class C, and Class R shares, respectively.
7 Contingent Deferred Sales Charge
Class A shares purchased at net asset value in amounts of $1 million or more (other than shares purchased in a single transaction of $5 million or more) are subject to a 1.00% contingent deferred sales charge (CDSC) if redeemed within 12 months of purchase. Investors who purchase Class A shares of a single fund in a single transaction at net asset value in amounts of $5 million or more will not be subject to any CDSC for such investment or any subsequent investment in the same fund but will be subject to a 1.00% redemption fee if they are redeemed or exchanged within the first three months after the settlement of the purchase. A contingent deferred sales charge (CDSC) generally is imposed on redemptions of Class B shares made within six years of purchase and on redemptions of Class C shares made within one year of purchase. Generally, the CDSC is based upon the lower of the net asset value at date of redemption or date of purcha se. No charge is levied on shares acquired by reinvestment of dividends or capital gain distributions. The Class B CDSC is imposed at declining rates that begin at 5% in the first and second year of redemption after purchase, declining one percentage point in each subsequent year. Class C shares will be subject to a 1% CDSC if redeemed within one year of purchase. No CDSC is levied on shares which have been sold to EVM or its affiliates or to their respective employees or clients and may be waived under certain other limited conditions. CDSC charges are paid to EVD to reduce the amount of Uncovered Distribution Charges calculated under the Fund's Distribution Plans (see Note 6). CDSC charges received when no Uncovered Distribution Charges exist will be credited to the Fund. The Fund was informed that EVD received approximately $2,000, $1,581,000, and $29,000 of CDSC paid by shareholders for Class A shares, Class B shares, and Class C shares, respectively, for the year ended October 31, 2005.
8 Fiscal Year End Change
Effective October 15, 2004 the Fund changed its fiscal year-end to October 31.
9 Stock Split
On October 17, 2005, the Trustees of the Fund approved a 1.1594595-for-1 stock split for Class A shares, effective November 11, 2005. The stock split will have no impact on the overall value of a shareholder's investment in the Fund.
14
Eaton Vance Government Obligations Fund as of October 31, 2005
REPORT OF INDEPENDENT REGISTERED PUBLIC ACCOUNTING FIRM
To the Trustees and Shareholders
of Eaton Vance Government Obligations Fund:
In our opinion, the accompanying statement of assets and liabilities, and the related statements of operations and of changes in net assets and the financial highlights present fairly, in all material respects, the financial position of Eaton Vance Government Obligations Fund, a series of Eaton Vance Mutual Funds Trust (the "Fund") at October 31, 2005, and the results of its operations, the changes in its net assets and the financial highlights for each of the periods indicated in conformity with accounting principles generally accepted in the United States of America. These financial statements and financial highlights (hereafter referred to as "financial statements") are the responsibility of the Fund's management; our responsibility is to express an opinion on these financial statements based on our audits. We conducted our audits of these financial statements in accordance with standards of the Public Company Accounting Over sight Board (United States). Those standards require that we plan and perform the audit to obtain reasonable assurance about whether the financial statements are free of material misstatement. An audit includes examining, on a test basis, evidence supporting the amounts and disclosures in the financial statements, assessing the accounting principles used and significant estimates made by management, and evaluating the overall financial statement presentation. We believe that our audits provide a reasonable basis for our opinion.
PricewaterhouseCoopers LLP
Boston, Massachusetts
December 23, 2005
15
Eaton Vance Government Obligations Fund as of October 31, 2005
FEDERAL TAX INFORMATION
The Form 1099-DIV you receive in January 2006 will show the tax status of all distributions paid to your account in calendar 2005. Shareholders are advised to consult their own tax adviser with respect to the tax consequences of their investment in the Fund.
16
Government Obligations Portfolio as of October 31, 2005
PORTFOLIO OF INVESTMENTS
| Mortgage Pass-Throughs — 140.6% | |
| Security | | Principal
Amount
(000's omitted) | | Value | |
| Federal Home Loan Mortgage Corp.: | |
| 5.50%, with various maturities to 2011 | | $ | 5 | | | $ | 5,117 | | |
| 6.00%, with various maturities to 2026 | | | 1,819 | | | | 1,855,458 | | |
| 6.25%, with maturity at 2008 | | | 3 | | | | 2,553 | | |
| 6.50%, with various maturities to 2024 | | | 32,755 | | | | 33,958,988 | | |
| 6.87%, with maturity at 2024 | | | 755 | | | | 792,131 | | |
| 7.00%, with various maturities to 2026 | | | 24,463 | | | | 25,689,023 | | |
| 7.09%, with maturity at 2023 | | | 2,288 | | | | 2,416,384 | | |
| 7.25%, with maturity at 2022 | | | 3,170 | | | | 3,360,594 | | |
| 7.31%, with maturity at 2027 | | | 774 | | | | 820,878 | | |
| 7.50%, with various maturities to 2028 | | | 12,715 | | | | 13,548,416 | | |
| 7.63%, with maturity at 2019 | | | 1,391 | | | | 1,484,728 | | |
| 7.75%, with various maturities to 2018 | | | 103 | | | | 108,930 | | |
| 7.78%, with maturity at 2022 | | | 343 | | | | 368,783 | | |
| 7.85%, with maturity at 2020 | | | 1,024 | | | | 1,101,130 | | |
| 8.00%, with various maturities to 2028 | | | 45,785 | | | | 48,893,896 | | |
| 8.13%, with maturity at 2019 | | | 2,117 | | | | 2,289,548 | | |
| 8.15%, with various maturities to 2021 | | | 716 | | | | 762,246 | | |
| 8.25%, with various maturities to 2017 | | | 1,145 | | | | 1,190,046 | | |
| 8.50%, with various maturities to 2027 | | | 19,947 | | | | 21,633,581 | | |
| 8.75%, with various maturities to 2016 | | | 765 | | | | 786,485 | | |
| 9.00%, with various maturities to 2032 | | | 38,761 | | | | 42,876,555 | | |
| 9.25%, with various maturities to 2017 | | | 1,745 | | | | 1,846,542 | | |
| 9.50%, with various maturities to 2026 | | | 9,124 | | | | 10,125,039 | | |
| 9.75%, with various maturities to 2018 | | | 600 | | | | 630,751 | | |
| 10.00%, with various maturities to 2025 | | | 10,079 | | | | 11,380,500 | | |
| 10.50%, with various maturities to 2021 | | | 5,938 | | | | 6,802,545 | | |
| 10.75%, with maturity at 2011 | | | 211 | | | | 225,862 | | |
| 11.00%, with various maturities to 2021 | | | 8,850 | | | | 10,123,490 | | |
| 11.25%, with maturity at 2014 | | | 177 | | | | 195,203 | | |
| 11.50%, with various maturities to 2019 | | | 4,450 | | | | 5,062,483 | | |
| 11.75%, with maturity at 2011 | | | 148 | | | | 163,186 | | |
| 12.00%, with various maturities to 2019 | | | 1,745 | | | | 2,027,864 | | |
| 12.25%, with various maturities to 2019 | | | 196 | | | | 222,768 | | |
| 12.50%, with various maturities to 2019 | | | 3,685 | | | | 4,232,274 | | |
| 12.75%, with various maturities to 2015 | | | 50 | | | | 58,427 | | |
| 13.00%, with various maturities to 2019 | | | 548 | | | | 641,327 | | |
| 13.25%, with various maturities to 2019 | | | 74 | | | | 86,084 | | |
| 13.50%, with various maturities to 2019 | | | 995 | | | | 1,150,327 | | |
| 14.00%, with various maturities to 2016 | | | 207 | | | | 241,570 | | |
| 14.50%, with various maturities to 2014 | | | 25 | | | | 30,871 | | |
| 14.75%, with maturity at 2010 | | | 58 | | | | 64,705 | | |
| 15.00%, with various maturities to 2013 | | | 458 | | | | 545,348 | | |
| 15.25%, with maturity at 2012 | | | 28 | | | | 34,743 | | |
| 15.50%, with maturity at 2011 | | | 8 | | | | 9,453 | | |
| 16.00%, with maturity at 2012 | | | 35 | | | | 42,207 | | |
| 16.25%, with various maturities to 2012 | | | 19 | | | | 22,976 | | |
| | | $ | 259,912,015 | | |
| Federal National Mortgage Assn.: | |
| 0.25%, with maturity at 2014 | | $ | 5 | | | $ | 4,996 | | |
| 3.872%, with maturity at 2033(1) | | | 10,072 | | | | 10,124,310 | | |
| 3.926%, with various maturities to 2035(1) | | | 154,947 | | | | 155,766,583 | | |
| 3.953%, with maturity at 2035(1) | | | 4,751 | | | | 4,776,513 | | |
| Security | | Principal
Amount
(000's omitted) | | Value | |
| 3.997%, with maturity at 2020(1) | | $ | 10,330 | | | $ | 10,410,831 | | |
| 4.007%, with various maturities to 2026(1) | | | 7,989 | | | | 8,092,648 | | |
| 4.021%, with maturity at 2022(1) | | | 5,349 | | | | 5,425,529 | | |
| 4.128%, with maturity at 2036(1) | | | 4,937 | | | | 4,971,685 | | |
| 4.403%, with maturity at 2036(1) | | | 2,007 | | | | 2,021,239 | | |
| 5.50%, with maturity at 2014(2) | | | 23,662 | | | | 23,861,605 | | |
| 6.00%, with various maturities to 2024 | | | 1,199 | | | | 1,221,122 | | |
| 6.50%, with various maturities to 2026(2) | | | 112,397 | | | | 116,361,963 | | |
| 7.00%, with various maturities to 2029 | | | 58,100 | | | | 60,937,714 | | |
| 7.25%, with various maturities to 2023 | | | 256 | | | | 265,047 | | |
| 7.50%, with various maturities to 2029 | | | 31,827 | | | | 33,699,604 | | |
| 7.75%, with maturity at 2008 | | | 45 | | | | 45,531 | | |
| 7.875%, with maturity at 2021 | | | 2,013 | | | | 2,170,323 | | |
| 7.979%, with maturity at 2030 | | | 187 | | | | 200,805 | | |
| 8.00%, with various maturities to 2027 | | | 39,484 | | | | 42,376,883 | | |
| 8.25%, with various maturities to 2025 | | | 1,763 | | | | 1,869,658 | | |
| 8.33%, with maturity at 2020 | | | 2,192 | | | | 2,385,698 | | |
| 8.50%, with various maturities to 2027 | | | 16,127 | | | | 17,405,647 | | |
| 8.679%, with maturity at 2021 | | | 731 | | | | 797,133 | | |
| 8.75%, with various maturities to 2017 | | | 977 | | | | 1,013,920 | | |
| 8.91%, with maturity at 2010 | | | 272 | | | | 285,794 | | |
| 9.00%, with various maturities to 2030 | | | 6,746 | | | | 7,286,743 | | |
| 9.125%, with maturity at 2011 | | | 161 | | | | 170,384 | | |
| 9.25%, with various maturities to 2016 | | | 328 | | | | 344,891 | | |
| 9.50%, with various maturities to 2030 | | | 8,467 | | | | 9,332,324 | | |
| 9.75%, with maturity at 2019 | | | 58 | | | | 65,156 | | |
| 9.851%, with maturity at 2021 | | | 271 | | | | 305,839 | | |
| 9.892%, with maturity at 2025 | | | 183 | | | | 205,447 | | |
| 10.00%, with various maturities to 2027 | | | 7,921 | | | | 8,902,516 | | |
| 10.151%, with maturity at 2021 | | | 204 | | | | 233,616 | | |
| 10.153%, with maturity at 2023 | | | 340 | | | | 388,761 | | |
| 10.388%, with maturity at 2020 | | | 300 | | | | 335,153 | | |
| 10.406%, with maturity at 2021 | | | 386 | | | | 439,365 | | |
| 10.50%, with various maturities to 2025 | | | 2,510 | | | | 2,817,867 | | |
| 10.646%, with maturity at 2025 | | | 201 | | | | 227,094 | | |
| 11.00%, with various maturities to 2025 | | | 4,047 | | | | 4,598,389 | | |
| 11.243%, with maturity at 2019 | | | 251 | | | | 285,986 | | |
| 11.50%, with various maturities to 2020 | | | 2,816 | | | | 3,206,186 | | |
| 11.591%, with maturity at 2018 | | | 549 | | | | 629,733 | | |
| 11.75%, with various maturities to 2017 | | | 374 | | | | 428,270 | | |
| 12.00%, with various maturities to 2019 | | | 6,339 | | | | 7,334,235 | | |
| 12.061%, with maturity at 2025 | | | 154 | | | | 178,273 | | |
| 12.25%, with various maturities to 2015 | | | 297 | | | | 343,137 | | |
| 12.406%, with maturity at 2021 | | | 235 | | | | 271,728 | | |
| 12.50%, with various maturities to 2021 | | | 1,847 | | | | 2,129,524 | | |
| 12.697%, with maturity at 2015 | | | 488 | | | | 574,722 | | |
| 12.75%, with various maturities to 2015 | | | 428 | | | | 492,496 | | |
| 13.00%, with various maturities to 2019 | | | 1,102 | | | | 1,264,957 | | |
| 13.25%, with various maturities to 2015 | | | 325 | | | | 375,912 | | |
| 13.50%, with various maturities to 2015 | | | 914 | | | | 1,082,928 | | |
| 13.75%, with maturity at 2011 | | | 10 | | | | 11,667 | | |
| 14.00%, with maturity at 2014 | | | 28 | | | | 33,161 | | |
| 14.50%, with maturity at 2014 | | | 32 | | | | 39,005 | | |
| 14.75%, with maturity at 2012 | | | 673 | | | | 797,727 | | |
| 15.00%, with various maturities to 2013 | | | 756 | | | | 909,210 | | |
| 15.50%, with maturity at 2012 | | | 104 | | | | 125,469 | | |
See notes to financial statements
17
Government Obligations Portfolio as of October 31, 2005
PORTFOLIO OF INVESTMENTS CONT'D
| Security | | Principal
Amount
(000's omitted) | | Value | |
| 15.75%, with maturity at 2011 | | $ | 4 | | | $ | 4,303 | | |
| 16.00%, with maturity at 2012 | | | 327 | | | | 397,964 | | |
| | | $ | 563,062,919 | | |
| Government National Mortgage Assn.: | |
| 6.50%, with various maturities to 2026(2) | | $ | 121,726 | | | $ | 126,228,344 | | |
| 7.00%, with various maturities to 2025(2) | | | 57,944 | | | | 60,975,321 | | |
| 7.25%, with maturity at 2022 | | | 174 | | | | 184,367 | | |
| 7.50%, with various maturities to 2024 | | | 16,589 | | | | 17,574,952 | | |
| 8.00%, with various maturities to 2027 | | | 36,932 | | | | 39,686,124 | | |
| 8.25%, with various maturities to 2019 | | | 376 | | | | 406,368 | | |
| 8.30%, with maturity at 2020 | | | 179 | | | | 194,548 | | |
| 8.50%, with various maturities to 2018 | | | 6,422 | | | | 6,970,394 | | |
| 9.00%, with various maturities to 2027(2) | | | 21,492 | | | | 23,812,492 | | |
| 9.50%, with various maturities to 2026 | | | 16,672 | | | | 18,540,695 | | |
| 10.00%, with various maturities to 2025 | | | 5,712 | | | | 6,377,504 | | |
| 10.50%, with various maturities to 2020 | | | 5,792 | | | | 6,611,156 | | |
| 11.00%, with various maturities to 2020 | | | 1,979 | | | | 2,282,576 | | |
| 11.50%, with maturity at 2013 | | | 27 | | | | 31,054 | | |
| 12.00%, with various maturities to 2015 | | | 1,915 | | | | 2,218,625 | | |
| 12.50%, with various maturities to 2019 | | | 753 | | | | 873,709 | | |
| 13.00%, with various maturities to 2014 | | | 207 | | | | 242,141 | | |
| 13.50%, with maturity at 2011 | | | 8 | | | | 8,984 | | |
| 14.50%, with maturity at 2014 | | | 7 | | | | 8,091 | | |
| 15.00%, with various maturities to 2013 | | | 189 | | | | 230,841 | | |
| 16.00%, with various maturities to 2012 | | | 47 | | | | 56,005 | | |
| | | $ | 313,514,291 | | |
| Collateralized Mortgage Obligations: | |
Federal Home Loan Mortgage Corp.,
Series 1577, Class PH, 6.30%, due 2023 | | $ | 1,166 | | | $ | 1,175,849 | | |
Federal Home Loan Mortgage Corp.,
Series 1666, Class H, 6.25%, due 2023 | | | 2,771 | | | | 2,822,209 | | |
Federal Home Loan Mortgage Corp.,
Series 1671, Class HA, 3.73%, due 2024(3) | | | 2,500 | | | | 2,507,348 | | |
Federal Home Loan Mortgage Corp.,
Series 1822, Class Z, 6.90%, due 2026 | | | 4,749 | | | | 4,979,371 | | |
Federal Home Loan Mortgage Corp.,
Series 1896, Class Z, 6.00%, due 2026 | | | 2,541 | | | | 2,599,267 | | |
Federal Home Loan Mortgage Corp.,
Series 2115, Class K, 6.00%, due 2029 | | | 7,368 | | | | 7,536,142 | | |
Federal Home Loan Mortgage Corp.,
Series 2245, Class A, 8.00%, due 2027 | | | 28,019 | | | | 30,064,681 | | |
Federal Home Loan Mortgage Corp.,
Series 24, Class ZE, 6.25%, due 2023 | | | 1,095 | | | | 1,129,391 | | |
Federal Home Loan Mortgage Corp.,
Series 30, Class I, 7.50%, due 2024 | | | 798 | | | | 839,008 | | |
Federal National Mortgage Assn.,
Series 1993-149, Class M, 7.00%, due 2023 | | | 1,786 | | | | 1,878,375 | | |
Federal National Mortgage Assn.,
Series 1993-16, Class Z, 7.50%, due 2023 | | | 1,493 | | | | 1,575,187 | | |
Federal National Mortgage Assn.,
Series 1993-250, Class Z, 7.00%, due 2023 | | | 1,166 | | | | 1,216,868 | | |
Federal National Mortgage Assn.,
Series 1993-39, Class Z, 7.50%, due 2023 | | | 3,549 | | | | 3,749,995 | | |
Federal National Mortgage Assn.,
Series 1994-82, Class Z, 8.00%, due 2024 | | | 6,181 | | | | 6,573,801 | | |
| Security | | Principal
Amount
(000's omitted) | | Value | |
Federal National Mortgage Assn.,
Series 2000-49, Class A, 8.00%, due 2027 | | $ | 3,079 | | | $ | 3,262,861 | | |
Federal National Mortgage Assn.,
Series 2002-1, Class G, 7.00%, due 2023 | | | 2,278 | | | | 2,388,658 | | |
Federal National Mortgage Assn.,
Series G-8, Class E, 9.00%, due 2021 | | | 1,064 | | | | 1,169,353 | | |
Federal National Mortgage Assn.,
Series G92-44, Class ZQ, 8.00%, due 2022 | | | 1,309 | | | | 1,399,580 | | |
Federal National Mortgage Assn.,
Series G93-29, Class Z, 7.00%, due 2023 | | | 4,667 | | | | 4,910,114 | | |
| | | $ | 81,778,058 | | |
Total Mortgage Pass-Throughs
(identified cost $1,223,299,347) | | | | | | $ | 1,218,267,283 | | |
| U.S. Treasury Obligations — 0.9% | |
| Security | | Principal
Amount
(000's omitted) | | Value | |
| U.S. Treasury Bond, 7.125%, 2/15/23(4) | | $ | 6,000 | | | $ | 7,603,362 | | |
Total U.S. Treasury Obligations
(identified cost, $6,261,678) | | | | | | $ | 7,603,362 | | |
| Short-Term Investments — 0.0% | |
| Security | | Principal
Amount
(000's omitted) | | Value | |
Investors Bank and Trust Company Time Deposit,
4.03%, 11/1/05 | | $ | 105 | | | $ | 105,000 | | |
Total Short-Term Investments
(at amortized cost, $105,000) | | | | | | $ | 105,000 | | |
Total Investments — 141.5%
(identified cost $1,229,666,025) | | | | | | $ | 1,225,975,645 | | |
| Other Assets, Less Liabilities — (41.5)% | | | | | | $ | (359,702,790 | ) | |
| Net Assets — 100.0% | | | | | | $ | 866,272,855 | | |
(1) Adjustable rate mortgage.
(2) All or a portion of these securities were on loan at October 31, 2005.
(3) Floating-rate security
(4) Security (or a portion thereof) has been segregated to cover margin requirements on open financial futures contracts.
See notes to financial statements
18
Government Obligations Portfolio as of October 31, 2005
FINANCIAL STATEMENTS
Statement of Assets and Liabilities
As of October 31, 2005
| Assets | |
Investments, at value including $220,413,258 of securities on loan
(identified cost, $1,229,666,025) | | $ | 1,225,975,645 | | |
| Cash | | | 388 | | |
| Receivable for investments sold | | | 1,197,301 | | |
| Interest receivable | | | 7,007,278 | | |
| Total assets | | $ | 1,234,180,612 | | |
| Liabilities | |
| Collateral for securities loaned | | $ | 225,779,024 | | |
| Payable to affiliate for investment advisory fees | | | 525,464 | | |
| Payable for investments purchased | | | 141,345,225 | | |
| Payable for daily variation margin on open financial futures contracts | | | 7,815 | | |
| Payable to affiliate for Trustees' fees | | | 2,166 | | |
| Accrued expenses | | | 248,063 | | |
| Total liabilities | | $ | 367,907,757 | | |
| Net Assets applicable to investors' interest in Portfolio | | $ | 866,272,855 | | |
| Sources of Net Assets | |
| Net proceeds from capital contributions and withdrawals | | $ | 869,139,019 | | |
| Net unrealized depreciation (computed on the basis of identified cost) | | | (2,866,164 | ) | |
| Total | | $ | 866,272,855 | | |
Statement of Operations
For the Year Ended
October 31, 2005
| Investment Income | |
| Interest | | $ | 34,329,177 | | |
| Security lending income, net | | | 2,817,332 | | |
| Total investment income | | $ | 37,146,509 | | |
| Expenses | |
| Investment adviser fee | | $ | 6,732,172 | | |
| Trustees' fees and expenses | | | 23,697 | | |
| Custodian fee | | | 318,597 | | |
| Legal and accounting services | | | 59,399 | | |
| Interest expense | | | 23,408 | | |
| Miscellaneous | | | 12,915 | | |
| Total expenses | | $ | 7,170,188 | | |
Deduct —
Reduction of custodian fee | | $ | 346 | | |
| Total expense reductions | | $ | 346 | | |
| Net expenses | | $ | 7,169,842 | | |
| Net investment income | | $ | 29,976,667 | | |
| Realized and Unrealized Gain (Loss) | |
Net realized gain (loss) —
Investment transactions (identified cost basis) | | $ | 73,422 | | |
| Financial futures contracts | | | 199,916 | | |
| Net realized gain | | $ | 273,338 | | |
Change in unrealized appreciation (depreciation) —
Investments (identified cost basis) | | $ | (13,112,638 | ) | |
| Financial futures contracts | | | 2,132,444 | | |
| Net change in unrealized appreciation (depreciation) | | $ | (10,980,194 | ) | |
| Net realized and unrealized loss | | $ | (10,706,856 | ) | |
| Net increase in net assets from operations | | $ | 19,269,811 | | |
See notes to financial statements
19
Government Obligations Portfolio as of October 31, 2005
FINANCIAL STATEMENTS CONT'D
Statements of Changes in Net Assets
| Increase (Decrease) in Net Assets | | Year Ended
October 31, 2005 | | Period Ended
October 31, 2004(1) | | Year Ended
December 31, 2003 | |
| From operations — | |
| Net investment income | | $ | 29,976,667 | | | $ | 37,609,133 | | | $ | 40,618,952 | | |
| Net realized gain (loss) from investment transactions and financial futures contracts | | | 273,338 | | | | (6,370,748 | ) | | | (7,567,531 | ) | |
| Net change in unrealized appreciation (depreciation) from investments and financial futures contracts | | | (10,980,194 | ) | | | (5,127,037 | ) | | | (34,142,719 | ) | |
| Net increase (decrease) in net assets from operations | | $ | 19,269,811 | | | $ | 26,111,348 | | | $ | (1,091,298 | ) | |
| Capital transactions — | |
| Contributions | | $ | 180,309,793 | | | $ | 116,763,308 | | | $ | 984,539,314 | | |
| Withdrawals | | | (394,108,150 | ) | | | (603,360,924 | ) | | | (1,034,972,621 | ) | |
| Net decrease in net assets from capital transactions | | $ | (213,798,357 | ) | | $ | (486,597,616 | ) | | $ | (50,433,307 | ) | |
| Net decrease in net assets | | $ | (194,528,546 | ) | | $ | (460,486,268 | ) | | $ | (51,524,605 | ) | |
| Net Assets | |
| At beginning of year | | $ | 1,060,801,401 | | | $ | 1,521,287,669 | | | $ | 1,572,812,274 | | |
| At end of year | | $ | 866,272,855 | | | $ | 1,060,801,401 | | | $ | 1,521,287,669 | | |
(1) For the ten months ended October 31, 2004.
See notes to financial statements
20
Government Obligations Portfolio as of October 31, 2005
FINANCIAL STATEMENTS CONT'D
Statement of Cash Flows
| Increase (Decrease) in Cash | | Year Ended
October 31, 2005 | |
Cash Flows From (Used For) Operating Activities —
Purchase of investments | | $ | (204,682,931 | ) | |
| Proceeds from sales of investments and principal repayments | | | 364,665,735 | | |
| Interest received, including net securities lending income | | | 74,365,535 | | |
| Interest paid | | | (27,215 | ) | |
| Operating expenses paid | | | (6,518,087 | ) | |
| Net sale of short-term investments | | | 1,894,789 | | |
| Financial futures contracts transactions | | | 2,077,674 | | |
| Payment of collateral for securities loaned, net | | | (17,997,190 | ) | |
| Net cash from operating activities | | $ | 213,778,310 | | |
Cash Flows From (Used For) Financing Activities —
Proceeds from capital contributions | | $ | 180,309,793 | | |
| Payments for capital withdrawals | | | (394,108,150 | ) | |
| Net cash used for financing activities | | $ | (213,798,357 | ) | |
| Net decrease in cash | | $ | (20,047 | ) | |
| Cash at beginning of year | | $ | 20,435 | | |
| Cash at end of year | | $ | 388 | | |
Reconciliation of Net Increase
in Net Assets From Operations to Net Cash
From Operating Activities | |
| Net increase in net assets from operations | | $ | 19,269,811 | | |
| Decrease in receivable for investments sold | | | 720,460 | | |
| Increase in payable for investments purchased | | | 141,345,225 | | |
| Decrease in interest receivable | | | 1,136,563 | | |
| Decrease in payable for daily variation margin | | | (254,685 | ) | |
| Increase in payable to affiliate | | | 468 | | |
| Increase in accrued expenses | | | 624,072 | | |
| Decrease in collateral for securities loaned | | | (17,997,190 | ) | |
| Net decrease in investments | | | 68,933,586 | | |
| Net cash from operating activities | | $ | 213,778,310 | | |
See notes to financial statements
21
Government Obligations Portfolio as of October 31, 2005
FINANCIAL STATEMENTS CONT'D
Supplementary Data
| | | Year Ended
October 31, | | Period Ended
October 31, | | Year Ended December 31, | |
| | | 2005 | | 2004(1) | | 2003 | | 2002 | | 2001(2) | | 2000 | |
| Ratios/Supplemental Data | |
| Ratios (As a percentage of average daily net assets): | |
| Expenses | | | 0.77 | % | | | 0.75 | %(4) | | | 0.70 | % | | | 0.75 | % | | | 0.81 | % | | | 0.84 | % | |
| Expenses after custodian fee reduction | | | 0.77 | % | | | 0.75 | %(4) | | | 0.70 | % | | | 0.75 | % | | | 0.81 | % | | | 0.84 | % | |
| Interest expense | | | 0.00 | %(3) | | | 0.00 | %(3)(4) | | | 0.01 | % | | | 0.00 | %(3) | | | 0.02 | % | | | 0.02 | % | |
| Net investment income | | | 3.21 | % | | | 3.63 | %(4) | | | 2.26 | % | | | 4.41 | % | | | 5.91 | % | | | 7.77 | % | |
| Portfolio Turnover | | | 30 | % | | | 5 | % | | | 67 | % | | | 41 | % | | | 21 | % | | | 22 | % | |
| Total Return(5) | | | 2.46 | % | | | 2.23 | % | | | 0.01 | % | | | 8.24 | % | | | 9.52 | % | | | — | | |
| Net assets, end of period (000's omitted) | | $ | 866,273 | | | $ | 1,060,801 | | | $ | 1,521,288 | | | $ | 1,572,812 | | | $ | 675,520 | | | $ | 339,990 | | |
(1) For the ten-month period ended October 31, 2004.
(2) The Portfolio adopted the provisions of the revised AICPA Audit and Accounting Guide for Investment Companies and began amortizing market premium on fixed income securities. Additionally, the Portfolio reclassified net losses realized on prepayments received on mortgage-backed securities that were previously included in realized gains/losses to interest income. The effect of these changes for the year ended December 31, 2001 was a decrease in the ratio of net investment income to average net assest from 7.51% to 5.91%.
(3) Represents less than 0.01%.
(4) Annualized.
(5) Total return is required to be disclosed for fiscal years beginning after December 15, 2000. Total return is not computed on an annualized basis.
See notes to financial statements
22
Government Obligations Portfolio as of October 31, 2005
NOTES TO FINANCIAL STATEMENTS
1 Significant Accounting Policies
Government Obligations Portfolio (the Portfolio) is registered under the Investment Company Act of 1940, as amended, as a diversified open-end management investment company. The Portfolio, which was organized as a trust under the laws of the State of New York in 1992, seeks to achieve a high current return by investing primarily in mortgage-backed securities (MBS) issued, insured, guaranteed or otherwise backed by the U.S. government or its agencies or instrumentalities. The Declaration of Trust permits the Trustees to issue beneficial interests in the Portfolio. At October 31, 2005, the Eaton Vance Government Obligations Fund had a 88.8% interest in the Portfolio. The following is a summary of significant accounting policies of the Portfolio. The policies are in conformity with accounting principles generally accepted in the United States of America.
A Investment Valuation — Debt securities (including collateralized mortgage obligations and certain mortgage backed securities ("MBS")) normally are valued by independent pricing services. The pricing services consider various factors relating to bonds or loans and/or market transactions to determine market value. Most seasoned MBS are valued by the investment adviser's matrix pricing system. The matrix pricing system also considers various factors relating to bonds and market transactions to determine market value. Options are valued at last sale price on a U.S. exchange or board of trade or, in the absence of a sale, at the mean between the last bid and asked price. Financial futures contracts listed on commodity exchanges are valued at closing settlement prices. Securi ties for which there is no such quotation or valuation are valued at fair value using methods determined in good faith by or at the direction of the Trustees. Short-term obligations having remaining maturities of 60 days or less are valued at amortized cost, which approximates value.
B Income — Interest income is determined on the basis of interest accrued, adjusted for amortization of premium or accretion of discount.
C Income Taxes — The Portfolio is treated as a partnership for federal tax purposes. No provision is made by the Portfolio for federal or state taxes on any taxable income of the Portfolio because each investor in the Portfolio is ultimately responsible for the payment of any taxes. Since at least one of the Portfolio's investors is a regulated investment company that invests all or substantially all of its assets in the Portfolio, the Portfolio normally must satisfy the applicable source of income and diversification requirements (under the Code) in order for its investors to satisfy them. The Portfolio will allocate at least annually among its investors each investor's distributive share of the Port folio's net investment income, net realized capital gains, and any other items of income, gain, loss, deduction or credit.
D Expense Reduction — Investors Bank & Trust Company (IBT) serves as custodian to the Portfolio. Pursuant to the custodian agreement, IBT receives a fee reduced by credits which are determined based on the average daily cash balances the Portfolio maintains with IBT. All credit balances used to reduce the Portfolio's custodian fees are reported as a reduction of expenses on the Statement of Operations. For the year ended October 31, 2005, $346 in credit balances were used to reduce the Portfolio's custodian fee.
E Written Options — Upon the writing of a call or a put option, an amount equal to the premium received by the Portfolio is included in the Statement of Assets and Liabilities as a liability. The amount of the liability is subsequently marked-to-market to reflect the current value of the option written in accordance with the Portfolio's policies on investment valuations discussed above. Premiums received from writing options which expire are treated as realized gains. Premiums received from writing options which are exercised or are closed are added to or offset against the proceeds or amount paid on the transaction to determine the realized gain or loss. If a put option is exercised, the premium reduces the cost basis of the securities purchased by the Portfolio. The Por tfolio, as writer of an option, may have no control over whether the underlying securities may be sold (call) or purchased (put) and, as a result, bears the market risk of an unfavorable change in the price of the securities underlying the written option.
F Purchased Options — Upon the purchase of a call or put option, the premium paid by the Portfolio is included in the Statement of Assets and Liabilities as an investment. The amount of the investment is subsequently marked-to-market to reflect the current market value of the option purchased, in accordance with the Portfolio's policies on investment valuations discussed above. If an option which the Portfolio has purchased expires on the stipulated expiration date, the Portfolio will realize a loss in the amount of the cost of the option. If the Portfolio enters into a closing sale transaction, the Portfolio will realize a gain or loss, depending on whether the sales proceeds from the closing sale transaction are greater or less than the cost of the option. If a Portfoli o exercises a put option, it will realize a gain or loss from the sale of the underlying
23
Government Obligations Portfolio as of October 31, 2005
NOTES TO FINANCIAL STATEMENTS CONT'D
security, and the proceeds from such sale will be decreased by the premium originally paid. If the Portfolio exercises a call option, the cost of the security which the Portfolio purchases upon exercise will be increased by the premium originally paid.
G Financial Futures Contracts — Upon entering into a financial futures contract, the Portfolio is required to deposit an amount (initial margin) either in cash or securities equal to a certain percentage of the purchase price indicated in the financial futures contract. Subsequent payments are made or received by the Portfolio (margin maintenance) each day, dependent on the daily fluctuations in the value of the underlying securities, and are recorded for book purposes as unrealized gains or losses by the Portfolio.
If the Portfolio enters into a closing transaction, the Portfolio will realize, for book purposes, a gain or loss equal to the difference between the value of the financial futures contract to sell and the financial futures contract to buy. The Portfolio's investment in financial futures contracts is designed only to hedge against anticipated future changes in interest rates. Should interest rates move unexpectedly, the Portfolio may not achieve the anticipated benefits of the financial futures contracts and may realize a loss.
H Other — Investment transactions are accounted for on the date the securities are purchased or sold. Realized gains and losses are computed based on the specific identification of securities sold.
I Use of Estimates — The preparation of the financial statements in conformity with accounting principles generally accepted in the United States of America requires management to make estimates and assumptions that affect the reported amounts of assets and liabilities at the date of the financial statements and the reported amounts of income and expense during the reporting period. Actual results could differ from those estimates.
J Indemnifications — Under the Portfolio's organizational documents, its officers and Trustees may be indemnified against certain liabilities and expenses arising out of the performance of their duties to the Portfolio. Interestholders in the Portfolio are jointly and severally liable for the liabilities and obligations of the Portfolio in the event that the Portfolio fails to satisfy such liabilities and obligations; provided however, that, to the extent assets are available in the Portfolio, the Portfolio may, under certain circumstances, indemnify interestholders from and against any claim or liability to which such holder may become subject by reason of being or having been an interestholder in th e Portfolio. Additionally, in the normal course of business, the Portfolio enters into agreements with service providers that may contain indemnification clauses. The Portfolio's maximum exposure under these arrangements is unknown as this would involve future claims that may be made against the Portfolio that have not yet occurred.
K Statement of Cash Flows — The cash amount shown in the Statement of Cash Flows is the amount included in the Portfolio's Statement of Assets and Liabilities and represents cash on hand at its custodian and does not include any short-term investments at October 31, 2005.
2 Purchases and Sales of Investments
Purchases and sales of investments, other than short-term obligations and including paydowns, aggregated $346,028,156 and $363,945,275, respectively.
3 Investment Adviser Fee and Other Transactions with Affiliates
The investment adviser fee is earned by Boston Management and Research (BMR), a wholly-owned subsidiary of Eaton Vance Management (EVM), as compensation for management and investment advisory services rendered to the Portfolio. Under its investment advisory agreement with the Portfolio, BMR receives a fee computed at the monthly rate of 0.0625% (0.75% per annum) of the Portfolio's average daily net assets up to $500 million. On net assets of $500 million or more, BMR has contractually agreed to reduce its advisory fee as follows: 0.6875% annually on average daily net assets of $500 million but less than $1 billion; 0.6250% of average daily net assets of $1 billion but less than $1.5 billion; 0.5625% of average daily net assets of $1.5 billion but less than $2 billion; 0.5000% of average daily net assets of $2 billion but less than $2.5 billion; and 0.4375% of average daily net assets of $2.5 billion and over. These contractual f ee reductions cannot be terminated or decreased without the express consent of the Portfolio's Board of Trustees and its shareholders and are intended to continue indefinitely. For the year ended October 31, 2005, the fee was equivalent to 0.72% of the Portfolio's average net assets for such period and amounted to $6,732,172. Except as to Trustees of the Portfolio who are not members of EVM's or BMR's organization, officers and Trustees receive remuneration for their services to the Portfolio out of such investment adviser fee. Trustees of the Portfolio that are not affiliated with the Investment Adviser may elect to defer receipt of all or a percentage of their annual
24
Government Obligations Portfolio as of October 31, 2005
NOTES TO FINANCIAL STATEMENTS CONT'D
fees in accordance with the terms of the Trustees Deferred Compensation Plan. For the year ended October 31, 2005, no significant amounts have been deferred.
Certain officers and Trustees of the Portfolio are officers of the above organizations.
4 Line of Credit
The Portfolio participates with other portfolios and funds managed by BMR and EVM and its affiliates in a $150 million unsecured line of credit agreement with a group of banks. Borrowings will be made by the Portfolio solely to facilitate the handling of unusual and/or unanticipated short term cash requirements. Interest is charged to each participating portfolio or fund based on its borrowings at an amount above either the Eurodollar rate or federal funds rate. In addition, a fee computed at an annual rate of 0.10% on the daily unused portion of the line of credit is allocated among the participating portfolios and funds at the end of each quarter. The average daily loan balance for the year ended October 31, 2005 was $752,877 and the average interest rate was 3.11%.
5 Securities Lending Agreement
The Portfolio has established a securities lending agreement with brokers in which the Portfolio lends portfolio securities to a broker in exchange for collateral consisting of either cash or U.S. government securities in an amount at least equal to the market value of the securities on loan. Under the agreement, the Portfolio continues to earn interest on the securities loaned. Collateral received is generally cash, and the Portfolio invests the cash and receives any interest on the amount invested but it must also pay the broker a loan rebate fee computed as a varying percentage of the collateral received. The loan rebate fee paid by the Portfolio offsets a portion of the interest income received and amounted to $6,034,162 for the year ended October 31, 2005. At October 31, 2005, the value of the securities loaned and the value of the collateral amounted to $220,413,258 and $225,779,024, respectively. In the event of counterpa rty default, the Portfolio is subject to potential loss if it is delayed or prevented from exercising its right to dispose of the collateral. The Portfolio bears risk in the event that invested collateral is not sufficient to meet obligations due on the loans.
6 Federal Income Tax Basis of
Unrealized Appreciation (Depreciation)
The cost and unrealized appreciation (depreciation) in value of the investments owned at October 31, 2005, as computed on a federal income tax basis, were as follows:
| Aggregate cost | | $ | 1,232,418,669 | | |
| Gross unrealized appreciation | | $ | 9,606,165 | | |
| Gross unrealized depreciation | | | (16,049,189 | ) | |
| Net unrealized depreciation | | $ | (6,443,024 | ) | |
7 Financial Instruments
The Portfolio regularly trades in financial instruments with off-balance sheet risk in the normal course of its investing activities to assist in managing exposure to various market risks. These financial instruments include written options and financial futures contracts, and may involve, to a varying degree, elements of risk in excess of the amounts recognized for financial statement purposes. The notional or contractual amounts of these instruments represent the investment the Portfolio has in particular classes of financial instruments and does not necessarily represent the amounts potentially subject to risk. The measurement of the risks associated with these instruments is meaningful only when all related and offsetting transactions are considered. A summary of obligations under these financial instruments at October 31, 2005 is as follows:
| Futures Contracts | |
Expiration
Date(s) | | Contracts | | Position | | Aggregate
Cost | | Value | | Net
Unrealized
Appreciation | |
| | 12/05 | | | 500 U.S Treasury
Five Year Note | | Short | | $ | (53,769,531 | ) | | $ | (52,945,315 | ) | | $ | 824,216 | | |
At October 31, 2005, the Portfolio had sufficient cash and/or securities to cover margin requirements on any open futures contracts.
8 Fiscal Year End Change
Effective October 15, 2004 the Portfolio changed its fiscal year-end to October 31.
25
Government Obligations Portfolio as of October 31, 2005
REPORT OF INDEPENDENT REGISTERED PUBLIC ACCOUNTING FIRM
To the Trustees and Shareholders
of Government Obligations Portfolio:
In our opinion, the accompanying statement of assets and liabilities, including the portfolio of investments, and the related statements of operations, changes in net assets and of cash flows and the supplementary data present fairly, in all material respects, the financial position of Government Obligations Portfolio (the "Portfolio") at October 31, 2005, and the results of its operations, the changes in its net assets, its cash flows and the supplementary data for the periods indicated, in conformity with accounting principles generally accepted in the United States of America. These financial statements and supplementary data (hereafter referred to as "financial statements") are the responsibility of the Portfolio's management; our responsibility is to express an opinion on these financial statements based on our audits. We conducted our audits of these financial statements in accordance with standards of the Public Company A ccounting Oversight Board (United States). Those standards require that we plan and perform the audit to obtain reasonable assurance about whether the financial statements are free of material misstatement. An audit includes examining, on a test basis, evidence supporting the amounts and disclosures in the financial statements, assessing the accounting principles used and significant estimates made by management, and evaluating the overall financial statement presentation. We believe that our audits, which included confirmation of securities at October 31, 2005 by correspondence with the custodian and brokers, provide a reasonable basis for our opinion.
PricewaterhouseCoopers LLP
Boston, Massachusetts
December 23, 2005
26
Eaton Vance Government Obligations Fund
BOARD OF TRUSTEES' ANNUAL APPROVAL OF THE INVESTMENT ADVISORY AGREEMENT
The investment advisory agreement between Government Obligations Portfolio (the "Portfolio") and its investment adviser, Boston Management and Research, provides that the advisory agreement will continue in effect from year to year so long as its continuance is approved at least annually (i) by a vote of a majority of the noninterested Trustees of the Portfolio cast in person at a meeting called for the purpose of voting on such approval and (ii) by the Trustees of the Portfolio or by vote of a majority of the outstanding interests of the Portfolio.
In considering the annual approval of the investment advisory agreement between the Portfolio and its investment adviser, the Special Committee of the Board of Trustees considered information that had been provided throughout the year at regular Board meetings, as well as information furnished for a series of meetings held in February and March in preparation for a Board meeting held on March 21, 2005 to specifically consider the renewal of the investment advisory agreement. Such information included, among other things, the following:
• An independent report comparing the advisory fees of the Portfolio with those of comparable funds;
• An independent report comparing the expense ratio of the Eaton Vance Government Obligations Fund (the "Fund") to those of comparable funds;
• Information regarding Fund investment performance in comparison to a relevant peer group of funds and appropriate indices;
• The economic outlook and the general investment outlook in relevant investment markets;
• Eaton Vance Management's ("Eaton Vance") results and financial condition and the overall organization of the investment adviser;
• The procedures and processes used to determine the fair value of Fund assets including in particular the use of valuation by matrix pricing and actions taken to monitor and test the effectiveness of such procedures and processes;
• Eaton Vance's management of the relationship with the custodian, subcustodians and fund accountants;
• The resources devoted to compliance efforts undertaken by Eaton Vance on behalf of the funds it manages and the record of compliance with the investment policies and restrictions and with policies on personal securities transactions;
• The quality, nature, cost and character of the administrative and other non-investment management services provided by Eaton Vance and its affiliates; and
• The terms of the advisory agreement and the reasonableness and appropriateness of the particular fee paid by the Portfolio for the services described therein.
The Special Committee also considered the investment adviser's portfolio management capabilities, including information relating to the education, experience and number of investment professionals and other personnel who provide services under the investment advisory agreement. The Special Committee noted the benefits of the investment adviser's extensive in-house research capabilities and the other resources available to the investment adviser. The Special Committee also took into account the time and attention to be devoted by senior management to the Portfolio and the other funds in the complex. The Special Committee evaluated the level of skill required to manage the Portfolio and concluded that the human resources available at the investment adviser were appropriate to fulfill effectively its duties on behalf of the Portfolio.
In its review of comparative information with respect to Fund investment performance, the Special Committee concluded that the Fund has performed within a range that the Special Committee deemed competitive. With respect to its review of investment advisory fees paid by the Portfolio and the Fund's expense ratio, the Special Committee concluded that, taking into account the impact of the Portfolio's use of leverage, the fees paid by the Portfolio and the Fund's expense ratio are reasonable.
In addition to the factors mentioned above, the Special Committee reviewed the level of the investment adviser's profits in providing investment management services for the Portfolio and for all Eaton Vance funds as a group. The Special Committee also reviewed the benefits to Eaton Vance and its affiliates in providing administration services for the Fund and for all Eaton Vance funds as a group. In addition, the Special Committee considered the fiduciary duty assumed by the investment adviser in connection with the services rendered to the Portfolio and the business reputation of the investment adviser and its financial resources. The Trustees concluded that in light of the services rendered, the profits realized by the investment adviser are not unreasonable. The Special Committee also considered the extent to which the investment adviser appears to be realizing benefits from economies of scale in managing the Portfolio, and c oncluded that the fee breakpoints which are in place will allow for an equitable sharing of such benefits, when realized, with the Portfolio and the shareholders of the Fund.
27
Eaton Vance Government Obligations Fund
BOARD OF TRUSTEES' ANNUAL APPROVAL OF THE INVESTMENT ADVISORY AGREEMENT CONT'D
The Special Committee did not consider any single factor as controlling in determining whether or not to renew the investment advisory agreement. Nor are the items described herein all the matters considered by the Special Committee. In assessing the information provided by Eaton Vance and its affiliates, the Special Committee also took into consideration the benefits to shareholders of investing in a fund that is a part of a large family of funds which provides a large variety of shareholder services.
Based on its consideration of the foregoing factors and conclusions, and such other factors and conclusions as it deemed relevant, and assisted by independent counsel, the Special Committee concluded that the renewal of the investment advisory agreement, including the fee structure, is in the interests of shareholders.
28
Eaton Vance Government Obligations Fund
MANAGEMENT AND ORGANIZATION
Fund Management. The Trustees of Eaton Vance Mutual Funds Trust (the Trust) and Government Obligations Portfolio (the Portfolio) are responsible for the overall management and supervision of the Trust's and Portfolio's affairs. The Trustees and officers of the Trust and the Portfolio are listed below. Except as indicated, each individual has held the office shown or other offices in the same company for the last five years. Trustees and officers of the Trust and the Portfolio hold indefinite terms of office. The "noninterested Trustees" consist of those Trustees who are not "interested persons" of the Trust and the Portfolio, as that term is defined under the 1940 Act. The business address of each Trustee and officer is The Eaton Vance Building, 255 State Street, Boston, Massachusetts 02109. As used below, "EVC" refers to Eaton Vance Corp., "EV" refers to Ea ton Vance, Inc., "EVM" refers to Eaton Vance Management, "BMR" refers to Boston Management and Research and "EVD" refers to Eaton Vance Distributors, Inc. EVC and EV are the corporate parent and trustee, respectively, of EVM and BMR. EVD is the Fund's principal underwriter, the Portfolio's placement agent and a wholly-owned subsidiary of EVM. Each officer affiliated with Eaton Vance may hold a position with other Eaton Vance affiliates that is comparable to its position with EVM listed below.
Name and
Date of Birth | | Position(s)
with the
Trust and
the Portfolio | | Term of
Office and
Length of
Service | | Principal Occupation(s)
During Past Five Years | | Number of Portfolios
in Fund Complex
Overseen By
Trustee(1) | | Other Directorships Held | |
| Interested Trustee | | | | | | | | | | | | | |
|
| James B. Hawkes 11/9/41 | | Trustee | | Trustee of the Trust since 1991; of the Portfolio since 1992 | | Chairman, President and Chief Executive Officer of BMR, EVC, EVM and EV; Director of EV; Vice President and Director of EVD. Trustee and/or officer of 161 registered investment companies in the Eaton Vance Fund Complex. Mr. Hawkes is an interested person because of his positions with BMR, EVM, EVC and EV, which are affiliates of the Fund and the Portfolio. | | | 161 | | | Director of EVC | |
|
| Noninterested Trustee(s) | | | | | | | | | | | | | |
|
| Benjamin C. Esty 1/2/63 | | Trustee | | Since 2005 | | Professor, Harvard University Graduate School of Business Administration (since 2003). Formerly, Associate Professor, Harvard University Graduate School of Business Administration (2000-2003). | | | 152 | | | None | |
|
| Samuel L. Hayes, III 2/23/35 | | Trustee | | Trustee of the Trust since 1986; of the Portfolio since 1993 and Chairman of the Board since 2005 | | Jacob H. Schiff Professor of Investment Banking Emeritus, Harvard University Graduate School of Business Administration. | | | 161 | | | Director of Tiffany & Co. (specialty retailer) and Telect, Inc. (telecommunication services company) | |
|
| William H. Park 9/19/47 | | Trustee | | Since 2003 | | President and Chief Executive Officer, Prizm Capital Management, LLC (investment management firm) (since 2002). Executive Vice President and Chief Financial Officer, United Asset Management Corporation (a holding company owning institutional investment management firms) (1982-2001). | | | 161 | | | None | |
|
| Ronald A. Pearlman 7/10/40 | | Trustee | | Since 2003 | | Professor of Law, Georgetown University Law Center (since 1999). Tax Partner, Covington & Burling, Washington, DC (1991-2000). | | | 161 | | | None | |
|
29
Eaton Vance Government Obligations Fund
MANAGEMENT AND ORGANIZATION CONT'D
Name and
Date of Birth | | Position(s)
with the
Trust and
the Portfolio | | Term of
Office and
Length of
Service | | Principal Occupation(s)
During Past Five Years | | Number of Portfolios
in Fund Complex
Overseen By
Trustee(1) | | Other Directorships Held | |
| Noninterested Trustee(s) (continued) | | | | | | | | | | | | | |
|
| Norton H. Reamer 9/21/35 | | Trustee | | Trustee of the Trust since 1986; of the Portfolio since 1993 | | President, Chief Executive Officer and a Director of Asset Management Finance Corp. (a specialty finance company serving the investment management industry) (since October 2003). President, Unicorn Corporation (an investment and financial advisory services company) (since September 2000). Formerly, Chairman, Hellman, Jordan Management Co., Inc. (an investment management company) (2000-2003). Formerly, Advisory Director of Berkshire Capital Corporation (investment banking firm) (2002-2003). Formerly Chairman of the Board, United Asset Management Corporation (a holding company owning institutional investment management firms) and Chairman, President and Director, UAM Funds (mutual funds) (1980-2000). | | | 161 | | | None | |
|
| Lynn A. Stout 9/14/57 | | Trustee | | Since 1998 | | Professor of Law, University of California at Los Angeles School of Law (since July 2001). Formerly, Professor of Law, Georgetown University Law Center. | | | 161 | | | None | |
|
| Ralph F. Verni 1/26/43 | | Trustee | | Since 2005 | | Consultant and private investor (since 2000). Formerly, President and Chief Executive Officer, Redwood Investment Systems, Inc. (software developer) (2000). Formerly, President and Chief Executive Officer, State Street Research & Management (investment advisor), SSRM Holdings (parent of State Street Research & Management), and SSR Realty (institutional realty manager) (1992-2000). | | | 152 | | | Director of W.P. Carey & Company LLC (manager of real estate investment trusts) | |
|
| Principal Officers who are not Trustees | | | | | | | |
|
Name and
Date of Birth | | Position(s)
with the
Trust and
the Portfolio | | Term of
Office and
Length of
Service | | Principal Occupation(s)
During Past Five Years | |
| Thomas E. Faust Jr. 5/31/58 | | President of the Trust | | Since 2002 | | Executive Vice President of EVM, BMR, EVC and EV; Chief Investment Officer of EVM and BMR and Director of EVC. Chief Executive Officer of Belair Capital Fund LLC, Belcrest Capital Fund LLC, Belmar Capital Fund LLC, Belport Capital Fund LLC and Belrose Capital Fund LLC (private investment companies sponsored by EVM). Officer of 65 registered investment companies managed by EVM or BMR. | |
|
| William H. Ahern, Jr. 7/28/59 | | Vice President of the Trust | | Since 1995 | | Vice President of EVM and BMR. Officer of 70 registered investment companies managed by EVM or BMR | |
|
| Cynthia J. Clemson 3/2/63 | | Vice President of the Trust | | Since 2005 | | Vice President of EVM and BMR. Officer of 85 registered investment companies managed by EVM or BMR. | |
|
| Kevin S. Dyer 2/21/75 | | Vice President of the Trust | | Since 2005 | | Assistant Vice president of EVM and BMR. Officer of 24 registered investment companies managed by EVM or BMR. | |
|
| Aamer Khan 6/7/60 | | Vice President of the Trust | | Since 2005 | | Vice President of EVM and BMR. Officer of 27 registered investment companies managed by EVM or BMR. | |
|
| Michael R. Mach 7/15/47 | | Vice President of the Trust | | Since 1999 | | Vice President of EVM and BMR. Officer of 32 registered investment companies managed by EVM or BMR. | |
|
| Robert B MacIntosh 1/22/57 | | Vice President of the Trust | | Since 1998 | | Vice President of EVM and BMR. Officer of 85 registered investment companies managed by EVM or BMR. | |
|
30
Eaton Vance Government Obligations Fund
MANAGEMENT AND ORGANIZATION CONT'D
Name and
Date of Birth | | Position(s)
with the
Trust and
the Portfolio | | Term of
Office and
Length of
Service | | Principal Occupation(s)
During Past Five Years | |
| Principal Officers who are not Trustees (continued) | | | | | | | |
|
| Duncan W. Richardson 10/26/57 | | Vice President of the Trust | | Since 2001 | | Senior Vice President and Chief Equity Investment Officer of EVM and BMR. Officer of 51 registered investment companies managed by EVM or BMR. | |
|
| Walter A. Row, III 7/20/57 | | Vice President of the Trust | | Since 2001 | | Director of Equity Research and a Vice President of EVM and BMR. Officer of 31 registered investment companies managed by EVM or BMR. | |
|
| Judith A. Saryan 8/21/54 | | Vice President of the Trust | | Since 2003 | | Vice President of EVM and BMR. Officer of 33 registered investment companies managed by EVM or BMR. | |
|
| Susan Schiff 3/13/61 | | Vice President | | Vice President of the Trust since 2002; of the Portfolio since 1993 | | Vice President of EVM and BMR. Officer of 29 registered investment companies managed by EVM or BMR. | |
|
| Mark Venezia 5/23/49 | | President of the Portfolio | | Since 2002(2) | | Vice President of EVM and BMR. Officer of 5 registered investment companies managed by EVM or BMR. | |
|
| Barbara E. Campbell 6/19/57 | | Treasurer | | Treasurer of the Trust since 2005(3); of the Portfolio since 2002(2) | | Vice President of EVM and BMR. Officer of 161 registered investment companies managed by EVM or BMR. | |
|
| Alan R. Dynner 10/10/40 | | Secretary | | Since 1997 | | Vice President, Secretary and Chief Legal Officer of BMR, EVM, EVD, EV and EVC. Officer of 161 registered investment companies managed by EVM or BMR. | |
|
| Paul M. O'Neil 7/11/53 | | Chief Compliance Officer | | Since 2004 | | Vice President of EVM and BMR. Officer of 161 registered investment companies managed by EVM or BMR. | |
|
(1) Includes both master and feeder funds in a master-feeder structure.
(2) Prior to 2002, Mr. Venezia served as Vice President of the Portfolio since 1993 and Ms. Campbell served as Assistant Treasurer of the Portfolio since 1998.
(3) Prior to 2005, Ms. Campbell served as Assistant Treasurer of the Trust since 1995.
The SAI for the Fund includes additional information about the Trustees and officers of the Fund and the Portfolio and can be obtained without charge by calling 1-800-225-6265.
31
This Page Intentionally Left Blank
This Page Intentionally Left Blank
Investment Adviser of Government Obligations Portfolio
Boston Management and Research
The Eaton Vance Building
255 State Street
Boston, MA 02109
Administrator of Eaton Vance Government Obligations Fund
Eaton Vance Management
The Eaton Vance Building
255 State Street
Boston, MA 02109
Principal Underwriter
Eaton Vance Distributors, Inc.
The Eaton Vance Building
255 State Street
Boston, MA 02109
(617) 482-8260
Custodian
Investors Bank & Trust Company
200 Clarendon Street
Boston, MA 02116
Transfer Agent
PFPC Inc.
Attn: Eaton Vance Funds
P.O. Box 9653
Providence, RI 02940-9653
(800) 262-1122
Independent Registered Public Accounting Firm
PricewaterhouseCoopers LLP
125 High Street
Boston, MA 02110
Eaton Vance Government Obligations Fund
The Eaton Vance Building
255 State Street
Boston, MA 02109
This report must be preceded or accompanied by a current prospectus. Before investing, investors should consider carefully the Fund's investment objective, risks, and charges and expenses. The Fund's current prospectus contains this and other information about the Fund and is available through your financial advisor. Please read the prospectus carefully before you invest or send money. For further information please call 1-800-225-6265.
140-12/05 GOSRC

Annual Report October 31, 2005


EATON VANCE
HIGH
INCOME
FUND
IMPORTANT NOTICES REGARDING PRIVACY,
DELIVERY OF SHAREHOLDER DOCUMENTS,
PORTFOLIO HOLDINGS AND PROXY VOTING
Privacy. The Eaton Vance organization is committed to ensuring your financial privacy. Each of the financial institutions identified below has in effect the following policy ("Privacy Policy") with respect to nonpublic personal information about its customers:
• Only such information received from you, through application forms or otherwise, and information about your Eaton Vance fund transactions will be collected. This may include information such as name, address, social security number, tax status, account balances and transactions.
• None of such information about you (or former customers) will be disclosed to anyone, except as permitted by law (which includes disclosure to employees necessary to service your account). In the normal course of servicing a customer's account, Eaton Vance may share information with unaffiliated third parties that perform various required services such as transfer agents, custodians and broker/dealers.
• Policies and procedures (including physical, electronic and procedural safeguards) are in place that are designed to protect the confidentiality of such information.
• We reserve the right to change our Privacy Policy at any time upon proper notification to you. Customers may want to review our Policy periodically for changes by accessing the link on our homepage: www.eatonvance.com.
Our pledge of privacy applies to the following entities within the Eaton Vance organization: the Eaton Vance Family of Funds, Eaton Vance Management, Eaton Vance Investment Counsel, Boston Management and Research, and Eaton Vance Distributors, Inc.
In addition, our Privacy Policy only applies to those Eaton Vance customers who are individuals and who have a direct relationship with us. If a customer's account (i.e. fund shares) is held in the name of a third-party financial adviser/broker-dealer, it is likely that only such adviser's privacy policies apply to the customer. This notice supersedes all previously issued privacy disclosures.
For more information about Eaton Vance's Privacy Policy, please call 1-800-262-1122.
Delivery of Shareholder Documents. The Securities and Exchange Commission (the "SEC") permits funds to deliver only one copy of shareholder documents, including prospectuses, proxy statements and shareholder reports, to fund investors with multiple accounts at the same residential or post office box address. This practice is often called "householding" and it helps eliminate duplicate mailings to shareholders.
Eaton Vance, or your financial adviser, may household the mailing of your documents indefinitely unless you instruct Eaton Vance, or your financial adviser, otherwise.
If you would prefer that your Eaton Vance documents not be householded, please contact Eaton Vance at 1-800-262-1122, or contact your financial adviser.
Your instructions that householding not apply to delivery of your Eaton Vance documents will be effective within 30 days of receipt by Eaton Vance or your financial adviser.
Portfolio Holdings. Each Eaton Vance Fund and Portfolio (if applicable) will file a schedule of its portfolio holdings on Form N-Q with the SEC for the first and third quarters of each fiscal year. The Form N-Q will be available on the Eaton Vance website www.eatonvance.com, by calling Eaton Vance at 1-800-262-1122 or in the EDGAR database on the SEC's website at www.sec.gov. Form N-Q may also be reviewed and copied at the SEC's public reference room in Washington, D.C. (call 1-800-732-0330 for information on the operation of the public reference room).
Proxy Voting. From time to time, funds are required to vote proxies related to the securities held by the funds. The Eaton Vance Funds or their underlying Portfolios (if applicable) vote proxies according to a set of policies and procedures approved by the Funds' and Portfolios' Boards. You may obtain a description of these policies and procedures and information on how the Funds or Portfolios voted proxies relating to Portfolio securities during the most recent 12 month period ended June 30, without charge, upon request, by calling 1-800-262-1122. This description is also available on the SEC's website at www.sec.gov.
Eaton Vance High Income Fund as of October 31, 2005
MANAGEMENT’S DISCUSSION OF FUND PERFORMANCE
The Fund
Performance for the Past Year
• The Fund’s Class A shares had a total return of 6.01% for the year ended October 31, 2005.(1) This return resulted from a decrease in net asset value per share (NAV) to $5.10 on October 31, 2005 from $5.21 on October 31, 2004, and the reinvestment of $0.417 in dividends.
• The Fund’s Class B shares had a total return of 5.34% for the year ended October 31, 2005.(1) This return resulted from a decrease in NAV to $5.08 on October 31, 2005 from $5.20 on October 31, 2004, and the reinvestment of $0.393 in dividends.
• The Fund’s Class C shares had a total return of 5.32% for the year ended October 31, 2005.(1) This return resulted from a decrease in NAV to $5.08 on October 31, 2005 from $5.20 on October 31, 2004, and the reinvestment of $0.386 in dividends. The Class C NAVs and dividends per share have been restated to reflect the effects of a stock split effective on November 11, 2005.
• In comparison, the Merrill Lynch U.S. High Yield Master II Index – an unmanaged index of below-investment-grade U.S. dollar-denominated corporatebonds publicly issued in the U.S. domestic market–had a return of 3.92% for the year ended October 31, 2005.(2)
• Based on the Fund’s most recent dividends and NAVs (restated for Class C to reflect the effects of a stock split effective on November 11, 2005) on October 31, 2005 of $5.10 per share for Class A, $5.08 for Class B and $5.08 for Class C, the Fund’s distribution rates were 8.10%, 7.32% and 7.33%, respectively.(3) The SEC 30-day yields for Class A, Class B and Class C were 6.90%, 6.49% and 6.49%, respectively.(4)
Recent Fund Developments
• The high-yield market was marked by significant volatility during the fiscal year. The market rallied strongly in the first half of the fiscal year, as low default rates and a better economic outlook pushed high-yield credit spreads as low as 290 basis points (2.90%) over Treasuries. The market declined in March, however, due to a downgrade of Ford Motor Co. and General Motors Corp. bonds and concerns about surging energy costs, with spreads rising to 425 basis points (4.25%). The market improved during the summer and into the fall, despite concerns about Hurricane Katrina and high fuel costs, as spreads fell to 360 basis points (3.60%) at October 31, 2005.
• Amid relatively flat yield and credit curves, management maintained a defensive posture for much of the fiscal year. The Fund had a short duration – 3.5 years at October 31, 2005 versus 4.5 years for the Index. The Fund achieved a shorter duration by increasing its exposure to shorter duration, shorter maturity bonds, as well as by increasing its investments in floating-rate notes. Short-maturity, floating-rate notes responded positively to the increase in short-term interest rates. In addition, the Fund increased its focus on debt more senior in the capital structure, such as senior notes and senior secured notes.
• The Fund’s performance was positively impacted by its investments in the telecom sector. The wireless industry has become more seasoned in recent years with the completion of network build-outs and, with that spending behind them, the companies have generated rising free cash flow. The industry has also been characterized recently by increasing consolidation. Other strong performers included gaming companies and health care providers. Some health care companies have benefited from improving margins and increased market share.
• Management underweighted paper and packaging companies, which were among the Portfolio’s lagging performers. These companies suffered from the increasing impact of higher raw material costs and rising fuel costs. The companies felt the pinch of higher energy prices in their manufacturing processes, as well in transportation costs.
The views expressed throughout this report are those of the portfolio managers and are current only through the end of the period of the report as stated on the cover. These views are subject to change at any time based upon market or other conditions, and the investment adviser disclaims any responsibility to update such views. These views may not be relied on as investment advice and, because investment decisions for a fund are based on many factors, may not be relied on as an indication of trading intent on behalf of any Eaton Vance fund.
Past performance is no guarantee of future results. Returns are historical and are calculated by determining the percentage change in net asset value or offering price (as applicable) with all distributions reinvested. Investment return and principal value will fluctuate so that shares, when redeemed, may be worth more or less than their original cost. Performance is for the stated time period only; due to market volatility, the Fund’s current performance may be lower or higher than the quoted return. For performance as of the most recent month-end, please refer to www.eatonvance.com.
(1) These returns do not include the 4.75% maximum sales charge for the Fund’s Class A shares or the applicable contingent deferred sales charges (CDSC) for Class B shares and Class C shares. If sales charges were deducted, returns would be lower.
(2) It is not possible to invest directly in an Index. The Index’s total return does not reflect the expenses that would have been incurred if an investor individually purchased or sold the securities represented in the Index.
(3) The Fund’s distribution rate represents actual distributions paid to shareholders and is calculated daily by dividing the last distribution per share (annualized) by the net asset value.
(4) The Fund’s SEC yield is calculated by dividing the net investment income per share for the 30-day period by the offering price at the end of the period and annualizing the result.
Fund shares are not insured by the FDIC and are not deposits or other obligations of, or guaranteed by, any depository institution. Shares are subject to investment risks, including possible loss of principal invested.
2
Eaton Vance High Income Fund as of October 31, 2005
FUND PERFORMANCE
The line graph and table set forth below provide information about the Fund’s performance. The line graph compares the performance of Class B of the Fund with that of the Merrill Lynch U.S. High Yield Master II Index, an unmanaged market index of below-investment-grade U.S. dollar-denominated corporate bonds publicly issued in the U.S. domestic market. The lines on the graph represent the total returns of a hypothetical investment of $10,000 in each of Class B of the Fund and the Merrill Lynch U.S. High Yield Master II Index. The table includes the total returns of each Class of the Fund at net asset value and public offering price. The performance presented below does not reflect the deduction of taxes, if any, that a shareholder would pay on Fund distributions or the redemption of Fund shares.
Performance(1) | | Class A | | Class B | | Class C | |
| | | | | | | |
Average Annual Total Returns (at net asset value) | | | | | | | |
One Year | | 6.01 | % | 5.34 | % | 5.32 | % |
Five Years | | N.A. | | 5.81 | | 5.82 | |
Ten Years | | N.A. | | 6.30 | | 6.27 | |
Life of Fund† | | 6.87 | | 7.36 | | 6.22 | |
| | | | | | | |
SEC Average Annual Total Returns (including sales charge or applicable CDSC) | | | | | | | |
One Year | | 0.97 | % | 0.45 | % | 4.35 | % |
Five Years | | N.A. | | 5.55 | | 5.82 | |
Ten Years | | N.A. | | 6.30 | | 6.27 | |
Life of Fund† | | 3.76 | | 7.36 | | 6.22 | |
† Inception dates: Class A: 3/11/04; Class B: 8/19/86; Class C: 6/8/94
(1) Average annual total returns do not include the 4.75% maximum sales charge for Class A shares or the applicable contingent deferred sales charges (CDSC) for Class B or Class C shares. If sales charges were deducted, returns would be lower. SEC returns for Class A reflect the maximum 4.75% sales charge. SEC returns for Class B reflect applicable CDSC based on the following schedule: 5% - 1st and 2nd years; 4% - 3rd year; 3% - 4th year; 2% - 5th year; 1% - 6th year. SEC 1-Year return for Class C reflects 1% CDSC. Class A shares redeemed or exchanged within three months of settlement of purchase are subject to a 1% redemption fee.
Comparison of Change in the Value of a $10,000 Investment in Eaton Vance High Income Fund Class B vs Merrill Lynch U.S. High Yield Master II Index *
October 31, 1995 – October 31, 2005
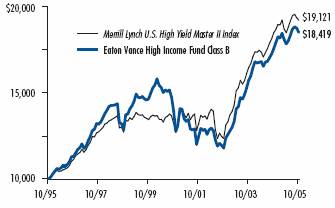
* Sources: Thomson Financial; Bloomberg, L.P. Class B of the Fund commenced operations on 8/19/86.
A $10,000 hypothetical investment at net asset value in Class A on 3/11/04 and Class C on 10/31/95 of the Fund would have been valued at $11,152 and $18,362, respectively, on 10/31/05. A $10,000 hypothetical investment in Class A shares of the Fund at maximum offering price would have been valued at $10,624. It is not possible to invest directly in an Index. The Index’s total return does not reflect the expenses that would have been incurred if an investor individually purchased or sold the securities represented in the Index.
Portfolio Credit Quality Ratings(2)
By total investments
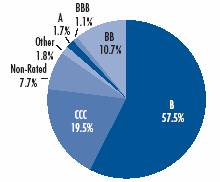
(2) Credit Quality ratings are those provided by Standard & Poor’s, a nationally recognized bond rating service. Reflects the Portfolio’s investments as of October 31, 2005. Portfolio information may not be representative of the Portfolio’s current or future investments and may change due to active management.
Past performance is no guarantee of future results. Returns are historical and are calculated by determining the percentage change in net asset value or offering price (as applicable) with all distributions reinvested. Investment return and principal value will fluctuate so that shares, when redeemed, may be worth more or less than their original cost. Performance is for the stated time period only; due to market volatility, the Fund’s current performance may be lower or higher than the quoted return. For performance as of the most recent month end, please refer to www.eatonvance.com.
3
Eaton Vance High Income Fund as of October 31, 2005
FUND EXPENSES
Example: As a shareholder of the Fund, you incur two types of costs: (1) transaction costs, including sales charges (loads) on purchases and redemption fees (if applicable); and (2) ongoing costs, including management fees; distribution or service fees; and other Fund expenses. This Example is intended to help you understand your ongoing costs (in dollars) of investing in the Fund and to compare these costs with the ongoing costs of investing in other mutual funds. The Example is based on an investment of $1,000 invested at the beginning of the period and held for the entire period (May 1, 2005 – October 31, 2005).
Actual Expenses: The first section of the table below provides information about actual account values and actual expenses. You may use the information in this section, together with the amount you invested, to estimate the expenses that you paid over the period. Simply divide your account value by $1,000 (for example, an $8,600 account value divided by $1,000 = 8.6), then multiply the result by the number in the first line under the heading entitled “Expenses Paid During Period” to estimate the expenses you paid on your account during this period.
Hypothetical Example for Comparison Purposes: The second section of the table below provides information about hypothetical account values and hypothetical expenses based on the Fund’s actual expense ratios and an assumed rate of return of 5% per year before expenses, which is not the actual return of the Fund. The hypothetical account values and expenses may not be used to estimate the actual ending account balance or expenses you paid for the period. You may use this information to compare the ongoing costs of investing in the Fund and other funds. To do so, compare this 5% hypothetical example with the 5% hypothetical examples that appear in the shareholder reports of the other funds.
Please note that the expenses shown in the table are meant to highlight your ongoing costs only and do not reflect any transactional costs, such as sales charges (loads) or redemption fees (if applicable). Therefore, the second section of the table is useful in comparing ongoing costs only, and will not help you determine the relative total costs of owning different funds. In addition, if these transactional costs were included, your costs would have been higher.
Eaton Vance High Income Fund
| | Beginning Account Value | | Ending Account Value | | Expenses Paid During Period* | |
| | (5/1/05) | | (10/31/05) | | (5/1/05 – 10/31/05) | |
| | | | | | | |
Actual | | | | | | | |
Class A | | $ | 1,000.00 | | $ | 1,043.20 | | $ | 5.05 | |
Class B | | $ | 1,000.00 | | $ | 1,037.20 | | $ | 8.88 | |
Class C | | $ | 1,000.00 | | $ | 1,038.80 | | $ | 8.89 | |
| | | | | | | |
Hypothetical | | | | | | | |
(5% return before expenses) | | | | | | | |
Class A | | $ | 1,000.00 | | $ | 1,020.30 | | $ | 4.99 | |
Class B | | $ | 1,000.00 | | $ | 1,016.50 | | $ | 8.79 | |
Class C | | $ | 1,000.00 | | $ | 1,016.50 | | $ | 8.79 | |
* Expenses are equal to the Fund’s annualized expense ratio of 0.98% for Class A shares, 1.73% for Class B shares and 1.73% for Class C shares, multiplied by the average account value over the period, multiplied by 184/365 (to reflect the one-half-year period). The example assumes that the $1,000 was invested at the net asset value per share determined at the close of business on April 30, 2005. The Example reflects the expenses of both the Fund and the Portfolio.
4
Eaton Vance High Income Fund as of October 31, 2005
FINANCIAL STATEMENTS
Statement of Assets and Liabilities
As of October 31, 2005
| Assets | |
Investment in High Income Portfolio, at value
(identified cost, $702,928,807) | | $ | 728,108,536 | | |
| Receivable for Fund shares sold | | | 743,768 | | |
| Total assets | | $ | 728,852,304 | | |
| Liabilities | |
| Dividends payable | | $ | 2,692,406 | | |
| Payable for Fund shares redeemed | | | 1,817,646 | | |
| Payable to affiliate for distribution and service fees | | | 516,648 | | |
| Payable to affiliate for Trustees' fees | | | 311 | | |
| Accrued expenses | | | 209,426 | | |
| Total liabilities | | $ | 5,236,437 | | |
| Net Assets | | $ | 723,615,867 | | |
| Sources of Net Assets | |
| Paid-in capital | | $ | 1,105,834,336 | | |
Accumulated net realized loss from Portfolio (computed on the basis of
identified cost) | | | (404,681,481 | ) | |
| Accumulated distributions in excess of net investment income | | | (2,716,717 | ) | |
Net unrealized appreciation from Portfolio (computed on the basis of
identified cost) | | | 25,179,729 | | |
| Total | | $ | 723,615,867 | | |
| Class A Shares | |
| Net Assets | | $ | 165,125,433 | | |
| Shares Outstanding | | | 32,396,579 | | |
Net Asset Value and Redemption Price Per Share
(net assets ÷ shares of beneficial interest outstanding) | | $ | 5.10 | | |
Maximum Offering Price Per Share
(100 ÷ 95.25 of $5.10) | | $ | 5.35 | | |
| Class B Shares | |
| Net Assets | | $ | 370,035,948 | | |
| Shares Outstanding | | | 72,798,705 | | |
Net Asset Value, Offering Price and Redemption Price Per Share
(net assets ÷ shares of beneficial interest outstanding) | | $ | 5.08 | | |
| Class C Shares | |
| Net Assets | | $ | 188,454,486 | | |
| Shares Outstanding | | | 37,084,025 | (1) | |
Net Asset Value, Offering Price and Redemption Price Per Share
(net assets ÷ shares of beneficial interest outstanding) | | $ | 5.08 | | |
| On sales of $25,000 or more, the offering price of Class A shares is reduced. | |
(1) Shares outstanding have been restated to reflect the effects of a stock split effective on November 11, 2005 (Note 8).
Statement of Operations
For the Year Ended
October 31, 2005
| Investment Income | |
| Interest allocated from Portfolio | | $ | 68,092,643 | | |
| Dividends allocated from Portfolio | | | 323,915 | | |
| Miscellaneous income allocated from Portfolio | | | 1,293,228 | | |
| Expenses allocated from Portfolio | | | (4,661,298 | ) | |
| Net investment income from Portfolio | | $ | 65,048,488 | | |
| Expenses | |
| Trustees' fees and expenses | | $ | 3,263 | | |
Distribution and service fees
Class A | | | 398,540 | | |
| Class B | | | 4,267,835 | | |
| Class C | | | 2,175,275 | | |
| Transfer and dividend disbursing agent fees | | | 829,025 | | |
| Printing and postage | | | 145,781 | | |
| Registration fees | | | 63,984 | | |
| Legal and accounting services | | | 35,591 | | |
| Custodian fee | | | 35,149 | | |
| Miscellaneous | | | 33,904 | | |
| Total expenses | | $ | 7,988,347 | | |
| Net investment income | | $ | 57,060,141 | | |
Realized and Unrealized
Gain (Loss) from Portfolio | |
Net realized gain (loss) —
Investment transactions (identified cost basis) | | $ | 18,195,580 | | |
| Swap contracts | | | (7,960 | ) | |
Foreign currency and forward foreign currency exchange
contract transactions | | | 79,052 | | |
| Net realized gain | | $ | 18,266,672 | | |
Change in unrealized appreciation (depreciation) —
Investments (identified cost basis) | | $ | (32,993,124 | ) | |
| Swap contracts | | | 166,800 | | |
| Foreign currency and forward foreign currency exchange contracts | | | 11,407 | | |
| Net change in unrealized appreciation (depreciation) | | $ | (32,814,917 | ) | |
| Net realized and unrealized loss | | $ | (14,548,245 | ) | |
| Net increase in net assets from operations | | $ | 42,511,896 | | |
See notes to financial statements
5
Eaton Vance High Income Fund as of October 31, 2005
FINANCIAL STATEMENTS CONT'D
Statements of Changes in Net Assets
Increase (Decrease)
in Net Assets | | Year Ended
October 31, 2005 | | Year Ended
October 31, 2004 | |
From operations —
Net investment income | | $ | 57,060,141 | | | $ | 69,688,293 | | |
Net realized gain from investments,
swap contracts, foreign currency and
forward foreign currency exchange
contract transactions | | | 18,266,672 | | | | 8,805,018 | | |
Net change in unrealized appreciation
(depreciation) from investments,
swap contracts, foreign currency and
forward foreign currency exchange contracts | | | (32,814,917 | ) | | | 21,766,517 | | |
| Net increase in net assets from operations | | $ | 42,511,896 | | | $ | 100,259,828 | | |
Distributions to shareholders —
From net investment income
Class A | | $ | (12,730,268 | ) | | $ | (7,024,416 | ) | |
| Class B | | | (30,883,089 | ) | | | (45,097,631 | ) | |
| Class C | | | (15,750,677 | ) | | | (21,645,396 | ) | |
| Total distributions to shareholders | | $ | (59,364,034 | ) | | $ | (73,767,443 | ) | |
Transactions in shares of beneficial interest —
Proceeds from sale of shares
Class A | | $ | 26,164,140 | | | $ | 23,508,122 | | |
| Class B | | | 23,213,445 | | | | 49,016,203 | | |
| Class C | | | 32,396,910 | | | | 51,931,667 | | |
Net asset value of shares issued to
shareholders in payment of
distributions declared
Class A | | | 5,227,870 | | | | 3,047,338 | | |
| Class B | | | 13,457,467 | | | | 18,955,270 | | |
| Class C | | | 6,751,299 | | | | 9,874,150 | | |
Cost of shares redeemed
Class A | | | (33,057,651 | ) | | | (23,457,203 | ) | |
| Class B | | | (112,454,552 | ) | | | (127,275,169 | ) | |
| Class C | | | (85,450,104 | ) | | | (111,372,869 | ) | |
Net asset value of shares exchanged
Class A | | | 20,572,317 | | | | 146,072,121 | | |
| Class B | | | (20,572,317 | ) | | | (146,072,121 | ) | |
| Redemption Fees | | | 8,009 | | | | 7,011 | | |
Net decrease in net assets from
Fund share transactions | | $ | (123,743,167 | ) | | $ | (105,765,480 | ) | |
| Net decrease in net assets | | $ | (140,595,305 | ) | | $ | (79,273,095 | ) | |
| Net Assets | | Year Ended
October 31, 2005 | | Year Ended
October 31, 2004 | |
| At beginning of year | | $ | 864,211,172 | | | $ | 943,484,267 | | |
| At end of year | | $ | 723,615,867 | | | $ | 864,211,172 | | |
Accumulated distributions
in excess of net investment
income included in
net assets | |
| At end of year | | $ | (2,716,717 | ) | | $ | (2,522,228 | ) | |
See notes to financial statements
6
Eaton Vance High Income Fund as of October 31, 2005
FINANCIAL STATEMENTS CONT'D
Financial Highlights
| | | Class A | |
| | | Year Ended
October 31, 2005(1) | | Period Ended
October 31, 2004(1)(2) | |
| Net asset value — Beginning of year | | $ | 5.210 | | | $ | 5.230 | | |
| Income (loss) from operations | |
| Net investment income | | $ | 0.402 | | | $ | 0.262 | | |
| Net realized and unrealized loss | | | (0.095 | ) | | | (0.001 | ) | |
| Total income from operations | | $ | 0.307 | | | $ | 0.261 | | |
| Less distributions | |
| From net investment income | | $ | (0.417 | ) | | $ | (0.281 | ) | |
| Total distributions | | $ | (0.417 | ) | | $ | (0.281 | ) | |
| Redemption fees | | $ | 0.000 | (3) | | $ | 0.000 | (3) | |
| Net asset value — End of period | | $ | 5.100 | | | $ | 5.210 | | |
| Total Return(4) | | | 6.01 | % | | | 5.20 | % | |
| Ratios/Supplemental Data | |
| Net assets, end of year (000's omitted) | | $ | 165,125 | | | $ | 150,042 | | |
| Ratios (As a percentage of average daily net assets): | |
| Expenses(5) | | | 0.97 | % | | | 0.96 | %(6) | |
| Expenses after custodian fee reduction(5) | | | 0.97 | % | | | 0.96 | %(6) | |
| Net investment income | | | 7.70 | % | | | 7.98 | %(6) | |
| Portfolio Turnover of the Portfolio | | | 62 | % | | | 80 | % | |
(1) Net investment income per share was computed using average shares outstanding.
(2) For the period from the commencement of offering of Class A shares, March 11, 2004, to October 31, 2004.
(3) Amounts represent less than $.0005.
(4) Returns are historical and are calculated by determining the perentage change in net asset value with all distributions reinvested. Total return is not computed on an annualized basis.
(5) Includes the Fund's share of the Portfolio's allocated expenses.
(6) Annualized.
See notes to financial statements
7
Eaton Vance High Income Fund as of October 31, 2005
FINANCIAL STATEMENTS CONT'D
Financial Highlights
| | | Class B | |
| | | Year Ended October 31, | |
| | | 2005(2) | | 2004(2) | | 2003 | | 2002(1) | | 2001 | |
| Net asset value — Beginning of year | | $ | 5.200 | | | $ | 5.050 | | | $ | 4.150 | | | $ | 4.860 | | | $ | 6.180 | | |
| Income (loss) from operations | |
| Net investment income | | $ | 0.363 | | | $ | 0.392 | | | $ | 0.416 | | | $ | 0.431 | | | $ | 0.601 | | |
| Net realized and unrealized gain (loss) | | | (0.106 | ) | | | 0.169 | | | | 0.904 | | | | (0.672 | ) | | | (1.206 | ) | |
| Total income (loss) from operations | | $ | 0.257 | | | $ | 0.561 | | | $ | 1.320 | | | $ | (0.241 | ) | | $ | (0.605 | ) | |
| Less distributions | |
| From net investment income | | $ | (0.377 | ) | | $ | (0.411 | ) | | $ | (0.420 | ) | | $ | (0.429 | ) | | $ | (0.670 | ) | |
| From tax return of capital | | | — | | | | — | | | | — | | | | (0.040 | ) | | | (0.045 | ) | |
| Total distributions | | $ | (0.377 | ) | | $ | (0.411 | ) | | $ | (0.420 | ) | | $ | (0.469 | ) | | $ | (0.715 | ) | |
| Redemption fees | | $ | 0.000 | (3) | | $ | 0.000 | (3) | | $ | — | | | $ | — | | | $ | — | | |
| Net asset value — End of year | | $ | 5.080 | | | $ | 5.200 | | | $ | 5.050 | | | $ | 4.150 | | | $ | 4.860 | | |
| Total Return(4) | | | 5.34 | %(5) | | | 11.55 | % | | | 33.26 | % | | | (5.46 | )% | | | (10.39 | )% | |
| Ratios/Supplemental Data | |
| Net assets, end of year (000's omitted) | | $ | 370,036 | | | $ | 474,861 | | | $ | 662,381 | | | $ | 530,326 | | | $ | 648,544 | | |
| Ratios (As a percentage of average daily net assets): | |
| Expenses(6) | | | 1.72 | % | | | 1.71 | % | | | 1.80 | % | | | 1.79 | % | | | 1.83 | % | |
| Expenses after custodian fee reduction(6) | | | 1.72 | % | | | 1.71 | % | | | 1.80 | % | | | 1.79 | % | | | 1.83 | % | |
| Net investment income | | | 6.95 | % | | | 7.60 | % | | | 8.96 | % | | | 9.30 | % | | | 10.91 | % | |
| Portfolio Turnover of the Portfolio | | | 62 | % | | | 80 | % | | | 122 | % | | | 88 | % | | | 83 | % | |
(1) The Fund, through its investment in the Portfolio, has adopted the provisions of the revised AICPA Audit and Accounting Guide for Investment Companies and began using the interest method to amortize premiums on fixed-income securities. The effect of this change for the year ended October 31, 2002 was to decrease net investement income per share by $0.010, decrease net realized and unrealized losses per share by $0.010 and decrease the ratio of net investment income to average net assets from 9.52% to 9.30%. Per-share data and ratios for the periods prior to November 1, 2001 have not been restated to reflect this change in presentation.
(2) Net investment income per share was computed using average shares outstanding.
(3) Amounts represent less than $.0005.
(4) Returns are historical and are calculated by determining the percentage change in net asset value with all distributions reinvested. Total return is not computed on an annualized basis.
(5) Total return reflects an increase of 0.33% due to a change in the timing of the payment and reinvestment of distributions.
(6) Includes the Fund's share of the Portfolio's allocated expenses.
See notes to financial statements
8
Eaton Vance High Income Fund as of October 31, 2005
FINANCIAL STATEMENTS CONT'D
Financial Highlights
| | | Class C | |
| | | Year Ended October 31, | |
| | | 2005(2)(3) | | 2004(2)(3) | | 2003(3) | | 2002(1)(3) | | 2001(3) | |
| Net asset value — Beginning of year | | $ | 5.200 | | | $ | 5.050 | | | $ | 4.150 | | | $ | 4.850 | | | $ | 6.160 | | |
| Income (loss) from operations | |
| Net investment income | | $ | 0.363 | | | $ | 0.389 | | | $ | 0.417 | | | $ | 0.429 | | | $ | 0.603 | | |
| Net realized and unrealized gain (loss) | | | (0.107 | ) | | | 0.171 | | | | 0.903 | | | | (0.660 | ) | | | (1.212 | ) | |
| Total income (loss) from operations | | $ | 0.256 | | | $ | 0.560 | | | $ | 1.320 | | | $ | (0.231 | ) | | $ | (0.609 | ) | |
| Less distributions | |
| From net investment income | | $ | (0.376 | ) | | $ | (0.410 | ) | | $ | (0.420 | ) | | $ | (0.433 | ) | | $ | (0.654 | ) | |
| From tax return of capital | | | — | | | | — | | | | — | | | | (0.036 | ) | | | (0.047 | ) | |
| Total distributions | | $ | (0.376 | ) | | $ | (0.410 | ) | | $ | (0.420 | ) | | $ | (0.469 | ) | | $ | (0.701 | ) | |
| Redemption fees | | $ | 0.000 | (4) | | $ | 0.000 | (4) | | $ | — | | | $ | — | | | $ | — | | |
| Net asset value — End of year | | $ | 5.080 | | | $ | 5.200 | | | $ | 5.050 | | | $ | 4.150 | | | $ | 4.850 | | |
| Total Return(5) | | | 5.32 | %(6) | | | 11.38 | % | | | 33.24 | % | | | (5.37 | )% | | | (10.31 | )% | |
| Ratios/Supplemental Data | |
| Net assets, end of year (000's omitted) | | $ | 188,454 | | | $ | 239,308 | | | $ | 281,103 | | | $ | 195,037 | | | $ | 202,906 | | |
| Ratios (As a percentage of average daily net assets): | |
| Expenses(7) | | | 1.72 | % | | | 1.71 | % | | | 1.80 | % | | | 1.79 | % | | | 1.82 | % | |
| Expenses after custodian fee reduction(7) | | | 1.72 | % | | | 1.71 | % | | | 1.80 | % | | | 1.79 | % | | | 1.82 | % | |
| Net investment income | | | 6.96 | % | | | 7.56 | % | | | 8.93 | % | | | 9.28 | % | | | 10.85 | % | |
| Portfolio Turnover of the Portfolio | | | 62 | % | | | 80 | % | | | 122 | % | | | 88 | % | | | 83 | % | |
(1) The Fund, through its investment in the Portfolio, has adopted the provisions of the revised AICPA Audit and Accounting Guide for Investment Companies and began using the interest method to amortize premiums on fixed-income securities. The effect of this change for the year ended October 31, 2002 was to decrease net investement income per share by $0.010, decrease net realized and unrealized losses per share by $0.010 and decrease the ratio of net investment income to average net assets from 9.50% to 9.28%. Per-share data and ratios for the periods prior to November 1, 2001 have not been restated to reflect this change in presentation.
(2) Net investment income per share was computed using average shares outstanding.
(3) Per share data have been restated to reflect the effects of a 1.3204633-for-1 stock split effective on November 11, 2005.
(4) Amounts represent less than $.0005.
(5) Returns are historical and are calculated by determining the percentage change in net asset value with all distributions reinvested. Total return is not computed on an annualized basis.
(6) Total return reflects an increase of 0.20% due to a change in the timing of the payment and reinvestment of distributions.
(7) Includes the Fund's share of the Portfolio's allocated expenses.
See notes to financial statements
9
Eaton Vance High Income Fund as of October 31, 2005
NOTES TO FINANCIAL STATEMENTS
1 Significant Accounting Policies
Eaton Vance High Income Fund (the Fund) is a series of Eaton Vance Mutual Funds Trust (the Trust). The Trust is an entity of the type commonly known as a Massachusetts business trust and is registered under the Investment Company Act of 1940, as amended, as an open-end, management investment company. The Fund offers three classes of shares. Class A shares are generally sold subject to a sales charge imposed at time of purchase and assess a redemption fee of 1% for shares redeemed or exchanged within three months of the settlement of the purchase. Class B shares and Class C shares are sold at net asset value and are subject to a contingent deferred sales charge (see Note 6). The Trustees have adopted a conversion feature pursuant to which Class B shares of the Fund automatically convert to Class A shares eight years after their purchase as described in the Fund's prospectus. Each class represents a pro rata interest in the Fund, but votes separately on class-specific matters and (as noted below) is subject to different expenses. Realized and unrealized gains and losses are allocated daily to each class of shares based on the relative net assets of each class to the total net assets of the Fund. Net investment income, other than class specific expenses, is allocated daily to each class of shares based upon the ratio of the value of each class's paid shares to the total value of all paid shares. Each class of shares differs in its distribution plan and certain other class specific expenses. The Fund invests all of its investable assets in interests in the High Income Portfolio (the Portfolio), a New York Trust, having the same investment objective as the Fund. The value of the Fund's investment in the Portfolio reflects the Fund's proportionate interest in the net assets of the Portfolio (65.6% at October 31, 2005). The performance of the Fund is directly affected by the performance of the Portfolio. The financial statements of the Po rtfolio, including the portfolio of investments, are included elsewhere in this report and should be read in conjunction with the Fund's financial statements.
The following is a summary of significant accounting policies consistently followed by the Fund in the preparation of its financial statements. The policies are in conformity with accounting principles generally accepted in the United States of America.
A Investment Valuation — Valuation of securities by the Portfolio is discussed in Note 1A of the Portfolio's Notes to Financial Statements which are included elsewhere in this report.
B Income — The Fund's net investment income consists of the Fund's pro rata share of the net investment income of the Portfolio, less all actual and accrued expenses of the Fund determined in accordance with accounting principles generally accepted in the United States of America.
C Federal Taxes — The Fund's policy is to comply with the provisions of the Internal Revenue Code applicable to regulated investment companies and to distribute to shareholders each year all of its taxable income, including any net realized gain on investments. Accordingly, no provision for federal income or excise tax is necessary. At October 31, 2005, the Fund, for federal income tax purposes, had a capital loss carryover of $399,909,630, which will reduce the Fund's taxable income arising from future net realized gain on investments, if any, to the extent permitted by the Internal Revenue Code and thus will reduce the amount of distributions to shareholders which would otherwise be necessary to relieve the Fund of any liability for federal income or excise tax. Such ca pital loss carryover will expire on October 31, 2010 ($143,280,458), October 31, 2009 ($235,765,703), and October 31, 2008 ($20,863,469), respectively.
D Other — Investment transactions are accounted for on a trade-date basis.
E Use of Estimates — The preparation of the financial statements in conformity with accounting principles generally accepted in the United States of America requires management to make estimates and assumptions that affect the reported amounts of assets and liabilities at the date of the financial statements and the reported amounts of income and expense during the reporting period. Actual results could differ from those estimates.
F Indemnifications — Under the Trust's organizational documents, its officers and Trustees may be indemnified against certain liabilities and expenses arising out of the performance of their duties to the Fund, and shareholders are indemnified against personal liability for obligations of the Trust. Additionally, in the normal course of business, the Fund enters into agreements with service providers that may contain indemnification clauses. The Fund's maximum exposure under these arrangements is unknown as this would involve future claims that may be made against the Fund that have not yet occurred.
G Expenses — The majority of expenses of the Trust are directly identifiable to an individual fund. Expenses which are not readily identifiable to a specific fund are allocated taking into consideration, among other things, the nature and type of expense and the relative size of the fund.
10
Eaton Vance High Income Fund as of October 31, 2005
NOTES TO FINANCIAL STATEMENTS CONT'D
2 Distributions to Shareholders
The net income of the Fund is determined daily and substantially all of the net income so determined is declared as a dividend to shareholders of record at the time of declaration. Such daily dividends are paid monthly. Distributions of realized capital gains, if any, are made at least annually. Shareholders may reinvest capital gain distributions in additional shares of the Fund at the net asset value as of the ex-dividend date. Distributions are paid in the form of additional shares of the Fund or, at the election of the shareholder, in cash. The Fund distinguishes between distributions on a tax basis and a financial reporting basis. Accounting principles generally accepted in the United States of America require that only distributions in excess of tax basis earnings and profits be reported in the financial statements as a return of capital. Permanent differences between book and tax accounting relating to distributions are r eclassified to paid-in capital. These differences relate primarily to the method for amortizing premiums.
The tax character of distributions paid for the years ended October 31, 2005 and October 31, 2004 was as follows:
| | | Year Ended October 31, | |
| | | 2005 | | 2004 | |
| Distributions declared from: | |
| Ordinary income | | $ | 59,364,034 | | | $ | 73,767,443 | | |
During the year ended October 31, 2005, accumulated distributions in excess of net investment income was decreased by $2,109,404, accumulated net realized loss was increased by $2,931,248 and paid-in capital was increased by $821,844 primarily due to differences between book and tax accounting for treatment of bond premium and foreign currency gain/loss. This change had no effect on the net assets or the net asset value per share.
As of October 31, 2005, the components of distributable earnings (accumulated losses) on a tax basis were as follows:
| Capital loss carryforwards | | $ | (399,909,630 | ) | |
| Unrealized appreciation | | $ | 20,407,878 | | |
| Other temporary differences | | $ | (2,716,717 | ) | |
3 Shares of Beneficial Interest
The Fund's Declaration of Trust permits the Trustees to issue an unlimited number of full and fractional shares of beneficial interest (without par value). Transactions in Fund shares were as follows:
| Class A | | Year Ended
October 31, 2005 | | Period Ended
October 31, 2004(1) | |
| Sales | | | 5,007,428 | | | | 4,554,886 | | |
Issued to shareholders electing to
receive payments of distributions
in Fund shares | | | 1,003,044 | | | | 593,070 | | |
| Redemptions | | | (6,327,933 | ) | | | (4,583,780 | ) | |
| Exchange from Class B shares | | | 3,929,337 | | | | 28,220,527 | | |
| Net increase | | | 3,611,876 | | | | 28,784,703 | | |
| Class B | | Year Ended
October 31, 2005 | | Year Ended
October 31, 2004 | |
| Sales | | | 4,446,355 | | | | 9,505,307 | | |
Issued to shareholders electing to
receive payments of distributions
in Fund shares | | | 2,584,766 | | | | 3,685,269 | | |
| Redemptions | | | (21,621,794 | ) | | | (24,732,586 | ) | |
| Exchange to Class A shares | | | (3,937,314 | ) | | | (28,277,719 | ) | |
| Net decrease | | | (18,527,987 | ) | | | (39,819,729 | ) | |
| Class C | | Year Ended
October 31, 2005(2) | | Year Ended
October 31, 2004(2) | |
| Sales | | | 6,223,895 | | | | 10,043,439 | | |
Issued to shareholders electing to
receive payments of distributions
in Fund shares | | | 1,297,087 | | | | 1,918,347 | | |
| Redemptions | | | (16,478,015 | ) | | | (21,592,439 | ) | |
| Net decrease | | | (8,957,033 | ) | | | (9,630,653 | ) | |
(1) For the period from the start of business, March 11, 2004 to October 31, 2004.
(2) Transactions have been restated to reflect the effects of a 1.3204633-for-1 stock split effective on November 11, 2005.
Redemptions or exchanges of Class A shares made within three months of purchase are subject to a redemption fee equal to 1% of the amount redeemed. For the year ended October 31, 2005 the Fund received redemption fees of $8,009 on Class A shares, which was less than $0.001 per share.
4 Transactions with Affiliates
Eaton Vance Management (EVM) serves as the administrator of the Fund, but receives no compensation. The Portfolio has engaged Boston Management and Research (BMR), a subsidiary of EVM, to render investment advisory services. See Note 2 of the Portfolio's Notes to Financial Statements
11
Eaton Vance High Income Fund as of October 31, 2005
NOTES TO FINANCIAL STATEMENTS CONT'D
which are included elsewhere in this report. EVM serves as the sub-transfer agent of the Fund and receives from the transfer agent an aggregate fee based upon the actual expenses incurred by EVM in the performance of those services. During the year ended October 31, 2005, EVM earned $51,066 in sub-transfer agent fees. Except as to Trustees of the Fund and the Portfolio who are not members of EVM's or BMR's organization, officers and Trustees receive remuneration for their services to the Fund out of such investment adviser fee. The Fund was informed that Eaton Vance Distributors, Inc. (EVD), a subsidiary of EVM and the Fund's principal underwriter, received $21,257 as its portion of the sales charge on sales of Class A shares for the year ended October 31, 2005.
Certain officers and Trustees of the Fund and of the Portfolio are officers of the above organizations.
5 Distribution and Service Plans
The Fund has in effect distribution plans for Class B Shares (the Class B Plan) and Class C Shares (Class C Plan) pursuant to Rule 12b-1 under the Investment Company Act of 1940, and a service plan for Class A shares (Class A Plan) (collectively, the Plans). The Class B and Class C Plans require the Fund to pay Eaton Vance Distributors, Inc. (EVD) amounts equal to 1/365 of 0.75% of the Fund's average daily net assets attributable to Class B and Class C shares for providing ongoing distribution services and facilities to the Fund. The Fund will automatically discontinue payments to EVD during any period in which there are no outstanding Uncovered Distribution Charges, which are equivalent to the sum of (i) 5% and 6.25% of the aggregate amount received by the Fund for the Class B and Class C shares sold, respectively, plus, (ii) interest calculated by applying the rate of 1% over the prevailing prime rate to the outstanding balanc e of Uncovered Distribution Charges of EVD of each respective class, reduced by the aggregate amount of contingent deferred sales charges (see Note 6) and daily amounts theretofore paid to EVD by each respective class. The Fund paid or accrued $3,200,876 and $1,631,456 for Class B and Class C shares, respectively, to or payable to EVD for the year ended October 31, 2005 representing 0.75% of the average daily net assets for Class B and Class C shares. At October 31, 2005, the amount of Uncovered Distribution Charges of EVD calculated under the Plan was approximately $23,004,000 and $36,270,000 for Class B and Class C shares, respectively.
The Plans authorize the Fund to make payments of service fees to EVD, investment dealers and other persons in amounts not exceeding 0.25% of the Fund's average daily net assets attributable to Class A, Class B and Class C shares for each fiscal year. Service fee payments will be made for personal services and/or the maintenance of shareholder accounts. Service fees are separate and distinct from the sales commissions and distribution fees payable by the Fund to EVD and, as such, are not subject to automatic discontinuance where there are no outstanding Uncovered Distribution Charges of EVD. Service fee payments for the year ended October 31, 2005 amounted to $398,540, $1,066,959 and $543,819 for Class A, Class B, and Class C Shares, respectively.
Certain officers and Trustees of the Fund are officers or directors of EVD.
6 Contingent Deferred Sales Charge
A contingent deferred sales charge (CDSC) generally is imposed on redemptions of Class B shares made within six years of purchase and on redemptions of Class C shares made within one year of purchase. Class A shares may be subject to a 1% CDSC if redeemed within one year of purchase (depending upon the circumstances of purchase). Generally, the CDSC is based upon the lower of the net asset value at date of redemption or date of purchase. No charge is levied on shares acquired by reinvestment of dividends or capital gains distributions. The Class B CDSC is imposed at declining rates that begin at 5% in the case of redemptions in the first and second year after purchase, declining one percentage point each subsequent year. Class C shares will be subject to a 1% CDSC if redeemed within one year of purchase. No CDSC is levied on shares which have been sold to EVM or its affiliates or to their respective employees or clients and may be waived under certain other limited conditions. CDSC charges are paid to EVD to reduce the amount of Uncovered Distribution Charges calculated under the Fund's Distribution Plan. CDSC charges received when no Uncovered Distribution Charges exist will be retained by the Fund. EVD received approximately $21,000, $1,359,000 and $44,000 of CDSC paid by shareholders for Class A, Class B and Class C shares, respectively, for the year ended October 31, 2005.
7 Investment Transactions
Increases and decreases in the Fund's investment in the Portfolio for the year ended October 31, 2005, aggregated $82,113,011 and $286,674,771, respectively.
8 Stock Split
On October 17, 2005, the Trustees of the Fund approved a 1.3204633-for-1 stock split for Class C shares, effective November 11, 2005. This action enables the Fund to bring the net asset value per share of its various classes into closer alignment, without adversely affecting current shareholders. The stock split will have no impact on the overall value of a shareholder's investment in the Fund.
12
Eaton Vance High Income Fund as of October 31, 2005
REPORT OF INDEPENDENT REGISTERED PUBLIC ACCOUNTING FIRM
To the Trustees of Eaton Vance Mutual Funds Trust and Shareholders of Eaton Vance High Income Fund:
We have audited the accompanying statement of assets and liabilities of Eaton Vance High Income Fund (the Fund) (one of the series of the Eaton Vance Mutual Funds Trust) as of October 31, 2005, and the related statement of operations for the year then ended, the statements of changes in net assets for each of the two years in the period then ended, and the financial highlights for each of the five years in the period then ended. These financial statements and financial highlights are the responsibility of the Fund's management. Our responsibility is to express an opinion on these financial statements and financial highlights based on our audits.
We conducted our audits in accordance with standards of the Public Company Accounting Oversight Board (United States). Those standards require that we plan and perform the audits to obtain reasonable assurance about whether the financial statements and financial highlights are free of material misstatement. The Fund is not required to have, nor were we engaged to perform, an audit of its internal control over financial reporting. An audit includes consideration of internal control over financial reporting as a basis for designing audit procedures that are appropriate in the circumstances, but not for the purpose of expressing an opinion on the effectiveness of the Fund's internal control over financial reporting. Accordingly, we express no such opinion. An audit also includes examining, on a test basis, evidence supporting the amounts and disclosures in the financial statements, assessing the accounting principles used and signi ficant estimates made by management, as well as evaluating the overall financial statement presentation. We believe that our audits provide a reasonable basis for our opinion.
In our opinion, the financial statements and financial highlights referred to above present fairly, in all material respects, the financial position of the Eaton Vance High Income Fund at October 31, 2005, the results of its operations for the year then ended, the changes in its net assets for each of the two years in the period then ended, and the financial highlights for each of the five years in the period then ended, in conformity with accounting principles generally accepted in the United States of America.
DELOITTE & TOUCHE LLP
Boston, Massachusetts
December 19, 2005
13
High Income Portfolio as of October 31, 2005
PORTFOLIO OF INVESTMENTS
| Senior, Floating Rate Loans — 3.0%(1) | |
| Security | | Principal
Amount | | Value | |
| Automotive & Auto Parts — 0.3% | |
Delphi Corp., Term Loan,
10.30%, Maturing 6/14/11 | | $ | 3,468,025 | | | $ | 3,614,795 | | |
| | | $ | 3,614,795 | | |
| Broadcasting — 0.7% | |
Hit Entertainment, Inc., Term Loan,
9.33%, Maturing 2/5/13 | | $ | 7,800,000 | | | $ | 7,864,998 | | |
| | | $ | 7,864,998 | | |
| Building Materials — 0.6% | |
Masonite International, Term Loan,
10.38%, Maturing 10/6/06 | | $ | 7,000,000 | | | $ | 7,000,000 | | |
| | | $ | 7,000,000 | | |
| Gaming — 0.4% | |
BLB Worldwide Holdings, Term Loan,
7.83%, Maturing 6/30/12 | | $ | 3,500,000 | | | $ | 3,552,500 | | |
Resorts International Holdings, LLC, Term Loan,
10.27%, Maturing 3/22/13 | | | 700,000 | | | | 694,094 | | |
| | | $ | 4,246,594 | | |
| Super Retail — 0.8% | |
| Toys R US, Term Loan, 9.43%, Maturing 7/21/06 | | $ | 8,800,000 | | | $ | 8,805,500 | | |
| | | $ | 8,805,500 | | |
| Utilities — 0.2% | |
Mirant Corp., Revolving Term Loan,
0.00%, Maturing 7/16/03(2) | | $ | 2,100,000 | | | $ | 2,212,875 | | |
| | | $ | 2,212,875 | | |
Total Senior, Floating Rate Loans
(identified cost $33,104,435) | | | | | | $ | 33,744,762 | | |
| Corporate Bonds & Notes — 88.3% | |
| Security | | Principal
Amount
(000's omitted) | | Value | |
| Aerospace — 0.2% | |
| Argo Tech Corp., Sr. Notes, 9.25%, 6/1/11 | | $ | 1,575 | | | $ | 1,630,125 | | |
BE Aerospace, Sr. Sub. Notes, Series B,
8.00%, 3/1/08 | | | 795 | | | | 796,987 | | |
Standard Aero Holdings, Inc., Sr. Sub. Notes,
8.25%, 9/1/14 | | | 395 | | | | 377,225 | | |
| | | $ | 2,804,337 | | |
| Air Transportation — 1.7% | |
| American Airlines, 7.80%, 10/1/06 | | $ | 7,968 | | | $ | 7,600,028 | | |
| American Airlines, 7.858%, 10/1/11 | | | 260 | | | | 266,726 | | |
| American Airlines, 8.608%, 4/1/11 | | | 570 | | | | 540,787 | | |
| AMR Corp., 9.00%, 8/1/12 | | | 7,790 | | | | 5,414,050 | | |
| Continental Airlines, 7.033%, 6/15/11 | | | 3,542 | | | | 3,198,419 | | |
| Delta Air Lines, 7.779%, 11/18/05(2) | | | 217 | | | | 199,776 | | |
| Delta Air Lines, 8.30%, 12/15/29(2) | | | 1,005 | | | | 183,412 | | |
| Delta Air Lines, 9.50%, 11/18/08(2)(3) | | | 2,078 | | | | 1,729,935 | | |
| | | $ | 19,133,133 | | |
| Automotive & Auto Parts — 4.9% | |
| Altra Industrial Motion, Inc., 9.50%, 12/1/11(3) | | $ | 770 | | | $ | 750,750 | | |
Commercial Vehicle Group, Inc., Sr. Notes,
8.00%, 7/1/13(3) | | | 1,230 | | | | 1,211,550 | | |
| Dana Credit Corp., 8.375%, 8/15/07(3) | | | 1,265 | | | | 1,233,375 | | |
| Ford Motor Credit Co., 7.875%, 6/15/10 | | | 13,685 | | | | 13,185,320 | | |
| Ford Motor Credit Co., Variable Rate, 7.24%, 11/2/07 | | | 8,190 | | | | 8,143,251 | | |
| General Motors Acceptance Corp., 7.00%, 2/1/12 | | | 470 | | | | 456,495 | | |
| General Motors Acceptance Corp., 8.00%, 11/1/31 | | | 11,790 | | | | 12,205,114 | | |
Keystone Automotive Operations, Inc., Sr. Sub. Notes,
9.75%, 11/1/13 | | | 1,195 | | | | 1,168,112 | | |
| Metaldyne Corp., Sr. Notes, 11.00%, 11/1/13(3) | | | 2,670 | | | | 2,416,350 | | |
| Tenneco Automotive, Inc., 8.625%, 11/15/14 | | | 2,965 | | | | 2,846,400 | | |
Tenneco Automotive, Inc., Series B,
10.25%, 7/15/13 | | | 3,955 | | | | 4,291,175 | | |
TRW Automotive, Inc., Sr. Sub. Notes,
11.00%, 2/15/13 | | | 2,142 | | | | 2,404,395 | | |
United Components, Inc., Sr. Sub. Notes,
9.375%, 6/15/13 | | | 1,670 | | | | 1,678,350 | | |
| Venture Holding Trust, Sr. Notes, 9.50%, 7/1/05(2) | | | 3,811 | | | | 23,819 | | |
| Visteon Corp., Sr. Notes, 8.25%, 8/1/10 | | | 2,215 | | | | 2,057,181 | | |
| | | $ | 54,071,637 | | |
See notes to financial statements
14
High Income Portfolio as of October 31, 2005
PORTFOLIO OF INVESTMENTS CONT'D
| Security | | Principal
Amount
(000's omitted) | | Value | |
| Broadcasting — 2.2% | |
Nexstar Finance Holdings LLC, Inc., Sr. Disc. Notes,
11.375%, (0% until 2008), 4/1/13 | | $ | 6,345 | | | $ | 4,600,125 | | |
| Paxson Communications Corp., 10.75%, 7/15/08 | | | 1,560 | | | | 1,532,700 | | |
Paxson Communications Corp.,
12.25%, (0% until 2006), 1/15/09 | | | 1,980 | | | | 1,945,350 | | |
Rainbow National Services, LLC, Sr. Notes,
8.75%, 9/1/12(3) | | | 2,200 | | | | 2,321,000 | | |
Rainbow National Services, LLC, Sr. Sub. Debs.,
10.375%, 9/1/14(3) | | | 7,400 | | | | 8,177,000 | | |
| Sirius Satellite Radio, Sr. Notes, 9.625%, 8/1/13(3) | | | 6,065 | | | | 5,769,331 | | |
| | | $ | 24,345,506 | | |
| Building Materials — 2.5% | |
| Coleman Cable, Inc., Sr. Notes, 9.875%, 10/1/12 | | $ | 1,325 | | | $ | 1,199,125 | | |
| General Cable Corp., Sr. Notes, 9.50%, 11/15/10 | | | 2,305 | | | | 2,443,300 | | |
Goodman Global Holdings, Sr. Notes, Variable Rate,
6.41%, 6/15/12(3) | | | 2,320 | | | | 2,285,200 | | |
| Interface, Inc., Sr. Sub. Notes, 9.50%, 2/1/14 | | | 745 | | | | 745,000 | | |
Interline Brands, Inc., Sr. Sub. Notes,
11.50%, 5/15/11 | | | 2,828 | | | | 3,153,220 | | |
| MAAX Corp., Sr. Sub. Notes, 9.75%, 6/15/12 | | | 2,725 | | | | 2,166,375 | | |
| Nortek, Inc., Sr. Sub Notes, 8.50%, 9/1/14 | | | 6,370 | | | | 6,115,200 | | |
NTK Holdings, Inc., Sr. Disc. Notes,
10.75%, (0.00% until 2009) 3/1/14 | | | 2,815 | | | | 1,703,075 | | |
Panolam Industries International, Sr. Sub. Notes,
10.75%, 10/1/13 | | | 2,445 | | | | 2,383,875 | | |
Ply Gem Industries, Inc., Sr. Sub. Notes,
9.00%, 2/15/12(3) | | | 2,190 | | | | 1,784,850 | | |
RMCC Acquisition Co., Sr. Sub. Notes,
9.50%, 11/1/12(3) | | | 4,010 | | | | 4,090,200 | | |
| | | $ | 28,069,420 | | |
| Cable/Satellite TV — 4.9% | |
Adelphia Communications, Sr. Notes,
10.25%, 11/1/06(2) | | $ | 9,200 | | | $ | 5,888,000 | | |
Adelphia Communications, Sr. Notes, Series B,
9.25%, 10/1/32(2) | | | 7,585 | | | | 4,892,325 | | |
CCO Holdings LLC / Capital Corp., Sr. Notes,
8.75%, 11/15/13(3) | | | 5,240 | | | | 5,069,700 | | |
Century Communications, Sr. Notes,
8.75%, 10/1/07(2) | | | 625 | | | | 662,500 | | |
Charter Communications Holdings II, LLC, Sr. Notes,
10.25%, 9/15/10 | | | 2,455 | | | | 2,473,412 | | |
| CSC Holdings, Inc., Sr. Notes, 6.75%, 4/15/12(3) | | | 735 | | | | 712,950 | | |
| CSC Holdings, Inc., Sr. Notes, 7.875%, 12/15/07 | | | 15 | | | | 15,450 | | |
| Security | | Principal
Amount
(000's omitted) | | Value | |
| Cable/Satellite TV (continued) | |
CSC Holdings, Inc., Sr. Notes, Series B,
7.625%, 4/1/11 | | $ | 615 | | | $ | 619,612 | | |
Insight Communications, Sr. Disc. Notes,
12.25%, (0% until 2006), 2/15/11 | | | 16,840 | | | | 17,387,300 | | |
| Kabel Deutschland GMBH, 10.625%, 7/1/14(3) | | | 7,785 | | | | 8,417,531 | | |
| Ono Finance PLC, Sr. Notes, 14.00%, 2/15/11 | | | 5,017 | | | | 5,487,344 | | |
| Ono Finance PLC, Sr. Notes, 14.00%, 2/15/11(4) | | EUR | 1,935 | | | | 2,549,075 | | |
| | | $ | 54,175,199 | | |
| Capital Goods — 3.6% | |
Amsted Industries, Inc., Sr. Notes,
10.25%, 10/15/11(3) | | $ | 7,765 | | | $ | 8,347,375 | | |
| Case New Holland, Inc., Sr. Notes, 9.25%, 8/1/11 | | | 3,720 | | | | 3,933,900 | | |
Chart Industries, Inc., Sr. Sub. Notes,
9.125%, 10/15/15(3) | | | 2,370 | | | | 2,358,150 | | |
| Dresser, Inc., 9.375%, 4/15/11 | | | 8,975 | | | | 9,334,000 | | |
| Koppers, Inc., 9.875%, 10/15/13 | | | 60 | | | | 65,700 | | |
| Manitowoc Co., Inc. (The), 10.50%, 8/1/12 | | | 589 | | | | 662,625 | | |
| Milacron Escrow Corp., 11.50%, 5/15/11 | | | 4,340 | | | | 3,754,100 | | |
| Mueller Group, Inc., Sr. Sub. Notes, 10.00%, 5/1/12 | | | 2,685 | | | | 2,832,675 | | |
Mueller Holdings, Inc., Disc. Notes,
14.75%, (0.00% until 2009), 4/15/14 | | | 3,975 | | | | 2,921,625 | | |
| Polypore, Inc., Sr. Sub Notes, 8.75%, 5/15/12 | | | 445 | | | | 393,825 | | |
| Rexnord Corp., 10.125%, 12/15/12 | | | 1,195 | | | | 1,314,500 | | |
Thermadyne Holdings Corp., Sr. Sub. Notes,
9.25%, 2/1/14 | | | 4,167 | | | | 3,750,300 | | |
| | | $ | 39,668,775 | | |
| Chemicals — 4.2% | |
| Avecia Group PLC, 11.00%, 7/1/09 | | $ | 391 | | | $ | 404,685 | | |
BCP Crystal Holdings Corp., Sr. Sub Notes,
9.625%, 6/15/14 | | | 3,783 | | | | 4,180,215 | | |
Borden U.S. Finance/Nova Scotia Finance, Sr. Notes,
9.00%, 7/15/14(3) | | | 2,130 | | | | 2,106,037 | | |
Crystal US Holdings/US Holdings 3, LLC, Sr. Disc. Notes,
Series B, 10.50%, (0.00% until 2009) 10/1/14 | | | 3,465 | | | | 2,416,837 | | |
| Equistar Chemical, Sr. Notes, 10.625%, 5/1/11 | | | 3,900 | | | | 4,270,500 | | |
| IMC Global, Inc., Sr. Notes, 10.875%, 8/1/13 | | | 6,000 | | | | 6,990,000 | | |
| Innophos, Inc., Sr. Sub. Notes, 8.875%, 8/15/14(3) | | | 415 | | | | 417,075 | | |
| Lyondell Chemical Co., 11.125%, 7/15/12 | | | 1,170 | | | | 1,310,400 | | |
| Nalco Co., Sr. Sub. Notes, 8.875%, 11/15/13 | | | 3,310 | | | | 3,396,887 | | |
Nova Chemicals Corp., Sr. Notes, Variable Rate,
7.561%, 11/15/13(3) | | | 3,525 | | | | 3,577,875 | | |
| OM Group, Inc., 9.25%, 12/15/11 | | | 10,260 | | | | 9,926,550 | | |
See notes to financial statements
15
High Income Portfolio as of October 31, 2005
PORTFOLIO OF INVESTMENTS CONT'D
| Security | | Principal
Amount
(000's omitted) | | Value | |
| Chemicals (continued) | |
| Polyone Corp., Sr. Notes, 8.875%, 5/1/12 | | $ | 30 | | | $ | 26,775 | | |
| Polyone Corp., Sr. Notes, 10.625%, 5/15/10 | | | 3,030 | | | | 2,984,550 | | |
| PQ Corp., 7.50%, 2/15/13(3) | | | 1,305 | | | | 1,207,125 | | |
| Rhodia SA, Sr. Notes, 10.25%, 6/1/10 | | | 1,355 | | | | 1,449,850 | | |
Rockwood Specialties Group, Sr. Sub. Notes,
10.625%, 5/15/11 | | | 1,505 | | | | 1,617,875 | | |
| | | $ | 46,283,236 | | |
| Consumer Products — 1.0% | |
| Aearo Co. I, Sr. Sub. Notes, 8.25%, 4/15/12 | | $ | 1,905 | | | $ | 1,905,000 | | |
| Fedders North America, Inc., 9.875%, 3/1/14 | | | 2,982 | | | | 2,214,135 | | |
Jafra Cosmetics/Distribution, Sr. Sub. Notes,
10.75%, 5/15/11 | | | 1,260 | | | | 1,389,150 | | |
Jostens Holding Corp., Sr. Disc. Notes,
10.25%, (0.00% until 2008), 12/1/13 | | | 1,380 | | | | 1,003,950 | | |
| Samsonite Corp., Sr. Sub. Notes, 8.875%, 6/1/11 | | | 2,765 | | | | 2,861,775 | | |
WH Holdings Ltd./WH Capital Corp., Sr. Notes,
9.50%, 4/1/11 | | | 1,290 | | | | 1,406,100 | | |
| | | $ | 10,780,110 | | |
| Containers — 1.7% | |
| Crown Euro Holdings SA, 9.50%, 3/1/11 | | $ | 1,625 | | | $ | 1,787,500 | | |
| Crown Euro Holdings SA, 10.875%, 3/1/13 | | | 5,755 | | | | 6,776,512 | | |
Intertape Polymer US, Inc., Sr. Sub. Notes,
8.50%, 8/1/14 | | | 3,945 | | | | 3,807,375 | | |
| Pliant Corp. (PIK), 11.625%, 6/15/09(3) | | | 2,608 | | | | 2,716,273 | | |
| Solo Cup Co., Sr. Sub. Notes, 8.50%, 2/15/14 | | | 2,720 | | | | 2,244,000 | | |
| US Can Corp., Sr. Notes, 10.875%, 7/15/10 | | | 1,220 | | | | 1,262,700 | | |
| | | $ | 18,594,360 | | |
| Diversified Financial Services — 0.7% | |
| E*Trade Financial Corp., Sr. Notes, 8.00%, 6/15/11 | | $ | 745 | | | $ | 759,900 | | |
| Greenbrier Companies, Inc. (The), 8.375%, 5/15/15 | | | 4,740 | | | | 4,894,050 | | |
| Residential Capital Corp., 6.875%, 6/30/15(3) | | | 1,945 | | | | 2,051,386 | | |
| | | $ | 7,705,336 | | |
| Diversified Media — 3.2% | |
| Advanstar Communications, Inc., 10.75%, 8/15/10 | | $ | 6,120 | | | $ | 6,808,500 | | |
| CanWest Media, Inc., 8.00%, 9/15/12 | | | 19,508 | | | | 20,532,010 | | |
| LBI Media, Inc., 10.125%, 7/15/12 | | | 2,020 | | | | 2,156,350 | | |
LBI Media, Inc., Sr. Disc. Notes,
11.00%, (0.00% until 2008), 10/15/13 | | | 2,760 | | | | 2,035,500 | | |
| Nextmedia Operating, Inc., 10.75%, 7/1/11 | | | 3,260 | | | | 3,557,475 | | |
| | | $ | 35,089,835 | | |
| Security | | Principal
Amount
(000's omitted) | | Value | |
| Energy — 5.6% | |
| ANR Pipeline Co., 8.875%, 3/15/10 | | $ | 1,600 | | | $ | 1,725,163 | | |
Aventine Renewable Energy Holdings, Inc.,
Variable Rate, 9.87%, 12/15/11(3) | | | 2,860 | | | | 2,988,700 | | |
Clayton Williams Energy, Inc., Sr. Notes,
7.75%, 8/1/13(3) | | | 1,220 | | | | 1,183,400 | | |
| Coastal Corp., Sr. Debs., 9.625%, 5/15/12 | | | 2,880 | | | | 3,182,400 | | |
| El Paso Corp., Sr. Notes, 7.625%, 8/16/07 | | | 1,945 | | | | 1,983,900 | | |
| El Paso Production Holding Co., 7.75%, 6/1/13 | | | 630 | | | | 652,050 | | |
| Giant Industries, 8.00%, 5/15/14 | | | 2,845 | | | | 2,958,800 | | |
Hanover Compressor Co., Sr. Sub. Notes,
0.00%, 3/31/07 | | | 10,010 | | | | 8,883,875 | | |
| Hanover Equipment Trust, Series B, 8.75%, 9/1/11 | | | 2,120 | | | | 2,257,800 | | |
| Inergy L.P. / Finance, Sr. Notes, 6.875%, 12/15/14 | | | 4,700 | | | | 4,476,750 | | |
| Northwest Pipeline Corp., 8.125%, 3/1/10 | | | 825 | | | | 878,625 | | |
| Ocean Rig Norway AS, Sr. Notes, 8.375%, 7/1/13(3) | | | 1,225 | | | | 1,321,469 | | |
| Parker Drilling Co., Sr. Notes, 9.625%, 10/1/13 | | | 1,615 | | | | 1,833,025 | | |
| Petrobras International Finance Co., 7.75%, 9/15/14 | | | 670 | | | | 713,550 | | |
Petrobras International Finance, Sr. Notes,
9.125%, 7/2/13 | | | 1,925 | | | | 2,204,125 | | |
| Premcor Refining Group, Sr. Notes, 9.50%, 2/1/13 | | | 5,035 | | | | 5,651,787 | | |
| Ram Energy, Inc., Sr. Notes, 11.50%, 2/15/08 | | | 4,602 | | | | 4,855,110 | | |
| Southern Natural Gas, 8.875%, 3/15/10 | | | 1,200 | | | | 1,293,872 | | |
| Transmontaigne, Inc., Sr. Sub. Notes, 9.125%, 6/1/10 | | | 6,810 | | | | 6,775,950 | | |
| United Refining Co., Sr. Notes, 10.50%, 8/15/12 | | | 4,175 | | | | 4,425,500 | | |
| Williams Cos., Inc. (The), 8.75%, 3/15/32 | | | 1,265 | | | | 1,465,819 | | |
| | | $ | 61,711,670 | | |
| Entertainment/Film — 1.5% | |
AMC Entertainment, Inc., Sr. Sub. Notes,
9.875%, 2/1/12 | | $ | 2,700 | | | $ | 2,592,000 | | |
| Loews Cineplex Entertainment Corp., 9.00%, 8/1/14 | | | 9,795 | | | | 9,476,662 | | |
Marquee Holdings, Inc., Sr. Disc. Notes,
12.00%, (0.00% until 2009) 8/15/14 | | | 7,210 | | | | 4,380,075 | | |
| | | $ | 16,448,737 | | |
| Environmental — 1.8% | |
| Aleris International, Inc., 9.00%, 11/15/14 | | $ | 2,373 | | | $ | 2,432,325 | | |
| Aleris International, Inc., 10.375%, 10/15/10 | | | 1,730 | | | | 1,898,675 | | |
| Allied Waste North America, Series B, 8.875%, 4/1/08 | | | 4,935 | | | | 5,169,412 | | |
Allied Waste North America, Sr. Notes, Series B,
8.50%, 12/1/08 | | | 5,075 | | | | 5,303,375 | | |
| Waste Services, Inc., Sr. Sub Notes, 9.50%, 4/15/14 | | | 4,810 | | | | 4,785,950 | | |
| | | $ | 19,589,737 | | |
See notes to financial statements
16
High Income Portfolio as of October 31, 2005
PORTFOLIO OF INVESTMENTS CONT'D
| Security | | Principal
Amount
(000's omitted) | | Value | |
| Food & Drug Retail — 0.4% | |
| Rite Aid Corp., 7.125%, 1/15/07 | | $ | 1,705 | | | $ | 1,713,525 | | |
| Rite Aid Corp., 8.125%, 5/1/10 | | | 2,415 | | | | 2,427,075 | | |
| | | $ | 4,140,600 | | |
| Food/Beverage/Tobacco — 2.4% | |
| American Seafood Group, LLC, 10.125%, 4/15/10 | | $ | 6,165 | | | $ | 6,534,900 | | |
ASG Consolidated, LLC/ASG Finance, Inc.,
Sr. Disc. Notes, 11.50%, (0.00% until 2008) 11/1/11 | | | 5,130 | | | | 3,975,750 | | |
| Pierre Foods, Inc., Sr. Sub. Notes, 9.875%, 7/15/12 | | | 3,900 | | | | 3,958,500 | | |
Pinnacle Foods Holdings Corp., Sr. Sub. Notes,
8.25%, 12/1/13 | | | 5,720 | | | | 5,319,600 | | |
UAP Holding Corp., Sr. Disc. Notes,
10.75%, (0% until 2008) 7/15/12 | | | 6,370 | | | | 5,573,750 | | |
United Agricultural Products, Sr. Notes,
8.25%, 12/15/11 | | | 1,632 | | | | 1,721,760 | | |
| | | $ | 27,084,260 | | |
| Gaming — 5.3% | |
| CCM Merger, Inc., 8.00%, 8/1/13(3) | | $ | 2,960 | | | $ | 2,945,200 | | |
| Chukchansi EDA, Sr. Notes, 8.00%, 11/15/13(3)(4) | | | 1,425 | | | | 1,425,000 | | |
| Chukchansi EDA, Sr. Notes, 14.50%, 6/15/09(3) | | | 7,220 | | | | 8,844,500 | | |
Chukchansi EDA, Sr. Notes, Variable Rate,
7.86%, 11/15/12(3)(4) | | | 3,320 | | | | 3,320,000 | | |
| Eldorado Casino Shreveport, 10.00%, 8/1/12 | | | 890 | | | | 841,253 | | |
Inn of the Mountain Gods, Sr. Notes,
12.00%, 11/15/10 | | | 3,720 | | | | 3,999,000 | | |
| Majestic Star Casino LLC, 9.50%, 10/15/10 | | | 4,365 | | | | 4,294,069 | | |
Mohegan Tribal Gaming Authority, Sr. Sub. Notes,
8.00%, 4/1/12 | | | 1,570 | | | | 1,642,612 | | |
| OED Corp./Diamond Jo LLC, 8.75%, 4/15/12 | | | 4,355 | | | | 4,246,125 | | |
| San Pasqual Casino, 8.00%, 9/15/13(3) | | | 3,740 | | | | 3,740,000 | | |
| Seneca Gaming Corp., Sr. Notes, 7.25%, 5/1/12 | | | 1,645 | | | | 1,688,181 | | |
| Trump Entertainment Resorts, Inc., 8.50%, 6/1/15 | | | 11,250 | | | | 10,954,688 | | |
| Waterford Gaming LLC, Sr. Notes, 8.625%, 9/15/12(3) | | | 9,944 | | | | 10,739,520 | | |
| | | $ | 58,680,148 | | |
| Healthcare — 5.0% | |
AMR HoldCo, Inc./EmCare HoldCo, Inc., Sr. Sub. Notes,
10.00%, 2/15/15(3) | | $ | 4,020 | | | $ | 4,401,900 | | |
CDRV Investors, Inc., Sr. Disc. Notes,
9.625%, (0.00% until 2010) 1/1/15 | | | 4,835 | | | | 2,707,600 | | |
Inverness Medical Innovations, Inc., Sr. Sub. Notes,
8.75%, 2/15/12 | | | 3,715 | | | | 3,807,875 | | |
| Security | | Principal
Amount
(000's omitted) | | Value | |
| Healthcare (continued) | |
Medical Device Manufacturing, Inc., Series B,
10.00%, 7/15/12 | | $ | 2,850 | | | $ | 3,348,750 | | |
| Medquest, Inc., 11.875%, 8/15/12 | | | 4,945 | | | | 4,907,913 | | |
National Mentor, Inc., Sr. Sub. Notes,
9.625%, 12/1/12(3) | | | 1,580 | | | | 1,635,300 | | |
Quintiles Transnational Corp., Sr. Sub. Notes,
10.00%, 10/1/13 | | | 8,415 | | | | 9,330,131 | | |
| Res-Care, Inc., Sr. Notes, 7.75%, 10/15/13(3) | | | 2,370 | | | | 2,393,700 | | |
Service Corp. International, Sr. Notes,
7.00%, 6/15/17(3) | | | 1,240 | | | | 1,236,900 | | |
| US Oncology, Inc., 9.00%, 8/15/12 | | | 2,665 | | | | 2,824,900 | | |
| US Oncology, Inc., 10.75%, 8/15/14 | | | 5,315 | | | | 5,886,363 | | |
Vanguard Health Holding Co. II LLC, Sr. Sub. Notes,
9.00%, 10/1/14 | | | 5,965 | | | | 6,248,338 | | |
Ventas Realty L.P. / Capital Corp., Sr. Notes,
7.125%, 6/1/15 | | | 1,725 | | | | 1,789,688 | | |
VWR International, Inc., Sr. Sub. Notes,
8.00%, 4/15/14 | | | 4,715 | | | | 4,597,125 | | |
| | | $ | 55,116,483 | | |
| Homebuilders/Real Estate — 0.1% | |
CB Richard Ellis Services, Inc., Sr. Notes,
9.75%, 5/15/10 | | $ | 510 | | | $ | 561,000 | | |
| Stanley-Martin Co., 9.75%, 8/15/15(3) | | | 955 | | | | 883,375 | | |
| | | $ | 1,444,375 | | |
| Hotels — 0.8% | |
Felcor Lodging L.P., Sr. Notes, Variable Rate,
7.78%, 6/1/11 | | $ | 1,660 | | | $ | 1,716,025 | | |
| Host Marriot L.P., Series O, 6.375%, 3/15/15 | | | 510 | | | | 497,250 | | |
Meristar Hospitality Operations/Finance,
10.50%, 6/15/09 | | | 5,890 | | | | 6,250,763 | | |
| | | $ | 8,464,038 | | |
| Leisure — 2.0% | |
Six Flags Theme Parks, Inc., Sr. Notes,
8.875%, 2/1/10 | | $ | 4,490 | | | $ | 4,478,775 | | |
Universal City Development Partners, Sr. Notes,
11.75%, 4/1/10 | | | 9,600 | | | | 10,812,000 | | |
Universal City Florida Holding, Sr. Notes,
8.375%, 5/1/10 | | | 270 | | | | 278,100 | | |
Universal City Florida, Sr. Notes, Variable Rate,
8.443%, 5/1/10 | | | 6,185 | | | | 6,362,819 | | |
| | | $ | 21,931,694 | | |
See notes to financial statements
17
High Income Portfolio as of October 31, 2005
PORTFOLIO OF INVESTMENTS CONT'D
| Security | | Principal
Amount
(000's omitted) | | Value | |
| Metals/Mining — 0.5% | |
| Alpha Natural Resources, Sr. Notes, 10.25%, 6/1/12 | | $ | 1,665 | | | $ | 1,839,825 | | |
| Novelis, Inc., Sr. Notes, 7.25%, 2/15/15(3) | | | 3,880 | | | | 3,559,900 | | |
| | | $ | 5,399,725 | | |
| Paper — 3.6% | |
| Caraustar Industries, Inc., 7.375%, 6/1/09 | | $ | 485 | | | $ | 468,025 | | |
Caraustar Industries, Inc., Sr. Sub. Notes,
9.875%, 4/1/11 | | | 6,665 | | | | 6,565,025 | | |
| Domtar, Inc., 7.125%, 8/1/15 | | | 3,620 | | | | 3,077,000 | | |
| Georgia-Pacific Corp., 9.50%, 12/1/11 | | | 5,330 | | | | 6,209,450 | | |
| JSG Funding PLC, Sr. Notes, 9.625%, 10/1/12 | | | 6,275 | | | | 6,055,375 | | |
| Newark Group, Inc., Sr. Sub. Notes, 9.75%, 3/15/14 | | | 2,470 | | | | 2,136,550 | | |
| NewPage Corp., 10.00%, 5/1/12 | | | 8,055 | | | | 7,370,325 | | |
Norske Skog Canada Ltd., Sr. Notes, Series D,
8.625%, 6/15/11 | | | 740 | | | | 717,800 | | |
| Stone Container Corp., Sr. Notes, 9.25%, 2/1/08 | | | 7,160 | | | | 7,321,100 | | |
| | | $ | 39,920,650 | | |
| Publishing/Printing — 2.6% | |
American Media Operations, Inc., Series B,
10.25%, 5/1/09 | | $ | 7,379 | | | $ | 7,028,498 | | |
| CBD Media, Inc., Sr. Sub. Notes, 8.625%, 6/1/11 | | | 1,615 | | | | 1,647,300 | | |
Dex Media West LLC, Sr. Sub. Notes,
9.875%, 8/15/13 | | | 740 | | | | 819,550 | | |
| Houghton Mifflin Co., Sr. Sub. Notes, 9.875%, 2/1/13 | | | 7,595 | | | | 7,879,813 | | |
Merrill Corp., Series A, (PIK), Variable Rate,
12.00%, 5/1/09 | | | 1,780 | | | | 1,878,353 | | |
Merrill Corp., Series B, (PIK), Variable Rate,
12.00%, 5/1/09 | | | 8,212 | | | | 8,663,188 | | |
| WDAC Subsidiary Corp., Sr. Notes, 8.375%, 12/1/14(3) | | | 1,655 | | | | 1,568,113 | | |
| | | $ | 29,484,815 | | |
| Railroad — 0.6% | |
Grupo Transportacion Ferroviaria Mexicana SA de C.V.,
Sr. Notes, 9.375%, 5/1/12(3) | | $ | 5,190 | | | $ | 5,657,100 | | |
| TFM SA de C.V., Sr. Notes, 12.50%, 6/15/12(3) | | | 1,290 | | | | 1,496,400 | | |
| | | $ | 7,153,500 | | |
| Services — 2.1% | |
Hydrochem Industrial Services, Inc., Sr. Sub Notes,
9.25%, 2/15/13(3) | | $ | 1,015 | | | $ | 933,800 | | |
Knowledge Learning Center, Sr. Sub. Notes,
7.75%, 2/1/15(3) | | | 2,545 | | | | 2,379,575 | | |
| Security | | Principal
Amount
(000's omitted) | | Value | |
| Services (continued) | |
Muzak LLC/Muzak Finance, Sr. Notes,
10.00%, 2/15/09 | | $ | 2,640 | | | $ | 2,270,400 | | |
Norcross Safety Products LLC/Norcross Capital Corp.,
Sr. Sub. Notes, Series B, 9.875%, 8/15/11 | | | 5,555 | | | | 5,943,850 | | |
NSP Holdings/NSP Holdings Capital Corp.,
Sr. Notes (PIK), 11.75%, 1/1/12 | | | 2,835 | | | | 2,836,907 | | |
Safety Products Holdings, Sr. Notes (PIK),
11.75%, 1/1/12(3) | | | 1,100 | | | | 1,100,916 | | |
| United Rentals North America, Inc., 6.50%, 2/15/12 | | | 930 | | | | 896,288 | | |
United Rentals North America, Inc., Sr. Sub. Notes,
7.00%, 2/15/14 | | | 7,900 | | | | 7,307,500 | | |
| | | $ | 23,669,236 | | |
| Steel — 0.4% | |
| Ispat Inland ULC, Sr. Notes, 9.75%, 4/1/14 | | $ | 2,915 | | | $ | 3,308,525 | | |
| Oregon Steel Mills, Inc., 10.00%, 7/15/09 | | | 1,340 | | | | 1,443,850 | | |
| | | $ | 4,752,375 | | |
| Super Retail — 2.3% | |
| Affinity Group, Inc., Sr. Sub. Notes, 9.00%, 2/15/12 | | $ | 3,815 | | | $ | 3,795,925 | | |
| GSC Holdings Corp., 8.00%, 10/1/12(3) | | | 9,825 | | | | 9,603,938 | | |
| GSC Holdings Corp., Variable Rate, 7.875%, 10/1/11(3) | | | 5,940 | | | | 5,969,700 | | |
Neiman Marcus Group, Inc., Sr. Notes,
9.00%, 10/15/15(3) | | | 940 | | | | 928,250 | | |
Neiman Marcus Group, Inc., Sr. Sub. Notes,
10.375%, 10/15/15(3) | | | 5,920 | | | | 5,742,400 | | |
| | | $ | 26,040,213 | | |
| Technology — 4.1% | |
Advanced Micro Devices, Inc., Senior Notes,
7.75%, 11/1/12 | | $ | 7,830 | | | $ | 7,869,150 | | |
| Amkor Technologies, Inc., Sr. Notes, 7.125%, 3/15/11 | | | 1,755 | | | | 1,526,850 | | |
| Amkor Technologies, Inc., Sr. Notes, 7.75%, 5/15/13 | | | 10,385 | | | | 8,905,138 | | |
CPI Holdco, Inc., Sr. Notes, Variable Rate,
9.672%, 2/1/15 | | | 1,545 | | | | 1,522,234 | | |
Stratus Technologies, Inc., Sr. Notes,
10.375%, 12/1/08 | | | 868 | | | | 881,020 | | |
Sungard Data Systems, Inc., Sr. Notes,
9.125%, 8/15/13(3) | | | 5,060 | | | | 5,161,200 | | |
Sungard Data Systems, Inc., Sr. Notes, Variable Rate,
8.525%, 8/15/13(3) | | | 1,170 | | | | 1,205,100 | | |
Sungard Data Systems, Inc., Sr. Sub. Notes,
10.25%, 8/15/15(3) | | | 4,340 | | | | 4,323,725 | | |
| UGS Corp., 10.00%, 6/1/12 | | | 12,660 | | | | 13,894,350 | | |
| | | $ | 45,288,767 | | |
See notes to financial statements
18
High Income Portfolio as of October 31, 2005
PORTFOLIO OF INVESTMENTS CONT'D
| Security | | Principal
Amount
(000's omitted) | | Value | |
| Telecommunications — 10.1% | |
| AirGate PCS, Inc., Variable Rate, 7.90%, 10/15/11 | | $ | 1,350 | | | $ | 1,390,500 | | |
Alamosa Delaware, Inc., Sr. Disc. Notes,
12.00%, (0.00% until 2005), 7/31/09 | | | 2,270 | | | | 2,497,000 | | |
| Alamosa Delaware, Inc., Sr. Notes, 11.00%, 7/31/10 | | | 7,270 | | | | 8,087,875 | | |
Centennial Cellular Operating Co./Centennial
Communications Corp., Sr. Notes, 10.125%, 6/15/13 | | | 13,400 | | | | 15,041,500 | | |
| Digicel Ltd., Sr. Notes, 9.25%, 9/1/12(3) | | | 1,200 | | | | 1,242,000 | | |
| Inmarsat Finance PLC, 7.625%, 6/30/12 | | | 3,429 | | | | 3,484,721 | | |
Intelsat Bermuda Ltd., Sr. Notes, Variable Rate,
8.695%, 1/15/12(3) | | | 6,795 | | | | 6,913,913 | | |
| Intelsat Ltd., Sr. Notes, 5.25%, 11/1/08 | | | 12,000 | | | | 11,040,000 | | |
IWO Holdings, Inc.,
10.75%, (0.00% until 2010) 1/15/15 | | | 2,470 | | | | 1,778,400 | | |
| IWO Holdings, Inc., 14.00%, 1/15/11(2) | | | 7,490 | | | | 0 | | |
| IWO Holdings, Inc., Variable Rate, 7.90%, 1/15/12 | | | 675 | | | | 705,375 | | |
| LCI International, Inc., Sr. Notes, 7.25%, 6/15/07 | | | 9,405 | | | | 9,334,463 | | |
New Skies Satellites NV, Sr. Notes, Variable Rate,
8.539%, 11/1/11 | | | 2,525 | | | | 2,600,750 | | |
New Skies Satellites NV, Sr. Sub. Notes,
9.125%, 11/1/12 | | | 4,450 | | | | 4,539,000 | | |
| Qwest Capital Funding, Inc., 6.375%, 7/15/08 | | | 2,240 | | | | 2,189,600 | | |
Qwest Communications International, Inc.,
7.25%, 2/15/11 | | | 1,525 | | | | 1,490,688 | | |
Qwest Communications International, Inc., Sr. Notes,
7.50%, 2/15/14(3) | | | 10,750 | | | | 10,346,875 | | |
| Qwest Corp., Sr. Notes, 7.625%, 6/15/15(3) | | | 2,510 | | | | 2,585,300 | | |
| Qwest Services Corp., 13.50%, 12/15/10 | | | 7,290 | | | | 8,365,275 | | |
| Rogers Wireless, Inc., 7.50%, 3/15/15 | | | 2,170 | | | | 2,338,175 | | |
| Rogers Wireless, Inc., Sr. Sub. Notes, 8.00%, 12/15/12 | | | 1,610 | | | | 1,710,625 | | |
| Rogers Wireless, Inc., Variable Rate, 6.995%, 12/15/10 | | | 3,870 | | | | 4,024,800 | | |
SBA Telecommunications, Sr. Disc. Notes,
9.75%, (0.00% until 2007), 12/15/11 | | | 2,068 | | | | 1,876,710 | | |
Telemig Celular SA/Amazonia Celular SA,
8.75%, 1/20/09(3) | | | 2,030 | | | | 2,101,050 | | |
| U.S. West Communications, Debs., 7.20%, 11/10/26 | | | 585 | | | | 538,200 | | |
| UbiquiTel Operating Co., Sr. Notes, 9.875%, 3/1/11 | | | 5,915 | | | | 6,491,713 | | |
| | | $ | 112,714,508 | | |
| Textiles/Apparel — 2.8% | |
| Levi Strauss & Co., Sr. Notes, 9.75%, 1/15/15 | | $ | 1,235 | | | $ | 1,253,525 | | |
| Levi Strauss & Co., Sr. Notes, 12.25%, 12/15/12 | | | 9,570 | | | | 10,550,925 | | |
Levi Strauss & Co., Sr. Notes, Variable Rate,
8.804%, 4/1/12 | | | 3,020 | | | | 3,012,450 | | |
| Oxford Industries, Inc., Sr. Notes, 8.875%, 6/1/11 | | | 6,665 | | | | 6,864,950 | | |
Perry Ellis International, Inc., Sr. Sub. Notes,
8.875%, 9/15/13 | | | 2,860 | | | | 2,895,750 | | |
| Phillips Van-Heusen, Sr. Notes, 7.25%, 2/15/11 | | | 1,350 | | | | 1,370,250 | | |
| Security | | Principal
Amount
(000's omitted) | | Value | |
| Textiles/Apparel (continued) | |
| Phillips Van-Heusen, Sr. Notes, 8.125%, 5/1/13 | | $ | 3,615 | | | $ | 3,804,788 | | |
| Quiksilver, Inc., Sr. Notes, 6.875%, 4/15/15(3) | | | 1,650 | | | | 1,538,625 | | |
| | | $ | 31,291,263 | | |
| Transportation Ex Air/Rail — 0.8% | |
H-Lines Finance Holding Corp., Sr. Disc. Notes,
11.00%, (0.00% until 2008) 4/1/13 | | $ | 2,681 | | | $ | 2,218,528 | | |
| Horizon Lines, LLC, 9.00%, 11/1/12(3) | | | 2,837 | | | | 3,024,951 | | |
| OMI Corp., Sr. Notes, 7.625%, 12/1/13 | | | 1,260 | | | | 1,297,800 | | |
Quality Distribution LLC / QD Capital Corp.,
Variable Rate, 8.65%, 1/15/12 | | | 2,100 | | | | 2,029,125 | | |
| | | $ | 8,570,404 | | |
| Utilities — 2.7% | |
| AES Corp., Sr. Notes, 8.75%, 5/15/13(3) | | $ | 2,030 | | | $ | 2,202,550 | | |
| AES Corp., Sr. Notes, 8.875%, 2/15/11 | | | 457 | | | | 491,275 | | |
| AES Corp., Sr. Notes, 9.00%, 5/15/15(3) | | | 1,585 | | | | 1,727,650 | | |
| AES Corp., Sr. Notes, 9.375%, 9/15/10 | | | 3,519 | | | | 3,835,710 | | |
| AES Eastern Energy, Series 99-A, 9.00%, 1/2/17 | | | 2,518 | | | | 2,909,680 | | |
| Calpine Corp., Sr. Notes, 8.75%, 7/15/07 | | | 550 | | | | 335,500 | | |
| Dynegy Holdings, Inc., Debs., 7.625%, 10/15/26 | | | 2,485 | | | | 2,199,225 | | |
| Dynegy Holdings, Inc., Sr. Notes, 10.125%, 7/15/13(3) | | | 2,690 | | | | 2,972,450 | | |
| Mission Energy Holding Co., 13.50%, 7/15/08 | | | 3,895 | | | | 4,527,938 | | |
| NRG Energy, Inc., 8.00%, 12/15/13 | | | 1,422 | | | | 1,557,090 | | |
| Orion Power Holdings, Inc., Sr. Notes, 12.00%, 5/1/10 | | | 6,490 | | | | 7,658,200 | | |
| | | $ | 30,417,268 | | |
Total Corporate Bonds & Notes
(identified cost $964,167,995) | | | | | | $ | 980,035,350 | | |
| Convertible Bonds — 2.1% | |
| Security | | Principal
Amount
(000's omitted) | | Value | |
| Amkor Technologies, Inc., 5.75%, 6/1/06 | | $ | 1,580 | | | $ | 1,528,650 | | |
| Kerzner International Ltd., 2.375%, 4/15/24(3) | | | 2,720 | | | | 3,087,200 | | |
| L-3 Communications Corp., 3.00%, 8/1/35(3) | | | 3,890 | | | | 3,928,900 | | |
| Nortel Networks Ltd., 4.25%, 9/1/08 | | | 11,760 | | | | 11,039,700 | | |
| Sinclair Broadcast Group, Inc., 4.875%, 7/15/18 | | | 1,275 | | | | 1,126,781 | | |
| XM Satellite Radio Holdings, Inc., 1.75%, 12/1/09 | | | 1,185 | | | | 1,029,469 | | |
| XM Satellite Radio, Inc., 1.75%, 12/1/09(3) | | | 2,450 | | | | 2,128,437 | | |
Total Convertible Bonds
(identified cost, $23,841,492) | | | | | | $ | 23,869,137 | | |
See notes to financial statements
19
High Income Portfolio as of October 31, 2005
PORTFOLIO OF INVESTMENTS CONT'D
| Common Stocks — 0.9% | |
| Security | | Shares | | Value | |
| Gaming — 0.7% | |
Peninsula Gaming LLC, Convertible Preferred
Membership Interests(5)(6) | | | 25,351 | | | $ | 152,107 | | |
| Shreveport Gaming Holdings, Inc.(4)(6) | | | 6,014 | | | | 107,350 | | |
| Trump Entertainment Resorts, Inc.(6) | | | 427,818 | | | | 7,343,496 | | |
| | | $ | 7,602,953 | | |
| Telecommunications — 0.2% | |
| Crown Castle International Corp.(6) | | | 49,828 | | | $ | 1,221,533 | | |
| New Skies Satellites Holdings, Ltd. | | | 35,300 | | | | 790,720 | | |
| | | $ | 2,012,253 | | |
Total Common Stocks
(identified cost $6,726,631) | | | | | | $ | 9,615,206 | | |
| Convertible Preferred Stocks — 1.7% | |
| Security | | Shares | | Value | |
| Energy — 0.9% | |
| Chesapeake Energy Corp., 5.00% | | | 11,225 | | | $ | 2,230,969 | | |
| Chesapeake Energy Corp., 4.50% | | | 32,900 | | | | 3,384,587 | | |
| Williams Holdings of Delaware, 5.50%(3) | | | 45,592 | | | | 4,798,558 | | |
| | | $ | 10,414,114 | | |
| Telecommunications — 0.7% | |
| Crown Castle International Corp., (PIK), 6.25% | | | 138,027 | | | $ | 7,108,391 | | |
| | | $ | 7,108,391 | | |
| Utilities — 0.1% | |
| NRG Energy, Inc., 4.00%(3) | | | 865 | | | $ | 1,063,085 | | |
| | | $ | 1,063,085 | | |
Total Convertible Preferred Stocks
(identified cost $13,705,966) | | | | | | $ | 18,585,590 | | |
| Warrants — 0.2% | |
| Security | | Shares | | Value | |
| Cable/Satellite TV — 0.0% | |
| Ono Finance PLC, Exp. 3/16/11(3)(4)(6) | | | 3,370 | | | $ | 0 | | |
| Ono Finance PLC, Exp. 5/31/09(4)(6) | | | 9,690 | | | | 0 | | |
| Ono Finance PLC, Exp. 5/31/09(4)(6) | | EUR | 3,390 | | | | 0 | | |
| | | $ | 0 | | |
| Capital Goods — 0.1% | |
| Mueller Holdings, Inc., Exp. 4/15/14(3)(6) | | | 2,325 | | | $ | 942,206 | | |
| | | $ | 942,206 | | |
| Consumer Products — 0.0% | |
| HF Holdings, Inc., Exp. 9/27/09(4)(6) | | | 13,600 | | | $ | 0 | | |
| | | $ | 0 | | |
| Restaurants — 0.0% | |
| New World Coffee, Exp. 6/15/06(5)(6) | | | 1,244 | | | $ | 13 | | |
| | | $ | 13 | | |
| Technology — 0.0% | |
| Asat Finance, Exp. 11/1/06(3)(4)(6) | | | 5,660 | | | $ | 170 | | |
| | | $ | 170 | | |
| Telecommunications — 0.1% | |
| American Tower Corp., Exp. 8/1/08(3)(6) | | | 5,070 | | | $ | 1,711,219 | | |
| | | $ | 1,711,219 | | |
| Transportation Ex Air/Rail — 0.0% | |
| Quality Distribution, Inc., Exp.1/15/07(4)(6) | | | 3,266 | | | $ | 26,847 | | |
| | | $ | 26,847 | | |
Total Warrants
(identified cost $1,182,468) | | | | | | $ | 2,680,455 | | |
| Miscellaneous — 0.0% | |
| Security | | Shares | | Value | |
| Trump Atlantic City(4)(6) | | | 6,815,000 | | | $ | 262,378 | | |
Total Miscellaneous
(identified cost $0) | | | | | | $ | 262,378 | | |
See notes to financial statements
20
High Income Portfolio as of October 31, 2005
PORTFOLIO OF INVESTMENTS CONT'D
| Commercial Paper — 2.5% | |
| Security | | Principal
Amount
(000's omitted) | | Value | |
| General Electric Capital Corp., 4.02%, 11/1/05 | | $ | 27,296 | | | $ | 27,296,000 | | |
Total Commercial Paper
(at amortized cost, $27,296,000) | | | | $ | 27,296,000 | | |
| Short-Term Investments — 0.2% | |
| Security | | Principal
Amount
(000's omitted) | | Value | |
Investors Bank and Trust Company Time Deposit,
4.03%, 11/1/05 | | $ | 2,000 | | | $ | 2,000,000 | | |
Total Short-Term Investments
(at amortized cost, $2,000,000) | | | | $ | 2,000,000 | | |
Total Investments — 98.9%
(identified cost $1,072,024,987) | | | | $ | 1,098,088,878 | | |
| Other Assets, Less Liabilities — 1.1% | | | | $ | 12,049,974 | | |
| Net Assets — 100.0% | | | | $ | 1,110,138,852 | | |
EUR - Euro
PIK - Payment In Kind.
(1) Senior floating-rate interests often require prepayments from excess cash flows or permit the borrower to repay at its election. The degree to which borrowers repay, whether as a contractual requirement or at their election, cannot be predicted with accuracy. As a result, the actual remaining maturity may be substantially less than the stated maturities shown. However, it is anticipated that the senior floating-rate interests will have an expected average life of approximately two to three years. The stated interest rate represents the weighted average interest rate of all contracts within the senior loan facility. Senior Loans typically have rates of interest which are redetermined either daily, monthly, quarterly or semi-annually by reference to a base lending rate, plus a premium. These base lending rates are primarily the London - -Interbank Offered Rate ("LIBOR"), and secondarily the prime rate offered by one or more major United States banks (the "Prime Rate") and the certificate of deposit ("CD") rate or other base lending rates used by commercial lenders.
(2) Defaulted security.
(3) Security exempt from registration under Rule 144A of the Securities Act of 1933. These securities may be sold in transactions exempt from registration, normally to qualified institutional buyers. At October 31, 2005, the aggregate value of the securities is $218,354,263 or 19.7% of the Fund's net assets.
(4) Security valued at fair value using methods determined in good faith by or at the direction of the Trustees.
(5) Restricted security.
(6) Non-income producing security.
See notes to financial statements
21
High Income Portfolio as of October 31, 2005
FINANCIAL STATEMENTS
Statement of Assets and Liabilities
As of October 31, 2005
| Assets | |
| Investments, at value (identified cost, $1,072,024,987) | | $ | 1,098,088,878 | | |
| Cash | | | 3,440 | | |
| Receivable for investments sold | | | 5,286,981 | | |
| Receivable for open swap contracts | | | 254,232 | | |
| Interest and dividends receivable | | | 23,135,587 | | |
| Receivable for open forward foreign currency contracts | | | 37,066 | | |
| Total assets | | $ | 1,126,806,184 | | |
| Liabilities | |
| Payable for investments purchased | | $ | 16,017,000 | | |
| Payable to affiliate for investment advisory fee | | | 517,561 | | |
| Miscellaneous liabilities | | | 14,661 | | |
| Payable to affiliate for Trustees' fees | | | 2,352 | | |
| Accrued expenses | | | 115,758 | | |
| Total liabilities | | $ | 16,667,332 | | |
| Net Assets applicable to investors' interest in Portfolio | | $ | 1,110,138,852 | | |
| Sources of Net Assets | |
| Net proceeds from capital contributions and withdrawals | | $ | 1,083,787,921 | | |
| Net unrealized appreciation (computed on the basis of identified cost) | | | 26,350,931 | | |
| Total | | $ | 1,110,138,852 | | |
Statement of Operations
For the Year Ended
October 31, 2005
| Investment Income | |
| Interest | | $ | 100,261,561 | | |
| Dividends | | | 431,179 | | |
| Miscellaneous | | | 1,940,034 | | |
| Total investment income | | $ | 102,632,774 | | |
| Expenses | |
| Investment adviser fee | | $ | 6,335,720 | | |
| Trustees' fees and expenses | | | 25,004 | | |
| Custodian fee | | | 330,747 | | |
| Legal and accounting services | | | 99,186 | | |
| Miscellaneous | | | 74,774 | | |
| Total expenses | | $ | 6,865,431 | | |
Deduct —
Reduction of custodian fee | | $ | 2,852 | | |
| Total expense reductions | | $ | 2,852 | | |
| Net expenses | | $ | 6,862,579 | | |
| Net investment income | | $ | 95,770,195 | | |
Realized and Unrealized
Gain (Loss) | |
Net realized gain (loss) —
Investment transactions (identified cost basis) | | $ | 21,521,751 | | |
| Swap contracts | | | (12,133 | ) | |
Foreign currency and forward foreign currency exchange
contract transactions | | | 135,306 | | |
| Net realized gain | | $ | 21,644,924 | | |
Change in unrealized appreciation (depreciation) —
Investments (identified cost basis) | | $ | (43,916,340 | ) | |
| Swap contracts | | | 254,232 | | |
| Foreign currency and forward foreign currency exchange contracts | | | 6,742 | | |
| Net change in unrealized appreciation (depreciation) | | $ | (43,655,366 | ) | |
| Net realized and unrealized loss | | $ | (22,010,442 | ) | |
| Net increase in net assets from operations | | $ | 73,759,753 | | |
See notes to financial statements
22
High Income Portfolio as of October 31, 2005
FINANCIAL STATEMENTS CONT'D
Statements of Changes in Net Assets
Increase (Decrease)
in Net Assets | | Year Ended
October 31, 2005 | | Year Ended
October 31, 2004 | |
From operations —
Net investment income | | $ | 95,770,195 | | | $ | 105,551,363 | | |
Net realized gain from investments,
swap contracts, foreign currency and
forward foreign currency exchange
contract transactions | | | 21,644,924 | | | | 13,246,595 | | |
Net change in unrealized appreciation
(depreciation) from investments,
swap contracts, foreign currency and
forward foreign currency
exchange contracts | | | (43,655,366 | ) | | | 27,536,858 | | |
| Net increase in net assets from operations | | $ | 73,759,753 | | | $ | 146,334,816 | | |
Capital transactions —
Contributions | | $ | 158,885,097 | | | $ | 289,846,419 | | |
| Withdrawals | | | (414,478,617 | ) | | | (308,251,669 | ) | |
Net decrease in net assets from
capital transactions | | $ | (255,593,520 | ) | | $ | (18,405,250 | ) | |
| Net increase (decrease) in net assets | | $ | (181,833,767 | ) | | $ | 127,929,566 | | |
| Net Assets | |
| At beginning of year | | $ | 1,291,972,619 | | | $ | 1,164,043,053 | | |
| At end of year | | $ | 1,110,138,852 | | | $ | 1,291,972,619 | | |
See notes to financial statements
23
High Income Portfolio as of October 31, 2005
FINANCIAL STATEMENTS CONT'D
Supplementary Data
| | | Year Ended October 31, | |
| | | 2005 | | 2004 | | 2003 | | 2002(1) | | 2001 | |
| Ratios/Supplemental Data | |
| Ratios (As a percentage of average daily net assets): | |
| Expenses | | | 0.58 | % | | | 0.59 | % | | | 0.66 | % | | | 0.64 | % | | | 0.67 | % | |
| Expenses after custodian fee reduction | | | 0.58 | % | | | 0.59 | % | | | 0.66 | % | | | 0.64 | % | | | 0.67 | % | |
| Net investment income | | | 8.06 | % | | | 8.61 | % | | | 10.04 | % | | | 10.38 | % | | | 11.96 | % | |
| Portfolio Turnover | | | 62 | % | | | 80 | % | | | 122 | % | | | 88 | % | | | 83 | % | |
| Total Return(2) | | | 6.54 | % | | | 12.79 | % | | | 34.76 | % | | | (4.36 | )% | | | — | | |
| Net assets, end of year (000's omitted) | | $ | 1,110,139 | | | $ | 1,291,973 | | | $ | 1,164,043 | | | $ | 889,653 | | | $ | 1,186,751 | | |
(1) The Portfolio has adopted the provisions of the revised AICPA Audit and Accounting Guide for Investment Companies and began using the interest method to amortize premiums on fixed-income securities. The effect of this change for the year ended October 31, 2002 was to decrease the ratio of net investment income to average net assets from 10.59% to 10.38%. Ratios for the periods prior to November 1, 2001 have not been restated to reflect this change in presentation.
(2) Total return is required to be disclosed for fiscal years beginning after December 15, 2000.
See notes to financial statements
24
High Income Portfolio as of October 31, 2005
NOTES TO FINANCIAL STATEMENTS
1 Significant Accounting Policies
High Income Portfolio (the Portfolio) is registered under the Investment Company Act of 1940 as an open-end management investment company which was organized as a trust under the laws of the State of New York on May 1, 1992. The Declaration of Trust permits the Trustees to issue interests in the Portfolio. At October 31, 2005 Eaton Vance High Income Fund, Eaton Vance Floating-Rate High Income Fund and Eaton Vance Strategic Income Fund held an approximate 65.6%, 21.7% and 5.5% interest in the Portfolio, respectively. The following is a summary of significant accounting policies of the Portfolio. The policies are in conformity with accounting principles generally accepted in the United States of America.
A Investment Valuations — Investments listed on securities exchanges are valued at closing sale prices. Investments listed on the NASDAQ National Market System are valued at the NASDAQ official closing price. Listed or unlisted investments for which closing sale prices are not available are valued at the mean between the latest bid and asked prices. Fixed income investments (other than short-term obligations), including listed investments and investments for which price quotations are available, will normally be valued on the basis of market valuations furnished by a pricing service. Financial futures contracts listed on commodity exchanges are valued at closing settlement prices. Short-term obligations, maturing in sixty days or less, are valued at amortized cost, which approximates fair value. The Portfolio also invests in interests in senior floating rate loans (Senior Loans). The Portfolio's investment adviser, Boston Management and Research (BMR) a wholly owned subsidiary of Eaton Vance Management (EVM), has characterized certain Senior Loans as liquid based on a predetermined acceptable number and range of market quotations available. Such loans are valued on the basis of market valuations furnished by a pricing service. Investments for which there are no quotations or valuations are valued at fair value using methods determined in good faith by or at the direction of the Trustees. Other Senior Loans are valued at fair value by BMR under procedures established by the Trustees as permitted by section 2(a)(41) of the Investment Company Act of 1940.
B Income — Interest income is determined on the basis of interest accrued, adjusted for amortization of premium or discount. Dividend income is recorded on ex-dividend date for dividends received in cash and/or securities. However, if the ex-dividend date has passed, certain dividends from foreign securities are recorded as the Portfolio is informed of the ex-dividend date.
C Income Taxes — The Portfolio has elected to be treated as a partnership for United States Federal tax purposes. No provision is made by the Portfolio for federal or state taxes on any taxable income of the Portfolio because each investor in the Portfolio is ultimately responsible for the payment of any taxes. Since some of the Portfolio's investors are regulated investment companies that invest all or substantially all of their assets in the Portfolio, the Portfolio normally must satisfy the applicable source of income and diversification requirements (under the Internal Revenue Code) in order for its investors to satisfy them. The Portfolio will allocate at least annually among its investors each investor's distributive share of the Portfolio's net taxable investment i ncome, net realized capital gains, and any other items of income, gain, loss, deduction or credit.
D Expense Reduction — Investors Bank & Trust Company (IBT) serves as custodian to the Portfolio. Pursuant to the custodian agreement, IBT receives a fee reduced by credits which are determined based on the average daily cash balances the Portfolio maintains with IBT. All credit balances used to reduce the Portfolio's custodian fees are reported as a reduction of total expenses on the Statement of Operations.
E Financial Futures Contracts — Upon the entering of a financial futures contract, the Portfolio is required to deposit (initial margin) either in cash or securities an amount equal to a certain percentage of the purchase price indicated in the financial futures contract. Subsequent payments are made or received by the Portfolio (margin maintenance) each day, dependent on the daily fluctuations in the value of the underlying security, and are recorded for book purposes as unrealized gains or losses by the Portfolio. The Portfolio's investment in financial futures contracts is designed only to hedge against anticipated future changes in interest rates. Should interest rates move unexpectedly, the Portfolio may not achieve the anticipated benefits of the financial futures c ontracts and may realize a loss.
F Foreign Currency Translation — Investment valuations, other assets, and liabilities initially expressed in foreign currencies are converted each business day into U.S. dollars based upon current exchange rates. Purchases and sales of foreign investment securities and income and expenses are converted into U.S. dollars based upon currency exchange rates prevailing on the respective dates of such transactions. Realized gains or losses on investment transactions attributable to changes in foreign currency exchange rates are recorded for financial statement
25
High Income Portfolio as of October 31, 2005
NOTES TO FINANCIAL STATEMENTS CONT'D
purposes as net realized gains and losses on investments. That portion of unrealized gains and losses on investments that results from fluctuations in foreign currency exchange rates is not separately disclosed.
G Forward Foreign Currency Exchange Contracts — The Portfolio may enter into forward foreign currency exchange contracts for the purchase or sale of a specific foreign currency at a fixed price on a future date. Risks may arise upon entering these contracts from the potential inability of counterparties to meet the terms of their contracts and from movements in the value of a foreign currency relative to the U.S. dollar. The Portfolio will enter into forward contracts for hedging purposes as well as non-hedging purposes. The forward foreign currency exchange contracts are adjusted by the daily exchange rate of the underlying currency and any gains or losses are recorded for financial statement purposes as unrealized until such time as the contracts have been closed.
H Credit Default Swaps — The Portfolio may enter into credit default swaps to buy or sell credit protection on an individual issuer or a basket of issuers of bonds. When the Portfolio is the buyer of a credit default swap contract, the Portfolio is entitled to receive the par or other agreed-upon value, of a referenced debt obligation from the counterparty to the contract in the event of a default by a third party, such as a U.S. or foreign corporate issuer, on the debt obligation. In return, the Portfolio would pay the counterparty a periodic stream of payments over the term of the contract provided that no event of default has occurred. If no default occurs, the Portfolio would have spent the stream of payments and received no benefit from the contract. When the Portfol io is the seller of a credit default swap contract, it receives the stream of payments, but is obligated to pay upon default of the referenced debt obligation. As the seller, the Portfolio would effectively add leverage to its portfolio because, in addition to its total net assets, the Portfolio would be subject to investment exposure on the notional amount of the swap. During the period that the credit default swap contract is open, the contract is marked to market in accordance with the terms of the contract based on the current interest rate spreads and credit risk of the referred obligation of the underlying issuer and interest accrual through valuation date. Changes in the value of credit default swap contracts are recorded as unrealized gains or losses and periodic cash settlements are recorded as realized gains or losses. The Portfolio will segregate assets in the form of cash and cash equivalents in an amount equal to the aggregate market value of the credit default swaps of which it is the seller, m arked to market on a daily basis. These transactions involve certain risks, including the risk that the seller may be unable to fulfill the transaction.
I Use of Estimates — The preparation of the financial statements in conformity with accounting principles generally accepted in the United States of America requires management to make estimates and assumptions that affect the reported amounts of assets and liabilities at the date of the financial statements and the reported amount of revenue and expense during the reporting period. Actual results could differ from those estimates.
J Indemnifications — Under the Portfolio's organizational documents, its officers and Trustees may be indemnified against certain liabilities and expenses arising out of the performance of their duties to the Portfolio. Interestholders in the Portfolio are jointly and severally liable for the liabilities and obligations of the Portfolio in the event that the Portfolio fails to satisfy such liabilities and obligations; provided, however, that, to the extent assets are available in the Portfolio, the Portfolio may, under certain circumstances, indemnify interestholders from and against any claim or liability to which such holder may become subject by reason of being or having been an interestholder in the Portfolio. Additionally, in the normal course of business, the Portfo lio enters into agreements with service providers that may contain indemnification clauses. The Portfolio's maximum exposure under these arrangements is unknown as this would involve future claims that may be made against the Portfolio that have not yet occurred.
K Other — Investment transactions are accounted for on a trade date basis. Realized gains and losses are computed based on the specific identification of the securities sold.
2 Investment Adviser Fee and Other Transactions with Affiliates
The investment adviser fee is earned by BMR, a wholly-owned subsidiary of EVM, as compensation for management and investment advisory services rendered to the Portfolio. The fee is based upon a percentage of average daily net assets plus a percentage of gross income (i.e., income other than gains from the sale of securities). For the year ended October 31, 2005, the fee was equivalent to 0.53% of the Portfolio's average daily net assets and amounted to $6,335,720. Except as to Trustees of the Portfolio who are not members of EVM's or BMR's organization, officers and Trustees receive remuneration for their services to the Portfolio out of such investment adviser fee. Certain officers and Trustees of the Portfolio are officers of the above organizations. Trustees of the Portfolio
26
High Income Portfolio as of October 31, 2005
NOTES TO FINANCIAL STATEMENTS CONT'D
that are not affiliated with the investment adviser may elect to defer receipt of all or a portion of their annual fees in accordance with the terms of the Trustees Deferred Compensation Plan. For the year ended October 31, 2005, no significant amounts have been deferred.
3 Investments
The Portfolio invests primarily in debt securities. The ability of the issuers of the debt securities held by the Portfolio to meet their obligations may be affected by economic developments in a specific industry. Purchases and sales of investments, other than U.S. Government securities and short-term obligations, aggregated $715,922,979 and $817,279,393, respectively, for the year ended October 31, 2005.
4 Line of Credit
The Portfolio participates with other portfolios and funds managed by BMR and EVM and its affiliates in a $150 million unsecured line of credit agreement with a group of banks. Borrowings will be made by the Portfolio solely to facilitate the handling of unusual and/or unanticipated short-term cash requirements. Interest is charged to each participating portfolio or fund based on its borrowings at an amount above either the Eurodollar rate or federal funds rate. In addition, a fee computed at an annual rate of 0.10% on the daily unused portion of the line of credit is allocated among the participating portfolios and funds at the end of each quarter. The Portfolio did not have any significant borrowings or allocated fees during the year ended October 31, 2005.
5 Financial Instruments
The Portfolio regularly trades in financial instruments with off-balance sheet risk in the normal course of its investing activities to assist in managing exposure to various market risks. These financial instruments include written options, forward foreign currency contracts, financial futures contracts and swap contracts and may involve, to a varying degree, elements of risk in excess of the amounts recognized for financial statement purposes. The notional or contractual amounts of these instruments represent the investment the Portfolio has in particular classes of financial instruments and does not necessarily represent the amounts potentially subject to risk. The measurement of the risks associated with these instruments is meaningful only when all related and offsetting transactions are considered. A summary of obligations under these financial instrum ents at October 31, 2005 is as follows:
Forward Foreign Currency Exchange Contracts
Sales
Settlement
Date(s) | | Deliver | | In Exchange For
(in U.S. dollars) | | Net Unrealized
Appreciation | |
| | 11/30/05 | | | Euro
2,194,626 | | $ | 2,669,653 | | | $ | 37,066 | | |
| | | | | | | $ | 2,669,653 | | | $ | 37,066 | | |
At October 31, 2005, the Portfolio had sufficient cash and/or securities to cover any commitments under these contracts.
Credit Default Swaps
Notional
Amount | |
Expiration
Date | |
Description | | Net Unrealized
Appreciation
(Depreciation) | |
8,000,000 USD
| | 12/20/2010
| | Agreement with Citibank N.A.
dated 10/21/2005 to pay
5.46% times the notional
amount per year. In exchange
for that periodic payment, upon
a default by Toys 'R' Us, Inc.,
Citibank N.A. agrees to pay the
Portfolio the notional amount of
the swap. To receive that payment,
the Portfolio must deliver a bond
(with par value equal to the
notional amount of the swap) issued
by Toys 'R' Us, Inc. to Citibank N.A. | | $254,232
| |
6 Federal Income Tax Basis of Unrealized Appreciation (Depreciation)
The cost and unrealized appreciation (depreciation) in value of the investments owned at October 31, 2005 as computed on a federal income tax basis, were as follows:
| Aggregate cost | | $ | 1,075,156,408 | | |
| Gross unrealized appreciation | | $ | 45,985,970 | | |
| Gross unrealized depreciation | | | (23,053,500 | ) | |
| Net unrealized appreciation | | $ | 22,932,470 | | |
27
High Income Portfolio as of October 31, 2005
NOTES TO FINANCIAL STATEMENTS CONT'D
7 Restricted Securities
At October 31, 2005, the Portfolio owned the following securities (representing less than 0.1% of net assets) which were restricted as to public resale and not registered under the Securities Act of 1933 (excluding Rule 144A securities). The Portfolio has various registration rights (exercisable under a variety of circumstances) with respect to these securities. The fair value of these securities is determined based on valuations provided by brokers when available, or if not available, they are valued at fair value using methods determined in good faith by or at the direction of the Trustees.
| Description | | Date of
Acquisition | |
Shares/Face | |
Cost | |
Fair Value | |
| Common Stocks and Warrants | | | | | | | | | |
New World Coffee, Warrants,
Exp. 6/15/06 | | 9/15/02 -
7/15/02
9/30/02 | | | 1,244 | | | $ | 0 | (1) | | $ | 13 | | |
Peninsula Gaming LLC,
Convertible Preferred
Membership Interests | | 7/08/99 | | | 25,351 | | | | 0 | (1) | | | 152,107 | | |
| | | $ | 0 | | | $ | 152,120 | | |
(1) Less than $0.50.
28
High Income Portfolio as of October 31, 2005
REPORT OF INDEPENDENT REGISTERED PUBLIC ACCOUNTING FIRM
To the Trustees and Shareholders
of High Income Portfolio:
We have audited the accompanying statement of assets and liabilities, including the portfolio of investments, of High Income Portfolio (the Portfolio) as of October 31, 2005 and the related statement of operations for the year then ended, the statements of changes in net assets for each of the two years in the period then ended, and the supplementary data for each of the years in the five year period then ended. These financial statements and supplementary data are the responsibility of the Portfolio's management. Our responsibility is to express an opinion on these financial statements and supplementary data based on our audits.
We conducted our audits in accordance with standards of the Public Company Accounting Oversight Board (United States). Those standards require that we plan and perform the audits to obtain reasonable assurance about whether the financial statements and supplementary data are free of material misstatement. The Portfolio is not required to have, nor were we engaged to perform, an audit of its internal control over financial reporting. An audit includes consideration of internal control over financial reporting as a basis for designing audit procedures that are appropriate in the circumstances, but not for the purpose of expressing an opinion on the effectiveness of the Portfolio's internal control over financial reporting. Accordingly, we express no such opinion. An audit also includes examining, on a test basis, evidence supporting the amounts and disclosures in the financial statements, assessing the accounting principles used a nd signifigant estimates made by management, as well as evaluating the overall financial statement presentation. Our procedures included confirmation of securities held at October 31, 2005 by correspondence with the custodian, brokers and agent banks; where replies were not received from brokers and agent banks, we performed other auditing procedures. We believe that our audits provide a reasonable basis for our opinion.
In our opinion, the financial statements and supplementary data referred to above present fairly, in all material respects, the financial position of the High Income Portfolio at October 31, 2005, the results of its operations for the year then ended, the changes in its net assets for each of the two years in the period then ended, and the supplementary data for each of the five years in the period then ended, in conformity with accounting principles generally accepted in the United States of America.
DELOITTE & TOUCHE LLP
Boston, Massachusetts
December 19, 2005
29
Eaton Vance High Income Fund as of October 31, 2005
FEDERAL TAX INFORMATION (Unaudited)
The Form 1099-DIV you receive in January 2006 will show the tax status of all distributions paid to your account in calendar 2005. Shareholders are advised to consult their own tax adviser with respect to the tax consequences of their investment in the Fund.
30
High Income Portfolio
BOARD OF TRUSTEES' ANNUAL APPROVAL OF THE INVESTMENT ADVISORY AGREEMENT
The investment advisory agreement between High Income Portfolio (the "Portfolio") and its investment adviser, Boston Management and Research, provides that the advisory agreement will continue in effect from year to year so long as its continuance is approved at least annually (i) by a vote of a majority of the noninterested Trustees of the Portfolio cast in person at a meeting called for the purpose of voting on such approval and (ii) by the Trustees of the Portfolio or by vote of a majority of the outstanding interests of the Portfolio.
In considering the annual approval of the investment advisory agreement between the Portfolio and its investment adviser, the Special Committee of the Board of Trustees considered information that had been provided throughout the year at regular Board meetings, as well as information furnished for a series of meetings held in February and March in preparation for a Board meeting held on March 21, 2005 to specifically consider the renewal of the investment advisory agreement. Such information included, among other things, the following:
• An independent report comparing the advisory fees of the Portfolio with those of comparable funds;
• An independent report comparing the expense ratio of the Eaton Vance High Income Fund (the "Fund") to those of comparable funds;
• Information regarding Fund investment performance in comparison to a relevant peer group of funds and appropriate indices;
• The economic outlook and the general investment outlook in relevant investment markets;
• Eaton Vance Management's ("Eaton Vance") results and financial condition and the overall organization of the investment adviser;
• The procedures and processes used to determine the fair value of Fund assets and actions taken to monitor and test the effectiveness of such procedures and processes;
• Eaton Vance's management of the relationship with the custodian, subcustodians and fund accountants;
• The resources devoted to compliance efforts undertaken by Eaton Vance on behalf of the funds it manages and the record of compliance with the investment policies and restrictions and with policies on personal securities transactions;
• The quality, nature, cost and character of the administrative and other non-investment management services provided by Eaton Vance and its affiliates; and
• The terms of the advisory agreement and the reasonableness and appropriateness of the particular fee paid by the Portfolio for the services described therein.
The Special Committee also considered the investment adviser's portfolio management capabilities, including information relating to the education, experience and number of investment professionals and other personnel who provide services under the investment advisory agreement. Specifically, the Special Committee considered the investment adviser's high-yield portfolio management team, including portfolio managers who perform their own investment and credit analysis and analysts who evaluate issuers' financial resources, operating history and sensitivity to economic conditions. The Special Committee noted the benefits to the Portfolio of the investment adviser's extensive in-house research capabilities. The Special Committee also took into account the time and attention to be devoted by senior management to the Portfolio and the other funds in the complex. The Special Committee evaluated the level of skill required to manage the Portfolio and concluded that the human resources available at the investment adviser were appropriate to fulfill effectively its duties on behalf of the Portfolio.
In its review of comparative information with respect to Fund investment performance, the Special Committee concluded that the Fund has performed within a range that the Special Committee deemed competitive. With respect to its review of investment advisory fees, the Special Committee concluded that the fees paid by the Portfolio are within the range of those paid by comparable funds within the mutual fund industry. In reviewing the information regarding the expense ratio of the Fund, the Special Committee concluded that the Fund's expense ratio is within a range that is competitive with comparable funds.
In addition to the factors mentioned above, the Special Committee reviewed the level of the investment adviser's profits in providing investment management services for the Portfolio and for all Eaton Vance funds as a group. The Special Committee also reviewed the benefits to Eaton Vance and its affiliates in providing administration services for the Fund and for all Eaton Vance funds as a group. In addition, the Special Committee considered the fiduciary duty assumed by the investment adviser in connection with the services rendered to the Portfolio and the business reputation of the investment adviser and its financial resources. The Trustees concluded that in light of the services rendered, the profits realized by the investment adviser are not unreasonable. The Special Committee also considered the extent to which the investment adviser appears to be realizing benefits from economies of scale in managing
31
High Income Portfolio
BOARD OF TRUSTEES' ANNUAL APPROVAL OF THE INVESTMENT ADVISORY AGREEMENT CONT'D
the Portfolio, and concluded that the fee breakpoints which are in place will allow for an equitable sharing of such benefits, when realized, with the Portfolio and the shareholders of the Fund.
The Special Committee did not consider any single factor as controlling in determining whether or not to renew the investment advisory agreement. Nor are the items described herein all the matters considered by the Special Committee. In assessing the information provided by Eaton Vance and its affiliates, the Special Committee also took into consideration the benefits to shareholders of investing in a fund that is a part of a large family of funds which provides a large variety of shareholder services.
Based on its consideration of the foregoing factors and conclusions, and such other factors and conclusions as it deemed relevant, and assisted by independent counsel, the Special Committee concluded that the renewal of the investment advisory agreement, including the fee structure, is in the interests of shareholders.
32
Eaton Vance High Income Fund
MANAGEMENT AND ORGANIZATION
Fund Management. The Trustees of Eaton Vance Mutual Funds Trust (the Trust) and High Income Portfolio (the Portfolio) are responsible for the overall management and supervision of the Trust's and Portfolio's affairs. The Trustees and officers of the Trust and the Portfolio are listed below. Except as indicated, each individual has held the office shown or other offices in the same company for the last five years. Trustees and officers of the Trust and the Portfolio hold indefinite terms of office. The "noninterested Trustees" consist of those Trustees who are not "interested persons" of the Trust and the Portfolio, as that term is defined under the 1940 Act. The business address of each Trustee and officer is The Eaton Vance Building, 255 State Street, Boston, Massachusetts 02109. As used below, "EVC" refers to Eaton Vance Corp., "EV" refers to Eaton Vance, Inc., "EVM" refers to Eaton Vance Management, "BMR" refers to Boston Management and Research and "EVD" refers to Eaton Vance Distributors, Inc. EVC and EV are the corporate parent and trustee, respectively, of EVM and BMR. EVD is the Fund's principal underwriter, the Portfolio's placement agent and a wholly-owned subsidiary of EVM. Each officer affiliated with Eaton Vance may hold a position with other Eaton Vance affiliates that is comparable to its position with EVM listed below.
Name and
Date of Birth | | Position(s)
with the
Trust and
the Portfolio | | Term of
Office and
Length of
Service | | Principal Occupation(s)
During Past Five Years | | Number of Portfolios
in Fund Complex
Overseen By
Trustee(1) | | Other Directorships Held | |
| Interested Trustee | |
|
James B. Hawkes
11/9/41 | | Trustee | | Trustee of the Trust since 1991; of the Portfolio since 1992 | | Chairman, President and Chief Executive Officer of BMR, EVC, EVM and EV; Director of EV; Vice President and Director of EVD. Trustee and/or officer of 161 registered investment companies in the Eaton Vance Fund Complex. Mr. Hawkes is an interested person because of his positions with BMR, EVM, EVC and EV, which are affiliates of the Trust and the Portfolio. | | | 161 | | | Director of EVC | |
|
| Noninterested Trustee(s) | |
|
Benjamin C. Esty
1/2/63 | | Trustee | | Since 2005 | | Professor, Harvard University Graduate School of Business Administration (since 2003). Formerly, Associate Professor, Harvard University Graduate School of Business Administration (2000-2003). | | | 152 | | | None | |
|
Samuel L. Hayes, III
2/23/35 | | Trustee | | Trustee of the Trust since 1986; of the Portfolio since 1993 and Chairman of the Board since 2005 | | Jacob H. Schiff Professor of Investment Banking Emeritus, Harvard University Graduate School of Business Administration. | | | 161 | | | Director of Tiffany & Co. (specialty retailer) and Telect, Inc. (telecommunication services company) | |
|
William H. Park
9/19/47 | | Trustee | | Since 2003 | | President and Chief Executive Officer, Prizm Capital Management, LLC (investment management firm) (since 2002). Executive Vice President and Chief Financial Officer, United Asset Management Corporation (a holding company owning institutional investment management firms) (1982-2001). | | | 161 | | | None | |
|
Ronald A. Pearlman
7/10/40 | | Trustee | | Since 2003 | | Professor of Law, Georgetown University Law Center (since 1999). Tax Partner Covington & Burling, Washington, DC (1991-2000). | | | 161 | | | None | |
|
33
Eaton Vance High Income Fund
MANAGEMENT AND ORGANIZATION CONT'D
Name and
Date of Birth | | Position(s)
with the
Trust and
the Portfolio | | Term of
Office and
Length of
Service | | Principal Occupation(s)
During Past Five Years | | Number of Portfolios
in Fund Complex
Overseen By
Trustee(1) | | Other Directorships Held | |
| Noninterested Trustee(s) (continued) | |
|
Norton H. Reamer
9/21/35 | | Trustee | | Trustee of the Trust since 1986; of the Portfolio since 1993 | | President, Chief Executive Officer and a Director of Asset Management Finance Corp. (a specialty finance company serving the investment management industry) (since October 2003). President, Unicorn Corporation (an investment and financial advisory services company) (since September 2000). Formerly, Chairman, Hellman, Jordan Management Co., Inc. (an investment management company) (2000-2003). Formerly, Advisory Director of Berkshire Capital Corporation (investment banking firm) (2002-2003). Formerly Chairman of the Board, United Asset Management Corporation (a holding company owning institutional investment management firms) and Chairman, President and Director, UAM Funds (mutual funds) (1980-2000). | | | 161 | | | None | |
|
Lynn A. Stout
9/14/57 | | Trustee | | Since 1998 | | Professor of Law, University of California at Los Angeles School of Law (since July 2001). Formerly, Professor of Law, Georgetown University Law Center. | | | 161 | | | None | |
|
Ralph F. Verni
1/26/43 | | Trustee | | Since 2005 | | Consultant and private investor (since 2000). Formerly, President and Chief Executive Officer, Redwood Investment Systems, Inc. (software developer) (2000). Formerly, President and Chief Executive Officer, State Street Research & Management (investment advisor), SSRM Holdings (parent of State Street Research & management), and SSR Realty (institutional realty manager) (1992-2000). | | | 152 | | | Director of W.P. Carey & Company LLC (manager of real estate investment trusts) | |
|
| Principal Officers who are not Trustees | |
|
Name and
Date of Birth | | Position(s)
with the
Trust and
the Portfolio | | Term of
Office and
Length of
Service | | Principal Occupation(s)
During Past Five Years | |
Thomas E. Faust Jr.
5/31/58 | | President of the Trust | | Since 2002 | | Executive Vice President of EVM, BMR, EVC and EV; Chief Investment Officer of EVM and BMR and Director of EVC. Chief Executive Officer of Belair Capital Fund LLC, Belcrest Capital Fund LLC, Belmar Capital Fund LLC, Belport Capital Fund LLC and Belrose Capital Fund LLC (private investment companies sponsored by EVM). Officer of 65 registered investment companies managed by EVM or BMR. | |
|
William H. Ahern, Jr.
7/28/59 | | Vice President of the Trust | | Since 1995 | | Vice President of EVM and BMR. Officer of 70 registered investment companies managed by EVM or BMR. | |
|
Cynthia J. Clemson
3/2/63 | | Vice President of the Trust | | Since 2005 | | Vice President of EVM and BMR. Officer of 85 registered investment companies managed by EVM or BMR. | |
|
Kevin S. Dyer
2/21/75 | | Vice President of the Trust | | Since 2005 | | Assistant Vice President of EVM and BMR. Officer of 24 registered investment companies managed by EVM or BMR. | |
|
Thomas P. Huggins
3/7/66 | | Vice President of the Portfolio | | Since 2000 | | Vice President of EVM and BMR. Officer of 4 registered investment companies managed by EVM or BMR. | |
|
Aamer Khan
6/7/60 | | Vice President of the Trust | | Since 2005 | | Vice President of EVM and BMR. Officer of 27 registered investment companies managed by EVM or BMR. | |
|
34
Eaton Vance High Income Fund
MANAGEMENT AND ORGANIZATION CONT'D
Name and
Date of Birth | | Position(s)
with the
Trust and
the Portfolio | | Term of
Office and
Length of
Service | | Principal Occupation(s)
During Past Five Years | |
| Principal Officers who are not Trustees (continued) | |
|
Michael R. Mach
7/15/47 | | Vice President of the Trust | | Since 1999 | | Vice President of EVM and BMR. Officer of 32 registered investment companies managed by EVM or BMR. | |
|
Robert B. MacIntosh
1/22/57 | | Vice President of the Trust | | Since 1998 | | Vice President of EVM and BMR. Officer of 85 registered investment companies managed by EVM or BMR. | |
|
Duncan W. Richardson
10/26/57 | | Vice President of the Trust | | Since 2001 | | Senior Vice President and Chief Equity Investment Officer of EVM and BMR. Officer of 51 registered investment companies managed by EVM or BMR. | |
|
Walter A. Row, III
7/20/57 | | Vice President of the Trust | | Since 2001 | | Director of Equity Research and a Vice President of EVM and BMR. Officer of 31 registered investment companies managed by EVM or BMR. | |
|
Judith A. Saryan
8/21/54 | | Vice President of the Trust | | Since 2003 | | Vice President of EVM and BMR. Officer of 33 registered investment companies managed by EVM or BMR. | |
|
Susan Schiff
3/13/61 | | Vice President of the Trust | | Since 2002 | | Vice President of EVM and BMR. Officer of 29 registered investment companies managed by EVM or BMR. | |
|
Michael W. Weilheimer
2/11/61 | | President of the Portfolio | | Since 2002(2) | | Vice President of EVM and BMR. Officer of 9 registered investment companies managed by EVM or BMR. | |
|
Barbara E. Campbell
6/19/57 | | Treasurer | | Treasurer of the Trust since 2005(3), of the Portfolio since 2002(2) | | Vice President of EVM and BMR. Officer of 161 registered investment companies managed by EVM or BMR. | |
|
Alan R. Dynner
10/10/40 | | Secretary | | Since 1997 | | Vice President, Secretary and Chief Legal Officer of BMR, EVM, EVD, EV and EVC. Officer of 161 registered investment companies managed by EVM or BMR. | |
|
Paul M. O'Neil
7/11/53 | | Chief Compliance Officer | | Since 2004 | | Vice President of EVM and BMR. Officer of 161 registered investment companies managed by EVM or BMR. | |
|
(1) Includes both master and feeder funds in a master-feeder structure.
(2) Prior to 2002, Mr. Weilheimer served as Vice President of the Portfolio since 1995 and Ms. Campbell served as Assistant Treasurer of the Portfolio since 1993.
(3) Prior to 2005, Ms. Campbell served as Assistant Treasurer of the Trust since 1995.
The SAI for the Fund includes additional information about the Trustees and officers of the Fund and the Portfolio and can be obtained without charge by calling 1-800-225-6265.
35
This Page Intentionally Left Blank
This Page Intentionally Left Blank
Investment Adviser of High Income Portfolio
Boston Management and Research
The Eaton Vance Building
255 State Street
Boston, MA 02109
Administrator of Eaton Vance High Income Fund
Eaton Vance Management
The Eaton Vance Building
255 State Street
Boston, MA 02109
Principal Underwriter
Eaton Vance Distributors, Inc.
The Eaton Vance Building
255 State Street
Boston, MA 02109
(617) 482-8260
Custodian
Investors Bank & Trust Company
200 Clarendon Street
Boston, MA 02116
Transfer Agent
PFPC Inc.
Attn: Eaton Vance Funds
P.O. Box 9653
Providence, RI 02940-9653
(800) 262-1122
Independent Registered Public Accounting Firm
Deloitte & Touche LLP
200 Berkeley Street
Boston, MA 02116-5022
Eaton Vance High Income Fund
The Eaton Vance Building
255 State Street
Boston, MA 02109
This report must be preceded or accompanied by a current prospectus. Before investing, investors should consider carefully the Fund's investment objective(s), risks, and charges and expenses. The Fund's current prospectus contains this and other information about the Fund and is available through your financial advisor. Please read the prospectus carefully before you invest or send money. For further information please call 1-800-225-6265.
446-12/05 HISRC

Annual Report October 31, 2005
EATON VANCE
LOW
DURATION
FUND


IMPORTANT NOTICES REGARDING PRIVACY,
DELIVERY OF SHAREHOLDER DOCUMENTS,
PORTFOLIO HOLDINGS AND PROXY VOTING
Privacy. The Eaton Vance organization is committed to ensuring your financial privacy. Each of the financial institutions identified below has in effect the following policy ("Privacy Policy") with respect to nonpublic personal information about its customers:
• Only such information received from you, through application forms or otherwise, and information about your Eaton Vance fund transactions will be collected. This may include information such as name, address, social security number, tax status, account balances and transactions.
• None of such information about you (or former customers) will be disclosed to anyone, except as permitted by law (which includes disclosure to employees necessary to service your account). In the normal course of servicing a customer's account, Eaton Vance may share information with unaffiliated third parties that perform various required services such as transfer agents, custodians and broker/dealers.
• Policies and procedures (including physical, electronic and procedural safeguards) are in place that are designed to protect the confidentiality of such information.
• We reserve the right to change our Privacy Policy at any time upon proper notification to you. Customers may want to review our Policy periodically for changes by accessing the link on our homepage: www.eatonvance.com.
Our pledge of privacy applies to the following entities within the Eaton Vance organization: the Eaton Vance Family of Funds, Eaton Vance Management, Eaton Vance Investment Counsel, Boston Management and Research, and Eaton Vance Distributors, Inc.
In addition, our Privacy Policy only applies to those Eaton Vance customers who are individuals and who have a direct relationship with us. If a customer's account (i.e., fund shares) is held in the name of a third-party financial adviser/broker-dealer, it is likely that only such adviser's privacy policies apply to the customer. This notice supersedes all previously issued privacy disclosures.
For more information about Eaton Vance's Privacy Policy, please call 1-800-262-1122.
Delivery of Shareholder Documents. The Securities and Exchange Commission (the "SEC") permits funds to deliver only one copy of shareholder documents, including prospectuses, proxy statements and shareholder reports, to fund investors with multiple accounts at the same residential or post office box address. This practice is often called "householding" and it helps eliminate duplicate mailings to shareholders.
Eaton Vance, or your financial adviser, may household the mailing of your documents indefinitely unless you instruct Eaton Vance, or your financial adviser, otherwise.
If you would prefer that your Eaton Vance documents not be householded, please contact Eaton Vance at 1-800-262-1122, or contact your financial adviser.
Your instructions that householding not apply to delivery of your Eaton Vance documents will be effective within 30 days of receipt by Eaton Vance or your financial adviser.
Portfolio Holdings. Each Eaton Vance Fund and its underlying Portfolio (if applicable) will file a schedule of its portfolio holdings on Form N-Q with the SEC for the first and third quarters of each fiscal year. The Form N-Q will be available on the Eaton Vance website www.eatonvance.com, by calling Eaton Vance at 1-800-262-1122 or in the EDGAR database on the SEC's website at www.sec.gov. Form N-Q may also be reviewed and copied at the SEC's public reference room in Washington, D.C.
(call 1-800-732-0330 for information on the operation of the public reference room).
Proxy Voting. From time to time, funds are required to vote proxies related to the securities held by the funds. The Eaton Vance Funds or their underlying Portfolios (if applicable) vote proxies according to a set of policies and procedures approved by the Funds' and Portfolios' Boards. You may obtain a description of these policies and procedures and information on how the Funds or Portfolios voted proxies relating to portfolio securities during the most recent 12 month period ended June 30, without charge, upon request, by calling 1-800-262-1122. This description is also available on the SEC's website at www.sec.gov.
Eaton Vance Low Duration Fund as of October 31, 2005
MANAGEMENT’S DISCUSSION OF PERFORMANCE

Susan Schiff
Co-Portfolio Manager

Christine Johnston
Co-Portfolio Manager
The Fund
Performance for the Past Year
• The Fund’s Class A shares had a total return of 2.06% for the year ended October 31, 2005.(1) This return resulted from a decrease in net asset value (NAV) per share to $9.22 on October 31, 2005 from $9.42 on October 31, 2004, and the reinvestment of $0.391 in dividends.
• The Fund’s Class B shares had a total return of 1.18% for the year ended October 31, 2005.(1) This return resulted from a decrease in NAV per share to $9.21 on October 31, 2005 from $9.42 on October 31, 2004, and the reinvestment of $0.320 in dividends.
• The Fund’s Class C shares had a total return of 1.45% for the year ended October 31, 2005.(1) This return resulted from a decrease in NAV per share to $9.22 on October 31, 2005 from $9.42 on October 31, 2004, and the reinvestment of $0.334 in dividends.
• In comparison, the Merrill Lynch 1-3 Year Treasury Index – an unmanaged market index of short-term U.S. Treasury securities – had a total return of 0.67% for the year ended October 31, 2005.(2)
Recent Fund Developments
• Low Duration Fund seeks total return, an objective it pursues primarily through investments in investment-grade, fixed-income securities. The Fund currently pursues its objective by investing in one or more registered investment companies. The Fund’s average weighted duration was 1.00 year at October 31, 2005.
• The Fund altered its investment focus slightly during the fiscal year, with an added emphasis on adjustable rate mortgage-backed securities (MBS) and floating-rate instruments. These vehicles are typically more responsive to rising rates and produce higher income returns in such a scenario.
• The Fund remained invested predominantly in three market sectors: mortgage-backed securities, (with the bulk invested in adjustable-rate collateralized mortgage obligations and a smaller amount invested in seasoned fixed-rate MBS) – 81% of total investments, as of October 31, 2005; short-term investments, 10% of total investments, as of October 31, 2005; and senior floating-rate loans, 9% of total investments, as of October 31, 2005. These sector weightings represented the Fund’s investments in Government Obligations Portfolio, Investment Portfolio and Floating Rate Portfolio.
• While short-term interest rates rose in response to the Federal Reserve’s continued hikes in its benchmark Federal Funds rate, spreads on MBS narrowed by 80 basis points relative to Treasuries, partially offsetting the rate hike, and accounting for the positive performance of the Fund’s MBS investments. In spite of significant tightening, spreads still remained above their historical lows. Short-term investment returns trended higher during the fiscal year in response to the Federal Reserve’s rate increases. Floating-rate loan returns also benefited from the Fed’s rate increases due to reset provisions that adjust loan rates to reflect changes in interest rates.
• The Fund was positioned defensively, continuing to avoid investments in corporate bonds, a strategy that helped performance. Investment-grade corporate bond spreads were largely unchanged for the period, resulting in underperformance versus the Fund’s seasoned MBS investments.
Past performance is no guarantee of future results. Returns are historical and are calculated by determining the percentage change in net asset value or offering price (as applicable) with all distributions reinvested. Investment return and principal value will fluctuate so that shares, when redeemed, may be worth more or less than their original cost. Performance is for the stated time period only; due to market volatility, the Fund’s current performance may be lower or higher than the quoted return. For performance as of the most recent month-end, please refer to www.eatonvance.com.
The views expressed throughout this report are those of the portfolio managers and are current only through the end of the period of the report as stated on the cover. These views are subject to change at any time based upon market or other conditions, and the investment adviser disclaims any responsibility to update such views. These views may not be relied on as investment advice and, because investment decisions for a fund are based on many factors, may not be relied on as an indication of trading intent on behalf of any Eaton Vance fund.
Fund shares are not insured by the FDIC and are not deposits or other obligations of, or guaranteed by, any depository institution. Shares are subject to investment risks, including possible loss of principal invested.
(1) These returns do not include the 2.25% maximum sales charge for the Fund’s Class A shares or the applicable contingent deferred sales charges (CDSC) for Class B shares and Class C shares. If sales charges were deducted, returns would be lower.
(2) It is not possible to invest directly in an Index. The Index’s total return does not reflect the commissions or expenses that would have been incurred if an investor individually purchased or sold the securities represented in the Index.
2
Eaton Vance Low Duration Fund as of October 31, 2005
FUND PERFORMANCE
The line graphs and table set forth below provide information about the Fund’s performance. The line graphs compare the performance of each class of the Fund with that of the Merrill Lynch 1-3 Year Treasury Index, an unmanaged market index of short-term U.S. Treasury securities. The lines on the graph represent the total returns of a hypothetical investment of $10,000 in each Class and in the Merrill Lynch 1-3 Year Treasury Index. Class A total returns are presented at net asset value and maximum public offering price. The table includes the total returns of each Class of the Fund at net asset value and public offering price. The performance presented below does not reflect the deduction of taxes, if any, that a shareholder would pay on Fund distributions or the redemption of Fund shares.
Performance† | | Class A | | Class B | | Class C | |
Average Annual Total Returns (at net asset values) | | | | | | | |
One year | | 2.06 | % | 1.18 | % | 1.45 | % |
Life of fund† | | 1.28 | | 0.48 | | 0.67 | |
| | | | | | | |
SEC Average Annual Total Returns (including sales charge or applicable CDSC) | | | | |
One year | | -0.27 | % | -1.75 | % | 0.47 | % |
Life of fund† | | 0.54 | | 0.19 | | 1.67 | |
†Inception Dates – Class A: 9/30/02; Class B: 9/30/02; Class C: 9/30/02
(1) Average Annual Total Returns do not include the 2.25% maximum sales charge for Class A shares or the applicable contingent deferred sales charge (CDSC) for Class B and Class C shares. If sales charges were deducted, returns would be lower. SEC returns for Class A reflect the maximum 2.25% sales charge. SEC Average Annual Total Returns for Class B reflect applicable CDSC based on the following schedule: 3% - 1st year; 2.5% - 2nd year; 2.0% - 3rd year; 1% - 4th year. SEC 1-Year return for Class C reflects a 1% CDSC.
Past performance is no guarantee of future results. Returns are historical and are calculated by determining the percentage change in net asset value or offering price (as applicable) with all distributions reinvested. Investment return and principal value will fluctuate so that shares, when redeemed, may be worth more or less than their original cost. Performance is for the stated time period only; due to market volatility, the Fund’s current performance may be lower or higher than the quoted return. For performance as of the most recent month-end, please refer to www.eatonvance.com.
Diversification by Sectors(2)
By total investments
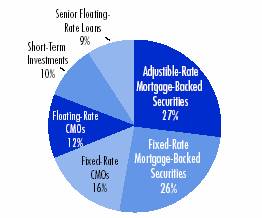
(2) The Diversification by Sectors breakdown reflects the Fund’s investments in Government Obligations Portfolio, Investment Portfolio and Floating Rate Portfolio, as of October 31, 2005. Sectors are shown as a percentage of the Fund’s total investments. Fund statistics may not be representative of the Portfolios’ current or future investments and may change due to active management.
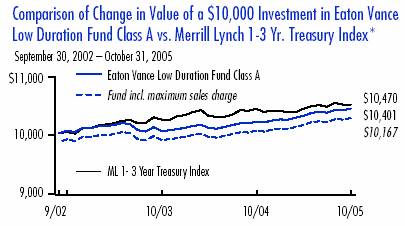
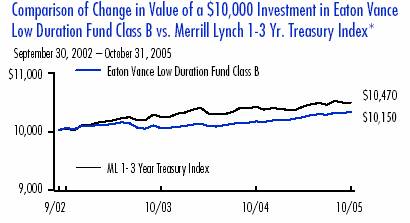
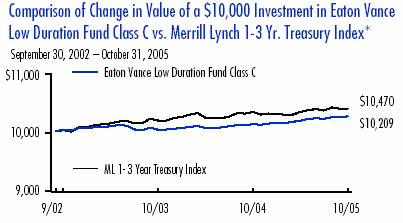
* Sources: Thomson Financial; Bloomberg, L.P. Class A, Class B and Class C of the Fund commenced operations on 9/30/02.
A $10,000 hypothetical investment in Class B shares would have been valued at $10,058 after deduction of the applicable CDSC. The Index’s total return does not reflect the commissions or expenses that would have been incurred if an investor individually purchased or sold the securities represented in the Index. It is not possible to invest directly in an Index.
3
Eaton Vance Low Duration Fund as of October 31, 2005
FUND EXPENSES
Example: As a shareholder of the Fund, you incur two types of costs: (1) transaction costs, including sales charges (loads) on purchases and redemption fees (if applicable); and (2) ongoing costs, including management fees; distribution or service fees; and other Fund expenses. This Example is intended to help you understand your ongoing costs (in dollars) of investing in the Fund and to compare these costs with the ongoing costs of investing in other mutual funds. The Example is based on an investment of $1,000 invested at the beginning of the period and held for the entire period (May 1, 2005 – October 31, 2005).
Actual Expenses: The first section of the table below provides information about actual account values and actual expenses. You may use the information in this section, together with the amount you invested, to estimate the expenses that you paid over the period. Simply divide your account value by $1,000 (for example, an $8,600 account value divided by $1,000 = 8.6), then multiply the result by the number in the first line under the heading entitled “Expenses Paid During Period” to estimate the expenses you paid on your account during this period.
Hypothetical Example for Comparison Purposes: The second section of the table below provides information about hypothetical account values and hypothetical expenses based on the Fund’s actual expense ratios and an assumed rate of return of 5% per year before expenses, which is not the actual return of the Fund. The hypothetical account values and expenses may not be used to estimate the actual ending account balance or expenses you paid for the period. You may use this information to compare the ongoing costs of investing in the Fund and other funds. To do so, compare this 5% hypothetical example with the 5% hypothetical examples that appear in the shareholder reports of the other funds.
Please note that the expenses shown in the table are meant to highlight your ongoing costs only and do not reflect any transactional costs, such as sales charges (loads) or redemption fees (if applicable). Therefore, the second section of the table is useful in comparing ongoing costs only, and will not help you determine the relative total costs of owning different funds. In addition, if these transactional costs were included, your costs would have been higher.
Eaton Vance Low Duration Fund
| | Beginning Account Value | | Ending Account Value | | Expenses Paid During Period* | |
| | (5/1/05) | | (10/31/05) | | (5/1/05 – 10/31/05) | |
| | | | | | | |
Actual | | | | | | | |
Class A | | $ | 1,000.00 | | $ | 1,011.20 | | $ | 6.39 | |
Class B | | $ | 1,000.00 | | $ | 1,006.40 | | $ | 10.17 | |
Class C | | $ | 1,000.00 | | $ | 1,008.30 | | $ | 9.42 | |
| | | | | | | |
Hypothetical | | | | | | | |
(5% return before expenses) | | | | | | | |
Class A | | $ | 1,000.00 | | $ | 1,018.90 | | $ | 6.41 | |
Class B | | $ | 1,000.00 | | $ | 1,015.10 | | $ | 10.21 | |
Class C | | $ | 1,000.00 | | $ | 1,015.80 | | $ | 9.45 | |
* Expenses are equal to the Fund’s annualized expense ratio of 1.26% for Class A shares, 2.01% for Class B shares and 1.86% for Class C shares, multiplied by the average account value over the period, multiplied by 184/365 (to reflect the one-half-year period). The example assumes that the $1,000 was invested at the net asset value per share determined at the close of business on April 30, 2005. The Example reflects the expenses of both the Fund and the Portfolios. |
4
Eaton Vance Low Duration Fund as of October 31, 2005
FINANCIAL STATEMENTS
Statement of Assets and Liabilities
As of October 31, 2005
| Assets | |
| Investment in Investment Portfolio, at value (identified cost, $46,298,804) | | $ | 45,936,890 | | |
Investment in Government Obligations Portfolio, at value
(identified cost, $8,465,350) | | | 7,467,159 | | |
| Investment in Floating Rate Portfolio, at value (identified cost, $5,543,168) | | | 5,557,434 | | |
| Receivable for Fund shares sold | | | 58,121 | | |
| Total assets | | $ | 59,019,604 | | |
| Liabilities | |
| Payable for Fund shares redeemed | | $ | 226,258 | | |
| Dividends payable | | | 91,341 | | |
| Payable to affiliate for distribution and service fees | | | 31,672 | | |
| Payable to affiliate for Trustees' fees | | | 155 | | |
| Accrued expenses | | | 40,277 | | |
| Total liabilities | | $ | 389,703 | | |
| Net Assets | | $ | 58,629,901 | | |
| Sources of Net Assets | |
| Paid-in capital | | $ | 68,619,386 | | |
Accumulated net realized loss from Portfolios (computed on the basis of
identified cost) | | | (8,741,386 | ) | |
| Accumulated undistributed net investment income | | | 97,740 | | |
Net unrealized depreciation from Portfolios (computed on the basis of
identified cost) | | | (1,345,839 | ) | |
| Total | | $ | 58,629,901 | | |
| Class A Shares | |
| Net Assets | | $ | 23,875,662 | | |
| Shares Outstanding | | | 2,590,853 | | |
Net Asset Value and Redemption Price Per Share
(net assets ÷ shares of beneficial interest outstanding) | | $ | 9.22 | | |
Maximum Offering Price Per Share
(100 ÷ 97.75 of $9.22) | | $ | 9.43 | | |
| Class B Shares | |
| Net Assets | | $ | 9,704,090 | | |
| Shares Outstanding | | | 1,053,131 | | |
Net Asset Value, Offering Price and Redemption Price Per Share (Note 6)
(net assets ÷ shares of beneficial interest outstanding) | | $ | 9.21 | | |
| Class C Shares | |
| Net Assets | | $ | 25,050,149 | | |
| Shares Outstanding | | | 2,718,074 | | |
Net Asset Value, Offering Price and Redemption Price Per Share (Note 6)
(net assets ÷ shares of beneficial interest outstanding) | | $ | 9.22 | | |
| On sales of $100,000 or more, the offering price of Class A shares is reduced. | |
Statement of Operations
For the Year Ended
October 31, 2005
| Investment Income | |
| Interest allocated from Portfolios | | $ | 2,348,782 | | |
| Dividends allocated from Portfolios | | | 25,837 | | |
| Security lending income allocated from Portfolio, net | | | 44,276 | | |
| Expenses allocated from Portfolios | | | (439,738 | ) | |
| Net investment income from Portfolios | | $ | 1,979,157 | | |
| Expenses | |
| Investment adviser and administration fee | | $ | 99,741 | | |
| Trustees' fees and expenses | | | 1,521 | | |
Distribution and service fees
Class A | | | 65,277 | | |
| Class B | | | 114,475 | | |
| Class C | | | 245,971 | | |
| Registration fees | | | 77,144 | | |
| Transfer and dividend disbursing agent fees | | | 56,370 | | |
| Legal and accounting services | | | 31,079 | | |
| Custodian fee | | | 26,001 | | |
| Printing and postage | | | 20,483 | | |
| Miscellaneous | | | 7,611 | | |
| Total expenses | | $ | 745,673 | | |
Deduct —
Reduction of Investment adviser and administration fee | | $ | 99,741 | | |
| Total expense reductions | | $ | 99,741 | | |
| Net expenses | | $ | 645,932 | | |
| Net investment income | | $ | 1,333,225 | | |
Realized and Unrealized
Gain (Loss) from Portfolios | |
Net realized gain (loss) —
Investment transactions (identified cost basis) | | $ | 2,418 | | |
| Financial futures contracts | | | 2,590 | | |
| Swap contracts | | | 943 | | |
| Foreign currency transactions | | | 4,130 | | |
| Net realized gain | | $ | 10,081 | | |
Change in unrealized appreciation (depreciation) —
Investments (identified cost basis) | | $ | (338,328 | ) | |
| Financial futures contracts | | | 28,485 | | |
| Swap contracts | | | 620 | | |
| Foreign currency | | | 3,388 | | |
| Net change in unrealized appreciation (depreciation) | | $ | (305,835 | ) | |
| Net realized and unrealized loss | | $ | (295,754 | ) | |
| Net increase in net assets from operations | | $ | 1,037,471 | | |
See notes to financial statements
5
Eaton Vance Low Duration Fund as of October 31, 2005
FINANCIAL STATEMENTS CONT'D
Statements of Changes in Net Assets
| Increase (Decrease) in Net Assets | | Year Ended
October 31, 2005 | | Period Ended
October 31, 2004(1) | | Year Ended
December 31, 2003 | |
From operations —
Net investment income | | $ | 1,333,225 | | | $ | 1,262,234 | | | $ | 943,378 | | |
Net realized gain (loss) from investments, financial futures contracts, swap contracts and forward foreign currency
exchange contract transactions | | | 10,081 | | | | (364,127 | ) | | | (698,481 | ) | |
Net change in unrealized appreciation (depreciation) from investments, financial futures contracts, swap contracts and
forward foreign currency exchange contract transactions | | | (305,835 | ) | | | 26,434 | | | | (1,272,184 | ) | |
| Net increase (decrease) in net assets from operations | | $ | 1,037,471 | | | $ | 924,541 | | | $ | (1,027,287 | ) | |
Distributions to shareholders —
From net investment income
Class A | | $ | (1,092,847 | ) | | $ | (1,421,359 | ) | | $ | (2,576,212 | ) | |
| Class B | | | (386,878 | ) | | | (363,491 | ) | | | (594,040 | ) | |
| Class C | | | (1,022,112 | ) | | | (1,079,571 | ) | | | (1,733,870 | ) | |
| Total distributions to shareholders | | $ | (2,501,837 | ) | | $ | (2,864,421 | ) | | $ | (4,904,122 | ) | |
Transactions in shares of beneficial interest —
Proceeds from sale of shares
Class A | | $ | 7,037,975 | | | $ | 13,883,724 | | | $ | 108,397,413 | | |
| Class B | | | 2,175,401 | | | | 4,784,196 | | | | 21,510,475 | | |
| Class C | | | 6,583,382 | | | | 5,435,107 | | | | 69,606,722 | | |
Net asset value of shares issued to shareholders in payment of distributions declared
Class A | | | 678,931 | | | | 870,521 | | | | 1,611,573 | | |
| Class B | | | 224,368 | | | | 222,589 | | | | 384,597 | | |
| Class C | | | 648,264 | | | | 646,755 | | | | 1,031,021 | | |
Cost of shares redeemed
Class A | | | (22,874,695 | ) | | | (41,096,625 | ) | | | (70,522,597 | ) | |
| Class B | | | (4,993,301 | ) | | | (6,621,592 | ) | | | (14,266,314 | ) | |
| Class C | | | (16,050,143 | ) | | | (25,854,783 | ) | | | (31,632,195 | ) | |
Net asset value of shares exchanged
Class A | | | 1,477,467 | | | | 1,636,117 | | | | — | | |
| Class B | | | (1,477,467 | ) | | | (1,636,117 | ) | | | — | | |
| Net increase (decrease) in net assets from Fund share transactions | | $ | (26,569,818 | ) | | $ | (47,730,108 | ) | | $ | 86,120,695 | | |
| Net increase (decrease) in net assets | | $ | (28,034,184 | ) | | $ | (49,669,988 | ) | | $ | 80,189,286 | | |
| Net Assets | |
| At beginning of period | | $ | 86,664,085 | | | $ | 136,334,073 | | | $ | 56,144,787 | | |
| At end of period | | $ | 58,629,901 | | | $ | 86,664,085 | | | $ | 136,334,073 | | |
Accumulated undistributed (distributions in excess of)
net investment income included in net assets | |
| At end of period | | $ | 97,740 | | | $ | (37,459 | ) | | $ | 8,172 | | |
(1) For the ten months ended October 31, 2004.
See notes to financial statements
6
Eaton Vance Low Duration Fund as of October 31, 2005
FINANCIAL STATEMENTS CONT'D
Financial Highlights
| | | Class A | |
| | | Year Ended | | Period Ended | | Year Ended December 31, | |
| | | October 31, 2005(1) | | October 31, 2004(1)(2) | | 2003(1) | | 2002(1)(3) | |
| Net asset value — Beginning of year | | $ | 9.420 | | | $ | 9.590 | | | $ | 9.990 | | | $ | 10.000 | | |
| Income (loss) from operations | |
| Net investment income | | $ | 0.224 | | | $ | 0.142 | | | $ | 0.098 | | | $ | 0.056 | | |
| Net realized and unrealized gain (loss) | | | (0.033 | ) | | | (0.027 | ) | | | (0.120 | ) | | | 0.035 | | |
| Total income (loss) from operations | | $ | 0.191 | | | $ | 0.115 | | | $ | (0.022 | ) | | $ | 0.091 | | |
| Less distributions | |
| From net investment income | | $ | (0.391 | ) | | $ | (0.285 | ) | | $ | (0.378 | ) | | $ | (0.101 | ) | |
| Total distributions | | $ | (0.391 | ) | | $ | (0.285 | ) | | $ | (0.378 | ) | | $ | (0.101 | ) | |
| Net asset value — End of year | | $ | 9.220 | | | $ | 9.420 | | | $ | 9.590 | | | $ | 9.990 | | |
| Total Return(4) | | | 2.06 | % | | | 1.22 | % | | | (0.23 | )% | | | 0.91 | % | |
| Ratios/Supplemental Data† | |
| Net assets, end of year (000's omitted) | | $ | 23,876 | | | $ | 38,147 | | | $ | 63,709 | | | $ | 27,033 | | |
Ratios (As a percentage of average daily net assets):
Net expenses(5) | | | 1.24 | % | | | 1.20 | %(6) | | | 1.21 | % | | | 1.16 | %(6) | |
| Net expenses after custodian fee reduction(5) | | | 1.24 | % | | | 1.20 | %(6) | | | 1.21 | % | | | 1.16 | %(6) | |
| Net investment income | | | 2.41 | % | | | 1.80 | %(6) | | | 1.00 | % | | | 2.18 | %(6) | |
| Portfolio Turnover of the Investment Portfolio | | | 67 | % | | | 92 | % | | | 43 | % | | | 0 | % | |
| Portfolio Turnover of the Government Obligations Portfolio | | | 30 | % | | | 5 | % | | | 67 | % | | | 41 | % | |
| Portfolio Turnover of the Floating Rate Portfolio | | | 57 | % | | | 67 | % | | | — | | | | — | | |
† The operating expenses of the Investment Portfolio and the Fund reflect an allocation/waiver of expenses to the Investment Adviser and Administrator. Had such actions not been taken, the ratios and net investment income per share would have been as follows:
Ratios (As a percentage of average daily net assets):
Expenses(5) | | | 1.39 | % | | | 1.31 | %(6) | | | 1.23 | % | | | 2.20 | %(6) | |
| Expenses after custodian fee reduction(5) | | | 1.39 | % | | | 1.31 | %(6) | | | 1.23 | % | | | 2.20 | %(6) | |
| Net investment income | | | 2.26 | % | | | 1.69 | %(6) | | | 0.98 | % | | | 1.14 | %(6) | |
| Net investment income per share | | $ | 0.210 | | | $ | 0.134 | | | $ | 0.096 | | | $ | 0.030 | | |
(1) Net investment income per share was computed using average shares outstanding.
(2) For the ten-month period ended October 31, 2004.
(3) For the period from the start of business, September 30, 2002, to December 31, 2002.
(4) Returns are historical and are calculated by determining the percentage change in net asset value with all distributions reinvested. Total return is not computed on an annualized basis. Total returns would have been lower had certain expenses not been reduced during the periods shown.
(5) Includes the Fund's share of the Portfolios' allocated expenses.
(6) Annualized.
See notes to financial statements
7
Eaton Vance Low Duration Fund as of October 31, 2005
FINANCIAL STATEMENTS CONT'D
Financial Highlights
| | | Class B | |
| | | Year Ended | | Period Ended | | Year Ended December 31, | |
| | | October 31, 2005(1) | | October 31, 2004(1)(2) | | 2003(1) | | 2002(1)(3) | |
| Net asset value — Beginning of year | | $ | 9.420 | | | $ | 9.590 | | | $ | 9.990 | | | $ | 10.000 | | |
| Income (loss) from operations | |
| Net investment income | | $ | 0.153 | | | $ | 0.083 | | | $ | 0.024 | | | $ | 0.039 | | |
| Net realized and unrealized gain (loss) | | | (0.043 | ) | | | (0.028 | ) | | | (0.121 | ) | | | 0.033 | | |
| Total income (loss) from operations | | $ | 0.110 | | | $ | 0.055 | | | $ | (0.097 | ) | | $ | 0.072 | | |
| Less distributions | |
| From net investment income | | $ | (0.320 | ) | | $ | (0.225 | ) | | $ | (0.303 | ) | | $ | (0.082 | ) | |
| Total distributions | | $ | (0.320 | ) | | $ | (0.225 | ) | | $ | (0.303 | ) | | $ | (0.082 | ) | |
| Net asset value — End of year | | $ | 9.210 | | | $ | 9.420 | | | $ | 9.590 | | | $ | 9.990 | | |
| Total Return(4) | | | 1.18 | % | | | 0.58 | % | | | (0.98 | )% | | | 0.72 | % | |
| Ratios/Supplemental Data† | |
| Net assets, end of year (000's omitted) | | $ | 9,704 | | | $ | 14,022 | | | $ | 17,547 | | | $ | 10,725 | | |
Ratios (As a percentage of average daily net assets):
Net expenses(5) | | | 1.99 | % | | | 1.95 | %(6) | | | 1.96 | % | | | 1.91 | %(6) | |
| Net expenses after custodian fee reduction(5) | | | 1.99 | % | | | 1.95 | %(6) | | | 1.96 | % | | | 1.91 | %(6) | |
| Net investment income | | | 1.64 | % | | | 1.05 | %(6) | | | 0.25 | % | | | 1.49 | %(6) | |
| Portfolio Turnover of the Investment Portfolio | | | 67 | % | | | 92 | % | | | 43 | % | | | 0 | % | |
| Portfolio Turnover of the Government Obligations Portfolio | | | 30 | % | | | 5 | % | | | 67 | % | | | 41 | % | |
| Portfolio Turnover of the Floating Rate Portfolio | | | 57 | % | | | 67 | % | | | — | | | | — | | |
† The operating expenses of the Investment Portfolio and the Fund reflect an allocation/waiver of expenses to the Investment Adviser and Administrator. Had such actions not been taken, the ratios and net investment income per share would have been as follows:
Ratios (As a percentage of average daily net assets):
Expenses(5) | | | 2.14 | % | | | 2.06 | %(6) | | | 1.98 | % | | | 2.95 | %(6) | |
| Expenses after custodian fee reduction(5) | | | 2.14 | % | | | 2.06 | %(6) | | | 1.98 | % | | | 2.95 | %(6) | |
| Net investment income | | | 1.49 | % | | | 0.94 | %(6) | | | 0.23 | % | | | 0.45 | %(6) | |
| Net investment income per share | | $ | 0.139 | | | $ | 0.074 | | | $ | 0.023 | | | $ | 0.013 | | |
(1) Net investment income per share was computed using average shares outstanding.
(2) For the ten-month period ended October 31, 2004.
(3) For the period from the start of business, September 30, 2002, to December 31, 2002.
(4) Returns are historical and are calculated by determining the percentage change in net asset value with all distributions reinvested. Total return is not computed on an annualized basis. Total returns would have been lower had certain expenses not been reduced during the periods shown.
(5) Includes the Fund's share of the Portfolios' allocated expenses.
(6) Annualized.
See notes to financial statements
8
Eaton Vance Low Duration Fund as of October 31, 2005
FINANCIAL STATEMENTS CONT'D
Financial Highlights
| | | Class C | |
| | | Year Ended | | Period Ended | | Year Ended December 31, | |
| | | October 31, 2005(1) | | October 31, 2004(1)(2) | | 2003(1) | | 2002(1)(3) | |
| Net asset value — Beginning of year | | $ | 9.420 | | | $ | 9.590 | | | $ | 9.980 | | | $ | 10.000 | | |
| Income (loss) from operations | |
| Net investment income | | $ | 0.167 | | | $ | 0.095 | | | $ | 0.040 | | | $ | 0.041 | | |
| Net realized and unrealized gain (loss) | | | (0.033 | ) | | | (0.028 | ) | | | (0.112 | ) | | | 0.025 | | |
| Total income (loss) from operations | | $ | 0.134 | | | $ | 0.067 | | | $ | (0.072 | ) | | $ | 0.066 | | |
| Less distributions | |
| From net investment income | | $ | (0.334 | ) | | $ | (0.237 | ) | | $ | (0.318 | ) | | $ | (0.086 | ) | |
| Total distributions | | $ | (0.334 | ) | | $ | (0.237 | ) | | $ | (0.318 | ) | | $ | (0.086 | ) | |
| Net asset value — End of year | | $ | 9.220 | | | $ | 9.420 | | | $ | 9.590 | | | $ | 9.980 | | |
| Total Return(4) | | | 1.45 | % | | | 0.71 | % | | | (0.74 | )% | | | 0.66 | % | |
| Ratios/Supplemental Data† | |
| Net assets, end of year (000's omitted) | | $ | 25,050 | | | $ | 34,495 | | | $ | 55,078 | | | $ | 18,387 | | |
Ratios (As a percentage of average daily net assets):
Net expenses(5) | | | 1.84 | % | | | 1.80 | %(6) | | | 1.81 | % | | | 1.76 | %(6) | |
| Net expenses after custodian fee reduction(5) | | | 1.84 | % | | | 1.80 | %(6) | | | 1.81 | % | | | 1.76 | %(6) | |
| Net investment income | | | 1.79 | % | | | 1.20 | %(6) | | | 0.41 | % | | | 1.56 | %(6) | |
| Portfolio Turnover of the Investment Portfolio | | | 67 | % | | | 92 | % | | | 43 | % | | | 0 | % | |
| Portfolio Turnover of the Government Obligations Portfolio | | | 30 | % | | | 5 | % | | | 67 | % | | | 41 | % | |
| Portfolio Turnover of the Floating Rate Portfolio | | | 57 | % | | | 67 | % | | | — | | | | — | | |
† The operating expenses of the Investment Portfolio and the Fund reflect an allocation/waiver of expenses to the Investment Adviser and Administrator. Had such actions not been taken, the ratios and net investment income per share would have been as follows:
Ratios (As a percentage of average daily net assets):
Expenses(5) | | | 1.99 | % | | | 1.91 | %(6) | | | 1.83 | % | | | 2.80 | %(6) | |
| Expenses after custodian fee reduction(5) | | | 1.99 | % | | | 1.91 | %(6) | | | 1.83 | % | | | 2.80 | %(6) | |
| Net investment income | | | 1.64 | % | | | 1.09 | %(6) | | | 0.39 | % | | | 0.52 | %(6) | |
| Net investment income per share | | $ | 0.153 | | | $ | 0.086 | | | $ | 0.038 | | | $ | 0.015 | | |
(1) Net investment income per share was computed using average shares outstanding.
(2) For the ten-month period ended October 31, 2004.
(3) For the period from the start of business, September 30, 2002, to December 31, 2002.
(4) Returns are historical and are calculated by determining the percentage change in net asset value with all distributions reinvested. Total return is not computed on an annualized basis. Total returns would have been lower had certain expenses not been reduced during the periods shown.
(5) Includes the Fund's share of the Portfolios' allocated expenses.
(6) Annualized.
See notes to financial statements
9
Eaton Vance Low Duration Fund as of October 31, 2005
NOTES TO FINANCIAL STATEMENTS
1 Significant Accounting Policies
Eaton Vance Low Duration Fund (the Fund) is a diversified series of Eaton Vance Mutual Funds Trust (the Trust). The Trust is an entity of the type commonly known as a Massachusetts business trust and is registered under the Investment Company Act of 1940, as amended, as an open-end management investment company. The Fund offers three classes of shares. Class A shares are generally sold subject to a sales charge imposed at time of purchase. Class B and Class C shares are sold at net asset value and are generally subject to a contingent deferred sales charge (see Note 6). After the longer of four years or the time when the CDSC applicable to Class B shares expires, Class B shares will automatically convert to Class A shares. Each class represents a pro rata interest in the Fund, but votes separately on class-specific matters and (as noted below) is subject to different expenses. Realized and unrealized gains and losses are allocat ed daily to each class of shares based on the relative net assets of each class to the total net assets of the Fund. Net investment income, other than class specific expenses, is allocated daily to each class of shares based on the ratio of the value of each class' paid shares to the total value of all paid shares. Each class of shares differs in its distribution plan and certain other class-specific expenses. The Fund currently invests all of its investable assets in interests in three Portfolios, Investment Portfolio, Government Obligations Portfolio, and Floating Rate Portfolio (the Portfolios), which are New York Trusts. Consistent with its investment objective and policies, the Fund may also invest in Cash Management Portfolio and Investment Grade Portfolio, which are also New York Trusts. The Fund does not currently invest in these portfolios. The investment objectives and policies of the Fund are the same as the Portfolios. Each Portfolio has an investment objective and investment policies that are si milar to or complementary to those of the Fund. The value of the Fund's investment in the Portfolios reflects the Fund's proportionate interest in the net assets of the Investment Portfolio, Government Obligations Portfolio and Floating Rate Portfolio, (99.8%, 0.9% and 0.1%, respectively, at October 31, 2005). The financial statements of the Investment Portfolio, including the portfolio of investments, are included elsewhere in this report and should be read in conjunction with the Fund's financial statements. A copy of the Government Obligations Portfolio's and Floating Rate Portfolio's financial statements are available on the EDGAR Database on the Securities and Exchange Commission's website (www.sec.gov), at the Commission's public reference room in Washington, DC or upon request from the Fund's principal underwriter, Eaton Vance Distributors Inc. (EVD) by calling 1-800-225-6265.
The following is a summary of significant accounting policies consistently followed by the Fund in the preparation of its financial statements. The policies are in conformity with accounting principles generally accepted in the United States of America.
A Investment Valuation — Valuation of securities by the Investment Portfolio is discussed in note 1A of the Portfolio's notes to financial statements which are included elsewhere in this report. The valuation policies of the and Government Obligations Portfolio are as follows: Debt securities (including collateralized mortgage obligations and certain mortgage backed securities ("MBS")) normally are valued by independent pricing services. The pricing services consider various factors relating to bonds or loans and/or market transactions to determine market value. Most seasoned MBS are valued by the investment adviser's matrix pricing system. The matrix pricing system also considers various factors relating to bonds and market transactions to determine market value. Options are valued at last sale price on a U.S. exchange or board of trade or, in the absence of a sale, at the mean between the last bid and asked price. Financial futures contracts listed on commodity exchanges are valued at closing settlement prices. Securities for which there is no such quotation or valuation are valued at fair value using methods determined in good faith by or at the direction of the Trustees. Short-term obligations and money market securities having remaining maturities of 60 days or less are valued at amortized cost, which approximates value.
Floating Rate Portfolio's valuation policies are as follows: Certain Senior Loans are deemed to be liquid because reliable market quotations are readily available for them. Liquid Senior Loans are valued on the basis of prices furnished by a pricing service. Other Senior Loans are valued at fair value by the Portfolio's investment adviser, Boston Management and Research (BMR), under procedures approved by the Trustees. In connection with determining the fair value of a Senior Loan, the investment adviser makes an assessment of the likelihood that the borrower will make a full repayment of the Senior Loan. The primary factors considered by the investment adviser when making this assessment are (i) the creditworthiness of the borrower, (ii) the value of the collateral backing the Senior Loan, and (iii) the priority of the Senior Loan versus other creditors of the borrower. If, based on its assessment, the investment adviser believ es there is a reasonable likelihood that the borrower will make a full repayment of the Senior Loan, the investment adviser will determine the fair value of the Senior Loan using a matrix pricing approach that considers the yield on the Senior Loan relative to yields on other loan
10
Eaton Vance Low Duration Fund as of October 31, 2005
NOTES TO FINANCIAL STATEMENTS CONT'D
interests issued by companies of comparable credit quality. If, based on its assessment, the investment adviser believes there is not a reasonable likelihood that the borrower will make a full repayment of the Senior Loan, the investment adviser will determine the fair value of the Senior Loan using analyses that include, but are not limited to (i) a comparison of the value of the borrower's outstanding equity and debt to that of comparable public companies; (ii) a discounted cash flow analysis; or (iii) when the investment adviser believes it is likely that a borrower will be liquidated or sold, an analysis of the terms of such liquidation or sale. In certain cases, the investment adviser will use a combination of analytical methods to determine fair value, such as when only a portion of a borrower's assets are likely to be sold. In conducting its assessment and analyses for purposes of determining fair value of a Senior Loan, the investment adviser will use its discretion and judgment in considering and appraising such factors, data and information and the relative weight to be given thereto as it deems relevant, including without limitation, some or all of the following: (i) the fundamental characteristics of and fundamental analytical data relating to the Senior Loan, including the cost, size, current interest rate, maturity and base lending rate of the Senior Loan, the terms and conditions of the Senior Loan and any related agreements, and the position of the Senior Loan in the Borrower's debt structure; (ii) the nature, adequacy and value of the collateral securing the Senior Loan, including the Portfolio's rights, remedies and interests with respect to the collateral; (iii) the creditworthiness of the Borrower, based on an evaluation of, among other things, its financial condition, financial statements and information about the Borrower's business, cash flows, capital structure and future prospects; (iv) information relating to the market for the Senior Loan, including price quotations for and trading in the Senior Loan and interests in similar Senior Loans and the market environment and investor attitudes towards the Senior Loan and interests in similar Senior Loans; (v) the experience, reputation, stability and financial condition of the agent and any intermediate participants in the Senior Loan; and (vi) general economic and market conditions affecting the fair value of the Senior Loan. Debt obligations (other than short-term obligations maturing in sixty days or less), including listed securities and securities for which price quotations are available and forward contracts, will normally be valued on the basis of market valuations furnished by dealers or pricing services. Financial futures contracts listed on commodity exchanges and exchange-traded options are valued at closing settlement prices. Over-the-counter options are valued at the mean between the bid and asked prices provided by dealers. Marketable securities liste d on the NASDAQ National Market System are valued at the NASDAQ official closing price. The value of interest rate swaps will be based upon a dealer quotation. Short-term obligations and money market securities maturing in sixty days or less are valued at amortized cost which approximates value. Investments for which reliable market quotations are unavailable are valued at fair value using methods determined in good faith by or at the direction of the Trustees of the Portfolio. Occasionally, events affecting the value of foreign securities may occur between the time trading is completed abroad and the close of the Exchange which will not be reflected in the computation of the Portfolio's net asset value (unless the Portfolio deems that such event would materially affect its net asset value in which case an adjustment would be made and reflected in such computation). The Portfolio may rely on an independent fair valuation service in makin g any such adjustment.
B Income — The Fund's net investment income or loss consists of the Fund's pro-rata share of the net investment income or loss of the Portfolios, less all actual and accrued expenses of the Fund, determined in accordance with accounting principles generally accepted in the United States of America.
C Federal Taxes — The Fund's policy is to comply with the provisions of the Internal Revenue Code applicable to regulated investment companies and to distribute to shareholders each year all of its taxable income, including any net realized gain on investments. Accordingly, no provision for federal income or excise tax is necessary. At October 31, 2005, the Fund, for federal income tax purposes, had a capital loss carryover of $8,787,489 which will reduce the taxable income arising from future net realized gain on investments, if any, to the extent permitted by the Internal Revenue Code and thus will reduce the amount of distributions to shareholders which would otherwise be necessary to relieve the Fund of any liability for federal income or excise tax. Such capital loss carryovers will expire on October 31, 2010 ($5,478), October 31, 2011 ($4,082,489), October 31, 2012 ($3,697,770) and October 31, 2013 ($1,001,752).
D Use of Estimates — The preparation of the financial statements in conformity with accounting principles generally accepted in the United States of America requires management to make estimates and assumptions that affect the reported amounts of assets and liabilities at the date of the financial statements and the reported amounts of income and expense during the reporting period. Actual results could differ from those estimates.
E Expenses — The majority of expenses of the Trust are directly identifiable to an individual fund. Expenses which are not readily identifiable to a specific fund are allocated taking into consideration, among other things, the nature and type of expense and the relative size of the funds.
11
Eaton Vance Low Duration Fund as of October 31, 2005
NOTES TO FINANCIAL STATEMENTS CONT'D
F Indemnifications — Under the Trust's organizational documents, its officers and Trustees may be indemnified against certain liabilities and expenses arising out of the performance of their duties to the Fund, and shareholders are indemnified against personal liability for obligations of the Trust. Additionally, in the normal course of business, the Fund enters into agreements with service providers that may contain indemnification clauses. The Fund's maximum exposure under these arrangements is unknown as this would involve future claims that may be made against the Fund that have not yet occurred.
G Expense Reduction — Investors Bank & Trust Company (IBT) serves as custodian to the Fund and the Portfolios. Pursuant to the respective custodian agreements, IBT receives a fee reduced by credits which are determined based on the average daily cash balance the Fund or the Portfolio maintains with IBT. All credit balances used to reduce the Fund's custodian fees are reported as a reduction of total expenses in the Statement of Operations. For the year ended October 31, 2005, there were no credits earned by the Fund.
H Other — Investment transactions are accounted for on a trade-date basis.
2 Distributions to Shareholders
The Fund declares dividends daily to shareholders of record at the time of declaration. Distributions are paid monthly. Distributions of allocated realized capital gains, if any, are made at least annually. Shareholders may reinvest capital gain distributions in additional shares of the Fund at the net asset value as of the ex-dividend date. Distributions are paid in the form of additional shares or, at the election of the shareholder, in cash. The Fund distinguishes between distributions on a tax basis and a financial reporting basis. Accounting principles generally accepted in the United States of America require that only distributions in excess of tax basis earnings and profits be reported in the financial statements as a return of capital. Permanent differences between book and tax accounting relating to distributions are reclassified to paid-in capital.
The tax character of the distributions declared for the year ended December 31, 2003, the period from January 1, 2004 to October 31, 2004 and the year ended October 31, 2005 was as follows:
| | | 10/31/05 | | 10/31/04 | | 12/31/03 | |
| Distributions declared from: | |
| Ordinary Income | | $ | 2,501,837 | | | $ | 2,864,421 | | | $ | 4,904,122 | | |
During the year ended October 31, 2005, accumulated distributions in excess of net investment income was decreased by $1,303,811, accumulated net realized loss was increased by $1,042,785 and paid-in-capital was decreased by $261,026 due to differences between book and tax accounting for paydown gains/losses on mortgage-backed securities, premium amortization, foreign currency and swaps. This change had no effect on net assets or net asset value per share.
At October 31, 2005, the components of distributable earnings (accumulated loss) on a tax basis were as follows:
| Undistributed ordinary income | | $ | 189,081 | | |
| Capital loss carryforwards | | $ | (8,787,489 | ) | |
The differences between components of distributable earnings (accumulated losses) on a tax basis and the amounts reflected in the statement of assets and liabilities are primarily due to differences in book and tax policies for financial future contracts and the timing of recognizing distributions.
3 Shares of Beneficial Interest
The Fund's Declaration of Trust permits the Trustees to issue an unlimited number of full and fractional shares of beneficial interest (without par value). Such shares may be issued in a number of different series (such as the Fund) and classes. Transactions in Fund shares were as follows:
| Class A | | Year Ended
October 31,
2005 | | Period Ended
October 31,
2004(1) | | Year Ended
December 31,
2003 | |
| Sales | | | 754,454 | | | | 1,441,186 | | | | 10,992,365 | | |
Issued to shareholders electing
to receive payments of
distributions in Fund shares | | | 72,890 | | | | 91,629 | | | | 165,077 | | |
| Redemptions | | | (2,444,476 | ) | | | (4,312,919 | ) | | | (7,221,795 | ) | |
| Exchange from Class B shares | | | 158,437 | | | | 188,030 | | | | — | | |
| Net increase (decrease) | | | (1,458,695 | ) | | | (2,592,074 | ) | | | 3,935,647 | | |
| Class B | | Year Ended
October 31,
2005 | | Period Ended
October 31,
2004(1) | | Year Ended
December 31,
2003 | |
| Sales | | | 233,464 | | | | 504,480 | | | | 2,179,780 | | |
Issued to shareholders electing
to receive payments of
distributions in Fund shares | | | 24,088 | | | | 23,458 | | | | 39,350 | | |
| Redemptions | | | (534,993 | ) | | | (681,260 | ) | | | (1,462,954 | ) | |
| Exchange to Class A shares | | | (158,333 | ) | | | (187,926 | ) | | | — | | |
| Net increase (decrease) | | | (435,774 | ) | | | (341,248 | ) | | | 756,176 | | |
12
Eaton Vance Low Duration Fund as of October 31, 2005
NOTES TO FINANCIAL STATEMENTS CONT'D
| Class C | | Year Ended
October 31,
2005 | | Period Ended
October 31,
2004 (1) | | Year Ended
December 31,
2003 | |
| Sales | | | 705,716 | | | | 571,485 | | | | 7,044,115 | | |
Issued to shareholders electing
to receive payments of
distributions in Fund shares | | | 69,577 | | | | 68,127 | | | | 105,670 | | |
| Redemptions | | | (1,718,945 | ) | | | (2,720,460 | ) | | | (3,248,823 | ) | |
| Net increase (decrease) | | | (943,652 | ) | | | (2,080,848 | ) | | | 3,900,962 | | |
(1) For the ten-months ended October 31, 2004.
4 Transactions with Affiliates
Eaton Vance Management (EVM) serves as the investment adviser and administrator of the Fund, providing the Fund with investment advisory services (relating to the investment of the Fund's assets in the Portfolios), and administering the business affairs of the Fund. Under the investment advisory and administrative agreement, EVM earns a fee in the amount of 0.15% per annum of average daily net assets of the Fund. Effective March 15, 2004, Eaton Vance agreed to waive its 0.15% fee in its entirety, such agreement being memorialized in a Fee Waiver Agreement between EVM and the Fund. For the year ended October 31, 2005, the advisory and administration fee amounted to $99,741. Pursuant to the waiver, EVM waived $99,741 of the Fund's investment advisory and administrative fee for the year ended October 31, 2005. The Portfolios have engaged Boston Management and Research (BMR), a subsidiary of EVM, to render investment advisory servic es and the Fund is allocated its share of the investment advisory fee paid by each Portfolio in which it invests. EVM serves as the sub-transfer agent of the Fund and receives from the transfer agent an aggregate fee based upon the actual expenses incurred by EVM in the performance of those services. For the year ended October 31, 2005, EVM earned $4,426 in sub-transfer agent fees. Certain officers and Trustees of the Fund and Portfolios are officers of the above organizations. Except as to Trustees of the Fund and the Portfolios who are not members of EVM's or BMR's organization, officers and Trustees receive remuneration for their services to the Fund out of the investment adviser fee earned by BMR. The Fund was informed that Eaton Vance Distributors, Inc. (EVD), a subsidiary of EVM, received $2,363 as its portion of the sales charge on sales of Class A shares for the year ended October 31, 2005.
5 Distribution and Service Plans
The Fund has in effect distribution plans for Class B shares (Class B Plan) and Class C shares (Class C Plan), pursuant to Rule 12b-1 under the Investment Company Act of 1940 and a service plan for Class A shares (Class A Plan) (collectively, the Plans). The Class B and Class C Plans require the Fund to pay EVD amounts equal to 0.75% and 0.60% of the Fund's average daily net assets attributable to Class B and Class C shares, respectively, for providing ongoing distribution services and facilities to the Fund. The Fund will automatically discontinue payments to EVD during any period in which there are no outstanding Uncovered Distribution Charges, which are equivalent to the sum of (i) 6.25% of the aggregate amount received by the Fund for the Class B and Class C shares sold, plus (ii) interest calculated by applying the rate of 1% over the prevailing prime r ate to the outstanding balance of Uncovered Distribution Charges of EVD of each respective class, reduced by the aggregate amount of contingent deferred sales charges (see Note 6) and daily amounts theretofore paid to EVD by each respective class. The Fund paid or accrued $85,856 and $173,627 for Class B and Class C shares, respectively, to or payable to EVD for the year ended October 31, 2005, representing 0.75% and 0.60% of the average daily net assets for Class B and Class C shares, respectively. At October 31, 2005, the amount of Uncovered Distribution Charges of EVD calculated under the Plans was approximately $755,000, and $4,273,000 for Class B and Class C shares, respectively.
The Plans authorize the Fund to make payments of service fees to EVD, investment dealers and other persons in amounts equal to 0.25% of the Fund's average daily net assets attributable to Class A, Class B and Class C shares for each fiscal year. Service fee payments are made for personal services and/or the maintenance of shareholder accounts. Service fees are separate and distinct from the sales commissions and distribution fees payable by the Fund to EVD and, as such, are not subject to automatic discontinuance when there are no outstanding Uncovered Distribution Charges of EVD. Service fees paid or accrued for the year ended October 31, 2005 amounted to $65,277, $28,619 and $72,344 for Class A, Class B, and Class C shares, respectively.
6 Contingent Deferred Sales Charge
A contingent deferred sales charge (CDSC) generally is imposed on redemptions of Class B shares made within four years of purchase and on redemptions of Class C shares made within one year of purchase. Generally, the CDSC is based upon the lower of the net asset value at date of redemption or date of purchase. No charge is levied on shares acquired by reinvestment of dividends or capital gain distributions. Class A shares purchased at net asset value in amounts of $1 million or more (other than shares purchased in a single transaction of $5 million or more) are subject to a 1.00% CDSC if redeemed within one year of
13
Eaton Vance Low Duration Fund as of October 31, 2005
NOTES TO FINANCIAL STATEMENTS CONT'D
purchase. The Class B CDSC is imposed at declining rates that begin at 3% in the case of redemptions in the first year after purchase, declining to 2.5% in the second year, 2.0% in the third year, 1.0% in the fourth year and 0.0% thereafter. Class C shares will be subject to a 1% CDSC if redeemed within one year of purchase.
No CDSC is levied on shares which have been sold to EVM or its affiliates or to their respective employees or clients and may be waived under certain other limited conditions. CDSC charges are paid to EVD to reduce the amount of Uncovered Distribution Charges calculated under the Fund's Distribution Plans (see Note 5). CDSC charges received when no Uncovered Distribution Charges exist will be credited to the Fund. The Fund was informed that EVD received approximately $3,000, $58,000, and $10,000 of CDSC paid by shareholders for Class A, Class B shares, and Class C shares, respectively, for the year ended October 31, 2005.
7 Investment Transactions
Increases and decreases in the Fund's investment in the Investment Portfolio for the year ended October 31, 2005 aggregated $37,719,129, and $51,083,812, respectively. Increases and decreases in the Fund's investment in the Government Obligations Portfolio for the year ended October 31, 2005 aggregated $6,276,651, and $18,308,481, respectively. Increases and decreases in the Fund's investment in the Floating Rate Portfolio for the year ended October 31, 2005 aggregated $692,646 and $4,605,119, respectively.
8 Investment in Portfolios
For the year ended October 31, 2005, the Fund was allocated net investment income and realized and unrealized gain (loss) from the Portfolios as follows:
| | | Investment
Portfolio | | Government
Obligations
Portfolio | | Floating
Rate
Portfolio | | Total | |
| Dividend & interest income | | $ | 1,539,564 | | | $ | 490,445 | | | $ | 344,610 | | | $ | 2,374,619 | | |
| Security lending income | | | — | | | | 44,276 | | | | — | | | | 44,276 | | |
| Expenses | | | (301,206 | ) | | | (102,145 | ) | | | (36,387 | ) | | | (439,738 | ) | |
| Net investment income | | $ | 1,238,358 | | | $ | 432,576 | | | $ | 308,223 | | | $ | 1,979,157 | | |
| Net realized gain (loss) — | |
Investment transactions
(identified cost basis) | | $ | (88 | ) | | $ | 6,126 | | | $ | (3,620 | ) | | $ | 2,418 | | |
| Financial futures contracts | | | — | | | | 2,590 | | | | — | | | | 2,590 | | |
| Forward foreign currency | | | — | | | | — | | | | 4,130 | | | | 4,130 | | |
| Swap contracts | | | — | | | | — | | | | 943 | | | | 943 | | |
| Net realized gain (loss) | | $ | (88 | ) | | $ | 8,716 | | | $ | 1,453 | | | $ | 10,081 | | |
Change in unrealized
appreciation (depreciation) | |
| Investments | | $ | (179,146 | ) | | $ | (159,509 | ) | | $ | 327 | | | $ | (338,328 | ) | |
| Financial futures contracts | | | — | | | | 28,485 | | | | — | | | | 28,485 | | |
| Forward foreign currency | | | — | | | | — | | | | 3,388 | | | | 3,388 | | |
| Swap contracts | | | — | | | | — | | | | 620 | | | | 620 | | |
Net change in unrealized
appreciation (depreciation) | | $ | (179,146 | ) | | $ | (131,024 | ) | | $ | 4,335 | | | $ | (305,835 | ) | |
9 Fiscal Year End Change
Effective October 15, 2004 the Fund changed its fiscal year end to October 31.
14
Eaton Vance Low Duration Fund as of October 31, 2005
REPORT OF INDEPENDENT REGISTERED PUBLIC ACCOUNTING FIRM
To the Trustees and Shareholders
of Eaton Vance Low Duration Fund:
In our opinion, the accompanying statement of assets and liabilities, and the related statements of operations and of changes in net assets and the financial highlights present fairly, in all material respects, the financial position of Eaton Vance Low Duration Fund ("the Fund"), a series of Eaton Vance Mutual Funds Trust at October 31, 2005, and the results of its operations, the changes in its net assets and the financial highlights for each of the periods indicated, in conformity with accounting principles generally accepted in the United States of America. These financial statements and financial highlights (hereafter referred to as "financial statements") are the responsibility of the Fund's management; our responsibility is to express an opinion on these financial statements based on our audits. We conducted our audits of these financial statements in accordance with the standards of the Public Company Accounting Oversight Board (United States). Those standards require that we plan and perform the audit to obtain reasonable assurance about whether the financial statements are free of material misstatement. An audit includes examining, on a test basis, evidence supporting the amounts and disclosures in the financial statements, assessing the accounting principles used and significant estimates made by management, and evaluating the overall financial statement presentation. We believe that our audits provide a reasonable basis for our opinion.
PricewaterhouseCoopers LLP
Boston, Massachusetts
December 23, 2005
15
Eaton Vance Low Duration Fund as of October 31, 2005
FEDERAL TAX INFORMATION (Unaudited)
The Form 1099-DIV you receive in January 2006 will show the tax status of all distributions paid to your account in calendar 2005. Shareholders are advised to consult their own tax adviser with respect to the tax consequences of their investment in the Fund.
16
Investment Portfolio as of October 31, 2005
PORTFOLIO OF INVESTMENTS
| Mortgage Pass-Throughs — 92.6% | |
| Security | | Principal
Amount
(000's omitted) | | Value | |
| FHLMC: | |
| 4.007%, with various maturities to 2037(1) | | $ | 1,677 | | | $ | 1,686,870 | | |
| 8.00%, with various maturities to 2025 | | | 1,652 | | | | 1,682,751 | | |
| 9.25%, with maturity at 2017 | | | 425 | | | | 442,145 | | |
| | | $ | 3,811,766 | | |
| FNMA: | |
| 3.687%, with maturity at 2018(1) | | | 293 | | | | 293,189 | | |
| 3.926%, with various maturities to 2035(1) | | | 3,341 | | | | 3,358,757 | | |
| 4.007%, with maturity at 2027(1) | | | 6,538 | | | | 6,586,559 | | |
| 4.128%, with maturity at 2036(1) | | | 1,646 | | | | 1,657,228 | | |
| 4.403%, with maturity at 2036(1) | | | 1,923 | | | | 1,936,691 | | |
| 9.00%, with maturity at 2011 | | | 1,486 | | | | 1,553,827 | | |
| 9.50%, with various maturities to 2022 | | | 3,819 | | | | 4,146,820 | | |
| 15.00%, with maturity at 2013 | | | 1,985 | | | | 2,389,802 | | |
| | | $ | 21,922,873 | | |
| GNMA: | |
| 11.00%, with maturity at 2016 | | | 188 | | | | 212,248 | | |
| | | $ | 212,248 | | |
| Collateralized Mortgage Obligations: | |
| FHLMC, Series 1543, Class VN, 7.00%, due 2023 | | | 2,150 | | | | 2,280,437 | | |
| FHLMC, Series 1577, Class PH, 6.30%, due 2023 | | | 1,282 | | | | 1,293,434 | | |
| FHLMC, Series 1666, Class H, 6.25%, due 2023 | | | 1,470 | | | | 1,496,779 | | |
| FHLMC, Series 1671, Class HA, 3.73%, due 2024(2) | | | 2,500 | | | | 2,507,348 | | |
| FHLMC, Series 1694, Class PQ, 6.50%, due 2023 | | | 639 | | | | 646,256 | | |
| FHLMC, Series 2132, Class FB, 4.81%, due 2029(2) | | | 1,749 | | | | 1,789,300 | | |
| FHLMC, Series 2791, Class FI, 4.32%, due 2031(2) | | | 2,597 | | | | 2,609,464 | | |
| FNMA, Series 1993-140, Class J, 6.65%, due 2013 | | | 2,000 | | | | 2,045,750 | | |
| FNMA, Series 1993-250, Class Z, 7.00%, due 2023 | | | 1,389 | | | | 1,448,652 | | |
| FNMA, Series G97-4, Class FA, 4.80%, due 2027(2) | | | 580 | | | | 587,987 | | |
| | | $ | 16,705,407 | | |
Total Mortgage Pass-Throughs
(identified cost $43,015,153) | | | | | | $ | 42,652,294 | | |
| Short-Term Investments — 12.3% | |
| Security | | Principal
Amount
(000's omitted) | | Value | |
Banque National De Paris Time Deposit,
4.02%, 11/1/05 | | $ | 2,022 | | | $ | 2,021,515 | | |
Investors Bank and Trust Company Time Deposit,
4.03%, 11/1/05 | | | 3,640 | | | | 3,640,000 | | |
Total Short-Term Investments
(at amortized cost, $5,661,515) | | | | $ | 5,661,515 | | |
Total Investments — 104.9%
(identified cost $48,676,668) | | | | $ | 48,313,809 | | |
| Other Assets, Less Liabilities — (4.9)% | | | | $ | (2,272,439 | ) | |
| Net Assets — 100.0% | | | | $ | 46,041,370 | | |
FHLMC - Federal Home Loan Mortgage Corporation (Freddie Mac)
FNMA - Federal National Mortgage Association (Fannie Mae)
GNMA - Government National Mortgage Association (Ginnie Mae)
(1) Adjustable rate mortgage.
(2) Floating-rate security.
See notes to financial statements
17
Investment Portfolio as of October 31, 2005
FINANCIAL STATEMENTS
Statement of Assets and Liabilities
As of October 31, 2005
| Assets | |
| Investments, at value (identified cost, $48,676,668) | | $ | 48,313,809 | | |
| Cash | | | 3,983 | | |
| Receivable for investments sold | | | 30,629 | | |
| Interest receivable | | | 211,802 | | |
| Total assets | | $ | 48,560,223 | | |
| Liabilities | |
| Payable for investments purchased | | $ | 2,478,894 | | |
| Payable to affiliate for investment advisory fees | | | 19,861 | | |
| Payable to affiliate for Trustees' fees | | | 156 | | |
| Accrued expenses | | | 19,942 | | |
| Total liabilities | | $ | 2,518,853 | | |
| Net Assets applicable to investors' interest in Portfolio | | $ | 46,041,370 | | |
| Sources of Net Assets | |
| Net proceeds from capital contributions and withdrawals | | $ | 46,404,229 | | |
| Net unrealized depreciation (computed on the basis of identified cost) | | | (362,859 | ) | |
| Total | | $ | 46,041,370 | | |
Statement of Operations
For the Year Ended
October 31, 2005
| Investment Income | |
| Interest | | $ | 1,517,333 | | |
| Dividends | | | 25,892 | | |
| Total investment income | | $ | 1,543,225 | | |
| Expenses | |
| Investment adviser fee | | $ | 234,429 | | |
| Trustees' fees and expenses | | | 3,546 | | |
| Custodian fee | | | 43,918 | | |
| Accounting services | | | 15,194 | | |
| Miscellaneous | | | 5,294 | | |
| Total expenses | | $ | 302,381 | | |
Deduct —
Reduction of custodian fee | | $ | 510 | | |
| Total expense reductions | | $ | 510 | | |
| Net expenses | | $ | 301,871 | | |
| Net investment income | | $ | 1,241,354 | | |
| Realized and Unrealized Gain (Loss) | |
Change in unrealized appreciation (depreciation) —
Investments (identified cost basis) | | $ | (179,862 | ) | |
| Net change in unrealized appreciation (depreciation) | | $ | (179,862 | ) | |
| Net realized and unrealized loss | | $ | (179,862 | ) | |
| Net increase in net assets from operations | | $ | 1,061,492 | | |
See notes to financial statements
18
Investment Portfolio as of October 31, 2005
FINANCIAL STATEMENTS CONT'D
Statements of Changes in Net Assets
| Increase (Decrease) in Net Assets | | Year Ended
October 31, 2005 | | Period Ended
October 31, 2004(1) | | Year Ended
December 31, 2003 | |
From operations —
Net investment income | | $ | 1,241,354 | | | $ | 819,651 | | | $ | 671,832 | | |
| Net realized loss from investment transactions | | | — | | | | (70,967 | ) | | | (26,460 | ) | |
| Net change in unrealized appreciation (depreciation) from investments | | | (179,862 | ) | | | (45,773 | ) | | | (137,263 | ) | |
| Net increase in net assets from operations | | $ | 1,061,492 | | | $ | 702,911 | | | $ | 508,109 | | |
Capital transactions —
Contributions | | $ | 37,719,129 | | | $ | 75,179,725 | | | $ | 244,906,169 | | |
| Withdrawals | | | (51,083,812 | ) | | | (89,695,225 | ) | | | (198,315,283 | ) | |
| Net increase (decrease) in net assets from capital transactions | | $ | (13,364,683 | ) | | $ | (14,515,500 | ) | | $ | 46,590,886 | | |
| Net increase (decrease) in net assets | | $ | (12,303,191 | ) | | $ | (13,812,589 | ) | | $ | 47,098,995 | | |
| Net Assets | |
| At beginning of period | | $ | 58,344,561 | | | $ | 72,157,150 | | | $ | 25,058,155 | | |
| At end of period | | $ | 46,041,370 | | | $ | 58,344,561 | | | $ | 72,157,150 | | |
(1) For the ten months ended October 31, 2004.
See notes to financial statements
19
Investment Portfolio as of October 31, 2005
FINANCIAL STATEMENTS CONT'D
Supplementary Data
| | | Year Ended
October 31, | | Period Ended | | Year Ended December 31, | |
| | | 2005 | | October 31, 2004(1) | | 2003 | | 2002(2) | |
| Ratios/Supplemental Data† | |
| Ratios (As a percentage of average daily net assets): | |
| Net expenses | | | 0.65 | % | | | 0.62 | %(3) | | | 0.59 | % | | | 0.50 | %(3) | |
| Net expenses after custodian fee reduction | | | 0.64 | % | | | 0.62 | %(3) | | | 0.59 | % | | | 0.50 | %(3) | |
| Net investment income | | | 2.65 | % | | | 1.51 | %(3) | | | 0.92 | % | | | 0.84 | %(3) | |
| Portfolio Turnover | | | 67 | % | | | 92 | % | | | 43 | % | | | 0 | % | |
| Total Return | | | 2.32 | % | | | 1.12 | % | | | 0.74 | % | | | 0.23 | % | |
| Net assets, end of year (000's omitted) | | $ | 46,041 | | | $ | 58,345 | | | $ | 72,157 | | | $ | 25,058 | | |
† The operating expenses of the Portolio reflect an allocation of expenses to the Investment Adviser. Had such action not been taken, the ratios would have been as follows:
| Ratios (As a percentage of average daily net assets): | |
| Expenses | | | 1.07 | %(3) | |
| Expenses after custodian fee reduction | | | 1.07 | %(3) | |
| Net investment income | | | 0.27 | %(3) | |
(1) For the ten-month period ended October 31, 2004.
(2) For the period from the start of business, September 30, 2002, to December 31, 2002.
(3) Annualized.
See notes to financial statements
20
Investment Portfolio as of October 31, 2005
NOTES TO FINANCIAL STATEMENTS
1 Significant Accounting Policies
Investment Portfolio (the Portfolio) is registered under the Investment Company Act of 1940, as amended, as a diversified open-end management investment company. The Portfolio was organized as a trust under the laws of the State of New York on June 18, 2002. The Portfolio seeks total return by investing in a broad range of fixed income securities, including U.S. Government obligations, corporate bonds, preferred stocks, asset-backed securities and money market instruments. The Declaration of Trust permits the Trustees to issue interests in the Portfolio. At October 31, 2005, the Eaton Vance Low Duration Fund held an approximate 99.8% interest in the Portfolio. The following is a summary of significant accounting policies of the Portfolio. The policies are in conformity with accounting principles generally accepted in the United States of America.
A Investment Valuation — Debt securities (including collateralized mortgage obligations and certain mortgage backed securities ("MBS")) normally are valued by an independent pricing service. The pricing service considers various factors relating to bonds or loans and/or market transactions to determine market value. Most seasoned MBS are valued by the investment adviser's matrix pricing system. The matrix pricing system also considers various factors relating to bonds and market transactions to determine market value. Short-term obligations and money market securities maturing in 60 days or less are valued at amortized cost which approximates value. Investments for which valuations or market quotation s are unavailable are valued at fair value using methods determined in good faith by or at the direction of the Trustees.
B Income — Interest income is determined on the basis of interest accrued adjusted for amortization of premium or accretion of discount.
C Income Taxes — The Portfolio has elected to be treated as a partnership for federal tax purposes. No provision is made by the Portfolio for federal or state taxes on any taxable income of the Portfolio because each investor in the Portfolio is ultimately responsible for the payment of any taxes. Since at least one of the Portfolio's investors is a regulated investment company that invests all or substantially all of its assets in the Portfolio, the Portfolio normally must satisfy the applicable source of income and diversification requirements (under the Internal Revenue Code) in order for its investors to satisfy them. The Portfolio will allocate at least annually among its investors each investor's distributive share of the Portfolio's net investment income, net realized capital gains, and any other items of income, gain, loss, deduction or credit.
D Use of Estimates — The preparation of the financial statements in conformity with accounting principles generally accepted in the United States of America requires management to make estimates and assumptions that affect the reported amounts of assets and liabilities at the date of the financial statements and the reported amounts of income and expense during the reporting period. Actual results could differ from those estimates.
E Indemnifications — Under the Portfolio's organizational documents, its officers and Trustees may be indemnified against certain liabilities and expenses arising out of the performance of their duties to the Portfolio. Interestholders in the Portfolio are jointly and severally liable for the liabilities and obligations of the Portfolio in the event that the Portfolio fails to satisfy such liabilities and obligations; provided, however, that, to the extent assets are available in the Portfolio, the Portfolio may, under certain circumstances, indemnify interestholders from and against any claim or liability to which such holder may become subject by reason of being or having been an interestholder in the Portfolio. Additionally, in the normal course of business, the Portfo lio enters into agreements with service providers that may contain indemnification clauses. The Portfolio's maximum exposure under these arrangements is unknown as this would involve future claims that may be made against the Portfolio that have not yet occurred.
F Expense Reduction — Investors Bank & Trust Company (IBT) serves as custodian to the Portfolio. Pursuant to the custodian agreement, IBT receives a fee reduced by credits which are determined based on the average daily cash balances the Portfolio maintains with IBT. All credit balances used to reduce the Portfolio's custodian fees are reported as a reduction of expenses on the Statement of Operations. For the year ended October 31, 2005, $510 in credit balances were used to reduce the Portfolio's custodian fee.
G Other — Investment transactions are accounted for on a trade date basis. Realized gains and losses are computed based on the specific identification of securities sold.
21
Investment Portfolio as of October 31, 2005
NOTES TO FINANCIAL STATEMENTS CONT'D
2 Investment Adviser Fee and Other Transactions with Affiliates
The investment adviser fee is earned by Boston Management and Research (BMR), a wholly-owned subsidiary of Eaton Vance Management (EVM), as compensation for management and investment advisory services rendered to the Portfolio. The fee is computed at the monthly rate of 0.0417% (0.50% per annum) of the Portfolio's average daily net assets. For the year ended October 31, 2005, the fee was equivalent to 0.50% of the Portfolio's average net assets for such period and amounted to $234,429. Except as to Trustees of the Portfolio who are not members of EVM's or BMR's organization, officers and Trustees receive remuneration for their services to the Portfolio out of such investment adviser fee. Trustees of the Portfolio that are not affiliated with the Investment Adviser may elect to defer receipt of all or a percentage of their annual fees in accordance with the terms of the Trustees Deferred Compensation Plan. For the year ended Octo ber 31, 2005, no significant amounts have been deferred.
Certain officers and Trustees of the Portfolio are officers of the above organizations.
3 Investment Transactions
Purchases and sales of investments, other than short-term obligations and including paydowns on mortgage backed securities in Investment Portfolio, aggregated $33,706,370 and $26,305,779, respectively.
4 Federal Income Tax Basis of Unrealized Appreciation (Depreciation)
The cost and unrealized appreciation (depreciation) in value of the investments owned at October 31, 2005, as computed on a federal income tax basis, were as follows:
| Aggregate cost | | $ | 48,676,668 | | |
| Gross unrealized appreciation | | $ | 262,918 | | |
| Gross unrealized depreciation | | | (625,777 | ) | |
| Net unrealized depreciation | | $ | (362,859 | ) | |
5 Line of Credit
The Portfolio participates with other portfolios and funds managed by BMR and EVM and its affiliates in a $150 million unsecured line of credit agreement with a group of banks. Borrowings will be made by the Portfolio solely to facilitate the handling of unusual and/or unanticipated short term cash requirements. Interest is charged to each participating portfolio or fund based on its borrowings at an amount above either the Eurodollar rate or federal funds rate. In addition, a fee computed at an annual rate of 0.10% on the daily unused portion of the line of credit is allocated among the participating portfolios and funds at the end of each quarter. The Portfolio did not have any significant borrowings or allocated fees during the year ended October 31, 2005.
6 Financial Instruments
The Portfolio may trade in financial instruments with off-balance sheet risk in the normal course of its investing activities to assist in managing exposure to various market risks. These financial instruments include written options and financial futures contracts, and may involve, to a varying degree, elements of risk in excess of the amounts recognized for financial statement purposes. The notional or contractual amounts of these instruments represent the investment the Portfolio has in particular classes of financial instruments and does not necessarily represent the amounts potentially subject to risk. The measurement of the risks associated with these instruments is meaningful only when all related and offsetting transactions are considered. At October 31, 2005, there were no outstanding obligations under these financial instruments.
7 Fiscal Year End Change
Effective October 15, 2004, the Portfolio changed its fiscal year end to October 31.
22
Investment Portfolio as of October 31, 2005
REPORT OF INDEPENDENT REGISTERED PUBLIC ACCOUNTING FIRM
To the Trustees and Investors
of Investment Portfolio:
In our opinion, the accompanying statement of assets and liabilities, including the portfolio of investments, and the related statements of operations and of changes in net assets and the supplementary data present fairly, in all material respects, the financial position of Investment Portfolio (the "Portfolio") at October 31, 2005, and the results of its operations, the changes in its net assets and the supplementary data for the periods indicated, in conformity with accounting principles generally accepted in the United States of America. These financial statements and supplementary data (hereafter referred to as "financial statements") are the responsibility of the Portfolio's management; our responsibility is to express an opinion on these financial statements based on our audits. We conducted our audits of these financial statements in accordance with the standards of the Public Company Accounting Oversight Board (United St ates). Those standards require that we plan and perform the audit to obtain reasonable assurance about whether the financial statements are free of material misstatement. An audit includes examining, on a test basis, evidence supporting the amounts and disclosures in the financial statements, assessing the accounting principles used and significant estimates made by management, and evaluating the overall financial statement presentation. We believe that our audits, which included confirmation of securities at October 31, 2005 by correspondence with the custodian and brokers, provide a reasonable basis for our opinion.
PricewaterhouseCoopers LLP
Boston, Massachusetts
December 23, 2005
23
Eaton Vance Low Duration Fund
BOARD OF TRUSTEES' ANNUAL APPROVAL OF THE INVESTMENT ADVISORY AGREEMENTS
The Eaton Vance Low Duration Fund (the "Fund") is a fund of funds that may invest in five Portfolios, Cash Management, Floating Rate, Government Obligations, Investment Grade Income and Investment Portfolios (together, the "Portfolios"), for which Boston Management and Research serves as investment adviser. Eaton Vance Management ("Eaton Vance") serves as the investment adviser to the Fund. The investment advisory agreement between Eaton Vance and the Fund and the investment advisory agreements between Boston Management and Research and the Portfolios each provides that the advisory agreement will continue in effect from year to year so long as its continuance is approved at least annually (i) by a vote of a majority of the noninterested Trustees of the Fund or Portfolio, as applicable, cast in person at a meeting called for the purpose of voting on such approval and (ii) by the Trustees of the Fund or Portfolio, as applicable, or by vote of a majority of the outstanding interests of the Fund or Portfolio, as applicable.
In considering the annual approval of the investment advisory agreements, the Special Committee of the Board of Trustees considered information that had been provided throughout the year at regular Board meetings, as well as information furnished for a series of meetings held in February and March in preparation for a Board meeting held on March 21, 2005 to specifically consider the renewal of the investment advisory agreements. Such information included, among other things, the following:
• An independent report comparing the advisory fees of each Portfolio and the Fund with those of comparable funds;
• An independent report comparing the expense ratio of the Fund to those of comparable funds;
• Information regarding Fund investment performance (including on a risk-adjusted basis) in comparison to relevant peer groups of funds and appropriate indices;
• The economic outlook and the general investment outlook in relevant investment markets;
• Eaton Vance's results and financial condition and the overall organization of the investment adviser;
• The procedures and processes used to determine the fair value of Fund assets including in particular the valuation of senior loan portfolios and actions taken to monitor and test the effectiveness of such procedures and processes;
• Eaton Vance's management of the relationship with the custodian, subcustodians and fund accountants;
• The resources devoted to compliance efforts undertaken by Eaton Vance on behalf of the funds it manages and the record of compliance with the investment policies and restrictions and with policies on personal securities transactions;
• The quality, nature, cost and character of the administrative and other non-investment management services provided by Eaton Vance and its affiliates; and
• The terms of the advisory agreements and the reasonableness and appropriateness of the particular fee paid by each Portfolio and the Fund for the services described therein.
The Special Committee also considered each investment adviser's portfolio management capabilities, including information relating to the education, experience, and number of investment professionals and other personnel who provide services under the investment advisory agreements. The Special Committee noted the benefits of the investment adviser's extensive in-house research capabilities and the other resources available to the investment adviser. The Special Committee noted the experience of the 26 bank loan investment professionals and other personnel who would provide services under the Floating Rate Portfolio's investment advisory agreement, including four portfolio managers and 15 analysts. Many of these portfolio managers and analysts have previous experience working for commercial banks and other lending institutions. The Special Committee also took into account the time and attention to be devoted by senior management t o the Fund, each Portfolio and the other funds in the complex. The Special Committee evaluated the level of skill required to manage the Portfolios and concluded that the human resources available to each investment adviser were appropriate to fulfill its duties on behalf of the applicable Portfolio.
In its review of comparative information with respect to Fund investment performance the Special Committee concluded that the Fund has performed within a range that the Special Committee deemed competitive. With respect to its review of investment advisory fees, the Special Committee concluded that the fees paid by each Portfolio and the Fund are within the range of those paid by comparable funds within the mutual fund industry. In reviewing the information regarding the expense ratio of the Fund, the Special Committee concluded that, in light of the size of the Fund and taking into consideration the voluntary elimination of the advisory and administration fee paid by the Fund to Eaton Vance prior to March 15, 2004, the Fund's expense ratio is reasonable.
24
Eaton Vance Low Duration Fund
BOARD OF TRUSTEES' ANNUAL APPROVAL OF THE INVESTMENT ADVISORY AGREEMENTS CONT'D
In addition to the factors mentioned above, the Special Committee reviewed the level of each investment adviser's profits in providing investment management services for the Portfolios and for all Eaton Vance funds as a group. The Special Committee also reviewed the benefits to Eaton Vance and its affiliates in providing administration services for the Fund and for all Eaton Vance funds as a group. The Special Committee noted in particular that effective March 15, 2004, Eaton Vance and the Fund entered into a contractual agreement pursuant to which Eaton Vance agreed to eliminate the annual administration fee previously payable by the Fund. In addition, the Special Committee considered the fiduciary duty assumed by the investment adviser in connection with the services rendered to the Fund and Portfolios and the business reputation of the investment adviser and its financial resources. The Trustees concluded that in light of the services rendered, the profits realized by the investment adviser are not unreasonable. The Special Committee also considered the extent to which the investment adviser appears to be realizing benefits from managing each of the Floating Rate Portfolio, Government Obligations Portfolio and Investment Grade Income Portfolio, and concluded that the fee breakpoints which are in place will allow for an equitable sharing of such benefits, when realized, with such Portfolios and the shareholders of the Fund.
The Special Committee did not consider any single factor as controlling in determining whether or not to renew the investment advisory agreements. Nor are the items described herein all the matters considered by the Special Committee. In assessing the information provided by Eaton Vance and its affiliates, the Special Committee also took into consideration the benefits to shareholders of investing in a fund that is a part of a large family of funds which provides a large variety of shareholder services.
Based on its consideration of the foregoing factors and conclusions, and such other factors and conclusions as it deemed relevant, and assisted by independent counsel, the Special Committee concluded that the renewal of the investment advisory agreements, including the fee structures, is in the interests of shareholders.
25
Eaton Vance Low Duration Fund
MANAGEMENT AND ORGANIZATION
Fund Management. The Trustees of Eaton Vance Mutual Funds Trust (the Trust), Cash Management Portfolio (CMP), Floating Rate Portfolio (FRP), Government Obligations Portfolio (GOP), Investment Portfolio (IP) and Investment Grade Income Portfolio (IGIP), are responsible for the overall management and supervision of the Trust's and Portfolios' affairs. The Trustees and officers of the Trust and the Portfolios are listed below. Except as indicated, each individual has held the office shown or other offices in the same company for the last five years. Trustees and officers of the Trust and the Portfolios hold indefinite terms of office. The "noninterested Trustees" consist of those Trustees who are not "interested persons" of the Trust and the Portfolios, as that term is defined under the 1940 Act. The business address of each Trustee and officer is The Eaton Van ce Building, 255 State Street, Boston, Massachusetts 02109. As used below, "EVC" refers to Eaton Vance Corp., "EV" refers to Eaton Vance, Inc., "EVM" refers to Eaton Vance Management, "BMR" refers to Boston Management and Research, and "EVD" refers to Eaton Vance Distributors, Inc. EVC and EV are the corporate parent and trustee, respectively, of EVM and BMR. EVD is the Fund's principal underwriter, the Portfolios' placement agent and a wholly-owned subsidiary of EVM. Each officer affiliated with Eaton Vance may hold a position with other Eaton Vance affiliates that is comparable to his or her position with Eaton Vance listed below.
Name and
Date of Birth | | Position(s)
with the
Trust and
the Portfolios | | Term of
Office and
Length of
Service | | Principal Occupation(s)
During Past Five Years | | Number of Portfolios
in Fund Complex
Overseen By
Trustee(1) | | Other Directorships Held | |
| Interested Trustee | |
|
| James B. Hawkes 11/9/41 | | Trustee | | Trustee of the Trust since 1991; of GOP since 1992; of CMP since 1993; of FRP and IGIP since 2000; of IP since 2002 | | Chairman, President and Chief Executive Officer of BMR, EVC, EVM and EV; Director of EV; Vice President and Director of EVD. Trustee and/or officer of 161 registered investment companies in the Eaton Vance Fund Complex. Mr. Hawkes is an interested person because of his positions with BMR, EVM, EVC and EV, which are affiliates of the Fund and Portfolios. | | | 161 | | | Director of EVC | |
|
| Noninterested Trustee(s) | |
|
| Benjamin C. Esty 1/2/63 | | Trustee | | Since 2005 | | Professor, Harvard University Graduate School of Business Administration (since 2003). Formerly, Associate Professor, Harvard University Graduate School of Business Administration (2000-2003). | | | 152 | | | None | |
|
| Samuel L. Hayes, III 2/23/35 | | Trustee | | Trustee of the Trust since 1986; of CMP and GOP since 1993; of FRP and IGIP since 2000; of IP since 2002 and Chairman of the Board since 2005 | | Jacob H. Schiff Professor of Investment Banking Emeritus, Harvard University Graduate School of Business Administration. | | | 161 | | | Director of Tiffany & Co. (specialty retailer) and Telect, Inc. (telecommunication services company) | |
|
| William H. Park 9/19/47 | | Trustee | | Since 2003 | | President and Chief Executive Officer, Prizm Capital Management, LLC (investment management firm) (since 2002). Executive Vice President and Chief Financial Officer, United Asset Management Corporation (a holding company owning institutional investment management firms) (1982-2001). | | | 161 | | | None | |
|
| Ronald A. Pearlman 7/10/40 | | Trustee | | Since 2003 | | Professor of Law, Georgetown University Law Center (since 1999). Tax Partner, Covington & Burling, Washington, DC (1991-2000). | | | 161 | | | None | |
|
26
Eaton Vance Low Duration Fund
MANAGEMENT AND ORGANIZATION CONT'D
Name and
Date of Birth | | Position(s)
with the
Trust and
Portfolios | | Term of
Office and
Length of
Service | | Principal Occupation(s)
During Past Five Years | | Number of Portfolios
in Fund Complex
Overseen By
Trustee(1) | | Other Directorships Held | |
| Noninterested Trustee(s) (continued) | |
|
| Norton H. Reamer 9/21/35 | | Trustee | | Trustee of the Trust since 1986; of CMP and GOP since 1993; of FRP and IGIP since 2000; of IP since 2002 | | President, Chief Executive Officer and a Director of Asset Management Finance Corp. (a specialty finance company serving the investment management industry) (since October 2003). President, Unicorn Corporation (an investment and financial advisory services company) (since September 2000). Formerly, Chairman, Hellman, Jordan Management Co., Inc. (an investment management company) (2000-2003). Formerly, Advisory Director of Berkshire Capital Corporation (investment banking firm) (2002-2003). Formerly Chairman of the Board, United Asset Management Corporation (a holding company owning institutional investment management firms) and Chairman, President and Director, UAM Funds (mutual funds) (1980-2000) | | | 161 | | | None | |
|
| Lynn A. Stout 9/14/57 | | Trustee | | Trustee of the Trust, CMP and GOP since 1998; of FRP and IGIP since 2000; of IP since 2002 | | Professor of Law, University of California at Los Angeles School of Law (since July 2001). Formerly, Professor of Law, Georgetown University Law Center. | | | 161 | | | None | |
|
| Ralph F. Verni 1/26/43 | | Trustee | | Since 2005 | | Consultant and private investor (since 2000). Formerly, President and Chief Executive Officer, Redwood Investment Systems, Inc. (software developer) (2000). Formerly, President and Chief Executive Officer, State Street Research & Management (investment advisor), SSRM Holdings (parent of State Street Research & Management), and SSR Realty (institutional realty manager) (1992-2000). | | | 152 | | | Director of W.P. Carey & Company LLC (manager of real estate investment trusts) | |
|
| Principal Officers who are not Trustees | |
|
Name and
Date of Birth | | Position(s)
with the
Trust and
the Portfolios | | Term of
Office and
Length of
Service | | Principal Occupation(s)
During Past Five Years | |
| Thomas E. Faust Jr. 5/31/58 | | President of the Trust | | Since 2002 | | Executive Vice President of EVM, BMR, EVC and EV; Chief Investment Officer of EVM and BMR and Director of EVC. Chief Executive Officer of Belair Capital Fund LLC, Belcrest Capital Fund LLC, Belmar Capital Fund LLC, Belport Capital Fund LLC and Belrose Capital Fund LLC (private investment companies sponsored by EVM). Officer of 65 registered investment companies managed by EVM or BMR. | |
|
| William H. Ahern, Jr. 7/28/59 | | Vice President of
the Trust | | Since 1995 | | Vice President of EVM and BMR. Officer of 70 registered investment companies managed by EVM or BMR. | |
|
| Cynthia J. Clemson 3/2/63 | | Vice President of
the Trust | | Since 2005 | | Vice President of EVM and BMR. Officer of 85 registered investment companies managed by EVM or BMR. | |
|
| Kevin S. Dyer 2/21/75 | | Vice President of
the Trust | | Since 2005 | | Assistant Vice President of EVM and BMR. Officer of 24 registered investment companies managed by EVM or BMR. | |
|
| Christine Johnston 11/9/72 | | Vice President of IP | | Since 2003 | | Vice President of EVM and BMR. Officer of 2 registered investment companies managed by EVM or BMR. | |
|
| Elizabeth S. Kenyon 9/8/59 | | President of CMP
and IGIP | | Since 2002(2) | | Vice President of EVM and BMR. Officer of 2 registered investment companies managed by EVM or BMR. | |
|
27
Eaton Vance Low Duration Fund
MANAGEMENT AND ORGANIZATION CONT'D
Name and
Date of Birth | | Position(s)
with the
Trust and
the Portfolios | | Term of
Office and
Length of
Service | | Principal Occupation(s)
During Past Five Years | |
| Principal Officers who are not Trustees (continued) | |
|
| Aamer Khan 6/7/60 | | Vice President of
the Trust | | Since 2005 | | Vice President of EVM and BMR. Officer of 27 registered investment companies managed by EVM or BMR. | |
|
| Thomas H. Luster 4/8/62 | | Vice President of CMP and IGIP | | Since 2002 | | Vice President of EVM and BMR. Officer of 16 registered investment companies managed by EVM or BMR. | |
|
| Michael R. Mach 7/15/47 | | Vice President of
the Trust | | Since 1999 | | Vice President of EVM and BMR. Officer of 32 registered investment companies managed by EVM or BMR. | |
|
| Robert B. MacIntosh 1/22/57 | | Vice President of
the Trust | | Since 1998 | | Vice President of EVM and BMR. Officer of 85 registered investment companies managed by EVM or BMR. | |
|
| Scott H. Page 11/30/59 | | Vice President of FRP | | Since 2000 | | Vice President of EVM and BMR. Officer of 14 registered investment companies managed by EVM or BMR. | |
|
| Duncan W. Richardson 10/26/57 | | Vice President
the Trust | | Since 2001 | | Senior Vice President and Chief Equity Investment Officer of EVM and BMR. Officer of 51 registered investment companies managed by EVM or BMR. | |
|
| Walter A. Row, III 7/20/57 | | Vice President of
the Trust | | Since 2001 | | Director of Equity Research and a Vice President of EVM and BMR. Officer of 31 registered investment companies managed by EVM or BMR. | |
|
| Payson F. Swaffield 8/13/56 | | President of FRP | | Since 2002(2) | | Vice President of EVM and BMR. Officer of 14 registered investment companies managed by EVM or BMR. | |
|
| Judith A. Saryan 8/21/54 | | Vice President of
the Trust | | Since 2003 | | Vice President of EVM and BMR. Officer of 33 registered investment companies managed by EVM or BMR. | |
|
| Susan Schiff 3/13/61 | | Vice President of the Trust, GOP and IP | | Vice President of the Trust and IP since 2002; of GOP since 1993 | | Vice President of EVM and BMR. Officer of 29 registered investment companies managed by EVM or BMR. | |
|
| Mark S. Venezia 5/23/49 | | President of GOP
and IP | | Since 2002(2) | | Vice President of EVM and BMR. Officer of 5 registered investment companies managed by EVM or BMR. | |
|
| Kristin S. Anagnost 6/12/65 | | Treasurer of CMP | | Since 2002(2) | | Assistant Vice President of EVM and BMR. Officer of 91 registered investment companies managed by EVM or BMR. | |
|
| William J. Austin, Jr. 12/27/51 | | Treasurer of IGIP | | Since 2002(2) | | Vice President of EVM and BMR. Officer of 45 registered investment companies managed by EVM or BMR. | |
|
| Barbara E. Campbell 6/19/57 | | Treasurer of the Trust, FRP, GOP and IP | | Treasurer of the Trust since 2005(3) , of FRP, GOP and IP since 2002(2) | | Vice President of EVM and BMR. Officer of 161 registered investment companies managed by EVM or BMR. | |
|
| Alan R. Dynner 10/10/40 | | Secretary | | Secretary of the Trust, CMP and GOP since 1997; of IGIP since 2000; of IP since 2002 | | Vice President, Secretary and Chief Legal Officer of BMR, EVM, EVD, EV and EVC. Officer of 161 registered investment companies managed by EVM or BMR. | |
|
| Paul M. O'Neil 7/11/53 | | Chief
Compliance Officer | | Since 2004 | | Vice President of EVM and BMR. Officer of 161 registered investment companies managed by EVM or BMR. | |
|
(1) Includes both master and feeder funds in a master-feeder structure.
(2) Prior to 2002, Ms. Kenyon served as Vice President of CMP and IGIP since 2001, Mr. Swaffield served as Vice President of FRP since 2000, Mr. Venezia served as Vice President of GOP since 1993, Ms. Anagnost served as Assistant Treasurer of CMP since 1998, Mr. Austin served as Assistant Treasurer of IGIP since 2000, Ms. Campbell served as Assistant Treasurer of FRP since 2000 and GOP since 1998.
(3) Prior to 2005, Ms. Campbell served as Assistant Treasurer of the Trust since 1995.
The SAI for the Fund includes additional information about the Trustees and officers of the Fund and the Portfolios and can be obtained without charge by calling 1-800-225-6265.
28
This Page Intentionally Left Blank
Investment Adviser of Investment Portfolio
Boston Management and Research
The Eaton Vance Building
255 State Street
Boston, MA 02109
Fund Investment Adviser and Administrator
Eaton Vance Management
The Eaton Vance Building
255 State Street
Boston, MA 02109
Principal Underwriter
Eaton Vance Distributors, Inc.
The Eaton Vance Building
255 State Street
Boston, MA 02109
(617) 482-8260
Custodian
Investors Bank & Trust Company
200 Clarendon Street
Boston, MA 02116
Transfer Agent
PFPC Inc.
Attn: Eaton Vance Funds
P.O. Box 9653
Providence, RI 02940-9653
(800) 262-1122
Independent Registered Public Accounting Firm
PricewaterhouseCoopers LLP
125 High Street
Boston, MA 02110
Eaton Vance Low Duration Fund
The Eaton Vance Building
255 State Street
Boston, MA 02109
This report must be preceded or accompanied by a current prospectus. Before investing, investors should consider carefully the Fund's investment objective, risks, and charges and expenses. The Fund's current prospectus contains this and other information about the Fund and is available
through your financial advisor. Please read the prospectus carefully before you invest or send money. For further information please call 1-800-225-6265.
1560-12/05 LDSRC

Annual Report October 31, 2005


EATON VANCE
STRATEGIC
INCOME
FUND
IMPORTANT NOTICES REGARDING PRIVACY,
DELIVERY OF SHAREHOLDER DOCUMENTS,
PORTFOLIO HOLDINGS AND PROXY VOTING
Privacy. The Eaton Vance organization is committed to ensuring your financial privacy. Each of the financial institutions identified below has in effect the following policy ("Privacy Policy") with respect to nonpublic personal information about its customers:
• Only such information received from you, through application forms or otherwise, and information about your Eaton Vance fund transactions will be collected. This may include information such as name, address, social security number, tax status, account balances and transactions.
• None of such information about you (or former customers) will be disclosed to anyone, except as permitted by law (which includes disclosure to employees necessary to service your account). In the normal course of servicing a customer's account, Eaton Vance may share information with unaffiliated third parties that perform various required services such as transfer agents, custodians and broker/dealers.
• Policies and procedures (including physical, electronic and procedural safeguards) are in place that are designed to protect the confidentiality of such information.
• We reserve the right to change our Privacy Policy at any time upon proper notification to you. Customers may want to review our Policy periodically for changes by accessing the link on our homepage: www.eatonvance.com.
Our pledge of privacy applies to the following entities within the Eaton Vance organization: the Eaton Vance Family of Funds, Eaton Vance Management, Eaton Vance Investment Counsel, Boston Management and Research, and Eaton Vance Distributors, Inc.
In addition, our Privacy Policy only applies to those Eaton Vance customers who are individuals and who have a direct relationship with us. If a customer's account (i.e. fund shares) is held in the name of a third-party financial adviser/ broker-dealer, it is likely that only such adviser's privacy policies apply to the customer. This notice supersedes all previously issued privacy disclosures.
For more information about Eaton Vance's Privacy Policy, please call 1-800-262-1122.
Delivery of Shareholder Documents. The Securities and Exchange Commission (the "SEC") permits funds to deliver only one copy of shareholder documents, including prospectuses, proxy statements and shareholder reports, to fund investors with multiple accounts at the same residential or post office box address. This practice is often called "householding" and it helps eliminate duplicate mailings to shareholders.
Eaton Vance, or your financial adviser, may household the mailing of your documents indefinitely unless you instruct Eaton Vance, or your financial adviser, otherwise.
If you would prefer that your Eaton Vance documents not be householded, please contact Eaton Vance at 1-800-262-1122, or contact your financial adviser.
Your instructions that householding not apply to delivery of your Eaton Vance documents will be effective within 30 days of receipt by Eaton Vance or your financial adviser.
Portfolio Holdings. Each Eaton Vance Fund and its underlying Portfolio (if applicable) will file a schedule of its portfolio holdings on Form N-Q with the SEC for the first and third quarters of each fiscal year. The Form N-Q will be available on the Eaton Vance website www.eatonvance.com, by calling Eaton Vance at 1-800-262-1122 or in the EDGAR database on the SEC's website at www.sec.gov. Form N-Q may also be reviewed and copied at the SEC's public reference room in Washington, D.C. (call 1-800-732-0330 for information on the operation of the public reference room).
Proxy Voting. From time to time, funds are required to vote proxies related to the securities held by the funds. The Eaton Vance Funds or their underlying Portfolios (if applicable) vote proxies according to a set of policies and procedures approved by the Funds' and Portfolios' Boards. You may obtain a description of these policies and procedures and information on how the Funds or Portfolios voted proxies relating to Portfolio securities during the most recent 12 month period ended June 30, without charge, upon request, by calling 1-800-262-1122. This description is also available on the SEC's website at www.sec.gov.
Eaton Vance Strategic Income Fund as of October 31, 2005
MANAGEMENT’S DISCUSSION OF PERFORMANCE

Mark S. Venezia
Portfolio Manager
The Fund
Performance for the Past Year
• The Fund’s Class A shares had a total return of 5.85% during the year ended October 31, 2005.(1) This return resulted from a decrease in net asset value (NAV) per share to $7.90 on October 31, 2005 from $8.03 on October 31, 2004, and the reinvestment of $0.590 in dividend payments during the year.
• The Fund’s Class B shares had a total return of 5.12% during the year ended October 31, 2005.(1) This return resulted from a decrease in NAV to $7.48 on October 31, 2005 from $7.60 on October 31, 2004, and the reinvestment of $0.502 in dividend payments during the year.
• The Fund’s Class C shares had a total return of 5.21% during the year ended October 31, 2005.(1) This return resulted from a decrease in NAV to $7.48 on October 31, 2005 from $7.61 on October 31, 2004, and the reinvestment of $0.516 in dividend payments during the year. The Class C NAVs and dividends have been restated to reflect the effects of a stock split effective on November 11, 2005.
• In comparison, the Lehman Brothers Aggregate Bond Index had a return of 1.13% for the year ended October 31, 2005(2) and the Fund’s peer group, the Lipper Multi-Sector Income Funds Classification, had an average return of 3.48%.(2)
Recent Fund Developments
• Since 1997, the Fund has invested in two registered investment companies (Portfolios) that invest in fixed-income securities. Beginning in March 2004, the Fund added additional Portfolios to its investment options, including Portfolios that invest in senior floating-rate loans, high-yield bonds and investment-grade bonds. At October 31, 2005, the Fund allocated its assets among Strategic Income, High Income and Floating Rate Portfolios.
• The Fund conservatively positioned its securities portfolio during the fiscal year ended October 31, 2005, with its low duration, small position in high-yield bonds and large position in seasoned mortgage-backed securities (MBS).
• The Fund benefited from the continued economic convergence in Europe, where Strategic Income Portfolio maintained forward currency positions. Strategic Income Portfolio had long positions in the Slovak koruna and the Polish zloty, which provided an attractive yield advantage over the euro. These positions were cross-hedged with short positions in the euro, which protected the Fund from the euro’s decline against the dollar during the year. Strategic Income Portfolio also largely offset its position in Asia with a short position in the Japanese yen, which shielded the Fund from the year-long weakness in Asia versus the dollar. The Fund also benefited from its holdings in Latin America, where monetary tightening did not have the negative impact many investors had anticipated.
• The Fund’s MBS positions were a significant contributor to performance. MBS yield spreads narrowed by roughly 80 basis points (0.80%) during the fiscal year, as prepayment rates for seasoned MBS declined to near 25% by October 31, 2005. Management increased the Fund’s investments in MBS (through its investment in Strategic Income Portfolio) to 65.6% of net assets at October 31, 2005 from 53.6% at October 31, 2004.(3) Management reduced the Fund’s exposure to below-investment grade bonds (including swaps and excluding foreign bonds) from 22.3% of net assets at October 31, 2004 to 10.5% at October 31, 2005. This lower exposure paid off, as the Fund outperformed the high-yield market.
• Another positive influence on performance was the Fund’s increased investment in Floating Rate Portfolio, which invests primarily in senior floating-rate loans. The Federal Reserve continued to increase its Federal funds rate during the year, pushing short-term interest rates higher. At October 31, 2005, the Fund’s investment in Floating Rate Portfolio was 19.6% of the Fund’s net assets, up from 13.6% a year earlier.(3)
• The Fund’s conservative posture was reflected in a shorter average duration, 1.41 years at October 31, 2005, down from 2.40 years a year earlier. Duration is a measure that indicates the sensitivity of a fund or a fixed-income security to changes in interest rates.
• The Fund’s diversification, combined with its low duration and modest exposure to credit risk, resulted in very low volatility.
The views expressed throughout this report are those of the portfolio manager and are current only through the end of the period of the report as stated on the cover. These views are subject to change at any time based upon market or other conditions, and the investment adviser disclaims any responsibility to update such views. These views may not be relied on as investment advice and, because investment decisions for a fund are based on many factors, may not be relied on as an indication of trading intent on behalf of any Eaton Vance fund.
(1) These returns do not include the 4.75% maximum sales charge for the Fund’s Class A shares or the applicable contingent deferred sales charges (CDSC) for Class B shares and Class C shares. If sales charges were reflected, performance would have been lower.
(2) It is not possible to invest directly in an Index or Lipper Classification. The Index’s total return does not reflect the expenses that would have been incurred if an investor individually purchased or sold the securities represented in the Index.
(3) Fund allocations are subject to change due to active management.
Past performance is no guarantee of future results. Returns are historical and are calculated by determining the percentage change in net asset value or offering price (as applicable) with all distributions reinvested. Investment return and principal value will fluctuate so that shares, when redeemed, may be worth more or less than their original cost. Performance is for the stated time period only; due to market volatility, the Fund’s current performance may be lower or higher than the quoted return. For performance as of the most recent month-end, please refer to www.eatonvance.com.
2
Eaton Vance Strategic Income Fund as of October 31, 2005
FUND PERFORMANCE
The line graph and table set forth below provide information about the Fund’s performance. The line graph compares the performance of Class B of the Fund with that of the Lehman Brothers Aggregate Bond Index, an unmanaged, broad-based index containing only investment-grade, fixed-income securities traded in the U.S. The lines on the graph represent the total returns of a hypothetical investment of $10,000 in Class B of the Fund and in the Lehman Brothers Aggregate Bond Index. The graph also offers a comparison to a Composite of two Lipper Fund Classification averages, reflecting the average total returns of the funds in the same classifications as this Fund. The fund classifications are established by Lipper Inc., a nationally recognized monitor of mutual fund performance. Funds within a classification have similar investment policies. The Composite is provided because the Fund amended its investment policies on March 1, 1997, allowing the Fund to invest in a portfolio with a dollar-weighted average maturity of any duration. In connection with this change, the Fund’s Lipper Classification also changed. Reflecting that change, the performance of the Composite is based on the Lipper Short World Multi-Market Income Funds Classification from October 31, 1995 through March 1, 1997, and thereafter, on the Lipper Multi-Sector Income Funds Classification. The table includes the total returns of each Class of the Fund at net asset value and public offering price. The performance presented below does not reflect the deduction of taxes, if any, that a shareholder would pay on Fund distributions or the redemption of Fund shares.
Performance(1) | | Class A | | Class B | | Class C | |
| | | | | | | |
Average Annual Total Returns (at net asset value) | | | | | | | |
One Year | | 5.85 | % | 5.12 | % | 5.21 | % |
Five Years | | 7.51 | | 6.70 | | 6.74 | |
Ten Years | | N.A. | | 6.85 | | 6.52 | |
Life of Fund† | | 5.81 | | 6.05 | | 6.94 | |
| | | | | | | |
SEC Average Annual Total Returns (including sales charge or applicable CDSC) | | | | | | | |
One Year | | 0.84 | % | 0.20 | % | 4.23 | % |
Five Years | | 6.46 | | 6.41 | | 6.74 | |
Ten Years | | N.A. | | 6.85 | | 6.52 | |
Life of Fund† | | 5.14 | | 6.05 | | 6.94 | |
† Inception Dates – Class A: 1/23/98; Class B: 11/26/90; Class C: 5/25/94
(1) Average Annual Total Returns do not include the 4.75% maximum sales charge for Class A shares or the applicable contingent deferred sales charges (CDSC) for Class B or Class C shares. If sales charges were deducted, returns would be lower. SEC returns for Class A reflect the maximum 4.75% sales charge. SEC Average Annual Total Returns for Class B reflect applicable CDSC based on the following schedule: 5% - 1st and 2nd years; 4% - 3rd year; 3% - 4th year; 2% - 5th year; 1% - 6th year. SEC 1-Year return for Class C reflects 1% CDSC.
Sector Breakdown(2)
By total investments
(2) The Fund Sector Breakdown reflects the Fund’s investments in Strategic Income Portfolio, High Income Portfolio and Floating Rate Portfolio as of 10/31/05. Indicated positions equal 134% of net assets as of 10/31/05. In addition to Sector net assets, the Global position includes the notional value of long forward currency contracts, long equity derivatives, and short credit default swap positions; and the U.S. Corporate Obligations position includes the notional value of long high-yield total return swap positions. All of the aforementioned derivatives are added to the net assets of the Fund to get the gross assets of the Fund. Then each sector is divided by the amount of gross assets to calculate its percentage allocation in the Fund Sector Breakdown. Fund Statistics may not be representative of the Fund’s current or future investments and are subject to change due to active management.
Past performance is no guarantee of future results. Returns are historical and are calculated by determining the percentage change in net asset value or offering price (as applicable) with all distributions reinvested. Investment return and principal value will fluctuate so that shares, when redeemed, may be worth more or less than their original cost. Performance is for the stated time period only; due to market volatility, the Fund’s current performance may be lower or higher than the quoted return. For performance as of the most recent month-end, please refer to www.eatonvance.com.
Comparison of Change in Value of a $10,000 Investment in Eaton Vance Strategic Income Fund, Class B vs. the Lehman Brothers Aggregate Bond Index & the Composite of Lipper Fund Averages*.
October 31, 1995 – October 31, 2005
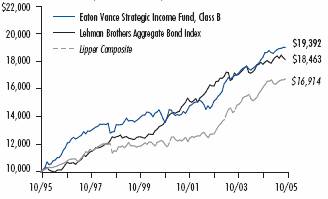
* Sources: Thomson Financial; Bloomberg, L.P. Class B of the Fund commenced operations on 11/26/90.
A $10,000 hypothetical investment at net asset value in Class A shares on 1/23/98 and Class C shares on 10/31/95 would have been valued at $15,504 ($14,766 at maximum offering price after investment at net asset value) and $18,808, respectively, on 10/31/05. It is not possible to invest directly in an Index or Lipper Classification. The Index’s total return does not reflect the expenses that would have been incurred if an investor individually purchased or sold the securities represented in the Index.
Foreign Positions
By total net assets. Positions are in Local Currency unless otherwise noted. Positions in Europe other than Turkey are cross-hedged with short euro.
Slovakia | | 6.9 | % |
Indonesia** | | 5.1 | |
Thailand | | 3.2 | |
Korea | | 2.9 | |
Romania | | 2.8 | |
Iceland | | 2.5 | |
Turkey | | 2.0 | |
Singapore | | 1.9 | |
New Zealand | | 1.7 | |
Colombia | | 1.1 | |
Poland | | 1.0 | |
Brazil | | 1.0 | |
Taiwan** | | 1.0 | |
Germany | | 0.9 | |
Vietnam* | | 0.2 | |
Phillipines* | | 0.2 | |
Greece | | -0.3 | |
Euro | | -0.8 | |
Japan*** | | -10.4 | |
*Position is in Hard Currency.
**Position is in Local Currency and Hard Currency.
***Position is net holdings in Currency and Forwards.
3
Eaton Vance Strategic Income Fund as of October 31, 2005
FUND EXPENSES
Example: As a shareholder of the Fund, you incur two types of costs: (1) transaction costs, including sales charges (loads) on purchases and redemption fees (if applicable); and (2) ongoing costs, including management fees; distribution or service fees; and other Fund expenses. This Example is intended to help you understand your ongoing costs (in dollars) of investing in the Fund and to compare these costs with the ongoing costs of investing in other mutual funds. The Example is based on an investment of $1,000 invested at the beginning of the period and held for the entire period (May 1, 2005 – October 31, 2005).
Actual Expenses: The first section of the table below provides information about actual account values and actual expenses. You may use the information in this section, together with the amount you invested, to estimate the expenses that you paid over the period. Simply divide your account value by $1,000 (for example, an $8,600 account value divided by $1,000 = 8.6), then multiply the result by the number in the first section under the heading entitled “Expenses Paid During Period” to estimate the expenses you paid on your account during this period.
Hypothetical Example for Comparison Purposes: The second section of the table below provides information about hypothetical account values and hypothetical expenses based on the Fund’s actual expense ratios and an assumed rate of return of 5% per year before expenses, which is not the actual return of the Fund. The hypothetical account values and expenses may not be used to estimate the actual ending account balance or expenses you paid for the period. You may use this information to compare the ongoing costs of investing in the Fund and other funds. To do so, compare this 5% hypothetical example with the 5% hypothetical examples that appear in the shareholder reports of the other funds.
Please note that the expenses shown in the table are meant to highlight your ongoing costs only and do not reflect any transactional costs, such as sales charges (loads) or redemption fees (if applicable). Therefore, the second section of the table is useful in comparing ongoing costs only, and will not help you determine the relative total costs of owning different funds. In addition, if these transactional costs were included, your costs would have been higher.
Eaton Vance Strategic Income Fund
| | Beginning Account Value | | Ending Account Value | | Expenses Paid During Period* | |
| | (5/1/05) | | (10/31/05) | | (5/1/05 – 10/31/05) | |
| | | | | | | |
Actual | | | | | | | |
Class A | | $ | 1,000.00 | | $ | 1,027.50 | | $ | 5.16 | |
Class B | | $ | 1,000.00 | | $ | 1,024.50 | | $ | 8.98 | |
Class C | | $ | 1,000.00 | | $ | 1,023.30 | | $ | 8.98 | |
| | | | | | | | | | |
Hypothetical | | | | | | | |
(5% return before expenses) | | | | | | | |
Class A | | $ | 1,000.00 | | $ | 1,020.10 | | $ | 5.14 | |
Class B | | $ | 1,000.00 | | $ | 1,016.30 | | $ | 8.94 | |
Class C | | $ | 1,000.00 | | $ | 1,016.30 | | $ | 8.94 | |
* Expenses are equal to the Fund’s annualized expense ratio of 1.01% for Class A shares, 1.76% for Class B shares and 1.76% for Class C shares, multiplied by the average account value over the period, multiplied by 184/365 (to reflect the one-half-year period). The example assumes that the $1,000 was invested at the net asset value per share determined at the close of business on April 30, 2005. The Example reflects the expenses of both the Fund and the Portfolios.
4
Eaton Vance Strategic Income Fund as of October 31, 2005
FINANCIAL STATEMENTS
Statement of Assets and Liabilities
As of October 31, 2005
| Assets | |
Investment in Strategic Income Portfolio, at value
(identified cost, $419,790,625) | | $ | 410,679,688 | | |
Investment in High Income Portfolio, at value
(identified cost, $59,600,250) | | | 61,100,669 | | |
Investment in Floating Rate Portfolio, at value
(identified cost, $114,093,934) | | | 114,346,647 | | |
| Receivable for Fund shares sold | | | 1,878,636 | | |
| Total assets | | $ | 588,005,640 | | |
| Liabilities | |
| Dividends payable | | $ | 1,709,179 | | |
| Payable for Fund shares redeemed | | | 1,516,821 | | |
| Payable to affiliate for distribution and service fees | | | 342,268 | | |
| Payable to affiliate for Trustees' fees | | | 311 | | |
| Accrued expenses | | | 156,852 | | |
| Total liabilities | | $ | 3,725,431 | | |
| Net Assets | | $ | 584,280,209 | | |
| Sources of Net Assets | |
| Paid-in capital | | $ | 628,078,405 | | |
Accumulated net realized loss from Portfolios
(computed on the basis of identified cost) | | | (37,886,382 | ) | |
| Undistributed net investment income | | | 1,445,991 | | |
Net unrealized depreciation from Portfolios
(computed on the basis of identified cost) | | | (7,357,805 | ) | |
| Total | | $ | 584,280,209 | | |
| Class A Shares | |
| Net Assets | | $ | 238,972,893 | | |
| Shares Outstanding | | | 30,243,457 | | |
Net Asset Value and Redemption Price Per Share
(net assets ÷ shares of beneficial interest outstanding) | | $ | 7.90 | | |
Maximum Offering Price Per Share
(100 ÷ 95.25 of $7.90) | | $ | 8.29 | | |
| Class B Shares | |
| Net Assets | | $ | 196,765,877 | | |
| Shares Outstanding | | | 26,314,725 | | |
Net Asset Value, Offering Price and Redemption Price Per Share (Note 6)
(net assets ÷ shares of beneficial interest outstanding) | | $ | 7.48 | | |
| Class C Shares | |
| Net Assets | | $ | 148,541,439 | | |
| Shares Outstanding | | | 19,854,456 | (1) | |
Net Asset Value, Offering Price and Redemption Price Per Share (Note 6)
(net assets ÷ shares of beneficial interest outstanding) | | $ | 7.48 | | |
| On sales of $25,000 or more, the offering price of Class A shares is reduced. | | | | | |
(1) Shares outstanding have been restated to reflect the effects of a stock split effective on November 11, 2005 (Note 9).
Statement of Operations
For the Year Ended
October 31, 2005
| Investment Income | |
| Interest allocated from Portfolios (net of foreign taxes, $72,160) | | $ | 24,748,441 | | |
| Dividends allocated from Portfolios | | | 237,062 | | |
| Expenses allocated from Portfolios | | | (3,343,134 | ) | |
| Net investment income from Portfolios | | $ | 21,642,369 | | |
| Expenses | |
| Trustees' fees and expenses | | $ | 3,263 | | |
| Distribution and service fees | | | | | |
| Class A | | | 516,157 | | |
| Class B | | | 1,965,705 | | |
| Class C | | | 1,290,749 | | |
| Transfer and dividend disbursing agent fees | | | 458,805 | | |
| Registration fees | | | 97,892 | | |
| Printing and postage | | | 79,634 | | |
| Legal and accounting services | | | 66,231 | | |
| Custodian fee | | | 40,277 | | |
| Miscellaneous | | | 17,587 | | |
| Total expenses | | $ | 4,536,300 | | |
| Net investment income | | $ | 17,106,069 | | |
| Realized and Unrealized Gain (Loss) from Portfolios | |
Net realized gain (loss) —
Investment transactions (identified cost basis) | | $ | 658,451 | | |
| Financial futures contracts | | | (263,392 | ) | |
| Swap contracts | | | 4,210,295 | | |
Foreign currency and forward foreign currency exchange
contract transactions | | | 12,940,644 | | |
| Net realized gain | | $ | 17,545,998 | | |
Change in unrealized appreciation (depreciation) —
Investments (identified cost basis) | | $ | (4,650,873 | ) | |
| Financial futures contracts | | | 592,831 | | |
| Swap contracts | | | (2,335,680 | ) | |
| Foreign currency and forward foreign currency exchange contracts | | | (1,619,315 | ) | |
| Net change in unrealized appreciation (depreciation) | | $ | (8,013,037 | ) | |
| Net realized and unrealized gain | | $ | 9,532,961 | | |
| Net increase in net assets from operations | | $ | 26,639,030 | | |
See notes to financial statements
5
Eaton Vance Strategic Income Fund as of October 31, 2005
FINANCIAL STATEMENTS CONT'D
Statements of Changes in Net Assets
Increase (Decrease)
in Net Assets | | Year Ended
October 31, 2005 | | Year Ended
October 31, 2004 | |
From operations —
Net investment income | | $ | 17,106,069 | | | $ | 12,664,174 | | |
Net realized gain from investments, financial
futures contracts, swap contracts and
foreign currency and foreign currency
exchange contract transactions | | | 17,545,998 | | | | 13,471,073 | | |
Net change in unrealized appreciation
(depreciation) from investments,
financial futures contracts, swap
contracts, and foreign currency and
foreign currency exchange contracts | | | (8,013,037 | ) | | | (214,745 | ) | |
| Net increase in net assets from operations | | $ | 26,639,030 | | | $ | 25,920,502 | | |
Distributions to shareholders —
From net investment income
Class A | | $ | (15,134,992 | ) | | $ | (8,741,465 | ) | |
| Class B | | | (12,983,253 | ) | | | (14,413,024 | ) | |
| Class C | | | (8,531,282 | ) | | | (6,339,755 | ) | |
| Total distributions to shareholders | | $ | (36,649,527 | ) | | $ | (29,494,244 | ) | |
Transactions in shares of beneficial interest —
Proceeds from sale of shares
Class A | | $ | 142,688,114 | | | $ | 90,770,693 | | |
| Class B | | | 47,794,361 | | | | 58,964,653 | | |
| Class C | | | 67,794,237 | | | | 45,837,605 | | |
Net asset value of shares issued to shareholders
in payment of distributions declared
Class A | | | 8,356,311 | | | | 4,726,882 | | |
| Class B | | | 5,084,301 | | | | 5,416,182 | | |
| Class C | | | 4,022,854 | | | | 3,087,539 | | |
Cost of shares redeemed
Class A | | | (74,405,319 | ) | | | (30,475,986 | ) | |
| Class B | | | (40,134,237 | ) | | | (38,918,733 | ) | |
| Class C | | | (24,052,318 | ) | | | (18,888,221 | ) | |
Net asset value of shares exchanged
Class A | | | 4,464,177 | | | | 49,615,502 | | |
| Class B | | | (4,464,177 | ) | | | (49,615,502 | ) | |
Net increase in net assets from Fund share
transactions | | $ | 137,148,304 | | | $ | 120,520,614 | | |
| Net increase in net assets | | $ | 127,137,807 | | | $ | 116,946,872 | | |
| Net Assets | |
| At beginning of year | | $ | 457,142,402 | | | $ | 340,195,530 | | |
| At end of year | | $ | 584,280,209 | | | $ | 457,142,402 | | |
| Undistributed net investment income | |
| At end of year | | $ | 1,445,991 | | | $ | 678,672 | | |
See notes to financial statements
6
Eaton Vance Strategic Income Fund as of October 31, 2005
FINANCIAL STATEMENTS CONT'D
Financial Highlights
| | | Class A | |
| | | Year Ended October 31, | |
| | | 2005(1) | | 2004(1) | | 2003(1) | | 2002(1)(2) | | 2001(1) | |
| Net asset value — Beginning of year | | $ | 8.030 | | | $ | 8.100 | | | $ | 7.550 | | | $ | 8.030 | | | $ | 8.360 | | |
| Income (loss) from operations | |
| Net investment income | | $ | 0.294 | | | $ | 0.286 | | | $ | 0.336 | | | $ | 0.504 | | | $ | 0.705 | | |
| Net realized and unrealized gain (loss) | | | 0.166 | | | | 0.273 | | | | 0.883 | | | | (0.286 | ) | | | (0.250 | ) | |
| Total income from operations | | $ | 0.460 | | | $ | 0.559 | | | $ | 1.219 | | | $ | 0.218 | | | $ | 0.455 | | |
| Less distributions | |
| From net investment income | | $ | (0.590 | ) | | $ | (0.629 | ) | | $ | (0.669 | ) | | $ | (0.670 | ) | | $ | (0.723 | ) | |
| From paid-in capital | | | — | | | | — | | | | — | | | | (0.028 | ) | | | (0.062 | ) | |
| Total distributions | | $ | (0.590 | ) | | $ | (0.629 | ) | | $ | (0.669 | ) | | $ | (0.698 | ) | | $ | (0.785 | ) | |
| Net asset value — End of year | | $ | 7.900 | | | $ | 8.030 | | | $ | 8.100 | | | $ | 7.550 | | | $ | 8.030 | | |
| Total Return(3) | | | 5.85 | % | | | 7.18 | % | | | 16.65 | % | | | 2.68 | % | | | 5.69 | % | |
| Ratios/Supplemental Data | |
| Net assets, end of year (000's omitted) | | $ | 238,973 | | | $ | 162,022 | | | $ | 48,738 | | | $ | 17,418 | | | $ | 12,352 | | |
| Ratios (As a percentage of average daily net assets): | |
| Expenses(4) | | | 1.02 | % | | | 1.06 | % | | | 1.11 | % | | | 1.17 | % | | | 1.21 | % | |
| Expenses after custodian fee reduction(4) | | | 1.02 | % | | | 1.06 | % | | | 1.11 | % | | | 1.17 | % | | | 1.21 | % | |
| Net investment income | | | 3.66 | % | | | 3.57 | % | | | 4.19 | % | | | 6.39 | % | | | 8.63 | % | |
| Portfolio Turnover of the Strategic Income Portfolio | | | 59 | % | | | 55 | % | | | 71 | % | | | 63 | % | | | 54 | % | |
| Portfolio Turnover of the High Income Portfolio | | | 62 | % | | | 80 | % | | | 122 | % | | | 88 | % | | | — | | |
| Portfolio Turnover of the Floating Rate Portfolio | | | 57 | % | | | 67 | % | | | — | | | | — | | | | — | | |
(1) Net investment income per share was computed using average shares outstanding.
(2) The Fund, through its investment in the Portfolios, adopted the provisions of the revised AICPA Audit and Accounting Guide for Investment Companies and began amortizing market premiums on fixed-income securities, excluding mortgage-backed securities, and accreting certain discounts using a different methodology. Additionally, the Portfolios reclassified net losses realized on prepayments received on mortgage-backed securities that were previously included in realized gains/losses to interest income. The effect of these changes for the year ended October 31, 2002 was to decrease net investment income per share by $0.095, decrease net realized and unrealized loss per share by $0.095 and decrease the ratio of net investment income to average net assets from 7.58% to 6.39%. Per share data and ratios for the periods prior to November 1, 2001 have not been restated to reflect this change in presentation.
(3) Returns are historical and are calculated by determining the percentage change in net asset value with all distributions reinvested.
(4) Includes the Fund's share of the Portfolios' allocated expenses.
See notes to financial statements
7
Eaton Vance Strategic Income Fund as of October 31, 2005
FINANCIAL STATEMENTS CONT'D
Financial Highlights
| | | Class B | |
| | | Year Ended October 31, | |
| | | 2005(1) | | 2004(1) | | 2003(1) | | 2002(1)(2) | | 2001(1) | |
| Net asset value — Beginning of year | | $ | 7.600 | | | $ | 7.660 | | | $ | 7.150 | | | $ | 7.600 | | | $ | 7.910 | | |
| Income (loss) from operations | |
| Net investment income | | $ | 0.223 | | | $ | 0.224 | | | $ | 0.269 | | | $ | 0.425 | | | $ | 0.607 | | |
| Net realized and unrealized gain (loss) | | | 0.159 | | | | 0.254 | | | | 0.817 | | | | (0.272 | ) | | | (0.241 | ) | |
| Total income from operations | | $ | 0.382 | | | $ | 0.478 | | | $ | 1.086 | | | $ | 0.153 | | | $ | 0.366 | | |
| Less distributions | |
| From net investment income | | $ | (0.502 | ) | | $ | (0.538 | ) | | $ | (0.576 | ) | | $ | (0.575 | ) | | $ | (0.614 | ) | |
| From paid-in capital | | | — | | | | — | | | | — | | | | (0.028 | ) | | | (0.062 | ) | |
| Total distributions | | $ | (0.502 | ) | | $ | (0.538 | ) | | $ | (0.576 | ) | | $ | (0.603 | ) | | $ | (0.676 | ) | |
| Net asset value — End of year | | $ | 7.480 | | | $ | 7.600 | | | $ | 7.660 | | | $ | 7.150 | | | $ | 7.600 | | |
| Total Return(3) | | | 5.12 | % | | | 6.47 | % | | | 15.61 | % | | | 1.96 | % | | | 4.82 | % | |
| Ratios/Supplemental Data | |
| Net assets, end of year (000's omitted) | | $ | 196,766 | | | $ | 191,765 | | | $ | 217,341 | | | $ | 173,780 | | | $ | 163,261 | | |
| Ratios (As a percentage of average daily net assets): | |
| Expenses(4) | | | 1.77 | % | | | 1.81 | % | | | 1.86 | % | | | 1.93 | % | | | 1.96 | % | |
| Expenses after custodian fee reduction(4) | | | 1.77 | % | | | 1.81 | % | | | 1.86 | % | | | 1.93 | % | | | 1.96 | % | |
| Net investment income | | | 2.94 | % | | | 2.95 | % | | | 3.57 | % | | | 5.68 | % | | | 7.83 | % | |
| Portfolio Turnover of the Strategic Income Portfolio | | | 59 | % | | | 55 | % | | | 71 | % | | | 63 | % | | | 54 | % | |
| Portfolio Turnover of the High Income Portfolio | | | 62 | % | | | 80 | % | | | 122 | % | | | 88 | % | | | — | | |
| Portfolio Turnover of the Floating Rate Portfolio | | | 57 | % | | | 67 | % | | | — | | | | — | | | | — | | |
(1) Net investment income per share was computed using average shares outstanding.
(2) The Fund, through its investment in the Portfolios, adopted the provisions of the revised AICPA Audit and Accounting Guide for Investment Companies and began amortizing market premiums on fixed-income securities, excluding mortgage-backed securities, and accreting certain discounts using a different methodology. Additionally, the Portfolios reclassified net losses realized on prepayments received on mortgage-backed securities that were previously included in realized gains/losses to interest income. The effect of these changes for the year ended October 31, 2002 was to decrease net investment income per share by $0.090, decrease net realized and unrealized loss per share by $0.090 and decrease the ratio of net investment income to average net assets from 6.86% to 5.68%. Per share data and ratios for the periods prior to November 1, 2001 have not been restated to reflect this change in presentation.
(3) Returns are historical and are calculated by determining the percentage change in net asset value with all distributions reinvested.
(4) Includes the Fund's share of the Portfolios' allocated expenses.
See notes to financial statements
8
Eaton Vance Strategic Income Fund as of October 31, 2005
FINANCIAL STATEMENTS CONT'D
Financial Highlights
| | | Class C | |
| | | Year Ended October 31, | |
| | | 2005(1)(2) | | 2004(1)(2) | | 2003(1)(2) | | 2002(1)(2)(3) | | 2001(1)(2) | |
| Net asset value — Beginning of year | | $ | 7.610 | | | $ | 7.670 | | | $ | 7.160 | | | $ | 7.610 | | | $ | 7.910 | | |
| Income (loss) from operations | |
| Net investment income | | $ | 0.222 | | | $ | 0.219 | | | $ | 0.267 | | | $ | 0.426 | | | $ | 0.612 | | |
| Net realized and unrealized gain (loss) | | | 0.150 | | | | 0.260 | | | | 0.819 | | | | (0.273 | ) | | | (0.240 | ) | |
| Total income from operations | | $ | 0.372 | | | $ | 0.479 | | | $ | 1.086 | | | $ | 0.153 | | | $ | 0.372 | | |
| Less distributions | |
| From net investment income | | $ | (0.502 | ) | | $ | (0.539 | ) | | $ | (0.576 | ) | | $ | (0.581 | ) | | $ | (0.623 | ) | |
| From paid-in capital | | | — | | | | — | | | | — | | | | (0.022 | ) | | | (0.049 | ) | |
| Total distributions | | $ | (0.502 | ) | | $ | (0.539 | ) | | $ | (0.576 | ) | | $ | (0.603 | ) | | $ | (0.672 | ) | |
| Net asset value — End of year | | $ | 7.480 | | | $ | 7.610 | | | $ | 7.670 | | | $ | 7.160 | | | $ | 7.610 | | |
| Total Return(4) | | | 5.21 | %(5) | | | 6.45 | % | | | 15.68 | % | | | 1.95 | % | | | 4.90 | % | |
| Ratios/Supplemental Data | |
| Net assets, end of year (000's omitted) | | $ | 148,541 | | | $ | 103,355 | | | $ | 74,117 | | | $ | 45,414 | | | $ | 44,603 | | |
| Ratios (As a percentage of average daily net assets): | |
| Expenses(6) | | | 1.77 | % | | | 1.81 | % | | | 1.86 | % | | | 1.93 | % | | | 1.96 | % | |
| Expenses after custodian fee reduction(6) | | | 1.77 | % | | | 1.81 | % | | | 1.86 | % | | | 1.93 | % | | | 1.96 | % | |
| Net investment income | | | 2.91 | % | | | 2.89 | % | | | 3.53 | % | | | 5.69 | % | | | 7.89 | % | |
| Portfolio Turnover of the Strategic Income Portfolio | | | 59 | % | | | 55 | % | | | 71 | % | | | 63 | % | | | 54 | % | |
| Portfolio Turnover of the High Income Portfolio | | | 62 | % | | | 80 | % | | | 122 | % | | | 88 | % | | | — | | |
| Portfolio Turnover of the Floating Rate Portfolio | | | 57 | % | | | 67 | % | | | — | | | | — | | | | — | | |
(1) Net investment income per share was computed using average shares outstanding.
(2) Per share data have been restated to reflect the effects of a 1.2632979-for-1 stock split effective on November 11, 2005.
(3) The Fund, through its investment in the Portfolios, adopted the provisions of the revised AICPA Audit and Accounting Guide for Investment Companies and began amortizing market premiums on fixed-income securities, excluding mortgage-backed securities, and accreting certain discounts using a different methodology. Additionally, the Portfolios reclassified net losses realized on prepayments received on mortgage-backed securities that were previously included in realized gains/losses to interest income. The effect of these changes for the year ended October 31, 2002 was to decrease net investment income per share by $0.089, decrease net realized and unrealized loss per share by $0.089 and decrease the ratio of net investment income to average net assets from 6.88% to 5.69%. Per share data and ratios for the periods prior to November 1, 2001 have not been restated to reflect this change in presentation.
(4) Returns are historical and are calculated by determining the percentage change in net asset value with all distributions reinvested.
(5) Total return reflects an increase of 0.17% due to a change in the timing of the payment and reinvestment of distributions.
(6) Includes the Fund's share of the Portfolios' allocated expenses.
See notes to financial statements
9
Eaton Vance Strategic Income Fund as of October 31, 2005
NOTES TO FINANCIAL STATEMENTS
1 Significant Accounting Policies
Eaton Vance Strategic Income Fund (the Fund) is a series of Eaton Vance Mutual Funds Trust (the Trust). The Trust is registered under the Investment Company Act of 1940, as amended, as an open-end management investment company. The Fund offers three classes of shares. Class A shares are generally sold subject to a sales charge imposed at the time of purchase. Class B and Class C shares are sold at net asset value and are generally subject to a contingent deferred sales charge (see Note 6). The Trustees have adopted a conversion feature pursuant to which Class B shares of the Fund automatically convert to Class A shares eight years after their purchase as described in the Fund's prospectus. Each class represents a pro rata interest in the Fund, but votes separately on class-specific matters and (as noted below) is subject to different expenses. Realized and unrealized gains and losses are allocated daily to each class of shares b ased on the relative net assets of each class to the total net assets of the Fund. Net investment income, other than class specific expenses, is allocated daily to each class of shares based upon the ratio of the value of each class' paid shares to the total value of all paid shares. Each class of shares differs in its distribution plan and certain other class specific expenses. The Fund is structured as a fund-of-funds and as of October 31, 2005, invested all of its investable assets in interests in three Portfolios: Strategic Income Portfolio, High Income Portfolio, and Floating Rate Portfolio (the Portfolios), which are New York Trusts. The value of the Fund's investment in the Portfolios reflects the Fund's proportionate interest in the net assets of the Strategic Income Portfolio, High Income Portfolio, and Floating Rate Portfolio (99.9%, 5.5%, and 1.8%, respectively, at October 31, 2005). The performance of the Fund is directly affected by the performance of the Portfolios. The financial statements of the Strategic Income Portfolio, including the portfolio of investments, are included elsewhere in this report and should be read in conjunction with the Fund's financial statements. See Note 8 for further information on the results of operations of High Income Portfolio and Floating Rate Portfolio. A copy of the financial statements of High Income Portfolio and Floating Rate Portfolio are available on the EDGAR Database on the Securities and Exchange Commission's website (www.sec.gov), at the Commission's public reference room in Washington, DC or upon request from the Fund's principal underwriter, Eaton Vance Distributors Inc. (EVD) by calling 1-800-225-6265.
The following is a summary of significant accounting policies consistently followed by the Fund in the preparation of its financial statements. The policies are in conformity with accounting principles generally accepted in the United States of America.
A Investment Valuation — Valuation of securities by the Strategic Income Portfolio is discussed in Note 1A of the Portfolio's Notes to Financial Statements, which are included elsewhere in this report. High Income Portfolio's valuation policies are as follows: Fixed income investments (other than short-term obligations), including listed investments and investments for which price quotations are available, will normally be valued on the basis of market valuations furnished by a pricing service. Investments listed on securities exchanges are valued at closing sale prices on the exchange where such securities are principally traded. Investments listed on the NASDAQ National Market System are valued at t he NASDAQ official closing price. Listed or unlisted investments for which closing sale prices are not available are valued at the mean between the latest bid and ask prices. Financial futures contracts listed on commodity exchanges are valued at closing settlement prices. Short-term obligations, maturing in sixty days or less, are valued at amortized cost, which approximates value. Investments for which there are no quotations or valuations are valued at fair value using methods determined in good faith by or at the direction of the Trustees. Floating Rate Portfolio's valuation policies are as follows: Certain Senior Loans are deemed to be liquid because reliable market quotations are readily available for them. Liquid Senior Loans are valued on the basis of prices furnished by a pricing service. Other Senior Loans are valued at fair value by the Portfolio's investment adviser under procedures approved by the Trustees. In connection with determining the fair value of a Senior Loan, the investment adviser ma kes an assessment of the likelihood that the borrower will make a full repayment of the Senior Loan. The primary factors considered by the investment adviser when making this assessment are (i) the creditworthiness of the borrower, (ii) the value of the collateral backing the Senior Loan, and (iii) the priority of the Senior Loan versus other creditors of the borrower. If, based on its assessment, the investment adviser believes there is a reasonable likelihood that the borrower will make a full repayment of the Senior Loan, the investment adviser will determine the fair value of the Senior Loan using a Matrix pricing approach that considers the yield on the Senior Loan relative to yields on other loan interests issued by companies of comparable credit quality. If, based on its assessment, the investment adviser believes there is not a reasonable likelihood that the borrower will make a full repayment of the Senior Loan, the investment adviser will determine the fair value of the Senior Loan using analyses t hat include but are not limited to (i) a comparison of the value of the borrower's outstanding equity and debt
10
Eaton Vance Strategic Income Fund as of October 31, 2005
NOTES TO FINANCIAL STATEMENTS CONT'D
to that of comparable public companies; (ii) a discounted cash flow analysis; or (iii) when the investment adviser believes it is likely that a borrower will be liquidated or sold, an analysis of the terms of such liquidation or sale. In certain cases, the investment adviser will use a combination of analytical methods to determine fair value, such as when only a portion of a borrower's assets are likely to be sold. In conducting its assessment and analyses for purposes of determining fair value of a Senior Loan, the investment adviser will use its discretion and judgment in considering and appraising such factors, data and information and the relative weight to be given thereto as it deems relevant, including without limitation, some or all of the following: (i) the fundamental characteristics of and fundamental analytical data relating to the Senior Loan, including the cost, size, current interest rate, maturity and base lendi ng rate of the Senior Loan, the terms and conditions of the Senior Loan and any related agreements, and the position of the Senior Loan in the Borrower's debt structure; (ii) the nature, adequacy and value of the collateral securing the Senior Loan, including the Portfolio's rights, remedies and interests with respect to the collateral; (iii) the creditworthiness of the Borrower, based on an evaluation of, among other things, its financial condition, financial statements and information about the Borrower's business, cash flows, capital structure and future prospects; (iv) information relating to the market for the Senior Loan including price quotations for and trading in the Senior Loan and interests in similar Senior Loans and the market environment and investor attitudes towards the Senior Loan and interests in similar Senior Loans; (v) the experience, reputation, stability and financial condition of the Agent and any intermediate participants in the Senior Loan; and (vi) general economic and market condi tions affecting the fair value of the Senior Loan.
Other portfolio securities (other than short-term obligations, but including listed issues) may be valued on the basis of prices furnished by one or more pricing services which determine prices for normal, institutional-size trading units of such securities which may use market information, transactions for comparable securities and various relationships between securities which are generally recognized by institutional traders. In certain circumstances, portfolio securities will be valued at the last sale price on the exchange that is the primary market for such securities, or the mean of the closing bid and asked prices for those securities for which the over-the-counter market is the primary market or for listed securities in which there were no sales during the day. The value of interest rate swaps will be based on dealer quotations. Short-term obligations which mature in sixty days or less are valued at amortized cost. If s hort-term debt securities were acquired with a remaining maturity of more than 60 days, their amortized cost value will be based on their value on the sixty-first day prior to maturity. OTC options are valued at the mean between the bid and the asked price provided by dealers. Financial futures contracts and options thereon listed on the commodity exchanges and exchange traded options are valued at closing settlement prices. Repurchase agreements are valued at cost plus accrued interest. Other portfolio securities for which there are no quotations or valuations, and investments for which the price of the security is not believed to represent its fair market value, are valued at fair value as determined in good faith by or at the direction of the Trustees.
B Income — The Fund's net investment income consists of the Fund's pro rata share of the net investment income of the Portfolios, less all actual and accrued expenses of the Fund determined in accordance with accounting principles generally accepted in the United States of America.
C Federal Taxes — The Fund's policy is to comply with the provisions of the Internal Revenue Code applicable to regulated investment companies and to distribute to shareholders each year all of its taxable income, including any net realized gain on investments. Accordingly, no provision for Federal income or excise tax is necessary. At October 31, 2005, the Fund, for Federal income tax purposes, had a capital loss carryover of $37,184,528 which will reduce the Fund's taxable income arising from future net realized gains on investments, if any, to the extent permitted by the Internal Revenue Code, and thus will reduce the amount of the distributions to shareholders which would otherwise be necessary to relieve the Fund of any liability for federal income or excise tax. Such capital loss carryover will expire on October 31, 2006 ($1,611,493), October 31, 2007 ($7,933,008), October 31, 2009 ($9,854,300), October 31, 2010 ($14,208,464), October 31, 2011 ($1,234,272) and October 31, 2012 ($2,342,991). At October 31, 2005, the amount of the tax basis capital loss carryforward differed from the accumulated net realized loss due primarily to the timing of recording gain/loss on certain futures contracts. In the year ended October 31, 2005, capital loss carryover of $372,654 was utilized to offset net realized gains.
D Expense Reduction — Investors Bank & Trust Company (IBT) serves as custodian to the Fund and the Portfolio. Pursuant to the respective custodian agreements, IBT receives a fee reduced by credits which are determined based on the average daily cash balances the Fund or the Portfolio maintains with IBT. All credit balances used to reduce the Fund's custodian fees are reported as a reduction of total expenses in the Statement of Operations.
11
Eaton Vance Strategic Income Fund as of October 31, 2005
NOTES TO FINANCIAL STATEMENTS CONT'D
For the year ended October 31, 2005, no credits were used to reduce the Fund's custodian fee.
E Use of Estimates — The preparation of the financial statements in conformity with accounting principles generally accepted in the United States of America requires management to make estimates and assumptions that affect the reported amounts of assets and liabilities at the date of the financial statements and the reported amounts of income and expense during the reporting period. Actual results could differ from those estimates.
F Expenses — The majority of expenses of the Trust are directly identifiable to an individual fund. Expenses which are not readily identifiable to a specific fund are allocated taking into consideration, among other things, the nature and type of expense and the relative size of the fund.
G Indemnifications — Under the Trust's organizational documents, its officers and Trustees may be indemnified against certain liabilities and expenses arising out of the performance of their duties to the Fund, and shareholders are indemnified against personal liability for obligations of the Trust. Additionally, in the normal course of business, the Fund enters into agreements with service providers that may contain indemnification clauses. The Fund's maximum exposure under these arrangements is unknown as this would involve future claims that may be made against the Fund that have not yet occurred.
2 Distributions to Shareholders
The Fund declares dividends daily to shareholders of record at the time of declaration. Distributions are ordinarily paid monthly. Distributions of allocated realized capital gains, if any, are made at least annually. Shareholders may reinvest income and capital gain distributions in additional shares of the Fund at the net asset value as of the ex-dividend date. Distributions are paid in the form of additional shares or, at the election of the shareholder, in cash. The Fund distinguishes between distributions on a tax basis and a financial reporting basis. Accounting principles generally accepted in the United States of America require that only distributions in excess of tax basis earnings and profits be reported in the financial statements as a return of capital. Permanent differences between book and tax accounting relating to distributions are reclassified to paid-in capital.
The tax character of distributions paid for the years ended October 31, 2005 and October 31, 2004 was as follows:
| | | Year Ended October 31, | |
| | | 2005 | | 2004 | |
| Distributions declared from: | | | | | |
| Ordinary income | | $ | 36,649,527 | | | $ | 29,494,244 | | |
During the year ended October 31, 2005, accumulated overdistributed net investment income was decreased by $20,310,777, accumulated net realized loss was increased by $17,255,262 and paid-in capital was decreased by $3,055,515, primarily due to differences between book and tax accounting for financial futures contracts, swaps, and foreign currency transactions; amortization/accretion; and paydown losses. This change had no effect on the net assets or the net asset value per share.
As of October 31, 2005, the components of distributable earnings (accumulated losses) on a tax basis were as follows:
| Undistributed ordinary income | | $ | 1,916,904 | | |
| Capital loss carryforwards | | $ | (37,184,528 | ) | |
The differences between components of distributable earnings (accumulated loss) on a tax basis and the amounts reflected in the statement of assets and liabilities are primarily due to differences between book and tax policies for swap contracts, financial futures contracts, straddles and the timing of recognizing distributions to shareholders.
3 Shares of Beneficial Interest
The Fund's Declaration of Trust permits the Trustees to issue an unlimited number of full and fractional shares of beneficial interest (without par value). Transactions in Fund shares were as follows:
| | | Year Ended October 31, | |
| Class A | | 2005 | | 2004 | |
| Sales | | | 17,751,914 | | | | 11,264,577 | | |
Issued to shareholders electing to receive
payments of distributions in Fund shares | | | 1,041,682 | | | | 590,344 | | |
| Redemptions | | | (9,285,301 | ) | | | (3,805,406 | ) | |
| Exchange from Class B shares | | | 557,285 | | | | 6,108,174 | | |
| Net increase | | | 10,065,580 | | | | 14,157,689 | | |
12
Eaton Vance Strategic Income Fund as of October 31, 2005
NOTES TO FINANCIAL STATEMENTS CONT'D
| | | Year Ended October 31, | |
| Class B | | 2005 | | 2004 | |
| Sales | | | 6,285,187 | | | | 7,732,706 | | |
Issued to shareholders electing to receive
payments of distributions in Fund shares | | | 669,200 | | | | 711,284 | | |
| Redemptions | | | (5,280,517 | ) | | | (5,121,629 | ) | |
| Exchange to Class A shares | | | (588,236 | ) | | | (6,452,600 | ) | |
| Net increase (decrease) | | | 1,085,634 | | | | (3,130,239 | ) | |
| | | Year Ended October 31, | |
| Class C | | 2005(1) | | 2004(1) | |
| Sales | | | 8,902,060 | | | | 6,003,947 | | |
Issued to shareholders electing to receive
payments of distributions in Fund shares | | | 529,300 | | | | 405,953 | | |
| Redemptions | | | (3,167,321 | ) | | | (2,484,063 | ) | |
| Net increase | | | 6,264,039 | | | | 3,925,837 | | |
(1) Transactions have been restated to reflect the effects of a 1.2632979-for-1 stock split effective on November 11, 2005.
4 Investment Adviser Fee and Other Transactions with Affiliates
Eaton Vance Management (EVM) serves as the administrator of the Fund, but receives no compensation. The Portfolios have engaged Boston Management and Research (BMR), a subsidiary of EVM, to render investment advisory services. See Note 2 of each of the Portfolio's Notes to financial statements. Except as to Trustees of the Fund and the Portfolios who are not members of EVM's organization, officers and Trustees receive remuneration for their services to the Fund out of such investment adviser fee. Certain officers and Trustees of the Fund and of the Portfolios are officers of the above organizations. EVM serves as the sub-transfer agent of the Fund and receives an aggregate fee based upon the actual expenses incurred by EVM in the performance of those services. During the year ended October 31, 2005, EVM earned $30,010 in sub-transfer agent fees. The Fund was informed that EVD, a subsidiary of EVM and the Fund's principal underwr iter, received $108,016 as its portion of the sales charge on sales of Class A shares for the year ended October 31, 2005.
5 Distribution and Service Plans
The Fund has in effect distribution plans for Class B shares (Class B Plan) and Class C shares (Class C Plan) pursuant to Rule 12b-1 under the Investment Company Act of 1940 and a service plan for Class A shares (Class A Plan) (collectively, the Plans). The Class B and Class C Plans require the Fund to pay EVD, amounts equal to 1/365 of 0.75% of the Fund's average daily net assets attributable to Class B and Class C shares, for providing ongoing distribution services and facilities to the Fund. The Fund will automatically discontinue payments to EVD during any period in which there are no outstanding Uncovered Distribution Charges, which are equivalent to the sum of (i) 4.5% and 6.25% of the aggregate amount received by the Fund for Class B and Class C shares sold, respectively, plus (ii) interest calculated by applying the rate of 1% over the prevailing pri me rate to the outstanding balance of Uncovered Distribution Charges due EVD, of each respective class reduced by the aggregate amount of contingent deferred sales charges (see Note 6) and daily amounts theretofore paid to EVD by each respective class. The amount payable to EVD with respect to each day is accrued on such day as a liability of the Fund and, accordingly, reduces the Fund's net assets. For the year ended October 31, 2005, the Fund paid or accrued $1,474,279 and $968,062, respectively, to or payable to EVD representing 0.75% of average daily net assets of Class B and Class C shares, respectively. At October 31, 2005, the amount of Uncovered Distribution Charges of EVD calculated under the Plans was approximately $35,468,000 and $10,837,000 for Class B and Class C shares, respectively.
The Plans authorize the Fund to make payments of service fees to EVD, investment dealers and other persons in amounts not exceeding 0.25% of the Fund's average daily net assets attributable to Class A, Class B, and Class C shares for the fiscal year. Service fee payments will be made for personal services and/or the maintenance of shareholder accounts. Service fees are separate and distinct from the sales and commissions and distribution fees payable by the Fund to EVD, and, as such are not subject to automatic discontinuance when there are no outstanding Uncovered Distribution Charges of EVD. Service fees for the year ended October 31, 2005 amounted to $516,157, $491,426, and $322,687 for Class A, Class B, and Class C shares, respectively.
6 Contingent Deferred Sales Charge
A contingent deferred sales charge (CDSC) generally is imposed on redemptions of Class B shares made within six years of purchase and on redemptions of Class C shares made within one year of purchase. Class A shares may be subject to a 1% CDSC if redeemed within one year of purchase (depending on the circumstances of purchase). Generally, the CDSC is based upon the lower of the net
13
Eaton Vance Strategic Income Fund as of October 31, 2005
NOTES TO FINANCIAL STATEMENTS CONT'D
asset value at date of redemption or date of purchase. No charge is levied on shares acquired by reinvestment of dividends or capital gain distributions. The Class B CDSC is imposed at declining rates that begin at 5% in the first and second year of redemption after purchase, declining one percentage point in each subsequent year. Class C shares will be subject to a 1% CDSC if redeemed within one year of purchase. No CDSC is levied on shares which have been sold to EVM or its affiliates or to their respective employees or clients and may be waived under certain other limited conditions. CDSC charges received on Class B and Class C redemptions are paid to EVD to reduce the amount of Uncovered Distribution Charges calculated under the Class B and Class C Plans, respectively (see Note 5). CDSC charges received on Class B and Class C redemptions when no Uncovered Distribution Charges exist for the respective classes will be credited to the Fund. The Fund has been informed that EVD received approximately $24,000, $635,000 and $33,000 of CDSC paid by shareholders of Class A, Class B and Class C shares, respectively, during the year ended October 31, 2005.
7 Investment Transactions
Increases and decreases in the Fund's investment in the Strategic Income Portfolio for the year ended October 31, 2005, aggregated $258,350,420 and $194,304,717, respectively. Decreases in the Fund's investment in the High Income Portfolio for the year ended October 31, 2005 aggregated $15,000,000. Increases in the Fund's investment in the Floating Rate Portfolio for the year ended October 31, 2005 aggregated $48,000,000.
8 Investment in Portfolios
For the year ended October 31, 2005, the Fund was allocated net investment income and realized and unrealized gain (loss) from the Portfolios as follows:
| | | Strategic
Income
Portfolio | | High
Income
Portfolio | | Floating
Rate
Portfolio | | Total | |
Interest income (net of foreign
taxes of $72,160, $0, $0
and $72,160, respectively) | | |
$14,487,231 | | | |
$5,360,485 | | | |
$4,900,725 | | | |
$24,748,441 | | |
| Dividend income | | | 210,708 | | | | 26,315 | | | | 39 | | | | 237,062 | | |
| Expenses | | | (2,478,100 | ) | | | (360,523 | ) | | | (504,511 | ) | | | (3,343,134 | ) | |
| Net investment income | | $ | 12,219,839 | | | $ | 5,026,277 | | | $ | 4,396,253 | | | $ | 21,642,369 | | |
| Net realized gain (loss) — | |
| Investment transactions | | $ | (331,502 | ) | | $ | 1,231,833 | | | $ | (241,880 | ) | | $ | 658,451 | | |
| Financial futures contracts | | | (263,392 | ) | | | | | | | | | | | (263,392 | ) | |
| Swap contracts | | | 4,197,194 | | | | (667 | ) | | | 13,768 | | | | 4,210,295 | | |
Foreign currency
and forward
foreign currency
exchange contracts | | | 12,871,381 | | | | 2,694 | | | | 66,569 | | | | 12,940,644 | | |
| Net realized gain (loss) | | $ | 16,473,681 | | | $ | 1,233,860 | | | $ | (161,543 | ) | | $ | 17,545,998 | | |
Change in unrealized
appreciation (depreciation) | |
| Investments | | $ | (2,560,516 | ) | | $ | (2,129,510 | ) | | $ | 39,153 | | | $ | (4,650,873 | ) | |
| Financial futures contracts | | | 592,831 | | | | | | | | | | | | 592,831 | | |
| Swap contracts | | | (2,353,249 | ) | | | 13,978 | | | | 3,591 | | | | (2,335,680 | ) | |
Foreign currency
and forward
foreign currency
exchange contracts | | | (1,682,919 | ) | | | 438 | | | | 63,166 | | | | (1,619,315 | ) | |
Net change in unrealized
appreciation (depreciation) | | $ | (6,003,853 | ) | | $ | (2,115,094 | ) | | $ | 105,910 | | | $ | (8,013,037 | ) | |
9 Stock Split
On October 17, 2005, the Trustees of the Fund approved a 1.2632979-for-1 stock split for Class C shares, effective November 11, 2005. The stock split will have no impact on the overall value of a shareholder's investment in the Fund.
14
Eaton Vance Strategic Income Fund as of October 31, 2005
REPORT OF INDEPENDENT REGISTERED PUBLIC ACCOUNTING FIRM
To the Trustees and Shareholders of
Eaton Vance Strategic Income Fund:
In our opinion, the accompanying statement of assets and liabilities, and the related statements of operations and of changes in net assets and the financial highlights present fairly, in all material respects, the financial position of Eaton Vance Strategic Income Fund (the "Fund"), a series of Eaton Vance Mutual Funds Trust, at October 31, 2005, and the results of its operations, the changes in its net assets and the financial highlights for each of the periods presented, in conformity with accounting principles generally accepted in the United States of America. These financial statements and financial highlights (hereafter referred to as "financial statements") are the responsibility of the Fund's management; our responsibility is to express an opinion on these financial statements based on our audits. We conducted our audits of these financial statements in accordance with standards of the Public Company Accounting Oversigh t Board (United States). Those standards require that we plan and perform the audit to obtain reasonable assurance about whether the financial statements are free of material misstatement. An audit includes examining, on a test basis, evidence supporting the amounts and disclosures in the financial statements, assessing the accounting principles used and significant estimates made by management, and evaluating the overall financial statement presentation. We believe that our audits provide a reasonable basis for our opinion.
PricewaterhouseCoopers LLP
Boston, Massachusetts
December 23, 2005
15
Eaton Vance Strategic Income Fund as of October 31, 2005
FEDERAL TAX INFORMATION (Unaudited)
The Form 1099-DIV you receive in January 2006 will show the tax status of all distributions paid to your account in calendar 2005. Shareholders are advised to consult their own tax adviser with respect to the tax consequences of their investment in the Fund.
16
Strategic Income Portfolio as of October 31, 2005
PORTFOLIO OF INVESTMENTS
| Bonds & Notes — 104.7% | |
| Security | | Principal | | U.S. $ Value | |
| Brazil — 1.4% | |
| Republic of Brazil, 12.50%, 1/5/16 | | BRL | 13,740,000 | | | $ | 5,765,035 | | |
| Total Brazil (identified cost $5,753,689) | | | | | | $ | 5,765,035 | | |
| Colombia — 1.5% | |
| Republic of Colombia, 11.75%, 3/1/10 | | COP | 12,139,000,000 | | | | 5,924,050 | | |
| Total Colombia (identified cost $5,094,104) | | | | | | $ | 5,924,050 | | |
| Indonesia — 1.3% | |
| APP Finance VI, 0.00%, 11/18/12(1)(2)(3) | | $ | 4,000,000 | | | $ | 120,000 | | |
| APP Finance VII, 3.50%, 4/30/03(1)(2)(3) | | | 2,000,000 | | | | 230,000 | | |
DGS International Finance,
10.00%, 6/1/07(1)(3) | | | 2,000,000 | | | | 32,000 | | |
Indah Kiat International Finance,
12.50%, 6/15/06(1)(3) | | | 1,000,000 | | | | 625,000 | | |
| Indonesia Recapital, 14.00%, 6/15/09 | | IDR | 45,000,000,000 | | | | 4,495,824 | | |
| Total Indonesia (identified cost $11,234,961) | | | | | | $ | 5,502,824 | | |
| Morocco — 0.1% | |
| Snap Ltd., 11.50%, 1/29/09 DEM | | | 716,595 | | | $ | 438,843 | | |
| Total Morocco (identified cost $368,988) | | | | | | $ | 438,843 | | |
| New Zealand — 2.2% | |
| New Zealand Government, 7.00%, 7/15/09 | | NZD | 12,600,000 | | | $ | 9,073,800 | | |
| Total New Zealand (identified cost $8,897,204) | | | | | | $ | 9,073,800 | | |
| Philippines — 0.2% | |
Bayan Telecommunications,
13.50%, 7/15/06(1)(3)(4) | | $ | 2,000,000 | | | $ | 860,000 | | |
| Total Philippines (identified cost $1,917,237) | | | | | | $ | 860,000 | | |
| United States — 97.8% | |
| Corporate Bonds & Notes — 1.2% | |
| Baltimore Gas and Electric, 6.73%, 6/12/12 | | $ | 400,000 | | | $ | 427,896 | | |
| Security | | Principal | | U.S. $ Value | |
| United States (continued) | |
| BellSouth Capital Funding, 6.04%, 11/15/26 | | $ | 300,000 | | | $ | 303,568 | | |
| Coca-Cola Enterprise, 7.00%, 10/1/26 | | | 375,000 | | | | 429,528 | | |
| Eaton Corp., 8.875%, 6/15/19 | | | 500,000 | | | | 644,717 | | |
| Ford Holdings, 9.30%, 3/1/30 | | | 1,000,000 | | | | 842,500 | | |
| Ingersoll-Rand Co., 6.48%, 6/1/25 | | | 1,050,000 | | | | 1,160,970 | | |
| US Bancorp, 7.50%, 6/1/26 | | | 840,000 | | | | 1,024,088 | | |
Total Corporate Bonds & Notes
(identified cost, $4,651,592) | | | | | | $ | 4,833,267 | | |
| Collateralized Mortgage Obligations — 14.1% | |
Federal Home Loan Mortgage Corp.,
Series 1548, Class Z, 7.00%, 7/15/23 | | $ | 1,265,106 | | | $ | 1,327,238 | | |
Federal Home Loan Mortgage Corp.,
Series 1817, Class Z, 6.50%, 2/15/26 | | | 1,015,338 | | | | 1,058,123 | | |
Federal Home Loan Mortgage Corp.,
Series 1927, Class ZA, 6.50%, 1/15/27 | | | 3,974,299 | | | | 4,120,868 | | |
Federal Home Loan Mortgage Corp.,
Series 4, Class D, 8.00%, 12/25/22 | | | 979,132 | | | | 1,042,052 | | |
Federal National Mortgage Association,
Series 1992-180, Class F, 5.213%, 10/25/22(5) | | | 4,313,905 | | | | 4,422,396 | | |
Federal National Mortgage Association,
Series 1993-104, Class ZB, 6.50%, 7/25/23 | | | 1,367,225 | | | | 1,425,959 | | |
Federal National Mortgage Association,
Series 1993-141, Class Z, 7.00%, 8/25/23 | | | 3,120,569 | | | | 3,304,264 | | |
Federal National Mortgage Association,
Series 1993-16, Class Z, 7.50%, 2/25/23 | | | 4,250,107 | | | | 4,484,063 | | |
Federal National Mortgage Association,
Series 1993-79, Class PL, 7.00%, 6/25/23 | | | 2,875,529 | | | | 3,024,795 | | |
Federal National Mortgage Association,
Series 1994-63, Class PJ, 7.00%, 12/25/23 | | | 7,958,551 | | | | 8,096,049 | | |
Federal National Mortgage Association,
Series 1994-79, Class Z, 7.00%, 4/25/24 | | | 3,747,858 | | | | 3,970,736 | | |
Federal National Mortgage Association,
Series 1994-89, Class ZQ, 8.00%, 7/25/24 | | | 2,414,493 | | | | 2,579,583 | | |
Federal National Mortgage Association,
Series 1996-35, Class Z, 7.00%, 7/25/26 | | | 953,713 | | | | 1,007,595 | | |
Federal National Mortgage Association,
Series 2000-49, Class A, 8.00%, 3/18/27 | | | 3,310,524 | | | | 3,508,263 | | |
Federal National Mortgage Association,
Series 2001-37, Class GA, 8.00%, 7/25/16 | | | 1,039,471 | | | | 1,094,468 | | |
Federal National Mortgage Association,
Series G93-1, Class K, 6.675%, 1/25/23 | | | 4,622,083 | | | | 4,793,431 | | |
Government National Mortgage Association,
Series 2001-35, Class K, 6.45%, 10/26/23 | | | 1,043,454 | | | | 1,081,483 | | |
Government National Mortgage Association,
Series 2002-48, Class OC, 6.00%, 9/16/30 | | | 5,000,000 | | | | 5,100,157 | | |
See notes to financial statements
17
Strategic Income Portfolio as of October 31, 2005
PORTFOLIO OF INVESTMENTS CONT'D
| Security | | Principal | | U.S. $ Value | |
| United States (continued) | |
Merrill Lynch Trust,
Series 45, Class Z, 9.10%, 9/20/20 | | $ | 2,522,091 | | | $ | 2,524,439 | | |
Total Collateralized Mortgage Obligations
(identified cost, $59,476,641) | | | | | | $ | 57,965,962 | | |
| Mortgage Pass-Throughs — 78.2% | |
| Federal Home Loan Mortgage Corp.: | |
| 6.00% with maturity at 2024 | | $ | 8,916,925 | | | $ | 9,105,759 | | |
| 6.50% with various maturities to 2024 | | | 6,251,892 | | | | 6,481,879 | | |
| 7.00% with various maturities to 2024 | | | 4,381,699 | | | | 4,605,511 | | |
| 7.31% with maturity at 2026 | | | 821,169 | | | | 870,880 | | |
| 7.50% with various maturities to 2026 | | | 15,934,703 | | | | 17,000,495 | | |
| 7.95% with maturity at 2022 | | | 1,215,717 | | | | 1,315,145 | | |
| 8.00% with various maturities to 2021 | | | 459,056 | | | | 478,197 | | |
| 8.15% with maturity at 2021 | | | 930,949 | | | | 952,828 | | |
| 8.30% with maturity at 2021 | | | 603,117 | | | | 657,671 | | |
| 8.47% with maturity at 2018 | | | 510,593 | | | | 556,470 | | |
| 8.50% with various maturities to 2028 | | | 4,281,463 | | | | 4,685,102 | | |
| 9.00% with various maturities to 2027 | | | 2,473,833 | | | | 2,730,812 | | |
| 9.25% with various maturities to 2016 | | | 418,371 | | | | 435,083 | | |
| 9.50% with various maturities to 2027 | | | 921,195 | | | | 1,029,572 | | |
| 9.75% with various maturities to 2020 | | | 104,540 | | | | 112,299 | | |
| 10.00% with various maturities to 2025 | | | 970,615 | | | | 1,095,106 | | |
| 10.25% with maturity at 2013 | | | 258,540 | | | | 273,546 | | |
| 10.50% with various maturities to 2021 | | | 1,451,297 | | | | 1,673,834 | | |
| 11.00% with various maturities to 2019 | | | 2,439,557 | | | | 2,795,710 | | |
| 11.25% with maturity at 2010 | | | 28,659 | | | | 31,217 | | |
| 12.50% with various maturities to 2019 | | | 316,286 | | | | 363,536 | | |
| 12.75% with maturity at 2013 | | | 24,166 | | | | 26,975 | | |
| 13.25% with maturity at 2013 | | | 4,649 | | | | 5,333 | | |
| 13.50% with maturity at 2019 | | | 28,109 | | | | 32,330 | | |
| | | $ | 57,315,290 | | |
| Federal National Mortgage Association: | |
| 3.872% with various maturities to 2033(6) | | $ | 41,343,675 | | | $ | 41,664,760 | | |
| 3.926% with various maturities to 2035(6) | | | 107,543,022 | | | | 108,110,150 | | |
| 3.953% with maturity at 2035(6) | | | 15,141,124 | | | | 15,222,238 | | |
| 3.989% with maturity at 2022(6) | | | 5,661,684 | | | | 5,756,080 | | |
| 4.076% with maturity at 2025(6) | | | 4,124,490 | | | | 4,125,437 | | |
| 4.276% with maturity at 2024(6) | | | 3,417,865 | | | | 3,467,303 | | |
| 4.28% with maturity at 2023(6) | | | 914,557 | | | | 916,987 | | |
| 4.906% with maturity at 2028(6) | | | 1,231,899 | | | | 1,262,312 | | |
| 6.50% with various maturities to 2028 | | | 9,132,643 | | | | 9,453,316 | | |
| 7.00% with various maturities to 2024 | | | 2,214,238 | | | | 2,321,633 | | |
| 7.50% with various maturities to 2026 | | | 16,092,127 | | | | 17,031,283 | | |
| 8.00% with various maturities to 2028 | | | 18,000,270 | | | | 19,331,642 | | |
| 8.50% with various maturities to 2026 | | | 592,179 | | | | 621,879 | | |
| 8.91% with maturity at 2010 | | | 271,452 | | | | 285,226 | | |
| 9.00% with various maturities to 2024 | | | 1,883,068 | | | | 2,051,714 | | |
| 9.03% with maturity at 2028 | | | 2,528,572 | | | | 2,786,127 | | |
| 9.50% with various maturities to 2030 | | | 3,807,427 | | | | 4,235,872 | | |
| Security | | Principal | | U.S. $ Value | |
| United States (continued) | |
| 10.50% with maturity at 2020 | | $ | 190,390 | | | $ | 220,401 | | |
| 11.00% with various maturities to 2025 | | | 219,483 | | | | 249,683 | | |
| 11.50% with maturity at 2019 | | | 244,809 | | | | 280,445 | | |
| 12.00% with maturity at 2015 | | | 152,880 | | | | 176,037 | | |
| 12.50% with maturity at 2015 | | | 853,522 | | | | 982,324 | | |
| 12.75% with maturity at 2014 | | | 25,860 | | | | 30,931 | | |
| 13.00% with various maturities to 2015 | | | 319,407 | | | | 373,590 | | |
| 13.50% with various maturities to 2015 | | | 151,965 | | | | 176,627 | | |
| 14.75% with maturity at 2012 | | | 522,575 | | | | 622,278 | | |
| | | $ | 241,756,275 | | |
| Government National Mortgage Association: | |
| 7.00% with various maturities to 2024 | | $ | 4,529,717 | | | $ | 4,775,512 | | |
| 7.50% with various maturities to 2028 | | | 5,760,664 | | | | 6,146,385 | | |
| 7.75% with maturity at 2019 | | | 49,736 | | | | 53,492 | | |
| 8.00% with various maturities to 2023 | | | 2,220,839 | | | | 2,398,985 | | |
| 8.30% with various maturities to 2020 | | | 604,036 | | | | 653,590 | | |
| 8.50% with various maturities to 2021 | | | 407,143 | | | | 439,413 | | |
| 9.00% with various maturities to 2025 | | | 1,563,456 | | | | 1,724,507 | | |
| 9.50% with various maturities to 2026 | | | 4,896,661 | | | | 5,514,838 | | |
| 12.50% with maturity at 2019 | | | 377,161 | | | | 435,205 | | |
| 13.50% with maturity at 2014 | | | 26,993 | | | | 32,641 | | |
| | | $ | 22,174,568 | | |
Total Mortgage Pass-Throughs
(identified cost, $321,450,779) | | | | | | $ | 321,246,133 | | |
| Auction Rate Certificates — 3.8% | |
Brazos Student Finance Corp.,
Series 2004A-4, Variable Rate, 3.90%, 3/1/40(6) | | $ | 4,250,000 | | | $ | 4,250,000 | | |
Brazos Student Finance Corp.,
Series 2004A-6, Variable Rate, 3.92%, 3/1/40(6) | | | 1,000,000 | | | | 1,000,000 | | |
Colorado Educational and Cultural Facilities Authority,
(The Nature Conservancy), Variable Rate Demand Note,
3.90%, 7/1/32(6) | | | 7,800,000 | | | | 7,800,000 | | |
Colorado Educational and Cultural Facilities Authority,
(The Nature Conservancy), Variable Rate Demand Note,
3.93%, 7/1/32(6) | | | 2,475,000 | | | | 2,475,000 | | |
Total Auction Rate Certificates
(identified cost, $15,525,000) | | | | | | $ | 15,525,000 | | |
| U.S. Treasury Obligations — 0.5% | |
United States Treasury Bond,
7.875%, 2/15/21(7) —
(identified cost, $1,828,006) | | $ | 1,500,000 | | | $ | 1,994,473 | | |
Total United States
(identified cost $402,932,018) | | | | | | $ | 401,564,835 | | |
See notes to financial statements
18
Strategic Income Portfolio as of October 31, 2005
PORTFOLIO OF INVESTMENTS CONT'D
| Security | | Principal | | U.S. $ Value | |
| Vietnam — 0.2% | |
| Socialist Republic of Vietnam, 6.875%, 1/15/16(4) | | $ | 1,000,000 | | | $ | 991,875 | | |
| Total Vietnam (identified cost $982,230) | | | | | | $ | 991,875 | | |
Total Bonds & Notes
(identified cost, $437,180,431) | | | | | | $ | 430,121,262 | | |
| Common Stocks — 0.1% | |
| Security | | Shares | | Value | |
| Indonesia — 0.1% | |
| Business Services — 0.1% | |
| APP China(1) | | | 8,155 | | | $ | 438,331 | | |
| | | $ | 438,331 | | |
| Total Indonesia (identified cost $1,522,635) | | | | | | $ | 438,331 | | |
Total Common Stocks
(identified cost $1,522,635) | | | | | | $ | 438,331 | | |
| Commercial Paper — 4.9% | |
| Security | | Principal
Amount
(000's omitted) | | Value | |
| Lafayette Asset Funding, 4.05%, 11/4/05 | | $ | 20,000 | | | $ | 19,993,250 | | |
Total Commercial Paper
(at amortized cost, $19,993,250) | | | | | | $ | 19,993,250 | | |
| Short-Term Investments — 1.6% | |
| Security | | Principal | | Value | |
Investors Bank and Trust Company Time Deposit,
4.03%, 11/1/05 | | $ | 6,410,000 | | | $ | 6,410,000 | | |
Total Short-Term Investments
(at amortized cost, $6,410,000) | | | | | | $ | 6,410,000 | | |
| Call Options Purchased — 0.1% | |
| Security | | Contracts | | Value | |
Kospi 200 Index, Expires 3/12/07,
Strike Price 143.946 | | | 37,083 | | | $ | 547,214 | | |
Taiwan SE Index, Expires 3/12/07,
Strike Price 6808.125 | | | 32 | | | | 84,775 | | |
Total Call Options Purchased
(at identified cost, $641,471) | | | | $ | 631,989 | | |
Total Investments — 111.4%
(identified cost $465,747,787) | | | | $ | 457,594,832 | | |
| Other Assets, Less Liabilities — (11.4)% | | | | $ | (46,915,129 | ) | |
| Net Assets — 100.0% | | | | $ | 410,679,703 | | |
BRL - Brazilian Real
COP - Colombian Peso
DEM - Deutsche Mark
IDR - Indonesian Rupiah
NZD - New Zealand Dollar
(1) Non-income producing security.
(2) Convertible bond.
(3) Defaulted security.
(4) Security exempt from registration under Rule 144A of the Securities Act of 1933. These securities may be sold in transactions exempt from registration, normally to qualified institutional buyers. At October 31, 2005, the aggregate value of the securities is $1,851,875 or 0.5% of the net assets.
(5) Floating-Rate.
(6) Adjustable rate securities. Rates shown are the rates at period end.
(7) Security (or a portion thereof) has been segregated to cover margin requirements on open financial futures contracts.
(8) Security valued at fair value using methods determined in good faith by or at the direction of the Trustees.
See notes to financial statements
19
Strategic Income Portfolio as of October 31, 2005
FINANCIAL STATEMENTS
Statement of Assets and Liabilities
As of October 31, 2005
| Assets | |
| Investments, at value (identified cost, $465,747,787) | | $ | 457,594,832 | | |
| Cash | | | 2,680 | | |
| Deposit for funded swap | | | 2,510,435 | | |
| Receivable for investments sold | | | 44,918 | | |
| Receivable for open swap contracts | | | 581,931 | | |
| Interest and dividends receivable | | | 2,781,213 | | |
| Receivable for open forward foreign currency contracts | | | 780,360 | | |
| Receivable for daily variation margin on open financial futures contracts | | | 184,315 | | |
| Total assets | | $ | 464,480,684 | | |
| Liabilities | |
| Payable for investments purchased | | $ | 50,562,947 | | |
| Payable for open swap contracts | | | 2,001,584 | | |
| Payable for open forward foreign currency contracts | | | 981,406 | | |
| Payble to affiliate for investment advisory fees | | | 150,049 | | |
| Payable to affiliate for Trustees' fees | | | 1,606 | | |
| Accrued expenses | | | 103,389 | | |
| Total liabilities | | $ | 53,800,981 | | |
| Net Assets applicable to investors' interest in Portfolio | | $ | 410,679,703 | | |
| Sources of Net Assets | |
| Net proceeds from capital contributions and withdrawals | | $ | 419,790,640 | | |
| Net unrealized depreciation (computed on the basis of identified cost) | | | (9,110,937 | ) | |
| Total | | $ | 410,679,703 | | |
Statement of Operations
For the Year Ended
October 31, 2005
| Investment Income | |
| Interest (net of foreign taxes, $72,160) | | $ | 14,487,232 | | |
| Dividends | | | 210,708 | | |
| Total investment income | | $ | 14,697,940 | | |
| Expenses | |
| Investment adviser fee | | $ | 1,650,371 | | |
| Administration fee | | | 566,827 | | |
| Trustees' fees and expenses | | | 17,172 | | |
| Custodian fee | | | 135,160 | | |
| Legal and accounting services | | | 100,424 | | |
| Miscellaneous | | | 9,012 | | |
| Total expenses | | $ | 2,478,966 | | |
Deduct —
Reduction of custodian fee | | $ | 866 | | |
| Total expense reductions | | $ | 866 | | |
| Net expenses | | $ | 2,478,100 | | |
| Net investment income | | $ | 12,219,840 | | |
| Realized and Unrealized Gain (Loss) | |
Net realized gain (loss) —
Investment transactions (identified cost basis) | | $ | (331,502 | ) | |
| Financial futures contracts | | | (263,392 | ) | |
| Swap contracts | | | 4,197,194 | | |
Foreign currency and forward foreign currency exchange
contract transactions | | | 12,871,381 | | |
| Net realized gain | | $ | 16,473,681 | | |
Change in unrealized appreciation (depreciation) —
Investments (identified cost basis) | | $ | (2,560,516 | ) | |
| Financial futures contracts | | | 592,831 | | |
| Swap contracts | | | (2,353,249 | ) | |
| Foreign currency and forward foreign currency exchange contracts | | | (1,682,919 | ) | |
| Net change in unrealized appreciation (depreciation) | | $ | (6,003,853 | ) | |
| Net realized and unrealized gain | | $ | 10,469,828 | | |
| Net increase in net assets from operations | | $ | 22,689,668 | | |
See notes to financial statements
20
Strategic Income Portfolio as of October 31, 2005
FINANCIAL STATEMENTS CONT'D
Statements of Changes in Net Assets
Increase (Decrease)
in Net Assets | | Year Ended
October 31, 2005 | | Year Ended
October 31, 2004 | |
From operations —
Net investment income | | $ | 12,219,840 | | | $ | 9,677,972 | | |
Net realized gain from investments,
financial futures contracts, swap
contracts and foreign currency and
forward foreign currency exchange
contract transactions | | | 16,473,681 | | | | 12,666,844 | | |
Net change in unrealized appreciation
(depreciation) from investments,
financial futures contracts, swap
contracts, foreign currency and
forward foreign currency
exchange contracts | | | (6,003,853 | ) | | | (1,734,244 | ) | |
| Net increase in net assets from operations | | $ | 22,689,668 | | | $ | 20,610,572 | | |
Capital transactions —
Contributions | | $ | 258,350,420 | | | $ | 195,245,483 | | |
| Withdrawals | | | (194,304,717 | ) | | | (168,992,839 | ) | |
Net increase in net assets from
capital transactions | | $ | 64,045,703 | | | $ | 26,252,644 | | |
| Net increase in net assets | | $ | 86,735,371 | | | $ | 46,863,216 | | |
| Net Assets | |
| At beginning of year | | $ | 323,944,332 | | | $ | 277,081,116 | | |
| At end of year | | $ | 410,679,703 | | | $ | 323,944,332 | | |
See notes to financial statements
21
Strategic Income Portfolio as of October 31, 2005
FINANCIAL STATEMENTS
Supplementary Data
| | | Year Ended October 31, | |
| | | 2005 | | 2004 | | 2003 | | 2002(1) | | 2001 | |
| Ratios/Supplemental Data | |
| Ratios (As a percentage of average daily net assets): | |
| Expenses | | | 0.66 | % | | | 0.68 | % | | | 0.71 | % | | | 0.77 | % | | | 0.79 | % | |
| Expenses after custodian fee reduction | | | 0.66 | % | | | 0.68 | % | | | 0.71 | % | | | 0.77 | % | | | 0.79 | % | |
| Net investment income | | | 3.23 | % | | | 3.10 | % | | | 3.36 | % | | | 5.88 | % | | | 8.10 | % | |
| Portfolio Turnover | | | 59 | % | | | 55 | % | | | 71 | % | | | 63 | % | | | 54 | % | |
| Total Return(2) | | | 6.48 | % | | | 6.97 | % | | | 12.97 | % | | | 5.25 | % | | | — | | |
| Net assets, end of year (000's omitted) | | $ | 410,680 | | | $ | 323,944 | | | $ | 277,081 | | | $ | 190,453 | | | $ | 179,492 | | |
(1) The Portfolio adopted the provisions of the AICPA Audit and Accounting Guide for Investment Companies and began amortizing market premiums on fixed-income securities, excluding mortgage-backed securities, and accreting certain discounts using a different methodology. Additionally, the Portfolio reclassified net losses realized on prepayments received on mortgage-backed securities that were previously included in realized gains/losses to interest income. The effect of these changes for the year ended October 31, 2002 was a decrease in the ratio of net investment income to average net assets from 7.32% to 5.88%. Ratios for the periods prior to October 31, 2001 have not been restated to reflect this change in presentation.
(2) Total return is required to be disclosed for fiscal years beginning after December 15, 2000.
See notes to financial statements
22
Strategic Income Portfolio as of October 31, 2005
NOTES TO FINANCIAL STATEMENTS
1 Significant Accounting Policies
Strategic Income Portfolio (the Portfolio) is registered under the Investment Company Act of 1940 as an open-end investment company. The Portfolio was organized as a trust under the laws of the State of New York in 1992. The Portfolio's investment objective is to provide a high level of income and total return by investing in a global portfolio consisting primarily of high grade debt securities. The Declaration of Trust permits the Trustees to issue beneficial interests in the Portfolio. At October 31, 2005, Eaton Vance Strategic Income Fund held an approximate 99.9% interest in the Portfolio. The following is a summary of significant accounting policies of the Portfolio. The policies are in conformity with accounting principles generally accepted in the United States of America.
A Investment Valuation — Most seasoned mortgage backed securities ("MBS") are valued by the investment adviser's matrix pricing system. The matrix pricing system also considers various factors relating to bonds and market transactions to determine market value. Debt securities (other than short-term obligations maturing in sixty days or less but including collateralized mortgage obligations and certain MBS), including listed securities and securities for which price quotations are available and forward contracts, will normally be valued on the basis of market valuations furnished by pricing services. The pricing services consider various factors relating to bonds or loans and/or market transactions to determine market value. Marketable securities that are listed on foreig n or U.S. securities exchanges are valued at closing sale prices on the exchange where such securities are principally traded. Marketable securities listed in the NASDAQ National Market System are valued at the NASDAQ official closing price. Unlisted or listed securities for which closing sale prices are not available are valued at the mean between the latest available bid and ask prices. When valuing foreign investments that meet certain criteria, the Trustees have approved the use of a fair value service that values such securities to reflect market trading that occurs after the close of the applicable foreign markets of comparable or other instruments that have strong correlation to the fair-valued securities. Financial futures contracts and options thereon listed on commodity exchanges and exchange-traded options are valued at closing settlement prices. Short-term obligations and money-market securities maturing in sixty days or less are valued at amortized cost which approximates value. Non-U.S. dollar denominated short-term obligations are valued at amortized cost as calculated in the base currency and translated to U.S. dollars at the current exchange rate. Investments for which market quotations are unavailable, and investments for which the price of the security is not believed to represent its fair market value, are valued at fair value using methods determined in good faith by or at the direction of the Trustees.
B Income — Interest income is determined on the basis of interest accrued and discount earned, adjusted for amortization of premium or accretion of discount. Dividend income is recorded on the ex-dividend date for dividends received in cash and/or securities. However, if the ex-dividend date has passed, certain dividends from foreign securities are recorded as the Portfolio is informed of the ex-dividend date.
C Gains and Losses From Investment Transactions — Realized gains and losses from investment transactions are recorded on the basis of identified cost.
D Income Taxes — The Portfolio is treated as a partnership for federal tax purposes. No provision is made by the Portfolio for federal or state taxes on any taxable income of the Portfolio because each investor in the Portfolio is ultimately responsible for the payment of any taxes. Since at least one of the Portfolio's investors is a regulated investment company that invests all or substantially all of its assets in the Portfolio, the Portfolio normally must satisfy the applicable source of income and diversification requirements (under the Internal Revenue Code) in order for its investors to satisfy them. The Portfolio will allocate at least annually among its investors each investor's distributive share of the Portfolio's net investment income, net realized capital gai ns, and any other items of income, gain, loss, deduction or credit. Withholding taxes on foreign dividends and capital gains have been provided for in accordance with the Portfolio's understanding of the applicable countries' tax rules and rates.
E Financial Futures Contracts — Upon entering into a financial futures contract, the Portfolio is required to deposit an amount (initial margin), either in cash or securities, equal to a certain percentage of the purchase price indicated in the financial futures contract. Subsequent payments are made or received by the Portfolio (variation margin) each day, dependent on the daily fluctuations in the value of the underlying security, and are recorded for book purposes as unrealized gains or losses by the Portfolio. The Portfolio's investment in financial futures contracts is designed for both hedging against anticipated future changes in interest or currency exchange rates and
23
Strategic Income Portfolio as of October 31, 2005
NOTES TO FINANCIAL STATEMENTS CONT'D
investment purposes. Should interest or currency exchange rates move unexpectedly, the Portfolio may not achieve the anticipated benefits of the financial futures contracts and may realize a loss. If the Portfolio enters into a closing transaction, the Portfolio will realize, for book purposes, a gain or loss equal to the difference between the value of the financial futures contract to sell and financial futures contract to buy.
F When-Issued and Delayed Delivery Transactions — The Portfolio may engage in when-issued and delayed delivery transactions. The Portfolio records when-issued securities on trade date and maintains security positions such that sufficient liquid assets will be available to make payments for the securities purchased. Securities purchased on a when-issued or delayed delivery basis are marked-to-market daily and begin earning interest on settlement date.
G Foreign Currency Translation — Investment valuations, other assets, and liabilities initially expressed in foreign currencies are converted each business day into U.S. dollars based upon current exchange rates. Purchases and sales of foreign investment securities and income and expenses are converted into U.S. dollars based upon currency exchange rates prevailing on the respective dates of such transactions. Recognized gains or losses on investment transactions attributable to changes in foreign currency exchange rates are recorded for financial statement purposes as net realized gains and losses on investments. That portion of unrealized gains and losses on investments that results from fluctuations in foreign currency exchange rates is not separately disclosed.
H Written Options — The Portfolio may write call or put options for which premiums are received and are recorded as liabilities, and are subsequently adjusted to the current value of the options written. Premiums received from writing options which expire are treated as realized gains. Premiums received from writing options which are exercised or closed are offset against the proceeds or amount paid on the transaction to determine the realized gain or loss. If a put option is exercised, the premium reduces the cost basis of the securities purchased by the Portfolio. The Portfolio as writer of an option may have no control over whether the underlying securities may be sold (call) or purchased (put) and as a result bears the market risk of an unfavorable change in the price of the securities underlying the written option.
I Purchased Options — Upon the purchase of a call or put option, the premium paid by the Portfolio is included in the Statement of Assets and Liabilities as an investment. The amount of the investment is subsequently marked-to-market to reflect the current market value of the option purchased, in accordance with the Portfolio's policies on investment valuations discussed above. If an option which the Portfolio has purchased expires on the stipulated expiration date, the Portfolio will realize a loss in the amount of the cost of the option. If the Portfolio enters into a closing sale transaction, the Portfolio will realize a gain or loss, depending on whether the sales proceeds from the closing sale tr ansaction are greater or less than the cost of the option. If a Portfolio exercises a put option, it will realize a gain or loss from the sale of the underlying security, and the proceeds from such sale will be decreased by the premium originally paid. If the Portfolio exercises a call option, the cost of the security which the Portfolio purchases upon exercise will be increased by the premium originally paid.
J Forward Foreign Currency Exchange Contracts — The Portfolio may enter into forward foreign currency exchange contracts for the purchase or sale of a specific foreign currency at a fixed price on a future date. Risks may arise upon entering these contracts from the potential inability of counterparties to meet the terms of their contracts and from movements in the value of a foreign currency relative to the U.S. dollar. The Portfolio will enter into forward contracts for hedging purposes as well as non-hedging purposes. The forward foreign currency exchange contracts are adjusted by the daily exchange rate of the underlying currency and any gains or losses are recorded for financial statement purposes as unrealized until such time as the contracts have been closed.
K Reverse Repurchase Agreements — The Portfolio may enter into reverse repurchase agreements. Under such an agreement, the Portfolio temporarily transfers possession, but not ownership, of a security to a counterparty, in return for cash. At the same time, the Portfolio agrees to repurchase the security at an agreed-upon price and time in the future. The Portfolio may enter into reverse repurchase agreements for temporary purposes, such as to fund withdrawals, or for use as hedging instruments where the underlying security is denominated in a foreign currency. As a form of leverage, reverse repurchase agreements may increase the risk of fluctuation in the market value of the Portfolio's assets or in its yield. Liabilities to counterparties under reverse repurchase agreeme nts are recognized in the Statement of Assets and Liabilities at the same time at which cash is received by the Portfolio. The securities underlying such
24
Strategic Income Portfolio as of October 31, 2005
NOTES TO FINANCIAL STATEMENTS CONT'D
agreements continue to be treated as owned by the Portfolio and remain in the Portfolio of Investments. Interest charged on amounts borrowed by the Portfolio under reverse repurchase agreements is accrued daily.
L Total Return Swaps — The Portfolio may enter into swap agreements to enhance return, to hedge against fluctuations in securities prices or interest rates or as substitution for the purchase or sale of securities. In a total return swap, the Portfolio makes payments at a rate equal to a predetermined spread to the one or three-month LIBOR. In exchange, the Portfolio receives payments based on the rate of return of a benchmark industry index or basket of securities. During the term of the outstanding swap agreement, changes in the underlying value of the swap are recorded as unrealized gains and losses. Periodic payments received or made are recorded as realized gains or losses. The value of the swap is determined by changes in the relationship between the rate of interes t and the benchmark industry index or basket of securities. The Portfolio is exposed to credit loss in the event of nonperformance by the swap counterparty. However, the Portfolio does not anticipate nonperformance by the counterparty. Risk may also arise from the unanticipated movements in value of interest rates, securities, or the index.
M Credit Default Swaps — The Portfolio may enter into credit default swaps to buy or sell credit protection on an individual issuer or a basket of issuers of bonds. When the Portfolio is the buyer of a credit default swap contract, the Portfolio is entitled to receive the par or other agreed-upon value, of a referenced debt obligation from the counterparty to the contract in the event of a default by a third party, such as a U.S. or foreign corporate issuer, on the debt obligation. In return, the Portfolio would pay the counterparty a periodic stream of payments over the term of the contract provided that no event of default has occurred. If no default occurs, the Portfolio would have spent the stream of payments and received no benefit from the contract. When the Portfol io is the seller of a credit default swap contract, it receives the stream of payments, but is obligated to pay upon default of the referenced debt obligation. As the seller, the Portfolio would effectively add leverage to its portfolio because, in addition to its total net assets, the Portfolio would be subject to investment exposure on the notional amount of the swap. During the period that the credit default swap contract is open, the contract is marked to market in accordance with the terms of the contract based on the current interest rate spreads and credit risk of the referred obligation of the underlying issuer and interest accrual through valuation date. Changes in the value of credit default swap contracts are recorded as unrealized gains or losses and periodic cash settlements are recorded as realized gains or losses. The Portfolio will segregate assets in the form of cash and cash equivalents in an amount equal to the aggrega te market value of the credit default swaps of which it is the seller, marked to market on a daily basis. These transactions involve certain risks, including the risk that the seller may be unable to fulfill the transaction.
N Expense Reduction — Investors Bank & Trust Company (IBT) serves as custodian of the Portfolio. Pursuant to the custodian agreement, Investors Bank receives a fee reduced by credits which are determined based on the average daily cash balance the Portfolio maintains with IBT. All credits used to reduce the Portfolio's custodian fees are reported separately as a reduction of total expenses in the Statement of Operations. For the year ended October 31, 2005, $866 in credits were used to reduce the Portfolio's custodian fee.
O Use of Estimates— The preparation of the financial statements in conformity with accounting principles generally accepted in the United States of America requires management to make estimates and assumptions that affect the reported amounts of assets and liabilities at the date of the financial statements and the reported amounts of income and expense during the reporting period. Actual results could differ from those estimates.
P Other — Investment transactions are accounted for on a trade date basis. Realized gains and losses are computed based on the specific identification of the securities sold.
Q Indemnifications — Under the Portfolio's organizational documents, its officers and Trustees may be indemnified against certain liabilities and expenses arising out of the performance of their duties to the Portfolio. Interestholders in the Portfolio are jointly and severally liable for the liabilities and obligations of the Portfolio in the event that the Portfolio fails to satisfy such liabilities and obligations; provided, however, that, to the extent assets are available in the Portfolio, the Portfolio may, under certain circumstances, indemnify interestholders from and against any claim or liability to which such holder may become subject by reason of being or having been an interestholder in the Portfolio. Additionally, in the normal course of business, the Portfo lio enters into agreements with service providers that may contain indemnification clauses. The Portfolio's maximum exposure under these arrangements is unknown as this would involve future
25
Strategic Income Portfolio as of October 31, 2005
NOTES TO FINANCIAL STATEMENTS CONT'D
claims that may be made against the Portfolio that have not yet occurred.
2 Investment Adviser Fee and Other Transactions with Affiliates
The investment adviser fee is earned by Boston Management and Research (BMR), a wholly-owned subsidiary of Eaton Vance Management (EVM), as compensation for management and investment advisory services rendered to the Portfolio. The fee is based upon a percentage of average daily net assets (0.275% annually up to $500 million of average net assets) plus a percentage of gross income (i.e., income other than gains from the sale of investments and paydown gains/losses). Such percentages are reduced as average daily net assets and gross income exceed certain levels. For the year ended October 31, 2005, the fee was equivalent to 0.44% of the Portfolio's average net assets for such period and amounted to $1,650,371. An administration fee, computed at an effective annual rate of 0.15% of average daily net assets was also paid to BMR for administrative services and office facilities. Such fee amounted to $566,827 for the year ended Octob er 31, 2005.
Except as to Trustees of the Portfolio who are not members of EVM's or BMR's organization, officers and Trustees receive remuneration for their services to the Portfolio out of such investment adviser fee. Trustees of the Portfolio that are not affiliated with the Investment Adviser may elect to defer receipt of all or a portion of their annual fees in accordance with the terms of the Trustees Deferred Compensation Plan. For the year ended October 31, 2005, no significant amounts have been deferred. Certain officers and Trustees of the Portfolio are officers of the above organizations.
3 Line of Credit
The Portfolio participates with other portfolios and funds managed by BMR or EVM and its affiliates in a $150 million unsecured line of credit agreement with a group of banks. Borrowings will be made by the Portfolio solely to facilitate the handling of unusual and/or unanticipated short-term cash requirements. Interest is charged to each portfolio or fund based on its borrowings at an amount above the Eurodollar rate or federal funds rate. In addition, a fee computed at an annual rate of 0.10% on the daily unused portion of the line of credit is allocated among the participating portfolios and funds at the end of each quarter. The Portfolio did not have any significant borrowings or allocated fees during the year ended October 31, 2005.
4 Investment Transactions
The Portfolio invests primarily in foreign government and U.S. Government debt securities. The ability of the issuers of the debt securities to meet their obligations may be affected by economic developments in a specific industry or country. The Portfolio regularly invests in lower rated and comparable quality unrated high yield securities. These investments have different risks than investments in debt securities rated investment grade and held by the Portfolio. Risk of loss upon default by the borrower is significantly greater with respect to such debt securities than with other debt securities because these securities are generally unsecured and are more sensitive to adverse economic conditions, such as recession or increasing interest rates, than are investment grade issuers. At October 31, 2005, the Portfolio had invested approximately 4.71% of its net assets or approximately $19,333,000 in high yield securities. Purchases and sales of investments, other than short-term obligations, and including paydowns on mortgage backed securities, for the year ended October 31, 2005 were as follows:
| Purchases | |
| Investments (non-U.S. Government) | | $ | 121,253,570 | | |
| U.S. Government Securities | | | 215,204,375 | | |
| | | $ | 336,457,945 | | |
| Sales | |
| Investments (non-U.S. Government) | | $ | 103,355,783 | | |
| U.S. Government Securities | | | 70,923,014 | | |
| | | $ | 174,278,797 | | |
5 Financial Instruments
The Portfolio regularly trades in financial instruments with off-balance sheet risk in the normal course of its investing activities and to assist in managing exposure to various market risks. These financial instruments include written options, forward foreign currency contracts, financial futures contracts and swaps and may involve, to a varying degree, elements of risk in excess of the amounts recognized for financial statement purposes. The notional or contractual amounts of these instruments represent the investment the Portfolio has in particular classes of financial instruments and does not necessarily represent the amounts potentially subject to risk. The measurement of the risks associated with these instruments is meaningful only when all related and offsetting transactions are
26
Strategic Income Portfolio as of October 31, 2005
NOTES TO FINANCIAL STATEMENTS CONT'D
considered. A summary of obligations under these financial instruments at October 31, 2005 is as follows:
Forward Foreign Currency Exchange Contracts
| Sales | |
Settlement
Date(s) | | Deliver | | In Exchange For | | Net Unrealized
Appreciation
(Depreciation) | |
| 11/10/05 | | Euro
3,670,000 | | United States Dollar
4,422,350 | | 24,709 | |
| 11/14/05 | | Euro
4,220,000 | | United States Dollar
5,086,577 | | 28,797 | |
| 12/06/05 | | Euro
2,000,000 | | United States Dollar
2,492,798 | | 92,893 | |
| 11/08/05 | | Japanese Yen
1,050,000,000 | | United States Dollar
9,072,058 | | 45,724 | |
| 11/14/05 | | Japanese Yen
3,100,000,000 | | United States Dollar
26,909,722 | | 242,505 | |
| | | | | | | $ | 434,628 | | |
| Purchases | |
Settlement
Date(s) | | In Exchange For | | Deliver | | Net Unrealized
Appreciation
(Depreciation) | |
| 11/14/05 | | Icelandic Kroner
250,000,000 | | Euro
3,344,034 | | 84,785 | |
| 11/25/05 | | Icelandic Kroner
637,296,000 | | Euro
8,784,232 | | (119,998) | |
| 11/14/05 | | Indonesian Rupiah
113,000,000,000 | | United States Dollar
11,289,839 | | (135,313) | |
| 11/17/05 | | Indonesian Rupiah
120,000,000,000 | | United States Dollar
11,752,032 | | 82,676 | |
| 11/28/05 | | Korean Won
17,000,000,000 | | United States Dollar
16,241,521 | | 106,938 | |
| 11/02/05 | | Polish Zloty
38,300,000 | | Euro
9,559,227 | | (116,191) | |
| 11/14/05 | | Polish Zloty
49,434,800 | | Euro
12,599,348 | | (174,626) | |
| 11/30/05 | | Polish Zloty
8,998,014 | | Euro
2,296,056 | | (38,040) | |
| 11/14/05 | | Romanian Leu
14,452,000 | | United States Dollar
4,836,033 | | (102,713) | |
| 10/27/06 | | Romanian Leu
27,425,000 | | Euro
7,432,249 | | (104,775) | |
| 11/17/05 | | Singapore Dollar
18,550,000 | | United States Dollar
10,969,840 | | (24,023) | |
| 11/14/05 | | Slovakia Koruna
709,532,000 | | Euro
18,227,862 | | (71,218) | |
| 11/30/05 | | Slovakia Koruna
594,500,000 | | Euro
15,290,048 | | (86,909) | |
Settlement
Date(s) | | In Exchange For | | Deliver | | Net Unrealized
Appreciation
(Depreciation) | |
| 11/17/05 | | Taiwan Dollar
187,000,000 | | United States Dollar
5,592,774 | | (7,600) | |
| 11/17/05 | | Thai Baht
306,000,000 | | United States Dollar
7,472,527 | | 32,531 | |
| 11/28/05 | | Thai Baht
460,000,000 | | United States Dollar
11,267,606 | | 19,076 | |
| 11/14/05 | | Turkish Lira
7,035,600 | | United States Dollar
5,182,762 | | 2,487 | |
| 11/29/05 | | Turkish Lira
2,700,000 | | United States Dollar
1,964,494 | | 17,239 | |
| | | | | | | $ | (635,674 | ) | |
| Futures Contracts | |
Expiration
Date(s) | | Contracts | | Position | | Aggregate
Cost | | Value | | Net Unrealized
Appreciation
(Depreciation) | |
| 12/05 | | | 35 | Nikkei 225 | | Long | | $ | 2,205,000 | | | $ | 2,394,875 | | | $ | 189,875 | | |
| 12/05 | | | 36 | DAX Index | | Long | | | 5,317,112 | | | | 5,311,183 | | | | (5,929 | ) | |
| 12/05 | | 23 Japan
10 Year Bond | | Short | | | (27,573,128 | ) | | | (27,073,236 | ) | | | 499,892 | | |
| | | $ | 683,838 | | |
Descriptions of the underlying instruments to Futures Contracts: Nikkei 225: The Nikkei 225 Stock Average is a price-weighted average of 225 top-rated Japanese companies listed in the First Section of the Tokyo Stock Exchange. DAX Index: The German Stock Index is a total return index of 30 selected German blue chip stocks traded on the Frankfurt Stock Exchange. Japan 10 Year Bond: Japanese Government Bonds (JGB) having a maturity of 7 years or more but less than 11 years.
At October 31, 2005, the Portfolio had sufficient cash and/or securities to cover potential obligations arising from open futures and forward contracts, as well as margin requirements on open futures contracts.
Total Return Swaps
The Portfolio has entered into a total return swap agreement with Barclays Bank PLC whereby the Portfolio makes an initial payment of $2,510,118 to Barclays. In exchange, the Portfolio will receive a payment in Euros equal to the total return on 7,022,626 Romanian Leu based on the interest rate of 4.80% and the closing spot exchange rate between the Euro and the Romanian Leu at termination. The value of the contract, which terminates on December 6, 2005 is recorded as a payable for open swap contracts of $211,592 at October 31, 2005.
The Portfolio has entered into a total return swap agreement with Morgan Stanley and Co. International Limited whereby the Portfolio makes quarterly payments at a rate equal to the three-month LIBOR minus 2.50% on the notional amount of $5,000,000 plus the price depreciation of the MSCI Turkey Index on the same notional amount. In exchange, the Portfolio receives payments equal to the price appreciation of the MSCI Turkey Index on the same notional amount. The value of the contract, which terminates on May 18, 2006 is recorded as a receivable for open swap contracts of $389,594 at October 31, 2005.
27
Strategic Income Portfolio as of October 31, 2005
NOTES TO FINANCIAL STATEMENTS CONT'D
| Credit Default Swaps | |
Notional
Amount | | Expiration
Date | | Description | | Net Unrealized
Appreciation
(Depreciation) | |
| | 4,000,000 | USD | | 4/6/2009 | | Agreement with JP Morgan Chase Bank dated 4/6/2004 to pay 3.60% per year times the notional amount. In exchange for that periodic payment, upon a default event in Turkey, JP Morgan Chase Bank agrees to pay the Portfolio the notional amount of the swap. To receive that payment, the Portfolio must deliver a bond (with par value equal to the notional amount of the swap) issued by Turkey to JP Morgan Chase Bank. | | $(275,996) | |
|
| | 10,000,000 | USD | | 4/20/2010 | | Agreement with JP Morgan Chase Bank dated 4/1/2005 to pay 3.16% per year times the notional amount. In exchange for that periodic payment, upon a default event in Turkey, JP Morgan Chase Bank agrees to pay the Portfolio the notional amount of the swap. To receive that payment, the Portfolio must deliver a bond (with par value equal to the notional amount of the swap) issued by Turkey to JP Morgan Chase Bank. | | (539,089) | |
|
| | 5,000,000 | USD | | 4/6/2014 | | Agreement with Morgan Stanley Capital Services Inc. dated 4/6/2004 to pay 4.05% per year times the notional amount. In exchange for that periodic payment, upon a default event in Turkey, Morgan Stanley Capital Services Inc. agrees to pay the Portfolio the notional amount of the swap. To receive that payment, the Portfolio must deliver a bond (with par value equal to the notional amount of the swap) issued by Turkey to Morgan Stanley Capital Services Inc. | | (471,445) | |
|
| | 4,000,000 | USD | | 1/29/2009 | | Agreement with Morgan Stanley Capital Services Inc. dated 1/29/2004 to pay 3.40% per year times the notional amount. In exchange for that periodic payment, upon a default event in Turkey, Morgan Stanley Capital Services Inc. agrees to pay the Portfolio the notional amount of the swap. To receive that payment, the Portfolio must deliver a bond (with par value equal to the notional amount of the swap) issued by Turkey to Morgan Stanley Capital Services Inc. | | (248,181) | |
|
| | 50,000,000 | USD | | 6/20/2015 | | Agreement with Goldman Sachs Capital Markets L.P., dated 6/16/2005 to pay 0.29% per year times the notional amount. In exchange for that periodic payment, upon a default event in Greece, Goldman Sachs Capital Markets L.P. agrees to pay the Portfolio the notional amount of the swap. To receive that payment, the Portfolio must deliver a bond (with par value equal to the notional amount of the swap) issued by Greece to Goldman Sachs Capital Markets L.P. | | (255,281) | |
|
| | 30,000,000 | USD | | 6/20/2020 | | Agreement with Goldman Sachs Capital Markets L.P., dated 3/23/2005 to pay 0.20% per year times the notional amount. In exchange for that periodic payment, upon a default event in Greece, Goldman Sachs Capital Markets L.P. agrees to pay the Portfolio the notional amount of the swap. To receive that payment, the Portfolio must deliver a bond (with par value equal to the notional amount of the swap) issued by Greece to Goldman Sachs Capital Markets L.P. | | 109,211 | |
|
| | 20,000,000 | USD | | 6/20/2020 | | Agreement with Credit Suisse First Boston dated 3/23/2005 to pay 0.195% per year times the notional amount. In exchange for that periodic payment, upon a default event in Greece, Credit Suisse First Boston agrees to pay the Portfolio the notional amount of the swap. To receive that payment, the Portfolio must deliver a bond (with par value equal to the notional amount of the swap) issued by Greece to Credit Suisse First Boston. | | 83,126 | |
|
28
Strategic Income Portfolio as of October 31, 2005
NOTES TO FINANCIAL STATEMENTS CONT'D
6 Federal Income Tax Basis of Unrealized Appreciation (Depreciation)
The cost and unrealized appreciation (depreciation) in value of the investments at October 31, 2005, as computed on a federal income tax basis, were as follows:
| Aggregate cost | | $ | 465,198,118 | | |
| Gross unrealized appreciation | | $ | 8,108,633 | | |
| Gross unrealized depreciation | | | (15,711,919 | ) | |
| Net unrealized depreciation | | $ | (7,603,286 | ) | |
The net unrealized depreciation on foreign currency, swaps, forwards and futures contracts at October 31, 2005 on a federal income tax basis was $957,982.
29
Strategic Income Portfolio as of October 31, 2005
REPORT OF INDEPENDENT REGISTERED PUBLIC ACCOUNTING FIRM
To the Trustees and Investors
of Strategic Income Portfolio:
In our opinion, the accompanying statement of assets and liabilities, including the portfolio of investments, and the related statements of operations and of changes in net assets and the supplementary data present fairly, in all material respects, the financial position of Strategic Income Portfolio (the "Portfolio") at October 31, 2005, and the results of its operations, the changes in its net assets, and the supplementary data for each of the periods presented, in conformity with accounting principles generally accepted in the United States of America. These financial statements and supplementary data (hereafter referred to as "financial statements") are the responsibility of the Portfolio's management; our responsibility is to express an opinion on these financial statements based on our audits. We conducted our audits of these financial statements in accordance with standards of the Public Company Accounting Oversight Board (United States). Those standards require that we plan and perform the audit to obtain reasonable assurance about whether the financial statements are free of material misstatement. An audit includes examining, on a test basis, evidence supporting the amounts and disclosures in the financial statements, assessing the accounting principles used and significant estimates made by management, and evaluating the overall financial statement presentation. We believe that our audits, which included confirmation of securities at October 31, 2005 by correspondence with the custodian and brokers, provide a reasonable basis for our opinion.
PricewaterhouseCoopers LLP
Boston, Massachusetts
December 23, 2005
30
Eaton Vance Strategic Income Fund
BOARD OF TRUSTEES' ANNUAL APPROVAL OF THE INVESTMENT ADVISORY AGREEMENTS
The Eaton Vance Strategic Income Fund (the "Fund") is a fund of funds that may invest in five Portfolios: Strategic Income, Boston Income, Floating Rate, High Income and Investment Grade Income Portfolios (together, the "Portfolios"), for which Boston Management and Research serves as investment adviser. The Fund will invest primarily (over 50% of net assets) in Strategic Income Portfolio. The investment advisory agreements between the investment adviser and the Portfolios each provides that the advisory agreement will continue in effect from year to year so long as its continuance is approved at least annually (i) by a vote of a majority of the noninterested Trustees of the Portfolio cast in person at a meeting called for the purpose of voting on such approval and (ii) by the Trustees of the Portfolio or by vote of a majority of the outstanding interests of the Portfolio.
In considering the annual approval of the investment advisory agreements between the Portfolios and the investment adviser, the Special Committee of the Board of Trustees considered information that had been provided throughout the year at regular Board meetings, as well as information furnished for a series of meetings held in February and March in preparation for a Board meeting held on March 21, 2005 to specifically consider the renewal of the investment advisory agreements. Such information included, among other things, the following:
• An independent report comparing the advisory fees of each Portfolio with those of comparable funds;
• An independent report comparing the expense ratio of the Fund to those of comparable funds;
• Information regarding Fund investment performance (including on a risk-adjusted basis) in comparison to relevant peer groups of funds and appropriate indices;
• The economic outlook and the general investment outlook in relevant investment markets;
• Eaton Vance Management's ("Eaton Vance") results and financial condition and the overall organization of the investment adviser;
• The procedures and processes used to determine the fair value of Fund assets including in particular the valuation of senior loan portfolios and actions taken to monitor and test the effectiveness of such procedures and processes;
• Eaton Vance's management of the relationship with the custodian, subcustodians and fund accountants;
• The resources devoted to compliance efforts undertaken by Eaton Vance on behalf of the funds it manages and the record of compliance with the investment policies and restrictions and with policies on personal securities transactions;
• The quality, nature, cost and character of the administrative and other non-investment management services provided by Eaton Vance and its affiliates; and
• The terms of the advisory agreements and the reasonableness and appropriateness of the particular fee paid by each Portfolio for the services described therein.
The Special Committee also considered the investment adviser's portfolio management capabilities, including information relating to the education, experience, and number of investment professionals and other personnel who provide services under the investment advisory agreements. The Special Committee noted the benefits of the investment adviser's extensive in-house research capabilities and the other resources available to the investment adviser. In addition, for Boston Income Portfolio and High Income Portfolio, the Special Committee considered the investment adviser's high-yield portfolio management team, including portfolio managers who perform their own investment and credit analysis and analysts who evaluate issuers' financial resources, operating history and sensitivity to economic conditions. For the Floating Rate Portfolio, the Special Committee noted the experience of the 26 bank loan investment professionals and other personnel who would provide services under the Floating Rate Portfolio's investment advisory agreement, including four portfolio managers and 15 analysts. Many of these portfolio managers and analysts have previous experience working for commercial banks and other lending institutions. The Special Committee also took into account the time and attention to be devoted by senior management to the Portfolios and the other funds in the complex. The Special Committee evaluated the level of skill required to manage the Portfolios and concluded that the human resources available at the investment adviser were appropriate to fulfill its duties on behalf of the Portfolios.
In its review of comparative information with respect to the Fund's investment performance (including on a risk-adjusted basis) the Special Committee concluded that the Fund has performed within a range that the Special Committee deemed competitive. With respect to its review of investment advisory fees, the Special Committee concluded that the fees paid by each Portfolio are within the
31
Eaton Vance Strategic Income Fund
BOARD OF TRUSTEES' ANNUAL APPROVAL OF THE INVESTMENT ADVISORY AGREEMENTS CONT'D
range of those paid by comparable funds within the mutual fund industry. In reviewing the information regarding the expense ratio of the Fund, the Special Committee concluded that the Fund's expense ratio is within a range that is competitive with comparable funds.
In addition to the factors mentioned above, the Special Committee reviewed the level of the investment adviser's profits in providing investment management services for the Portfolios and for all Eaton Vance funds as a group. The Special Committee also reviewed the benefits to Eaton Vance and its affiliates in providing administration services for the Fund and for all Eaton Vance funds as a group. In addition, the Special Committee considered the fiduciary duty assumed by the investment adviser in connection with the services rendered to the Fund and Portfolios and the business reputation of the investment adviser and its financial resources. The Trustees concluded that in light of the services rendered, the profits realized by the investment adviser are not unreasonable. The Special Committee also considered the extent to which the investment adviser appears to be realizing benefits from managing each of the Strategic Income Po rtfolio, Floating Rate Portfolio and Investment Grade Income Portfolio, and concluded that the fee breakpoints which are in place will allow for an equitable sharing of such benefits, when realized, with such Portfolios and the shareholders of the Fund.
The Special Committee did not consider any single factor as controlling in determining whether or not to renew the investment advisory agreements. Nor are the items described herein all the matters considered by the Special Committee. In assessing the information provided by Eaton Vance and its affiliates, the Special Committee also took into consideration the benefits to shareholders of investing in a fund that is a part of a large family of funds which provides a large variety of shareholder services.
Based on its consideration of the foregoing factors and conclusions, and such other factors and conclusions as it deemed relevant, and assisted by independent counsel, the Special Committee concluded that the renewal of the investment advisory agreements, including the fee structures, is in the interests of shareholders.
32
Eaton Vance Strategic Income Fund
MANAGEMENT AND ORGANIZATION
Fund Management. The Trustees of Eaton Vance Mutual Funds Trust (the Trust), Boston Income Portfolio (BIP), Floating Rate Portfolio (FRP), High Income Portfolio (HIP), Investment Grade Income Portfolio (IGIP) and Strategic Income Portfolio (SIP) (the Portfolios) are responsible for the overall management and supervision of the Trust's and Portfolios' affairs. The Trustees and officers of the Trust and the Portfolios are listed below. Except as indicated, each individual has held the office shown or other offices in the same company for the last five years. Trustees and officers of the Trust and the Portfolios hold indefinite terms of office. The "noninterested Trustees" consist of those Trustees who are not "interested persons" of the Trust and the Portfolios, as that term is defined under the 1940 Act. The business address of each Trustee and officer is The Eaton Vance Building, 255 State Street, Boston, Massachusetts 02109. As used below, "EVC" refers to Eaton Vance Corp., "EV" refers to Eaton Vance, Inc., "EVM" refers to Eaton Vance Management, "BMR" refers to Boston Management and Research and "EVD" refers to Eaton Vance Distributors, Inc. EVC and EV are the corporate parent and trustee, respectively, of EVM and BMR. EVD is the Fund's principal underwriter, the Portfolios' placement agent and a wholly-owned subsidiary of EVM. Each officer affiliated with Eaton Vance may hold a position with other Eaton Vance affiliates that is comparable to its position with EVM listed below.
Name and
Date of Birth | | Position(s)
with the
Trust and
the Portfolios | | Term of
Office and
Length of
Service | | Principal Occupation(s)
During Past Five Years | | Number of Portfolios
in Fund Complex
Overseen By
Trustee(1) | | Other Directorships Held | |
| Interested Trustee | | | | | | | | | | | | | |
|
James B. Hawkes
11/9/41 | | Trustee | | Trustee of the Trust since 1991; of HIP and SIP since 1992; of FRP and IGIP since 2000 and BIP since 2001 | | Chairman, President and Chief Executive Officer of BMR, EVC, EVM and EV; Director of EV; Vice President and Director of EVD. Trustee and/or officer of 161 registered investment companies in the Eaton Vance Fund Complex. Mr. Hawkes is an interested person because of his positions with BMR, EVM, EVC and EV, which are affiliates of the Trust and the Portfolios. | | | 161 | | | Director of EVC | |
|
| Noninterested Trustee(s) | | | | | | | | | | | | | |
|
Benjamin C. Esty
1/2/63 | | Trustee | | Since 2005 | | Professor, Harvard University Graduate School of Business Administration (since 2003). Formerly, Associate Professor, Harvard University Graduate School of Business Administration (2000-2003). | | | 152 | | | None | |
|
Samuel L. Hayes, III
2/23/35 | | Trustee | | Trustee of the Trust since 1986; of HIP and SIP since 1993; of FRP and IGIP since 2000; of BIP since 2001 and Chairman of the Board since 2005 | | Jacob H. Schiff Professor of Investment Banking Emeritus, Harvard University Graduate School of Business Administration. Director of Yakima Products, Inc. (manufacturer of automotive accessories) (since 2001) and Director of Telect, Inc. (telecommunication services company) (since 2000). | | | 161 | | | Director of Tiffany & Co. (specialty retailer) | |
|
William H. Park
9/19/47 | | Trustee | | Since 2003 | | President and Chief Executive Officer, Prizm Capital Management, LLC (investment management firm) (since 2002). Formerly, Executive Vice President and Chief Financial Officer, United Asset Management Corporation (a holding company owning institutional investment management firms) (1982-2001). | | | 161 | | | None | |
|
Ronald A. Pearlman
7/10/40 | | Trustee | | Since 2003 | | Professor of Law, Georgetown University Law Center (since 1999). Tax Partner Covington & Burling, Washington, DC (1991-2000). | | | 161 | | | None | |
|
33
Eaton Vance Strategic Income Fund
MANAGEMENT AND ORGANIZATION CONT'D
Name and
Date of Birth | | Position(s)
with the
Trust and
the Portfolios | | Term of
Office and
Length of
Service | | Principal Occupation(s)
During Past Five Years | | Number of Portfolios
in Fund Complex
Overseen By
Trustee(1) | | Other Directorships Held | |
| Noninterested Trustee(s) (continued) | | | | | | | | | | | | | |
|
Norton H. Reamer
9/21/35 | | Trustee | | Trustee of the Trust since 1986; of HIP and SIP since 1993; of FRP and IGIP since 2000 and BIP since 2001 | | President, Chief Executive Officer and a Director of Asset Management Finance Corp. (a specialty finance company serving the investment management industry) (since October 2003). President, Unicorn Corporation (an investment and financial advisory services company) (since September 2000). Formerly, Chairman, Hellman, Jordan Management Co., Inc. (an investment management company) (2000-2003). Formerly, Advisory Director of Berkshire Capital Corporation (investment banking firm) (2002-2003). Formerly Chairman of the Board, United Asset Management Corporation (a holding company owning institutional investment management firms) and Chairman, President and Director, UAM Funds (mutual funds) (1980-2000). | | | 161 | | | None | |
|
Lynn A. Stout
9/14/57 | | Trustee | | Trustee of the Trust, HIP and SIP since 1998; of FRP and IGIP since 2000 and of BIP since 2001 | | Professor of Law, University of California at Los Angeles School of Law (since July 2001). Formerly, Professor of Law, Georgetown University Law Center. | | | 161 | | | None | |
|
Ralph F. Verni
1/26/43 | | Trustee | | Since 2005 | | Consultant and private investor (since 2000). Formerly, President and Chief Executive Officer, Redwood Investment Systems, Inc. (software developer) (2000). Formerly, President and Chief Executive Officer, State Street Research & Management (investment advisor), SSRM Holdings (parent of State Street Research & Management), and SSR Realty (institutional realty manager) (1992-2000). | | | 152 | | | Director of W.P. Carey & Company LLC (manager of real estate investment trusts) | |
|
| Principal Officers who are not Trustees | | | | | | | |
|
Name and
Date of Birth | | Position(s)
with the
Trust and
the Portfolios | | Term of
Office and
Length of
Service | | Principal Occupation(s)
During Past Five Years | |
Thomas E. Faust Jr.
5/31/58 | | President of the Trust | | Since 2002 | | Executive Vice President of EVM, BMR, EVC and EV; Chief Investment Officer of EVM and BMR and Director of EVC. Chief Executive Officer of Belair Capital Fund LLC, Belcrest Capital Fund LLC, Belmar Capital Fund LLC, Belport Capital Fund LLC and Belrose Capital Fund LLC (private investment companies sponsored by EVM). Officer of 65 registered investment companies managed by EVM or BMR. | |
|
William H. Ahern, Jr.
7/28/59 | | Vice President of the Trust | | Since 1995 | | Vice President of EVM and BMR. Officer of 70 registered investment companies managed by EVM or BMR. | |
|
Cynthia J. Clemson
3/2/63 | | Vice President of the Trust | | Since 2005 | | Vice President of EVM and BMR. Officer of 85 registered investment companies managed by EVM or BMR. | |
|
Kevin S. Dyer
2/21/75 | | Vice President of the Trust | | Since 2005 | | Assistant Vice President of EVM and BMR. Officer of 24 registered investment companies managed by EVM or BMR. | |
|
Thomas P. Huggins
3/7/66 | | Vice President of BIP and HIP | | Vice President of HIP since 2000; of BIP since 2001 | | Vice President of EVM and BMR. Officer of 4 registered investment companies managed by EVM or BMR. | |
|
Elizabeth S. Kenyon
9/8/59 | | President of IGIP | | Since 2002(2) | | Vice President of EVM and BMR. Officer of 2 registered investment companies managed by EVM or BMR. | |
|
34
Eaton Vance Strategic Income Fund
MANAGEMENT AND ORGANIZATION CONT'D
Name and
Date of Birth | | Position(s)
with the
Trust and
the Portfolios | | Term of
Office and
Length of
Service | | Principal Occupation(s)
During Past Five Years | |
| Principal Officers who are not Trustees (continued) | | | | | | | |
|
Aamer Khan
6/7/60 | | Vice President of the Trust | | Since 2005 | | Vice President of EVM and BMR. Officer of 27 registered investment companies managed by EVM or BMR. | |
|
Thomas H. Luster
4/8/62 | | Vice President of IGIP | | Since 2002 | | Vice President of EVM and BMR. Officer of 16 registered investment companies managed by EVM or BMR. | |
|
Michael R. Mach
7/15/47 | | Vice President of the Trust | | Since 1999 | | Vice President of EVM and BMR. Officer of 32 registered investment companies managed by EVM or BMR. | |
|
Robert B. MacIntosh
1/22/57 | | Vice President of the Trust | | Since 1998 | | Vice President of EVM and BMR. Officer of 85 registered investment companies managed by EVM or BMR. | |
|
Scott H. Page
11/30/59 | | Vice President of FRP | | Since 2000 | | Vice President of EVM and BMR. Officer of 14 registered investment companies managed by EVM or BMR. | |
|
Duncan W. Richardson
10/26/57 | | Vice President of the Trust | | Since 2001 | | Senior Vice President and Chief Equity Investment Officer of EVM and BMR. Officer of 51 registered investment companies managed by EVM or BMR. | |
|
Walter A. Row, III
7/20/57 | | Vice President of the Trust | | Since 2001 | | Director of Equity Research and a Vice President of EVM and BMR. Officer of 31 registered investment companies managed by EVM or BMR. | |
|
Judith A. Saryan
8/21/54 | | Vice President of the Trust | | Since 2003 | | Vice President of EVM and BMR. Officer of 33 registered investment companies managed by EVM or BMR. | |
|
Susan Schiff
3/13/61 | | Vice President of the Trust and SIP | | Since 2002 | | Vice President of EVM and BMR. Officer of 29 registered investment companies managed by EVM or BMR. | |
|
Payson F. Swaffield
8/13/56 | | President of FRP | | Since 2002(2) | | Vice President of EVM and BMR. Officer of 14 registered investment companies managed by EVM or BMR. | |
|
Mark S. Venezia
5/23/49 | | President of Strategic Income Portfolio | | Since 2002(2) | | Vice President of EVM and BMR. Officer of 5 registered investment companies managed by EVM or BMR. | |
|
Michael W. Weilheimer
2/11/61 | | President of BIP and HIP | | Since 2002(2) | | Vice President of EVM and BMR. Officer of 9 registered investment companies managed by EVM or BMR. | |
|
William J. Austin, Jr.
12/27/51 | | Treasurer of IGIP | | Since 2002(2) | | Vice President of EVM and BMR. Officer of 45 registered investment companies managed by EVM or BMR. | |
|
Barbara E. Campbell
6/19/57 | | Treasurer of the Trust and BIP, FRP, HIP and SIP | | Treasurer of the Trust since 2005(2); of the Portfolios since 2002(2) | | Vice President of EVM and BMR. Officer of 161 registered investment companies managed by EVM or BMR. | |
|
Alan R. Dynner
10/10/40 | | Secretary | | Since 1997 | | Vice President, Secretary and Chief Legal Officer of BMR, EVM, EVD, EV and EVC. Officer of 161 registered investment companies managed by EVM or BMR. | |
|
Paul M. O'Neil
7/11/53 | | Chief Compliance Officer | | Since 2004 | | Vice President of EVM and BMR. Officer of 161 registered investment companies managed by EVM or BMR. | |
|
(1) Includes both master and feeder funds in a master-feeder structure.
(2) Prior to 2002, Ms. Kenyon served as Vice President of IGIP since 2001, Mr. Swaffield served as Vice President of FRP since 2000, Mr. Venezia served as Vice President of SIP since 1992, Mr. Weilheimer served as Vice President of BIP since 2001 and HIP since 1995, Mr. Austin served as Assistant Treasurer of IGIP since 2000 and Ms. Campbell served as Assistant Treasurer of BIP since 2001, FRP since 2000, HIP since 1993 and SIP since 1998. Prior to 2005, Ms. Campbell served as Assistant Treasurer of the Trust since 1995.
The SAI for the Fund includes additional information about the Trustees and officers of the Fund and the Portfolios and can be obtained without charge by calling 1-800-225-6265.
35
This Page Intentionally Left Blank
This Page Intentionally Left Blank
Investment Adviser of Strategic Income Portfolio
Boston Management and Research
The Eaton Vance Building
255 State Street
Boston, MA 02109
Administrator of Eaton Vance Strategic Income Fund
Eaton Vance Management
The Eaton Vance Building
255 State Street
Boston, MA 02109
Principal Underwriter
Eaton Vance Distributors, Inc.
The Eaton Vance Building
255 State Street
Boston, MA 02109
(617) 482-8260
Custodian
Investors Bank & Trust Company
200 Clarendon Street
Boston, MA 02116
Transfer and Dividend Disbursing Agent
PFPC Inc.
Attn: Eaton Vance Funds
P.O. Box 9653
Providence, RI 02940-9653
(800) 262-1122
Independent Registered Public Accounting Firm
PricewaterhouseCoopers, LLP
125 High Street
Boston, MA 02110
Eaton Vance Strategic Income Fund
The Eaton Vance Building
255 State Street
Boston, MA 02109
This report must be preceded or accompanied by a current prospectus. Before investing, investors should consider carefully the Fund's investment
objective(s), risks, and charges and expenses. The Fund's current prospectus contains this and other information about the Fund and is available
through your financial advisor. Please read the prospectus carefully before you invest or send money. For further information please call 1-800-225-6265.
028-12/05 SISRC

Annual Report October 31, 2005


EATON VANCE
TAX-MANAGED
INTERNATIONAL
EQUITY
FUND
IMPORTANT NOTICES REGARDING PRIVACY,
DELIVERY OF SHAREHOLDER DOCUMENTS,
PORTFOLIO HOLDINGS AND PROXY VOTING
Privacy. The Eaton Vance organization is committed to ensuring your financial privacy. Each of the financial institutions identified below has in effect the following policy ("Privacy Policy") with respect to nonpublic personal information about its customers:
• Only such information received from you, through application forms or otherwise, and information about your Eaton Vance fund transactions will be collected. This may include information such as name, address, social security number, tax status, account balances and transactions.
• None of such information about you (or former customers) will be disclosed to anyone, except as permitted by law (which includes disclosure to employees necessary to service your account). In the normal course of servicing a customer's account, Eaton Vance may share information with unaffiliated third parties that perform various required services such as transfer agents, custodians and broker/dealers.
• Policies and procedures (including physical, electronic and procedural safeguards) are in place that are designed to protect the confidentiality of such information.
• We reserve the right to change our Privacy Policy at any time upon proper notification to you. Customers may want to review our Policy periodically for changes by accessing the link on our homepage: www.eatonvance.com.
Our pledge of privacy applies to the following entities within the Eaton Vance organization: the Eaton Vance Family of Funds, Eaton Vance Management, Eaton Vance Investment Counsel, Boston Management and Research, and Eaton Vance Distributors, Inc.
In addition, our Privacy Policy only applies to those Eaton Vance customers who are individuals and who have a direct relationship with us. If a customer's account (i.e. fund shares) is held in the name of a third-party financial adviser/ broker-dealer, it is likely that only such adviser's privacy policies apply to the customer. This notice supersedes all previously issued privacy disclosures.
For more information about Eaton Vance's Privacy Policy, please call 1-800-262-1122.
Delivery of Shareholder Documents. The Securities and Exchange Commission (the "SEC") permits funds to deliver only one copy of shareholder documents, including prospectuses, proxy statements and shareholder reports, to fund investors with multiple accounts at the same residential or post office box address. This practice is often called "householding" and it helps eliminate duplicate mailings to shareholders.
Eaton Vance, or your financial adviser, may household the mailing of your documents indefinitely unless you instruct Eaton Vance, or your financial adviser, otherwise.
If you would prefer that your Eaton Vance documents not be householded, please contact Eaton Vance at 1-800-262-1122, or contact your financial adviser.
Your instructions that householding not apply to delivery of your Eaton Vance documents will be effective within 30 days of receipt by Eaton Vance or your financial adviser.
Portfolio Holdings. Each Eaton Vance Fund and its underlying Portfolio (if applicable) will file a schedule of its portfolio holdings on Form N-Q with the SEC for the first and third quarters of each fiscal year. The Form N-Q will be available on the Eaton Vance website www.eatonvance.com, by calling Eaton Vance at 1-800-262-1122 or in the EDGAR database on the SEC's website at www.sec.gov. Form N-Q may also be reviewed and copied at the SEC's public reference room in Washington, D.C. (call 1-800-732-0330 for information on the operation of the public reference room).
Proxy Voting. From time to time, funds are required to vote proxies related to the securities held by the funds. The Eaton Vance Funds or their underlying Portfolios (if applicable) vote proxies according to a set of policies and procedures approved by the Funds' and Portfolios' Boards. You may obtain a description of these policies and procedures and information on how the Funds or Portfolios voted proxies relating to Portfolio securities during the most recent 12 month period ended June 30, without charge, upon request, by calling 1-800-262-1122. This description is also available on the SEC's website at www.sec.gov.
Eaton Vance Tax-Managed International Equity Fund as of October 31, 2005
MANAGEMENT’S DISCUSSION OF FUND PERFORMANCE

Edward R. Allen, III
Eagle Global Advisors
Portfolio Manager

Thomas N. Hunt, III
Eagle Global Advisors
Portfolio Manager
The Fund
Performance for the Past Year
• For the year ended October 31, 2005, the Fund’s Class A shares had a total return of 22.46%. This return was the result of an increase in net asset value (NAV) per share to $8.67 on October 31, 2005, from $7.08 on October 31, 2004.(1)
• The Fund’s Class B shares had a total return of 21.56% for the same period, the result of an increase in NAV per share to $8.23 from $6.77.(1)
• The Fund’s Class C shares had a total return of 21.60% for the same period, the result of an increase in NAV per share to $8.22 from $6.76.(1)
• For comparison, the Fund’s benchmark, the Morgan Stanley Capital International Europe, Australasia, and Far East Index (EAFE) — a broad-based, unmanaged market index of international stocks – had a total return of 18.09% for the 12-month period.(2)
See pages 4 and 5 for more performance information, including after-tax returns.
Management Discussion
• During the 12 months ended October 31, 2005, the international investment environment was positive, but mixed. A late 2004 rally, spurred by lower oil prices and stabilizing economic conditions, gave way to market consolidation through June, followed by a mild improvement through the end of the fiscal year. Overall, European and Asian markets outperformed their U.S. counterparts during the 12-month time frame, in spite of a strong U.S. dollar rally during this period that detracted from the performance of international markets. In April of 2005, international markets sold off, as oil and commodity prices came in sharply. This proved to be a buying opportunity, as prices rebounded to post new highs.
• For the 12 months ended October 31, 2005, the Fund had positive returns, outperforming the benchmark index. The Portfolio’s overweighting of strong-performing sectors, such as energy and industrials, and our decision to underweight consumer discretionary and information technology added to performance. Additionally, the Portfolio’s small exposure to emerging markets also aided in the Fund’s outperformance of the benchmark. The Fund’s performance was affected by the Portfolio’s market capitalization and style focus: in an environment in which the value style of investing generally outperformed the growth style, and small-capitalization companies generally outperformed large-cap companies, the Portfolio’s emphasis on large-cap growth stocks dampened returns somewhat.
• Individual stock selection made positive contributions to Fund returns over the period. Stocks adding relative value were found in consumer staples, industrials, energy, and materials.
• Management added a number of new holdings during the period, including a major Japanese supermarket retailer, a U.K. tobacco company, and a Mexican discount retailer. In keeping with the Portfolio’s tax-management strategies, we endeavor to purchase stocks primarily from a long-term perspective, emphasizing capital appreciation and dividends that qualify for federal income taxation at long-term capital gains rates.
The views expressed throughout this report are those of the portfolio managers and are current only through the end of the period of the report as stated on the cover. These views are subject to change at any time based upon market or other conditions, and the investment adviser disclaims any responsibility to update such views. These views may not be relied on as investment advice and, because investment decisions for a fund are based on many factors, may not be relied on as an indication of trading intent on behalf of any Eaton Vance fund.
Past performance is no guarantee of future results. Returns are historical and are calculated by determining the percentage change in net asset value or offering price (as applicable) with all distributions reinvested. Investment return and principal value will fluctuate so that shares, when redeemed, may be worth more or less than their original cost. Performance is for stated time period only; due to market volatility, the Fund’s current performance may be lower or higher than the quoted return. Fund performance during certain periods reflects the strong stock market performance and/or the strong performance of stocks held during those periods. This performance is not typical and may not be repeated. For performance as of the most recent month end, please refer to www.eatonvance.com.
(1) These returns do not include the 5.75% maximum sales charge for Class A shares or the applicable contingent deferred sales charge (CDSC) for Class B and Class C shares. Class A shares are subject to a 1% redemption fee if redeemed or exchanged within three months of settlement of purchase. If sales charges were deducted, returns would be lower.
(2) It is not possible to invest directly in an Index. The Index’s total return does not reflect commissions or expenses that would have been incurred if an investor individually purchased or sold the securities represented in the Index.
Fund shares are not insured by the FDIC and are not deposits or other obligations of, or guaranteed by, any depository institution. Shares are subject to investment risks, including possible loss of principal invested.
2
Eaton Vance Tax-Managed International Equity Fund as of October 31, 2005
FUND PERFORMANCE
Global Allocation*
By net assets

* Portfolio information may not be representative of the Portfolio’s current or future investments and may change due to active management.
Ten Largest Holdings**
By net assets
Total SA | | 3.8 | % |
Mitsubishi Corp. | | 3.7 | |
Mitsubishi Tokyo Financial Group | | 3.1 | |
Roche Holding AG | | 2.9 | |
Komatsu, Ltd. | | 2.4 | |
Keppel Corp., Ltd. | | 2.4 | |
Rio Tinto, Ltd. | | 2.3 | |
UBS AG | | 2.2 | |
Stolt Offshore SA | | 2.1 | |
Canon, Inc. | | 2.0 | |
** Ten Largest Holdings represented 26.9% of Portfolio net assets as of October 31, 2005. Holdings are subject to change due to active management.
3
The line graphs and table set forth below provide information about the Fund’s performance. The line graphs compare the performance of Class A, Class B, and Class C of the Fund with that of the Morgan Stanley Capital International Europe, Australasia, and Far East (EAFE) Index, a broad-based, unmanaged market index of international stocks. The lines on the graphs represent the total returns of a hypothetical investment of $10,000 in each of Class A, Class B, Class C, and the MSCI EAFE Index. Class A total returns are presented at net asset value and maximum public offering price. The table includes the total returns of each Class of the Fund at net asset value and public offering price. The performance presented below does not reflect the deduction of taxes, if any, that a shareholder would pay on distributions or redemptions of Fund shares.
Performance* | | Class A | | Class B | | Class C | |
Average Annual Total Returns (at net asset value) | | | | | | | |
One Year | | 22.46 | % | 21.56 | % | 21.60 | % |
Five Years | | -6.37 | % | -7.08 | % | -7.07 | % |
Life of Fund† | | -1.79 | % | -2.53 | % | -2.55 | % |
SEC Average Annual Total Returns (including sales charge or applicable CDSC) | | | | | | | |
One Year | | 15.45 | % | 16.56 | % | 20.60 | % |
Five Years | | -7.48 | % | -7.45 | % | -7.07 | % |
Life of Fund† | | -2.56 | % | -2.53 | % | -2.55 | % |
† Inception Dates – Class A: 4/22/98; Class B: 4/22/98; Class C: 4/22/98
* Average annual total returns do not include the 5.75% maximum sales charge for Class A shares or the applicable contingent deferred sales charge (CDSC) for Class B and Class C shares. If sales charges were deducted, returns would be lower. Class A shares are subject to a 1% redemption fee if redeemed or exchanged within three months of settlement of purchase. SEC average annual total returns for Class A reflect the maximum 5.75% sales charge. SEC returns for Class B shares reflect the applicable CDSC based on the following schedule: 5% - 1st and 2nd years; 4% - 3rd year; 3% - 4th year; 2% - 5th year; 1% - 6th year. SEC 1-year return for Class C reflects a 1% CDSC.
Past performance is no guarantee of future results. Returns are historical and are calculated by determining the percentage change in net asset value or offering price (as applicable) with all distributions reinvested. Investment return and principal value will fluctuate so that shares, when redeemed, may be worth more or less than their original cost. Performance is for stated time period only; due to market volatility, the Fund’s current performance may be lower or higher than the quoted return. Fund performance during certain periods reflects the strong stock market performance and/or the strong performance of stocks held during those periods. This performance is not typical and may not be repeated. For performance as of the most recent month end, please refer to www.eatonvance.com.
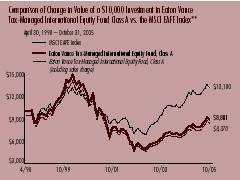
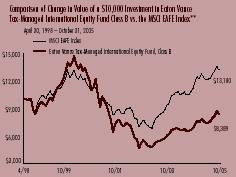
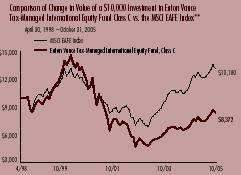
** Source: Thomson Financial. Investment operations commenced 4/22/98. It is not possible to invest directly in an Index. The Index’s total returns do not reflect commissions or expenses that would have been incurred if an investor individually purchased or sold the securities represented in the Index.
4
“Return Before Taxes” does not take into consideration shareholder taxes. It is most relevant to tax-free or tax-deferred shareholder accounts. “Return After Taxes on Distributions” reflects the impact of federal income taxes due on Fund distributions of dividends and capital gains. It is most relevant to taxpaying shareholders who continue to hold their shares. “Return After Taxes on Distributions and Sale of Fund Shares” also reflects the impact of taxes on capital gain or loss realized upon a sale of shares. It is most relevant to taxpaying shareholders who sell their shares.
Average Annual Total Returns
(For the periods ended October 31, 2005)
Returns at Net Asset Value (NAV) (Class A)
| | One Year | | Five Years | | Life of Fund | |
Return Before Taxes | | 22.46 | % | -6.37 | % | -1.79 | % |
Return After Taxes on Distributions | | 22.65 | % | -6.27 | % | -1.71 | % |
Return After Taxes on Distributions and Sale of Fund Shares | | 14.79 | % | -5.20 | % | -1.41 | % |
Returns at Public Offering Price (POP) (Class A)
| | One Year | | Five Years | | Life of Fund | |
Return Before Taxes | | 15.45 | % | -7.48 | % | -2.56 | % |
Return After Taxes on Distributions | | 15.63 | % | -7.38 | % | -2.47 | % |
Return After Taxes on Distributions and Sale of Fund Shares | | 10.22 | % | -6.10 | % | -2.05 | % |
Average Annual Total Returns
(For the periods ended October 31, 2005)
Returns at Net Asset Value (NAV) (Class C)
| | One Year | | Five Years | | Life of Fund | |
Return Before Taxes | | 21.60 | % | -7.07 | % | -2.55 | % |
Return After Taxes on Distributions | | 21.80 | % | -6.95 | % | -2.47 | % |
Return After Taxes on Distributions and Sale of Fund Shares | | 14.24 | % | -5.75 | % | -2.06 | % |
Returns at Public Offering Price (POP) (Class C)
| | One Year | | Five Years | | Life of Fund | |
Return Before Taxes | | 20.60 | % | -7.07 | % | -2.55 | % |
Return After Taxes on Distributions | | 20.80 | % | -6.95 | % | -2.47 | % |
Return After Taxes on Distributions and Sale of Fund Shares | | 13.59 | % | -5.75 | % | -2.06 | % |
Average Annual Total Returns
(For the periods ended October 31, 2005)
Returns at Net Asset Value (NAV) (Class B)
| | One Year | | Five Years | | Life of Fund | |
Return Before Taxes | | 21.56 | % | -7.08 | % | -2.53 | % |
Return After Taxes on Distributions | | 21.77 | % | -6.96 | % | -2.45 | % |
Return After Taxes on Distributions and Sale of Fund Shares | | 14.22 | % | -5.76 | % | -2.04 | % |
Returns at Public Offering Price (POP) (Class B)
| | One Year | | Five Years | | Life of Fund | |
Return Before Taxes | | 16.56 | % | -7.45 | % | -2.53 | % |
Return After Taxes on Distributions | | 16.77 | % | -7.33 | % | -2.45 | % |
Return After Taxes on Distributions and Sale of Fund Shares | | 10.97 | % | -6.06 | % | -2.04 | % |
Class A, Class B, and Class C of the Fund commenced investment operations on 4/22/98. Returns at Public Offering Price (POP) reflect the deduction of the maximum initial sales charge and applicable CDSC, while Returns at Net Asset Value (NAV) do not.
After-tax returns are calculated using the highest historical individual federal income tax rate and do not reflect the impact of state and local taxes. Actual after-tax returns depend on a shareholder’s tax situation and may differ from those shown. After-tax returns are not relevant for shareholders who hold shares in tax-deferred accounts or to shares held by non-taxable entities. Return After Taxes on Distributions for a period may be the same as Return Before Taxes for that period because no distributions were paid during that period, or because the taxable portion of distributions made during the period was insignificant. Also, Return After Taxes on Distributions and Sale of Fund Shares for a period may be greater than Return After Taxes on Distributions for the same period because of realized losses on the sale of Fund shares. The Fund’s after-tax returns also may reflect foreign tax credits passed by the Fund to its shareholders.
Past performance is no guarantee of future results. Returns are historical and are calculated by determining the percentage change in net asset value or offering price (as applicable) with all distributions reinvested. Investment return and principal value will fluctuate so that shares, when redeemed, may be worth more or less than their original cost. Performance is for the stated time period only; due to market volatility, the Fund’s current performance may be lower or higher than the quoted return. Fund performance during certain periods reflects the strong stock market performance and/or the strong performance of stocks held during those periods. This performance is not typical and may not be repeated. For performance as of the most recent month-end, please refer to www.eatonvance.com.
5
Eaton Vance Tax-Managed International Equity Fund as of October 31, 2005
FUND EXPENSES
Example: As a shareholder of the Fund, you incur two types of costs: (1) transaction costs, including sales charges (loads) on purchases and redemption fees (if applicable); and (2) ongoing costs, including management fees; distribution or service fees; and other Fund expenses. This Example is intended to help you understand your ongoing costs (in dollars) of investing in the Fund and to compare these costs with the ongoing costs of investing in other mutual funds. The Example is based on an investment of $1,000 invested at the beginning of the period and held for the entire period (May 1, 2005 – October 31, 2005).
Actual Expenses: The first section of the table below provides information about actual account values and actual expenses. You may use the information in this line, together with the amount you invested, to estimate the expenses that you paid over the period. Simply divide your account value by $1,000 (for example, an $8,600 account value divided by $1,000 = 8.6), then multiply the result by the number in the first line under the heading entitled “Expenses Paid During Period” to estimate the expenses you paid on your account during this period.
Hypothetical Example for Comparison Purposes: The second section of the table below provides information about hypothetical account values and hypothetical expenses based on the actual Fund expense ratio and an assumed rate of return of 5% per year (before expenses), which is not the actual return of the Fund. The hypothetical account values and expenses may not be used to estimate the actual ending account balance or expenses you paid for the period. You may use this information to compare the ongoing costs of investing in your Fund and other funds. To do so, compare this 5% hypothetical example with the 5% hypothetical examples that appear in the shareholder reports of the other funds.
Please note that the expenses shown in the table are meant to highlight your ongoing costs only and do not reflect any transactional costs, such as sales charges (loads) or redemption fees (if applicable). Therefore, the second section of the table is useful in comparing ongoing costs only, and will not help you determine the relative total costs of owning different funds. In addition, if these transactional costs were included, your costs would have been higher.
Eaton Vance Tax-Managed International Equity Fund
| | Beginning Account Value | | Ending Account Value | | Expenses Paid During Period* | |
| | (5/1/05) | | (10/31/05) | | (5/1/05 – 10/31/05) | |
| | | | | | | |
Actual | | | | | | | |
Class A | | $ | 1,000.00 | | $ | 1,131.80 | | $ | 9.99 | |
Class B | | $ | 1,000.00 | | $ | 1,128.90 | | $ | 14.01 | |
Class C | | $ | 1,000.00 | | $ | 1,127.60 | | $ | 14.00 | |
| | | | | | | |
Hypothetical | | | | | | | |
(5% return per year before expenses) | | | | | | | |
Class A | | $ | 1,000.00 | | $ | 1,015.80 | | $ | 9.45 | |
Class B | | $ | 1,000.00 | | $ | 1,012.00 | | $ | 13.24 | |
Class C | | $ | 1,000.00 | | $ | 1,012.00 | | $ | 13.24 | |
* Expenses are equal to the Fund’s annualized expense ratio of 1.86% for Class A shares, 2.61% for Class B shares, and 2.61% for Class C shares, multiplied by the average account value over the period, multiplied by 184/365 (to reflect the one-half year period). The example assumes that the $1,000 was invested at the net asset value per share determined at the close of business on April 30, 2005. The Example reflects the expenses of both the Fund and the Portfolio.
6
Eaton Vance Tax-Managed International Equity Fund as of October 31, 2005
FINANCIAL STATEMENTS
Statement of Assets and Liabilities
As of October 31, 2005
| Assets | |
Investment in Tax-Managed International Equity Portfolio, at value
(identified cost, $52,914,375) | | $ | 76,110,988 | | |
| Receivable for Fund shares sold | | | 230,669 | | |
| Total assets | | $ | 76,341,657 | | |
| Liabilities | |
| Payable for Fund shares redeemed | | $ | 70,776 | | |
| Payable to affiliate for distribution and service fees | | | 45,801 | | |
| Accrued expenses | | | 82,641 | | |
| Total liabilities | | $ | 199,218 | | |
| Net Assets | | $ | 76,142,439 | | |
| Sources of Net Assets | |
| Paid-in capital | | $ | 168,911,104 | | |
Accumulated net realized loss from Portfolio (computed on
the basis of identified cost) | | | (115,919,784 | ) | |
| Accumulated net investment loss | | | (45,494 | ) | |
Net unrealized appreciation from Portfolio (computed on
the basis of identified cost) | | | 23,196,613 | | |
| Total | | $ | 76,142,439 | | |
| Class A Shares | |
| Net Assets | | $ | 29,633,833 | | |
| Shares Outstanding | | | 3,417,044 | | |
Net Asset Value and Redemption Price Per Share
(net assets ÷ shares of beneficial interest outstanding) | | $ | 8.67 | | |
Maximum Offering Price Per Share
(100 ÷ 94.25 of $8.67) | | $ | 9.20 | | |
| Class B Shares | |
| Net Assets | | $ | 27,861,183 | | |
| Shares Outstanding | | | 3,384,985 | | |
Net Asset Value, Offering Price and Redemption Price Per Share
(net assets ÷ shares of beneficial interest outstanding) | | $ | 8.23 | | |
| Class C Shares | |
| Net Assets | | $ | 18,647,423 | | |
| Shares Outstanding | | | 2,267,835 | | |
Net Asset Value, Offering Price and Redemption Price Per Share
(net assets ÷ shares of beneficial interest outstanding) | | $ | 8.22 | | |
| On sales of $50,000 or more, the offering price of Class A shares is reduced. | |
Statement of Operations
For the Year Ended
October 31, 2005
| Investment Income | |
| Dividends allocated from Portfolio (net of foreign taxes, $179,074) | | $ | 1,897,373 | | |
| Interest allocated from Portfolio | | | 15,722 | | |
| Expenses allocated from Portfolio | | | (861,610 | ) | |
| Net investment income from Portfolio | | $ | 1,051,485 | | |
| Expenses | |
| Trustees' fees and expenses | | $ | 1,307 | | |
Distribution and service fees
Class A | | | 68,637 | | |
| Class B | | | 281,843 | | |
| Class C | | | 182,708 | | |
| Transfer and dividend disbursing agent fees | | | 195,968 | | |
| Registration fees | | | 68,109 | | |
| Printing and postage | | | 38,692 | | |
| Legal and accounting services | | | 19,071 | | |
| Custodian fee | | | 17,942 | | |
| Miscellaneous | | | 9,073 | | |
| Total expenses | | $ | 883,350 | | |
| Net investment income | | $ | 168,135 | | |
Realized and Unrealized
Gain (Loss) from Portfolio | |
Net realized gain (loss) —
Investment transactions (identified cost basis) | | $ | 4,229,928 | | |
| Foreign currency transactions | | | (140,622 | ) | |
| Net realized gain | | $ | 4,089,306 | | |
Change in unrealized appreciation (depreciation) —
Investments (identified cost basis) | | $ | 10,295,983 | | |
| Foreign currency | | | (6,857 | ) | |
| Net change in unrealized appreciation (depreciation) | | $ | 10,289,126 | | |
| Net realized and unrealized gain | | $ | 14,378,432 | | |
| Net increase in net assets from operations | | $ | 14,546,567 | | |
See notes to financial statements
7
Eaton Vance Tax-Managed International Equity Fund as of October 31, 2005
FINANCIAL STATEMENTS CONT'D
Statements of Changes in Net Assets
Increase (Decrease)
in Net Assets | | Year Ended
October 31, 2005 | | Year Ended
October 31, 2004 | |
From operations —
Net investment income (loss) | | $ | 168,135 | | | $ | (90,888 | ) | |
Net realized gain from investments and
foreign currency transactions | | | 4,089,306 | | | | 5,534,103 | | |
Net change in unrealized
appreciation (depreciation)
from investments and foreign currency | | | 10,289,126 | | | | 3,609,965 | | |
| Net increase in net assets from operations | | $ | 14,546,567 | | | $ | 9,053,180 | | |
Transactions in shares of beneficial interest —
Proceeds from sale of shares
Class A | | $ | 4,927,186 | | | $ | 5,098,878 | | |
| Class B | | | 2,024,959 | | | | 1,673,520 | | |
| Class C | | | 2,462,849 | | | | 2,262,001 | | |
| Class D | | | — | | | | 399,664 | | |
Cost of shares redeemed
Class A | | | (5,677,410 | ) | | | (7,800,685 | ) | |
| Class B | | | (7,027,365 | ) | | | (5,993,370 | ) | |
| Class C | | | (5,171,725 | ) | | | (5,411,241 | ) | |
| Class D | | | — | | | | (150,268 | ) | |
Net asset value of shares exchanged
Class A | | | 171,122 | | | | 398,494 | | |
| Class B | | | (171,122 | ) | | | (398,494 | ) | |
Net asset value of shares merged
Class B | | | — | | | | 1,007,215 | | |
| Class D | | | — | | | | (1,007,215 | ) | |
| Redemption Fees | | | 1,025 | | | | 1,465 | | |
Net decrease in net assets from
Fund share transactions | | $ | (8,460,481 | ) | | $ | (9,920,036 | ) | |
| Net increase (decrease) in net assets | | $ | 6,086,086 | | | $ | (866,856 | ) | |
| Net Assets | |
| At beginning of year | | $ | 70,056,353 | | | $ | 70,923,209 | | |
| At end of year | | $ | 76,142,439 | | | $ | 70,056,353 | | |
Accumulated net
investment loss included
in net assets | |
| At end of year | | $ | (45,494 | ) | | $ | (73,007 | ) | |
See notes to financial statements
8
Eaton Vance Tax-Managed International Equity Fund as of October 31, 2005
FINANCIAL STATEMENTS CONT'D
Financial Highlights
| | | Class A | |
| | | Year Ended October 31, | |
| | | 2005(1) | | 2004(1) | | 2003(1) | | 2002(1) | | 2001(1) | |
| Net asset value — Beginning of year | | $ | 7.080 | | | $ | 6.210 | | | $ | 5.330 | | | $ | 7.350 | | | $ | 12.070 | | |
| Income (loss) from operations | |
| Net investment income (loss) | | $ | 0.056 | | | $ | 0.026 | | | $ | 0.015 | | | $ | (0.044 | ) | | $ | (0.045 | ) | |
| Net realized and unrealized gain (loss) | | | 1.534 | | | | 0.844 | | | | 0.865 | | | | (1.976 | ) | | | (4.656 | ) | |
| Total income (loss) from operations | | $ | 1.590 | | | $ | 0.870 | | | $ | 0.880 | | | $ | (2.020 | ) | | $ | (4.701 | ) | |
| Less distributions | |
| From net investment income | | $ | — | | | $ | — | | | $ | — | | | $ | — | | | $ | (0.019 | ) | |
| Total distributions | | $ | — | | | $ | — | | | $ | — | | | $ | — | | | $ | (0.019 | ) | |
| Redemption fees | | $ | 0.000 | (2) | | $ | 0.000 | (2) | | $ | — | | | $ | — | | | $ | — | | |
| Net asset value — End of year | | $ | 8.670 | | | $ | 7.080 | | | $ | 6.210 | | | $ | 5.330 | | | $ | 7.350 | | |
| Total Return(3) | | | 22.46 | % | | | 14.01 | % | | | 16.51 | % | | | (27.48 | )% | | | (39.01 | )% | |
| Ratios/Supplemental Data | |
| Net assets, end of year (000's omitted) | | $ | 29,634 | | | $ | 24,714 | | | $ | 23,857 | | | $ | 27,929 | | | $ | 51,419 | | |
| Ratios (As a percentage of average daily net assets): | |
| Expenses(4) | | | 1.89 | % | | | 2.08 | % | | | 2.09 | % | | | 1.82 | % | | | 1.70 | % | |
| Expenses after custodian fee reduction(4) | | | 1.89 | % | | | 2.08 | % | | | 2.09 | % | | | 1.82 | % | | | 1.70 | % | |
| Net investment income (loss) | | | 0.70 | % | | | 0.38 | % | | | 0.28 | % | | | (0.64 | )% | | | (0.46 | )% | |
| Portfolio Turnover of the Portfolio | | | 39 | % | | | 62 | % | | | 100 | % | | | 128 | % | | | 31 | %(5) | |
| Portfolio Turnover of the Fund(6) | | | — | | | | — | | | | — | | | | — | | | | 90 | % | |
(1) Net investment income (loss) and redemption fees per share were computed using average shares outstanding.
(2) Amounts represent less than $0.0005 per share.
(3) Returns are historical and are calculated by determining the percentage change in net asset value with all distributions reinvested. Total return is not computed on an annualized basis.
(4) Includes the Fund's share of the Portfolio's allocated expenses.
(5) For the period from the Portfolio's start of business, July 23, 2001 to October 31, 2001.
(6) Represents the rate of portfolio activity for the period during which the Fund was making investments directly in securities. On July 23, 2001, the Fund transferred all of its investable assets to the Tax-Managed International Growth Portfolio.
See notes to financial statements
9
Eaton Vance Tax-Managed International Equity Fund as of October 31, 2005
FINANCIAL STATEMENTS CONT'D
Financial Highlights
| | | Class B | |
| | | Year Ended October 31, | |
| | | 2005(1) | | 2004(1) | | 2003(1) | | 2002(1) | | 2001(1) | |
| Net asset value — Beginning of year | | $ | 6.770 | | | $ | 5.980 | | | $ | 5.170 | | | $ | 7.190 | | | $ | 11.880 | | |
| Income (loss) from operations | |
| Net investment loss | | $ | (0.004 | ) | | $ | (0.026 | ) | | $ | (0.024 | ) | | $ | (0.092 | ) | | $ | (0.115 | ) | |
| Net realized and unrealized gain (loss) | | | 1.464 | | | | 0.816 | | | | 0.834 | | | | (1.928 | ) | | | (4.575 | ) | |
| Total income (loss) from operations | | $ | 1.460 | | | $ | 0.790 | | | $ | 0.810 | | | $ | (2.020 | ) | | $ | (4.690 | ) | |
| Redemption fees | | $ | 0.000 | (2) | | $ | 0.000 | (2) | | $ | — | | | $ | — | | | $ | — | | |
| Net asset value — End of year | | $ | 8.230 | | | $ | 6.770 | | | $ | 5.980 | | | $ | 5.170 | | | $ | 7.190 | | |
| Total Return(3) | | | 21.56 | % | | | 13.21 | % | | | 15.67 | % | | | (28.10 | )% | | | (39.48 | )% | |
| Ratios/Supplemental Data | |
| Net assets, end of year (000's omitted) | | $ | 27,861 | | | $ | 27,546 | | | $ | 27,764 | | | $ | 29,610 | | | $ | 50,444 | | |
| Ratios (As a percentage of average daily net assets): | |
| Expenses(4) | | | 2.64 | % | | | 2.83 | % | | | 2.84 | % | | | 2.57 | % | | | 2.45 | % | |
| Expenses after custodian fee reduction(4) | | | 2.64 | % | | | 2.83 | % | | | 2.84 | % | | | 2.57 | % | | | 2.45 | % | |
| Net investment loss | | | (0.05 | )% | | | (0.40 | )% | | | (0.46 | )% | | | (1.38 | )% | | | (1.21 | )% | |
| Portfolio Turnover of the Portfolio | | | 39 | % | | | 62 | % | | | 100 | % | | | 128 | % | | | 31 | %(5) | |
| Portfolio Turnover of the Fund(6) | | | — | | | | — | | | | — | | | | — | | | | 90 | % | |
(1) Net investment income (loss) and redemption fees per share were computed using average shares outstanding.
(2) Amounts represent less than $0.0005 per share.
(3) Returns are historical and are calculated by determining the percentage change in net asset value with all distributions reinvested. Total return is not computed on an annualized basis.
(4) Includes the Fund's share of the Portfolio's allocated expenses.
(5) For the period from the Portfolio's start of business, July 23, 2001 to October 31, 2001.
(6) Represents the rate of portfolio activity for the period during which the Fund was making investments directly in securities. On July 23, 2001, the Fund transferred all of its investable assets to the Tax-Managed International Growth Portfolio.
See notes to financial statements
10
Eaton Vance Tax-Managed International Equity Fund as of October 31, 2005
FINANCIAL STATEMENTS CONT'D
Financial Highlights
| | | Class C | |
| | | Year Ended October 31, | |
| | | 2005(1) | | 2004(1) | | 2003(1) | | 2002(1) | | 2001(1) | |
| Net asset value — Beginning of year | | $ | 6.760 | | | $ | 5.970 | | | $ | 5.160 | | | $ | 7.180 | | | $ | 11.860 | | |
| Income (loss) from operations | |
| Net investment loss | | $ | (0.004 | ) | | $ | (0.025 | ) | | $ | (0.023 | ) | | $ | (0.091 | ) | | $ | (0.113 | ) | |
| Net realized and unrealized gain (loss) | | | 1.464 | | | | 0.815 | | | | 0.833 | | | | (1.929 | ) | | | (4.567 | ) | |
| Total income (loss) from operations | | $ | 1.460 | | | $ | 0.790 | | | $ | 0.810 | | | $ | (2.020 | ) | | $ | (4.680 | ) | |
| Redemption fees | | $ | 0.000 | (2) | | $ | 0.000 | (2) | | $ | — | | | $ | — | | | $ | — | | |
| Net asset value — End of year | | $ | 8.220 | | | $ | 6.760 | | | $ | 5.970 | | | $ | 5.160 | | | $ | 7.180 | | |
| Total Return(3) | | | 21.60 | % | | | 13.23 | % | | | 15.70 | % | | | (28.13 | )% | | | (39.46 | )% | |
| Ratios/Supplemental Data | |
| Net assets, end of year (000's omitted) | | $ | 18,647 | | | $ | 17,797 | | | $ | 18,616 | | | $ | 21,919 | | | $ | 37,263 | | |
| Ratios (As a percentage of average daily net assets): | |
| Expenses(4) | | | 2.64 | % | | | 2.83 | % | | | 2.84 | % | | | 2.57 | % | | | 2.45 | % | |
| Expenses after custodian fee reduction(4) | | | 2.64 | % | | | 2.83 | % | | | 2.84 | % | | | 2.57 | % | | | 2.45 | % | |
| Net investment loss | | | (0.06 | )% | | | (0.39 | )% | | | (0.44 | )% | | | (1.38 | )% | | | (1.20 | )% | |
| Portfolio Turnover of the Portfolio | | | 39 | % | | | 62 | % | | | 100 | % | | | 128 | % | | | 31 | %(5) | |
| Portfolio Turnover of the Fund(6) | | | — | | | | — | | | | — | | | | — | | | | 90 | % | |
(1) Net investment income (loss) and redemption fees per share were computed using average shares outstanding.
(2) Amounts represent less than $0.0005 per share.
(3) Returns are historical and are calculated by determining the percentage change in net asset value with all distributions reinvested. Total return is not computed on an annualized basis.
(4) Includes the Fund's share of the Portfolio's allocated expenses.
(5) For the period from the Portfolio's start of business, July 23, 2001 to October 31, 2001.
(6) Represents the rate of portfolio activity for the period during which the Fund was making investments directly in securities. On July 23, 2001, the Fund transferred all of its investable assets to the Tax-Managed International Growth Portfolio.
See notes to financial statements
11
Eaton Vance Tax-Managed International Equity Fund as of October 31, 2005
NOTES TO FINANCIAL STATEMENTS
1 Significant Accounting Policies
Eaton Vance Tax-Managed International Equity Fund (the Fund) is a diversified series of Eaton Vance Mutual Funds Trust (the Trust). The Trust is an entity of the type commonly known as a Massachusetts business trust and is registered under the Investment Company Act of 1940, as amended, as an open-end management investment company. The Fund offers three classes of shares. Class A shares are generally sold subject to a sales charge imposed at time of purchase. Class B and Class C shares are sold at net asset value and are subject to a contingent deferred sales charge (see Note 6). The Trustees have adopted a conversion feature pursuant to which Class B shares of the Fund automatically convert to Class A shares eight years after their purchase as described in the Fund's prospectus. The Fund previously offered Class D shares. Such offering was discontinued during the year ended October 31, 2004. At the close of business on Septembe r 10, 2004, the Class D shares were merged into Class B shares. Each class represents a pro-rata interest in the Fund, but votes separately on class-specific matters and (as noted below) is subject to different expenses. Realized and unrealized gains and losses and net investment income, other than class-specific expenses, are allocated daily to each class of shares based on the relative net assets of each class to the total net assets of the Fund. Each class of shares differs in its distribution plan and certain other class-specific expenses. The Fund invests all of its investable assets in interests in the Tax-Managed International Equity Portfolio (the Portfolio), a New York Trust, having the same investment objective as the Fund. The value of the Fund's investment in the Portfolio reflects the Fund's proportionate interest in the net assets of the Portfolio (50.2% at October 31, 2005). The performance of the Fund is directly affected by the performance of the Portfolio. The financial statements of the Po rtfolio, including the portfolio of investments, are included elsewhere in this report and should be read in conjunction with the Fund's financial statements.
The following is a summary of significant accounting policies consistently followed by the Fund in the preparation of its financial statements. The policies are in conformity with accounting principles generally accepted in the United States of America.
A Investment Valuation — Valuation of securities by the Portfolio is discussed in Note 1A of the Portfolio's Notes to Financial Statements, which are included elsewhere in this report.
B Income — The Fund's net investment income or loss consists of the Fund's pro-rata share of the net investment income or loss of the Portfolio, less all actual and accrued expenses of the Fund determined in accordance with accounting principles generally accepted in the United States of America.
C Federal Taxes — The Fund's policy is to comply with the provisions of the Internal Revenue Code applicable to regulated investment companies and to distribute to shareholders each year all of its taxable income, including any net realized gain on investments. Accordingly, no provision for federal income or excise tax is necessary. At October 31, 2005, the Fund, for federal income tax purposes, had a capital loss carryover of $115,688,947 which will reduce the taxable income arising from future net realized gain on investments, if any, to the extent permitted by the Internal Revenue Code and thus will reduce the amount of distributions to shareholders which would otherwise be necessary to relieve the Fund of any liability for federal income or excise tax. Such capital lo ss carryover will expire on October 31, 2009 ($26,622,409), October 31, 2010 ($49,131,487) and October 31, 2011 ($39,935,051).
D Expenses — The majority of expenses of the Trust are directly identifiable to an individual fund. Expenses which are not readily identifiable to a specific fund are allocated taking into consideration, among other things, the nature and type of expense and the relative size of the fund.
E Use of Estimates — The preparation of the financial statements in conformity with accounting principles generally accepted in the United States of America requires management to make estimates and assumptions that affect the reported amounts of assets and liabilities at the date of the financial statements and the reported amounts of income and expense during the reporting period. Actual results could differ from those estimates.
F Indemnifications — Under the Trust's organizational documents, its officers and Trustees may be indemnified against certain liabilities and expenses arising out of the performance of their duties to the Fund and shareholders are indemnified against personal liability for the obligations of the Trust. Additionally, in the normal course of business, the Fund enters into agreements with service providers that may contain indemnification clauses. The Fund's maximum exposure under these arrangements is unknown as this would involve future claims that may be made against the Fund that have not yet occurred.
12
Eaton Vance Tax-Managed International Equity Fund as of October 31, 2005
NOTES TO FINANCIAL STATEMENTS CONT'D
G Redemption Fee — Upon the redemption or exchange of shares by Class A shareholders within 90 days of the settlement of purchase, a fee of 1% of the current net asset value of these shares will be assessed and retained by the Fund for the benefit of the remaining shareholders. The redemption fee is accounted for as an addition to paid-in capital.
2 Distributions to Shareholders
It is the present policy of the Fund to make at least one distribution annually (normally in December) of all or substantially all of its net investment income and at least one distribution annually of all or substantially all of its net realized capital gains (reduced by available capital loss carryforwards from prior years, if any). Distributions are declared separately for each class of shares. Shareholders may reinvest distributions in shares of the same class of the Fund at the net asset value as of the ex-dividend date. Distributions are paid in the form of additional shares of the same class of the Fund or, at the election of the shareholder, in cash. The Fund distinguishes between distributions on a tax basis and a financial reporting basis. Accounting principles generally accepted in the United States of America require that only distributions in excess of tax basis earnings and profits be reported in the financial stat ements as a return of capital. Permanent differences between book and tax accounting relating to distributions are reclassified to paid-in capital.
During the year ended October 31, 2005, accumulated paid-in capital was decreased by $6, accumulated net investment loss was increased by $140,622 and accumulated net realized loss was decreased by $140,628 primarily due to differences between book and tax accounting for foreign currency gain/loss. This change had no effect on the net assets or the net asset value per share.
As of October 31, 2005, the components of distributable earnings (accumulated losses) on a tax basis were as follows:
| Ordinary income | | $ | 332,040 | | |
| Capital loss carryforward | | $ | (115,688,947 | ) | |
| Unrealized gain | | $ | 22,588,242 | | |
3 Shares of Beneficial Interest
The Fund's Declaration of Trust permits the Trustees to issue an unlimited number of full and fractional shares of beneficial interest (without par value). Such shares may be issued in a number of different series (such as the Fund) and classes. Transactions in Fund shares were as follows:
| | | Year Ended October 31, | |
| Class A | | 2005 | | 2004 | |
| Sales | | | 615,868 | | | | 748,080 | | |
| Redemptions | | | (711,797 | ) | | | (1,157,419 | ) | |
| Exchange from Class B shares | | | 21,573 | | | | 58,278 | | |
| Net decrease | | | (74,356 | ) | | | (351,061 | ) | |
| | | Year Ended October 31, | |
| Class B | | 2005 | | 2004 | |
| Sales | | | 264,394 | | | | 257,121 | | |
| Redemptions | | | (926,665 | ) | | | (921,701 | ) | |
| Exchange to Class A shares | | | (22,670 | ) | | | (60,698 | ) | |
| Merged from Class D shares | | | — | | | | 153,539 | | |
| Net decrease | | | (684,941 | ) | | | (571,739 | ) | |
| | | Year Ended October 31, | |
| Class C | | 2005 | | 2004 | |
| Sales | | | 324,572 | | | | 345,933 | | |
| Redemptions | | | (688,729 | ) | | | (829,636 | ) | |
| Net decrease | | | (364,157 | ) | | | (483,703 | ) | |
| | | Year Ended October 31, | |
| Class D | | 2005 | | 2004(1) | |
| Sales | | | — | | | | 56,160 | | |
| Redemptions | | | — | | | | (20,688 | ) | |
| Merged to Class B shares | | | — | | | | (140,156 | ) | |
| Net decrease | | | — | | | | (104,684 | ) | |
(1) Offering of Class D shares was discontinued during the year ended October 31, 2004 (see note 1).
Class A shares are subject to a 1% redemption fee if redeemed or exchanged within 90 days of the settlement of the purchase. For the year ended October 31, 2005, the Fund received $1,025 in redemption fees on Class A shares.
13
Eaton Vance Tax-Managed International Equity Fund as of October 31, 2005
NOTES TO FINANCIAL STATEMENTS CONT'D
4 Transactions with Affiliates
Eaton Vance Management (EVM) serves as the administrator to the Fund, but receives no compensation. The Portfolio has engaged Boston Management and Research (BMR), a subsidiary of EVM, to render investment advisory services. See Note 2 of the Portfolio's Notes to Financial Statements which are included elsewhere in this report. Except for Trustees of the Fund and the Portfolio who are not members of EVM's or BMR's organization, officers and Trustees receive remuneration for their services to the Fund out of the investment adviser fees earned by BMR. The Fund was informed that Eaton Vance Distributors, Inc. (EVD), a subsidiary of EVM and the Fund's principal underwriter, received $10,809 as its portion of the sales charge on sales of Class A shares for the year ended October 31, 2005. EVM serves as the sub-transfer agent of the Fund and receives from the transfer agent an aggregate fee based upon the actual expenses incurred by E VM in the performance of those services. For the year ended October 31, 2005, EVM earned $15,853 in sub-transfer agent fees.
Certain officers and Trustees of the Fund and Portfolio are officers of the above organizations.
5 Distribution and Service Plans
The Fund has in effect distribution plans for Class B shares (Class B Plan) and Class C shares (Class C Plan) pursuant to Rule 12b-1 under the Investment Company Act of 1940, as amended, and a service plan for Class A shares (Class A Plan) (collectively, the Plans). The Class B and Class C Plans require the Fund to pay EVD amounts equal to 1/365 of 0.75% of the Fund's average daily net assets attributable to Class B and Class C shares for providing ongoing distribution services and facilities to the Fund. The Fund will automatically discontinue payments to EVD during any period in which there are no outstanding Uncovered Distribution Charges, which are equivalent to the sum of (i) 5% (in the case of Class B) and 6.25% (in the case of Class C) of the aggregate amount received by the Fund for each class shares sold, plus (ii) interest calculated by applying the rate of 1% over the prevailing prime rate to the outstanding balance o f Uncovered Distribution Charges of EVD of each respective class, reduced by the aggregate amount of contingent deferred sales charges (see Note 6) and daily amounts theretofore paid to EVD by each respective class. The Fund paid or accrued $211,382 and $137,031 for Class B and Class C shares, respectively, to or payable to EVD for the year ended October 31, 2005, representing 0.75% of the average daily net assets for Class B and Class C shares, respectively. At October 31, 2005, the amount of Uncovered Distribution Charges of EVD calculated under the Plans was approximately $3,546,000 and $6,429,000 for Class B and Class C shares, respectively.
The Plans authorize the Fund to make payments of service fees to EVD, investment dealers and other persons amounting to 0.25% of the Fund's average daily net assets attributable to Class A, Class B and Class C shares for each fiscal year. Service fee payments will be made for personal services and/or the maintenance of shareholder accounts. Service fees are separate and distinct from the sales commissions and distribution fees payable by the Fund to EVD and, as such, are not subject to automatic discontinuance when there are no outstanding Uncovered Distribution Charges of EVD. Service fees paid or accrued for the year ended October 31, 2005 amounted to $68,637, $70,461 and $45,677 for Class A, Class B and Class C shares, respectively.
6 Contingent Deferred Sales Charge
A contingent deferred sales charge (CDSC) generally is imposed on redemptions of Class B shares made within six years of purchase and on redemptions of Class C shares made within one year of purchase. Class A shares may be subject to a 1% CDSC if redeemed within one year of purchase (depending upon the circumstances of purchase). Generally, the CDSC is based upon the lower of the net asset value at date of redemption or date of purchase. No charge is levied on shares acquired by reinvestment of dividends or capital gain distributions. The Class B CDSC is imposed at declining rates that begin at 5% in the case of redemptions in the first and second year after purchase, declining one percentage point in each subsequent year. Class C shares will be subject to a 1% CDSC if redeemed within one year of purchase. No CDSC is levied on shares which have been sold to EVM or its affiliates or to their respective employees or clients and ma y be waived under certain other limited conditions. CDSCs received on Class B and Class C redemptions are paid to EVD to reduce the amount of Uncovered Distribution Charges calculated under the Class B and Class C Plans, respectively (see Note 5). CDSCs received on Class B and Class C shares when no Uncovered Distribution Charges exist for the respective classes will be credited to the Fund. EVD received approximately $77,000 and $1,000 of CDSC paid by shareholders for Class B and Class C shares, respectively, for the year ended October 31, 2005. EVD did not receive any CDSC fee for Class A shares for the year ended October 31, 2005.
7 Investment Transactions
Increases and decreases in the Fund's investment in the Portfolio aggregated $9,201,552 and $18,793,984, respectively, for the year ended October 31, 2005.
14
Eaton Vance Tax-Managed International Equity Fund as of October 31, 2005
REPORT OF INDEPENDENT REGISTERED PUBLIC ACCOUNTING FIRM
To the Trustees of Eaton Vance Mutual Funds Trust and the Shareholders of Eaton Vance Tax-Managed International Equity Fund:
We have audited the accompanying statement of assets and liabilities of Eaton Vance Tax-Managed International Equity Fund (the Fund) (one of the series of Eaton Vance Mutual Funds Trust), as of October 31, 2005, the related statement of operations for the year then ended, the statements of changes in net assets for each of the two years in the period then ended, and the financial highlights for each of the five years in the period then ended. These financial statements and financial highlights are the responsibility of the Fund's management. Our responsibility is to express an opinion on these financial statements and financial highlights based on our audits.
We conducted our audits in accordance with the standards of the Public Company Accounting Oversight Board (United States). Those standards require that we plan and perform the audits to obtain reasonable assurance about whether the financial statements and financial highlights are free of material misstatement. The Fund is not required to have, nor were we engaged to perform, an audit of its internal control over financial reporting. An audit includes consideration of internal control over financial reporting as a basis for designing audit procedures that are appropriate in the circumstances, but not for the purpose of expressing an opinion on the effectiveness of the Fund's internal control over financial reporting. Accordingly, we express no such opinion. An audit also includes examining, on a test basis, evidence supporting the amounts and disclosures in the financial statements, assessing the accounting principles used and s ignificant estimates made by management, as well as evaluating the overall financial statement presentation. We believe that our audits provide a reasonable basis for our opinion.
In our opinion, such financial statements and financial highlights referred to above present fairly, in all material respects, the financial position of the Eaton Vance Tax-Managed International Equity Fund as of October 31, 2005, the results of its operations for the year then ended, the changes in its net assets for each of the two years in the period then ended and the financial highlights for each of the five years in the period then ended, in conformity with accounting principles generally accepted in the United States of America.
Deloitte & Touche LLP
Boston, Massachusetts
December 19, 2005
15
Eaton Vance Tax-Managed International Equity Fund as of October 31, 2005
FEDERAL TAX INFORMATION (Unaudited)
The Form 1099-DIV you receive in January 2006 will show the tax status of all distributions paid to your account in calendar 2005. Shareholders are advised to consult their own tax adviser with respect to the tax consequences of their investment in the Fund. As required by the Internal Revenue Code regulations, shareholders must be notified within 60 days of the Fund's fiscal year end regarding the status of the qualified dividend income for individuals and the foreign tax credit.
Qualified Dividend Income. The Fund designates approximately $1,918,897, or up to the maximum amount of such dividends allowable pursuant to the Internal Revenue Code, as qualified dividend income eligible for the reduced tax rate of 15%.
Foreign Tax Credit. The Fund designates a foreign tax credit of $179,074 and recognizes foreign source income of $2,076,447.
16
Tax-Managed International Equity Portfolio as of October 31, 2005
PORTFOLIO OF INVESTMENTS
| Common Stocks — 99.8% | |
| Security | | Shares | | Value | |
| Aerospace and Defense — 1.3% | |
| Empresa Brasileira de Aeronautica SA ADR | | | 51,000 | | | $ | 1,978,290 | | |
| | | $ | 1,978,290 | | |
| Airport Operator / Development — 0.7% | |
| BAA PLC | | | 93,500 | | | $ | 1,015,971 | | |
| | | $ | 1,015,971 | | |
| Automobiles — 3.7% | |
| Honda Motor Co., Ltd. | | | 38,000 | | | $ | 2,113,471 | | |
| Renault SA | | | 7,500 | | | | 649,179 | | |
| Toyota Motor Corp. | | | 60,000 | | | | 2,782,348 | | |
| | | $ | 5,544,998 | | |
| Banking — 17.5% | |
| Anglo Irish Bank Corp. PLC | | | 77,400 | | | $ | 1,048,900 | | |
| Australia and New Zealand Banking Group, Ltd. | | | 68,500 | | | | 1,208,377 | | |
| Banco Bilbao Vizcaya Argentaria SA | | | 66,700 | | | | 1,175,521 | | |
| Banco Santander Central Hispano SA | | | 75,000 | | | | 954,504 | | |
| Bank of Ireland | | | 66,500 | | | | 1,011,861 | | |
| Barclays PLC | | | 300,000 | | | | 2,973,481 | | |
| BNP Paribas SA | | | 15,000 | | | | 1,137,041 | | |
| Danske Bank A/S | | | 26,700 | | | | 836,961 | | |
| DBS Group Holdings, Ltd. | | | 172,000 | | | | 1,555,462 | | |
| HBOS PLC | | | 50,000 | | | | 738,726 | | |
| HSBC Holdings PLC | | | 151,780 | | | | 2,385,135 | | |
| Mitsubishi Tokyo Financial Group, Inc. | | | 375 | | | �� | 4,713,371 | | |
| Orix Corp. | | | 8,300 | | | | 1,556,382 | | |
| Societe Generale | | | 10,300 | | | | 1,175,777 | | |
| Sumitomo Trust and Banking Co., Ltd. (The) | | | 90,000 | | | | 766,233 | | |
| UBS AG | | | 38,800 | | | | 3,303,393 | | |
| | | $ | 26,541,125 | | |
| Beverages — 3.8% | |
| Diageo PLC | | | 90,000 | | | $ | 1,329,564 | | |
| Fomento Economico Mexicano SA de C.V. ADR | | | 44,000 | | | | 2,991,560 | | |
| SABMiller PLC | | | 76,000 | | | | 1,434,101 | | |
| | | $ | 5,755,225 | | |
| Security | | Shares | | Value | |
| Business Services — 3.7% | |
| Mitsubishi Corp. | | | 290,000 | | | $ | 5,639,664 | | |
| | | $ | 5,639,664 | | |
| Chemicals — 0.9% | |
| BASF AG | | | 20,000 | | | $ | 1,441,512 | | |
| | | $ | 1,441,512 | | |
| Computer Software — 0.3% | |
| UbiSoft Entertainment SA(1) | | | 10,000 | | | $ | 460,894 | | |
| | | $ | 460,894 | | |
| Consumer Electronics — 2.6% | |
| Canon, Inc. | | | 57,500 | | | $ | 3,043,559 | | |
| Samsung Electronics Co., Ltd. | | | 1,570 | | | | 838,963 | | |
| | | $ | 3,882,522 | | |
| Distribution / Wholesale / Retail — 3.5% | |
| AEON Co., Ltd. | | | 140,000 | | | $ | 2,908,992 | | |
| Controladora Comercial Mexicana S.A. de C.V. | | | 1,000,000 | | | | 1,499,768 | | |
| Esprit Holdings, Ltd. | | | 130,000 | | | | 920,939 | | |
| | | $ | 5,329,699 | | |
| Drugs — 5.5% | |
| Novartis AG | | | 41,000 | | | $ | 2,202,159 | | |
| Roche Holding AG | | | 29,500 | | | | 4,401,440 | | |
| Serono SA, Class B | | | 1,700 | | | | 1,098,580 | | |
| Takeda Pharmaceutical Co., Ltd. | | | 13,000 | | | | 712,601 | | |
| | | $ | 8,414,780 | | |
| Engineering and Construction — 1.1% | |
| Vinci SA | | | 22,000 | | | $ | 1,719,210 | | |
| | | $ | 1,719,210 | | |
| Entertainment — 0.9% | |
| Vivendi Universal SA | | | 42,600 | | | $ | 1,340,109 | | |
| | | $ | 1,340,109 | | |
| Financial Services — 3.7% | |
| Fortis | | | 35,000 | | | $ | 995,804 | | |
| Grupo Financiero Banorte S.A. de C.V. | | | 125,000 | | | | 1,064,729 | | |
See notes to financial statements
17
Tax-Managed International Equity Portfolio as of October 31, 2005
PORTFOLIO OF INVESTMENTS CONT'D
| Security | | Shares | | Value | |
| Financial Services (continued) | |
| ING Groep NV | | | 90,439 | | | $ | 2,606,925 | | |
| LG Card Co., Ltd.(1) | | | 23,000 | | | | 842,108 | | |
| Mizuho Financial Group, Inc.(1) | | | 5 | | | | 33,381 | | |
| | | $ | 5,542,947 | | |
| Foods — 1.1% | |
| Nestle SA | | | 5,500 | | | $ | 1,635,446 | | |
| | | $ | 1,635,446 | | |
| Hotels and Motels — 0.8% | |
| Shangri-La Asia, Ltd. | | | 900,000 | | | $ | 1,262,336 | | |
| | | $ | 1,262,336 | | |
| Household Products / Food — 1.2% | |
| Cadbury Schweppes PLC | | | 180,000 | | | $ | 1,774,067 | | |
| | | $ | 1,774,067 | | |
| Industrial-Conglomerate — 2.4% | |
| Keppel Corp., Ltd. | | | 521,000 | | | $ | 3,570,857 | | |
| | | $ | 3,570,857 | | |
| Insurance — 2.3% | |
| Aviva PLC | | | 91,700 | | | $ | 1,083,090 | | |
| AXA Company | | | 85,900 | | | | 2,486,718 | | |
| | | $ | 3,569,808 | | |
| Machinery — 2.4% | |
| Komatsu, Ltd. | | | 270,000 | | | $ | 3,597,823 | | |
| | | $ | 3,597,823 | | |
| Medical Products — 1.0% | |
| Terumo Corp. | | | 50,000 | | | $ | 1,516,767 | | |
| | | $ | 1,516,767 | | |
| Metals-Industrial — 4.7% | |
| BHP Billiton, Ltd. | | | 100,000 | | | $ | 1,549,816 | | |
| Companhia Vale do Rio Doce ADR | | | 55,000 | | | | 2,029,500 | | |
| Rio Tinto, Ltd. | | | 82,500 | | | | 3,485,903 | | |
| | | $ | 7,065,219 | | |
| Security | | Shares | | Value | |
| Mining — 0.9% | |
| Cameco Corp. | | | 30,000 | | | $ | 1,434,000 | | |
| | | $ | 1,434,000 | | |
| Oil and Gas-Integrated — 11.5% | |
| BP PLC | | | 253,264 | | | $ | 2,806,020 | | |
| ENI SPA | | | 75,000 | | | | 2,006,448 | | |
| Norsk Hydro ASA | | | 15,000 | | | | 1,489,822 | | |
| Petroleo Brasileiro SA ADR | | | 45,000 | | | | 2,581,650 | | |
| Royal Dutch Shell PLC, Class B | | | 40,858 | | | | 1,333,021 | | |
| Statoil ASA | | | 65,000 | | | | 1,444,012 | | |
| Total SA | | | 23,000 | | | | 5,784,828 | | |
| | | $ | 17,445,801 | | |
| Oil and Gas-Services — 2.7% | |
| Samchully Co., Ltd. | | | 9,000 | | | $ | 977,697 | | |
| Stolt Offshore SA(1) | | | 300,000 | | | | 3,116,923 | | |
| | | $ | 4,094,620 | | |
| Real Estate — 2.1% | |
| Cheung Kong Holdings, Ltd. | | | 160,000 | | | $ | 1,671,260 | | |
| Sun Hung Kai Properties, Ltd. | | | 155,000 | | | | 1,471,063 | | |
| | | $ | 3,142,323 | | |
| Telecommunication Equipment — 1.0% | |
| Nokia Oyj | | | 90,000 | | | $ | 1,507,214 | | |
| | | $ | 1,507,214 | | |
| Telecommunication Services — 5.4% | |
| BT Group PLC | | | 730,000 | | | $ | 2,748,439 | | |
| Deutsche Telekom AG | | | 48,000 | | | | 848,396 | | |
| Philippine Long Distance Telephone Co. ADR | | | 55,300 | | | | 1,667,295 | | |
| Vodafone Group PLC | | | 727,954 | | | | 1,911,526 | | |
| Vodafone Group PLC ADR | | | 36,000 | | | | 945,360 | | |
| | | $ | 8,121,016 | | |
| Tobacco — 2.6% | |
| British American Tobacco PLC | | | 70,000 | | | $ | 1,540,616 | | |
| Japan Tobacco, Inc. | | | 150 | | | | 2,371,479 | | |
| | | $ | 3,912,095 | | |
See notes to financial statements
18
Tax-Managed International Equity Portfolio as of October 31, 2005
PORTFOLIO OF INVESTMENTS CONT'D
| Security | | Shares | | Value | |
| Transportation — 2.3% | |
| Canadian Pacific Railway, Ltd. | | | 61,000 | | | $ | 2,510,746 | | |
| Cosco Corp., Ltd. | | | 800,000 | | | | 1,041,618 | | |
| | | $ | 3,552,364 | | |
| Truck Manufacturer — 0.9% | |
| Volvo AB | | | 35,000 | | | $ | 1,439,333 | | |
| | | $ | 1,439,333 | | |
| Utilities-Electric — 3.3% | |
| British Energy Group PLC(1) | | | 100,000 | | | $ | 786,514 | | |
| Enel SPA | | | 152,000 | | | | 1,223,582 | | |
| Iberdrola SA | | | 29,000 | | | | 776,103 | | |
| RWE AG | | | 36,000 | | | | 2,299,161 | | |
| | | $ | 5,085,360 | | |
| Utilities-Electrical and Gas — 2.0% | |
| E. ON AG | | | 15,340 | | | $ | 1,389,389 | | |
| Endesa SA | | | 34,000 | | | | 843,724 | | |
| Scottish and Southern Energy PLC | | | 44,500 | | | | 772,254 | | |
| | | $ | 3,005,367 | | |
Total Common Stocks
(identified cost $109,107,040) | | | | | | $ | 151,338,762 | | |
| Short-Term Investments — 0.1% | |
| Security | | Principal
Amount
(000's omitted) | | Value | |
Investors Bank and Trust Company Time Deposit,
4.03%, 11/1/05 | | $ | 140 | | | $ | 140,000 | | |
Total Short-Term Investments
(at amortized cost, $140,000) | | | | $ | 140,000 | | |
Total Investments — 99.9%
(identified cost $109,247,040) | | | | $ | 151,478,762 | | |
| Other Assets, Less Liabilities — 0.1% | | | | $ | 121,846 | | |
| Net Assets — 100.0% | | | | $ | 151,600,608 | | |
ADR - American Depository Receipt
(1) Non-income producing security.
See notes to financial statements
19
Tax-Managed International Equity Portfolio as of October 31, 2005
PORTFOLIO OF INVESTMENTS CONT'D
Country Concentration of Portfolio
| Country | | Percentage
of Net Assets | | Value | |
| Australia | | | 4.1 | % | | $ | 6,244,096 | | |
| Belgium | | | 0.7 | % | | | 995,804 | | |
| Brazil | | | 4.3 | % | | | 6,589,440 | | |
| Canada | | | 2.6 | % | | | 3,944,746 | | |
| Denmark | | | 0.6 | % | | | 836,961 | | |
| Finland | | | 1.0 | % | | | 1,507,214 | | |
| France | | | 9.7 | % | | | 14,753,756 | | |
| Germany | | | 3.9 | % | | | 5,978,457 | | |
| Hong Kong | | | 3.5 | % | | | 5,325,599 | | |
| Ireland | | | 1.4 | % | | | 2,060,761 | | |
| Italy | | | 2.1 | % | | | 3,230,029 | | |
| Japan | | | 20.9 | % | | | 31,756,073 | | |
| Mexico | | | 3.7 | % | | | 5,556,057 | | |
| Netherlands | | | 1.7 | % | | | 2,606,925 | | |
| Norway | | | 4.0 | % | | | 6,050,757 | | |
| Philippines | | | 1.1 | % | | | 1,667,295 | | |
| Republic of Korea | | | 1.8 | % | | | 2,658,767 | | |
| Singapore | | | 4.1 | % | | | 6,167,937 | | |
| Spain | | | 2.5 | % | | | 3,749,851 | | |
| Sweden | | | 0.9 | % | | | 1,439,333 | | |
| Switzerland | | | 8.3 | % | | | 12,641,018 | | |
| United Kingdom | | | 16.9 | % | | | 25,577,886 | | |
| Total Common Stocks | | | 99.8 | % | | $ | 151,338,762 | | |
| Short-Term Investments | | | 0.1 | % | | $ | 140,000 | | |
See notes to financial statements
20
Tax-Managed International Equity Portfolio as of October 31, 2005
FINANCIAL STATEMENTS
Statement of Assets and Liabilities
As of October 31, 2005
| Assets | |
| Investments, at value (identified cost, $109,247,040) | | $ | 151,478,762 | | |
| Foreign currency, at value (identified cost, $6,609) | | | 6,594 | | |
| Interest and dividends receivable | | | 207,915 | | |
| Tax reclaim receivable | | | 155,242 | | |
| Total assets | | $ | 151,848,513 | | |
| Liabilities | |
| Payable to affiliate for investment advisory fees | | $ | 126,101 | | |
| Payable for investments purchased | | | 30,371 | | |
| Due to custodian | | | 28,888 | | |
| Accrued expenses | | | 62,545 | | |
| Total liabilities | | $ | 247,905 | | |
| Net Assets applicable to investors' interest in Portfolio | | $ | 151,600,608 | | |
| Sources of Net Assets | |
| Net proceeds from capital contributions and withdrawals | | $ | 109,375,304 | | |
| Net unrealized appreciation (computed on the basis of identified cost) | | | 42,225,304 | | |
| Total | | $ | 151,600,608 | | |
Statement of Operations
For the Year Ended
October 31, 2005
| Investment Income | |
| Dividends (net of foreign taxes, $345,201) | | $ | 3,669,758 | | |
| Interest | | | 30,556 | | |
| Total investment income | | $ | 3,700,314 | | |
| Expenses | |
| Investment adviser fee | | $ | 1,433,736 | | |
| Trustees' fees and expenses | | | 7,450 | | |
| Custodian fee | | | 186,759 | | |
| Legal and accounting services | | | 30,632 | | |
| Miscellaneous | | | 9,264 | | |
| Total expenses | | $ | 1,667,841 | | |
| Net investment income | | $ | 2,032,473 | | |
| Realized and Unrealized Gain (Loss) | |
Net realized gain (loss) —
Investment transactions (identified cost basis) | | $ | 6,566,334 | | |
| Foreign currency transactions | | | (271,512 | ) | |
| Net realized gain | | $ | 6,294,822 | | |
Change in unrealized appreciation (depreciation) —
Investments (identified cost basis) | | $ | 21,432,726 | | |
| Foreign currency | | | (13,529 | ) | |
| Net change in unrealized appreciation (depreciation) | | $ | 21,419,197 | | |
| Net realized and unrealized gain | | $ | 27,714,019 | | |
| Net increase in net assets from operations | | $ | 29,746,492 | | |
See notes to financial statements
21
Tax-Managed International Equity Portfolio as of October 31, 2005
FINANCIAL STATEMENTS CONT'D
Statements of Changes in Net Assets
Increase (Decrease)
in Net Assets | | Year Ended
October 31, 2005 | | Year Ended
October 31, 2004 | |
From operations —
Net investment income | | $ | 2,032,473 | | | $ | 1,517,905 | | |
Net realized gain from investments and
foreign currency transactions | | | 6,294,822 | | | | 8,799,001 | | |
Net change in unrealized
appreciation (depreciation)
from investments and
foreign currency | | | 21,419,197 | | | | 6,269,258 | | |
| Net increase in net assets from operations | | $ | 29,746,492 | | | $ | 16,586,164 | | |
Capital transactions —
Contributions | | $ | 9,201,552 | | | $ | 27,502,487 | | |
| Withdrawals | | | (19,362,515 | ) | | | (20,527,595 | ) | |
Net increase (decrease) in net assets from
capital transactions | | $ | (10,160,963 | ) | | $ | 6,974,892 | | |
| Net increase in net assets | | $ | 19,585,529 | | | $ | 23,561,056 | | |
| Net Assets | |
| At beginning of year | | $ | 132,015,079 | | | $ | 108,454,023 | | |
| At end of year | | $ | 151,600,608 | | | $ | 132,015,079 | | |
See notes to financial statements
22
Tax-Managed International Equity Portfolio as of October 31, 2005
FINANCIAL STATEMENTS CONT'D
Supplementary Data
| | | Year Ended October 31, | |
| | | 2005 | | 2004 | | 2003 | | 2002 | | 2001(1) | |
| Ratios/Supplemental Data | |
| Ratios (As a percentage of average daily net assets): | |
| Expenses | | | 1.16 | % | | | 1.21 | % | | | 1.23 | % | | | 1.20 | % | | | 1.23 | %(2) | |
| Expenses after custodian fee reduction | | | 1.16 | % | | | 1.21 | % | | | 1.23 | % | | | 1.20 | % | | | 1.23 | %(2) | |
| Net investment income (loss) | | | 1.42 | % | | | 1.24 | % | | | 1.15 | % | | | (0.01 | )% | | | (0.59 | )%(2) | |
| Portfolio Turnover | | | 39 | % | | | 62 | % | | | 100 | % | | | 128 | % | | | 31 | % | |
| Total Return(3) | | | 23.36 | % | | | 15.04 | % | | | 17.52 | % | | | (27.07 | )% | | | — | | |
| Net assets, end of year (000's omitted) | | $ | 151,601 | | | $ | 132,015 | | | $ | 108,454 | | | $ | 95,920 | | | $ | 139,518 | | |
(1) For the period from the start of business July 23, 2001, to October 31, 2001.
(2) Annualized.
(3) Total return is required to be disclosed for fiscal years beginning after December 15, 2000.
See notes to financial statements
23
Tax-Managed International Equity Portfolio as of October 31, 2005
NOTES TO FINANCIAL STATEMENTS
1 Significant Accounting Policies
Tax-Managed International Equity Portfolio (the Portfolio) is registered under the Investment Company Act of 1940, as amended, as a diversified open-end management investment company. The Portfolio, which was organized as a trust under the laws of the State of New York on June 22, 1998, seeks to achieve long-term after-tax returns by investing in a diversified portfolio of foreign equity securities. The Declaration of Trust permits the Trustees to issue interests in the Portfolio. At October 31, 2005, the Eaton Vance Tax-Managed International Equity Fund and the Eaton Vance Tax-Managed Equity Asset Allocation Fund held 50.2% and 49.6% interests in the Portfolio, respectively. The following is a summary of significant accounting policies consistently followed by the Portfolio in the preparation of its financial statements. The policies are in conformity with accounting principles generally accepted in the United States of America .
A Investment Valuation — Securities listed on a U.S. securities exchange generally are valued at the last sale price on the day of valuation or, if no sales took place on such date, at the mean between the closing bid and asked prices therefore on the exchange where such securities are principally traded. Equity securities listed on the NASDAQ National Market System generally are valued at the official NASDAQ closing price. Unlisted or listed securities for which closing sales prices or closing quotations are not available are valued at the mean between the latest available bid and asked prices or, in the case of preferred equity securities that are not listed or traded in the over-the-counter market, by an independent pricing service. Exchange-traded options are valued a t the last sale price for the day of valuation as quoted on the principal exchange or board of trade on which the options are traded or, in the absence of sales on such date, at the mean between the latest bid and asked prices therefore. Futures positions on securities and currencies generally are valued at closing settlement prices. Short-term debt securities with a remaining maturity of 60 days or less are valued at amortized cost. If short-term debt securities were acquired with a remaining maturity of more than 60 days, their amortized cost value will be based on their value on the sixty-first day prior to maturity. Other fixed income and debt securities, including listed securities and securities for which price quotations are available, will normally be valued on the basis of valuations furnished by a pricing service. Foreign securities and currencies are valued in U.S. dollars, based on foreign currency exchange rate quotations supplied by an independent quotation service. The daily valuation of excha nge-traded foreign securities generally is determined as of the close of trading on the principal exchange on which such securities trade. Events occurring after the close of trading on foreign exchanges may result in adjustments to the valuation of foreign securities to more accurately reflect their fair value as of the close of regular trading on the New York Stock Exchange. When valuing foreign equity securities that meet certain criteria, the Trustees have approved the use of a fair value service that values such securities to reflect market trading that occurs after the close of the applicable foreign markets of comparable securities or other instruments that have a strong correlation to the fair-valued securities. Investments held by the Portfolio for which valuations or market quotations are unavailable are valued at fair value using methods determined in good faith by or at the direction of the Trustees of the Portfolio consideri ng relevant factors, data and information including the market value of freely tradable securities of the same class in the principal market on which such securities are normally traded.
B Income — Dividend income is recorded on the ex-dividend date for dividends received in cash and/or securities. However, if the ex-dividend date has passed, certain dividends from foreign securities are recorded as the Portfolio is informed of the ex-dividend date. Interest income is recorded on the accrual basis.
C Income Taxes — The Portfolio is treated as a partnership for federal tax purposes. No provision is made by the Portfolio for federal or state taxes on any taxable income of the Portfolio because each investor in the Portfolio is ultimately responsible for the payment of any taxes on its share of taxable income. Since the Portfolio's investors include regulated investment companies that invest all or substantially all of their assets in the Portfolio, the Portfolio normally must satisfy the applicable source of income and diversification requirements (under the Internal Revenue Code) in order for its investors to satisfy them. The Portfolio will allocate at least annually among its investors each investor's distributive share of the Portfolio's net investment income, net realized capital gains, and any other items of income, gain, loss, deduction or credit.
D Financial Futures Contracts — Upon entering a financial futures contract, the Portfolio is required to deposit either in cash or securities an amount (initial margin) equal to a certain percentage of the purchase price indicated in the financial futures contract. Subsequent payments are made or received by the Portfolio (margin maintenance) each day, dependent on daily fluctuations in the value of the underlying security, and are recorded for book purposes as unrealized gains or losses by the Portfolio.
24
Tax-Managed International Equity Portfolio as of October 31, 2005
NOTES TO FINANCIAL STATEMENTS CONT'D
The Portfolio's investment in financial futures contracts is designed to hedge against anticipated future changes in price of current or anticipated Portfolio positions. Should prices move unexpectedly, the Portfolio may not achieve the anticipated benefits of the financial futures contracts and may realize a loss.
E Put Options — Upon the purchase of a put option by the Portfolio, the premium paid is recorded as an investment, the value of which is marked-to-market daily. When a purchased option expires, the Portfolio will realize a loss in the amount of the cost of the option. When the Portfolio enters into a closing sale transaction, the Portfolio will realize a gain or loss depending on whether the sales proceeds from the closing sale transaction are greater or less than the cost of the option. When the Portfolio exercises a put option, settlement is made in cash. The risk associated with purchasing options is limited to the premium originally paid.
F Foreign Currency Translation — Investment valuations, other assets, and liabilities initially expressed in foreign currencies are converted each business day into U.S. dollars based upon current exchange rates. Purchases and sales of foreign investment securities and income and expenses are converted into U.S. dollars based upon currency exchange rates prevailing on the respective dates of such transactions. Recognized gains or losses on investment transactions attributable to foreign currency exchange rates are recorded for financial statement purposes as net realized gains and losses on investments. That portion of unrealized gains and losses on investments that results from fluctuations in foreign currency exchange rates is not separately disclosed.
G Forward Foreign Currency Exchange Contracts — The Portfolio may enter into forward foreign currency exchange contracts for the purchase or sale of a specific foreign currency at a fixed price on a future date. Risks may arise upon entering these contracts from the potential inability of counterparties to meet the terms of their contracts and from movements in the value of a foreign currency relative to the U.S. dollar. The Portfolio will enter into forward contracts for hedging purposes as well as non-hedging purposes. The forward foreign currency exchange contracts are adjusted by the daily exchange rate of the underlying currency and any gains or losses are recorded for financial statement purposes as unrealized until such time as the contracts have been closed or off set.
H Expense Reduction — Investors Bank & Trust Company (IBT) serves as custodian to the Portfolio. Pursuant to the custodian agreement, IBT receives a fee reduced by credits which are determined based on the average daily cash balances the Portfolio maintains with IBT. All credit balances used to reduce the Portfolio's custodian fees are reported as a reduction of expenses on the Statement of Operations.
I Use of Estimates — The preparation of the financial statements in conformity with accounting principles generally accepted in the United States of America requires management to make estimates and assumptions that affect the reported amounts of assets and liabilities at the date of the financial statements and the reported amounts of income and expense during the reporting period. Actual results could differ from those estimates.
J Indemnifications — Under the Portfolio's organizational documents, its officers and Trustees may be indemnified against certain liabilities and expenses arising out of the performance of their duties to the Portfolio. Interestholders in the Portfolio are jointly and severally liable for the liabilities and obligations of the Portfolio in the event that the Portfolio fails to satisfy such liabilities and obligations; provided, however, that, to the extent assets are available in the Portfolio, the Portfolio may, under certain circumstances, indemnify interestholders from and against any claim or liability to which such holder may become subject by reason of being or having been an interestholder in the Portfolio. Additionally, in the normal course of business, the Portfo lio enters into agreements with service providers that may contain indemnification clauses. The Portfolio's maximum exposure under these arrangements is unknown as this would involve future claims that may be made against the Portfolio that have not yet occurred.
K Other — Investment transactions are accounted for on a trade date basis. Realized gains and losses are computed based on the specific identification of the securities sold.
2 Investment Adviser Fee and Other Transactions with Affiliates
The investment adviser fee is earned by Boston Management and Research (BMR), a wholly-owned subsidiary of Eaton Vance Management (EVM), as compensation for management and investment advisory services rendered to the Portfolio. BMR receives a monthly advisory fee in the amount of 1.00% annually of the
25
Tax-Managed International Equity Portfolio as of October 31, 2005
NOTES TO FINANCIAL STATEMENTS CONT'D
average daily net assets of the Portfolio up to $500 million and at reduced rates as daily net assets exceed that level. For the year ended October 31, 2005, the advisory fee amounted to $1,433,736. Pursuant to a sub-advisory agreement, BMR has delegated the investment management of the Portfolio to Eagle Global Advisors, L.L.C. ("Eagle"). BMR pays Eagle a monthly sub-advisory fee equal to 0.50% annually of the average daily net assets of the Portfolio up to $500 million, and at reduced rates as daily net assets exceed that level. Except for Trustees of the Portfolio who are not members of EVM's or BMR's organization, officers and Trustees receive remuneration for their services to the Portfolio out of the investment adviser and sub-adviser fees. Trustees of the Portfolio that are not affiliated with BMR may elect to defer receipt of all or a percentage of their annual fees in accordance with the terms of the Trustees Deferred C ompensation Plan. For the year ended October 31, 2005, no significant amounts have been deferred. Certain officers and Trustees of the Portfolio are officers of the above organizations.
3 Investment Transactions
Purchases and sales of investments, other than short-term obligations, aggregated $55,533,686 and $62,727,475, respectively, for the year ended October 31, 2005.
4 Federal Income Tax Basis of Investments
The cost and unrealized appreciation (depreciation) in value of the investments owned at October 31, 2005, as computed on a federal income tax basis, were as follows:
| Aggregate cost | | $ | 110,034,343 | | |
| Gross unrealized appreciation | | $ | 41,501,729 | | |
| Gross unrealized depreciation | | | (57,310 | ) | |
| Net unrealized appreciation | | $ | 41,444,419 | | |
The net unrealized depreciation on foreign currency at October 31, 2005 was $6,418.
5 Financial Instruments
The Portfolio may trade in financial instruments with off-balance sheet risk in the normal course of its investing activities to assist in managing exposure to various market risks. These financial instruments include written options, forward foreign currency contracts and financial futures contracts and may involve, to a varying degree, elements of risk in excess of the amounts recognized for financial statement purposes. The notional or contractual amounts of these instruments represent the investment the Portfolio has in particular classes of financial instruments and does not necessarily represent the amounts potentially subject to risk. The measurement of the risks associated with these instruments is meaningful only when all related and offsetting transactions are considered. The Portfolio did not have any open obligations under these financial instrum ents at October 31, 2005.
6 Line of Credit
The Portfolio participates with other portfolios and funds managed by BMR and EVM and its affiliates in a $150 million unsecured line of credit agreement with a group of banks. Borrowings will be made by the Portfolio solely to facilitate the handling of unusual and/or unanticipated short-term cash requirements. Interest is charged to each participating portfolio or fund based on its borrowings at an amount above either the Eurodollar rate or federal funds rate. In addition, a fee computed at an annual rate of 0.10% on the daily unused portion of the line of credit is allocated among the participating portfolios and funds at the end of each quarter. The Portfolio did not have any significant borrowings or allocated fees during the year ended October 31, 2005.
7 Overdraft Advances
Pursuant to the custodian agreement between the Portfolio and IBT, IBT may, in its discretion, advance funds to the Portfolio to make properly authorized payments. When such payments result in an overdraft by the Portfolio, the Portfolio is obligated to repay IBT at the current rate of interest charged by IBT for secured loans (currently a rate above the federal funds rate). This obligation is payable on demand to IBT. IBT has a lien on the Portfolio's assets to the extent of any overdraft. At October 31, 2005, payment due to IBT pursuant to the foregoing arrangement was $28,888.
8 Risks Associated with Foreign Investments
Investing in securities issued by companies whose principal business activities are outside the United States may involve significant risks not present in domestic investments. For example, there is generally less publicly available information about foreign companies, particularly those not subject to the disclosure and reporting requirements of the U.S. securities laws. Foreign issuers are generally not bound by uniform accounting, auditing, and financial reporting requirements and standards of practice comparable to those applicable to domestic issuers. Investments in foreign securities also involve the risk of possible adverse changes in investment or exchange control regulations, expropriation or confiscatory taxation, limitation on the removal of funds
26
Tax-Managed International Equity Portfolio as of October 31, 2005
NOTES TO FINANCIAL STATEMENTS CONT'D
or other assets of the Portfolio, political or financial instability or diplomatic and other developments which could affect such investments. Foreign stock markets, while growing in volume and sophistication, are generally not as developed as those in the United States, and securities of some foreign issuers (particularly those located in developing countries) may be less liquid and more volatile than securities of comparable U.S. companies. In general, there is less overall governmental supervision and regulation of foreign securities markets, broker-dealers and issuers than in the United States.
27
Tax-Managed International Equity Portfolio as of October 31, 2005
REPORT OF INDEPENDENT REGISTERED PUBLIC ACCOUNTING FIRM
To the Trustees and Investors
of Tax-Managed International Equity Portfolio:
We have audited the accompanying statement of assets and liabilities of Tax-Managed International Equity Portfolio (the Portfolio), ncluding the portfolio of investments as of October 31, 2005, the related statement of operations for the year then ended, the statements of changes in net assets for each of the two years in the period then ended and the supplementary data for each of the four years in the period then ended, and for the period from the start of business, July 23, 2001, to October 31, 2001. These financial statements and supplementary data are the responsibility of the Portfolio's management. Our responsibility is to express an opinion on these financial statements and supplementary data based on our audits.
We conducted our audits in accordance with standards of the Public Company Accounting Oversight Board (United States). Those standards require that we plan and perform the audits to obtain reasonable assurance about whether the financial statements and supplementary data are free of material misstatement. The Portfolio is not required to have, nor were we engaged to perform, an audit of its internal control over financial reporting. An audit includes consideration of internal control over financial reporting as a basis for designing audit procedures that are appropriate for the circumstances, but not for the purpose of expressing an opinion on the effectiveness of the Portfolio's internal control over financial reporting. Accordingly, we express no such opinion. An audit also includes examining, on a test basis, evidence supporting the amounts and disclosures in the financial statements, assessing the principles used and signifi cant estimates made by management, as well as evaluating the overall financial statement presentation. Our procedures included confirmation of securities owned as of October 31, 2005 by correspondence with the custodian and brokers; where replies were not received from brokers, we performed other auditing procedures. We believe that our audits provide a reasonable basis for our opinion.
In our opinion, such financial statements and supplementary data referred to above present fairly, in all material respects, the financial position of the Tax-Managed International Equity Portfolio as of October 31, 2005, the results of its operations for the year then ended, the changes in its net assets for each of the two years in the period then ended, and the supplementary data for each of the four years in the period then ended and the period from the start of business, July 23, 2001 to October 31, 2001, in conformity with accounting principles generally accepted in the United States of America.
Deloitte & Touche LLP
Boston, Massachusetts
December 19, 2005
28
Eaton Vance Tax-Managed International Equity Fund
BOARD OF TRUSTEES' ANNUAL APPROVAL OF THE INVESTMENT ADVISORY AND SUB-ADVISORY AGREEMENTS
The investment advisory agreement between Tax-Managed International Equity Portfolio (the "Portfolio") and the investment adviser, Boston Management and Research, and the investment sub-advisory agreement between the investment adviser and the sub-adviser, Eagle Global Advisors, L.L.C. ("Eagle"), each provide that the agreement will continue in effect from year to year so long as its continuance is approved at least annually (i) by a vote of a majority of the noninterested Trustees of the Portfolio cast in person at a meeting called for the purpose of voting on such approval and (ii) by the Trustees of the Portfolio or by vote of a majority of the outstanding interests of the Portfolio.
In considering the annual approval of the investment advisory and sub-advisory agreements, the Special Committee of the Board of Trustees considered information that had been provided throughout the year at regular Board meetings, as well as information furnished for a series of meetings held in February and March in preparation for a Board meeting held on March 21, 2005 to specifically consider the renewal of the investment advisory and sub-advisory agreements. Such information included, among other things, the following:
• An independent report comparing the advisory fees of the Portfolio with those of comparable funds;
• An independent report comparing the expense ratio of the Eaton Vance Tax-Managed International Equity Fund (the "Fund") to those of comparable funds;
• Information regarding Fund investment performance in comparison to relevant peer groups of funds and appropriate indices;
• The economic outlook and the general investment outlook in relevant investment markets;
• Eaton Vance Management's ("Eaton Vance") results and financial condition and the overall organization of the investment adviser;
• The procedures and processes used to determine the fair value of Fund assets and actions taken to monitor and test the effectiveness of such procedures and processes;
• The allocation of brokerage and the benefits received by the investment adviser as the result of brokerage allocation;
• Eaton Vance's management of the relationship with the custodian, subcustodians and fund accountants;
• The resources devoted to compliance efforts undertaken by Eaton Vance and Eagle, where applicable, on behalf of the funds they manage and the record of compliance with the investment policies and restrictions and with policies on personal securities transactions;
• The quality, nature, cost and character of the administrative and other non-investment management services provided by Eaton Vance and its affiliates; and
• The terms of the advisory agreement and the reasonableness and appropriateness of the particular fee paid by the Portfolio for the services described therein.
The Special Committee also considered the nature, extent and quality of the management services provided by the investment adviser and the sub-adviser. In so doing, the Special Committee considered their management capabilities with respect to the types of investments held by the Portfolio, including information relating to the education, experience and number of investment professionals and other personnel who provide services under the investment advisory and sub-advisory agreements. The Special Committee specifically noted the investment adviser's in-house equity research capabilities and experience in managing funds that seek to maximize after-tax returns. The Special Committee evaluated the level of skill required to manage the Portfolio and concluded that the human resources available at the investment adviser and sub-adviser were appropriate to fulfill effectively their duties on behalf of the Portfolio.
In its review of comparative information with regard to investment performance, the Special Committee noted that since assuming responsibility for day-to-day portfolio management in May 2004, Eagle has taken actions to improve the performance of the Fund, such as significantly restructuring portfolio holdings. The Special Committee concluded that it is appropriate to allow reasonable time to evaluate the effectiveness of these actions.
With respect to its review of investment advisory and sub-advisory fees, the Special Committee concluded that the fees paid by the Portfolio are within the range of those paid by comparable funds within the mutual fund industry. In reviewing the information regarding the expense ratio of the Fund, the Special Committee concluded that, in light of the asset size of the Fund, the Fund's expense ratio is reasonable.
29
Eaton Vance Tax-Managed International Equity Fund
BOARD OF TRUSTEES' ANNUAL APPROVAL OF THE INVESTMENT ADVISORY AND SUB-ADVISORY AGREEMENTS CONT'D
In addition to the factors mentioned above, the Special Committee reviewed the level of profits of the investment adviser in providing investment management services for the Portfolio and for all Eaton Vance funds as a group. The Special Committee also reviewed the implementation of a soft dollar reimbursement program pursuant to which the Portfolio may receive reimbursement payments in respect of third party research services obtained by the investment adviser or sub-adviser as a result of soft dollar credits generated through trading on behalf of the Portfolio. The Special Committee also reviewed the benefits to Eaton Vance and its affiliates in providing administration services for the Fund and for all Eaton Vance funds as a group. In addition, the Special Committee considered the fiduciary duty assumed by the investment adviser and sub-adviser in connection with the services rendered to the Portfolio and the business reputat ion of the investment adviser and its financial resources. The Special Committee also concluded that, in light of its role as a sub-adviser not affiliated with the Portfolio's investment adviser, Eagle's profitability in managing the Portfolio was not a material factor. The Trustees concluded that in light of the services rendered, the profits realized by the investment adviser are not unreasonable. The Special Committee also considered the extent to which the investment adviser and sub-adviser appear to be realizing benefits from economies of scale in managing the Portfolio, and concluded that the fee breakpoints which are in place will allow for an equitable sharing of such benefits, when realized, with the Portfolio and the shareholders of the Fund.
The Special Committee did not consider any single factor as controlling in determining whether or not to renew the investment advisory and sub-advisory agreements. Nor are the items described herein all the matters considered by the Special Committee. In assessing the information provided by Eaton Vance and its affiliates, the Special Committee also took into consideration the benefits to shareholders of investing in a fund that is a part of a large family of funds which provides a large variety of shareholder services.
Based on its consideration of the foregoing factors and conclusions, and such other factors and conclusions as it deemed relevant, and assisted by independent counsel, the Special Committee concluded that the renewal of the investment advisory and sub-advisory agreements, including the fee structures, is in the interests of shareholders.
30
Eaton Vance Tax-Managed International Equity Fund
MANAGEMENT AND ORGANIZATION
Fund Management. The Trustees of Eaton Vance Mutual Funds Trust (the Trust) and Tax-Managed International Equity Portfolio (the Portfolio) are responsible for the overall management and supervision of the Trust's and Portfolio's affairs. The Trustees and officers of the Trust and the Portfolio are listed below. Except as indicated, each individual has held the office shown or other offices in the same company for the last five years. Trustees and officers of the Trust and the Portfolio hold indefinite terms of office. The "noninterested Trustees" consist of those Trustees who are not "interested persons" of the Trust and the Portfolio, as that term is defined under the 1940 Act. The business address of each Trustee and officer is The Eaton Vance Building, 255 State Street, Boston, Massachusetts 02109. As used below, "EVC" refers to Eaton Vance Corp., "EV" re fers to Eaton Vance, Inc., "EVM" refers to Eaton Vance Management, "BMR" refers to Boston Management and Research and "EVD" refers to Eaton Vance Distributors, Inc. EVC and EV are the corporate parent and trustee, respectively, of EVM and BMR. EVD is the Fund's principal underwriter, the Portfolio's placement agent and a wholly-owned subsidiary of EVM. Each officer affiliated with Eaton Vance may hold a position with other Eaton Vance affiliates that is comparable to its position with EVM listed below.
Name and
Date of Birth | | Position(s)
with the
Trust and
the Portfolio | | Term of
Office and
Length of
Service | | Principal Occupation(s)
During Past Five Years | | Number of Portfolios
in Fund Complex
Overseen By
Trustee(1) | | Other Directorships Held | |
| Interested Trustee | | | | | | | | | | | | | |
|
| James B. Hawkes 11/9/41 | | Trustee | | Trustee of the Trust since 1991; of the Portfolio since 1998 | | Chairman, President and Chief Executive Officer of BMR, EVC, EVM and EV; Director of EV; Vice President and Director of EVD. Trustee and/or officer of 161 registered investment companies in the Eaton Vance Fund Complex. Mr. Hawkes is an interested person because of his positions with BMR, EVM, EVC and EV, which are affiliates of the Trust and the Portfolio. | | | 161 | | | Director of EVC | |
|
| Noninterested Trustees(s) | | | | | | | | | | | | | |
|
| Benjamin C. Esty 1/26/63 | | Trustee | | Since 2005 | | Professor, Harvard University Graduate School of Business Administration (since 2003). Formerly, Associate Professor, Harvard University Graduate School of Business Administration (2000-2003). | | | 152 | | | None | |
|
| Samuel L. Hayes, III 2/23/35 | | Trustee | | Trustee of the Trust since 1986; of the Portfolio since 1998 and Chairman of the Board since 2005 | | Jacob H. Schiff Professor of Investment Banking Emeritus, Harvard University Graduate School of Business Administration. | | | 161 | | | Director of Tiffany & Co. (specialty retailer) and Telect, Inc. (telecommunication services company) | |
|
| William H. Park 9/19/47 | | Trustee | | Since 2003 | | President and Chief Executive Officer, Prizm Capital Management, LLC (investment management firm) (since 2002). Executive Vice President and Chief Financial Officer, United Asset Management Corporation (a holding company owning institutional investment management firms) (1982-2001). | | | 161 | | | None | |
|
| Ronald A. Pearlman 7/10/40 | | Trustee | | Since 2003 | | Professor of Law, Georgetown University Law Center (since 1999). Tax Partner Covington & Burling, Washington, DC (1991-2000). | | | 161 | | | None | |
|
31
Eaton Vance Tax-Managed International Equity Fund
MANAGEMENT AND ORGANIZATION CONT'D
Name and
Date of Birth | | Position(s)
with the
Trust and
the Portfolio | | Term of
Office and
Length of
Service | | Principal Occupation(s)
During Past Five Years | | Number of Portfolios
in Fund Complex
Overseen By
Trustee(1) | | Other Directorships Held | |
| Noninterested Trustee(s) (continued) | | | | | | | | | | | | | |
|
| Norton H. Reamer 9/21/35 | | Trustee | | Trustee of the Trust since 1986; of the Portfolio since 1998 | | President, Chief Executive Officer and a Director of Asset Management Finance Corp. (a specialty finance company serving the investment management industry) (since October 2003). President, Unicorn Corporation (an investment and financial advisory services company) (since September 2000). Formerly, Chairman, Hellman, Jordan Management Co., Inc. (an investment management company) (2000-2003). Formerly, Advisory Director of Berkshire Capital Corporation (investment banking firm) (2002-2003). Formerly Chairman of the Board, United Asset Management Corporation (a holding company owning institutional investment management firms) and Chairman, President and Director, UAM Funds (mutual funds) (1980-2000). | | | 161 | | | None | |
|
| Lynn A. Stout 9/14/57 | | Trustee | | Since 1998 | | Professor of Law, University of California at Los Angeles School of Law (since July 2001). Formerly, Professor of Law, Georgetown University Law Center. | | | 161 | | | None | |
|
| Ralph F. Verni 1/26/43 | | Trustee | | Since 2005 | | Consultant and private investor (since 2000). Formerly, President and Chief Executive Officer, Redwood Investment Systems, Inc. (software developer) (2000). Formerly, President and Chief Executive Officer, State Street Research & Management (investment advisor), SSRM Holdings (parent of State Street Research & Management), and SSR Realty (institutional realty manager) (1992-2000). | | | 152 | | | Director of W.P. Carey & Company LLC (manager of real estate investement trusts) | |
|
| Principal Officers who are not Trustees | | | | | | | |
|
Name and
Date of Birth | | Position(s)
with the
Trust and
the Portfolio | | Term of
Office and
Length of
Service | | Principal Occupation(s)
During Past Five Years | |
| Thomas E. Faust Jr. 5/31/58 | | President of the Trust | | Since 2002 | | Executive Vice President of EVM, BMR, EVC and EV; Chief Investment Officer of EVM and BMR and Director of EVC. Chief Executive Officer of Belair Capital Fund LLC, Belcrest Capital Fund LLC, Belmar Capital Fund LLC, Belport Capital Fund LLC and Belrose Capital Fund LLC (private investment companies sponsored by EVM). Officer of 65 registered investment companies managed by EVM or BMR. | |
|
| William H. Ahern, Jr. 7/28/59 | | Vice President of the Trust | | Since 1995 | | Vice President of EVM and BMR. Officer of 70 registered investment companies managed by EVM or BMR. | |
|
| Edward R. Allen, III 7/5/60 | | Vice President of the Portfolio | | Since 2004 | | Partner and Chairman of the International Investment Committee of Eagle Global Advisors, L.L.C. Officer of 1 registered investment company managed by EVM or BMR. | |
|
| Cynthia J. Clemson 3/2/63 | | Vice President of the Trust | | Since 2005 | | Vice President of EVM and BMR. Officer of 85 registered investment companies managed by EVM or BMR | |
|
| Kevin S. Dyer 2/21/75 | | Vice President of the Trust | | Since 2005 | | Assistant Vice President of EVM and BMR. Officer of 24 registered investment companies managed by EVM or BMR. | |
|
| Thomas N. Hunt, III 11/6/64 | | Vice President of the Portfolio | | Since 2004 | | Partner of Eagle Global Advisors, L.L.C. Officer of 1 registered investment company managed by EVM or BMR. | |
|
32
Eaton Vance Tax-Managed International Equity Fund
MANAGEMENT AND ORGANIZATION CONT'D
Name and
Date of Birth | | Position(s)
with the
Trust and
the Portfolio | | Term of
Office and
Length of
Service | | Principal Occupation(s)
During Past Five Years | |
| Principal Officers who are not Trustees (continued) | | | | | | | |
|
| Aamer Khan 6/7/60 | | Vice President of the Trust | | Since 2005 | | Vice President of EVM and BMR. Officer of 27 registered investment companies managed by EVM or BMR. | |
|
| Michael R. Mach 7/15/47 | | Vice President of the Trust | | Since 1999 | | Vice President of EVM and BMR. Officer of 32 registered investment companies managed by EVM or BMR. | |
|
| Robert B. MacIntosh 1/22/57 | | Vice President of the Trust | | Since 1998 | | Vice President of EVM and BMR. Officer of 85 registered investment companies managed by EVM and BMR. | |
|
| Duncan W. Richardson 10/26/57 | | Vice President of the Trust; President of the Portfolio | | Vice President of the Trust since 2001; President of the Portfolio since 2002 | | Senior Vice President and Chief Equity Investment Officer of EVM and BMR. Officer of 51 registered investment companies managed by EVM or BMR. | |
|
| Walter A. Row, III 7/20/57 | | Vice President of the Trust | | Since 2001 | | Director of Equity Research and a Vice President of EVM and BMR. Officer of 31 registered investment companies managed by EVM or BMR. | |
|
| Judith A. Saryan 8/21/54 | | Vice President of the Trust | | Since 2003 | | Vice President of EVM and BMR. Officer of 33 registered investment companies managed by EVM or BMR. | |
|
| Susan Schiff 3/13/61 | | Vice President of the Trust | | Since 2002 | | Vice President of EVM and BMR. Officer of 29 registered investment companies managed by EVM or BMR. | |
|
| Kristin S. Anagnost 6/12/65 | | Treasurer of the Portfolio | | Since 2002(2) | | Assistant Vice President of EVM and BMR. Officer of 91 registered investment companies managed by EVM or BMR. | |
|
| Barbara E. Campbell 6/19/57 | | Treasurer of the Trust | | Since 2005(3) | | Vice President of EVM and BMR. Officer of 161 registered investment companies managed by EVM or BMR. | |
|
| Alan R. Dynner 10/10/40 | | Secretary | | Secretary of the Trust since 1997; of the Portfolio since 1998 | | Vice President, Secretary and Chief Legal Officer of BMR, EVM, EVD, EV and EVC. Officer of 161 registered investment companies managed by EVM or BMR. | |
|
| Paul M. O'Neil 7/11/53 | | Chief Compliance Officer | | Since 2004 | | Vice President of EVM and BMR. Officer of 161 registered investment companies managed by EVM or BMR. | |
|
(1) Includes both master and feeder funds in a master-feeder structure.
(2) Prior to 2002, Ms. Anagnost served as Assistant Treasurer of the Portfolio since 1998.
(3) Prior to 2005, Ms. Campbell served as Assistant Treasurer of the Trust since 1995.
The SAI for the Fund includes additional information about the Trustees and officers of the Fund and the Portfolio and can be obtained without charge by calling 1-800-225-6265.
33
Investment Adviser of Tax-Managed International Equity Portfolio
Boston Management and Research
The Eaton Vance Building
255 State Street
Boston, MA 02109
Sub-Adviser of Tax-Managed International Equity Portfolio
Eagle Global Advisors, L.L.C.
5847 San Felipe, Suite 930
Houston, TX 77057
Administrator of Eaton Vance Tax-Managed International Equity Fund
Eaton Vance Management
The Eaton Vance Building
255 State Street
Boston, MA 02109
Principal Underwriter
Eaton Vance Distributors, Inc.
The Eaton Vance Building
255 State Street
Boston, MA 02109
(617) 482-8260
Custodian
Investors Bank & Trust Company
200 Clarendon Street
Boston, MA 02116
Transfer Agent
PFPC Inc.
Attn: Eaton Vance Funds
P.O. Box 9653
Providence, RI 02940-9653
(800) 262-1122
Independent Registered Public Accounting Firm
Deloitte & Touche LLP
200 Berkeley Street
Boston, MA 02116-5022
Eaton Vance Tax-Managed International Equity Fund
The Eaton Vance Building
255 State Street
Boston, MA 02109
This report must be preceded or accompanied by a current prospectus. Before investing, investors should consider carefully the Fund's investment objective(s), risks, and charges and expenses. The Fund's current prospectus contains this and other information about the Fund and is available through your financial advisor. Please read the prospectus carefully before you invest or send money. For further information please call 1-800-225-6265.
038-12/05 IGSRC

Annual Report October 31, 2005


EATON VANCE
TAX-MANAGED
MID-CAP
CORE
FUND
IMPORTANT NOTICES REGARDING PRIVACY,
DELIVERY OF SHAREHOLDER DOCUMENTS,
PORTFOLIO HOLDINGS AND PROXY VOTING
Privacy. The Eaton Vance organization is committed to ensuring your financial privacy. Each of the financial institutions identified below has in effect the following policy ("Privacy Policy") with respect to nonpublic personal information about its customers:
• Only such information received from you, through application forms or otherwise, and information about your Eaton Vance fund transactions will be collected. This may include information such as name, address, social security number, tax status, account balances and transactions.
• None of such information about you (or former customers) will be disclosed to anyone, except as permitted by law (which includes disclosure to employees necessary to service your account). In the normal course of servicing a customer's account, Eaton Vance may share information with unaffiliated third parties that perform various required services such as transfer agents, custodians and broker/dealers.
• Policies and procedures (including physical, electronic and procedural safeguards) are in place that are designed to protect the confidentiality of such information.
• We reserve the right to change our Privacy Policy at any time upon proper notification to you. Customers may want to review our Policy periodically for changes by accessing the link on our homepage: www.eatonvance.com.
Our pledge of privacy applies to the following entities within the Eaton Vance organization: the Eaton Vance Family of Funds, Eaton Vance Management, Eaton Vance Investment Counsel, Boston Management and Research, and Eaton Vance Distributors, Inc.
In addition, our Privacy Policy only applies to those Eaton Vance customers who are individuals and who have a direct relationship with us. If a customer's account (i.e., fund shares) is held in the name of a third-party financial adviser/ broker-dealer, it is likely that only such adviser's privacy policies apply to the customer. This notice supersedes all previously issued privacy disclosures.
For more information about Eaton Vance's Privacy Policy, please call 1-800-262-1122.
Delivery of Shareholder Documents. The Securities and Exchange Commission (the "SEC") permits funds to deliver only one copy of shareholder documents, including prospectuses, proxy statements and shareholder reports, to fund investors with multiple accounts at the same residential or post office box address. This practice is often called "householding" and it helps eliminate duplicate mailings to shareholders.
Eaton Vance, or your financial adviser, may household the mailing of your documents indefinitely unless you instruct Eaton Vance, or your financial adviser, otherwise.
If you would prefer that your Eaton Vance documents not be householded, please contact Eaton Vance at 1-800-262-1122, or contact your financial adviser.
Your instructions that householding not apply to delivery of your Eaton Vance documents will be effective within 30 days of receipt by Eaton Vance or your financial adviser.
Portfolio Holdings. The Fund and its underlying Portfolio (if applicable) will file a schedule of its portfolio holdings on Form N-Q with the SEC for the first and third quarters of each fiscal year. The Form N-Q will be available on the Eaton Vance website www.eatonvance.com, by calling Eaton Vance at 1-800-262-1122 or in the EDGAR database on the SEC's website at www.sec.gov. Form N-Q may also be reviewed and copied at the SEC's public reference room in Washington, D.C. (call 1-800-732-0330 for information on the operation of the public reference room).
Proxy Voting. From time to time, funds are required to vote proxies related to the securities held by the funds. The Eaton Vance Funds or their underlying Portfolios (if applicable) vote proxies according to a set of policies and procedures approved by the Funds' and Portfolios' Boards. You may obtain a description of these policies and procedures and information on how the Fund or Portfolio voted proxies relating to portfolio securities during the 12 month period ended June 30, without charge, upon request, by calling 1-800-262-1122. This description is also available on the SEC's website at www.sec.gov.
Eaton Vance Tax-Managed Mid-Cap Core Fund as of October 31, 2005
MANAGEMENT’S DISCUSSION OF FUND PERFORMANCE

William R. Hackney, III
The Fund
Performance for the Past Year
• For the year ended October 31, 2005, the Fund’s Class A shares had a total return of 9.67%. This return was the result of an increase in net asset value (NAV) per share to $12.36 on October 31, 2005, from $11.27 on October 31, 2004.(1)
• The Fund’s Class B shares had a total return of 8.87% during the same period, the result of an increase in NAV per share to $12.03 from $11.05.(1)
• The Fund’s Class C shares had a total return of 8.87% during the same period, the result of an increase in NAV per share to $12.03 from $11.05.(1)
• For comparison, the S&P 400 MidCap Index (the S&P 400) had a total return of 17.65% during the same period.(2)
See pages 3 and 4 for more performance information, including after-tax returns.
Management Discussion
• The stock market posted solid gains for the year ended October 31, 2005, as a strong economic environment and robust corporate earnings growth offset the negative effects of continued interest rate hikes by the Federal Reserve.
• All 10 of the economic sectors constituting the S&P 400 posted gains for the year ended October 31, 2005. The leading group in the market was the energy sector, which posted a total return of almost 50%. The earnings of the energy sector benefited from sharply rising crude oil and natural gas prices, as well as accelerating demand for oil field services associated with increased exploration activity.(2)
• The lagging sectors within the S&P 400 included telecommunications services, with a total return of 3.6% for the year ended October 31, 2005, and the consumer discretionary sector, with a return of 9.1%.(2) The telecom sector continued to experience severe price competition for both wireless and wireline services. The consumer discretionary sectors, particularly the retailers, were buffeted by the negative impact of high gasoline prices this summer. The expectation of high heating oil prices this winter also weighed heavily on discretionary consumer spending.
• Not surprisingly, for the year ended October 31, 2005, the strongest gain in the Tax-Managed Mid-Cap Core Portfolio (the Portfolio) was achieved in its energy sector. Favorable stock selection in this sector enabled the Portfolio’s energy stocks to exceed the return in the S&P 400’s energy sector.(2) The Portfolio’s utilities, financials and health care stocks also achieved solid price gains during the period.
• Portfolio performance was weakest in the consumer discretionary and information technology sectors, which produced negative returns of -6.8% and -5.3%, respectively. Price declines by several of the Portfolio’s computer hardware, housing-related, and media-relatedstocks accounted for the lackluster performance in these sectors of the Portfolio.
• The Portfolio seeks to invest in a number of different industries, with a focus on stocks that, in management’s opinion, have attractive relative valuations and/ or potential for above-average sustainable growth. The past year has been particularly challenging for managers focused on these types of higher-quality securities, as many lower-quality issues posted strong price gains in a robust economic expansion.
Past performance is no guarantee of future results. Returns are historical and are calculated by determining the percentage change in net asset value or offering price (as applicable) with all distributions reinvested. Investment return and principal value will fluctuate so that shares, when redeemed, may be worth more or less than their original cost. Performance is for stated time period only; due to market volatility, the Fund’s current performance may be lower or higher than the quoted return. For performance as of the most recent month end, please refer to www.eatonvance.com.
(1) These returns do not include the 5.75% maximum sales charge for Class A shares or the applicable contingent deferred sales charge (CDSC) for Class B and Class C shares. If sales charges were deducted, returns would be lower.
(2) It is not possible to invest directly in an Index. The Index’s total return does not reflect commissions or expenses that would have been incurred if an investor individually purchased or sold the securities represented in the Index.
Fund shares are not insured by the FDIC and are not deposits or other obligations of, or guaranteed by, any depository institution. Shares are subject to investment risks, including possible loss of principal invested.
2
Eaton Vance Tax-Managed Mid-Cap Core Fund as of October 31, 2005
FUND PERFORMANCE
• During the year ended October 31, 2005, the Portfolio generally increased its diversification among the various industry groups constituting the S&P 400, with the addition of stocks in the electric utility, regional bank, insurance, REIT, apparel retailing, food and homebuilding industries. As of October 31, 2005, the Portfolio held investments in nine of the S&P 400’s 10 economic sectors.
• Effective September 30, 2005, the team of investment professionals managing the Portfolio has changed. The day-to-day management of the Portfolio is the responsibility of a team of Atlanta Capital investment professionals that consists of William O. Bell IV, William R. Hackney, III and Marilyn Robinson Irvin. Mr. Bell, Vice President and Principal of Atlanta Capital, Mr. Hackney, Managing Partner and member of the Executive Committee of Atlanta Capital, and Ms. Irvin, Senior Vice President and Principal of Atlanta Capital, have been employed by Atlanta Capital for more than five years and manage other Atlanta Capital investment portfolios.
The views expressed throughout this report are those of the portfolio managers and are current only through the end of the period of the report as stated on the cover. These views are subject to change at any time based upon market or other conditions, and the investment adviser disclaims any responsibility to update such views. These views may not be relied on as investment advice and, because investment decisions for a fund are based on many factors, may not be relied on as an indication of trading intent on behalf of any Eaton Vance fund.
Common Stock Investments by Sector*
By net assets
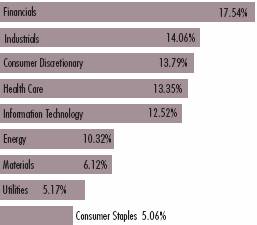
* Portfolio information may not be representative of the Portfolio’s current or future investments and may change due to active management.
Top Ten Holdings**
By net assets
National Oilwell Varco, Inc. | | 3.05 | % |
Affiliated Managers Group | | 3.01 | % |
Newfield Exploration Company | | 2.60 | % |
Expeditors International of Washington, Inc. | | 2.57 | % |
Varian Medical Systems, Inc. | | 2.55 | % |
Legg Mason, Inc. | | 2.43 | % |
C.H. Robinson Worldwide, Inc. | | 2.32 | % |
CDW Corp. | | 2.16 | % |
Bed, Bath & Beyond, Inc. | | 2.07 | % |
Questar Corp. | | 2.05 | % |
** Ten Largest Holdings represented 24.81% of Portfolio net assets as of October 31, 2005. Holdings are subject to change due to active management.
3
The line graphs and table set forth below provide information about the Fund’s performance. The line graphs compare the performance of Class A, Class B, and Class C of the Fund with that of the S&P Midcap 400 Index, a broad-based, unmanaged market index of mid-cap stocks. The lines on the graph represent the total returns of a hypothetical investment of $10,000 in each of Class A, Class B, Class C and the S&P Midcap 400 Index. Class A total returns are presented at net asset value and maximum public offering price. The table includes the total returns of each Class of the Fund at net asset value and public offering price. The performance presented below does not reflect the deduction of taxes, if any, that a shareholder would pay on distributions or redemptions of Fund shares.
Performance* | | Class A | | Class B | | Class C | |
| | | | | | | |
Average Annual Total Returns (at net asset value) | | | | | | | |
One Year | | 9.67 | % | 8.87 | % | 8.87 | % |
Life of Fund† | | 5.94 | % | 5.16 | % | 5.16 | % |
| | | | | | | |
SEC Average Annual Total Returns (including sales charge or applicable CDSC) | | | | | | | |
One Year | | 3.34 | % | 3.87 | % | 7.87 | % |
Life of Fund† | | 4.25 | % | 4.44 | % | 5.16 | % |
†Inception Dates – Class A: 3/4/02; Class B: 3/4/02; Class C: 3/4/02
* Average annual total returns do not include the 5.75% maximum sales charge for Class A shares or the applicable contingent deferred sales charge (CDSC) for Class B and Class C shares. If sales charges were deducted, returns would be lower. SEC average annual total returns for Class A reflect the maximum 5.75% sales charge. SEC returns for Class B shares reflect the applicable CDSC based on the following schedule: 5% - 1st and 2nd years; 4% - 3rd year; 3% - 4th year; 2% - 5th year; 1% - 6th year. SEC 1-year return for Class C reflects a 1% CDSC.
Past performance is no guarantee of future results. Returns are historical and are calculated by determining the percentage change in net asset value or offering price (as applicable) with all distributions reinvested. Investment return and principal value will fluctuate so that shares, when redeemed, may be worth more or less than their original cost. Performance is for the stated time period only; due to market volatility, the Fund’s current performance may be lower or higher than the quoted return. For performance as of the most recent month-end, please refer to www.eatonvance.com.
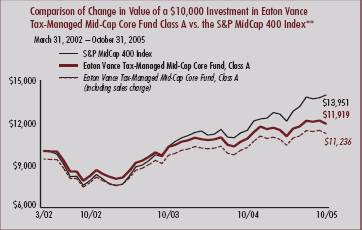
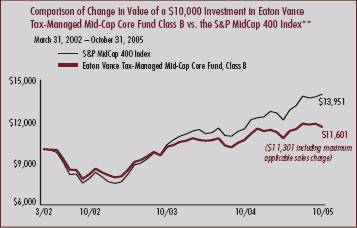
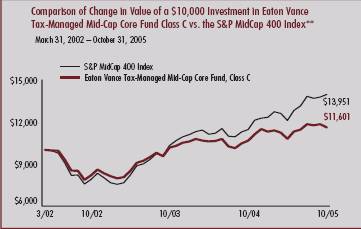
** Source: Thomson Financial. Class A, Class B, and Class C of the Fund commenced investment operations on 3/4/02. It is not possible to invest directly in an Index. The Index’s total returns do not reflect commissions or expenses that would have been incurred if an investor individually purchased or sold the securities represented in the Index.
4
“Return Before Taxes” does not take into consideration shareholder taxes. It is most relevant to tax-free or tax-deferred shareholder accounts. “Return After Taxes on Distributions” reflects the impact of federal income taxes due on Fund distributions of dividends and capital gains. It is most relevant to taxpaying shareholders who continue to hold their shares. “Return After Taxes on Distributions and Sale of Fund Shares” also reflects the impact of taxes on capital gain or loss realized upon a sale of shares. It is most relevant to taxpaying shareholders who sell their shares.
Average Annual Total Returns
(For the periods ended October 31, 2005)
Returns at Net Asset Value (NAV) (Class A)
| | One Year | | Life of Fund | |
| | | | | |
Return Before Taxes | | 9.67 | % | 5.94 | % |
Return After Taxes on Distributions | | 9.67 | % | 5.94 | % |
Return After Taxes on Distributions and Sale of Fund Shares | | 6.29 | % | 5.11 | % |
Returns at Public Offering Price (POP) (Class A)
| | One Year | | Life of Fund | |
| | | | | |
Return Before Taxes | | 3.34 | % | 4.25 | % |
Return After Taxes on Distributions | | 3.34 | % | 4.25 | % |
Return After Taxes on Distributions and Sale of Fund Shares | | 2.17 | % | 3.64 | % |
Average Annual Total Returns
(For the periods ended October 31, 2005)
Returns at Net Asset Value (NAV) (Class B)
| | One Year | | Life of Fund | |
| | | | | |
Return Before Taxes | | 8.87 | % | 5.16 | % |
Return After Taxes on Distributions | | 8.87 | % | 5.16 | % |
Return After Taxes on Distributions and Sale of Fund Shares | | 5.77 | % | 4.43 | % |
Returns at Public Offering Price (POP) (Class B)
| | One Year | | Life of Fund | |
| | | | | |
Return Before Taxes | | 3.87 | % | 4.44 | % |
Return After Taxes on Distributions | | 3.87 | % | 4.44 | % |
Return After Taxes on Distributions and Sale of Fund Shares | | 2.52 | % | 3.81 | % |
Average Annual Total Returns
(For the periods ended October 31, 2005)
Returns at Net Asset Value (NAV) (Class C)
| | One Year | | Life of Fund | |
| | | | | |
Before Taxes | | 8.87 | % | 5.16 | % |
After Taxes on Distributions | | 8.87 | % | 5.16 | % |
After Taxes on Distributions Sale of Fund Shares | | 5.77 | % | 4.43 | % |
Returns at Public Offering Price (POP) (Class C)
| | One Year | | Life of Fund | |
| | | | | |
Return Before Taxes | | 7.87 | % | 5.16 | % |
Return After Taxes on Distributions | | 7.87 | % | 5.16 | % |
Return After Taxes on Distributions and Sale of Fund Shares | | 5.12 | % | 4.43 | % |
Class A, Class B, and Class C of the Fund commenced investment operations on 3/4/02. Returns at Public Offering Price (POP) reflect the deduction of the maximum initial sales charge and applicable CDSC, while Returns at Net Asset Value (NAV) do not.
After-tax returns are calculated using the highest historical individual federal income tax rate and do not reflect the impact of state and local taxes. Actual after-tax returns tax rate and do not reflect the impact of state and local taxes. Actual after-tax returns depend on a shareholder’s tax situation and may differ from those shown. After-tax returns are not relevant for shareholders who hold shares in tax-deferred accounts or shares held by non-taxable entities. Return After Taxes on Distributions for a period may be the same as Return Before Taxes for that period because no distributions were paid during that period, or because the taxable portion of distributions made during paid during that period was insignificant. Also, Return After Taxes on Distributions and Sale of Fund Shares for a period may be greater than Return After Taxes on Distributions for the same period because of realized losses on the sale of Fund shares.
Past performance is no guarantee of future results. Returns are historical and are calculated by determining the percentage change in net asset value or offering price (as applicable) with all distributions reinvested. Investment return and principal value will fluctuate so that shares, when redeemed, may be worth more or less than their original cost. Performance is for the stated time period only; due to market volatility, the Fund’s current performance may be lower or higher than the quoted return. For performance as of the most recent month-end, please refer to www.eatonvance.com.
5
Eaton Vance Tax-Managed Mid-Cap Core Fund as of October 31, 2005
FUND EXPENSES
Example: As a shareholder of the Fund, you incur two types of costs: (1) transaction costs, including sales charges (loads) on purchases and redemption fees (if applicable); and (2) ongoing costs, including management fees; distribution or service fees; and other Fund expenses. This Example is intended to help you understand your ongoing costs (in dollars) of investing in the Fund and to compare these costs with the ongoing costs of investing in other mutual funds. The Example is based on an investment of $1,000 invested at the beginning of the period and held for the entire period (May 1, 2005 – October 31, 2005).
Actual Expenses: The first line of the table below provides information about actual account values and actual expenses. You may use the information in this line, together with the amount you invested, to estimate the expenses that you paid over the period. Simply divide your account value by $1,000 (for example, an $8,600 account value divided by $1,000 = 8.6), then multiply the result by the number in the first line under the heading entitled “Expenses Paid During Period” to estimate the expenses you paid on your account during this period.
Hypothetical Example for Comparison Purposes: The second line of the table below provides information about hypothetical account values and hypothetical expenses based on the actual Fund expense ratio and an assumed rate of return of 5% per year (before expenses), which is not the actual return of the Fund. The hypothetical account values and expenses may not be used to estimate the actual ending account balance or expenses you paid for the period. You may use this information to compare the ongoing costs of investing in your Fund and other funds. To do so, compare this 5% hypothetical example with the 5% hypothetical examples that appear in the shareholder reports of the other funds.
Please note that the expenses shown in the table are meant to highlight your ongoing costs only and do not reflect any transactional costs, such as sales charges (loads) or redemption fees (if applicable). Therefore, the second line of the table is useful in comparing ongoing costs only, and will not help you determine the relative total costs of owning different funds. In addition, if these transactional costs were included, your costs would have been higher.
Eaton Vance Tax-Managed Mid-Cap Core Fund
| | Beginning Account Value | | Ending Account Value | | Expenses Paid During Period* | |
| | (5/1/05) | | (10/31/05) | | (5/1/05 – 10/31/05) | |
| | | | | | | |
Actual | | | | | | | |
Class A | | $ | 1,000.00 | | $ | 1,079.50 | | $ | 8.91 | |
Class B | | $ | 1,000.00 | | $ | 1,075.10 | | $ | 12.81 | |
Class C | | $ | 1,000.00 | | $ | 1,075.10 | | $ | 12.81 | |
| | | | | | | |
Hypothetical | | | | | | | |
(5% return per year before expenses) | | | | | | | |
Class A | | $ | 1,000.00 | | $ | 1,016.60 | | $ | 8.64 | |
Class B | | $ | 1,000.00 | | $ | 1,012.90 | | $ | 12.43 | |
Class C | | $ | 1,000.00 | | $ | 1,012.90 | | $ | 12.43 | |
* Expenses are equal to the Fund’s annualized expense ratio of 1.70% for Class A shares, 2.45% for Class B shares, and 2.45% for Class C shares multiplied by the average account value over the period, multiplied by 184/365 (to reflect the one-half year period). The example assumes that the $1,000 was invested at the net asset value per share determined at the close of business on April 30, 2005. The Example reflects the expenses of both the Fund and the Portfolio.
6
Eaton Vance Tax-Managed Mid-Cap Core Fund as of October 31, 2005
FINANCIAL STATEMENTS
Statement of Assets and Liabilities
As of October 31, 2005
| Assets | |
Investment in Tax-Managed Mid-Cap Portfolio, at value
(identified cost, $21,031,640) | | $ | 26,278,784 | | |
| Receivable for Fund shares sold | | | 5,563 | | |
| Receivable from affiliate | | | 37,320 | | |
| Total assets | | $ | 26,321,667 | | |
| Liabilities | |
| Payable for Fund shares redeemed | | $ | 44,623 | | |
| Payable to affiliate for distribution and service fees | | | 13,273 | | |
| Payable to affiliate for administration fee | | | 3,265 | | |
| Payable to affiliate for Trustees' fees | | | 163 | | |
| Other accrued expenses | | | 35,495 | | |
| Total liabilities | | $ | 96,819 | | |
| Net Assets | | $ | 26,224,848 | | |
| Sources of Net Assets | |
| Paid-in capital | | $ | 20,921,562 | | |
Accumulated undistributed net realized gain from Portfolio (computed on
the basis of identified cost) | | | 56,142 | | |
Net unrealized appreciation from Portfolio (computed on the basis of
identified cost) | | | 5,247,144 | | |
| Total | | $ | 26,224,848 | | |
| Class A Shares | |
| Net Assets | | $ | 13,761,457 | | |
| Shares Outstanding | | | 1,113,727 | | |
Net Asset Value and Redemption Price Per Share
(net assets ÷ shares of beneficial interest outstanding) | | $ | 12.36 | | |
Maximum Offering Price Per Share
(100 ÷ 94.25 of $12.36) | | $ | 13.11 | | |
| Class B Shares | |
| Net Assets | | $ | 6,436,370 | | |
| Shares Outstanding | | | 534,987 | | |
Net Asset Value, Offering Price and Redemption Price Per Share
(net assets ÷ shares of beneficial interest outstanding) | | $ | 12.03 | | |
| Class C Shares | |
| Net Assets | | $ | 6,027,021 | | |
| Shares Outstanding | | | 501,115 | | |
Net Asset Value, Offering Price and Redemption Price Per Share
(net assets ÷ shares of beneficial interest outstanding) | | $ | 12.03 | | |
| On sales of $50,000 or more, the offering price of Class A shares is reduced. | | | | | |
Statement of Operations
For the Year Ended
October 31, 2005
| Investment Income | |
| Dividends allocated from Portfolio | | $ | 198,359 | | |
| Interest allocated from Portfolio | | | 6,786 | | |
| Expenses allocated from Portfolio | | | (232,333 | ) | |
| Net investment loss from Portfolio | | $ | (27,188 | ) | |
| Expenses | |
| Administration fee | | $ | 38,185 | | |
| Trustees' fees and expenses | | | 248 | | |
Distribution and service fees
Class A | | | 33,154 | | |
| Class B | | | 63,620 | | |
| Class C | | | 58,327 | | |
| Registration fees | | | 49,001 | | |
| Transfer and dividend disbursing agent fees | | | 37,443 | | |
| Printing and postage | | | 18,351 | | |
| Legal and accounting services | | | 16,550 | | |
| Custodian fee | | | 11,360 | | |
| Miscellaneous | | | 3,003 | | |
| Total expenses | | $ | 329,242 | | |
Deduct —
Allocation of Fund expenses to affiliate | | $ | 37,320 | | |
| Total expense reductions | | $ | 37,320 | | |
| Net expenses | | $ | 291,922 | | |
| Net investment loss | | $ | (319,110 | ) | |
Realized and Unrealized
Gain (Loss) from Portfolio | |
Net realized gain (loss) —
Investment transactions (identified cost basis) | | $ | 440,954 | | |
| Net realized gain | | $ | 440,954 | | |
Change in unrealized appreciation (depreciation) —
Investments (identified cost basis) | | $ | 2,040,778 | | |
| Net change in unrealized appreciation (depreciation) | | $ | 2,040,778 | | |
| Net realized and unrealized gain | | $ | 2,481,732 | | |
| Net increase in net assets from operations | | $ | 2,162,622 | | |
See notes to financial statements
7
Eaton Vance Tax-Managed Mid-Cap Core Fund as of October 31, 2005
FINANCIAL STATEMENTS CONT'D
Statements of Changes in Net Assets
Increase (Decrease)
in Net Assets | | Year Ended
October 31, 2005 | | Year Ended
October 31, 2004 | |
From operations —
Net investment loss | | $ | (319,110 | ) | | $ | (256,168 | ) | |
Net realized gain from
investment transactions | | | 440,954 | | | | 324,603 | | |
Net change in unrealized
appreciation (depreciation)
of investments | | | 2,040,778 | | | | 898,590 | | |
| Net increase in net assets from operations | | $ | 2,162,622 | | | $ | 967,025 | | |
Transactions in shares of beneficial interest —
Proceeds from sale of shares
Class A | | $ | 4,562,665 | | | $ | 5,396,928 | | |
| Class B | | | 1,245,661 | | | | 2,030,425 | | |
| Class C | | | 2,067,673 | | | | 2,213,240 | | |
Cost of shares redeemed
Class A | | | (3,357,260 | ) | | | (1,786,002 | ) | |
| Class B | | | (902,774 | ) | | | (622,972 | ) | |
| Class C | | | (1,970,830 | ) | | | (1,030,214 | ) | |
Net asset value of shares exchanged
Class A | | | 163,284 | | | | 35,284 | | |
| Class B | | | (163,284 | ) | | | (35,284 | ) | |
Net increase in net assets from
Fund share transactions | | $ | 1,645,135 | | | $ | 6,201,405 | | |
| Net increase in net assets | | $ | 3,807,757 | | | $ | 7,168,430 | | |
| Net Assets | |
| At beginning of year | | $ | 22,417,091 | | | $ | 15,248,661 | | |
| At end of year | | $ | 26,224,848 | | | $ | 22,417,091 | | |
See notes to financial statements
8
Eaton Vance Tax-Managed Mid-Cap Core Fund as of October 31, 2005
FINANCIAL STATEMENTS CONT'D
Financial Highlights
| | | Class A | |
| | | Year Ended October 31, | | Period Ended | |
| | | 2005 | | 2004 | | 2003 | | October 31, 2002(1) | |
| Net asset value — Beginning of year | | $ | 11.270 | | | $ | 10.670 | | | $ | 8.530 | | | $ | 10.000 | | |
| Income (loss) from operations | |
| Net investment loss(2) | | $ | (0.108 | ) | | $ | (0.102 | ) | | $ | (0.087 | ) | | $ | (0.047 | ) | |
| Net realized and unrealized gain (loss) | | | 1.198 | | | | 0.702 | | | | 2.227 | | | | (1.423 | ) | |
| Total income (loss) from operations | | $ | 1.090 | | | $ | 0.600 | | | $ | 2.140 | | | $ | (1.470 | ) | |
| Net asset value — End of year | | $ | 12.360 | | | $ | 11.270 | | | $ | 10.670 | | | $ | 8.530 | | |
| Total Return(3) | | | 9.67 | % | | | 5.62 | % | | | 25.09 | % | | | (14.70 | )% | |
| Ratios/Supplemental Data† | |
| Net assets, end of year (000's omitted) | | $ | 13,761 | | | $ | 11,226 | | | $ | 7,054 | | | $ | 4,394 | | |
| Ratios (As a percentage of average daily net assets): | |
| Net expenses(4) | | | 1.70 | % | | | 1.70 | % | | | 1.70 | % | | | 1.65 | %(5) | |
| Net investment loss | | | (0.89 | )% | | | (0.93 | )% | | | (0.93 | )% | | | (0.80 | )%(5) | |
| Portfolio Turnover of the Portfolio | | | 53 | % | | | 42 | % | | | 50 | % | | | 13 | % | |
† The operating expenses of the Portfolio may reflect a reduction of the investment adviser fee. The operating expenses of the Fund reflect an allocation of expenses to the Administrator. Had such actions not been taken, the ratios and net investment loss per share would have been as follows:
| Ratios (As a percentage of average daily net assets): | |
| Expenses(4) | | | 1.86 | % | | | 1.92 | % | | | 2.43 | % | | | 4.78 | %(5) | |
| Net investment loss | | | (1.05 | )% | | | (1.15 | )% | | | (1.66 | )% | | | (3.93 | )%(5) | |
| Net investment loss per share | | $ | (0.127 | ) | | $ | (0.126 | ) | | $ | (0.155 | ) | | $ | (0.231 | ) | |
(1) For the period from the start of business, March 4, 2002, to October 31, 2002.
(2) Net investment loss per share was computed using average shares outstanding.
(3) Returns are historical and are calculated by determining the percentage change in net asset value with all distributions reinvested. Total return is not computed on an annualized basis.
(4) Includes the Fund's share of the Portfolio's allocated expenses.
(5) Annualized.
See notes to financial statements
9
Eaton Vance Tax-Managed Mid-Cap Core Fund as of October 31, 2005
FINANCIAL STATEMENTS CONT'D
Financial Highlights
| | | Class B | |
| | | Year Ended October 31, | | Period Ended | |
| | | 2005 | | 2004 | | 2003 | | October 31, 2002(1) | |
| Net asset value — Beginning of year | | $ | 11.050 | | | $ | 10.540 | | | $ | 8.490 | | | $ | 10.000 | | |
| Income (loss) from operations | |
| Net investment loss(2) | | $ | (0.194 | ) | | $ | (0.182 | ) | | $ | (0.158 | ) | | $ | (0.089 | ) | |
| Net realized and unrealized gain (loss) | | | 1.174 | | | | 0.692 | | | | 2.208 | | | | (1.421 | ) | |
| Total income (loss) from operations | | $ | 0.980 | | | $ | 0.510 | | | $ | 2.050 | | | $ | (1.510 | ) | |
| Net asset value — End of year | | $ | 12.030 | | | $ | 11.050 | | | $ | 10.540 | | | $ | 8.490 | | |
| Total Return(3) | | | 8.87 | % | | | 4.84 | % | | | 24.15 | % | | | (15.10 | )% | |
| Ratios/Supplemental Data† | |
| Net assets, end of year (000's omitted) | | $ | 6,436 | | | $ | 5,741 | | | $ | 4,139 | | | $ | 1,254 | | |
| Ratios (As a percentage of average daily net assets): | |
| Net expenses(4) | | | 2.45 | % | | | 2.45 | % | | | 2.45 | % | | | 2.40 | %(5) | |
| Net investment loss | | | (1.64 | )% | | | (1.67 | )% | | | (1.69 | )% | | | (1.52 | )%(5) | |
| Portfolio Turnover of the Portfolio | | | 53 | % | | | 42 | % | | | 50 | % | | | 13 | % | |
† The operating expenses of the Portfolio may reflect a reduction of the investment adviser fee. The operating expenses of the Fund reflect an allocation of expenses to the Administrator. Had such actions not been taken, the ratios and net investment loss per share would have been as follows:
| Ratios (As a percentage of average daily net assets): | |
| Expenses(4) | | | 2.61 | % | | | 2.67 | % | | | 3.18 | % | | | 5.53 | %(5) | |
| Net investment loss | | | (1.80 | )% | | | (1.89 | )% | | | (2.42 | )% | | | (4.65 | )%(5) | |
| Net investment loss per share | | $ | (0.213 | ) | | $ | (0.206 | ) | | $ | (0.226 | ) | | $ | (0.272 | ) | |
(1) For the period from the start of business, March 4, 2002, to October 31, 2002.
(2) Net investment loss per share was computed using average shares outstanding.
(3) Returns are historical and are calculated by determining the percentage change in net asset value with all distributions reinvested. Total return is not computed on an annualized basis.
(4) Includes the Fund's share of the Portfolio's allocated expenses.
(5) Annualized.
See notes to financial statements
10
Eaton Vance Tax-Managed Mid-Cap Core Fund as of October 31, 2005
FINANCIAL STATEMENTS CONT'D
Financial Highlights
| | | Class C | |
| | | Year Ended October 31, | | Period Ended | |
| | | 2005 | | 2004 | | 2003 | | October 31, 2002(1) | |
| Net asset value — Beginning of year | | $ | 11.050 | | | $ | 10.540 | | | $ | 8.490 | | | $ | 10.000 | | |
| Income (loss) from operations | |
| Net investment loss(2) | | $ | (0.194 | ) | | $ | (0.182 | ) | | $ | (0.157 | ) | | $ | (0.090 | ) | |
| Net realized and unrealized gain (loss) | | | 1.174 | | | | 0.692 | | | | 2.207 | | | | (1.420 | ) | |
| Total income (loss) from operations | | $ | 0.980 | | | $ | 0.510 | | | $ | 2.050 | | | $ | (1.510 | ) | |
| Net asset value — End of year | | $ | 12.030 | | | $ | 11.050 | | | $ | 10.540 | | | $ | 8.490 | | |
| Total Return(3) | | | 8.87 | % | | | 4.84 | % | | | 24.15 | % | | | (15.10 | )% | |
| Ratios/Supplemental Data† | |
| Net assets, end of year (000's omitted) | | $ | 6,027 | | | $ | 5,450 | | | $ | 4,056 | | | $ | 1,575 | | |
| Ratios (As a percentage of average daily net assets): | |
| Net expenses(4) | | | 2.45 | % | | | 2.45 | % | | | 2.45 | % | | | 2.40 | %(5) | |
| Net investment loss | | | (1.64 | )% | | | (1.68 | )% | | | (1.70 | )% | | | (1.52 | )%(5) | |
| Portfolio Turnover of the Portfolio | | | 53 | % | | | 42 | % | | | 50 | % | | | 13 | % | |
† The operating expenses of the Portfolio may reflect a reduction of the investment adviser fee. The operating expenses of the Fund reflect an allocation of expenses to the Administrator. Had such actions not been taken, the ratios and net investment loss per share would have been as follows:
| Ratios (As a percentage of average daily net assets): | |
| Expenses(4) | | | 2.61 | % | | | 2.67 | % | | | 3.18 | % | | | 5.53 | %(5) | |
| Net investment loss | | | (1.80 | )% | | | (1.90 | )% | | | (2.43 | )% | | | (4.65 | )%(5) | |
| Net investment loss per share | | $ | (0.213 | ) | | $ | (0.206 | ) | | $ | (0.225 | ) | | $ | (0.275 | ) | |
(1) For the period from the start of business, March 4, 2002, to October 31, 2002.
(2) Net investment loss per share was computed using average shares outstanding.
(3) Returns are historical and are calculated by determining the percentage change in net asset value with all distributions reinvested. Total return is not computed on an annualized basis.
(4) Includes the Fund's share of the Portfolio's allocated expenses.
(5) Annualized.
See notes to financial statements
11
Eaton Vance Tax-Managed Mid-Cap Core Fund as of October 31, 2005
NOTES TO FINANCIAL STATEMENTS
1 Significant Accounting Policies
Eaton Vance Tax-Managed Mid-Cap Core Fund (the Fund) is a diversified series of Eaton Vance Mutual Funds Trust (the Trust). The Trust is an entity of the type commonly known as a Massachusetts business trust and is registered under the Investment Company Act of 1940, as amended, as an open-end management investment company. The Fund offers three classes of shares. Class A shares are generally sold subject to a sales charge imposed at time of purchase. Class B and Class C shares are sold at net asset value and are generally subject to a contingent deferred sales charge (see Note 6). Class B shares held for eight years will automatically convert to Class A shares. Each class represents a pro-rata interest in the Fund, but votes separately on class-specific matters and (as noted below) is subject to different expenses. Realized and unrealized gains and losses and net investment income and losses, other than class-specific expenses, are allocated daily to each class of shares based on the relative net assets of each class to the total net assets of the Fund. Each class of shares differs in its distribution plan and certain other class-specific expenses. The Fund invests all of its investable assets in interests of the Tax-Managed Mid-Cap Core Portfolio (the Portfolio), a New York Trust, having the same investment objective as the Fund. The value of the Fund's investment in the Portfolio reflects the Fund's proportionate interest in the net assets of the Portfolio (34.5% at October 31, 2005). The performance of the Fund is directly affected by the performance of the Portfolio. The financial statements of the Portfolio, including the Portfolio of Investments, are included elsewhere in this report and should be read in conjunction with the Fund's financial statements.
The following is a summary of significant accounting policies consistently followed by the Fund in the preparation of its financial statements. The policies are in conformity with accounting principles generally accepted in the United States of America.
A Investment Valuation — Valuation of securities by the Portfolio is discussed in Note 1A of the Portfolio's Notes to Financial Statements which are included elsewhere in this report.
B Income — The Fund's net investment income or loss consists of the Fund's pro-rata share of the net investment income or loss of the Portfolio, less all actual and accrued expenses of the Fund determined in accordance with accounting principles generally accepted in the United States of America.
C Expenses — The majority of expenses of the Trust are directly identifiable to an individual fund. Expenses which are not readily identifiable to a specific fund are allocated taking into consideration, among other things, the nature and type of expense and the relative size of the fund.
D Federal Taxes — The Fund's policy is to comply with the provisions of the Internal Revenue Code applicable to regulated investment companies and to distribute to shareholders, each year, all of its net investment income, and any net realized capital gains. Accordingly, no provision for federal income or excise tax is necessary.
E Expense Reduction — Investors Bank & Trust Company (IBT) serves as custodian to the Fund and the Portfolio. Pursuant to the respective custodian agreements, IBT receives a fee reduced by credits which are determined based on the average daily cash balances the Fund or the Portfolio maintains with IBT. All credit balances used to reduce the Fund's custodian fees are reported as a reduction of total expenses in the Statement of Operations.
F Other — Investment transactions are accounted for on a trade-date basis. Dividends to shareholders are recorded on the ex-dividend date.
G Use of Estimates — The preparation of the financial statements in conformity with accounting principles generally accepted in the United States of America requires management to make estimates and assumptions that affect the reported amounts of assets and liabilities at the date of the financial statements and the reported amounts of income and expense during the reporting period. Actual results could differ from those estimates.
H Indemnifications — Under the Trust's organizational documents, its officers and Trustees may be indemnified against certain liabilities and expenses arising out of the performance of their duties to the Fund, and shareholders are indemnified against personal liability for obligations of the Trust. Additionally, in the normal course of business, the Fund enters into agreements with service providers that may contain indemnification clauses. The Fund's maximum exposure under these arrangements is unknown as this would involve future claims that may be made against the Fund that have not yet occurred.
2 Distributions to Shareholders
It is the present policy of the Fund to make at least one distribution annually (normally in December) of all or substantially all of its net investment income, if any, and at least one distribution annually of all or substantially all of its net realized capital gains, if any (reduced by available capital loss carryforwards from prior years, if any). Distributions are paid in the form of additional shares of
12
Eaton Vance Tax-Managed Mid-Cap Core Fund as of October 31, 2005
NOTES TO FINANCIAL STATEMENTS CONT'D
the Fund or, at the election of the shareholder, in cash. Shareholders may reinvest all distributions in additional shares of the Fund at the net asset value as of the close of business on the ex-dividend date. The Fund distinguishes between distributions on a tax basis and a financial reporting basis. Accounting principles generally accepted in the United States of America require that only distributions in excess of tax basis earnings and profits be reported in the financial statements as a return of capital. Permanent differences between book and tax accounting relating to distributions are reclassified to paid-in capital.
During the year ended October 31, 2005, paid-in capital was decreased by $319,110 and accumulated net investment loss was decreased by $319,110 primarily due to differences between book and tax accounting for net operating losses. This change had no effect on the net assets or the net asset value per share.
As of October 31, 2005, the components of distributable earnings on a tax basis were as follows:
| Undistributed capital gains | | $ | 142,945 | | |
| Unrealized appreciation | | $ | 5,160,341 | | |
3 Shares of Beneficial Interest
The Fund's Declaration of Trust permits the Trustees to issue an unlimited number of full and fractional shares of beneficial interest (without par value). Transactions in Fund shares were as follows:
| | | Year Ended October 31, | |
| Class A | | 2005 | | 2004 | |
| Sales | | | 379,449 | | | | 494,987 | | |
| Redemptions | | | (275,555 | ) | | | (162,967 | ) | |
| Exchange from Class B shares | | | 13,329 | | | | 3,292 | | |
| Net increase | | | 117,223 | | | | 335,312 | | |
| | | Year Ended October 31, | |
| Class B | | 2005 | | 2004 | |
| Sales | | | 105,625 | | | | 187,530 | | |
| Redemptions | | | (76,467 | ) | | | (57,282 | ) | |
| Exchange to Class A shares | | | (13,655 | ) | | | (3,341 | ) | |
| Net increase | | | 15,503 | | | | 126,907 | | |
| | | Year Ended October 31, | |
| Class C | | 2005 | | 2004 | |
| Sales | | | 174,945 | | | | 203,749 | | |
| Redemptions | | | (167,143 | ) | | | (95,182 | ) | |
| Net increase | | | 7,802 | | | | 108,567 | | |
4 Transactions with Affiliates
The administration fee is earned by Eaton Vance Management (EVM) as compensation for managing and administering the business affairs of the Fund. Under the administration agreement, EVM earns a fee in the amount of 0.15% per annum of average daily net assets of the Fund. For the year ended October 31, 2005, the administration fee amounted to $38,185. Pursuant to a voluntary expense reimbursement, EVM was allocated $37,320 of the Fund's operating expenses for the year ended October 31, 2005. The Portfolio has engaged Boston Management and Research (BMR), a subsidiary of EVM, to render investment advisory services. See Note 2 of the Portfolio's Notes to Financial Statements which are included elsewhere in this report. EVM serves as the sub-transfer agent of the Fund and receives from the transfer agent an aggregate fee based upon the actual expenses incurred by EVM in the performance of those services. For the year ended October 3 1, 2005, EVM earned approximately $3,122 in sub-transfer agent fees.
Except for Trustees of the Fund and the Portfolio who are not members of EVM's or BMR's organization, officers and Trustees receive remuneration for their services to the Fund out of the investment adviser fee earned by BMR. Trustees of the Fund that are not affiliated with EVM or BMR may elect to defer receipt of all or a percentage of their annual fees in accordance with the terms of the Trustees Deferred Compensation Plan. For the year ended October 31, 2005, no significant amounts have been deferred.
Eaton Vance Distributors, Inc. (EVD), a subsidiary of EVM and the Fund's principal underwriter, received $11,084 as its portion of the sales charge on sales of Class A shares for the year ended October 31, 2005.
Certain officers and Trustees of the Fund and of the Portfolio are officers of the above organizations.
5 Distribution and Service Plans
The Fund has in effect distribution plans for Class B shares (Class B Plan) and Class C shares (Class C Plan) pursuant to Rule 12b-1 under the Investment Company Act of 1940
13
Eaton Vance Tax-Managed Mid-Cap Core Fund as of October 31, 2005
NOTES TO FINANCIAL STATEMENTS CONT'D
and a service plan for Class A shares (Class A Plan) (collectively, the Plans). The Class B and Class C Plans require the Fund to pay EVD amounts equal to 1/365 of 0.75% of the Fund's average daily net assets attributable to Class B and Class C shares, for providing ongoing distribution services and facilities to the Fund. The Fund will automatically discontinue payments to EVD during any period in which there are no outstanding Uncovered Distribution Charges, which are equivalent to the sum of (i) 6.25% of the aggregate amount received by the Fund for the Class B and Class C shares sold, plus (ii) interest calculated by applying the rate of 1% over the prevailing prime rate to the outstanding balance of Uncovered Distribution Charges of EVD of each respective class, reduced by the aggregate amount of contingent deferred sales charges (see Note 6) and daily amounts theretofore paid to EVD by each respective class. The Fund paid or accrued $47,715 and $43,745 for Class B and Class C shares, respectively, for the year ended October 31, 2005, representing 0.75% of the average daily net assets for Class B and Class C shares. At October 31, 2005, the amount of Uncovered Distribution Charges of EVD calculated under the Plans was approximately $155,000 and $335,000 for Class B and Class C shares, respectively.
The Plans authorize the Fund to make payments of service fees to EVD, investment dealers and other persons in amounts equal to 0.25% of the Fund's average daily net assets attributable to Class A, Class B and Class C shares for each fiscal year. Service fee payments are made for personal services and/or the maintenance of shareholder accounts. Service fees are separate and distinct from the sales commissions and distribution fees payable by the Fund to EVD and, as such, are not subject to automatic discontinuance when there are no outstanding Uncovered Distribution Charges of EVD. Service fee payments for the year ended October 31, 2005 amounted to $33,154, $15,905 and $14,582 for Class A, Class B and Class C shares, respectively.
6 Contingent Deferred Sales Charge
A contingent deferred sales charge (CDSC) generally is imposed on redemptions of Class B shares made within six years of purchase and on redemptions of Class C shares made within one year of purchase. Generally, the CDSC is based upon the lower of the net asset value at date of redemption or date of purchase. No charge is levied on shares acquired by reinvestment of dividends or capital gain distributions. Class A shares may be subject to a 1% CDSC if redeemed within one year of purchase (depending upon the circumstances of purchase). The Class B CDSC is imposed at declining rates that begin at 5% in the case of redemptions in the first and second year after purchase, declining one percentage point each subsequent year. Class C shares will be subject to a 1% CDSC if redeemed within one year of purchase.
No CDSC is levied on shares which have been sold to EVM or its affiliates or to their respective employees or clients and may be waived under certain other limited conditions. CDSC charges received on Class B and Class C redemptions are paid to EVD to reduce the amount of Uncovered Distribution Charges calculated under the Class B and Class C Plans, respectively (see Note 5). CDSC charges assessed on Class B and Class C shares when no Uncovered Distribution Charges exist for the respective classes will be credited to the Fund. The Fund was informed that EVD received approximately $1, $12,000 and $1,000 of CDSC paid by shareholders for Class A, Class B and Class C shares, respectively, for the year ended October 31, 2005.
7 Investment Transactions
Increases and decreases in the Fund's investment in the Portfolio for the year ended October 31, 2005 aggregated $7,874,785 and $6,496,638, respectively.
14
Eaton Vance Tax-Managed Mid-Cap Core Fund as of October 31, 2005
REPORT OF INDEPENDENT REGISTERED PUBLIC ACCOUNTING FIRM
To the Trustees of Eaton Vance Mutual Funds Trust and Shareholders of Eaton Vance Tax-Managed Mid-Cap Core Fund:
We have audited the accompanying statement of assets and liabilities of Eaton Vance Tax-Managed Mid-Cap Core Fund (the "Fund") (one of the series of Eaton Vance Mutual Funds Trust) as of October 31, 2005, the related statement of operations for the year then ended, the statements of changes in net assets for each of the two years in the period then ended and the financial highlights for each of the three years in the period then ended, and for the period from the start of business March 4, 2002 to October 31, 2002. These financial statement and financial highlights are the responsibility of the Fund's management. Our responsibility is to express an opinion on these financial statements and financial highlights based on our audits.
We conducted our audits in accordance with standards of the Public Company Accounting Oversight Board (United States). Those standards require that we plan and perform the audits to obtain reasonable assurance about whether the financial statements and financial highlights are free of material misstatement. The Fund is not required to have, nor were we engaged to perform, an audit of its internal control over financial reporting. An audit includes consideration of internal control over financial reporting as a basis for designing audit procedures that are appropriate in the circumstances, but not for the purpose of expressing an opinion on the effectiveness of the Fund's internal control over financial reporting. Accordingly, we express no such opinion. An audit also includes examining, on a test basis, evidence supporting the amounts and disclosures in the financial statements, assessing the accounting principles used and signi ficant estimates made by management, as well as evaluating the overall financial statement presentation. We believe that our audits provide a reasonable basis for our opinion.
In our opinion, the financial statements and financial highlights referred to above present fairly, in all material respects, the financial position of Eaton Vance Tax-Managed Mid-Cap Core Fund as of October 31, 2005, the results of its operations for the year then ended and the changes in its net assets for each of the two years in the period then ended and its financial highlights for each of the three years in the period then ended and for the period from the start of business March 4, 2002 to October 31, 2002, in conformity with accounting principles generally accepted in the United States of America.
DELOITTE & TOUCHE LLP
Boston, Massachusetts
December 19, 2005
15
Tax-Managed Mid-Cap Core Portfolio as of October 31, 2005
PORTFOLIO OF INVESTMENTS
| Common Stocks — 97.9% | |
| Security | | Shares | | Value | |
| Aerospace / Defense — 1.5% | |
| Engineered Support Systems, Inc. | | | 27,200 | | | $ | 1,100,240 | | |
| | | $ | 1,100,240 | | |
| Applications Software — 3.7% | |
| ANSYS, Inc.(1) | | | 18,100 | | | $ | 674,406 | | |
| Jack Henry & Associates, Inc. Class A | | | 69,500 | | | | 1,249,610 | | |
| Kronos, Inc.(1) | | | 19,700 | | | | 903,442 | | |
| | | $ | 2,827,458 | | |
| Banks-Regional — 4.8% | |
| City National Corp. | | | 18,000 | | | $ | 1,320,840 | | |
| Cullen/Frost Bankers, Inc. | | | 22,900 | | | | 1,209,578 | | |
| Synovus Financial Corp. | | | 39,900 | | | | 1,096,053 | | |
| | | $ | 3,626,471 | | |
| Broadcasting and Radio — 0.6% | |
| Westwood One, Inc. | | | 25,500 | | | $ | 471,750 | | |
| | | $ | 471,750 | | |
| Building and Development — 0.7% | |
| Hovnanian Enterprises, Inc.(1) | | | 12,000 | | | $ | 539,880 | | |
| | | $ | 539,880 | | |
| Building Products — 2.0% | |
| Florida Rock Industries, Inc. | | | 27,250 | | | $ | 1,550,525 | | |
| | | $ | 1,550,525 | | |
| Business Services-Miscellaneous — 3.4% | |
| Fiserv, Inc.(1) | | | 31,200 | | | $ | 1,362,816 | | |
| SEI Investments Co. | | | 31,500 | | | | 1,222,200 | | |
| | | $ | 2,585,016 | | |
| Chemicals — 1.0% | |
| Air Products and Chemicals, Inc. | | | 13,800 | | | $ | 789,912 | | |
| | | $ | 789,912 | | |
| Security | | Shares | | Value | |
| Cosmetics & Toiletries — 1.7% | |
| Alberto-Culver Co. | | | 30,450 | | | $ | 1,321,834 | | |
| | | $ | 1,321,834 | | |
| Distribution / Wholesale — 3.3% | |
| CDW Corp. | | | 29,200 | | | $ | 1,645,420 | | |
| Hughes Supply, Inc. | | | 26,700 | | | | 893,115 | | |
| | | $ | 2,538,535 | | |
| Electric-Integrated — 2.5% | |
| DPL, Inc. | | | 41,600 | | | $ | 1,072,032 | | |
| OGE Energy Corp. | | | 32,000 | | | | 824,320 | | |
| | | $ | 1,896,352 | | |
| Electrical Equipment — 2.0% | |
| Cooper Industries Ltd. Class A | | | 21,100 | | | $ | 1,495,779 | | |
| | | $ | 1,495,779 | | |
| Electronics-Equipment / Instruments — 1.9% | |
| Amphenol Corp. Class A | | | 36,200 | | | $ | 1,446,914 | | |
| | | $ | 1,446,914 | | |
| Entertainment — 1.7% | |
| International Speedway Corp. Class A | | | 25,400 | | | $ | 1,312,672 | | |
| | | $ | 1,312,672 | | |
| Finance-Investment Management — 6.8% | |
| Affiliated Managers Group, Inc.(1) | | | 29,800 | | | $ | 2,287,150 | | |
| Ambac Financial Group, Inc. | | | 15,100 | | | | 1,070,439 | | |
| Legg Mason, Inc. | | | 17,200 | | | | 1,845,732 | | |
| | | $ | 5,203,321 | | |
| Food-Wholesale / Distribution — 2.2% | |
| Dean Foods Co.(1) | | | 20,200 | | | $ | 730,230 | | |
| McCormick & Co., Inc. | | | 11,800 | | | | 357,422 | | |
| Tootsie Roll Industries, Inc. | | | 18,000 | | | | 545,400 | | |
| | | $ | 1,633,052 | | |
See notes to financial statements
16
Tax-Managed Mid-Cap Core Portfolio as of October 31, 2005
PORTFOLIO OF INVESTMENTS CONT'D
| Security | | Shares | | Value | |
| Gas Distribution — 3.1% | |
| AGL Resources, Inc. | | | 36,100 | | | $ | 1,270,359 | | |
| Piedmont Natural Gas Co., Inc. | | | 46,800 | | | | 1,107,288 | | |
| | | $ | 2,377,647 | | |
| Healthcare Services — 3.5% | |
| Express Scripts, Inc.(1) | | | 19,500 | | | $ | 1,470,495 | | |
| Omnicare, Inc. | | | 21,600 | | | | 1,168,560 | | |
| | | $ | 2,639,055 | | |
| Household Products — 1.7% | |
| Mohawk Industries, Inc.(1) | | | 17,000 | | | $ | 1,326,850 | | |
| | | $ | 1,326,850 | | |
| Insurance — 1.7% | |
| Markel Corp.(1) | | | 4,000 | | | $ | 1,272,000 | | |
| | | $ | 1,272,000 | | |
| Investment Services — 1.4% | |
| A.G. Edwards, Inc. | | | 25,800 | | | $ | 1,091,856 | | |
| | | $ | 1,091,856 | | |
| Machinery-Industrial — 1.5% | |
| Graco, Inc. | | | 34,200 | | | $ | 1,172,034 | | |
| | | $ | 1,172,034 | | |
| Manufacturing — 4.2% | |
| Dover Corp. | | | 25,300 | | | $ | 986,194 | | |
| Jacobs Engineering Group, Inc.(1) | | | 19,200 | | | | 1,224,000 | | |
| Pentair, Inc. | | | 30,800 | | | | 1,000,692 | | |
| | | $ | 3,210,886 | | |
| Medical Devices — 2.5% | |
| Varian Medical Systems, Inc.(1) | | | 42,500 | | | $ | 1,936,300 | | |
| | | $ | 1,936,300 | | |
| Medical Products — 4.8% | |
| Biomet, Inc. | | | 38,240 | | | $ | 1,331,899 | | |
| Patterson Companies, Inc.(1) | | | 22,400 | | | | 926,912 | | |
| Respironics, Inc.(1) | | | 38,500 | | | | 1,380,995 | | |
| | | $ | 3,639,806 | | |
| Security | | Shares | | Value | |
| Medical Services / Supplies — 2.6% | |
| C.R. Bard, Inc. | | | 15,800 | | | $ | 985,604 | | |
| DENTSPLY International, Inc. | | | 17,300 | | | | 953,922 | | |
| | | $ | 1,939,526 | | |
| Multi-Utilities — 2.1% | |
| Questar Corp. | | | 19,800 | | | $ | 1,559,250 | | |
| | | $ | 1,559,250 | | |
| Office Electronics / Technology — 1.3% | |
| Zebra Technologies Corp. Class A(1) | | | 22,675 | | | $ | 977,519 | | |
| | | $ | 977,519 | | |
| Oil and Gas-Equipment and Services — 3.6% | |
| FMC Technologies, Inc.(1) | | | 11,500 | | | $ | 419,290 | | |
| National Oilwell Varco, Inc.(1) | | | 37,200 | | | | 2,323,884 | | |
| | | $ | 2,743,174 | | |
| Oil and Gas-Exploration and Production — 4.2% | |
| EOG Resources, Inc. | | | 18,200 | | | $ | 1,233,596 | | |
| Newfield Exploration Co.(1) | | | 43,600 | | | | 1,976,388 | | |
| | | $ | 3,209,984 | | |
| Personal Products — 1.2% | |
| Estee Lauder Cos., Inc. (The), Class A | | | 27,000 | | | $ | 895,590 | | |
| | | $ | 895,590 | | |
| Publishing — 1.9% | |
| E.W. Scripps Co. | | | 31,400 | | | $ | 1,438,120 | | |
| | | $ | 1,438,120 | | |
| REITS — 1.2% | |
| Developers Diversified Realty Corp. | | | 21,300 | | | $ | 930,384 | | |
| | | $ | 930,384 | | |
| Retail-Discount — 0.7% | |
| Dollar General Corp. | | | 28,300 | | | $ | 550,152 | | |
| | | $ | 550,152 | | |
See notes to financial statements
17
Tax-Managed Mid-Cap Core Portfolio as of October 31, 2005
PORTFOLIO OF INVESTMENTS CONT'D
| Security | | Shares | | Value | |
| Retail-Restaurants — 1.4% | |
| Sonic Corp.(1) | | | 35,900 | | | $ | 1,038,946 | | |
| | | $ | 1,038,946 | | |
| Retail-Specialty and Apparel — 3.9% | |
| Bed Bath and Beyond, Inc.(1) | | | 38,900 | | | $ | 1,576,228 | | |
| Ross Stores, Inc. | | | 52,500 | | | | 1,419,600 | | |
| | | $ | 2,995,828 | | |
| Semiconductors & Semiconductor Equipment — 1.7% | |
| Microchip Technology, Inc. | | | 42,050 | | | $ | 1,268,649 | | |
| | | $ | 1,268,649 | | |
| Specialty Chemicals and Materials — 1.9% | |
| Ecolab, Inc. | | | 43,100 | | | $ | 1,425,748 | | |
| | | $ | 1,425,748 | | |
| Transportation — 6.0% | |
| C.H. Robinson Worldwide, Inc. | | | 50,000 | | | $ | 1,763,000 | | |
| Expeditors International of Washington, Inc. | | | 32,200 | | | | 1,953,574 | | |
| Thor Industries Inc. | | | 25,000 | | | | 815,750 | | |
| | | $ | 4,532,324 | | |
Total Common Stocks
(identified cost $59,035,136) | | | | | | $ | 74,511,339 | | |
Total Investments — 97.9%
(identified cost $59,035,136) | | | | | | $ | 74,511,339 | | |
| Other Assets, Less Liabilities — 2.1% | | | | | | $ | 1,579,245 | | |
| Net Assets — 100.0% | | | | | | $ | 76,090,584 | | |
(1) Non-income producing security.
See notes to financial statements
18
Tax-Managed Mid-Cap Core Portfolio as of October 31, 2005
FINANCIAL STATEMENTS
Statement of Assets and Liabilities
As of October 31, 2005
| Assets | |
| Investments, at value (identified cost, $59,035,136) | | $ | 74,511,339 | | |
| Cash | | | 1,647,043 | | |
| Dividends and interest receivable | | | 17,778 | | |
| Total assets | | $ | 76,176,160 | | |
| Liabilities | |
| Payable to affiliate for investment adviser fee | | $ | 49,433 | | |
| Payable to affiliate for Trustees' fees | | | 605 | | |
| Other accrued expenses | | | 35,538 | | |
| Total liabilities | | $ | 85,576 | | |
| Net Assets applicable to investors' interest in Portfolio | | $ | 76,090,584 | | |
| Sources of Net Assets | |
| Net proceeds from capital contributions and withdrawals | | $ | 60,614,381 | | |
| Net unrealized appreciation (computed on the basis of identified cost) | | | 15,476,203 | | |
| Total | | $ | 76,090,584 | | |
Statement of Operations
For the Year Ended
October 31, 2005
| Investment Income | |
| Dividends | | $ | 573,910 | | |
| Interest | | | 19,583 | | |
| Total investment income | | $ | 593,493 | | |
| Expenses | |
| Investment adviser fee | | $ | 591,529 | | |
| Trustees' fees and expenses | | | 5,622 | | |
| Custodian fee | | | 48,725 | | |
| Legal and accounting services | | | 26,874 | | |
| Miscellaneous | | | 5,230 | | |
| Total expenses | | $ | 677,980 | | |
Deduct —
Reduction of investment adviser fee | | $ | 5,945 | | |
| Total expense reductions | | $ | 5,945 | | |
| Net expenses | | $ | 672,035 | | |
| Net investment loss | | $ | (78,542 | ) | |
| Realized and Unrealized Gain (Loss) | |
Net realized gain (loss) —
Investment transactions (identified cost basis) | | $ | 1,310,390 | | |
| Net realized gain | | $ | 1,310,390 | | |
Change in unrealized appreciation (depreciation) —
Investments (identified cost basis) | | $ | 5,930,816 | | |
| Net change in unrealized appreciation (depreciation) | | $ | 5,930,816 | | |
| Net realized and unrealized gain | | $ | 7,241,206 | | |
| Net increase in net assets from operations | | $ | 7,162,664 | | |
See notes to financial statements
19
Tax-Managed Mid-Cap Core Portfolio as of October 31, 2005
FINANCIAL STATEMENTS CONT'D
Statements of Changes in Net Assets
Increase (Decrease)
in Net Assets | | Year Ended
October 31, 2005 | | Year Ended
October 31, 2004 | |
From operations —
Net investment loss | | $ | (78,542 | ) | | $ | (89,595 | ) | |
Net realized gain from
investment transactions | | | 1,310,390 | | | | 914,226 | | |
Net change in unrealized
appreciation (depreciation)
of investments | | | 5,930,816 | | | | 2,644,478 | | |
| Net increase in net assets from operations | | $ | 7,162,664 | | | $ | 3,469,109 | | |
Capital transactions —
Contributions | | $ | 8,294,624 | | | $ | 21,164,553 | | |
| Withdrawals | | | (6,496,638 | ) | | | (3,615,999 | ) | |
Net increase in net assets from
capital transactions | | $ | 1,797,986 | | | $ | 17,548,554 | | |
| Net increase in net assets | | $ | 8,960,650 | | | $ | 21,017,663 | | |
| Net Assets | |
| At beginning of year | | $ | 67,129,934 | | | $ | 46,112,271 | | |
| At end of year | | $ | 76,090,584 | | | $ | 67,129,934 | | |
See notes to financial statements
20
Tax-Managed Mid-Cap Core Portfolio as of October 31, 2005
FINANCIAL STATEMENTS CONT'D
Supplementary Data
| | | Year Ended October 31, | | Period Ended | |
| | | 2005 | | 2004 | | 2003 | | October 31, 2002(1) | |
| Ratios/Supplemental Data† | |
| Ratios (As a percentage of average daily net assets): | |
| Net expenses | | | 0.91 | % | | | 0.93 | % | | | 0.99 | % | | | 1.68 | %(2) | |
| Net investment loss | | | (0.11 | )% | | | (0.15 | )% | | | (0.22 | )% | | | (0.81 | )%(2) | |
| Portfolio Turnover | | | 53 | % | | | 42 | % | | | 50 | % | | | 13 | % | |
| Total Return(3) | | | 10.54 | % | | | 6.43 | % | | | 25.97 | % | | | (14.72 | )% | |
| Net assets, end of year (000's omitted) | | $ | 76,091 | | | $ | 67,130 | | | $ | 46,112 | | | $ | 17,149 | | |
| † The operating expenses of the Portfolio reflect a reduction of the investment adviser fee. Had such action not been taken, the ratios would have been as follows: | |
| Ratios (As a percentage of average daily net assets): | |
| Expenses | | | 0.92 | % | | | 0.93 | % | | | | | | | | | |
| Net investment loss | | | (0.12 | )% | | | (0.15 | )% | | | | | | | | | |
(1) For the period from the start of business, March 1, 2002, to October 31, 2002.
(2) Annualized.
(3) Total return is not computed on an annualized basis.
See notes to financial statements
21
Tax-Managed Mid-Cap Core Portfolio as of October 31, 2005
NOTES TO FINANCIAL STATEMENTS
1 Significant Accounting Policies
Tax-Managed Mid-Cap Core Portfolio (the Portfolio) is registered under the Investment Company Act of 1940, as amended, as a diversified open-end management investment company. The Portfolio, which was organized as a trust under the laws of the State of New York on December 10, 2001, seeks to achieve long-term, after-tax returns by investing in a diversified portfolio of common stocks of mid-cap companies. The Declaration of Trust permits the Trustees to issue interests in the Portfolio. At October 31, 2005, the Eaton Vance Tax-Managed Mid-Cap Core Fund and the Eaton Vance Tax-Managed Equity Asset Allocation Fund held 34.5% and 65.3% interests in the Portfolio, respectively. The following is a summary of significant accounting policies consistently followed by the Portfolio in the preparation of its financial statements. The policies are in conformity with accounting principles generally accepted in the United States of America.
A Investment Valuation — Securities listed on a U.S. securities exchange generally are valued at the last sale price on the day of valuation or, if no sales took place on such date, at the mean between the closing bid and asked prices therefore on the exchange where such securities are principally traded. Equity securities listed on the NASDAQ National Market System generally are valued at the official NASDAQ closing price. Unlisted or listed securities for which closing sales prices or closing quotations are not available are valued at the mean between the latest available bid and asked prices, or, in the case of preferred equity securities that are not listed or traded in the over-the-counter market, by an independent pricing service. Exchange-traded options are valued at the last sale price for the day of valuation as quoted on the principal exchange or board of trade on which the options are traded or, in the absence of sales on such date, at the mean between the latest bid and asked prices therefore. Futures positions on securities and currencies generally are valued at closing settlement prices. Short-term debt securities with a remaining maturity of 60 days or less are valued at amortized cost. If short-term debt securities were acquired with a remaining maturity of more than 60 days, their amortized cost value will be based on their value on the sixty-first day prior to maturity. Other fixed income and debt securities, including listed securities and securities for which price quotations are available, will normally be valued on the basis of valuations furnished by a pricing service. Foreign securities and currencies are valued in U.S. dollars, based on foreign currency exchange rate quotations supplied by an independent quotation service. The daily valuation of exch ange-traded foreign securities generally is determined as of the close of trading on the principal exchange on which such securities trade. Events occurring after the close of trading on foreign exchanges may result in adjustments to the valuation of foreign securities to more accurately reflect their fair value as of the close of regular trading on the New York Stock Exchange. When valuing foreign securities that meet certain criteria, the Trustees have approved the use of a fair value service that values such securities to reflect market trading that occurs after the close of the applicable foreign markets of comparable securities or other instruments that have a strong correlation to the fair-valued securities. Investments held by the Portfolio for which valuations or market quotations are unavailable are valued at fair value using methods determined in good faith by or at the direction of the Trustees of the Portfolio considering rel evant factors, data and information including the market value of freely tradable securities of the same class in the principal market on which such securities are normally traded.
B Income — Dividend income is recorded on the ex-dividend date for dividends received in cash and/or securities. However, if the ex-dividend date has passed, certain dividends from foreign securities are recorded as the Portfolio is informed of the ex-dividend date. Interest income is recorded on the accrual basis.
C Income Taxes — The Portfolio is treated as a partnership for federal tax purposes. No provision is made by the Portfolio for federal or state taxes on any taxable income of the Portfolio because each investor in the Portfolio is ultimately responsible for the payment of any taxes on its share of taxable income. Since the Portfolio's investors include regulated investment companies that invest all or substantially all of their assets in the Portfolio, the Portfolio normally must satisfy the applicable source of income and diversification requirements (under the Internal Revenue Code) in order for its investors to satisfy them. The Portfolio will allocate at least annually among its investors each investor's distributive share of the Portfolio's net investment income, net realized capital gains, and any other items of income, gain, loss, deduction or credit.
D Expense Reduction — Investors Bank & Trust Company (IBT) serves as custodian to the Portfolio. Pursuant to the custodian agreement, IBT receives a fee reduced by credits which are determined based on the average daily cash balances the Portfolio maintains with IBT. All credit balances used to reduce the Portfolio's custodian fees are reported as a reduction of total expenses on the Statement of Operations.
22
Tax-Managed Mid-Cap Core Portfolio as of October 31, 2005
NOTES TO FINANCIAL STATEMENTS CONT'D
E Financial Futures Contract — Upon entering a financial futures contract, the Portfolio is required to deposit either in cash or securities an amount (initial margin) equal to a certain percentage of the purchase price indicated in the financial futures contract. Subsequent payments are made or received by the Portfolio (margin maintenance) each day, dependent on daily fluctuations in the value of the underlying security, and are recorded for book purposes as unrealized gains or losses by the Portfolio. The Portfolio's investment in financial futures contracts is designed to hedge against anticipated future changes in price of current or anticipated Portfolio positions. Should prices move unexpectedly, the Portfolio may not achieve the anticipated benefits of the financi al futures contracts and may realize a loss.
F Put Options — Upon the purchase of a put option by the Portfolio, the premium paid is recorded as an investment, the value of which is marked-to-market daily. When a purchased option expires, the Portfolio will realize a loss in the amount of the cost of the option. When the Portfolio enters into a closing sale transaction, the Portfolio will realize a gain or loss depending on whether the sales proceeds from the closing sale transaction are greater or less than the cost of the option. When the Portfolio exercises a put option, settlement is made in cash. The risk associated with purchasing options is limited to the premium originally paid.
G Securities Sold Short — The Portfolio may sell a security short if it owns at least an equal amount of the security sold short or another security convertible or exchangeable for an equal amount of the security sold short. Such transactions are done in anticipation of a decline in the market price of the securities or in order to hedge portfolio positions. The Portfolio will generally borrow the security sold in order to make delivery to the buyer. Upon executing the transaction, the Portfolio records the proceeds as deposits with brokers in the Statement of Assets and Liabilities and establishes an offsetting payable for securities sold short for the securities due on settlement. The proceeds are retained by the broker as collateral for the short position. The liabilit y is marked-to-market and the Portfolio is required to pay the lending broker any dividend or interest income earned while the short position is open. A gain or loss is recorded when the security is delivered to the broker. The Portfolio may recognize a loss on the transaction if the market value of the securities sold increases before the securities are delivered.
H Foreign Currency Translation — Investment valuations, other assets and liabilities initially expressed in foreign currencies are converted each business day into U.S. dollars based upon current exchange rates. Purchases and sales of foreign investment securities and income and expenses are converted into U.S. dollars based upon currency exchange rates prevailing on the respective dates of such transactions. Recognized gains or losses on investment transactions attributable to foreign currency exchange rates are recorded for financial statement purposes as net realized gains and losses on investments. That portion of unrealized gains and losses on investments that results from fluctuations in foreign currency exchange rates is not separately disclosed.
I Use of Estimates — The preparation of the financial statements in conformity with accounting principles generally accepted in the United States of America requires management to make estimates and assumptions that affect the reported amounts of assets and liabilities at the date of the financial statements and the reported amounts of income and expense during the reporting period. Actual results could differ from those estimates.
J Other — Investment transactions are accounted for on a trade date basis. Realized gains and losses are computed on the specific identification of the securities sold.
K Indemnifications — Under the Portfolio's organizational documents, its officers and Trustees may be indemnified against certain liabilities and expenses arising out of the performance of their duties to the Portfolio. Interestholders in the Portfolio are jointly and severally liable for the liabilities and obligations of the Portfolio in the event that the Portfolio fails to satisfy such liabilities and obligations; provided, however, that, to the extent assets are available in the Portfolio, the Portfolio may, under certain circumstances, indemnify interestholders from and against any claim or liability to which such holder may become subject by reason of being or having been an interestholder in the Portfolio. Additionally, in the normal course of business, the Portfo lio enters into agreements with service providers that may contain indemnification clauses. The Portfolio's maximum exposure under these arrangements is unknown as this would involve future claims that may be made against the Portfolio that have not yet occurred.
23
Tax-Managed Mid-Cap Core Portfolio as of October 31, 2005
NOTES TO FINANCIAL STATEMENTS CONT'D
2 Investment Adviser Fee and Other Transactions with Affiliates
The investment adviser fee is earned by Boston Management and Research (BMR), a wholly-owned subsidiary of Eaton Vance Management (EVM), as compensation for management and investment advisory services rendered to the Portfolio. Under the advisory agreement, BMR receives a monthly advisory fee equal to 0.80% annually of the average daily net assets of the Portfolio up to $500 million, and at reduced rates as daily net assets exceed that level. For the year ended October 31, 2005, the advisory fee amounted to $591,529. BMR has agreed to reduce the investment adviser fee by an amount equal to that portion of commissions paid to broker dealers in execution of Portfolio transactions that is consideration for third-party research services. For the year ended October 31, 2005, BMR waived $5,945 of its advisory fee. Pursuant to a sub-advisory agreement, BMR has delegated the investment management of the Portfolio to Atlanta Capital Mana gement Company, LLC (Atlanta Capital), a majority-owned subsidiary of Eaton Vance. BMR pays Atlanta Capital a monthly fee for sub-advisory services provided to the Portfolio equal to 0.55% annually of the average daily net assets up to $500 million, and at reduced rates as daily net assets exceed that level. Except for Trustees of the Portfolio who are not members of EVM's or BMR's organization, officers and Trustees receive remuneration for their services to the Portfolio out of the investment adviser and sub-adviser fees. Trustees of the Portfolio who are not affiliated with BMR may elect to defer receipt of all or a percentage of their annual fees in accordance with the terms of the Trustees Deferred Compensation Plan. For the year ended October 31, 2005, no significant amounts have been deferred.
Certain officers and Trustees of the Portfolio are officers of the above organizations.
3 Investment Transactions
Purchases and sales of investments, other than short-term obligations, aggregated $39,921,598 and $38,778,569, respectively, for the year ended October 31, 2005.
4 Federal Income Tax Basis of Unrealized Appreciation (Depreciation)
The cost and unrealized appreciation (depreciation) in value of the investments owned at October 31, 2005, as computed on a federal income tax basis, were as follows:
| Aggregate cost | | $ | 59,240,819 | | |
| Gross unrealized appreciation | | $ | 15,944,895 | | |
| Gross unrealized depreciation | | | (674,375 | ) | |
| Net unrealized appreciation | | $ | 15,270,520 | | |
5 Financial Instruments
The Portfolio may trade in financial instruments with off-balance sheet risk in the normal course of its investing activities to assist in managing exposure to various market risks. These financial instruments include written options and financial futures contracts and may involve, to a varying degree, elements of risk in excess of the amounts recognized for financial statement purposes.
The notional or contractual amounts of these instruments represent the investment the Portfolio has in particular classes of financial instruments and does not necessarily represent the amounts potentially subject to risk. The measurement of the risks associated with these instruments is meaningful only when all related and offsetting transactions are considered. The Portfolio did not have any open obligations under these financial instruments at October 31, 2005.
6 Line of Credit
The Portfolio participates with other portfolios and funds managed by BMR and EVM and its affiliates in a $150 million unsecured line of credit agreement with a group of banks. Borrowings will be made by the Portfolio solely to facilitate the handling of unusual and/or unanticipated short-term cash requirements. Interest is charged to each participating portfolio or fund based on its borrowings at an amount above either the Eurodollar rate or Federal Funds rate. In addition, a fee computed at an annual rate of 0.10% on the daily unused portion of the line of credit is allocated among the participating portfolios and funds at the end of each quarter. The Portfolio did not have any significant borrowings or allocated fees for the year ended October 31, 2005.
24
Tax-Managed Mid-Cap Core Portfolio as of October 31, 2005
REPORT OF INDEPENDENT REGISTERED PUBLIC ACCOUNTING FIRM
To the Trustees and Investors
of Tax-Managed Mid-Cap Core Portfolio:
We have audited the accompanying statement of assets and liabilities of Tax-Managed Mid-Cap Core Portfolio (the "Portfolio"), including the portfolio of investments as of October 31, 2005, the related statement of operations for the year then ended, the statement of changes in net assets for each of the two years in the period then ended and the supplementary data for each of the three years in the period then ended and for the period from the start of business March 1, 2002, to October 31, 2002. These financial statements and supplementary data are the responsibility of the Portfolio's management. Our responsibility is to express an opinion on these financial statements and supplementary data based on our audits.
We conducted our audits in accordance with standards of the Public Company Accounting Oversight Board (United States). Those standards require that we plan and perform the audits to obtain reasonable assurance about whether the financial statements and supplementary data are free of material misstatement. The Portfolio is not required to have, nor were we engaged to perform, an audit of its internal control over financial reporting. An audit includes consideration of internal control over financial reporting as a basis for designing audit procedures that are appropriate in the circumstances, but not for the purpose of expressing an opinion on the effectiveness of the Portfolio's internal control over financial reporting. Accordingly, we express no such opinion. An audit includes examining, on a test basis, evidence supporting the amounts and disclosures in the financial statements, assessing the accounting principles used and si gnificant estimates made by management, as well as evaluating the overall financial statement presentation. Our procedures included confirmation of securities owned as of October 31, 2005 by correspondence with the custodian and brokers. We believe that our audits provide a reasonable basis for our opinion.
In our opinion, the financial statements and supplementary data referred to above present fairly, in all material respects, the financial position of Tax-Managed Mid-Cap Core Portfolio at October 31, 2005, the results of its operations for the year then ended, the changes in its net assets for each of the two years in the period ended and the supplementary data for each of the three years in the period then ended and for the period from the start of business March 1, 2002 to October 31, 2002, in conformity with accounting principles generally accepted in the United States of America.
DELOITTE & TOUCHE LLP
Boston, Massachusetts
December 19, 2005
25
Eaton Vance Tax-Managed Mid-Cap Core Fund
BOARD OF TRUSTEES' ANNUAL APPROVAL OF THE INVESTMENT ADVISORY AND SUB-ADVISORY AGREEMENTS
The investment advisory agreement between Tax-Managed Mid-Cap Core Portfolio (the "Portfolio") and the investment adviser, Boston Management and Research, and the investment sub-advisory agreement between the investment adviser and the sub-adviser, Atlanta Capital Management, LLC ("Atlanta Capital"), each provide that the agreement will continue in effect from year to year so long as its continuance is approved at least annually (i) by a vote of a majority of the noninterested Trustees of the Portfolio cast in person at a meeting called for the purpose of voting on such approval and (ii) by the Trustees of the Portfolio or by vote of a majority of the outstanding interests of the Portfolio.
In considering the annual approval of the investment advisory and sub-advisory agreements, the Special Committee of the Board of Trustees considered information that had been provided throughout the year at regular Board meetings, as well as information furnished for a series of meetings held in February and March in preparation for a Board meeting held on March 21, 2005 to specifically consider the renewal of the investment advisory and sub-advisory agreements. Such information included, among other things, the following:
• An independent report comparing the advisory fees of the Portfolio with those of comparable funds;
• An independent report comparing the expense ratio of the Eaton Vance Tax-Managed Mid-Cap Core Fund (the "Fund") to those of comparable funds;
• Information regarding Fund investment performance in comparison to relevant peer groups of funds and appropriate indices;
• The economic outlook and the general investment outlook in relevant investment markets;
• Eaton Vance Management's ("Eaton Vance") results and financial condition and the overall organization of the investment adviser;
• The procedures and processes used to determine the fair value of Fund assets and actions taken to monitor and test the effectiveness of such procedures and processes;
• The allocation of brokerage and the benefits received by the investment adviser as the result of brokerage allocation;
• Eaton Vance's management of the relationship with the custodian, subcustodians and fund accountants;
• The resources devoted to compliance efforts undertaken by Eaton Vance and Atlanta Capital, where applicable, on behalf of the funds they manage and the record of compliance with the investment policies and restrictions and with policies on personal securities transactions;
• The quality, nature, cost and character of the administrative and other non-investment management services provided by Eaton Vance and its affiliates; and
• The terms of the advisory agreement and the reasonableness and appropriateness of the particular fee paid by the Portfolio for the services described therein.
The Special Committee also considered the nature, extent and quality of the management services provided by the investment adviser and sub-adviser. In so doing, the Special Committee considered their management capabilities with respect to the types of investments held by the Portfolio, including information relating to the education, experience and number of investment professionals and other personnel who provide services under the investment advisory and sub-advisory agreements. The Special Committee specifically noted the investment adviser's in-house equity research capabilities and experience in managing funds that seek to maximize after-tax returns. The Special Committee evaluated the level of skill required to manage the Portfolio and concluded that the human resources available at the investment adviser and sub-adviser were appropriate to fulfill effectively their duties on behalf of the Portfolio.
In its review of comparative information with respect to investment performance, the Special Committee concluded that the Fund has performed within a range that the Special Committee deemed competitive. With respect to its review of investment advisory and sub-advisory fees, the Special Committee concluded that the fees paid by the Portfolio are within the range of those paid by comparable funds within the mutual fund industry. In reviewing the information regarding the expense ratio of the Fund, the Special Committee concluded that, in light of the asset size of the Fund, the Fund's expense ratio is reasonable.
In addition to the factors mentioned above, the Special Committee reviewed the level of profits of the investment adviser and sub-adviser in providing investment management services for the Portfolio and for all Eaton Vance funds as a group. The Special Committee also reviewed the implementation of a soft dollar reimbursement program pursuant to which the Portfolio may receive reimbursement payments in respect of third party research services obtained by the investment adviser or sub-adviser as a result of soft dollar credits generated through trading on behalf of the Portfolio. The Special Committee also reviewed the benefits to Eaton Vance and its affiliates
26
Eaton Vance Tax-Managed Mid-Cap Core Fund
BOARD OF TRUSTEES' ANNUAL APPROVAL OF THE INVESTMENT ADVISORY AND SUB-ADVISORY AGREEMENTS CONT'D
in providing administration services for the Fund and for all Eaton Vance funds as a group. In addition, the Special Committee considered the fiduciary duty assumed by the investment adviser and sub-adviser in connection with the services rendered to the Portfolio and the business reputation of the investment adviser and its financial resources. The Trustees concluded that in light of the services rendered, the profits realized by the investment adviser and Atlanta Capital, an affiliated sub-adviser, are not unreasonable. The Special Committee also considered the extent to which the investment adviser and sub-adviser appear to be realizing benefits from economies of scale in managing the Portfolio, and concluded that the fee breakpoints which are in place will allow for an equitable sharing of such benefits, when realized, with the Portfolio and the shareholders of the Fund.
The Special Committee did not consider any single factor as controlling in determining whether or not to renew the investment advisory and sub-advisory agreements. Nor are the items described herein all the matters considered by the Special Committee. In assessing the information provided by Eaton Vance and its affiliates, the Special Committee also took into consideration the benefits to shareholders of investing in a fund that is a part of a large family of funds which provides a large variety of shareholder services.
Based on its consideration of the foregoing factors and conclusions, and such other factors and conclusions as it deemed relevant, and assisted by independent counsel, the Special Committee concluded that the renewal of the investment advisory and sub-advisory agreements, including the fee structures, is in the interests of shareholders.
27
Eaton Vance Tax-Managed Mid-Cap Core Fund
MANAGEMENT AND ORGANIZATION
Fund Management. The Trustees of Eaton Vance Mutual Funds Trust (the Trust) and Tax-Managed Mid-Cap Core Portfolio (the Portfolio) are responsible for the overall management and supervision of the Trust's and Portfolio's affairs. The Trustees and officers of the Trust and the Portfolio are listed below. Except as indicated, each individual has held the office shown or other offices in the same company for the last five years. Trustees and officers of the Trust and the Portfolio hold indefinite terms of office. The "noninterested Trustees" consist of those Trustees who are not "interested persons" of the Trust and the Portfolio, as that term is defined under the 1940 Act. The business address of each Trustee and officer is The Eaton Vance Building, 255 State Street, Boston, Massachusetts 02109. As used below, "EVC" refers to Eaton Vance Corp., "EV" refers to Eaton Vance, Inc., "EVM" refers to Eaton Vance Management, "BMR" refers to Boston Management and Research, "EVD" refers to Eaton Vance Distributors, Inc. and "Atlanta Capital" refers to Atlanta Capital Management Company, LLC. EVC and EV are the corporate parent and trustee, respectively, of EVM and BMR. EVD is the Fund's principal underwriter, the Portfolio's placement agent and a wholly-owned subsidiary of EVM. Each officer affiliated with Eaton Vance may hold a position with other Eaton Vance affiliates that is comparable to its position with EVM listed below.
Name and
Date of Birth | | Position(s)
with the
Trust and the
Portfolio | | Term of
Office and
Length of
Service | | Principal Occupation(s)
During Past Five Years | | Number of Portfolios
in Fund Complex
Overseen By
Trustee(1) | | Other Directorships Held | |
| Interested Trustee | |
|
James B. Hawkes
11/9/41 | | Trustee of the Trust; Trustee and President of the Portfolio | | Trustee of the Trust since 1991; Trustee and President of the Portfolio since 2001 | | Chairman, President and Chief Executive Officer of BMR, EVC, EVM and EV; Director of EV; Vice President and Director of EVD. Trustee and/or officer of 161 registered investment companies in the Eaton Vance Fund Complex. Mr. Hawkes is an interested person because of his positions with BMR, EVM, EVC and EV, which are affiliates of the Trust and the Portfolio. | | | 161 | | | Director of EVC | |
|
| Noninterested Trustee(s) | |
|
Benjamin C. Esty
1/2/63 | | Trustee | | Since 2005 | | Professor, Harvard University Graduate School of Business Administration (since 2003). Formerly, Associate Professor, Harvard University Graduate School of Business Administration (2000-2003). | | | 152 | | | None | |
|
Samuel L. Hayes, III
2/23/35 | | Trustee | | Trustee of the Trust since 1986; of the Portfolio since 2001 and Chairman of the Board since 2005 | | Jacob H. Schiff Professor of Investment Banking Emeritus, Harvard University Graduate School of Business Administration. | | | 161 | | | Director of Tiffany & Co. (specialty retailer) and Telect, Inc. (telecommunication services company) | |
|
William H. Park
9/19/47 | | Trustee | | Since 2003 | | President and Chief Executive Officer, Prizm Capital Management, LLC (investment management firm) (since 2002). Executive Vice President and Chief Financial Officer, United Asset Management Corporation (a holding company owning institutional investment management firms) (1982-2001). | | | 161 | | | None | |
|
Ronald A. Pearlman
7/10/40 | | Trustee | | Since 2003 | | Professor of Law, Georgetown University Law Center (since 1999). Tax Partner, Covington & Burling, Washington, DC (1991-2000). | | | 161 | | | None | |
|
28
Eaton Vance Tax-Managed Mid-Cap Core Fund
MANAGEMENT AND ORGANIZATION CONT'D
Name and
Date of Birth | | Position(s)
with the
Trust and the
Portfolio | | Term of
Office and
Length of
Service | | Principal Occupation(s)
During Past Five Years | | Number of Portfolios
in Fund Complex
Overseen By
Trustee(1) | | Other Directorships Held | |
| Noninterested Trustee(s) (continued) | |
|
Norton H. Reamer
9/21/35 | | Trustee | | Trustee of the Trust since 1986; of the Portfolio since 2001 | | President, Chief Executive Officer and a Director of Asset Management Finance Corp. (a specialty finance company serving the investment management industry) (since October 2003). President, Unicorn Corporation (an investment and financial advisory services company) (since September 2000). Formerly, Chairman, Hellman, Jordan Management Co., Inc. (an investment management company) (2000-2003). Formerly, Advisory Director of Berkshire Capital Corporation (investment banking firm) (2002-2003). Formerly Chairman of the Board, United Asset Management Corporation (a holding company owning institutional investment management firms) and Chairman, President and Director, UAM Funds (mutual funds) (1980-2000). | | | 161 | | | None | |
|
Lynn A. Stout
9/14/57 | | Trustee | | Trustee of the Trust since 1998; of the Portfolio since 2001 | | Professor of Law, University of California at Los Angeles School of Law (since July 2001). Formerly, Professor of Law, Georgetown University Law Center. | | | 161 | | | None | |
|
Ralph F. Verni
1/26/43 | | Trustee | | Since 2005 | | Consultant and private investor (since 2000). Formerly, President and Chief Executive Officer, Redwood Investment Systems, Inc. (software developer) (2000). Formerly, President and Chief Executive Officer, State Street Research & Management (investment advisor), SSRM Holdings (parent of State Street Research & Management), and SSR Realty (institutional realty manager) (1992-2000). | | | 152 | | | Director of W.P. Carey & Company LLC (manager of real estate investment trusts) | |
|
| Principal Officers who are not Trustees | |
|
Name and
Date of Birth | | Position(s)
with the
Trust and the
Portfolio | | Term of
Office and
Length of
Service | | Principal Occupation(s)
During Past Five Years | |
Thomas E. Faust Jr.
5/31/58 | | President of the Trust; Vice President of the Portfolio | | President of the Trust since 2002; Vice President of the Portfolio since 2001 | | Executive Vice President of EVM, BMR, EVC and EV; Chief Investment Officer of EVM and BMR and Director of EVC. Chief Executive Officer of Belair Capital Fund LLC, Belcrest Capital Fund LLC, Belmar Capital Fund LLC, Belport Capital Fund LLC and Belrose Capital Fund LLC (private investment companies sponsored by EVM). Officer of 65 registered investment companies managed by EVM or BMR. | |
|
William H. Ahern, Jr.
7/28/59 | | Vice President of the Trust | | Since 1995 | | Vice President of EVM and BMR. Officer of 70 registered investment companies managed by EVM or BMR. | |
|
William O. Bell, IV
7/26/73 | | Vice President of the Portfolio | | Since 2005 | | Vice President of Atlanta Capital. Officer of 2 registered investment companies managed by EVM or BMR. | |
|
Cynthia J. Clemson
3/2/63(2) | | Vice President of the Trust | | Since 2005 | | Vice President of EVM and BMR. Officer of 85 registered investment companies managed by EVM or BMR. | |
|
Kevin S. Dyer
2/21/75 | | Vice President of the Trust | | Since 2005 | | Assistant Vice President of EVM and BMR. Officer of 24 registered investment companies managed by EVM or BMR. | |
|
| William R. Hackney, III 4/12/48(3) | | Vice President of the Portfolio | | Since 2001 | | Managing Partner and member of the Executive Committee of Atlanta Capital. Officer of 3 registered investment companies managed by EVM or BMR. | |
|
Marilyn Robinson Irvin
6/17/58 | | Vice President of the Portfolio | | Since 2005 | | Senior Vice President and Principal of Atlanta Capital. Officer of 2 registered investment companies managed by EVM or BMR. | |
|
29
Eaton Vance Tax-Managed Mid-Cap Core Fund
MANAGEMENT AND ORGANIZATION CONT'D
Name and
Date of Birth | | Position(s)
with the
Trust and the
Portfolio | | Term of
Office and
Length of
Service | | Principal Occupation(s)
During Past Five Years | |
| Principal Officers who are not Trustees (continued) | |
|
Aamer Khan
6/7/60 | | Vice President of the Trust | | Since 2005 | | Vice President of EVM and BMR. Officer of 27 registered investment companies managed by EVM or BMR. | |
|
Michael R. Mach
7/15/47 | | Vice President of the Trust | | Since 1999 | | Vice President of EVM and BMR. Officer of 32 registered investment companies managed by EVM or BMR. | |
|
Robert B. MacIntosh
1/22/57 | | Vice President of the Trust | | Since 1998 | | Vice President of EVM and BMR. Officer of 85 registered investment companies managed by EVM or BMR. | |
|
Paul J. Marshall
5/2/65 | | Vice President of the Portfolio | | Since 2001 | | Vice President of Atlanta Capital. Portfolio manager for Bank of America Capital Management (1995-2000). Officer of 2 registered investment companies managed by EVM or BMR. | |
|
Charles B. Reed
10/9/65 | | Vice President of the Portfolio | | Since 2001 | | Vice President of Atlanta Capital. Officer of 2 registered investment companies managed by EVM or BMR. | |
|
Duncan W. Richardson
10/26/57 | | Vice President of the Trust | | Since 2001 | | Senior Vice President and Chief Equity Investment Officer of EVM and BMR. Officer of 51 registered investment companies managed by EVM or BMR. | |
|
Walter A. Row, III
7/20/57 | | Vice President of the Trust | | Since 2001 | | Director of Equity Research and a Vice President of EVM and BMR. Officer of 31 registered investment companies managed by EVM or BMR. | |
|
Judith A. Saryan
8/21/54 | | Vice President of the Trust | | Since 2003 | | Vice President of EVM and BMR. Officer of 33 registered investment companies managed by EVM or BMR. | |
|
Susan Schiff
3/13/61 | | Vice President of the Trust | | Since 2002 | | Vice President of EVM and BMR. Officer of 29 registered investment companies managed by EVM or BMR. | |
|
Barbara E. Campbell
6/19/57 | | Treasurer of the Trust | | Since 2005* | | Vice President of EVM and BMR. Officer of 161 registered investment companies managed by EVM or BMR. | |
|
Alan R. Dynner
10/10/40 | | Secretary | | Secretary of the Trust since 1997; of the Portfolio since 2001 | | Vice President, Secretary and Chief Legal Officer of BMR, EVM, EVD, EV and EVC. Officer of 161 registered investment companies managed by EVM or BMR. | |
|
Michelle A. Green
8/25/69 | | Treasurer of the Portfolio | | Since 2002* | | Vice President of EVM and BMR. Chief Financial Officer of Belair Capital Fund LLC, Belcrest Capital Fund LLC, Belmar Capital Fund LLC, Belport Capital Fund LLC and Belrose Capital Fund LLC (private investment companies sponsored by EVM). Officer of 67 registered investment companies managed by EVM or BMR. | |
|
Paul M. O'Neil
7/11/53 | | Chief
Compliance Officer | | Since 2004 | | Vice President of EVM and BMR. Officer of 161 registered investment companies managed by EVM or BMR. | |
|
(1) Includes both master and feeder funds in a master-feeder structure.
* Prior to 2005, Ms. Campbell served as Assistant Treasurer of the Trust since 1995 and prior to 2002 Ms. Green served as Assistant Treasurer of the Portfolio since 2001.
The SAI for the Fund includes additional information about the Trustees and officers of the Fund and the Portfolio and can be obtained without charge by calling 1-800-225-6265.
30
This Page Intentionally Left Blank
This Page Intentionally Left Blank
This Page Intentionally Left Blank
Investment Adviser of Tax-Managed Mid-Cap Core Portfolio
Boston Management and Research
The Eaton Vance Building
255 State Street
Boston, MA 02109
Sub-Adviser of Tax-Managed Mid-Cap Core Portfolio
Atlanta Capital Management Company L.L.C.
1349 West Peachtree Street
Suite 1600
Atlanta, GA 30309
Administrator of Eaton Vance Tax-Managed Mid-Cap Core Fund
Eaton Vance Management
The Eaton Vance Building
255 State Street
Boston, MA 02109
Principal Underwriter
Eaton Vance Distributors, Inc.
The Eaton Vance Building
255 State Street
Boston, MA 02109
(617) 482-8260
Custodian
Investors Bank & Trust Company
200 Clarendon Street
Boston, MA 02116
Transfer Agent
PFPC Inc.
Attn: Eaton Vance Funds
P.O. Box 9653
Providence, RI 02940-9653
(800) 262-1122
Independent Registered Public Accounting Firm
Deloitte & Touche LLP
200 Berkeley Street
Boston, MA 02116-5022
Eaton Vance Tax-Managed Mid-Cap Core Fund
The Eaton Vance Building
255 State Street
Boston, MA 02109
This report must be preceded or accompanied by a current prospectus. Before investing, investors should consider carefully the Fund's investment
objective, risks, and charges and expenses. The Fund's current prospectus contains this and other information about the Fund and is available
through your financial advisor. Please read the prospectus carefully before you invest or send money. For further information please call 1-800-225-6265.
1301-12/05 TMMCCSRC

Annual Report October 31, 2005


EATON VANCE
TAX-MANAGED
MULTI-CAP
OPPORTUNITY
FUND
IMPORTANT NOTICES REGARDING PRIVACY,
DELIVERY OF SHAREHOLDER DOCUMENTS,
PORTFOLIO HOLDINGS AND PROXY VOTING
Privacy. The Eaton Vance organization is committed to ensuring your financial privacy. Each of the financial institutions identified below has in effect the following policy ("Privacy Policy") with respect to nonpublic personal information about its customers:
• Only such information received from you, through application forms or otherwise, and information about your Eaton Vance fund transactions will be collected. This may include information such as name, address, social security number, tax status, account balances and transactions.
• None of such information about you (or former customers) will be disclosed to anyone, except as permitted by law (which includes disclosure to employees necessary to service your account). In the normal course of servicing a customer's account, Eaton Vance may share information with unaffiliated third parties that perform various required services such as transfer agents, custodians and broker/dealers.
• Policies and procedures (including physical, electronic and procedural safeguards) are in place that are designed to protect the confidentiality of such information.
• We reserve the right to change our Privacy Policy at any time upon proper notification to you. Customers may want to review our Policy periodically for changes by accessing the link on our homepage: www.eatonvance.com.
Our pledge of privacy applies to the following entities within the Eaton Vance organization: the Eaton Vance Family of Funds, Eaton Vance Management, Eaton Vance Investment Counsel, Boston Management and Research, and Eaton Vance Distributors, Inc.
In addition, our Privacy Policy only applies to those Eaton Vance customers who are individuals and who have a direct relationship with us. If a customer's account (i.e. fund shares) is held in the name of a third-party financial adviser/ broker-dealer, it is likely that only such adviser's privacy policies apply to the customer. This notice supersedes all previously issued privacy disclosures.
For more information about Eaton Vance's Privacy Policy, please call 1-800-262-1122.
Delivery of Shareholder Documents. The Securities and Exchange Commission (the "SEC") permits funds to deliver only one copy of shareholder documents, including prospectuses, proxy statements and shareholder reports, to fund investors with multiple accounts at the same residential or post office box address. This practice is often called "householding" and it helps eliminate duplicate mailings to shareholders.
Eaton Vance, or your financial adviser, may household the mailing of your documents indefinitely unless you instruct Eaton Vance, or your financial adviser, otherwise.
If you would prefer that your Eaton Vance documents not be householded, please contact Eaton Vance at 1-800-262-1122, or contact your financial adviser.
Your instructions that householding not apply to delivery of your Eaton Vance documents will be effective within 30 days of receipt by Eaton Vance or your financial adviser.
Portfolio Holdings. Each Eaton Vance Fund and its underlying Portfolio (if applicable) will file a schedule of its portfolio holdings on Form N-Q with the SEC for the first and third quarters of each fiscal year. The Form N-Q will be available on the Eaton Vance website www.eatonvance.com, by calling Eaton Vance at 1-800-262-1122 or in the EDGAR database on the SEC's website at www.sec.gov. Form N-Q may also be reviewed and copied at the SEC's public reference room in Washington, D.C. (call 1-800-732-0330 for information on the operation of the public reference room).
Proxy Voting. From time to time, funds are required to vote proxies related to the securities held by the funds. The Eaton Vance Funds or their underlying Portfolios (if applicable) vote proxies according to a set of policies and procedures approved by the Funds' and Portfolios' Boards. You may obtain a description of these policies and procedures and information on how the Funds or Portfolios voted proxies relating to Portfolio securities during the most recent 12 month period ended June 30, without charge, upon request, by calling 1-800-262-1122. This description is also available on the SEC's website at www.sec.gov.
Eaton Vance Tax-Managed Multi-Cap Opportunity Fund as of October 31, 2005
MANAGEMENT’S DISCUSSION OF FUND PERFORMANCE

Arieh Coll
Portfolio Manager
The Fund
Performance For The Past Year
• During the year ended October 31, 2005, the Fund’s Class A shares had a total return of 7.85%. This return was the result of an increase in net asset value (NAV) per share to $10.85 on October 31, 2005, from $10.06 on October 31, 2004.(1)
• The Fund’s Class B shares had a total return of 6.92% during the same period, the result of an increase in NAV per share to $10.35 from $9.68.(1)
• The Fund’s Class C shares had a total return of 6.91% during the same period, the result of an increase in NAV per share to $10.37 from $9.70.(1)
• For comparison, the Fund’s benchmark, the S&P 500 Index – a broad-based, unmanaged index of stocks commonly used as a measure of U.S. stock market performance – had a total return of 8.72% during the same period.(2)
See pages 3 and 4 for more performance information, including after-tax returns.
Management Discussion
• Despite rising interest rates during the year ended October 31, 2005, U.S. equities trended upward, producing solid returns in the high single digits. The increase in interest rates was caused by inflation fears and rising commodity prices. Defensive stocks, such as those found in the energy and utilities sectors, continued to be the main focus for investors. Growth stocks, such as those found in the information technology and consumer cyclicals sectors, continued to lag the overall market.
• Individual stock selection tended to be the primary contributor to relative returns for the Fund. Certain holdings in the information technology, consumer discretionary, and industrials sectors were the primary drivers of underperformance. Examples included a consumer electronics retailer and a manufacturer of wireless Internet-based communications devices. On the positive side, a semiconductor stock held by the Portfolio realized strong returns during the period, as did several of the Fund’s holdings in the energy sector, which management overweighted relative to the S&P 500 Index.(2) This overweight also contributed positively to the Fund’s relative performance.
• In some cases, management responded to stock price declines by selling shares purchased at higher levels in order to realize capital losses. Realizing losses when they are available allows us to build a cushion of capital losses with which we can offset realized capital gains. Harvesting available capital losses in a consistent and disciplined manner is an important component of the Portfolio’s tax-managed strategy.
• Although the Fund’s underperformance of the past year was disappointing, it has outperformed its benchmark index over a five-year period. The Fund continues to invest primarily in common stocks of growth companies that are attractive relative to their long term investment prospects. “Growth companies” are companies that we expect, over the long term, to have earnings growth that is faster than the growth rates of the U.S. economy and the U.S. stock market as a whole. We are confident that our flexible investment approach to growth investing is a solid strategy that over time can serve shareholders well.
The views expressed throughout this report are those of the portfolio manager and are current only through the end of the period of the report as stated on the cover. These views are subject to change at any time based upon market or other conditions, and the investment adviser disclaims any responsibility to update such views. These views may not be relied on as investment advice and, because investment decisions for a fund are based on many factors, may not be relied on as an indication of trading intent on behalf of any Eaton Vance fund.
Past performance is no guarantee of future results. Returns are historical and are calculated by determining the percentage change in net asset value or offering price (as applicable) with all distributions reinvested. Investment return and principal value will fluctuate so that shares, when redeemed, may be worth more or less than their original cost. Performance is for stated time period only; due to market volatility, the Fund’s current performance may be lower or higher than the quoted return. For performance as of the most recent month end, please refer to www.eatonvance.com.
(1) These returns do not include the 5.75% maximum sales charge for Class A shares or the applicable contingent deferred sales charge (CDSC) for Class B and Class C shares. If sales charges were deducted, returns would be lower.
(2) It is not possible to invest directly in an Index. The Index’s total return does not reflect commissions or expenses that would have been incurred if an investor individually purchased or sold the securities represented in the Index.
Fund shares are not insured by the FDIC and are not deposits or other obligations of, or guaranteed by, any depository institution. Shares are subject to investment risks, including possible loss of principal invested.
2
Eaton Vance Tax-Managed Multi-Cap Opportunity Fund as of October 31, 2005
FUND PERFORMANCE
The line graph and table set forth below provide information about the Fund’s performance. The line graph compares the performance of Class A of the Fund with that of the S&P 500 Index, an unmanaged index of 500 common stocks commonly used as a measure of U.S. stock market performance. The lines on the graph represent the total returns of a hypothetical investment of $10,000 in each of Class A and the S&P 500 Index. Class A total returns are presented at net asset value and maximum public offering price. The table includes the total returns of each Class of the Fund at net asset value and public offering price. The performance presented below does not reflect the deduction of taxes, if any, that a shareholder would pay on distributions or redemptions of Fund shares.
Performance* | | Class A | | Class B | | Class C | |
| | | | | | | |
Average Annual Total Returns (at net asset value) | | | | | | | |
One Year | | 7.85 | % | 6.92 | % | 6.91 | % |
Five Years | | -0.88 | | -1.67 | | -1.63 | |
Life of Fund† | | 1.54 | | 0.65 | | 0.69 | |
| | | | | | | |
SEC Average Annual Total Returns (including sales charge or applicable CDSC) | | | | | |
One Year | | 1.69 | % | 1.92 | % | 5.91 | % |
Five Years | | -2.04 | | -2.07 | | -1.63 | |
Life of Fund† | | 0.42 | | 0.47 | | 0.69 | |
† Inception Dates - Class A: 6/30/00; Class B: 7/10/00; Class C: 7/10/00
* Average annual total returns do not include the 5.75% maximum sales charge for Class A shares or the applicable contingent deferred sales charge (CDSC) for Class B and Class C shares. If sales charges were deducted, returns would be lower. SEC average annual total returns for Class A reflect the maximum 5.75% sales charge. SEC returns for Class B shares reflect the applicable CDSC based on the following schedule: 5% - 1st and 2nd years; 4% - 3rd year; 3% - 4th year; 2% - 5th year; 1% - 6th year. SEC 1-year return for Class C reflects a 1% CDSC.
Past performance is no guarantee of future results. Returns are historical and are calculated by determining the percentage change in net asset value or offering price (as applicable) with all distributions reinvested. Investment return and principal value will fluctuate so that shares, when redeemed, may be worth more or less than their original cost. Performance is for stated time period only; due to market volatility, the Fund’s current performance may be lower or higher than the quoted return. For performance as of the most recent month end, please refer to www.eatonvance.com.
Top 10 Common Stock Holdings†
By net assets
NII Holdings, Inc. | | 4.6 | % |
| | | |
E*TRADE Financial Corp. | | 4.1 | % |
| | | |
Arch Coal, Inc. | | 3.3 | % |
| | | |
Amerada Hess Corp. | | 2.9 | % |
| | | |
Sportingbet PLC | | 2.8 | % |
| | | |
Research In Motion Ltd. | | 2.3 | % |
| | | |
Google Inc. | | 2.1 | % |
| | | |
UnumProvident Corp. | | 2.1 | % |
| | | |
Trico Marine Services, Inc. | | 2.0 | % |
| | | |
British Energy Group PLC | | 2.0 | % |
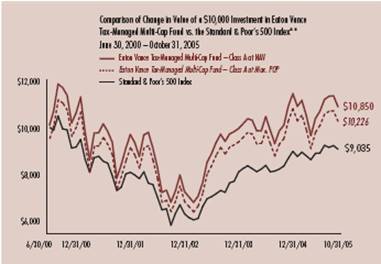
** Source: Thomson Financial. Class A of the Fund commenced investment operations on June 30, 2000.
A $10,000 hypothetical investment on 7/10/00 at net asset value in Class B shares and Class C shares would have been valued at $10,350 ($10,250 after deduction of the applicable CDSC) and $10,370, respectively, on 10/31/05. It is not possible to invest directly in an Index. The Index’s total returns do not reflect commissions or expenses that would have been incurred if an investor individually purchased or sold the securities represented in the Index.
Common Stock Investments by Sector†
By net assets
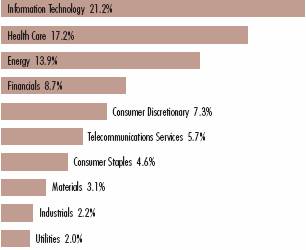
† Portfolio information may not be representative of the Portfolio’s current or future investments and may change due to active management.
3
“Return Before Taxes” does not take into consideration shareholder taxes. It is most relevant to tax-free or tax-deferred shareholder accounts. “Return After Taxes on Distributions” reflects the impact of federal income taxes due on Fund distributions of dividends and capital gains. It is most relevant to taxpaying shareholders who continue to hold their shares. “Return After Taxes on Distributions and Sale of Fund Shares” also reflects the impact of taxes on capital gain or loss realized upon a sale of shares. It is most relevant to taxpaying shareholders who sell their shares.
Average Annual Total Returns
(For the periods ended October 31, 2005)
Returns at Net Asset Value (NAV) (Class A)
| | One Year | | 5 Years | | Life of Fund | |
| | | | | | | |
Return Before Taxes | | 7.85 | % | -0.88 | % | 1.54 | % |
Return After Taxes on Distributions | | 7.85 | | -0.88 | | 1.54 | |
Return After Taxes on Distributions and Sale of Fund Shares | | 5.10 | | -0.75 | | 1.31 | |
Returns at Public Offering Price (POP) (Class A)
| | One Year | | 5 Years | | Life of Fund | |
Return Before Taxes | | 1.69 | % | -2.04 | % | 0.42 | % |
Return After Taxes on Distributions | | 1.69 | | -2.04 | | 0.42 | |
Return After Taxes on Distributions and Sale of Fund Shares | | 1.10 | | -1.73 | | 0.36 | |
Average Annual Total Returns
(For the periods ended October 31, 2005)
Returns at Net Asset Value (NAV) (Class C)
| | One Year | | 5 Years | | Life of Fund | |
Return Before Taxes | | 6.91 | % | -1.63 | % | 0.69 | % |
Return After Taxes on Distributions | | 6.91 | | -1.63 | | 0.69 | |
Return After Taxes on Distributions and Sale of Fund Shares | | 4.49 | | -1.38 | | 0.58 | |
Returns at Public Offering Price (POP) (Class C)
| | One Year | | 5 Years | | Life of Fund | |
Return Before Taxes | | 5.91 | % | -1.63 | % | 0.69 | % |
Return After Taxes on Distributions | | 5.91 | | -1.63 | | 0.69 | |
Return After Taxes on Distributions and Sale of Fund Shares | | 3.84 | | -1.38 | | 0.58 | |
Average Annual Total Returns
(For the periods ended October 31, 2005)
Returns at Net Asset Value (NAV) (Class B)
| | One Year | | 5 Years | | Life of Fund | |
Return Before Taxes | | 6.92 | % | -1.67 | % | 0.65 | % |
Return After Taxes on Distributions | | 6.92 | | -1.67 | | 0.65 | |
Return After Taxes on Distributions and Sale of Fund Shares | | 4.50 | | -1.41 | | 0.55 | |
Returns at Public Offering Price (POP) (Class B)
| | One Year | | 5 Years | | Life of Fund | |
Return Before Taxes | | 1.92 | % | -2.07 | % | 0.47 | % |
Return After Taxes on Distributions | | 1.92 | | -2.07 | | 0.47 | |
Return After Taxes on Distributions and Sale of Fund Shares | | 1.25 | | -1.75 | | 0.40 | |
Class A of the Fund commenced investment operations on 6/30/00. Class B and Class C of the Fund commenced investment operations on 7/10/00. Returns at Public Offering Price (POP) reflect the deduction of the maximum initial sales charge and applicable CDSC, while Returns at Net Asset Value (NAV) do not.
After-tax returns are calculated using the highest historical individual federal income tax rate and do not reflect the impact of state and local taxes. Actual after-tax returns depend on a shareholder’s tax situation and may differ from those shown. After-tax returns are not relevant for shareholders who hold shares in tax-deferred accounts or to shares held by non-taxable entities. Return After Taxes on Distributions for a period may be the same as Return Before Taxes for that period because no distributions were paid during that period, or because the taxable portion of distributions made during the period was insignificant. Also, Return After Taxes on Distributions and Sale of Fund Shares for a period may be greater than Return After Taxes on Distributions for the same period because of realized losses on the sale of Fund shares.
Past performance is no guarantee of future results. Returns are historical and are calculated by determining the percentage change in net asset value or offering price (as applicable) with all distributions reinvested. Investment return and principal value will fluctuate so that shares, when redeemed, may be worth more or less than their original cost. Performance is for the stated time period only; due to market volatility, the Fund’s current performance may be lower or higher than the quoted return. For performance as of the most recent month-end, please refer to www.eatonvance.com.
4
Eaton Vance Tax-Managed Multi-Cap Opportunity Fund as of October 31, 2005
FUND EXPENSES
Example: As a shareholder of the Fund, you incur two types of costs: (1) transaction costs, including sales charges (loads) on purchases and redemption fees (if applicable); and (2) ongoing costs, including management fees; distribution or service fees; and other Fund expenses. This Example is intended to help you understand your ongoing costs (in dollars) of investing in the Fund and to compare these costs with the ongoing costs of investing in other mutual funds. The Example is based on an investment of $1,000 invested at the beginning of the period and held for the entire period (May 1, 2005 - October 31, 2005).
Actual Expenses: The first section of the table below provides information about actual account values and actual expenses. You may use the information in this line, together with the amount you invested, to estimate the expenses that you paid over the period. Simply divide your account value by $1,000 (for example, an $8,600 account value divided by $1,000 = 8.6), then multiply the result by the number in the first section under the heading entitled “Expenses Paid During Period” to estimate the expenses you paid on your account during this period.
Hypothetical Example for Comparison Purposes: The second section of the table below provides information about hypothetical account values and hypothetical expenses based on the actual Fund expense ratio and an assumed rate of return of 5% per year (before expenses), which is not the actual return of the Fund. The hypothetical account values and expenses may not be used to estimate the actual ending account balance or expenses you paid for the period. You may use this information to compare the ongoing costs of investing in your Fund and other funds. To do so, compare this 5% hypothetical example with the 5% hypothetical examples that appear in the shareholder reports of the other funds.
Please note that the expenses shown in the table are meant to highlight your ongoing costs only and do not reflect any transactional costs, such as sales charges (loads) or redemption fees (if applicable). Therefore, the second section of the table is useful in comparing ongoing costs only, and will not help you determine the relative total costs of owning different funds. In addition, if these transactional costs were included, your costs would have been higher.
Eaton Vance Tax-Managed Multi-Cap Opportunity Fund
| | Beginning Account Value | | Ending Account Value | | Expenses Paid During Period | |
| | (5/1/05) | | (10/31/05) | | (5/1/05 - 10/31/05) | |
| | | | | | | |
Actual | | | | | | | |
Class A | | $ | 1,000.00 | | $ | 1,127.90 | | $ | 8.58 | |
Class B | | $ | 1,000.00 | | $ | 1,122.60 | | $ | 12.57 | |
Class C | | $ | 1,000.00 | | $ | 1,123.50 | | $ | 12.58 | |
| | | | | | | |
Hypothetical | | | | | | | |
(5% return before expenses) | | | | | | | |
Class A | | $ | 1,000.00 | | $ | 1,017.10 | | $ | 8.13 | |
Class B | | $ | 1,000.00 | | $ | 1,013.40 | | $ | 11.93 | |
Class C | | $ | 1,000.00 | | $ | 1,013.40 | | $ | 11.93 | |
* Expenses are equal to the Fund’s annualized expense ratio of 1.60% for Class A shares, 2.35% for Class B shares, and 2.35% for Class C shares, multiplied by the average account value over the period, multiplied by 184/365 (to reflect the one-half year period). The example assumes that the $1,000 was invested at the net asset value per share determined at the close of business on April 30, 2005. The Example reflects the expenses of both the Fund and the Portfolio.
5
Eaton Vance Tax-Managed Multi-Cap Opportunity Fund as of October 31, 2005
FINANCIAL STATEMENTS
Statement of Assets and Liabilities
As of October 31, 2005
| Assets | |
Investment in Tax-Managed Multi-Cap Opportunity Portfolio, at value
(identified cost, $50,461,527) | | $ | 57,927,626 | | |
| Receivable for Fund shares sold | | | 9,233 | | |
| Total assets | | $ | 57,936,859 | | |
| Liabilities | |
| Payable for Fund shares redeemed | | $ | 136,749 | | |
| Payable to affiliate for distribution and service fees | | | 35,166 | | |
| Payable to affiliate for Administration fees | | | 7,387 | | |
| Payable to affiliate for Trustees' fees | | | 155 | | |
| Accrued expenses | | | 48,106 | | |
| Total liabilities | | $ | 227,563 | | |
| Net Assets | | $ | 57,709,296 | | |
| Sources of Net Assets | |
| Paid-in capital | | $ | 49,981,717 | | |
Undistributed net realized gain from Portfolio (computed on the basis
of identified cost) | | | 261,480 | | |
Net unrealized appreciation from Portfolio (computed on the basis of
identified cost) | | | 7,466,099 | | |
| Total | | $ | 57,709,296 | | |
| Class A Shares | |
| Net Assets | | $ | 21,997,910 | | |
| Shares Outstanding | | | 2,028,146 | | |
Net Asset Value and Redemption Price Per Share
(net assets ÷ shares of beneficial interest outstanding) | | $ | 10.85 | | |
Maximum Offering Price Per Share
(100 ÷ 94.25 of $10.85) | | $ | 11.51 | | |
| Class B Shares | |
| Net Assets | | $ | 18,653,344 | | |
| Shares Outstanding | | | 1,801,534 | | |
Net Asset Value, Offering Price and Redemption Price Per Share
(net assets ÷ shares of beneficial interest outstanding) | | $ | 10.35 | | |
| Class C Shares | |
| Net Assets | | $ | 17,058,042 | | |
| Shares Outstanding | | | 1,644,672 | | |
Net Asset Value, Offering Price and Redemption Price Per Share
(net assets ÷ shares of beneficial interest outstanding) | | $ | 10.37 | | |
| On sales of $50,000 or more, the offering price of Class A shares is reduced. | |
Statement of Operations
For the Year Ended
October 31, 2005
| Investment Income | |
| Dividends allocated from Portfolio (net of foreign taxes, $1,051) | | $ | 450,986 | | |
| Interest allocated from Portfolio | | | 104,175 | | |
| Expenses allocated from Portfolio | | | (482,089 | ) | |
| Net investment income from Portfolio | | $ | 73,072 | | |
| Expenses | |
| Administration fee | | $ | 94,194 | | |
| Trustees' fees and expenses | | | 1,632 | | |
Distribution and service fees
Class A | | | 59,118 | | |
| Class B | | | 205,001 | | |
| Class C | | | 186,488 | | |
| Transfer and dividend disbursing agent fees | | | 114,145 | | |
| Registration fees | | | 56,801 | | |
| Printing and postage | | | 22,032 | | |
| Legal and accounting services | | | 20,899 | | |
| Custodian fee | | | 18,221 | | |
| Miscellaneous | | | 6,393 | | |
| Total expenses | | $ | 784,924 | | |
| Net investment loss | | $ | (711,852 | ) | |
Realized and Unrealized
Gain (Loss) from Portfolio | |
Net realized gain (loss) —
Investment transactions (identified cost basis) | | $ | 7,215,331 | | |
| Foreign currency transactions | | | (7,882 | ) | |
| Net realized gain | | $ | 7,207,449 | | |
Change in unrealized appreciation (depreciation) —
Investments (identified cost basis) | | $ | (2,035,201 | ) | |
| Securities sold short | | | (2,703 | ) | |
| Net change in unrealized appreciation (depreciation) | | $ | (2,037,904 | ) | |
| Net realized and unrealized gain | | $ | 5,169,545 | | |
| Net increase in net assets from operations | | $ | 4,457,693 | | |
See notes to financial statements
6
Eaton Vance Tax-Managed Multi-Cap Opportunity Fund as of October 31, 2005
FINANCIAL STATEMENTS CONT'D
Statements of Changes in Net Assets
Increase (Decrease)
in Net Assets | | Year Ended
October 31, 2005 | | Year Ended
October 31, 2004 | |
From operations —
Net investment loss | | $ | (711,852 | ) | | $ | (855,554 | ) | |
Net realized gain from investment
transactions, securities sold short,
and foreign currency transactions | | | 7,207,449 | | | | 2,661,761 | | |
Net change in unrealized appreciation
(depreciation) from investments,
and securities sold short | | | (2,037,904 | ) | | | 181,532 | | |
| Net increase in net assets from operations | | $ | 4,457,693 | | | $ | 1,987,739 | | |
Transactions in shares of beneficial interest —
Proceeds from sale of shares
Class A | | $ | 3,522,643 | | | $ | 12,212,157 | | |
| Class B | | | 1,272,535 | | | | 9,372,568 | | |
| Class C | | | 1,718,654 | | | | 5,772,811 | | |
Cost of shares redeemed
Class A | | | (7,004,334 | ) | | | (9,746,606 | ) | |
| Class B | | | (4,757,175 | ) | | | (9,698,744 | ) | |
| Class C | | | (4,263,188 | ) | | | (3,791,111 | ) | |
Net asset value of shares exchanged
Class A | | | 209,697 | | | | 239,982 | | |
| Class B | | | (209,697 | ) | | | (239,982 | ) | |
Net increase (decrease) in net assets from
Fund share transactions | | $ | (9,510,865 | ) | | $ | 4,121,075 | | |
| Net increase (decrease) in net assets | | $ | (5,053,172 | ) | | $ | 6,108,814 | | |
| Net Assets | |
| At beginning of year | | $ | 62,762,468 | | | $ | 56,653,654 | | |
| At end of year | | $ | 57,709,296 | | | $ | 62,762,468 | | |
See notes to financial statements
7
Eaton Vance Tax-Managed Multi-Cap Opportunity Fund as of October 31, 2005
FINANCIAL STATEMENTS CONT'D
Financial Highlights
| | | Class A | |
| | | Year Ended October 31, | |
| | | 2005(1) | | 2004(1) | | 2003(1) | | 2002(1) | | 2001(1) | |
| Net asset value — Beginning of year | | $ | 10.060 | | | $ | 9.690 | | | $ | 7.250 | | | $ | 8.380 | | | $ | 11.340 | | |
| Income (loss) from operations | |
| Net investment loss | | $ | (0.072 | ) | | $ | (0.083 | ) | | $ | (0.116 | ) | | $ | (0.114 | ) | | $ | (0.065 | ) | |
| Net realized and unrealized gain (loss) | | | 0.862 | | | | 0.453 | | | | 2.556 | | | | (1.016 | ) | | | (2.895 | ) | |
| Total income (loss) from operations | | $ | 0.790 | | | $ | 0.370 | | | $ | 2.440 | | | $ | (1.130 | ) | | $ | (2.960 | ) | |
| Net asset value — End of year | | $ | 10.850 | | | $ | 10.060 | | | $ | 9.690 | | | $ | 7.250 | | | $ | 8.380 | | |
| Total Return(2) | | | 7.85 | % | | | 3.82 | % | | | 33.66 | % | | | (13.48 | )% | | | (26.10 | )% | |
| Ratios/Supplemental Data† | |
| Net assets, end of year (000's omitted) | | $ | 21,998 | | | $ | 23,462 | | | $ | 19,884 | | | $ | 14,289 | | | $ | 10,637 | | |
| Ratios (As a percentage of average daily net assets): | |
| Net expenses(3) | | | 1.55 | % | | | 1.52 | % | | | 1.66 | % | | | 1.60 | % | | | 1.40 | % | |
| Net expenses after custodian fee reduction(3) | | | 1.55 | % | | | 1.52 | % | | | 1.66 | % | | | 1.60 | % | | | 1.40 | % | |
| Net investment loss | | | (0.67 | )% | | | (0.84 | )% | | | (1.42 | )% | | | (1.35 | )% | | | (0.69 | )% | |
| Portfolio Turnover | | | 217 | % | | | 239 | % | | | 224 | % | | | 225 | % | | | 324 | % | |
† The operating expenses of the Portfolio may reflect a reduction of the investment adviser fee. The operating expenses of the Fund may reflect an allocation of expenses to the Administrator. Had such actions not been taken, the ratios and net investment loss per share would have been as follows:
| Ratios (As a percentage of average daily net assets): | |
| Expenses(3) | | | 1.55 | % | | | 1.53 | % | | | 1.66 | % | | | 1.67 | % | | | 2.40 | % | |
| Expenses after custodian fee reduction(3) | | | 1.55 | % | | | 1.53 | % | | | 1.66 | % | | | 1.67 | % | | | 2.40 | % | |
| Net investment loss | | | (0.67 | )% | | | (0.85 | )% | | | (1.42 | )% | | | (1.42 | )% | | | (1.69 | )% | |
| Net investment loss per share | | $ | (0.072 | ) | | $ | (0.086 | ) | | $ | (0.116 | ) | | $ | (0.120 | ) | | $ | (0.159 | ) | |
(1) Net investment loss per share was computed using average shares outstanding.
(2) Returns are historical and are calculated by determining the percentage change in net asset value with all distributions reinvested. Total return is not computed on an annualized basis.
(3) Includes the Fund's share of the Portfolio's allocated expenses.
See notes to financial statements
8
Eaton Vance Tax-Managed Multi-Cap Opportunity Fund as of October 31, 2005
FINANCIAL STATEMENTS CONT'D
Financial Highlights
| | | Class B | |
| | | Year Ended October 31, | |
| | | 2005(1) | | 2004(1) | | 2003(1) | | 2002(1) | | 2001(1) | |
| Net asset value — Beginning of year | | $ | 9.680 | | | $ | 9.390 | | | $ | 7.080 | | | $ | 8.260 | | | $ | 11.260 | | |
| Income (loss) from operations | |
| Net investment loss | | $ | (0.146 | ) | | $ | (0.153 | ) | | $ | (0.173 | ) | | $ | (0.175 | ) | | $ | (0.131 | ) | |
| Net realized and unrealized gain (loss) | | | 0.816 | | | | 0.443 | | | | 2.483 | | | | (1.005 | ) | | | (2.869 | ) | |
| Total income (loss) from operations | | $ | 0.670 | | | $ | 0.290 | | | $ | 2.310 | | | $ | (1.180 | ) | | $ | (3.000 | ) | |
| Net asset value — End of year | | $ | 10.350 | | | $ | 9.680 | | | $ | 9.390 | | | $ | 7.080 | | | $ | 8.260 | | |
| Total Return(2) | | | 6.92 | % | | | 3.09 | % | | | 32.63 | % | | | (14.29 | )% | | | (26.64 | )% | |
| Ratios/Supplemental Data† | |
| Net assets, end of year (000's omitted) | | $ | 18,653 | | | $ | 20,928 | | | $ | 20,868 | | | $ | 11,939 | | | $ | 8,931 | | |
| Ratios (As a percentage of average daily net assets): | |
| Net expenses(3) | | | 2.30 | % | | | 2.27 | % | | | 2.41 | % | | | 2.35 | % | | | 2.15 | % | |
| Net expenses after custodian fee reduction(3) | | | 2.30 | % | | | 2.27 | % | | | 2.41 | % | | | 2.35 | % | | | 2.15 | % | |
| Net investment loss | | | (1.42 | )% | | | (1.60 | )% | | | (2.16 | )% | | | (2.10 | )% | | | (1.43 | )% | |
| Portfolio Turnover | | | 217 | % | | | 239 | % | | | 224 | % | | | 225 | % | | | 324 | % | |
† The operating expenses of the Portfolio may reflect a reduction of the investment adviser fee. The operating expenses of the Fund may reflect an allocation of expenses to the Administrator. Had such actions not been taken, the ratios and net investment loss per share would have been as follows:
| Ratios (As a percentage of average daily net assets): | |
| Expenses(3) | | | 2.30 | % | | | 2.28 | % | | | 2.41 | % | | | 2.42 | % | | | 3.15 | % | |
| Expenses after custodian fee reduction(3) | | | 2.30 | % | | | 2.28 | % | | | 2.41 | % | | | 2.42 | % | | | 3.15 | % | |
| Net investment loss | | | (1.42 | )% | | | (1.61 | )% | | | (2.16 | )% | | | (2.17 | )% | | | (2.43 | )% | |
| Net investment loss per share | | $ | (0.146 | ) | | $ | (0.154 | ) | | $ | (0.173 | ) | | $ | (0.181 | ) | | $ | (0.223 | ) | |
(1) Net investment loss per share was computed using average shares outstanding.
(2) Returns are historical and are calculated by determining the percentage change in net asset value with all distributions reinvested. Total return is not computed on an annualized basis.
(3) Includes the Fund's share of the Portfolio's allocated expenses.
See notes to financial statements
9
Eaton Vance Tax-Managed Multi-Cap Opportunity Fund as of October 31, 2005
FINANCIAL STATEMENTS CONT'D
Financial Highlights
| | | Class C | |
| | | Year Ended October 31, | |
| | | 2005(1) | | 2004(1) | | 2003(1) | | 2002(1) | | 2001(1) | |
| Net asset value — Beginning of year | | $ | 9.700 | | | $ | 9.410 | | | $ | 7.090 | | | $ | 8.270 | | | $ | 11.260 | | |
| Income (loss) from operations | |
| Net investment loss | | $ | (0.146 | ) | | $ | (0.151 | ) | | $ | (0.172 | ) | | $ | (0.175 | ) | | $ | (0.133 | ) | |
| Net realized and unrealized gain (loss) | | | 0.816 | | | | 0.441 | | | | 2.492 | | | | (1.005 | ) | | | (2.857 | ) | |
| Total income (loss) from operations | | $ | 0.670 | | | $ | 0.290 | | | $ | 2.320 | | | $ | (1.180 | ) | | $ | (2.990 | ) | |
| Net asset value — End of year | | $ | 10.370 | | | $ | 9.700 | | | $ | 9.410 | | | $ | 7.090 | | | $ | 8.270 | | |
| Total Return(2) | | | 6.91 | % | | | 3.08 | % | | | 32.72 | % | | | (14.27 | )% | | | (26.55 | )% | |
| Ratios/Supplemental Data† | |
| Net assets, end of year (000's omitted) | | $ | 17,058 | | | $ | 18,373 | | | $ | 15,902 | | | $ | 11,432 | | | $ | 8,670 | | |
| Ratios (As a percentage of average daily net assets): | |
| Net expenses(3) | | | 2.30 | % | | | 2.27 | % | | | 2.41 | % | | | 2.35 | % | | | 2.15 | % | |
| Net expenses after custodian fee reduction(3) | | | 2.30 | % | | | 2.27 | % | | | 2.41 | % | | | 2.35 | % | | | 2.15 | % | |
| Net investment loss | | | (1.42 | )% | | | (1.57 | )% | | | (2.16 | )% | | | (2.10 | )% | | | (1.46 | )% | |
| Portfolio Turnover | | | 217 | % | | | 239 | % | | | 224 | % | | | 225 | % | | | 324 | % | |
† The operating expenses of the Portfolio may reflect a reduction of the investment adviser fee. The operating expenses of the Fund may reflect an allocation of expenses to the Administrator. Had such actions not been taken, the ratios and net investment loss per share would have been as follows:
| Ratios (As a percentage of average daily net assets): | |
| Expenses(3) | | | 2.30 | % | | | 2.28 | % | | | 2.41 | % | | | 2.42 | % | | | 3.15 | % | |
| Expenses after custodian fee reduction(3) | | | 2.30 | % | | | 2.28 | % | | | 2.41 | % | | | 2.42 | % | | | 3.15 | % | |
| Net investment loss | | | (1.42 | )% | | | (1.58 | )% | | | (2.16 | )% | | | (2.17 | )% | | | (2.46 | )% | |
| Net investment loss per share | | $ | (0.146 | ) | | $ | (0.152 | ) | | $ | (0.172 | ) | | $ | (0.181 | ) | | $ | (0.224 | ) | |
(1) Net investment loss per share was computed using average shares outstanding.
(2) Returns are historical and are calculated by determining the percentage change in net asset value with all distributions reinvested. Total return is not computed on an annualized basis.
(3) Includes the Fund's share of the Portfolio's allocated expenses.
See notes to financial statements
10
Eaton Vance Tax-Managed Multi-Cap Opportunity Fund as of October 31, 2005
NOTES TO FINANCIAL STATEMENTS
1 Significant Accounting Policies
Eaton Vance Tax-Managed Multi-Cap Opportunity Fund (the Fund) is a diversified series of Eaton Vance Mutual Funds Trust (the Trust). The Trust is an entity of the type commonly known as a Massachusetts business trust and is registered under the Investment Company Act of 1940, as amended, as an open-end management investment company. The Fund currently offers three classes of shares. Class A shares are generally sold subject to a sales charge imposed at time of purchase. Class B and Class C shares are sold at net asset value and are subject to a contingent deferred sales charge (see Note 6). Class B shares held for eight years will automatically convert to Class A shares. Each class represents a pro rata interest in the Fund, but votes separately on class-specific matters and (as noted below) is subject to different expenses. Realized and unrealized gains and losses and net investment income, other than class-specific expenses, a re allocated daily to each class of shares based on the relative net assets of each class to the total net assets of the Fund. Each class of shares differs in its distribution plan and certain other class-specific expenses. The Fund invests all of its investable assets in interests in the Tax-Managed Multi-Cap Opportunity Portfolio (the Portfolio), a New York Trust, having the same investment objective as the Fund. The value of the Fund's investment in the Portfolio reflects the Fund's proportionate interest in the net assets of the Portfolio (42.7%) at October 31, 2005. The performance of the Fund is directly affected by the performance of the Portfolio. The financial statements of the Portfolio, including the portfolio of investments, are included elsewhere in this report and should be read in conjunction with the Fund's financial statements.
The following is a summary of significant accounting policies consistently followed by the Fund in the preparation of its financial statements. The policies are in conformity with accounting principles generally accepted in the United States of America.
A Investment Valuation — Valuation of securities by the Portfolio is discussed in Note 1A of the Portfolio's Notes to Financial Statements which are included elsewhere in this report.
B Income — The Fund's net investment income consists of the Fund's pro rata share of the net investment income of the Portfolio, less all actual and accrued expenses of the Fund determined in accordance with accounting principles generally accepted in the United States of America.
C Federal Taxes — The Fund's policy is to comply with the provisions of the Internal Revenue Code applicable to regulated investment companies and to distribute to shareholders each year all of its taxable income, including any net realized gain on investments. Accordingly, no provision for federal income or excise tax is necessary.
D Expense Reduction — Investors Bank & Trust Company (IBT) serves as custodian to the Fund and the Portfolio. Pursuant to the respective custodian agreements, IBT receives a fee reduced by credits which are determined based on the average daily cash balances the Fund or the Portfolio maintains with IBT. All credit balances used to reduce the Fund's custodian fees are reported as a reduction of total expenses in the Statement of Operations.
E Indemnifications — Under the Trust's organizational documents, its officers and Trustees may be indemnified against certain liabilities and expenses arising out of the performance of their duties to the Fund, and shareholders are indemnified against personal liability for obligations of the Trust. Additionally, in the normal course of business, the Fund enters into agreements with service providers that may contain indemnification clauses. The Fund's maximum exposure under these arrangements is unknown as this would involve future claims that may be made against the Fund that have not yet occurred.
F Other — Dividends to shareholders are recorded on the ex-dividend date.
G Use of Estimates — The preparation of the financial statements in conformity with accounting principles generally accepted in the United States of America requires management to make estimates and assumptions that affect the reported amounts of assets and liabilities at the date of the financial statements and the reported amounts of income and expense during the reporting period. Actual results could differ from those estimates.
H Expenses — The majority of expenses of the Trust are directly identifiable to an individual fund. Expenses which are not readily identifiable to a specific fund are allocated taking into consideration, among other things, the nature and type of expense and the relative size of the fund.
2 Distributions to Shareholders
It is the present policy of the Fund to make at least one distribution annually (normally in December ) of all or substantially all of its net investment income and at least one distribution of all or substantially all of its net realized
11
Eaton Vance Tax-Managed Multi-Cap Opportunity Fund as of October 31, 2005
NOTES TO FINANCIAL STATEMENTS CONT'D
capital gains (reduced by available capital loss carryforwards from prior years, if any). Distributions are declared separately for each class of shares. Shareholders may reinvest income and capital gain distributions in additional shares of the same class of the Fund at the net asset value as of the ex-dividend date. Distributions are paid in the form of additional shares of the same class of the Fund or, at the election of the shareholder, in cash. The Fund distinguishes between distributions on a tax basis and a financial reporting basis. Accounting principles generally accepted in the United States of America require that only distributions in excess of tax basis earnings and profits be reported in the financial statements as a return of capital. Permanent differences between book and tax accounting relating to distributions are reclassified to paid-in capital.
During the year ended October 31, 2005, accumulated paid-in capital was decreased by $719,441, net investment loss was decreased by $711,852, and undistributed net realized gain was increased by $7,589 primarily due to differences between book and tax accounting for net operating losses. This change had no effect on the net assets or the net asset value per share.
As of October 31, 2005, the components of distributable earnings on a tax basis were as follows:
| Undistributed net realized gain | | $ | 1,208,013 | | |
| Unrealized gain | | $ | 6,519,566 | | |
3 Shares of Beneficial Interest
The Fund's Declaration of Trust permits the Trustees to issue an unlimited number of full and fractional shares of beneficial interest (without par value). Such shares may be issued in a number of different series (such as the Fund) and classes. Transactions in Fund shares were as follows:
| | | Year Ended October 31, | |
| Class A | | 2005 | | 2004 | |
| Sales | | | 327,726 | | | | 1,237,539 | | |
| Redemptions | | | (650,284 | ) | | | (982,291 | ) | |
| Exchange from Class B shares | | | 19,670 | | | | 24,431 | | |
| Net increase (decrease) | | | (302,888 | ) | | | 279,679 | | |
| | | Year Ended October 31, | |
| Class B | | 2005 | | 2004 | |
| Sales | | | 122,117 | | | | 968,737 | | |
| Redemptions | | | (461,850 | ) | | | (1,003,357 | ) | |
| Exchange to Class A shares | | | (20,534 | ) | | | (25,073 | ) | |
| Net decrease | | | (360,267 | ) | | | (59,693 | ) | |
| | | Year Ended October 31, | |
| Class C | | 2005 | | 2004 | |
| Sales | | | 165,013 | | | | 602,389 | | |
| Redemptions | | | (415,103 | ) | | | (397,404 | ) | |
| Net increase (decrease) | | | (250,090 | ) | | | 204,985 | | |
4 Transactions with Affiliates
The administration fee is earned by Eaton Vance Management (EVM) (the Administrator) as compensation for managing and administering the business affairs of the Fund. Under the administration agreement, EVM earns a fee in the amount of 0.15% per annum of average daily net assets of the Fund. For the year ended October 31, 2005, the administration fee amounted to $94,194. The Portfolio has engaged Boston Management and Research (BMR), a subsidiary of EVM, to render investment advisory services. See Note 2 of the Portfolio's Notes to Financial Statements which are included elsewhere in this report. Except as to Trustees of the Fund and the Portfolio who are not members of EVM's or BMR's organization, officers and Trustees receive remuneration for their services to the Fund out of the investment adviser fee earned by BMR. EVM serves as the sub-transfer agent of the Fund and receives from the transfer agent an aggregate fee based upo n the actual expenses incurred by EVM in the performance of those services. During the year ended October 31, 2005, EVM earned $9,782 in sub-transfer agent fees. The Fund was informed that Eaton Vance Distributors, Inc. (EVD), a subsidiary of EVM and the Fund's principal underwriter, received $139,496 as its portion of the sales charge on sales of Class A shares for the year ended October 31, 2005. Certain officers and Trustees of the Fund and Portfolio are officers of the above organizations.
5 Distribution and Service Plans
The Fund has in effect distribution plans for Class B shares (Class B Plan) and Class C shares (Class C Plan) pursuant to Rule 12b-1 under the Investment Company Act of 1940 and a service plan for Class A shares (Class A Plan) (collectively, the Plans). The Class B and Class C Plans require the Fund
12
Eaton Vance Tax-Managed Multi-Cap Opportunity Fund as of October 31, 2005
NOTES TO FINANCIAL STATEMENTS CONT'D
to pay EVD amounts equal to 1/365 of 0.75% of the Fund's average daily net assets attributable to Class B and Class C shares for providing ongoing distribution services and facilities to the Fund. The Fund will automatically discontinue payments to EVD during any period in which there are no outstanding Uncovered Distribution Charges, which are equivalent to the sum of (i) 6.25% of the aggregate amount received by the Fund for the Class B and Class C shares sold, respectively, plus (ii) interest calculated by applying the rate of 1% over the prevailing prime rate to the outstanding balance of Uncovered Distribution Charges of EVD of each respective class, reduced by the aggregate amount of contingent deferred sales charges (see Note 6) and daily amounts theretofore paid to EVD by each respective class. The Fund paid or accrued $153,751 and $139,866 for Class B and Class C shares, respectively, to or payable to EVD for the year e nded October 31, 2005, representing 0.75% of the average daily net assets for Class B and Class C shares, respectively. At October 31, 2005, the amount of Uncovered Distribution Charges of EVD calculated under the Plans was approximately $736,000 and $927,000 for Class B and Class C shares, respectively.
The Plans authorize the Fund to make payments of service fees to EVD, investment dealers and other persons in amounts not exceeding 0.25% of the Fund's average daily net assets attributable to Class A, Class B and Class C shares for each fiscal year. Service fee payments will be made for personal services and/or the maintenance of shareholder accounts. Service fees are separate and distinct from the sales commissions and distribution fees payable by the Fund to EVD and as such are not subject to automatic discontinuance when there are no outstanding Uncovered Distribution Charges of EVD. Service fee payments for the year ended October 31, 2005 amounted to $59,118, $51,250, and $46,622 for Class A, Class B and Class C, respectively.
6 Contingent Deferred Sales Charge
A contingent deferred sales charge (CDSC) generally is imposed on redemptions of Class B shares made within six years of purchase and on redemptions of Class C shares made within one year of purchase. Class A shares may be subject to a 1% CDSC if redeemed within one year of purchase (depending on the circumstances of purchase). Generally, the CDSC is based upon the lower of the net asset value at date of redemption or date of purchase. No charge is levied on shares acquired by reinvestment of dividends or capital gain distributions. The Class B CDSC is imposed at declining rates that begin at 5% in the first and second year of redemption after purchase, declining one percentage point in each subsequent year. Class C shares will be subject to a 1% CDSC if redeemed within one year of purchase. No CDSC is levied on shares which have been sold to EVM or its affiliates or to their respective employees or clients and may be waived und er certain other limited conditions. CDSC charges received on Class B and Class C redemptions are paid to EVD to reduce the amount of Uncovered Distribution Charges calculated under the Class B and Class C Plans, respectively (see Note 5). CDSC charges received on Class B and Class C redemptions when no Uncovered Distribution Charges exist for the respective classes will be credited to the Fund. EVD received approximately $0, $57,000 and $1,000 of CDSC paid by shareholders for Class A, Class B and Class C shares, respectively, for the year ended October 31, 2005.
7 Investment Transactions
Increases and decreases in the Fund's investment in the Portfolio for the year ended October 31, 2005, aggregated $34,178,509 and $17,005,507, respectively.
13
Eaton Vance Tax-Managed Multi-Cap Opportunity Fund as of October 31, 2005
REPORT OF INDEPENDENT REGISTERED PUBLIC ACCOUNTING FIRM
To the Trustees of Eaton Vance Mutual Funds Trust and Shareholders of the Eaton Vance Tax-Managed
Multi-Cap Opportunity Fund:
We have audited the accompanying statement of assets and liabilities of Eaton Vance Tax-Managed Multi-Cap Opportunity Fund (the Fund) (one of the series of Eaton Vance Mutual Funds Trust) as of October 31, 2005, the related statement of operations for the year then ended, the statements of changes in net assets for the two years in the period then ended, and the financial highlights for each of the five years in the period ended October 31, 2005. These financial statements and financial highlights are the responsibility of the Fund's management. Our responsibility is to express an opinion on these financial statements and financial highlights based on our audits.
We conducted our audits in accordance with the standards of the Public Company Accounting Oversight Board (United States). Those standards require that we plan and perform the audit to obtain reasonable assurance about whether the financial statements and financial highlights are free of material misstatement. The Trust is not required to have, nor were we engaged to perform, an audit of its internal control over financial reporting. An audit includes consideration of internal control over financial reporting as a basis for designing audit procedures that are appropriate in the circumstances, but not for the purpose of expressing an opinion on the effectiveness of the Fund's internal control over financial reporting. Accordingly, we express no such opinion. An audit also includes examining, on a test basis, evidence supporting the amounts and disclosures in the financial statements, assessing the accounting principles used and s ignificant estimates made by management, as well as evaluating the overall financial statement presentation. We believe that our audits provide a reasonable basis for our opinion.
In our opinion, such financial statements and financial highlights referred to above present fairly, in all material respects, the financial position of Eaton Vance Tax-Managed Multi-Cap Opportunity Fund at October 31, 2005, the results of its operations for the year ended, the changes in its net assets for each of the two years in the period then ended, and its financial highlights for each of the five years in the period then ended, in conformity with accounting principles generally accepted in the United States of America.
DELOITTE & TOUCHE LLP
Boston, Massachusetts
December 19, 2005
14
Tax-Managed Multi-Cap Opportunity Portfolio as of October 31, 2005
PORTFOLIO OF INVESTMENTS
| Common Stocks — 92.3% | |
| Security | | Shares | | Value | |
| Aerospace-Equipment — 1.4% | |
| Precision Castparts Corp. | | | 40,000 | | | $ | 1,894,400 | | |
| | | $ | 1,894,400 | | |
| Beverages — 1.5% | |
| Cott Corp.(1) | | | 46,000 | | | $ | 681,260 | | |
| Nestle SA ADR | | | 18,000 | | | | 1,338,394 | | |
| | | $ | 2,019,654 | | |
| Biotechnology — 1.1% | |
| Amgen, Inc.(1) | | | 16,000 | | | $ | 1,212,160 | | |
| Arena Pharmaceuticals, Inc.(1) | | | 34,000 | | | | 353,600 | | |
| | | $ | 1,565,760 | | |
| Broadcasting and Cable — 1.1% | |
| Central European Media Enterprises Ltd.(1) | | | 33,000 | | | $ | 1,534,170 | | |
| | | $ | 1,534,170 | | |
| Building and Construction — 2.4% | |
| Caterpillar, Inc. | | | 6,402 | | | $ | 336,681 | | |
| Foster Wheeler Ltd.(1) | | | 13,000 | | | | 367,640 | | |
| Martin Marietta Materials, Inc. | | | 33,000 | | | | 2,604,030 | | |
| | | $ | 3,308,351 | | |
| Business Services — 2.2% | |
| Gartner, Inc.(1) | | | 110,000 | | | $ | 1,324,400 | | |
| Greenfield Online, Inc.(1) | | | 44,806 | | | | 224,926 | | |
| MoneyGram International, Inc. | | | 61,000 | | | | 1,482,300 | | |
| | | $ | 3,031,626 | | |
| Chemicals — 1.0% | |
| Ecolab, Inc. | | | 40,000 | | | $ | 1,323,200 | | |
| Potash Corporation of Saskatchewan, Inc. | | | 500 | | | | 41,160 | | |
| | | $ | 1,364,360 | | |
| Computer Services — 0.6% | |
| Kanbay International, Inc.(1) | | | 44,000 | | | $ | 641,520 | | |
| Syntel, Inc. | | | 8,400 | | | | 170,436 | | |
| | | $ | 811,956 | | |
| Security | | Shares | | Value | |
| Computer Software — 2.7% | |
| Compuware Corp.(1) | | | 169,000 | | | $ | 1,367,210 | | |
| Magma Design Automation, Inc.(1) | | | 100,000 | | | | 868,000 | | |
| Satyam Computer Services Ltd. ADR | | | 42,000 | | | | 1,435,560 | | |
| | | $ | 3,670,770 | | |
| Computers-Integrated Systems — 2.9% | |
| McDATA Corp., Class B(1) | | | 155,000 | | | $ | 683,550 | | |
| Research in Motion Ltd.(1) | | | 52,700 | | | | 3,240,523 | | |
| Symbol Technologies, Inc. | | | 131 | | | | 1,087 | | |
| | | $ | 3,925,160 | | |
| Computers & Peripherals — 2.9% | |
| Palm, Inc.(1) | | | 102,000 | | | $ | 2,620,380 | | |
| Synaptics, Inc.(1) | | | 55,000 | | | | 1,277,650 | | |
| | | $ | 3,898,030 | | |
| Education — 1.2% | |
| DeVry, Inc.(1) | | | 71,000 | | | $ | 1,604,600 | | |
| | | $ | 1,604,600 | | |
| Energy — 2.0% | |
| British Energy Group PLC(1) | | | 351,000 | | | $ | 2,760,666 | | |
| | | $ | 2,760,666 | | |
| ETFs — 2.0% | |
| Midcap SPDR Trust Series I | | | 21,000 | | | | 2,677,500 | | |
| | | $ | 2,677,500 | | |
| Financial Services — 6.0% | |
| E*Trade Financial Corp.(1) | | | 307,000 | | | $ | 5,694,850 | | |
| MarketAxess Holdings, Inc.(1) | | | 86,900 | | | | 1,072,346 | | |
| OptionsXpress Holdings, Inc. | | | 1,000 | | | | 18,860 | | |
| SFE Corp., Ltd. | | | 76,000 | | | | 708,800 | | |
| Student Loan Corp. (The) | | | 3,100 | | | | 679,520 | | |
| | | $ | 8,174,376 | | |
| Gaming — 3.9% | |
| PartyGaming PLC(1) | | | 800,000 | | | $ | 1,235,634 | | |
| Sportingbet PLC(1) | | | 759,000 | | | | 4,032,300 | | |
| | | $ | 5,267,934 | | |
See notes to financial statements
15
Tax-Managed Multi-Cap Opportunity Portfolio as of October 31, 2005
PORTFOLIO OF INVESTMENTS CONT'D
| Security | | Shares | | Value | |
| Health Care Services — 5.2% | |
| Caremark Rx, Inc.(1) | | | 45,000 | | | $ | 2,358,000 | | |
| Coventry Health Care, Inc.(1) | | | 22,000 | | | | 1,187,780 | | |
| DaVita, Inc.(1) | | | 41,075 | | | | 2,020,068 | | |
| United Surgical Partners International, Inc.(1) | | | 150 | | | | 5,378 | | |
| WellPoint, Inc.(1) | | | 20,000 | | | | 1,493,600 | | |
| | | $ | 7,064,826 | | |
| Hotels, Restaurants & Leisure — 0.5% | |
| Wynn Resorts Ltd.(1) | | | 14,000 | | | $ | 653,520 | | |
| | | $ | 653,520 | | |
| Insurance — 3.9% | |
| Admiral Group PLC | | | 165,000 | | | $ | 1,276,863 | | |
| Mercury General Corp. | | | 17,729 | | | | 1,071,718 | | |
| Progressive Corp. | | | 100 | | | | 11,581 | | |
| UnumProvident Corp. | | | 142,000 | | | | 2,881,180 | | |
| | | $ | 5,241,342 | | |
| Internet Services — 7.1% | |
| CheckFree Corp.(1) | | | 57,000 | | | $ | 2,422,500 | | |
| eResearch Technology, Inc.(1) | | | 40,000 | | | | 573,200 | | |
| Google, Inc., Class A(1) | | | 8,000 | | | | 2,977,120 | | |
| HomeStore, Inc.(1) | | | 1,013 | | | | 3,677 | | |
| i2 Technologies, Inc.(1) | | | 86,000 | | | | 1,050,920 | | |
| Yahoo!, Inc.(1) | | | 70,000 | | | | 2,587,900 | | |
| | | $ | 9,615,317 | | |
| Medical Products — 4.5% | |
| Celgene Corp.(1) | | | 21,000 | | | $ | 1,178,100 | | |
| Cooper Co., Inc. | | | 19,000 | | | | 1,307,960 | | |
| Henry Schein, Inc.(1) | | | 28,000 | | | | 1,109,920 | | |
| I-Flow Corp.(1) | | | 18,808 | | | | 227,013 | | |
| Mentor Corp. | | | 52,000 | | | | 2,340,000 | | |
| | | $ | 6,162,993 | | |
| Mining — 4.2% | |
| Arch Coal, Inc. | | | 60,000 | | | $ | 4,624,200 | | |
| Foundation Coal Holdings, Inc. | | | 18,000 | | | | 675,000 | | |
| Gammon Lake Resources, Inc.(1) | | | 45,000 | | | | 350,100 | | |
| | | $ | 5,649,300 | | |
| Security | | Shares | | Value | |
| Oil and Gas-Equipment and Services — 3.7% | |
| Halliburton Co. | | | 23,000 | | | $ | 1,359,300 | | |
| Tesoro Corp. | | | 15,000 | | | | 917,250 | | |
| Trico Marine Services, Inc.(1) | | | 109,471 | | | | 2,790,416 | | |
| | | $ | 5,066,966 | | |
| Oil and Gas-Exploration and Production — 6.7% | |
| Amerada Hess Corp. | | | 32,500 | | | $ | 4,065,750 | | |
| Bankers Petroleum Ltd.(1) | | | 1,000 | | | | 1,017 | | |
| Pride International, Inc.(1) | | | 46,000 | | | | 1,291,220 | | |
| Range Resources Corp. | | | 39,000 | | | | 1,391,910 | | |
| Vintage Petroleum, Inc. | | | 45,000 | | | | 2,335,050 | | |
| | | $ | 9,084,947 | | |
| Personal Products — 1.7% | |
| Procter & Gamble Co. | | | 40,500 | | | $ | 2,267,595 | | |
| | | $ | 2,267,595 | | |
| Pharmaceuticals — 6.4% | |
| American Pharmaceutical Partners, Inc.(1) | | | 30,679 | | | $ | 1,320,731 | | |
| Ligand Pharmaceuticals, Inc., Class B(1) | | | 146,000 | | | | 1,263,630 | | |
| MedImmune, Inc.(1) | | | 40,000 | | | | 1,399,200 | | |
| Omnicare, Inc. | | | 5,000 | | | | 270,500 | | |
| OSI Pharmaceuticals, Inc.(1) | | | 54,000 | | | | 1,258,200 | | |
| Sanofi-Aventis ADR | | | 31,000 | | | | 1,243,720 | | |
| Shire Pharmaceuticals Group PLC ADR | | | 54,000 | | | | 1,935,360 | | |
| | | $ | 8,691,341 | | |
| REITs — 0.0% | |
| MFA Mortgage Investments, Inc. | | | 1,000 | | | $ | 5,750 | | |
| | | $ | 5,750 | | |
| Retail-Food and Drug — 1.6% | |
| Walgreen Co. | | | 47,000 | | | $ | 2,135,210 | | |
| | | $ | 2,135,210 | | |
| Retail-Specialty — 1.9% | |
| American Eagle Outfitters, Inc. | | | 56,000 | | | $ | 1,318,800 | | |
| Men's Wearhouse, Inc.(1) | | | 24,000 | | | | 592,800 | | |
| Pep Boys - Manny, Moe & Jack | | | 1,000 | | | | 13,800 | | |
| Tweeter Home Entertainment Group, Inc.(1) | | | 131,000 | | | | 613,080 | | |
| | | $ | 2,538,480 | | |
See notes to financial statements
16
Tax-Managed Multi-Cap Opportunity Portfolio as of October 31, 2005
PORTFOLIO OF INVESTMENTS CONT'D
| Security | | Shares | | Value | |
| Semiconductors — 2.4% | |
| Atheros Communications, Inc.(1) | | | 208,000 | | | $ | 1,803,360 | | |
| Cabot Microelectronics Corp.(1) | | | 22,000 | | | | 646,800 | | |
| Cirrus Logic, Inc.(1) | | | 116,000 | | | | 760,960 | | |
| | | $ | 3,211,120 | | |
| Telecommunications-Services — 1.1% | |
| AO VimpelCom ADR(1) | | | 5,000 | | | $ | 200,000 | | |
| PanAmSat Holding Corp. | | | 55,000 | | | | 1,312,850 | | |
| Philippine Long Distance Telephone Co. ADR | | | 1,000 | | | | 30,150 | | |
| | | $ | 1,543,000 | | |
| Transportation — 0.3% | |
| American Commercial Lines, Inc.(1) | | | 16,389 | | | $ | 460,859 | | |
| | | $ | 460,859 | | |
| Wireless Communications — 6.2% | |
| NII Holdings, Inc., Class B(1) | | | 77,000 | | | $ | 6,384,840 | | |
| Novatel Wireless, Inc.(1) | | | 162,000 | | | | 2,057,400 | | |
| | | $ | 8,442,240 | | |
Total Common Stocks
(identified cost $109,712,275) | | | | | | $ | 125,344,119 | | |
| Short-Term Investments — 10.1% | |
| Security | | Principal
Amount
(000's omitted) | | Value | |
General Electrical Corp., Commercial Paper,
4.02%, 11/1/05 | | $ | 6,384 | | | $ | 6,384,000 | | |
HSBC Finance Corp., Commercial Paper,
3.81%, 11/3/05 | | | 4,600 | | | | 4,599,026 | | |
Investors Bank and Trust Company Time Deposit,
4.03%, 11/1/05 | | | 2,000 | | | | 2,000,000 | | |
Prudential Financial, Inc., Commercial Paper,
4.02%, 11/1/05 | | | 688 | | | | 688,000 | | |
Total Short-Term Investments
(at amortized cost, $13,671,026) | | | | | | $ | 13,671,026 | | |
Total Investments — 102.4%
(identified cost $123,383,301) | | | | | | $ | 139,015,145 | | |
| Securities Sold Short — (1.9)% | |
| Security | | Shares | | Value | |
| Yahoo!, Inc. | | | 70,000 | | | $ | (2,587,900 | ) | |
Total Securities Sold Short — (1.9)%
(proceeds $1,144,289) | | | | $ | (2,587,900 | ) | |
| Other Assets, Less Liabilities — (0.5)% | | | | $ | (652,956 | ) | |
| Net Assets — 100.0% | | | | $ | 135,774,289 | | |
ADR - American Depository Receipt
ETF - Exchange Traded Fund
REIT - Real Estate Investment Trust
SPDR - S&P Depository Receipt
(1) Non-income producing security.
See notes to financial statements
17
Tax-Managed Multi-Cap Opportunity Portfolio as of October 31, 2005
FINANCIAL STATEMENTS
Statement of Assets and Liabilities
As of October 31, 2005
| Assets | |
| Investments, at value (identified cost, $123,383,301) | | $ | 139,015,145 | | |
| Cash | | | 969 | | |
| Deposit with brokers for securities sold short | | | 1,144,289 | | |
| Receivable for investments sold | | | 1,771,673 | | |
| Tax reclaim receivable | | | 18 | | |
| Total assets | | $ | 141,932,094 | | |
| Liabilities | |
| Payable for investments purchased | | $ | 3,428,872 | | |
| Payable for securities sold short, at value | | | 2,587,900 | | |
| Payable to affiliate for investment advisory fees | | | 73,785 | | |
| Interest and dividends payable | | | 12,457 | | |
| Payable to affiliate for Trustees' fees | | | 797 | | |
| Accrued expenses | | | 53,994 | | |
| Total liabilities | | $ | 6,157,805 | | |
| Net Assets applicable to investors' interest in Portfolio | | $ | 135,774,289 | | |
| Sources of Net Assets | |
| Net proceeds from capital contributions and withdrawals | | $ | 121,586,056 | | |
| Net unrealized appreciation (computed on the basis of identified cost) | | | 14,188,233 | | |
| Total | | $ | 135,774,289 | | |
Statement of Operations
For the Year Ended
October 31, 2005
| Investment Income | |
| Dividends (net of foreign taxes, $2,120) | | $ | 853,240 | | |
| Interest | | | 217,589 | | |
| Total investment income | | $ | 1,070,829 | | |
| Expenses | |
| Investment adviser fee | | $ | 804,940 | | |
| Trustees' fees and expenses | | | 8,688 | | |
| Custodian fee | | | 107,409 | | |
| Legal and accounting services | | | 30,445 | | |
| Miscellaneous | | | 7,904 | | |
| Total expenses | | $ | 959,386 | | |
Deduct —
Reduction of investment adviser fee | | $ | 8,178 | | |
| Total expense reductions | | $ | 8,178 | | |
| Net expenses | | $ | 951,208 | | |
| Net investment income | | $ | 119,621 | | |
| Realized and Unrealized Gain (Loss) | |
Net realized gain (loss) —
Investment transactions (identified cost basis) | | $ | 10,819,745 | | |
| Foreign currency transactions | | | (16,133 | ) | |
| Net realized gain | | $ | 10,803,612 | | |
Change in unrealized appreciation (depreciation) —
Investments (identified cost basis) | | $ | (1,161,147 | ) | |
| Securities sold short | | | (54,600 | ) | |
| Net change in unrealized appreciation (depreciation) | | $ | (1,215,747 | ) | |
| Net realized and unrealized gain | | $ | 9,587,865 | | |
| Net increase in net assets from operations | | $ | 9,707,486 | | |
See notes to financial statements
18
Tax-Managed Multi-Cap Opportunity Portfolio as of October 31, 2005
FINANCIAL STATEMENTS CONT'D
Statements of Changes in Net Assets
Increase (Decrease)
in Net Assets | | Year Ended
October 31, 2005 | | Year Ended
October 31, 2004 | |
From operations —
Net investment income (loss) | | $ | 119,621 | | | $ | (69,550 | ) | |
Net realized gain from investment
transactions, securities sold
short, and foreign currency
and foreign currency exchange
contract transactions | | | 10,803,612 | | | | 3,049,822 | | |
Net change in unrealized
appreciation (depreciation)
from investments and
securities sold short | | | (1,215,747 | ) | | | 1,641,170 | | |
| Net increase in net assets from operations | | $ | 9,707,486 | | | $ | 4,621,442 | | |
Capital transactions —
Contributions | | $ | 33,968,812 | | | $ | 41,277,097 | | |
| Withdrawals | | | (16,795,810 | ) | | | (23,993,091 | ) | |
Net increase in net assets from
capital transactions | | $ | 17,173,002 | | | $ | 17,284,006 | | |
| Net increase in net assets | | $ | 26,880,488 | | | $ | 21,905,448 | | |
| Net Assets | |
| At beginning of year | | $ | 108,893,801 | | | $ | 86,988,353 | | |
| At end of year | | $ | 135,774,289 | | | $ | 108,893,801 | | |
See notes to financial statements
19
Tax-Managed Multi-Cap Opportunity Portfolio as of October 31, 2005
FINANCIAL STATEMENTS CONT'D
Supplementary Data
| | | Year Ended October 31, | |
| | | 2005 | | 2004 | | 2003 | | 2002 | | 2001 | |
| Ratios/Supplemental Data† | |
| Ratios (As a percentage of average daily net assets): | |
| Net expenses | | | 0.77 | % | | | 0.76 | % | | | 0.79 | % | | | 0.82 | % | | | 1.09 | % | |
| Net expenses after custodian fee reduction | | | 0.77 | % | | | 0.76 | % | | | 0.79 | % | | | 0.82 | % | | | 1.09 | % | |
| Net investment income (loss) | | | 0.10 | % | | | (0.06 | )% | | | (0.54 | )% | | | (0.58 | )% | | | (0.36 | )% | |
| Portfolio Turnover | | | 217 | % | | | 239 | % | | | 224 | % | | | 225 | % | | | 324 | % | |
| Total Return(1) | | | 8.71 | % | | | 4.60 | % | | | 34.80 | % | | | (12.80 | )% | | | — | | |
| Net assets, end of year (000's omitted) | | $ | 135,774 | | | $ | 108,894 | | | $ | 86,988 | | | $ | 48,896 | | | $ | 34,392 | | |
| † The operating expenses of the Portfolio may reflect a reduction of the investment adviser fee. Had such actions not been taken, the ratios would have been as follows: | | | |
| Ratios (As a percentage of average daily net assets): | | | | | | | | | | | | | | | | | | | | | |
| Expenses | | | 0.77 | % | | | 0.77 | % | | | | | | | | | | | | | |
| Expenses after custodian fee reduction | | | 0.77 | % | | | 0.77 | % | | | | | | | | | | | | | |
| Net investment loss | | | 0.10 | % | | | (0.07 | )% | | | | | | | | | | | | | |
(1) Total return is required to be disclosed for fiscal years beginning after December 15, 2000.
See notes to financial statements
20
Tax-Managed Multi-Cap Opportunity Portfolio as of October 31, 2005
NOTES TO FINANCIAL STATEMENTS
1 Significant Accounting Policies
Tax-Managed Multi-Cap Opportunity Portfolio (the Portfolio) is registered under the Investment Company Act of 1940, as amended, as a diversified open-end investment management company. The Portfolio, which was organized as a trust under the laws of the State of New York on February 28, 2000, seeks to achieve long-term, after-tax returns by investing in a diversified portfolio of equity securities. The Declaration of Trust permits the Trustees to issue beneficial interests in the Portfolio. At October 31, 2005, the Eaton Vance Tax-Managed Multi-Cap Opportunity Fund and the Eaton Vance Tax-Managed Equity Asset Allocation Fund held 42.7% and 57.2% interests in the Portfolio, respectively. The following is a summary of significant accounting policies consistently followed by the Portfolio in the preparation of its financial statements. The policies are in conformity with accounting principles generally accepted in the United States of America.
A Investment Valuation — Securities listed on a U.S. securities exchange generally are valued at the last sale price on the day of valuation or, if no sales took place on such date, at the mean between the closing bid and asked prices therefore on the exchange where such securities are principally traded. Equity securities listed on the NASDAQ National Market System generally are valued at the official NASDAQ closing price. Unlisted or listed securities for which closing sales prices or closing quotations are not available are valued at the mean between the latest available bid and asked prices or, in the case of preferred equity securities that are not listed or traded in the over-the-counter market, by an independent pricing service. Exchange-traded options are valued a t the last sale price for the day of valuation as quoted on the principal exchange or board of trade on which the options are traded or, in the absence of sales on such date, at the mean between the latest bid and asked prices therefore. Futures positions on securities and currencies generally are valued at closing settlement prices. Short-term debt securities with a remaining maturity of 60 days or less are valued at amortized cost. If short-term debt securities were acquired with a remaining maturity of more than 60 days, their amortized cost value will be based on their value on the sixty-first day prior to maturity. Other fixed income and debt securities, including listed securities and securities for which price quotations are available, will normally be valued on the basis of valuations furnished by a pricing service. Foreign securities and currencies are valued in U.S. dollars, based on foreign currency exchange rate quotations supplied by an independent quotation service. The daily valuation of excha nge traded foreign securities generally is determined as of the close of trading on the principal exchange on which such securities trade. Events occurring after the close of trading on foreign exchanges may result in adjustments to the valuation of foreign securities to more accurately reflect their fair value as of the close of regular trading on the New York Stock Exchange. When valuing foreign equity securities that meet certain criteria, the Trustees have approved the use of a fair value service that values such securities to reflect market trading that occurs after the close of the applicable foreign markets of comparable securities or other instruments that have a strong correlation to the fair valued securities. Investments held by the Portfolio for which valuations or market quotations are unavailable are valued at fair value using methods determined in good faith by or at the direction of the Trustees of the Portfolio consideri ng relevant factors, data and information including the market value of freely tradable securities of the same class in the principal market on which such securities are normally traded.
B Income — Dividend income is recorded on the ex-dividend date for dividends received in cash and/or securities. However, if the ex-dividend date has passed, certain dividends from foreign securities are recorded as the Portfolio is informed of the ex-dividend date. Interest income is recorded on the accrual basis.
C Income Taxes — The Portfolio has elected to be treated as a partnership for federal tax purposes. No provision is made by the Portfolio for federal or state taxes on any taxable income of the Portfolio because each investor in the Portfolio is ultimately responsible for the payment of any taxes. Since at least one of the Portfolio's investors is a regulated investment company that invests all or substantially all of its assets in the Portfolio, the Portfolio normally must satisfy the applicable source of income and diversification requirements (under the Internal Revenue Code) in order for its investors to satisfy them. The Portfolio will allocate at least annually among its investors each investor's distributive share of the Portfolio's net investment income, net reali zed capital gains, and any other items of income, gain, loss, deduction or credit.
D Financial Futures Contract — Upon entering a financial futures contract, the Portfolio is required to deposit either in cash or securities an amount (initial margin) equal to a certain percentage of the purchase price indicated in the financial futures contract. Subsequent payments are made or received by the Portfolio (margin maintenance) each day, dependent on daily fluctuations in the value of the underlying security, and are recorded for book purposes as unrealized gains or losses by the Portfolio.
21
Tax-Managed Multi-Cap Opportunity Portfolio as of October 31, 2005
NOTES TO FINANCIAL STATEMENTS CONT'D
The Portfolio's investment in financial futures contracts is designed to hedge against anticipated future changes in price of current or anticipated Portfolio positions. Should prices move unexpectedly, the Portfolio may not achieve the anticipated benefits of the financial futures contracts and may realize a loss.
E Put Options — Upon the purchase of a put option by the Portfolio, the premium paid is recorded as an investment, the value of which is marked-to-market daily. When a purchased option expires, the Portfolio will realize a loss in the amount of the cost of the option. When the Portfolio enters into a closing sale transaction, the Portfolio will realize a gain or loss depending on whether the sales proceeds from the closing sale transaction are greater or less than the cost of the option. When the Portfolio exercises a put option, settlement is made in cash. The risk associated with purchasing options is limited to the premium originally paid.
F Expense Reduction — Investors Bank & Trust Company (IBT) serves as custodian of the Portfolio. Pursuant to the custodian agreement, IBT receives a fee reduced by credits which are determined based on the average daily cash balance the Portfolio maintains with IBT. All credit balances used to reduce the Portfolio's custodian fees are reported as a reduction of total expenses on the Statement of Operations.
G Securities Sold Short — The Portfolio may sell a security short if it owns at least an equal amount of the security sold short or another security exchangeable for an equal amount of the security sold short without payment of further compensation (a short sale against the box) in anticipation of a decline in the market price of the securities or in order to hedge portfolio positions. The Portfolio will generally borrow the security sold in order to make the delivery to the buyer. Upon executing the transaction, the Portfolio records the proceeds as deposits with brokers in the Statement of Assets and Liabilities and establishes an offsetting payable for securities sold short for the securities due on settlement. The proceeds are retained by the broker as collateral for the short position. The liability is marked-to-market on a daily basis and the Portfolio is required to pay the lending broker any dividend or interest income earned while the short position is open. A gain or loss is recorded when the security is delivered to the broker. The Portfolio may recognize a loss on the transaction if the market value of the securities sold increases before the securities are delivered.
H Foreign Currency Translation — Investment valuations, other assets and liabilities initially expressed in foreign currencies are converted each business day into U.S. dollars based upon current exchange rates. Purchases and sales of foreign investment securities and income and expenses are converted into U.S. dollars based upon currency exchange rates prevailing on the respective dates of such transactions. Recognized gains or losses on investment transactions attributable to foreign currency exchange rates are recorded for financial statement purposes as net realized gains and losses on investments. That portion of unrealized gains and losses on investments that results from fluctuations in foreign currency exchange rates is not separately disclosed.
I Indemnifications — Under the Portfolio's organizational documents, its officers and Trustees may be indemnified against certain liabilities and expenses arising out of the performance of their duties to the Portfolio. Interestholders in the Portfolio are jointly and severally liable for the liabilities and obligations of the Portfolio in the event that the Portfolio fails to satisfy such liabilities and obligations; provided, however, that, to the extent assets are available in the Portfolio, the Portfolio may, under certain circumstances, indemnify interestholders from and against any claim or liability to which such holder may become subject by reason of being or having been an interestholder in the Portfolio. Additionally, in the normal course of business, the Portfo lio enters into agreements with service providers that may contain indemnification clauses. The Portfolio's maximum exposure under these arrangements is unknown as this would involve future claims that may be made against the Portfolio that have not yet occurred.
J Other — Investment transactions are accounted for on the date the securities are purchased or sold. Realized gains and losses are computed based on the specific identification of securities sold.
K Use of Estimates — The preparation of the financial statements in conformity with accounting principles generally accepted in the United States of America requires management to make estimates and assumptions that affect the reported amounts of assets and liabilities at the date of the financial statements and the reported amounts of income and expense during the reporting period. Actual results could differ from those estimates.
22
Tax-Managed Multi-Cap Opportunity Portfolio as of October 31, 2005
NOTES TO FINANCIAL STATEMENTS CONT'D
2 Investment Adviser Fee and Other Transactions with Affiliates
The investment adviser fee is earned by Boston Management and Research (BMR), a wholly-owned subsidiary of Eaton Vance Management (EVM), as compensation for management and investment advisory services rendered to the Portfolio. Under the advisory agreement, BMR receives a monthly advisory fee equal to 0.65% annually of average daily net assets of the Portfolio up to $500 million, and at reduced rates as daily net assets exceed that level. For the year ended October 31, 2005, the advisory fee amounted to $804,940. BMR has also agreed to reduce the investment adviser fee by an amount equal to that portion of commissions paid to broker dealers in execution of Portfolio security transactions that is consideration for third-party research services. For the year ended October 31, 2005, BMR waived $8,178 of its advisory fee. Except for Trustees of the Portfolio who are not members of EVM's or BMR's organization, officers and Trustees r eceive remuneration for their services to the Portfolio out of such investment adviser fee. Trustees of the Portfolio that are not affiliated with the Investment Adviser may elect to defer receipt of all or a percentage of their annual fees in accordance with the terms of the Trustees Deferred Compensation Plan. For the year ended October 31, 2005, no significant amounts have been deferred.
Certain officers and Trustees of the Portfolio are officers of the above organizations.
3 Investment Transactions
Purchases and sales of investments, other than short-term obligations, aggregated $266,737,180 and $256,034,367, respectively, for the year ended October 31, 2005.
4 Federal Income Tax Basis of Unrealized Appreciation (Depreciation)
The cost and unrealized appreciation (depreciation) in value of the investments owned at October 31, 2005 as computed on a federal income tax basis, were as follows:
| Aggregate cost | | $ | 125,342,165 | | |
| Gross unrealized appreciation | | $ | 17,028,129 | | |
| Gross unrealized depreciation | | | (3,355,149 | ) | |
| Net unrealized appreciation | | $ | 13,672,980 | | |
5 Line of Credit
The Portfolio participates with other portfolios and funds managed by BMR and EVM and its affiliates in a $150 million unsecured line of credit agreement with a group of banks. Borrowings will be made by the Portfolio solely to facilitate the handling of unusual and/or unanticipated short-term cash requirements. Interest is charged to each participating portfolio or fund based on its borrowings at an amount above either the Eurodollar rate or federal funds rate. In addition, a fee computed at an annual rate of 0.10% on the daily unused portion of the line of credit is allocated among the participating portfolios and funds at the end of each quarter. The Portfolio did not have any significant borrowings or allocated fees during the year ended October 31, 2005.
6 Financial Instruments
The Portfolio may trade in financial instruments with off-balance sheet risk in the normal course of its investing activities to assist in managing exposure to various market risks. These financial instruments include written options and financial futures contracts, and may involve, to a varying degree, elements of risk in excess of the amounts recognized for financial statement purposes. The notional or contractual amounts of these instruments represent the investment the Portfolio has in particular classes of financial instruments and does not necessarily represent the amounts potentially subject to risk. The measurement of the risks associated with these instruments is meaningful only when all related and offsetting transactions are considered. At October 31, 2005 there were no outstanding obligations under these financial instruments.
23
Tax-Managed Multi-Cap Opportunity Portfolio as of October 31, 2005
REPORT OF INDEPENDENT REGISTERED PUBLIC ACCOUNTING FIRM
To the Trustees and Investors of Tax-Managed Multi-Cap Opportunity Portfolio:
We have audited the accompanying statement of assets and liabilities of Tax-Managed Multi-Cap Opportunity Portfolio (the Portfolio), including the portfolio of investments as of October 31, 2005, the related statement of operations for the year then ended, the statements of changes in net assets for the two years in the period then ended, and the supplementary data for each of the five years, in the period then ended. These financial statements and supplementary data are the responsibility of the Portfolio's management. Our responsibility is to express an opinion on these financial statements and supplementary data based on our audits.
We conducted our audits in accordance with standards of the Public Company Accounting Oversight Board (United States). Those standards require that we plan and perform the audits to obtain reasonable assurance about whether the financial statements and supplementary data are free of material misstatement. The Portfolio is not required to have, nor were we engaged to perform, an audit of its internal control over financial reporting. An audit includes consideration of internal control over financial reporting as a basis for designing audit procedures that are appropriate in the circumstances, but not for the purpose of expressing an opinion on the effectiveness of the Portfolio's internal control over financial reporting. Accordingly, we express no such opinion. An audit also includes examining, on a test basis, evidence supporting the amounts and disclosures in the financial statements, assessing the accounting principles used a nd significant estimates made by management, as well as evaluating the overall financial statement presentation. Our procedures included confirmation of securities held at October 31, 2005 by correspondence with the custodian and brokers; where replies were not received from brokers, we performed other audit procedures. We believe that our audits provide a reasonable basis for our opinion.
In our opinion, such financial statements and supplementary data referred to above present fairly, in all material respects, the financial position of Tax-Managed Multi-Cap Opportunity Portfolio at October 31, 2005, the results of its operations for the year then ended, the changes in its net assets for each of the two years in the period then ended, and the supplementary data for each of the five years in the period then ended, in conformity with accounting principles generally accepted in the United States of America.
DELOITTE & TOUCHE LLP
Boston, Massachusetts
December 19, 2005
24
Eaton Vance Tax-Managed Multi-Cap Opportunity Fund
BOARD OF TRUSTEES' ANNUAL APPROVAL OF THE INVESTMENT ADVISORY AGREEMENT
The investment advisory agreement between Tax-Managed Multi-Cap Opportunity Portfolio (the "Portfolio") and its investment adviser, Boston Management and Research, provides that the advisory agreement will continue in effect from year to year so long as its continuance is approved at least annually (i) by a vote of a majority of the noninterested Trustees of the Portfolio cast in person at a meeting called for the purpose of voting on such approval and (ii) by the Trustees of the Portfolio or by vote of a majority of the outstanding interests of the Portfolio.
In considering the annual approval of the investment advisory agreement between the Portfolio and its investment adviser, the Special Committee of the Board of Trustees considered information that had been provided throughout the year at regular Board meetings, as well as information furnished for a series of meetings held in February and March in preparation for a Board meeting held on March 21, 2005 to specifically consider the renewal of the investment advisory agreement. Such information included, among other things, the following:
•An independent report comparing the advisory fees of the Portfolio with those of comparable funds;
•An independent report comparing the expense ratio of the Eaton Vance Tax-Managed Multi-Cap Opportunity Fund (the "Fund") to those of comparable funds;
•Information regarding Fund investment performance in comparison to relevant peer groups of funds and appropriate indices;
•The economic outlook and the general investment outlook in relevant investment markets;
•Eaton Vance Management's ("Eaton Vance") results and financial condition and the overall organization of the investment adviser;
•The procedures and processes used to determine the fair value of Fund assets and actions taken to monitor and test the effectiveness of such procedures and processes;
•The allocation of brokerage and the benefits received by the investment adviser as the result of brokerage allocation;
•Eaton Vance's management of the relationship with the custodian, subcustodians and fund accountants;
•The resources devoted to compliance efforts undertaken by Eaton Vance, on behalf of the funds it manages and the record of compliance with the investment policies and restrictions and with policies on personal securities transactions;
•The quality, nature, cost and character of the administrative and other non-investment management services provided by Eaton Vance and its affiliates; and
•The terms of the advisory agreement and the reasonableness and appropriateness of the particular fee paid by the Portfolio for the services described therein.
The Special Committee also considered the nature, extent and quality of the management services provided by the investment adviser. In so doing, the Special Committee considered its management capabilities with respect to the types of investments held by the Portfolio, including information relating to the education, experience and number of investment professionals and other personnel who provide services under the investment advisory agreement. The Special Committee specifically noted the investment adviser's in-house equity research capabilities and experience in managing funds that seek to maximize after-tax returns. The Special Committee evaluated the level of skill required to manage the Portfolio and concluded that the human resources available at the investment adviser were appropriate to fulfill effectively its duties on behalf of the Portfolio.
In its review of comparative information with respect to investment performance, the Special Committee concluded that the Fund has performed within a range that the Special Committee deemed competitive. With respect to its review of investment advisory fees, the Special Committee concluded that the fees paid by the Portfolio are within the range of those paid by comparable funds within the mutual fund industry. In reviewing the information regarding the expense ratio of the Fund, the Special Committee concluded that, in light of the asset size of the Fund, the Fund's expense ratio is reasonable.
In addition to the factors mentioned above, the Special Committee reviewed the level of profits of the investment adviser in providing investment management services for the Portfolio and for all Eaton Vance funds as a group. The Special Committee also reviewed the implementation of a soft dollar reimbursement program pursuant to which the Portfolio may receive reimbursement payments in respect of third party research services obtained by the investment adviser as a result of soft dollar credits generated through trading on behalf of the Portfolio. The Special Committee also reviewed the benefits to Eaton Vance and its affiliates in providing administration
25
Eaton Vance Tax-Managed Multi-Cap Opportunity Fund
BOARD OF TRUSTEES' ANNUAL APPROVAL OF THE INVESTMENT ADVISORY AGREEMENT CONT'D
services for the Fund and for all Eaton Vance funds as a group. In addition, the Special Committee considered the fiduciary duty assumed by the investment adviser in connection with the services rendered to the Portfolio and the business reputation of the investment adviser and its financial resources. The Trustees concluded that in light of the services rendered, the profits realized by the investment adviser are not unreasonable. The Special Committee also considered the extent to which the investment adviser appears to be realizing benefits from economies of scale in managing the Portfolio, and concluded that the fee breakpoints which are in place will allow for an equitable sharing of such benefits, when realized, with the Portfolio and the shareholders of the Fund.
The Special Committee did not consider any single factor as controlling in determining whether or not to renew the investment advisory agreement. Nor are the items described herein all the matters considered by the Special Committee. In assessing the information provided by Eaton Vance and its affiliates, the Special Committee also took into consideration the benefits to shareholders of investing in a fund that is a part of a large family of funds which provides a large variety of shareholder services.
Based on its consideration of the foregoing factors and conclusions, and such other factors and conclusions as it deemed relevant, and assisted by independent counsel, the Special Committee concluded that the renewal of the investment advisory agreement, including the fee structure, is in the interests of shareholders.
26
Eaton Vance Tax-Managed Multi-Cap Opportunity Fund
MANAGEMENT AND ORGANIZATION
Fund Management. The Trustees of Eaton Vance Mutual Funds Trust (the Trust) and Tax-Managed Multi-Cap Opportunity Portfolio (the Portfolio) are responsible for the overall management and supervision of the Trust's and Portfolio's affairs. The Trustees and officers of the Trust and the Portfolio are listed below. Except as indicated, each individual has held the office shown or other offices in the same company for the last five years. Trustees and officers of the Trust and the Portfolio hold indefinite terms of office. The "noninterested Trustees" consist of those Trustees who are not "interested persons" of the Trust and the Portfolio, as that term is defined under the 1940 Act. The business address of each Trustee and officer is The Eaton Vance Building, 255 State Street, Boston, Massachusetts 02109. As used below, "EVC" refers to Eaton Vance Corp., "EV" r efers to Eaton Vance, Inc., "EVM" refers to Eaton Vance Management, "BMR" refers to Boston Management and Research, and "EVD" refers to Eaton Vance Distributors, Inc. EVC and EV are the corporate parent and trustee, respectively, of EVM and BMR. EVD is the Fund's principal underwriter, the Portfolio's placement agent and wholly-owned subsidiary of EVM. Each officer affiliated with Eaton Vance may hold a position with other Eaton Vance affiliates that is comparable to its position with EVM listed below.
Name and
Date of Birth | | Position(s)
with the
Trust and the
Portfolio | | Term of
Office and
Length of
Service | | Principal Occupation(s)
During Past Five Years | | Number of Portfolios
in Fund Complex
Overseen By
Trustee(1) | | Other Directorships Held | |
| Interested Trustee | | | | | | | | | | | | | |
|
James B. Hawkes
11/9/41 | | Trustee | | Trustee of the Trust since 1991; of the Portfolio since 2000 | | Chairman, President and Chief Executive Officer of BMR, EVC, EVM and EV; Director of EV; Vice President and Director of EVD. Trustee and/or officer of 161 registered investment companies in the Eaton Vance Fund Complex. Mr. Hawkes is an interested person because of his positions with BMR, EVM, EVC and EV, which are affiliates of the Trust and the Portfolio. | | | 161 | | | Director of EVC | |
|
| Noninterested Trustee(s) | | | | | | | | | | | | | |
|
Benjamin C. Esty
1/2/63 | | Trustee | | Since 2005 | | Professor, Harvard University Graduate School of Business Administration (since 2003). Formerly, Associate Professor, Harvard University Graduate School of Business Administration (2000-2003). | | | 152 | | | None | |
|
Samuel L. Hayes, III
2/23/35 | | Trustee | | Trustee of the Trust since 1986; of the Portfolio since 2000 and Chairman of the Board since 2005 | | Jacob H. Schiff Professor of Investment Banking Emeritus, Harvard University Graduate School of Business Administration. | | | 161 | | | Director of Tiffany & Co. (specialty retailer) and Telect, Inc. (telecommunication services company) | |
|
William H. Park
9/19/47 | | Trustee | | Since 2003 | | President and Chief Executive Officer, Prizm Capital Management, LLC (investment management firm) (since 2002). Executive Vice President and Chief Financial Officer, United Asset Management Corporation (a holding company owning institutional investment management firms) (1982-2001). | | | 161 | | | None | |
|
Ronald A. Pearlman
7/10/40 | | Trustee | | Since 2003 | | Professor of Law, Georgetown University Law Center (since 1999). Tax Partner Covington & Burling, Washington, DC (1991-2000). | | | 161 | | | None | |
|
Norton H. Reamer
9/21/35 | | Trustee | | Trustee of the Trust since 1986; of the Portfolio since 2000 | | President, Chief Executive Officer and a Director of Asset Management Finance Corp. (a specialty finance company serving the investment management industry) (since October 2003). President, Unicorn Corporation (an investment and financial advisory services company) (since September 2000). Formerly, Chairman, Hellman, Jordan Management Co., Inc. (an investment management company) (2000-2003). Formerly, Advisory Director of Berkshire Capital Corporation (investment banking firm) (2002-2003). Formerly Chairman of the Board, United Asset Management Corporation (a holding company owning institutional investment management firms) and Chairman, President and Director, UAM Funds (mutual funds) (1980-2000). | | | 161 | | | None | |
|
27
Eaton Vance Tax-Managed Multi-Cap Opportunity Fund
MANAGEMENT AND ORGANIZATION CONT'D
Name and
Date of Birth | | Position(s)
with the
Trust and the
Portfolio | | Term of
Office and
Length of
Service | | Principal Occupation(s)
During Past Five Years | | Number of Portfolios
in Fund Complex
Overseen By
Trustee(1) | | Other Directorships Held | |
| Noninterested Trustee(s) (continued) | | | | | | | | | | | |
|
Lynn A. Stout
9/14/57 | | Trustee | | Trustee of the Trust since 1998; of the Portfolio since 2000 | | Professor of Law, University of California at Los Angeles School of Law (since July 2001). Formerly, Professor of Law, Georgetown University Law Center. | | | 161 | | | None | |
|
Ralph F. Verni
1/26/43 | | Trustee | | Since 2005 | | Consultant and private investor (since 2000). Formerly, President and Chief Executive Officer, Redwood Investment Systems, Inc. (software developer) (2000). Formerly, President and Chief Executive Officer, State Street Research & Management (investment advisor), SSRM Holdings (parent of State Street Research & Management), and SSR Realty (institutional realty manager) (1992-2000). | | | 152 | | | Director of W.P. Carey & Company LLC (manager of real estate investment trusts) | |
|
| Principal Officers who are not Trustees | | | | | | | |
|
Name and
Date of Birth | | Position(s)
with the
Trust and the
Portfolio | | Term of
Office and
Length of
Service | | Principal Occupation(s)
During Past Five Years | |
Thomas E. Faust Jr.
5/31/58 | | President of the Trust | | Since 2002 | | Executive Vice President of EVM, BMR, EVC and EV; Chief Investment Officer of EVM and BMR and Director of EVC. Chief Executive Officer of Belair Capital Fund LLC, Belcrest Capital Fund LLC, Belmar Capital Fund LLC, Belport Capital Fund LLC, and Belrose Capital Fund LLC (private investment companies sponsored by EVM). Officer of 65 registered investment companies managed by EVM or BMR. | |
|
William H. Ahern, Jr.
7/28/59 | | Vice President of the Trust | | Since 1995 | | Vice President of EVM and BMR. Officer of 70 registered investment companies managed by EVM or BMR. | |
|
| Cynthia J. Clemson 3/2/63 | | Vice President of the Trust | | Since 2005 | | Vice President of EVM and BMR. Officer of 85 registered investment companies managed by EVM or BMR. | |
|
Arieh Coll
11/9/63 | | Vice President of the Portfolio | | Since 2000 | | Vice President of EVM and BMR. Officer of 4 registered investment companies managed by EVM or BMR. | |
|
Kevin S. Dyer
2/21/75 | | Vice President of the Trust | | Since 2005 | | Assistant Vice President of EVM and BMR. Officer of 24 registered investment companies managed by EVM or BMR. | |
|
Aamer Khan
6/7/60 | | Vice President of the Trust | | Since 2005 | | Vice President of EVM and BMR. Officer of 27 registered investment companies managed by EVM or BMR. | |
|
Michael R. Mach
7/15/47 | | Vice President of the Trust | | Since 1999 | | Vice President of EVM and BMR. Officer of 32 registered investment companies managed by EVM or BMR. | |
|
Robert B. MacIntosh
1/22/57 | | Vice President of the Trust | | Since 1998 | | Vice President of EVM and BMR. Officer of 85 registered investment companies managed by EVM or BMR. | |
|
Duncan W. Richardson
10/26/57 | | Vice President of the Trust; President of the Portfolio | | Vice President of the Trust since 2001; President of the Portfolio since 2002 | | Senior Vice President and Chief Equity Investment Officer of EVM and BMR. Officer of 51 registered investment companies managed by EVM or BMR. | |
|
Walter A. Row, III
7/20/57 | | Vice President of the Trust | | Since 2001 | | Director of Equity Research and a Vice President of EVM and BMR. Officer of 31 registered investment companies managed by EVM or BMR. | |
|
Judith A. Saryan
8/21/54 | | Vice President of the Trust | | Since 2003 | | Vice President of EVM and BMR. Officer of 33 registered investment companies managed by EVM or BMR. | |
|
Susan Schiff
3/13/61 | | Vice President of the Trust | | Since 2002 | | Vice President of EVM and BMR. Officer of 29 registered investment companies managed by EVM or BMR. | |
|
28
Eaton Vance Tax-Managed Multi-Cap Opportunity Fund
MANAGEMENT AND ORGANIZATION CONT'D
| Principal Officers who are not Trustees (continued) | | | | | | | |
|
Name and
Date of Birth | | Position(s)
with the
Trust and the
Portfolio | | Term of
Office and
Length of
Service | | Principal Occupation(s)
During Past Five Years | |
| Barbara E. Campbell 6/19/57 | | Treasurer of the Trust | | Since 2005(2) | | Vice President of EVM and BMR. Officer of 161 registered investment companies managed by EVM or BMR. | |
|
Kevin M. Connerty
4/20/64 | | Treasurer of the Portfolio | | Since 2005 | | Vice President of EVM and BMR. Previously, Director and Vice President of PFPC Inc. (1999-2005). Officer of 88 registered investment companies managed by EVM or BMR. | |
|
Alan R. Dynner
10/10/40 | | Secretary | | Secretary of the Trust since 1997; of the Portfolio since 2000 | | Vice President, Secretary and Chief Legal Officer of BMR, EVM, EVD, EV and EVC. Officer of 161 registered investment companies managed by EVM or BMR. | |
|
Paul M. O'Neil
7/11/53 | | Chief Compliance Officer | | Since 2004 | | Vice President of EVM and BMR. Officer of 161 registered investment companies managed by EVM or BMR. | |
|
(1) Includes both master and feeder funds in a master-feeder structure
(2) Prior to 2005, Ms. Campbell served as Assistant Treasurer of the Trust since 1995.
The SAI for the Fund includes additional information about the Trustees and officers of the Fund and the Portfolio and can be obtained without charge by calling 1-800-225-6265.
29
Investment Adviser of Tax-Managed Multi-Cap Opportunity Portfolio
Boston Management and Research
The Eaton Vance Building
255 State Street
Boston, MA 02109
Administrator of Eaton Vance Tax-Managed Multi-Cap Opportunity Fund
Eaton Vance Management
The Eaton Vance Building
255 State Street
Boston, MA 02109
Principal Underwriter
Eaton Vance Distributors, Inc.
The Eaton Vance Building
255 State Street
Boston, MA 02109
(617) 482-8260
Custodian
Investors Bank & Trust Company
200 Clarendon Street
Boston, MA 02116
Transfer Agent
PFPC Inc.
Attn: Eaton Vance Funds
P.O. Box 9653
Providence, RI 02940-9653
(800) 262-1122
Independent Registered Public Accounting Firm
Deloitte & Touche LLP
200 Berkeley Street
Boston, MA 02116-5022
Eaton Vance Tax-Managed Multi-Cap Opportunity Fund
The Eaton Vance Building
255 State Street
Boston, MA 02109
This report must be preceded or accompanied by a current prospectus. Before investing, investors should consider carefully the Fund's investment
objective(s), risks, and charges and expenses. The Fund's current prospectus contains this and other information about the Fund and is available
through your financial advisor. Please read the prospectus carefully before you invest or send money. For further information please call 1-800-225-6265.
824-12/05 TMCAPSRC

Annual Report October 31, 2005


EATON VANCE
TAX-MANAGED
SMALL-CAP
GROWTH FUND
1.1
IMPORTANT NOTICES REGARDING PRIVACY,
DELIVERY OF SHAREHOLDER DOCUMENTS,
PORTFOLIO HOLDINGS AND PROXY VOTING
Privacy. The Eaton Vance organization is committed to ensuring your financial privacy. Each of the financial institutions identified below has in effect the following policy ("Privacy Policy") with respect to nonpublic personal information about its customers:
• Only such information received from you, through application forms or otherwise, and information about your Eaton Vance fund transactions will be collected. This may include information such as name, address, social security number, tax status, account balances and transactions.
• None of such information about you (or former customers) will be disclosed to anyone, except as permitted by law (which includes disclosure to employees necessary to service your account). In the normal course of servicing a customer's account, Eaton Vance may share information with unaffiliated third parties that perform various required services such as transfer agents, custodians and broker/dealers.
• Policies and procedures (including physical, electronic and procedural safeguards) are in place that are designed to protect the confidentiality of such information.
• We reserve the right to change our Privacy Policy at any time upon proper notification to you. Customers may want to review our Policy periodically for changes by accessing the link on our homepage: www.eatonvance.com.
Our pledge of privacy applies to the following entities within the Eaton Vance organization: the Eaton Vance Family of Funds, Eaton Vance Management, Eaton Vance Investment Counsel, Boston Management and Research, and Eaton Vance Distributors, Inc.
In addition, our Privacy Policy only applies to those Eaton Vance customers who are individuals and who have a direct relationship with us. If a customer's account (i.e. fund shares) is held in the name of a third-party financial adviser/broker-dealer, it is likely that only such adviser's privacy policies apply to the customer. This notice supersedes all previously issued privacy disclosures.
For more information about Eaton Vance's Privacy Policy, please call 1-800-262-1122.
Delivery of Shareholder Documents. The Securities and Exchange Commission ("the SEC") permits funds to deliver only one copy of shareholder documents, including prospectuses, proxy statements and shareholder reports, to fund investors with multiple accounts at the same residential or post office box address. This practice is often called "householding" and it helps eliminate duplicate mailings to shareholders.
Eaton Vance, or your financial adviser, may household the mailing of your documents indefinitely unless you instruct Eaton Vance, or your financial adviser, otherwise.
If you would prefer that your Eaton Vance documents not be householded, please contact Eaton Vance at 1-800-262-1122, or contact your financial adviser.
Your instructions that householding not apply to delivery of your Eaton Vance documents will be effective within 30 days of receipt by Eaton Vance or your financial adviser.
Portfolio Holdings. Each Eaton Vance Fund and its underlying Portfolio (if applicable) will file a schedule of its portfolio holdings on Form N-Q with the SEC for the first and third quarters of each fiscal year. The Form N-Q will be available on the Eaton Vance website www.eatonvance.com, by calling Eaton Vance at 1-800-262-1122 or in the EDGAR database on the SEC's website at www.sec.gov. Form N-Q may also be reviewed and copied at the SEC's public reference room in Washington, D.C. (call 1-800-732-0330 for information on the operation of the public reference room).
Proxy Voting. From time to time, funds are required to vote proxies related to the securities held by the funds. The Eaton Vance Funds or their underlying Portfolios (if applicable) vote proxies according to a set of policies and procedures approved by the Funds' and Portfolios' Boards. You may obtain a description of these policies and procedures and information on how the Funds or Portfolios voted proxies relating to Portfolio securities during the most recent 12 month period ended June 30, without charge, upon request, by calling 1-800-262-1122. This description is also available on the SEC's website at www.sec.gov.
Eaton Vance Tax-Managed Small-Cap Growth Fund 1.1 as of October 31, 2005
MANAGEMENT’S DISCUSSION OF FUND PERFORMANCE

| |
Martha Locke | |
Portfolio Manager | |
The Fund
Performance for the Past Year
• For the year ended October 31, 2005, the Fund’s Class A shares had a total return of 8.76%. This return was the result of an increase in net asset value (NAV) per share to $10.30 on October 31, 2005, from $9.47 on October 31, 2004.(1)
• The Fund’s Class B shares had a total return of 7.80% for the same period, the result of an increase in NAV per share to $9.68 from $8.98.(1)
• The Fund’s Class C shares had a total return of 7.94% for the same period, the result of an increase in NAV per share to $9.65 from $8.94.(1)
• For comparison, the Russell 2000 Growth Index – an unmanaged market index of small-cap growth stocks – had a total return of 10.91%, while the S&P SmallCap 600 Index – a broad-based, unmanaged index of both growth and value small-capitalization stocks – had a total return of 15.27% during the same period.(2)
See pages 3 through 5 for more performance information, including after-tax returns.
Management Discussion
• Over the past year, the U.S. economy remained strong, despite eight successive interest rate hikes by the Federal Reserve and surging energy prices since summer. Small-cap stocks in general outperformed large-cap stocks, but the value style of investing outperformed the growth style, due to the strong performance of the energy, basic materials and industrial sectors. The information technology sector, which accounts for a quarter of the benchmark Russell 2000 Growth Index, lagged most other sectors and was the primary factor in growth stocks lagging value stocks.(2)
• Against this backdrop, the Fund posted positive returns for the year, though it lagged the returns of its benchmarks. Energy, telecommunications and financial stocks held by Tax-Managed Small-Cap Growth Portfolio (the Portfolio), in which the Fund invests, contributed the most to the Fund’s performance.
• While stock selection is the primary driver of performance, the Portfolio remained overweighted in the energy sector for most of the year and thus benefited from the surge in energy prices caused by Hurricane Katrina.
• The Portfolio also benefited from strong stock selection in the telecom services sector, in which we were somewhat overweight versus the benchmark. A number of industrial stocks also added to our results, but performance was offset by a slight underweighting in this sector. Our underweighting in financials proved correct, and the names we held added to performance.
• However, the important IT sector substantially lagged other areas, and despite the Portfolio’s underweighting the benchmark, the underperformance of the semiconductor and software securities held by the Portfolio aggravated this drag.
• The health care and consumer discretionary sectors also represented significant portions of the benchmark and the Portfolio, and their overall contributions were positive. Within consumer discretionary stocks, the media, education and textile apparel industries led the way, offset somewhat by some specialty retail and restaurant stocks. In health care, pharmaceutical stocks were the strongest, offset by health care providers and services stocks. Our underweighting in biotechnology was positive.
The views expressed throughout this report are those of the portfolio manager and are current only through the end of the period of the report as stated on the cover. These views are subject to change at any time based upon market or other conditions, and the investment adviser disclaims any responsibility to update such views. These views may not be relied on as investment advice and, because investment decisions for a fund are based on many factors, may not be relied on as an indication of trading intent on behalf of any Eaton Vance fund.
Past performance is no guarantee of future results. Returns are historical and are calculated by determining the percentage change in net asset value or offering price (as applicable) with all distributions reinvested. Investment return and principal value will fluctuate so that shares, when redeemed, may be worth more or less than their original cost. Performance is for stated time period only; due to market volatility, the Fund’s current performance may be lower or higher than the quoted return. For performance as of the most recent month end, please refer to www.eatonvance.com.
(1) These returns do not include the 5.75% maximum sales charge for Class A shares or the applicable contingent deferred sales charge (CDSC) for Class B and Class C shares. If sales charges were deducted, returns would be lower.
(2) It is not possible to invest directly in an Index. The Indexes’ total return does not reflect commissions or expenses that would have been incurred if an investor individually purchased or sold the securities represented in an Index.
Fund shares are not insured by the FDIC and are not deposits or other obligations of, or guaranteed by, any depository institution. Shares are subject to investment risks, including possible loss of principal invested.
2
Eaton Vance Tax-Managed Small-Cap Growth Fund 1.1 as of October 31, 2005
FUND PERFORMANCE
The line graph and table set forth below provide information about the Fund’s performance. The line graph compares the performance of Class A of the Fund with that of the S&P SmallCap 600 Index, a broad-based, unmanaged market index of both growth and value small-capitalization stocks, and the Russell 2000 Growth Index, an unmanaged market index of small-cap growth stocks. The lines on the graph represent the total returns of a hypothetical investment of $10,000 in each of Class A, the S&P SmallCap 600 Index, and the Russell 2000 Index. Class A total returns are presented at net asset value and maximum public offering price. The table includes the total returns of each Class of the Fund at net asset value and public offering price. The performance presented below does not reflect the deduction of taxes, if any, that a shareholder would pay on distributions or redemptions of Fund shares.
Performance* | | Class A | | Class B | | Class C | |
| | | | | | | |
Average Annual Total Returns (at net asset value) | | | | | | | |
One Year | | 8.76 | % | 7.80 | % | 7.94 | % |
Five Years | | -8.98 | % | -9.70 | % | -9.67 | % |
Life of Fund† | | 0.37 | % | -0.40 | % | -0.44 | % |
| | | | | | | |
SEC Average Annual Total Returns (including sales charge or applicable CDSC) | | | | | | | |
One Year | | 2.49 | % | 2.80 | % | 6.94 | % |
Five Years | | -10.06 | % | -10.06 | % | -9.67 | % |
Life of Fund† | | -0.37 | % | -0.40 | % | -0.44 | % |
†Inception Dates – Class A: 9/25/97; Class B: 9/29/97; Class C: 9/29/97
* Average annual total returns do not include the 5.75% maximum sales charge for Class A shares or the applicable contingent deferred sales charge (CDSC) for Class B and Class C shares. If sales charges were deducted, returns would be lower. SEC average annual total returns for Class A reflect the maximum 5.75% sales charge. SEC returns for Class B shares reflect the applicable CDSC based on the following schedule: 5% - 1st and 2nd years; 4% - 3rd year; 3% - 4th year; 2% - 5th year; 1% - 6th year. SEC 1-year return for Class C reflects a 1% CDSC.
Past performance is no guarantee of future results. Returns are historical and are calculated by determining the percentage change in net asset value or offering price (as applicable) with all distributions reinvested. Investment return and principal value will fluctuate so that shares, when redeemed, may be worth more or less than their original cost. Performance is for the stated time period only; due to market volatility, the Fund’s current performance may be lower or higher than the quoted return. For performance as of the most recent month-end, please refer to www.eatonvance.com.
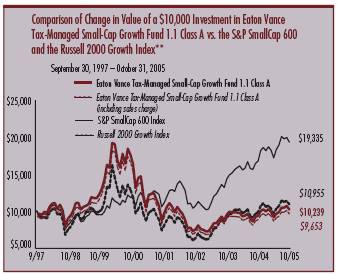
** Source: Thomson Financial. Class A of the Fund investment commenced investment operations on 9/25/97. A $10,000 hypothetical investment at net asset value in Class B shares and Class C shares on 9/29/97 would have been valued at $9,680 and $9,650, respectively. It is not possible to invest directly in an Index.The Indexes’ total returns do not reflect commissions or expenses that would have been incurred if an investor individually purchased or sold the securities represented in an Index.
3
Top Ten Holdings*
By net assets
NII Holdings Inc., Class B | | 2.20 | % |
Central European Media Enterprises, Ltd. | | 1.96 | % |
Novatel Wireless, Inc. | | 1.75 | % |
Southwestern Energy Co. | | 1.68 | % |
MoneyGram International, Inc. | | 1.59 | % |
Peabody Energy Corp. | | 1.57 | % |
Vintage Petroleum, Inc. | | 1.52 | % |
Palm Inc. | | 1.37 | % |
Student Loan Corp. | | 1.33 | % |
Hologic, Inc. | | 1.32 | % |
* Ten Largest Holdings represented 16.29% of Portfolio net assets as of October 31, 2005. Holdings are subject to change due to active management.
Common Stock Investments by Sector**
By net assets
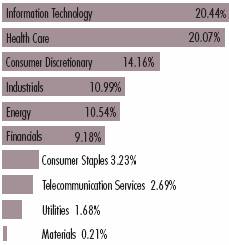
** Portfolio information may not be representative of the Portfolio’s current or future investments and may change due to active management.
4
“Return Before Taxes” does not take into consideration shareholder taxes. It is most relevant to tax-free or tax-deferred shareholder accounts. “Return After Taxes on Distributions” reflects the impact of federal income taxes due on Fund distributions of dividends and capital gains. It is most relevant to taxpaying shareholders who continue to hold their shares. “Return After Taxes on Distributions and Sale of Fund Shares” also reflects the impact of taxes on capital gain or loss realized upon a sale of shares. It is most relevant to taxpaying shareholders who sell their shares.
Average Annual Total Returns
(For the periods ended October 31, 2005)
Returns at Net Asset Value (NAV) (Class A)
| | One Year | | Five Years | | Life of Fund | |
| | | | | | | |
Return Before Taxes | | 8.76 | % | -8.98 | % | 0.37 | % |
Return After Taxes on Distributions | | 8.76 | % | -8.98 | % | 0.37 | % |
Return After Taxes on Distributions and Sale of Fund Shares | | 5.70 | % | -7.40 | % | 0.31 | % |
Returns at Public Offering Price (POP) (Class A)
| | One Year | | Five Years | | Life of Fund | |
| | | | | | | |
Return Before Taxes | | 2.49 | % | -10.06 | % | -0.37 | % |
Return After Taxes on Distributions | | 2.49 | % | -10.06 | % | -0.37 | % |
Return After Taxes on Distributions and Sale of Fund Shares | | 1.62 | % | -8.25 | % | -0.31 | % |
Average Annual Total Returns
(For the periods ended October 31, 2005)
Returns at Net Asset Value (NAV) (Class B)
| | One Year | | Five Years | | Life of Fund | |
| | | | | | | |
Return Before Taxes | | 7.80 | % | -9.70 | % | -0.40 | % |
Return After Taxes on Distributions | | 7.80 | % | -9.70 | % | -0.40 | % |
Return After Taxes on Distributions and Sale of Fund Shares | | 5.07 | % | -7.96 | % | -0.34 | % |
Returns at Public Offering Price (POP) (Class B)
| | One Year | | Five Years | | Life of Fund | |
| | | | | | | |
Return Before Taxes | | 2.80 | % | -10.06 | % | -0.40 | % |
Return After Taxes on Distributions | | 2.80 | % | -10.06 | % | -0.40 | % |
Return After Taxes on Distributions and Sale of Fund Shares | | 1.82 | % | -8.25 | % | -0.34 | % |
Average Annual Total Returns
(For the periods ended October 31, 2005)
Returns at Net Asset Value (NAV) (Class C)
| | One Year | | Five Years | | Life of Fund | |
| | | | | | | |
Return Before Taxes | | 7.94 | % | -9.67 | % | -0.44 | % |
Return After Taxes on Distributions | | 7.94 | % | -9.67 | % | -0.44 | % |
Return After Taxes on Distributions and Sale of Fund Shares | | 5.16 | % | -7.95 | % | -0.37 | % |
Returns at Public Offering Price (POP) (Class C)
| | One Year | | Five Years | | Life of Fund | |
| | | | | | | |
Return Before Taxes | | 6.94 | % | -9.67 | % | -0.44 | % |
Return After Taxes on Distributions | | 6.94 | % | -9.67 | % | -0.44 | % |
Return After Taxes on Distributions and Sale of Fund Shares | | 4.51 | % | -7.95 | % | -0.37 | % |
Class A of the Fund commenced investment operations on 9/25/97, and Class B and Class C of the Fund commenced investment operations on 9/29/97. Returns at Public Offering Price (POP) reflect the deduction of the maximum initial sales charge and applicable CDSC, while Returns at Net Asset Value (NAV) do not.
After-tax returns are calculated using the highest historical individual federal income tax rate and do not reflect the impact of state and local taxes. Actual after-tax returns depend on a shareholder’s tax situation and may differ from those shown. After-tax returns are not relevant for shareholders who hold shares in tax-deferred accounts or to shares held by non-taxable entities. Return After Taxes on Distributions for a period may be the same as Return Before Taxes for that period because no distributions were paid during that period, or because the taxable portion of distributions made duringthe period was insignificant. Also, Return After Taxes on Distributions and Sale of Fund the period was insignificant. Also, Return After Taxes on Distributions and Sale of Fund Shares for a period may be greater than Return After Taxes on Distributions for the same period because of realized losses on the sale of Fund shares.
Past performance is no guarantee of future results. Returns are historical and are calculated by determining the percentage change in net asset value or offering price (as applicable) with all distributions reinvested. Investment return and principal value will fluctuate so that shares, when redeemed, may be worth more or less than their original cost. Performance is for the stated time period only; due to market volatility, the Fund’s current performance may be lower or higher than the quoted return. For performance as of the most recent month-end, please refer to www.eatonvance.com.
5
Eaton Vance Tax-Managed Small-Cap Growth Fund 1.1 as of October 31, 2005
FUND EXPENSES
Example: As a shareholder of the Fund, you incur two types of costs: (1) transaction costs, including sales charges (loads) on purchases and redemption fees (if applicable); and (2) ongoing costs, including management fees; distribution or service fees; and other Fund expenses. This Example is intended to help you understand your ongoing costs (in dollars) of investing in the Fund and to compare these costs with the ongoing costs of investing in other mutual funds. The Example is based on an investment of $1,000 invested at the beginning of the period and held for the entire period (May 1, 2005 – October 31, 2005).
Actual Expenses: The first section of the table below provides information about actual account values and actual expenses. You may use the information in this line, together with the amount you invested, to estimate the expenses that you paid over the period. Simply divide your account value by $1,000 (for example, an $8,600 account value divided by $1,000 = 8.6), then multiply the result by the number in the first section under the heading entitled “Expenses Paid During Period” to estimate the expenses you paid on your account during this period.
Hypothetical Example for Comparison Purposes: The second section of the table below provides information about hypothetical account values and hypothetical expenses based on the actual Fund expense ratio and an assumed rate of return of 5% per year (before expenses), which is not the actual return of the Fund. The hypothetical account values and expenses may not be used to estimate the actual ending account balance or expenses you paid for the period. You may use this information to compare the ongoing costs of investing in your Fund and other funds. To do so, compare this 5% hypothetical example with the 5% hypothetical examples that appear in the shareholder reports of the other funds.
Please note that the expenses shown in the table are meant to highlight your ongoing costs only and do not reflect any transactional costs, such as sales charges (loads) or redemption fees (if applicable). Therefore, the second section of the table is useful in comparing ongoing costs only, and will not help you determine the relative total costs of owning different funds. In addition, if these transactional costs were included, your costs would have been higher.
| | Eaton Vance Tax-Managed Small-Cap Growth Fund 1.1 | |
| | Beginning Account Value | | Ending Account Value | | Expenses Paid During Period* | |
| | (5/1/05) | | (10/31/05) | | (5/1/05 – 10/31/05) | |

| | | | | | | |
Actual | | | | | | | |
Class A | | $ | 1,000.00 | | $ | 1,113.50 | | $ | 7.67 | |
Class B | | $ | 1,000.00 | | $ | 1,107.60 | | $ | 11.58 | |
Class C | | $ | 1,000.00 | | $ | 1,109.20 | | $ | 11.64 | |
| | | | | | | |
Hypothetical | | | | | | | |
(5% return per year before expenses) | | | | | | | |
Class A | | $ | 1,000.00 | | $ | 1,017.90 | | $ | 7.32 | |
Class B | | $ | 1,000.00 | | $ | 1,014.20 | | $ | 11.07 | |
Class C | | $ | 1,000.00 | | $ | 1,014.20 | | $ | 11.12 | |
* Expenses are equal to the Fund’s annualized expense ratio of 1.44% for Class A shares, 2.18% for Class B shares, and 2.19% for Class C shares multiplied by the average account value over the period, multiplied by 184/365 (to reflect the one-half year period). The example assumes that the $1,000 was invested at the net asset value per share determined at the close of business on April 30, 2005. The Example reflects the expenses of both the Fund and the Portfolio.
6
Eaton Vance Tax-Managed Small-Cap Growth Fund 1.1 as of October 31, 2005
FINANCIAL STATEMENTS
Statement of Assets and Liabilities
As of October 31, 2005
| Assets | |
Investment in Tax-Managed Small-Cap Growth Portfolio, at value
(identified cost, $77,989,625) | | $ | 90,793,664 | | |
| Receivable for Fund shares sold | | | 6,975 | | |
| Total assets | | $ | 90,800,639 | | |
| Liabilities | |
| Payable for Fund shares redeemed | | $ | 240,416 | | |
| Payable to affiliate for distribution and service fees | | | 62,174 | | |
| Payable to affiliate for Trustees' fees | | | 417 | | |
| Accrued expenses | | | 79,257 | | |
| Total liabilities | | $ | 382,264 | | |
| Net Assets | | $ | 90,418,375 | | |
| Sources of Net Assets | |
| Paid-in capital | | $ | 209,111,860 | | |
Accumulated net realized loss from Portfolio (computed on
the basis of identified cost) | | | (131,497,524 | ) | |
Net unrealized appreciation from Portfolio (computed on
the basis of identified cost) | | | 12,804,039 | | |
| Total | | $ | 90,418,375 | | |
| Class A Shares | |
| Net Assets | | $ | 24,855,338 | | |
| Shares Outstanding | | | 2,414,258 | | |
Net Asset Value and Redemption Price Per Share
(net assets ÷ shares of beneficial interest outstanding) | | $ | 10.30 | | |
Maximum Offering Price Per Share
(100 ÷ 94.25 of $10.30) | | $ | 10.93 | | |
| Class B Shares | |
| Net Assets | | $ | 47,222,026 | | |
| Shares Outstanding | | | 4,876,008 | | |
Net Asset Value, Offering Price and Redemption Price Per Share
(net assets ÷ shares of beneficial interest outstanding) | | $ | 9.68 | | |
| Class C Shares | |
| Net Assets | | $ | 18,341,011 | | |
| Shares Outstanding | | | 1,900,989 | | |
Net Asset Value, Offering Price and Redemption Price Per Share
(net assets ÷ shares of beneficial interest outstanding) | | $ | 9.65 | | |
| On sales of $50,000 or more, the offering price of Class A shares is reduced. | | | | | |
Statement of Operations
For the Year Ended
October 31, 2005
| Investment Income | |
| Dividends allocated from Portfolio (net of foreign taxes, $5,202) | | $ | 309,255 | | |
| Interest allocated from Portfolio | | | 108,542 | | |
| Expenses allocated from Portfolio | | | (772,477 | ) | |
| Net investment loss from Portfolio | | $ | (354,680 | ) | |
| Expenses | |
| Trustees' fees and expenses | | $ | 1,507 | | |
| Distribution and service fees | |
| Class A | | | 67,986 | | |
| Class B | | | 556,813 | | |
| Class C | | | 214,268 | | |
| Transfer and dividend disbursing agent fees | | | 314,695 | | |
| Registration fees | | | 58,488 | | |
| Printing and postage | | | 37,799 | | |
| Legal and accounting services | | | 20,889 | | |
| Custodian fee | | | 20,868 | | |
| Miscellaneous | | | 11,217 | | |
| Total expenses | | $ | 1,304,530 | | |
| Net investment loss | | $ | (1,659,210 | ) | |
Realized and Unrealized
Gain (Loss) from Portfolio | |
Net realized gain (loss) —
Investment transactions (identified cost basis) | | $ | 15,697,406 | | |
| Foreign currency transactions | | | (2,344 | ) | |
| Net realized gain | | $ | 15,695,062 | | |
Change in unrealized appreciation (depreciation) —
Investments (identified cost basis) | | $ | (5,158,066 | ) | |
| Foreign currency | | | (189 | ) | |
| Net change in unrealized appreciation (depreciation) | | $ | (5,158,255 | ) | |
| Net realized and unrealized gain | | $ | 10,536,807 | | |
| Net increase in net assets from operations | | $ | 8,877,597 | | |
See notes to financial statements
7
Eaton Vance Tax-Managed Small-Cap Growth Fund 1.1 as of October 31, 2005
FINANCIAL STATEMENTS CONT'D
Statements of Changes in Net Assets
Increase (Decrease)
in Net Assets | | Year Ended
October 31, 2005 | | Year Ended
October 31, 2004 | |
From operations —
Net investment loss | | $ | (1,659,210 | ) | | $ | (2,330,552 | ) | |
Net realized gain from investment
transactions, payments by affiliate
and foreign currency transactions | | | 15,695,062 | | | | 9,048,172 | | |
Net change in unrealized appreciation
(depreciation) of investments
and foreign currency | | | (5,158,255 | ) | | | (9,934,437 | ) | |
Net increase (decrease) in net assets
from operations | | $ | 8,877,597 | | | $ | (3,216,817 | ) | |
Transactions in shares of beneficial interest —
Proceeds from sale of shares
Class A | | $ | 479,543 | | | $ | 1,267,142 | | |
| Class B | | | 533,785 | | | | 1,056,138 | | |
| Class C | | | 394,910 | | | | 911,310 | | |
Cost of shares redeemed
Class A | | | (9,789,356 | ) | | | (12,769,324 | ) | |
| Class B | | | (18,896,375 | ) | | | (17,339,046 | ) | |
| Class C | | | (9,188,732 | ) | | | (10,616,048 | ) | |
Net asset value of shares exchanged
Class A | | | 1,537,677 | | | | 1,688,751 | | |
| Class B | | | (1,537,677 | ) | | | (1,688,751 | ) | |
Net decrease in net assets from
Fund share transactions | | $ | (36,466,225 | ) | | $ | (37,489,828 | ) | |
| Net decrease in net assets | | $ | (27,588,628 | ) | | $ | (40,706,645 | ) | |
| Net Assets | |
| At beginning of year | | $ | 118,007,003 | | | $ | 158,713,648 | | |
| At end of year | | $ | 90,418,375 | | | $ | 118,007,003 | | |
Accumulated net
investment loss included
in net assets | |
| At end of year | | $ | — | | | $ | (305,272 | ) | |
See notes to financial statements
8
Eaton Vance Tax-Managed Small-Cap Growth Fund 1.1 as of October 31, 2005
FINANCIAL STATEMENTS CONT'D
Financial Highlights
| | | Class A | |
| | | Year Ended October 31, | |
| | | 2005(1) | | 2004(1) | | 2003(1) | | 2002(1) | | 2001 | |
| Net asset value — Beginning of year | | $ | 9.470 | | | $ | 9.630 | | | $ | 7.620 | | | $ | 9.840 | | | $ | 16.490 | | |
| Income (loss) from operations | |
| Net investment loss | | $ | (0.105 | ) | | $ | (0.107 | ) | | $ | (0.100 | ) | | $ | (0.095 | ) | | $ | (0.110 | ) | |
| Net realized and unrealized gain (loss) | | | 0.935 | | | | (0.053 | ) | | | 2.110 | | | | (2.125 | ) | | | (6.540 | ) | |
| Total income (loss) from operations | | $ | 0.830 | | | $ | (0.160 | ) | | $ | 2.010 | | | $ | (2.220 | ) | | $ | (6.650 | ) | |
| Net asset value — End of year | | $ | 10.300 | | | $ | 9.470 | | | $ | 9.630 | | | $ | 7.620 | | | $ | 9.840 | | |
| Total Return(2) | | | 8.76 | % | | | (1.66 | )%(3) | | | 26.38 | % | | | (22.56 | )% | | | (40.33 | )% | |
| Ratios/Supplemental Data† | |
| Net assets, end of year (000's omitted) | | $ | 24,855 | | | $ | 30,172 | | | $ | 40,514 | | | $ | 44,208 | | | $ | 81,608 | | |
| Ratios (As a percentage of average daily net assets): | |
| Net expenses(4) | | | 1.44 | % | | | 1.37 | % | | | 1.43 | % | | | 1.24 | % | | | 1.16 | % | |
| Net expenses after custodian fee reduction(4) | | | 1.44 | % | | | 1.37 | % | | | 1.43 | % | | | 1.24 | % | | | 1.14 | % | |
| Net investment loss | | | (1.04 | )% | | | (1.12 | )% | | | (1.23 | )% | | | (1.00 | )% | | | (0.83 | )% | |
| Portfolio Turnover(5) | | | — | | | | — | | | | — | | | | — | | | | 22 | % | |
| Portfolio Turnover of the Portfolio | | | 223 | % | | | 282 | % | | | 248 | % | | | 131 | % | | | 38 | %* | |
† The operating expenses of the Fund reflect a reduction of the investment adviser fee of the Portfolio. Had such action not been taken, the net investment loss per share and the ratios would have been the same.
(1) Net investment loss per share was computed using average shares outstanding.
(2) Returns are historical and are calculated by determining the percentage change in net asset value with all distributions reinvested.
(3) The effect of the Fund's net increase from payments by affiliate and net gains (losses), through its investment in the Portfolio, realized on the disposal of investments purchased which did not meet the Portfolio's investment guidelines amounted to less than $0.01 per share and had no effect on total return for the year ended October 31, 2004.
(4) Includes the Fund's share of the Portfolio's allocated expenses.
(5) Portfolio Turnover represents the rate of portfolio activity for the period while the Fund was making investments directly in securities.
* For the period from the Portfolio's start of business, March 1, 2001, to October 31, 2001.
See notes to financial statements
9
Eaton Vance Tax-Managed Small-Cap Growth Fund 1.1 as of October 31, 2005
FINANCIAL STATEMENTS CONT'D
Financial Highlights
| | | Class B | |
| | | Year Ended October 31, | |
| | | 2005(1) | | 2004(1) | | 2003(1) | | 2002(1) | | 2001 | |
| Net asset value — Beginning of year | | $ | 8.980 | | | $ | 9.190 | | | $ | 7.330 | | | $ | 9.540 | | | $ | 16.120 | | |
| Income (loss) from operations | |
| Net investment loss | | $ | (0.170 | ) | | $ | (0.170 | ) | | $ | (0.155 | ) | | $ | (0.161 | ) | | $ | (0.197 | ) | |
| Net realized and unrealized gain (loss) | | | 0.870 | | | | (0.040 | ) | | | 2.015 | | | | (2.049 | ) | | | (6.383 | ) | |
| Total income (loss) from operations | | $ | 0.700 | | | $ | (0.210 | ) | | $ | 1.860 | | | $ | (2.210 | ) | | $ | (6.580 | ) | |
| Net asset value — End of year | | $ | 9.680 | | | $ | 8.980 | | | $ | 9.190 | | | $ | 7.330 | | | $ | 9.540 | | |
| Total Return(2) | | | 7.80 | % | | | (2.28 | )%(3) | | | 25.38 | % | | | (23.16 | )% | | | (40.82 | )% | |
| Ratios/Supplemental Data† | |
| Net assets, end of year (000's omitted) | | $ | 47,222 | | | $ | 62,553 | | | $ | 82,345 | | | $ | 81,353 | | | $ | 132,892 | | |
| Ratios (As a percentage of average daily net assets): | |
| Net expenses(4) | | | 2.19 | % | | | 2.12 | % | | | 2.18 | % | | | 1.99 | % | | | 1.92 | % | |
| Net expenses after custodian fee reduction(4) | | | 2.19 | % | | | 2.12 | % | | | 2.18 | % | | | 1.99 | % | | | 1.90 | % | |
| Net investment loss | | | (1.79 | )% | | | (1.87 | )% | | | (1.98 | )% | | | (1.75 | )% | | | (1.58 | )% | |
| Portfolio Turnover(5) | | | — | | | | — | | | | — | | | | — | | | | 22 | % | |
| Portfolio Turnover of the Portfolio | | | 223 | % | | | 282 | % | | | 248 | % | | | 131 | % | | | 38 | %* | |
† The operating expenses of the Fund reflect a reduction of the investment adviser fee of the Portfolio. Had such action not been taken, the net investment loss per share and the ratios would have been the same.
(1) Net investment loss per share was computed using average shares outstanding.
(2) Returns are historical and are calculated by determining the percentage change in net asset value with all distributions reinvested.
(3) The effect of the Fund's net increase from payments by affiliate and net gains (losses), through its investment in the Portfolio, realized on the disposal of investments purchased which did not meet the Portfolio's investment guidelines amounted to less than $0.01 per share and had no effect on total return for the year ended October 31, 2004.
(4) Includes the Fund's share of the Portfolio's allocated expenses.
(5) Portfolio Turnover represents the rate of portfolio activity for the period while the Fund was making investments directly in securities.
* For the period from the Portfolio's start of business, March 1, 2001, to October 31, 2001.
See notes to financial statements
10
Eaton Vance Tax-Managed Small-Cap Growth Fund 1.1 as of October 31, 2005
FINANCIAL STATEMENTS CONT'D
Financial Highlights
| | | Class C | |
| | | Year Ended October 31, | |
| | | 2005(1) | | 2004(1) | | 2003(1) | | 2002(1) | | 2001 | |
| Net asset value — Beginning of year | | $ | 8.940 | | | $ | 9.160 | | | $ | 7.310 | | | $ | 9.500 | | | $ | 16.050 | | |
| Income (loss) from operations | |
| Net investment loss | | $ | (0.170 | ) | | $ | (0.170 | ) | | $ | (0.154 | ) | | $ | (0.161 | ) | | $ | (0.198 | ) | |
| Net realized and unrealized gain (loss) | | | 0.880 | | | | (0.050 | ) | | | 2.004 | | | | (2.029 | ) | | | (6.352 | ) | |
| Total income (loss) from operations | | $ | 0.710 | | | $ | (0.220 | ) | | $ | 1.850 | | | $ | (2.190 | ) | | $ | (6.550 | ) | |
| Net asset value — End of year | | $ | 9.650 | | | $ | 8.940 | | | $ | 9.160 | | | $ | 7.310 | | | $ | 9.500 | | |
| Total Return(2) | | | 7.94 | % | | | (2.40 | )%(3) | | | 25.31 | % | | | (23.05 | )% | | | (40.81 | )% | |
| Ratios/Supplemental Data† | |
| Net assets, end of year (000's omitted) | | $ | 18,341 | | | $ | 25,282 | | | $ | 35,855 | | | $ | 36,789 | | | $ | 66,550 | | |
| Ratios (As a percentage of average daily net assets): | |
| Net expenses(4) | | | 2.19 | % | | | 2.12 | % | | | 2.18 | % | | | 1.99 | % | | | 1.92 | % | |
| Net expenses after custodian fee reduction(4) | | | 2.19 | % | | | 2.12 | % | | | 2.18 | % | | | 1.99 | % | | | 1.90 | % | |
| Net investment loss | | | (1.79 | )% | | | (1.87 | )% | | | (1.97 | )% | | | (1.75 | )% | | | (1.58 | )% | |
| Portfolio Turnover(5) | | | — | | | | — | | | | — | | | | — | | | | 22 | % | |
| Portfolio Turnover of the Portfolio | | | 223 | % | | | 282 | % | | | 248 | % | | | 131 | % | | | 38 | %* | |
† The operating expenses of the Fund reflect a reduction of the investment adviser fee of the Portfolio. Had such action not been taken, the net investment loss per share and the ratios would have been the same.
(1) Net investment loss per share was computed using average shares outstanding.
(2) Returns are historical and are calculated by determining the percentage change in net asset value with all distributions reinvested.
(3) The effect of the Fund's net increase from payments by affiliate and net gains (losses), through its investment in the Portfolio, realized on the disposal of investments purchased which did not meet the Portfolio's investment guidelines amounted to less than $0.01 per share and had no effect on total return for the year ended October 31, 2004.
(4) Includes the Fund's share of the Portfolio's allocated expenses.
(5) Portfolio Turnover represents the rate of portfolio activity for the period while the Fund was making investments directly in securities.
* For the period from the Portfolio's start of business, March 1, 2001, to October 31, 2001.
See notes to financial statements
11
Eaton Vance Tax-Managed Small-Cap Growth Fund 1.1 as of October 31, 2005
NOTES TO FINANCIAL STATEMENTS
1 Significant Accounting Policies
Eaton Vance Tax-Managed Small-Cap Growth Fund 1.1 (the Fund) is a diversified series of Eaton Vance Mutual Funds Trust (the Trust). The Trust is an entity of the type commonly known as a Massachusetts business trust and is registered under the Investment Company Act of 1940, as amended, as an open-end management investment company. The Fund has three classes of shares. Class A shares are generally sold subject to a sales charge imposed at time of purchase. Class B and Class C shares are sold at net asset value and are subject to a contingent deferred sales charge (see Note 6). The Trustees have adopted a conversion feature pursuant to which Class B shares of the Fund automatically convert to Class A shares eight years after their purchase as described in the Fund's prospectus. Each class represents a pro-rata interest in the Fund, but votes separately on class-specific matters and (as noted below) is subject to different expense s. Realized and unrealized gains and losses and net investment income and losses, other than class-specific expenses, are allocated daily to each class of shares based on the relative net assets of each class to the total net assets of the Fund. Each class of shares differs in its distribution plan and certain other class-specific expenses. The Fund invests all of its investable assets in interests of the Tax-Managed Small-Cap Growth Portfolio (the Portfolio), a New York Trust, having the same investment objective as the Fund. The value of the Fund's investment in the Portfolio reflects the Fund's proportionate interest in the net assets of the Portfolio (59.3% at October 31, 2005). The performance of the Fund is directly affected by the performance of the Portfolio. The financial statements of the Portfolio, including the Portfolio of Investments, are included elsewhere in this report and should be read in conjunction with the Fund's financial statements.
The following is a summary of significant accounting policies consistently followed by the Fund in the preparation of its financial statements. The policies are in conformity with accounting principles generally accepted in the United States of America.
A Investment Valuation — Valuation of securities by the Portfolio is discussed in Note 1A of the Portfolio's Notes to Financial Statements which are included elsewhere in this report.
B Income — The Fund's net investment income or loss consists of the Fund's pro-rata share of the net investment income or loss of the Portfolio, less all actual and accrued expenses of the Fund determined in accordance with accounting principles generally accepted in the United States of America.
C Expenses — The majority of expenses of the Trust are directly identifiable to an individual fund. Expenses which are not readily identifiable to a specific fund are allocated taking into consideration, among other things, the nature and type of expense and the relative size of the fund.
D Indemnifications — Under the Trust's organizational documents, its officers and Trustees may be indemnified against certain liabilities and expenses arising out of the performance of their duties to the Fund, and shareholders are indemnified against personal liability for obligations of the Trust. Additionally, in the normal course of business, the Fund enters into agreements with service providers that may contain indemnification clauses. The Fund's maximum exposure under these arrangements is unknown as this would involve future claims that may be made against the Fund that have not yet occurred.
E Federal Taxes — The Fund's policy is to comply with the provisions of the Internal Revenue Code applicable to regulated investment companies and to distribute to shareholders each year all of its taxable income, including any net realized gain on investments. Accordingly, no provision for federal income or excise tax is necessary. At October 31, 2005, the Fund, for federal income tax purposes, had a capital loss carryover of $134,115,554 which will reduce the taxable income arising from future net realized gain on investments, if any, to the extent permitted by the Internal Revenue Code and thus will reduce the amount of distributions to shareholders which would otherwise be necessary to relieve the Fund of any liability for federal income or excise tax. Such capital lo ss carryover will expire on October 31, 2008, ($1,708,181), on October 31, 2009, ($76,461,635), and on October 31, 2010, ($55,945,738).
F Expense Reduction — Investors Bank & Trust Company (IBT) serves as custodian to the Fund and the Portfolio. Pursuant to the respective custodian agreements, IBT receives a fee reduced by credits which are determined based on the average daily cash balances the Fund or the Portfolio maintains with IBT. All credit balances used to reduce the Fund's custodian fees are reported as a reduction of total expenses in the Statement of Operations.
G Other — Investment transactions are accounted for on a trade-date basis. Dividends to shareholders are recorded on the ex-dividend date.
12
Eaton Vance Tax-Managed Small-Cap Growth Fund 1.1 as of October 31, 2005
NOTES TO FINANCIAL STATEMENTS CONT'D
H Use of Estimates — The preparation of the financial statements in conformity with accounting principles generally accepted in the United States of America requires management to make estimates and assumptions that affect the reported amounts of assets and liabilities at the date of the financial statements and the reported amounts of income and expense during the reporting period. Actual results could differ from those estimates.
2 Distributions to Shareholders
It is the present policy of the Fund to make at least one distribution annually (normally in December) of all or substantially all of its net investment income, if any, and at least one distribution annually of all or substantially all of its net realized capital gains (reduced by available capital loss carryforwards from prior years, if any). Distributions are declared separately for each class of shares. Shareholders may reinvest all distributions in additional shares of the same class of the Fund at the net asset value as of the close of business on the reinvestment date. Distributions are paid in the form of additional shares of the same class of the Fund, or at the election of the shareholder, in cash. The Fund distinguishes between distributions on a tax basis and a financial reporting basis. Accounting principles generally accepted in the United States of America require that only distributions in excess of tax basis earn ings and profits be reported in the financial statements as a return of capital. Permanent differences between book and tax accounting relating to distributions are reclassified to paid–in capital.
During the year ended October 31, 2005, accumulated paid-in capital was decreased by $1,865,343, net investment loss was decreased by $1,964,482, and accumulated net realized loss was increased by $99,139 primarily due to differences between book and tax accounting treatment of net operating losses, foreign currency gains and losses and passive foreign investment companies. This change had no effect on the net assets or the net asset value per share.
As of October 31, 2005, the components of distributable earnings (accumulated losses) on a tax basis were as follows:
| Capital loss carryforwards | | $ | (134,115,554 | ) | |
| Unrealized appreciation | | $ | 15,422,069 | | |
3 Shares of Beneficial Interest
The Fund's Declaration of Trust permits the Trustees to issue an unlimited number of full and fractional shares of beneficial interest (without par value). Transactions in Fund shares were as follows:
| | | Year Ended October 31, | |
| Class A | | 2005 | | 2004 | |
| Sales | | | 47,908 | | | | 133,211 | | |
| Redemptions | | | (970,900 | ) | | | (1,333,450 | ) | |
| Exchange from Class B shares | | | 152,323 | | | | 177,497 | | |
| Net decrease | | | (770,669 | ) | | | (1,022,742 | ) | |
| | | Year Ended October 31, | |
| Class B | | 2005 | | 2004 | |
| Sales | | | 56,356 | | | | 115,435 | | |
| Redemptions | | | (1,985,600 | ) | | | (1,918,120 | ) | |
| Exchange to Class A shares | | | (161,630 | ) | | | (186,494 | ) | |
| Net decrease | | | (2,090,874 | ) | | | (1,989,179 | ) | |
| | | Year Ended October 31, | |
| Class C | | 2005 | | 2004 | |
| Sales | | | 41,701 | | | | 98,653 | | |
| Redemptions | | | (967,142 | ) | | | (1,186,433 | ) | |
| Net decrease | | | (925,441 | ) | | | (1,087,780 | ) | |
4 Transactions with Affiliates
Eaton Vance Management (EVM) serves as the administrator to the Fund, but receives no compensation. The Portfolio has engaged Boston Management and Research (BMR), a subsidiary of EVM, to render investment advisory services. See Note 2 of the Portfolio's Notes to Financial Statements which are included elsewhere in this report. EVM serves as the sub-transfer agent of the Fund and receives from the transfer agent an aggregate fee based upon the actual expenses incurred by EVM in the performance of those services. For the year ended October 31, 2005, EVM earned $23,387 in sub-transfer agent fees.
Except for Trustees of the Fund and the Portfolio who are not members of EVM's or BMR's organization, officers and Trustees receive remuneration for their services to the Fund out of the investment adviser fee earned by BMR. Trustees of the Fund who are not affiliated with EVM or BMR may elect to defer receipt of all or a percentage of their annual fees in accordance with the terms of the Trustees Deferred
13
Eaton Vance Tax-Managed Small-Cap Growth Fund 1.1 as of October 31, 2005
NOTES TO FINANCIAL STATEMENTS CONT'D
Compensation Plan. For the year ended October 31, 2005, no significant amounts have been deferred.
Eaton Vance Distributors, Inc. (EVD), a subsidiary of EVM and the Fund's principal underwriter, received $2,402 as its portion of the sales charge on sales of Class A shares for the year ended October 31, 2005.
Certain officers and Trustees of the Fund and Portfolio are officers of the above organizations.
5 Distribution and Service Plans
The Fund has in effect distribution plans for Class B shares (Class B Plan) and Class C shares (Class C Plan) pursuant to Rule 12b-1 under the Investment Company Act of 1940 and a service plan for Class A shares (Class A Plan) (collectively, the Plans). The Class B and Class C Plans require the Fund to pay EVD amounts equal to 1/365 of 0.75% of the Fund's average daily net assets attributable to Class B and Class C shares for providing ongoing distribution services and facilities to the Fund. The Fund will automatically discontinue payments to EVD during any period in which there are no outstanding Uncovered Distribution Charges, which are equivalent to the sum of (i) 5% and 6.25% of the aggregate amount received by the Fund for the Class B and Class C shares sold, respectively, plus (ii) interest calculated by applying the rate of 1% over the prevailing prime rate to the outstanding balance of Uncovered Distribution Charges of EVD of each respective class, reduced by the aggregate amount of contingent deferred sales charges (see Note 6) and daily amounts theretofore paid to EVD by each respective class. The fund paid or accrued $417,610 and $160,701 for Class B and Class C shares, respectively, to or payable to EVD for the year ended October 31, 2005, representing 0.75% of the average daily net assets for Class B and Class C shares, respectively. At October 31, 2005, the amount of Uncovered Distribution Charges of EVD calculated under the Plans was approximately $5,839,000 and $8,550,000 for Class B and Class C shares, respectively.
The Plans authorize the Fund to make payments of service fees to EVD, investment dealers and other persons amounting to 0.25% of the Fund's average daily net assets attributable to Class A, Class B, and Class C shares for each fiscal year. Service fee payments will be made for personal services and/or the maintenance of shareholder accounts. Service fees are separate and distinct from the sales commissions and distribution fees payable by the Fund to EVD and, as such, are not subject to automatic discontinuance when there are no outstanding Uncovered Distribution Charges of EVD. Service fee payments for the year ended October 31, 2005 amounted to $67,986, $139,203 and $53,567 for Class A, Class B, and Class C shares, respectively.
6 Contingent Deferred Sales Charge
A contingent deferred sales charge (CDSC) generally is imposed on redemptions of Class B shares made within six years of purchase and on redemptions of Class C shares made within one year of purchase. Generally, the CDSC is based upon the lower of the net asset value at date of redemption or date of purchase. No charge is levied on shares acquired by reinvestment of dividends or capital gain distributions. Class A shares may be subject to a 1% CDSC if redeemed within one year of purchase (depending upon the circumstances of purchase). The Class B CDSC is imposed at declining rates that begin at 5% in the case of redemptions in the first and second year after purchase, declining one percentage point in each subsequent year. Class C shares will be subject to a 1% CDSC if redeemed within one year of purchase.
No CDSC is levied on shares which have been sold to EVM, its affiliates, or their respective employees or clients and may be waived under certain other limited conditions. CDSC pertaining to Class B and Class C redemptions are paid to EVD to reduce the amount of Uncovered Distribution Charges calculated under the Class B and Class C Plans, respectively (see Note 5). CDSC assessed on Class B and Class C shares when no Uncovered Distribution Charges exist for the respective classes will be credited to the Fund. EVD received approximately $146,000 and $1,000 of CDSC paid by shareholders for Class B shares and Class C shares, respectively for the year ended October 31, 2005. EVD did not receive any CDSC for Class A shares for the year ended October 31, 2005.
7 Investment Transactions
Increases and decreases in the Fund's investment in the Portfolio aggregated $1,405,397 and $39,195,516 respectively for the year ended October 31, 2005.
8 Subsequent Event
On November 14, 2005, the Board of Trustees of the Trust unanimously approved the merger of Eaton Vance Tax-Managed Small-Cap Growth Fund 1.2, another series of the Trust, into Eaton Vance Tax-Managed Small-Cap Growth Fund 1.1. Specifically, the Board approved an Agreement and Plan of Reorganization ("Plan of Reorganization") with respect to the merger. Under the terms of the Plan of Reorganization, Eaton Vance Tax-Managed Small-Cap Growth Fund 1.2 will transfer all of its assets to Eaton Vance Tax-Managed Small-Cap Growth Fund 1.1, and Eaton Vance Tax-Managed Small-Cap Growth Fund 1.1 will assume the liabilities of Eaton Vance Tax-Managed Small-Cap Growth Fund 1.2. It is expected that the Reorganization will be treated as a tax-free reorganization for federal tax purposes.
14
Eaton Vance Tax-Managed Small-Cap Growth Fund 1.1 as of October 31, 2005
REPORT OF INDEPENDENT REGISTERED PUBLIC ACCOUNTING FIRM
To the Trustees of Eaton Vance Mutual Funds Trust and Shareholders of Eaton Vance Tax-Managed Small-Cap Growth Fund 1.1:
We have audited the accompanying statement of assets and liabilities of Eaton Vance Tax-Managed Small-Cap Growth Fund 1.1 (the Fund) (one of the series of Eaton Vance Mutual Funds Trust) as of October 31, 2005, and the related statement of operations for the year then ended, the statements of changes in net assets for each of the two years in the period then ended and the financial highlights for each of the five years in the period then ended. These financial statements and financial highlights are the responsibility of the Fund's management. Our responsibility is to express an opinion on these financial statements and financial highlights based on our audits.
We conducted our audits in accordance with standards of the Public Company Accounting Oversight Board (United States). Those standards require that we plan and perform the audits to obtain reasonable assurance about whether the financial statements and financial highlights are free of material misstatement. The Fund is not required to have, nor were we engaged to perform, an audit of its internal control over financial reporting. An audit includes consideration of internal control over financial reporting as a basis for designing audit procedures that are appropriate in the circumstances, but not for the purpose of expressing an opinion on the effectiveness of the Fund's internal control over financial reporting. Accordingly, we express no such opinion. An audit also includes examining, on a test basis, evidence supporting the amounts and disclosures in the financial statements, assessing the accounting principles used and signi ficant estimates made by management, as well as evaluating the overall financial statement presentation. We believe that our audits provide a reasonable basis for our opinion.
In our opinion, such financial statements and financial highlights referred to above present fairly, in all material respects, the financial position of Eaton Vance Tax-Managed Small-Cap Growth Fund 1.1 as of October 31, 2005, the results of its operations for the year then ended, the changes in its net assets for each of the two years in the period then ended, and the financial highlights for each of the five years in the period then ended, in conformity with accounting principles generally accepted in the United States of America.
DELOITTE & TOUCHE LLP
Boston, Massachusetts
December 19, 2005
15
Tax-Managed Small-Cap Growth Portfolio as of October 31, 2005
PORTFOLIO OF INVESTMENTS
| Common Stocks — 92.7% | |
| Security | | Shares | | Value | |
| Aerospace & Defense — 2.5% | |
| Aviall, Inc.(1) | | | 46,000 | | | $ | 1,451,300 | | |
| DRS Technologies, Inc. | | | 31,700 | | | | 1,561,542 | | |
| Teledyne Technologies, Inc.(1) | | | 21,500 | | | | 758,090 | | |
| | | $ | 3,770,932 | | |
| Air Freight & Logistics — 1.7% | |
| Hub Group, Inc., Class A(1) | | | 35,000 | | | $ | 1,272,950 | | |
| UTI Worldwide, Inc.(2) | | | 16,400 | | | | 1,402,856 | | |
| | | $ | 2,675,806 | | |
| Beverages — 0.7% | |
| Cott Corp.(1)(2) | | | 26,900 | | | $ | 398,389 | | |
| Hansen Natural Corp.(1) | | | 13,930 | | | | 703,744 | | |
| | | $ | 1,102,133 | | |
| Biotechnology — 2.0% | |
| Abgenix, Inc.(1) | | | 166,000 | | | $ | 1,726,400 | | |
| United Therapeutics Corp.(1) | | | 17,400 | | | | 1,285,164 | | |
| | | $ | 3,011,564 | | |
| Capital Markets — 2.0% | |
| Affiliated Managers Group, Inc.(1) | | | 15,400 | | | $ | 1,181,950 | | |
| Greenhill & Co., Inc. | | | 40,800 | | | | 1,956,360 | | |
| | | $ | 3,138,310 | | |
| Commercial Services & Supplies — 2.0% | |
| Harland (John H.) Co. | | | 23,300 | | | $ | 969,047 | | |
| Resources Connection, Inc.(1) | | | 70,700 | | | | 2,018,485 | | |
| | | $ | 2,987,532 | | |
| Computers & Peripherals — 3.8% | |
| Novatel Wireless, Inc.(1) | | | 210,600 | | | $ | 2,674,620 | | |
| Palm, Inc.(1) | | | 81,722 | | | | 2,099,438 | | |
| Synaptics, Inc.(1) | | | 48,090 | | | | 1,117,131 | | |
| | | $ | 5,891,189 | | |
| Consumer Finance — 1.3% | |
| Student Loan Corp. (The) | | | 9,300 | | | $ | 2,038,560 | | |
| | | $ | 2,038,560 | | |
| Security | | Shares | | Value | |
| Diversified Consumer Services — 2.4% | |
| DeVry, Inc.(1) | | | 86,900 | | | $ | 1,963,940 | | |
| Education Management Corp.(1) | | | 25,700 | | | | 792,588 | | |
| Regis Corp. | | | 24,900 | | | | 955,164 | | |
| | | $ | 3,711,692 | | |
| Electric Utilities — 0.7% | |
| Westar Energy, Inc. | | | 47,500 | | | $ | 1,049,750 | | |
| | | $ | 1,049,750 | | |
| Electrical Equipment — 2.1% | |
| AMETEK, Inc. | | | 34,900 | | | $ | 1,421,477 | | |
| Roper Industries, Inc. | | | 45,800 | | | | 1,726,660 | | |
| | | $ | 3,148,137 | | |
| Energy Equipment & Services — 1.1% | |
| Todco, Class A(1) | | | 38,800 | | | $ | 1,736,300 | | |
| | | $ | 1,736,300 | | |
| Food & Staples Retailing — 1.0% | |
| Longs Drugstores Corp. | | | 37,000 | | | $ | 1,543,270 | | |
| | | $ | 1,543,270 | | |
| Health Care Equipment & Supplies — 7.2% | |
| Aspect Medical Systems, Inc.(1) | | | 53,100 | | | $ | 1,732,122 | | |
| DJ Orthopedics, Inc.(1) | | | 46,800 | | | | 1,360,944 | | |
| Hologic, Inc.(1) | | | 36,500 | | | | 2,024,290 | | |
| IDEXX Laboratories, Inc.(1) | | | 17,700 | | | | 1,241,301 | | |
| Intuitive Surgical, Inc.(1) | | | 18,100 | | | | 1,606,013 | | |
| Respironics, Inc.(1) | | | 53,100 | | | | 1,904,697 | | |
| Ventana Medical Systems, Inc.(1) | | | 30,400 | | | | 1,165,232 | | |
| | | $ | 11,034,599 | | |
| Health Care Providers & Services — 8.0% | |
| Chemed Corp. | | | 38,500 | | | $ | 1,851,080 | | |
| Community Health Systems, Inc.(1) | | | 38,200 | | | | 1,417,602 | | |
| eResearch Technology, Inc.(1) | | | 81,400 | | | | 1,166,462 | | |
| Health Net, Inc.(1) | | | 42,700 | | | | 2,000,068 | | |
| LifePoint Hospitals, Inc.(1) | | | 18,000 | | | | 703,800 | | |
| Pediatrix Medical Group, Inc.(1) | | | 13,000 | | | | 1,001,780 | | |
| Psychiatric Solutions, Inc.(1) | | | 17,900 | | | | 979,130 | | |
| United Surgical Partners International, Inc.(1) | | | 49,000 | | | | 1,756,650 | | |
See notes to financial statements
16
Tax-Managed Small-Cap Growth Portfolio as of October 31, 2005
PORTFOLIO OF INVESTMENTS CONT'D
| Security | | Shares | | Value | |
| Health Care Providers & Services (continued) | |
| VCA Antech, Inc.(1) | | | 53,300 | | | $ | 1,375,140 | | |
| | | $ | 12,251,712 | | |
| Hotels, Restaurants & Leisure — 6.1% | |
| Aztar Corp.(1) | | | 44,100 | | | $ | 1,326,087 | | |
| Cheesecake Factory, Inc. (The)(1) | | | 20,900 | | | | 717,288 | | |
| Choice Hotels International, Inc. | | | 44,200 | | | | 1,462,578 | | |
| CKE Restaurants, Inc.(1) | | | 60,800 | | | | 773,376 | | |
| Gaylord Entertainment Co.(1) | | | 33,600 | | | | 1,326,528 | | |
| Penn National Gaming, Inc.(1) | | | 20,704 | | | | 611,803 | | |
| Sonic Corp.(1) | | | 27,300 | | | | 790,062 | | |
| Starwood Hotels & Resorts Worldwide, Inc. | | | 27,200 | | | | 1,589,296 | | |
| Station Casinos, Inc. | | | 11,600 | | | | 743,560 | | |
| | | $ | 9,340,578 | | |
| Household Durables — 0.3% | |
| Jarden Corp.(1) | | | 11,950 | | | $ | 403,790 | | |
| | | $ | 403,790 | | |
| Household Products — 0.5% | |
| Central Garden & Pet Co.(1) | | | 18,300 | | | $ | 784,521 | | |
| | | $ | 784,521 | | |
| Insurance — 1.7% | |
| Philadelphia Consolidated Holding Corp.(1) | | | 12,300 | | | $ | 1,183,998 | | |
| Stewart Information Services Corp. | | | 28,900 | | | | 1,471,877 | | |
| | | $ | 2,655,875 | | |
| Internet Software & Services — 0.5% | |
| SINA Corp.(1)(2) | | | 32,537 | | | $ | 824,813 | | |
| | | $ | 824,813 | | |
| IT Services — 5.8% | |
| Cognizant Technology Solutions Corp.(1) | | | 34,300 | | | $ | 1,508,514 | | |
| Euronet Worldwide, Inc.(1) | | | 62,900 | | | | 1,767,490 | | |
| MoneyGram International, Inc. | | | 100,300 | | | | 2,437,290 | | |
| SI International, Inc.(1) | | | 55,000 | | | | 1,587,850 | | |
| SRA International, Inc., Class A(1) | | | 46,600 | | | | 1,529,412 | | |
| | | $ | 8,830,556 | | |
| Security | | Shares | | Value | |
| Machinery — 2.7% | |
| Actuant Corp., Class A | | | 37,100 | | | $ | 1,806,770 | | |
| Bucyrus International, Inc., Class A | | | 22,200 | | | | 922,410 | | |
| Joy Global, Inc. | | | 32,000 | | | | 1,467,840 | | |
| | | $ | 4,197,020 | | |
| Media — 2.0% | |
| Central European Media Enterprises, Ltd.(1)(2) | | | 64,400 | | | $ | 2,993,956 | | |
| | | $ | 2,993,956 | | |
| Metals & Mining — 0.1% | |
| Formation Capital Corp.(1)(2)(3)(4) | | | 400,000 | | | $ | 77,996 | | |
| | | $ | 77,996 | | |
| Multi-Utilities — 1.0% | |
| CMS Energy Corp.(1) | | | 101,100 | | | $ | 1,507,401 | | |
| | | $ | 1,507,401 | | |
| Oil, Gas & Consumable Fuels — 9.4% | |
| Alon USA Energy, Inc.(1) | | | 95,074 | | | $ | 1,853,943 | | |
| Denbury Resources, Inc.(1) | | | 44,300 | | | | 1,932,809 | | |
| Goodrich Petroleum Corp.(1) | | | 81,566 | | | | 1,818,922 | | |
| Peabody Energy Corp. | | | 30,700 | | | | 2,399,512 | | |
| Quicksilver Resources, Inc.(1) | | | 36,900 | | | | 1,429,137 | | |
| Southwestern Energy Co.(1) | | | 35,500 | | | | 2,575,170 | | |
| Vintage Petroleum, Inc. | | | 45,000 | | | | 2,335,050 | | |
| | | $ | 14,344,543 | | |
| Personal Products — 1.0% | |
| Chattem, Inc.(1) | | | 45,415 | | | $ | 1,498,695 | | |
| | | $ | 1,498,695 | | |
| Pharmaceuticals — 2.8% | |
| Cypress Bioscience, Inc. | | | 147,500 | | | $ | 746,350 | | |
| Hi-Tech Pharmacal Co., Inc.(1) | | | 28,600 | | | | 1,073,930 | | |
| MGI Pharma, Inc.(1) | | | 36,800 | | | | 690,368 | | |
| Penwest Pharmaceuticals Co.(1) | | | 69,500 | | | | 1,102,270 | | |
| Shire Pharmaceuticals Group PLC ADR | | | 20,300 | | | | 727,552 | | |
| | | $ | 4,340,470 | | |
See notes to financial statements
17
Tax-Managed Small-Cap Growth Portfolio as of October 31, 2005
PORTFOLIO OF INVESTMENTS CONT'D
| Security | | Shares | | Value | |
| Real Estate — 2.4% | |
| Strategic Hotel Capital, Inc. | | | 71,200 | | | $ | 1,209,688 | | |
| Taubman Centers, Inc. | | | 42,500 | | | | 1,401,225 | | |
| Trizec Properties, Inc. | | | 48,600 | | | | 1,081,350 | | |
| | | $ | 3,692,263 | | |
| Semiconductors & Semiconductor Equipment — 5.1% | |
| Advanced Analogic Technologies, Inc.(1) | | | 131,435 | | | $ | 1,432,641 | | |
| Advanced Energy Industries, Inc.(1) | | | 140,249 | | | | 1,507,677 | | |
| Atheros Communications, Inc.(1) | | | 160,000 | | | | 1,387,200 | | |
| Brooks Automation, Inc.(1) | | | 51,400 | | | | 601,894 | | |
| Ikanos Communications(1) | | | 12,880 | | | | 202,989 | | |
| Intersil Corp., Class A | | | 50,300 | | | | 1,144,828 | | |
| Veeco Instruments, Inc.(1) | | | 99,900 | | | | 1,587,411 | | |
| | | $ | 7,864,640 | | |
| Software — 5.1% | |
| Activision, Inc.(1) | | | 120,397 | | | $ | 1,898,660 | | |
| Blackbaud, Inc. | | | 60,700 | | | | 874,080 | | |
| i2 Technologies, Inc.(1) | | | 128,700 | | | | 1,572,714 | | |
| Intellisync Corp.(1) | | | 317,700 | | | | 1,381,995 | | |
| MICROS Systems, Inc.(1) | | | 33,100 | | | | 1,519,952 | | |
| NAVTEQ, Corp.(1) | | | 14,100 | | | | 551,592 | | |
| | | $ | 7,798,993 | | |
| Specialty Retail — 1.9% | |
| Hibbet Sporting Goods, Inc.(1) | | | 60,600 | | | $ | 1,589,538 | | |
| O'Reilly Automotive, Inc.(1) | | | 47,100 | | | | 1,328,220 | | |
| | | $ | 2,917,758 | | |
| Textiles, Apparel & Luxury Goods — 1.5% | |
| Gildan Activewear, Inc.(1)(2) | | | 41,364 | | | $ | 1,442,363 | | |
| Warnaco Group, Inc. (The)(1) | | | 35,200 | | | | 798,336 | | |
| | | $ | 2,240,699 | | |
| Thrifts & Mortgage Finance — 1.6% | |
| IndyMac Bancorp, Inc. | | | 42,900 | | | $ | 1,601,457 | | |
| WSFS Financial Corp. | | | 14,400 | | | | 892,080 | | |
| | | $ | 2,493,537 | | |
| Security | | Shares | | Value | |
| Wireless Telecommunication Services — 2.7% | |
| AO VimpelCom ADR(1) | | | 18,100 | | | $ | 724,000 | | |
| NII Holdings, Inc., Class B(1) | | | 40,700 | | | | 3,374,843 | | |
| | | $ | 4,098,843 | | |
Total Common Stocks
(identified cost $120,281,562) | | | | | | $ | 141,998,433 | | |
| Special Warrants — 0.1% | |
| Security | | Shares | | Value | |
| Metals & Mining — 0.1% | |
| Western Exploration and Development, Ltd.(1)(3)(4) | | | 600,000 | | | $ | 180,000 | | |
| | | $ | 180,000 | | |
Total Special Warrants
(identified cost $480,000) | | | | | | $ | 180,000 | | |
| Private Placements — 0.0% | |
| Security | | Shares | | Value | |
| Metals & Mining — 0.0% | |
| Nevada Pacific Mining Co.(1)(3)(4) | | | 80,000 | | | $ | 56,000 | | |
| | | $ | 56,000 | | |
Total Private Placements
(identified cost $80,000) | | | | | | $ | 56,000 | | |
| Commercial Paper — 5.6% | |
| Security | | Principal
Amount
(000's omitted) | | Value | |
| General Electric Capital Corp., 4.02%, 11/1/05 | | $ | 7,248 | | | $ | 7,248,000 | | |
| Prudential Financial, Inc., 4.02%, 11/1/05 | | | 1,237 | | | | 1,237,000 | | |
Total Commercial Paper
(at amortized cost, $8,485,000) | | | | | | $ | 8,485,000 | | |
See notes to financial statements
18
Tax-Managed Small-Cap Growth Portfolio as of October 31, 2005
PORTFOLIO OF INVESTMENTS CONT'D
| Short-Term Investments — 1.3% | |
| Security | | Principal
Amount
(000's omitted) | | Value | |
Investors Bank and Trust Company Time Deposit,
4.03%, 11/1/05 | | $ | 2,000 | | | $ | 2,000,000 | | |
Total Short-Term Investments
(at amortized cost, $2,000,000) | | | | $ | 2,000,000 | | |
Total Investments — 99.7%
(identified cost $131,326,562) | | | | $ | 152,719,433 | | |
| Other Assets, Less Liabilities — 0.3% | | | | $ | 401,578 | | |
| Net Assets — 100.0% | | | | $ | 153,121,011 | | |
ADR - American Depository Receipt
(1) Non-income producing security.
(2) Foreign security.
(3) Restricted security.
(4) Security valued at fair value using methods determined in good faith by or at the direction of the Trustees of the Portfolio.
| Country Concentration of Portfolio | |
| Country | | Percentage of
Total Investments | | Value | |
| United States | | | 94.4 | % | | $ | 144,127,509 | | |
| Bermuda | | | 2.0 | % | | | 2,993,956 | | |
| United Kingdom | | | 1.4 | % | | | 2,130,408 | | |
| Canada | | | 1.2 | % | | | 1,918,747 | | |
| Cayman Islands | | | 0.5 | % | | | 824,813 | | |
| Russia | | | 0.5 | % | | | 724,000 | | |
| | | | 100 | % | | $ | 152,719,433 | | |
See notes to financial statements
19
Tax-Managed Small-Cap Growth Portfolio as of October 31, 2005
FINANCIAL STATEMENTS
Statement of Assets and Liabilities
As of October 31, 2005
| Assets | |
| Investments, at value (identified cost, $131,326,562) | | $ | 152,719,433 | | |
| Cash | | | 2,073 | | |
| Receivable for investments sold | | | 2,875,564 | | |
| Dividends and interest receivable | | | 3,939 | | |
| Total assets | | $ | 155,601,009 | | |
| Liabilities | |
| Payable for investments purchased | | $ | 2,338,059 | | |
| Payable to affiliate for investment advisory fees | | | 80,520 | | |
| Payable to affiliate for Trustees' fees | | | 1,003 | | |
| Accrued expenses | | | 60,416 | | |
| Total liabilities | | $ | 2,479,998 | | |
| Net Assets applicable to investors' interest in Portfolio | | $ | 153,121,011 | | |
| Sources of Net Assets | |
| Net proceeds from capital contributions and withdrawals | | $ | 131,728,140 | | |
| Net unrealized appreciation (computed on the basis of identified cost) | | | 21,392,871 | | |
| Total | | $ | 153,121,011 | | |
Statement of Operations
For the Year Ended
October 31, 2005
| Investment Income | |
| Dividends (net of foreign taxes, $8,442) | | $ | 498,229 | | |
| Interest | | | 176,074 | | |
| Total investment income | | $ | 674,303 | | |
| Expenses | |
| Investment adviser fee | | $ | 1,052,955 | | |
| Trustees' fees and expenses | | | 4,469 | | |
| Custodian fee | | | 138,439 | | |
| Legal and accounting services | | | 44,569 | | |
| Miscellaneous | | | 11,477 | | |
| Total expenses | | $ | 1,251,909 | | |
Deduct —
Reduction of custodian fee | | $ | 18 | | |
| Reduction of investment adviser fee | | | 7,967 | | |
| Total expense reductions | | $ | 7,985 | | |
| Net expenses | | $ | 1,243,924 | | |
| Net investment loss | | $ | (569,621 | ) | |
| Realized and Unrealized Gain (Loss) | |
Net realized gain (loss) —
Investment transactions (identified cost basis) | | $ | 22,772,180 | | |
| Foreign currency transactions | | | (3,754 | ) | |
| Net realized gain | | $ | 22,768,426 | | |
Change in unrealized appreciation (depreciation) —
Investments (identified cost basis) | | $ | (6,290,258 | ) | |
| Foreign currency | | | (96 | ) | |
| Net change in unrealized appreciation (depreciation) | | $ | (6,290,354 | ) | |
| Net realized and unrealized gain | | $ | 16,478,072 | | |
| Net increase in net assets from operations | | $ | 15,908,451 | | |
See notes to financial statements
20
Tax-Managed Small-Cap Growth Portfolio as of October 31, 2005
FINANCIAL STATEMENTS CONT'D
Statements of Changes in Net Assets
Increase (Decrease)
in Net Assets | | Year Ended
October 31, 2005 | | Year Ended
October 31, 2004 | |
From operations —
Net investment loss | | $ | (569,621 | ) | | $ | (1,027,824 | ) | |
Net realized gain from investment
transactions, payments by affiliate
and foreign currency transactions | | | 22,768,426 | | | | 10,299,688 | | |
Net change in unrealized
appreciation (depreciation)
of investments and foreign currency | | | (6,290,354 | ) | | | (11,832,647 | ) | |
Net increase (decrease) in net assets
from operations | | $ | 15,908,451 | | | $ | (2,560,783 | ) | |
Capital transactions —
Contributions | | $ | 5,377,839 | | | $ | 14,945,367 | | |
| Withdrawals | | | (48,942,689 | ) | | | (58,309,543 | ) | |
Net decrease in net assets from
capital transactions | | $ | (43,564,850 | ) | | $ | (43,364,176 | ) | |
| Net decrease in net assets | | $ | (27,656,399 | ) | | $ | (45,924,959 | ) | |
| Net Assets | |
| At beginning of year | | $ | 180,777,410 | | | $ | 226,702,369 | | |
| At end of year | | $ | 153,121,011 | | | $ | 180,777,410 | | |
See notes to financial statements
21
Tax-Managed Small-Cap Growth Portfolio as of October 31, 2005
FINANCIAL STATEMENTS CONT'D
Supplementary Data
| | | Year Ended October 31, | | Period Ended | |
| | | 2005 | | 2004 | | 2003 | | 2002 | | October 31, 2001(1) | |
| Ratios/Supplemental Data† | |
| Ratios (As a percentage of average daily net assets): | |
| Net expenses | | | 0.74 | % | | | 0.75 | % | | | 0.73 | % | | | 0.73 | % | | | 0.70 | %(2) | |
| Net expenses after custodian fee reduction | | | 0.74 | % | | | 0.75 | % | | | 0.73 | % | | | 0.73 | % | | | 0.68 | %(2) | |
| Net investment loss | | | (0.34 | )% | | | (0.50 | )% | | | (0.53 | )% | | | (0.49 | )% | | | (0.48 | )%(2) | |
| Portfolio Turnover | | | 223 | % | | | 282 | % | | | 248 | % | | | 131 | % | | | 38 | % | |
| Total Return(3) | | | 9.52 | % | | | (1.05 | )%(4) | | | 27.24 | % | | | (22.16 | )% | | | — | | |
| Net assets, end of year (000's omitted) | | $ | 153,121 | | | $ | 180,777 | | | $ | 226,702 | | | $ | 209,074 | | | $ | 307,838 | | |
† The operating expenses of the Portfolio reflect a reduction of the investment adviser fee. Had such action not been taken, the ratios would have been the same.
(1) For the period from the start of business, March 1, 2001, to October 31, 2001.
(2) Annualized.
(3) Total return is required to be disclosed for fiscal years beginning after December 15, 2000.
(4) The Portfolio's net increase from payments by affiliate and net gains (losses) realized on the disposal of investments purchased which did not meet the Portfolio's investment guidelines had no effect on total return for the year ended October 31, 2004.
See notes to financial statements
22
Tax-Managed Small-Cap Growth Portfolio as of October 31, 2005
NOTES TO FINANCIAL STATEMENTS
1 Significant Accounting Policies
Tax-Managed Small-Cap Growth Portfolio (the Portfolio) is registered under the Investment Company Act of 1940, as amended, as a diversified open-end management investment company. The Portfolio, which was organized as a trust under the laws of the State of New York on June 22, 1998, seeks to achieve long-term after-tax returns by investing in a diversified portfolio of equity securities of small-cap companies. The Declaration of Trust permits the Trustees to issue interests in the Portfolio. At October 31, 2005, the Eaton Vance Tax-Managed Small-Cap Growth Fund 1.1, the Eaton Vance Tax-Managed Small-Cap Growth Fund 1.2 and the Eaton Vance Tax-Managed Equity Asset Allocation Fund held 59.3%, 21.3% and 19.3% interests in the Portfolio, respectively. The following is a summary of significant accounting policies consistently followed by the Portfolio in the preparation of its financial statements. The policies are in conformity with accounting principles generally accepted in the United States of America.
A Investment Valuation — Securities listed on a U.S. securities exchange generally are valued at the last sale price on the day of valuation or, if no sales took place on such date, at the mean between the closing bid and asked prices therefore on the exchange where such securities are principally traded. Equity securities listed on the NASDAQ National Market System generally are valued at the official NASDAQ closing price. Unlisted or listed securities for which closing sales prices or closing quotations are not available are valued at the mean between the latest available bid and asked prices or, in the case of preferred equity securities that are not listed or traded in the over-the-counter market, by an independent pricing service. Exchange-traded options are valued a t the last sale price for the day of valuation as quoted on the principal exchange or board of trade on which the options are traded or, in the absence of sales on such date, at the mean between the latest bid and asked prices therefore. Futures positions on securities and currencies generally are valued at closing settlement prices. Short-term debt securities with a remaining maturity of 60 days or less are valued at amortized cost. If short-term debt securities were acquired with a remaining maturity of more than 60 days, their amortized cost value will be based on their value on the sixty-first day prior to maturity. Other fixed income and debt securities, including listed securities and securities for which price quotations are available, will normally be valued on the basis of valuations furnished by a pricing service. Foreign securities and currencies are valued in U.S. dollars, based on foreign currency exchange rate quotations supplied by an independent quotation service. The daily valuation of exchange-traded foreign securities generally is determined as of the close of trading on the principal exchange on which such securities trade. Events occurring after the close of trading on foreign exchanges may result in adjustments to the valuation of foreign securities to more accurately reflect their fair value as of the close of regular trading on the New York Stock Exchange. When valuing foreign equity securities that meet certain criteria, the Trustees have approved the use of a fair value service that values such securities to reflect market trading that occurs after the close of the applicable foreign markets of comparable securities or other instruments that have a strong correlation to the fair-valued securities. Investments held by the Portfolio for which valuations or market quotations are unavailable are valued at fair value using methods determined in good faith by or at the direction of the Trustees of the Portfolio consideri ng relevant factors, data and information including the market value of freely tradable securities of the same class in the principal market on which such securities are normally traded.
B Income — Dividend income is recorded on the ex-dividend date for dividends received in cash and/or securities. However, if the ex-dividend date has passed, certain dividends from foreign securities are recorded as the Portfolio is informed of the ex-dividend date. Interest income is recorded on the accrual basis.
C Income Taxes — The Portfolio is treated as a partnership for federal tax purposes. No provision is made by the Portfolio for federal or state taxes on any taxable income of the Portfolio because each investor in the Portfolio is ultimately responsible for the payment of any taxes on its share of taxable income. Since the Portfolio's investors include regulated investment companies that invest all or substantially all of their assets in the Portfolio, the Portfolio normally must satisfy the applicable source of income and diversification requirements (under the Internal Revenue Code) in order for its investors to satisfy them. The Portfolio will allocate at least annually among its investors, each investor's distributive share of the Portfolio's net investment income, ne t realized capital gains, and any other items of income, gain, loss, deduction or credit.
D Financial Futures Contracts — Upon entering a financial futures contract, the Portfolio is required to deposit either in cash or securities an amount (initial margin) equal to a certain percentage of the purchase price indicated in the financial futures contract. Subsequent payments are made or received by the Portfolio (variation
23
Tax-Managed Small-Cap Growth Portfolio as of October 31, 2005
NOTES TO FINANCIAL STATEMENTS CONT'D
margin) each day, dependent on daily fluctuations in the value of the underlying security, and are recorded for book purposes as unrealized gains or losses by the Portfolio. The Portfolio's investment in financial futures contracts is designed to hedge against anticipated future changes in price of current or anticipated Portfolio positions. Should prices move unexpectedly, the Portfolio may not achieve the anticipated benefits of the financial futures contracts and may realize a loss.
E Foreign Currency Translation — Investment valuations, other assets and liabilities initially expressed in foreign currencies are converted each business day into U.S. dollars based upon current exchange rates. Purchases and sales of foreign investment securities and income and expenses are converted into U.S. dollars based upon currency exchange rates prevailing on the respective dates of such transactions. Recognized gains or losses on investment transactions attributable to foreign currency exchange rates are recorded for financial statement purposes as net realized gains and losses on investments. That portion of unrealized gains and losses on investments that results from fluctuations in foreign currency exchange rates is not separately disclosed.
F Expense Reduction — Investors Bank & Trust Company (IBT) serves as custodian of the Portfolio. Pursuant to the custodian agreement, IBT receives a fee reduced by credits which are determined based on the average daily cash balances the Portfolio maintains with IBT. All credit balances used to reduce the Portfolio's custodian fees are reported as a reduction of expenses on the Statement of Operations.
G Securities Sold Short — The Portfolio may sell a security short if it owns at least an equal amount of the security sold short or another security exchangeable for an equal amount of the security sold short in anticipation of a decline in the market price of the securities or in order to hedge portfolio positions. The Portfolio will generally borrow the security sold in order to make delivery to the buyer. Upon executing the transaction, the Portfolio records the proceeds as deposits with brokers on the Statement of Assets and Liabilities and establishes an offsetting payable for securities sold short for the securities due on settlement. The proceeds are retained by the broker as collateral for the short position. The liability is marked-to-market on a daily basis and the Portfolio is required to pay the lending broker any dividend or interest income earned while the short position is open. A gain or loss is recorded when the security is delivered to the broker. The Portfolio may recognize a loss on the transaction if the market value of the securities sold increases before the securities are delivered.
H Use of Estimates — The preparation of the financial statements in conformity with accounting principles generally accepted in the United States of America requires management to make estimates and assumptions that affect the reported amounts of assets and liabilities at the date of the financial statements and the reported amounts of income and expense during the reporting period. Actual results could differ from those estimates.
I Indemnifications — Under the Portfolio's organizational documents, its officers and Trustees may be indemnified against certain liabilities and expenses arising out of the performance of their duties to the Portfolio. Interestholders in the Portfolio are jointly and severally liable for the liabilities and obligations of the Portfolio in the event that the Portfolio fails to satisfy such liabilities and obligations; provided, however, that, to the extent assets are available in the Portfolio, the Portfolio may, under certain circumstances, indemnify interestholders from and against any claim or liability to which such holder may become subject by reason of being or having been an interestholder in the Portfolio. Additionally, in the normal course of business, the Portfo lio enters into agreements with service providers that may contain indemnification clauses. The Portfolio's maximum exposure under these arrangements is unknown as this would involve future claims that may be made against the Portfolio that have not yet occurred.
J Other — Investment transactions are accounted for on a trade-date basis.
2 Investment Adviser Fee and Other Transactions with Affiliates
The investment adviser fee is earned by Boston Management and Research (BMR), a wholly-owned subsidiary of Eaton Vance Management (EVM), as compensation for management and investment advisory services rendered to the Portfolio. BMR receives a monthly advisory fee in the amount of 5/96th of 1% (equal to 0.625% annually) of average daily net assets of the Portfolio up to $500 million, and at reduced rates as daily net assets exceed that level. EVM has also agreed to reduce the investment adviser fee by an amount equal to that portion of commissions paid to broker dealers in execution of portfolio transactions attributed to the Portfolio that is
24
Tax-Managed Small-Cap Growth Portfolio as of October 31, 2005
NOTES TO FINANCIAL STATEMENTS CONT'D
consideration for third-party research services. For the year ended October 31, 2005, EVM waived $7,967 of its advisory fee. For the year ended October 31, 2005, the advisory fee amounted to $1,052,955. Except for Trustees of the Portfolio who are not members of EVM's or BMR's organization, officers and Trustees receive remuneration for their services to the Portfolio out of the investment adviser fee. Trustees of the Portfolio who are not affiliated with BMR may elect to defer receipt of all or a percentage of their annual fees in accordance with the terms of the Trustees Deferred Compensation Plan. For the year ended October 31, 2005, no significant amounts have been deferred.
Certain officers and Trustees of the Portfolio are officers of the above organizations.
3 Investment Transactions
Purchases and sales of investments, other than short-term obligations, aggregated $364,709,013 and $414,322,811, respectively, for the year ended October 31, 2005.
4 Federal Income Tax Basis of Unrealized Appreciation (Depreciation)
The cost and unrealized appreciation (depreciation) in value of the investments owned at October 31, 2005, as computed on a federal income tax basis, were as follows:
| Aggregate Cost | | $ | 131,485,754 | | |
| Gross unrealized appreciation | | $ | 23,549,032 | | |
| Gross unrealized depreciation | | | (2,315,353 | ) | |
| Net unrealized appreciation | | $ | 21,233,679 | | |
5 Risks Associated with Foreign Investments
Investing in securities issued by companies whose principal business activities are outside the United States may involve significant risks not present in domestic investments. For example, there is generally less publicly available information about foreign companies, particularly those not subject to the disclosure and reporting requirements of the U.S. securities laws. Foreign issuers are generally not bound by uniform accounting, auditing, and financial reporting requirements and standards of practice comparable to those applicable to domestic issuers. Investments in foreign securities also involve the risk of possible adverse changes in investment or exchange control regulations, expropriation or confiscatory taxation, limitation on the removal of funds or other assets of the Portfolio, political or financial instability or diplomatic and other developm ents which could affect such investments. Foreign stock markets, while growing in volume and sophistication, are generally not as developed as those in the United States, and securities of some foreign issuers (particularly those in developing countries) may be less liquid and more volatile than securities of comparable U.S. companies. In general, there is less overall governmental supervision and regulation of foreign securities markets, broker-dealers, and issuers than in the United States.
6 Financial Instruments
The Portfolio may trade in financial instruments with off-balance sheet risk in the normal course of its investing activities to assist in managing exposure to various market risks. These financial instruments include financial futures contracts and may involve, to a varying degree, elements of risk in excess of the amounts recognized for financial statement purposes.
The notional or contractual amounts of these instruments represent the investment the Portfolio has in particular classes of financial instruments and does not necessarily represent the amounts potentially subject to risk. The measurement of the risks associated with these instruments is meaningful only when all related and offsetting transactions are considered. The Portfolio did not have any open obligations under these financial instruments at October 31, 2005.
7 Line of Credit
The Portfolio participates with other portfolios and funds managed by BMR and EVM and its affiliates in a $150 million unsecured line of credit agreement with a group of banks. Borrowings will be made by the Portfolio solely to facilitate the handling of unusual and/or unanticipated short-term cash requirements. Interest is charged to each participating portfolio or fund based on its borrowings at an amount above either the Eurodollar rate or Federal Funds rate. In addition, a fee computed at an annual rate of 0.10% on the daily unused portion of the line of credit is allocated among the participating portfolios and funds at the end of each quarter. The Portfolio did not have any significant borrowings or allocated fees during the year ended October 31, 2005.
25
Tax-Managed Small-Cap Growth Portfolio as of October 31, 2005
NOTES TO FINANCIAL STATEMENTS CONT'D
8 Restricted Securities
At October 31, 2005, the Portfolio owned the following securities (representing 0.21% of net assets) which were restricted as to public resale and not registered under the Securities Act of 1933. The fair value is determined using methods determined in good faith by or at the direction of the Trustees.
| Description | | Date of
Acquisition | | Shares | | Cost | | Fair Value | |
| Common Stocks | |
| Formation Capital Corp. | | 12/21/98 | | | 400,000 | | | $ | 88,260 | | | $ | 77,996 | | |
| | | $ | 88,260 | | | $ | 77,996 | | |
| Private Placements and Special Warrants | |
| Nevada Pacific Mining Co. | | 12/21/98 | | | 80,000 | | | $ | 80,000 | | | $ | 56,000 | | |
Western Exploration and
Development, Ltd. | | 12/21/98 | | | 600,000 | | | | 480,000 | | | | 180,000 | | |
| | | $ | 560,000 | | | $ | 236,000 | | |
26
Tax-Managed Small-Cap Growth Portfolio as of October 31, 2005
REPORT OF INDEPENDENT REGISTERED PUBLIC ACCOUNTING FIRM
To the Trustees and Investors
of Tax-Managed Small-Cap Growth Portfolio:
We have audited the accompanying statement of assets and liabilities of Tax-Managed Small-Cap Growth Portfolio (the Portfolio), including the portfolio of investments as of October 31, 2005, the related statement of operations for the year then ended, the statements of changes in net assets for each of the two years in the period then ended and the supplementary data for each of the four years in the period then ended and the period from the start of business, March 1, 2001 to October 31, 2001. These financial statements and supplementary data are the responsibility of the Portfolio's management. Our responsibility is to express an opinion on these financial statements and supplementary data based on our audits.
We conducted our audits in accordance with standards of the Public Company Accounting Oversight Board (United States). Those standards require that we plan and perform the audits to obtain reasonable assurance about whether the financial statements and supplementary data are free of material misstatement. The Portfolio is not required to have, nor were we engaged to perform, an audit of its internal control over financial reporting. An audit includes consideration of internal control over financial reporting as a basis for designing audit procedures that are appropriate in the circumstances, but not for the purpose of expressing an opinion on the effectiveness of the Portfolio's internal control over financial reporting. Accordingly, we express no such opinion. An audit also includes examining, on a test basis, evidence supporting the amounts and disclosures in the financial statements, assessing the accounting principles used a nd significant estimates made by management, as well as evaluating the overall financial statement presentation. Our procedures included confirmation of securities held as of October 31, 2005 by correspondence with the custodian and brokers; where replies were not received from brokers, we performed other auditing procedures. We believe that our audits provide a reasonable basis for our opinion.
In our opinion, the financial statements and supplementary data present fairly, in all material respects, the financial position of the Tax-Managed Small-Cap Growth Portfolio at October 31, 2005, the results of its operations for the year then ended, the changes in its net assets for each of the two years in the period then ended, and the supplementary data for each of the four years in the period then ended and for the period from the start of business, March 1, 2001 to October 31,2001, in conformity with accounting principles generally accepted in the United States of America.
DELOITTE & TOUCHE LLP
Boston, Massachusetts
December 19, 2005
27
Eaton Vance Tax-Managed Small-Cap Growth Fund 1.1
BOARD OF TRUSTEES' ANNUAL APPROVAL OF THE INVESTMENT ADVISORY AGREEMENT
The investment advisory agreement between Tax-Managed Small-Cap Growth Portfolio (the "Portfolio") and its investment adviser, Boston Management and Research, provides that the advisory agreement will continue in effect from year to year so long as its continuance is approved at least annually (i) by a vote of a majority of the noninterested Trustees of the Portfolio cast in person at a meeting called for the purpose of voting on such approval and (ii) by the Trustees of the Portfolio or by vote of a majority of the outstanding interests of the Portfolio.
In considering the annual approval of the investment advisory agreement between the Portfolio and its investment adviser, the Special Committee of the Board of Trustees considered information that had been provided throughout the year at regular Board meetings, as well as information furnished for a series of meetings held in February and March in preparation for a Board meeting held March 21, 2005 to specifically consider the renewal of the investment advisory agreement. Such information included, among other things, the following:
•An independent report comparing the advisory fees of the Portfolio with those of comparable funds;
•An independent report comparing the expense ratio of the Eaton Vance Tax-Managed Small-Cap Growth Fund 1.1 (the "Fund") to those of comparable funds;
•Information regarding Fund investment performance in comparison to a relevant peer group of funds and appropriate indices;
•The economic outlook and the general investment outlook in relevant investment markets;
•Eaton Vance Management's results ("Eaton Vance") and financial condition and the overall organization of the investment adviser;
•The procedures and processes used to determine the fair value of Fund assets and actions taken to monitor and test the effectiveness of such procedures and processes;
•The allocation of brokerage and the benefits received by the investment adviser as the result of brokerage allocation;
•Eaton Vance's management of the relationship with the custodian, subcustodians and fund accountants;
•The resources devoted to compliance efforts undertaken by Eaton Vance on behalf of the funds it manages and the record of compliance with the investment policies and restrictions and with policies on personal securities transactions;
•The quality, nature, cost and character of the administrative and other non-investment management services provided by Eaton Vance and its affiliates; and
•The terms of the advisory agreement and the reasonableness and appropriateness of the particular fee paid by the Portfolio for the services described therein.
The Special Committee also considered the nature, extent and quality of the management services provided by the investment adviser. In so doing, the Special Committee considered its management capabilities with respect to the types of investments held by the Portfolio, including information relating to the education, experience and number of investment professionals and other personnel who provide services under the investment advisory agreement. The Special Committee specifically noted the investment adviser's in-house equity research capabilities and experience in managing funds that seek to maximize after-tax returns. The Special Committee also took into account the time and attention to be devoted by senior management to the Fund and the other funds in the complex. The Special Committee evaluated the level of skill required to manage the Portfolio and concluded that the human resources available at the investment adviser wer e appropriate to fulfill effectively its duties on behalf of the Portfolio.
In its review of comparative information with respect to the Fund's investment performance, the Special Committee concluded that, in light of improvements in the Fund's performance in 2004, it is appropriate to allow reasonable time to evaluate the investment adviser's performance. It was also noted that Eaton Vance hired a new portfolio manager in June 2003 and allocated increased analytical resources to the Fund during 2004. The Special Committee concluded that it is appropriate to allow reasonable time to evaluate the effectiveness of these actions. With respect to its review of investment advisory fees, the Special Committee concluded that the fees paid by the Portfolio are within the range of those paid by comparable funds within the mutual fund industry. In reviewing the information regarding the expense ratio of the Fund, the Special Committee concluded that the Fund's expense ratio is within a range that is competitive w ith comparable funds.
28
Eaton Vance Tax-Managed Small-Cap Growth Fund 1.1
BOARD OF TRUSTEES' ANNUAL APPROVAL OF THE INVESTMENT ADVISORY AGREEMENT CONT'D
In addition to the factors mentioned above, the Special Committee reviewed the level of the investment adviser's profits in providing investment management services for the Portfolio and for all Eaton Vance funds as a group, as well as the investment adviser's implementation of a soft dollar reimbursement program. Pursuant to the soft dollar reimbursement program, the Portfolio may receive reimbursement payments in respect of third party research services obtained by the investment adviser as a result of soft dollar credits generated through trading on behalf of the Portfolio. The Special Committee also reviewed the benefits to Eaton Vance and its affiliates in providing administration services for the Fund and for all Eaton Vance funds as a group. In addition, the Special Committee considered the fiduciary duty assumed by the investment adviser in connection with the services rendered to the Portfolio and the business reputatio n of the investment adviser and its financial resources. The Trustees concluded that in light of the services rendered, the profits realized by the investment adviser are not unreasonable. The Special Committee also considered the extent to which the investment adviser appears to be realizing benefits from economies of scale in managing the Portfolio, and concluded that the fee breakpoints which are in place will allow for an equitable sharing of such benefits, when realized, with the Portfolio and the shareholders of the Fund.
The Special Committee did not consider any single factor as controlling in determining whether or not to renew the investment advisory agreement. Nor are the items described herein all the matters considered by the Special Committee. In assessing the information provided by Eaton Vance and its affiliates, the Special Committee also took into consideration the benefits to shareholders of investing in a fund that is a part of a large family of funds which provides a large variety of shareholder services.
Based on its consideration of the foregoing factors and conclusions, and such other factors and conclusions as it deemed relevant, and assisted by independent counsel, the Special Committee concluded that the renewal of the investment advisory agreement, including the fee structure, is in the interests of shareholders.
29
Eaton Vance Tax-Managed Small-Cap Growth Fund 1.1
MANAGEMENT AND ORGANIZATION
Fund Management. The Trustees of Eaton Vance Mutual Funds Trust (the Trust) and Tax-Managed Small-Cap Growth Portfolio (the Portfolio) are responsible for the overall management and supervision of the Trust's and Portfolio's affairs. The Trustees and officers of the Trust and the Portfolio are listed below. Except as indicated, each individual has held the office shown or other offices in the same company for the last five years. Trustees and officers of the Trust and the Portfolio hold indefinite terms of office. The "noninterested Trustees" consist of those Trustees who are not "interested persons" of the Trust and the Portfolio, as that term is defined under the 1940 Act. The business address of each Trustee and officer is The Eaton Vance Building, 255 State Street, Boston, Massachusetts 02109. As used below, "EVC" refers to Eaton Vance Corp., "EV" refers to Eaton Vance, Inc., "EVM" refers to Eaton Vance Management, "BMR" refers to Boston Management and Research and "EVD" refers to Eaton Vance Distributors, Inc. EVC and EV are the corporate parent and trustee, respectively, of EVM and BMR. EVD is the Fund's principal underwriter, the Portfolio's placement agent and a wholly-owned subsidiary of EVM. Each officer affiliated with Eaton Vance may hold a position with other Eaton Vance affiliates that is comparable to its position with EVM listed below.
Name and
Date of Birth | | Position(s)
with the
Trust and
the Portfolio | | Term of
Office and
Length of
Service | | Principal Occupation(s)
During Past Five Years | | Number of Portfolios
in Fund Complex
Overseen By
Trustee(1) | | Other Directorships Held | |
| Interested Trustee | | | | | | | | | | | | | |
|
James B. Hawkes
11/9/41 | | Trustee | | Trustee of the Trust since 1991; of the Portfolio since 1998 | | Chairman, President and Chief Executive Officer of BMR, EVC, EVM and EV; Director of EV; Vice President and Director of EVD. Trustee and/or officer of 161 registered investment companies in the Eaton Vance Fund Complex. Mr. Hawkes is an interested person because of his positions with BMR, EVM, EVC and EV, which are affiliates of the Trust and the Portfolio. | | | 161 | | | Director of EVC | |
|
| Noninterested Trustee(s) | | | | | | | | | | | | | |
|
Benjamin C. Esty
1/2/63 | | Trustee | | Since 2005 | | Professor, Harvard University Graduate School of Business Administration (since 2003). Formerly, Associate Professor, Harvard University Graduate School of Business Administration (2000-2003). | | | 152 | | | None | |
|
Samuel L. Hayes, III
2/23/35 | | Trustee | | Trustee of the Trust since 1986; of the Portfolio since 1998 and Chairman of the Board since 2005 | | Jacob H. Schiff Professor of Investment Banking Emeritus, Harvard University Graduate School of Business Administration. | | | 161 | | | Director of Tiffany & Co. (specialty retailer) and Telect, Inc. (telecommunication services company) | |
|
William H. Park
9/19/47 | | Trustee | | Since 2003 | | President and Chief Executive Officer, Prizm Capital Management, LLC (investment management firm) (since 2002). Executive Vice President and Chief Financial Officer, United Asset Management Corporation (a holding company owning institutional investment management firms) (1982-2001). | | | 161 | | | None | |
|
Ronald A. Pearlman
7/10/40 | | Trustee | | Since 2003 | | Professor of Law, Georgetown University Law Center (since 1999). Tax Partner, Covington & Burling, Washington, DC (1991-2000). | | | 161 | | | None | |
|
30
Eaton Vance Tax-Managed Small-Cap Growth Fund 1.1
MANAGEMENT AND ORGANIZATION CONT'D
Name and
Date of Birth | | Position(s)
with the
Trust and
the Portfolio | | Term of
Office and
Length of
Service | | Principal Occupation(s)
During Past Five Years | | Number of Portfolios
in Fund Complex
Overseen By
Trustee(1) | | Other Directorships Held | |
| Noninterested Trustee(s) (continued) | | | | | | | | | | | | | |
|
Norton H. Reamer
9/21/35 | | Trustee | | Trustee of the Trust since 1986; of the Portfolio since 1998 | | President, Chief Executive Officer and a Director of Asset Management Finance Corp. (a specialty finance company serving the investment management industry) (since October 2003). President, Unicorn Corporation (an investment and financial advisory services company) (since September 2000). Formerly, Chairman, Hellman, Jordan Management Co., Inc. (an investment management company) (2000-2003). Formerly, Advisory Director of Berkshire Capital Corporation (investment banking firm) (2002-2003). Formerly Chairman of the Board, United Asset Management Corporation (a holding company owning institutional investment management firms) and Chairman, President and Director, UAM Funds (mutual funds) (1980-2000). | | | 161 | | | None | |
|
Lynn A. Stout
9/14/57 | | Trustee | | Since 1998 | | Professor of Law, University of California at Los Angeles School of Law (since July 2001). Formerly, Professor of Law, Georgetown University Law Center. | | | 161 | | | None | |
|
Ralph F. Verni
1/26/43 | | Trustee | | Since 2005 | | Consultant and private investor (since 2000). Formerly, President and Chief Executive Officer, Redwood Investment Systems, Inc. (software developer) (2000). Formerly, President and Chief Executive Officer, State Street Research & Management (investment advisor), SSRM Holdings (parent of State Street Research & management), and SSR Realty (institutional realty manager) (1992-2000). | | | 152 | | | Director of W.P. Carey & Company LLC (manager of real estate investment trusts) | |
|
| Principal Officers who are not Trustees | | | | | | | |
|
Name and
Date of Birth | | Position(s)
with the
Trust and
the Portfolio | | Term of
Office and
Length of
Service | | Principal Occupation(s)
During Past Five Years | |
Thomas E. Faust Jr.
5/31/58 | | President of the Trust | | Since 2002 | | Executive Vice President of EVM, BMR, EVC and EV; Chief Investment Officer of EVM and BMR and Director of EVC. Chief Executive Officer of Belair Capital Fund LLC, Belcrest Capital Fund LLC, Belmar Capital Fund LLC, Belport Capital Fund LLC and Belrose Capital Fund LLC (private investment companies sponsored by EVM). Officer of 65 registered investment companies managed by EVM or BMR. | |
|
William H. Ahern, Jr.
7/28/59 | | Vice President of the Trust | | Since 1995 | | Vice President of EVM and BMR. Officer of 70 registered investment companies managed by EVM or BMR. | |
|
Cynthia J. Clemson
3/2/63 | | Vice President of the Trust | | Since 2004 | | Vice President of EVM and BMR. Officer of 85 registered investment companies managed by EVM or BMR. | |
|
Kevin S. Dyer
2/21/75 | | Vice President of the Trust | | Since 2005 | | Assistant Vice President of EVM and BMR. Officer of 24 registered investment companies managed by EVM or BMR. | |
|
Aamer Khan
6/7/60 | | Vice President of the Trust | | Since 2005 | | Vice President of EVM and BMR. Officer of 27 registered investment companies managed by EVM or BMR. | |
|
Michael R. Mach
7/15/47 | | Vice President of the Trust | | Since 1999 | | Vice President of EVM and BMR. Officer of 32 registered investment companies managed by EVM or BMR. | |
|
31
Eaton Vance Tax-Managed Small-Cap Growth Fund 1.1
MANAGEMENT AND ORGANIZATION CONT'D
Name and
Date of Birth | | Position(s)
with the
Trust and
the Portfolio | | Term of
Office and
Length of
Service | | Principal Occupation(s)
During Past Five Years | |
| Principal Officers who are not Trustees (continued) | | | | | | | |
|
Robert B. MacIntosh
1/22/27 | | Vice President of the Trust | | Since 1998 | | Vice President of EVM and BMR. Officer of 85 registered investment companies managed by EVM or BMR. | |
|
Duncan W. Richardson
10/26/57 | | Vice President of the Trust; President of the Portfolio | | Vice President of the Trust since 2001; President of the Portfolio since 2002 | | Senior Vice President and Chief Equity Investment Officer of EVM and BMR. Officer of 51 registered investment companies managed by EVM or BMR. | |
|
Walter A. Row, III
7/20/57 | | Vice President of the Trust | | Since 2001 | | Director of Equity Research and a Vice President of EVM and BMR. Officer of 31 registered investment companies managed by EVM or BMR. | |
|
Judith A. Saryan
8/21/54 | | Vice President of the Trust | | Since 2003 | | Vice President of EVM and BMR. Officer of 33 registered investment companies managed by EVM or BMR. | |
|
Susan Schiff
3/13/61 | | Vice President of the Trust | | Since 2002 | | Vice President of EVM and BMR. Officer of 29 registered investment companies managed by EVM or BMR. | |
|
Barbara E. Campbell
6/19/57 | | Treasurer of the Trust | | Since 2005(2) | | Vice President EVM and BMR. Officer of 161 registered investment companies managed by EVM or BMR. | |
|
Alan R. Dynner
10/10/40 | | Secretary | | Secretary of the Trust since 1997; of the Portfolio since 1998 | | Vice President, Secretary and Chief Legal Officer of BMR, EVM, EVD, EV and EVC. Officer of 161 registered investment companies managed by EVM and BMR. | |
|
Michelle A. Green
8/25/69 | | Treasurer of the Portfolio | | Since 2002(2) | | Vice President of EVM and BMR. Chief Financial Officer of Belair Capital Fund LLC, Belcrest Capital Fund LLC, Belmar Capital Fund LLC, Belport Capital Fund LLC and Belrose Capital Fund LLC (private investment companies sponsored by EVM). Officer of 67 registered investment companies managed by EVM or BMR. | |
|
Paul M. O'Neil
7/11/53 | | Chief Compliance Officer | | Since 2004 | | Vice President of EVM and BMR. Officer of 161 registered investment companies managed by EVM or BMR. | |
|
(1) Includes both master feeder and feeder funds in a master-feeder structure.
(2) Prior to 2002, Ms. Green served as Assistant Treasurer of the Portfolio since 1998, and prior to 2005, Ms. Campbell served as Assistant Treasurer of the Trust since 1995.
The SAI for the Fund includes additional information about the Trustees and officers of the Fund and the Portfolio and can be obtained without charge by calling 1-800-225-6265.
32
This Page Intentionally Left Blank
Investment Adviser of Tax-Managed Small-Cap Growth Portfolio
Boston Management and Research
The Eaton Vance Building
255 State Street
Boston, MA 02109
Administrator of Eaton Vance Tax-Managed Small-Cap Growth Fund 1.1
Eaton Vance Management
The Eaton Vance Building
255 State Street
Boston, MA 02109
Principal Underwriter
Eaton Vance Distributors, Inc.
The Eaton Vance Building
255 State Street
Boston, MA 02109
(617) 482-8260
Custodian
Investors Bank & Trust Company
200 Clarendon Street
Boston, MA 02116
Transfer Agent
PFPC Inc.
Attn: Eaton Vance Funds
P.O. Box 9653
Providence, RI 02940-9653
(800) 262-1122
Independent Registered Public Accounting Firm
Deloitte & Touche LLP
200 Berkeley Street
Boston, MA 02116-5022
Eaton Vance Tax-Managed Small-Cap Growth Fund 1.1
The Eaton Vance Building
255 State Street
Boston, MA 02109
This report must be preceded or accompanied by a current prospectus. Before investing, investors should consider carefully the Fund's investment objective(s), risks, and charges and expenses. The Fund's current prospectus contains this and other information about the Fund and is available through your financial advisor. Please read the prospectus carefully before you invest or send money. For further information please call 1-800-225-6265.
130-12/05 MGSRC

Annual Report October 31, 2005


EATON VANCE
TAX-MANAGED
SMALL-CAP
GROWTH FUND
1.2
IMPORTANT NOTICES REGARDING PRIVACY,
DELIVERY OF SHAREHOLDER DOCUMENTS,
PORTFOLIO HOLDINGS AND PROXY VOTING
Privacy. The Eaton Vance organization is committed to ensuring your financial privacy. Each of the financial institutions identified below has in effect the following policy ("Privacy Policy") with respect to nonpublic personal information about its customers:
• Only such information received from you, through application forms or otherwise, and information about your Eaton Vance fund transactions will be collected. This may include information such as name, address, social security number, tax status, account balances and transactions.
• None of such information about you (or former customers) will be disclosed to anyone, except as permitted by law (which includes disclosure to employees necessary to service your account). In the normal course of servicing a customer's account, Eaton Vance may share information with unaffiliated third parties that perform various required services such as transfer agents, custodians and broker/dealers.
• Policies and procedures (including physical, electronic and procedural safeguards) are in place that are designed to protect the confidentiality of such information.
• We reserve the right to change our Privacy Policy at any time upon proper notification to you. Customers may want to review our Policy periodically for changes by accessing the link on our homepage: www.eatonvance.com.
Our pledge of privacy applies to the following entities within the Eaton Vance organization: the Eaton Vance Family of Funds, Eaton Vance Management, Eaton Vance Investment Counsel, Boston Management and Research, and Eaton Vance Distributors, Inc.
In addition, our Privacy Policy only applies to those Eaton Vance customers who are individuals and who have a direct relationship with us. If a customer's account (i.e. fund shares) is held in the name of a third-party financial adviser/broker-dealer, it is likely that only such adviser's privacy policies apply to the customer. This notice supersedes all previously issued privacy disclosures.
For more information about Eaton Vance's Privacy Policy, please call 1-800-262-1122.
Delivery of Shareholder Documents. The Securities and Exchange Commission ("the SEC") permits funds to deliver only one copy of shareholder documents, including prospectuses, proxy statements and shareholder reports, to fund investors with multiple accounts at the same residential or post office box address. This practice is often called "householding" and it helps eliminate duplicate mailings to shareholders.
Eaton Vance, or your financial adviser, may household the mailing of your documents indefinitely unless you instruct Eaton Vance, or your financial adviser, otherwise.
If you would prefer that your Eaton Vance documents not be householded, please contact Eaton Vance at 1-800-262-1122, or contact your financial adviser.
Your instructions that householding not apply to delivery of your Eaton Vance documents will be effective within 30 days of receipt by Eaton Vance or your financial adviser.
Portfolio Holdings. Each Eaton Vance Fund and its underlying Portfolio (if applicable) will file a schedule of its portfolio holdings on Form N-Q with the SEC for the first and third quarters of each fiscal year. The Form N-Q will be available on the Eaton Vance website www.eatonvance.com, by calling Eaton Vance at 1-800-262-1122 or in the EDGAR database on the SEC's website at www.sec.gov. Form N-Q may also be reviewed and copied at the SEC's public reference room in Washington, D.C. (call 1-800-732-0330 for information on the operation of the public reference room).
Proxy Voting. From time to time, funds are required to vote proxies related to the securities held by the funds. The Eaton Vance Funds or their underlying Portfolios (if applicable) vote proxies according to a set of policies and procedures approved by the Funds' and Portfolios' Boards. You may obtain a description of these policies and procedures and information on how the Funds or Portfolios voted proxies relating to Portfolio securities during the most recent 12 month period ended June 30, without charge, upon request, by calling 1-800-262-1122. This description is also available on the SEC's website at www.sec.gov.
Eaton Vance Tax-Managed Small-Cap Growth Fund 1.2 as of October 31, 2005
MANAGEMENT’S DISCUSSION OF FUND PERFORMANCE

| |
Martha Locke | |
Portfolio Manager | |
The Fund
Performance for the Past Year
• For the year ended October 31, 2005, the Fund’s Class A shares had a total return of 8.34%. This return was the result of an increase in net asset value (NAV) per share to $8.31 on October 31, 2005, from $7.67 on October 31, 2004.(1)
• The Fund’s Class B shares had a total return of 7.78% for the same period, the result of an increase in NAV per share to $8.04 from $7.46.(1)
• The Fund’s Class C shares had a total return of 7.64% for the same period, the result of an increase in NAV per share to $8.03 from $7.46.(1)
• For comparison, the Russell 2000 Growth Index – an unmanaged market index of small-cap growth stocks – had a total return of 10.91%, while the S&P SmallCap 600 Index – a broad-based, unmanaged index of both growth and value small-capitalization stocks – had a total return of 15.27% during the same period.(2)
See pages 3 through 5 for more performance information, including after-tax returns.
Management Discussion
• Over the past year, the U.S. economy remained strong, despite eight successive interest rate hikes by the Federal Reserve and surging energy prices since summer. Small-cap stocks in general outperformed large-cap stocks, but the value style of investing outperformed the growth style, due to the strong performance of the energy, basic materials and industrial sectors. The information technology sector, which accounts for a quarter of the benchmark Russell 2000 Growth Index, lagged most other sectors and was the primary factor in growth stocks lagging value stocks.(2)
• Against this backdrop, the Fund posted positive returns for the year, though it lagged the returns of its benchmarks. Energy, telecommunications and financial stocks held by Tax-Managed Small-Cap Growth Portfolio (the Portfolio), in which the Fund invests, contributed the most to the Fund’s performance.
• While stock selection is the primary driver of performance, the Portfolio remained overweighted in the energy sector for most of the year and thus benefited from the surge in energy prices caused by Hurricane Katrina.
• The Portfolio also benefited from strong stock selection in the telecom services sector, in which we were somewhat overweight versus the benchmark. A number of industrial stocks also added to our results, but performance was offset by a slight underweighting in this sector. Our underweighting in financials proved correct, and the names we held added to performance.
• However, the important IT sector substantially lagged other areas, and despite the Portfolio’s underweighting the benchmark, the underperformance of the semiconductor and software securities held by the Portfolio aggravated this drag.
• The health care and consumer discretionary sectors also represented significant portions of the benchmark and the Portfolio, and their overall contributions were positive. Within consumer discretionary stocks, the media, education and textile apparel industries led the way, offset somewhat by some specialty retail and restaurant stocks. In health care, pharmaceutical stocks were the strongest, offset by health care providers and services stocks. Our underweighting in biotechnology was positive.
The views expressed throughout this report are those of the portfolio manager and are current only through the end of the period of the report as stated on the cover. These views are subject to change at any time based upon market or other conditions, and the investment adviser disclaims any responsibility to update such views. These views may not be relied on as investment advice and, because investment decisions for a fund are based on many factors, may not be relied on as an indication of trading intent on behalf of any Eaton Vance fund.
Past performance is no guarantee of future results. Returns are historical and are calculated by determining the percentage change in net asset value or offering price (as applicable) with all distributions reinvested. Investment return and principal value will fluctuate so that shares, when redeemed, may be worth more or less than their original cost. Performance is for stated time period only; due to market volatility, the Fund’s current performance may be lower or higher than the quoted return. For performance as of the most recent month end, please refer to www.eatonvance.com.
(1) These returns do not include the 5.75% maximum sales charge for Class A shares or the applicable contingent deferred sales charge (CDSC) for Class B and Class C shares. If sales charges were deducted, returns would be lower.
(2) It is not possible to invest directly in an Index. The Indexes’ total return does not reflect commissions or expenses that would have been incurred if an investor individually purchased or sold the securities represented in an Index.
Fund shares are not insured by the FDIC and are not deposits or other obligations of, or guaranteed by, any depository institution. Shares are subject to investment risks, including possible loss of principal invested.
2
Eaton Vance Tax-Managed Small-Cap Growth Fund 1.2 as of October 31, 2005
FUND PERFORMANCE
The line graphs and table set forth below provide information about the Fund’s performance. The line graphs compare the performance of Class A, Class B, and Class C of the Fund with that of the S&P SmallCap 600 Index, a broad-based, unmanaged market index of both growth and value small-capitalization stocks, and the Russell 2000 Growth Index, an unmanaged market index of small-cap growth stocks. The lines on the graphs represent the total returns of a hypothetical investment of $10,000 in each of Class A, Class B, Class C, the S&P Small-Cap 600 Index, and the Russell 2000 Index. Class A total returns are presented at net asset value and maximum public offering price. The table includes the total returns of each Class of the Fund at net asset value and public offering price. The performance presented below does not reflect the deduction of taxes, if any, that a shareholder would pay on distributions or redemptions of Fund shares.
Performance* | | Class A | | Class B | | Class C | |
| | | | | | | |
Average Annual Total Returns (at net asset value) | | | | | | | |
One Year | | 8.34 | % | 7.78 | % | 7.64 | % |
Life of Fund† | | -3.89 | % | -4.56 | % | -4.59 | % |
| | | | | | | |
SEC Average Annual Total Returns (including sales charge or applicable CDSC) | | | | | | | |
One Year | | 2.09 | % | 2.78 | % | 6.64 | % |
Life of Fund† | | -5.10 | % | -4.98 | % | -4.59 | % |
†Inception Dates – Class A: 3/2/01; Class B: 3/2/01; Class C: 3/2/01
* Average annual total returns do not include the 5.75% maximum sales charge for Class A shares or the applicable contingent deferred sales charge (CDSC) for Class B and Class C shares. If sales charges were deducted, returns would be lower. SEC average annual total returns for Class A reflect the maximum 5.75% sales charge. SEC returns for Class B shares reflect the applicable CDSC based on the following schedule: 5% - 1st and 2nd years; 4% - 3rd year; 3% - 4th year; 2% - 5th year; 1% - 6th year. SEC 1-year return for Class C reflects a 1% CDSC.
Past performance is no guarantee of future results. Returns are historical and are calculated by determining the percentage change in net asset value or offering price (as applicable) with all distributions reinvested. Investment return and principal value will fluctuate so that shares, when redeemed, may be worth more or less than their original cost. Performance is for the stated time period only; due to market volatility, the Fund’s current performance may be lower or higher than the quoted return. For performance as of the most recent month-end, please refer to www.eatonvance.com.

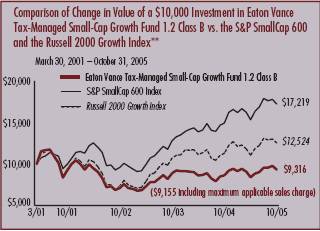
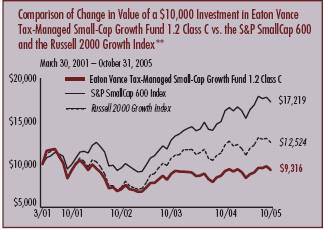
** Source: Thomson Financial. Investment operations commenced 3/2/01. It is not possible to invest directly in an Index. The Indexes’ total returns do not reflect commissions or expenses that would have been incurred if an investor individually purchased or sold the securities represented in an Index.
3
Top Ten Holdings*
By net assets
NII Holdings Inc., Class B | | 2.20 | % |
Central European Media Enterprises, Ltd. | | 1.96 | % |
Novatel Wireless, Inc. | | 1.75 | % |
Southwestern Energy Co. | | 1.68 | % |
MoneyGram International, Inc. | | 1.59 | % |
Peabody Energy Corp. | | 1.57 | % |
Vintage Petroleum, Inc. | | 1.52 | % |
Palm Inc. | | 1.37 | % |
Student Loan Corp. | | 1.33 | % |
Hologic, Inc. | | 1.32 | % |
* Ten Largest Holdings represented 16.29% of Portfolio net assets as of October 31, 2005. Holdings are subject to change due to active management.
Common Stock Investments by Sector**
By net assets
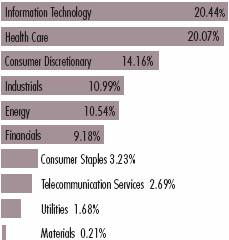
** Portfolio information may not be representative of the Portfolio’s current or future investments and may change due to active management.
4
“Return Before Taxes” does not take into consideration shareholder taxes. It is most relevant to tax-free or tax-deferred shareholder accounts. “Return After Taxes on Distributions” reflects the impact of federal income taxes due on Fund distributions of dividends and capital gains. It is most relevant to taxpaying shareholders who continue to hold their shares. “Return After Taxes on Distributions and Sale of Fund Shares” also reflects the impact of taxes on capital gain or loss realized upon a sale of shares. It is most relevant to taxpaying shareholders who sell their shares.
Average Annual Total Returns
(For the periods ended October 31, 2005)
Returns at Net Asset Value (NAV) (Class A)
| | One Year | | Life of Fund | |
| | | | | |
Return Before Taxes | | 8.34 | % | -3.89 | % |
Return After Taxes on Distributions | | 8.34 | % | -3.89 | % |
Return After Taxes on Distributions and Sale of Fund Shares | | 5.42 | % | -3.27 | % |
Returns at Public Offering Price (POP) (Class A)
| | One Year | | Life of Fund | |
| | | | | |
Return Before Taxes | | 2.09 | % | -5.10 | % |
Return After Taxes on Distributions | | 2.09 | % | -5.10 | % |
Return After Taxes on Distributions and Sale of Fund Shares | | 1.36 | % | -4.27 | % |
Average Annual Total Returns
(For the periods ended October 31, 2005)
Returns at Net Asset Value (NAV) (Class B)
| | One Year | | Life of Fund | |
| | | | | |
Return Before Taxes | | 7.78 | % | -4.56 | % |
Return After Taxes on Distributions | | 7.78 | % | -4.56 | % |
Return After Taxes on Distributions and Sale of Fund Shares | | 5.05 | % | -3.83 | % |
Returns at Public Offering Price (POP) (Class B)
| | One Year | | Life of Fund | |
| | | | | |
Return Before Taxes | | 2.78 | % | -4.98 | % |
Return After Taxes on Distributions | | 2.78 | % | -4.98 | % |
Return After Taxes on Distributions and Sale of Fund Shares | | 1.80 | % | -4.17 | % |
Average Annual Total Returns
(For the periods ended October 31, 2005)
Returns at Net Asset Value (NAV) (Class C)
| | One Year | | Life of Fund | |
| | | | | |
Return Before Taxes | | 7.64 | % | -4.59 | % |
Return After Taxes on Distributions | | 7.64 | % | -4.59 | % |
Return After Taxes on Distributions and Sale of Fund Shares | | 4.97 | % | -3.85 | % |
Returns at Public Offering Price (POP) (Class C)
| | One Year | | Life of Fund | |
| | | | | |
Return Before Taxes | | 6.64 | % | -4.59 | % |
Return After Taxes on Distributions | | 6.64 | % | -4.59 | % |
Return After Taxes on Distributions and Sale of Fund Shares | | 4.32 | % | -3.85 | % |
Class A, Class B, and Class C of the Fund commenced investment operations on 3/2/01. Returns at Public Offering Price (POP) reflect the deduction of the maximum initial sales charge and applicable CDSC, while Returns at Net Asset Value (NAV) do not.
After-tax returns are calculated using the highest historical individual federal income tax rate and do not reflect the impact of state and local taxes. Actual after-tax returns depend on a shareholder’s tax situation and may differ from those shown. After-tax returns are not relevant for shareholders who hold shares in tax-deferred accounts or to shares held by non-taxable entities. Return After Taxes on Distributions for a period may be the same as Return Before Taxes for that period because no distributions were paid during that period, or because the taxable portion of distributions made during the period was insignificant. Also, Return After Taxes on Distributions and Sale of Fund Shares for a period may be greater than Return After Taxes on Distributions for the same period because of realized losses on the sale of Fund shares.
Past performance is no guarantee of future results. Returns are historical and are calculated by determining the percentage change in net asset value or offering price (as applicable) with all distributions reinvested. Investment return and principal value will fluctuate so that shares, when redeemed, may be worth more or less than their original cost. Performance is for the stated time period only; due to market volatility, the Fund’s current performance may be lower or higher than the quoted return. For performance as of the most recent month-end, please refer to www.eatonvance.com.
5
Eaton Vance Tax-Managed Small-Cap Growth Fund 1.2 as of October 31, 2005
FUND EXPENSES
Example: As a shareholder of the Fund, you incur two types of costs: (1) transaction costs, including sales charges (loads) on purchases and redemption fees (if applicable); and (2) ongoing costs, including management fees; distribution or service fees; and other Fund expenses. This Example is intended to help you understand your ongoing costs (in dollars) of investing in the Fund and to compare these costs with the ongoing costs of investing in other mutual funds. The Example is based on an investment of $1,000 invested at the beginning of the period and held for the entire period (May 1, 2005 – October 31, 2005).
Actual Expenses: The first section of the table below provides information about actual account values and actual expenses. You may use the information in this line, together with the amount you invested, to estimate the expenses that you paid over the period. Simply divide your account value by $1,000 (for example, an $8,600 account value divided by $1,000 = 8.6), then multiply the result by the number in the first section under the heading entitled “Expenses Paid During Period” to estimate the expenses you paid on your account during this period.
Hypothetical Example for Comparison Purposes: The second section of the table below provides information about hypothetical account values and hypothetical expenses based on the actual Fund expense ratio and an assumed rate of return of 5% per year (before expenses), which is not the actual return of the Fund. The hypothetical account values and expenses may not be used to estimate the actual ending account balance or expenses you paid for the period. You may use this information to compare the ongoing costs of investing in your Fund and other funds. To do so, compare this 5% hypothetical example with the 5% hypothetical examples that appear in the shareholder reports of the other funds.
Please note that the expenses shown in the table are meant to highlight your ongoing costs only and do not reflect any transactional costs, such as sales charges (loads) or redemption fees (if applicable). Therefore, the second section of the table is useful in comparing ongoing costs only, and will not help you determine the relative total costs of owning different funds. In addition, if these transactional costs were included, your costs would have been higher.
| | Eaton Vance Tax-Managed Small-Cap Growth Fund 1.2 | |
| | Beginning Account Value | | Ending Account Value | | Expenses Paid During Period* | |
| | (5/1/05) | | (10/31/05) | | (5/1/05 – 10/31/05) | |
| | | | | | | |
Actual | | | | | | | |
Class A | | $ | 1,000.00 | | $ | 1,111.00 | | $ | 8.73 | |
Class B | | $ | 1,000.00 | | $ | 1,109.00 | | $ | 12.76 | |
Class C | | $ | 1,000.00 | | $ | 1,107.60 | | $ | 12.75 | |
| | | | | | | |
Hypothetical | | | | | | | |
(5% return per year before expenses) | | | | | | | |
Class A | | $ | 1,000.00 | | $ | 1,016.90 | | $ | 8.34 | |
Class B | | $ | 1,000.00 | | $ | 1,013.10 | | $ | 12.18 | |
Class C | | $ | 1,000.00 | | $ | 1,013.10 | | $ | 12.18 | |
* Expenses are equal to the Fund’s annualized expense ratio of 1.64% for Class A shares, 2.40% for Class B shares, and 2.40% for Class C shares multiplied by the average account value over the period, multiplied by 184/365 (to reflect the one-half year period). The example assumes that the $1,000 was invested at the net asset value per share determined at the close of business on April 30, 2005. The Example reflects the expenses of both the Fund and the Portfolio.
6
Eaton Vance Tax-Managed Small-Cap Growth Fund 1.2 as of October 31, 2005
FINANCIAL STATEMENTS
Statement of Assets and Liabilities
As of October 31, 2005
| Assets | |
Investment in Tax-Managed Small-Cap Growth Portfolio, at value
(identified cost, $27,782,855) | | $ | 32,645,323 | | |
| Receivable for Fund shares sold | | | 97,846 | | |
| Total assets | | $ | 32,743,169 | | |
| Liabilities | |
| Payable for Fund shares redeemed | | $ | 44,325 | | |
| Payable to affiliate for distribution and service fees | | | 20,412 | | |
| Payable to affiliate for Administration fee | | | 4,190 | | |
| Payable to affiliate for Trustees' fees | | | 19 | | |
| Accrued expenses | | | 42,024 | | |
| Total liabilities | | $ | 110,970 | | |
| Net Assets | | $ | 32,632,199 | | |
| Sources of Net Assets | |
| Paid-in capital | | $ | 36,287,534 | | |
Accumulated net realized loss from Portfolio (computed on
the basis of identified cost) | | | (8,511,947 | ) | |
| Accumulated net investment loss | | | (5,856 | ) | |
Net unrealized appreciation from Portfolio (computed on the basis of
identified cost) | | | 4,862,468 | | |
| Total | | $ | 32,632,199 | | |
| Class A Shares | |
| Net Assets | | $ | 11,796,612 | | |
| Shares Outstanding | | | 1,419,014 | | |
Net Asset Value and Redemption Price Per Share
(net assets ÷ shares of beneficial interest outstanding) | | $ | 8.31 | | |
Maximum Offering Price Per Share
(100 ÷ 94.25 of $8.31) | | $ | 8.82 | | |
| Class B Shares | |
| Net Assets | | $ | 11,522,882 | | |
| Shares Outstanding | | | 1,433,954 | | |
Net Asset Value, Offering Price and Redemption Price Per Share
(net assets ÷ shares of beneficial interest outstanding) | | $ | 8.04 | | |
| Class C Shares | |
| Net Assets | | $ | 9,312,705 | | |
| Shares Outstanding | | | 1,159,808 | | |
Net Asset Value, Offering Price and Redemption Price Per Share
(net assets ÷ shares of beneficial interest outstanding) | | $ | 8.03 | | |
| On sales of $50,000 or more, the offering price of Class A shares is reduced. | |
Statement of Operations
For the Year Ended
October 31, 2005
| Investment Income | |
| Dividends allocated from Portfolio (net of foreign taxes, $1,799) | | $ | 103,051 | | |
| Interest allocated from Portfolio | | | 36,875 | | |
| Expenses allocated from Portfolio | | | (257,053 | ) | |
| Net investment loss from Portfolio | | $ | (117,127 | ) | |
| Expenses | |
| Administration fee | | $ | 52,015 | | |
| Trustees' fees and expenses | | | 167 | | |
Distribution and service fees
Class A | | | 31,317 | | |
| Class B | | | 119,004 | | |
| Class C | | | 102,497 | | |
| Transfer and dividend disbursing agent fees | | | 78,598 | | |
| Registration fees | | | 47,093 | | |
| Printing and postage | | | 22,272 | | |
| Legal and accounting services | | | 17,046 | | |
| Custodian fee | | | 3,060 | | |
| Miscellaneous | | | 6,200 | | |
| Total expenses | | $ | 479,269 | | |
| Net investment loss | | $ | (596,396 | ) | |
Realized and Unrealized
Gain (Loss) from Portfolio | |
Net realized gain (loss) —
Investment transactions (identified cost basis) | | $ | 4,230,945 | | |
| Foreign currency transactions | | | (775 | ) | |
| Net realized gain | | $ | 4,230,170 | | |
Change in unrealized appreciation (depreciation) —
Investments (identified cost basis) | | $ | (944,297 | ) | |
| Foreign currency | | | 125 | | |
| Net change in unrealized appreciation (depreciation) | | $ | (944,172 | ) | |
| Net realized and unrealized gain | | $ | 3,285,998 | | |
| Net increase in net assets from operations | | $ | 2,689,602 | | |
See notes to financial statements
7
Eaton Vance Tax-Managed Small-Cap Growth Fund 1.2 as of October 31, 2005
FINANCIAL STATEMENTS CONT'D
Statements of Changes in Net Assets
Increase (Decrease)
in Net Assets | | Year Ended
October 31, 2005 | | Year Ended
October 31, 2004 | |
From operations —
Net investment loss | | $ | (596,396 | ) | | $ | (740,778 | ) | |
Net realized gain from investment
transactions, payments by affiliate
and foreign currency transactions | | | 4,230,170 | | | | 1,564,108 | | |
Net change in unrealized appreciation
(depreciation) of investments and
foreign currency | | | (944,172 | ) | | | (1,883,094 | ) | |
Net increase (decrease) in net assets
from operations | | $ | 2,689,602 | | | $ | (1,059,764 | ) | |
Transactions in shares of beneficial interest —
Proceeds from sale of shares
Class A | | $ | 2,711,488 | | | $ | 3,049,014 | | |
| Class B | | | 2,128,473 | | | | 1,601,406 | | |
| Class C | | | 830,535 | | | | 1,909,527 | | |
Cost of shares redeemed
Class A | | | (4,565,631 | ) | | | (6,111,890 | ) | |
| Class B | | | (2,880,393 | ) | | | (2,738,157 | ) | |
| Class C | | | (3,436,095 | ) | | | (4,086,660 | ) | |
Net asset value of shares exchanged
Class A | | | 65,737 | | | | 49,688 | | |
| Class B | | | (65,737 | ) | | | (49,688 | ) | |
Net decrease in net assets from
Fund share transactions | | $ | (5,211,623 | ) | | $ | (6,376,760 | ) | |
| Net decrease in net assets | | $ | (2,522,021 | ) | | $ | (7,436,524 | ) | |
| Net Assets | |
| At beginning of year | | $ | 35,154,220 | | | $ | 42,590,744 | | |
| At end of year | | $ | 32,632,199 | | | $ | 35,154,220 | | |
Accumulated net
investment loss included
in net assets | |
| At end of year | | $ | (5,856 | ) | | $ | (113,453 | ) | |
See notes to financial statements
8
Eaton Vance Tax-Managed Small-Cap Growth Fund 1.2 as of October 31, 2005
FINANCIAL STATEMENTS CONT'D
Financial Highlights
| | | Class A | |
| | | Year Ended October 31, | | Period Ended | |
| | | 2005 | | 2004 | | 2003 | | 2002 | | October 31, 2001(1) | |
| Net asset value — Beginning of year | | $ | 7.670 | | | $ | 7.810 | | | $ | 6.200 | | | $ | 8.010 | | | $ | 10.000 | | |
| Income (loss) from operations | |
| Net investment loss(2) | | $ | (0.101 | ) | | $ | (0.108 | ) | | $ | (0.096 | ) | | $ | (0.087 | ) | | $ | (0.066 | ) | |
| Net realized and unrealized gain (loss) | | | 0.741 | | | | (0.032 | ) | | | 1.706 | | | | (1.723 | ) | | | (1.924 | ) | |
| Total income (loss) from operations | | $ | 0.640 | | | $ | (0.140 | ) | | $ | 1.610 | | | $ | (1.810 | ) | | $ | (1.990 | ) | |
| Net asset value — End of year | | $ | 8.310 | | | $ | 7.670 | | | $ | 7.810 | | | $ | 6.200 | | | $ | 8.010 | | |
| Total Return(3) | | | 8.34 | % | | | (1.79 | )%(4) | | | 25.97 | % | | | (22.60 | )% | | | (19.90 | )% | |
| Ratios/Supplemental Data† | |
| Net assets, end of year (000's omitted) | | $ | 11,797 | | | $ | 12,545 | | | $ | 15,910 | | | $ | 13,750 | | | $ | 9,419 | | |
| Ratios (As a percentage of average daily net assets): | |
| Net expenses(5) | | | 1.64 | % | | | 1.65 | % | | | 1.65 | % | | | 1.39 | % | | | 1.35 | %(6) | |
| Net expenses after custodian fee reduction(5) | | | 1.64 | % | | | 1.65 | % | | | 1.65 | % | | | 1.39 | % | | | 1.33 | %(6) | |
| Net investment loss | | | (1.24 | )% | | | (1.40 | )% | | | (1.44 | )% | | | (1.15 | )% | | | (1.13 | )%(6) | |
| Portfolio Turnover of the Portfolio | | | 223 | % | | | 282 | % | | | 248 | % | | | 131 | % | | | 38 | % | |
† The operating expenses of the Fund reflect a reduction of the investment adviser fee of the Portfolio and an allocation of expenses to the Administrator. Had such action not been taken, the net investment loss per share and the ratios would have been as follows:
| Ratios (As a percentage of average daily net assets): | |
| Expenses(5) | | | 1.64 | % | | | 1.67 | % | | | 1.70 | % | | | 1.66 | % | | | 2.35 | %(6) | |
| Expenses after custodian fee reduction(5) | | | 1.64 | % | | | 1.67 | % | | | 1.70 | % | | | 1.66 | % | | | 2.33 | %(6) | |
| Net investment loss | | | (1.24 | )% | | | (1.42 | )% | | | (1.49 | )% | | | (1.42 | )% | | | (2.13 | )%(6) | |
| Net investment loss per share(2) | | $ | (0.101 | ) | | $ | (0.110 | ) | | $ | (0.100 | ) | | $ | (0.107 | ) | | $ | (0.124 | ) | |
(1) For the period from the start of business, March 2, 2001, to October 31, 2001.
(2) Net investment loss per share was computed using average shares outstanding.
(3) Returns are historical and are calculated by determining the percentage change in net asset value with all distributions reinvested. Total return is not computed on an annualized basis.
(4) The effect of the Fund's net increase from payments by affiliate and net gains (losses), through its investment in the Portfolio, realized on the disposal of investments purchased which did not meet the Portfolio's investment guidelines amounted to $0.01 per share. Had such actions not been taken, the total return would have been (1.92)% for the year ended October 31, 2004.
(5) Includes the Fund's share of the Portfolio's allocated expenses.
(6) Annualized.
See notes to financial statements
9
Eaton Vance Tax-Managed Small-Cap Growth Fund 1.2 as of October 31, 2005
FINANCIAL STATEMENTS CONT'D
Financial Highlights
| | | Class B | |
| | | Year Ended October 31, | | Period Ended | |
| | | 2005 | | 2004 | | 2003 | | 2002 | | October 31, 2001(1) | |
| Net asset value — Beginning of year | | $ | 7.460 | | | $ | 7.660 | | | $ | 6.120 | | | $ | 7.970 | | | $ | 10.000 | | |
| Income (loss) from operations | |
| Net investment loss(2) | | $ | (0.157 | ) | | $ | (0.162 | ) | | $ | (0.145 | ) | | $ | (0.142 | ) | | $ | (0.110 | ) | |
| Net realized and unrealized gain (loss) | | | 0.737 | | | | (0.038 | ) | | | 1.685 | | | | (1.708 | ) | | | (1.920 | ) | |
| Total income (loss) from operations | | $ | 0.580 | | | $ | (0.200 | ) | | $ | 1.540 | | | $ | (1.850 | ) | | $ | (2.030 | ) | |
| Net asset value — End of year | | $ | 8.040 | | | $ | 7.460 | | | $ | 7.660 | | | $ | 6.120 | | | $ | 7.970 | | |
| Total Return(3) | | | 7.78 | % | | | (2.61 | )%(4) | | | 25.16 | % | | | (23.21 | )% | | | (20.30 | )% | |
| Ratios/Supplemental Data† | |
| Net assets, end of year (000's omitted) | | $ | 11,523 | | | $ | 11,480 | | | $ | 13,028 | | | $ | 9,550 | | | $ | 7,125 | | |
| Ratios (As a percentage of average daily net assets): | |
| Net expenses(5) | | | 2.39 | % | | | 2.40 | % | | | 2.40 | % | | | 2.14 | % | | | 2.10 | %(6) | |
| Net expenses after custodian fee reduction(5) | | | 2.39 | % | | | 2.40 | % | | | 2.40 | % | | | 2.14 | % | | | 2.08 | %(6) | |
| Net investment loss | | | (1.99 | )% | | | (2.14 | )% | | | (2.20 | )% | | | (1.90 | )% | | | (1.89 | )%(6) | |
| Portfolio Turnover of the Portfolio | | | 223 | % | | | 282 | % | | | 248 | % | | | 131 | % | | | 38 | % | |
† The operating expenses of the Fund reflect a reduction of the investment adviser fee of the Portfolio and an allocation of expenses to the Administrator. Had such action not been taken, the net investment loss per share and the ratios would have been as follows:
| Ratios (As a percentage of average daily net assets): | |
| Expensess(5) | | | 2.39 | % | | | 2.42 | % | | | 2.43 | % | | | 2.41 | % | | | 3.10 | %(6) | |
| Expenses after custodian fee reductions(5) | | | 2.39 | % | | | 2.42 | % | | | 2.43 | % | | | 2.41 | % | | | 3.08 | %(6) | |
| Net investment loss | | | (1.99 | )% | | | (2.16 | )% | | | (2.23 | )% | | | (2.17 | )% | | | (2.89 | )%(6) | |
| Net investment loss per share(2) | | $ | (0.157 | ) | | $ | (0.164 | ) | | $ | (0.147 | ) | | $ | (0.162 | ) | | $ | (0.168 | ) | |
(1) For the period from the start of business, March 2, 2001, to October 31, 2001.
(2) Net investment loss per share was computed using average shares outstanding.
(3) Returns are historical and are calculated by determining the percentage change in net asset value with all distributions reinvested. Total return is not computed on an annualized basis.
(4) The effect of the Fund's net increase from payments by affiliate and net gains (losses), through its investment in the Portfolio, realized on the disposal of investments purchased which did not meet the Portfolio's investment guidelines amounted to less than $0.01 per share and had no effect on total return for the year ended October 31, 2004.
(5) Includes the Fund's share of the Portfolio's allocated expenses.
(6) Annualized.
See notes to financial statements
10
Eaton Vance Tax-Managed Small-Cap Growth Fund 1.2 as of October 31, 2005
FINANCIAL STATEMENTS CONT'D
Financial Highlights
| | | Class C | |
| | | Year Ended October 31, | | Period Ended | |
| | | 2005 | | 2004 | | 2003 | | 2002 | | October 31, 2001(1) | |
| Net asset value — Beginning of year | | $ | 7.460 | | | $ | 7.660 | | | $ | 6.120 | | | $ | 7.980 | | | $ | 10.000 | | |
| Income (loss) from operations | |
| Net investment loss(2) | | $ | (0.158 | ) | | $ | (0.162 | ) | | $ | (0.144 | ) | | $ | (0.143 | ) | | $ | (0.111 | ) | |
| Net realized and unrealized gain (loss) | | | 0.728 | | | | (0.038 | ) | | | 1.684 | | | | (1.717 | ) | | | (1.909 | ) | |
| Total income (loss) from operations | | $ | 0.570 | | | $ | (0.200 | ) | | $ | 1.540 | | | $ | (1.860 | ) | | $ | (2.020 | ) | |
| Net asset value — End of year | | $ | 8.030 | | | $ | 7.460 | | | $ | 7.660 | | | $ | 6.120 | | | $ | 7.980 | | |
| Total Return(3) | | | 7.64 | % | | | (2.61 | )%(4) | | | 25.16 | % | | | (23.31 | )% | | | (20.20 | )% | |
| Ratios/Supplemental Data† | |
| Net assets, end of year (000's omitted) | | $ | 9,313 | | | $ | 11,129 | | | $ | 13,652 | | | $ | 12,152 | | | $ | 9,747 | | |
| Ratios (As a percentage of average daily net assets): | |
| Net expenses(5) | | | 2.39 | % | | | 2.40 | % | | | 2.40 | % | | | 2.14 | % | | | 2.10 | %(6) | |
| Net expenses after custodian fee reduction(5) | | | 2.39 | % | | | 2.40 | % | | | 2.40 | % | | | 2.14 | % | | | 2.08 | %(6) | |
| Net investment loss | | | (1.99 | )% | | | (2.15 | )% | | | (2.20 | )% | | | (1.90 | )% | | | (1.88 | )%(6) | |
| Portfolio Turnover of the Portfolio | | | 223 | % | | | 282 | % | | | 248 | % | | | 131 | % | | | 38 | % | |
† The operating expenses of the Fund reflect a reduction of the investment adviser fee of the Portfolio and an allocation of expenses to the Administrator. Had such action not been taken, the net investment loss per share and the ratios would have been as follows:
Ratios (As a percentage of average daily net assets):
| Expenses(5) | | | 2.39 | % | | | 2.42 | % | | | 2.44 | % | | | 2.41 | % | | | 3.10 | %(6) | |
| Expenses after custodian fee reduction(5) | | | 2.39 | % | | | 2.42 | % | | | 2.44 | % | | | 2.41 | % | | | 3.08 | %(6) | |
| Net investment loss | | | (1.99 | )% | | | (2.17 | )% | | | (2.24 | )% | | | (2.17 | )% | | | (2.88 | )%(6) | |
| Net investment loss per share(2) | | $ | (0.158 | ) | | $ | (0.164 | ) | | $ | (0.147 | ) | | $ | (0.163 | ) | | $ | (0.170 | ) | |
(1) For the period from the start of business, March 2, 2001, to October 31, 2001.
(2) Net investment loss per share was computed using average shares outstanding.
(3) Returns are historical and are calculated by determining the percentage change in net asset value with all distributions reinvested. Total return is not computed on an annualized basis.
(4) The effect of the Fund's net increase from payments by affiliate and net gains (losses), through its investment in the Portfolio, realized on the disposal of investments purchased which did not meet the Portfolio's investment guidelines amounted to less than $0.01 per share and had no effect on total return for the year ended October 31, 2004.
(5) Includes the Fund's share of the Portfolio's allocated expenses.
(6) Annualized.
See notes to financial statements
11
Eaton Vance Tax-Managed Small-Cap Growth Fund 1.2 as of October 31, 2005
NOTES TO FINANCIAL STATEMENTS
1 Significant Accounting Policies
Eaton Vance Tax-Managed Small-Cap Growth Fund 1.2 (the Fund) is a diversified series of Eaton Vance Mutual Funds Trust (the Trust). The Trust is an entity of the type commonly known as a Massachusetts business trust and is registered under the Investment Company Act of 1940, as amended, as an open-end management investment company. The Fund currently offers three classes of shares. Class A shares are generally sold subject to a sales charge imposed at time of purchase. Class B and Class C shares are sold at net asset value and are subject to a contingent deferred sales charge (see Note 6). Class B shares held for eight years will automatically convert to Class A shares. Each class represents a pro-rata interest in the Fund, but votes separately on class-specific matters and (as noted below) is subject to different expenses. Realized and unrealized gains and losses and net investment income and losses, other than class-specific e xpenses, are allocated daily to each class of shares based on the relative net assets of each class to the total net assets of the Fund. Each class of shares differs in its distribution plan and certain other class-specific expenses. The Fund invests all of its investable assets in interests of the Tax-Managed Small-Cap Growth Portfolio (the Portfolio), a New York Trust, having the same investment objective as the Fund. The value of the Fund's investment in the Portfolio reflects the Fund's proportionate interest in the net assets of the Portfolio (21.3% at October 31, 2005). The performance of the Fund is directly affected by the performance of the Portfolio. The financial statements of the Portfolio, including the Portfolio of Investments, are included elsewhere in this report and should be read in conjunction with the Fund's financial statements.
The following is a summary of significant accounting policies consistently followed by the Fund in the preparation of its financial statements. The policies are in conformity with accounting principles generally accepted in the United States of America.
A Investment Valuation — Valuation of securities by the Portfolio is discussed in Note 1A of the Portfolio's Notes to Financial Statements which are included elsewhere in this report.
B Income — The Fund's net investment income or loss consists of the Fund's pro-rata share of the net investment income or loss of the Portfolio, less all actual and accrued expenses of the Fund determined in accordance with accounting principles generally accepted in the United States of America.
C Expenses — The majority of expenses of the Trust are directly identifiable to an individual fund. Expenses which are not readily identifiable to a specific fund are allocated taking into consideration, among other things, the nature and type of expense and the relative size of the fund.
D Indemnifications — Under the Trust's organizational documents, its officers and Trustees may be indemnified against certain liabilities and expenses arising out of the performance of their duties to the Fund, and shareholders are indemnified against personal liability for obligations of the Trust. Additionally, in the normal course of business, the Fund enters into agreements with service providers that may contain indemnification clauses. The Fund's maximum exposure under these arrangements is unknown as this would involve future claims that may be made against the Fund that have not yet occurred.
E Federal Taxes — The Fund's policy is to comply with the provisions of the Internal Revenue Code applicable to regulated investment companies and to distribute to shareholders each year all of its taxable income, including any net realized gain on investments. Accordingly, no provision for federal income or excise tax is necessary. At October 31, 2005, the Fund, for federal income tax purposes, had a capital loss carryover of $6,135,010 which will reduce the taxable income arising from future net realized gain on investments, if any, to the extent permitted by the Internal Revenue Code and thus will reduce the amount of distributions to shareholders which would otherwise be necessary to relieve the Fund of any liability for federal income or excise tax. Such capital loss carryover will expire on October 31, 2010.
F Expense Reduction — Investors Bank & Trust Company (IBT) serves as custodian to the Fund and the Portfolio. Pursuant to the respective custodian agreements, IBT receives a fee reduced by credits which are determined based on the average daily cash balances the Fund or the Portfolio maintains with IBT. All credit balances used to reduce the Fund's custodian fees are reported as a reduction of total expenses in the Statement of Operations.
G Other — Investment transactions are accounted for on a trade-date basis. Dividends to shareholders are recorded on the ex-dividend date.
H Use of Estimates — The preparation of the financial statements in conformity with accounting principles generally accepted in the United States of America requires
12
Eaton Vance Tax-Managed Small-Cap Growth Fund 1.2 as of October 31, 2005
NOTES TO FINANCIAL STATEMENTS CONT'D
management to make estimates and assumptions that affect the reported amounts of assets and liabilities at the date of the financial statements and the reported amounts of income and expense during the reporting period. Actual results could differ from those estimates.
2 Distributions to Shareholders
It is the present policy of the Fund to make at least one distribution annually (normally in December) of all or substantially all of its net investment income, if any, and at least one distribution annually of all or substantially all of its net realized capital gains (reduced by available capital loss carryforwards from prior years, if any.) Distributions are declared separately for each class of shares. Shareholders may reinvest all distributions in additional shares of the same class of the Fund at the net asset value as of the close of business on the reinvestment date. Distributions are paid in the form of additional shares of the same class of the Fund, or at the election of the shareholder, in cash. The Fund distinguishes between distributions on a tax basis and a financial reporting basis. Accounting principles generally accepted in the United States of America require that only distributions in excess of tax basis earn ings and profits be reported in the financial statements as a return of capital. Permanent differences between book and tax accounting relating to distributions are reclassified to paid-in capital.
During the year ended October 31, 2005, accumulated paid-in capital was decreased by $676,164, net investment loss was decreased by $703,993, and accumulated net realized loss was increased by $27,829 primarily due to differences between book and tax accounting treatment of net operating losses, foreign currency gains and losses and passive foreign investment companies. This change had no effect on the net assets or the net asset value per share.
As of October 31, 2005, the components of distributable earnings (accumulated losses) on a tax basis were as follows:
| Capital loss carryforwards | | $ | (6,135,010 | ) | |
| Unrealized appreciation | | $ | 2,485,531 | | |
| Other temporay differences | | $ | (5,856 | ) | |
3 Shares of Beneficial Interest
The Fund's Declaration of Trust permits the Trustees to issue an unlimited number of full and fractional shares of beneficial interest (without par value). Transactions in Fund shares were as follows:
| | | Year Ended October 31, | |
| Class A | | 2005 | | 2004 | |
| Sales | | | 335,230 | | | | 387,692 | | |
| Redemptions | | | (560,908 | ) | | | (793,963 | ) | |
| Exchanges from Class B shares | | | 8,308 | | | | 6,485 | | |
| Net decrease | | | (217,370 | ) | | | (399,786 | ) | |
| | | Year Ended October 31, | |
| Class B | | 2005 | | 2004 | |
| Sales | | | 271,537 | | | | 210,519 | | |
| Redemptions | | | (367,125 | ) | | | (366,682 | ) | |
| Exchanges to Class A shares | | | (8,569 | ) | | | (6,616 | ) | |
| Net decrease | | | (104,157 | ) | | | (162,779 | ) | |
| | | Year Ended October 31, | |
| Class C | | 2005 | | 2004 | |
| Sales | | | 105,157 | | | | 246,229 | | |
| Redemptions | | | (437,553 | ) | | | (536,500 | ) | |
| Net decrease | | | (332,396 | ) | | | (290,271 | ) | |
4 Transactions with Affiliates
The administration fee is earned by Eaton Vance Management (EVM) as compensation for managing and administering the business affairs of the Fund. Under the administration agreement, EVM earns a fee in the amount of 0.15% per annum of average daily net assets of the Fund. For the year ended October 31, 2005, the administration fee amounted to $52,015. The Portfolio has engaged Boston Management and Research (BMR), a subsidiary of EVM, to render investment advisory services. See Note 2 of the Portfolio's Notes to Financial Statements which are included elsewhere in this report. EVM serves as the sub-transfer agent of the Fund and receives from the transfer agent an aggregate fee based upon the actual expenses incurred by EVM in the performance of those services. For the year ended October 31, 2005, EVM earned $6,354 in sub-transfer agent fees.
13
Eaton Vance Tax-Managed Small-Cap Growth Fund 1.2 as of October 31, 2005
NOTES TO FINANCIAL STATEMENTS CONT'D
Except for Trustees of the Fund and the Portfolio who are not members of EVM's or BMR's organization, officers and Trustees receive remuneration for their services to the Fund out of the investment adviser fee earned by BMR. Trustees of the Fund who are not affiliated with EVM or BMR may elect to defer receipt of all or a percentage of their annual fees in accordance with the terms of the Trustees Deferred Compensation Plan. For year ended October 31, 2005, no significant amounts have been deferred.
Eaton Vance Distributors, Inc. (EVD), a subsidiary of EVM and the Fund's principal underwriter, received $3,380 as its portion of the sales charge on sales of Class A shares for the year ended October 31, 2005.
Certain officers and Trustees of the Fund and Portfolio are officers of the above organizations.
5 Distribution and Service Plans
The Fund has in effect distribution plans for Class B shares (Class B Plan) and Class C shares (Class C Plan) pursuant to Rule 12b-1 under the Investment Company Act of 1940 and a service plan for Class A shares (Class A Plan) (collectively, the Plans). The Class B and Class C Plans require the Fund to pay EVD amounts equal to 1/365 of 0.75% of the Fund's average daily net assets attributable to Class B and Class C shares for providing ongoing distribution services and facilities to the Fund. The Fund will automatically discontinue payments to EVD during any period in which there are no outstanding Uncovered Distribution Charges, which are equivalent to the sum of (i) 6.25% of the aggregate amount received by the Fund for the Class B and Class C shares sold, plus (ii) interest calculated by applying the rate of 1% over the prevailing prime rate to the outstanding balance of Uncovered Distribution Charges of EVD of each respectiv e class, reduced by the aggregate amount of contingent deferred sales charges (see Note 6) and daily amounts theretofore paid to EVD by each respective class. The Fund paid or accrued $89,253 and $76,873 for Class B and Class C shares, respectively, to or payable to EVD for the year ended October 31, 2005, representing 0.75% of the average daily net assets for Class B and Class C shares, respectively. At October 31, 2005, the amount of Uncovered Distribution Charges of EVD calculated under the Plans was approximately $705,000 and $1,300,000 for Class B and Class C shares, respectively.
The Plans authorize the Fund to make payments of service fees to EVD, investment dealers and other persons in the amount of 0.25% of the Fund's average daily net assets attributable to Class A, Class B, and Class C shares for each fiscal year. Service fee payments will be made for personal services and/or the maintenance of shareholder accounts. Service fees are separate and distinct from the sales commissions and distribution fees payable by the Fund to EVD and, as such, are not subject to automatic discontinuance when there are no outstanding Uncovered Distribution Charges of EVD. Service fee payments for the year ended October 31, 2005 amounted to $31,317, $29,751, and $25,624 for Class A, Class B, and Class C shares, respectively.
6 Contingent Deferred Sales Charge
A contingent deferred sales charge (CDSC) generally is imposed on redemptions of Class B shares made within six years of purchase and on redemptions of Class C shares made within one year of purchase. Generally, the CDSC is based upon the lower of the net asset value at date of redemption or date of purchase. No charge is levied on shares acquired by reinvestment of dividends or capital gain distributions. Class A shares may be subject to a 1% CDSC if redeemed within one year of purchase (depending upon the circumstances of the purchase). The Class B CDSC is imposed at declining rates that begin at 5% in the case of redemptions in the first and second year after purchase, declining one percentage point in each subsequent year. Class C shares will be subject to a 1% CDSC if redeemed within one year of purchase.
No CDSC is levied on shares which have been sold to EVM, its affiliates, or to their respective employees or clients and may be waived under certain other limited conditions. CDSC charges received on Class B and Class C redemptions are paid to EVD to reduce the amount of Uncovered Distribution Charges calculated under the Class B and Class C Plans, respectively (see Note 5). CDSC assessed on Class B, and Class C shares when no Uncovered Distribution Charges exist for the respective class will be credited to the Fund. EVD received approximately $100, $53,000 and $1,000 of CDSC paid by shareholders for Class A shares, Class B shares, and Class C shares, respectively, for the year ended October 31, 2005.
14
Eaton Vance Tax-Managed Small-Cap Growth Fund 1.2 as of October 31, 2005
NOTES TO FINANCIAL STATEMENTS CONT'D
7 Investment Transactions
Increases and decreases in the Fund's investment in the Portfolio for the year ended October 31, 2005, aggregated $5,575,856 and $11,347,869, respectively.
8 Subsequent Event
On November 14, 2005, the Board of Trustees of the Trust unanimously approved the merger of Eaton Vance Tax-Managed Small-Cap Growth Fund 1.2 into Eaton Vance Tax-Managed Small-Cap Growth Fund 1.1, another series of the Trust. Specifically, the Board approved an Agreement and Plan of Reorganization ("Plan of Reorganization") with respect to the merger. Under the terms of the Plan of Reorganization, Eaton Vance Tax-Managed Small-Cap Growth Fund 1.2 will transfer all of its assets to Eaton Vance Tax-Managed Small-Cap Growth Fund 1.1, and Eaton Vance Tax-Managed Small-Cap Growth Fund 1.1 will assume the liabilities of Eaton Vance Tax-Managed Small-Cap Growth Fund 1.2. It is expected that the Reorganization will be treated as a tax-free reorganization for federal tax purposes.
15
Eaton Vance Tax-Managed Small-Cap Growth Fund 1.2 as of October 31, 2005
REPORT OF INDEPENDENT REGISTERED PUBLIC ACCOUNTING FIRM
To the Trustees of Eaton Vance Mutual Funds Trust and Shareholders of Eaton Vance
Tax-Managed Small-Cap Growth Fund 1.2:
We have audited the accompanying statement of assets and liabilities of Eaton Vance Tax-Managed Small-Cap Growth Fund 1.2 (the Fund) (one of the series of Eaton Vance Mutual Funds Trust) as of October 31, 2005, and the related statement of operations for the year then ended, the statements of changes in net assets for each of the two years in the period then ended and the financial highlights for each of the four years in the period then ended and the period from the start of business, March 2, 2001 to October 31, 2001. These financial statements and financial highlights are the responsibility of the Fund's management. Our responsibility is to express an opinion on these financial statements and financial highlights based on our audits.
We conducted our audits in accordance with standards of the Public Company Accounting Oversight Board (United States). Those standards require that we plan and perform the audits to obtain reasonable assurance about whether the financial statements and financial highlights are free of material misstatement. The Fund is not required to have, nor were we engaged to perform, an audit of its internal control over financial reporting. An audit includes consideration of internal control over financial reporting as a basis for designing audit procedures that are appropriate in the circumstances, but not for the purpose of expressing an opinion on the effectiveness of the Fund's internal control over financial reporting. Accordingly, we express no such opinion. An audit also includes examining, on a test basis, evidence supporting the amounts and disclosures in the financial statements, assessing the accounting principles used and signi ficant estimates made by management, as well as evaluating the overall financial statement presentation. We believe that our audits provide a reasonable basis for our opinion.
In our opinion, such financial statements and financial highlights referred to above present fairly, in all material respects, the financial position of Eaton Vance Tax-Managed Small-Cap Growth Fund 1.2 as of October 31, 2005, the results of its operations for the year ended, the changes in its net assets for each of the two years in the period then ended, and its financial highlights for each of the four years in the period then ended, and for the period from start of business, March 2, 2001 to October 31, 2001, in conformity with accounting principles generally accepted in the United States of America.
DELOITTE & TOUCHE LLP
Boston, Massachusetts
December 19, 2005
16
Tax-Managed Small-Cap Growth Portfolio as of October 31, 2005
PORTFOLIO OF INVESTMENTS
| Common Stocks — 92.7% | |
| Security | | Shares | | Value | |
| Aerospace & Defense — 2.5% | |
| Aviall, Inc.(1) | | | 46,000 | | | $ | 1,451,300 | | |
| DRS Technologies, Inc. | | | 31,700 | | | | 1,561,542 | | |
| Teledyne Technologies, Inc.(1) | | | 21,500 | | | | 758,090 | | |
| | | $ | 3,770,932 | | |
| Air Freight & Logistics — 1.7% | |
| Hub Group, Inc., Class A(1) | | | 35,000 | | | $ | 1,272,950 | | |
| UTI Worldwide, Inc.(2) | | | 16,400 | | | | 1,402,856 | | |
| | | $ | 2,675,806 | | |
| Beverages — 0.7% | |
| Cott Corp.(1)(2) | | | 26,900 | | | $ | 398,389 | | |
| Hansen Natural Corp.(1) | | | 13,930 | | | | 703,744 | | |
| | | $ | 1,102,133 | | |
| Biotechnology — 2.0% | |
| Abgenix, Inc.(1) | | | 166,000 | | | $ | 1,726,400 | | |
| United Therapeutics Corp.(1) | | | 17,400 | | | | 1,285,164 | | |
| | | $ | 3,011,564 | | |
| Capital Markets — 2.0% | |
| Affiliated Managers Group, Inc.(1) | | | 15,400 | | | $ | 1,181,950 | | |
| Greenhill & Co., Inc. | | | 40,800 | | | | 1,956,360 | | |
| | | $ | 3,138,310 | | |
| Commercial Services & Supplies — 2.0% | |
| Harland (John H.) Co. | | | 23,300 | | | $ | 969,047 | | |
| Resources Connection, Inc.(1) | | | 70,700 | | | | 2,018,485 | | |
| | | $ | 2,987,532 | | |
| Computers & Peripherals — 3.8% | |
| Novatel Wireless, Inc.(1) | | | 210,600 | | | $ | 2,674,620 | | |
| Palm, Inc.(1) | | | 81,722 | | | | 2,099,438 | | |
| Synaptics, Inc.(1) | | | 48,090 | | | | 1,117,131 | | |
| | | $ | 5,891,189 | | |
| Consumer Finance — 1.3% | |
| Student Loan Corp. (The) | | | 9,300 | | | $ | 2,038,560 | | |
| | | $ | 2,038,560 | | |
| Security | | Shares | | Value | |
| Diversified Consumer Services — 2.4% | |
| DeVry, Inc.(1) | | | 86,900 | | | $ | 1,963,940 | | |
| Education Management Corp.(1) | | | 25,700 | | | | 792,588 | | |
| Regis Corp. | | | 24,900 | | | | 955,164 | | |
| | | $ | 3,711,692 | | |
| Electric Utilities — 0.7% | |
| Westar Energy, Inc. | | | 47,500 | | | $ | 1,049,750 | | |
| | | $ | 1,049,750 | | |
| Electrical Equipment — 2.1% | |
| AMETEK, Inc. | | | 34,900 | | | $ | 1,421,477 | | |
| Roper Industries, Inc. | | | 45,800 | | | | 1,726,660 | | |
| | | $ | 3,148,137 | | |
| Energy Equipment & Services — 1.1% | |
| Todco, Class A(1) | | | 38,800 | | | $ | 1,736,300 | | |
| | | $ | 1,736,300 | | |
| Food & Staples Retailing — 1.0% | |
| Longs Drugstores Corp. | | | 37,000 | | | $ | 1,543,270 | | |
| | | $ | 1,543,270 | | |
| Health Care Equipment & Supplies — 7.2% | |
| Aspect Medical Systems, Inc.(1) | | | 53,100 | | | $ | 1,732,122 | | |
| DJ Orthopedics, Inc.(1) | | | 46,800 | | | | 1,360,944 | | |
| Hologic, Inc.(1) | | | 36,500 | | | | 2,024,290 | | |
| IDEXX Laboratories, Inc.(1) | | | 17,700 | | | | 1,241,301 | | |
| Intuitive Surgical, Inc.(1) | | | 18,100 | | | | 1,606,013 | | |
| Respironics, Inc.(1) | | | 53,100 | | | | 1,904,697 | | |
| Ventana Medical Systems, Inc.(1) | | | 30,400 | | | | 1,165,232 | | |
| | | $ | 11,034,599 | | |
| Health Care Providers & Services — 8.0% | |
| Chemed Corp. | | | 38,500 | | | $ | 1,851,080 | | |
| Community Health Systems, Inc.(1) | | | 38,200 | | | | 1,417,602 | | |
| eResearch Technology, Inc.(1) | | | 81,400 | | | | 1,166,462 | | |
| Health Net, Inc.(1) | | | 42,700 | | | | 2,000,068 | | |
| LifePoint Hospitals, Inc.(1) | | | 18,000 | | | | 703,800 | | |
| Pediatrix Medical Group, Inc.(1) | | | 13,000 | | | | 1,001,780 | | |
| Psychiatric Solutions, Inc.(1) | | | 17,900 | | | | 979,130 | | |
| United Surgical Partners International, Inc.(1) | | | 49,000 | | | | 1,756,650 | | |
See notes to financial statements
17
Tax-Managed Small-Cap Growth Portfolio as of October 31, 2005
PORTFOLIO OF INVESTMENTS CONT'D
| Security | | Shares | | Value | |
| Health Care Providers & Services (continued) | |
| VCA Antech, Inc.(1) | | | 53,300 | | | $ | 1,375,140 | | |
| | | $ | 12,251,712 | | |
| Hotels, Restaurants & Leisure — 6.1% | |
| Aztar Corp.(1) | | | 44,100 | | | $ | 1,326,087 | | |
| Cheesecake Factory, Inc. (The)(1) | | | 20,900 | | | | 717,288 | | |
| Choice Hotels International, Inc. | | | 44,200 | | | | 1,462,578 | | |
| CKE Restaurants, Inc.(1) | | | 60,800 | | | | 773,376 | | |
| Gaylord Entertainment Co.(1) | | | 33,600 | | | | 1,326,528 | | |
| Penn National Gaming, Inc.(1) | | | 20,704 | | | | 611,803 | | |
| Sonic Corp.(1) | | | 27,300 | | | | 790,062 | | |
| Starwood Hotels & Resorts Worldwide, Inc. | | | 27,200 | | | | 1,589,296 | | |
| Station Casinos, Inc. | | | 11,600 | | | | 743,560 | | |
| | | $ | 9,340,578 | | |
| Household Durables — 0.3% | |
| Jarden Corp.(1) | | | 11,950 | | | $ | 403,790 | | |
| | | $ | 403,790 | | |
| Household Products — 0.5% | |
| Central Garden & Pet Co.(1) | | | 18,300 | | | $ | 784,521 | | |
| | | $ | 784,521 | | |
| Insurance — 1.7% | |
| Philadelphia Consolidated Holding Corp.(1) | | | 12,300 | | | $ | 1,183,998 | | |
| Stewart Information Services Corp. | | | 28,900 | | | | 1,471,877 | | |
| | | $ | 2,655,875 | | |
| Internet Software & Services — 0.5% | |
| SINA Corp.(1)(2) | | | 32,537 | | | $ | 824,813 | | |
| | | $ | 824,813 | | |
| IT Services — 5.8% | |
| Cognizant Technology Solutions Corp.(1) | | | 34,300 | | | $ | 1,508,514 | | |
| Euronet Worldwide, Inc.(1) | | | 62,900 | | | | 1,767,490 | | |
| MoneyGram International, Inc. | | | 100,300 | | | | 2,437,290 | | |
| SI International, Inc.(1) | | | 55,000 | | | | 1,587,850 | | |
| SRA International, Inc., Class A(1) | | | 46,600 | | | | 1,529,412 | | |
| | | $ | 8,830,556 | | |
| Security | | Shares | | Value | |
| Machinery — 2.7% | |
| Actuant Corp., Class A | | | 37,100 | | | $ | 1,806,770 | | |
| Bucyrus International, Inc., Class A | | | 22,200 | | | | 922,410 | | |
| Joy Global, Inc. | | | 32,000 | | | | 1,467,840 | | |
| | | $ | 4,197,020 | | |
| Media — 2.0% | |
| Central European Media Enterprises, Ltd.(1)(2) | | | 64,400 | | | $ | 2,993,956 | | |
| | | $ | 2,993,956 | | |
| Metals & Mining — 0.1% | |
| Formation Capital Corp.(1)(2)(3)(4) | | | 400,000 | | | $ | 77,996 | | |
| | | $ | 77,996 | | |
| Multi-Utilities — 1.0% | |
| CMS Energy Corp.(1) | | | 101,100 | | | $ | 1,507,401 | | |
| | | $ | 1,507,401 | | |
| Oil, Gas & Consumable Fuels — 9.4% | |
| Alon USA Energy, Inc.(1) | | | 95,074 | | | $ | 1,853,943 | | |
| Denbury Resources, Inc.(1) | | | 44,300 | | | | 1,932,809 | | |
| Goodrich Petroleum Corp.(1) | | | 81,566 | | | | 1,818,922 | | |
| Peabody Energy Corp. | | | 30,700 | | | | 2,399,512 | | |
| Quicksilver Resources, Inc.(1) | | | 36,900 | | | | 1,429,137 | | |
| Southwestern Energy Co.(1) | | | 35,500 | | | | 2,575,170 | | |
| Vintage Petroleum, Inc. | | | 45,000 | | | | 2,335,050 | | |
| | | $ | 14,344,543 | | |
| Personal Products — 1.0% | |
| Chattem, Inc.(1) | | | 45,415 | | | $ | 1,498,695 | | |
| | | $ | 1,498,695 | | |
| Pharmaceuticals — 2.8% | |
| Cypress Bioscience, Inc. | | | 147,500 | | | $ | 746,350 | | |
| Hi-Tech Pharmacal Co., Inc.(1) | | | 28,600 | | | | 1,073,930 | | |
| MGI Pharma, Inc.(1) | | | 36,800 | | | | 690,368 | | |
| Penwest Pharmaceuticals Co.(1) | | | 69,500 | | | | 1,102,270 | | |
| Shire Pharmaceuticals Group PLC ADR | | | 20,300 | | | | 727,552 | | |
| | | $ | 4,340,470 | | |
See notes to financial statements
18
Tax-Managed Small-Cap Growth Portfolio as of October 31, 2005
PORTFOLIO OF INVESTMENTS CONT'D
| Security | | Shares | | Value | |
| Real Estate — 2.4% | |
| Strategic Hotel Capital, Inc. | | | 71,200 | | | $ | 1,209,688 | | |
| Taubman Centers, Inc. | | | 42,500 | | | | 1,401,225 | | |
| Trizec Properties, Inc. | | | 48,600 | | | | 1,081,350 | | |
| | | $ | 3,692,263 | | |
| Semiconductors & Semiconductor Equipment — 5.1% | |
| Advanced Analogic Technologies, Inc.(1) | | | 131,435 | | | $ | 1,432,641 | | |
| Advanced Energy Industries, Inc.(1) | | | 140,249 | | | | 1,507,677 | | |
| Atheros Communications, Inc.(1) | | | 160,000 | | | | 1,387,200 | | |
| Brooks Automation, Inc.(1) | | | 51,400 | | | | 601,894 | | |
| Ikanos Communications(1) | | | 12,880 | | | | 202,989 | | |
| Intersil Corp., Class A | | | 50,300 | | | | 1,144,828 | | |
| Veeco Instruments, Inc.(1) | | | 99,900 | | | | 1,587,411 | | |
| | | $ | 7,864,640 | | |
| Software — 5.1% | |
| Activision, Inc.(1) | | | 120,397 | | | $ | 1,898,660 | | |
| Blackbaud, Inc. | | | 60,700 | | | | 874,080 | | |
| i2 Technologies, Inc.(1) | | | 128,700 | | | | 1,572,714 | | |
| Intellisync Corp.(1) | | | 317,700 | | | | 1,381,995 | | |
| MICROS Systems, Inc.(1) | | | 33,100 | | | | 1,519,952 | | |
| NAVTEQ, Corp.(1) | | | 14,100 | | | | 551,592 | | |
| | | $ | 7,798,993 | | |
| Specialty Retail — 1.9% | |
| Hibbet Sporting Goods, Inc.(1) | | | 60,600 | | | $ | 1,589,538 | | |
| O'Reilly Automotive, Inc.(1) | | | 47,100 | | | | 1,328,220 | | |
| | | $ | 2,917,758 | | |
| Textiles, Apparel & Luxury Goods — 1.5% | |
| Gildan Activewear, Inc.(1)(2) | | | 41,364 | | | $ | 1,442,363 | | |
| Warnaco Group, Inc. (The)(1) | | | 35,200 | | | | 798,336 | | |
| | | $ | 2,240,699 | | |
| Thrifts & Mortgage Finance — 1.6% | |
| IndyMac Bancorp, Inc. | | | 42,900 | | | $ | 1,601,457 | | |
| WSFS Financial Corp. | | | 14,400 | | | | 892,080 | | |
| | | $ | 2,493,537 | | |
| Security | | Shares | | Value | |
| Wireless Telecommunication Services — 2.7% | |
| AO VimpelCom ADR(1) | | | 18,100 | | | $ | 724,000 | | |
| NII Holdings, Inc., Class B(1) | | | 40,700 | | | | 3,374,843 | | |
| | | $ | 4,098,843 | | |
Total Common Stocks
(identified cost $120,281,562) | | | | | | $ | 141,998,433 | | |
| Special Warrants — 0.1% | |
| Security | | Shares | | Value | |
| Metals & Mining — 0.1% | |
| Western Exploration and Development, Ltd.(1)(3)(4) | | | 600,000 | | | $ | 180,000 | | |
| | | $ | 180,000 | | |
Total Special Warrants
(identified cost $480,000) | | | | | | $ | 180,000 | | |
| Private Placements — 0.0% | |
| Security | | Shares | | Value | |
| Metals & Mining — 0.0% | |
| Nevada Pacific Mining Co.(1)(3)(4) | | | 80,000 | | | $ | 56,000 | | |
| | | $ | 56,000 | | |
Total Private Placements
(identified cost $80,000) | | | | | | $ | 56,000 | | |
| Commercial Paper — 5.6% | |
| Security | | Principal
Amount
(000's omitted) | | Value | |
| General Electric Capital Corp., 4.02%, 11/1/05 | | $ | 7,248 | | | $ | 7,248,000 | | |
| Prudential Financial, Inc., 4.02%, 11/1/05 | | | 1,237 | | | | 1,237,000 | | |
Total Commercial Paper
(at amortized cost, $8,485,000) | | | | | | $ | 8,485,000 | | |
See notes to financial statements
19
Tax-Managed Small-Cap Growth Portfolio as of October 31, 2005
PORTFOLIO OF INVESTMENTS CONT'D
| Short-Term Investments — 1.3% | |
| Security | | Principal
Amount
(000's omitted) | | Value | |
Investors Bank and Trust Company Time Deposit,
4.03%, 11/1/05 | | $ | 2,000 | | | $ | 2,000,000 | | |
Total Short-Term Investments
(at amortized cost, $2,000,000) | | | | $ | 2,000,000 | | |
Total Investments — 99.7%
(identified cost $131,326,562) | | | | $ | 152,719,433 | | |
| Other Assets, Less Liabilities — 0.3% | | | | $ | 401,578 | | |
| Net Assets — 100.0% | | | | $ | 153,121,011 | | |
ADR - American Depository Receipt
(1) Non-income producing security.
(2) Foreign security.
(3) Restricted security.
(4) Security valued at fair value using methods determined in good faith by or at the direction of the Trustees of the Portfolio.
| Country Concentration of Portfolio | |
| Country | | Percentage of
Total Investments | | Value | |
| United States | | | 94.4 | % | | $ | 144,127,509 | | |
| Bermuda | | | 2.0 | % | | | 2,993,956 | | |
| United Kingdom | | | 1.4 | % | | | 2,130,408 | | |
| Canada | | | 1.2 | % | | | 1,918,747 | | |
| Cayman Islands | | | 0.5 | % | | | 824,813 | | |
| Russia | | | 0.5 | % | | | 724,000 | | |
| | | | 100 | % | | $ | 152,719,433 | | |
See notes to financial statements
20
Tax-Managed Small-Cap Growth Portfolio as of October 31, 2005
FINANCIAL STATEMENTS
Statement of Assets and Liabilities
As of October 31, 2005
| Assets | |
| Investments, at value (identified cost, $131,326,562) | | $ | 152,719,433 | | |
| Cash | | | 2,073 | | |
| Receivable for investments sold | | | 2,875,564 | | |
| Dividends and interest receivable | | | 3,939 | | |
| Total assets | | $ | 155,601,009 | | |
| Liabilities | |
| Payable for investments purchased | | $ | 2,338,059 | | |
| Payable to affiliate for investment advisory fees | | | 80,520 | | |
| Payable to affiliate for Trustees' fees | | | 1,003 | | |
| Accrued expenses | | | 60,416 | | |
| Total liabilities | | $ | 2,479,998 | | |
| Net Assets applicable to investors' interest in Portfolio | | $ | 153,121,011 | | |
| Sources of Net Assets | |
| Net proceeds from capital contributions and withdrawals | | $ | 131,728,140 | | |
| Net unrealized appreciation (computed on the basis of identified cost) | | | 21,392,871 | | |
| Total | | $ | 153,121,011 | | |
Statement of Operations
For the Year Ended
October 31, 2005
| Investment Income | |
| Dividends (net of foreign taxes, $8,442) | | $ | 498,229 | | |
| Interest | | | 176,074 | | |
| Total investment income | | $ | 674,303 | | |
| Expenses | |
| Investment adviser fee | | $ | 1,052,955 | | |
| Trustees' fees and expenses | | | 4,469 | | |
| Custodian fee | | | 138,439 | | |
| Legal and accounting services | | | 44,569 | | |
| Miscellaneous | | | 11,477 | | |
| Total expenses | | $ | 1,251,909 | | |
Deduct —
Reduction of custodian fee | | $ | 18 | | |
| Reduction of investment adviser fee | | | 7,967 | | |
| Total expense reductions | | $ | 7,985 | | |
| Net expenses | | $ | 1,243,924 | | |
| Net investment loss | | $ | (569,621 | ) | |
| Realized and Unrealized Gain (Loss) | |
Net realized gain (loss) —
Investment transactions (identified cost basis) | | $ | 22,772,180 | | |
| Foreign currency transactions | | | (3,754 | ) | |
| Net realized gain | | $ | 22,768,426 | | |
Change in unrealized appreciation (depreciation) —
Investments (identified cost basis) | | $ | (6,290,258 | ) | |
| Foreign currency | | | (96 | ) | |
| Net change in unrealized appreciation (depreciation) | | $ | (6,290,354 | ) | |
| Net realized and unrealized gain | | $ | 16,478,072 | | |
| Net increase in net assets from operations | | $ | 15,908,451 | | |
See notes to financial statements
21
Tax-Managed Small-Cap Growth Portfolio as of October 31, 2005
FINANCIAL STATEMENTS CONT'D
Statements of Changes in Net Assets
Increase (Decrease)
in Net Assets | | Year Ended
October 31, 2005 | | Year Ended
October 31, 2004 | |
From operations —
Net investment loss | | $ | (569,621 | ) | | $ | (1,027,824 | ) | |
Net realized gain from investment
transactions, payments by affiliate
and foreign currency transactions | | | 22,768,426 | | | | 10,299,688 | | |
Net change in unrealized
appreciation (depreciation)
of investments and foreign currency | | | (6,290,354 | ) | | | (11,832,647 | ) | |
Net increase (decrease) in net assets
from operations | | $ | 15,908,451 | | | $ | (2,560,783 | ) | |
Capital transactions —
Contributions | | $ | 5,377,839 | | | $ | 14,945,367 | | |
| Withdrawals | | | (48,942,689 | ) | | | (58,309,543 | ) | |
Net decrease in net assets from
capital transactions | | $ | (43,564,850 | ) | | $ | (43,364,176 | ) | |
| Net decrease in net assets | | $ | (27,656,399 | ) | | $ | (45,924,959 | ) | |
| Net Assets | |
| At beginning of year | | $ | 180,777,410 | | | $ | 226,702,369 | | |
| At end of year | | $ | 153,121,011 | | | $ | 180,777,410 | | |
See notes to financial statements
22
Tax-Managed Small-Cap Growth Portfolio as of October 31, 2005
FINANCIAL STATEMENTS CONT'D
Supplementary Data
| | | Year Ended October 31, | | Period Ended | |
| | | 2005 | | 2004 | | 2003 | | 2002 | | October 31, 2001(1) | |
| Ratios/Supplemental Data† | |
| Ratios (As a percentage of average daily net assets): | |
| Net expenses | | | 0.74 | % | | | 0.75 | % | | | 0.73 | % | | | 0.73 | % | | | 0.70 | %(2) | |
| Net expenses after custodian fee reduction | | | 0.74 | % | | | 0.75 | % | | | 0.73 | % | | | 0.73 | % | | | 0.68 | %(2) | |
| Net investment loss | | | (0.34 | )% | | | (0.50 | )% | | | (0.53 | )% | | | (0.49 | )% | | | (0.48 | )%(2) | |
| Portfolio Turnover | | | 223 | % | | | 282 | % | | | 248 | % | | | 131 | % | | | 38 | % | |
| Total Return(3) | | | 9.52 | % | | | (1.05 | )%(4) | | | 27.24 | % | | | (22.16 | )% | | | — | | |
| Net assets, end of year (000's omitted) | | $ | 153,121 | | | $ | 180,777 | | | $ | 226,702 | | | $ | 209,074 | | | $ | 307,838 | | |
† The operating expenses of the Portfolio reflect a reduction of the investment adviser fee. Had such action not been taken, the ratios would have been the same.
(1) For the period from the start of business, March 1, 2001, to October 31, 2001.
(2) Annualized.
(3) Total return is required to be disclosed for fiscal years beginning after December 15, 2000.
(4) The Portfolio's net increase from payments by affiliate and net gains (losses) realized on the disposal of investments purchased which did not meet the Portfolio's investment guidelines had no effect on total return for the year ended October 31, 2004.
See notes to financial statements
23
Tax-Managed Small-Cap Growth Portfolio as of October 31, 2005
NOTES TO FINANCIAL STATEMENTS
1 Significant Accounting Policies
Tax-Managed Small-Cap Growth Portfolio (the Portfolio) is registered under the Investment Company Act of 1940, as amended, as a diversified open-end management investment company. The Portfolio, which was organized as a trust under the laws of the State of New York on June 22, 1998, seeks to achieve long-term after-tax returns by investing in a diversified portfolio of equity securities of small-cap companies. The Declaration of Trust permits the Trustees to issue interests in the Portfolio. At October 31, 2005, the Eaton Vance Tax-Managed Small-Cap Growth Fund 1.1, the Eaton Vance Tax-Managed Small-Cap Growth Fund 1.2 and the Eaton Vance Tax-Managed Equity Asset Allocation Fund held 59.3%, 21.3% and 19.3% interests in the Portfolio, respectively. The following is a summary of significant accounting policies consistently followed by the Portfolio in the preparation of its financial statements. The policies are in conformity with accounting principles generally accepted in the United States of America.
A Investment Valuation — Securities listed on a U.S. securities exchange generally are valued at the last sale price on the day of valuation or, if no sales took place on such date, at the mean between the closing bid and asked prices therefore on the exchange where such securities are principally traded. Equity securities listed on the NASDAQ National Market System generally are valued at the official NASDAQ closing price. Unlisted or listed securities for which closing sales prices or closing quotations are not available are valued at the mean between the latest available bid and asked prices or, in the case of preferred equity securities that are not listed or traded in the over-the-counter market, by an independent pricing service. Exchange-traded options are valued a t the last sale price for the day of valuation as quoted on the principal exchange or board of trade on which the options are traded or, in the absence of sales on such date, at the mean between the latest bid and asked prices therefore. Futures positions on securities and currencies generally are valued at closing settlement prices. Short-term debt securities with a remaining maturity of 60 days or less are valued at amortized cost. If short-term debt securities were acquired with a remaining maturity of more than 60 days, their amortized cost value will be based on their value on the sixty-first day prior to maturity. Other fixed income and debt securities, including listed securities and securities for which price quotations are available, will normally be valued on the basis of valuations furnished by a pricing service. Foreign securities and currencies are valued in U.S. dollars, based on foreign currency exchange rate quotations supplied by an independent quotation service. The daily valuation of exchange-traded foreign securities generally is determined as of the close of trading on the principal exchange on which such securities trade. Events occurring after the close of trading on foreign exchanges may result in adjustments to the valuation of foreign securities to more accurately reflect their fair value as of the close of regular trading on the New York Stock Exchange. When valuing foreign equity securities that meet certain criteria, the Trustees have approved the use of a fair value service that values such securities to reflect market trading that occurs after the close of the applicable foreign markets of comparable securities or other instruments that have a strong correlation to the fair-valued securities. Investments held by the Portfolio for which valuations or market quotations are unavailable are valued at fair value using methods determined in good faith by or at the direction of the Trustees of the Portfolio consideri ng relevant factors, data and information including the market value of freely tradable securities of the same class in the principal market on which such securities are normally traded.
B Income — Dividend income is recorded on the ex-dividend date for dividends received in cash and/or securities. However, if the ex-dividend date has passed, certain dividends from foreign securities are recorded as the Portfolio is informed of the ex-dividend date. Interest income is recorded on the accrual basis.
C Income Taxes — The Portfolio is treated as a partnership for federal tax purposes. No provision is made by the Portfolio for federal or state taxes on any taxable income of the Portfolio because each investor in the Portfolio is ultimately responsible for the payment of any taxes on its share of taxable income. Since the Portfolio's investors include regulated investment companies that invest all or substantially all of their assets in the Portfolio, the Portfolio normally must satisfy the applicable source of income and diversification requirements (under the Internal Revenue Code) in order for its investors to satisfy them. The Portfolio will allocate at least annually among its investors, each investor's distributive share of the Portfolio's net investment income, ne t realized capital gains, and any other items of income, gain, loss, deduction or credit.
D Financial Futures Contracts — Upon entering a financial futures contract, the Portfolio is required to deposit either in cash or securities an amount (initial margin) equal to a certain percentage of the purchase price indicated in the financial futures contract. Subsequent payments are made or received by the Portfolio (variation
24
Tax-Managed Small-Cap Growth Portfolio as of October 31, 2005
NOTES TO FINANCIAL STATEMENTS CONT'D
margin) each day, dependent on daily fluctuations in the value of the underlying security, and are recorded for book purposes as unrealized gains or losses by the Portfolio. The Portfolio's investment in financial futures contracts is designed to hedge against anticipated future changes in price of current or anticipated Portfolio positions. Should prices move unexpectedly, the Portfolio may not achieve the anticipated benefits of the financial futures contracts and may realize a loss.
E Foreign Currency Translation — Investment valuations, other assets and liabilities initially expressed in foreign currencies are converted each business day into U.S. dollars based upon current exchange rates. Purchases and sales of foreign investment securities and income and expenses are converted into U.S. dollars based upon currency exchange rates prevailing on the respective dates of such transactions. Recognized gains or losses on investment transactions attributable to foreign currency exchange rates are recorded for financial statement purposes as net realized gains and losses on investments. That portion of unrealized gains and losses on investments that results from fluctuations in foreign currency exchange rates is not separately disclosed.
F Expense Reduction — Investors Bank & Trust Company (IBT) serves as custodian of the Portfolio. Pursuant to the custodian agreement, IBT receives a fee reduced by credits which are determined based on the average daily cash balances the Portfolio maintains with IBT. All credit balances used to reduce the Portfolio's custodian fees are reported as a reduction of expenses on the Statement of Operations.
G Securities Sold Short — The Portfolio may sell a security short if it owns at least an equal amount of the security sold short or another security exchangeable for an equal amount of the security sold short in anticipation of a decline in the market price of the securities or in order to hedge portfolio positions. The Portfolio will generally borrow the security sold in order to make delivery to the buyer. Upon executing the transaction, the Portfolio records the proceeds as deposits with brokers on the Statement of Assets and Liabilities and establishes an offsetting payable for securities sold short for the securities due on settlement. The proceeds are retained by the broker as collateral for the short position. The liability is marked-to-market on a daily basis and the Portfolio is required to pay the lending broker any dividend or interest income earned while the short position is open. A gain or loss is recorded when the security is delivered to the broker. The Portfolio may recognize a loss on the transaction if the market value of the securities sold increases before the securities are delivered.
H Use of Estimates — The preparation of the financial statements in conformity with accounting principles generally accepted in the United States of America requires management to make estimates and assumptions that affect the reported amounts of assets and liabilities at the date of the financial statements and the reported amounts of income and expense during the reporting period. Actual results could differ from those estimates.
I Indemnifications — Under the Portfolio's organizational documents, its officers and Trustees may be indemnified against certain liabilities and expenses arising out of the performance of their duties to the Portfolio. Interestholders in the Portfolio are jointly and severally liable for the liabilities and obligations of the Portfolio in the event that the Portfolio fails to satisfy such liabilities and obligations; provided, however, that, to the extent assets are available in the Portfolio, the Portfolio may, under certain circumstances, indemnify interestholders from and against any claim or liability to which such holder may become subject by reason of being or having been an interestholder in the Portfolio. Additionally, in the normal course of business, the Portfo lio enters into agreements with service providers that may contain indemnification clauses. The Portfolio's maximum exposure under these arrangements is unknown as this would involve future claims that may be made against the Portfolio that have not yet occurred.
J Other — Investment transactions are accounted for on a trade-date basis.
2 Investment Adviser Fee and Other Transactions with Affiliates
The investment adviser fee is earned by Boston Management and Research (BMR), a wholly-owned subsidiary of Eaton Vance Management (EVM), as compensation for management and investment advisory services rendered to the Portfolio. BMR receives a monthly advisory fee in the amount of 5/96th of 1% (equal to 0.625% annually) of average daily net assets of the Portfolio up to $500 million, and at reduced rates as daily net assets exceed that level. EVM has also agreed to reduce the investment adviser fee by an amount equal to that portion of commissions paid to broker dealers in execution of portfolio transactions attributed to the Portfolio that is
25
Tax-Managed Small-Cap Growth Portfolio as of October 31, 2005
NOTES TO FINANCIAL STATEMENTS CONT'D
consideration for third-party research services. For the year ended October 31, 2005, EVM waived $7,967 of its advisory fee. For the year ended October 31, 2005, the advisory fee amounted to $1,052,955. Except for Trustees of the Portfolio who are not members of EVM's or BMR's organization, officers and Trustees receive remuneration for their services to the Portfolio out of the investment adviser fee. Trustees of the Portfolio who are not affiliated with BMR may elect to defer receipt of all or a percentage of their annual fees in accordance with the terms of the Trustees Deferred Compensation Plan. For the year ended October 31, 2005, no significant amounts have been deferred.
Certain officers and Trustees of the Portfolio are officers of the above organizations.
3 Investment Transactions
Purchases and sales of investments, other than short-term obligations, aggregated $364,709,013 and $414,322,811, respectively, for the year ended October 31, 2005.
4 Federal Income Tax Basis of Unrealized Appreciation (Depreciation)
The cost and unrealized appreciation (depreciation) in value of the investments owned at October 31, 2005, as computed on a federal income tax basis, were as follows:
| Aggregate Cost | | $ | 131,485,754 | | |
| Gross unrealized appreciation | | $ | 23,549,032 | | |
| Gross unrealized depreciation | | | (2,315,353 | ) | |
| Net unrealized appreciation | | $ | 21,233,679 | | |
5 Risks Associated with Foreign Investments
Investing in securities issued by companies whose principal business activities are outside the United States may involve significant risks not present in domestic investments. For example, there is generally less publicly available information about foreign companies, particularly those not subject to the disclosure and reporting requirements of the U.S. securities laws. Foreign issuers are generally not bound by uniform accounting, auditing, and financial reporting requirements and standards of practice comparable to those applicable to domestic issuers. Investments in foreign securities also involve the risk of possible adverse changes in investment or exchange control regulations, expropriation or confiscatory taxation, limitation on the removal of funds or other assets of the Portfolio, political or financial instability or diplomatic and other developm ents which could affect such investments. Foreign stock markets, while growing in volume and sophistication, are generally not as developed as those in the United States, and securities of some foreign issuers (particularly those in developing countries) may be less liquid and more volatile than securities of comparable U.S. companies. In general, there is less overall governmental supervision and regulation of foreign securities markets, broker-dealers, and issuers than in the United States.
6 Financial Instruments
The Portfolio may trade in financial instruments with off-balance sheet risk in the normal course of its investing activities to assist in managing exposure to various market risks. These financial instruments include financial futures contracts and may involve, to a varying degree, elements of risk in excess of the amounts recognized for financial statement purposes.
The notional or contractual amounts of these instruments represent the investment the Portfolio has in particular classes of financial instruments and does not necessarily represent the amounts potentially subject to risk. The measurement of the risks associated with these instruments is meaningful only when all related and offsetting transactions are considered. The Portfolio did not have any open obligations under these financial instruments at October 31, 2005.
7 Line of Credit
The Portfolio participates with other portfolios and funds managed by BMR and EVM and its affiliates in a $150 million unsecured line of credit agreement with a group of banks. Borrowings will be made by the Portfolio solely to facilitate the handling of unusual and/or unanticipated short-term cash requirements. Interest is charged to each participating portfolio or fund based on its borrowings at an amount above either the Eurodollar rate or Federal Funds rate. In addition, a fee computed at an annual rate of 0.10% on the daily unused portion of the line of credit is allocated among the participating portfolios and funds at the end of each quarter. The Portfolio did not have any significant borrowings or allocated fees during the year ended October 31, 2005.
26
Tax-Managed Small-Cap Growth Portfolio as of October 31, 2005
NOTES TO FINANCIAL STATEMENTS CONT'D
8 Restricted Securities
At October 31, 2005, the Portfolio owned the following securities (representing 0.21% of net assets) which were restricted as to public resale and not registered under the Securities Act of 1933. The fair value is determined using methods determined in good faith by or at the direction of the Trustees.
| Description | | Date of
Acquisition | | Shares | | Cost | | Fair Value | |
| Common Stocks | |
| Formation Capital Corp. | | 12/21/98 | | | 400,000 | | | $ | 88,260 | | | $ | 77,996 | | |
| | | $ | 88,260 | | | $ | 77,996 | | |
| Private Placements and Special Warrants | |
| Nevada Pacific Mining Co. | | 12/21/98 | | | 80,000 | | | $ | 80,000 | | | $ | 56,000 | | |
Western Exploration and
Development, Ltd. | | 12/21/98 | | | 600,000 | | | | 480,000 | | | | 180,000 | | |
| | | $ | 560,000 | | | $ | 236,000 | | |
27
Tax-Managed Small-Cap Growth Portfolio as of October 31, 2005
REPORT OF INDEPENDENT REGISTERED PUBLIC ACCOUNTING FIRM
To the Trustees and Investors
of Tax-Managed Small-Cap Growth Portfolio:
We have audited the accompanying statement of assets and liabilities of Tax-Managed Small-Cap Growth Portfolio (the Portfolio), including the portfolio of investments as of October 31, 2005, the related statement of operations for the year then ended, the statements of changes in net assets for each of the two years in the period then ended and the supplementary data for each of the four years in the period then ended and the period from the start of business, March 1, 2001 to October 31, 2001. These financial statements and supplementary data are the responsibility of the Portfolio's management. Our responsibility is to express an opinion on these financial statements and supplementary data based on our audits.
We conducted our audits in accordance with standards of the Public Company Accounting Oversight Board (United States). Those standards require that we plan and perform the audits to obtain reasonable assurance about whether the financial statements and supplementary data are free of material misstatement. The Portfolio is not required to have, nor were we engaged to perform, an audit of its internal control over financial reporting. An audit includes consideration of internal control over financial reporting as a basis for designing audit procedures that are appropriate in the circumstances, but not for the purpose of expressing an opinion on the effectiveness of the Portfolio's internal control over financial reporting. Accordingly, we express no such opinion. An audit also includes examining, on a test basis, evidence supporting the amounts and disclosures in the financial statements, assessing the accounting principles used a nd significant estimates made by management, as well as evaluating the overall financial statement presentation. Our procedures included confirmation of securities held as of October 31, 2005 by correspondence with the custodian and brokers; where replies were not received from brokers, we performed other auditing procedures. We believe that our audits provide a reasonable basis for our opinion.
In our opinion, the financial statements and supplementary data present fairly, in all material respects, the financial position of the Tax-Managed Small-Cap Growth Portfolio at October 31, 2005, the results of its operations for the year then ended, the changes in its net assets for each of the two years in the period then ended, and the supplementary data for each of the four years in the period then ended and for the period from the start of business, March 1, 2001 to October 31,2001, in conformity with accounting principles generally accepted in the United States of America.
DELOITTE & TOUCHE LLP
Boston, Massachusetts
December 19, 2005
28
Eaton Vance Tax-Managed Small-Cap Growth Fund 1.2
BOARD OF TRUSTEES' ANNUAL APPROVAL OF THE INVESTMENT ADVISORY AGREEMENT
The investment advisory agreement between Tax-Managed Small-Cap Growth Portfolio (the "Portfolio") and its investment adviser, Boston Management and Research, provides that the advisory agreement will continue in effect from year to year so long as its continuance is approved at least annually (i) by a vote of a majority of the noninterested Trustees of the Portfolio cast in person at a meeting called for the purpose of voting on such approval and (ii) by the Trustees of the Portfolio or by vote of a majority of the outstanding interests of the Portfolio.
In considering the annual approval of the investment advisory agreement between the Portfolio and its investment adviser, the Special Committee of the Board of Trustees considered information that had been provided throughout the year at regular Board meetings, as well as information furnished for a series of meetings held in February and March in preparation for a Board meeting held on March 21, 2005 to specifically consider the renewal of the investment advisory agreement. Such information included, among other things, the following:
•An independent report comparing the advisory fees of the Portfolio with those of comparable funds;
•An independent report comparing the expense ratio of the Eaton Vance Tax-Managed Small-Cap Growth Fund 1.2 (the "Fund") to those of comparable funds;
•Information regarding Fund investment performance in comparison to relevant peer groups of funds and appropriate indices;
•The economic outlook and the general investment outlook in relevant investment markets;
•Eaton Vance Management's ("Eaton Vance") results and financial condition and the overall organization of the investment adviser;
•The procedures and processes used to determine the fair value of Fund assets and actions taken to monitor and test the effectiveness of such procedures and processes;
•The allocation of brokerage and the benefits received by the investment adviser as the result of brokerage allocation;
•Eaton Vance's management of the relationship with the custodian, subcustodians and fund accountants;
•The resources devoted to compliance efforts undertaken by Eaton Vance, on behalf of the funds it manages and the record of compliance with the investment policies and restrictions and with policies on personal securities transactions;
•The quality, nature, cost and character of the administrative and other non-investment management services provided by Eaton Vance and its affiliates; and
•The terms of the advisory agreement and the reasonableness and appropriateness of the particular fee paid by the Portfolio for the services described therein.
The Special Committee also considered the nature, extent and quality of the management services provided by the investment adviser. In so doing, the Special Committee considered its management capabilities with respect to the types of investments held by the Portfolio, including information relating to the education, experience and number of investment professionals and other personnel who provide services under the investment advisory agreement. The Special Committee specifically noted the investment adviser's in-house equity research capabilities and experience in managing funds that seek to maximize after-tax returns. The Special Committee evaluated the level of skill required to manage the Portfolio and concluded that the human resources available at the investment adviser were appropriate to fulfill effectively its duties on behalf of the Portfolio.
In its review of comparative information with respect to investment performance, the Special Committee concluded that the Fund has performed within a range that the Special Committee deemed competitive. With respect to its review of investment advisory fees, the Special Committee concluded that the fees paid by the Portfolio are within the range of those paid by comparable funds within the mutual fund industry. In reviewing the information regarding the expense ratio of the Fund, the Special Committee concluded that, in light of the asset size of the Fund, the Fund's expense ratio is reasonable.
In addition to the factors mentioned above, the Special Committee reviewed the level of profits of the investment adviser in providing investment management services for the Portfolio and for all Eaton Vance funds as a group. The Special Committee also reviewed the implementation of a soft dollar reimbursement program pursuant to which the Portfolio may receive reimbursement payments in respect of third party research services obtained by the investment adviser as a result of soft dollar credits generated through trading on behalf of the Portfolio. The Special Committee also reviewed the benefits to Eaton Vance and its affiliates in providing administration services for the Fund and for all Eaton Vance funds as a group. In addition, the Special Committee considered the fiduciary duty assumed by the investment adviser in connection with the services rendered to the Portfolio and the business reputation of the investment adviser a nd its financial resources. The Trustees concluded that in light of the services rendered, the profits realized by the
29
Eaton Vance Tax-Managed Small-Cap Growth Fund 1.2
BOARD OF TRUSTEES' ANNUAL APPROVAL OF THE INVESTMENT ADVISORY AGREEMENT CONT'D
investment adviser, are not unreasonable. The Special Committee also considered the extent to which the investment adviser appears to be realizing benefits from economies of scale in managing the Portfolio, and concluded that the fee breakpoints which are in place will allow for an equitable sharing of such benefits, when realized, with the Portfolio and the shareholders of the Fund.
The Special Committee did not consider any single factor as controlling in determining whether or not to renew the investment advisory agreement. Nor are the items described herein all the matters considered by the Special Committee. In assessing the information provided by Eaton Vance and its affiliates, the Special Committee also took into consideration the benefits to shareholders of investing in a fund that is a part of a large family of funds which provides a large variety of shareholder services.
Based on its consideration of the foregoing factors and conclusions, and such other factors and conclusions as it deemed relevant, and assisted by independent counsel, the Special Committee concluded that the renewal of the investment advisory agreement, including the fee structure, is in the interests of shareholders.
30
Eaton Vance Tax-Managed Small-Cap Growth Fund 1.2
MANAGEMENT AND ORGANIZATION
Fund Management. The Trustees of Eaton Vance Mutual Funds Trust (the Trust) and Tax-Managed Small-Cap Growth Portfolio (the Portfolio) are responsible for the overall management and supervision of the Trust's and Portfolio's affairs. The Trustees and officers of the Trust and the Portfolio are listed below. Except as indicated, each individual has held the office shown or other offices in the same company for the last five years. Trustees and officers of the Trust and the Portfolio hold indefinite terms of office. The "noninterested Trustees" consist of those Trustees who are not "interested persons" of the Trust and the Portfolio, as that term is defined under the 1940 Act. The business address of each Trustee and officer is The Eaton Vance Building, 255 State Street, Boston, Massachusetts 02109. As used below, "EVC" refers to Eaton Vance Corp., "EV" refers to Eaton Vance, Inc., "EVM" refers to Eaton Vance Management, "BMR" refers to Boston Management and Research and "EVD" refers to Eaton Vance Distributors, Inc. EVC and EV are the corporate parent and trustee, respectively, of EVM and BMR. EVD is the Fund's principal underwriter, the Portfolio's placement agent and a wholly-owned subsidiary of EVM. Each officer affiliated with Eaton Vance may hold a position with other Eaton Vance affiliates that is comparable to its position with EVM listed below.
Name and
Date of Birth | | Position(s)
with the
Trust and
the Portfolio | | Term of
Office and
Length of
Service | | Principal Occupation(s)
During Past Five Years | | Number of Portfolios
in Fund Complex
Overseen By
Trustee(1) | | Other Directorships Held | |
| Interested Trustee | | | | | | | | | | | | | |
|
| James B. Hawkes 11/9/41 | | Trustee | | Trustee of the Trust since 1991; of the Portfolio since 1998 | | Chairman, President and Chief Executive Officer of BMR, EVC, EVM and EV; Director of EV; Vice President and Director of EVD. Trustee and/or officer of 161 registered investment companies in the Eaton Vance Fund Complex. Mr. Hawkes is an interested person because of his positions with BMR, EVM, EVC and EV, which are affiliates of the Trust and the Portfolio. | | | 161 | | | Director of EVC | |
|
| Noninterested Trustee(s) | | | | | | | | | | | | | |
|
| Benjamin C. Esty 1/2/63 | | Trustee | | Since 2005 | | Professor, Harvard University Graduate School of Business Administration (since 2003). Formerly, Associate Professor, Harvard University Graduate School of Business Administration (2000-2003). | | | 152 | | | None | |
|
| Samuel L. Hayes, III 2/23/35 | | Trustee | | Trustee of the Trust since 1986; of the Portfolio since 1998 and Chairman of the Board since 2005 | | Jacob H. Schiff Professor of Investment Banking Emeritus, Harvard University Graduate School of Business Administration. | | | 161 | | | Director of Tiffany & Co. (specialty retailer) and Telect, Inc. (telecommunication services company) | |
|
| William H. Park 9/19/47 | | Trustee | | Since 2003 | | President and Chief Executive Officer, Prizm Capital Management, LLC (investment management firm) (since 2002). Executive Vice President and Chief Financial Officer, United Asset Management Corporation (a holding company owning institutional investment management firms) (1982-2001). | | | 161 | | | None | |
|
| Ronald A. Pearlman 7/10/40 | | Trustee | | Since 2003 | | Professor of Law, Georgetown University Law Center (since 1999). Tax Partner, Covington & Burling, Washington, DC (1991-2000). | | | 161 | | | None | |
|
31
Eaton Vance Tax-Managed Small-Cap Growth Fund 1.2
MANAGEMENT AND ORGANIZATION CONT'D
Name and
Date of Birth | | Position(s)
with the
Trust and
the Portfolio | | Term of
Office and
Length of
Service | | Principal Occupation(s)
During Past Five Years | | Number of Portfolios
in Fund Complex
Overseen By
Trustee(1) | | Other Directorships Held | |
| Noninterested Trustee(s) (continued) | | | | | | | | | | | | | |
|
| Norton H. Reamer 9/21/35 | | Trustee | | Trustee of the Trust since 1986; of the Portfolio since 1998 | | President, Chief Executive Officer and a Director of Asset Management Finance Corp. (a specialty finance company serving the investment management industry) (since October 2003). President, Unicorn Corporation (an investment and financial advisory services company) (since September 2000). Formerly, Chairman, Hellman, Jordan Management Co., Inc. (an investment management company) (2000-2003). Formerly, Advisory Director of Berkshire Capital Corporation (investment banking firm) (2002-2003). Formerly Chairman of the Board, United Asset Management Corporation (a holding company owning institutional investment management firms) and Chairman, President and Director, UAM Funds (mutual funds) (1980-2000). | | | 161 | | | None | |
|
| Lynn A. Stout 9/14/57 | | Trustee | | Since 1998 | | Professor of Law, University of California at Los Angeles School of Law (since July 2001). Formerly, Professor of Law, Georgetown University Law Center. | | | 161 | | | None | |
|
| Ralph F. Verni 1/26/43 | | Trustee | | Since 2005 | | Consultant and private investor (since 2000). Formerly, President and Chief Executive Officer, Redwood Investment Systems, Inc. (software developer) (2000). Formerly, President and Chief Executive Officer, State Street Research & Management (investment advisor), SSRM Holdings (parent of State Street Research & management), and SSR Realty (institutional realty manager) (1992-2000). | | | 152 | | | Director of W.P. Carey & Company LLC (manager of real estate investment trusts) | |
|
| Principal Officers who are not Trustees | | | | | | | | | | | | | |
|
Name and
Date of Birth | | Position(s)
with the
Trust and
the Portfolio | | Term of
Office and
Length of
Service | | Principal Occupation(s)
During Past Five Years | |
| Thomas E. Faust Jr. 5/31/58 | | President of the Trust | | Since 2002 | | Executive Vice President of EVM, BMR, EVC and EV; Chief Investment Officer of EVM and BMR and Director of EVC. Chief Executive Officer of Belair Capital Fund LLC, Belcrest Capital Fund LLC, Belmar Capital Fund LLC, Belport Capital Fund LLC and Belrose Capital Fund LLC (private investment companies sponsored by EVM). Officer of 65 registered investment companies managed by EVM or BMR. | |
|
| William H. Ahern, Jr. 7/28/59 | | Vice President of the Trust | | Since 1995 | | Vice President of EVM and BRM. Officer of 70 registered investment companies managed by EVM or BMR. | |
|
| Cynthia J. Clemson 3/2/63 | | Vice President of the Trust | | Since 2004 | | Vice President of EVM and BMR. Officer of 85 registered investment companies managed by EVM or BMR. | |
|
| Kevin S. Dyer 2/21/75 | | Vice President of the Trust | | Since 2005 | | Assistant Vice President of EVM and BMR. Officer of 24 registered companies managed by EVM or BMR. | |
|
| Aamer Khan 6/7/60 | | Vice President of the Trust | | Since 2005 | | Vice President of EVM and BMR. Officer of 27 registered investment companies mangaged by EVM or BMR. | |
|
| Michael R. Mach 7/15/47 | | Vice President of the Trust | | Since 1999 | | Vice President of EVM and BMR. Officer of 32 registered investment companies managed by EVM or BMR. | |
|
32
Eaton Vance Tax-Managed Small-Cap Growth Fund 1.2
MANAGEMENT AND ORGANIZATION CONT'D
Name and
Date of Birth | | Position(s)
with the
Trust and
the Portfolio | | Term of
Office and
Length of
Service | | Principal Occupation(s)
During Past Five Years | |
| Principal Officers who are not Trustees (continued) | |
|
| Robert B. MacIntosh 1/22/57 | | Vice President of the Trust | | Since 1998 | | Vice President of EVM and BMR. Officer of 85 registered investment companies managed by EVM or BMR. | |
|
| Duncan W. Richardson 10/26/57 | | Vice President of the Trust; President of the Portfolio | | Vice President of the Trust since 2001; President of the Portfolio since 2002 | | Senior Vice President and Chief Equity Investment Officer of EVM and BMR. Officer of 51 registered investment companies managed by EVM or BMR. | |
|
| Walter A. Row, III 7/20/57 | | Vice President of the Trust | | Since 2001 | | Director of Equity Research and a Vice President of EVM and BMR. Officer of 31 registered investment companies managed by EVM or BMR. | |
|
| Judith A. Saryan 8/21/54 | | Vice President of the Trust | | Since 2003 | | Vice President of EVM and BMR. Officer of 33 registered investment companies managed by EVM or BMR. | |
|
| Susan Schiff 3/13/61 | | Vice President of the Trust | | Since 2002 | | Vice President of EVM and BMR. Officer of 29 registered investment companies managed by EVM or BMR. | |
|
| Barbara E. Campbell 6/19/57 | | Treasurer of the Trust | | Since 2005(2) | | Vice President EVM and BMR. Officer of 161 registered investment companies managed by EVM or BMR. | |
|
| Alan R. Dynner 10/10/40 | | Secretary | | Secretary of the Trust since 1997; of the Portfolio since 1998 | | Vice President, Secretary and Chief Legal Officer of BMR, EVM, EVD, EV and EVC. Officer of 161 registered investment companies managed by EVM and BMR. | |
|
| Michelle A. Green | | Treasurer of the Portfolio | | Since 2002(2) | | Vice President of EVM and BMR. Chief Financial Officer of Belair Capital Fund LLC, Belcrest Capital Fund LLC, Belmar Capital Fund LLC, Belport Capital Fund LLC and Belrose Capital Fund LLC (private investment companies sponsored by EVM). Officer of 67 registered investment companies managed by EVM or BMR. | |
|
| Paul M. O'Neil 7/11/53 | | Chief Compliance Officer | | Since 2004 | | Vice President of EVM and BMR. Officer of 161 registered investment companies managed by EVM or BMR. | |
|
(1) Includes both master feeder and feeder funds in a master-feeder structure.
(2) Prior to 2002, Ms. Green served as Assistant Treasurer of the Portfolio since 1998 and prior to 2005, Ms. Campbell served as Assistant Treasurer of the Trust since 1995.
The SAI for the Fund includes additional information about the Trustees and officers of the Fund and the Portfolio and can be obtained without charge by calling 1-800-225-6265.
33
Investment Adviser of Tax-Managed Small-Cap Growth Portfolio
Boston Management and Research
The Eaton Vance Building
255 State Street
Boston, MA 02109
Administrator of Eaton Vance Tax-Managed Small-Cap Growth Fund 1.2
Eaton Vance Management
The Eaton Vance Building
255 State Street
Boston, MA 02109
Principal Underwriter
Eaton Vance Distributors, Inc.
The Eaton Vance Building
255 State Street
Boston, MA 02109
(617) 482-8260
Custodian
Investors Bank & Trust Company
200 Clarendon Street
Boston, MA 02116
Transfer Agent
PFPC Inc.
Attn: Eaton Vance Funds
P.O. Box 9653
Providence, RI 02940-9653
(800) 262-1122
Independent Registered Public Accounting Firm
Deloitte & Touche LLP
200 Berkeley Street
Boston, MA 02116-5022
Eaton Vance Tax-Managed Small-Cap Growth Fund 1.2
The Eaton Vance Building
255 State Street
Boston, MA 02109
This report must be preceded or accompanied by a current prospectus. Before investing, investors should consider carefully the Fund's investment objective(s), risks, and charges and expenses. The Fund's current prospectus contains this and other information about the Fund and is available through your financial advisor. Please read the prospectus carefully before you invest or send money. For further information please call 1-800-225-6265.
1087-12/05 MGSRC1.2

Annual Report October 31, 2005


EATON VANCE
TAX-MANAGED
SMALL-CAP
VALUE
FUND
IMPORTANT NOTICES REGARDING PRIVACY,
DELIVERY OF SHAREHOLDER DOCUMENTS,
PORTFOLIO HOLDINGS AND PROXY VOTING
Privacy. The Eaton Vance organization is committed to ensuring your financial privacy. Each of the financial institutions identified below has in effect the following policy ("Privacy Policy") with respect to nonpublic personal information about its customers:
• Only such information received from you, through application forms or otherwise, and information about your Eaton Vance fund transactions will be collected. This may include information such as name, address, social security number, tax status, account balances and transactions.
• None of such information about you (or former customers) will be disclosed to anyone, except as permitted by law (which includes disclosure to employees necessary to service your account). In the normal course of servicing a customer's account, Eaton Vance may share information with unaffiliated third parties that perform various required services such as transfer agents, custodians and broker/dealers.
• Policies and procedures (including physical, electronic and procedural safeguards) are in place that are designed to protect the confidentiality of such information.
• We reserve the right to change our Privacy Policy at any time upon proper notification to you. Customers may want to review our Policy periodically for changes by accessing the link on our homepage: www.eatonvance.com.
Our pledge of privacy applies to the following entities within the Eaton Vance organization: the Eaton Vance Family of Funds, Eaton Vance Management, Eaton Vance Investment Counsel, Boston Management and Research, and Eaton Vance Distributors, Inc.
In addition, our Privacy Policy only applies to those Eaton Vance customers who are individuals and who have a direct relationship with us. If a customer's account (i.e. fund shares) is held in the name of a third-party financial adviser/broker-dealer, it is likely that only such adviser's privacy policies apply to the customer. This notice supersedes all previously issued privacy disclosures.
For more information about Eaton Vance's Privacy Policy, please call 1-800-262-1122.
Delivery of Shareholder Documents. The Securities and Exchange Commission (the "SEC") permits funds to deliver only one copy of shareholder documents, including prospectuses, proxy statements and shareholder reports, to fund investors with multiple accounts at the same residential or post office box address. This practice is often called "householding" and it helps eliminate duplicate mailings to shareholders.
Eaton Vance, or your financial adviser, may household the mailing of your documents indefinitely unless you instruct Eaton Vance, or your financial adviser, otherwise.
If you would prefer that your Eaton Vance documents not be householded, please contact Eaton Vance at 1-800-262-1122, or contact your financial adviser.
Your instructions that householding not apply to delivery of your Eaton Vance documents will be effective within 30 days of receipt by Eaton Vance or your financial adviser.
Portfolio Holdings. Each Eaton Vance Fund and its underlying Portfolio (if applicable) will file a schedule of its portfolio holdings on Form N-Q with the SEC for the first and third quarters of each fiscal year. The Form N-Q will be available on the Eaton Vance website www.eatonvance.com, by calling Eaton Vance at 1-800-262-1122 or in the EDGAR database on the SEC's website at www.sec.gov. Form N-Q may also be reviewed and copied at the SEC's public reference room in Washington, D.C. (call 1-800-732-0330 for information on the operation of the public reference room).
Proxy Voting. From time to time, funds are required to vote proxies related to the securities held by the funds. The Eaton Vance Funds or their underlying Portfolios (if applicable) vote proxies according to a set of policies and procedures approved by the Funds' and Portfolios' Boards. You may obtain a description of these policies and procedures and information on how the Funds or Portfolios voted proxies relating to Portfolio securities during the most recent 12 month period ended June 30, without charge, upon request, by calling 1-800-262-1122. This description is also available on the SEC's website at www.sec.gov.
Eaton Vance Tax-Managed Small-Cap Value Fund as of October 31, 2005
MANAGEMENT’S DISCUSSION OF FUND PERFORMANCE

George Pierides,
Lead Portfolio Manager
J. Bradley Ohlmuller, CFA,
Team Member (not pictured)
Philip E. Laverson,
Team Member (not pictured)
The Fund
Performance for the Past Year
• For the year ended October 31, 2005, the Fund’s Class A shares had a total return of 12.53%. This return was the result of an increase in net asset value (NAV) per share to $14.64 on October 31, 2005, from $13.01 on October 31, 2004.(1)
• The Fund’s Class B shares had a total return of 11.67% for the same period, the result of an increase in NAV per share to $14.26 from $12.77.(1)
• The Fund’s Class C shares had a total return of 11.66% for the same period, the result of an increase in NAV per share to $14.27 from $12.78.(1)
• For comparison, the Fund’s benchmark, the S&P SmallCap 600 Index (the S&P 600) – a broad-based, unmanaged market index of both growth and value small-capitalization stocks – had a total return of 15.27% during the period, while the Russell 2000 Index, a larger basket of small-cap stocks, had a return of 12.08%.(2)
Management Discussion
• During the year ended October 31, 2005, the Tax-Managed Small-Cap Value Portfolio (the Portfolio) continued to focus on small-cap companies that management believed to be undervalued relative to the overall stock market. In addition to relative valuation, management considers companies’ earnings and cash flow capabilities, the strength of their business franchises and financial positions, and the quality of their managements. Management pursues a tax-managed approach that seeks to maximize the after-tax returns of the Fund’s shareholders.
• The U.S. economy remained strong in 2005, despite eight interest rate hikes by the Federal Reserve, surging energy and raw material prices, and the disruptive effects of two major hurricanes in the Gulf Coast region. Although the economy was strong, momentum remained uneven, with various segments of the economy growing at disparate rates. During the year, we maintained a well balanced mix of stocks that included economically sensitive areas, defensive consumer-related sectors, and exposure to energy. Accordingly, at October 31, 2005, the Portfolio maintained significant weightings in materials and processing, consumer discretionary, and energy.
• The Fund posted positive returns during the year ended October 31, 2005, with Class A shares outperforming the Russell 2000 Index but lagging the S&P 600.(2) The energy, materials and processing, and consumer staples sectors outperformed the indexes, while financial services, technology, and consumer discretionary sectors were relative underperformers. The Fund’s investment returns benefited from the Portfolio’s significant exposure to energy stocks, which were the best performers during the year. An underweighting in financial services and technology further bolstered results.
• Energy stocks were the largest contributor to the Fund’s returns for the year, benefiting from surging oil and natural gas prices. Strong worldwide demand for oil, combined with ongoing concerns about supply, pushed the price of oil north of $70 per barrel – levels not seen since the early 1980s on an inflation-adjusted basis. Natural gas prices also surged late in the fiscal year, as hurricane activity disrupted gas refining capabilities in the Gulf Coast region.
• The Portfolio maintained its long-standing underweight in financial services, which lagged the overall market. The yield curve flattened during the year, amid the Fed’s ongoing campaign to raise short-term interest rates and strong foreign demand for longer term U.S. Treasury securities. A flattening yield curve remained unfavorable for financial services that are overly dependent on net interest margin for earnings. The potential for deterioration in credit quality, given heightened competition among lenders and loose lending standards in the financial services area, remained another area of concern during the year.
Past performance is no guarantee of future results. Returns are historical and are calculated by determining the percentage change in net asset value or offering price (as applicable) with all distributions reinvested. Investment return and principal value will fluctuate so that shares, when redeemed, may be worth more or less than their original cost. Performance is for stated time period only; due to market volatility, the Fund’s current performance may be lower or higher than the quoted return. For performance as of the most recent month end, please refer to www.eatonvance. com.
(1) These returns do not include the 5.75% maximum sales charge for Class A shares or the applicable contingent deferred sales charge (CDSC) for Class B and Class C shares. If sales charges were deducted, returns would be lower.
(2) It is not possible to invest directly in an Index. The Index’s total return does not reflect commissions or expenses that would have been incurred if an investor individually purchased or sold the securities represented in the Index.
Fund shares are not insured by the FDIC and are not deposits or other obligations of, or guaranteed by, any depository institution. Shares are subject to investment risks, including possible loss of principal invested.
2
• Consumer discretionary companies were among the Portfolio’s weakest performers during the year. While fundamentals remained favorable, with positive job growth and rising incomes, investor concerns over rising energy costs and their impact on consumer spending weighed on the sector.
• Since November 21, 2005, the Portfolio has been managed by a three-person team led by George C. Pierides, who had previuosly been sole portfolio manager of the Portfolio since it commenced operations. Mr. Pieridesis joined by J. Bradley Ohlmuller, CFA, a Principal of Fox Asset Management and a member of the firm’s Investment Committee, and Philip E. Laverson, a Vice President of Fox Asset Management, who joined the firm in 2005. The members of the investment team meet regularly to discuss investment holdings, prospective investments, and portfolio composition.
The views expressed throughout this report are those of the portfolio managers and are current only through the end of the period of the report as stated on the cover. These views are subject to change at any time based upon market or other conditions, and the investment adviser disclaims any responsibility to update such views. These views may not be relied on as investment advice and, because investment decisions for a fund are based on many factors, may not be relied on as an indication of trading intent on behalf of any Eaton Vance fund.
Common Stock Investments by Sector*
By net assets
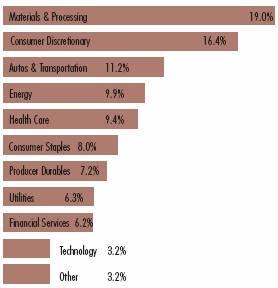
* Portfolio information may not be representative of the Portfolio’s current or future investments and may change due to active management.
Ten Largest Holdings**
By net assets
Spinnaker Exploration, Co. | | 5.2 | % |
Church & Dwight, Co., Inc. | | 4.5 | % |
AptarGroup, Inc. | | 3.9 | % |
Arkansas Best Corp. | | 3.7 | % |
Protective Life Corp. | | 3.6 | % |
Newfield Exploration Co. | | 3.5 | % |
Piedmont Natural Gas Co., Inc. | | 3.4 | % |
Albany International Corp., Class A | | 3.3 | % |
Maverick Tube Corp. | | 3.2 | % |
BorgWarner, Inc. | | 3.2 | % |
**Ten Largest Holdings represented 37.5% of Portfolio net assets as of October 31, 2005. Holdings are subject to change due to active management.
3
Eaton Vance Tax-Managed Small-Cap Value Fund as of October 31, 2005
FUND PERFORMANCE
The line graphs and table set forth below provide information about the Fund’s performance. The line graphs compare the performance of Class A, Class B, and Class C of the Fund with that of the S&P SmallCap 600 Index, a broad-based, unmanaged market index of both growth and value small-capitalization stocks. The lines on the graphs represent the total returns of a hypothetical investment of $10,000 in each of Class A, Class B, Classs C, and the S&P SmallCap 600 Index. Class A total returns are presented at net asset value and maximum public offering price. The table includes the total returns of each Class of the Fund at net asset value and public offering price. The performance presented below does not reflect the deduction of taxes, if any, that a shareholder would pay on distributions or redemptions of Fund shares.
Performance* | | Class A | | Class B | | Class C | |
Average Annual Total Returns (at net asset value) | | | | | | | |
One Year | | 12.53 | % | 11.67 | % | 11.66 | % |
Life of Fund† | | 10.94 | % | 10.15 | % | 10.17 | % |
| | | | | | | |
SEC Average Annual Total Returns (including sales charge or applicable CDSC) | | | | | |
One Year | | 6.09 | % | 6.67 | % | 10.66 | % |
Life of Fund† | | 9.17 | % | 9.52 | % | 10.17 | % |
†Inception Dates – Class A: 3/4/02; Class B: 3/4/02; Class C: 3/4/02
* Average annual total returns do not include the 5.75% maximum sales charge for Class A shares or the applicable contingent deferred sales charge (CDSC) for Class B and Class C shares. If sales charges were deducted, returns would be lower. SEC average annual total returns for Class A reflect the maximum 5.75% sales charge. SEC returns for Class B shares reflect the applicable CDSC based on the following schedule: 5% - 1st and 2nd years; 4% - 3rd year; 3% - 4th year; 2% - 5th year; 1% - 6th year. SEC 1-year return for Class C reflects a 1% CDSC.
Past performance is no guarantee of future results. Returns are historical and are calculated by determining the percentage change in net asset value or offering price (as applicable) with all distributions reinvested. Investment return and principal value will fluctuate so that shares, when redeemed, may be worth more or less than their original cost. Performance is for stated time period only; due to market volatility, the Fund’s current performance may be lower or higher than the quoted return. For performance as of the most recent month end, please refer to www.eatonvance.com.
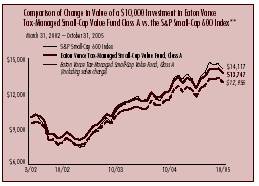
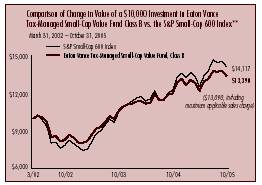
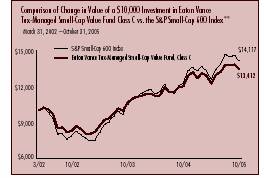
** | Source: Thomson Financial. Investment operations commenced 3/4/02. |
| It is not possible to invest directly in an Index. The Index’s total returns do not reflect commissions or expenses that would have been incurred if an investor individually purchased or sold the securities represented in the Index. |
4
“Return Before Taxes” does not take into consideration shareholder taxes. It is most relevant to tax-free or tax-deferred shareholder accounts. “Return After Taxes on Distributions” reflects the impact of federal income taxes due on Fund distributions of dividends and capital gains. It is most relevant to taxpaying shareholders who continue to hold their shares.
“Return After Taxes on Distributions and Sale of Fund Shares” also reflects the impact of taxes on capital gain or loss realized upon a sale of shares. It is most relevant to taxpaying shareholders who sell their shares.
Average Annual Total Returns
(For the periods ended October 31, 2005)
Returns at Net Asset Value (NAV) (Class A)
| | One Year | | Life of Fund | |
| | | | | |
Return Before Taxes | | 12.53 | % | 10.94 | % |
Return After Taxes on Distributions | | 12.53 | % | 10.94 | % |
Return After Taxes on Distributions and Sale of Fund Shares | | 8.14 | % | 9.48 | % |
Returns at Public Offering Price (POP) (Class A)
| | One Year | | Life of Fund | |
| | | | | |
Return Before Taxes | | 6.09 | % | 9.17 | % |
Return After Taxes on Distributions | | 6.09 | % | 9.17 | % |
Return After Taxes on Distributions and Sale of Fund Shares | | 3.96 | % | 7.92 | % |
Average Annual Total Returns
(For the periods ended October 31, 2005)
Returns at Net Asset Value (NAV) (Class C)
| | One Year | | Life of Fund | |
| | | | | |
Return Before Taxes | | 11.66 | % | 10.17 | % |
Return After Taxes on Distributions | | 11.66 | % | 10.17 | % |
Return After Taxes on Distributions and Sale of Fund Shares | | 7.58 | % | 8.80 | % |
Returns at Public Offering Price (POP) (Class C)
| | One Year | | Life of Fund | |
| | | | | |
Return Before Taxes | | 10.66 | % | 10.17 | % |
Return After Taxes on Distributions | | 10.66 | % | 10.17 | % |
Return After Taxes on Distributions and Sale of Fund Shares | | 6.93 | % | 8.80 | % |
Average Annual Total Returns
(For the periods ended October 31, 2005)
Returns at Net Asset Value (NAV) (Class B)
| | One Year | | Life of Fund | |
| | | | | |
Return Before Taxes | | 11.67 | % | 10.15 | % |
Return After Taxes on Distributions | | 11.67 | % | 10.15 | % |
Return After Taxes on Distributions and Sale of Fund Shares | | 7.59 | % | 8.79 | % |
Returns at Public Offering Price (POP) (Class B)
| | One Year | | Life of Fund | |
| | | | | |
Return Before Taxes | | 6.67 | % | 9.52 | % |
Return After Taxes on Distributions | | 6.67 | % | 9.52 | % |
Return After Taxes on Distributions and Sale of Fund Shares | | 4.33 | % | 8.23 | % |
Class A, Class B, and Class C of the Fund commenced investment operations on 3/4/02. Returns at Public Offering Price (POP) reflect the deduction of the maximum initial sales charge and applicable CDSC, while Returns at Net Asset Value (NAV) do not.
After-tax returns are calculated using the highest historical individual federal income tax rate and do not reflect the impact of state and local taxes. Actual after-tax returns depend on a shareholder’s tax situation and may differ from those shown. After-tax returns are not relevant for shareholders who hold shares in tax-deferred accounts or to shares held by non-taxable entities. Return After Taxes on Distributions for a period may be the same as Return Before Taxes for that period because no distributions were paid during that period, or because the taxable portion of distributions made during the period was insignificant. Also, Return After Taxes on Distributions and Sale of Fund Shares for a period may be greater than Return After Taxes on Distributions for the same period because of realized losses on the sale of Fund shares.
Past performance is no guarantee of future results. Returns are historical and are calculated by determining the percentage change in net asset value or offering price (as applicable) with all distributions reinvested. Investment return and principal value will fluctuate so that shares, when redeemed, may be worth more or less than their original cost. Performance is for the stated time period only; due to market volatility, the Fund’s current performance may be lower or higher than the quoted return. For performance as of the most recent month-end, please refer to www.eatonvance.com.
5
Eaton Vance Tax-Managed Small-Cap Value Fund as of October 31, 2005
FUND EXPENSES
Example: As a shareholder of the Fund, you incur two types of costs: (1) transaction costs, including sales charges (loads) on purchases and redemption fees (if applicable); and (2) ongoing costs, including management fees; distribution or service fees; and other Fund expenses. This Example is intended to help you understand your ongoing costs (in dollars) of investing in the Fund and to compare these costs with the ongoing costs of investing in other mutual funds. The Example is based on an investment of $1,000 invested at the beginning of the period and held for the entire period (May 1, 2005 – October 31, 2005).
Actual Expenses: The first section of the table below provides information about actual account values and actual expenses. You may use the information in this line, together with the amount you invested, to estimate the expenses that you paid over the period. Simply divide your account value by $1,000 (for example, an $8,600 account value divided by $1,000 = 8.6), then multiply the result by the number in the first section under the heading entitled “Expenses Paid During Period” to estimate the expenses you paid on your account during this period.
Hypothetical Example for Comparison Purposes: The second section of the table below provides information about hypothetical account values and hypothetical expenses based on the actual Fund expense ratio and an assumed rate of return of 5% per year (before expenses), which is not the actual return of the Fund. The hypothetical account values and expenses may not be used to estimate the actual ending account balance or expenses you paid for the period. You may use this information to compare the ongoing costs of investing in your Fund and other funds. To do so, compare this 5% hypothetical example with the 5% hypothetical examples that appear in the shareholder reports of the other funds.
Please note that the expenses shown in the table are meant to highlight your ongoing costs only and do not reflect any transactional costs, such as sales charges (loads) or redemption fees (if applicable). Therefore, the second section of the table is useful in comparing ongoing costs only, and will not help you determine the relative total costs of owning different funds. In addition, if these transactional costs were included, your costs would have been higher.
Eaton Vance Tax-Managed Small-Cap Value Fund
| | Beginning Account Value | | Ending Account Value | | Expenses Paid During Period* | |
| | (5/1/05) | | (10/31/05) | | (5/1/05 – 10/31/05) | |
Actual | | | | | | | |
Class A | | $ | 1,000.00 | | $ | 1,101.60 | | $ | 9.27 | |
Class B | | $ | 1,000.00 | | $ | 1,097.80 | | $ | 13.27 | |
Class C | | $ | 1,000.00 | | $ | 1,097.70 | | $ | 13.22 | |
| | | | | | | |
Hypothetical | | | | | | | |
(5% return before expenses) | | | | | | | |
Class A | | $ | 1,000.00 | | $ | 1,016.40 | | $ | 8.89 | |
Class B | | $ | 1,000.00 | | $ | 1,012.60 | | $ | 12.73 | |
Class C | | $ | 1,000.00 | | $ | 1,012.60 | | $ | 12.68 | |
* Expenses are equal to the Fund’s annualized expense ratio of 1.75% for Class A shares, 2.50% for Class B shares, and 2.50% for Class C shares, multiplied by the average account value over the period, multiplied by 184/365 (to reflect the one-half year period). The example assumes that the $1,000 was invested at the net asset value per share determined at the close of business on April 30, 2005. The Example reflects the expenses of both the Fund and the Portfolio. |
6
Eaton Vance Tax-Managed Small-Cap Value Fund as of October 31, 2005
FINANCIAL STATEMENTS
Statement of Assets and Liabilities
As of October 31, 2005
| Assets | |
Investment in Tax-Managed Small-Cap Value Portfolio, at value
(identified cost, $22,606,791) | | $ | 29,137,828 | | |
| Receivable for Fund shares sold | | | 845 | | |
| Receivable from affiliate | | | 77,125 | | |
| Total assets | | $ | 29,215,798 | | |
| Liabilities | |
| Payable for Fund shares redeemed | | $ | 95,299 | | |
| Payable to affiliate for distribution and service fees | | | 15,584 | | |
| Payable to affiliate for Trustees' fees | | | 42 | | |
| Payable to affiliate for Administration fee | | | 3,691 | | |
| Accrued expenses | | | 28,518 | | |
| Total liabilities | | $ | 143,134 | | |
| Net Assets | | $ | 29,072,664 | | |
| Sources of Net Assets | |
| Paid-in capital | | $ | 20,940,841 | | |
Accumulated undistributed net realized gain from Portfolio (computed on
the basis of identified cost) | | | 1,600,786 | | |
Net unrealized appreciation from Portfolio (computed on the basis of
identified cost) | | | 6,531,037 | | |
| Total | | $ | 29,072,664 | | |
| Class A Shares | |
| Net Assets | | $ | 14,302,653 | | |
| Shares Outstanding | | | 976,720 | | |
Net Asset Value and Redemption Price Per Share
(net assets ÷ shares of beneficial interest outstanding) | | $ | 14.64 | | |
Maximum Offering Price Per Share
(100 ÷ 94.25 of $14.64) | | $ | 15.53 | | |
| Class B Shares | |
| Net Assets | | $ | 7,801,793 | | |
| Shares Outstanding | | | 546,929 | | |
Net Asset Value, Offering Price and Redemption Price Per Share
(net assets ÷ shares of beneficial interest outstanding) | | $ | 14.26 | | |
| Class C Shares | |
| Net Assets | | $ | 6,968,218 | | |
| Shares Outstanding | | | 488,203 | | |
Net Asset Value, Offering Price and Redemption Price Per Share
(net assets ÷ shares of beneficial interest outstanding) | | $ | 14.27 | | |
| On sales of $50,000 or more, the offering price of Class A shares is reduced. | | | | | |
Statement of Operations
For the Year Ended
October 31, 2005
| Investment Income | |
| Dividends allocated from Portfolio | | $ | 309,603 | | |
| Interest allocated from Portfolio | | | 7,989 | | |
| Expenses allocated from Portfolio | | | (319,168 | ) | |
| Net investment loss from Portfolio | | $ | (1,576 | ) | |
| Expenses | |
| Administration fee | | $ | 41,665 | | |
| Trustees' fees and expenses | | | 188 | | |
Distribution and service fees
Class A | | | 33,521 | | |
| Class B | | | 80,580 | | |
| Class C | | | 63,104 | | �� |
| Registration fees | | | 49,204 | | |
| Transfer and dividend disbursing agent fees | | | 37,688 | | |
| Printing and postage | | | 16,517 | | |
| Legal and accounting services | | | 15,381 | | |
| Custodian fee | | | 11,586 | | |
| Miscellaneous | | | 3,001 | | |
| Total expenses | | $ | 352,435 | | |
Deduct —
Allocation of Fund expenses to affiliate | | $ | 77,125 | | |
| Total expense reductions | | $ | 77,125 | | |
| Net expenses | | $ | 275,310 | | |
| Net investment loss | | $ | (276,886 | ) | |
Realized and Unrealized
Gain (Loss) from Portfolio | |
Net realized gain (loss) —
Investment transactions (identified cost basis) | | $ | 1,706,801 | | |
| Net realized gain | | $ | 1,706,801 | | |
Change in unrealized appreciation (depreciation) —
Investments (identified cost basis) | | $ | 1,546,477 | | |
| Net change in unrealized appreciation (depreciation) | | $ | 1,546,477 | | |
| Net realized and unrealized gain | | $ | 3,253,278 | | |
| Net increase in net assets from operations | | $ | 2,976,392 | | |
See notes to financial statements
7
Eaton Vance Tax-Managed Small-Cap Value Fund as of October 31, 2005
FINANCIAL STATEMENTS CONT'D
Statements of Changes in Net Assets
Increase (Decrease)
in Net Assets | | Year Ended
October 31, 2005 | | Year Ended
October 31, 2004 | |
From operations —
Net investment loss | | $ | (276,886 | ) | | $ | (226,845 | ) | |
Net realized gain (loss) from
investment transactions | | | 1,706,801 | | | | (78,269 | ) | |
Net change in unrealized appreciation
(depreciation) of investments | | | 1,546,477 | | | | 2,887,638 | | |
| Net increase in net assets from operations | | $ | 2,976,392 | | | $ | 2,582,524 | | |
Transactions in shares of beneficial interest —
Proceeds from sale of shares
Class A | | $ | 3,665,581 | | | $ | 3,661,567 | | |
| Class B | | | 1,643,624 | | | | 1,686,742 | | |
| Class C | | | 2,297,905 | | | | 1,531,872 | | |
Cost of shares redeemed
Class A | | | (1,685,652 | ) | | | (1,647,682 | ) | |
| Class B | | | (2,425,388 | ) | | | (630,993 | ) | |
| Class C | | | (1,134,719 | ) | | | (788,545 | ) | |
Net asset value of shares exchanged
Class A | | | 94,010 | | | | 72,695 | | |
| Class B | | | (94,010 | ) | | | (72,695 | ) | |
Net increase in net assets from
Fund share transactions | | $ | 2,361,351 | | | $ | 3,812,961 | | |
| Net increase in net assets | | $ | 5,337,743 | | | $ | 6,395,485 | | |
| Net Assets | |
| At beginning of year | | $ | 23,734,921 | | | $ | 17,339,436 | | |
| At end of year | | $ | 29,072,664 | | | $ | 23,734,921 | | |
See notes to financial statements
8
Eaton Vance Tax-Managed Small-Cap Value Fund as of October 31, 2005
FINANCIAL STATEMENTS CONT'D
Financial Highlights
| | | Class A | |
| | | Year Ended October 31, | | Period Ended | |
| | | 2005 | | 2004 | | 2003 | | October 31, 2002(2) | |
| Net asset value — Beginning of year | | $ | 13.010 | | | $ | 11.420 | | | $ | 8.860 | | | $ | 10.000 | | |
| Income (loss) from operations | |
| Net investment loss(1) | | $ | (0.087 | ) | | $ | (0.082 | ) | | $ | (0.061 | ) | | $ | (0.046 | ) | |
| Net realized and unrealized gain (loss) | | | 1.717 | | | | 1.672 | | | | 2.621 | | | | (1.094 | ) | |
| Total income (loss) from operations | | $ | 1.630 | | | $ | 1.590 | | | $ | 2.560 | | | $ | (1.140 | ) | |
| Net asset value — End of year | | $ | 14.640 | | | $ | 13.010 | | | $ | 11.420 | | | $ | 8.860 | | |
| Total Return(3) | | | 12.53 | % | | | 13.92 | % | | | 28.89 | % | | | (11.40 | )% | |
| Ratios/Supplemental Data† | |
| Net assets, end of year (000's omitted) | | $ | 14,303 | | | $ | 10,772 | | | $ | 7,509 | | | $ | 3,105 | | |
| Ratios (As a percentage of average daily net assets): | |
| Net expenses(4) | | | 1.75 | % | | | 1.75 | % | | | 1.75 | % | | | 1.75 | %(5) | |
| Net expenses after custodian fee reduction(4) | | | 1.75 | % | | | 1.75 | % | | | 1.75 | % | | | 1.75 | %(5) | |
| Net investment loss | | | (0.61 | )% | | | (0.67 | )% | | | (0.62 | )% | | | (0.74 | )%(5) | |
| Portfolio Turnover of the Portfolio | | | 24 | % | | | 12 | % | | | 21 | % | | | 5 | % | |
† The operating expenses of the Fund reflect an allocation of expenses to the Administrator. Had such action not been taken, the ratios and net investment loss per share would have been as follows:
| Ratios (As a percentage of average daily net assets): | |
| Expenses(4) | | | 2.03 | % | | | 2.10 | % | | | 2.60 | % | | | 4.41 | %(5) | |
| Expenses after custodian fee reduction(4) | | | 2.03 | % | | | 2.10 | % | | | 2.60 | % | | | 4.41 | %(5) | |
| Net investment loss | | | (0.89 | )% | | | (1.02 | )% | | | (1.47 | )% | | | (3.40 | )%(5) | |
| Net investment loss per share(1) | | $ | (0.126 | ) | | $ | (0.125 | ) | | $ | (0.145 | ) | | $ | (0.211 | ) | |
(1) Net investment loss per share was computed using average shares outstanding.
(2) For the period from the start of business, March 4, 2002, to October 31, 2002.
(3) Returns are historical and are calculated by determining the percentage change in net asset value with all distributions reinvested. Total return is not computed on an annualized basis.
(4) Includes the Fund's share of the Portfolio's allocated expenses.
(5) Annualized.
See notes to financial statements
9
Eaton Vance Tax-Managed Small-Cap Value Fund as of October 31, 2005
FINANCIAL STATEMENTS CONT'D
Financial Highlights
| | | Class B | |
| | | Year Ended October 31, | | Period Ended | |
| | | 2005 | | 2004 | | 2003 | | October 31, 2002(2) | |
| Net asset value — Beginning of year | | $ | 12.770 | | | $ | 11.290 | | | $ | 8.820 | | | $ | 10.000 | | |
| Income (loss) from operations | |
| Net investment loss(1) | | $ | (0.189 | ) | | $ | (0.171 | ) | | $ | (0.132 | ) | | $ | (0.091 | ) | |
| Net realized and unrealized gain (loss) | | | 1.679 | | | | 1.651 | | | | 2.602 | | | | (1.089 | ) | |
| Total income (loss) from operations | | $ | 1.490 | | | $ | 1.480 | | | $ | 2.470 | | | $ | (1.180 | ) | |
| Net asset value — End of year | | $ | 14.260 | | | $ | 12.770 | | | $ | 11.290 | | | $ | 8.820 | | |
| Total Return(3) | | | 11.67 | % | | | 13.11 | % | | | 28.00 | % | | | (11.80 | )% | |
| Ratios/Supplemental Data† | |
| Net assets, end of year (000's omitted) | | $ | 7,802 | | | $ | 7,784 | | | $ | 5,961 | | | $ | 2,323 | | |
| Ratios (As a percentage of average daily net assets): | |
| Net expenses(4) | | | 2.50 | % | | | 2.50 | % | | | 2.50 | % | | | 2.50 | %(5) | |
| Net expenses after custodian fee reduction(4) | | | 2.50 | % | | | 2.50 | % | | | 2.50 | % | | | 2.50 | %(5) | |
| Net investment loss | | | (1.36 | )% | | | (1.41 | )% | | | (1.36 | )% | | | (1.47 | )%(5) | |
| Portfolio Turnover of the Portfolio | | | 24 | % | | | 12 | % | | | 21 | % | | | 5 | % | |
† The operating expenses of the Fund reflect an allocation of expenses to the Administrator. Had such action not been taken, the ratios and net investment loss per share would have been as follows:
| Ratios (As a percentage of average daily net assets): | |
| Expenses(4) | | | 2.78 | % | | | 2.85 | % | | | 3.35 | % | | | 5.16 | %(5) | |
| Expenses after custodian fee reduction(4) | | | 2.78 | % | | | 2.85 | % | | | 3.35 | % | | | 5.16 | %(5) | |
| Net investment loss | | | (1.64 | )% | | | (1.76 | )% | | | (2.21 | )% | | | (4.13 | )%(5) | |
| Net investment loss per share(1) | | $ | (0.227 | ) | | $ | (0.213 | ) | | $ | (0.215 | ) | | $ | (0.256 | ) | |
(1) Net investment loss per share was computed using average shares outstanding.
(2) For the period from the start of business, March 4, 2002, to October 31, 2002.
(3) Returns are historical and are calculated by determining the percentage change in net asset value with all distributions reinvested. Total return is not computed on an annualized basis.
(4) Includes the Fund's share of the Portfolio's allocated expenses.
(5) Annualized.
See notes to financial statements
10
Eaton Vance Tax-Managed Small-Cap Value Fund as of October 31, 2005
FINANCIAL STATEMENTS CONT'D
Financial Highlights
| | | Class C | |
| | | Year Ended October 31, | | Period Ended | |
| | | 2005 | | 2004 | | 2003 | | October 31, 2002(2) | |
| Net asset value — Beginning of year | | $ | 12.780 | | | $ | 11.290 | | | $ | 8.820 | | | $ | 10.000 | | |
| Income (loss) from operations | |
| Net investment loss(1) | | $ | (0.189 | ) | | $ | (0.171 | ) | | $ | (0.131 | ) | | $ | (0.092 | ) | |
| Net realized and unrealized gain (loss) | | | 1.679 | | | | 1.661 | | | | 2.601 | | | | (1.088 | ) | |
| Total income (loss) from operations | | $ | 1.490 | | | $ | 1.490 | | | $ | 2.470 | | | $ | (1.180 | ) | |
| Net asset value — End of year | | $ | 14.270 | | | $ | 12.780 | | | $ | 11.290 | | | $ | 8.820 | | |
| Total Return(3) | | | 11.66 | % | | | 13.20 | % | | | 28.00 | % | | | (11.80 | )% | |
| Ratios/Supplemental Data† | |
| Net assets, end of year (000's omitted) | | $ | 6,968 | | | $ | 5,179 | | | $ | 3,870 | | | $ | 1,862 | | |
| Ratios (As a percentage of average daily net assets): | |
| Net expenses(4) | | | 2.50 | % | | | 2.50 | % | | | 2.50 | % | | | 2.50 | %(5) | |
| Net expenses after custodian fee reduction(4) | | | 2.50 | % | | | 2.50 | % | | | 2.50 | % | | | 2.50 | %(5) | |
| Net investment loss | | | (1.36 | )% | | | (1.42 | )% | | | (1.35 | )% | | | (1.48 | )%(5) | |
| Portfolio Turnover of the Portfolio | | | 24 | % | | | 12 | % | | | 21 | % | | | 5 | % | |
† The operating expenses of the Fund reflect an allocation of expenses to the Administrator. Had such action not been taken, the ratios and net investment loss per share would have been as follows:
| Ratios (As a percentage of average daily net assets): | |
| Expenses(4) | | | 2.78 | % | | | 2.85 | % | | | 3.35 | % | | | 5.16 | %(5) | |
| Expenses after custodian fee reduction(4) | | | 2.78 | % | | | 2.85 | % | | | 3.35 | % | | | 5.16 | %(5) | |
| Net investment loss | | | (1.64 | )% | | | (1.77 | )% | | | (2.20 | )% | | | (4.15 | )%(5) | |
| Net investment loss per share(1) | | $ | (0.228 | ) | | $ | (0.213 | ) | | $ | (0.213 | ) | | $ | (0.258 | ) | |
(1) Net investment loss per share was computed using average shares outstanding.
(2) For the period from the start of business, March 4, 2002, to October 31, 2002.
(3) Returns are historical and are calculated by determining the percentage change in net asset value with all distributions reinvested. Total return is not computed on an annualized basis.
(4) Includes the Fund's share of the Portfolio's allocated expenses.
(5) Annualized.
See notes to financial statements
11
Eaton Vance Tax-Managed Small-Cap Value Fund as of October 31, 2005
NOTES TO FINANCIAL STATEMENTS
1 Significant Accounting Policies
Eaton Vance Tax-Managed Small-Cap Value Fund (the Fund) is a diversified series of Eaton Vance Mutual Funds Trust (the Trust). The Trust is an entity of the type commonly known as a Massachusetts business trust and is registered under the Investment Company Act of 1940, as amended, as an open-end management investment company. The Fund offers three classes of shares. Class A shares are generally sold subject to a sales charge imposed at time of purchase. Class B and Class C shares are sold at net asset value and are generally subject to a contingent deferred sales charge (see Note 6). Class B shares held for eight years will automatically convert to Class A shares. Each class represents a pro rata interest in the Fund, but votes separately on class-specific matters and (as noted below) is subject to different expenses. Realized and unrealized gains and losses and net investment income and losses, other than class-specific expens es, are allocated daily to each class of shares based on the relative net assets of each class to the total net assets of the Fund. Each class of shares differs in its distribution plan and certain other class-specific expenses. The Fund invests all of its investable assets in interests of the Tax-Managed Small-Cap Value Portfolio (the Portfolio), a New York Trust, having the same investment objective as the Fund. The value of the Fund's investment in the Portfolio reflects the Fund's proportionate interest in the net assets of the Portfolio (57.4% at October 31, 2005). The performance of the Fund is directly affected by the performance of the Portfolio. The financial statements of the Portfolio, including the Portfolio of Investments, are included elsewhere in this report and should be read in conjunction with the Fund's financial statements.
The following is a summary of significant accounting policies consistently followed by the Fund in the preparation of its financial statements. The policies are in conformity with accounting principles generally accepted in the United States of America.
A Investment Valuation — Valuation of securities by the Portfolio is discussed in Note 1A of the Portfolio's Notes to Financial Statements which are included elsewhere in this report.
B Income — The Fund's net investment income or loss consists of the Fund's pro-rata share of the net investment income or loss of the Portfolio, less all actual and accrued expenses of the Fund, determined in accordance with accounting principles generally accepted in the United States of America.
C Expenses — The majority of expenses of the Trust are directly identifiable to an individual fund. Expenses which are not readily identifiable to a specific fund are allocated taking into consideration, among other things, the nature and type of expense and the relative size of the fund.
D Federal Taxes — The Fund's policy is to comply with the provisions of the Internal Revenue Code applicable to regulated investment companies and to distribute to shareholders, each year, all of its net investment income, and any net realized capital gains. Accordingly, no provision for federal income or excise tax is necessary.
E Expense Reduction — Investors Bank & Trust Company (IBT) serves as custodian to the Fund and the Portfolio. Pursuant to the respective custodian agreements, IBT receives a fee reduced by credits which are determined based on the average daily cash balances the Fund or the Portfolio maintains with IBT. All credit balances used to reduce the Fund's custodian fees are reported as a reduction of total expenses in the Statement of Operations.
F Other — Investment transactions are accounted for on a trade-date basis. Dividends to shareholders are recorded on the ex-dividend date.
G Indemnifications — Under the Trust's organizational documents, its officers and Trustees may be indemnified against certain liabilities and expenses arising out of the performance of their duties to the Fund, and shareholders are indemnified against personal liability for obligations of the Trust. Additionally, in the normal course of business, the Fund enters into agreements with service providers that may contain indemnification clauses. The Fund's maximum exposure under these arrangements is unknown as this would involve future claims that may be made against the Fund that have not yet occurred.
H Use of Estimates — The preparation of the financial statements in conformity with accounting principles generally accepted in the United States of America requires management to make estimates and assumptions that affect the reported amounts of assets and liabilities at the date of the financial statements and the reported amounts of income and expense during the reporting period. Actual results could differ from those estimates.
12
Eaton Vance Tax-Managed Small-Cap Value Fund as of October 31, 2005
NOTES TO FINANCIAL STATEMENTS CONT'D
2 Distributions to Shareholders
It is the present policy of the Fund to make at least one distribution annually (normally in December) of all or substantially all of its net investment income, if any, and at least one distribution annually of all or substantially all of its net realized capital gains, if any (reduced by available capital loss carryforwards from prior years, if any). Distributions are declared separately for each class of shares. Shareholders may reinvest all distributions in additional shares of the same class of the Fund at the net asset value as of the close of business on the ex-dividend date. Distributions are paid in the form of additional shares of the same class of the Fund or, at the election of the shareholder, in cash. The Fund distinguishes between distributions on a tax basis and a financial reporting basis. Accounting principles generally accepted in the United States of America require that only distributions in excess of tax bas is earnings and profits be reported in the financial statements as a return of capital. Permanent differences between book and tax accounting relating to distributions are reclassified to paid-in capital.
During the year ended October 31, 2005, accumulated paid-in capital was decreased by $276,886 and accumulated net investment loss was decreased by $276,886 primarily due to differences between book and tax accounting for net operating losses. This change had no effect on the net assets or the net asset value per share.
As of October 31, 2005, the components of distributable earnings (accumulated losses) on a tax basis were as follows:
| Unrealized gain | | $ | 6,517,917 | | |
| Other temporary differences | | $ | (10,199 | ) | |
| Long-term capital gain | | $ | 1,624,105 | | |
3 Shares of Beneficial Interest
The Fund's Declaration of Trust permits the Trustees to issue an unlimited number of full and fractional shares of beneficial interest (without par value). Transactions in Fund shares were as follows:
| | | Year Ended October 31, | |
| Class A | | 2005 | | 2004 | |
| Sales | | | 260,833 | | | | 298,567 | | |
| Redemptions | | | (118,493 | ) | | | (134,413 | ) | |
| Exchange from Class B shares | | | 6,518 | | | | 6,175 | | |
| Net increase | | | 148,858 | | | | 170,329 | | |
| | | Year Ended October 31, | |
| Class B | | 2005 | | 2004 | |
| Sales | | | 118,925 | | | | 140,127 | | |
| Redemptions | | | (174,916 | ) | | | (52,242 | ) | |
| Exchange to Class A shares | | | (6,667 | ) | | | (6,256 | ) | |
| Net increase (decrease) | | | (62,658 | ) | | | 81,629 | | |
| | | Year Ended October 31, | |
| Class C | | 2005 | | 2004 | |
| Sales | | | 164,905 | | | | 127,970 | | |
| Redemptions | | | (81,963 | ) | | | (65,327 | ) | |
| Net increase | | | 82,942 | | | | 62,643 | | |
4 Transactions with Affiliates
The administration fee is earned by Eaton Vance Management (EVM) as compensation for managing and administering the business affairs of the Fund. Under the administration agreement, EVM earns a fee in the amount of 0.15% per annum of average daily net assets of the Fund. For the year ended October 31, 2005, the administration fee amounted to $41,665. Pursuant to a voluntary expense reimbursement, EVM was allocated $77,125 of the Fund's operating expenses for the year ended October 31, 2005. The Portfolio has engaged Boston Management and Research (BMR), a subsidiary of EVM, to render investment advisory services. (See Note 2 of the Portfolio's Notes to Financial Statements which are included elsewhere in this report.) EVM serves as the sub-transfer agent of the Fund and receives from the transfer agent an aggregate fee based upon the actual expenses incurred by EVM in the performance of those services. For the year ended October 31, 2005, EVM earned $3,479 in sub-transfer agent fees.
Except for Trustees of the Fund and the Portfolio who are not members of EVM's or BMR's organization, officers and Trustees receive remuneration for their services to the Fund out of the investment adviser fee earned by BMR. Trustees of the Fund that are not affiliated with EVM or BMR may elect to defer receipt of all or a percentage of their annual fees in accordance with the terms of the Trustees Deferred Compensation Plan. For the year ended October 31, 2005, no significant amounts have been deferred.
Eaton Vance Distributors, Inc. (EVD), a subsidiary of EVM and the Fund's principal underwriter, received $9,571 as its
13
Eaton Vance Tax-Managed Small-Cap Value Fund as of October 31, 2005
NOTES TO FINANCIAL STATEMENTS CONT'D
portion of the sales charge on sales of Class A shares for the year ended October 31, 2005.
Certain officers and Trustees of the Fund and of the Portfolio are officers of the above organizations.
5 Distribution and Service Plans
The Fund has in effect distribution plans for Class B shares (Class B Plan), and Class C shares (Class C Plan), pursuant to Rule 12b-1 under the Investment Company Act of 1940 and a service plan for Class A shares (Class A Plan) (collectively, the Plans). The Class B and Class C Plans require the Fund to pay EVD amounts equal to 1/365 of 0.75% of the Fund's average daily net assets attributable to Class B and Class C shares, for providing ongoing distribution services and facilities to the Fund. The Fund will automatically discontinue payments to EVD during any period in which there are no outstanding Uncovered Distribution Charges, which are equivalent to the sum of (i) 6.25% of the aggregate amount received by the Fund for the Class B and Class C shares sold, plus (ii) interest calculated by applying the rate of 1% over the prevailing prime rate to the outstanding balance of Uncovered Distribution Charges of EVD, of each respe ctive class, reduced by the aggregate amount of contingent deferred sales charges (see Note 6) and daily amounts theretofore paid to EVD by each respective class. The Fund paid or accrued $60,435 and $47,328 for Class B and Class C shares, respectively, to or payable to EVD for the year ended October 31, 2005, representing 0.75% of the average daily net assets for Class B and Class C shares, respectively. At October 31, 2005, the amount of Uncovered Distribution Charges of EVD calculated under the Plans was approximately $171,000 and $301,000 for Class B and Class C shares, respectively.
The Plans authorize the Fund to make payments of service fees to EVD, investment dealers and other persons in amounts equal to 0.25% of the Fund's average daily net assets attributable to Class A, Class B and Class C shares for each fiscal year. Service fee payments are made for personal services and/or the maintenance of shareholder accounts. Service fees are separate and distinct from the sales commissions and distribution fees payable by the Fund to EVD and, as such, are not subject to automatic discontinuance when there are no outstanding Uncovered Distribution Charges of EVD. Service fees for the year ended October 31, 2005 amounted to $33,521, $20,145, and $15,776, for Class A, Class B and Class C shares, respectively.
6 Contingent Deferred Sales Charge
A contingent deferred sales charge (CDSC) generally is imposed on redemptions of Class B shares made within six years of purchase and on redemptions of Class C shares made within one year of purchase. Generally, the CDSC is based upon the lower of the net asset value at date of redemption or date of purchase. No charge is levied on shares acquired by reinvestment of dividends or capital gain distributions. Class A shares may be subject to a 1% CDSC if redeemed within one year of purchase (depending upon the circumstances of purchase). The Class B CDSC is imposed at declining rates that begin at 5% in the case of redemptions in the first and second year after purchase, declining one percentage point each subsequent year. Class C shares will be subject to a 1% CDSC if redeemed within one year of purchase.
No CDSC is levied on shares which have been sold to EVM or its affiliates or to their respective employees or clients and may be waived under certain other limited conditions. CDSC pertaining to Class B and Class C redemptions are paid to EVD to reduce the amount of Uncovered Distribution Charges calculated under the Class B and Class C Plans, respectively (see Note 5). CDSC assessed on Class B and Class C shares when no Uncovered Distribution Charges exist for the respective classes will be credited to the Fund. EVD received approximately $45,000 and $1,000 of CDSC paid by shareholders of Class B shares and Class C shares, respectively, for the year ended October 31, 2005. EVD did not receive any CDSC for Class A shares for the year ended October 31, 2005.
7 Investment Transactions
Increases and decreases in the Fund's investment in the Portfolio aggregated $7,616,139 and $5,415,239, respectively, for the year ended October 31, 2005.
14
Eaton Vance Tax-Managed Small-Cap Value Fund as of October 31, 2005
REPORT OF INDEPENDENT REGISTERED PUBLIC ACCOUNTING FIRM
To the Trustees of Eaton Vance Mutual Funds Trust and Shareholders of Eaton Vance Tax-Managed Small-Cap Value Fund:
We have audited the accompanying statement of assets and liabilities of Eaton Vance Tax-Managed Small-Cap Value Fund (the Fund) (one of the series of Eaton Vance Mutual Funds Trust) as of October 31, 2005, the related statement of operations for the year then ended, the statements of changes in net assets for each of the two years in the period then ended and the financial highlights for each of the three years in the period then ended, and for the period from the start of business, March 4, 2002, to October 31, 2002. These financial statements and financial highlights are the responsibility of the Fund's management. Our responsibility is to express an opinion on these financial statements and financial highlights based on our audits.
We conducted our audits in accordance with standards of the Public Company Accounting Oversight Board (United States). Those standards require that we plan and perform the audit to obtain reasonable assurance about whether the financial statements and financial highlights are free of material misstatement. The Fund is not required to have, nor were we engaged to perform, an audit of its internal control over financial reporting. An audit includes consideration of internal control over financial reporting as a basis for designing audit procedures that are appropriate in the circumstances, but not for the purpose of expressing an opinion on the effectiveness of the Fund's internal control over financial reporting. Accordingly, we express no such opinion. An audit also includes examining, on a test basis, evidence supporting the amounts and disclosures in the financial statements, assessing the accounting principles used and signif icant estimates made by management, as well as evaluating the overall financial statement presentation. We believe that our audits provide a reasonable basis for our opinion.
In our opinion, the financial statements and financial highlights referred to above present fairly, in all material respects, the financial position of Eaton Vance Tax-Managed Small-Cap Value Fund as of October 31, 2005, the results of its operations for the year then ended, the changes in its net assets for each of the two years in the period then ended, and the financial highlights for each of the three years in the period then ended and for the period from the start of business, March 4, 2002 to October 31, 2002, in conformity with accounting principles generally accepted in the United States of America.
DELOITTE & TOUCHE LLP
Boston, Massachusetts
December 19, 2005
15
Tax-Managed Small-Cap Value Portfolio as of October 31, 2005
PORTFOLIO OF INVESTMENTS
| Common Stocks — 99.1% | |
| Security | | Shares | | Value | |
| Auto Related — 3.2% | |
| BorgWarner, Inc. | | | 28,100 | | | $ | 1,629,519 | | |
| | | $ | 1,629,519 | | |
| Cement — 2.4% | |
| Lafarge North America, Inc. | | | 20,500 | | | $ | 1,240,455 | | |
| | | $ | 1,240,455 | | |
| Chemical — 3.2% | |
| RPM, Inc. | | | 87,500 | | | $ | 1,629,250 | | |
| | | $ | 1,629,250 | | |
| Computer / Communications Related — 1.4% | |
| International Rectifier Corp.(1) | | | 23,800 | | | $ | 704,242 | | |
| | | $ | 704,242 | | |
| Construction / Engineering — 1.6% | |
| Granite Construction, Inc. | | | 24,000 | | | $ | 818,640 | | |
| | | $ | 818,640 | | |
| Electrical Equipment — 2.9% | |
| Belden CDT, Inc. | | | 74,500 | | | $ | 1,484,785 | | |
| | | $ | 1,484,785 | | |
| Electronics — 3.1% | |
| Bel Fuse, Inc. Class B | | | 30,400 | | | $ | 915,040 | | |
| Technitrol, Inc. | | | 38,000 | | | | 639,160 | | |
| | | $ | 1,554,200 | | |
| Energy — 19.3% | |
| Cimarex Energy Co.(1) | | | 14,500 | | | $ | 569,270 | | |
| Maverick Tube Corp.(1) | | | 52,900 | | | | 1,637,784 | | |
| Newfield Exploration Co.(1) | | | 39,000 | | | | 1,767,870 | | |
| Piedmont Natural Gas Co., Inc. | | | 74,000 | | | | 1,750,840 | | |
| Questar Corp. | | | 18,000 | | | | 1,417,500 | | |
| Spinnaker Exploration Co.(1) | | | 43,000 | | | | 2,647,940 | | |
| | | $ | 9,791,204 | | |
| Security | | Shares | | Value | |
| Food Wholesalers / Retailers — 2.5% | |
| Performance Food Group Co.(1) | | | 26,900 | | | $ | 742,171 | | |
| SUPERVALU, Inc. | | | 16,500 | | | | 518,595 | | |
| | | $ | 1,260,766 | | |
| Household Products — 6.7% | |
| Church & Dwight Co., Inc. | | | 65,000 | | | $ | 2,278,250 | | |
| Prestige Brands Holdings, Inc.(1) | | | 92,000 | | | | 1,108,600 | | |
| | | $ | 3,386,850 | | |
| Industrial Products — 10.6% | |
| A.O. Smith Corp. | | | 46,500 | | | $ | 1,505,670 | | |
| Albany International Corp., Class A | | | 43,000 | | | | 1,661,090 | | |
| CLARCOR, Inc. | | | 22,000 | | | | 605,000 | | |
| Teleflex, Inc. | | | 24,500 | | | | 1,621,655 | | |
| | | $ | 5,393,415 | | |
| Insurance — 6.1% | |
| Protective Life Corp. | | | 42,000 | | | $ | 1,841,280 | | |
| Scottish Re Group Ltd. | | | 52,000 | | | | 1,276,600 | | |
| | | $ | 3,117,880 | | |
| Medical Services / Supplies — 9.3% | |
| CONMED Corp.(1) | | | 44,000 | | | $ | 1,055,120 | | |
| Owens & Minor, Inc. | | | 47,500 | | | | 1,398,875 | | |
| PolyMedica Corp. | | | 40,000 | | | | 1,320,400 | | |
| West Pharmaceutical Services, Inc. | | | 40,500 | | | | 971,190 | | |
| | | $ | 4,745,585 | | |
| Packaging — 5.7% | |
| AptarGroup, Inc. | | | 38,200 | | | $ | 1,955,458 | | |
| Tupperware Corp. | | | 40,000 | | | | 917,200 | | |
| | | $ | 2,872,658 | | |
| Personal Products — 1.0% | |
| Chattem, Inc.(1) | | | 15,000 | | | $ | 495,000 | | |
| | | $ | 495,000 | | |
| Restaurant — 4.1% | |
| Applebee's International, Inc. | | | 28,500 | | | $ | 624,435 | | |
| CBRL Group, Inc. | | | 17,200 | | | | 596,840 | | |
| Landry's Restaurants, Inc. | | | 30,700 | | | | 844,250 | | |
| | | $ | 2,065,525 | | |
See notes to financial statements
16
Tax-Managed Small-Cap Value Portfolio as of October 31, 2005
PORTFOLIO OF INVESTMENTS CONT'D
| Security | | Shares | | Value | |
| Retailing — 5.5% | |
| BJ's Wholesale Club, Inc.(1) | | | 47,000 | | | $ | 1,338,560 | | |
| Claire's Stores, Inc. | | | 56,000 | | | | 1,458,800 | | |
| | | $ | 2,797,360 | | |
| Toy — 2.6% | |
| RC2 Corp.(1) | | | 38,500 | | | $ | 1,346,730 | | |
| | | $ | 1,346,730 | | |
| Transportation — 7.9% | |
| Arkansas Best Corp. | | | 48,500 | | | $ | 1,879,860 | | |
| Offshore Logistics, Inc.(1) | | | 28,500 | | | | 969,000 | | |
| OMI Corp. | | | 31,500 | | | | 569,520 | | |
| Yellow Roadway Corp.(1) | | | 12,800 | | | | 581,760 | | |
| | | $ | 4,000,140 | | |
Total Common Stocks
(identified cost $35,283,980) | | | | | | $ | 50,334,204 | | |
Total Investments — 99.1%
(identified cost $35,283,980) | | | | | | $ | 50,334,204 | | |
| Other Assets, Less Liabilities — 0.9% | | | | | | $ | 456,695 | | |
| Net Assets — 100.0% | | | | | | $ | 50,790,899 | | |
(1) Non-income producing security.
See notes to financial statements
17
Tax-Managed Small-Cap Value Portfolio as of October 31, 2005
FINANCIAL STATEMENTS
Statement of Assets and Liabilities
As of October 31, 2005
| Assets | |
| Investments, at value (identified cost, $35,283,980) | | $ | 50,334,204 | | |
| Cash | | | 493,803 | | |
| Dividends and interest receivable | | | 43,841 | | |
| Total assets | | $ | 50,871,848 | | |
| Liabilities | |
| Payable to affiliate for Trustees' fees | | $ | 559 | | |
| Payable to affiliate for investment advisory fees | | | 42,445 | | |
| Accrued expenses | | | 37,945 | | |
| Total liabilities | | $ | 80,949 | | |
| Net Assets applicable to investors' interest in Portfolio | | $ | 50,790,899 | | |
| Sources of Net Assets | |
| Net proceeds from capital contributions and withdrawals | | $ | 35,740,675 | | |
| Net unrealized appreciation (computed on the basis of identified cost) | | | 15,050,224 | | |
| Total | | $ | 50,790,899 | | |
Statement of Operations
For the Year Ended
October 31, 2005
| Investment Income | |
| Dividends | | $ | 621,486 | | |
| Interest | | | 16,708 | | |
| Total investment income | | $ | 638,194 | | |
| Expenses | |
| Investment adviser fee | | $ | 561,188 | | |
| Trustees' fees and expenses | | | 5,129 | | |
| Custodian fee | | | 41,056 | | |
| Legal and accounting services | | | 27,790 | | |
| Miscellaneous | | | 5,674 | | |
| Total expenses | | $ | 640,837 | | |
Deduct —
Reduction of custodian fee | | $ | 115 | | |
| Total expense reductions | | $ | 115 | | |
| Net expenses | | $ | 640,722 | | |
| Net investment loss | | $ | (2,528 | ) | |
| Realized and Unrealized Gain (Loss) | |
Net realized gain (loss) —
Investment transactions (identified cost basis) | | $ | 4,166,726 | | |
| Net realized gain | | $ | 4,166,726 | | |
Change in unrealized appreciation (depreciation) —
Investments (identified cost basis) | | $ | 2,782,379 | | |
| Net change in unrealized appreciation (depreciation) | | $ | 2,782,379 | | |
| Net realized and unrealized gain | | $ | 6,949,105 | | |
| Net increase in net assets from operations | | $ | 6,946,577 | | |
See notes to financial statements
18
Tax-Managed Small-Cap Value Portfolio as of October 31, 2005
FINANCIAL STATEMENTS CONT'D
Statements of Changes in Net Assets
Increase (Decrease)
in Net Assets | | Year Ended
October 31, 2005 | | Year Ended
October 31, 2004 | |
From operations —
Net investment loss | | $ | (2,528 | ) | | $ | (29,710 | ) | |
Net realized gain (loss) from
investment transactions | | | 4,166,726 | | | | (18,679 | ) | |
Net change in unrealized appreciation
(depreciation) of investments | | | 2,782,379 | | | | 6,737,706 | | |
| Net increase in net assets from operations | | $ | 6,946,577 | | | $ | 6,689,317 | | |
Capital transactions —
Contributions | | $ | 7,616,139 | | | $ | 11,868,068 | | |
| Withdrawals | | | (16,997,334 | ) | | | (7,234,811 | ) | |
Net increase (decrease) in net assets from
capital transactions | | $ | (9,381,195 | ) | | $ | 4,633,257 | | |
| Net increase (decrease) in net assets | | $ | (2,434,618 | ) | | $ | 11,322,574 | | |
| Net Assets | |
| At beginning of year | | $ | 53,225,517 | | | $ | 41,902,943 | | |
| At end of year | | $ | 50,790,899 | | | $ | 53,225,517 | | |
See notes to financial statements
19
Tax-Managed Small-Cap Value Portfolio as of October 31, 2005
FINANCIAL STATEMENTS CONT'D
Supplementary Data
| | | Year Ended October 31, | | Period Ended | |
| | | 2005 | | 2004 | | 2003 | | October 31, 2002(1) | |
| Ratios/Supplemental Data | |
| Ratios (As a percentage of average daily net assets): | |
| Expenses | | | 1.15 | % | | | 1.14 | % | | | 1.18 | % | | | 1.77 | %(2) | |
| Expenses after custodian fee reduction | | | 1.15 | % | | | 1.14 | % | | | 1.18 | % | | | 1.77 | %(2) | |
| Net investment loss | | | (0.00 | )%(3) | | | (0.06 | )% | | | (0.04 | )% | | | (0.74 | )%(2) | |
| Portfolio Turnover | | | 24 | % | | | 12 | % | | | 21 | % | | | 5 | % | |
| Total Return(4) | | | 13.20 | % | | | 14.62 | % | | | 29.62 | % | | | (11.41 | )% | |
| Net assets, end of year (000's omitted) | | $ | 50,791 | | | $ | 53,226 | | | $ | 41,903 | | | $ | 17,340 | | |
(1) For the period from the start of business, March 1, 2002, to October 31, 2002.
(2) Annualized.
(3) Amounts to less than (0.00)%.
(4) Total return is not computed on an annualized basis.
See notes to financial statements
20
Tax-Managed Small-Cap Value Portfolio as of October 31, 2005
NOTES TO FINANCIAL STATEMENT
1 Significant Accounting Policies
Tax-Managed Small-Cap Value Portfolio (the Portfolio) is registered under the Investment Company Act of 1940, as amended, as a diversified open-end management investment company. The Portfolio, which was organized as a trust under the laws of the State of New York on December 10, 2001, seeks to achieve long-term after-tax returns by investing in a diversified portfolio of value stocks of small-cap companies. The Declaration of Trust permits the Trustees to issue interests in the Portfolio. At October 31, 2005, the Eaton Vance Tax-Managed Small-Cap Value Fund and the Eaton Vance Tax-Managed Equity Asset Allocation Fund held 57.4% and 42.3% interests in the Portfolio, respectively. The following is a summary of significant accounting policies consistently followed by the Portfolio in the preparation of its financial statements. The policies are in conformity with accounting principles generally accepted in the United States of Ame rica.
A Investment Valuation — Securities listed on a U.S. securities exchange generally are valued at the last sale price on the day of valuation or, if no sales took place on such date, at the mean between the closing bid and asked prices therefore on the exchange where such securities are principally traded. Equity securities listed on the NASDAQ National Market System generally are valued at the official NASDAQ closing price. Unlisted or listed securities for which closing sales prices or closing quotations are not available are valued at the mean between the latest available bid and asked prices or, in the case of preferred equity securities that are not listed or traded in the over-the-counter market, by an independent pricing service. Exchange-traded options are valued at the last sale price for the day of valuation as quoted on the principal exchange or board of trade on which the options are traded or, in the absence of sales on such date, at the mean between the latest bid and asked prices therefore. Futures positions on securities and currencies generally are valued at closing settlement prices. Short-term debt securities with a remaining maturity of 60 days or less are valued at amortized cost. If short-term debt securities were acquired with a remaining maturity of more than 60 days, their amortized cost value will be based on their value on the sixty-first day prior to maturity. Other fixed income and debt securities, including listed securities and securities for which price quotations are available, will normally be valued on the basis of valuations furnished by a pricing service. Foreign securities and currencies are valued in U.S. dollars, based on foreign currency exchange rate quotations su pplied by an independent quotation service. The daily valuation of exchange traded foreign securities generally is determined as of the close of trading on the principal exchange on which such securities trade. Events occurring after the close of trading on foreign exchanges may result in adjustments to the valuation of foreign securities to more accurately reflect their fair value as of the close of regular trading on the New York Stock Exchange. When valuing foreign equity securities that meet certain criteria, the Trustees have approved the use of a fair value service that values such securities to reflect market trading that occurs after the close of the applicable foreign markets of comparable securities or other instruments that have a strong correlation to the fair valued securities. Investments held by the Portfolio for which valuations or market quotations are unavailable are valued at fair value using methods determined in good faith by or at the direction of the Trustees of the Portfolio considering relevant factors, data and information including the market value of freely tradable securities of the same class in the principal market on which such securities are normally traded.
B Income — Dividend income is recorded on the ex-dividend date for dividends received in cash and/or securities. However, if the ex-dividend date has passed, certain dividends from foreign securities are recorded as the Portfolio is informed of the ex-dividend date. Interest income is recorded on the accrual basis.
C Income Taxes — The Portfolio is treated as a partnership for federal tax purposes. No provision is made by the Portfolio for federal or state taxes on any taxable income of the Portfolio because each investor in the Portfolio is ultimately responsible for the payment of any taxes on its share of taxable income. Since the Portfolio's investors include regulated investment companies that invest all or substantially all of their assets in the Portfolio, the Portfolio normally must satisfy the applicable source of income and diversification requirements (under the Internal Revenue Code) in order for its investors to satisfy them. The Portfolio will allocate at least annually among its investors each inv estor's distributive share of the Portfolio's net investment income, net realized capital gains, and any other items of income, gain, loss, deduction or credit.
D Financial Futures Contract — Upon entering a financial futures contract, the Portfolio is required to deposit either in cash or securities an amount (initial margin) equal to a certain percentage of the purchase price indicated in the financial futures contract. Subsequent payments are made or received by the Portfolio (margin maintenance) each day, dependent on daily fluctuations in the value of the underlying security, and are recorded for book purposes as unrealized gains or losses by the Portfolio.
21
Tax-Managed Small-Cap Value Portfolio as of October 31, 2005
NOTES TO FINANCIAL STATEMENT CONT'D
The Portfolio's investment in financial futures contracts is designed to hedge against anticipated future changes in price of current or anticipated Portfolio positions. Should prices move unexpectedly, the Portfolio may not achieve the anticipated benefits of the financial futures contracts and may realize a loss.
E Put Options — Upon the purchase of a put option by the Portfolio, the premium paid is recorded as an investment, the value of which is marked-to-market daily. When a purchased option expires, the Portfolio will realize a loss in the amount of the cost of the option. When the Portfolio enters into a closing sale transaction, the Portfolio will realize a gain or loss depending on whether the sales proceeds from the closing sale transaction are greater or less than the cost of the option. When the Portfolio exercises a put option, settlement is made in cash. The risk associated with purchasing options is limited to the premium originally paid.
F Securities Sold Short — The Portfolio may sell a security short if it owns at least an equal amount of the security sold short or another security convertible or exchangeable for an equal amount of the security sold short. Such transactions are done in anticipation of a decline in the market price of the securities or in order to hedge portfolio positions. The Portfolio will generally borrow the security sold in order to make delivery to the buyer. Upon executing the transaction, the Portfolio records the proceeds as deposits with brokers in the Statement of Assets and Liabilities and establishes an offsetting payable for securities sold short for the securities due on settlement. The proceeds are r etained by the broker as collateral for the short position. The liability is marked-to-market and the Portfolio is required to pay the lending broker any dividend or interest income earned while the short position is open. A gain or loss is recorded when the security is delivered to the broker. The Portfolio may recognize a loss on the transaction if the market value of the securities sold increases before the securities are delivered.
G Foreign Currency Translation — Investment valuations, other assets and liabilities initially expressed in foreign currencies are converted each business day into U.S. dollars based upon current exchange rates. Purchases and sales of foreign investment securities and income and expenses are converted into U.S. dollars based upon currency exchange rates prevailing on the respective dates of such transactions. Recognized gains or losses on investment transactions attributable to foreign currency exchange rates are recorded for financial statement purposes as net realized gains and losses on investments. That portion of unrealized g ains and losses on investments that results from fluctuations in foreign currency exchange rates is not separately disclosed.
H Expense Reduction — Investors Bank & Trust Company (IBT) serves as custodian of the Portfolio. Pursuant to the custodian agreement, IBT receives a fee reduced by credits which are determined based on the average daily cash balances the Portfolio maintains with IBT. All credit balances used to reduce the Portfolio's custodian fees are reported as a reduction of expenses on the Statement of Operations.
I Indemnifications — Under the Portfolio's organizational documents, its officers and Trustees may be indemnified against certain liabilities and expenses arising out of the performance of their duties to the Portfolio. Interestholders in the Portfolio are jointly and severally liable for the liabilities and obligations of the Portfolio in the event that the Portfolio fails to satisfy such liabilities and obligations; provided, however, that, to the extent assets are available in the Portfolio, the Portfolio may, under certain circumstances, indemnify interestholders from and against any claim or liability to which such holder may become subject by reason of being or having been an interestholder in t he Portfolio. Additionally, in the normal course of business, the Portfolio enters into agreements with service providers that may contain indemnification clauses. The Portfolio's maximum exposure under these arrangements is unknown as this would involve future claims that may be made against the Portfolio that have not yet occurred.
J Use of Estimates — The preparation of the financial statements in conformity with accounting principles generally accepted in the United States of America requires management to make estimates and assumptions that affect the reported amounts of assets and liabilities at the date of the financial statements and the reported amounts of income and expense during the reporting period. Actual results could differ from those estimates.
K Other — Investment transactions are accounted for on a trade-date basis. Realized gains and losses are computed based on the specific identification of securities sold.
2 Investment Adviser Fee and Other Transactions with Affiliates
The investment adviser fee is earned by Boston Management and Research (BMR), a wholly-owned subsidiary of Eaton Vance Management (EVM), as
22
Tax-Managed Small-Cap Value Portfolio as of October 31, 2005
NOTES TO FINANCIAL STATEMENT CONT'D
compensation for management and investment advisory services rendered to the Portfolio. Under the advisory agreement, BMR receives a monthly advisory fee in the amount of 1.00% annually of average daily net assets of the Portfolio up to $500 million, and at reduced rates as daily net assets exceed that level. For the year ended October 31, 2005, the advisory fee amounted to $561,188. Pursuant to a sub-advisory agreement, BMR has delegated the investment management of the Portfolio to Fox Asset Management LLC (Fox), a majority-owned subsidiary of EVM. BMR pays Fox a monthly fee for sub-advisory services provided to the Portfolio in the amount of 0.75% annually of average daily net assets up to $500 million, and at reduced rates as daily net assets exceed that level. Except for Trustees of the Portfolio who are not members of EVM's or BMR's organization, officers and Trustees receive remuneration for their services to the Portfoli o out of the investment adviser fee. Trustees of the Portfolio who are not affiliated with BMR may elect to defer receipt of all or a percentage of their annual fees in accordance with the terms of the Trustees Deferred Compensation Plan. For the year ended October 31, 2005, no significant amounts have been deferred.
Certain officers and Trustees of the Portfolio are officers of the above organizations.
3 Investment Transactions
Purchases and sales of investments, other than short-term obligations, aggregated $12,932,573 and $21,398,556, respectively, for the year ended October 31, 2005.
4 Federal Income Tax Basis of Unrealized Appreciation (Depreciation)
The cost and unrealized appreciation (depreciation) in value of the investments owned at October 31, 2005, as computed on a federal income tax basis, were as follows:
| Aggregate Cost | | $ | 35,314,929 | | |
| Gross unrealized appreciation | | $ | 15,206,802 | | |
| Gross unrealized depreciation | | | (187,527 | ) | |
| Net unrealized appreciation | | $ | 15,019,275 | | |
5 Financial Instruments
The Portfolio may trade in financial instruments with off-balance sheet risk in the normal course of its investing activities to assist in managing exposure to various market risks. These financial instruments include written options and financial futures contracts and may involve, to a varying degree, elements of risk in excess of the amounts recognized for financial statement purposes. The notional or contractual amounts of these instruments represent the investment the Portfolio has in particular classes of financial instruments and does not necessarily represent the amounts potentially subject to risk. The measurement of the risks associated with these instruments is meaningful only when all related and offsetting transactions are considered. The Portfolio did not have any open obligations under these financial instruments at October 31, 2005.
6 Line of Credit
The Portfolio participates with other portfolios and funds managed by BMR and EVM and its affiliates in a $150 million unsecured line of credit agreement with a group of banks. Borrowings will be made by the Portfolio solely to facilitate the handling of unusual and/or unanticipated short-term cash requirements. Interest is charged to each participating portfolio or fund based on its borrowings at an amount above either the Eurodollar rate or Federal Funds rate. In addition, a fee computed at an annual rate of 0.10% on the daily unused portion of the line of credit is allocated among the participating portfolios and funds at the end of each quarter. The Portfolio did not have any significant borrowings or allocated fees for the year ended October 31, 2005.
23
Tax-Managed Small-Cap Value Portfolio as of October 31, 2005
REPORT OF INDEPENDENT REGISTERED PUBLIC ACCOUNTING FIRM
To the Trustees and Investors
of Tax-Managed Small-Cap Value Portfolio:
We have audited the accompanying statement of assets and liabilities, including the portfolio of investments, of Tax-Managed Small-Cap Value Portfolio (the Portfolio) as of October 31, 2005, and the related statement of operations for the year then ended, the statements of changes in net assets for each of the two years in the period then ended and the supplementary data for each of the three years in the period then ended and for the period from the start of business, March 1, 2002 to October 31, 2002. These financial statements and supplementary data are the responsibility of the Portfolio's management. Our responsibility is to express an opinion on these financial statements and supplementary data based on our audits.
We conducted our audits in accordance with standards of the Public Company Accounting Oversight Board (United States). Those standards require that we plan and perform the audit to obtain reasonable assurance about whether the financial statements and supplementary data are free of material misstatement. The Portfolio is not required to have, nor were we engaged to perform, an audit of its internal control over financial reporting. An audit includes consideration of internal control over financial reporting as a basis for designing audit procedures that are appropriate in the circumstances, but not for the purpose of expressing an opinion on the effectiveness of the Portfolio's internal control over financial reporting. Accordingly, we express no such opinion. An audit also includes examining, on a test basis, evidence supporting the amounts and disclosures in the financial statements, assessing the accounting principles used an d significant estimates made by management, as well as evaluating the overall financial statement presentation. Our procedures included confirmation of securities held as of October 31, 2005 by correspondence with the custodian and brokers. We believe that our audits provide a reasonable basis for our opinion.
In our opinion, the financial statements and supplementary data referred to above present fairly, in all material respects, the financial position of Tax-Managed Small-Cap Value Portfolio as of October 31, 2005, the results of its operations for the year then ended, the changes in its net assets for each of the two years in the period then ended, and the supplementary data for each of the three years in the period then ended and for the period from the start of business, March 1, 2002 to October 31, 2002, in conformity with accounting principles generally accepted in the United States of America.
DELOITTE & TOUCHE LLP
Boston, Massachusetts
December 19, 2005
24
Eaton Vance Tax-Managed Small-Cap Value Fund
BOARD OF TRUSTEES' ANNUAL APPROVAL OF THE INVESTMENT ADVISORY AND SUB-ADVISORY AGREEMENTS
The investment advisory agreement between Tax-Managed Small-Cap Value Portfolio (the "Portfolio") and the investment adviser, Boston Management and Research, and the investment sub-advisory agreement between the investment adviser and the sub-adviser, Fox Asset Management LLC ("Fox"), each provide that the agreement will continue in effect from year to year so long as its continuance is approved at least annually (i) by a vote of a majority of the noninterested Trustees of the Portfolio cast in person at a meeting called for the purpose of voting on such approval and (ii) by the Trustees of the Portfolio or by vote of a majority of the outstanding interests of the Portfolio.
In considering the annual approval of the investment advisory and sub-advisory agreements, the Special Committee of the Board of Trustees considered information that had been provided throughout the year at regular Board meetings, as well as information furnished for a series of meetings held in February and March in preparation for a Board meeting held on March 21, 2005 to specifically consider the renewal of the investment advisory and sub-advisory agreements. Such information included, among other things, the following:
• An independent report comparing the advisory fees of the Portfolio with those of comparable funds;
• An independent report comparing the expense ratio of the Eaton Vance Tax-Managed Small-Cap Value Fund (the "Fund") to those of comparable funds;
• Information regarding Fund investment performance in comparison to relevant peer groups of funds and appropriate indices;
• The economic outlook and the general investment outlook in relevant investment markets;
• Eaton Vance Management's ("Eaton Vance") results and financial condition and the overall organization of the investment adviser;
• The procedures and processes used to determine the fair value of Fund assets and actions taken to monitor and test the effectiveness of such procedures and processes;
• The allocation of brokerage and the benefits received by the investment adviser as the result of brokerage allocation;
• Eaton Vance's management of the relationship with the custodian, subcustodians and fund accountants;
• The resources devoted to compliance efforts undertaken by Eaton Vance and Fox, where applicable, on behalf of the funds they manage and the record of compliance with the investment policies and restrictions and with policies on personal securities transactions;
• The quality, nature, cost and character of the administrative and other non-investment management services provided by Eaton Vance and its affiliates; and
• The terms of the advisory agreement and the reasonableness and appropriateness of the particular fee paid by the Portfolio for the services described therein.
The Special Committee also considered the nature, extent and quality of the management services provided by the investment adviser and the sub-adviser. In so doing, the Special Committee considered their management capabilities with respect to the types of investments held by the Portfolio, including information relating to the education, experience and number of investment professionals and other personnel who provide services under the investment advisory and sub-advisory agreements. The Special Committee specifically noted the investment adviser's in-house equity research capabilities and experience in managing funds that seek to maximize after-tax returns. The Special Committee evaluated the level of skill required to manage the Portfolio and concluded that the human resources available at the investment adviser and the sub-adviser were appropriate to fulfill effectively its duties on behalf of the Portfolio.
In its review of comparative information with respect to investment performance, the Special Committee concluded that the Fund has performed within a range that the Special Committee deemed competitive. With respect to its review of investment advisory and sub-advisory fees, the Special Committee concluded that the fees paid by the Portfolio are within the range of those paid by comparable funds within the mutual fund industry. In reviewing the information regarding the expense ratio of the Fund, the Special Committee concluded that, in light of the asset size of the Fund, the Fund's expense ratio is reasonable.
In addition to the factors mentioned above, the Special Committee reviewed the level of profits of the investment adviser and the sub-adviser in providing investment management services for the Portfolio and for all Eaton Vance funds as a group. The Special Committee also reviewed the implementation of a soft dollar reimbursement program pursuant to which the Portfolio
25
Eaton Vance Tax-Managed Small-Cap Value Fund
BOARD OF TRUSTEES' ANNUAL APPROVAL OF THE INVESTMENT ADVISORY AND SUB-ADVISORY AGREEMENTS CONT'D
may receive reimbursement payments in respect of third party research services obtained by the investment adviser or sub-adviser as a result of soft dollar credits generated through trading on behalf of the Portfolio. The Special Committee also reviewed the benefits to Eaton Vance and its affiliates in providing administration services for the Fund and for all Eaton Vance funds as a group. In addition, the Special Committee considered the fiduciary duty assumed by the investment adviser and sub-adviser in connection with the services rendered to the Portfolio and the business reputation of the investment adviser and its financial resources. The Trustees concluded that in light of the services rendered, the profits realized by the investment adviser and Fox, an affiliated sub-adviser, are not unreasonable. The Special Committee also considered the extent to which the investment adviser and sub-adviser appear to be realizing benef its from economies of scale in managing the Portfolio, and concluded that the fee breakpoints which are in place will allow for an equitable sharing of such benefits, when realized, with the Portfolio and the shareholders of the Fund.
The Special Committee did not consider any single factor as controlling in determining whether or not to renew the investment advisory and sub-advisory agreements. Nor are the items described herein all the matters considered by the Special Committee. In assessing the information provided by Eaton Vance and its affiliates, the Special Committee also took into consideration the benefits to shareholders of investing in a fund that is a part of a large family of funds which provides a large variety of shareholder services.
Based on its consideration of the foregoing factors and conclusions, and such other factors and conclusions as it deemed relevant, and assisted by independent counsel, the Special Committee concluded that the renewal of the investment advisory and sub-advisory agreements, including the fee structures, is in the interests of shareholders.
26
Eaton Vance Tax-Managed Small-Cap Value Fund
MANAGEMENT AND ORGANIZATION
Fund Management. The Trustees of Eaton Vance Mutual Funds Trust (the Trust) and Tax-Managed Small-Cap Value Portfolio (the Portfolio) are responsible for the overall management and supervision of the Trust's and Portfolio's affairs. The Trustees and officers of the Trust and the Portfolio are listed below. Except as indicated, each individual has held the office shown or other offices in the same company for the last five years. Trustees and officers of the Trust and the Portfolio hold indefinite terms of office. The "noninterested Trustees" consist of those Trustees who are not "interested persons" of the Trust and the Portfolio, as that term is defined under the 1940 Act. The business address of each Trustee and officer is The Eaton Vance Building, 255 State Street, Boston, Massachusetts 02109. As used below, "EVC" refers to Eaton Vance Corp., "EV" refers to Eaton Vance, Inc., "EVM" refers to Eaton Vance Management, "BMR" refers to Boston Management and Research, "EVD" refers to Eaton Vance Distributors, Inc. and "Fox" refers to Fox Asset Management LLC. EVC and EV are the corporate parent and trustee, respectively, of EVM and BMR. EVD is the Fund's principal underwriter, the Portfolio's placement agent and a wholly-owned subsidiary of EVM. Each officer affiliated with Eaton Vance may hold a position with other Eaton Vance affiliates that is comparable to its position with EVM listed below.
Name and
Date of Birth | | Position(s)
with the
Trust and
the Portfolio | | Term of
Office and
Length of
Service | | Principal Occupation(s)
During Past Five Years | | Number of Portfolios
in Fund Complex
Overseen By
Trustee(1) | | Other Directorships Held | |
| Interested Trustee | |
|
| James B. Hawkes 11/9/41 | | Trustee of the Trust; President and Trustee of the Portfolio | | Trustee of the Trust since 1991; President and Trustee of the Portfolio since 2001 | | Chairman, President and Chief Executive Officer of BMR, EVC, EVM and EV; Director of EV; Vice President and Director of EVD. Trustee and/or officer of 161 registered investment companies in the Eaton Vance Fund Complex. Mr. Hawkes is an interested person because of his positions with BMR, EVM, EVC and EV, which are affiliates of the Trust and the Portfolio. | | | 161 | | | Director of EVC | |
|
| Noninterested Trustee(s) | |
|
Benjamin C. Esty
1/2/63 | | Trustee | | Since 2005 | | Professor, Harvard University Graduate School of Business Administration (since 2003). Formerly, Associate Professor, Harvard University Graduate School of Business Administaration (2000-2003). | | | 152 | | | None | |
|
Samuel L. Hayes, III
2/23/35 | | Trustee | | Trustee of the Trust since 1986; of the Portfolio since 2001 and Chairman of the Board since 2005 | | Jacob H. Schiff Professor of Investment Banking Emeritus, Harvard University Graduate School of Business Administration. | | | 161 | | | Director of Tiffany & Co. (specialty retailer) and Telect, Inc. (telecommunication services company) | |
|
William H. Park
9/19/47 | | Trustee | | Since 2003 | | President and Chief Executive Officer, Prizm Capital Management, LLC (investment management firm) (since 2002). Executive Vice President and Chief Financial Officer, United Asset Management Corporation (a holding company owning institutional investment management firms) (1982-2001). | | | 161 | | | None | |
|
| Ronald A. Pearlman 7/10/40 | | Trustee | | Since 2003 | | Professor of Law, Georgetown University Law Center (since 1999). Tax Partner, Covington & Burling, Washington, DC (1991-2000). | | | 161 | | | None | |
|
| Norton H. Reamer 9/21/35 | | Trustee | | Trustee of the Trust since 1986; of the Portfolio since 2001 | | President, Chief Executive Officer and a Director of Asset Management Finance Corp. (a specialty finance company serving the investment management industry) (since October 2003). President, Unicorn Corporation (an investment and financial advisory services company) (since September 2000). Formerly, Chairman, Hellman, Jordan Management Co., Inc. (an investment management company) (2000-2003). Formerly, Advisory Director of Berkshire Capital Corporation (investment banking firm) (2002-2003). Formerly Chairman of the Board, United Asset Management Corporation (a holding company owning institutional investment management firms) and Chairman, President and Director, UAM Funds (mutual funds) (1980-2000). | | | 161 | | | None | |
|
27
Eaton Vance Tax-Managed Small-Cap Value Fund
MANAGEMENT AND ORGANIZATION CONT'D
Name and
Date of Birth | | Position(s)
with the
Trust and
the Portfolio | | Term of
Office and
Length of
Service | | Principal Occupation(s)
During Past Five Years | | Number of Portfolios
in Fund Complex
Overseen By
Trustee(1) | | Other Directorships Held | |
| Noninterested Trustee(s) (continued) | |
|
| Lynn A. Stout 9/14/57 | | Trustee | | Trustee of the Trust since 1998; of the Portfolio since 2001 | | Professor of Law, University of California at Los Angeles School of Law (since July 2001). Formerly, Professor of Law, Georgetown University Law Center. | | | 161 | | | None | |
|
| Ralph F. Verni 1/26/43 | | Trustee | | Since 2005 | | Consultant and private investor (since 2000). Formerly, President and Chief Executive Officer, Redwood Investment Systems, Inc. (software developer) (2000). Formerly, President and Chief Executive Officer, State Street Research & Management (investment advisor), SSRM Holdings, (parent of State Street Research & Management), and SSR Realty (institutional realty manager) (1992-2000). | | | 152 | | | Director of W.P. Carey & Company LLC (manager of real estate investment trusts) | |
|
| Principal Officers who are not Trustees | |
|
Name and
Date of Birth | | Position(s)
with the
Trust and
the Portfolios | | Term of
Office and
Length of
Service | | Principal Occupation(s)
During Past Five Years | |
| Thomas E. Faust Jr. 5/31/58 | | President of the Trust; Vice President of the Portfolio | | President of the Trust since 2002; Vice President of the Portfolio since 2001 | | Executive Vice President of EVM, BMR, EVC and EV; Chief Investment Officer of EVM and BMR and Director of EVC. Chief Executive Officer of Belair Capital Fund LLC, Belcrest Capital Fund LLC, Belmar Capital Fund LLC, Belport Capital Fund LLC and Belrose Capital Fund LLC (private investment companies sponsored by EVM). Officer of 65 registered investment companies managed by EVM or BMR. | |
|
| William H. Ahern, Jr. 7/28/59 | | Vice President of the Trust | | Since 1995 | | Vice President of EVM and BMR. Officer of 70 registered investment companies managed by EVM or BMR. | |
|
| Cynthia J. Clemson 3/2/63 | | Vice President of the Trust | | Since 2005 | | Vice President of EVM and BMR. Officer of 85 registered investment companies managed by EVM or BMR. | |
|
| Kevin S. Dyer 2/21/75 | | Vice President of the Trust | | Since 2005 | | Assistant Vice President of EVM and BMR. Officer of 24 registered investment companies managed by EVM or BMR | |
|
| Aamer Khan 6/7/60 | | Vice President of the Trust | | Since 2005 | | Vice President of EVM and BMR. Officer of 27 registered investment companies managed by EVM or BMR. | |
|
| Michael R. Mach 7/15/47 | | Vice President of the Trust | | Since 1999 | | Vice President of EVM and BMR. Officer of 32 registered investment companies managed by EVM or BMR | |
|
| Robert B. MacIntosh 1/22/57 | | Vice President of the Trust | | Since 1998 | | Vice President of EVM and BMR. Officer of 85 registered investment companies managed by EVM or BMR. | |
|
| George C. Pierides 12/16/57 | | Vice President of the Portfolio | | Since 2001 | | Senior Managing Director of Fox. Officer of 12 registered investment companies managed by EVM or BMR. | |
|
| Duncan W. Richardson 10/26/57 | | Vice President of the Trust | | Since 2001 | | Senior Vice President and Chief Equity Investment Officer of EVM and BMR. Officer of 51 registered investment companies managed by EVM or BMR. | |
|
| Walter A. Row, III 7/20/57 | | Vice President of the Trust | | Since 2001 | | Director of Equity Research and a Vice President of EVM and BMR. Officer of 31 registered investment companies managed by EVM or BMR. | |
|
| Judith A. Saryan 8/21/54 | | Vice President of the Trust | | Since 2003 | | Vice President of EVM and BMR. Officer of 33 registered investment companies managed by EVM or BMR. | |
|
28
Eaton Vance Tax-Managed Small-Cap Value Fund
MANAGEMENT AND ORGANIZATION CONT'D
| Principal Officers who are not Trustees (continued) | |
|
Name and
Date of Birth | | Position(s)
with the
Trust and
the Portfolios | | Term of
Office and
Length of
Service | | Principal Occupation(s)
During Past Five Years | |
| Susan Schiff 3/13/61 | | Vice President of the Trust | | Since 2002 | | Vice President Of EVM and BMR. Officer of 29 registered investment companies managed by EVM or BMR. | |
|
| Barbara E. Campbell 6/19/57 | | Treasurer of the trust | | Since 2005* | | Vice President of EVM and BMR. Officer of 161 registered investment companies managed by EVM or BMR. | |
|
| Alan R. Dynner 10/10/40 | | Secretary | | Secretary of the Trust since 1997; of the Portfolio since 2001 | | Vice President, Secretary and Chief Legal Officer of BMR, EVM, EVD, EV and EVC. Officer of 161 registered investment companies managed by EVM or BMR. | |
|
| Michelle A. Green 8/25/69 | | Treasurer of the Portfolio | | Since 2002* | | Vice President of EVM and BMR. Chief Financial Officer of Belair Capital Fund LLC, Belcrest Capital Fund LLC, Belmar Capital Fund LLC, Belport Capital Fund LLC and Belrose Capital Fund LLC (private investment companies sponsored by EVM). Officer of 67 registered investment companies managed by EVM or BMR. | |
|
| Paul M. O'Neil 7/11/53 | | Chief Compliance Officer | | Since 2004 | | Vice President of EVM and BMR. Officer of 161 registered investment companies managed by EVM or BMR. | |
|
(1) Includes both master and feeder funds in a master-feeder structure.
* Prior to 2005, Ms. Campbell served as Assistant Treasurer of the Trust since 1995 and Ms. Green served as Assistant Treasurer of the Portfolio since 2001.
The SAI for the Fund includes additional information about the Trustees and officers of the Fund and the Portfolio and can be obtained without charge by calling 1-800-225-6265.
29
Investment Adviser of Tax-Managed Small-Cap Value Portfolio
Boston Management and Research
The Eaton Vance Building
255 State Street
Boston, MA 02109
Sub-Adviser of Tax-Managed Small-Cap Value Portfolio
Fox Asset Management LLC
331 Newman Springs Road, Suite 122
Red Bank, NJ 07701
Administrator of Eaton Vance Tax-Managed Small-Cap Value Fund
Eaton Vance Management
The Eaton Vance Building
255 State Street
Boston, MA 02109
Principal Underwriter
Eaton Vance Distributors, Inc.
The Eaton Vance Building
255 State Street
Boston, MA 02109
(617) 482-8260
Custodian
Investors Bank & Trust Company
200 Clarendon Street
Boston, MA 02116
Transfer Agent
PFPC Inc.
Attn: Eaton Vance Funds
P.O. Box 9653
Providence, RI 02940-9653
(800) 262-1122
Independent Registered Public Accounting Firm
Deloitte & Touche LLP
200 Berkeley Street
Boston, MA 02116-5022
Eaton Vance Tax-Managed Small-Cap Value Fund
The Eaton Vance Building
255 State Street
Boston, MA 02109
This report must be preceded or accompanied by a current prospectus. Before investing, investors should consider carefully the Fund's investment objective(s), risks, and charges and expenses. The Fund's current prospectus contains this and other information about the Fund and is available through your financial advisor. Please read the prospectus carefully before you invest or send money. For further information please call 1-800-225-6265.
1300-12/05 TMSCVSRC

Annual Report October 31, 2005


EATON VANCE
TAX-MANAGED
VALUE
FUND
IMPORTANT NOTICES REGARDING PRIVACY,
DELIVERY OF SHAREHOLDER DOCUMENTS,
PORTFOLIO HOLDINGS AND PROXY VOTING
Privacy. The Eaton Vance organization is committed to ensuring your financial privacy. Each of the financial institutions identified below has in effect the following policy ("Privacy Policy") with respect to nonpublic personal information about its customers:
• Only such information received from you, through application forms or otherwise, and information about your Eaton Vance fund transactions will be collected. This may include information such as name, address, social security number, tax status, account balances and transactions.
• None of such information about you (or former customers) will be disclosed to anyone, except as permitted by law (which includes disclosure to employees necessary to service your account). In the normal course of servicing a customer's account, Eaton Vance may share information with unaffiliated third parties that perform various required services such as transfer agents, custodians and broker/dealers.
• Policies and procedures (including physical, electronic and procedural safeguards) are in place that are designed to protect the confidentiality of such information.
• We reserve the right to change our Privacy Policy at any time upon proper notification to you. Customers may want to review our Policy periodically for changes by accessing the link on our homepage: www.eatonvance.com.
Our pledge of privacy applies to the following entities within the Eaton Vance organization: the Eaton Vance Family of Funds, Eaton Vance Management, Eaton Vance Investment Counsel, Boston Management and Research, and Eaton Vance Distributors, Inc.
In addition, our Privacy Policy only applies to those Eaton Vance customers who are individuals and who have a direct relationship with us. If a customer's account (i.e. fund shares) is held in the name of a third-party financial adviser/broker-dealer, it is likely that only such adviser's privacy policies apply to the customer. This notice supersedes all previously issued privacy disclosures.
For more information about Eaton Vance's Privacy Policy, please call 1-800-262-1122.
Delivery of Shareholder Documents. The Securities and Exchange Commission (the "SEC") permits funds to deliver only one copy of shareholder documents, including prospectuses, proxy statements and shareholder reports, to fund investors with multiple accounts at the same residential or post office box address. This practice is often called "householding" and it helps eliminate duplicate mailings to shareholders.
Eaton Vance, or your financial adviser, may household the mailing of your documents indefinitely unless you instruct Eaton Vance, or your financial adviser, otherwise.
If you would prefer that your Eaton Vance documents not be householded, please contact Eaton Vance at 1-800-262-1122, or contact your financial adviser.
Your instructions that householding not apply to delivery of your Eaton Vance documents will be effective within 30 days of receipt by Eaton Vance or your financial adviser.
Portfolio Holdings. Each Eaton Vance Fund and its underlying Portfolio (if applicable) will file a schedule of its portfolio holdings on Form N-Q with the SEC for the first and third quarters of each fiscal year. The Form N-Q will be available on the Eaton Vance website www.eatonvance.com, by calling Eaton Vance at 1-800-262-1122 or in the EDGAR database on the SEC's website at www.sec.gov. Form N-Q may also be reviewed and copied at the SEC's public reference room in Washington, D.C. (call 1-800-732-0330 for information on the operation of the public reference room).
Proxy Voting. From time to time, funds are required to vote proxies related to the securities held by the funds. The Eaton Vance Funds or their underlying Portfolios (if applicable) vote proxies according to a set of policies and procedures approved by the Funds' and Portfolios' Boards. You may obtain a description of these policies and procedures and information on how the Funds or Portfolios voted proxies relating to Portfolio securities during the most recent 12 month period ended June 30, without charge, upon request, by calling 1-800-262-1122. This description is also available on the SEC's website at www.sec.gov.
Eaton Vance Tax-Managed Value Fund as of October 31, 2005
MANAGEMENT’S DISCUSSION OF FUND PERFORMANCE

Michael R. Mach, CFA
Portfolio Manager
The Fund
Performance for the Past Year
• For the year ended October 31, 2005, the Fund’s Class A shares had a total return of 15.17%. This return was the result of an increase in net asset value (NAV) per share to $15.92 on October 31, 2005, $13.95 on October 31, 2004, and the reinvestment of $0.136 per share in dividend income.(1)
• The Fund’s Class B shares had a total return of 14.34% for the same period, the result of an increase in NAV per share to $14.97 from $13.13, and the reinvestment of $0.040 per share in dividend income.(1)
• The Fund’s Class C shares had a total return of 14.37% for the same period, the result of an increase in NAV per share to $15.37 from $13.47, and the reinvestment of $0.033 per share in dividend income.(1)
• For comparison, the Fund’s benchmark, the Russell 1000 Value Index – a broad-based, unmanaged index of stocks commonly used as a measure of value stock performance – had a total return of 11.86% during the period.(2)
See pages 3 - - 5 for more performance information, including after-tax returns.
Management Discussion
• During the 12 months ended October 31, 2005, U.S. equity markets continued their rise, as the economy showed resiliency in an environment of rising interest rates and elevated energy prices.
• Over the last 12 months, growing worldwide demand allowed oil and gas prices to move higher. This helped push the earnings and stock prices of many energy companies to record levels. Information technology stocks reversed their downward trend from the first half of the period, as more prudent capital management and continued end-market demand proved to be attractive to investors seeking stocks with solid capital appreciation potential during the later half of the period. Over the last 12 months, the Portfolio’s holdings in the energy and information technology sectors made significant contributions to the Fund’s overall performance.
• Health care and telecommunications stocks struggled over the period; the Portfolio owned a number of stocks in these sectors that also declined in value. In some cases, we responded to stock price declines by selling shares purchased at higher levels in order to realize capital losses. Realizing losses when they are available allows us to build a cushion of capital losses with which we can offset capital gains, should we want to realize them at some later date. Harvesting available capital losses in a consistent and disciplined manner is an important component of the Portfolio’s tax-managed strategy. Since its inception in December of 1999, the Fund has never made any taxable capital gains distributions to its shareholders.
• The Fund seeks to invest in value stocks that, in the opinion of the investment adviser, are inexpensive or undervalued relative to the overall stock market. As always, we thank you, our fellow shareholders for your continued participation and confidence in the Fund.
The views expressed throughout this report are those of the portfolio manager and are current only through the end of the period of the report as stated on the cover. These views are subject to change at any time based upon market or other conditions, and the investment adviser disclaims any responsibility to update such views. These views may not be relied on as investment advice and, because investment decisions for a fund are based on many factors, may not be relied on as an indication of trading intent on behalf of any Eaton Vance fund.
Past performance is no guarantee of future results. Returns are historical and are calculated by determining the percentage change in net asset value or offering price (as applicable) with all distributions reinvested. Investment return and principal value will fluctuate so that shares, when redeemed, may be worth more or less than their original cost. Performance is for stated time period only; due to market volatility, the Fund’s current performance may be lower or higher than the quoted return. For performance as of the most recent month end, please refer to www.eatonvance. com.
(1) These returns do not include the 5.75% maximum sales charge for Class A shares or the applicable contingent deferred sales charge (CDSC) for Class B and Class C shares. If sales charges were deducted, returns would be lower.
(2) It is not possible to invest directly in an Index. The Index’s total return does not reflect commissions or expenses that would have been incurred if an investor individually purchased or sold the securities represented in the Index.
Fund shares are not insured by the FDIC and are not deposits or other obligations of, or guaranteed by, any depository institution. Shares are subject to investment risks, including possible loss of principal invested.
2
Eaton Vance Tax-Managed Value Fund as of October 31, 2005
FUND PERFORMANCE
The line graph and table set forth below provide information about the Fund’s performance. The line graph compares the performance of Class A of the Fund with that of the Russell 1000 Index, a broad-based, unmanaged index of value stocks, and the S&P 500 Index, a broad-based unmanaged market index of common stocks. The lines on the graph represent the total returns of a hypothetical investment of $10,000 in each of Class A, the Russell 1000 Index, and the S&P 500 Index. Class A total returns are presented at net asset value and maximum public offering price. The table includes the total returns of each Class of the Fund at net asset value and public offering price. The performance presented below does not reflect the deduction of taxes, if any, that a shareholder would pay on distributions or redemptions of Fund shares.
Performance* | | Class A | | Class B | | Class C | |
| | | | | | | |
Average Annual Total Returns (at net asset value) | | | | | | | |
One Year | | 15.17 | % | 14.34 | % | 14.37 | % |
Five Years | | 5.94 | % | 5.14 | % | 5.14 | % |
Life of Fund† | | 8.62 | % | 7.30 | % | 7.81 | % |
| | | | | | | |
SEC Average Annual Total Returns (including sales charge or applicable CDSC) | | | | | |
One Year | | 8.56 | % | 9.34 | % | 13.37 | % |
Five Years | | 4.70 | % | 4.81 | % | 5.14 | % |
Life of Fund† | | 7.52 | % | 7.18 | % | 7.81 | % |
†Inception Dates – Class A: 12/27/99; Class B: 1/18/00; Class C: 1/24/00
* Average annual total returns do not include the 5.75% maximum sales charge for Class A shares or the applicable contingent deferred sales charge (CDSC) for Class B and Class C shares. If sales charges were deducted, returns would be lower. SEC average annual total returns for Class A reflect the maximum 5.75% sales charge. SEC returns for Class B shares reflect the applicable CDSC based on the following schedule: 5% - 1st and 2nd years; 4% - 3rd year; 3% - - 4th year; 2% - 5th year; 1% - 6th year. SEC 1-year return for Class C reflects a 1% CDSC.
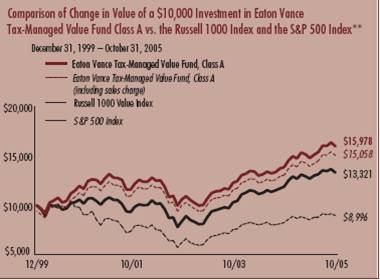
** Source: Thomson Financial. Class A of the Fund commenced investment operations on 12/27/99.
A $10,000 hypothetical investment at net asset value in Class B shares on 1/18/00 and Class C shares on 1/24/00 would have been valued at $15,048 ($14,948, after deduction of the applicable CDSC) and $15,442 respectively, on 10/31/05. It is not possible to invest directly in an Index. The Indexes’ total returns do not reflect commissions or expenses that would have been incurred if an investor individually purchased or sold the securities represented in an Index.
Past performance is no guarantee of future results. Returns are historical and are calculated by determining the percentage change in net asset value or offering price (as applicable) with all distributions reinvested. Investment return and principal value will fluctuate so that shares, when redeemed, may be worth more or less than their original cost. Performance is for stated time period only; due to market volatility, the Fund’s current performance may be lower or higher than the quoted return. For performance as of the most recent month end, please refer to www.eatonvance.com.
3
Common Stock Investments by Sector*
By net assets
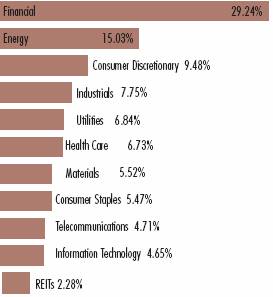
* Portfolio information may not be representative of the Portfolio’s current or future investments and may change due to active management.
Top Ten Holdings**
By net assets
Altria Group, Inc. | | 2.38 | % |
Bank of America Corp. | | 2.31 | % |
Exelon Corp. | | 2.20 | % |
Citigroup Inc. | | 2.18 | % |
Occidental Petroleum Corp. | | 2.08 | % |
Exxon Mobil Corp. | | 2.08 | % |
ConocoPhillips | | 2.07 | % |
Dominion Resources, Inc. | | 2.01 | % |
Goldman Sachs, Inc. | | 2.00 | % |
Chevron Corporation | | 1.96 | % |
** Ten Largest Holdings represented 21.27% of Portfolio net assets as of October 31, 2005. Holdings are subject to change due to active management.
4
“Return Before Taxes” does not take into consideration shareholder taxes. It is most relevant to tax-free or tax-deferred shareholder accounts. “Return After Taxes on Distributions” reflects the impact of federal income taxes due on Fund distributions of dividends and capital gains. It is most relevant to taxpaying shareholders who continue to hold their shares. “Return After Taxes on Distributions and Sale of Fund Shares” also reflects the impact of taxes on capital gain or loss realized upon a sale of shares. It is most relevant to taxpaying shareholders who sell their shares.
Average Annual Total Returns
(For the periods ended October 31, 2005)
Returns at Net Asset Value (NAV) (Class A)
| | One Year | | Five Years | | Life of Fund | |
| | | | | | | |
Return Before Taxes | | 15.17 | % | 5.94 | % | 8.62 | % |
Return After Taxes on Distributions | | 15.01 | % | 5.88 | % | 8.56 | % |
Return After Taxes on Distributions and Sale of Fund Shares | | 10.05 | % | 5.12 | % | 7.51 | % |
Returns at Public Offering Price (POP) (Class A)
| | One Year | | Five Years | | Life of Fund | |
| | | | | | | |
Return Before Taxes | | 8.56 | % | 4.70 | % | 7.52 | % |
Return After Taxes on Distributions | | 8.41 | % | 4.64 | % | 7.47 | % |
Return After Taxes on Distributions and Sale of Fund Shares | | 5.74 | % | 4.04 | % | 6.54 | % |
Average Annual Total Returns
(For the periods ended October 31, 2005)
Returns at Net Asset Value (NAV) (Class B)
| | One Year | | Five Years | | Life of Fund | |
| | | | | | | |
Return Before Taxes | | 14.34 | % | 5.14 | % | 7.30 | % |
Return After Taxes on Distributions | | 14.29 | % | 5.13 | % | 7.30 | % |
Return After Taxes on Distributions and Sale of Fund Shares | | 9.38 | % | 4.43 | % | 6.36 | % |
Returns at Public Offering Price (POP (Class B)
| | One Year | | Five Years | | Life of Fund | |
| | | | | | | |
Return Before Taxes | | 9.34 | % | 4.81 | % | 7.18 | % |
Return After Taxes on Distributions | | 9.29 | % | 4.80 | % | 7.18 | % |
Return After Taxes on Distributions and Sale of Fund Shares | | 6.13 | % | 4.15 | % | 6.25 | % |
Average Annual Total Returns
(For the periods ended October 31, 2005)
Returns at Net Asset Value (NAV) (Class C)
| | One Year | | Five Years | | Life of Fund | |
| | | | | | | |
Return Before Taxes | | 14.37 | % | 5.14 | % | 7.81 | % |
Return After Taxes on Distributions | | 14.33 | % | 5.12 | % | 7.79 | % |
Return After Taxes on Distributions and Sale of Fund Shares | | 9.39 | % | 4.43 | % | 6.80 | % |
Returns at Public Offering Price (POP) (Class C)
| | One Year | | Five Years | | Life of Fund | |
| | | | | | | |
Return Before Taxes | | 13.37 | % | 5.14 | % | 7.81 | % |
Return After Taxes on Distributions | | 13.33 | % | 5.12 | % | 7.79 | % |
Return After Taxes on Distributions and Sale of Fund Shares | | 8.74 | % | 4.43 | % | 6.80 | % |
Class A, Class B, and Class C of the Fund commenced investment operations on 12/27/99, 1/18/00, and 1/24/00, respectively. Returns at Public Offering Price (POP) reflect the deduction of the maximum initial sales charge and applicable CDSC, while Returns at Net Asset Value (NAV) do not.
After-tax returns are calculated using the highest historical individual federal income tax rate and do not reflect the impact of state and local taxes. Actual after-tax returns depend on a shareholder’s tax situation and may differ from those shown. After-tax returns are not relevant for shareholders who hold shares in tax-deferred accounts or to shares held by non-taxable entities. Return After Taxes on Distributions for a period may be the same as Return Before Taxes for that period because no distributions were paid during that period, or because the taxable portion of distributions made during the period was insignificant. Also, Return After Taxes on Distributions and Sale of Fund Shares for a period may be greater than Return After Taxes on Distributions for the same period because of realized losses on the sale of Fund shares.
Past performance is no guarantee of future results. Returns are historical and are calculated by determining the percentage change in net asset value or offering price (as applicable) with all distributions reinvested. Investment return and principal value will fluctuate so that shares, when redeemed, may be worth more or less than their original cost. Performance is for the stated time period only; due to market volatility, the Fund’s current performance may be lower or higher than the quoted return. For performance as of the most recent month-end, please refer to www.eatonvance.com.
5
Example: As a shareholder of the Fund, you incur two types of costs: (1) transaction costs, including sales charges (loads) on purchases and redemption fees (if applicable); and (2) ongoing costs, including management fees; distribution or service fees; and other Fund expenses. This Example is intended to help you understand your ongoing costs (in dollars) of investing in the Fund and to compare these costs with the ongoing costs of investing in other mutual funds. The Example is based on an investment of $1,000 invested at the beginning of the period and held for the entire period (May 1, 2005 - October 31, 2005).
Actual Expenses: The first section of the table below provides information about actual account values and actual expenses. You may use the information in this line, together with the amount you invested, to estimate the expenses that you paid over the period. Simply divide your account value by $1,000 (for example, an $8,600 account value divided by $1,000 = 8.6), then multiply the result by the number in the first line under the heading entitled “Expenses Paid During Period” to estimate the expenses you paid on your account during this period.
Hypothetical Example for Comparison Purposes: The second section of the table below provides information about hypothetical account values and hypothetical expenses based on the actual Fund expense ratio and an assumed rate of return of 5% per year (before expenses), which is not the actual return of the Fund. The hypothetical account values and expenses may not be used to estimate the actual ending account balance or expenses you paid for the period. You may use this information to compare the ongoing costs of investing in your Fund and other funds. To do so, compare this 5% hypothetical example with the 5% hypothetical examples that appear in the shareholder reports of the other funds.
Please note that the expenses shown in the table are meant to highlight your ongoing costs only and do not reflect any transactional costs, such as sales charges (loads) or redemption fees (if applicable). Therefore, the second section of the table is useful in comparing ongoing costs only, and will not help you determine the relative total costs of owning different funds. In addition, if these transactional costs were included, your costs would have been higher.
Eaton Vance Tax-Managed Value Fund
| | Beginning Account Value | | Ending Account Value | | Expenses Paid During Period* | |
| | (5/1/05) | | (10/31/05) | | (5/1/05 – 10/31/05) | |
| | | | | | | |
Actual | | | | | | | |
Class A | | $ | 1,000.00 | | $ | 1,080.06 | | $ | 6.29 | |
Class B | | $ | 1,000.00 | | $ | 1,076.20 | | $ | 10.20 | |
Class C | | $ | 1,000.00 | | $ | 1,076.33 | | $ | 10.21 | |
| | | | | | | |
Hypothetical | | | | | | | |
(5% return before expenses) | | | | | | | |
Class A | | $ | 1,000.00 | | $ | 1,019.20 | | $ | 6.11 | |
Class B | | $ | 1,000.00 | | $ | 1,015.40 | | $ | 9.91 | |
Class C | | $ | 1,000.00 | | $ | 1,015.40 | | $ | 9.91 | |
* Expenses are equal to the Fund’s annualized expense ratio of 1.20% for Class A shares, 1.95% for Class B shares, and 1.95% for Class C shares, multiplied by the average account value over the period, multiplied by 184/365 (to reflect the one-half year period). The example assumes that the $1,000 was invested at the net asset value per share determined at the close of business on April 30, 2005. The Example reflects the expenses of both the Fund and the Portfolio.
6
Eaton Vance Tax-Managed Value Fund as of October 31, 2005
FINANCIAL STATEMENTS
Statement of Assets and Liabilities
As of October 31, 2005
| Assets | |
Investment in Tax-Managed Value Portfolio, at value
(identified cost, $601,418,466) | | $ | 849,574,950 | | |
| Receivable for Fund shares sold | | | 1,722,364 | | |
| Total assets | | $ | 851,297,314 | | |
| Liabilities | |
| Payable for Fund shares redeemed | | $ | 1,000,974 | | |
| Payable to affiliate for distribution and service fees | | | 484,707 | | |
| Payable to affiliate for administration fees | | | 106,786 | | |
| Payable to affiliate for Trustees' fees | | | 311 | | |
| Accrued expenses | | | 193,406 | | |
| Total liabilities | | $ | 1,786,184 | | |
| Net Assets | | $ | 849,511,130 | | |
| Sources of Net Assets | |
| Paid-in capital | | $ | 681,159,018 | | |
Accumulated net realized loss from Portfolio (computed on the basis of
identified cost) | | | (82,070,439 | ) | |
| Undistributed net investment income | | | 2,266,067 | | |
Net unrealized appreciation from Portfolio (computed on the basis of
identified cost) | | | 248,156,484 | | |
| Total | | $ | 849,511,130 | | |
| Class A Shares | |
| Net Assets | | $ | 363,526,908 | | |
| Shares Outstanding | | | 22,830,260 | | |
Net Asset Value and Redemption Price Per Share
(net assets ÷ shares of beneficial interest outstanding) | | $ | 15.92 | | |
Maximum Offering Price Per Share
(100 ÷ 94.25 of $15.92) | | $ | 16.89 | | |
| Class B Shares | |
| Net Assets | | $ | 239,391,659 | | |
| Shares Outstanding | | | 15,991,761 | | |
Net Asset Value, Offering Price and Redemption Price Per Share
(net assets ÷ shares of beneficial interest outstanding) | | $ | 14.97 | | |
| Class C Shares | |
| Net Assets | | $ | 246,592,563 | | |
| Shares Outstanding | | | 16,043,481 | | |
Net Asset Value, Offering Price and Redemption Price Per Share
(net assets ÷ shares of beneficial interest outstanding) | | $ | 15.37 | | |
| On sales of $50,000 or more, the offering price of Class A shares is reduced. | |
Statement of Operations
For the Year Ended
October 31, 2005
| Investment Income | |
| Dividends allocated from Portfolio (net of foreign taxes, $45,560) | | $ | 16,253,602 | | |
| Interest allocated from Portfolio | | | 302,673 | | |
| Expenses allocated from Portfolio | | | (5,407,772 | ) | |
| Net investment income from Portfolio | | $ | 11,148,503 | | |
| Expenses | |
| Administration fee | | $ | 1,193,542 | | |
| Trustees' fees and expenses | | | 3,263 | | |
Distribution and service fees
Class A | | | 798,888 | | |
| Class B | | | 2,408,825 | | |
| Class C | | | 2,352,565 | | |
| Transfer and dividend disbursing agent fees | | | 751,155 | | |
| Printing and postage | | | 115,207 | | |
| Registration fees | | | 69,349 | | |
| Legal and accounting services | | | 35,482 | | |
| Custodian fee | | | 33,069 | | |
| Miscellaneous | | | 26,953 | | |
| Total expenses | | $ | 7,788,298 | | |
| Net investment income | | $ | 3,360,205 | | |
Realized and Unrealized
Gain (Loss) from Portfolio | |
Net realized gain (loss) —
Investment transactions (identified cost basis) | | $ | 22,750,423 | | |
| Foreign currency transactions | | | (4,168 | ) | |
| Net realized gain | | $ | 22,746,255 | | |
Change in unrealized appreciation (depreciation) —
Investments (identified cost basis) | | $ | 79,627,130 | | |
| Foreign currency | | | (10,807 | ) | |
| Net change in unrealized appreciation (depreciation) | | $ | 79,616,323 | | |
| Net realized and unrealized gain | | $ | 102,362,578 | | |
| Net increase in net assets from operations | | $ | 105,722,783 | | |
See notes to financial statements
7
Eaton Vance Tax-Managed Value Fund as of October 31, 2005
FINANCIAL STATEMENTS CONT'D
Statements of Changes in Net Assets
Increase (Decrease)
in Net Assets | | Year Ended
October 31, 2005 | | Year Ended
October 31, 2004 | |
From operations —
Net investment income | | $ | 3,360,205 | | | $ | 3,836,527 | | |
Net realized gain from investment
and foreign currency transactions | | | 22,746,255 | | | | 20,941,516 | | |
Net change in unrealized appreciation
(depreciation) from investments and
foreign currency | | | 79,616,323 | | | | 53,255,335 | | |
| Net increase in net assets from operations | | $ | 105,722,783 | | | $ | 78,033,378 | | |
Distributions to shareholders —
From net investment income
Class A | | $ | (2,671,322 | ) | | $ | (1,984,039 | ) | |
| Class B | | | (688,214 | ) | | | (506,249 | ) | |
| Class C | | | (526,497 | ) | | | (495,483 | ) | |
| Class D | | | — | | | | (23,797 | ) | |
| Total distributions to shareholders | | $ | (3,886,033 | ) | | $ | (3,009,568 | ) | |
Transactions in shares of beneficial interest —
Proceeds from sale of shares
Class A | | $ | 97,121,961 | | | $ | 75,408,071 | | |
| Class B | | | 17,784,025 | | | | 19,948,754 | | |
| Class C | | | 32,104,482 | | | | 31,618,250 | | |
| Class D | | | — | | | | 1,687,731 | | |
Net asset value of shares issued to
shareholders in payment of
distributions declared
Class A | | | 2,220,656 | | | | 1,630,589 | | |
| Class B | | | 515,875 | | | | 375,448 | | |
| Class C | | | 362,191 | | | | 342,453 | | |
| Class D | | | — | | | | 22,024 | | |
Cost of shares redeemed
Class A | | | (49,235,244 | ) | | | (48,203,508 | ) | |
| Class B | | | (34,766,581 | ) | | | (29,037,152 | ) | |
| Class C | | | (32,184,572 | ) | | | (36,554,297 | ) | |
| Class D | | | — | | | | (1,286,713 | ) | |
Net asset value of shares exchanged
Class A | | | 3,151,851 | | | | 2,349,078 | | |
| Class B | | | (3,151,851 | ) | | | (2,349,078 | ) | |
Net asset value of shares merged
Class B | | | — | | | | 11,191,097 | | |
| Class D | | | — | | | | (11,191,097 | ) | |
Net increase in net assets from
Fund share transactions | | $ | 33,922,793 | | | $ | 15,951,650 | | |
| Net increase in net assets | | $ | 135,759,543 | | | $ | 90,975,460 | | |
| Net Assets | | Year Ended
October 31, 2005 | | Year Ended
October 31, 2004 | |
| At beginning of year | | $ | 713,751,587 | | | $ | 622,776,127 | | |
| At end of year | | $ | 849,511,130 | | | $ | 713,751,587 | | |
Undistributed net
investment income
included in net assets | |
| At end of year | | $ | 2,266,067 | | | $ | 2,987,922 | | |
See notes to financial statements
8
Eaton Vance Tax-Managed Value Fund as of October 31, 2005
FINANCIAL STATEMENTS CONT'D
Financial Highlights
| | | Class A | |
| | | Year Ended October 31, | |
| | | 2005 | | 2004 | | 2003 | | 2002 | | 2001 | |
| Net asset value — Beginning of year | | $ | 13.950 | | | $ | 12.460 | | | $ | 10.770 | | | $ | 11.770 | | | $ | 12.150 | | |
| Income (loss) from operations | |
| Net investment income | | $ | 0.122 | | | $ | 0.135 | | | $ | 0.101 | | | $ | 0.051 | | | $ | 0.012 | | |
| Net realized and unrealized gain (loss) | | | 1.984 | | | | 1.471 | | | | 1.594 | | | | (1.051 | ) | | | (0.392 | ) | |
| Total income (loss) from operations | | $ | 2.106 | | | $ | 1.606 | | | $ | 1.695 | | | $ | (1.000 | ) | | $ | (0.380 | ) | |
| Less distributions | |
| From net investment income | | $ | (0.136 | ) | | $ | (0.116 | ) | | $ | (0.005 | ) | | $ | — | | | $ | — | | |
| Total distributions | | $ | (0.136 | ) | | $ | (0.116 | ) | | $ | (0.005 | ) | | $ | — | | | $ | — | | |
| Net asset value — End of period | | $ | 15.920 | | | $ | 13.950 | | | $ | 12.460 | | | $ | 10.770 | | | $ | 11.770 | | |
| Total Return(1) | | | 15.17 | % | | | 12.96 | % | | | 15.74 | % | | | (8.50 | )% | | | (3.13 | )% | |
| Ratios/Supplemental Data | |
| Net assets, end of year (000's omitted) | | $ | 363,527 | | | $ | 269,908 | | | $ | 211,918 | | | $ | 181,588 | | | $ | 152,849 | | |
| Ratios (As a percentage of average daily net assets): | |
| Expenses(2) | | | 1.21 | %† | | | 1.22 | % | | | 1.27 | % | | | 1.26 | % | | | 1.29 | % | |
| Expenses after custodian fee reduction(2) | | | 1.21 | %† | | | 1.22 | % | | | 1.27 | % | | | 1.26 | % | | | 1.29 | % | |
| Net investment income | | | 0.86 | %† | | | 1.03 | % | | | 0.91 | % | | | 0.44 | % | | | 0.17 | % | |
| Portfolio Turnover of the Portfolio | | | 40 | % | | | 44 | % | | | 76 | % | | | 213 | % | | | 45 | %(3) | |
| Portfolio Turnover of the Fund(4) | | | — | | | | — | | | | — | | | | — | | | | 83 | % | |
(1) Returns are historical and are calculated by determining the percentage change in net asset value with all distributions reinvested. Total return is not computed on an annualized basis.
(2) Includes the Fund's share of the Portfolio's allocated expenses.
(3) For the period from the commencement of the Portfolio's operations, July 23, 2001, to October 31, 2001.
(4) Represents the rate of portfolio activity for the period during which the fund was making investments directly in securities.
† The operating expenses of the Portfolio reflect a reduction of the investment advisor fee. Had such actions not been taken, the ratios would have changed by less than 0.005%.
See notes to financial statements
9
Eaton Vance Tax-Managed Value Fund as of October 31, 2005
FINANCIAL STATEMENTS CONT'D
Financial Highlights
| | | Class B | |
| | | Year Ended October 31, | |
| | | 2005 | | 2004 | | 2003 | | 2002 | | 2001 | |
| Net asset value — Beginning of year | | $ | 13.130 | | | $ | 11.740 | | | $ | 10.220 | | | $ | 11.250 | | | $ | 11.710 | | |
| Income (loss) from operations | |
| Net investment income (loss) | | $ | 0.018 | | | $ | 0.035 | | | $ | 0.017 | | | $ | (0.034 | ) | | $ | (0.039 | ) | |
| Net realized and unrealized gain (loss) | | | 1.862 | | | | 1.384 | | | | 1.503 | | | | (0.996 | ) | | | (0.421 | ) | |
| Total income (loss) from operations | | $ | 1.880 | | | $ | 1.419 | | | $ | 1.520 | | | $ | (1.030 | ) | | $ | (0.460 | ) | |
| Less distributions | |
| From net investment income | | $ | (0.040 | ) | | $ | (0.029 | ) | | $ | — | | | $ | — | | | $ | — | | |
| Total distributions | | $ | (0.040 | ) | | $ | (0.029 | ) | | $ | — | | | $ | — | | | $ | — | | |
| Net asset value — End of year | | $ | 14.970 | | | $ | 13.130 | | | $ | 11.740 | | | $ | 10.220 | | | $ | 11.250 | | |
| Total Return(1) | | | 14.34 | % | | | 12.10 | % | | | 14.87 | % | | | (9.16 | )% | | | (3.93 | )% | |
| Ratios/Supplemental Data | |
| Net assets, end of year (000's omitted) | | $ | 239,392 | | | $ | 227,778 | | | $ | 203,665 | | | $ | 174,951 | | | $ | 147,570 | | |
| Ratios (As a percentage of average daily net assets): | |
| Expenses(2) | | | 1.96 | %† | | | 1.97 | % | | | 2.02 | % | | | 2.01 | % | | | 2.04 | % | |
| Expenses after custodian fee reduction(2) | | | 1.96 | %† | | | 1.97 | % | | | 2.02 | % | | | 2.01 | % | | | 2.04 | % | |
| Net investment income (loss) | | | 0.13 | %† | | | 0.29 | % | | | 0.16 | % | | | (0.31 | )% | | | (0.59 | )% | |
| Portfolio Turnover of the Portfolio | | | 40 | % | | | 44 | % | | | 76 | % | | | 213 | % | | | 45 | %(3) | |
| Portfolio Turnover of the Fund(4) | | | — | | | | — | | | | — | | | | — | | | | 83 | % | |
(1) Returns are historical and are calculated by determining the percentage change in net asset value with all distributions reinvested. Total return is not computed on an annualized basis.
(2) Includes the Fund's share of the Portfolio's allocated expenses.
(3) For the period from the commencement of the Portfolio's operations, July 23, 2001, to October 31, 2001.
(4) Represents the rate of portfolio activity for the period during which the fund was making investments directly in securities.
† The operating expenses of the Portfolio reflect a reduction of the investment advisor fee. Had such actions not been taken, the ratios would have changed by less than 0.005%.
See notes to financial statements
10
Eaton Vance Tax-Managed Value Fund as of October 31, 2005
FINANCIAL STATEMENTS CONT'D
Financial Highlights
| | | Class C | |
| | | Year Ended October 31, | |
| | | 2005 | | 2004 | | 2003 | | 2002 | | 2001 | |
| Net asset value — Beginning of year | | $ | 13.470 | | | $ | 12.050 | | | $ | 10.490 | | | $ | 11.550 | | | $ | 12.020 | | |
| Income (loss) from operations | |
| Net investment income (loss) | | $ | 0.018 | | | $ | 0.038 | | | $ | 0.018 | | | $ | (0.034 | ) | | $ | (0.041 | ) | |
| Net realized and unrealized gain (loss) | | | 1.915 | | | | 1.412 | | | | 1.542 | | | | (1.026 | ) | | | (0.429 | ) | |
| Total income (loss) from operations | | $ | 1.933 | | | $ | 1.450 | | | $ | 1.560 | | | $ | (1.060 | ) | | $ | (0.470 | ) | |
| Less distributions | |
| From net investment income | | $ | (0.033 | ) | | $ | (0.030 | ) | | $ | — | | | $ | — | | | $ | — | | |
| Total distributions | | $ | (0.033 | ) | | $ | (0.030 | ) | | $ | — | | | $ | — | | | $ | — | | |
| Net asset value — End of year | | $ | 15.370 | | | $ | 13.470 | | | $ | 12.050 | | | $ | 10.490 | | | $ | 11.550 | | |
| Total Return(1) | | | 14.37 | % | | | 12.05 | % | | | 14.87 | % | | | (9.18 | )% | | | (3.91 | )% | |
| Ratios/Supplemental Data | |
| Net assets, end of year (000's omitted) | | $ | 246,593 | | | $ | 216,066 | | | $ | 197,385 | | | $ | 173,306 | | | $ | 139,653 | | |
| Ratios (As a percentage of average daily net assets): | |
| Expenses(2) | | | 1.96 | %† | | | 1.97 | % | | | 2.02 | % | | | 2.01 | % | | | 2.04 | % | |
| Expenses after custodian fee reduction(2) | | | 1.96 | %† | | | 1.97 | % | | | 2.02 | % | | | 2.01 | % | | | 2.04 | % | |
| Net investment income (loss) | | | 0.12 | %† | | | 0.29 | % | | | 0.16 | % | | | (0.31 | )% | | | (0.59 | )% | |
| Portfolio Turnover of the Portfolio | | | 40 | % | | | 44 | % | | | 76 | % | | | 213 | % | | | 45 | %(3) | |
| Portfolio Turnover of the Fund(4) | | | — | | | | — | | | | — | | | | — | | | | 83 | % | |
(1) Returns are historical and are calculated by determining the percentage change in net asset value with all distributions reinvested. Total return is not computed on an annualized basis.
(2) Includes the Fund's share of the Portfolio's allocated expenses.
(3) For the period from the commencement of the Portfolio's operations, July 23, 2001, to October 31, 2001.
(4) Represents the rate of portfolio activity for the period during which the fund was making investments directly in securities.
† The operating expenses of the Portfolio reflect a reduction of the investment advisor fee. Had such actions not been taken, the ratios would have changed by less than 0.005%.
See notes to financial statements
11
Eaton Vance Tax-Managed Value Fund as of October 31, 2005
NOTES TO FINANCIAL STATEMENTS
1 Significant Accounting Policies
Eaton Vance Tax-Managed Value Fund (the Fund) is a diversified series of Eaton Vance Mutual Funds Trust (the Trust). The Trust is an entity of the type commonly known as a Massachusetts business trust and is registered under the Investment Company Act of 1940, as amended, as an open-end management investment company. The Fund offers three classes of shares. Class A shares are generally sold subject to a sales charge imposed at time of purchase. Class B and Class C shares are sold at net asset value and are generally subject to a contingent deferred sales charge (see Note 6). Class B shares held for eight years will automatically convert to Class A shares. The Fund previously offered Class D shares. Such offering was discontinued during the year ended October 31, 2004. At the close of business on September 10, 2004, the Class D shares were merged into Class B shares. Each class represents a pro rata interest in the Fund, but vote s separately on class-specific matters and (as noted below) is subject to different expenses. Realized and unrealized gains and losses and net investment income, other than class-specific expenses, are allocated daily to each class of shares based on the relative net assets of each class to the total net assets of the Fund. Each class of shares differs in its distribution plan and certain other class-specific expenses. The Fund invests all of its investable assets in interests in the Tax-Managed Value Portfolio (the Portfolio), a New York Trust, having the same investment objective as the Fund. The value of the Fund's investment in the Portfolio reflects the Fund's proportionate interest in the net assets of the Portfolio (89.8% at October 31, 2005). The performance of the Fund is directly affected by the performance of the Portfolio. The financial statements of the Portfolio, including the Portfolio of Investments, are included elsewhere in this report and should be read in conjunction with the Fund's finan cial statements. The following is a summary of significant accounting policies consistently followed by the Fund in the preparation of its financial statements. The policies are in conformity with accounting principles generally accepted in the United States of America.
A Investment Valuation — Valuation of securities by the Portfolio is discussed in Note 1A of the Portfolio's Notes to Financial Statements which are included elsewhere in this report.
B Income — The Fund's net investment income or loss consists of the Fund's pro rata share of the net investment income of the Portfolio, less all actual and accrued expenses of the Fund, determined in accordance with accounting principles generally accepted in the United States of America.
C Federal Taxes — The Fund's policy is to comply with the provisions of the Internal Revenue Code applicable to regulated investment companies and to distribute to shareholders each year all of its taxable income, including any net realized gain on investments. Accordingly, no provision for federal income or excise tax is necessary. At October 31, 2005, the Fund, for federal income tax purposes, had a capital loss carryover of $81,033,399 which will reduce the taxable income arising from future net realized gain on investments, if any, to the extent permitted by the Internal Revenue Code and thus will reduce the amount of distributions to shareholders which would otherwise be necessary to relieve the Fund of any liability for federal income or excise tax. Such capital los s carryover will expire on October 31, 2010.
D Expenses — The majority of expenses of the Trust are directly identifiable to an individual fund. Expenses which are not readily identifiable to a specific fund are allocated taking into consideration, among other things, the nature and type of expense and the relative size of the fund.
E Other — Dividends to shareholders are recorded on the ex-dividend date.
F Use of Estimates — The preparation of the financial statements in conformity with accounting principles generally accepted in the United States of America requires management to make estimates and assumptions that affect the reported amounts of assets and liabilities at the date of the financial statements and the reported amounts of income and expense during the reporting period. Actual results could differ from those estimates.
G Indemnifications — Under the Trust's organizational documents, its officers and Trustees may be indemnified against certain liabilities and expenses arising out of the performance of their duties to the Fund, and shareholders are indemnified against personal liability for obligations of the Trust. Additionally, in the normal course of business, the Fund enters into agreements with service providers that may contain indemnification clauses. The Fund's maximum exposure under these arrangements is unknown as this would involve future claims that may be made against the Fund that have not yet occurred.
H Expense Reduction — Investors Bank & Trust Company (IBT) serves as custodian of the Fund. Pursuant to the custodian agreement, IBT receives a fee reduced by credits which are determined based on the average daily cash balance the Fund maintains with IBT. All credit balances used to reduce the Fund's custodian fees are reported as a reduction of total expenses in the Statement of Operations.
12
Eaton Vance Tax-Managed Value Fund as of October 31, 2005
NOTES TO FINANCIAL STATEMENTS CONT'D
2 Distributions to Shareholders
It is the present policy of the Fund to make at least one distribution annually (normally in December) of all or substantially all of its net investment income and at least one distribution annually of all or substantially all of its net realized capital gains (reduced by available capital loss carryforwards from prior years, if any). Distributions are declared separately for each class of shares. Shareholders may reinvest all distributions in shares of the Fund of the same class at the net asset value as of the close of business on the reinvestment date. Distributions are paid in the form of additional shares of the same class or, at the election of the shareholder, in cash. The Fund distinguishes between distributions on a tax basis and a financial reporting basis. Accounting principles generally accepted in the United States of America require that only distributions in excess of tax basis earnings and profits be reported in the financial statements as a return of capital. Permanent differences between book and tax accounting relating to distributions are reclassified to paid-in capital.
The tax character of distributions paid for the years ended October 31, 2005 and October 31, 2004 was as follows:
| | | Year Ended October 31, | |
| | | 2005 | | 2004 | |
| Distributions declared from: | |
| Ordinary income | | $ | 3,886,033 | | | $ | 3,009,568 | | |
During the year ended October 31, 2005, undistributed net investment income was decreased by $196,027, and accumulated net realized loss was decreased by $196,027 primarily due to differences between book and tax accounting relating to foreign currency. This change had no effect on the net assets or the net asset value per share.
As of October 31, 2005, the components of distributable earnings (accumulated losses) on a tax basis were as follows:
| Undistributed income | | $ | 2,227,362 | | |
| Capital loss carryforwards | | $ | (81,033,399 | ) | |
| Unrealized gain | | $ | 247,158,149 | | |
3 Shares of Beneficial Interest
The Fund's Declaration of Trust permits the Trustees to issue an unlimited number of full and fractional shares of beneficial interest (without par value). Such shares may be issued in a number of different series (such as the Fund) and classes. Transactions in Fund shares were as follows:
| | | Year Ended October 31, | |
| Class A | | 2005 | | 2004 | |
| Sales | | | 6,355,776 | | | | 5,670,757 | | |
Issued to shareholders electing to receive
payments of distributions in Fund shares | | | 150,052 | | | | 125,915 | | |
| Redemptions | | | (3,228,847 | ) | | | (3,630,559 | ) | |
| Exchange from Class B shares | | | 204,339 | | | | 176,616 | | |
| Net increase | | | 3,481,320 | | | | 2,342,729 | | |
| | | Year Ended October 31, | |
| Class B | | 2005 | | 2004 | |
| Sales | | | 1,246,568 | | | | 1,599,923 | | |
Issued to shareholders electing to receive
payments of distributions in Fund shares | | | 36,848 | | | | 30,599 | | |
| Redemptions | | | (2,423,386 | ) | | | (2,312,580 | ) | |
| Exchange to Class A shares | | | (216,665 | ) | | | (186,906 | ) | |
| Merged from Class D shares | | | — | | | | 868,200 | | |
| Net decrease | | | (1,356,635 | ) | | | (764 | ) | |
| | | Year Ended October 31, | |
| Class C | | 2005 | | 2004 | |
| Sales | | | 2,179,673 | | | | 2,471,899 | | |
Issued to shareholders electing to receive
payments of distributions in Fund shares | | | 25,205 | | | | 27,200 | | |
| Redemptions | | | (2,198,056 | ) | | | (2,847,137 | ) | |
| Net increase (decrease) | | | 6,822 | | | | (348,038 | ) | |
| | | Year Ended October 31, | |
| Class D | | 2005 | | 2004(1) | |
| Sales | | | — | | | | 160,674 | | |
Issued to shareholders electing to receive
payments of distributions in Fund shares | | | — | | | | 2,132 | | |
| Redemptions | | | — | | | | (123,936 | ) | |
| Merged to Class B shares | | | — | | | | (1,030,773 | ) | |
| Net decrease | | | — | | | | (991,903 | ) | |
(1) Offering of Class D shares was discontinued during the year ended October 31, 2004 (see Note 1)
13
Eaton Vance Tax-Managed Value Fund as of October 31, 2005
NOTES TO FINANCIAL STATEMENTS CONT'D
4 Transactions with Affiliates
The administrative fee is earned by Eaton Vance Management (EVM) as compensation for managing and administering the business affairs of the Fund. Under the administration agreement, EVM earns a fee in the amount of 0.15% per annum of the average daily net assets of the Fund. For the year ended October 31, 2005, the administration fee amounted to $1,193,542. The Portfolio has engaged Boston Management and Research (BMR), a subsidiary of EVM, to render investment advisory services. See Note 2 of the Portfolio's Notes to Financial Statements which are included elsewhere in this report.
Except for Trustees of the Fund and the Portfolio who are not members of EVM's or BMR's organization, officers and Trustees receive remuneration for their services to the Fund out of the investment adviser and administrative fees earned by EVM and BMR. The Fund was informed that Eaton Vance Distributors, Inc. (EVD), a subsidiary of EVM and the Fund's principal underwriter, received $139,496 as its portion of the sales charge on sales of Class A for the year ended October 31, 2005.
EVM serves as the sub-transfer agent of the Fund and receives an aggregate fee based upon the actual expenses incurred by EVM in the performance of those services. For the year ended October 31, 2005, EVM earned $56,787 in sub-transfer agent fees from the Fund.
Certain officers and Trustees of the Fund and of the Portfolio are officers of the above organizations.
5 Distribution and Service Plans
The Fund has in effect distribution plans for Class B shares (Class B Plan) and Class C shares (Class C Plan) pursuant to Rule 12b-1 under the Investment Company Act of 1940 and a service plan for Class A shares (Class A Plan) (collectively, the Plans). The Class B and Class C Plans require the Fund to pay EVD amounts equal to 1/365 of 0.75% of the Fund's average daily net assets attributable to Class B and Class C shares, for providing ongoing distribution services and facilities to the Fund. The Fund will automatically discontinue payments to EVD during any period in which there are no outstanding Uncovered Distribution Charges, which are equivalent to the sum of (i) 5% and 6.25% of the aggregate amount received by the Fund for the Class B and Class C shares sold, respectively, plus (ii) interest calculated by applying the rate of 1% over the prevailing prime rate to the outstanding balance of Uncovered Distribution Charges of EVD, of each respective class, reduced by the aggregate amount of contingent deferred sales charges (see Note 6) and daily amounts theretofore paid to EVD by each respective class. The Fund paid or accrued $1,806,619 and $1,764,424 for Class B and Class C, respectively, to or payable to EVD for the year ended October 31, 2005, representing 0.75% of the average daily net assets for Class B and Class C shares. At October 31, 2005, the amount of Uncovered Distribution Charges of EVD calculated under the Plans was approximately $4,493,000 and $19,411,000 for Class B and Class C shares, respectively.
The Plans authorize the Fund to make payments of service fees to EVD, investment dealers and other persons in amounts equal to 0.25% of the Fund's average daily net assets attributable to Class A, Class B and Class C shares for each fiscal year. Service fee payments are made for personal services and/or the maintenance of shareholder accounts. Service fees are separate and distinct from the sales commissions and distribution fees payable by the Fund to EVD and, as such are not subject to automatic discontinuance when there are no outstanding Uncovered Distribution Charges of EVD. Service fee payments for the year ended October 31, 2005 amounted to $798,888, $602,206 and $588,141 for Class A, Class B and Class C shares, respectively.
6 Contingent Deferred Sales Charge
A contingent deferred sales charge (CDSC) generally is imposed on redemptions of Class B shares made within six years of purchase and on redemptions of Class C shares made within one year of purchase. Generally, the CDSC is based upon the lower of the net asset value at date of redemption or date of purchase. No charge is levied on shares acquired by reinvestment of dividends or capital gain distributions. Class A shares may be subject to a 1% CDSC if redeemed within one year of purchase (depending upon the circumstances of purchase). Class B CDSC is imposed at declining rates that begin at 5% in the case of redemptions in the first and second year after purchase, declining one percentage point each subsequent year. Class C shares will be subject to a 1% CDSC if redeemed within one year of purchase.
No CDSC is levied on shares which have been sold to EVM or its affiliates or to their respective employees or clients and may be waived under certain other limited conditions. CDSC charges received on Class B and Class C redemptions are paid to EVD to reduce the amount of Uncovered Distribution Charges calculated under the Class B and Class C Plans, respectively (see Note 5). CDSC received on Class B and Class C redemptions when no Uncovered
14
Eaton Vance Tax-Managed Value Fund as of October 31, 2005
NOTES TO FINANCIAL STATEMENTS CONT'D
Distribution Charges exist for the respective classes will be credited to the Fund. EVD received approximately $481,000 and $16,000 of CDSC paid by shareholders for Class B shares and Class C shares, respectively for the year ended October 31, 2005.
7 Investment Transactions
Increases and decreases in the Fund's investment in the Portfolio aggregated $145,936,797 and $125,313,707 respectively, for the year ended October 31, 2005.
15
Eaton Vance Tax-Managed Value Fund as of October 31, 2005
REPORT OF INDEPENDENT REGISTERED PUBLIC ACCOUNTING FIRM
To the Trustees of Eaton Vance Mutual Funds Trust and Shareholders of Eaton Vance Tax-Managed Value Fund:
We have audited the accompanying statement of assets and liabilities of Eaton Vance Tax-Managed Value Fund (the Fund) (one of the series of Eaton Vance Mutual Funds Trust) as of October 31, 2005, the related statement of operations for the year then ended, the statements of changes in net assets for each of the two years in the period then ended and the financial highlights for each of the four years in the period then ended and for the period from the start of business, July 23, 2001 to October 31, 2001. These financial statements and financial highlights are the responsibility of the Fund's management. Our responsibility is to express an opinion on these financial statements and financial highlights based on our audits.
We conducted our audits in accordance with standards of the Public Company Accounting Oversight Board (United States). Those standards require that we plan and perform the audits to obtain reasonable assurance about whether the financial statements and financial highlights are free of material misstatement. The Fund is not required to have, nor were we engaged to perform, an audit of its internal control over financial reporting. An audit includes consideration of internal control over financial reporting as a basis for designing audit procedures that are appropriate in the circumstances, but not for the purpose of expressing an opinion on the effectiveness of the Fund's internal control over financial reporting. Accordingly, we express no such opinion. An audit also includes examining, on a test basis, evidence supporting the amounts and disclosures in the financial statements, assessing the accounting principles used and signi ficant estimates made by management, as well as evaluating the overall financial statement presentation. We believe that our audits provide a reasonable basis for our opinion.
In our opinion, the financial statements and financial highlights referred to above present fairly, in all material respects, the financial position of Eaton Vance Tax-Managed Value Fund as of October 31, 2005, the results of its operations for the year then ended, the changes in its net assets for each of the two years in the period then ended and its financial highlights for each of the four years in the period then ended and for the period from the start of business, July 23, 2001 to October 31, 2001, in conformity with accounting principles generally accepted in the United States of America.
DELOITTE & TOUCHE LLP
Boston, Massachusetts
December 19, 2005
16
Eaton Vance Tax-Managed Value Fund as of October 31, 2005
FEDERAL TAX INFORMATION (Unaudited)
The Form 1099-DIV you receive in January 2006 will show the tax status of all distributions paid to your account in calendar 2005. Shareholders are advised to consult their own tax adviser with respect to the tax consequences of their investment in the Fund. As required by the Internal Revenue Code regulations, shareholders must be notified within 60 days of the Fund's fiscal year end regarding the status of qualified dividend income for individuals, the dividends received deduction for corporations, and the foreign tax credit.
Qualified Dividend Income. The Fund designates approximately $15,510,000, or up to the maximum amount of such dividends allowable pursuant to the Internal Revenue Code, as qualified dividend income eligible for the reduced tax rate of 15%.
Dividends Received Deduction. Corporate shareholders are generally entitled to take the dividends received deduction on the portion of the Fund's dividend distribution that qualifies under tax law. For the Fund's fiscal 2005 ordinary income dividends, 100% qualifies for the corporate dividends received deduction.
17
Tax-Managed Value Portfolio as of October 31, 2005
PORTFOLIO OF INVESTMENTS
| Common Stocks — 97.7% | |
| Security | | Shares | | Value | |
| Aerospace and Defense — 2.4% | |
| General Dynamics Corp. | | | 100,000 | | | $ | 11,630,000 | | |
| Northrop Grumman Corp. | | | 200,000 | | | | 10,730,000 | | |
| | | $ | 22,360,000 | | |
| Auto Parts and Equipment — 1.1% | |
| BorgWarner, Inc. | | | 175,000 | | | $ | 10,148,250 | | |
| | | $ | 10,148,250 | | |
| Banks-Regional — 8.8% | |
| Bank of America Corp. | | | 500,000 | | | $ | 21,870,000 | | |
| Marshall & Ilsley Corp. | | | 125,000 | | | | 5,370,000 | | |
| SunTrust Banks, Inc. | | | 175,000 | | | | 12,684,000 | | |
| TCF Financial Corp. | | | 300,000 | | | | 8,130,000 | | |
| U.S. Bancorp | | | 200,000 | | | | 5,916,000 | | |
| Wachovia Corp. | | | 250,000 | | | | 12,630,000 | | |
| Wells Fargo & Co. | | | 275,000 | | | | 16,555,000 | | |
| | | $ | 83,155,000 | | |
| Chemicals — 1.2% | |
| Air Products and Chemicals, Inc. | | | 190,000 | | | $ | 10,875,600 | | |
| | | $ | 10,875,600 | | |
| Communications Services — 3.7% | |
| Alltel Corp. | | | 125,000 | | | $ | 7,732,500 | | |
| SBC Communications, Inc. | | | 550,000 | | | | 13,117,500 | | |
| Sprint Nextel Corp. | | | 300,000 | | | | 6,993,000 | | |
| Verizon Communications, Inc. | | | 240,000 | | | | 7,562,400 | | |
| | | $ | 35,405,400 | | |
| Computers and Business Equipment — 3.7% | |
| Hewlett-Packard Co. | | | 500,000 | | | $ | 14,020,000 | | |
| International Business Machines Corp. | | | 200,000 | | | | 16,376,000 | | |
| NCR Corp.(1) | | | 160,000 | | | | 4,835,200 | | |
| | | $ | 35,231,200 | | |
| Diversified Manufacturing — 0.6% | |
| Eaton Corp. | | | 100,000 | | | $ | 5,883,000 | | |
| | | $ | 5,883,000 | | |
| Security | | Shares | | Value | |
| Electric Utilities — 6.8% | |
| Dominion Resources, Inc. | | | 250,000 | | | $ | 19,020,000 | | |
| Entergy Corp. | | | 200,000 | | | | 14,144,000 | | |
| Exelon Corp. | | | 400,000 | | | | 20,812,000 | | |
| FPL Group, Inc. | | | 250,000 | | | | 10,765,000 | | |
| | | $ | 64,741,000 | | |
| Financial Services — 8.0% | |
| Citigroup, Inc. | | | 450,000 | | | $ | 20,601,000 | | |
| Countrywide Financial Corp. | | | 500,000 | | | | 15,885,000 | | |
| First American Corp. | | | 125,000 | | | | 5,477,500 | | |
| J.P.Morgan Chase & Co. | | | 400,000 | | | | 14,648,000 | | |
| Principal Financial Group, Inc. | | | 100,000 | | | | 4,963,000 | | |
| Washington Mutual, Inc. | | | 350,000 | | | | 13,860,000 | | |
| | | $ | 75,434,500 | | |
| Foods — 1.9% | |
| Nestle SA(2) | | | 60,000 | | | $ | 17,841,231 | | |
| | | $ | 17,841,231 | | |
| Health Care Services — 1.2% | |
| Medco Health Solutions, Inc.(1) | | | 200,000 | | | $ | 11,300,000 | | |
| | | $ | 11,300,000 | | |
| Home Builders — 0.9% | |
| Lennar Corp., Class A | | | 150,000 | | | $ | 8,337,000 | | |
| | | $ | 8,337,000 | | |
| Household Products — 1.2% | |
| Kimberly-Clark Corp. | | | 200,000 | | | $ | 11,368,000 | | |
| | | $ | 11,368,000 | | |
| Insurance — 6.4% | |
| Allstate Corp. | | | 175,000 | | | $ | 9,238,250 | | |
| American International Group, Inc. | | | 125,000 | | | | 8,100,000 | | |
| MetLife, Inc. | | | 300,000 | | | | 14,823,000 | | |
| Progressive Corp. | | | 100,000 | | | | 11,581,000 | | |
| Prudential Financial, Inc. | | | 225,000 | | | | 16,377,750 | | |
| | | $ | 60,120,000 | | |
See notes to financial statements
18
Tax-Managed Value Portfolio as of October 31, 2005
PORTFOLIO OF INVESTMENTS CONT'D
| Security | | Shares | | Value | |
| Investment Services — 6.1% | |
| Franklin Resources, Inc. | | | 75,000 | | | $ | 6,627,750 | | |
| Goldman Sachs Group, Inc. | | | 150,000 | | | | 18,955,500 | | |
| Lehman Brothers Holdings, Inc. | | | 135,000 | | | | 16,155,450 | | |
| Merrill Lynch & Co., Inc. | | | 250,000 | | | | 16,185,000 | | |
| | | $ | 57,923,700 | | |
| Machinery — 2.4% | |
| Caterpillar, Inc. | | | 200,000 | | | $ | 10,518,000 | | |
| Deere & Co. | | | 200,000 | | | | 12,136,000 | | |
| | | $ | 22,654,000 | | |
| Managed Care — 1.2% | |
| WellPoint, Inc.(1) | | | 150,000 | | | $ | 11,202,000 | | |
| | | $ | 11,202,000 | | |
| Media — 2.8% | |
| Time Warner, Inc. | | | 900,000 | | | $ | 16,047,000 | | |
| Walt Disney Co., (The) | | | 425,000 | | | | 10,355,125 | | |
| | | $ | 26,402,125 | | |
| Medical-Drugs — 3.2% | |
| Sanofi-Aventis ADR | | | 300,000 | | | $ | 12,036,000 | | |
| Wyeth | | | 400,000 | | | | 17,824,000 | | |
| | | $ | 29,860,000 | | |
| Medical-Lab Products & Services — 1.2% | |
| Fisher Scientific International, Inc.(1) | | | 200,000 | | | $ | 11,300,000 | | |
| | | $ | 11,300,000 | | |
| Metals-Industrial — 3.0% | |
| Alcoa, Inc. | | | 325,000 | | | $ | 7,894,250 | | |
| Peabody Energy Corp. | | | 150,000 | | | | 11,724,000 | | |
| Phelps Dodge Corp. | | | 75,000 | | | | 9,035,250 | | |
| | | $ | 28,653,500 | | |
| Oil and Gas-Equipment and Services — 1.6% | |
| GlobalSantaFe Corp. | | | 150,000 | | | $ | 6,682,500 | | |
| Transocean Sedco Forex, Inc.(1) | | | 150,000 | | | | 8,623,500 | | |
| | | $ | 15,306,000 | | |
| Security | | Shares | | Value | |
| Oil and Gas-Exploration and Production — 2.9% | |
| Apache Corp. | | | 200,000 | | | $ | 12,766,000 | | |
| Burlington Resources, Inc. | | | 200,000 | | | | 14,444,000 | | |
| | | $ | 27,210,000 | | |
| Oil and Gas-Integrated — 9.1% | |
| Chevron Corp. | | | 325,000 | | | $ | 18,547,750 | | |
| ConocoPhillips | | | 300,000 | | | | 19,614,000 | | |
| Exxon Mobil Corp. | | | 350,000 | | | | 19,649,000 | | |
| Marathon Oil Corp. | | | 150,000 | | | | 9,024,000 | | |
| Occidental Petroleum Corp. | | | 250,000 | | | | 19,720,000 | | |
| | | $ | 86,554,750 | | |
| Oil and Gas-Refinery — 1.4% | |
| Valero Energy Corp. | | | 125,000 | | | $ | 13,155,000 | | |
| | | $ | 13,155,000 | | |
| Paper and Forest Products — 1.3% | |
| Weyerhaeuser Co. | | | 200,000 | | | $ | 12,668,000 | | |
| | | $ | 12,668,000 | | |
| REITS — 2.3% | |
| AMB Property Corp. | | | 110,000 | | | $ | 4,859,800 | | |
| AvalonBay Communities, Inc. | | | 75,000 | | | | 6,468,750 | | |
| General Growth Properties, Inc. | | | 125,000 | | | | 5,310,000 | | |
| Public Storage, Inc. | | | 75,000 | | | | 4,965,000 | | |
| | | $ | 21,603,550 | | |
| Restaurants — 1.0% | |
| McDonald's Corp. | | | 300,000 | | | $ | 9,480,000 | | |
| | | $ | 9,480,000 | | |
| Retail-General — 1.2% | |
| J.C. Penney Company, Inc. | | | 225,000 | | | $ | 11,520,000 | | |
| | | $ | 11,520,000 | | |
| Retail-Home Improvement — 1.7% | |
| Home Depot, Inc. | | | 400,000 | | | $ | 16,416,000 | | |
| | | $ | 16,416,000 | | |
See notes to financial statements
19
Tax-Managed Value Portfolio as of October 31, 2005
PORTFOLIO OF INVESTMENTS CONT'D
| Security | | Shares | | Value | |
| Retail-Specialty and Apparel — 0.8% | |
| Target Corporation | | | 75,000 | | | $ | 4,176,750 | | |
| TJX Companies, Inc. | | | 150,000 | | | | 3,229,500 | | |
| | | $ | 7,406,250 | | |
| Semiconductors & Semiconductor Equipment — 0.9% | |
| Intel Corp. | | | 200,000 | | | $ | 4,700,000 | | |
| Taiwan Semiconductor Manufacturing Co., Ltd. ADR | | | 500,000 | | | | 4,040,000 | | |
| | | $ | 8,740,000 | | |
| Tobacco — 2.4% | |
| Altria Group, Inc. | | | 300,000 | | | $ | 22,515,000 | | |
| | | $ | 22,515,000 | | |
| Transport-Services — 0.7% | |
| FedEx Corp. | | | 75,000 | | | $ | 6,894,750 | | |
| | | $ | 6,894,750 | | |
| Transportation — 1.6% | |
| Burlington Northern Santa Fe Corp. | | | 250,000 | | | $ | 15,515,000 | | |
| | | $ | 15,515,000 | | |
| Wireless Telecommunication Services — 1.0% | |
| Vodafone Group PLC ADR | | | 350,000 | | | $ | 9,191,000 | | |
| | | $ | 9,191,000 | | |
Total Common Stocks
(identified cost $652,442,549) | | | | | | $ | 924,370,806 | | |
| Short-Term Investments — 2.2% | |
| Security | | Principal
Amount
(000's omitted) | | Value | |
General Electric Capital Corp., Commercial Paper,
4.02%, 11/1/05 | | $ | 18,857 | | | $ | 18,857,000 | | |
Investors Bank and Trust Company Time Deposit,
4.03%, 11/1/05 | | | 2,000 | | | | 2,000,000 | | |
Total Short-Term Investments
(at amortized cost, $20,857,000) | | | | $ | 20,857,000 | | |
Total Investments — 99.9%
(identified cost $673,299,549) | | | | $ | 945,227,806 | | |
| Other Assets, Less Liabilities — 0.1% | | | | $ | 846,726 | | |
| Net Assets — 100.0% | | | | $ | 946,074,532 | | |
ADR - American Depository Receipt
(1) Non-income producing security.
(2) Foreign security.
See notes to financial statements
20
Tax-Managed Value Portfolio as of October 31, 2005
FINANCIAL STATEMENTS
Statement of Assets and Liabilities
As of October 31, 2005
| Assets | |
| Investments, at value (identified cost, $673,299,549) | | $ | 945,227,806 | | |
| Receivable for investments sold | | | 17,831,967 | | |
| Interest and dividends receivable | | | 1,120,513 | | |
| Tax reclaim receivable | | | 146,292 | | |
| Total assets | | $ | 964,326,578 | | |
| Liabilities | |
| Payable for investments purchased | | $ | 17,573,612 | | |
| Payable to affiliate for investment advisory fee | | | 506,478 | | |
| Due to custodian | | | 61,607 | | |
| Payable to affiliate for Trustees' fees | | | 2,165 | | |
| Accrued expenses | | | 108,184 | | |
| Total liabilities | | $ | 18,252,046 | | |
| Net Assets applicable to investors' interest in Portfolio | | $ | 946,074,532 | | |
| Sources of Net Assets | |
| Net proceeds from capital contributions and withdrawals | | $ | 674,149,465 | | |
| Net unrealized appreciation (computed on the basis of identified cost) | | | 271,925,067 | | |
| Total | | $ | 946,074,532 | | |
Statement of Operations
For the Year Ended
October 31, 2005
| Investment Income | |
| Dividends (net of foreign taxes, $50,845) | | $ | 18,130,894 | | |
| Interest | | | 337,480 | | |
| Total investment income | | $ | 18,468,374 | | |
| Expenses | |
| Investment adviser fee | | $ | 5,674,883 | | |
| Trustees' fees and expenses | | | 23,045 | | |
| Custodian fee | | | 264,481 | | |
| Legal and accounting services | | | 68,883 | | |
| Miscellaneous | | | 13,344 | | |
| Total expenses | | $ | 6,044,636 | | |
Deduct —
Reduction of custodian fee | | $ | 7 | | |
| Reduction of investment adviser fee | | | 12,844 | | |
| Total expense reductions | | $ | 12,851 | | |
| Net expenses | | $ | 6,031,785 | | |
| Net investment income | | $ | 12,436,589 | | |
| Realized and Unrealized Gain (Loss) | |
Net realized gain (loss) —
Investment transactions (identified cost basis) | | $ | 24,472,520 | | |
| Foreign currency transactions | | | (4,650 | ) | |
| Net realized gain | | $ | 24,467,870 | | |
Change in unrealized appreciation (depreciation) —
Investments (identified cost basis) | | $ | 89,734,320 | | |
| Foreign currency | | | (12,055 | ) | |
| Net change in unrealized appreciation (depreciation) | | $ | 89,722,265 | | |
| Net realized and unrealized gain | | $ | 114,190,135 | | |
| Net increase in net assets from operations | | $ | 126,626,724 | | |
See notes to financial statements
21
Tax-Managed Value Portfolio as of October 31, 2005
FINANCIAL STATEMENTS CONT'D
Statements of Changes in Net Assets
Increase (Decrease)
in Net Assets | | Year Ended
October 31, 2005 | | Year Ended
October 31, 2004 | |
From operations —
Net investment income | | $ | 12,436,589 | | | $ | 11,882,320 | | |
Net realized gain from investment and
foreign currency transactions | | | 24,467,870 | | | | 21,705,872 | | |
Net change in unrealized
appreciation (depreciation) from
investments and foreign currency | | | 89,722,265 | | | | 59,594,458 | | |
| Net increase in net assets from operations | | $ | 126,626,724 | | | $ | 93,182,650 | | |
Capital transactions —
Contributions | | $ | 147,375,650 | | | $ | 163,659,208 | | |
| Withdrawals | | | (125,350,738 | ) | | | (132,830,780 | ) | |
Net increase in net assets from capital
transactions | | $ | 22,024,912 | | | $ | 30,828,428 | | |
| Net increase in net assets | | $ | 148,651,636 | | | $ | 124,011,078 | | |
| Net Assets | |
| At beginning of year | | $ | 797,422,896 | | | $ | 673,411,818 | | |
| At end of year | | $ | 946,074,532 | | | $ | 797,422,896 | | |
See notes to financial statements
22
Tax-Managed Value Portfolio as of October 31, 2005
FINANCIAL STATEMENTS CONT'D
Supplementary Data
| | | Year Ended October 31, | |
| | | 2005† | | 2004 | | 2003 | | 2002 | | 2001(1) | |
| Ratios/Supplemental Data | |
| Ratios (As a percentage of average daily net assets): | |
| Expenses | | | 0.68 | % | | | 0.69 | % | | | 0.70 | % | | | 0.72 | % | | | 0.70 | %(2) | |
| Expenses after custodian fee reduction | | | 0.68 | % | | | 0.69 | % | | | 0.70 | % | | | 0.72 | % | | | 0.70 | %(2) | |
| Net investment income | | | 1.40 | % | | | 1.57 | % | | | 1.47 | % | | | 0.99 | % | | | 0.69 | %(2) | |
| Portfolio Turnover | | | 40 | % | | | 44 | % | | | 76 | % | | | 213 | % | | | 45 | % | |
| Total Return(3) | | | 15.76 | % | | | 13.55 | % | | | 16.40 | % | | | (7.99 | )% | | | — | | |
| Net assets, end of year (000's omitted) | | $ | 946,075 | | | $ | 797,423 | | | $ | 673,412 | | | $ | 562,361 | | | $ | 442,447 | | |
(1) For the period from the start of business, July 23, 2001, to October 31, 2001.
(2) Annualized
(3) Total return is required to be disclosed for fiscal years beginning after December 15, 2000.
† The operating expenses of the Portfolio reflect a reduction of the investment advisor fee. Had such actions not been taken, the ratios would have changed by less than 0.005%.
See notes to financial statements
23
Tax-Managed Value Portfolio as of October 31, 2005
NOTES TO FINANCIAL STATEMENTS
1 Significant Accounting Policies
Tax-Managed Value Portfolio (the Portfolio) is registered under the Investment Company Act of 1940, as amended, as a diversified open-end management investment company. The Portfolio, which was organized as a trust under the laws of the State of New York on February 13, 2001, seeks to achieve long-term after-tax returns by investing in a diversified portfolio of value stocks. The Declaration of Trust permits the Trustees to issue interests in the Portfolio. At October 31, 2005, the Eaton Vance Tax-Managed Value Fund and Eaton Vance Tax-Managed Equity Asset Allocation Fund held approximately 89.8% and 10.2%, respectively, of the interest in the Portfolio. The following is a summary of significant accounting policies consistently followed by the Portfolio in the preparation of its financial statements. The policies are in conformity with accounting principles generally accepted in the United States of America.
A Investment Valuation — Securities listed on a U.S. securities exchange generally are valued at the last sale price on the day of valuation or, if no sales took place on such date, at the mean between the closing bid and asked prices therefore on the exchange where such securities are principally traded. Equity securities listed on the NASDAQ National Market System generally are valued at the official NASDAQ closing price. Unlisted or listed securities for which closing sales prices or closing quotations are not available are valued at the mean between the latest available bid and asked prices or, in the case of preferred equity securities that are not listed or traded in the over-the-counter market, by an independent pricing service. Exchange-traded options are valued a t the last sale price for the day of valuation as quoted on the principal exchange or board of trade on which the options are traded or, in the absence of sales on such date, at the mean between the latest bid and asked prices therefore. Futures positions on securities and currencies generally are valued at closing settlement prices. Short-term debt securities with a remaining maturity of 60 days or less are valued at amortized cost. If short-term debt securities were acquired with a remaining maturity of more than 60 days, their amortized cost value will be based on their value on the sixty-first day prior to maturity. Other fixed income and debt securities, including listed securities and securities for which price quotations are available, will normally be valued on the basis of valuations furnished by a pricing service. Foreign securities and currencies are valued in U.S. dollars, based on foreign currency exchange rate quotations supplied by an independent quotation service. The daily valuation of excha nge-traded foreign securities generally is determined as of the close of trading on the principal exchange on which such securities trade. Events occurring after the close of trading on foreign exchanges may result in adjustments to the valuation of foreign securities to more accurately reflect their fair value as of the close of regular trading on the New York Stock Exchange. When valuing foreign equity securities that meet certain criteria, the Trustees have approved the use of a fair value service that values such securities to reflect market trading that occurs after the close of the applicable foreign markets of comparable securities or other instruments that have a strong correlation to the fair-valued securities. Investments held by the Portfolio for which valuations or market quotations are unavailable are valued at fair value using methods determined in good faith by or at the direction of the Trustees of the Portfolio consideri ng relevant factors, data and information including the market value of freely tradable securities of the same class in the principal market on which such securities are normally traded.
B Income — Dividend income is recorded on the ex-dividend date for dividends received in cash and/or securities. However, if the ex-dividend date has passed, certain dividends from foreign securities are recorded as the Portfolio is informed of the ex-dividend date. Interest income is recorded on the accrual basis.
C Income Taxes — The Portfolio is treated as a partnership for federal tax purposes. No provision is made by the Portfolio for federal or state taxes on any taxable income of the Portfolio because each investor in the Portfolio is ultimately responsible for the payment of any taxes on its share of taxable income. Since the Portfolio's investors include regulated investment companies that invest all or substantially all of their assets in the Portfolio, the Portfolio normally must satisfy the applicable source of income and diversification requirements (under the Internal Revenue Code) in order for its investors to satisfy them. The Portfolio will allocate at least annually among its investors each investor's distributive share of the Portfolio's net investment income, net realized capital gains and any other items of income, gain, loss, deduction or credit.
D Financial Futures Contract — Upon entering a financial futures contract, the Portfolio is required to deposit (initial margin) either in cash or securities an amount equal to a certain percentage of the purchase price indicated in the financial futures contract. Subsequent payments are made or received by the Portfolio (margin maintenance) each day, dependent on daily fluctuations in the value of the underlying security and are recorded for book purposes as unrealized gains or losses by the Portfolio. The Portfolio's investment in financial futures contracts is designed to hedge against anticipated future changes in price of current or anticipated Portfolio positions.
24
Tax-Managed Value Portfolio as of October 31, 2005
NOTES TO FINANCIAL STATEMENTS CONT'D
Should prices move unexpectedly, the Portfolio may not achieve the anticipated benefits of the financial futures contracts and may realize a loss.
E Expense Reduction — Investors Bank & Trust Company (IBT) serves as custodian of the Portfolio. Pursuant to the custodian agreement, IBT receives a fee reduced by credits which are determined based on the average daily cash balance the Portfolio maintains with IBT. All credit balances used to reduce the Portfolio's custodian fees are reported as a reduction of expenses on the Statement of Operations.
F Use of Estimates — The preparation of the financial statements in conformity with accounting principles generally accepted in the United States of America requires management to make estimates and assumptions that affect the reported amounts of assets and liabilities at the date of the financial statements and the reported amounts of income and expense during the reporting period. Actual results could differ from those estimates.
G Indemnifications — Under the Portfolio's organizational documents, its officers and Trustees may be indemnified against certain liabilities and expenses arising out of the performance of their duties to the Portfolio. Interestholders in the Portfolio are jointly and severally liable for the liabilities and obligations of the Portfolio in the event that the Portfolio fails to satisfy such liabilities and obligations; provided, however, that, to the extent assets are available in the Portfolio, the Portfolio may, under certain circumstances, indemnify interestholders from and against any claim or liability to which such holder may become subject by reason of being or having been an interestholder in the Portfolio. Additionally, in the normal course of business, the Portfo lio enters into agreements with service providers that may contain indemnification clauses. The Portfolio's maximum exposure under these arrangements is unknown as this would involve future claims that may be made against the Portfolio that have not yet occurred.
H Other — Investment transactions are accounted for on a trade date basis. Realized gains and losses are computed based on the specific identification of the securities sold.
2 Investment Adviser Fee and Other Transactions with Affiliates
The investment adviser fee is earned by Boston Management and Research (BMR), a wholly-owned subsidiary of Eaton Vance Management (EVM), as compensation for management and investment advisory services rendered to the Portfolio. Under the advisory agreement, BMR receives a monthly advisory fee in the amount of 13/240 of 1% (equal to 0.65% annually) of average daily net assets of the Portfolio up to $500 million, 0.625% of average net assets of $500 million but less than $1 billion and 0.600% of average net assets of $1 billion and over. For the year ended October 31, 2005, the advisory fee amounted to $5,674,883. EVM has also agreed to reduce the investment adviser fee by an amount equal to that portion of commissions paid to broker dealers in execution of portfolio transactions attributed to the Portfolio that is consideration for third-party research servic es. Pursuant to this agreement, EVM waived $12,844 of its advisory fee for the year ended October 31, 2005. Except for Trustees of the Portfolio who are not members of EVM's or BMR's organization, officers and Trustees receive remuneration for their services to the Portfolio out of the investment adviser fee. Trustees of the Portfolio that are not affiliated with BMR may elect to defer receipt of all or a percentage of their annual fees in accordance with the terms of the Trustees Deferred Compensation Plan. For the year ended October 31, 2005, no significant amounts have been deferred. Certain officers and Trustees of the Portfolio are officers of the above organizations.
3 Investment Transactions
Purchases and sales of investments, other than short-term obligations, aggregated $376,708,988 and $353,561,266, respectively, for the year ended October 31, 2005.
4 Federal Income Tax Basis of Unrealized Appreciation (Depreciation)
The cost and unrealized appreciation (depreciation) in value of the investments owned at October 31, 2005, as computed on a federal income tax basis, were as follows:
| Aggregate cost | | $ | 674,676,892 | | |
| Gross unrealized appreciation | | $ | 271,928,216 | | |
| Gross unrealized depreciation | | | (1,377,302 | ) | |
| Net unrealized appreciation | | $ | 270,550,914 | | |
5 Financial Instruments
The Portfolio may trade in financial instruments with off-balance sheet risk in the normal course of its investing activities to assist in managing exposure to various market risks. These financial instruments include written options, forward foreign currency exchange contracts, and financial
25
Tax-Managed Value Portfolio as of October 31, 2005
NOTES TO FINANCIAL STATEMENTS CONT'D
futures contracts and may involve, to a varying degree, elements of risk in excess of the amounts recognized for financial statement purposes. The notional or contractual amounts of these instruments represent the investment the Portfolio has in particular classes of financial instruments and does not necessarily represent the amounts potentially subject to risk. The measurement of the risks associated with these instruments is meaningful only when all related and offsetting transactions are considered. The Portfolio did not have any open obligations under these financial instruments at October 31, 2005.
6 Line of Credit
The Portfolio participates with other portfolios and funds managed by BMR and EVM and its affiliates in a $150 million unsecured line of credit agreement with a group of banks. Borrowings will be made by the Portfolio solely to facilitate the handling of unusual and/or unanticipated short-term cash requirements. Interest is charged to each participating portfolio or fund based on its borrowings at an amount above either the Eurodollar rate or Federal Funds rate. In addition, a fee computed at an annual rate of 0.10% on the daily unused portion of the line of credit is allocated among the participating portfolios and funds at the end of each quarter. The Portfolio did not have any significant borrowings or allocated fees during the year ended October 31, 2005.
7 Overdraft Advances
Pursuant to the custodian agreement between the Portfolios and IBT, IBT may, in its discretion, advance funds to the Funds to make properly authorized payments. When such payments result in an overdraft by the Funds, the Funds are obligated to repay IBT at the current rate of interest charged by IBT for secured loans (currently, a rate above the Federal Funds rate). This obligation is payable on demand to IBT. IBT has lien on the Fund's assets to the extent of any overdraft. At October 31, 2005, the Tax Managed Value Portfolio payment due to IBT pursuant to the foregoing arrangement was $61,607.
26
Tax-Managed Value Portfolio as of October 31, 2005
REPORT OF INDEPENDENT REGISTERED PUBLIC ACCOUNTING FIRM
To the Trustees and Investors
of Tax-Managed Value Portfolio:
We have audited the accompanying statement of assets and liabilities of Tax-Managed Value Portfolio (the Portfolio), including the portfolio of investments as of October 31, 2005, the related statement of operations for the year then ended, the statements of changes in net assets for each of the two years in the period then ended and the supplementary data for each of the four years in the period then ended, and for the period from the start of business, July 23, 2001 to October 31, 2001. These financial statements and supplementary data are the responsibility of the Portfolio's management. Our responsibility is to express an opinion on these financial statements and supplementary data based on our audits.
We conducted our audits in accordance with standards of the Public Company Accounting Oversight Board (United States). Those standards require that we plan and perform the audits to obtain reasonable assurance about whether the financial statements and supplementary data are free of material misstatement. The Portfolio is not required to have, nor were we engaged to perform, an audit of its internal control over financial reporting. An audit includes consideration of internal control over financial reporting as a basis for designing audit procedures that are appropriate in the circumstances, but not for the purpose of expressing an opinion on the effectiveness of the Portfolio's internal control over financial reporting. Accordingly, we express no such opinion. An audit also includes examining, on a test basis, evidence supporting the amounts and disclosures in the financial statements, assessing the accounting principles used a nd significant estimates made by management, as well as evaluating the overall financial statement presentation. Our procedures included confirmation of securities held as of October 31, 2005 by correspondence with the custodian and brokers; where replies were not received from brokers, we performed other auditing procedures. We believe that our audits provide a reasonable basis for our opinion.
In our opinion, the financial statements and supplementary data referred to above present fairly, in all material respects, the financial position of the Tax-Managed Value Portfolio as of October 31, 2005, the results of its operations for the year then ended, the changes in its net assets for each of the two years in the period then ended, and the supplementary data for each of the four years in the period then ended and for the period from the start of business, July 23, 2001 to October 31, 2001, in conformity with accounting principles generally accepted in the United States of America.
DELOITTE & TOUCHE LLP
Boston, Massachusetts
December 19, 2005
27
Eaton Vance Tax-Managed Value Fund
BOARD OF TRUSTEES' ANNUAL APPROVAL OF THE INVESTMENT ADVISORY AGREEMENT
The investment advisory agreement between Tax-Managed Value Portfolio (the "Portfolio") and its investment adviser, Boston Management and Research, provides that the advisory agreement will continue in effect from year to year so long as its continuance is approved at least annually (i) by a vote of a majority of the noninterested Trustees of the Portfolio cast in person at a meeting called for the purpose of voting on such approval and (ii) by the Trustees of the Portfolio or by vote of a majority of the outstanding interests of the Portfolio.
In considering the annual approval of the investment advisory agreement, the Special Committee of the Board of Trustees considered information that had been provided throughout the year at regular Board meetings, as well as information furnished for a series of meetings held in February and March in preparation for a Board meeting held on March 21, 2005 to specifically consider the renewal of the investment advisory agreement. Such information included, among other things, the following:
• An independent report comparing the advisory fees of the Portfolio with those of comparable funds;
• An independent report comparing the expense ratio of the Eaton Vance Tax-Managed Value Fund (the "Fund") to those of comparable funds;
• Information regarding Fund investment performance in comparison to relevant peer groups of funds and appropriate indices;
• The economic outlook and the general investment outlook in relevant investment markets;
• Eaton Vance Management's ("Eaton Vance") results and financial condition and the overall organization of the investment adviser;
• The procedures and processes used to determine the fair value of Fund assets and actions taken to monitor and test the effectiveness of such procedures and processes;
• The allocation of brokerage and the benefits received by the investment adviser as the result of brokerage allocation;
• Eaton Vance's management of the relationship with the custodian, subcustodians and fund accountants;
• The resources devoted to compliance efforts undertaken by Eaton Vance, on behalf of the funds it manages and the record of compliance with the investment policies and restrictions and with policies on personal securities transactions;
• The quality, nature, cost and character of the administrative and other non-investment management services provided by Eaton Vance and its affiliates; and
• The terms of the advisory agreement and the reasonableness and appropriateness of the particular fee paid by the Portfolio for the services described therein.
The Special Committee also considered the nature, extent and quality of the management services provided by the investment adviser. In so doing, the Special Committee considered their management capabilities with respect to the types of investments held by the Portfolio, including information relating to the education, experience and number of investment professionals and other personnel who provide services under the investment advisory agreement. The Special Committee specifically noted the investment adviser's in-house equity research capabilities and experience in managing funds that seek to maximize after-tax returns. The Special Committee evaluated the level of skill required to manage the Portfolio and concluded that the human resources available at the investment adviser were appropriate to fulfill effectively its duties on behalf of the Portfolio.
In its review of comparative information with respect to investment performance, the Special Committee concluded that the Fund has performed within a range that the Special Committee deemed competitive. With respect to its review of investment advisory fees, the Special Committee concluded that the fees paid by the Portfolio are within the range of those paid by comparable funds within the mutual fund industry. In reviewing the information regarding the expense ratio of the Fund, the Special Committee concluded that, in light of the asset size of the Fund, the Fund's expense ratio is reasonable.
In addition to the factors mentioned above, the Special Committee reviewed the level of profits of the investment adviser in providing investment management services for the Portfolio and for all Eaton Vance funds as a group. The Special Committee also reviewed the implementation of a soft dollar reimbursement program pursuant to which the Portfolio may receive reimbursement payments in respect of third party research services obtained by the investment adviser as a result of soft dollar credits generated through trading on behalf of the Portfolio. The Special Committee also reviewed the benefits to Eaton Vance and its affiliates in providing administration services for the Fund and for all Eaton Vance funds as a group. In addition, the Special Committee considered the fiduciary duty assumed by the investment adviser in connection with the services rendered to the Portfolio and the business reputation of the investment adviser a nd its financial resources. The Trustees concluded that in light of the services rendered, the profits realized by the investment adviser are not unreasonable. The Special Committee also
28
Eaton Vance Tax-Managed Value Fund
BOARD OF TRUSTEES' ANNUAL APPROVAL OF THE INVESTMENT ADVISORY AGREEMENT CONT'D
considered the extent to which the investment adviser appears to be realizing benefits from economies of scale in managing the Portfolio, and concluded that the fee breakpoints which are in place will allow for an equitable sharing of such benefits, when realized, with the Portfolio and the shareholders of the Fund.
The Special Committee did not consider any single factor as controlling in determining whether or not to renew the investment advisory agreement. Nor are the items described herein all the matters considered by the Special Committee. In assessing the information provided by Eaton Vance and its affiliates, the Special Committee also took into consideration the benefits to shareholders of investing in a fund that is a part of a large family of funds which provides a large variety of shareholder services.
Based on its consideration of the foregoing factors and conclusions, and such other factors and conclusions as it deemed relevant, and assisted by independent counsel, the Special Committee concluded that the renewal of the investment advisory agreement, including the fee structure, is in the interests of shareholders.
29
Eaton Vance Tax-Managed Value Fund
MANAGEMENT AND ORGANIZATION
Fund Management. The Trustees of Eaton Vance Mutual Funds Trust (the Trust) and Tax-Managed Value Portfolio (the Portfolio) are responsible for the overall management and supervision of the Trust's and Portfolio's affairs. The Trustees and officers of the Trust and the Portfolio are listed below. Except as indicated, each individual has held the office shown or other offices in the same company for the last five years. Trustees and officers of the Trust and the Portfolio hold indefinite terms of office. The "noninterested Trustees" consist of those Trustees who are not "interested persons" of the Trust and the Portfolio, as that term is defined under the 1940 Act. The business address of each Trustee and officer is The Eaton Vance Building, 255 State Street, Boston, Massachusetts 02109. As used below, "EVC" refers to Eaton Vance Corp., "EV" refers to Eaton V ance, Inc., "EVM" refers to Eaton Vance Management, "BMR" refers to Boston Management and Research and "EVD" refers to Eaton Vance Distributors, Inc. EVC and EV are the corporate parent and trustee, respectively, of EVM and BMR. EVD is the Fund's principal underwriter, the Portfolio's placement agent and a wholly-owned subsidiary of EVM. Each officer affiliated with Eaton Vance may hold a position with other Eaton Vance affiliates that is comparable to its position with EVM listed below.
Name and
Date of Birth | | Position(s)
with the
Trust and
the Portfolio | | Term of
Office and
Length of
Service | | Principal Occupation(s)
During Past Five Years | | Number of Portfolios
in Fund Complex
Overseen By
Trustee(1) | | Other Directorships Held | |
| Interested Trustee | | | | | | | | | | | | | |
|
| James B. Hawkes 11/9/41 | | Trustee | | Trustee of the Trust since 1991; of the Portfolio since 2001 | | Chairman, President and Chief Executive Officer of BMR, EVC, EVM and EV; Director of EV; Vice President and Director of EVD. Trustee and/or officer of 161 registered investment companies in the Eaton Vance Fund Complex. Mr. Hawkes is an interested person because of his positions with BMR, EVM, EVC and EV, which are affiliates of the Trust and the Portfolio. | | | 161 | | | Director of EVC | |
|
| Noninterested Trustee(s) | | | | | | | | | | | | | |
|
| Benjamin C. Esty 1/2/63 | | Trustee | | Since 2005 | | Professor, Harvard University Graduate School of Business Administration (since 2003). Formerly, Associate Professor, Harvard University Graduate School of Business Administration (2000-2003). | | | 152 | | | None | |
|
| Samuel L. Hayes, III 2/23/35 | | Trustee | | Trustee of the Trust since 1986; of the Portfolio since 2001 and Chairman of the Board since 2005 | | Jacob H. Schiff Professor of Investment Banking Emeritus, Harvard University Graduate School of Business Administration. | | | 161 | | | Director of Tiffany & Co. (specialty retailer) and Telect, Inc. (telecommunication services company) | |
|
| William H. Park 9/19/47 | | Trustee | | Since 2003 | | President and Chief Executive Officer, Prizm Capital Management, LLC (investment management firm) (since 2002). Executive Vice President and Chief Financial Officer, United Asset Management Corporation (a holding company owning institutional investment management firms) (1982-2001). | | | 161 | | | None | |
|
| Ronald A. Pearlman 7/10/40 | | Trustee | | Since 2003 | | Professor of Law, Georgetown University Law Center (since 1999). Formerly, Tax Partner Covington & Burling, Washington, DC (1991-2000). | | | 161 | | | None | |
|
30
Eaton Vance Tax-Managed Value Fund
MANAGEMENT AND ORGANIZATION CONT'D
Name and
Date of Birth | | Position(s)
with the
Trust and
the Portfolio | | Term of
Office and
Length of
Service | | Principal Occupation(s)
During Past Five Years | | Number of Portfolios
in Fund Complex
Overseen By
Trustee(1) | | Other Directorships Held | |
| Noninterested Trustee(s) (continued) | | | | | | | | | | | | | |
|
| Norton H. Reamer 9/21/35 | | Trustee | | Trustee of the Trust since 1986; of the Portfolio since 2001 | | President, Chief Executive Officer and a Director of Asset Management Finance Corp. (a specialty finance company serving the investment management industry) (since October 2003). President, Unicorn Corporation (an investment and financial advisory services company) (since September 2000). Formerly, Chairman, Hellman, Jordan Management Co., Inc. (an investment management company) (2000-2003). Formerly, Advisory Director of Berkshire Capital Corporation (investment banking firm) (2002-2003). Formerly Chairman of the Board, United Asset Management Corporation (a holding company owning institutional investment management firms) and Chairman, President and Director, UAM Funds (mutual funds) (1980-2000). | | | 161 | | | None | |
|
| Lynn A. Stout 9/14/57 | | Trustee | | Trustee of the Trust since 1998; of the Portfolio since 2001 | | Professor of Law, University of California at Los Angeles School of Law (since July 2001). Formerly, Professor of Law, Georgetown University Law Center. | | | 161 | | | None | |
|
| Ralph F. Verni 1/26/43 | | Trustee | | Since 2005 | | Consultant and private investor (since 2000). Formerly, President and Chief Executive Officer, Redwood Investment Systems, Inc. (software developer) (2000). Formerly, President and Chief Executive Officer, State Street Research & Management (investment advisor), SSRM Holdings (parent of State Street Research & management), and SSR Realty (institutional realty manager) (1992-2000). | | | 152 | | | Director of W.P. Carey & Company LLC (manager of real estate investment trusts) | |
|
| Principal Officers who are not Trustees | | | | | | | |
|
Name and
Date of Birth | | Position(s)
with the
Trust and
Portfolios | | Term of
Office and
Length of
Service | | Principal Occupation(s)
During Past Five Years | |
| Thomas E. Faust Jr. 5/31/58 | | President of the Trust | | Since 2002 | | Executive Vice President of EVM, BMR, EVC and EV; Chief Investment Officer of EVM and BMR and Director of EVC. Chief Executive Officer of Belair Capital Fund LLC, Belcrest Capital Fund LLC, Belmar Capital Fund LLC, Belport Capital Fund LLC and Belrose Capital Fund LLC (private investment companies sponsored by EVM). Officer of 65 registered investment companies managed by EVM or BMR. | |
|
| William H. Ahern, Jr. 7/28/59 | | Vice President
of the Trust | | Since 1995 | | Vice President of EVM and BMR. Officer of 70 registered investment companies managed by EVM or BMR. | |
|
| Cynthia J. Clemson 3/2/63 | | Vice President
of the Trust | | Since 2005 | | Vice President of EVM and BMR. Officer of 85 registered investment companies managed by EVM or BMR. | |
|
| Kevin S. Dyer 2/21/75 | | Vice President
of the Trust | | Since 2005 | | Assistant Vice President of EVM and BMR. Officer of 24 registered investment companies managed by EVM or BMR. | |
|
| Aamer Khan 6/7/60 | | Vice President
of the Trust | | Since 2005 | | Vice President of EVM and BMR. Officer of 27 registered investment companies managed by EVM or BMR. | |
|
| Michael R. Mach 7/15/47 | | Vice President | | Vice President of the Trust since 1999; of the Portfolio since 2001 | | Vice President of EVM and BMR. Officer of 32 registered investment companies managed by EVM or BMR. | |
|
31
Eaton Vance Tax-Managed Value Fund
MANAGEMENT AND ORGANIZATION CONT'D
Name and
Date of Birth | | Position(s)
with the
Trust and
Portfolios | | Term of
Office and
Length of
Service | | Principal Occupation(s)
During Past Five Years | |
| Principal Officers who are not Trustees (continued) | | | | | | | |
|
| Robert B. MacIntosh 1/22/57 | | Vice President
of the Trust | | Since 1998 | | Vice President of EVM and BMR. Officer of 85 registered investment companies managed by EVM or BMR. | |
|
| Duncan W. Richardson 10/26/57 | | Vice President of the Trust; President of
the Portfolio | | Vice President of the Trust since 2001; President of the Portfolio since 2002 | | Senior Vice President and Chief Equity Investment Officer of EVM and BMR. Officer of 51 registered investment companies managed by EVM or BMR. | |
|
| Walter A. Row, III 7/20/57 | | Vice President
of the Trust | | Since 2001 | | Director of Equity Research and a Vice President of EVM and BMR. Officer of 31 registered investment companies managed by EVM or BMR. | |
|
| Judith A. Saryan 8/21/54 | | Vice President
of the Trust | | Since 2003 | | Vice President of EVM and BMR. Officer of 33 registered investment companies managed by EVM or BMR. | |
|
| Susan Schiff 3/13/61 | | Vice President
of the Trust | | Since 2002 | | Vice President of EVM and BMR. Officer of 29 registered investment companies managed by EVM or BMR. | |
|
| Barbara E. Campbell 6/19/57 | | Treasurer of the Trust | | Since 2005(2) | | Vice President of EVM and BMR. Officer of 161 registered investment companies managed by EVM or BMR. | |
|
| Kevin M. Connerty 4/20/64 | | Treasurer of
the Portfolio | | Since 2005 | | Vice President of EVM and BMR. Previously, Director and Vice President of PFPC Inc. (1999-2005). Officer of 88 registered investment companies managed by EVM or BMR. | |
|
| Alan R. Dynner 10/10/40 | | Secretary | | Secretary of the Trust since 1997; of the Portfolio since 2001 | | Vice President, Secretary and Chief Legal Officer of BMR, EVM, EVD, EV and EVC. Officer of 161 registered investment companies managed by EVM or BMR. | |
|
| Paul M. O'Neil 7/11/53 | | Chief Compliance Officer | | Since 2004 | | Vice President of EVM and BMR. Officer of 161 registered investment companies managed by EVM or BMR. | |
|
(1) Includes both master and feeder funds in a master-feeder structure.
(2) Prior to 2005, Ms. Campbell served as Assistant Treasurer of the Trust since 1995.
The SAI for the Fund includes additional information about the Trustees and officers of the Fund and the Portfolio and can be obtained without charge by calling 1-800-225-6265.
32
This Page Intentionally Left Blank
Investment Adviser of Tax-Managed Value Portfolio
Boston Management and Research
The Eaton Vance Building
255 State Street
Boston, MA 02109
Administrator of Eaton Vance Tax-Managed Value Fund
Eaton Vance Management
The Eaton Vance Building
255 State Street
Boston, MA 02109
Principal Underwriter
Eaton Vance Distributors, Inc.
The Eaton Vance Building
255 State Street
Boston, MA 02109
(617) 482-8260
Custodian
Investors Bank & Trust Company
200 Clarendon Street
Boston, MA 02116
Transfer Agent
PFPC Inc.
Attn: Eaton Vance Funds
P.O. Box 9653
Providence, RI 02940-9653
(800) 262-1122
Independent Registered Public Accounting Firm
Deloitte & Touche LLP
200 Berkeley Street
Boston, MA 02116-5022
Eaton Vance Tax-Managed Value Fund
The Eaton Vance Building
255 State Street
Boston, MA 02109
This report must be preceded or accompanied by a current prospectus. Before investing, investors should consider carefully the Fund's investment objective(s), risks, and charges and expenses. The Fund's current prospectus contains this and other information about the Fund and is available through your financial advisor. Please read the prospectus carefully before you invest or send money. For further information please call 1-800-225-6265.
501-12/05 TVSRC
Item 2. Code of Ethics
The registrant has adopted a code of ethics applicable to its Principal Executive Officer, Principal Financial Officer and Principal Accounting Officer. The registrant undertakes to provide a copy of such code of ethics to any person upon request, without charge, by calling 1-800-262-1122.
Item 3. Audit Committee Financial Expert
The registrant’s Board has designated William H. Park, Samuel L. Hayes, III and Norton H. Reamer, each an independent trustee, as its audit committee financial experts. Mr. Park is a certified public accountant who is the President and Chief Executive Officer of Prizm Capital Management, LLC (investment management firm). Previously, he served as Executive Vice President and Chief Financial Officer of United Asset Management Corporation (“UAM”) (a holding company owning institutional investment management firms). Mr. Hayes is the Jacob H. Schiff Professor of Investment Banking Emeritus of the Harvard University Graduate School of Business Administration. Mr. Reamer is the President, Chief Executive Officer and a Director of Asset Management Finance Corp. (a specialty finance company serving the investment management industry) and is President of Unicorn Corporation (an investment and financial advisory services company). Formerly, Mr. Reamer was Chairman of Hellman, Jordan Management Co., Inc. (an investment management company) and Advisory Director of Berkshire Capital Corporation (an investment banking firm), Chairman of the Board of UAM and Chairman, President and Director of the UAM Funds (mutual funds).
Item 4. Principal Accountant Fees and Services
(a) –(d)
Eaton Vance Tax-Managed Small Cap Value Fund, Eaton Vance Tax-Managed Mid-Cap Core Fund, Eaton Vance Multi-Cap Opportunities Fund, Eaton Vance Tax-Managed Value Fund, Eaton Vance Tax-Managed International Equity Fund, Eaton Vance Tax-Managed Small-Cap Growth Fund 1.1, Eaton Vance Tax-Managed Small-Cap Growth Fund 1.2, Eaton Vance Tax-Managed Equity Asset Allocation Fund, Eaton Vance High Income Fund, Eaton Vance Floating-Rate Fund, Eaton Vance Floating-Rate High Income Fund, Eaton Vance Strategic Income Fund, Eaton Vance Low Duration Fund, Eaton Vance Government Obligations Fund, Eaton Vance Diversified Income Fund, and Eaton Vance Equity Research Fund (the “Fund(s)”) are series of Eaton Vance Mutual Funds Trust (the “Trust”), a Massachusetts business trust, which, including the Funds, contains a total of 24 series (the “Series”). The Trust is registered under the Investment Company Act of 1940 as an open-end management investment company. This Form N-CSR relates to the Funds’ annual reports.
The following tables present the aggregate fees billed to each Fund for the Fund’s respective fiscal years ended October 31, 2004 and October 31, 2005 by the Fund’s principal accountant for professional services rendered for the audit of the Fund’s annual financial statements and fees billed for other services rendered by the principal accountant during those periods.
Eaton Vance Tax-Managed Small-Cap Value Fund
Fiscal Years Ended | | 10/31/04 | | 10/31/05 | |
| | | | | |
Audit Fees | | $ | 8,640 | | $ | 8,720 | |
| | | | | |
Audit-Related Fees(1) | | 0 | | 0 | |
| | | | | |
Tax Fees(2) | | 5,800 | | 6,090 | |
| | | | | |
All Other Fees(3) | | 0 | | 0 | |
| | | | | |
Total | | $ | 14,440 | | $ | 14,810 | |
Eaton Vance Tax-Managed Mid-Cap Core Fund
Fiscal Years Ended | | 10/31/04 | | 10/31/05 | |
| | | | | |
Audit Fees | | $ | 8,640 | | $ | 8,720 | |
| | | | | |
Audit-Related Fees(1) | | 0 | | 0 | |
| | | | | |
Tax Fees(2) | | 6,000 | | 6,300 | |
| | | | | |
All Other Fees(3) | | 0 | | 0 | |
| | | | | |
Total | | $ | 14,640 | | $ | 15,020 | |
Eaton Vance Tax-Managed Multi-Cap Opportunities Fund
Fiscal Years Ended | | 10/31/04 | | 10/31/05 | |
| | | | | |
Audit Fees | | $ | 10,740 | | $ | 10,840 | |
| | | | | |
Audit-Related Fees(1) | | 0 | | 0 | |
| | | | | |
Tax Fees(2) | | 5,800 | | 6,090 | |
| | | | | |
All Other Fees(3) | | 0 | | 0 | |
| | | | | |
Total | | $ | 16,540 | | $ | 16,930 | |
Eaton Vance Tax-Managed Value Fund
Fiscal Years Ended | | 10/31/04 | | 10/31/05 | |
| | | | | |
Audit Fees | | $ | 11,940 | | $ | 12,055 | |
| | | | | |
Audit-Related Fees(1) | | 0 | | 0 | |
| | | | | |
Tax Fees(2) | | 6,000 | | 6,300 | |
| | | | | |
All Other Fees(3) | | 0 | | 0 | |
| | | | | |
Total | | $ | 17,940 | | $ | 18,355 | |
Eaton Vance Tax-Managed International Equity Fund
Fiscal Years Ended | | 10/31/04 | | 10/31/05 | |
| | | | | |
Audit Fees | | $ | 10,740 | | $ | 10,840 | |
| | | | | |
Audit-Related Fees(1) | | 0 | | 0 | |
| | | | | |
Tax Fees(2) | | 5,900 | | 6,195 | |
| | | | | |
All Other Fees(3) | | 0 | | 0 | |
| | | | | |
Total | | $ | 16,640 | | $ | 17,035 | |
Eaton Vance Tax-Managed Small-Cap Growth Fund 1.1
Fiscal Years Ended | | 10/31/04 | | 10/31/05 | |
| | | | | |
Audit Fees | | $ | 11,940 | | $ | 12,055 | |
| | | | | |
Audit-Related Fees(1) | | 0 | | 0 | |
| | | | | |
Tax Fees(2) | | 6,000 | | 6,300 | |
| | | | | |
All Other Fees(3) | | 0 | | 0 | |
| | | | | |
Total | | $ | 17,940 | | $ | 18,355 | |
Eaton Vance Tax-Managed Small-Cap Growth Fund 1.2
Fiscal Years Ended | | 10/31/04 | | 10/31/05 | |
| | | | | |
Audit Fees | | $ | 9,740 | | $ | 9,830 | |
| | | | | |
Audit-Related Fees(1) | | 0 | | 0 | |
| | | | | |
Tax Fees(2) | | 6,000 | | 6,300 | |
| | | | | |
All Other Fees(3) | | 0 | | 0 | |
| | | | | |
Total | | $ | 15,740 | | $ | 16,130 | |
Eaton Vance Tax Managed Equity Asset Allocation Fund
Fiscal Years Ended | | 10/31/04 | | 10/31/05 | |
| | | | | |
Audit Fees | | $ | 44,880 | | $ | 46,775 | |
| | | | | |
Audit-Related Fees(1) | | 0 | | 0 | |
| | | | | |
Tax Fees(2) | | 16,000 | | 16,800 | |
| | | | | |
All Other Fees(3) | | 0 | | 0 | |
| | | | | |
Total | | $ | 60,880 | | $ | 63,575 | |
Eaton Vance High Income Fund
Fiscal Years Ended | | 10/31/04 | | 10/31/05 | |
| | | | | |
Audit Fees | | $ | 11,940 | | $ | 12,055 | |
| | | | | |
Audit-Related Fees(1) | | 0 | | 0 | |
| | | | | |
Tax Fees(2) | | 5,800 | | 6,090 | |
| | | | | |
All Other Fees(3) | | 0 | | 0 | |
| | | | | |
Total | | $ | 17,740 | | $ | 18,145 | |
Eaton Vance Floating-Rate Fund
Fiscal Years Ended | | 10/31/04 | | 10/31/05 | |
| | | | | |
Audit Fees | | $ | 11,940 | | $ | 12,055 | |
| | | | | |
Audit-Related Fees(1) | | 0 | | 0 | |
| | | | | |
Tax Fees(2) | | 6,000 | | 6,300 | |
| | | | | |
All Other Fees(3) | | 0 | | 0 | |
| | | | | |
Total | | $ | 17,940 | | $ | 18,355 | |
Eaton Vance Floating-Rate High Income Fund
Fiscal Years Ended | | 10/31/04 | | 10/31/05 | |
| | | | | |
Audit Fees | | $ | 11,940 | | $ | 12,055 | |
| | | | | |
Audit-Related Fees(1) | | 0 | | 0 | |
| | | | | |
Tax Fees(2) | | 6,000 | | 6,300 | |
| | | | | |
All Other Fees(3) | | 0 | | 0 | |
| | | | | |
Total | | $ | 17,940 | | $ | 18,355 | |
Eaton Vance Strategic Income Fund
Fiscal Years Ended | | 10/31/04 | | 10/31/05 | |
| | | | | |
Audit Fees | | $ | 29,550 | | $ | 31,300 | |
| | | | | |
Audit-Related Fees(1) | | 0 | | 0 | |
| | | | | |
Tax Fees(2) | | 18,100 | | 19,175 | |
| | | | | |
All Other Fees(3) | | 0 | | 0 | |
| | | | | |
Total | | $ | 47,650 | | $ | 50,475 | |
Eaton Vance Low Duration Fund
Fiscal Years Ended | | 10/31/04 | | 10/31/05 | |
| | | | | |
Audit Fees | | $ | 21,000 | | $ | 22,300 | |
| | | | | |
Audit-Related Fees(1) | | 0 | | 0 | |
| | | | | |
Tax Fees(2) | | 10,800 | | 11,450 | |
| | | | | |
All Other Fees(3) | | 0 | | 0 | |
| | | | | |
Total | | $ | 31,800 | | $ | 33,750 | |
Eaton Vance Government Obligations Fund
Fiscal Years Ended | | 10/31/04 | | 10/31/05 | |
| | | | | |
Audit Fees | | $ | 21,350 | | $ | 22,600 | |
| | | | | |
Audit-Related Fees(1) | | 0 | | 0 | |
| | | | | |
Tax Fees(2) | | 12,675 | | 13,450 | |
| | | | | |
All Other Fees(3) | | 0 | | 0 | |
| | | | | |
Total | | $ | 34,025 | | $ | 36,050 | |
Eaton Vance Equity Research Fund
Fiscal Years Ended | | 10/31/04 | | 10/31/05 | |
| | | | | |
Audit Fees | | $ | 21,750 | | $ | 23,100 | |
| | | | | |
Audit-Related Fees(1) | | 0 | | 0 | |
| | | | | |
Tax Fees(2) | | 8,600 | | 9,125 | |
| | | | | |
All Other Fees(3) | | 0 | | 0 | |
| | | | | |
Total | | $ | 30,350 | | $ | 32,225 | |
*Eaton Vance Diversified Income Fund
Fiscal Years Ended | | 10/31/04* | | 10/31/05 | |
| | | | | |
Audit Fees | | $ | 0 | | $ | 25,100 | |
| | | | | |
Audit-Related Fees(1) | | 0 | | 0 | |
| | | | | |
Tax Fees(2) | | 0 | | 13,050 | |
| | | | | |
All Other Fees(3) | | 0 | | 0 | |
| | | | | |
Total | | $ | 0 | | $ | 38,150 | |
* Commenced operations December 7, 2004 therefore there are no fees listed for 2004.
(1) Audit-related fees consist of the aggregate fees billed for assurance and related services that are reasonably related to the performance of the audit of financial statements and are not reported under the category of audit fees.
(2) Tax fees consist of the aggregate fees billed for professional services rendered by the principal accountant relating to tax compliance, tax advice, and tax planning and specifically include fees for tax return preparation.
(3) All other fees consist of the aggregate fees billed for products and services provided by the principal accountant other than audit, audit-related, and tax services.
The various Series comprising the Trust have differing fiscal year ends (April 30, October 31, and December 31). In addition, the Series differ as to principal accountant; i.e., certain Series have PricewaterhouseCoopers LLP (“PWC”) as a principal accountant and other Series have Deloitte & Touche LLP (“D&T”) as a principal accountant. The following table presents the aggregate audit, audit-related, tax, and other fees billed to all of the Series in the Trust by each Series’s respective principal accountant for the last two fiscal years of each Series.
Fiscal | | | | | | | | | | | | | |
Years | | 12/31/03 | | 04/30/04 | | 10/31/04 | | 12/31/04 | | 4/30/05 | | 10/31/05 | |
Ended | | PWC | | D&T | | PWC | | D&T | | PWC | | D&T | | PWC | | D&T | | PWC | | D&T | | PWC | | D&T | |
| | | | | | | | | | | | | | | | | | | | | | | | | |
Audit Fees | | $ | 43,225 | | $ | 59,456 | | $ | 0 | | $ | 15,000 | | $ | 93,650 | | $ | 153,080 | | $ | 43,400 | | $ | 40,662 | | $ | 0 | | $ | 44,880 | | $ | 124,400 | | $ | 156,000 | |
| | | | | | | | | | | | | | | | | | | | | | | | | |
Audit-Related Fees(1) | | 0 | | 0 | | 0 | | 0 | | 0 | | 0 | | 0 | | 0 | | 0 | | 0 | | 0 | | 0 | |
| | | | | | | | | | | | | | | | | | | | | | | | | |
Tax Fees(2) | | 8,925 | | 15,800 | | 0 | | 5,800 | | 50,175 | | 75,300 | | 9,150 | | 16,200 | | 0 | | 8,000 | | 66,250 | | 79,065 | |
| | | | | | | | | | | | | | | | | | | | | | | | | |
All Other Fees(3) | | 6,400 | | 0 | | 0 | | 0 | | 0 | | 0 | | 6,550 | | 0 | | 0 | | 0 | | 0 | | 0 | |
Total | | $ | 58,550 | | $ | 75,256 | | $ | 0 | | $ | 20,800 | | $ | 143,825 | | $ | 228,380 | | $ | 59,100 | | $ | 56,862 | | $ | 0 | | $ | 52,880 | | $ | 190,650 | | $ | 52,880 | |
(1) Audit-related fees consist of the aggregate fees billed for assurance and related services that are reasonably related to the performance of the audit of financial statements and are not reported under the category of audit fees.
(2) Tax fees consist of the aggregate fees billed for professional services rendered by the principal accountant relating to tax compliance, tax advice, and tax planning and specifically include fees for tax return preparation.
(3) All other fees consist of the aggregate fees billed for products and services provided by the principal accountant other than audit, audit-related, and tax services.
During each of the fiscal years ended October 31, 2004 and October 31, 2005, $35,000 was billed by D&T, the principal accountant to certain Series of the Trust for work done in connection with its Rule 17Ad-13 examination of Eaton Vance Management’s assertion that it has maintained an effective internal control structure over sub-transfer agent and registrar functions, such services being pre-approved in accordance with Rule 2-01(c)(7)(ii) of Regulation S-X.
(e)(1) The registrant’s audit committee has adopted policies and procedures relating to the pre-approval of services provided by the registrant’s principal accountant (the “Pre-Approval Policies”). The Pre-Approval Policies establish a framework intended to assist the audit committee in the proper discharge of its pre-approval responsibilities. As a general matter, the Pre-Approval Policies (i) specify certain types of audit, audit-related, tax, and other services determined to be pre-approved by the audit committee; and (ii) delineate specific procedures governing the mechanics of the pre-approval process, including the approval and monitoring of audit and non-audit service fees. Unless a service is specifically pre-approved under the Pre-Approval Policies, it must be separately pre-approved by the audit committee.
The Pre-Approval Policies and the types of audit and non-audit services pre-approved therein must be reviewed and ratified by the registrant’s audit committee at least annually. The registrant’s audit committee maintains full responsibility for the appointment, compensation, and oversight of the work of the registrant’s principal accountant.
(e)(2) No services described in paragraphs (b)-(d) above were approved by the registrant’s audit committee pursuant to the “de minimis exception” set forth in Rule 2-01(c)(7)(i)(C) of Regulation S-X.
(f) Not applicable.
(g) The following table presents (i) the aggregate non-audit fees (i.e., fees for audit-related, tax, and other services) billed for services rendered to all of the Series in the Trust by each Series’s respective principal accountant (either PWC or D&T) for the last two fiscal years of each Series; and (ii) the aggregate non-audit fees (i.e., fees for audit-related, tax, and other services) billed for services rendered to the Eaton Vance organization by PWC and D&T for the last two fiscal years of each Series.
Fiscal Years | | 12/31/03 | | 4/30/04 | | 10/31/04 | | 12/31/04 | | 04/30/05 | | 10/31/05 | |
Ended | | PWC | | D&T | | PWC | | D&T | | PWC | | D&T | | PWC | | D&T | | PWC | | D&T | | PWC | | D&T | |
| | | | | | | | | | | | | | | | | | | | | | | | | |
Registrant(1) | | $ | 15,325 | | $ | 15,800 | | $ | 0 | | $ | 5,800 | | $ | 50,175 | | $ | 75,300 | | $ | 15,700 | | $ | 16,200 | | $ | 0 | | $ | 8,000 | | $ | 66,250 | | $ | 79,065 | |
| | | | | | | | | | | | | | | | | | | | | | | | | |
Eaton
Vance(2) | | $ | 0 | | $ | 467,489 | | $ | 4,490 | | $ | 479,012 | | $ | 84,490 | | $ | 344,230 | | $ | 84,490 | | $ | 344,713 | | $ | 83,555 | | $ | 351,449 | | $ | 33,235 | | $ | 170,983 | |
(1) Includes all of the Series in the Trust.
(2) Various subsidiaries of Eaton Vance Corp. act in either an investment advisory and/or service provider capacity with respect to the Series.
(h) The registrant’s audit committee has considered whether the provision by the registrant’s principal accountants of non-audit services to the registrant’s investment adviser and any entity controlling, controlled by, or under common control with the adviser that provides ongoing services to the registrant that were not pre-approved pursuant to Rule 2-01(c)(7)(ii) of Regulation S-X is compatible with maintaining the principal accountants’ independence.
Item 5. Audit Committee of Listed registrants
Not required in this filing.
Item 6. Schedule of Investments
Please see schedule of investments contained in the Report to Stockholders included under Item 1 of this Form N-CSR.
Item 7. Disclosure of Proxy Voting Policies and Procedures for Closed-End Management Investment Companies
Not required in this filing.
Item 8. Purchases of Equity Securities by Closed-End Management Investment Company and Affiliated Purchasers.
Not required in this filing.
Item 9. Submission of Matters to a Vote of Security Holders.
Effective February 7, 2005, the Governance Committee of the Board of Trustees revised the procedures by which a Fund’s shareholders may recommend nominees to the registrant’s Board of Trustees to add the following (highlighted):
The Governance Committee shall, when identifying candidates for the position of Independent Trustee, consider any such candidate recommended by a shareholder of a Fund if such recommendation contains (i)sufficient background information concerning the candidate, including evidence the candidate is willing to serve as an Independent Trustee if selected for the position; and (ii) is received in a sufficiently timely manner (and in any event no later than the date specified for receipt of shareholder proposals in any applicable proxy statement with respect to a Fund). Shareholders shall be directed to address any such recommendations in writing to the attention of the Governance Committee, c/o the Secretary of the Fund. The Secretary shall retain copies of any shareholder recommendations which meet the foregoing requirements for a period of not more than 12 months following receipt. The Secretary shall have no obligation to acknowledge receipt of any shareholder recommendations
Item 10. Controls and Procedures
(a) It is the conclusion of the registrant’s principal executive officer and principal financial officer that the effectiveness of the registrant’s current disclosure controls and procedures (such disclosure controls and procedures having been evaluated within 90 days of the date of this filing) provide reasonable assurance that the information required to be disclosed by the registrant has been recorded, processed, summarized and reported within the time period specified in the Commission’s rules and forms and that the information required to be disclosed by the registrant has been accumulated and communicated to the registrant’s principal executive officer and principal financial officer in order to allow timely decisions regarding required disclosure.
(b) There have been no changes in the registrant’s internal controls over financial reporting during the second fiscal quarter of the period covered by this report that has materially affected, or is reasonably likely to materially affect, the registrant’s internal control over financial reporting.
Item 11. Exhibits
(a)(1) | | Registrant’s Code of Ethics – Not applicable (please see Item 2). |
(a)(2)(i) | | Treasurer’s Section 302 certification. |
(a)(2)(ii) | | President’s Section 302 certification. |
(b) | | Combined Section 906 certification. |
Signatures
Pursuant to the requirements of the Securities Exchange Act of 1934 and the Investment Company Act of 1940, the registrant has duly caused this report to be signed on its behalf by the undersigned, thereunto duly authorized.
Eaton Vance Mutual Funds Trust | |
| |
By: | /s/ Thomas E. Faust Jr. | |
| Thomas E. Faust Jr. |
| President |
| |
| |
Date: | December 16, 2005 |
| | | |
Pursuant to the requirements of the Securities Exchange Act of 1934 and the Investment Company Act of 1940, this report has been signed below by the following persons on behalf of the registrant and in the capacities and on the dates indicated.
By: | /s/ Barbara E. Campbell | |
| Barbara E. Campbell |
| Treasurer |
| |
| |
Date: | December 16, 2005 |
By: | /s/ Thomas E. Faust | |
| Thomas E. Faust Jr. |
| President |
| |
| |
Date: | December 16, 2005 |