UNITED STATES
SECURITIES AND EXCHANGE COMMISSION
Washington, D.C. 20549
Form N-CSR
CERTIFIED SHAREHOLDER REPORT OF REGISTERED
MANAGEMENT INVESTMENT COMPANIES
Investment Company Act File Number: 811-04015
Eaton Vance Mutual Funds Trust
(Exact Name of registrant as Specified in Charter)
The Eaton Vance Building, 255 State Street, Boston, Massachusetts 02109
(Address of Principal Executive Offices)
Alan R. Dynner
The Eaton Vance Building, 255 State Street, Boston, Massachusetts 02109
(Name and Address of Agent for Services)
(617) 482-8260
(registrant’s Telephone Number)
April 30
Date of Fiscal Year End
April 30, 2006
Date of Reporting Period
Item 1. Reports to Stockholders

Annual Report April 30, 2006


EATON VANCE
TAX-MANAGED
DIVIDEND
INCOME
FUND
IMPORTANT NOTICES REGARDING PRIVACY,
DELIVERY OF SHAREHOLDER DOCUMENTS,
PORTFOLIO HOLDINGS AND PROXY VOTING
Privacy. The Eaton Vance organization is committed to ensuring your financial privacy. Each of the financial institutions identified below has in effect the following policy ("Privacy Policy") with respect to nonpublic personal information about its customers:
• Only such information received from you, through application forms or otherwise, and information about your Eaton Vance fund transactions will be collected. This may include information such as name, address, social security number, tax status, account balances and transactions.
• None of such information about you (or former customers) will be disclosed to anyone, except as permitted by law (which includes disclosure to employees necessary to service your account). In the normal course of servicing a customer's account, Eaton Vance may share information with unaffiliated third parties that perform various required services such as transfer agents, custodians and broker/dealers.
• Policies and procedures (including physical, electronic and procedural safeguards) are in place that are designed to protect the confidentiality of such information.
• We reserve the right to change our Privacy Policy at any time upon proper notification to you. Customers may want to review our Policy periodically for changes by accessing the link on our homepage: www.eatonvance.com.
Our pledge of privacy applies to the following entities within the Eaton Vance organization: the Eaton Vance Family of Funds, Eaton Vance Management, Eaton Vance Investment Counsel, Boston Management and Research, and Eaton Vance Distributors, Inc.
In addition, our Privacy Policy only applies to those Eaton Vance customers who are individuals and who have a direct relationship with us. If a customer's account (i.e., fund shares) is held in the name of a third-party financial adviser/ broker-dealer, it is likely that only such adviser's privacy policies apply to the customer. This notice supersedes all previously issued privacy disclosures.
For more information about Eaton Vance's Privacy Policy, please call 1-800-262-1122.
Delivery of Shareholder Documents. The Securities and Exchange Commission (the "SEC") permits funds to deliver only one copy of shareholder documents, including prospectuses, proxy statements and shareholder reports, to fund investors with multiple accounts at the same residential or post office box address. This practice is often called "householding" and it helps eliminate duplicate mailings to shareholders.
Eaton Vance, or your financial adviser, may household the mailing of your documents indefinitely unless you instruct Eaton Vance, or your financial adviser, otherwise.
If you would prefer that your Eaton Vance documents not be householded, please contact Eaton Vance at 1-800-262-1122, or contact your financial adviser.
Your instructions that householding not apply to delivery of your Eaton Vance documents will be effective within 30 days of receipt by Eaton Vance or your financial adviser.
Portfolio Holdings. Each Eaton Vance Fund and its underlying Portfolio (if applicable) will file a schedule of its portfolio holdings on Form N-Q with the SEC for the first and third quarters of each fiscal year. The Form N-Q will be available on the Eaton Vance website www.eatonvance.com, by calling Eaton Vance at 1-800-262-1122 or in the EDGAR database on the SEC's website at www.sec.gov. Form N-Q may also be reviewed and copied at the SEC's public reference room in Washington, D.C. (call 1-800-732-0330 for information on the operation of the public reference room).
Proxy Voting. From time to time, funds are required to vote proxies related to the securities held by the funds. The Eaton Vance Funds or their underlying Portfolios (if applicable) vote proxies according to a set of policies and procedures approved by the Funds' and Portfolios' Boards. You may obtain a description of these policies and procedures and information on how the Funds or Portfolios voted proxies relating to portfolio securities during the most recent 12 month period ended June 30, without charge, upon request, by calling 1-800-262-1122. This description is also available on the SEC's website at www.sec.gov.
Eaton Vance Tax-Managed Dividend Income Fund as of April 30, 2006
MANAGEMENT‘S DISCUSSION OF FUND PERFORMANCE


The Fund
Performance for the Past Year
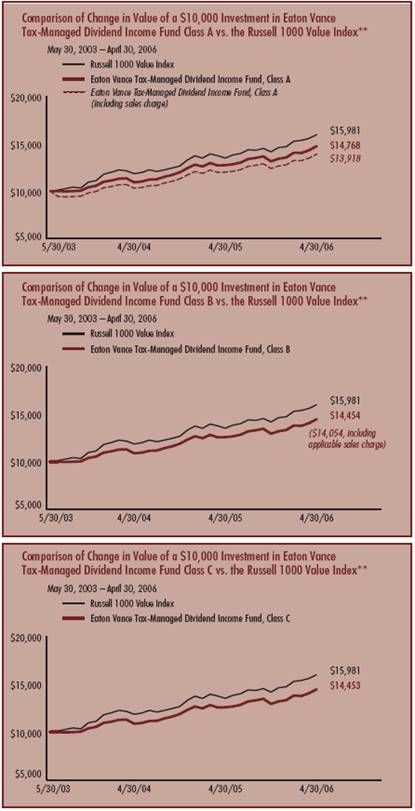
• For the year ended April 30, 2006, the Fund’s Class A shares had a total return of 15.78%. This return was the result of an increase in net asset value (NAV) per share to $12.99 on April 30, 2006, from $11.82 on April 30, 2005, and the reinvestment of $0.641 per share in dividend income.(1)
• The Fund’s Class B shares had a total return of 14.97% during the same period, the result of an increase in NAV per share to $12.96 from $11.79, and the reinvestment of $0.55 per share in dividend income.(1)
• The Fund’s Class C shares had a total return of 14.87% during the same period, the result of an increase in NAV per share to $12.96 from $11.80, and the reinvestment of $0.55 per share in dividend income.(1)
• For comparison, the Fund’s benchmark, the Russell 1000 Value Index — a broad-based, unmanaged market index of 1,000 U.S. value stocks — had a total return of 18.28% during the period.(2)
See pages 4 and 5 for more performance information, including after-tax returns.
Management Discussion
• During the past year, the Fund’s performance benefited from the ongoing global economic expansion. In recent months, investor angst over rising interest rates and record-level energy prices has been offset by resilient consumer spending and healthy growth of corporate profits. Double-digit growth in dividend payments and share buybacks, coupled with continued strength in merger and acquisition activity, provided additional support to the equity markets.
• Based on the Fund’s objective of providing after-tax total return, consisting primarily of tax-favored dividend income and capital appreciation, the Fund was primarily invested in securities that generated a relatively high level of qualified dividend income (QDI) during the year ended April 30, 2006. At the end of the period, the Fund had approximately 89% of total investments invested in common stocks, approximately 9% of total investments invested in preferred stocks and 2% of total investments in cash equivalents. Within the common stock portfolio, the Fund had a significant exposure to the higher-yielding utility, telecommunication and financial sectors. In addition, the Fund maintained a diversified common stock portfolio across the consumer, industrial, energy, health care and materials sectors.
• Over the last 12 months, stock selection was again a key driver of the Fund’s performance. Stocks making meaningful positive contributions to this year’s Fund performance included the Fund’s holdings in the materials, energy, and information technology sectors. Fund holdings in the materials and energy sectors saw their stock prices advance as demand and pricing for commodities such as coal, oil, and copper all moved higher. In the information technology sector, Fund holdings in the communications and electronic equipment industries contributed to performance as their earnings and dividend payments increased and their stock prices rebounded from relatively depressed levels. Fund holdings in each of these three sectors generated returns that were in excess of comparable sector holdings of the Russell 1000 Value Index.(2)
• Limiting the Fund’s relative performance over the past 12 months were Fund holdings in the health care and telecommunications services sectors. In each of these sectors, returns generated by the Fund’s holdings were meaningfully below those generated by comparable sector holdings in the Russell 1000 Value Index.(2)
Past performance is no guarantee of future results. Returns are historical and are calculated by determining the percentage change in net asset value or offering price (as applicable) with all distributions reinvested. Investment return and principal value will fluctuate so that shares, when redeemed, may be worth more or less than their original cost. Performance is for stated time period only; due to market volatility, the Fund’s current performance may be lower or higher than the quoted return. For performance as of the most recent month end, please refer to www.eatonvance.com.
(1) These returns do not include the 5.75% maximum sales charge for Class A shares or the applicable contingent deferred sales charge (CDSC) for Class B and Class C shares. If sales charges were deducted, returns would be lower.
(2) It is not possible to invest directly in an Index. The Index’s total return does not reflect commissions or expenses that would have been incurred if an investor individually purchased or sold the securities represented in the Index.
Fund shares are not insured by the FDIC and are not deposits or other obligations of, or guaranteed by, any depository institution. Shares are subject to investment risks, including possible loss of principal invested.
2
• During the 12 months ended April 30, 2006, the Federal Reserve Board moved to increase short-term interest rates eight times by a total of 2.0%. Rates rose across the yield curve as well. This created a challenging environment for the preferred stock portion of the Fund. Challenges posed by these rising rates were somewhat offset by improving corporate credit quality and stable yield spreads. Nonetheless, rising interest rates put downward pressure on preferred stock prices. Not surprisingly, however, over the past year the total return generated by the Fund’s preferred stock holdings, while positive, was less than the dividend income generated by the preferred stock portfolio.
• During the period, a portion of Fund assets was invested in non-U.S. common and preferred stocks. These investments provided the Fund with international diversification and dividend yields often more attractive than the yields available on stocks issued by similar domestic corporations. As of April 30, 2006, approximately 21% of the Fund’s total investments was invested in non-U.S. common stocks. In addition, approximately 4% of the Fund’s total investments was invested in “Yankee” preferreds. Yankee preferreds are preferred stocks generally issued by large, highly-rated, European financial institutions but denominated in U.S. dollars.
• We are pleased to report that since inception through April 30, 2006, the Fund has increased its monthly dividend five times for all share classes. Since its inception, all of the income generated by the Fund has come from dividends paid by the Fund’s common and preferred stock holdings. The Fund expects that all of the dividends paid by the Fund in fiscal 2006 will be qualified dividends subject to federal income tax at long-term capital gain rates (up to 15%, as long as certain holding periods and other requirements have been met by receiving Fund shareholders).
• The increases in the Fund’s monthly dividend reflected both the effective implementation of the Fund’s dividend capture strategy and the significant number of dividend increases announced by companies represented in the Fund’s common stock portfolio.
• The Fund’s dividend capture strategy is a trading strategy designed to enhance the level of qualified dividend income earned by the Fund. By implementing dividend capture trading, the Fund has been able to collect a greater number of dividend payments than it would have collected by simply adhering to a buy-and-hold strategy. (There can be no assurance that the continued use of dividend capture trading will be successful in the future.)
• The Fund continued to adhere to its strategy of owning a diversified portfolio of dividend-paying common and preferred stocks during the year ended April 30, 2006. Our strategy is to focus investments in companies characterized by strong business franchises and solid balance sheets. For common stocks, we generally focus on companies that offer the potential for growth of earnings and dividends, and for capital appreciation over time. For preferred stocks, we take into consideration the interest rate sensitivity of the investment and our interest rate expectations.
• In closing, we would like to thank the shareholders for their continued confidence and participation in the Fund.
• Effective July 1, 2006, Thomas Luster joins the portfolio management team of the Fund. Mr. Luster has been a Vice President of Eaton Vance and its subsidiary, Boston Management and Research (“BMR”) for more than five years, and he manages or co-manages other Eaton Vance portfolios.
The views expressed throughout this report are those of the portfolio managers and are current only through the end of the period of the report as stated on the cover. These views are subject to change at any time based upon market or other conditions, and the investment adviser disclaims any responsibility to update such views. These views may not be relied on as investment advice and, because investment decisions for a fund are based on many factors, may not be relied on as an indication of trading intent on behalf of any Eaton Vance fund.
Top Ten Holdings*
By net assets
Citigroup, Inc. | | 2.70 | % |
AT&T, Inc. | | 2.62 | % |
Verizon Communications, Inc. | | 2.59 | % |
Wachovia Corp. | | 2.59 | % |
Altria Group, Inc. | | 2.57 | % |
FPL Group, Inc. | | 2.57 | % |
Johnson & Johnson | | 2.54 | % |
UBS AG | | 2.53 | % |
General Electric Co. | | 2.53 | % |
JPMorgan Chase & Co. | | 2.46 | % |
* Top Ten Holdings represented 25.70% of Fund net assets as of April 30, 2006. Holdings are subject to change due to active management.
3
The line graphs and table set forth below provide information about the Fund’s performance. The line graphs compare the performance of Class A, Class B, and Class C of the Fund with that of the Russell 1000 Value Index, a broad-based, unmanaged market index of 1000 U.S. value stocks. The lines on the graph represent the total returns of a hypothetical investment of $10,000 in each of Class A, Class B, and Class C of the Fund and the Russell 1000 Value Index. Class A total returns are presented at net asset value and maximum public offering price. The table includes the total returns of each class of the Fund at net asset value and public offering price. The performance presented below does not reflect the deduction of taxes, if any, that a shareholder would pay on distributions or redemptions of Fund shares. It is not possible to invest directly in an Index. The Index’s total returns do not reflect any commissions or expenses that would have been incurred if an investor individually purchased or sold the securities represented in the Index.
Performance* | | Class A | | Class B | | Class C | |
Average Annual Total Returns (at net asset value) | | | | | | | |
One Year | | 15.78 | % | 14.97 | % | 14.87 | % |
Life of Fund† | | 14.28 | % | 13.45 | % | 13.44 | % |
| | | | | | | |
SEC Average Annual Total Returns (including sales charge or applicable CDSC) | |
One Year | | 9.13 | % | 9.97 | % | 13.87 | % |
Life of Fund† | | 11.99 | % | 12.36 | % | 13.44 | % |
† Inception Dates — Class A: 5/30/03; Class B: 5/30/03; Class C: 5/30/03
* Average Annual Total Returns do not include the 5.75% maximum sales charge for Class A shares or the applicable contingent deferred sales charge (CDSC) for Class B and Class C shares. If s ales charges were deducted, returns would be lower. SEC average annual total returns for Class A reflect the maximum 5.75% sales charge. SEC returns for Class B shares reflect the applicable CDSC based on the following schedule: 5% - 1st and 2nd years; 4% - 3rd year; 3% - 4th year; 2% - 5th year; 1% - 6th year. SEC 1-year return for Class C reflects a 1% CDSC.
Past performance is no guarantee of future results. Returns are historical and are calculated by determining the percentage change in net asset value or offering price (as applicable) with all distributions reinvested. Investment return and principal value will fluctuate so that shares, when redeemed, may be worth more or less than their original cost. Performance is for stated time period only; due to market volatility, the Fund’s current performance may be lower or higher than the quoted return. For performance as of the most recent month end, please refer to www.eatonvance.com.
Asset Allocation††
By net assets
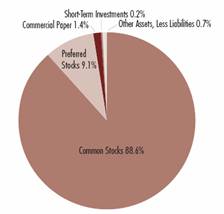
†† Fund information may not be representative of the Fund’s current or future investments and may change due to active management.
** Source: Thomson Financial. Investment operations commenced 5/30/03.
4
“Return Before Taxes” does not take into consideration shareholder taxes. It is most relevant to tax-free or tax-deferred shareholder accounts. “Return After Taxes on Distributions” reflects the impact of federal income taxes due on Fund distributions of dividends and capital gains. It is most relevant to taxpaying shareholders who continue to hold their shares. “Return After Taxes on Distributions and Sale of Fund Shares” also reflects the impact of taxes on capital gain or loss realized upon a sale of shares. It is most relevant to taxpaying shareholders who sell their shares.
Average Annual Total Returns
(For the periods ended April 30, 2006)
Returns at Net Asset Value (NAV) (Class A)
| | One Year | | Life of Fund | |
Return Before Taxes | | 15.78 | % | 14.28 | % |
Return After Taxes on Distributions | | 14.89 | % | 13.54 | % |
Return After Taxes on Distributions and Sale of Fund Shares | | 11.32 | % | 12.24 | % |
Returns at Public Offering Price (POP) (Class A)
| | One Year | | Life of Fund | |
Return Before Taxes | | 9.13 | % | 11.99 | % |
Return After Taxes on Distributions | | 8.29 | % | 11.26 | % |
Return After Taxes on Distributions and Sale of Fund Shares | | 6.94 | % | 10.23 | % |
Average Annual Total Returns
(For the periods ended April 30, 2006)
Returns at Net Asset Value (NAV) (Class C)
| | One Year | | Life of Fund | |
Return Before Taxes | | 14.87 | % | 13.44 | % |
Return After Taxes on Distributions | | 14.10 | % | 12.81 | % |
Return After Taxes on Distributions and Sale of Fund Shares | | 10.57 | % | 11.52 | % |
Returns at Public Offering Price (POP) (Class C)
| | One Year | | Life of Fund | |
Return Before Taxes | | 13.87 | % | 13.44 | % |
Return After Taxes on Distributions | | 13.10 | % | 12.81 | % |
Return After Taxes on Distributions and Sale of Fund Shares | | 9.92 | % | 11.52 | % |
Average Annual Total Returns
(For the periods ended April 30, 2006)
Returns at Net Asset Value (NAV) (Class B)
| | One Year | | Life of Fund | |
Return Before Taxes | | 14.97 | % | 13.45 | % |
Return After Taxes on Distributions | | 14.20 | % | 12.82 | % |
Return After Taxes on Distributions and Sale of Fund Shares | | 10.64 | % | 11.53 | % |
Returns at Public Offering Price (POP) (Class B)
| | One Year | | Life of Fund | |
Return Before Taxes | | 9.97 | % | 12.36 | % |
Return After Taxes on Distributions | | 9.20 | % | 11.72 | % |
Return After Taxes on Distributions and Sale of Fund Shares | | 7.39 | % | 10.57 | % |
Class A, Class B, and Class C commenced operations on 5/30/03. Returns at Public Offering Price (POP) reflect the deduction of the maximum initial sales charge and applicable CDSC, while Returns at Net Asset Value (NAV) do not.
After-tax returns are calculated using the highest historical individual federal income tax rate and do not reflect the impact of state and local taxes. Actual after-tax returns depend on a shareholder’s tax situation and may differ from those shown. After-tax returns are not relevant for shareholders who hold Fund shares in tax-deferred accounts or to shares held by non-taxable entities. Return After Taxes on Distributions for a period may be the same as Return Before Taxes for that period because no distributions were paid during that period, or because the taxable portion of distributions made during the period was insignificant. Also, Return After Taxes on Distributions and Sale of Fund Shares for a period may be greater than Return After Taxes on Distributions for the same period because of realized losses on the sale of Fund shares.
Past performance is no guarantee of future results. Returns are historical and are calculated by determining the percentage change in net asset value or offering price (as applicable) with all distributions reinvested. Investment return and principal value will fluctuate so that shares, when redeemed, may be worth more or less than their original cost. Performance is for the stated time period only; due to market volatility, the Fund’s current performance may be lower or higher than the quoted return. For performance as of the most recent month-end, please refer to www.eatonvance.com.
5
Eaton Vance Tax-Managed Dividend Income Fund as of April 30, 2006
FUND EXPENSES
Example: As a shareholder of the Fund, you incur two types of costs: (1) transaction costs, including sales charges (loads) on purchases and redemption fees (if applicable); and (2) ongoing costs, including management fees; distribution or service fees; and other Fund expenses. This Example is intended to help you understand your ongoing costs (in dollars) of investing in the Fund and to compare these costs with the ongoing costs of investing in other mutual funds. The Example is based on an investment of $1,000 invested at the beginning of the period and held for the entire period (November 1, 2005 – April 30, 2006).
Actual Expenses: The first section of the table below provides information about actual account values and actual expenses. You may use the information in this section, together with the amount you invested, to estimate the expenses that you paid over the period. Simply divide your account value by $1,000 (for example, an $8,600 account value divided by $1,000 = 8.6), then multiply the result by the number in the first section under the heading entitled "Expenses Paid During Period" to estimate the expenses you paid on your account during this period.
Hypothetical Example for Comparison Purposes: The second section of the table below provides information about hypothetical account values and hypothetical expenses based on the actual Fund expense ratio and an assumed rate of return of 5% per year (before expenses), which is not the actual return of the Fund. The hypothetical account values and expenses may not be used to estimate the actual ending account balance or expenses you paid for the period. You may use this information to compare the ongoing costs of investing in your Fund and other funds. To do so, compare this 5% hypothetical example with the 5% hypothetical examples that appear in the shareholder reports of the other funds.
Please note that the expenses shown in the table are meant to highlight your ongoing costs only and do not reflect any transactional costs, such as sales charges (loads) or redemption fees (if applicable). Therefore, the second section of the table is useful in comparing ongoing costs only, and will not help you determine the relative total costs of owning different funds. In addition, if these transactional costs were included, your costs would have been higher.
Eaton Vance Tax-Managed Dividend Income Fund
| | | Beginning Account Value
(11/1/05) | | Ending Account Value
(4/30/06) | | Expenses Paid During Period*
(11/1/05 – 4/30/06) | |
| Actual | |
| Class A | | $ | 1,000.00 | | | $ | 1,122.50 | | | $ | 6.32 | | |
| Class B | | $ | 1,000.00 | | | $ | 1,117.80 | | | $ | 10.24 | | |
| Class C | | $ | 1,000.00 | | | $ | 1,117.80 | | | $ | 10.24 | | |
| Hypothetical | |
| (5% return per year before expenses) | |
| Class A | | $ | 1,000.00 | | | $ | 1,018.80 | | | $ | 6.01 | | |
| Class B | | $ | 1,000.00 | | | $ | 1,015.10 | | | $ | 9.74 | | |
| Class C | | $ | 1,000.00 | | | $ | 1,015.10 | | | $ | 9.74 | | |
* Expenses are equal to the Fund's annualized expense ratio of 1.20% for Class A shares, 1.95% for Class B shares, and 1.95% for Class C shares, multiplied by the average account value over the period, multiplied by 181/365 (to reflect the one-half year period). The Example assumes that the $1,000 was invested at the net asset value per share determined at the close of business on October 31, 2005.
6
Eaton Vance Tax-Managed Dividend Income Fund as of April 30, 2006
PORTFOLIO OF INVESTMENTS
| Common Stocks — 88.6% | |
| Security | | Shares | | Value | |
| Capital Markets — 2.5% | |
| UBS AG(1) | | | 200,000 | | | $ | 23,370,000 | | |
| | | $ | 23,370,000 | | |
| Commercial Banks — 10.0% | |
| Bank of Nova Scotia(1) | | | 500,000 | | | $ | 20,880,000 | | |
| KBC Groep NV SA(1) | | | 100,000 | | | | 11,588,480 | | |
| UniCredito Italiano SpA(1) | | | 2,500,000 | | | | 18,801,346 | | |
| Wachovia Corp. | | | 400,000 | | | | 23,940,000 | | |
| Wells Fargo & Co. | | | 250,000 | | | | 17,172,500 | | |
| | | $ | 92,382,326 | | |
| Communications Equipment — 1.9% | |
| Nokia Oyj ADR | | | 750,000 | | | $ | 16,995,000 | | |
| | | $ | 16,995,000 | | |
| Construction Materials — 1.1% | |
| Cemex SA de CV ADR | | | 150,000 | | | $ | 10,128,000 | | |
| | | $ | 10,128,000 | | |
| Diversified Financial Services — 5.2% | |
| Citigroup, Inc. | | | 500,000 | | | $ | 24,975,000 | | |
| JPMorgan Chase & Co. | | | 500,000 | | | | 22,690,000 | | |
| | | $ | 47,665,000 | | |
| Diversified Telecommunication Services — 7.4% | |
| AT&T, Inc. | | | 925,000 | | | $ | 24,244,250 | | |
| Citizens Communications Co. | | | 1,500,000 | | | | 19,920,000 | | |
| Verizon Communications, Inc. | | | 725,000 | | | | 23,946,750 | | |
| | | $ | 68,111,000 | | |
| Electric Utilities — 8.6% | |
| E.ON AG(1)(2) | | | 150,000 | | | $ | 18,222,747 | | |
| Edison International | | | 250,000 | | | | 10,102,500 | | |
| Fortum Oyj(1) | | | 600,000 | | | | 15,113,884 | | |
| FPL Group, Inc. | | | 600,000 | | | | 23,760,000 | | |
| Scottish Power PLC ADR | | | 300,000 | | | | 12,204,000 | | |
| | | $ | 79,403,131 | | |
| Security | | Shares | | Value | |
| Electrical Equipment — 1.4% | |
| Emerson Electric Co. | | | 150,000 | | | $ | 12,742,500 | | |
| | | $ | 12,742,500 | | |
| Energy Equipment & Services — 2.8% | |
| Diamond Offshore Drilling, Inc. | | | 150,000 | | | $ | 13,615,500 | | |
| GlobalSantaFe Corp.(1) | | | 200,000 | | | | 12,242,000 | | |
| | | $ | 25,857,500 | | |
| Hotels, Restaurants & Leisure — 0.8% | |
| Ladbrokes PLC(1) | | | 882,353 | | | $ | 6,843,395 | | |
| | | $ | 6,843,395 | | |
| Household Durables — 1.1% | |
| Stanley Works (The) | | | 200,000 | | | $ | 10,450,000 | | |
| | | $ | 10,450,000 | | |
| Household Products — 2.7% | |
| Kimberly-Clark Corp. | | | 300,000 | | | $ | 17,559,000 | | |
| Kimberly-Clark de Mexico SA de CV(1) | | | 2,000,000 | | | | 7,044,286 | | |
| | | $ | 24,603,286 | | |
| Independent Power Producers & Energy Traders — 1.9% | |
| TXU Corp. | | | 350,000 | | | $ | 17,370,500 | | |
| | | $ | 17,370,500 | | |
| Industrial Conglomerates — 2.5% | |
| General Electric Co. | | | 675,000 | | | $ | 23,348,250 | | |
| | | $ | 23,348,250 | | |
| Insurance — 3.0% | |
| PartnerRe, Ltd.(1) | | | 200,000 | | | $ | 12,510,000 | | |
| St. Paul Travelers Cos., Inc. (The) | | | 350,000 | | | | 15,410,500 | | |
| | | $ | 27,920,500 | | |
| Metals & Mining — 4.4% | |
| Fording Canadian Coal Trust(1) | | | 300,000 | | | $ | 11,025,000 | | |
| Freeport-McMoRan Copper & Gold, Inc., Class B | | | 270,000 | | | | 17,436,600 | | |
| Southern Copper Corp. | | | 125,000 | | | | 12,381,250 | | |
| | | $ | 40,842,850 | | |
See notes to financial statements
7
Eaton Vance Tax-Managed Dividend Income Fund as of April 30, 2006
PORTFOLIO OF INVESTMENTS CONT'D
| Security | | Shares | | Value | |
| Multiline Retail — 1.6% | |
| Saks, Inc.(2) | | | 750,000 | | | $ | 15,105,000 | | |
| | | $ | 15,105,000 | | |
| Multi-Utilities — 1.5% | |
| RWE AG(1) | | | 160,000 | | | $ | 13,860,487 | | |
| | | $ | 13,860,487 | | |
| Oil, Gas & Consumable Fuels — 12.1% | |
| BP PLC ADR | | | 300,000 | | | $ | 22,116,000 | | |
| ChevronTexaco Corp. | | | 250,000 | | | | 15,255,000 | | |
| Marathon Oil Corp. | | | 250,000 | | | | 19,840,000 | | |
| Neste Oil Oyj(1) | | | 500,000 | | | | 17,353,934 | | |
| Statoil ASA ADR | | | 500,000 | | | | 16,390,000 | | |
| Total SA(1) | | | 150,000 | | | | 20,703,000 | | |
| | | $ | 111,657,934 | | |
| Pharmaceuticals — 7.1% | |
| Bristol-Myers Squibb Co. | | | 550,000 | | | $ | 13,959,000 | | |
| GlaxoSmithKline PLC ADR | | | 250,000 | | | | 14,220,000 | | |
| Johnson & Johnson | | | 400,000 | | | | 23,444,000 | | |
| Pfizer, Inc. | | | 550,000 | | | | 13,931,500 | | |
| | | $ | 65,554,500 | | |
| Real Estate Investment Trusts (REITs) — 2.3% | |
| Boston Properties, Inc. | | | 50,000 | | | $ | 4,413,500 | | |
| Equity Residential | | | 200,000 | | | | 8,974,000 | | |
| Simon Property Group, Inc. | | | 100,000 | | | | 8,188,000 | | |
| | | $ | 21,575,500 | | |
| Specialty Retail — 1.7% | |
| Home Depot, Inc. | | | 400,000 | | | $ | 15,972,000 | | |
| | | $ | 15,972,000 | | |
| Thrifts & Mortgage Finance — 2.4% | |
| Washington Mutual, Inc. | | | 500,000 | | | $ | 22,530,000 | | |
| | | $ | 22,530,000 | | |
| Tobacco — 2.6% | |
| Altria Group, Inc. | | | 325,000 | | | $ | 23,777,000 | | |
| | | $ | 23,777,000 | | |
Total Common Stocks
(identified cost $725,710,634) | | | | | | $ | 818,065,659 | | |
| Preferred Stocks — 9.1% | |
| Security | | Shares | | Value | |
| Commercial Banks — 2.9% | |
| ABN AMRO Capital Funding Trust VII, 6.08%(1) | | | 80,000 | | | $ | 1,853,600 | | |
| Auction Pass-Through Trust 2006-5B - USB H, 9.20%(3)(4) | | | 40 | | | | 1,110,811 | | |
| Auction Pass-Through Trust 2006-6B - USB H, 9.20%(3)(4) | | | 40 | | | | 1,110,811 | | |
| Banco Santander, 6.41%(1) | | | 225,000 | | | | 5,467,500 | | |
| First Republic Bank, 6.25% | | | 55,000 | | | | 1,361,800 | | |
| First Republic Bank, 6.70% | | | 162,000 | | | | 4,025,700 | | |
| First Tennessee Bank, 5.87%(3)(4) | | | 3,000 | | | | 3,047,625 | | |
| HSBC Holdings PLC, 6.20%(1) | | | 170,000 | | | | 3,949,100 | | |
| Royal Bank of Scotland Group PLC, 5.75%(1) | | | 71,000 | | | | 1,564,840 | | |
| Royal Bank of Scotland Group PLC, 6.40%(1) | | | 145,000 | | | | 3,509,000 | | |
| | | $ | 27,000,787 | | |
| Consumer Finance — 0.1% | |
| Ford Motor Credit Co., 7.375% | | | 40,000 | | | $ | 802,400 | | |
| | | $ | 802,400 | | |
| Diversified Financial Services — 0.6% | |
| ING Groep NV, 6.125%(1) | | | 145,000 | | | $ | 3,346,600 | | |
Structured Auction Rate Securities/Stock
Custodial-Receipts Merrill H, 7.89%(3)(4) | | | 2,100 | | | | 2,118,900 | | |
| | | $ | 5,465,500 | | |
| Food Products — 0.1% | |
| Ocean Spray Cranberries, Inc., 6.25%(3) | | | 5,750 | | | $ | 443,110 | | |
| | | $ | 443,110 | | |
| Gas Utilities — 0.3% | |
| Southern Union Co., 7.55% | | | 118,300 | | | $ | 3,052,140 | | |
| | | $ | 3,052,140 | | |
| Insurance — 2.4% | |
| Ace Ltd., 7.80%(1) | | | 45,500 | | | $ | 1,176,175 | | |
| Aegon NV, 6.50%(1) | | | 205,000 | | | | 4,952,800 | | |
| Arch Capital Group, Ltd., 8.00%(1) | | | 12,000 | | | | 310,200 | | |
| Endurance Specialty Holdings, Ltd., 7.75%(1) | | | 231,550 | | | | 5,510,890 | | |
| MetLife, Inc., 5.91%(4) | | | 200,000 | | | | 5,154,000 | | |
| PartnerRe Ltd., 6.50%(1) | | | 80,000 | | | | 1,852,800 | | |
| PartnerRe Ltd., 6.75%(1) | | | 64,700 | | | | 1,559,917 | | |
| RenaissanceRe Holdings, Ltd., 6.08%(1) | | | 70,000 | | | | 1,449,000 | | |
| | | $ | 21,965,782 | | |
See notes to financial statements
8
Eaton Vance Tax-Managed Dividend Income Fund as of April 30, 2006
PORTFOLIO OF INVESTMENTS CONT'D
| Security | | Shares | | Value | |
| Real Estate Investment Trusts (REITs) — 1.8% | |
| AMB Property Corp., 6.75% | | | 79,900 | | | $ | 1,877,650 | | |
| BRE Properties, Series D, 6.75% | | | 40,000 | | | | 964,800 | | |
| Duke Realty Corp., 6.95% | | | 120,000 | | | | 2,942,400 | | |
| Health Care Property, 7.10% | | | 150,000 | | | | 3,742,500 | | |
| Prologis Trust, 6.75% | | | 65,000 | | | | 1,582,750 | | |
| PS Business Parks, Inc., 7.00% | | | 50,000 | | | | 1,190,000 | | |
| PS Business Parks, Inc., 7.95% | | | 110,000 | | | | 2,795,100 | | |
| Vornado Realty Trust, 6.75% | | | 75,000 | | | | 1,755,000 | | |
| | | $ | 16,850,200 | | |
| Thrifts & Mortgage Finance — 0.9% | |
Federal National Mortgage Association,
Series K, 5.396%(4) | | | 140,000 | | | $ | 7,000,000 | | |
Federal National Mortgage Association,
Series O, 7.065%(4) | | | 30,000 | | | | 1,644,375 | | |
| | | $ | 8,644,375 | | |
Total Preferred Stocks
(identified cost $86,432,215) | | | | | | $ | 84,224,294 | | |
| Commercial Paper — 1.4% | |
| Security | | Principal
Amount
(000's omitted) | | Value | |
| General Electric Capital Corp., 4.84%, 5/1/06 | | $ | 13,323 | | | $ | 13,323,000 | | |
Total Commercial Paper
(at amortized cost, $13,323,000) | | | | | | $ | 13,323,000 | | |
| Other Short-Term Investments — 0.2% | |
| Security | | Principal
Amount
(000's omitted) | | Value | |
Investors Bank and Trust Company Time Deposit,
4.86%, 5/1/06 | | $ | 2,000 | | | $ | 2,000,000 | | |
Total Other Short-Term Investments
(at amortized cost, $2,000,000) | | | | $ | 2,000,000 | | |
Total Investments — 99.3%
(identified cost $827,465,849) | | | | $ | 917,612,953 | | |
| Other Assets, Less Liabilities — 0.7% | | | | $ | 6,201,847 | | |
| Net Assets — 100.0% | | | | $ | 923,814,800 | | |
ADR - American Depository Receipt
(1) Foreign security.
(2) Non-income producing security.
(3) Security exempt from registration under Rule 144A of the Securities Act of 1933. These securities may be sold in transactions exempt from registration, normally to qualified institutional buyers. At April 30, 2006, the aggregate value of the securities is $7,831,257 or 0.8% of the Fund's net assets.
(4) Variable rate security. The stated interest rate represents the rate in effect at April 30, 2006.
See notes to financial statements
9
Eaton Vance Tax-Managed Dividend Income Fund as of April 30, 2006
PORTFOLIO OF INVESTMENTS CONT'D
| Country Concentration of Portfolio | |
| Country | | Percentage
of Total Investments | | Value | |
| United States | | | 75.5 | % | | $ | 692,254,972 | | |
| Finland | | | 3.5 | | | | 32,467,818 | | |
| Germany | | | 3.5 | | | | 32,083,234 | | |
| Canada | | | 3.5 | | | | 31,905,000 | | |
| Bermuda | | | 2.7 | | | | 24,368,982 | | |
| Switzerland | | | 2.5 | | | | 23,370,000 | | |
| Italy | | | 2.0 | | | | 18,801,346 | | |
| United Kingdom | | | 1.7 | | | | 15,866,335 | | |
| Cayman Islands | | | 1.3 | | | | 12,242,000 | | |
| Belgium | | | 1.3 | | | | 11,588,480 | | |
| Netherlands | | | 1.1 | | | | 10,153,000 | | |
| Mexico | | | 0.8 | | | | 7,044,286 | | |
| Spain | | | 0.6 | | | | 5,467,500 | | |
| Total | | | 100.0 | % | | $ | 917,612,953 | | |
See notes to financial statements
10
Eaton Vance Tax-Managed Dividend Income Fund as of April 30, 2006
FINANCIAL STATEMENTS
Statement of Assets and Liabilities
As of April 30, 2006
| Assets | |
| Investments, at value (identified cost, $827,465,849) | | $ | 917,612,953 | | |
| Cash | | | 5,771 | | |
| Foreign currency, at value (cost $8,138,111) | | | 8,211,618 | | |
| Receivable for investments sold | | | 27,374,119 | | |
| Receivable for Fund shares sold | | | 4,914,931 | | |
| Dividends and interest receivable | | | 3,496,895 | | |
| Tax reclaim receivable | | | 502,557 | | |
| Total assets | | $ | 962,118,844 | | |
| Liabilities | |
| Payable for investments purchased | | $ | 34,356,742 | | |
| Payable for Fund shares redeemed | | | 2,656,637 | | |
| Payable to affiliate for investment advisory fees | | | 477,212 | | |
| Payable to affiliate for distribution and service fees | | | 464,647 | | |
| Payable to affiliate for Administration fees | | | 110,010 | | |
| Payable to affiliate for Trustees' fees | | | 1,557 | | |
| Accrued expenses | | | 237,239 | | |
| Total liabilities | | $ | 38,304,044 | | |
| Net Assets | | $ | 923,814,800 | | |
| Sources of Net Assets | |
| Paid-in capital | | $ | 822,896,524 | | |
| Accumulated net realized loss (computed on the basis of identified cost) | | | (6,882,000 | ) | |
| Accumulated undistributed net investment income | | | 17,520,182 | | |
| Net unrealized appreciation (computed on the basis of identified cost) | | | 90,280,094 | | |
| Total | | $ | 923,814,800 | | |
| Class A Shares | |
| Net Assets | | $ | 452,784,921 | | |
| Shares Outstanding | | | 34,867,681 | | |
Net Asset Value and Redemption Price Per Share
(net assets ÷ shares of beneficial interest outstanding) | | $ | 12.99 | | |
Maximum Offering Price Per Share
(100 ÷ 94.25 of $12.99) | | $ | 13.78 | | |
| Class B Shares | |
| Net Assets | | $ | 120,271,746 | | |
| Shares Outstanding | | | 9,281,690 | | |
Net Asset Value, Offering Price and Redemption Price Per Share
(net assets ÷ shares of beneficial interest outstanding) | | $ | 12.96 | | |
| Class C Shares | |
| Net Assets | | $ | 350,758,133 | | |
| Shares Outstanding | | | 27,062,341 | | |
Net Asset Value, Offering Price and Redemption Price Per Share
(net assets ÷ shares of beneficial interest outstanding) | | $ | 12.96 | | |
| On sales of $50,000 or more, the offering price of Class A shares is reduced. | |
Statement of Operations
For the Year Ended
April 30, 2006
| Investment Income | |
| Dividends (net of foreign taxes, $1,839,086) | | $ | 57,850,384 | | |
| Interest | | | 408,310 | | |
| Total investment income | | $ | 58,258,694 | | |
| Expenses | |
| Investment adviser fee | | $ | 4,380,016 | | |
| Administration fee | | | 1,010,657 | | |
| Trustees' fees and expenses | | | 22,566 | | |
Distribution and service fee
Class A | | | 791,449 | | |
| Class B | | | 981,272 | | |
| Class C | | | 2,590,647 | | |
| Transfer and dividend disbursing agent fees | | | 506,323 | | |
| Custodian fee | | | 353,449 | | |
| Registration fees | | | 120,053 | | |
| Printing and postage | | | 66,440 | | |
| Legal and accounting services | | | 49,090 | | |
| Miscellaneous | | | 42,966 | | |
| Total expenses | | $ | 10,914,928 | | |
Deduct —
Reduction of custodian fee | | $ | 11,462 | | |
| Reduction of investment adviser fee | | | 67,418 | | |
| Total expense reductions | | $ | 78,880 | | |
| Net expenses | | $ | 10,836,048 | | |
| Net investment income | | $ | 47,422,646 | | |
| Realized and Unrealized Gain (Loss) | |
Net realized gain (loss) —
Investment transactions (identified cost basis) | | $ | (5,869,280 | ) | |
| Foreign currency transactions | | | (426,079 | ) | |
| Net realized loss | | $ | (6,295,359 | ) | |
Change in unrealized appreciation (depreciation) —
Investments (identified cost basis) | | $ | 60,865,840 | | |
| Foreign currency | | | 126,025 | | |
| Net change in unrealized appreciation (depreciation) | | $ | 60,991,865 | | |
| Net realized and unrealized gain | | $ | 54,696,506 | | |
| Net increase in net assets from operations | | $ | 102,119,152 | | |
See notes to financial statements
11
Eaton Vance Tax-Managed Dividend Income Fund as of April 30, 2006
FINANCIAL STATEMENTS CONT'D
Statements of Changes in Net Assets
Increase (Decrease)
in Net Assets | | Year Ended
April 30, 2006 | | Year Ended
April 30, 2005 | |
From operations —
Net investment income | | $ | 47,422,646 | | | $ | 20,653,197 | | |
Net realized loss from investment
transactions and foreign
currency transactions | | | (6,295,359 | ) | | | (2,129,197 | ) | |
Net change in unrealized appreciation
(depreciation) of investments and
foreign currency | | | 60,991,865 | | | | 27,134,694 | | |
Net increase in net assets
from operations | | $ | 102,119,152 | | | $ | 45,658,694 | | |
Distributions to shareholders —
From net investment income
Class A | | $ | (16,854,194 | ) | | $ | (7,435,167 | ) | |
| Class B | | | (4,458,473 | ) | | | (2,537,028 | ) | |
| Class C | | | (11,849,664 | ) | | | (5,638,474 | ) | |
| Total distributions to shareholders | | $ | (33,162,331 | ) | | $ | (15,610,669 | ) | |
Transactions in shares of beneficial interest —
Proceeds from sale of shares
Class A | | $ | 251,392,106 | | | $ | 125,098,185 | | |
| Class B | | | 42,104,047 | | | | 38,656,600 | | |
| Class C | | | 162,588,198 | | | | 89,783,302 | | |
Net asset value of shares issued to
shareholders in payment of
distributions declared
Class A | | | 11,286,235 | | | | 4,995,133 | | |
| Class B | | | 2,821,775 | | | | 1,573,826 | | |
| Class C | | | 6,109,408 | | | | 2,801,624 | | |
Cost of shares redeemed
Class A | | | (60,580,545 | ) | | | (31,957,287 | ) | |
| Class B | | | (12,211,050 | ) | | | (6,044,426 | ) | |
| Class C | | | (29,585,505 | ) | | | (11,250,437 | ) | |
Net asset value of shares exchanged
Class A | | | 2,017,596 | | | | 412,800 | | |
| Class B | | | (2,017,596 | ) | | | (412,800 | ) | |
Net increase in net assets from Fund
share transactions | | $ | 373,924,669 | | | $ | 213,656,520 | | |
| Net increase in net assets | | $ | 442,881,490 | | | $ | 243,704,545 | | |
| Net Assets | | Year Ended
April 30, 2006 | | Year Ended
April 30, 2005 | |
| At beginning of year | | $ | 480,933,310 | | | $ | 237,228,765 | | |
| At end of year | | $ | 923,814,800 | | | $ | 480,933,310 | | |
Accumulated undistributed
net investment income
included in net assets | |
| At end of year | | $ | 17,520,182 | | | $ | 5,284,430 | | |
See notes to financial statements
12
Eaton Vance Tax-Managed Dividend Income Fund as of April 30, 2006
FINANCIAL STATEMENTS CONT'D
Financial Highlights
| | | Class A | |
| | | Year Ended April 30, | | Period Ended | |
| | | 2006 | | 2005 | | April 30, 2004(1) | |
| Net asset value — Beginning of year | | $ | 11.820 | | | $ | 10.640 | | | $ | 10.000 | | |
| Income (loss) from operations | |
| Net investment income(2) | | $ | 0.922 | | | $ | 0.743 | | | $ | 0.500 | | |
| Net realized and unrealized gain | | | 0.889 | | | | 0.989 | | | | 0.437 | | |
| Total income from operations | | $ | 1.811 | | | $ | 1.732 | | | $ | 0.937 | | |
| Less distributions | |
| From net investment income | | $ | (0.641 | ) | | $ | (0.552 | ) | | $ | (0.297 | ) | |
| Total distributions | | $ | (0.641 | ) | | $ | (0.552 | ) | | $ | (0.297 | ) | |
| Net asset value — End of year | | $ | 12.990 | | | $ | 11.820 | | | $ | 10.640 | | |
| Total Return(3) | | | 15.78 | % | | | 16.54 | % | | | 9.44 | % | |
| Ratios/Supplemental Data† | |
| Net assets, end of year (000's omitted) | | $ | 452,785 | | | $ | 215,759 | | | $ | 104,169 | | |
| Ratios (As a percentage of average daily net assets): | |
| Net expenses | | | 1.21 | % | | | 1.25 | % | | | 1.40 | %(4) | |
| Net expenses after custodian fee reduction | | | 1.21 | % | | | 1.25 | % | | | 1.40 | %(4) | |
| Net investment income | | | 7.49 | % | | | 6.46 | % | | | 5.05 | %(4) | |
| Portfolio Turnover | | | 247 | % | | | 162 | % | | | 117 | % | |
† The operating expenses of the Fund reflect an allocation of expenses to the Administrator and/or a reduction of the investment adviser fee. Had such actions not been taken, the ratios and net investment income per share would have been as follows:
| Ratios (As a percentage of average daily net assets): | |
| Expenses | | | 1.22 | % | | | 1.26 | % | | | 1.47 | %(4) | |
| Expenses after custodian fee reduction | | | 1.22 | % | | | 1.26 | % | | | 1.47 | %(4) | |
| Net investment income | | | 7.48 | % | | | 6.45 | % | | | 4.98 | %(4) | |
| Net investment income per share(2) | | $ | 0.921 | | | $ | 0.742 | | | $ | 0.493 | | |
(1) For the period from the start of business, May 30, 2003, to April 30, 2004.
(2) Net investment income per share was computed using average shares outstanding.
(3) Returns are historical and are calculated by determining the percentage change in net asset value with all distributions reinvested. Total return is not computed on an annualized basis.
(4) Annualized.
See notes to financial statements
13
Eaton Vance Tax-Managed Dividend Income Fund as of April 30, 2006
FINANCIAL STATEMENTS CONT'D
Financial Highlights
| | | Class B | |
| | | Year Ended April 30, | | Period Ended | |
| | | 2006 | | 2005 | | April 30, 2004(1) | |
| Net asset value — Beginning of year | | $ | 11.790 | | | $ | 10.630 | | | $ | 10.000 | | |
| Income (loss) from operations | |
| Net investment income(2) | | $ | 0.801 | | | $ | 0.648 | | | $ | 0.427 | | |
| Net realized and unrealized gain | | | 0.919 | | | | 0.986 | | | | 0.446 | | |
| Total income from operations | | $ | 1.720 | | | $ | 1.634 | | | $ | 0.873 | | |
| Less distributions | |
| From net investment income | | $ | (0.550 | ) | | $ | (0.474 | ) | | $ | (0.243 | ) | |
| Total distributions | | $ | (0.550 | ) | | $ | (0.474 | ) | | $ | (0.243 | ) | |
| Net asset value — End of year | | $ | 12.960 | | | $ | 11.790 | | | $ | 10.630 | | |
| Total Return(3) | | | 14.97 | % | | | 15.57 | % | | | 8.79 | % | |
| Ratios/Supplemental Data† | |
| Net assets, end of year (000's omitted) | | $ | 120,272 | | | $ | 79,871 | | | $ | 40,731 | | |
| Ratios (As a percentage of average daily net assets): | |
| Net expenses | | | 1.96 | % | | | 2.00 | % | | | 2.15 | %(4) | |
| Net expenses after custodian fee reduction | | | 1.96 | % | | | 2.00 | % | | | 2.15 | %(4) | |
| Net investment income | | | 6.53 | % | | | 5.65 | % | | | 4.31 | %(4) | |
| Portfolio Turnover | | | 247 | % | | | 162 | % | | | 117 | % | |
† The operating expenses of the Fund reflect an allocation of expenses to the Administrator and/or a reduction of the investment adviser fee. Had such actions not been taken, the ratios and net investment income per share would have been as follows:
| Ratios (As a percentage of average daily net assets): | |
| Expenses | | | 1.97 | % | | | 2.01 | % | | | 2.22 | %(4) | |
| Expenses after custodian fee reduction | | | 1.97 | % | | | 2.01 | % | | | 2.22 | %(4) | |
| Net investment income | | | 6.52 | % | | | 5.64 | % | | | 4.24 | %(4) | |
| Net investment income per share(2) | | $ | 0.800 | | | $ | 0.647 | | | $ | 0.420 | | |
(1) For the period from the start of business, May 30, 2003, to April 30, 2004.
(2) Net investment income per share was computed using average shares outstanding.
(3) Returns are historical and are calculated by determining the percentage change in net asset value with all distributions reinvested. Total return is not computed on an annualized basis.
(4) Annualized.
See notes to financial statements
14
Eaton Vance Tax-Managed Dividend Income Fund as of April 30, 2006
FINANCIAL STATEMENTS CONT'D
Financial Highlights
| | | Class C | |
| | | Year Ended April 30, | | Period Ended | |
| | | 2006 | | 2005 | | April 30, 2004(1) | |
| Net asset value — Beginning of year | | $ | 11.800 | | | $ | 10.630 | | | $ | 10.000 | | |
| Income (loss) from operations | |
| Net investment income(2) | | $ | 0.817 | | | $ | 0.653 | | | $ | 0.432 | | |
| Net realized and unrealized gain | | | 0.893 | | | | 0.991 | | | | 0.441 | | |
| Total income from operations | | $ | 1.710 | | | $ | 1.644 | | | $ | 0.873 | | |
| Less distributions | |
| From net investment income | | $ | (0.550 | ) | | $ | (0.474 | ) | | $ | (0.243 | ) | |
| Total distributions | | $ | (0.550 | ) | | $ | (0.474 | ) | | $ | (0.243 | ) | |
| Net asset value — End of year | | $ | 12.960 | | | $ | 11.800 | | | $ | 10.630 | | |
| Total Return(3) | | | 14.87 | % | | | 15.66 | % | | | 8.79 | % | |
| Ratios/Supplemental Data† | |
| Net assets, end of year (000's omitted) | | $ | 350,758 | | | $ | 185,303 | | | $ | 92,329 | | |
| Ratios (As a percentage of average daily net assets): | |
| Net expenses | | | 1.96 | % | | | 2.00 | % | | | 2.15 | %(4) | |
| Net expenses after custodian fee reduction | | | 1.96 | % | | | 2.00 | % | | | 2.15 | %(4) | |
| Net investment income | | | 6.65 | % | | | 5.69 | % | | | 4.34 | %(4) | |
| Portfolio Turnover | | | 247 | % | | | 162 | % | | | 117 | % | |
† The operating expenses of the Fund reflect an allocation of expenses to the Administrator and/or a reduction of the investment adviser fee. Had such actions not been taken, the ratios and net investment income per share would have been as follows:
| Ratios (As a percentage of average daily net assets): | |
| Expenses | | | 1.97 | % | | | 2.01 | % | | | 2.22 | %(4) | |
| Expenses after custodian fee reduction | | | 1.97 | % | | | 2.01 | % | | | 2.22 | %(4) | |
| Net investment income | | | 6.64 | % | | | 5.68 | % | | | 4.27 | %(4) | |
| Net investment income per share(2) | | $ | 0.816 | | | $ | 0.652 | | | $ | 0.425 | | |
(1) For the period from the start of business, May 30, 2003, to April 30, 2004.
(2) Net investment income per share was computed using average shares outstanding.
(3) Returns are historical and are calculated by determining the percentage change in net asset value with all distributions reinvested. Total return is not computed on an annualized basis.
(4) Annualized.
See notes to financial statements
15
Eaton Vance Tax-Managed Dividend Income Fund as of April 30, 2006
NOTES TO FINANCIAL STATEMENTS
1 Significant Accounting Policies
Eaton Vance Tax-Managed Dividend Income Fund (the Fund) is a diversified series of Eaton Vance Mutual Funds Trust (the Trust). The Trust is an entity of the type commonly known as a Massachusetts business trust and is registered under the Investment Company Act of 1940, as amended, as an open-end management investment company. The Fund seeks to achieve after-tax total return by investing primarily in a diversified portfolio of common and preferred stocks that pay dividends that qualify for federal income taxation at long–term capital gains rates ("tax-favored dividends"). The Fund offers three classes of shares. Class A shares are generally sold subject to a sales charge imposed at time of purchase. Class B and Class C shares are sold at net asset value and are subject to a contingent deferred sales charge (see Note 6). Class B shares held for eight years will automatically convert to Class A shares. Each class represents a pro rata interest in the Fund, but votes separately on class-specific matters and (as noted below) is subject to different expenses. Realized and unrealized gains and losses and net investment income and losses, other than class specific expenses, are allocated daily to each class of shares based on the relative net assets of each class to the total net assets of the Fund. Each class of shares differs in its distribution plan and certain other class specific expenses.
The following is a summary of significant accounting policies consistently followed by the Fund in the preparation of its financial statements. The policies are in conformity with accounting principles generally accepted in the United States of America.
A Investment Valuation — Securities listed on a U.S. securities exchange generally are valued at the last sale price on the day of valuation or, if no sales took place on such date, at the mean between the closing bid and asked prices therefore on the exchange where such securities are principally traded. Equity securities listed on the NASDAQ National Market System generally are valued at the official NASDAQ closing price. Unlisted or listed securities for which closing sales prices or closing quotations are not available are valued at the mean between the latest available bid and asked prices or, in the case of preferred equity securities that are not listed or traded in the ov er-the-counter market, by an independent pricing service. The value of preferred equity securities that are valued by a pricing service on a bond basis will be adjusted by an income factor, to be determined by the investment adviser, to reflect the next anticipated regular dividend. Exchange-traded options are valued at the last sale price for the day of valuation as quoted on the principal exchange or board of trade on which the
options are traded or, in the absence of sales on such date, at the mean between the latest bid and asked prices therefore. Futures positions on securities and currencies generally are valued at closing settlement prices. Short-term debt securities with a remaining maturity of 60 days or less are valued at amortized cost. If short-term debt securities are acquired with a remaining maturity of more than 60 days, they will be valued by a pricing service. Other fixed income and debt securities, including listed securities and securities for which price quotations are available, will normally be valued on the basis of valuations furnished by a pricing service. Foreign securities and currencies are valued in U.S. dollars, based on foreign currency exchange rate quotations supplied by an independent quotation service. The daily valuation of e xchange-traded foreign securities generally is determined as of the close of trading on the principal exchange on which such securities trade. Events occurring after the close of trading on foreign exchanges may result in adjustments to the valuation of foreign securities to more accurately reflect their fair value as of the close of regular trading on the New York Stock Exchange. When valuing foreign equity securities that meet certain criteria, the Trustees have approved the use of a fair value service that values such securities to reflect market trading that occurs after the close of the applicable foreign markets of comparable securities or other instruments that have a strong correlation to the fair-valued securities. Investments held by the Fund for which valuations or market quotations are unavailable are valued at fair value using methods determined in good faith by or at the direction of the Trustees of the Fund considering relevant factors, data and information including the market value of freely tradable securities of the same class in the principal market on which such securities are normally traded.
B Income — Dividend income is recorded on the ex-dividend date for dividends received in cash and/or securities. However, if the ex-dividend date has passed, certain dividends from foreign securities are recorded as the Fund is informed of the ex-dividend date. Interest income is recorded on the accrual basis.
C Expenses — The majority of expenses of the Trust are directly identifiable to an individual fund. Expenses which are not readily identifiable to a specific fund are allocated taking into consideration, among other things, the nature and type of expense and the relative size of the funds.
D Federal Taxes — The Fund's policy is to comply with the provisions of the Internal Revenue Code applicable to regulated investment companies and to
16
Eaton Vance Tax-Managed Dividend Income Fund as of April 30, 2006
NOTES TO FINANCIAL STATEMENTS CONT'D
distribute to shareholders each year all of its taxable income, including any net realized capital gain on investments. Accordingly, no provision for federal income or excise tax is necessary. At April 30, 2006, the Fund, for federal income tax purposes, had a capital loss carryover of $6,878,105 which will reduce the taxable income arising from future net realized gain in investments, if any, to the extent permitted by the Internal Revenue Code and thus will reduce the amount of distributions to shareholders which would otherwise be necessary to relieve the Fund of any liability for federal income or excise tax. Such capital loss carryover will expire on: April 30, 2012 ($252,492), April 30, 2013 ($2,039,433) and April 30, 2014 ($4,586,180).
At April 30, 2006, undistributed ordinary income on a tax basis was $17,392,922. The difference between book basis and tax basis undistributed ordinary income is attributable primarily to differing treatment of certain dividends received from the Fund's investment in Real Estate Investment Trusts (REITs). The tax character of the dividends paid during the fiscal year ended April 30, 2006 was $33,162,331 of ordinary income.
E Expense Reduction — Investors Bank & Trust Company (IBT) serves as custodian of the Fund. Pursuant to the custodian agreement, IBT receives a fee reduced by credits which are determined based on the average daily cash balance the Fund maintains with IBT. All credit balances used to reduce the Fund's custodian fees are reported as a reduction of expenses in the Statements of Operations.
F Financial Futures Contracts — Upon entering a financial futures contract, the Fund is required to deposit (initial margin) either in cash or securities an amount equal to a certain percentage of the purchase price indicated in the financial futures contract. Subsequent payments are made or received by the Fund (margin maintenance) each day, dependent on the daily fluctuations in the value of the underlying security, and are recorded for book purposes as unrealized gains or losses by the Fund. The Fund's investment in financial futures contracts is designed to hedge against anticipated future changes in price of current or anticipated Fund positions. Should prices move unexpectedly, the Fund may not achieve the anticipated benefits of the financial futures contracts and may realize a loss.
G Foreign Currency Translation — Investment valuations, other assets, and liabilities initially expressed in foreign currencies are converted each business day into U.S. dollars based upon current exchange rates. Purchases and sales of foreign investment securities and income and expenses are converted into U.S. dollars based upon currency exchange rates prevailing on the respective dates of such transactions. Recognized gains or losses on investment transactions attributable to changes in foreign currency exchange rates are recorded for financial statement purposes as net realized gains and losses on investments. That portion of unrealized gains and losses on investments that results from fluctuation s in foreign currency exchange rates is not separately disclosed.
H Purchased Options — Upon the purchase of a put option by the Fund, the premium paid is recorded as an investment, the value of which is marked-to-market daily. When a purchased option expires, the Fund will realize a loss in the amount of the cost of the option. When the Fund enters into a closing sale transaction, the Fund will realize a gain or loss depending on whether the sales proceeds from the closing sale transaction are greater or less than the cost of the option. When the Fund exercises a put option, settlement is made in cash. The risk associated with purchasing options is limited to the premium originally paid.
I Securities Sold Short — The Fund may sell individual securities short if it owns at least an equal amount of the security sold short or has at the time of sale a right to obtain securities equilivant in kind and amount to the securities sold and provided that, if such right is conditional, the sale is made upon the same conditions (a covered short sale). The Fund may sell short securities representing an index or basket of securities whose constituents the Fund holds in whole or in part. A short sale of an index or basket security will be covered short sale if the underlying index or basket of securities is the same or substantially identical to securities held by the Fund.
The seller of a short position generally realizes a profit on the transaction if the price it receives on the short sale exceeds the cost of closing out the position by purchasing securities in the market, but generally realizes a loss if the cost of closing out the short position exceeds the proceeds of the short sale. The exposure to loss on covered short sales (to the extent the value of the security sold short rises instead of falls) is offset by the increase in the value of the underlying security or securities retained. The profit or loss on a covered short sale is also affected by the borrowing cost of any securities borrowed in connection with the short sale (which will vary with market conditions) and use of the proceeds of the short sale. The Fund expects normally to close its short sales against-the box by delivering newly-aquired stock.
Exposure to loss on an index or basket security sold short will not be offset by gains on other securities
17
Eaton Vance Tax-Managed Dividend Income Fund as of April 30, 2006
NOTES TO FINANCIAL STATEMENTS CONT'D
holdings to the extent that the constituent securities of the index or basket security sold short are not held by the Fund. Such losses may be substantial.
J Use of Estimates — The preparation of the financial statements in conformity with accounting principles generally accepted in the United States of America requires management to make estimates and assumptions that affect the reported amounts of assets and liabilities at the date of the financial statements and the reported amounts of income and expense during the reporting period. Actual results could differ from those estimates.
K Indemnifications — Under the Trust's organizational documents, its officers and Trustees may be indemnified against certain liabilities and expenses arising out of the performance of their duties to the Fund and shareholders are indemnified against personal liability for the obligations of the Trust. Additionally, in the normal course of business, the Fund enters into agreements with service providers that may contain indemnification clauses. The Fund's maximum exposure under these arrangements is unknown as this would involve future claims that may be made against the Fund that have not yet occurred.
L Other — Investment transactions are accounted for on the date the securities are purchased or sold. Realized gains and losses on securities sold are determined on the basis of identified cost.
2 Distribution to Shareholders
It is the present policy of the Fund to make monthly distributions to shareholders, and at least one distribution annually of all or substantially all of its net realized capital gains, if any (reduced by available capital loss carryforwards from prior years, if any). Distributions are declared separately for each class of shares. Distributions are paid in the form of additional shares of the same class of the Fund or, at the election of the shareholder, in cash. Shareholders may reinvest all distributions in additional shares of the same class of the Fund at the net asset value as of the close of business on the ex-dividend date. The Fund distinguishes between distributions on a tax basis and a financial reporting basis. Accounting principles generally accepted in the United States of America require that only distributions in excess of tax basis earnings and profits be reported in the financial statements as a return of capita l. Permanent differences between book and tax accounting relating to distributions are reclassified to paid-in capital.
The tax character of distributions paid for the years ended April 30, 2006 and April 30, 2005 was as follows:
| | | Year Ended April 30, | |
| | | 2006 | | 2005 | |
| Distributions declared from: | |
| Ordinary income | | $ | 33,162,331 | | | $ | 15,610,669 | | |
During the year ended April 30, 2006, accumulated undistributed net investment income was decreased by $2,024,563 and accumulated net realized loss was decreased by $2,024,563 primarily due to differences between book and tax accounting for investment transactions. This change had no effect on the net assets or the net asset value per share.
As of April 30, 2006, the components of distributable earnings (accumulated losses) on a tax basis were as follows:
| Undistributed income | | $ | 17,392,922 | | |
| Capital loss carryforwards | | $ | (6,878,105 | ) | |
| Unrealized gain | | $ | 90,403,459 | | |
3 Shares of Beneficial Interest
The Agreement and Declaration of Trust permits the Trustees to issue an unlimited number of full and fractional shares of beneficial interest (without par value). Transactions in shares were as follows:
| | | Year Ended April 30, | |
| Class A | | 2006 | | 2005 | |
| Sales | | | 20,439,240 | | | | 10,852,656 | | |
Issued to shareholders electing to
receive payments of distributions
in Fund shares | | | 918,038 | | | | 431,760 | | |
| Redemptions | | | (4,913,417 | ) | | | (2,847,599 | ) | |
| Exchanges from Class B shares | | | 163,619 | | | | 35,461 | | |
| Net increase | | | 16,607,480 | | | | 8,472,278 | | |
| | | Year Ended April 30, | |
| Class B | | 2006 | | 2005 | |
| Sales | | | 3,436,193 | | | | 3,368,539 | | |
Issued to shareholders electing to
receive payments of distributions
in Fund shares | | | 230,280 | | | | 136,088 | | |
| Redemptions | | | (993,777 | ) | | | (528,003 | ) | |
| Exchanges to Class A shares | | | (163,946 | ) | | | (35,527 | ) | |
| Net increase | | | 2,508,750 | | | | 2,941,097 | | |
18
Eaton Vance Tax-Managed Dividend Income Fund as of April 30, 2006
NOTES TO FINANCIAL STATEMENTS CONT'D
| | | Year Ended April 30, | |
| Class C | | 2006 | | 2005 | |
| Sales | | | 13,261,839 | | | | 7,760,896 | | |
Issued to shareholders electing to
receive payments of distributions
in Fund shares | | | 497,886 | | | | 242,047 | | |
| Redemptions | | | (2,407,104 | ) | | | (978,209 | ) | |
| Net increase | | | 11,352,621 | | | | 7,024,734 | | |
4 Investment Adviser Fee and Other Transactions with Affiliates
The investment adviser fee is earned by Eaton Vance Management (EVM), as compensation for management and investment advisory services rendered to the Fund. Under the advisory agreement, EVM receives a monthly advisory fee equal to 0.650% annually of average daily net assets of the Fund up to $500 million, and at reduced rates as daily net assets exceed that level. For the year ended April 30, 2006, the advisory fee amounted to $4,380,016. EVM has agreed to reduce the investment adviser fee by an amount equal to that portion of commissions paid to broker dealers in execution of Fund portfolio transactions that is consideration for third-party research services. For the year ended April 30, 2006, EVM waived $67,418 of its advisory fee. An administration fee is earned by EVM for managing and administering the business affairs of the Fund. Under the administration agreement, EVM earns a fee in the amount of 0.15% per annum of the av erage daily net assets of the Fund. For the year ended April 30, 2006, the administration fee amounted to $1,010,657.
Except for Trustees of the Fund who are not members of EVM's organization, officers and Trustees receive remuneration for their services to the Fund out of the investment adviser fee earned by EVM. Trustees of the Fund who are not affiliated with EVM may elect to defer receipt of all or a percentage of their annual fees in accordance with the terms of the Trustees Deferred Compensation Plan. For the year ended April 30, 2006, no significant amounts have been deferred.
EVM serves as the sub-transfer agent of the Fund and receives from the transfer agent an aggregate fee based upon the actual expenses incurred by EVM in the performance of those activities. For the year ended April 30, 2006, EVM earned $30,572 in sub-transfer agent fees.
Eaton Vance Distributors, Inc. (EVD), a subsidiary of EVM and the Fund's principal underwriter, received $666,228 as its portion of the sales charge on sales of Class A shares for the year ended April 30, 2006.
Certain officers and Trustees of the Fund are officers of the above organizations.
5 Distribution Plans
Class A has in effect a distribution plan pursuant to Rule 12b-1 (Class A Plan). The Class A Plan provides that the Fund will pay EVD a distribution and service fee of 0.25% of the Fund's average daily net assets attributable to Class A shares for each fiscal year for distribution services and facilities provided to the Fund by EVD, as well as for personal services and/or the maintenance of shareholder accounts. Distribution and service fees paid or accrued for the year ended April 30, 2006 amounted to $791,449 for Class A shares. The Fund also has in effect distribution plans for Class B shares (Class B Plan) and Class C shares (Class C Plan) pursuant to Rule 12b-1 under the Investment Company Act of 1940. The Class B and Class C Plans require the Fund to pay EVD amounts equal to 1/365 of 0.75% of the Fund's average daily net assets attributable to Class B and Class C shares, for providing ongoing distribution services and faci lities to the Fund. The Fund will automatically discontinue payments to EVD during any period in which there are no outstanding Uncovered Distribution Charges, which are equivalent to the sum of (i) 6.25% of the aggregate amount received by the Fund for the Class B and Class C shares sold, respectively, plus (ii) interest calculated by applying the rate of 1% over the prevailing prime rate to the outstanding balance of Uncovered Distribution Charges of EVD, of each respective class, reduced by the aggregate amount of contingent deferred sales charges (see Note 6) and daily amounts theretofore paid to EVD by each respective class. Distribution fees paid or accrued for the year ended April 30, 2006 amounted to $735,954 and $1,942,985 for Class B and Class C shares, respectively. At April 30, 2006, the amount of Uncovered Distribution Charges of EVD calculated under the Plans was approximately $4,228,000 and $16,616,000 for Class B and Class C shares, respectively. The Class B and Class C Plans also authorize t he Fund to make payments of service fees to EVD, investment dealers and other persons in amounts not exceeding 0.25% annually of the average daily net assets attributable to that Class. Service fees are paid for personal services and/or the maintenance of shareholder accounts. They are separate and distinct from the Class B and Class C sales commissions and distribution fees and, as such, are not subject to automatic discontinuance when there are no outstanding Uncovered Distribution Charges to EVD. Service fees paid or accrued for the year ended April 30, 2006 amounted to $245,318, and $647,662, for Class B and Class C shares, respectively.
6 Contingent Deferred Sales Charge
A contingent deferred sales charge (CDSC) generally is imposed on redemptions of Class B shares made within six years of purchase and on redemptions of Class C
19
Eaton Vance Tax-Managed Dividend Income Fund as of April 30, 2006
NOTES TO FINANCIAL STATEMENTS CONT'D
shares made within one year of purchase. Class A shares may be subject to a 1% CDSC if redeemed within one year of purchase (depending upon the circumstances of purchase). Generally, the CDSC is based upon the lower of the net asset value at date of redemption or date of purchase. No charge is levied on shares acquired by reinvestment of dividends or capital gain distributions. The Class B CDSC is imposed at declining rates that begin at 5% in the case of redemptions in the first and second year after purchase, declining one percentage point each subsequent year. Class C shares will be subject to a 1% CDSC if redeemed within one year of purchase.
No CDSC is levied on shares which have been sold to EVM or its affiliates or to their respective employees or clients and may be waived under certain other limited conditions. CDSC pertaining to Class B and Class C redemptions are paid to EVD to reduce the amount of Uncovered Distribution Charges calculated under the Class B and Class C Plans, respectively (see Note 5). CDSC assessed on Class B and Class C shares when no Uncovered Distribution Charges exist for the respective classes will be credited to the Fund. EVD received approximately $4,000, $196,000 and $51,000 of CDSC paid by shareholders for Class A, Class B, and Class C shares, respectively, for the year ended April 30, 2006.
7 Investments Transactions
Purchases and sales of investments, other than short-term obligations, aggregated $2,010,209,586 and $1,637,817,216 respectively, for the year ended April 30, 2006.
8 Federal Income Tax Basis of Unrealized Appreciation (Depreciation)
The cost and unrealized appreciation (depreciation) of investments of the Fund at April 30, 2006, as computed on a federal income tax basis, were as follows:
| Aggregate cost | | $ | 827,342,484 | | |
| Gross unrealized appreciation | | $ | 105,230,636 | | |
| Gross unrealized depreciation | | | (14,960,167 | ) | |
| Net unrealized appreciation | | $ | 90,270,469 | | |
Unrealized appreciation on foreign currency as of April 30, 2006 is $132,990.
9 Risks Associated with Foreign Investments
Investing in securities issued by companies whose principal business activities are outside the United States may involve significant risks not present in domestic investments. For
example, there is generally less publicly available information about foreign companies, particularly those not subject to the disclosure and reporting requirements of the U.S. securities laws. Foreign issuers are generally not bound by uniform accounting, auditing, and financial reporting requirements and standards of practice comparable to those applicable to domestic issuers. Investments in foreign securities also involve the risk of possible adverse changes in investment or exchange control regulations, expropriation or confiscatory taxation, limitation on the removal of funds or other assets of the Fund, political or financial instability or diplomatic and other developments which could affect such investments. Foreign stock markets, while growing in volume and sophistication, are generally not as developed as those in the United States, and securities of some foreign issuers (particularly those located in developing countr ies) may be less liquid and more volatile than securities of comparable U.S. companies. In general, there is less overall governmental supervision and regulation of foreign securities markets, broker-dealers and issuers than in the United States.
10 Financial Instruments
The Fund may trade in financial instruments with off-balance sheet risk in the normal course of its investing activities to assist in managing exposure to various market risks. These financial instruments include written options, and financial futures contracts and may involve, to a varying degree, elements of risk in excess of the amounts recognized for financial statement purposes.
The notional or contractual amounts of these instruments represent the investment the Fund has in particular classes of financial instruments and does not necessarily represent the amounts potentially subject to risk. The measurement of the risks associated with these instruments is meaningful only when all related and offsetting transactions are considered. The Fund did not have any open obligations under these financial instruments at April 30, 2006.
11 Line of Credit
The Fund participates with other portfolios and funds managed by EVM and its affiliates in a $150 million unsecured line of credit agreement with a group of banks. Borrowings will be made by the Fund solely to facilitate the handling of unusual and/or unanticipated short term cash requirements. Interest is charged to each participating portfolio or fund based on its borrowings at an amount above either the Eurodollar rate or Federal Funds rate. In addition, a fee computed at an annual rate of 0.10% on the daily unused portion of the line of credit is allocated among the participating portfolios and funds at the end of each quarter. The Fund did not have any significant borrowings or allocated fees during the year ended April 30, 2006.
20
Eaton Vance Tax-Managed Dividend Income Fund as of April 30, 2006
REPORT OF INDEPENDENT REGISTERED PUBLIC ACCOUNTING FIRM
To the Trustees of Eaton Vance Mutual Funds Trust and Shareholders of Eaton Vance Tax-Managed Dividend Income Fund:
We have audited the accompanying statement of assets and liabilities of Eaton Vance Tax-Managed Dividend Income Fund (one of the series constituting the Eaton Vance Mutual Funds Trust) (the Fund), including the portfolio of investments, as of April 30, 2006, the related statement of operations for the year then ended, the statements of changes in net assets for each of the two years in the period then ended, and the financial highlights for each of the two years in the period then ended and for the period from May 30, 2003 (commencement of operations) to April 30, 2004. These financial statements and financial highlights are the responsibility of the Fund's management. Our responsibility is to express an opinion on these financial statements and financial highlights based on our audits.
We conducted our audits in accordance with the standards of the Public Company Accounting Oversight Board (United States). Those standards require that we plan and perform the audits to obtain reasonable assurance about whether the financial statements and financial highlights are free of material misstatement. The Fund is not required to have, nor were we engaged to perform, an audit of its internal control over financial reporting. Our audit included consideration of internal control over financial reporting as a basis for designing audit procedures that are appropriate in the circumstances, but not for the purpose of expressing an opinion on the effectiveness of the Fund's internal control over financial reporting. Accordingly, we express no such opinion. An audit also includes examining, on a test basis, evidence supporting the amounts and disclosures in the financial statements, assessing the accounting principles used and significant estimates made by management, as well as evaluating the overall financial statement presentation. Our procedures included confirmation of securities owned as of April 30, 2006, by correspondence with the custodian and brokers; where replies were not received from brokers, we performed other auditing procedures. We believe that our audits provide a reasonable basis for our opinion.
In our opinion, the financial statements and financial highlights referred to above present fairly, in all material respects, the financial position of the Eaton Vance Tax-Managed Dividend Income Fund as of April 30, 2006, the results of its operations for the year then ended, and the changes in its net assets for each of the two years in the period then ended, and the financial highlights for each of the two years in the period then ended and for the period from May 30, 2003 (commencement of operations) to April 30, 2004, in conformity with accounting principles generally accepted in the United States of America.
DELOITTE & TOUCHE LLP
Boston, Massachusetts
June 16, 2006
21
Eaton Vance Tax-Managed Dividend Income Fund as of April 30, 2006
FEDERAL TAX INFORMATION
The Form 1099-DIV you receive in January 2007 will show the tax status of all distributions paid to your account in calendar year 2006. Shareholders are advised to consult their own tax adviser with respect to the tax consequences of their investment in the Fund. As required by the Internal Revenue Code regulations, shareholders must be notified within 60 days of the Fund's fiscal year end regarding the status of qualified dividend income for individuals, the dividends received deduction for corporations, and the foreign tax credit.
Qualified Dividend Income — The Fund designates approximately $48,662,049, or up to the maximum amount of such dividend allowable pursuant to the Internal Revenue Code, as qualified dividend income eligible for the reduced tax rate of 15%.
Dividends Received Deduction — Corporate shareholders are generally entitled to take the dividends received deduction on the portion of the Fund's dividend distribution that qualifies under tax law. For the Fund's fiscal 2006 ordinary income dividends, 39.89% qualifies for the corporate dividends received deduction.
22
Eaton Vance Tax-Managed Dividend Income Fund as of April 30, 2006
MANAGEMENT AND ORGANIZATION
Fund Management. The Trustees of Eaton Vance Mutual Funds Trust (the Trust) are responsible for the overall management and supervision of the Trust's affairs. The Trustees and officers of the Trust are listed below. Except as indicated, each individual has held the office shown or other offices in the same company for the last five years. Trustees and officers of the Trust hold indefinite terms of office. The "noninterested Trustees" consist of those Trustees who are not "interested persons" of the Trust, as that term is defined under the 1940 Act. The business address of each Trustee and officer is The Eaton Vance Building, 255 State Street, Boston, Massachusetts 02109. As used below, "EVC" refers to Eaton Vance Corp., "EV" refers to Eaton Vance, Inc., "EVM" refers to Eaton Vance Management, "BMR" refers to Boston Management and Research and "EVD" refers to Eaton Vance Distributors, Inc. EVC and EV are the corporate parent and trustee, respectively, of EVM and BMR. EVD is the Fund's principal underwriter and a wholly-owned subsidiary of EVM. Each officer affiliated with Eaton Vance may hold a position with other Eaton Vance affiliates that is comparable to his or her position with EVM listed below.
Name and
Date of Birth | | Position(s)
with the
Trust | | Term of
Office and
Length of
Service | | Principal Occupation(s)
During Past Five Years | | Number of Portfolios
in Fund Complex
Overseen By
Trustee(1) | | Other Directorships Held | |
| Interested Trustee | | | | | | | | | | | | | |
|
James B. Hawkes
11/9/41 | | Trustee | | Since 1991 | | Chairman and Chief Executive Officer of EVC, BMR, EVM and EV; Director of EV; Vice President and Director of EVD. Trustee and/or officer of 166 registered investment companies in the Eaton Vance Fund Complex. Mr. Hawkes is an interested person because of his positions with BMR, EVM, EVC and EV, which are affiliates of the Fund. | | | 166 | | | Director of EVC | |
|
| Noninterested Trustee(s) | | | | | | | | | | | | | |
|
Benjamin C. Esty
1/2/63 | | Trustee | | Since 2005 | | Roy and Elizabeth Simmons Professor of Business Administration, Harvard University Graduate School of Business Administration (since 2003). Formerly, Associate Professor, Harvard University Graduate School of Business Administration (2000-2003). | | | 166 | | | None | |
|
Samuel L. Hayes, III
2/23/35 | | Trustee and Chairman of the Board | | Trustee of the Trust since 1986 and Chairman of the Board since 2005 | | Jacob H. Schiff Professor of Investment Banking Emeritus, Harvard University Graduate School of Business Administration. Director of Yakima Products, Inc. (manufacturer of automotive accessories) (since 2001) and Director of Telect, Inc. (telecommunications services company) (since 2000). | | | 166 | | | Director of Tiffany & Co. (specialty retailer) | |
|
William H. Park
9/19/47 | | Trustee | | Since 2003 | | Vice Chairman, Commercial Industrial Finance Corp. (specialty finance company) (since 2006). Formerly, President and Chief Executive Officer, Prizm Capital Management, LLC (investment management firm) (since 2002). Executive Vice President and Chief Financial Officer, United Asset Management Corporation (a holding company owning institutional investment management firms) (1982-2001). | | | 166 | | | None | |
|
Ronald A. Pearlman
7/10/40 | | Trustee | | Since 2003 | | Professor of Law, Georgetown University Law Center. | | | 166 | | | None | |
|
Norton H. Reamer
9/21/35 | | Trustee | | Since 1986 | | President, Chief Executive Officer and a Director of Asset Management Finance Corp. (a specialty finance company serving the investment management industry) (since October 2003). President, Unicorn Corporation (an investment and financial advisory services company) (since September 2000). Formerly, Chairman and Chief Operating Officer, Hellman, Jordan Management Co., Inc. (an investment management company) (2000-2003). Formerly, Advisory Director of Berkshire Capital Corporation (investment banking firm) (2002-2003). | | | 166 | | | None | |
|
Lynn A. Stout
9/14/57 | | Trustee | | Since 1998 | | Professor of Law, University of California at Los Angeles School of Law (since July 2001). Formerly, Professor of Law, Georgetown University Law Center. | | | 166 | | | None | |
|
23
Eaton Vance Tax-Managed Dividend Income Fund as of April 30, 2006
MANAGEMENT AND ORGANIZATION CONT'D
Name and
Date of Birth | | Position(s)
with the
Trust | | Term of
Office and
Length of
Service | | Principal Occupation(s)
During Past Five Years | | Number of Portfolios
in Fund Complex
Overseen By
Trustee(1) | | Other Directorships Held | |
| Noninterested Trustee(s) (continued) | | | | | | | | | |
|
Ralph F. Verni
1/26/43 | | Trustee | | Since 2005 | | Consultant and private investor. | | | 166 | | | none | |
|
| Principal Officers who are not Trustees | | | | | | | | | |
|
Name and
Date of Birth | | Position(s)
with the
Trust | | Term of
Office and
Length of
Service | | Principal Occupation(s)
During Past Five Years | |
Thomas E. Faust Jr.
5/31/58 | | President | | Since 2002 | | President of EVC, EVM, BMR, and EV and Director of EVC. Chief Investment Officer of EVC, EVM and BMR. Officer of 68 registered investment companies and 5 private investment companies managed by EVM or BMR. | |
|
William H. Ahern, Jr.
7/28/59 | | Vice President | | Since 1995 | | Vice President of EVM and BMR. Officer of 71 registered investment companies managed by EVM or BMR. | |
|
Cynthia J. Clemson
3/2/63 | | Vice President | | Since 2005 | | Vice President of EVM and BMR. Officer of 86 registered investment companies managed by EVM or BMR. | |
|
Kevin S. Dyer
2/21/75 | | Vice President | | Since 2005 | | Assistant Vice President of EVM and BMR. Officer of 25 registered investment companies managed by EVM or BMR. | |
|
Aamer Khan
6/7/60 | | Vice President | | Since 2005 | | Vice President of EVM and BMR. Officer of 29 registered investment companies managed by EVM or BMR. | |
|
Thomas H. Luster
4/8/62 | | Vice President | | Since 2006 | | Vice President of EVM and BMR. Officer of 43 registered investment companies managed by EVM or BMR. | |
|
Michael R. Mach
7/15/47 | | Vice President | | Since 1999 | | Vice President of EVM and BMR. Officer of 33 registered investment companies managed by EVM or BMR. | |
|
Robert B. MacIntosh
1/22/57 | | Vice President | | Since 1998 | | Vice President of EVM and BMR. Officer of 86 registered investment companies managed by EVM or BMR. | |
|
Cliff Quisenbery Jr.
1/1/65 | | Vice President | | Since 2006 | | Vice President and Director of Research and Product Development of Parametric Portfolio Associate ("Parametric"). Officer of 30 registered investment companies managed by EVM or BMR. | |
|
Duncan W. Richardson
10/26/57 | | Vice President | | Since 2001 | | Executive Vice President and Chief Equity Investment Officer of EVC, EVM and BMR. Officer of 54 registered investment companies managed by EVM or BMR. | |
|
Walter A. Row, III
7/20/57 | | Vice President | | Since 2001 | | Director of Equity Research and a Vice President of EVM and BMR. Officer of 32 registered investment companies managed by EVM or BMR. | |
|
Judith A. Saryan
8/21/54 | | Vice President | | Since 2003 | | Vice President of EVM and BMR. Officer of 35 registered investment companies managed by EVM or BMR. | |
|
Susan Schiff
3/13/61 | | Vice President | | Since 2002 | | Vice President of EVM and BMR. Officer of 29 registered investment companies managed by EVM or BMR. | |
|
Barbara E. Campbell
6/19/57 | | Treasurer | | Since 2005(2) | | Vice President of EVM and BMR. Officer of 166 registered investment companies managed by EVM or BMR. | |
|
Alan R. Dynner
10/10/40 | | Secretary | | Since 1997 | | Vice President, Secretary and Chief Legal Officer of BMR, EVM, EVD, EV and EVC. Officer of 166 registered investment companies managed by EVM or BMR. | |
|
Paul M. O'Neil
7/11/53 | | Chief Compliance Officer | | Since 2004 | | Vice President of EVM and BMR. Officer of 166 registered investment companies managed by EVM or BMR. | |
|
(1) Includes both master and feeder funds in a master-feeder structure.
(2) Prior to 2005, Ms. Campbell served as Assistant Treasurer since 1995.
The SAI for the Fund includes additional information about the Trustees and officers of the Fund and can be obtained without charge by calling 1-800-225-6265.
24
This Page Intentionally Left Blank
Investment Advisor and Administrator of
Eaton Vance Tax-Managed Dividend Income Fund
Eaton Vance Management
The Eaton Vance Building
255 State Street
Boston, MA 02109
Principal Underwriter
Eaton Vance Distributors, Inc.
The Eaton Vance Building
255 State Street
Boston, MA 02109
(617) 482-8260
Custodian
Investors Bank & Trust Company
200 Clarendon Street
Boston, MA 02116
Transfer Agent
PFPC Inc.
Attn: Eaton Vance Funds
P.O. Box 9653
Providence, RI 02940-9653
(800) 262-1122
Independent Registered Public Accounting Firm
Deloitte & Touche LLP
200 Berkeley Street
Boston, MA 02116-5022
Eaton Vance Tax-Managed Dividend Income Fund
The Eaton Vance Building
255 State Street
Boston, MA 02109
This report must be preceded or accompanied by a current prospectus. Before investing, investors should consider carefully the Fund's investment objective(s), risks, and charges and expenses. The Fund's current prospectus contains this and other information about the Fund and is available through your financial advisor. Please read the prospectus carefully before you invest or send money. For further information please call 1-800-225-6265.
1857-6/06 TMDISRC
Item 2. Code of Ethics
The registrant has adopted a code of ethics applicable to its Principal Executive Officer, Principal Financial Officer and Principal Accounting Officer. The registrant undertakes to provide a copy of such code of ethics to any person upon request, without charge, by calling 1-800-262-1122.
Item 3. Audit Committee Financial Expert
The registrant’s Board has designated William H. Park, Samuel L. Hayes, III and Norton H. Reamer, each an independent trustee, as its audit committee financial experts. Mr. Park is a certified public accountant who is the President and Chief Executive Officer of Prizm Capital Management, LLC (investment management firm). Previously, he served as Executive Vice President and Chief Financial Officer of United Asset Management Corporation (“UAM”) (a holding company owning institutional investment management firms). Mr. Hayes is the Jacob H. Schiff Professor of Investment Banking Emeritus of the Harvard University Graduate School of Business Administration. Mr. Reamer is the President, Chief Executive Officer and a Director of Asset Management Finance Corp. (a specialty finance company serving the investment management industry) and is President of Unicorn Corporation (an investment and financial advisory services company). Formerly, Mr. Reamer was Chairman of Hellman, Jordan Management Co., Inc. (an investment management company) and Advisory Director of Berkshire Capital Corporation (an investment banking firm), Chairman of the Board of UAM and Chairman, President and Director of the UAM Funds (mutual funds).
Item 4. Principal Accountant Fees and Services
(a)-(d)
Eaton Vance Tax-Managed Dividend Income Fund (the “Fund”) is a series of Eaton Vance Mutual Funds Trust (the “Trust”), a Massachusetts business trust. The Trust is registered under the Investment Company Act of 1940 as an open-end management investment company. Including the Fund, the Trust contains a total of 25 series (collectively, the “Series”). This Form N-CSR relates to the Fund’s annual report.
The following table presents the aggregate fees billed to the Fund for the Fund’s respective fiscal years ended April 30, 2005 and April 30, 2006 by the Fund’s principal accountant for professional services rendered for the audit of the Fund’s annual financial statements and fees billed for other services rendered by the principal accountant during those periods.
Fiscal Years Ended | | 4/30/05 | | 4/30/06 | |
| | | | | |
Audit Fees | | $ | 44,880 | | $ | 46,775 | |
| | | | | |
Audit-Related Fees(1) | | $ | 0 | | $ | 0 | |
| | | | | |
Tax Fees(2) | | $ | 8,000 | | $ | 8,400 | |
| | | | | |
All Other Fees(3) | | $ | 0 | | $ | 0 | |
| | | | | |
Total | | $ | 52,880 | | $ | 55,175 | |
(1) Audit-related fees consist of the aggregate fees billed for assurance and related services that are reasonably related to the performance of the audit of financial statements and are not reported under the category of audit fees.
(2) Tax fees consist of the aggregate fees billed for professional services rendered by the principal accountant relating to tax compliance, tax advice, and tax planning and specifically include fees for tax return preparation.
(3) All other fees consist of the aggregate fees billed for products and services provided by the principal accountant other than audit, audit-related, and tax services.
The various Series comprising the Trust have differing fiscal year ends (April 30, October 31, or December 31). In addition, the Series differ as to principal accountant; i.e., certain Series have PricewaterhouseCoopers LLP (“PWC”) as a principal accountant and other Series have Deloitte & Touche LLP (“D&T”) as a principal accountant. The following table presents the aggregate audit, audit-related, tax, and other fees billed to all of the Series in the Trust by each Series’s respective principal accountant for the last two fiscal years of each Series.
Fiscal Years Ended | | 10/31/04 | | 12/31/04 | | 4/30/05 | | 10/31/05 | | 12/31/05 | | 4/30/06 | |
| PWC | | D&T | | PWC | | D&T | | PWC | | D&T | | PWC | | D&T | | PWC | | D&T | | PWC | | D&T | |
| | | | | | | | | | | | | | | | | | | | | | | | | |
Audit Fees | | $ | 93,650 | | 153,080 | | $ | 43,400 | | $ | 68,760 | | $ | 0 | | $ | 44,880 | | $ | 124,400 | | $ | 156,000 | | $ | 45,900 | | $ | 73,785 | | $ | 0 | | $ | 46,775 | |
| | | | | | | | | | | | | | | | | | | | | | | | | |
Audit-Related Fees(1) | | 0 | | 0 | | 0 | | 0 | | 0 | | 0 | | 0 | | 0 | | 0 | | 0 | | 0 | | 0 | |
| | | | | | | | | | | | | | | | | | | | | | | | | |
Tax Fees(2) | | 50,175 | | 75,300 | | 15,700 | | 16,200 | | 0 | | 8,000 | | 50,175 | | 79,065 | | 16,600 | | 17,010 | | 0 | | 8,400 | |
| | | | | | | | | | | | | | | | | | | | | | | | | |
All Other | | | | | | | | | | | | | | | | | | | | | | | | | |
Fees(3) | | 0 | | 0 | | 0 | | 0 | | 0 | | 0 | | 0 | | 0 | | 0 | | 0 | | 0 | | 0 | |
| | | | | | | | | | | | | | | | | | | | | | | | | |
| | | | | | | | | | | | | | | | | | | | | | | | | | | | | | | | | | | | |
Total | | $ | 143,825 | | $ | 143,825 | | $ | 59,100 | | $ | 84,960 | | $ | 0 | | $ | 84,960 | | $ | 143,825 | | $ | 235,065 | | $ | 62,500 | | $ | 90,795 | | $ | 0 | | $ | 55,175 | |
(1) Audit-related fees consist of the aggregate fees billed for assurance and related services that are reasonably related to the performance of the audit of financial statements and are not reported under the category of audit fees.
(2) Tax fees consist of the aggregate fees billed for professional services rendered by the principal accountant relating to tax compliance, tax advice, and tax planning and specifically include fees for tax return preparation.
(3) All other fees consist of the aggregate fees billed for products and services provided by the principal accountant other than audit, audit-related, and tax services.
During the fiscal year ended April 30, 2006, $35,000 was billed by D&T, the principal accountant to certain Series of the Trust for work done in connection with its Rule 17Ad-13 examination of Eaton Vance Management’s assertion that it has maintained an effective internal control structure over sub-transfer agent and registrar functions, such services being pre-approved in accordance with Rule 2-01(c)(7)(ii) of Regulation S-X.
(e)(1) The registrant’s audit committee has adopted policies and procedures relating to the pre-approval of services provided by the registrant’s principal accountant (the “Pre-Approval Policies”). The Pre-Approval Policies establish a framework intended to assist the audit committee in the proper discharge of its pre-approval responsibilities. As a general matter, the Pre-Approval Policies (i) specify certain types of audit, audit-related, tax, and other services determined to be pre-approved by the audit committee; and (ii) delineate specific procedures governing the mechanics of the pre-approval process, including the approval and monitoring of audit and non-audit service fees. Unless a service is specifically pre-approved under the Pre-Approval Policies, it must be separately pre-approved by the audit committee.
The Pre-Approval Policies and the types of audit and non-audit services pre-approved therein must be reviewed and ratified by the registrant’s audit committee at least annually. The registrant’s audit committee maintains full responsibility for the appointment, compensation, and oversight of the work of the registrant’s principal accountant.
(e)(2) No services described in paragraphs (b)-(d) above were approved by the registrant’s audit committee pursuant to the “de minimis exception” set forth in Rule 2-01(c)(7)(i)(C) of Regulation S-X.
(f) Not applicable.
(g) The following table presents (i) the aggregate non-audit fees (i.e., fees for audit-related, tax, and other services) billed for services rendered to all of the Series in the Trust by each Series’s respective principal accountant (either PWC or D&T) for the last two fiscal years of each Series; and (ii) the aggregate non-audit fees (i.e., fees for audit-related, tax, and other services) billed for services rendered to the Eaton Vance o rganization by PWC and D&T for the last two fiscal years of each Series
Fiscal Years | | 10/31/04 | | 12/31/04 | | 4/30/05 | | 10/31/05 | | 12/31/05 | | 4/30/06 | |
Ended | | PWC | | D&T | | PWC | | D&T | | PWC | | D&T | | PWC | | D&T | | PWC | | D&T | | PWC | | D&T | |
| | | | | | | | | | | | | | | | | | | | | | | | | |
Registrant(1) | | $ | 50,175 | | $ | 75,300 | | $ | 15,700 | | $ | 16,200 | | $ | 0 | | $ | 8,000 | | $ | 66,250 | | $ | 79,065 | | $ | 16,600 | | $ | 17,010 | | $ | 0 | | $ | 55,175 | |
| | | | | | | | | | | | | | | | | | | | | | | | | |
| | | | | | | | | | | | | | | | | | | | | | | | | | | | | | | | | | | | | |
Eaton Vance(2) | | $ | 84,490 | | $ | 344,230 | | $ | 84,490 | | $ | 344,713 | | $ | 83,555 | | $ | 351,449 | | $ | 33,235 | | $ | 170,983 | | $ | 61,422 | | $ | 179,500 | | $ | 85,666 | | $ | 339,899 | |
| | | | | | | | | | | | | | | | | | | | | | | | | |
(1) Includes all of the Series in the Trust.
(2) The investment adviser to the series, as well as any of it’s affiliates that provide ongoing services to the series, are subsidiaries of Eaton Vance Corp.
(h) The registrant’s audit committee has considered whether the provision by the registrant’s principal accountants of non-audit services to the registrant’s investment adviser and any entity controlling, controlled by, or under common control with the adviser that provides ongoing services to the registrant that were not pre-approved pursuant to Rule 2-01(c)(7)(ii) of Regulation S-X is compatible with maintaining the principal accountants’ independence.
��
Item 5. Audit Committee of Listed registrants
Not required in this filing.
Item 6. Schedule of Investments
Please see schedule of investments contained in the Report to Stockholders included under Item 1 of this Form N-CSR.
Item 7. Disclosure of Proxy Voting Policies and Procedures for Closed-End Management Investment Companies
Not required in this filing.
Item 8. Purchases of Equity Securities by Closed-End Management Investment Company and Affiliated Purchasers.
Not required in this filing.
Item 9. Submission of Matters to a Vote of Security Holders.
Effective February 7, 2005, the Governance Committee of the Board of Trustees revised the procedures by which a Fund’s shareholders may recommend nominees to the registrant’s Board of Trustees to add the following (highlighted):
The Governance Committee shall, when identifying candidates for the position of Independent Trustee, consider any such candidate recommended by a shareholder of a Fund if such recommendation contains (i)sufficient background information concerning the candidate, including evidence the candidate is willing to serve as an Independent Trustee if selected for the position; and (ii) is received in a sufficiently timely manner (and in any event no later than the date specified for receipt of shareholder proposals in any applicable proxy statement with respect to a Fund). Shareholders shall be directed to address any such recommendations in writing to the attention of the Governance Committee, c/o the Secretary of the Fund. The Secretary shall retain copies of any shareholder recommendations which meet the foregoing requirements for a period of not more than 12 months following receipt. The Secretary shall have no obligation to acknowledge receipt of any shareholder recommendations
Item 10. Controls and Procedures
No Material Changes.
Item 11. Exhibits
(a)(1) | | Registrant’s Code of Ethics — Not applicable (please see Item 2). |
(a)(2)(i) | | Treasurer’s Section 302 certification. |
(a)(2)(ii) | | President’s Section 302 certification. |
(b) | | Combined Section 906 certification. |
Signatures
Pursuant to the requirements of the Securities Exchange Act of 1934 and the Investment Company Act of 1940, the registrant has duly caused this report to be signed on its behalf by the undersigned, thereunto duly authorized.
Eaton Vance Mutual Funds Trust
By: | /s/Thomas E. Faust Jr. | |
| Thomas E. Faust Jr. | |
| President | |
June 16, 2006
Pursuant to the requirements of the Securities Exchange Act of 1934 and the Investment Company Act of 1940, this report has been signed below by the following persons on behalf of the registrant and in the capacities and on the dates indicated.
By: | /s/Barbara E. Campbell | |
| Barbara E. Campbell | |
| Treasurer | |
June 16, 2006
| | |
By: | /s/ Thomas E. Faust Jr. | |
| Thomas E. Faust Jr. | |
| President | |
June 16, 2006