UNITED STATES
SECURITIES AND EXCHANGE COMMISSION
Washington, D.C. 20549
FORM N-CSR
CERTIFIED SHAREHOLDER REPORT OF REGISTERED
MANAGEMENT INVESTMENT COMPANIES
Investment Company Act file number | 811-04015 |
|
Eaton Vance Mutual Funds Trust |
(Exact name of registrant as specified in charter) |
|
The Eaton Vance Building, 255 State Street, Boston, Massachusetts | | 02109 |
(Address of principal executive offices) | | (Zip code) |
|
Alan R. Dynner The Eaton Vance Building, 255 State Street, Boston, Massachusetts 02109 |
(Name and address of agent for service) |
|
Registrant’s telephone number, including area code: | (617) 482-8260 | |
|
Date of fiscal year end: | October 31 | |
|
Date of reporting period: | October 31, 2006 | |
| | | | | | | | |
Item 1. Reports to Stockholders

Annual Report October 31, 2006


EATON VANCE
TAX-MANAGED
DIVIDEND
INCOME
FUND
IMPORTANT NOTICES REGARDING PRIVACY,
DELIVERY OF SHAREHOLDER DOCUMENTS,
PORTFOLIO HOLDINGS AND PROXY VOTING
Privacy. The Eaton Vance organization is committed to ensuring your financial privacy. Each of the financial institutions identified below has in effect the following policy ("Privacy Policy") with respect to nonpublic personal information about its customers:
• Only such information received from you, through application forms or otherwise, and information about your Eaton Vance fund transactions will be collected. This may include information such as name, address, social security number, tax status, account balances and transactions.
• None of such information about you (or former customers) will be disclosed to anyone, except as permitted by law (which includes disclosure to employees necessary to service your account). In the normal course of servicing a customer's account, Eaton Vance may share information with unaffiliated third parties that perform various required services such as transfer agents, custodians and broker/dealers.
• Policies and procedures (including physical, electronic and procedural safeguards) are in place that are designed to protect the confidentiality of such information.
• We reserve the right to change our Privacy Policy at any time upon proper notification to you. Customers may want to review our Policy periodically for changes by accessing the link on our homepage: www.eatonvance.com.
Our pledge of privacy applies to the following entities within the Eaton Vance organization: the Eaton Vance Family of Funds, Eaton Vance Management, Eaton Vance Investment Counsel, Boston Management and Research, and Eaton Vance Distributors, Inc.
In addition, our Privacy Policy only applies to those Eaton Vance customers who are individuals and who have a direct relationship with us. If a customer's account (i.e., fund shares) is held in the name of a third-party financial adviser/ broker-dealer, it is likely that only such adviser's privacy policies apply to the customer. This notice supersedes all previously issued privacy disclosures.
For more information about Eaton Vance's Privacy Policy, please call 1-800-262-1122.
Delivery of Shareholder Documents. The Securities and Exchange Commission (the "SEC") permits funds to deliver only one copy of shareholder documents, including prospectuses, proxy statements and shareholder reports, to fund investors with multiple accounts at the same residential or post office box address. This practice is often called "householding" and it helps eliminate duplicate mailings to shareholders.
Eaton Vance, or your financial adviser, may household the mailing of your documents indefinitely unless you instruct Eaton Vance, or your financial adviser, otherwise.
If you would prefer that your Eaton Vance documents not be householded, please contact Eaton Vance at 1-800-262-1122, or contact your financial adviser.
Your instructions that householding not apply to delivery of your Eaton Vance documents will be effective within 30 days of receipt by Eaton Vance or your financial adviser.
Portfolio Holdings. Each Eaton Vance Fund and its underlying Portfolio (if applicable) will file a schedule of its portfolio holdings on Form N-Q with the SEC for the first and third quarters of each fiscal year. The Form N-Q will be available on the Eaton Vance website www.eatonvance.com, by calling Eaton Vance at 1-800-262-1122 or in the EDGAR database on the SEC's website at www.sec.gov. Form N-Q may also be reviewed and copied at the SEC's public reference room in Washington, D.C. (call 1-800-732-0330 for information on the operation of the public reference room).
Proxy Voting. From time to time, funds are required to vote proxies related to the securities held by the funds. The Eaton Vance Funds or their underlying Portfolios (if applicable) vote proxies according to a set of policies and procedures approved by the Funds' and Portfolios' Boards. You may obtain a description of these policies and procedures and information on how the Funds or Portfolios voted proxies relating to portfolio securities during the most recent 12 month period ended June 30, without charge, upon request, by calling 1-800-262-1122. This description is also available on the SEC's website at www.sec.gov.
Eaton Vance Tax-Managed Dividend Income Fund as of October 31, 2006
MANAGEMENT'S DISCUSSION OF FUND PERFORMANCE

Aamer Khan, CFA
Co-Portfolio Manager

Thomas H. Luster, CFA
Co-Portfolio Manager

Michael R. Mach, CFA
Co-Portfolio Manager

Judith A. Saryan, CFA
Co-Portfolio Manager
The Fund
Performance for the Period Ended October 31, 2006
· The fiscal year end for Eaton Vance Tax-Managed Dividend Income Fund (the Fund) has been changed from April 30 to October 31. For the period from April 30, 2006, through October 31, 2006, the Fund’s Class A shares had a total return of 6.14%. This return was the result of an increase in net asset value (NAV) per share to $13.40 on October 31, 2006, from $12.99 on April 30, 2006, and the reinvestment of $0.363 per share in dividend income.(1)
· The Fund’s Class B shares had a total return of 5.76% during the same period, the result of an increase in NAV per share to $13.37 from $12.96, and the reinvestment of $0.316 per share in dividend income.(1)
· The Fund’s Class C shares had a total return of 5.76% during the same period, the result of an increase in NAV per share to $13.37 from $12.96, and the reinvestment of $0.316 per share in dividend income.(1)
· For comparison, the Fund’s benchmark, the Russell 1000 Value Index – a broad-based, unmanaged market index of 1000 U.S. value stocks – had a total return of 7.61% during the same period. The Fund’s peer group, the Lipper Equity Income Funds Classification, had an average return at NAV of 6.13% for the same period.(2)
Management Discussion
· U.S. equity markets were volatile, but moved upward at a moderate pace during the period from April 30, 2006 to October 31, 2006. Equities generally rallied after a correction early in the period. Stock prices declined in early May 2006 on fears that global interest rates could continue to rise and concerns about record-high energy prices. In the latter months of the period, however, stocks again rallied, driven by a sharp decline in energy prices, fewer geopolitical worries, and moderate U.S. inflation numbers that eased concerns about future interest-rate increases by the U.S. Federal Reserve Board (the “Fed”). International stocks outperformed U.S. stocks in this late-period rally and for the period.
· Based on the Fund’s objective of providing after-tax total return consisting primarily of tax-favored dividend income and capital appreciation, the Fund was primarily invested in securities that generated a relatively high level of qualified dividend income (QDI) during the period ended October 31, 2006. At the end of the period, the Fund had approximately 90% of total investments in common stocks, approximately 9% of total investments in preferred stocks and 1% of total investments in cash equivalents. Within the common stock portfolio, the Fund had a significant exposure to the higher-yielding utility and financial sectors. In addition, the Fund maintained a diversified exposure to the consumer, industrial, energy, health care and materials sectors.(3)
· During the period, the Fund underperformed its benchmark index, and the Fund’s Class A shares slightly outperformed its Lipper Classification average (although Class B and Class C shares underperformed the Lipper Classification average). The Fund underperformed the Russell 1000 Value Index primarily because of lagging performance of Fund holdings in the energy, materials, and telecommunications sectors.(2) In the energy sector, the Fund’s holdings in the equipment and services industries were disappointing. Despite strong long-term performance, energy stocks underperformed the broader market during the six month period due to a sharp decline in the price of oil during the fall of 2006. In the materials sector, Fund
(1) These returns do not include the 5.75% maximum sales charge for Class A shares or the applicable contingent deferred sales charge (CDSC) for Class B and Class C shares. If sales charges were deducted, the returns would be lower.
(2) It is not possible to invest directly in an Index or Lipper Classification. The Index’s total return does not reflect commissions or expenses that would have been incurred if an investor individually purchased or sold the securities represented in the Index. The Lipper Average is the average total return, at net asset value, of the funds that are in the same Lipper Classification as the Fund.
(3) Sector weightings are subject to change due to active management.
See pages 3 and 4 for more performance information, including after-tax returns.
Past performance is no guarantee of future results. Returns are historical and are calculated by determining the percentage change in net asset value or offering price (as applicable) with all distributions reinvested. Investment return and principal value will fluctuate so that shares, when redeemed, may be worth more or less than their original cost. Performance is for stated time period only; due to market volatility, the Fund’s current performance may be lower or higher than the quoted return. For performance as of the most recent month end, please refer to www.eatonvance.com.
Fund shares are not insured by the FDIC and are not deposits or other obligations of, or guaranteed by, any depository institution. Shares are subject to investment risks, including possible loss of principal invested.
1
holdings in metals and mining stocks underperformed, also as a result of falling commodity prices among key metals. The Fund's telecommunications stocks detracted from performance primarily because of one holding in the wireless industry.
· On the other hand, the Fund saw positive contributions to performance in the financials and utilities sectors. In the financial sector, the Fund was underweighted relative to the Russell 1000 Value Index, and this allocation decision contributed positively. Within the sector, the Fund’s financial holdings — especially in the insurance industry — outperformed those in the Index, so selection also contributed positively to the Fund’s performance.(1) In the utilities sector, management continued to diversify and seek high-quality companies, with independent power producers and electric utilities showing particularly strong results.(2)
· The Fund’s preferred stock holdings continued to be influenced by interest rates in the market place. During the period, the Fed appeared to bring an end to its two-year tightening cycle in June 2006, which sparked a bond market rally that pushed longer rates down. Falling interest rates drove preferred stock prices higher during the period, while credit quality remained solid.
· During the period, a portion of Fund assets was invested in non-U.S. common and preferred stocks. These investments provided the Fund with international diversification and dividend yields often more attractive than the yields available on stocks issued by similar domestic corporations. As of October 31, 2006, approximately 17% of the Fund’s total investments was invested in non-U.S. dollar-denominated common stocks. In addition, approximately 4% of the Fund’s total investments was invested in “Yankee” preferreds. Yankee preferreds are preferred stocks generally issued by large, highly-rated, European financial institutions but denominated in U.S. dollars.
· We are pleased to report that since inception through October 31, 2006, the Fund has increased its monthly dividend 5 times for all share classes. Since its inception, all of the income generated by the Fund has come from dividends paid by the Fund’s common and preferred stock holdings. The Fund expects that all of the dividends paid by the Fund in fiscal 2006 will be qualified dividends subject to federal income tax at long-term capital gain rates (up to 15%, as long ascertain holding periods and other requirements have been met by receiving Fund shareholders).
· The increases in the Fund’s monthly dividend reflected both the effective implementation of the Fund’s dividend capture strategy and the significant number of dividend increases announced by companies represented in the Fund’s common stock portfolio.
· Effective July 1, 2006, Thomas Luster joined the portfolio management team of the Fund. Mr. Luster has been a Vice President of Eaton Vance and its subsidiary, Boston Management and Research (“BMR”) for more than five years, and he manages or co-manages other Eaton Vance portfolios.
· In closing, we would like to thank the shareholders for their continued confidence and participation in the Fund.
(1) It is not possible to invest directly in an Index. The Index’s total return does not reflect commissions or expenses that would have been incurred if an investor individually purchased or sold the securities represented in the Index.
(2) Sector weightings are subject to change due to active management.
The views expressed throughout this report are those of the portfolio managers and are current only through the end of the period of the report as stated on the cover. These views are subject to change at any time based upon market or other conditions, and the investment adviser disclaims any responsibility to update such views. These views may not be relied on as investment advice and, because investment decisions for a fund are based on many factors, may not be relied on as an indication of trading intent on behalf of any Eaton Vance fund.
Top Ten Holdings* | | | |
By net assets | | | |
Altria Group | | 3.2 | % |
Exxon | | 2.8 | % |
UBS | | 2.8 | % |
Bank of America | | 2.7 | % |
Bellsouth Corporation | | 2.6 | % |
Citigroup | | 2.5 | % |
TXU Corporation | | 2.4 | % |
Wachovia Corp | | 2.4 | % |
First Energy Corp | | 2.3 | % |
Verizon Communications | | 2.2 | % |
* Top Ten Holdings represented 25.9% of Fund net assets as of October 31, 2006. Holdings are subject to change due to active management.
2
Eaton Vance Tax-Managed Dividend Income Fund as of October 31, 2006
FUND PERFORMANCE
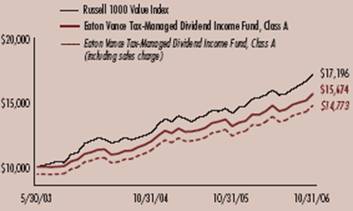
The line graphs and table set forth below provide information about the Fund's performance. The line graphs compare the performance of Class A, Class B and Class C of the Fund with that of the Russell 1000 Value Index, a broad-based, unmanaged market index of 1000 U.S. value stocks. The lines on the graph represent the total returns of a hypothetical investment of $10,000 in each of Class A, Class B and Class C of the Fund and the Russell 1000 Value Index. Class A total returns are presented at net asset value and maximum public offering price. The table includes the total returns of each class of the Fund at net asset value and public offering price. The performance presented below does not reflect the deduction of taxes, if any, that a shareholder would pay on distributions or redemptions of Fund shares.
Performance* | | Class A | | Class B | | Class C | |
Average Annual Total Returns (at net asset value) | | | | | | | |
One Year | | 19.14 | % | 18.22 | % | 18.22 | % |
Life of Fund† | | 14.00 | % | 13.17 | % | 13.17 | % |
SEC Average Annual Total Returns (including sales charge or applicable CDSC) | | | | | | | |
One Year | | 12.25 | % | 13.22 | % | 17.22 | % |
Life of Fund† | | 12.05 | % | 12.52 | % | 13.17 | % |
† Inception Dates – Class A: 5/30/03; Class B: 5/30/03; Class C: 5/30/03
* Average Annual Total Returns do not include the 5.75% maximum sales charge for Class A shares or the applicable contingent deferred sales charge (CDSC) for Class B and Class C shares. If sales charges were deducted, the returns would be lower. SEC average annual total returns for Class A reflect the maximum 5.75% sales charge. SEC returns for Class B shares reflect the applicable CDSC based on the following schedule: 5% - 1st and 2nd years; 4% - 3rd year; 3% - 4th year; 2% - 5th year; 1% - 6th year. SEC returns for Class C reflect a 1% CDSC for the first year. Absent an allocation of certain expenses to the administrator, the returns would be lower.
Past performance is no guarantee of future results. Returns are historical and are calculated by determining the percentage change in net asset value or offering price (as applicable) with all distributions reinvested. Investment return and principal value will fluctuate so that shares, when redeemed, may be worth more or less than their original cost. Performance is for stated time period only; due to market volatility, the Fund’s current performance may be lower or higher than the quoted return. For performance as of the most recent month end, please refer to www.eatonvance.com.
Fund Common Stock Investment by Sector††
By net assets
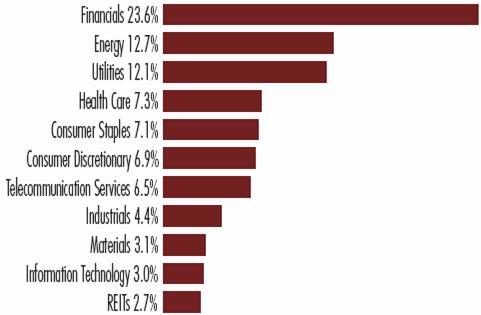
†† Fund information may not be representative of the Fund's current or future investments and may change due to active management.
Comparison of Change in value of a $10,000 Investment in Eaton Vance Tax-Managed Dividend Income Fund Class A vs. the Russell 1000 Value Index**
May 30, 2003 – October 31, 2006
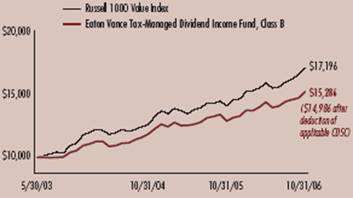
Comparison of Change in value of a $10,000 Investment in Eaton Vance Tax-Managed Dividend Income Fund Class B vs. the Russell 1000 Value Index**
May 30, 2003 – October 31, 2006
Comparison of Change in value of a $10,000 Investment in Eaton Vance Tax-Managed Dividend Income Fund Class C vs. the Russell 1000 Value Index**
May 30, 2003 – October 31, 2006

** Source: Thomson Financial. Investment operations commenced 5/30/03. It is not possible to invest directly in an Index. The Index’s total returns do not reflect any commissions or expenses that would have been incurred if an investor individually purchased or sold the securities represented in the Index.
3
“Return Before Taxes” does not take into consideration shareholder taxes. It is most relevant to tax-free or tax-deferred shareholder accounts. “Return After Taxes on Distributions” reflects the impact of federal income taxes due on Fund distributions of dividends and capital gains. It is most relevant to taxpaying shareholders who continue to hold their shares.
“Return After Taxes on Distributions and Sale of Fund Shares” also reflects the impact of taxes on capital gain or loss realized upon a sale of shares. It is most relevant to taxpaying shareholders who sell their shares.
Average Annual Total Returns
(For the periods ended October 31, 2006)
Returns at Net Asset Value (NAV) (Class A)
| | One Year | | Life of Fund | |
Return Before Taxes | | 19.14 | % | 14.00 | % |
Return After Taxes on Distributions | | 18.15 | % | 13.22 | % |
Return After Taxes on Distributions and Sale of Fund Shares | | 13.61 | % | 12.02 | % |
Returns at Public Offering Price (POP) (Class A)
| | One Year | | Life of Fund | |
Return Before Taxes | | 12.25 | % | 12.05 | % |
Return After Taxes on Distributions | | 11.31 | % | 11.29 | % |
Return After Taxes on Distributions and Sale of Fund Shares | | 9.06 | % | 10.30 | % |
Average Annual Total Returns
(For the periods ended October 31, 2006)
Returns at Net Asset Value (NAV) (Class B)
| | One Year | | Life of Fund | |
Return Before Taxes | | 18.22 | % | 13.17 | % |
Return After Taxes on Distributions | | 17.35 | % | 12.51 | % |
Return After Taxes on Distributions and Sale of Fund Shares | | 12.86 | % | 11.31 | % |
Returns at Public Offering Price (POP) (Class B)
| | One Year | | Life of Fund | |
Return Before Taxes | | 13.22 | % | 12.52 | % |
Return After Taxes on Distributions | | 12.35 | % | 11.85 | % |
Return After Taxes on Distributions and Sale of Fund Shares | | 9.61 | % | 10.73 | % |
Average Annual Total Returns
(For the periods ended October 31, 2006)
Returns at Net Asset Value (NAV) (Class C)
| | One Year | | Life of Fund | |
Return Before Taxes | | 18.22 | % | 13.17 | % |
Return After Taxes on Distributions | | 17.35 | % | 12.51 | % |
Return After Taxes on Distributions and Sale of Fund Shares | | 12.86 | % | 11.31 | % |
Returns at Public Offering Price (POP) (Class C)
| | One Year | | Life of Fund | |
Return Before Taxes | | 17.22 | % | 13.17 | % |
Return After Taxes on Distributions | | 16.35 | % | 12.51 | % |
Return After Taxes on Distributions and Sale of Fund Shares | | 12.21 | % | 11.31 | % |
Class A, Class B and Class C commenced operations on 5/30/03. Returns at Public Offering Price (POP) reflect the deduction of the maximum initial sales charge and applicable CDSC, while Returns at Net Asset Value (NAV) do not.
After-tax returns are calculated using the highest historical individual federal income tax rate and do not reflect the impact of state and local taxes. Actual after-tax returns depend on a shareholder’s tax situation and may differ from those shown. After-tax returns are not relevant for shareholders who hold Fund shares in tax-deferred accounts or to shares held by non-taxable entities. Return After Taxes on Distributions for a period may be the same as Return Before Taxes for that period because no distributions were paid during that period, or because the taxable portion of distributions made during the period was insignificant. Also, Return After Taxes on Distributions and Sale of Fund Shares for a period may be greater than Return After Taxes on Distributions for the same period because of realized losses on the sale of Fund shares. Absent an allocation of certain expenses to the administrator, the returns would be lower.
Past performance is no guarantee of future results. Returns are historical and are calculated by determining the percentage change in net asset value or offering price (as applicable) with all distributions reinvested. Investment return and principal value will fluctuate so that shares, when redeemed, may be worth more or less than their original cost. Performance is for the stated time period only; due to market volatility, the Fund’s current performance may be lower or higher than the quoted return. For performance as of the most recent month end, please refer to www.eatonvance.com.
4
Eaton Vance Tax-Managed Dividend Income Fund as of October 31, 2006
FUND EXPENSES
Example: As a shareholder of the Fund, you incur two types of costs: (1) transaction costs, including sales charges (loads) on purchases and redemption fees (if applicable); and (2) ongoing costs, including management fees; distribution or service fees; and other Fund expenses. This Example is intended to help you understand your ongoing costs (in dollars) of investing in the Fund and to compare these costs with the ongoing costs of investing in other mutual funds. The Example is based on an investment of $1,000 invested at the beginning of the period and held for the entire period (May 1, 2006 – October 31, 2006).
Actual Expenses: The first section of the table below provides information about actual account values and actual expenses. You may use the information in this section, together with the amount you invested, to estimate the expenses that you paid over the period. Simply divide your account value by $1,000 (for example, an $8,600 account value divided by $1,000 = 8.6), then multiply the result by the number in the first section under the heading entitled "Expenses Paid During Period" to estimate the expenses you paid on your account during this period.
Hypothetical Example for Comparison Purposes: The second section of the table below provides information about hypothetical account values and hypothetical expenses based on the Fund's actual expense ratio and an assumed rate of return of 5% per year (before expenses), which is not the actual return of the Fund. The hypothetical account values and expenses may not be used to estimate the actual ending account balance or expenses you paid for the period. You may use this information to compare the ongoing costs of investing in your Fund and other funds. To do so, compare this 5% hypothetical example with the 5% hypothetical examples that appear in the shareholder reports of the other funds.
Please note that the expenses shown in the table are meant to highlight your ongoing costs only and do not reflect any transactional costs, such as sales charges (loads) or redemption fees (if applicable). Therefore, the second section of the table is useful in comparing ongoing costs only, and will not help you determine the relative total costs of owning different funds. In addition, if these transactional costs were included, your costs would have been higher.
Eaton Vance Tax-Managed Dividend Income Fund
| | | Beginning Account Value
(5/1/06) | | Ending Account Value
(10/31/06) | | Expenses Paid During Period*
(5/1/06 – 10/31/06) | |
| Actual | |
| Class A | | $ | 1,000.00 | | | $ | 1,061.40 | | | $ | 6.18 | | |
| Class B | | $ | 1,000.00 | | | $ | 1,057.60 | | | $ | 10.06 | | |
| Class C | | $ | 1,000.00 | | | $ | 1,057.60 | | | $ | 10.06 | | |
| Hypothetical | |
| (5% return per year before expenses) | |
| Class A | | $ | 1,000.00 | | | $ | 1,019.20 | | | $ | 6.06 | | |
| Class B | | $ | 1,000.00 | | | $ | 1,015.40 | | | $ | 9.86 | | |
| Class C | | $ | 1,000.00 | | | $ | 1,015.40 | | | $ | 9.86 | | |
* Expenses are equal to the Fund's annualized expense ratio of 1.19% for Class A shares, 1.94% for Class B shares and 1.94% for Class C shares, multiplied by the average account value over the period, multiplied by 184/365 (to reflect the one-half year period). The Example assumes that the $1,000 was invested at the net asset value per share determined at the close of business on April 30, 2006.
5
Eaton Vance Tax-Managed Dividend Income Fund as of October 31, 2006
PORTFOLIO OF INVESTMENTS
Common Stocks — 89.3%
| Security | | Shares | | Value | |
| Capital Markets — 4.2% | |
| Goldman Sachs Group, Inc. (The) | | | 100,000 | | | $ | 18,979,000 | | |
| UBS AG(1) | | | 600,000 | | | | 35,904,000 | | |
| | | $ | 54,883,000 | | |
| Commercial Banks — 8.0% | |
| National City Corp. | | | 350,000 | | | $ | 13,037,500 | | |
| Toronto-Dominion Bank, (The)(1) | | | 450,000 | | | | 26,068,500 | | |
| U.S. Bancorp | | | 250,000 | | | | 8,460,000 | | |
| Wachovia Corp. | | | 550,000 | | | | 30,525,000 | | |
| Wells Fargo & Co. | | | 700,000 | | | | 25,403,000 | | |
| | | $ | 103,494,000 | | |
| Communications Equipment — 1.5% | |
| Nokia Oyj ADR | | | 1,000,000 | | | $ | 19,880,000 | | |
| | | $ | 19,880,000 | | |
| Computer Peripherals — 1.4% | |
| International Business Machines Corp. | | | 200,000 | | | $ | 18,466,000 | | |
| | | $ | 18,466,000 | | |
| Diversified Financial Services — 7.2% | |
| Bank of America Corp. | | | 650,000 | | | $ | 35,015,500 | | |
| Citigroup, Inc. | | | 650,000 | | | | 32,604,000 | | |
| JPMorgan Chase & Co. | | | 550,000 | | | | 26,092,000 | | |
| | | $ | 93,711,500 | | |
| Diversified Telecommunication Services — 6.5% | |
| BellSouth Corp. | | | 750,000 | | | $ | 33,825,000 | | |
| Citizens Communications Co. | | | 1,500,000 | | | | 21,990,000 | | |
| Verizon Communications, Inc. | | | 750,000 | | | | 27,750,000 | | |
| | | $ | 83,565,000 | | |
| Electric Utilities — 7.9% | |
| CEZ AS(1) | | | 225,000 | | | $ | 8,894,132 | | |
| E.ON AG(1) | | | 100,000 | | | | 12,041,660 | | |
| Edison International | | | 550,000 | | | | 24,442,000 | | |
| FirstEnergy Corp. | | | 500,000 | | | | 29,425,000 | | |
| Fortum Oyj(1) | | | 600,000 | | | | 16,565,097 | | |
| Iberdrola SA(1) | | | 222,000 | | | | 10,174,899 | | |
| | | $ | 101,542,788 | | |
| Security | | Shares | | Value | |
| Electrical Equipment — 1.0% | |
| Emerson Electric Co. | | | 150,000 | | | $ | 12,660,000 | | |
| | | $ | 12,660,000 | | |
| Energy Equipment & Services — 0.7% | |
| GlobalSantaFe Corp.(1) | | | 175,000 | | | $ | 9,082,500 | | |
| | | $ | 9,082,500 | | |
| Food & Staples Retailing — 1.1% | |
| Wal-Mart Stores, Inc. | | | 300,000 | | | $ | 14,784,000 | | |
| | | $ | 14,784,000 | | |
| Food Products — 1.3% | |
| Nestle SA(1) | | | 50,000 | | | $ | 17,088,506 | | |
| | | $ | 17,088,506 | | |
| Hotels, Restaurants & Leisure — 2.0% | |
| McDonald's Corp. | | | 600,000 | | | $ | 25,152,000 | | |
| | | $ | 25,152,000 | | |
| Household Durables — 0.7% | |
| Stanley Works (The) | | | 200,000 | | | $ | 9,530,000 | | |
| | | $ | 9,530,000 | | |
| Household Products — 1.5% | |
| Kimberly-Clark Corp. | | | 150,000 | | | $ | 9,978,000 | | |
| Kimberly-Clark de Mexico SA de CV(1) | | | 2,250,000 | | | | 9,406,536 | | |
| | | $ | 19,384,536 | | |
Independent Power Producers &
Energy Traders — 2.4% | |
| TXU Corp. | | | 500,000 | | | $ | 31,565,000 | | |
| | | $ | 31,565,000 | | |
| Industrial Conglomerates — 1.9% | |
| General Electric Co. | | | 700,000 | | | $ | 24,577,000 | | |
| | | $ | 24,577,000 | | |
| Insurance — 4.1% | |
| Lincoln National Corp. | | | 250,000 | | | $ | 15,827,500 | | |
| St. Paul Travelers Cos., Inc. (The) | | | 500,000 | | | | 25,565,000 | | |
| Willis Group Holdings Ltd.(1) | | | 300,000 | | | | 11,409,000 | | |
| | | $ | 52,801,500 | | |
See notes to financial statements
6
Eaton Vance Tax-Managed Dividend Income Fund as of October 31, 2006
PORTFOLIO OF INVESTMENTS CONT'D
| Security | | Shares | | Value | |
| Metals & Mining — 3.1% | |
| Freeport-McMoRan Copper & Gold, Inc., Class B | | | 300,000 | | | $ | 18,144,000 | | |
| Nucor Corp. | | | 200,000 | | | | 11,682,000 | | |
| Southern Copper Corp. | | | 200,000 | | | | 10,276,000 | | |
| | | $ | 40,102,000 | | |
| Multiline Retail — 1.8% | |
| J.C. Penney Company, Inc. | | | 300,000 | | | $ | 22,569,000 | | |
| | | $ | 22,569,000 | | |
| Multi-Utilities — 1.9% | |
| RWE AG(1) | | | 150,000 | | | $ | 14,857,043 | | |
| Veolia Environnement(1) | | | 150,000 | | | | 9,179,706 | | |
| | | $ | 24,036,749 | | |
| Oil, Gas & Consumable Fuels — 12.0% | |
| BP PLC ADR | | | 250,000 | | | $ | 16,775,000 | | |
| ChevronTexaco Corp. | | | 400,000 | | | | 26,880,000 | | |
| ENI SpA ADR | | | 300,000 | | | | 18,213,000 | | |
| Exxon Mobil Corp. | | | 500,000 | | | | 35,710,000 | | |
| Marathon Oil Corp. | | | 300,000 | | | | 25,920,000 | | |
| Statoil ASA ADR | | | 450,000 | | | | 11,412,000 | | |
| Total SA ADR | | | 300,000 | | | | 20,442,000 | | |
| | | $ | 155,352,000 | | |
| Pharmaceuticals — 7.3% | |
| Eli Lilly & Co. | | | 400,000 | | | $ | 22,404,000 | | |
| GlaxoSmithKline PLC ADR | | | 300,000 | | | | 15,975,000 | | |
| Johnson & Johnson | | | 400,000 | | | | 26,960,000 | | |
| Pfizer, Inc. | | | 250,000 | | | | 6,662,500 | | |
| Wyeth | | | 450,000 | | | | 22,963,500 | | |
| | | $ | 94,965,000 | | |
| Real Estate Investment Trusts (REITs) — 2.7% | |
| Boston Properties, Inc. | | | 50,000 | | | $ | 5,341,500 | | |
| Equity Residential | | | 200,000 | | | | 10,922,000 | | |
| Host Hotels & Resorts, Inc. | | | 400,000 | | | | 9,224,000 | | |
| Simon Property Group, Inc. | | | 100,000 | | | | 9,710,000 | | |
| | | $ | 35,197,500 | | |
| Road & Rail — 1.5% | |
| Canadian National Railway Co.(1) | | | 400,000 | | | $ | 19,056,000 | | |
| | | $ | 19,056,000 | | |
| Security | | Shares | | Value | |
| Specialty Retail — 1.0% | |
| Kingfisher PLC(1) | | | 2,500,000 | | | $ | 12,538,700 | | |
| | | $ | 12,538,700 | | |
| Textiles, Apparel & Luxury Goods — 1.5% | |
| VF Corp. | | | 250,000 | | | $ | 19,002,500 | | |
| | | $ | 19,002,500 | | |
| Tobacco — 3.1% | |
| Altria Group, Inc. | | | 500,000 | | | $ | 40,665,000 | | |
| | | $ | 40,665,000 | | |
Total Common Stocks
(identified cost $983,238,153) | | $ | 1,155,651,779 | | |
| Preferred Stocks — 8.8% | |
| Security | | Shares | | Value | |
| Automobiles — 0.4% | |
| Porsche International Finance PLC, 7.20%(1)(2) | | | 55,000 | | | $ | 5,598,725 | | |
| | | $ | 5,598,725 | | |
| Commercial Banks — 2.5% | |
| Abbey National Capital Trust I, 8.963%(2)(4) | | | 47,500 | | | $ | 6,469,049 | | |
| Auction Pass-Through Trust 2006-5B - USB H, 9.81%(3)(4) | | | 40 | | | | 1,225,010 | | |
| Auction Pass-Through Trust 2006-6B - USB H, 9.45%(3)(4) | | | 40 | | | | 1,225,010 | | |
| DB Capital Funding VIII, 6.375% | | | 150,000 | | | | 3,825,000 | | |
| First Republic Bank, 6.25% | | | 95,000 | | | | 2,356,000 | | |
| First Republic Bank, 6.70% | | | 162,000 | | | | 4,064,580 | | |
| First Tennessee Bank, 6.22%(3)(4) | | | 2,250 | | | | 2,317,359 | | |
| HSBC Capital Funding LP., 10.176%(1)(2)(4) | | | 32,500 | | | | 4,939,938 | | |
| Royal Bank of Scotland Group PLC, 5.75%(1) | | | 71,000 | | | | 1,706,130 | | |
| Royal Bank of Scotland Group PLC, 6.40%(1) | | | 145,000 | | | | 3,706,200 | | |
| | | $ | 31,834,276 | | |
| Consumer Finance — 0.1% | |
| Ford Motor Credit Co., 7.375% | | | 40,000 | | | $ | 840,800 | | |
| | | $ | 840,800 | | |
| Diversified Financial Services — 1.0% | |
| Bank of America Corp., Series D, 6.204% | | | 200,000 | | | $ | 5,178,000 | | |
| ING Groep NV, 6.125%(1) | | | 242,000 | | | | 6,045,160 | | |
See notes to financial statements
7
Eaton Vance Tax-Managed Dividend Income Fund as of October 31, 2006
PORTFOLIO OF INVESTMENTS CONT'D
| Security | | Shares | | Value | |
| Diversified Financial Services (continued) | |
Structured Auction Rate Securities/Stock
Custodial-Receipts Merrill H, 6.15%(3)(4) | | | 2,100 | | | $ | 2,228,025 | | |
| | | $ | 13,451,185 | | |
| Food Products — 0.1% | |
| Ocean Spray Cranberries, Inc., 6.25%(3) | | | 13,250 | | | $ | 1,093,125 | | |
| | | $ | 1,093,125 | | |
| Gas Utilities — 0.2% | |
| Southern Union Co., 7.55% | | | 118,300 | | | $ | 3,089,996 | | |
| | | $ | 3,089,996 | | |
| Insurance — 2.6% | |
| Ace Ltd., 7.80%(1) | | | 45,500 | | | $ | 1,197,560 | | |
| Aegon NV, 6.50%(1) | | | 205,000 | | | | 5,241,850 | | |
| Arch Capital Group, Ltd., 7.875%(1) | | | 26,500 | | | | 679,990 | | |
| Arch Capital Group, Ltd., 8.00%(1) | | | 185,500 | | | | 4,869,375 | | |
| Endurance Specialty Holdings, Ltd., 7.75%(1) | | | 231,550 | | | | 5,927,680 | | |
| MetLife, Inc., 6.39% | | | 146,000 | | | | 3,796,000 | | |
| MetLife, Inc., 6.50% | | | 70,000 | | | | 1,820,000 | | |
| PartnerRe, Ltd., 6.50%(1) | | | 137,000 | | | | 3,411,300 | | |
| PartnerRe, Ltd., 6.75%(1) | | | 139,700 | | | | 3,555,365 | | |
| RenaissanceRe Holdings, Ltd., 6.08%(1) | | | 107,000 | | | | 2,493,100 | | |
| | | $ | 32,992,220 | | |
| Real Estate Investment Trusts (REITs) — 1.4% | |
| AMB Property Corp., 6.75% | | | 79,900 | | | $ | 2,010,284 | | |
| BRE Properties, Series D, 6.75% | | | 40,000 | | | | 996,000 | | |
| Duke Realty Corp., 6.95% | | | 120,000 | | | | 3,067,200 | | |
| Health Care Property, 7.10% | | | 150,000 | | | | 3,807,000 | | |
| Prologis Trust, 6.75% | | | 65,000 | | | | 1,638,000 | | |
| PS Business Parks, Inc., 7.00% | | | 50,000 | | | | 1,262,500 | | |
| PS Business Parks, Inc., 7.95% | | | 110,000 | | | | 2,883,100 | | |
| Vornado Realty Trust, 6.75% | | | 75,000 | | | | 1,875,000 | | |
| | | $ | 17,539,084 | | |
| Thrifts & Mortgage Finance — 0.5% | |
| Federal National Mortgage Association, Series K, 5.396% | | | 140,000 | | | $ | 7,035,000 | | |
| | | $ | 7,035,000 | | |
Total Preferred Stocks
(identified cost $110,473,783) | | $ | 113,474,411 | | |
| Short-Term Investments — 1.3% | |
| Security | | Principal
Amount
(000's omitted) | | Value | |
| Societe Generale Time Deposit, 5.31%, 11/1/06 | | $ | 16,408 | | | $ | 16,408,000 | | |
Total Short-Term Investments
(at amortized cost, $16,408,000) | | $ | 16,408,000 | | |
Total Investments — 99.4%
(identified cost $1,110,119,936) | | $ | 1,285,534,190 | | |
| Other Assets, Less Liabilities — 0.6% | | $ | 8,203,084 | | |
| Net Assets — 100.0% | | $ | 1,293,737,274 | | |
ADR - American Depository Receipt
(1) Foreign security.
(2) Security valued at fair value using methods determined in good faith by or at the direction of the Trustees.
(3) Security exempt from registration under Rule 144A of the Securities Act of 1933. These securities may be sold in transactions exempt from registration, normally to qualified institutional buyers. At October 31, 2006, the aggregate value of the securities is $8,088,529 or 0.6% of the Fund's net assets.
(4) Variable rate security. The stated interest rate represents the rate in effect at October 31, 2006.
See notes to financial statements
8
Eaton Vance Tax-Managed Dividend Income Fund as of October 31, 2006
PORTFOLIO OF INVESTMENTS CONT'D
Country Concentration of Portfolio
| Country | | Percentage of
Total Investments | | Value | |
| United States | | | 79.7 | % | | $ | 1,023,895,538 | | |
| Switzerland | | | 4.1 | | | | 52,992,506 | | |
| Canada | | | 3.5 | | | | 45,124,500 | | |
| Bermuda | | | 2.5 | | | | 32,345,810 | | |
| Germany | | | 2.1 | | | | 26,898,703 | | |
| United Kingdom | | | 1.8 | | | | 22,890,968 | | |
| Finland | | | 1.3 | | | | 16,565,097 | | |
| Netherlands | | | 0.9 | | | | 11,287,010 | | |
| Cayman Islands | | | 0.8 | | | | 10,280,060 | | |
| Spain | | | 0.8 | | | | 10,174,899 | | |
| Mexico | | | 0.7 | | | | 9,406,536 | | |
| France | | | 0.7 | | | | 9,179,706 | | |
| Czech Republic | | | 0.7 | | | | 8,894,132 | | |
| Ireland | | | 0.4 | | | | 5,598,725 | | |
| Total | | | 100.0 | % | | $ | 1,285,534,190 | | |
See notes to financial statements
9
Eaton Vance Tax-Managed Dividend Income Fund as of October 31, 2006
FINANCIAL STATEMENTS
Statement of Assets and Liabilities
As of October 31, 2006
| Assets | |
| Investments, at value (identified cost, $1,110,119,936) | | $ | 1,285,534,190 | | |
| Cash | | | 954 | | |
| Receivable for investments sold | | | 12,708,089 | | |
| Receivable for Fund shares sold | | | 10,898,228 | | |
| Dividends and interest receivable | | | 2,846,507 | | |
| Tax reclaim receivable | | | 113,432 | | |
| Total assets | | $ | 1,312,101,400 | | |
| Liabilities | |
| Payable for investments purchased | | $ | 14,887,860 | | |
| Payable for Fund shares redeemed | | | 1,706,181 | | |
| Payable to affiliate for distribution and service fees | | | 650,045 | | |
| Payable to affiliate for investment advisory fees | | | 620,725 | | |
| Payable to affiliate for administration fees | | | 157,549 | | |
| Payable to affiliate for Trustees' fees | | | 1,133 | | |
| Accrued expenses | | | 340,633 | | |
| Total liabilities | | $ | 18,364,126 | | |
| Net Assets | | $ | 1,293,737,274 | | |
| Sources of Net Assets | |
| Paid-in capital | | $ | 1,149,995,479 | | |
| Accumulated net realized loss (computed on the basis of identified cost) | | | (38,955,634 | ) | |
| Accumulated undistributed net investment income | | | 7,267,903 | | |
| Net unrealized appreciation (computed on the basis of identified cost) | | | 175,429,526 | | |
| Total | | $ | 1,293,737,274 | | |
| Class A Shares | |
| Net Assets | | $ | 659,949,547 | | |
| Shares Outstanding | | | 49,250,699 | | |
Net Asset Value and Redemption Price Per Share
(net assets ÷ shares of beneficial interest outstanding) | | $ | 13.40 | | |
Maximum Offering Price Per Share
(100 ÷ 94.25 of $13.40) | | $ | 14.22 | | |
| Class B Shares | |
| Net Assets | | $ | 143,731,310 | | |
| Shares Outstanding | | | 10,750,714 | | |
Net Asset Value, Offering Price and Redemption Price Per Share
(net assets ÷ shares of beneficial interest outstanding) | | $ | 13.37 | | |
| Class C Shares | |
| Net Assets | | $ | 490,056,417 | | |
| Shares Outstanding | | | 36,647,620 | | |
Net Asset Value, Offering Price and Redemption Price Per Share
(net assets ÷ shares of beneficial interest outstanding) | | $ | 13.37 | | |
| On sales of $50,000 or more, the offering price of Class A shares is reduced. | |
Statement of Operations
| Investment Income | | Period Ended
October 31, 2006(1) | | Year Ended
April 30, 2006 | |
Dividends (net of foreign taxes, $761,373
and $1,839,086, respectively) | | $ | 25,459,389 | | | $ | 57,850,384 | | |
| Interest | | | 449,562 | | | | 408,310 | | |
| Total investment income | | $ | 25,908,951 | | | $ | 58,258,694 | | |
| Expenses | |
| Investment adviser fee | | $ | 3,346,304 | | | $ | 4,380,016 | | |
| Administration fee | | | 790,226 | | | | 1,010,657 | | |
| Trustees' fees and expenses | | | 11,386 | | | | 22,566 | | |
| Distribution and service fees | |
| Class A | | | 658,646 | | | | 791,449 | | |
| Class B | | | 635,212 | | | | 981,272 | | |
| Class C | | | 1,998,375 | | | | 2,590,647 | | |
| Transfer and dividend disbursing agent fees | | | 381,817 | | | | 506,323 | | |
| Custodian fee | | | 161,990 | | | | 353,449 | | |
| Legal and accounting services | | | 67,060 | | | | 49,090 | | |
| Registration fees | | | 61,353 | | | | 120,053 | | |
| Printing and postage | | | 56,279 | | | | 66,440 | | |
| Miscellaneous | | | 72,488 | | | | 42,966 | | |
| Total expenses | | $ | 8,241,136 | | | $ | 10,914,928 | | |
Deduct —
Reduction of custodian fee | | $ | 6,347 | | | $ | 11,462 | | |
| Reduction of investment advisory fee | | | — | | | | 67,418 | | |
| Total expense reductions | | $ | 6,347 | | | $ | 78,880 | | |
| Net expenses | | $ | 8,234,789 | | | $ | 10,836,048 | | |
| Net investment income | | $ | 17,674,162 | | | $ | 47,422,646 | | |
| Realized and Unrealized Gain (Loss) | |
Net realized gain (loss) —
Investment transactions (identified cost basis) | | $ | (32,073,633 | ) | | $ | (5,869,280 | ) | |
| Foreign currency transactions | | | (86,078 | ) | | | (426,079 | ) | |
| Net realized loss | | $ | (32,159,711 | ) | | $ | (6,295,359 | ) | |
Change in unrealized appreciation (depreciation) —
Investments (identified cost basis) | | $ | 85,267,150 | | | $ | 60,865,840 | | |
| Foreign currency | | | (117,718 | ) | | | 126,025 | | |
Net change in unrealized appreciation
(depreciation) | | $ | 85,149,432 | | | $ | 60,991,865 | | |
| Net realized and unrealized gain | | $ | 52,989,721 | | | $ | 54,696,506 | | |
| Net increase in net assets from operations | | $ | 70,663,883 | | | $ | 102,119,152 | | |
(1) For the six months ended October 31, 2006.
See notes to financial statements
10
Eaton Vance Tax-Managed Dividend Income Fund as of October 31, 2006
FINANCIAL STATEMENTS CONT'D
Statements of Changes in Net Assets
| Increase (Decrease) in Net Assets | | Period Ended
October 31, 2006(1) | | Year Ended
April 30, 2006 | | Year Ended
April 30, 2005 | |
From operations —
Net investment income | | $ | 17,674,162 | | | $ | 47,422,646 | | | $ | 20,653,197 | | |
| Net realized loss from investment transactions and foreign currency | | | (32,159,711 | ) | | | (6,295,359 | ) | | | (2,129,197 | ) | |
| Net change in unrealized appreciation (depreciation) of investments and foreign currency | | | 85,149,432 | | | | 60,991,865 | | | | 27,134,694 | | |
| Net increase in net assets from operations | | $ | 70,663,883 | | | $ | 102,119,152 | | | $ | 45,658,694 | | |
Distributions to shareholders —
From net investment income
Class A | | $ | (14,892,374 | ) | | $ | (16,854,194 | ) | | $ | (7,435,167 | ) | |
| Class B | | | (3,116,092 | ) | | | (4,458,473 | ) | | | (2,537,028 | ) | |
| Class C | | | (9,831,898 | ) | | | (11,849,664 | ) | | | (5,638,474 | ) | |
| Total distributions to shareholders | | $ | (27,840,364 | ) | | $ | (33,162,331 | ) | | $ | (15,610,669 | ) | |
Transactions in shares of beneficial interest —
Proceeds from sale of shares
Class A | | $ | 211,021,600 | | | $ | 251,392,106 | | | $ | 125,098,185 | | |
| Class B | | | 26,571,508 | | | | 42,104,047 | | | | 38,656,600 | | |
| Class C | | | 139,299,888 | | | | 162,588,198 | | | | 89,783,302 | | |
| Net asset value of shares issued to shareholders in payment of distributions declared | |
| Class A | | | 9,886,452 | | | | 11,286,235 | | | | 4,995,133 | | |
| Class B | | | 1,971,057 | | | | 2,821,775 | | | | 1,573,826 | | |
| Class C | | | 5,144,929 | | | | 6,109,408 | | | | 2,801,624 | | |
| Cost of shares redeemed | |
| Class A | | | (37,791,536 | ) | | | (60,580,545 | ) | | | (31,957,287 | ) | |
| Class B | | | (7,675,616 | ) | | | (12,211,050 | ) | | | (6,044,426 | ) | |
| Class C | | | (21,329,327 | ) | | | (29,585,505 | ) | | | (11,250,437 | ) | |
| Net asset value of shares exchanged | |
| Class A | | | 1,952,983 | | | | 2,017,596 | | | | 412,800 | | |
| Class B | | | (1,952,983 | ) | | | (2,017,596 | ) | | | (412,800 | ) | |
| Net increase in net assets from Fund share transactions | | $ | 327,098,955 | | | $ | 373,924,669 | | | $ | 213,656,520 | | |
| Net increase in net assets | | $ | 369,922,474 | | | $ | 442,881,490 | | | $ | 243,704,545 | | |
| Net Assets | |
| At beginning of period | | $ | 923,814,800 | | | $ | 480,933,310 | | | $ | 237,228,765 | | |
| At end of period | | $ | 1,293,737,274 | | | $ | 923,814,800 | | | $ | 480,933,310 | | |
Accumulated undistributed net investment
income included in net assets | |
| At end of period | | $ | 7,267,903 | | | $ | 17,520,182 | | | $ | 5,284,430 | | |
(1) For the six months ended October 31, 2006.
See notes to financial statements
11
Eaton Vance Tax-Managed Dividend Income Fund as of October 31, 2006
FINANCIAL STATEMENTS CONT'D
Financial Highlights
| | | Class A | |
| | | Period Ended | | Year Ended April 30, | | Period Ended | |
| | | October 31, 2006(1) | | 2006 | | 2005 | | April 30, 2004(2) | |
| Net asset value — Beginning of period | | $ | 12.990 | | | $ | 11.820 | | | $ | 10.640 | | | $ | 10.000 | | |
| Income (loss) from operations | |
| Net investment income(3) | | $ | 0.239 | | | $ | 0.922 | | | $ | 0.743 | | | $ | 0.500 | | |
| Net realized and unrealized gain | | | 0.534 | | | | 0.889 | | | | 0.989 | | | | 0.437 | | |
| Total income from operations | | $ | 0.773 | | | $ | 1.811 | | | $ | 1.732 | | | $ | 0.937 | | |
| Less distributions | |
| From net investment income | | $ | (0.363 | ) | | $ | (0.641 | ) | | $ | (0.552 | ) | | $ | (0.297 | ) | |
| Total distributions | | $ | (0.363 | ) | | $ | (0.641 | ) | | $ | (0.552 | ) | | $ | (0.297 | ) | |
| Net asset value — End of period | | $ | 13.400 | | | $ | 12.990 | | | $ | 11.820 | | | $ | 10.640 | | |
| Total Return(4) | | | 6.14 | % | | | 15.78 | % | | | 16.54 | % | | | 9.44 | % | |
| Ratios/Supplemental Data | |
| Net assets, end of period (000's omitted) | | $ | 659,950 | | | $ | 452,785 | | | $ | 215,759 | | | $ | 104,169 | | |
| Ratios (As a percentage of average daily net assets): | |
| Expenses before custodian fee reduction(5) | | | 1.19 | %(6) | | | 1.21 | % | | | 1.25 | % | | | 1.40 | %(6) | |
| Expenses after custodian fee reduction(5) | | | 1.19 | %(6) | | | 1.21 | % | | | 1.25 | % | | | 1.40 | %(6) | |
| Net investment income | | | 3.69 | %(6) | | | 7.49 | % | | | 6.46 | % | | | 5.05 | %(6) | |
| Portfolio Turnover | | | 46 | % | | | 247 | % | | | 162 | % | | | 117 | % | |
(1) For the six month period ended October 31, 2006. During the current period, Fund changed its fiscal year end from April 30 to October 31.
(2) For the period from the start of business, May 30, 2003 to April 30, 2004.
(3) Net investment income per share was computed using average shares outstanding.
(4) Returns are historical and are calculated by determining the percentage change in net asset value with all distributions reinvested. Total return is not computed on an annualized basis.
(5) The investment adviser waived a portion of its advisory fee and/or the administrator subsized certain operating expenses (equal to 0.01%, 0.01% and 0.07% of average daily net assets for the fiscal years ended April 30, 2006, 2005 and 2004, respectively).
(6) Annualized.
See notes to financial statements
12
Eaton Vance Tax-Managed Dividend Income Fund as of October 31, 2006
FINANCIAL STATEMENTS CONT'D
Financial Highlights
| | | Class B | |
| | | Period Ended | | Year Ended April 30, | | Period Ended | |
| | | October 31, 2006(1) | | 2006 | | 2005 | | April 30, 2004(2) | |
| Net asset value — Beginning of period | | $ | 12.960 | | | $ | 11.790 | | | $ | 10.630 | | | $ | 10.000 | | |
| Income (loss) from operations | |
| Net investment income(3) | | $ | 0.200 | | | $ | 0.801 | | | $ | 0.648 | | | $ | 0.427 | | |
| Net realized and unrealized gain | | | 0.526 | | | | 0.919 | | | | 0.986 | | | | 0.446 | | |
| Total income from operations | | $ | 0.726 | | | $ | 1.720 | | | $ | 1.634 | | | $ | 0.873 | | |
| Less distributions | |
| From net investment income | | $ | (0.316 | ) | | $ | (0.550 | ) | | $ | (0.474 | ) | | $ | (0.243 | ) | |
| Total distributions | | $ | (0.316 | ) | | $ | (0.550 | ) | | $ | (0.474 | ) | | $ | (0.243 | ) | |
| Net asset value — End of period | | $ | 13.370 | | | $ | 12.960 | | | $ | 11.790 | | | $ | 10.630 | | |
| Total Return(4) | | | 5.76 | % | | | 14.97 | % | | | 15.57 | % | | | 8.79 | % | |
| Ratios/Supplemental Data | |
| Net assets, end of period (000's omitted) | | $ | 143,731 | | | $ | 120,272 | | | $ | 79,871 | | | $ | 40,731 | | |
| Ratios (As a percentage of average daily net assets): | |
| Expenses before custodian fee reduction(5) | | | 1.94 | %(6) | | | 1.96 | % | | | 2.00 | % | | | 2.15 | %(6) | |
| Expenses after custodian fee reduction(5) | | | 1.94 | %(6) | | | 1.96 | % | | | 2.00 | % | | | 2.15 | %(6) | |
| Net investment income | | | 3.11 | %(6) | | | 6.53 | % | | | 5.65 | % | | | 4.31 | %(6) | |
| Portfolio Turnover | | | 46 | % | | | 247 | % | | | 162 | % | | | 117 | % | |
(1) For the six month period ended October 31, 2006. During the current period, the Fund changed its fiscal year end from April 30 to October 31.
(2) For the period from the start of business, May 30, 2003, to April 30, 2004.
(3) Net investment income per share was computed using average shares outstanding.
(4) Returns are historical and are calculated by determining the percentage change in net asset value with all distributions reinvested. Total return is not computed on an annualized basis.
(5) The investment adviser waived a portion of its advisory fee and/or the administrator subsized certain operating expenses (equal to 0.01%, 0.01% and 0.07% of average daily net assets for the fiscal years ended April 30, 2006, 2005 and 2004, respectively).
(6) Annualized.
See notes to financial statements
13
Eaton Vance Tax-Managed Dividend Income Fund as of October 31, 2006
FINANCIAL STATEMENTS CONT'D
Financial Highlights
| | | Class C | |
| | | Period Ended | | Year Ended April 30, | | Period Ended | |
| | | October 31, 2006(1) | | 2006 | | 2005 | | April 30, 2004(2) | |
| Net asset value — Beginning of period | | $ | 12.960 | | | $ | 11.800 | | | $ | 10.630 | | | $ | 10.000 | | |
| Income (loss) from operations | |
| Net investment income(3) | | $ | 0.192 | | | $ | 0.817 | | | $ | 0.653 | | | $ | 0.432 | | |
| Net realized and unrealized gain | | | 0.534 | | | | 0.893 | | | | 0.991 | | | | 0.441 | | |
| Total income from operations | | $ | 0.726 | | | $ | 1.710 | | | $ | 1.644 | | | $ | 0.873 | | |
| Less distributions | |
| From net investment income | | $ | (0.316 | ) | | $ | (0.550 | ) | | $ | (0.474 | ) | | $ | (0.243 | ) | |
| Total distributions | | $ | (0.316 | ) | | $ | (0.550 | ) | | $ | (0.474 | ) | | $ | (0.243 | ) | |
| Net asset value — End of period | | $ | 13.370 | | | $ | 12.960 | | | $ | 11.800 | | | $ | 10.630 | | |
| Total Return(4) | | | 5.76 | % | | | 14.87 | % | | | 15.66 | % | | | 8.79 | % | |
| Ratios/Supplemental Data | |
| Net assets, end of period (000's omitted) | | $ | 490,056 | | | $ | 350,758 | | | $ | 185,303 | | | $ | 92,329 | | |
| Ratios (As a percentage of average daily net assets): | |
| Expenses before custodian fee reduction(5) | | | 1.94 | %(6) | | | 1.96 | % | | | 2.00 | % | | | 2.15 | %(6) | |
| Expenses after custodian fee reduction(5) | | | 1.94 | %(6) | | | 1.96 | % | | | 2.00 | % | | | 2.15 | %(6) | |
| Net investment income | | | 2.98 | %(6) | | | 6.65 | % | | | 5.69 | % | | | 4.34 | %(6) | |
| Portfolio Turnover | | | 46 | % | | | 247 | % | | | 162 | % | | | 117 | % | |
(1) For the six month period ended October 31, 2006. During the current period, the Fund changed its fiscal year end from April 30 to October 31.
(2) For the period from the start of business, May 30, 2003 to April 30, 2004.
(3) Net investment income per share was computed using average shares outstanding.
(4) Returns are historical and are calculated by determining the percentage change in net asset value with all distributions reinvested. Total return is not computed on an annualized basis.
(5) The investment adviser waived a portion of its advisory fee and/or the administrator subsized certain operating expenses (equal to 0.01%, 0.01% and 0.07% of average daily net assets for the fiscal fiscal years ended April 30, 2006, 2005 and 2004, respectively).
(6) Annualized.
See notes to financial statements
14
Eaton Vance Tax-Managed Dividend Income Fund as of October 31, 2006
NOTES TO FINANCIAL STATEMENTS
1 Significant Accounting Policies
Eaton Vance Tax-Managed Dividend Income Fund (the Fund) is a diversified series of Eaton Vance Mutual Funds Trust (the Trust). The Trust is an entity of the type commonly known as a Massachusetts business trust and is registered under the Investment Company Act of 1940, as amended, as an open-end management investment company. The Fund seeks to achieve after-tax total return by investing primarily in a diversified portfolio of common and preferred stocks that pay dividends that qualify for federal income taxation at long–term capital gains rates ("tax-favored dividends"). The Fund offers three classes of shares. Class A shares are generally sold subject to a sales charge imposed at time of purchase. Class B and Class C shares are sold at net asset value and are subject to a contingent deferred sales charge (see Note 6). Class B shares held for eight years will automatically convert to Class A shares. Each class represents a pro rata interest in the Fund, but votes separately on class-specific matters and (as noted below) is subject to different expenses. Realized and unrealized gains and losses and net investment income and losses, other than class specific expenses, are allocated daily to each class of shares based on the relative net assets of each class to the total net assets of the Fund. Each class of shares differs in its distribution plan and certain other class specific expenses.
The following is a summary of significant accounting policies consistently followed by the Fund in the preparation of its financial statements. The policies are in conformity with accounting principles generally accepted in the United States of America.
A Investment Valuation — Securities listed on a U.S. securities exchange generally are valued at the last sale price on the day of valuation or, if no sales took place on such date, at the mean between the closing bid and asked prices therefore on the exchange where such securities are principally traded. Equity securities listed on the NASDAQ National Market System generally are valued at the official NASDAQ closing price. Unlisted or listed securities for which closing sales prices or closing quotations are not available are valued at the mean between the latest available bid and asked prices or, in the case of preferred equity securities that are not listed or traded in the over-the-counter market, by an independent pricing service. The value of preferred equity securi ties that are valued by a pricing service on a bond basis will be adjusted by an income factor, to be determined by the investment adviser, to reflect the next anticipated regular dividend. Exchange-traded options are valued at the last sale price for the day of valuation as quoted on the principal exchange or board of trade on which the options are traded or, in the absence of sales on such date, at the mean between the latest bid and asked prices therefore. Futures positions on securities and currencies generally are valued at closing settlement prices. Short-term debt securities with a remaining maturity of 60 days or less are valued at amortized cost. If short-term debt securities are acquired with a remaining maturity of more than 60 days, they will be valued by a pricing service. Other fixed income and debt securities, including listed securities and securities for which price quotations are available, will normally be valued on th e basis of valuations furnished by a pricing service. Foreign securities and currencies are valued in U.S. dollars, based on foreign currency exchange rate quotations supplied by an independent quotation service. The daily valuation of exchange-traded foreign securities generally is determined as of the close of trading on the principal exchange on which such securities trade. Events occurring after the close of trading on foreign exchanges may result in adjustments to the valuation of foreign securities to more accurately reflect their fair value as of the close of regular trading on the New York Stock Exchange. When valuing foreign equity securities that meet certain criteria, the Trustees have approved the use of a fair value service that values such securities to reflect market trading that occurs after the close of the applicable foreign markets of comparable securities or other instruments that have a strong correlation to the fair-valued securities. Investments held by the Fund for which valuations or market quotations are unavailable are valued at fair value using methods determined in good faith by or at the direction of the Trustees of the Fund considering relevant factors, data and information including the market value of freely tradable securities of the same class in the principal market on which such securities are normally traded.
B Income — Dividend income is recorded on the ex-dividend date for dividends received in cash and/or securities. However, if the ex-dividend date has passed, certain dividends from foreign securities are recorded as the Fund is informed of the ex-dividend date. Withholding taxes on foreign dividends and capital gains have been provided for in accordance with the Fund's understanding of the applicable countries' tax rules and rates. Interest income is recorded on the accrual basis.
C Expenses — The majority of expenses of the Trust are directly identifiable to an individual fund. Expenses which are not readily identifiable to a specific fund are allocated taking into consideration, among other things,
Eaton Vance Tax-Managed Dividend Income Fund as of October 31, 2006
NOTES TO FINANCIAL STATEMENTS CONT'D
the nature and type of expense and the relative size of the funds.
D Federal Taxes — The Fund's policy is to comply with the provisions of the Internal Revenue Code applicable to regulated investment companies and to distribute to shareholders each year all of its taxable income, including any net realized capital gain on investments. Accordingly, no provision for federal income or excise tax is necessary. At October 31, 2006, the Fund, for federal income tax purposes, had a capital loss carryover of $38,835,761 which will reduce the taxable income arising from future net realized gain in investments, if any, to the extent permitted by the Internal Revenue Code and thus will reduce the amount of distributions to shareholders which would otherwise be necessary to relieve the Fund of any liability for federal income or excise tax. Such cap ital loss carryover will expire on: October 31, 2011 ($252,492), October 31, 2012 ($2,039,433), October 31, 2013 ($4,586,180) and October 31, 2014 ($31,957,656).
E Expense Reduction — Investors Bank & Trust Company (IBT) serves as custodian of the Fund. Pursuant to the custodian agreement, IBT receives a fee reduced by credits which are determined based on the average daily cash balance the Fund maintains with IBT. All credit balances used to reduce the Fund's custodian fees are reported as a reduction of expenses in the Statements of Operations.
F Financial Futures Contracts — Upon entering a financial futures contract, the Fund is required to deposit (initial margin) either in cash or securities an amount equal to a certain percentage of the purchase price indicated in the financial futures contract. Subsequent payments are made or received by the Fund (margin maintenance) each day, dependent on the daily fluctuations in the value of the underlying security, and are recorded for book purposes as unrealized gains or losses by the Fund. The Fund's investment in financial futures contracts is designed to hedge against anticipated future changes in price of current or anticipated Fund positions. Should prices move unexpectedly, the Fund may not achieve the anticipated benefits of the financial futures contracts and may realize a loss.
G Foreign Currency Translation — Investment valuations, other assets, and liabilities initially expressed in foreign currencies are converted each business day into U.S. dollars based upon current exchange rates. Purchases and sales of foreign investment securities and income and expenses are converted into U.S. dollars based upon currency exchange rates prevailing on the respective dates of such transactions. Recognized gains or losses on investment transactions attributable to changes in foreign currency exchange rates are recorded for financial statement purposes as net realized gains and losses on investments. That portion of unrealized gains and losses on investments that results from fluctuation s in foreign currency exchange rates is not separately disclosed.
H Purchased Options — Upon the purchase of a put option by the Fund, the premium paid is recorded as an investment, the value of which is marked-to-market daily. When a purchased option expires, the Fund will realize a loss in the amount of the cost of the option. When the Fund enters into a closing sale transaction, the Fund will realize a gain or loss depending on whether the sales proceeds from the closing sale transaction are greater or less than the cost of the option. When the Fund exercises a put option, settlement is made in cash. The risk associated with purchasing options is limited to the premium originally paid.
I Securities Sold Short — The Fund may sell individual securities short if it owns at least an equal amount of the security sold short or has at the time of sale a right to obtain securities equivalent in kind and amount to the securities sold and provided that, if such right is conditional, the sale is made upon the same conditions (a covered short sale). The Fund may sell short securities representing an index or basket of securities whose constituents the Fund holds in whole or in part. A short sale of an index or basket security will be a covered short sale if the underlying index or basket of securities is the same or substantially identical to securities held by the Fund.
The seller of a short position generally realizes a profit on the transaction if the price it receives on the short sale exceeds the cost of closing out the position by purchasing securities in the market, but generally realizes a loss if the cost of closing out the short position exceeds the proceeds of the short sale. The exposure to loss on covered short sales (to the extent the value of the security sold short rises instead of falls) is offset by the increase in the value of the underlying security or securities retained. The profit or loss on a covered short sale is also affected by the borrowing cost of any securities borrowed in connection with the short sale (which will vary with market conditions) and use of the proceeds of the short sale. The Fund expects normally to close its covered short sales by delivering newly-acquired stock.
Eaton Vance Tax-Managed Dividend Income Fund as of October 31, 2006
NOTES TO FINANCIAL STATEMENTS CONT'D
Exposure to loss on an index or basket security sold short will not be offset by gains on other securities holdings to the extent that the constituent securities of the index or basket security sold short are not held by the Fund. Such losses may be substantial.
J Use of Estimates — The preparation of the financial statements in conformity with accounting principles generally accepted in the United States of America requires management to make estimates and assumptions that affect the reported amounts of assets and liabilities at the date of the financial statements and the reported amounts of income and expense during the reporting period. Actual results could differ from those estimates.
K Indemnifications — Under the Trust's organizational documents, its officers and Trustees may be indemnified against certain liabilities and expenses arising out of the performance of their duties to the Fund, and shareholders are indemnified against personal liability for the obligations of the Trust. Additionally, in the normal course of business, the Fund enters into agreements with service providers that may contain indemnification clauses. The Fund's maximum exposure under these arrangements is unknown as this would involve future claims that may be made against the Fund that have not yet occurred.
L Other — Investment transactions are accounted for on the date the securities are purchased or sold. Realized gains and losses on securities sold are determined on the basis of identified cost.
2 Distribution to Shareholders
It is the present policy of the Fund to make monthly dividend distributions to shareholders and at least one distribution annually of all or substantially all of its net realized capital gains, if any (reduced by available capital loss carryforwards from prior years, if any). Distributions are declared separately for each class of shares. Distributions are paid in the form of additional shares of the same class of the Fund or, at the election of the shareholder, in cash. Shareholders may reinvest all distributions in additional shares of the same class of the Fund at the net asset value as of the close of business on the ex-dividend date. The Fund distinguishes between distributions on a tax basis and a financial reporting basis. Accounting principles generally accepted in the United States of America require that only distributions in excess of tax basis ea rnings and profits be reported in the financial statements as a return of capital. Permanent differences between book and tax accounting relating to distributions are reclassified to paid-in capital.
The tax character of distributions paid for the period from May 1, 2006 to October 31, 2006 and the years ended April 30, 2006 and April 30, 2005 was as follows:
| | | Year Ended | |
| | | October 31, 2006 | | April 30, 2006 | | April 30, 2005 | |
| Distributions declared from: | | | | | | | |
|
| Ordinary income | | $ | 27,840,364 | | | $ | 33,162,331 | | | $ | 15,610,669 | | |
|
During the period from May 1, 2006 to October 31, 2006, accumulated undistributed net investment income was decreased by $86,077 and accumulated net realized loss was decreased by $86,077 primarily due to differing treatment of certain dividends received from the Fund's investment in Real Estate Investment Trusts (REITs). This change had no effect on the net assets or the net asset value per share.
As of October 31, 2006, the components of distributable earnings (accumulated losses) on a tax basis were as follows:
| Undistributed income | | $ | 7,140,643 | | |
| Capital loss carryforwards | | $ | (38,835,761 | ) | |
| Unrealized gain | | $ | 175,436,913 | | |
3 Shares of Beneficial Interest
The Agreement and Declaration of Trust permits the Trustees to issue an unlimited number of full and fractional shares of beneficial interest (without par value). Transactions in shares were as follows:
| Class A | | Period Ended
October 31,
2006(1) | | Year Ended
April 30,
2006 | | Year Ended
April 30,
2005 | |
| Sales | | | 16,412,434 | | | | 20,439,240 | | | | 10,852,656 | | |
Issued to shareholders electing
to receive payments of
distributions in Fund shares | | | 776,077 | | | | 918,038 | | | | 431,760 | | |
| Redemptions | | | (2,959,859 | ) | | | (4,913,417 | ) | | | (2,847,599 | ) | |
| Exchanges from Class B shares | | | 154,366 | | | | 163,619 | | | | 35,461 | | |
| Net increase | | | 14,383,018 | | | | 16,607,480 | | | | 8,472,278 | | |
Eaton Vance Tax-Managed Dividend Income Fund as of October 31, 2006
NOTES TO FINANCIAL STATEMENTS CONT'D
| Class B | | Period Ended
October 31,
2006(1) | | Year Ended
April 30,
2006 | | Year Ended
April 30,
2005 | |
| Sales | | | 2,071,311 | | | | 3,436,193 | | | | 3,368,539 | | |
Issued to shareholders electing
to receive payments of
distributions in Fund shares | | | 155,293 | | | | 230,280 | | | | 136,088 | | |
| Redemptions | | | (602,906 | ) | | | (993,777 | ) | | | (528,003 | ) | |
| Exchanges to Class A shares | | | (154,674 | ) | | | (163,946 | ) | | | (35,527 | ) | |
| Net increase | | | 1,469,024 | | | | 2,508,750 | | | | 2,941,097 | | |
| Class C | | Period Ended
October 31,
2006(1) | | Year Ended
April 30,
2006 | | Year Ended
April 30,
2005 | |
| Sales | | | 10,852,246 | | | | 13,261,839 | | | | 7,760,896 | | |
Issued to shareholders electing
to receive payments of
distributions in Fund shares | | | 404,714 | | | | 497,886 | | | | 242,047 | | |
| Redemptions | | | (1,671,681 | ) | | | (2,407,104 | ) | | | (978,209 | ) | |
| Net increase | | | 9,585,279 | | | | 11,352,621 | | | | 7,024,734 | | |
(1) For the period from May 1, 2006 to October 31, 2006.
4 Investment Adviser Fee and Other Transactions with Affiliates
The investment adviser fee is earned by Eaton Vance Management (EVM), as compensation for management and investment advisory services rendered to the Fund. Under the advisory agreement, EVM receives a monthly advisory fee equal to 0.650% annually of average daily net assets of the Fund up to $500 million, and at reduced rates as daily net assets exceed that level. The Fund's advisory fee was 0.61% of the Fund's average daily net assets for the period ended October 31, 2006 and the year ended Apri 30, 2006. For the period from May 1, 2006 to October 31, 2006, the advisory fee amounted to $3,346,304. For the year ended April 30, 2006, the advisory fee amounted to $4,380,016. EVM has agreed to reduce the investment adviser fee by an amount equal to that portion of commissions paid to broker dealers in execution of Fund portfolio transactions that is consideration for third-party research services. For the period from May 1, 2006 to October 31, 2006, EVM did not waive any of its advisory fee. For the year ended April 30, 2006, EVM waived $67,418 of its advisory fee. An administration fee is earned by EVM for managing and administering the business affairs of the Fund. Under the administration agreement, EVM earns a fee in the amount of 0.15% per annum of the average daily net assets of the Fund. For the period from May 1, 2006 to October 31, 2006, the administration fee amounted to $790,226. For the year ended April 30, 2006, the administration fee amounted to $1,010,657.
Except for Trustees of the Fund who are not members of EVM's organization, officers and Trustees receive remuneration for their services to the Fund out of the investment adviser fee earned by EVM. Trustees of the Fund who are not affiliated with EVM may elect to defer receipt of all or a percentage of their annual fees in accordance with the terms of the Trustees Deferred Compensation Plan. For the period from May 1, 2006 to October 31, 2006 and the year ended April 30, 2006, no significant amounts have been deferred.
EVM serves as the sub-transfer agent of the Fund and receives from the transfer agent an aggregate fee based upon the actual expenses incurred by EVM in the performance of those activities. For the period from May 1, 2006 to October 31, 2006 and the year ended April 30, 2006, EVM received $36,216 and $30,576 in sub-transfer agent fees, respectively.
Eaton Vance Distributors, Inc. (EVD), a subsidiary of EVM and the Fund's principal underwriter, received $569,929 and $666,228 as its portion of the sales charge on sales of Class A shares for the period from May 1, 2006 to October 31, 2006 and the year ended April 30, 2006, respectively.
Certain officers and Trustees of the Fund are officers of the above organizations.
5 Distribution Plans
Class A has in effect a distribution plan pursuant to Rule 12b-1 under the Investment Company Act of 1940 (Class A Plan). The Class A Plan provides that the Fund will pay EVD a distribution and service fee of 0.25% of the Fund's average daily net assets attributable to Class A shares for each fiscal year for distribution services and facilities provided to the Fund by EVD, as well as for personal services and/or the maintenance of shareholder accounts. Distribution and service fees paid or accrued for the period from May 1, 2006 to October 31, 2006 amounted to $658,646 for Class A shares. Distribution and service fees paid or accrued for the year ended April 30, 2006 amounted to $791,449. The Fund also has in effect distribution plans for Class B shares (Class B Plan) and Class C shares (Class C Plan) pursuant to Rule 12b-1 under the Investment Company Act of 1940 (collectively, "the Plans"). The Class B and Class C Plans requir e the Fund to pay EVD amounts equal to 1/365 of
Eaton Vance Tax-Managed Dividend Income Fund as of October 31, 2006
NOTES TO FINANCIAL STATEMENTS CONT'D
0.75% (annualized) of the Fund's average daily net assets attributable to Class B and Class C shares, for providing ongoing distribution services and facilities to the Fund. The Fund will automatically discontinue payments to EVD during any period in which there are no outstanding Uncovered Distribution Charges, which are equivalent to the sum of (i) 6.25% of the aggregate amount received by the Fund for the Class B and Class C shares sold, respectively, plus (ii) interest calculated by applying the rate of 1% over the prevailing prime rate to the outstanding balance of Uncovered Distribution Charges of EVD, of each respective class, reduced by the aggregate amount of contingent deferred sales charges (see Note 6) and daily amounts theretofore paid to EVD by each respective class. Distribution fees paid or accrued for the period from May 1, 2006 to October 31, 2006 amounted to $476,409 and $1,498,781, for Class B and Class C sha res, respectively. Distribution fees paid or accrued for the year ended April 30, 2006 amounted to $735,954 and $1,942,985 for Class B and Class C shares, respectively. At October 31, 2006, the amount of Uncovered Distribution Charges of EVD calculated under the Plans was approximately $5,212,000 and $24,235,000 for Class B and Class C shares, respectively. The Class B and Class C Plans also authorize the Fund to make payments of service fees to EVD, investment dealers and other persons in amounts not exceeding 0.25% annually of the average daily net assets attributable to that Class. Service fees are paid for personal services and/or the maintenance of shareholder accounts. They are separate and distinct from the Class B and Class C sales commissions and distribution fees and, as such, are not subject to automatic discontinuance when there are no outstanding Uncovered Distribution Charges to EVD. Service fees paid or accrued for the period from May 1, 2006 to October 31, 2006 amounted to $158,803, and $499, 594, for Class B and Class C shares, respectively. Service fees paid or accrued for the year ended April 30, 2006 amounted to $245,318, and $647,662, for Class B and Class C shares, respectively.
6 Contingent Deferred Sales Charge
A contingent deferred sales charge (CDSC) generally is imposed on redemptions of Class B shares made within six years of purchase and on redemptions of Class C shares made within one year of purchase. Class A shares may be subject to a CDSC up to 1% if redeemed within two years of purchase (depending upon the circumstances of purchase). Generally, the CDSC is based upon the lower of the net asset value at date of redemption or date of purchase. No charge is levied on shares acquired by reinvestment of dividends or capital gain distributions. The Class B CDSC is imposed at declining rates that begin at 5% in the case of redemptions in the first and second year after purchase, declining one percentage point each subsequent year. Class C shares will be subject to a 1% CDSC if redeemed within one year of purchase.
No CDSC is levied on shares which have been sold to EVM or its affiliates or to their respective employees or clients and may be waived under certain other limited conditions. CDSC pertaining to Class B and Class C redemptions are paid to EVD to reduce the amount of Uncovered Distribution Charges calculated under the Class B and Class C Plans, respectively (see Note 5). CDSC assessed on Class B and Class C shares when no Uncovered Distribution Charges exist for the respective classes will be credited to the Fund. EVD received approximately $3,000, $139,000 and $28,000 of CDSC paid by shareholders for Class A, Class B and Class C shares, respectively, for the period from May 1, 2006 to October 31, 2006.
7 Investments Transactions
Purchases and sales of investments, other than short-term obligations, aggregated $791,399,412 and $477,756,693 respectively, for the period from May 1, 2006 to October 31, 2006.
8 Federal Income Tax Basis of Unrealized Appreciation (Depreciation)
The cost and unrealized appreciation (depreciation) of investments of the Fund at October 31, 2006, as computed on a federal income tax basis, were as follows:
| Aggregate cost | | $ | 1,110,112,549 | | |
| Gross unrealized appreciation | | $ | 176,003,762 | | |
| Gross unrealized depreciation | | | (582,121 | ) | |
| Net unrealized appreciation | | $ | 175,421,641 | | |
The net unrealized appreciation on foreign currency as of October 31, 2006 is $15,272.
9 Risks Associated with Foreign Investments
Investing in securities issued by companies whose principal business activities are outside the United States may involve significant risks not present in domestic investments. For example, there is generally less publicly available information about foreign companies, particularly those not subject to the disclosure and reporting requirements of the U.S. securities laws. Foreign issuers are generally not bound by uniform accounting, auditing, and financial reporting requirements and standards of practice comparable to
Eaton Vance Tax-Managed Dividend Income Fund as of October 31, 2006
NOTES TO FINANCIAL STATEMENTS CONT'D
those applicable to domestic issuers. Investments in foreign securities also involve the risk of possible adverse changes in investment or exchange control regulations, expropriation or confiscatory taxation, limitation on the removal of funds or other assets of the Fund, political or financial instability or diplomatic and other developments which could affect such investments. Foreign stock markets, while growing in volume and sophistication, are generally not as developed as those in the United States, and securities of some foreign issuers (particularly those located in developing countries) may be less liquid and more volatile than securities of comparable U.S. companies. In general, there is less overall governmental supervision and regulation of foreign securities markets, broker-dealers and issuers than in the United States.
10 Financial Instruments
The Fund may trade in financial instruments with off-balance sheet risk in the normal course of its investing activities to assist in managing exposure to various market risks. These financial instruments include written options, and financial futures contracts and may involve, to a varying degree, elements of risk in excess of the amounts recognized for financial statement purposes.
The notional or contractual amounts of these instruments represent the investment the Fund has in particular classes of financial instruments and does not necessarily represent the amounts potentially subject to risk. The measurement of the risks associated with these instruments is meaningful only when all related and offsetting transactions are considered. The Fund did not have any open obligations under these financial instruments at October 31, 2006.
11 Line of Credit
The Fund participates with other portfolios and funds managed by EVM and its affiliates in a $150 million unsecured line of credit agreement with a group of banks. Borrowings will be made by the Fund solely to facilitate the handling of unusual and/or unanticipated short term cash requirements. Interest is charged to each participating portfolio or fund based on its borrowings at an amount above either the Eurodollar rate or Federal Funds rate. In addition, a fee computed at an annual rate of 0.10% on the daily unused portion of the line of credit is allocated among the participating portfolios and funds at the end of each quarter. The Fund did not have any significant borrowings or allocated fees during the period from May 1, 2006 to October 31, 2006 and the year ended April 30, 2006.
12 Fiscal Year End Change
Effective August, 7, 2006, the Fund changed its fiscal year end from April 30 to October 31.
13 Recently Issued Accounting Pronouncements
In June 2006, the Financial Accounting Standards Board (FASB) issued FASB Interpretation No. 48, (FIN 48) "Accounting for Uncertainty in Income Taxes – an interpretation of FASB Statement No. 109". FIN 48 clarifies the accounting for uncertainty in income taxes recognized in accordance with FASB Statement No. 109, "Accounting for Income Taxes." This interpretation prescribes a recognition threshold and measurement attribute for the financial statement recognition and measurement of a tax position taken or expected to be taken in a tax return. It also provides guidance on de-recognition, classification, interest and penalties, accounting in interim periods, disclosure and transition. FIN 48 is effective for fiscal years beginning after December 15, 2006. Management is currently evaluating the impact of applying the various provisions of FIN 48.
In September 2006, the FASB issued Statement of Financial Accounting Standards No. 157 (FAS 157) "Fair Value Measurements". FAS 157 defines fair value, establishes a framework for measuring fair value in accordance with generally accepted accounting principles and expands disclosure about fair value measurements. FAS 157 is effective for fiscal years beginning after November 15, 2007. Management is currently evaluating the impact the adoption of FAS 157 will have on the Fund's financial statement disclosures.
Eaton Vance Tax-Managed Dividend Income Fund as of October 31, 2006
REPORT OF INDEPENDENT REGISTERED PUBLIC ACCOUNTING FIRM
To the Trustees of Eaton Vance Mutual Funds Trust and Shareholders of Eaton Vance Tax-Managed Dividend Income Fund:
We have audited the accompanying statement of assets and liabilities of Eaton Vance Tax-Managed Dividend Income Fund (one of the series constituting the Eaton Vance Mutual Funds Trust) (the "Fund"), including the portfolio of investments, as of October 31, 2006, the related statement of operations for the six month period ended October 31, 2006 and the year ended April 30, 2006, the statements of changes in net assets for the six month period ended October 31, 2006 and for each of the two years ended April 30, 2006, and April 30, 2005 and the financial highlights for the six month period ended October 31, 2006 and for each of the two years ended April 30, 2006, and April 30, 2005 and for the period from May 30, 2003 (commencement of operations) to April 30, 2004. These financial statements and financial highlights are the responsibility of the Fund's management. Our responsibility is to express an opinion on these financial stat ements and financial highlights based on our audits.
We conducted our audits in accordance with the standards of the Public Company Accounting Oversight Board (United States). Those standards require that we plan and perform the audits to obtain reasonable assurance about whether the financial statements and financial highlights are free of material misstatement. The Fund is not required to have, nor were we engaged to perform, an audit of its internal control over financial reporting. Our audit included consideration of internal control over financial reporting as a basis for designing audit procedures that are appropriate in the circumstances, but not for the purpose of expressing an opinion on the effectiveness of the Fund's internal control over financial reporting. Accordingly, we express no such opinion. An audit also includes examining, on a test basis, evidence supporting the amounts and disclosures in the financial statements, assessing the accounting principles used and significant estimates made by management, as well as evaluating the overall financial statement presentation. Our procedures included confirmation of securities owned as of October 31, 2006, by correspondence with the custodian and brokers; where replies were not received from brokers, we performed other auditing procedures. We believe that our audits provide a reasonable basis for our opinion.
In our opinion, the financial statements and financial highlights referred to above present fairly, in all material respects, the financial position of the Eaton Vance Tax-Managed Dividend Income Fund as of October 31, 2006, the results of its operations for the six month period ended October 31, 2006 and the year ended April 30, 2006, the statements of changes in its net assets for the six month period ended October 31, 2006 and for each of the two years ended April 30, 2006 and April 30, 2005 and the financial highlights for the six month period ended October 31, 2006 and for each of the two years ended April 30, 2006 and April 30, 2005 and for the period from May 30, 2003 (commencement of operations) to April 30, 2004, in conformity with accounting principles generally accepted in the United States of America.
DELOITTE & TOUCHE LLP
Boston, Massachusetts
December 15, 2006
21
Eaton Vance Tax-Managed Dividend Income Fund as of October 31, 2006
FEDERAL TAX INFORMATION
The Form 1099-DIV you receive in January 2007 will show the tax status of all distributions paid to your account in calendar year 2006. Shareholders are advised to consult their own tax adviser with respect to the tax consequences of their investment in the Fund. As required by the Internal Revenue Code regulations, shareholders must be notified within 60 days of the Fund's fiscal year end regarding the status of qualified dividend income for individuals and the dividends received deduction for corporations.
Qualified Dividend Income — The Fund designates approximately $24,712,713, or up to the maximum amount of such dividend allowable pursuant to the Internal Revenue Code, as qualified dividend income eligible for the reduced tax rate of 15%.
Dividends Received Deduction — Corporate shareholders are generally entitled to take the dividends received deduction on the portion of the Fund's dividend distribution that qualifies under tax law. For the Fund's fiscal 2006 ordinary income dividends, 84.94% qualifies for the corporate dividends received deduction.
22
Eaton Vance Tax-Managed Dividend Income Fund
BOARD OF TRUSTEES' ANNUAL APPROVAL OF THE INVESTMENT ADVISORY AGREEMENTS
Overview of the Contract Review Process
The Investment Company Act of 1940, as amended (the "1940 Act"), provides, in substance, that each investment advisory agreement between a fund and its investment adviser will continue in effect from year to year only if its continuance is approved at least annually by the fund's board of trustees, including by a vote of a majority of the trustees who are not "interested persons" of the fund ("Independent Trustees") cast in person at a meeting called for the purpose of considering such approval.
At a meeting of the Boards of Trustees (each a "Board") of the Eaton Vance group of mutual funds (the "Eaton Vance Funds") held on March 27, 2006, the Board, including a majority of the Independent Trustees, voted to approve continuation of existing advisory and sub-advisory agreements for the Eaton Vance Funds for an additional one-year period. In voting its approval, the Board relied upon the affirmative recommendation of the Special Committee of the Board, which is a committee comprised exclusively of Independent Trustees. Prior to making its recommendation, the Special Committee reviewed information furnished for a series of meetings of the Special Committee held in February and March 2006. Such information included, among other things, the following:
Information about Fees, Performance and Expenses
• An independent report comparing the advisory and related fees paid by each fund with fees paid by comparable funds;
• An independent report comparing each fund's total expense ratio and its components to comparable funds;
• An independent report comparing the investment performance of each fund to the investment performance of comparable funds over various time periods;
• Data regarding investment performance in comparison to relevant peer groups of funds and appropriate indices;
• Comparative information concerning fees charged by each adviser for managing other mutual funds and institutional accounts using investment strategies and techniques similar to those used in managing the fund;
• Profitability analyses for each adviser with respect to each fund managed by it;
Information about Portfolio Management
• Descriptions of the investment management services provided to each fund, including the investment strategies and processes employed;
• Information concerning the allocation of brokerage and the benefits received by each adviser as a result of brokerage allocation, including information concerning the acquisition of research through "soft dollar" benefits received in connection with the funds' brokerage, and the implementation of a soft dollar reimbursement program established with respect to the funds;
• Data relating to portfolio turnover rates of each fund;
• The procedures and processes used to determine the fair value of fund assets and actions taken to monitor and test the effectiveness of such procedures and processes;
Information about each Adviser
• Reports detailing the financial results and condition of each adviser;
• Descriptions of the qualifications, education and experience of the individual investment professionals whose responsibilities include portfolio management and investment research for the funds, and information relating to their compensation and responsibilities with respect to managing other mutual funds and investment accounts;
• Copies of the Codes of Ethics of each adviser and its affiliates, together with information relating to compliance with and the administration of such codes;
• Information concerning the resources devoted to compliance efforts undertaken by each adviser and its affiliates on behalf of the funds (including descriptions of various compliance programs) and their record of compliance with investment policies and restrictions, including policies with respect to market-timing, late trading and selective portfolio disclosure, and with policies on personal securities transactions;
• Descriptions of the business continuity and disaster recovery plans of each adviser and its affiliates;
Other Relevant Information
• Information concerning the nature, cost and character of the administrative and other non-investment management services provided by Eaton Vance Management and its affiliates;
• Information concerning management of the relationship with the custodian, subcustodians and fund accountants by each adviser or the funds' administrator; and
• The terms of each advisory agreement.
23
Eaton Vance Tax-Managed Dividend Income Fund
BOARD OF TRUSTEES' ANNUAL APPROVAL OF THE INVESTMENT ADVISORY AGREEMENTS CONT'D
In addition to the information identified above, the Special Committee considered information provided from time to time by each adviser throughout the year at meetings of the Board and its committees. Over the course of the twelve month period ended March 31, 2006, the Board met nine times and the Special Committee, the Audit Committee and the Governance Committee, each of which is a Committee comprised solely of Independent Trustees, met eight, twelve and five times, respectively. At such meetings, the Trustees received, among other things, presentations by the portfolio managers and other investment professionals of each adviser relating to the investment performance of each fund and the investment strategies used in pursuing the fund's investment objective.
For funds that invest through one or more underlying portfolios, the Board considered similar information about the portfolio(s) when considering the approval of advisory agreements. In addition, in cases where the fund's investment adviser has engaged a sub-adviser, the Board considered similar information about the sub-adviser when considering the approval of any sub-advisory agreement.
The Special Committee was assisted throughout the contract review process by Goodwin Procter LLP, legal counsel for the Independent Trustees. The members of the Special Committee relied upon the advice of such counsel and their own business judgment in determining the material factors to be considered in evaluating each advisory and sub-advisory agreement and the weight to be given to each such factor. The conclusions reached with respect to each advisory and sub-advisory agreement were based on a comprehensive evaluation of all the information provided and not any single factor. Moreover, each member of the Special Committee may have placed varying emphasis on particular factors in reaching conclusions with respect to each advisory and sub-advisory agreement.
Results of the Process
Based on its consideration of the foregoing, and such other information as it deemed relevant, including the factors and conclusions described below, the Special Committee concluded that the continuance of the investment advisory agreement of the Tax-Managed Dividend Income Fund (the "Fund") with Eaton Vance Management (the "Adviser"), including its fee structure, is in the interests of shareholders and, therefore, the Special Committee recommended to the Board approval of the agreement. The Board accepted the recommendation of the Special Committee as well as the factors considered and conclusions reached by the Special Committee with respect to the agreement. Accordingly, the Board, including a majority of the Independent Trustees, voted to approve continuation of the advisory agreement for the Fund.
Nature, Extent and Quality of Services
In considering whether to approve the investment advisory agreement of the Fund, the Board evaluated the nature, extent and quality of services provided to the Fund by the Adviser.
The Board considered the Adviser's management capabilities and investment process with respect to the types of investments held by the Fund, including the education, experience and number of its investment professionals and other personnel who provide portfolio management, investment research, and similar services to the Fund, including recent changes to such personnel. The Board evaluated the abilities and experience of such investment personnel in analyzing factors such as special considerations relevant to investing in foreign markets. The Board specifically noted the Adviser's in-house equity research capabilities and experience in managing funds that seek to maximize after-tax returns. The Board also took into account the resources dedicated to portfolio management and other services, including the compensation paid to recruit and retain investment personnel, and the time and attention devoted to each Fund in the complex by senior management.
The Board reviewed the compliance programs of the Adviser and relevant affiliates thereof. Among other matters, the Board considered compliance and reporting matters relating to personal trading by investment personnel, selective disclosure of portfolio holdings, late trading, frequent trading, portfolio valuation, business continuity and the allocation of investment opportunities. The Board also evaluated the responses of the Adviser and its affiliates to requests from regulatory authorities such as the Securities and Exchange Commission and the National Association of Securities Dealers.
The Board considered shareholder and other administrative services provided or managed by Eaton Vance Management and its affiliates, including transfer agency and accounting services. The Board evaluated the benefits to shareholders of investing in a fund that is a part of a large family of funds, including the ability, in many cases, to exchange an investment among different funds without incurring additional sales charges.
24
Eaton Vance Tax-Managed Dividend Income Fund
BOARD OF TRUSTEES' ANNUAL APPROVAL OF THE INVESTMENT ADVISORY AGREEMENTS CONT'D
After consideration of the foregoing factors, among others, the Board concluded that the nature, extent and quality of services provided by the Adviser, taken as a whole, are appropriate and consistent with the terms of the investment advisory agreement.
Fund Performance
The Board compared the Fund's investment performance to a relevant universe of similarly managed funds identified by an independent data provider and appropriate benchmark indices. The Board reviewed comparative performance data for the one-year period ended September 30, 2005 for the Fund. On the basis of the foregoing and other relevant information, the Board concluded that the performance of the Fund is satisfactory.
Management Fees and Expenses
The Board reviewed contractual investment advisory fee rates, including administrative fee rates, payable by the Fund (referred to collectively as "management fees").
As part of its review, the Board considered the Fund's management fees (including administrative fees) and total expense ratio for the one-year period ended September 30, 2005, as compared to a group of similarly managed funds selected by an independent data provider.
After reviewing the foregoing information, and in light of the nature, extent and quality of the services provided by the Adviser, the Board concluded that the management fees charged for advisory and related services and the Fund's total expense ratio are reasonable.
Profitability
The Board reviewed the level of profits realized by the Adviser and relevant affiliates thereof in providing investment advisory and administrative services to the Fund and to all Eaton Vance Funds as a group. The Board considered the level of profits realized without regard to revenue sharing or other payments by the Adviser and its affiliates to third parties in respect of distribution services. The Board also considered other direct or indirect benefits received by the Adviser in connection with its relationship with the Fund, including the benefits of research services that may be available to the Adviser as a result of securities transactions effected for the Fund and other investment advisory clients.
The Board concluded that, in light of the foregoing factors and the nature, extent and quality of the services rendered, the profits realized by the Adviser and its affiliates are reasonable.
Economies of Scale
In reviewing management fees and profitability, the Board also considered the extent to which the Adviser and its affiliates, on the one hand, and the Fund, on the other hand, can expect to realize benefits from economies of scale as the assets of the Fund increase. The Board acknowledged the difficulty in accurately measuring the benefits resulting from the economies of scale with respect to the management of any specific fund or group of funds. The Board reviewed data summarizing the increases and decreases in the assets of the Fund and of all Eaton Vance Funds as a group over various time periods, and evaluated the extent to which the total expense ratio of the Fund and the Adviser's profitability may have been affected by such increases or decreases. Based upon the foregoing, the Board concluded that the benefits from economies of scale are currently being shared equitably by the Adviser and the Fund. The Board also conclude d that the structure of the advisory fee, which includes breakpoints at several asset levels, can be expected to cause the Adviser and its affiliates and the Fund to continue to share such benefits equitably.
25
Eaton Vance Tax-Managed Dividend Income Fund
MANAGEMENT AND ORGANIZATION
Fund Management. The Trustees of Eaton Vance Mutual Funds Trust (the Trust) are responsible for the overall management and supervision of the Trust's affairs. The Trustees and officers of the Trust are listed below. Except as indicated, each individual has held the office shown or other offices in the same company for the last five years. Trustees and officers of the Trust hold indefinite terms of office. The "noninterested Trustees" consist of those Trustees who are not "interested persons" of the Trust, as that term is defined under the 1940 Act. The business address of each Trustee and officer is The Eaton Vance Building, 255 State Street, Boston, Massachusetts 02109. As used below, "EVC" refers to Eaton Vance Corp., "EV" refers to Eaton Vance, Inc., "EVM" refers to Eaton Vance Management, "BMR" refers to Boston Management and Research, "Parametric" refer s to Parametric Portfolio Associates and "EVD" refers to Eaton Vance Distributors, Inc. EVC and EV are the corporate parent and trustee, respectively, of EVM and BMR. EVD is the Fund's principal underwriter and a wholly-owned subsidiary of EVM. Each officer affiliated with Eaton Vance may hold a position with other Eaton Vance affiliates that is comparable to his or her position with EVM listed below.
Name and
Date of Birth | | Position(s)
with the
Trust | | Term of
Office and
Length of
Service | | Principal Occupation(s)
During Past Five Years | | Number of Portfolios
in Fund Complex
Overseen By
Trustee(1) | | Other Directorships Held | |
| Interested Trustee | | | | | | | | | | | | | |
|
| James B. Hawkes 11/9/41 | | Trustee | | Since 1991 | | Chairman and Chief Executive Officer of EVC, BMR, EVM and EV; Director of EV; Vice President and Director of EVD. Trustee and/or officer of 170 registered investment companies in the Eaton Vance Fund Complex. Mr. Hawkes is an interested person because of his positions with BMR, EVM, EVC and EV, which are affiliates of the Trust. | | | 170 | | | Director of EVC | |
|
| Noninterested Trustee(s) | | | | | | | | | | | | | |
|
| Benjamin C. Esty 1/2/63 | | Trustee | | Since 2005 | | Roy and Elizabeth Simmons Professor of Business Administration, Harvard University Graduate School of Business Administration (since 2003). Formerly, Associate Professor, Harvard University Graduate School of Business Administration (2000-2003). | | | 170 | | | None | |
|
| Samuel L. Hayes, III 2/23/35 | | Trustee and Chairman of the Board | | Trustee of the Trust since 1986 and Chairman of the Board since 2005 | | Jacob H. Schiff Professor of Investment Banking Emeritus, Harvard University Graduate School of Business Administration. Director of Yakima Products, Inc. (manufacturer of automotive accessories) (since 2001) and Director of Telect, Inc. (telecommunications services company). | | | 170 | | | Director of Tiffany & Co. (specialty retailer) | |
|
| William H. Park 9/19/47 | | Trustee | | Since 2003 | | Vice Chairman, Commercial Industrial Finance Corp. (specialty finance company) (since 2006). Formerly, President and Chief Executive Officer, Prizm Capital Management, LLC (investment management firm) (2002-2005). Formerly, Executive Vice President and Chief Financial Officer, United Asset Management Corporation (a holding company owning institutional investment management firms) (1982-2001). | | | 170 | | | None | |
|
| Ronald A. Pearlman 7/10/40 | | Trustee | | Since 2003 | | Professor of Law, Georgetown University Law Center. | | | 170 | | | None | |
|
26
Eaton Vance Tax-Managed Dividend Income Fund
MANAGEMENT AND ORGANIZATION CONT'D
Name and
Date of Birth | | Position(s)
with the
Trust | | Term of
Office and
Length of
Service | | Principal Occupation(s)
During Past Five Years | | Number of Portfolios
in Fund Complex
Overseen By
Trustee(1) | | Other Directorships Held | |
| Noninterested Trustee(s) (continued) | | | | | | | | | | | | | |
|
| Norton H. Reamer 9/21/35 | | Trustee | | Since 1986 | | President, Chief Executive Officer and a Director of Asset Management Finance Corp. (a specialty finance company serving the investment management industry) (since October 2003). President, Unicorn Corporation (an investment and financial advisory services company) (since September 2000). Formerly, Chairman and Chief Operating Officer, Hellman, Jordan Management Co., Inc. (an investment management company) (2000-2003). Formerly, Advisory Director of Berkshire Capital Corporation (investment banking firm) (2002-2003). | | | 170 | | | None | |
|
| Lynn A. Stout 9/14/57 | | Trustee | | Since 1998 | | Professor of Law, University of California at Los Angeles School of Law. | | | 170 | | | None | |
|
| Ralph F. Verni 1/26/43 | | Trustee | | Since 2005 | | Consultant and private investor. | | | 170 | | | None | |
|
| Principal Officers who are not Trustees | | | | | | | | | | | | | |
|
Name and
Date of Birth | | Position(s)
with the
Trust | | Term of
Office and
Length of
Service | | Principal Occupation(s)
During Past Five Years | |
| Thomas E. Faust Jr. 5/31/58 | | President | | Since 2002 | | President of EVC, EVM, BMR and EV and Director of EVC. Chief Investment Officer of EVC, EVM and BMR. Officer of 71 registered investment companies and 5 private investment companies managed by EVM or BMR. | |
|
| William H. Ahern, Jr. 7/28/59 | | Vice President | | Since 1995 | | Vice President of EVM and BMR. Officer of 71 registered investment companies managed by EVM or BMR. | |
|
| Cynthia J. Clemson 3/2/63 | | Vice President | | Since 2005 | | Vice President of EVM and BMR. Officer of 86 registered investment companies managed by EVM or BMR. | |
|
| Aamer Khan 6/7/60 | | Vice President | | Since 2005 | | Vice President of EVM and BMR. Officer of 29 registered investment companies managed by EVM or BMR. | |
|
| Thomas H. Luster 4/8/62 | | Vice President | | Since 2006 | | Vice President of EVM and BMR. Officer of 45 registered investment companies managed by EVM or BMR. | |
|
| Michael R. Mach 7/15/47 | | Vice President | | Since 1999 | | Vice President of EVM and BMR. Officer of 51 registered investment companies managed by EVM or BMR. | |
|
| Robert B. MacIntosh 1/22/57 | | Vice President | | Since 1998 | | Vice President of EVM and BMR. Officer of 86 registered investment companies managed by EVM or BMR. | |
|
| Cliff Quisenberry, Jr. 1/1/65 | | Vice President | | Since 2006 | | Vice President and Director of Research and Product Development of Parametric. Officer of 30 registered investment companies managed by EVM or BMR. | |
|
| Duncan W. Richardson 10/26/57 | | Vice President | | Since 2001 | | Executive Vice President and Chief Equity Investment Officer of EVC, EVM and BMR. Officer of 71 registered investment companies managed by EVM or BMR. | |
|
| Walter A. Row, III 7/20/57 | | Vice President | | Since 2001 | | Director of Equity Research and a Vice President of EVM and BMR. Officer of 33 registered investment companies managed by EVM or BMR. | |
|
| Judith A. Saryan 8/21/54 | | Vice President | | Since 2003 | | Vice President of EVM and BMR. Officer of 50 registered investment companies managed by EVM or BMR. | |
|
27
Eaton Vance Tax-Managed Dividend Income Fund
MANAGEMENT AND ORGANIZATION CONT'D
Name and
Date of Birth | | Position(s)
with the
Trust | | Term of
Office and
Length of
Service | | Principal Occupation(s)
During Past Five Years | |
| Principal Officers who are not Trustees (continued) | | | | | | | |
|
| Susan Schiff 3/13/61 | | Vice President | | Since 2002 | | Vice President of EVM and BMR. Officer of 30 registered investment companies managed by EVM or BMR. | |
|
| Barbara E. Campbell 6/19/57 | | Treasurer | | Since 2005(2) | | Vice President of EVM and BMR. Officer of 170 registered investment companies managed by EVM or BMR. | |
|
| Alan R. Dynner 10/10/40 | | Secretary | | Since 1997 | | Vice President, Secretary and Chief Legal Officer of BMR, EVM, EVD, EV and EVC. Officer of 170 registered investment companies managed by EVM or BMR. | |
|
| Paul M. O'Neil 7/11/53 | | Chief Compliance Officer | | Since 2004 | | Vice President of EVM and BMR. Officer of 170 registered investment companies managed by EVM or BMR. | |
|
(1) Includes both master and feeder funds in a master-feeder structure.
(2) Prior to 2005, Ms. Campbell served as Assistant Treasurer since 1995.
The SAI for the Fund includes additional information about the Trustees and officers of the Fund and can be obtained without charge by calling 1-800-225-6265.
28
Investment Advisor and Administrator of
Eaton Vance Tax-Managed Dividend Income Fund
Eaton Vance Management
The Eaton Vance Building
255 State Street
Boston, MA 02109
Principal Underwriter
Eaton Vance Distributors, Inc.
The Eaton Vance Building
255 State Street
Boston, MA 02109
(617) 482-8260
Custodian
Investors Bank & Trust Company
200 Clarendon Street
Boston, MA 02116
Transfer Agent
PFPC Inc.
Attn: Eaton Vance Funds
P.O. Box 9653
Providence, RI 02940-9653
(800) 262-1122
Independent Registered Public Accounting Firm
Deloitte & Touche LLP
200 Berkeley Street
Boston, MA 02116-5022
Eaton Vance Tax-Managed Dividend Income Fund
The Eaton Vance Building
255 State Street
Boston, MA 02109
This report must be preceded or accompanied by a current prospectus. Before investing, investors should consider carefully the Fund's investment objective(s), risks, and charges and expenses. The Fund's current prospectus contains this and other information about the Fund and is available through your financial advisor. Please read the prospectus carefully before you invest or send money. For further information please call 1-800-225-6265.
1857-12/06 TMDISRC

Annual Report October 31, 2006
EATON VANCE
EQUITY
RESEARCH
FUND
IMPORTANT NOTICES REGARDING PRIVACY,
DELIVERY OF SHAREHOLDER DOCUMENTS,
PORTFOLIO HOLDINGS AND PROXY VOTING
Privacy. The Eaton Vance organization is committed to ensuring your financial privacy. Each of the financial institutions identified below has in effect the following policy (“Privacy Policy”) with respect to nonpublic personal information about its customers:
· Only such information received from you, through application forms or otherwise, and information about your Eaton Vance fund transactions will be collected. This may include information such as name, address, social security number, tax status, account balances and transactions.
· None of such information about you (or former customers) will be disclosed to anyone, except as permitted by law (which includes disclosure to employees necessary to service your account). In the normal course of servicing a customer’s account, Eaton Vance may share information with unaffiliated third parties that perform various required services such as transfer agents, custodians and broker/dealers.
· Policies and procedures (including physical, electronic and procedural safeguards) are in place that are designed to protect the confidentiality of such information.
· We reserve the right to change our Privacy Policy at any time upon proper notification to you. Customers may want to review our Policy periodically for changes by accessing the link on our homepage: www.eatonvance.com.
Our pledge of privacy applies to the following entities within the Eaton Vance organization: the Eaton Vance family of funds, Eaton Vance Management, Eaton Vance Investment Counsel, Boston Management and Research, and Eaton Vance Distributors, Inc.
In addition, our Privacy Policy only applies to those Eaton Vance customers who are individuals and who have a direct relationship with us. If a customer’s account (i.e. fund shares) is held in the name of a third-party financial adviser/broker-dealer, it is likely that only such adviser’s privacy policies apply to the customer. This notice supersedes all previously issued privacy disclosures.
For more information about Eaton Vance’s Privacy Policy, please call 1-800-262-1122.
Delivery of Shareholder Documents. The Securities and Exchange Commission (the “SEC”) permits funds to deliver only one copy of shareholder documents, including prospectuses, proxy statements and shareholder reports, to fund investors with multiple accounts at the same residential or post office box address. This practice is often called “householding” and it helps eliminate duplicate mailings to shareholders.
Eaton Vance, or your financial adviser, may household the mailing of your documents indefinitely unless you instruct Eaton Vance, or your financial adviser, otherwise.
If you would prefer that your Eaton Vance documents not be householded, please contact Eaton Vance at 1-800-262-1122, or contact your financial adviser.
Your instructions that householding not apply to delivery of your Eaton Vance documents will be effective within 30 days of receipt by Eaton Vance or your financial adviser.
Portfolio Holdings. Each Eaton Vance Fund and its underlying Portfolio (if applicable) will file a schedule of its portfolio holdings on Form N-Q with the SEC for the first and third quarters of each fiscal year. The Form N-Q will be available on the Eaton Vance website www.eatonvance.com, by calling Eaton Vance at 1-800-262-1122 or in the EDGAR database on the SEC’s website at www.sec.gov. Form N-Q may also be reviewed and copied at the SEC’s public reference room in Washington, D.C. (call 1-800-732-0330 for information on the operation of the public reference room).
Proxy Voting. From time top time, funds are required to vote proxies related to the securities held by the funds. The Eaton Vance Funds or their underlying Portfolios (if applicable) vote proxies according to a set of policies and procedures approved by the Funds’ and Portfolios’ Boards. You may obtain a description of these policies and procedures and information on how the Funds or Portfolios voted proxies relating to Portfolio securities during the 12 month period ended June 30, without charge, upon request, by calling 1-800-262-1122. This description is also available on the SEC’s website at www.sec.gov.
Eaton Vance Equity Research Fund as of October 31, 2006
MANAGEMENT’S DISCUSSION OF FUND PERFORMANCE

Walter A. Row III, CFA
Investment Team Leader
The Fund
Performance for the Past Year
· During the year ended October 31, 2006, the Fund’s Class A shares had a total return of 15.59%.(1) This return was the result of an increase in net asset value (NAV) per share to $13.37 on October 31, 2006, from $12.15 on October 31, 2005, and the reinvestment of $0.021 per share in dividend income and $0.594 per share in capital gains.(1)
· For comparison, the Fund’s benchmark, the Standard & Poor’s 500 Index (the S&P 500) — a broad-based, unmanaged market index of common stocks commonly used as a measure of U.S. stock market performance — had a total return of 16.33% during the same period. The Fund’s peer group, the Lipper Large-Cap Core Funds Classification, had an average total return of 14.23% during the same period.(2)
Management Discussion
· U.S. equity markets moved upward at a solid pace during the year ended October 31, 2006, driven by continued strong economic growth, low to moderate inflation, and a pause in the U.S. Federal Reserve Board’s (the “Fed”) long tightening cycle. The Fed, which raised short-term rates 17 times between June 2004 and June 2006, appears to be awaiting further economic inputs to determine the future direction of interest rate moves. At October 31, 2006, the Federal Funds rate stood at 5.25%. In addition to solid economic growth and generally strong profit reports, the stock market benefited from a sharp decline in oil prices late in the period, which bolstered consumer confidence and spending. Moreover, unemployment reached a 5-year low of 4.4% in October 2006, indicating that the job market remained strong.
· During the period, the Fund slightly underperformed its benchmark index primarily due to lagging returns in the telecommunication services, health care and consumer staples sectors. Fund holdings in these sectors detracted from relative performance because, while positive, the sectors’ performance lagged that of the S&P 500 Index during the period.(2)
· On the positive side, several of the Fund’s energy holdings made solid contributions to performance, reflecting tight energy supply, geopolitcal turmoil, and increasing demand from sustained global economic growth. Despite a sharp decline in energy prices at the end of the period, this was still the top-performing sector for the Fund’s fiscal year. Selection played a key role, especially in the oil and oil services industries, in which the Fund’s holdings performed well during the period.
· Information technology (IT) also contributed positively to the Fund’s relative performance, as management’s selections outperformed IT stocks in the S&P 500 Index. Finally, in the materials sector, the Fund’s holdings performed well, contributing positively to performance relative to the S&P 500.(2), (3) In this sector, mining stocks made solid contributions, benefiting from high prices for several metals — including gold, silver, and copper — during much of the period.
Past performance is no guarantee of future results. Returns are historical and are calculated by determining the percentage change in net asset value or offering price (as applicable) with all distributions reinvested. Investment return and principal value will fluctuate so that shares, when redeemed, may be worth more or less than their original cost. Performance is for stated time period only; due to market volatility, the Fund’s current performance may be lower or higher than the quoted return. For performance as of the most recent month end, please refer to www.eatonvance.com.
Fund shares are not insured by the FDIC and are not deposits or other obligations of, or guaranteed by, any depository institution. Shares are subject to investment risks, including possible loss of principal invested.
(1) | These returns do not include the 5.75% maximum sales charge for Class A shares. If the sales charge was deducted, the returns would be lower. Absent expense waivers by the adviser and the administrator and an allocation of certain expenses to the adviser, the returns would be lower. |
| |
(2) | It is not possible to invest directly in an Index or a Lipper Classification. The Index’s total return does not reflect commissions or expenses that would have been incurred if an investor individually purchased or sold the securities represented in the Index. The Lipper Average is the average total return, at net asset value, of the funds that are in the same Lipper Classification as the Fund. |
| |
(3) | Sector weightings are subject to change due to active management. |
The views expressed throughout this report are those of the investment team leader and are current only through the end of the period of the report as stated on the cover. These views are subject to change at any time based upon market or other conditions, and the investment adviser disclaims any responsibility to update such views. These views may not be relied on as investment advice and, because investment decisions for a fund are based on many factors, may not be relied on as an indication of trading intent on behalf of any Eaton Vance fund.
1
Eaton Vance Equity Research Fund as of October 31, 2006
FUND PERFORMANCE
The line graph and table set forth below provide information about the Fund’s performance. The line graph compares the performance of Class A of the Fund with that of the S&P 500 Index, a broad-based, unmanaged market index of common stocks commonly used as a measure of U.S. stock market performance. Effective June 13, 2005, the Fund’s outstanding shares were classified as Class A shares. Prior to August 26, 2005, the Fund was not actively marketed and had few shareholders. From inception to August 26, 2005, the Fund’s expenses were voluntarily subsidized to limit Annual Fund Operating Expenses to 1.40%. Absent the subsidy, Fund performance would have been lower. The lines on the graph represent the total returns of a hypothetical investment of $10,000 in each of Class A and the S&P 500 Index. The table includes the total returns of Class A shares of the Fund at net asset value and maximum public offering price. The performance presented below does not reflect the deduction of taxes, if any, that a shareholder would pay on distributions or redemptions of Fund shares.
Performance* | | Class A | |
Average Annual Total Returns (at net as set value) | | | |
One Year | | 15.59 | % |
Life of Fund† | | 7.11 | |
SEC Average Annual Total Returns (including sales charge) | | | |
One Year | | 8.96 | % |
Life of Fund† | | 5.85 | |
† Inception Date – 11/01/01
* Average Annual Total Returns do not include the 5.75% maximum sales charge for Class A shares. If the sales charge was deducted, the returns would be lower. Absent expense waivers by the adviser and the administrator and an allocation of certain expenses to the adviser, the returns would be lower. SEC Average Annual Total Returns for Class A shares reflect the maximum 5.75% sales charge.
Past performance is no guarantee of future results. Returns are historical and are calculated by determining the percentage change in net asset value or offering price (as applicable) with all distributions reinvested. Investment return and principal value will fluctuate so that shares, when redeemed, may be worth more or less than their original cost. Performance is for the stated time period only; due to market volatility, the Fund’s current performance may be lower or higher than the quoted return. For performance as of the most recent month end, please refer to www.eatonvance.com.
Common Stock Investments by Sector†
By net assets
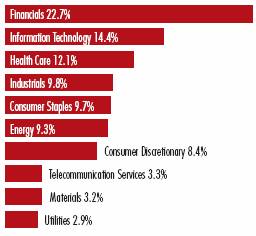
† As of October 31, 2006. Fund information may not be representative of the Fund’s current or future investments and are subject to change due to active management.
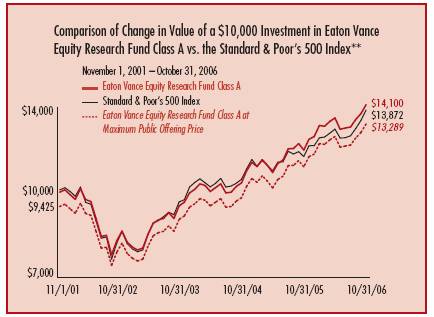
** Source: Thomson Financial. Class A of the Fund commenced investment operations on 11/1/01.
It is not possible to invest directly in an Index. The Index’s total returns do not reflect commissions or expenses that would have been incurred if an investor individually purchased or sold the securities represented in the Index.
Top Ten Equity Holdings††
By net assets
Exxon Mobil Corp. | | 3.5 | % |
General Electric Co. | | 2.1 | |
Procter & Gamble Co. | | 1.9 | |
Microsoft Corp. | | 1.9 | |
Altria Group, Inc. | | 1.7 | |
J.P. Morgan Chase & Co. | | 1.7 | |
Verizon Communications, Inc. | | 1.7 | |
Emerson Electric Co. | | 1.6 | |
Google, Inc. Class A | | 1.6 | |
Bank of America Corp. | | 1.5 | |
†† Top Ten Equity Holdings represented 19.2% of Fund net assets as of October 31, 2006. Holdings are subject to change due to active management.
2
Eaton Vance Equity Research Fund as of October 31, 2006
FUND EXPENSES
Example: As a shareholder of the Fund, you incur two types of costs: (1) transaction costs, including sales charges (loads) on purchases and redemption fees (if applicable); and (2) ongoing costs, including management fees; distribution or service fees; and other Fund expenses. This Example is intended to help you understand your ongoing costs (in dollars) of investing in the Fund and to compare these costs with the ongoing costs of investing in other mutual funds. The Example is based on an investment of $1,000 invested at the beginning of the period and held for the entire period (May 1, 2006 – October 31, 2006).
Actual Expenses: The first section of the table below provides information about actual account values and actual expenses. You may use the information in this section, together with the amount you invested, to estimate the expenses that you paid over the period. Simply divide your account value by $1,000 (for example, an $8,600 account value divided by $1,000 = 8.6), then multiply the result by the number in the first section under the heading entitled “Expenses Paid During Period” to estimate the expenses you paid on your account during this period.
Hypothetical Example for Comparison Purposes: The second section of the table below provides information about hypothetical account values and hypothetical expenses based on the actual Fund expense ratio and an assumed rate of return of 5% per year (before expenses), which is not the actual return of the Fund. The hypothetical account values and expenses may not be used to estimate the actual ending account balance or expenses you paid for the period. You may use this information to compare the ongoing costs of investing in your Fund and other funds. To do so, compare this 5% hypothetical example with the 5% hypothetical examples that appear in the shareholder reports of the other funds.
Please note that the expenses shown in the table are meant to highlight your ongoing costs only and do not reflect any transactional costs, such as sales charges (loads) or redemption fees (if applicable). Therefore, the second section of the table is useful in comparing ongoing costs only, and will not help you determine the relative total costs of owning different funds. In addition, if these transactional costs were included, your costs would have been higher.
Eaton Vance Equity Research Fund
| | Beginning Account Value
(5/1/06) | | Ending Account Value
(10/31/06) | | Expenses Paid During Period*
(5/1/06 – 10/31/06) | | |
Actual | | $ | 1,000.00 | | $ | 1,041.30 | | $ | 6.43 | ** | | |
Class A | | | | | | | | | |
Hypothetical
(5% return per year before expenses) | | | | | | | | | |
Class A | | $ | 1,000.00 | | $ | 1,018.90 | | $ | 6.36 | ** | | |
| | | | | | | | | | | | | |
* Expenses are equal to the Fund’s annualized expense ratio of 1.25% for Class A shares, multiplied by the average account value over the period, multiplied by 184/365 (to reflect the one-half-year period). The Example assumes that the $1,000 was invested at the net asset value per share determined at the close of business on April 30, 2006.
** Absent expense waivers by the adviser and administrator and an allocation of certain expenses to the adviser, expenses would be higher.
3
Eaton Vance Equity Research Fund as of October 31, 2006
PORTFOLIO OF INVESTMENTS
Security | | Shares | | Value | |
| | | | | |
Common Stocks — 95.8% | | | | | |
| | | | | |
Aerospace & Defense — 3.0% | | | | | |
General Dynamics Corp. | | 342 | | $ | 24,316 | |
Lockheed Martin Corp. | | 233 | | 20,255 | |
Northrop Grumman Corp. | | 232 | | 15,402 | |
United Technologies Corp. | | 483 | | 31,743 | |
| | | | $ | 91,716 | |
| | | | | |
Airfreight & Logistics — 1.0% | | | | | |
Fed Ex Corp. | | 261 | | $ | 29,895 | |
| | | | | |
Auto Components — 0.5% | | | | | |
Borg-Warner, Inc. | | 266 | | $ | 15,295 | |
| | | | | |
Beverages — 1.9% | | | | | |
Anheuser-Busch Cos., Inc. | | 265 | | $ | 12,566 | |
Pepsi Co, Inc. | | 745 | | 47,263 | |
| | | | $ | 59,829 | |
| | | | | |
Biotechnology — 2.8% | | | | | |
Amgen, Inc.(1) | | 161 | | $ | 12,222 | |
Biogen Idec Inc.(1) | | 360 | | 17,136 | |
BioMarin Pharmaceutical Inc.(1) | | 1,315 | | 21,079 | |
Celgene Corp.(1) | | 294 | | 15,711 | |
Gilead Sciences, Inc.(1) | | 290 | | 19,981 | |
| | | | $ | 86,129 | |
| | | | | |
Business Services — 1.2% | | | | | |
Master card Inc., Class A | | 130 | | $ | 9,633 | |
MoneyGram International, Inc. | | 330 | | 11,289 | |
Paychex, Inc. | | 335 | | 13,226 | |
Western Union Co.(1) | | 70 | | 1,544 | |
| | | | $ | 35,692 | |
| | | | | |
Capital Markets — 4.6% | | | | | |
Affiliated Managers Group, Inc.(1) | | 111 | | $ | 11,116 | |
AMVESCAP plc, ADS | | 620 | | 14,248 | |
Bank of New York, Co., Inc. | | 240 | | $ | 8,249 | |
Credit Suisse Group, ADS | | 181 | | 10,947 | |
Deutsche Bank AG, GRS | | 91 | | 11,498 | |
Goldman Sachs Group, Inc. | | 156 | | 29,607 | |
Mellon Financial Corp. | | 745 | | 28,906 | |
UBS AG | | 450 | | 26,928 | |
| | | | $ | 141,499 | |
| | | | | |
Chemicals — 1.4% | | | | | |
Ecolab Inc. | | 145 | | $ | 6,576 | |
E.I. Dupont de Nemours & Co. | | 601 | | 27,526 | |
Monsanto Co. | | 226 | | 9,994 | |
| | | | $ | 44,096 | |
| | | | | |
Commercial Banks — 3.7% | | | | | |
Anglo Irish Bank Corp., plc | | 915 | | $ | 16,330 | |
BNP Paribas SA | | 66 | | 7,249 | |
Industrial & Commercial Bank of China, Ltd.(1) | | 1,403 | | 628 | |
KBC Group N.V. | | 157 | | 17,144 | |
National Bank of Canada | | 125 | | 6,833 | |
PNC Financial Services Group, Inc. | | 330 | | 23,110 | |
Wachovia Corp. | | 551 | | 30,581 | |
Wells Fargo & Co. | | 300 | | 10,887 | |
| | | | $ | 112,762 | |
| | | | | |
Communications Equipment — 2.3% | | | | | |
Cisco Systems, Inc.(1) | | 1,325 | | $ | 31,972 | |
Corning, Inc.(1) | | 1,542 | | 31,503 | |
Tellabs inc.(1) | | 760 | | 8,010 | |
| | | | $ | 71,485 | |
| | | | | |
Computers & Peripherals — 3.3% | | | | | |
Apple Computer, Inc.(1) | | 255 | | $ | 20,675 | |
Dell, Inc.(1) | | 582 | | 14,160 | |
EMC Corp.(1) | | 834 | | 10,217 | |
Hewlett-Packard Co. | | 440 | | 17,046 | |
See notes to financial statements
4
Security | | Shares | | Value | |
| | | | | |
Computers & Peripherals (continued) | | | | | |
International Business Machines Corp. | | 355 | | $ | 32,777 | |
Sun Microsystems, Inc.(1) | | 1,400 | | 7,602 | |
| | | | $ | 102,477 | |
| | | | | |
Consumer Finance — 1.1% | | | | | |
American Express Co. | | 286 | | $ | 16,534 | |
Student Loan Corp. | | 89 | | 18,423 | |
| | | | $ | 34,957 | |
| | | | | |
Electrical Equipment — 1.6% | | | | | |
Emerson Electric Co. | | 600 | | $ | 50,640 | |
| | | | | |
Electronics – Semiconductors — 3.3% | | | | | |
Altera Corp. (1) | | 260 | | $ | 4,794 | |
Analog Devices, Inc. | | 363 | | 11,551 | |
Applied Materials, Inc. | | 315 | | 5,478 | |
ASML Holding N.V.(1) | | 265 | | 6,053 | |
Broadcom Corp., Class A(1) | | 105 | | 3,178 | |
Intel Corp. | | 1,407 | | 30,025 | |
Marvell Technology Group, Ltd.(1) | | 284 | | 5,192 | |
Maxim Integrated Products, Inc. | | 157 | | 4,712 | |
Microchip Technology, Inc. | | 260 | | 8,562 | |
Silicon Laboratories, Inc.(1) | | 142 | | 4,633 | |
Teradyne, Inc.(1) | | 667 | | 9,351 | |
Texas Instruments Inc. | | 269 | | 8,118 | |
| | | | $ | 101,647 | |
| | | | | |
Energy Equipment & Services — 1.6% | | | | | |
Schlumberger Ltd. | | 500 | | $ | 31,540 | |
Transocean Inc.(1) | | 248 | | 17,990 | |
| | | | $ | 49,530 | |
| | | | | |
Financial Services – Diversified — 5.4% | | | | | |
Bank of America Corp. | | 880 | | $ | 47,406 | |
Citigroup, Inc. | | 801 | | 40,178 | |
JP Morgan Chase & Co. | | 1,085 | | 51,472 | |
Moody’s Corp. | | 425 | | $ | 28,178 | |
| | | | $ | 167,234 | |
| | | | | |
Food Products — 1.3% | | | | | |
Nestle SA, ADR | | 457 | | $ | 39,037 | |
| | | | | |
Health Care Equipment & Supplies — 1.4% | | | | | |
Baxter International Inc. | | 340 | | $ | 15,630 | |
Medtronic, Inc. | | 304 | | 14,799 | |
Zimmer Holdings, Inc.(1) | | 168 | | 12,098 | |
| | | | $ | 42,527 | |
| | | | | |
Health Care Services — 2.0% | | | | | |
Caremark Rx, Inc. | | 232 | | $ | 11,421 | |
Express Scripts, Inc.(1) | | 165 | | 10,514 | |
Quest Diagnostics Inc. | | 240 | | 11,938 | |
UnitedHealth Group, Inc. | | 305 | | 14,878 | |
WellPoint, Inc.(1) | | 155 | | 11,830 | |
| | | | $ | 60,581 | |
| | | | | |
Hotels, Restaurants & Leisure — 0.6% | | | | | |
Marriott International, Inc., Class A | | 435 | | $ | 18,170 | |
| | | | | |
Household Durables — 0.3% | | | | | |
D.R. Horton, Inc. | | 200 | | $ | 4,686 | |
Ryland Group, Inc. (The) | | 90 | | 4,134 | |
| | | | $ | 8,820 | |
| | | | | |
Household Products — 2.6% | | | | | |
Colgate-Palmolive Co. | | 299 | | $ | 19,127 | |
Procter & Gamble Co. | | 944 | | 59,840 | |
| | | | $ | 78,967 | |
| | | | | |
Industrial Conglomerates — 2.1% | | | | | |
General Electric Co. | | 1,806 | | $ | 63,409 | |
See notes to financial statements
5
Security | | Shares | | Value | |
| | | | | |
Insurance — 5.7% | | | | | |
ACE Ltd. | | 195 | | $ | 11,164 | |
American International Group, Inc. | | 691 | | 46,414 | |
AON Corp. | | 293 | | 10,193 | |
Assurant, Inc. | | 45 | | 2,370 | |
First American Corp. | | 170 | | 6,941 | |
Hartford Financial Services Group, Inc. (The) | | 192 | | 16,737 | |
Lincoln National Corp. | | 130 | | 8,230 | |
Markel Corp. (1) | | 13 | | 5,194 | |
MetLife, Inc. | | 154 | | 8,798 | |
Prudential Financial, Inc. | | 238 | | 18,309 | |
RLI Corp. | | 126 | | 6,830 | |
St. Paul Travelers Companies, Inc. (The) | | 249 | | 12,731 | |
Willis Group Holdings Ltd. | | 77 | | 2,928 | |
W.R. Berkley Corp. | | 345 | | 12,717 | |
Zurich Financial Services | | 22 | | 5,436 | |
| | | | $ | 174,992 | |
| | | | | |
Internet Software & Services — 1.6% | | | | | |
Google Inc., Class A(1) | | 106 | | $ | 50,497 | |
| | | | | |
Life Sciences Tools & Services — 0.5% | | | | | |
Fisher Scientific International Inc.(1) | | 170 | | $ | 14,555 | |
| | | | | |
Machinery — 2.1% | | | | | |
Danaher Corp. | | 637 | | $ | 45,718 | |
Deere & Co. | | 239 | | 20,346 | |
| | | | $ | 66,064 | |
| | | | | |
Media — 2.5% | | | | | |
CBS Corp., Class B | | 97 | | $ | 2,807 | |
Comcast Corp., Class A(1) | | 680 | | 27,656 | |
McGraw-Hill Companies, Inc., (The) | | 354 | | 22,716 | |
Omnicom Group, Inc. | | 67 | | 6,797 | |
Time Warner Inc. | | 725 | | 14,507 | |
Viacom, Inc., Class B(1) | | 97 | | 3,775 | |
| | | | $ | 78,258 | |
| | | | | |
Metals & Mining — 1.3% | | | | | |
Alcan Inc. | | 95 | | $ | 4,475 | |
Companhia Vale do Rio Doce, ADR | | 516 | | 13,127 | |
Goldcorp Inc. | | 390 | | 10,249 | |
Teck Cominco Ltd., Class B | | 184 | | 13,574 | |
| | | | $ | 41,425 | |
| | | | | |
Oil & Gas — 7.7% | | | | | |
Chesapeake Energy Corp. | | 967 | | $ | 31,369 | |
Chevron Corp. | | 480 | | 32,256 | |
Exxon Mobil Corp. | | 1,517 | | 108,344 | |
Occidental Petroleum Corp. | | 420 | | 19,715 | |
Suncor Energy Inc. | | 300 | | 22,995 | |
Western Refining, Inc. | | 983 | | 23,159 | |
| | | | $ | 237,838 | |
| | | | | |
Paper & Forest Products — 0.5% | | | | | |
Bowater Inc. | | 105 | | $ | 2,196 | |
International Paper Co. | | 225 | | 7,504 | |
Weyerhaeuser Co. | | 75 | | 4,769 | |
| | | | $ | 14,469 | |
| | | | | |
Pharmaceuticals — 5.4% | | | | | |
Abbott Laboratories | | 270 | | $ | 12,828 | |
Allergan, Inc. | | 190 | | 21,945 | |
Lilly (Eli) & Co. | | 247 | | 13,834 | |
Novartis AG, ADS | | 330 | | 20,041 | |
Novo Nordisk A/S, ADS | | 180 | | 13,536 | |
Roche Holding Ltd, ADR | | 310 | | 27,128 | |
Shire plc, ADS | | 480 | | 26,328 | |
Wyeth | | 614 | | 31,332 | |
| | | | $ | 166,972 | |
| | | | | |
Reits — 1.0% | | | | | |
AvalonBay Communities, Inc. | | 116 | | $ | 15,203 | |
Simon Property Group, Inc. | | 155 | | 15,051 | |
| | | | $ | 30,254 | |
See notes to financial statements
6
Security | | Shares | | Value | |
| | | | | |
Retail – Food & Staples — 1.6% | | | | | |
Walgreen Co. | | 390 | | $ | 17,035 | |
Wal-Mart Stores, Inc. | | 634 | | 31,244 | |
| | | | $ | 48,279 | |
| | | | | |
Retail – Multiline — 1.7% | | | | | |
Federated Department Stores, Inc. | | 505 | | $ | 22,175 | |
J.C. Penney Co., Inc. | | 290 | | 21,817 | |
Target Corp. | | 139 | | 8,226 | |
| | | | $ | 52,218 | |
| | | | | |
Retail – Specialty — 2.5% | | | | | |
Bed Bath & Beyond Inc.(1) | | 185 | | $ | 7,454 | |
Best Buy Co., Inc. | | 165 | | 9,116 | |
Chico’s FAS, Inc.(1) | | 710 | | 16,990 | |
GameStop Corp.(1) | | 120 | | 6,127 | |
Home Depot, Inc. | | 347 | | 12,954 | |
Staples, Inc. | | 897 | | 23,134 | |
| | | | $ | 75,775 | |
| | | | | |
Software Services — 3.1% | | | | | |
Activision, Inc.(1) | | 460 | | $ | 7,093 | |
Autodesk, Inc.(1) | | 185 | | 6,799 | |
Microsoft Corp. | | 2,082 | | 59,774 | |
Oracle Corp.(1) | | 1,139 | | 21,037 | |
| | | | $ | 94,703 | |
| | | | | |
Telecommunication Services – Diversified — 2.4% | | | | | |
Verizon Communications Inc. | | 1,390 | | $ | 51,430 | |
Windstream Corp. | | 1,523 | | 20,896 | |
| | | | $ | 72,326 | |
| | | | | |
Telecommunication Services – Wireless — 0.9% | | | | | |
Alltel Corp. | | 530 | | $ | 28,254 | |
| | | | | |
Textiles, Apparel & Luxury Goods — 0.3% | | | | | |
Phillips-Van Heusen Corp. | | 175 | | $ | 8,008 | |
| | | | | |
Thrifts & Mortgage Finance — 0.8% | | | | | |
Fannie Mae | | 228 | | $ | 13,511 | |
Freddie Mac | | 165 | | 11,383 | |
| | | | $ | 24,894 | |
| | | | | |
Tobacco — 2.3% | | | | | |
Altria Group, Inc. | | 645 | | $ | 52,458 | |
Carolina Group | | 111 | | 6,418 | |
Reynolds American Inc. | | 166 | | 10,485 | |
| | | | $ | 69,361 | |
| | | | | |
Utilities – Electric — 2.5% | | | | | |
Exelon Corp. | | 330 | | $ | 20,453 | |
Mirant Corp.(1) | | 465 | | 13,745 | |
TXU Corp. | | 673 | | 42,486 | |
| | | | $ | 76,684 | |
| | | | | |
Utilities – Multi-Utilities — 0.4% | | | | | |
Northwestern corp. | | 360 | | $ | 12,737 | |
| | | | | |
Total Common Stocks
(identified cost $2,558,199) | | | | $ | 2,944,957 | |
| | | | | |
Total investments — 95.8%
(identified cost $2,558,199) | | | | $ | 2,944,957 | |
| | | | | |
Other Assets, Less Liabilities — 4.2% | | | | $ | 130,428 | |
| | | | | |
Net assets — 100.0% | | | | $ | 3,075,385 | |
(1) Non-Income producing security.
ADR–American Depository Receipt
ADS–American Depository Share
GRS–Global Registered Share
See notes to financial statements
7
Eaton Vance Equity Research Fund as of October 31, 2006
FINANCIAL STATEMENTS
Statement of Assets and Liabilities
As of October31, 2006
Assets | | | |
Investments, at value
(identified cost, $2,558,199) | | $ | 2,944,957 | |
Cash | | 75,372 | |
Foreign currency, at value
(identified cost, $6,533) | | 6,479 | |
Receivable for Fund shares sold | | 25,923 | |
Receivable for investments sold | | 15,011 | |
Dividends receivable | | 2,328 | |
Tax reclaim receivable | | 21 | |
Receivable from the Adviser | | 68,311 | |
Total assets | | $ | 3,138,402 | |
| | | |
Liabilities | | | |
Payable to affiliate for distribution and service fees | | $ | 623 | |
Payable for investments purchased | | 42,540 | |
Accrued expenses | | 19,854 | |
Total liabilities | | $ | 63,017 | |
Net Assets | | $ | 3,075,385 | |
| | | |
Sources of Net Assets | | | |
Paid-in capital | | $ | 2,555,949 | |
Accumulated net realized gain (computed on the basis of identified cost) | | 122,325 | |
Accumulated undistributed net investment income | | 10,404 | |
Net unrealized appreciation (computed on the basis of identified cost) | | 386,707 | |
Total | | $ | 3,075,385 | |
| | | |
Class A shares | | | |
Net Assets | | $ | 3,075,385 | |
Shares Outstanding | | 230,045 | |
Net Asset Value and Redemption Price Per Share
(net assets ÷ shares of beneficial interest outstanding) | | $ | 13.37 | |
Maximum Offering Price Per Share
(100÷94.25 of $13.37) | | $ | 14.19 | |
Statement of Operations
For the Year Ended
October 31, 2006
Investment income | | | |
Dividends (net of foreign taxes, $613) | | $ | 34,508 | |
Interest | | 6,237 | |
Total investment income | | $ | 40,745 | |
Expenses — | | | |
Investment adviser fee | | $ | 15,040 | |
Administration fee | | 3,472 | |
Distribution and service fees – Class A | | 5,788 | |
Custodian fee | | 14,285 | |
Legal and accounting services | | 36,864 | |
Printing and postage | | 13,052 | |
Registration fees | | 22,771 | |
Transfer and dividend disbursing agent fees | | 1,006 | |
Miscellaneous | | 3,634 | |
Total expenses | | $ | 115,912 | |
| | | |
Deduct — | | | |
Waiver and reimbursement of expenses by the Adviser and/or Administrator | | $ | 86,823 | |
Reduction of custodian fee | | 125 | |
Total expense reductions | | $ | 86,948 | |
| | | |
Net expenses | | $ | 28,964 | |
| | | |
Net investment income | | $ | 11,781 | |
| | | |
Realized and unrealized gain (Loss) | | | |
| | | |
Net realized gain (loss) — | | | |
Investment transactions (identified cost basis) | | $ | 132,959 | |
Foreign currency transactions | | 110 | |
Net realized gain | | $ | 133,069 | |
Change in unrealized appreciation (depreciation) — Investments (identified cost basis) | | $ | 183,606 | |
Foreign currency | | 28 | |
Net change in unrealized appreciation (depreciation) | | $ | 183,634 | |
| | | |
Net realized and unrealized gain | | $ | 316,703 | |
| | | |
Net increase in net assets from operations | | $ | 328,484 | |
See notes to financial statements
8
Statements of Changes in Net Assets
Increase (Decrease) | | Year ended | | Year ended | |
in Net assets | | October 31,2006 | | October 31,2005 | |
From operations — | | | | | |
Net investment income | | $ | 11,781 | | $ | 5,434 | |
Net realized gain on investments and foreign currency transactions | | 133,069 | | 100,556 | |
Net change in unrealized appreciation (depreciation) from investments | | 183,634 | | 76,534 | |
Net increase in net assets from operations | | $ | 328,484 | | $ | 182,524 | |
| | | | | |
Distributions to Shareholders: | | | | | |
From net investment income | | $ | (3,119 | ) | $ | (4,361 | ) |
From net realized gains | | (88,696 | ) | — | |
Total distributions to shareholders | | $ | (91,815 | ) | $ | (4,361 | ) |
Transactions in shares of beneficial interest — | | | | | |
Proceeds from sale of shares | | $ | 1,159,759 | | $ | 784,868 | |
Net asset value of shares issued to shareholders in payment of distributions declared | | 91,642 | | 4,361 | |
Cost of shares redeemed | | (143,030 | ) | (532,825 | ) |
Net increase in net assets from Fund share transactions | | $ | 1,108,371 | | $ | 256,404 | |
Net increase in net assets | | $ | 1,345,040 | | $ | 434,567 | |
| | | | | |
Net Assets | | | | | |
At beginning of year | | $ | 1,730,345 | | $ | 1,295,778 | |
At end of year | | $ | 3,075,385 | | $ | 1,730,345 | |
| | | | | |
Accumulated undistributed net investment income included in net assets | | | | | |
At end of year | | $ | 10,404 | | $ | 1,637 | |
See notes to financial statements
9
Financial Highlights
| | Class A | |
| | Year Ended October 31, | |
| | 2006(1) | | 2005(1) | | 2004(1) | | 2003(1) | | 2002(1)(3) | |
Net asset value — Beginning of year | | $ | 12.150 | | $ | 10.810 | | $ | 9.860 | | $ | 8.400 | | $ | 10.000 | |
| | | | | | | | | | | |
Income (loss) from operations | | | | | | | | | | | |
Net investment income (loss) | | $ | 0.064 | | $ | 0.041 | | $ | 0.007 | | $ | 0.007 | | $ | (0.001 | ) |
Net realized and unrealized gain (loss) | | 1.771 | | 1.334 | | 0.952 | | 1.453 | | (1.599 | ) |
Total Income (loss) from operations | | $ | 1.835 | | $ | 1.375 | | $ | 0.959 | | $ | 1.460 | | $ | (1.600 | ) |
| | | | | | | | | | | |
Less distributions | | | | | | | | | | | |
From net investment income | | $ | (0.021 | ) | $ | (0.035 | ) | $ | (0.009 | ) | $ | — | | $ | — | |
From net realized gain | | (0.594 | ) | — | | — | | — | | — | |
Total distributions | | $ | (0.615 | ) | $ | (0.035 | ) | $ | (0.009 | ) | $ | — | | $ | — | |
Net asset value — End of year | | $ | 13.370 | | $ | 12.150 | | $ | 10.810 | | $ | 9.860 | | $ | 8.400 | |
Total Return(2) | | 15.59 | % | 12.74 | % | 9.73 | % | 17.38 | % | (16.00 | )% |
| | | | | | | | | | | |
Ratios/Supplemental Data † | | | | | | | | | | | |
Net assets, end of period (000’s omitted) | | $ | 3,075 | | $ | 1,730 | | $ | 1,296 | | $ | 949 | | $ | 686 | |
Ratios (As a percentage of average daily net assets): | | | | | | | | | | | |
Expenses before custodian fee reduction(4) | | 1.25 | % | 1.25 | % | 1.40 | % | 1.40 | % | 1.45 | % |
Expenses after custodian fee reduction(4) | | 1.25 | % | 1.25 | % | 1.40 | % | 1.40 | % | 1.40 | % |
Net investment income (loss) | | 0.51 | % | 0.35 | % | 0.07 | % | 0.08 | % | (0.01 | )% |
Portfolio Turnover | | 74 | % | 93 | % | 70 | % | 64 | % | 90 | % |
(1) Net investment income (loss) per share was computed using average shares outstanding.
(2) Returns are historical and are calculated by determining the percentage change in net asset value with all distributions reinvested. Total return is not computed on an annualized basis. Total return would have been lower had certain expenses had not been reduced during the periods shown.
(3) Class A commenced operations on November 1, 2001.
(4) The advisor waived its advisory fee, the administrator waived its administration fee and the advisor subsidized certain operating expenses (equal to 3.74%, 5.70%, 4.27%, 5.27% and 5.77% of average daily net assets for 2006, 2005, 2004, 2003 and 2002, respectively).
10
Eaton Vance Equity Research fund as of October 31, 2006
NOTES TO FINANCIAL STATEMENTS
1 Significant Accounting Policies
Eaton Vance Equity Research Fund (the Fund) is a diversified series of Eaton Vance Mutual Funds Trust (the Trust) and commenced operations on November 1, 2001. The Trust is an entity of the type commonly known as a Massachusetts business trust and is registered under the Investment Company Act of 1940, as amended, as an open-end management investment company. The Fund’s investment objective is to achieve long-term capital appreciation by investing in a diversified portfolio of equity securities. The following is a summary of significant accounting policies consistently followed by the Fund in the preparation of its financial statements. The policies are in conformity with accounting principles generally accepted in the United States of America.
A Investment Valuations — Securities listed on a U.S. securities exchange generally are valued at the last sale price on the day of valuation or, if no sales took place on such date, at the mean between the closing bid and asked prices therefore on the exchange where such securities are principally traded. Equity securities listed on the NASDAQ National Market system generally are valued at the official NASDAQ closing price. Unlisted or listed securities for which closing sales prices or closing quotations are not available are valued at the mean between the latest available bid and asked prices or, in the case of preferred equity securities that are not listed or traded in the over-the-counter market, by an independent pricing service. Exchange-traded options are valued at the last sale price for the day of valuation as quoted on the principal exchange or board of trade on which the options are traded or, in the absence of sales on such date, at the mean between the latest bid and asked prices therefore. Futures positions on securities and currencies generally are valued at closing settlement prices. Short-term debt securities with a remaining maturity of 60 days or less are valued at amortized cost. If short-term debt securities were acquired with a remaining maturity of more than 60 days, they will be valued by a pricing service. Other fixed income and debt securities, including listed securities and securities for which price quotations are available, will normally be valued on the basis of valuations furnished by a pricing service. Foreign securities and currencies are valued in U.S. dollars, based on foreign currency exchange rate quotations supplied by an independent quotation service. The daily valuation of exchange traded foreign securities generally is determined as of the close of trading on the principal exchange on which such securities trade. Events occurring after the close of trading on foreign exchanges may result in adjustments to the valuation of foreign securities to more accurately reflect their fair value as of the close of regular trading on the New York Stock Exchange. When valuing foreign equity securities that meet certain criteria, the Trustees have approved the use of a fair value service that values such securities to reflect market trading that occurs after the close of the applicable foreign markets of comparable securities or other instruments that have a strong correlation to the fair valued securities. Investments held by the Fund for which valuations or market quotations are unavailable are valued at fair value using methods determined in good faith by or at the direction of the Trustees of the Fund considering relevant factors, data and information including the market value of freely tradable securities of the same class in the principal market on which such securities are normally traded.
B Income — Dividend income is recorded on the ex-dividend date for dividends received in cash and/or securities. however, if the ex-dividend date has passed, certain dividends from foreign securities are recorded as the Fund is informed of the ex-dividend date. Withholding taxes on foreign dividends and capital gains have been provided for in accordance with the fund’s understanding of the applicable countries’ tax rules and rates. Interest income is determined on the basis of interest accrued, adjusted for amortization of premium or accretion of discount.
C Federal Taxes — The Fund’s policy is to comply with the provisions of the Internal Revenue Code applicable to regulated investment companies and to distribute to shareholders each year all of its taxable income, including any net realized gain on investments. Accordingly, no provision for federal income or excise tax is necessary.
D Foreign Currency Translation — Investment valuations, other assets, and liabilities initially expressed in foreign currencies are converted each business day into U.S. dollars based upon current exchange rates. Purchases and sales of foreign investment securities and income and expenses are converted into U.S. dollars based upon currency exchange rates prevailing on the respective dates of such transactions. Recognized gains or losses on investment transactions attributable to changes in foreign currency exchange rates are recorded for financial statement purposes as net realized gains and losses on investments. That portion of unrealized gains and losses on investments that results from fluctuations in foreign currency exchange rates is not separately disclosed.
E Expenses — The majority of expenses of the Trust are directly identifiable to an individual fund. Expenses which are not readily identifiable to a specific fund are allocated taking into consideration, among other things, the nature and type of expense and the relative size of the funds.
F Expense Reduction — Investors Bank & Trust Company (IBT) serves as custodian to the Fund. Pursuant to the custodian agreement, IBT receives a fee reduced by credits which are determined based on the average daily cash balance the Fund maintains with IBT. All credit balances used to reduce the Fund’s custodian fee are reported as a reduction of total expenses in the Statement of Operations.
11
G Use of Estimates — The preparation of financial statements in conformity with accounting principles generally accepted in the United States of America requires management to make estimates and assumptions that affect the reported amounts of assets and liabilities at the date of the financial statements and the reported amounts of income and expense during the reporting period. Actual results could differ from those estimates.
H Indemnifications — Under the Trust’s organizational documents, its officers and Trustees may be indemnified against certain liabilities and expenses arising out of the performance of their duties to the Fund and shareholders are indemnified against personal liability for obligations of the Trust. Additionally, in the normal course of business, the Fund enters into agreements with service providers that may contain indemnification clauses. The Fund’s maximum exposure under these arrangements is unknown as this would involve future claims that may be made against the Fund that have not yet occurred.
I Other — Investment transactions are accounted for on the date the securities are purchased or sold. Realized gains and losses are determined on the basis of identified cost. Distributions to shareholders are recorded on the ex-dividend date.
2 Distributions to Shareholders
It is the present policy of the Fund to distribute annually substantially all of the net investment income of the Fund and to distribute, at least annually, substantially all of its net realized capital gains, if any. Distributions are paid in the form of additional shares of the Fund or, at the election of the shareholder, in cash. Shareholders may reinvest distributions in additional shares of the Fund at the net asset value as of the ex-dividend date. The Fund distinguishes between distributions on a tax basis and a financial reporting basis. Permanent differences between book and tax accounting relating to distributions are reclassified to paid-in capital.
The tax character of distributions paid during the years ended October 31, 2006 and October 31, 2005 was as follows:
| | Year Ended
October 31, 2006 | | Year Ended
October 31, 2005 | |
Distributions declared from: | | | | | |
Ordinary income | | $ | 8,864 | | $ | 4,361 | |
Long-term capital gain | | $ | 82,951 | | — | |
| | | | | | | |
During the year ended October 31, 2006, accumulated undistributed net investment income was increased by $105, paid-in capital was increased by $2 and accumulated net realized gain was decreased by $107 primarily due to differences between book and tax accounting for currency gains. These changes had no effect on the net assets or the net asset value per share.
As of October 31, 2006, the components of distributable earnings (accumulated losses) on a tax basis were as follows:
Accumulated undistributed net investment income | | $ | 10,404 | |
Accumulated net realized gain | | $ | 129,087 | |
Unrealized gain | | $ | 379,945 | |
The differences between components of distributable earnings (accumulated losses) on a tax basis and the amounts reflected in the statement of assets and liabilities are primarily due to wash sales.
3 Shares of Beneficial Interest
The Fund’s Declaration of Trust permits the Trustees to issue an unlimited number of full and fractional shares of beneficial interest (without par value). Such shares may be issued in a number of different series (such as the Fund) and classes. Transactions in shares of beneficial interest were as follows:
Class A | | Year Ended
October 31, 2006 | | Year Ended
October 31, 2005 | |
Sales | | 91,410 | | 69,579 | |
Issued to shareholders electing to receive payments of distributions in Fund shares | | 7,518 | | 378 | |
Redemptions | | (11,267 | ) | (47,423 | ) |
Net increase | | 87,661 | | 22,534 | |
At October 31, 2006, Eaton Vance Management (EVM) and an EVM retirement plan owned 20% and 44%, respectively, of the outstanding shares of the Fund.
4 Investment Adviser Fee and Other Transactions with Affiliates
The investment adviser fee is earned by EVM as compensation for management and investment advisory services rendered to the Fund. EVM receives a monthly advisory fee equal to 0.65% (annually) of the average daily net assets of the Fund up to $500 million and at reduced rates as daily net assets exceed that level. For the year ended October 31, 2006, the fee amounted to $15,040, all of which was waived. An administrative fee is earned by EVM as compensation for administering certain business affairs of the Fund. The fee is equal to 0.15% (annually) of the average daily net assets of the Fund. For the year ended October 31, 2006, the fee amounted to $3,472, all of which was waived. EVM has contractually agreed to limit net annual Fund operating expenses to 1.40% for Class A. The expense limitation will continue for at least one year, beginning on March 1, 2006.
12
There is no guarantee the expense limitation will continue beyond such date. For the year ended October 31, 2006, EVM has voluntarily agreed to further limit net annual Fund operating expenses to 1.25% for Class A. This voluntary expense reduction could be terminated at any time. Pursuant to these expense reductions, EVM was allocated $68,311 of the Fund’s operating expenses. EVM serves as the sub-transfer agent of the Fund and receives an aggregate fee based on the actual expenses incurred by EVM in the performance of those services. For the year ended October 31, 2006, EVM received $96 in sub-transfer agent fees from the Fund.
Except as to Trustees of the Fund who are not members of EVM’s organization, officers and Trustees receive remuneration for their services to the Fund out of such investment adviser fee. Trustees of the Fund who are not affiliated with the Investment Adviser may elect to defer receipt of all or a percentage of their annual fees in accordance with the terms of the Trustees Deferred Compensation Plan. For the year ended October 31, 2006, no significant amounts have been deferred. Certain officers and Trustees of the Fund are officers of the above organization.
5 Distribution Plan
Class A has in effect a distribution plan pursuant to Rule 12b-1 under the Investment Company Act of 1940 (Class A Plan). The Class A Plan provides that the Fund will pay Eaton Vance Distributor’s, Inc. (EVD) a distribution and service fee of 0.25% of the Fund’s average daily net assets attributable to Class A shares for each fiscal year for distribution services and facilities provided to the Fund by EVD, as well as for personal services and/or the maintenance of shareholder accounts. Distribution and service fees paid or accrued for the year ended October 31, 2006 amounted to $5,788 for Class A shares.
6 Contingent Deferred Sales Charge
Prior to September 15, 2006, Class A shares purchased at net asset value in amounts of $1 million or more (other than shares purchased in a single transaction of $5 million or more) were subject to a 1% contingent deferred sales charge (CDSC) if redeemed within 12 months of purchase. Effective September 15, 2006, all purchases of Class A shares of $1 million or more will be subject to a 1% CDSC in the event of redemption within 18 months of purchase. Generally, the CDSC is based upon the lower of the net asset value at date of redemption or date of purchase. No charge is levied on shares acquired by reinvestment of dividends or capital gains distributions. No CDSC is levied on shares which have been sold to EVD or its affiliates or to their respective employees or clients and may be waived under certain other limited conditions. EVD did not receive any CDSC paid by Class A shareholders for the year ended October 31, 2006.
7 Investment Transactions
Purchases and sales of investments, other than short-term obligations, aggregated $2,575,356 and $1,596,692, respectively for the year ended October 31, 2006.
8 Federal Income Tax Basis of Unrealized Appreciation (Depreciation)
The cost and unrealized appreciation (depreciation) in value of the investments owned at October 31, 2006, as computed on a federal income tax basis, were as follows:
Aggregate cost | | $ | 2,564,961 | |
Gross unrealized appreciation | | $ | 399,286 | |
Gross unrealized depreciation | | (19,290 | ) |
Net unrealized appreciation | | $ | 379,996 | |
The net unrealized depreciation on foreign currency at October 31, 2006 was $51.
9 Line of Credit
The Fund participates with other portfolios and funds managed by BMR and EVM and its affiliates in a $150 million unsecured line of credit agreement with a group of banks. Borrowings will be made by the Fund solely to facilitate the handling of unusual and/or unanticipated short-term cash requirements. Interest is charged to each participating portfolio or fund based on its borrowings at an amount above either the Eurodollar rate or federal funds rate. In addition, a fee computed at an annnual rate of 0.10% on the daily unused portion of the line of cerdit is allocated among the participating portfolios and funds at the end of each quarter. The Fund did not have any siginificant borrowings or allocated fees during the year ended October 31, 2006.
10 Recently Issued Accounting Pronouncements
In June 2006, the Financial Accounting Standards Board (“FASB”) issued FASB interpretation No. 48, (“FIN 48”) “Accounting for uncertainty in income Taxes – an interpretation of FASB Statement No. 109”. FIN 48 clarifies the accounting for uncertainty in income taxes recognized in accordance with FASB Statement No. 109, “Accounting for Income Taxes.” The interpretation prescribes a recognition threshold and measurement attribute for the financial statement recognition and measurement of a tax position taken or expected to be taken in a tax return. It also provides
13
guidance and de-recognition, classification, interest and penalties, accounting in interim periods, disclosure and transition. FIN 48 is effective for fiscal years beginning after December 15, 2006. Management is currently evaluating the impact of applying the various provisions of FIN 48.
In September 2006, the FASB issued Statement of Financial Accounting Standards No. 157, (“FAS 157”) “Fair Value Measurements”. FAS 157 defines fair value, establishes a framework for measuring fair value in accordance with generally accepted accounting principles and expands disclosure about fair value measurements. FAS 157 is effective for fiscal years beginning after November 15, 2007. Management is currently evaluating the impact the adoption of FAS 157 will have on the Fund’s financial statement disclosures.
14
Eaton Vance Equity Research Fund as of October 31, 2006
REPORT OF INDEPENDENT REGISTERED PUBLIC ACCOUNTING FIRM
To the Trustees and Shareholders of Eaton Vance Equity Research Fund:
In our opinion, the accompanying statement of assets and liabilities, including the portfolio of investments, and the related statements of operations and of changes in net assets and the financial highlights present fairly, in all material respects, the financial position of Eaton Vance Equity Research Fund, a series of Eaton Vance Mutual Funds Trust (the “Fund”), at October 31, 2006, and the results of its operations, the changes in its net assets and the financial highlights for each of the periods indicated, in conformity with accounting principles generally accepted in the United States of America. These financial statements and financial highlights (hereafter referred to as “financial statements”) are the responsibility of the Fund’s management; our responsibility is to express an opinion on these financial statements based on our audits. We conducted our audits of these financial statements in accordance with the standards of the Public Company Accounting Oversight Board (United States). Those standards require that we plan and perform the audit to obtain reasonable assurance about whether the financial statements are free of material misstatement. An audit includes examining, on a test basis, evidence supporting the amounts and disclosures in the financial statements, assessing the accounting principles used and significant estimates made by management, and evaluating the overall financial statement presentation. We believe that our audits, which included confirmation of securities at October 31, 2006 by correspondence with the custodian and brokers, provide a reasonable basis for our opinion.
PricewaterhouseCoopers LLP
Boston, Massachusetts
December 19, 2006
15
Eaton Vance Equity Research Fund
FEDERAL TAX INFORMATION (Unaudited)
The Form 1099-DIV you receive in January 2007 will show the tax status of all distributions paid to your account in calendar 2006. Shareholders are advised to consult their own tax adviser with respect to the tax consequences of their investment in the Fund. As required by the Internal Revenue Code regulations, shareholders must be notified within 60 days of the Fund’s fiscal year end regarding the status of qualified dividend income for individuals, the dividends received deduction for corporations and capital gains dividends.
Qualified Dividend Income. The Fund designates approximately $33,946, or up to the maximum amount of such dividends allowable pursuant to the Internal Revenue Code, as qualified dividend income eligible for the reduced tax rate of 15%.
Dividends Received Deduction. Corporate shareholders are generally entitled to take the dividends received deduction on the portion of the Fund’s dividend distribution that qualifies under tax law. For the Fund’s fiscal year 2006 ordinary income dividends, 100% qualifies for the corporate dividends received deduction.
Capital Gains Dividends. The Fund designates $82,951 as a capital gain dividend.
16
Eaton Vance Equity Research Fund
BOARD OF TRUSTEES’ ANNUAL APPROVAL OF THE INVESTMENT ADVISORY AGREEMENT
Overview of the Contract Review Process
The Investment Company Act of 1940, as amended (the “1940 Act”), provides, in substance, that each investment advisory agreement between a fund and its investment adviser will continue in effect from year to year only if its continuance is approved at least annually by the fund’s board of trustees, including by a vote of a majority of the trustees who are not “interested persons” of the fund (“Independent Trustees”) cast in person at a meeting called for the purpose of considering such approval.
At a meeting of the Boards of Trustees (each a “Board”) of the Eaton Vance group of mutual funds (the “Eaton Vance Funds”) held on March 27, 2006, the Board, including a majority of the Independent Trustees, voted to approve continuation of existing advisory and sub-advisory agreements for the Eaton Vance Funds for an additional one-year period. In voting its approval, the Board relied upon the affirmative recommendation of the Special Committee of the Board, which is a committee comprised exclusively of Independent Trustees. Prior to making its recommendation, the Special Committee reviewed information furnished for a series of meetings of the Special Committee held in February and March 2006. Such information included, among other things, the following:
Information about Fees, Performance and Expenses
· An independent report comparing the advisory and related fees paid by each fund with fees paid by comparable funds;
· An independent report comparing each fund’s total expense ratio and its components to comparable funds;
· An independent report comparing the investment performance of each fund to the investment performance of comparable funds over various time periods;
· Data regarding investment performance in comparison to relevant peer groups of funds and appropriate indices;
· Comparative information concerning fees charged by each adviser for managing other mutual funds and institutional accounts using investment strategies and techniques similar to those used in managing the fund;
· Profitability analyses for each adviser with respect to each fund managed by it;
Information about Portfolio Management
· Descriptions of the investment management services provided to each fund, including the investment strategies and processes employed;
· Information concerning the allocation of brokerage and the benefits received by each adviser as a result of brokerage allocation, including information concerning the acquisition of research through “soft dollar” benefits received in connection with the funds’ brokerage, and the implementation of a soft dollar reimbursement program established with respect to the funds;
· Data relating to portfolio turnover rates of each fund;
· The procedures and processes used to determine the fair value of fund assets and actions taken to monitor and test the effectiveness of such procedures and processes;
Information about each Adviser
· Reports detailing the financial results and condition of each adviser;
· Descriptions of the qualifications, education and experience of the individual investment professionals whose responsibilities include portfolio management and investment research for the funds, and information relating to their compensation and responsibilities with respect to managing other mutual funds and investment accounts;
· Copies of the Codes of Ethics of each adviser and its affiliates, together with information relating to compliance with and the administration of such codes;
· Information concerning the resources devoted to compliance efforts undertaken by each adviser and its affiliates on behalf of the funds (including descriptions of various compliance programs) and their record of compliance with investment policies and restrictions, including policies with respect to market-timing, late trading and selective portfolio disclosure, and with policies on personal securities transactions;
· Descriptions of the business continuity and disaster recovery plans of each adviser and its affiliates;
17
Other Relevant Information
· Information concerning the nature, cost and character of the administrative and other non-investment management services provided by Eaton Vance Management and its affiliates;
· Information concerning management of the relationship with the custodian, subcustodians and fund accountants by each adviser or the funds’ administrator; and
· The terms of each advisory agreement.
In addition to the information identified above, the Special Committee considered information provided from time to time by each adviser throughout the year at meetings of the Board and its committees. Over the course of the twelve month period ended March 31, 2006, the Board met nine times and the Special Committee, the Audit Committee and the Governance Committee, each of which is a Committee comprised solely of independent Trustees, met eight, twelve and five times, respectively. At such meetings, the Trustees received, among other things, presentations by the portfolio managers and other investment professionals of each adviser relating to the investment performance of each fund and the investment strategies used in pursuing the fund’s investment objective.
For funds that invest through one or more underlying portfolios, the Board considered similar information about the portfolio(s) when considering the approval of advisory agreements. In addition, in cases where the fund’s investment adviser has engaged a sub-adviser, the Board considered similar information about the sub-adviser when considering the approval of any sub-advisory agreement.
The Special Committee was assisted throughout the contract review process by Goodwin Procter LLP, legal counsel for the Independent Trustees. The members of the Special Committee relied upon the advice of such counsel and their own business judgment in determining the material factors to be considered in evaluating each advisory and sub-advisory agreement and the weight to be given to each such factor. The conclusions reached with respect to each advisory and sub-advisory agreement were based on a comprehensive evaluation of all the information provided and not any single factor. Moreover, each member of the Special Committee may have placed varying emphasis on particular factors in reaching conclusions with respect to each advisory and sub-advisory agreement.
Results of the Process
Based on its consideration of the foregoing, and such other information as it deemed relevant, including the factors and conclusions described below, the Special Committee concluded that the continuance of the investment advisory agreement of the Eaton Vance Equity Research Fund (the “Fund”) with Eaton Vance Management (the “Adviser”), including its fee structure, is in the interests of shareholders and, therefore, the Special Committee recommended to the Board approval of the agreement. The Board accepted the recommendation of the Special Committee as well as the factors considered and conclusions reached by the Special Committee with respect to the agreement. Accordingly, the Board, including a majority of the Independent Trustees, voted to approve continuation of the advisory agreement for the Fund.
Nature, Extent and Quality of Services
In considering whether to approve the investment advisory agreement of the Fund, the Board evaluated the nature, extent and quality of services provided to the Fund by the Adviser.
The Board considered the Adviser’s management capabilities and investment process with respect to the types of investments held by the Fund, including the education, experience and number of its investment professionals and other personnel who provide portfolio management, investment research, and similar services to the Fund. In particular, the Board evaluated, where relevant, the abilities and experience of such investment personnel in analyzing factors such as credit risk, tax efficiency, and special considerations relevant to investing in foreign markets. Specifically, the Board considered the Adviser’s in-house equity research capabilities. The Board also took into account the resources dedicated to portfolio management and other services, including the compensation paid to recruit and retain investment personnel, and the time and attention devoted to each Fund in the complex by senior management.
The Board reviewed the compliance programs of the Adviser and relevant affiliates thereof. Among other matters, the Board considered compliance and reporting matters relating to personal trading by investment personnel, selective disclosure of portfolio holdings, late trading, frequent trading, portfolio valuation, business continuity and the allocation of investment opportunities. The Board also evaluated the responses of the Adviser and its affiliates to requests from regulatory authorities such as the Securities and Exchange Commission and the National Association of Securities Dealers.
The Board considered shareholder and other administrative services provided or managed by Eaton Vance Management and its affiliates, including transfer agency and accounting services. The Board evaluated the benefits to shareholders of investing in a fund that is a part of a large family of funds, including the ability, in many cases, to exchange an investment among different funds without incurring additional sales charges.
18
After consideration of the foregoing factors, among others, the Board concluded that the nature, extent and quality of services provided by the Adviser, taken as a whole, are appropriate and consistent with the terms of the investment advisory agreement.
Fund Performance
The Board compared the Fund’s investment performance to a relevant universe of similarly managed funds identified by an independent data provider and appropriate benchmark indices. The Board reviewed comparative performance data for the one- and three-year periods ended September 30, 2005 for the Fund. On the basis of the foregoing and other relevant information, the Board concluded that the performance of the Fund is satisfactory.
Management Fees and Expenses
The Board reviewed contractual investment advisory fee rates, including administrative fee rates payable by the Fund (referred to collectively as “management fees”). As part of its review, the Board considered the Fund’s management fees (including administrative fees) and total expense ratio for the one-year period ended September 30, 2005, as compared to a group of similarly managed funds selected by an independent data provider. The Board considered the fact that the Adviser had waived fees and/or paid expenses for the Fund.
After reviewing the foregoing information, and in light of the nature, extent and quality of the services provided by the Adviser, the Board concluded that the management fees charged for advisory and related services and the Fund’s total expense ratio are reasonable.
Profitability
The Board reviewed the level of profits realized by the Adviser and relevant affiliates thereof in providing investment advisory and administrative services to the Fund and to all Eaton Vance Funds as a group. The Board considered the level of profits realized without regard to revenue sharing or other payments by the Adviser and its affiliates to third parties in respect of distribution services. The Board also considered other direct or indirect benefits received by the Adviser and its affiliates in connection with its relationship with the Fund, including the benefits of research services that may be available to the Adviser as a result of securities transactions effected for the Fund and other investment advisory clients.
The Board concluded that, in light of the foregoing factors and the nature, extent and quality of the services rendered, the profits realized by the Adviser and its affiliates are reasonable.
Economies of Scale
In reviewing management fees and profitability, the Board also considered the extent to which the Adviser and its affiliates, on the one hand, and the Fund, on the other hand, can expect to realize benefits from economies of scale as the assets of the Fund increase. The Board acknowledged the difficulty in accurately measuring the benefits resulting from the economies of scale with respect to the management of any specific fund or group of funds. The Board reviewed data summarizing the increases and decreases in the assets of the Fund and of all Eaton Vance Funds as a group over various time periods, and evaluated the extent to which the total expense ratio of the Fund and the Adviser’s profitability may have been affected by such increases or decreases. Based upon the foregoing, the Board concluded that the benefits from economies of scale are currently being shared equitably by the Adviser and the Fund. The Board also concluded that, the structure of the advisory fee, which includes breakpoints at several asset levels, can be expected to cause the Adviserand its affiliates and the Fund to continue to share such benefits equitably.
19
Eaton Vance Equity Research Fund
MANAGEMENT AND ORGANIZATION
Fund Management
The Trustees of Eaton Vance Mutual Funds Trust (the Trust), are responsible for the overall management and supervision of the Trust’s affairs. The Trustees and officers of the Trust are listed below. Except as indicated, each individual has held the office shown or other offices in the same company for the last five years. Trustees and officers of the Trust hold indefinite terms of office. The “noninterested Trustees” consist of those Trustees who are not “interested persons” of the Trust, as that term is defined under the 1940 Act. The business address of each Trustee and officer is The Eaton Vance Building, 255 State Street, Boston, Massachusetts, 02109. As used below, “EVC” means Eaton Vance Corporation, “EV” means Eaton Vance, Inc., “EVM” means Eaton Vance Management, “BMR” means Boston Management and Research, “EVD” means Eaton Vance Distributors, Inc, and “Parametric” refers to Parametric Portfolio Associates. EVC and EV are the corporate parent and trustee, respectively, of EVM and BMR. EVD is the Fund’s principal underwriter and a wholly-owned subsidiary of EVM. Each officer affiliated with Eaton Vance may hold a position with other Eaton Vance affiliates that is comparable to his or her position with EVM listed below.
Name and
Date of Birth | | Position(s)
with the
Trust | | Term of
Office and
Length of
Service | | Principal Occupation(s)
During Past Five Years | | Number of
Portfolios in
Fund Complex
Overseen
By Trustee(1) | | Other
Directorships
Held |
Interested Trustee | | | | | | | | | | |
James B. Hawkes 11/9/41 | | Trustee | | Since 1991 | | Chairman, President and Chief Executive Officer of BMR, EVC, EVM and EV; Director of EV; Vice President and Director of EVD. Trustee and/or officer of 170 registered investment companies in the Eaton Vance Fund Complex. Mr. Hawkes is an interested person because of his positions with BMR, EVM, EVC and EV, which are affiliates of the Trust. | | 170 | | Director of EVC |
20
Name and
Date of Birth | | Position(s)
with the
Trust | | Term of
Office and
Length of
Service | | Principal Occupation(s)
During Past Five Years | | Number of
Portfolios in
Fund Complex
Overseen
By Trustee(1) | | Other
Directorships
Held |
Noninterested Trustees |
Benjamin C. Esty 1/2/63 | | Trustee | | Since 2005 | | Roy & Elizabeth Simmons Professor of Business Administration, Harvard University Graduate School of Business Administration (since 2003). Formerly, Associate Professor, Harvard University Graduate School of Business Administration (2000-2003). | | 170 | | None |
| | | | | | | | | | |
Samuel L. Hayes, III 2/23/35 | | Trustee and Chairman of the Board | | Trustee since 1986 and Chairman of the Board since 2005 | | Jacob H. Schiff Professor of Investment Banking Emeritus, Harvard University Graduate School of Business Administration. Director of Yakima Products, Inc. (manufacturer of automotive accessories) (since 2001) and Director of Telect, Inc. (telecommunications services company). | | 170 | | Director of Tiffany & Co. (specialty retailer) |
| | | | | | | | | | |
William H. Park 9/19/47 | | Trustee | | Since 2003 | | Vice Chairman, Commercial Industrial Finance Corp. (specialty finance company) (since 2006). Formerly, President and Chief Executive Officer, Prizm Capital Management, LLC (investment management firm) (2002–2005). Formerly, Executive Vice President and Chief Financial Officer, United Asset Management Corporation (a holding company owning institutional investment management firms) (1982–2001). | | 170 | | None |
| | | | | | | | | | |
Ronald A. Pearlman 7/10/40 | | Trustee | | Since 2003 | | Professor of Law, Georgetown University Law Center. | | 170 | | None |
21
Name and
Date of Birth | | Position(s)
with the
Trust | | Term of
Office and
Length of
Service | | Principal Occupation(s)
During Past Five Years | | Number of
Portfolios in
Fund Complex
Overseen
By Trustee(1) | | Other
Directorships
Held |
Noninterested Trustees (continued) | | | | | | |
Norton H. Reamer 9/21/35 | | Trustee | | Since 1986 | | President, Chief Executive Officer and a Director of Asset Management Finance Corp. (a specialty finance company serving the investment management industry) (since October 2003) President, Unicorn Corporation (an investment and financial advisory services company) (since September 2000). Formerly, Chairman and Chief Operating Officer, Hellman, Jordan Management Co., Inc. (an investment management company) (2000–2003). Formerly, Advisory Director, Berkshire Capital Corporation (investment banking firm) (2002–2003). | | 170 | | None |
| | | | | | | | | | |
Lynn A. Stout
9/14/57 | | Trustee | | Since 1998 | | Professor of Law, University of California at Los Angeles School of Law. | | 170 | | None |
| | | | | | | | | | |
Ralph F. Verni
1/26/43 | | Trustee | | Since 2005 | | Consultant and private investor. | | 170 | | None |
22
Name and
Date of Birth | | Position(s)
with the
Trust | | Term of
Office and
Length of
Service | | Principal Occupation(s)
During Past Five Years |
Principal Officers Who Are Not Trustees |
Thomas E. Faust Jr.
5/31/58 | | President | | Since 2002 | | President of EVC, EVM, BMR and EV and Director of EVC. Chief Investment Officer of EVC, EVM and BMR. Officer of 71 registered investment companies and 5 private investment companies managed by EVM or BMR. |
| | | | | | |
William H. Ahern, Jr.
7/28/59 | | Vice President | | Since 1995 | | Vice President of EVM and BMR. Officer of 71 registered investment companies managed by EVM or BMR. |
| | | | | | |
Cynthia J. Clemson
3/2/63 | | Vice President | | Since 2005 | | Vice President of EVM and BMR. Officer of 86 registered investment companies managed by EVM or BMR. |
| | | | | | |
Aamer Khan
6/7/60 | | Vice President | | Since 2005 | | Vice President of EVM and BMR. Officer of 29 registered investment companies managed by EVM or BMR. |
| | | | | | |
Thomas H. Luster
4/8/62 | | Vice President | | Since 2006 | | Vice President of EVM and BMR. Officer of 45 registered investment companies managed by EVM or BMR. |
| | | | | | |
Michael R. Mach
7/15/47 | | Vice President | | Since 1999 | | Vice President of EVM and BMR. Officer of 51 investment companies managed by EVM or BMR. |
| | | | | | |
Robert B. MacIntosh
1/22/57 | | Vice President | | Since 1998 | | Vice President of EVM and BMR. Officer of 86 registered investment companies managed by EVM or BMR. |
| | | | | | |
Cliff Quisenberry, Jr.
1/1/65 | | Vice President | | Since 2006 | | Vice President and Director of Research and Product Development of Parametric. Officer of 30 registered investment companies managed by EVM or BMR. |
23
Name and
Date of Birth | | Position(s)
with the
Trust | | Term of
Office and
Length of
Service | | Principal Occupation(s)
During Past Five Years |
Principal Officers Who Are Not Trustees (continued) | | |
Duncan W. Richardson
10/26/57 | | Vice President | | Since 2001 | | Executive Vice President and Chief Equity Investment Officer of EVC, EVM and BMR. Officer of 71 registered investment companies managed by EVM or BMR. |
| | | | | | |
Walter A. Row, III
7/20/57 | | Vice President | | Since 2001 | | Director of Equity Research and a Vice President of EVM and BMR. Officer of 33 registered investment companies managed by EVM or BMR. |
| | | | | | |
Judith A. Saryan
8/21/54 | | Vice President | | Since 2003 | | Vice President of EVM and BMR. Officer of 50 registered investment companies managed by EVM or BMR. |
| | | | | | |
Susan Schiff
3/31/61 | | Vice President | | Since 2003 | | Vice President of EVM and BMR. Officer of 30 registered investment companies managed by EVM or BMR. |
| | | | | | |
Barbara E. Campbell
6/19/57 | | Treasurer | | Since 2005 (2) | | Vice President of EVM and BMR. Officer of 170 registered investment companies managed by EVM or BMR. |
| | | | | | |
Alan R. Dynner
10/10/40 | | Secretary | | Since 1997 | | Vice President, Secretary and Chief Legal Officer of BMR, EVM, EVD, EV and EVC. Officer of 170 registered investment companies managed by EVM or BMR. |
| | | | | | |
Paul M. O’Neil
7/1/53 | | Chief Compliance Officer | | Since 2004 | | Vice President of EVM and BMR. Officer of 170 registered investment companies managed by EVM or BMR. |
(1) Includes both master and feeder funds in a master-feeder structure.
(2) Prior to 2005, Ms. Campbell served as Assistant Treasurer since 1995.
The SAI for the Fund includes additional information about the Trustees and officers of the Fund and can be obtained without charge by calling 1-800-225-6265.
24
Investment Adviser and Administrator of Eaton Vance Equity Research Fund
Eaton Vance Management
The Eaton Vance Building
255 State Street
Boston, mA 02109
Principal Underwriter
Eaton Vance Distributors, Inc.
The Eaton Vance Building
255 State Street
Boston, MA 02109
(617) 482-8260
Custodian
Investors Bank & Trust Company
200 Clarendon Street
Boston, MA 02116
Transfer Agent
pfpc Inc.
Attn: Eaton Vance Funds
P.O. Box 9653
Providence, ri 02940-9653
(800) 262-1122
Independent Registered Public Accounting Firm
PricewaterhouseCoopers llp
125 High Street
Boston, MA 02110
Eaton Vance Equity Research Fund
The Eaton Vance Building
255 State Street
Boston, ma 02109
This report must be preceded or accompanied by a current prospectus. Before investing, investors should consider carefully the Fund’s investment objective(s), risks, and charges and expenses. The Fund’s current prospectus contains this and other information about the Fund and is available through your financial advisor. Please read the prospectus carefully before you invest or send money. For further information please call 1-800-225-6265.

Annual Report October 31, 2006


EATON VANCE
TAX-MANAGED
SMALL-CAP
VALUE
FUND
IMPORTANT NOTICES REGARDING PRIVACY,
DELIVERY OF SHAREHOLDER DOCUMENTS,
PORTFOLIO HOLDINGS AND PROXY VOTING
Privacy. The Eaton Vance organization is committed to ensuring your financial privacy. Each of the financial institutions identified below has in effect the following policy ("Privacy Policy") with respect to nonpublic personal information about its customers:
• Only such information received from you, through application forms or otherwise, and information about your Eaton Vance fund transactions will be collected. This may include information such as name, address, social security number, tax status, account balances and transactions.
• None of such information about you (or former customers) will be disclosed to anyone, except as permitted by law (which includes disclosure to employees necessary to service your account). In the normal course of servicing a customer's account, Eaton Vance may share information with unaffiliated third parties that perform various required services such as transfer agents, custodians and broker/dealers.
• Policies and procedures (including physical, electronic and procedural safeguards) are in place that are designed to protect the confidentiality of such information.
• We reserve the right to change our Privacy Policy at any time upon proper notification to you. Customers may want to review our Policy periodically for changes by accessing the link on our homepage: www.eatonvance.com.
Our pledge of privacy applies to the following entities within the Eaton Vance organization: the Eaton Vance Family of Funds, Eaton Vance Management, Eaton Vance Investment Counsel, Boston Management and Research, and Eaton Vance Distributors, Inc.
In addition, our Privacy Policy only applies to those Eaton Vance customers who are individuals and who have a direct relationship with us. If a customer's account (i.e. fund shares) is held in the name of a third-party financial adviser/broker-dealer, it is likely that only such adviser's privacy policies apply to the customer. This notice supersedes all previously issued privacy disclosures.
For more information about Eaton Vance's Privacy Policy, please call 1-800-262-1122.
Delivery of Shareholder Documents. The Securities and Exchange Commission (the "SEC") permits funds to deliver only one copy of shareholder documents, including prospectuses, proxy statements and shareholder reports, to fund investors with multiple accounts at the same residential or post office box address. This practice is often called "householding" and it helps eliminate duplicate mailings to shareholders.
Eaton Vance, or your financial adviser, may household the mailing of your documents indefinitely unless you instruct Eaton Vance, or your financial adviser, otherwise.
If you would prefer that your Eaton Vance documents not be householded, please contact Eaton Vance at 1-800-262-1122, or contact your financial adviser.
Your instructions that householding not apply to delivery of your Eaton Vance documents will be effective within 30 days of receipt by Eaton Vance or your financial adviser.
Portfolio Holdings. Each Eaton Vance Fund and its underlying Portfolio (if applicable) will file a schedule of its portfolio holdings on Form N-Q with the SEC for the first and third quarters of each fiscal year. The Form N-Q will be available on the Eaton Vance website www.eatonvance.com, by calling Eaton Vance at 1-800-262-1122 or in the EDGAR database on the SEC's website at www.sec.gov. Form N-Q may also be reviewed and copied at the SEC's public reference room in Washington, D.C. (call 1-800-732-0330 for information on the operation of the public reference room).
Proxy Voting. From time to time, funds are required to vote proxies related to the securities held by the funds. The Eaton Vance Funds or their underlying Portfolios (if applicable) vote proxies according to a set of policies and procedures approved by the Funds' and Portfolios' Boards. You may obtain a description of these policies and procedures and information on how the Funds or Portfolios voted proxies relating to Portfolio securities during the most recent 12 month period ended June 30, without charge, upon request, by calling 1-800-262-1122. This description is also available on the SEC's website at www.sec.gov.
Eaton Vance Tax-Managed Small-Cap Value Fund as of October 31, 2006
MANAGEMENT‘S DISCUSSION OF FUND PERFORMANCE

Gregory R. Greene, CFA,
Lead Portfolio Manager
The Fund
Performance for the Past Year
· For the year ended October 31, 2006, the Fund’s Class A shares had a total return of 11.24%. This return was the result of an increase in net asset value (NAV) per share to $15.40 on October 31, 2006, from $14.64 on October 31, 2005, and the distribution of $0.8182 per share in capital gains.(1)
· The Fund’s Class B shares had a total return of 10.45% for the same period, the result of an increase in NAV per share to $14.87 from $14.26 and the distribution of $0.8182 per share in capital gains.(1)
· The Fund’s Class C shares had a total return of 10.44% for the same period, the result of an increase in NAV per share to $14.88 from $14.27 and the distribution of $0.8182 per share in capital gains.(1)
· For comparison, the Fund’s benchmark, the S&P SmallCap 600 Index (the S&P 600) – a broad-based, unmanaged market index of small-capitalization stocks – had a total return of 16.10% during the period. The Fund’s peer group, the Lipper Small Cap Value Funds Classification, had an average total return of 16.79%.(2)
See pages 3 and 4 for more performance information, including after-tax returns.
Management Discussion
· Tax-Managed Small-Cap Value Portfolio (the “Portfolio”), a separate registered investment company in which the Fund invests, invests primarily in value stocks of small-cap companies. Value stocks are common stocks that, in the opinion of the investment adviser, are undervalued or inexpensive relative to the overall stock market based on one of more measures of value.
· The U.S. economy showed impressive strength in the first half of the fiscal year, amid high consumer confidence, strong job creation and solid corporate earnings growth. However, the economy moderated in the second half of the fiscal year ended October 31, 2006, as the combination of rising interest rates and higher energy costs finally began to take a toll on consumer spending.
· The stock market moved modestly higher through April, but underwent a sharp correction in May and June 2006, as the spike in oil prices and the flagging real estate market temporarily cooled investor sentiment. In mid-summer, the market regained its footing on signs of improving corporate earnings and extended its rally through October 31, 2006. Small-cap stocks outperformed their larger-cap counterparts, with value stocks – dominated by energy and building materials – leading the market.
· Management maintained a balance in the Portfolio between cyclical stocks and non-economy sensitive stocks, with a focus on what management deemed higher quality value stocks with good earnings visibility. This emphasis on higher quality hurt relative performance against the Fund’s benchmark, as lower quality stocks paced the value stock universe during the fiscal year.(2)
· The Portfolio’s leading performers during the fiscal year were in the energy, health care and information technology sectors. An overweighting in the energy equipment area produced significant gains, as these companies enjoyed robust demand from exploration companies for drilling products and services. Health care equipment stocks also turned in good showings, as selected companies posted strong revenue growth. Stock selection among electrical equipment manufacturers was additive to performance, as the companies enjoyed strong demand for niche products, such as electronic cables and electric motors during the Fund’s fiscal year.
(1) | | These returns do not include the 5.75% maximum sales charge for Class A shares or the applicable contingent deferred sales charge (CDSC) for Class B and Class C shares. If sales charges were deducted, the returns would be lower. Absent an allocation of certain expenses to the administrator of the Fund and the sub-adviser of the Portfolio, the returns would be lower. |
| | |
(2) | | It is not possible to invest directly in an Index or a Lipper Classification. The Index’s total return does not reflect commissions or expenses that would have been incurred if an investor individually purchased or sold the securities represented in the Index. The Lipper average is the average total return, at net asset value, of the funds that are in the same Lipper Classification as the Fund. |
Past performance is no guarantee of future results. Returns are historical and are calculated by determining the percentage change in net asset value or offering price (as applicable) with all distributions reinvested. Investment return and principal value will fluctuate so that shares, when redeemed, may be worth more or less than their original cost. Performance is for stated time period only; due to market volatility, the Fund’s current performance may be lower or higher than the quoted return. For performance as of the most recent month end, please refer to www.eatonvance.com.
Fund shares are not insured by the FDIC and are not deposits or other obligations of, or guaranteed by, any depository institution. Shares are subject to investment risks, including possible loss of principal invested.
1
· Among the Portfolio’s laggard stocks, consumer staples stocks constrained performance. Financial stocks also showed weakness, especially insurance stocks, which faced the twin challenges of a flat yield curve and an increasingly competitive environment. Machinery manufacturers were poor performers for the Portfolio during the fiscal year as they struggled with eroding margins due to higher raw materials costs and price competition from European manufacturers.
· Effective October 1, 2006, Gregory R. Greene became lead portfolio manager of the Portfolio. Mr. Greene is a Managing Director of Fox Asset Management (Fox), manages other Fox investment portfolios and has been employed by Fox for more than five years. The other members of the investment team are J. Bradley Ohlmuller and Robert J. Milmore.
The views expressed throughout this report are those of the portfolio managers and are current only through the end of the period of the report as stated on the cover. These views are subject to change at any time based upon market or other conditions, and the investment adviser disclaims any responsibility to update such views. These views may not be relied on as investment advice and, because investment decisions for a fund are based on many factors, may not be relied on as an indication of trading intent on behalf of any Eaton Vance fund.
Common Stock Investments by Sector(1)
By net assets
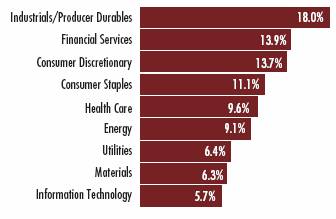
(1) As a percentage of the Portfolio’s net assets as of 10/31/06. Portfolio information may not be representative of the Portfolio’s current or future investments and may change due to active management.
Top Ten Holdings(2)
By net assets
Church & Dwight, Co., Inc. | | 4.8 | % |
Piedmont Natural Gas Co., Inc. | | 3.7 | |
Belden CDT, Inc. | | 3.6 | |
AptarGroup, Inc. | | 3.4 | |
RC2 Corp. | | 3.2 | |
West Pharmaceutical Services, Inc. | | 3.1 | |
Protective Life Corp. | | 2.9 | |
RPM International, Inc. | | 2.9 | |
Teleflex, Inc. | | 2.8 | |
Owens & Minor, Inc. | | 2.7 | |
(2) Top Ten Holdings represented 33.1% of Portfolio net assets as of October 31, 2006. Holdings are subject to change due to active management.
2
Eaton Vance Tax-Managed Small-Cap Value Fund as of October 31, 2006
FUND PERFORMANCE
The line graphs and table set forth below provide information about the Fund’s performance. The line graphs compare the performance of Class A, Class B and Class C of the Fund with that of the S&P SmallCap 600 Index, a broad-based, unmanaged market index of small-capitalization stocks. The lines on the graphs represent the total returns of a hypothetical investment of $10,000 in each of Class A, Class B and Class C and the S&P SmallCap 600 Index. Class A total returns are presented at net asset value and maximum public offering price. The table includes the total returns of each Class of the Fund at net asset value and public offering price. The performance presented below does not reflect the deduction of taxes, if any, that a shareholder would pay on distributions or redemptions of Fund shares.
Performance* | | Class A | | Class B | | Class C | |
Average Annual Total Returns (at net asset value) | | | | | | | |
One Year | | 11.24 | % | 10.45 | % | 10.44 | % |
Life of Fund† | | 11.01 | % | 10.22 | % | 10.23 | % |
| | | | | | | |
SEC Average Annual Total Returns (including sales charge or applicable CDSC) | | | | | | | |
One Year | | 4.86 | % | 5.45 | % | 9.44 | % |
Life of Fund† | | 9.61 | % | 9.91 | % | 10.23 | % |
†Inception Dates – 3/4/02 for all Classes.
* Average annual total returns do not include the 5.75% maximum sales charge for Class A shares or the applicable contingent deferred sales charge (CDSC) for Class B and Class C shares. If sales charges were deducted, returns would be lower. SEC average annual total returns for Class A reflect the maximum 5.75% sales charge. SEC returns for Class B shares reflect the applicable CDSC based on the following schedule: 5% - 1st and 2nd years; 4% - 3rd year; 3% - 4th year; 2% - 5th year; 1% - 6th year. SEC returns for Class C reflect a 1% CDSC for the first year. Absent an allocation of certain expenses to the administrator of the Fund and the subadviser of the Portfolio, the returns would be lower.
Past performance is no guarantee of future results. Returns are historical and are calculated by determining the percentage change in net asset value or offering price (as applicable) with all distributions reinvested. Investment return and principal value will fluctuate so that shares, when redeemed, may be worth more or less than their original cost. Performance is for stated time period only; due to market volatility, the Fund’s current performance may be lower or higher than the quoted return. For performance as of the most recent month end, please refer to www.eatonvance.com.
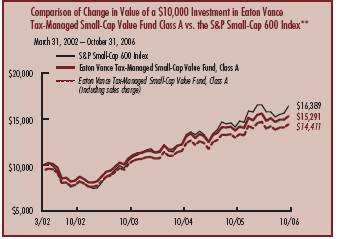

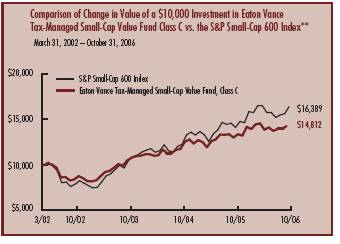
** Source: Thomson Financial. Investment operations commenced 3/4/02. It is not possible to invest directly in an Index. The Index’s total returns do not reflect commissions or expenses that would have been incurred if an investor individually purchased or sold the securities represented in the Index.
3
“Return Before Taxes” does not take into consideration shareholder taxes. It is most relevant to tax-free or tax-deferred shareholder accounts. “Return After Taxes on Distributions” reflects the impact of federal income taxes due on Fund distributions of dividends and capital gains. It is most relevant to taxpaying shareholders who continue to hold their shares. “Return After Taxes on Distributions and Sale of Fund Shares” also reflects the impact of taxes on capital gain or loss realized upon a sale of shares. It is most relevant to taxpaying shareholders who sell their shares.
Average Annual Total Returns
(For the periods ended October 31, 2006)
Returns at Net Asset Value (NAV) (Class A)
| | One Year | | Life of Fund | |
Return Before Taxes | | 11.24 | % | 11.01 | % |
Return After Taxes on Distributions | | 10.33 | % | 10.81 | % |
Return After Taxes on Distributions and Sale of Fund Shares | | 8.38 | % | 9.57 | % |
Returns at Public Offering Price (POP) (Class A)
| | One Year | | Life of Fund | |
Return Before Taxes | | 4.86 | % | 9.61 | % |
Return After Taxes on Distributions | | 4.01 | % | 9.42 | % |
Return After Taxes on Distributions and Sale of Fund Shares | | 4.17 | % | 8.33 | % |
Average Annual Total Returns
(For the periods ended October 31, 2006)
Returns at Net Asset Value (NAV) (Class C)
| | One Year | | Life of Fund | |
Return Before Taxes | | 10.44 | % | 10.23 | % |
Return After Taxes on Distributions | | 9.52 | % | 10.03 | % |
Return After Taxes on Distributions and Sale of Fund Shares | | 7.89 | % | 8.88 | % |
Returns at Public Offering Price (POP) (Class C)
| | One Year | | Life of Fund | |
Return Before Taxes | | 9.44 | % | 10.23 | % |
Return After Taxes on Distributions | | 8.52 | % | 10.03 | % |
Return After Taxes on Distributions and Sale of Fund Shares | | 7.24 | % | 8.88 | % |
Average Annual Total Returns
(For the periods ended October 31, 2006)
Returns at Net Asset Value (NAV) (Class B)
| | One Year | | Life of Fund | |
Return Before Taxes | | 10.45 | % | 10.22 | % |
Return After Taxes on Distributions | | 9.52 | % | 10.02 | % |
Return After Taxes on Distributions and Sale of Fund Shares | | 7.90 | % | 8.87 | % |
Returns at Public Offering Price (POP) (Class B)
| | One Year | | Life of Fund | |
Return Before Taxes | | 5.45 | % | 9.91 | % |
Return After Taxes on Distributions | | 4.52 | % | 9.71 | % |
Return After Taxes on Distributions and Sale of Fund Shares | | 4.65 | % | 8.60 | % |
Class A, Class B and Class C of the Fund commenced investment operations on 3/4/02. Returns at Public Offering Price (POP) reflect the deduction of the maximum initial sales charge and applicable CDSC, while Returns at Net Asset Value (NAV) do not. Absent an allocation of certain expenses to the administrator of the Fund and the sub-adviser of the Portfolio, the returns would be lower.
After-tax returns are calculated using the highest historical individual federal income tax rate and do not reflect the impact of state and local taxes. Actual after-tax returns depend on a shareholder’s tax situation and may differ from those shown. After-tax returns are not relevant for shareholders who hold Fund shares in tax-deferred accounts or to shares held by non-taxable entities. Return After Taxes on Distributions for a period may be the same as Return Before Taxes for that period because no distributions were paid during that period, or because the taxable portion of distributions made during the period was insignificant. Also, Return After Taxes on Distributions and Sale of Fund Shares for a period may be greater than Return After Taxes on Distributions for the same period because of realized losses on the sale of Fund shares.
Past performance is no guarantee of future results. Returns are historical and are calculated by determining the percentage change in net asset value or offering price (as applicable) with all distributions reinvested. Investment return and principal value will fluctuate so that shares, when redeemed, may be worth more or less than their original cost. Performance is for the stated time period only; due to market volatility, the Fund’s current performance may be lower or higher than the quoted return. For performance as of the most recent month end, please refer to www.eatonvance.com.
4
Eaton Vance Tax-Managed Small-Cap Value Fund as of October 31, 2006
FUND EXPENSES
Example: As a shareholder of the Fund, you incur two types of costs: (1) transaction costs, including sales charges (loads) on purchases and redemption fees (if applicable); and (2) ongoing costs, including management fees; distribution or service fees; and other Fund expenses. This Example is intended to help you understand your ongoing costs (in dollars) of investing in the Fund and to compare these costs with the ongoing costs of investing in other mutual funds. The Example is based on an investment of $1,000 invested at the beginning of the period and held for the entire period (May 1, 2006 – October 31, 2006).
Actual Expenses: The first section of the table below provides information about actual account values and actual expenses. You may use the information in this section, together with the amount you invested, to estimate the expenses that you paid over the period. Simply divide your account value by $1,000 (for example, an $8,600 account value divided by $1,000 = 8.6), then multiply the result by the number in the first section under the heading entitled "Expenses Paid During Period" to estimate the expenses you paid on your account during this period.
Hypothetical Example for Comparison Purposes: The second section of the table below provides information about hypothetical account values and hypothetical expenses based on the actual Fund expense ratio and an assumed rate of return of 5% per year (before expenses), which is not the actual return of the Fund. The hypothetical account values and expenses may not be used to estimate the actual ending account balance or expenses you paid for the period. You may use this information to compare the ongoing costs of investing in your Fund and other funds. To do so, compare this 5% hypothetical example with the 5% hypothetical examples that appear in the shareholder reports of the other funds.
Please note that the expenses shown in the table are meant to highlight your ongoing costs only and do not reflect any transactional costs, such as sales charges (loads) or redemption fees (if applicable). Therefore, the second section of the table is useful in comparing ongoing costs only, and will not help you determine the relative total costs of owning different funds. In addition, if these transactional costs were included, your costs would have been higher.
Eaton Vance Tax-Managed Small-Cap Value Fund
| | | Beginning Account Value
(5/1/06) | | Ending Account Value
(10/31/06) | | Expenses Paid During Period*
(5/1/06 – 10/31/06) | |
| Actual | |
| Class A | | $ | 1,000.00 | | | $ | 982.20 | | | $ | 8.74 | ** | |
| Class B | | $ | 1,000.00 | | | $ | 978.30 | | | $ | 12.47 | ** | |
| Class C | | $ | 1,000.00 | | | $ | 978.30 | | | $ | 12.47 | ** | |
| Hypothetical | |
| (5% return per year before expenses) | |
| Class A | | $ | 1,000.00 | | | $ | 1,016.40 | | | $ | 8.89 | ** | |
| Class B | | $ | 1,000.00 | | | $ | 1,012.60 | | | $ | 12.68 | ** | |
| Class C | | $ | 1,000.00 | | | $ | 1,012.60 | | | $ | 12.68 | ** | |
* Expenses are equal to the Fund's annualized expense ratio of 1.75% for Class A shares, 2.50% for Class B shares, and 2.50% for Class C shares, multiplied by the average account value over the period, multiplied by 184/365 (to reflect the one-half year period). The Example assumes that the $1,000 was invested at the net asset value per share determined at the close of business on April 30, 2006. The Example reflects the expenses of both the Fund and the Portfolio.
** Absent an allocation of certain expenses to the administrator of the Fund and sub-adviser of the Portfolio, expenses would be higher.
5
Eaton Vance Tax-Managed Small-Cap Value Fund as of October 31, 2006
FINANCIAL STATEMENTS
Statement of Assets and Liabilities
As of October 31, 2006
| Assets | |
Investment in Tax-Managed Small-Cap Value Portfolio, at value
(identified cost, $22,874,815) | | $ | 30,499,452 | | |
| Receivable for Fund shares sold | | | 65,922 | | |
| Receivable from affiliate | | | 80,483 | | |
| Total assets | | $ | 30,645,857 | | |
| Liabilities | |
| Payable for Fund shares redeemed | | $ | 57,971 | | |
| Payable to affiliate for distribution and service fees | | | 16,038 | | |
| Payable to affiliate for administration fee | | | 3,887 | | |
| Payable to affiliate for Trustees' fees | | | 55 | | |
| Accrued expenses | | | 35,347 | | |
| Total liabilities | | $ | 113,298 | | |
| Net Assets | | $ | 30,532,559 | | |
| Sources of Net Assets | |
| Paid-in capital | | $ | 20,695,076 | | |
Accumulated undistributed net realized gain from Portfolio (computed on
the basis of identified cost) | | | 2,212,846 | | |
Net unrealized appreciation from Portfolio (computed on the basis of
identified cost) | | | 7,624,637 | | |
| Total | | $ | 30,532,559 | | |
| Class A Shares | |
| Net Assets | | $ | 15,694,574 | | |
| Shares Outstanding | | | 1,018,961 | | |
Net Asset Value and Redemption Price Per Share
(net assets ÷ shares of beneficial interest outstanding) | | $ | 15.40 | | |
Maximum Offering Price Per Share
(100 ÷ 94.25 of $15.40) | | $ | 16.34 | | |
| Class B Shares | |
| Net Assets | | $ | 7,032,892 | | |
| Shares Outstanding | | | 472,998 | | |
Net Asset Value, Offering Price and Redemption Price Per Share
(net assets ÷ shares of beneficial interest outstanding) | | $ | 14.87 | | |
| Class C Shares | |
| Net Assets | | $ | 7,805,093 | | |
| Shares Outstanding | | | 524,452 | | |
Net Asset Value, Offering Price and Redemption Price Per Share
(net assets ÷ shares of beneficial interest outstanding) | | $ | 14.88 | | |
| On sales of $50,000 or more, the offering price of Class A shares is reduced. | |
Statement of Operations
For the Year Ended
October 31, 2006
| Investment Income | |
| Dividends allocated from Portfolio | | $ | 356,708 | | |
| Interest allocated from Portfolio | | | 43,236 | | |
| Expenses allocated from Portfolio | | | (349,610 | ) | |
| Net investment income from Portfolio | | $ | 50,334 | | |
| Expenses | |
| Administration fee | | $ | 45,883 | | |
| Trustees' fees and expenses | | | 186 | | |
Distribution and service fees
Class A | | | 38,321 | | |
| Class B | | | 75,961 | | |
| Class C | | | 76,640 | | |
| Transfer and dividend disbursing agent fees | | | 48,424 | | |
| Registration fees | | | 47,877 | | |
| Legal and accounting services | | | 17,051 | | |
| Printing and postage | | | 12,666 | | |
| Custodian fee | | | 12,627 | | |
| Miscellaneous | | | 5,102 | | |
| Total expenses | | $ | 380,738 | | |
Deduct —
Allocation of Fund expenses to affiliate | | $ | 80,483 | | |
| Total expense reductions | | $ | 80,483 | | |
| Net expenses | | $ | 300,255 | | |
| Net investment loss | | $ | (249,921 | ) | |
Realized and Unrealized
Gain (Loss) from Portfolio | |
Net realized gain (loss) —
Investment transactions (identified cost basis) | | $ | 2,237,106 | | |
| Net realized gain | | $ | 2,237,106 | | |
Change in unrealized appreciation (depreciation) —
Investments (identified cost basis) | | $ | 1,093,600 | | |
| Net change in unrealized appreciation (depreciation) | | $ | 1,093,600 | | |
| Net realized and unrealized gain | | $ | 3,330,706 | | |
| Net increase in net assets from operations | | $ | 3,080,785 | | |
See notes to financial statements
6
Eaton Vance Tax-Managed Small-Cap Value Fund as of October 31, 2006
FINANCIAL STATEMENTS CONT'D
Statements of Changes in Net Assets
Increase (Decrease)
in Net Assets | | Year Ended
October 31, 2006 | | Year Ended
October 31, 2005 | |
From operations —
Net investment loss | | $ | (249,921 | ) | | $ | (276,886 | ) | |
Net realized gain from
investment transactions | | | 2,237,106 | | | | 1,706,801 | | |
Net change in unrealized appreciation
(depreciation) of investments | | | 1,093,600 | | | | 1,546,477 | | |
| Net increase in net assets from operations | | $ | 3,080,785 | | | $ | 2,976,392 | | |
Distributions to Shareholders —
From net realized gain
Class A | | $ | (796,154 | ) | | $ | — | | |
| Class B | | | (431,201 | ) | | | — | | |
| Class C | | | (397,691 | ) | | | — | | |
| Total distributions | | $ | (1,625,046 | ) | | $ | — | | |
Transactions in shares of beneficial interest —
Proceeds from sale of shares
Class A | | $ | 3,354,218 | | | $ | 3,665,581 | | |
| Class B | | | 734,067 | | | | 1,643,624 | | |
| Class C | | | 1,540,274 | | | | 2,297,905 | | |
Net asset value of shares issued to
shareholders in payment of
distributions declared
Class A | | | 656,068 | | | | — | | |
| Class B | | | 330,817 | | | | — | | |
| Class C | | | 285,407 | | | | — | | |
Cost of shares redeemed
Class A | | | (4,136,432 | ) | | | (1,685,652 | ) | |
| Class B | | | (1,432,137 | ) | | | (2,425,388 | ) | |
| Class C | | | (1,328,126 | ) | | | (1,134,719 | ) | |
Net asset value of shares exchanged
Class A | | | 723,254 | | | | 94,010 | | |
| Class B | | | (723,254 | ) | | | (94,010 | ) | |
Net increase in net assets from
Fund share transactions | | $ | 4,156 | | | $ | 2,361,351 | | |
| Net increase in net assets | | $ | 1,459,895 | | | $ | 5,337,743 | | |
| Net Assets | |
| At beginning of year | | $ | 29,072,664 | | | $ | 23,734,921 | | |
| At end of year | | $ | 30,532,559 | | | $ | 29,072,664 | | |
See notes to financial statements
7
Eaton Vance Tax-Managed Small-Cap Value Fund as of October 31, 2006
FINANCIAL STATEMENTS CONT'D
Financial Highlights
| | | Class A | |
| | | Year Ended October 31, | | Period Ended | |
| | | 2006 | | 2005 | | 2004 | | 2003 | | October 31, 2002(2) | |
| Net asset value — Beginning of year | | $ | 14.640 | | | $ | 13.010 | | | $ | 11.420 | | | $ | 8.860 | | | $ | 10.000 | | |
| Income (loss) from operations | |
| Net investment loss(1) | | $ | (0.066 | ) | | $ | (0.087 | ) | | $ | (0.082 | ) | | $ | (0.061 | ) | | $ | (0.046 | ) | |
| Net realized and unrealized gain (loss) | | | 1.644 | | | | 1.717 | | | | 1.672 | | | | 2.621 | | | | (1.094 | ) | |
| Total income (loss) from operations | | $ | 1.578 | | | $ | 1.630 | | | $ | 1.590 | | | $ | 2.560 | | | $ | (1.140 | ) | |
| Less distributions | |
| From net realized gain | | $ | (0.818 | ) | | $ | — | | | $ | — | | | $ | — | | | $ | — | | |
| Total distributions | | $ | (0.818 | ) | | $ | — | | | $ | — | | | $ | — | | | $ | — | | |
| Net asset value — End of year | | $ | 15.400 | | | $ | 14.640 | | | $ | 13.010 | | | $ | 11.420 | | | $ | 8.860 | | |
| Total Return(3) | | | 11.24 | % | | | 12.53 | % | | | 13.92 | % | | | 28.89 | % | | | (11.40 | )% | |
| Ratios/Supplemental Data | |
| Net assets, end of year (000's omitted) | | $ | 15,695 | | | $ | 14,303 | | | $ | 10,772 | | | $ | 7,509 | | | $ | 3,105 | | |
| Ratios (As a percentage of average daily net assets): | |
| Expenses(4)(5) | | | 1.75 | % | | | 1.75 | % | | | 1.75 | % | | | 1.75 | % | | | 1.75 | %(6) | |
| Net investment loss | | | (0.44 | )% | | | (0.61 | )% | | | (0.67 | )% | | | (0.62 | )% | | | (0.74 | )%(6) | |
| Portfolio Turnover of the Portfolio | | | 49 | % | | | 24 | % | | | 12 | % | | | 21 | % | | | 5 | % | |
(1) Net investment loss per share was computed using average shares outstanding.
(2) For the period from the start of business, March 4, 2002, to October 31, 2002.
(3) Returns are historical and are calculated by determining the percentage change in net asset value with all distributions reinvested. Total return is not computed on an annualized basis.
(4) Includes the Fund's share of the Portfolio's allocated expenses.
(5) The administrator subsidized certain operating expenses (equal to 0.26%, 0.28%, 0.35%, 0.85%, and 2.66% of average daily net assets for the fiscal years ended October 31, 2006, 2005, 2004, 2003 and 2002, respectively). A portion of the subsidy was borne by the sub-adviser of the Portfolio.
(6) Annualized.
See notes to financial statements
8
Eaton Vance Tax-Managed Small-Cap Value Fund as of October 31, 2006
FINANCIAL STATEMENTS CONT'D
Financial Highlights
| | | Class B | |
| | | Year Ended October 31, | | Period Ended | |
| | | 2006 | | 2005 | | 2004 | | 2003 | | October 31, 2002(2) | |
| Net asset value — Beginning of year | | $ | 14.260 | | | $ | 12.770 | | | $ | 11.290 | | | $ | 8.820 | | | $ | 10.000 | | |
| Income (loss) from operations | |
| Net investment loss(1) | | $ | (0.174 | ) | | $ | (0.189 | ) | | $ | (0.171 | ) | | $ | (0.132 | ) | | $ | (0.091 | ) | |
| Net realized and unrealized gain (loss) | | | 1.602 | | | | 1.679 | | | | 1.651 | | | | 2.602 | | | | (1.089 | ) | |
| Total income (loss) from operations | | $ | 1.428 | | | $ | 1.490 | | | $ | 1.480 | | | $ | 2.470 | | | $ | (1.180 | ) | |
| Less distributions | |
| From net realized gain | | $ | (0.818 | ) | | $ | — | | | $ | — | | | $ | — | | | $ | — | | |
| Total distributions | | $ | (0.818 | ) | | $ | — | | | $ | — | | | $ | — | | | $ | — | | |
| Net asset value — End of year | | $ | 14.870 | | | $ | 14.260 | | | $ | 12.770 | | | $ | 11.290 | | | $ | 8.820 | | |
| Total Return(3) | | | 10.45 | % | | | 11.67 | % | | | 13.11 | % | | | 28.00 | % | | | (11.80 | )% | |
| Ratios/Supplemental Data | |
| Net assets, end of year (000's omitted) | | $ | 7,033 | | | $ | 7,802 | | | $ | 7,784 | | | $ | 5,961 | | | $ | 2,323 | | |
| Ratios (As a percentage of average daily net assets): | |
| Expenses(4)(5) | | | 2.50 | % | | | 2.50 | % | | | 2.50 | % | | | 2.50 | % | | | 2.50 | %(6) | |
| Net investment loss | | | (1.20 | )% | | | (1.36 | )% | | | (1.41 | )% | | | (1.36 | )% | | | (1.47 | )%(6) | |
| Portfolio Turnover of the Portfolio | | | 49 | % | | | 24 | % | | | 12 | % | | | 21 | % | | | 5 | % | |
(1) Net investment loss per share was computed using average shares outstanding.
(2) For the period from the start of business, March 4, 2002, to October 31, 2002.
(3) Returns are historical and are calculated by determining the percentage change in net asset value with all distributions reinvested. Total return is not computed on an annualized basis.
(4) Includes the Fund's share of the Portfolio's allocated expenses.
(5) The administrator subsidized certain operating expenses (equal to 0.26%, 0.28%, 0.35%, 0.85%, and 2.66% of average daily net assets for the fiscal years ended October 31, 2006, 2005, 2004, 2003 and 2002, respectively). A portion of the subsidy was borne by the sub-adviser of the Portfolio.
(6) Annualized.
See notes to financial statements
9
Eaton Vance Tax-Managed Small-Cap Value Fund as of October 31, 2006
FINANCIAL STATEMENTS CONT'D
Financial Highlights
| | | Class C | |
| | | Year Ended October 31, | | Period Ended | |
| | | 2006 | | 2005 | | 2004 | | 2003 | | October 31, 2002(2) | |
| Net asset value — Beginning of year | | $ | 14.270 | | | $ | 12.780 | | | $ | 11.290 | | | $ | 8.820 | | | $ | 10.000 | | |
| Income (loss) from operations | |
| Net investment loss(1) | | $ | (0.174 | ) | | $ | (0.189 | ) | | $ | (0.171 | ) | | $ | (0.131 | ) | | $ | (0.092 | ) | |
| Net realized and unrealized gain (loss) | | | 1.602 | | | | 1.679 | | | | 1.661 | | | | 2.601 | | | | (1.088 | ) | |
| Total income (loss) from operations | | $ | 1.428 | | | $ | 1.490 | | | $ | 1.490 | | | $ | 2.470 | | | $ | (1.180 | ) | |
| Less distributions | |
| From net realized gain | | $ | (0.818 | ) | | $ | — | | | $ | — | | | $ | — | | | $ | — | | |
| Total distributions | | $ | (0.818 | ) | | $ | — | | | $ | — | | | $ | — | | | $ | — | | |
| Net asset value — End of year | | $ | 14.880 | | | $ | 14.270 | | | $ | 12.780 | | | $ | 11.290 | | | $ | 8.820 | | |
| Total Return(3) | | | 10.44 | % | | | 11.66 | % | | | 13.20 | % | | | 28.00 | % | | | (11.80 | )% | |
| Ratios/Supplemental Data | |
| Net assets, end of year (000's omitted) | | $ | 7,805 | | | $ | 6,968 | | | $ | 5,179 | | | $ | 3,870 | | | $ | 1,862 | | |
| Ratios (As a percentage of average daily net assets): | |
| Expenses(4)(5) | | | 2.50 | % | | | 2.50 | % | | | 2.50 | % | | | 2.50 | % | | | 2.50 | %(6) | |
| Net investment loss | | | (1.19 | )% | | | (1.36 | )% | | | (1.42 | )% | | | (1.35 | )% | | | (1.48 | )%(6) | |
| Portfolio Turnover of the Portfolio | | | 49 | % | | | 24 | % | | | 12 | % | | | 21 | % | | | 5 | % | |
(1) Net investment loss per share was computed using average shares outstanding.
(2) For the period from the start of business, March 4, 2002, to October 31, 2002.
(3) Returns are historical and are calculated by determining the percentage change in net asset value with all distributions reinvested. Total return is not computed on an annualized basis.
(4) Includes the Fund's share of the Portfolio's allocated expenses.
(5) The administrator subsidized certain operating expenses (equal to 0.26%, 0.28%, 0.35%, 0.85%, and 2.66% of average daily net assets for the fiscal years ended October 31, 2006, 2005, 2004, 2003 and 2002, respectively). A portion of the subsidy was borne by the sub-adviser of the Portfolio.
(6) Annualized.
See notes to financial statements
10
Eaton Vance Tax-Managed Small-Cap Value Fund as of October 31, 2006
NOTES TO FINANCIAL STATEMENTS
1 Significant Accounting Policies
Eaton Vance Tax-Managed Small-Cap Value Fund (the Fund) is a diversified series of Eaton Vance Mutual Funds Trust (the Trust). The Trust is an entity of the type commonly known as a Massachusetts business trust and is registered under the Investment Company Act of 1940, as amended, as an open-end management investment company. The Fund offers three classes of shares. Class A shares are generally sold subject to a sales charge imposed at time of purchase. Class B and Class C shares are sold at net asset value and are generally subject to a contingent deferred sales charge (see Note 6). Class B shares held for eight years will automatically convert to Class A shares. Each class represents a pro rata interest in the Fund, but votes separately on class-specific matters and (as noted below) is subject to different expenses. Realized and unrealized gains and losses and net investment income and losses, other than class-specific expens es, are allocated daily to each class of shares based on the relative net assets of each class to the total net assets of the Fund. Each class of shares differs in its distribution plan and certain other class-specific expenses. The Fund invests all of its investable assets in interests of the Tax-Managed Small-Cap Value Portfolio (the Portfolio), a New York Trust, having the same investment objective as the Fund. The value of the Fund's investment in the Portfolio reflects the Fund's proportionate interest in the net assets of the Portfolio (56.1% at October 31, 2006). The performance of the Fund is directly affected by the performance of the Portfolio. The financial statements of the Portfolio, including the Portfolio of Investments, are included elsewhere in this report and should be read in conjunction with the Fund's financial statements.
The following is a summary of significant accounting policies consistently followed by the Fund in the preparation of its financial statements. The policies are in conformity with accounting principles generally accepted in the United States of America.
A Investment Valuation — Valuation of securities by the Portfolio is discussed in Note 1A of the Portfolio's Notes to Financial Statements, which are included elsewhere in this report.
B Income — The Fund's net investment income or loss consists of the Fund's pro rata share of the net investment income or loss of the Portfolio, less all actual and accrued expenses of the Fund.
C Expenses — The majority of expenses of the Trust are directly identifiable to an individual fund. Expenses which are not readily identifiable to a specific fund are allocated taking into consideration, among other things, the nature and type of expense and the relative size of the funds.
D Federal Taxes — The Fund's policy is to comply with the provisions of the Internal Revenue Code applicable to regulated investment companies and to distribute to shareholders, each year, substantially all of its net investment income and all or substantially all of its net realized capital gains. Accordingly, no provision for federal income or excise tax is necessary.
E Expense Reduction — Investors Bank & Trust Company (IBT) serves as custodian of the Fund. Pursuant to the custodian agreement, IBT receives a fee reduced by credits which are determined based on the average daily cash balance the Fund maintains with IBT. All credit balances used to reduce the Fund's custodian fees are reported as a reduction of expenses in the Statement of Operations.
F Other — Investment transactions are accounted for on the date the securities are purchased or sold. Dividends to shareholders are recorded on the ex-dividend date.
G Indemnifications — Under the Trust's organizational documents, its officers and Trustees may be indemnified against certain liabilities and expenses arising out of the performance of their duties to the Fund and shareholders are indemnified against personal liability for the obligations of the Trust. Additionally, in the normal course of business, the Fund enters into agreements with service providers that may contain indemnification clauses. The Fund's maximum exposure under these arrangements is unknown as this would involve future claims that may be made against the Fund that have not yet occurred.
H Use of Estimates — The preparation of the financial statements in conformity with accounting principles generally accepted in the United States of America requires management to make estimates and assumptions that affect the reported amounts of assets and liabilities at the date of the financial statements and the reported amounts of income and expense during the reporting period. Actual results could differ from those estimates.
2 Distributions to Shareholders
It is the present policy of the Fund to make at least one distribution annually (normally in December) of all or substantially all of its net investment income, if any, and at least one distribution annually of all or substantially all of its net realized capital gains, if any (reduced by available capital loss carryforwards from prior years, if any). Distributions are declared separately for each class of shares. Shareholders may reinvest all distributions in additional shares of the same class of the Fund at the net asset value as of the close of business on the ex-dividend date. Distributions are paid in the form of additional shares
Eaton Vance Tax-Managed Small-Cap Value Fund as of October 31, 2006
NOTES TO FINANCIAL STATEMENTS CONT'D
of the same class of the Fund or, at the election of the shareholder, in cash. The Fund distinguishes between distributions on a tax basis and a financial reporting basis. Accounting principles generally accepted in the United States of America require that only distributions in excess of tax basis earnings and profits be reported in the financial statements as a return of capital. Permanent differences between book and tax accounting relating to distributions are reclassified to paid-in capital.
The tax character of distributions paid for the years ended October 31, 2006 and October 31, 2005 was as follows:
| | | Year Ended October 31, | |
| | | 2006 | | 2005 | |
Distributions declared from:
Long-term capital gains | | $ | 1,625,046 | | | | — | | |
During the year ended October 31, 2006, accumulated paid-in capital was decreased by $249,921 and accumulated net investment loss was decreased by $249,921 primarily due to differences between book and tax accounting for net operating losses. This change had no effect on the net assets or the net asset value per share.
As of October 31, 2006, the components of distributable earnings (accumulated losses) on a tax basis were as follows:
| Unrealized gain | | $ | 7,582,651 | | |
| Other temporary differences | | $ | (11,161 | ) | |
| Long-term capital gain | | $ | 2,265,993 | | |
3 Shares of Beneficial Interest
The Fund's Declaration of Trust permits the Trustees to issue an unlimited number of full and fractional shares of beneficial interest (without par value). Transactions in Fund shares were as follows:
| | | Year Ended October 31, | |
| Class A | | 2006 | | 2005 | |
| Sales | | | 222,934 | | | | 260,833 | | |
Issued to shareholders electing to
receive payments of distributions
in Fund shares | | | 46,072 | | | | — | | |
| Redemptions | | | (274,772 | ) | | | (118,493 | ) | |
| Exchanges from Class B shares | | | 48,007 | | | | 6,518 | | |
| Net increase | | | 42,241 | | | | 148,858 | | |
| | | Year Ended October 31, | |
| Class B | | 2006 | | 2005 | |
| Sales | | | 50,495 | | | | 118,925 | | |
Issued to shareholders electing to
receive payments of distributions
in Fund shares | | | 23,920 | | | | — | | |
| Redemptions | | | (98,844 | ) | | | (174,916 | ) | |
| Exchanges to Class A shares | | | (49,502 | ) | | | (6,667 | ) | |
| Net decrease | | | (73,931 | ) | | | (62,658 | ) | |
| | | Year Ended October 31, | |
| Class C | | 2006 | | 2005 | |
| Sales | | | 107,147 | | | | 164,905 | | |
Issued to shareholders electing to
receive payments of distributions
in Fund shares | | | 20,622 | | | | — | | |
| Redemptions | | | (91,520 | ) | | | (81,963 | ) | |
| Net increase | | | 36,249 | | | | 82,942 | | |
4 Transactions with Affiliates
The administration fee is earned by Eaton Vance Management (EVM) as compensation for managing and administering the business affairs of the Fund. Under the administration agreement, EVM earns a fee in the amount of 0.15% per annum of average daily net assets of the Fund. For the year ended October 31, 2006, the administration fee amounted to $45,883. Pursuant to a voluntary expense reimbursement, EVM and Fox Asset Management LLC (Fox), a majority owned subsidiary of EVM and sub-adviser to the Portfolio, were allocated $20,121 and $60,362, respectively of the Fund's operating expenses for the year ended October 31, 2006. This voluntary reimbursement may be terminated at any time. The Portfolio has engaged Boston Management and Research (BMR), a subsidiary of EVM, to render investment advisory services. (See Note 2 of the Portfolio's Notes to Financial Statements which are included elsewhere in this report.) EVM serves as the sub- transfer agent of the Fund and receives from the transfer agent an aggregate fee based upon the actual expenses incurred by EVM in the performance of those services. For the year ended October 31, 2006, EVM received $3,101 in sub-transfer agent fees.
Except for Trustees of the Fund and the Portfolio who are not members of EVM's or BMR's organization, officers and Trustees receive remuneration for their services to the Fund out of the investment adviser fee earned by BMR. Trustees
Eaton Vance Tax-Managed Small-Cap Value Fund as of October 31, 2006
NOTES TO FINANCIAL STATEMENTS CONT'D
of the Fund that are not affiliated with EVM or BMR may elect to defer receipt of all or a percentage of their annual fees in accordance with the terms of the Trustees Deferred Compensation Plan. For the year ended October 31, 2006, no significant amounts have been deferred.
Eaton Vance Distributors, Inc. (EVD), a subsidiary of EVM and the Fund's principal underwriter, received $8,597 as its portion of the sales charge on sales of Class A shares for the year ended October 31, 2006.
Certain officers and Trustees of the Fund and of the Portfolio are officers of the above organizations.
5 Distribution Plans
Class A has in effect a distribution plan pursuant to Rule 12b-1 under the Investment Company Act of 1940 (Class A Plan). The Class A Plan provides that the Fund will pay EVD a distribution and service fee of 0.25% of the Fund's average daily net assets attributable to Class A shares for each fiscal year for distribution services and facilities provided to the Fund by EVD, as well as for personal services and/or the maintenance of shareholder accounts. Distribution and service fees paid or accrued for the year ended October 31, 2006 amounted to $38,321 for Class A shares. The Fund also has in effect distribution plans for Class B shares (Class B Plan) and Class C shares (Class C Plan) pursuant to Rule 12b-1 under the Investment Company Act of 1940 (collectively, "The Plans"). The Class B and Class C Plans require the Fund to pay EVD amounts equal to 1/365 of 0.75% of the Fund's average daily net assets attributable to Class B an d Class C shares for providing ongoing distribution services and facilities to the Fund. The Fund will automatically discontinue payments to EVD during any period in which there are no outstanding Uncovered Distribution Charges, which are equivalent to the sum of (i) 6.25% of the aggregate amount received by the Fund for the Class B and Class C shares sold, respectively, plus (ii) interest calculated by applying the rate of 1% over the prevailing prime rate to the outstanding balance of Uncovered Distribution Charges of EVD of each respective class, reduced by the aggregate amount of contingent deferred sales charges (see Note 6) and daily amounts theretofore paid to EVD by each respective class. Distribution fees paid or accrued for the year ended October 31, 2006 amounted to $56,971 and $57,480 for Class B and Class C shares, respectively. At October 31, 2006, the amount of Uncovered Distribution Charges of EVD calculated under the Plans was approximately $134,000 and $357,000 for Class B and Class C share s, respectively. The Class B and Class C Plans also authorize the Fund to make payments of service fees to EVD, investment dealers and other persons in amounts not exceeding 0.25% annually of the average daily net assets attributable to that Class. Service fees are paid for personal services and/or the maintenance of shareholder accounts. They are separate and distinct from the Class B and Class C sales commissions and distribution fees and, as such, are not subject to automatic discontinuance when there are no outstanding Uncovered Distribution Charges to EVD. Service fees paid or accrued for the year ended October 31, 2006 amounted to $18,990, and $19,160, for Class B and Class C shares, respectively.
6 Contingent Deferred Sales Charge
A contingent deferred sales charge (CDSC) generally is imposed on redemptions of Class B shares made within six years of purchase and on redemptions of Class C shares made within one year of purchase. Class A shares may be subject to a CDSC up to 1% if redeemed within two years of purchase (depending upon the circumstances of purchase). Generally, the CDSC is based upon the lower of the net asset value at date of redemption or date of purchase. No charge is levied on shares acquired by reinvestment of dividends or capital gain distributions. The Class B CDSC is imposed at declining rates that begin at 5% in the case of redemptions in the first and second year after purchase, declining one percentage point each subsequent year. Class C shares will be subject to a 1% CDSC if redeemed within one year of purchase.
No CDSC is levied on shares which have been sold to EVM or its affiliates or to their respective employees or clients and may be waived under certain other limited conditions. CDSC pertaining to Class B and Class C redemptions are paid to EVD to reduce the amount of Uncovered Distribution Charges calculated under the Class B and Class C Plans, respectively (see Note 5). CDSC assessed on Class B and Class C shares when no Uncovered Distribution Charges exist for the respective classes will be credited to the Fund. EVD received approximately $13,000 and $136 of CDSC paid by shareholders of Class B shares and Class C shares, respectively, for the year ended October 31, 2006. EVD did not receive any CDSC for Class A shares for the year ended October 31, 2006.
7 Investment Transactions
Increases and decreases in the Fund's investment in the Portfolio aggregated $6,286,735 and $8,306,151 respectively, for the year ended October 31, 2006.
Eaton Vance Tax-Managed Small-Cap Value Fund as of October 31, 2006
NOTES TO FINANCIAL STATEMENTS CONT'D
8 Recently Issued Accounting Pronouncements
In June 2006, the Financial Accounting Standards Board (FASB) issued FASB Interpretation No. 48, (FIN 48) "Accounting for Uncertainty in Income Taxes – an interpretation of FASB Statement No. 109". FIN 48 clarifies the accounting for uncertainty in income taxes recognized in accordance with FASB Statement No. 109, "Accounting for Income Taxes." This interpretation prescribes a recognition threshold and measurement attribute for the financial statement recognition and measurement of a tax position taken or expected to be taken in a tax return. It also provides guidance on de-recognition, classification, interest and penalties, accounting in interim periods, disclosure and transition. FIN 48 is effective for fiscal years beginning after December 15, 2006. Management is currently evaluating the impact of applying the various provisions of FIN 48.
In September 2006, FASB issued Statement of Financial Accounting Standards No. 157 (FAS 157) "Fair Value Measurements". FAS 157 defines fair value, establishes a framework for measuring fair value in accordance with generally accepted accounting principles and expands disclosure about fair value measurements. FAS 157 is effective for fiscal years beginning after November 15, 2007. Management is currently evaluating the impact the adoption of FAS 157 will have on the Fund's financial statement disclosures.
Eaton Vance Tax-Managed Small-Cap Value Fund as of October 31, 2006
REPORT OF INDEPENDENT REGISTERED PUBLIC ACCOUNTING FIRM
To the Trustees of Eaton Vance Mutual Funds
Trust and Shareholders of Eaton Vance
Tax-Managed Small-Cap Value Fund:
We have audited the accompanying statement of assets and liabilities of Eaton Vance Tax-Managed Small-Cap Value Fund ("the Fund") (one of the series of Eaton Vance Mutual Funds Trust) as of October 31, 2006, and the related statement of operations for the year then ended, the statements of changes in net assets for each of the two years in the period then ended and the financial highlights for each of the four years in the period then ended, and for the period from the start of business, March 4, 2002, to October 31, 2002. These financial statements and financial highlights are the responsibility of the Fund's management. Our responsibility is to express an opinion on these financial statements and financial highlights based on our audits.
We conducted our audits in accordance with the standards of the Public Company Accounting Oversight Board (United States). Those standards require that we plan and perform the audit to obtain reasonable assurance about whether the financial statements and financial highlights are free of material misstatement. The Fund is not required to have, nor were we engaged to perform, an audit of its internal control over financial reporting. Our audits included consideration of internal control over financial reporting as a basis for designing audit procedures that are appropriate in the circumstances, but not for the purpose of expressing an opinion on the effectiveness of the Fund's internal control over financial reporting. Accordingly, we express no such opinion. An audit also includes examining, on a test basis, evidence supporting the amounts and disclosures in the financial statements, assessing the accounting principles used and significant estimates made by management, as well as evaluating the overall financial statement presentation. We believe that our audits provide a reasonable basis for our opinion.
In our opinion, such financial statements and financial highlights referred to above present fairly, in all material respects, the financial position of Eaton Vance Tax-Managed Small-Cap Value Fund as of October 31, 2006, the results of its operations for the year then ended, the changes in its net assets for each of the two years in the period then ended and the financial highlights for each of the four years in the period then ended, and for the period from the start of business, March 4, 2002, to October 31, 2002, in conformity with accounting principles generally accepted in the United States of America.
DELOITTE & TOUCHE LLP
Boston, Massachusetts
December 15, 2006
15
Eaton Vance Tax-Managed Small-Cap Value Fund as of October 31, 2006
FEDERAL TAX INFORMATION (Unaudited)
The Form 1099-DIV you receive in January 2007 will show the tax status of all distributions paid to your account in calendar year 2006. Shareholders are advised to consult their own tax adviser with respect to the tax consequences of their investment in the Fund. As required by the Internal Revenue Code regulations, shareholders must be notified within 60 days of the Fund's fiscal year end regarding the status of long-term capital gains distributions.
Long-term Capital Gains Distributions — The Fund designates $1,625,046 as a long-term capital gain distribution.
16
Tax-Managed Small-Cap Value Portfolio as of October 31, 2006
PORTFOLIO OF INVESTMENTS
| Common Stocks — 93.8% | |
| Security | | Shares | | Value | |
| Aerospace & Defense — 1.1% | |
| K&F Industries Holdings, Inc.(1) | | | 31,000 | | | $ | 602,640 | | |
| | | $ | 602,640 | | |
| Auto Components — 2.2% | |
| BorgWarner, Inc. | | | 20,500 | | | $ | 1,178,750 | | |
| | | $ | 1,178,750 | | |
| Chemicals — 2.9% | |
| RPM International, Inc. | | | 82,500 | | | $ | 1,579,875 | | |
| | | $ | 1,579,875 | | |
| Commercial Banks — 9.6% | |
| Boston Private Financial Holdings, Inc. | | | 19,800 | | | $ | 547,272 | | |
| First Midwest Bancorp, Inc. | | | 28,000 | | | | 1,064,840 | | |
| Hanmi Financial Corp. | | | 40,300 | | | | 861,211 | | |
| Provident Bankshares Corp. | | | 31,200 | | | | 1,127,568 | | |
| UCBH Holdings, Inc. | | | 45,800 | | | | 785,012 | | |
| Umpqua Holdings Corp. | | | 29,400 | | | | 830,256 | | |
| | | $ | 5,216,159 | | |
| Communications Equipment — 1.5% | |
| Bel Fuse, Inc. Class B | | | 23,300 | | | $ | 829,946 | | |
| | | $ | 829,946 | | |
| Construction & Engineering — 2.3% | |
| Granite Construction, Inc. | | | 24,000 | | | $ | 1,250,400 | | |
| | | $ | 1,250,400 | | |
| Containers & Packaging — 3.4% | |
| AptarGroup, Inc. | | | 34,000 | | | $ | 1,866,940 | | |
| | | $ | 1,866,940 | | |
| Electrical Equipment — 5.2% | |
| A.O. Smith Corp. | | | 25,000 | | | $ | 879,000 | | |
| Belden CDT, Inc. | | | 53,400 | | | | 1,933,080 | | |
| | | $ | 2,812,080 | | |
| Security | | Shares | | Value | |
| Electronic Equipment & Instruments — 1.8% | |
| Technitrol, Inc. | | | 38,000 | | | $ | 958,360 | | |
| | | $ | 958,360 | | |
| Energy Equipment & Services — 5.0% | |
| Lone Star Technologies, Inc.(1) | | | 10,600 | | | $ | 511,768 | | |
| NS Group, Inc.(1) | | | 10,800 | | | | 705,888 | | |
| Parker Drilling Co.(1) | | | 76,000 | | | | 622,440 | | |
| Pioneer Drilling Co.(1) | | | 65,500 | | | | 860,015 | | |
| | | $ | 2,700,111 | | |
| Food & Staples Retailing — 4.0% | |
| BJ's Wholesale Club, Inc.(1) | | | 45,000 | | | $ | 1,289,250 | | |
| Performance Food Group Co.(1) | | | 30,700 | | | | 892,449 | | |
| | | $ | 2,181,699 | | |
| Gas Utilities — 6.4% | |
| Piedmont Natural Gas Co., Inc. | | | 74,000 | | | $ | 1,998,000 | | |
| Questar Corp. | | | 18,000 | | | | 1,466,640 | | |
| | | $ | 3,464,640 | | |
| Health Care Equipment & Supplies — 6.9% | |
| CONMED Corp.(1) | | | 44,000 | | | $ | 976,360 | | |
| PolyMedica Corp. | | | 25,600 | | | | 1,063,680 | | |
| West Pharmaceutical Services, Inc. | | | 40,500 | | | | 1,702,620 | | |
| | | $ | 3,742,660 | | |
| Health Care Providers & Services — 2.7% | |
| Owens & Minor, Inc. | | | 47,500 | | | $ | 1,496,725 | | |
| | | $ | 1,496,725 | | |
| Hotels, Restaurants & Leisure — 2.3% | |
| Applebee's International, Inc. | | | 28,500 | | | $ | 650,370 | | |
| CBRL Group, Inc. | | | 13,800 | | | | 605,958 | | |
| | | $ | 1,256,328 | | |
| Household Durables — 2.3% | |
| Tupperware Brands Corp. | | | 60,000 | | | $ | 1,273,800 | | |
| | | $ | 1,273,800 | | |
See notes to financial statements
17
Tax-Managed Small-Cap Value Portfolio as of October 31, 2006
PORTFOLIO OF INVESTMENTS CONT'D
| Security | | Shares | | Value | |
| Household Products — 4.8% | |
| Church & Dwight Co., Inc. | | | 65,000 | | | $ | 2,637,050 | | |
| | | $ | 2,637,050 | | |
| Industrial Conglomerates — 2.8% | |
| Teleflex, Inc. | | | 24,500 | | | $ | 1,523,900 | | |
| | | $ | 1,523,900 | | |
| Insurance — 4.3% | |
| IPC Holdings Ltd. | | | 24,700 | | | $ | 741,988 | | |
| Protective Life Corp. | | | 35,500 | | | | 1,570,875 | | |
| | | $ | 2,312,863 | | |
| Leisure Equipment & Products — 3.2% | |
| RC2 Corp.(1) | | | 38,500 | | | $ | 1,739,430 | | |
| | | $ | 1,739,430 | | |
| Machinery — 3.2% | |
| Albany International Corp., Class A | | | 25,300 | | | $ | 850,333 | | |
| CLARCOR, Inc. | | | 27,700 | | | | 902,466 | | |
| | | $ | 1,752,799 | | |
| Oil, Gas & Consumable Fuels — 4.1% | |
| Newfield Exploration Co.(1) | | | 23,200 | | | $ | 946,328 | | |
| OMI Corp. | | | 31,500 | | | | 703,080 | | |
| Penn Virginia Corp. | | | 8,500 | | | | 608,175 | | |
| | | $ | 2,257,583 | | |
| Personal Products — 2.3% | |
| Chattem, Inc.(1) | | | 16,000 | | | $ | 678,720 | | |
| Prestige Brands Holdings, Inc.(1) | | | 47,000 | | | | 554,600 | | |
| | | $ | 1,233,320 | | |
| Road & Rail — 3.4% | |
| Arkansas Best Corp. | | | 32,500 | | | $ | 1,331,850 | | |
| YRC Worldwide, Inc.(1) | | | 12,800 | | | | 495,872 | | |
| | | $ | 1,827,722 | | |
| Security | | Shares | | Value | |
Semiconductors & Semiconductor
Equipment — 2.4% | |
| ON Semiconductor Corp.(1) | | | 207,600 | | | $ | 1,291,272 | | |
| | | $ | 1,291,272 | | |
| Specialty Retail — 3.7% | |
| Claire's Stores, Inc. | | | 42,800 | | | $ | 1,213,380 | | |
| Stage Stores, Inc. | | | 24,000 | | | | 777,840 | | |
| | | $ | 1,991,220 | | |
Total Common Stocks
(identified cost $34,897,504) | | | | | | $ | 50,978,272 | | |
Total Investments — 93.8%
(identified cost $34,897,504) | | | | | | $ | 50,978,272 | | |
| Other Assets, Less Liabilities — 6.2% | | | | | | $ | 3,352,863 | | |
| Net Assets — 100.0% | | | | | | $ | 54,331,135 | | |
(1) Non-income producing security.
See notes to financial statements
18
Tax-Managed Small-Cap Value Portfolio as of October 31, 2006
FINANCIAL STATEMENTS
Statement of Assets and Liabilities
As of October 31, 2006
| Assets | |
| Investments, at value (identified cost, $34,897,504) | | $ | 50,978,272 | | |
| Cash | | | 3,375,937 | | |
| Dividends and interest receivable | | | 65,424 | | |
| Total assets | | $ | 54,419,633 | | |
| Liabilities | |
| Payable to affiliate for investment advisory fees | | $ | 45,360 | | |
| Payable to affiliate for Trustees' fees | | | 899 | | |
| Accrued expenses | | | 42,239 | | |
| Total liabilities | | $ | 88,498 | | |
| Net Assets applicable to investors' interest in Portfolio | | $ | 54,331,135 | | |
| Sources of Net Assets | |
| Net proceeds from capital contributions and withdrawals | | $ | 38,250,367 | | |
| Net unrealized appreciation (computed on the basis of identified cost) | | | 16,080,768 | | |
| Total | | $ | 54,331,135 | | |
Statement of Operations
For the Year Ended
October 31, 2006
| Investment Income | |
| Dividends | | $ | 625,888 | | |
| Interest | | | 75,883 | | |
| Total investment income | | $ | 701,771 | | |
| Expenses | |
| Investment adviser fee | | $ | 536,925 | | |
| Trustees' fees and expenses | | | 7,244 | | |
| Custodian fee | | | 37,848 | | |
| Legal and accounting services | | | 27,812 | | |
| Miscellaneous | | | 3,168 | | |
| Total expenses | | $ | 612,997 | | |
| Net investment income | | $ | 88,774 | | |
| Realized and Unrealized Gain (Loss) | |
Net realized gain (loss) —
Investment transactions (identified cost basis) | | $ | 4,818,587 | | |
| Net realized gain | | $ | 4,818,587 | | |
Change in unrealized appreciation (depreciation) —
Investments (identified cost basis) | | $ | 1,030,544 | | |
| Net change in unrealized appreciation (depreciation) | | $ | 1,030,544 | | |
| Net realized and unrealized gain | | $ | 5,849,131 | | |
| Net increase in net assets from operations | | $ | 5,937,905 | | |
See notes to financial statements
19
Tax-Managed Small-Cap Value Portfolio as of October 31, 2006
FINANCIAL STATEMENTS CONT'D
Statements of Changes in Net Assets
Increase (Decrease)
in Net Assets | | Year Ended
October 31, 2006 | | Year Ended
October 31, 2005 | |
From operations —
Net investment income (loss) | | $ | 88,774 | | | $ | (2,528 | ) | |
Net realized gain from
investment transactions | | | 4,818,587 | | | | 4,166,726 | | |
Net change in unrealized appreciation
(depreciation) of investments | | | 1,030,544 | | | | 2,782,379 | | |
| Net increase in net assets from operations | | $ | 5,937,905 | | | $ | 6,946,577 | | |
Capital transactions —
Contributions | | $ | 5,563,481 | | | $ | 7,616,139 | | |
| Withdrawals | | | (7,961,150 | ) | | | (16,997,334 | ) | |
Net decrease in net assets from
capital transactions | | $ | (2,397,669 | ) | | $ | (9,381,195 | ) | |
| Net increase (decrease) in net assets | | $ | 3,540,236 | | | $ | (2,434,618 | ) | |
| Net Assets | |
| At beginning of year | | $ | 50,790,899 | | | $ | 53,225,517 | | |
| At end of year | | $ | 54,331,135 | | | $ | 50,790,899 | | |
See notes to financial statements
20
Tax-Managed Small-Cap Value Portfolio as of October 31, 2006
FINANCIAL STATEMENTS CONT'D
Supplementary Data
| | | Year Ended October 31, | | Period Ended | |
| | | 2006 | | 2005 | | 2004 | | 2003 | | October 31, 2002(1) | |
| Ratios/Supplemental Data | |
| Ratios (As a percentage of average daily net assets): | |
| Expenses | | | 1.14 | % | | | 1.15 | % | | | 1.14 | % | | | 1.18 | % | | | 1.77 | %(2) | |
| Net investment income (loss) | | | 0.17 | % | | | (0.00 | )%(3) | | | (0.06 | )% | | | (0.04 | )% | | | (0.74 | )%(2) | |
| Portfolio Turnover | | | 49 | % | | | 24 | % | | | 12 | % | | | 21 | % | | | 5 | % | |
| Total Return(4) | | | 11.91 | % | | | 13.20 | % | | | 14.62 | % | | | 29.62 | % | | | (11.41 | )% | |
| Net assets, end of year (000's omitted) | | $ | 54,331 | | | $ | 50,791 | | | $ | 53,226 | | | $ | 41,903 | | | $ | 17,340 | | |
(1) For the period from the start of business, March 1, 2002, to October 31, 2002.
(2) Annualized.
(3) Amounts to less than (0.01)%.
(4) Total return is not computed on an annualized basis.
See notes to financial statements
21
Tax-Managed Small-Cap Value Portfolio as of October 31, 2006
NOTES TO FINANCIAL STATEMENTS
1 Significant Accounting Policies
Tax-Managed Small-Cap Value Portfolio (the Portfolio) is registered under the Investment Company Act of 1940, as amended, as a diversified open-end management investment company. The Portfolio, which was organized as a trust under the laws of the State of New York on December 10, 2001, seeks to achieve long-term after-tax returns by investing in a diversified portfolio of value stocks of small-cap companies. The Declaration of Trust permits the Trustees to issue interests in the Portfolio. At October 31, 2006, the Eaton Vance Tax-Managed Small-Cap Value Fund and the Eaton Vance Tax-Managed Equity Asset Allocation Fund held 56.1% and 43.9% interests in the Portfolio, respectively. The following is a summary of significant accounting policies consistently followed by the Portfolio in the preparation of its financial statements. The policies are in conformity with accounting principles generally accepted in the United States of Ame rica.
A Investment Valuation — Securities listed on a U.S. securities exchange generally are valued at the last sale price on the day of valuation or, if no sales took place on such date, at the mean between the closing bid and asked prices therefore on the exchange where such securities are principally traded. Equity securities listed on the NASDAQ National Market System generally are valued at the official NASDAQ closing price. Unlisted or listed securities for which closing sales prices or closing quotations are not available are valued at the mean between the latest available bid and asked prices or, in the case of preferred equity securities that are not listed or traded in the over-the-counter market, by an independent pricing service. Exchange-traded options are valued at the last sale price for the day of valuation as quoted on the principal exchange or board of trade on which the options are traded or, in the absence of sales on such date, at the mean between the latest bid and asked prices therefore. Futures positions on securities and currencies generally are valued at closing settlement prices. Short-term debt securities with a remaining maturity of 60 days or less are valued at amortized cost. If short-term debt securities are acquired with a remaining maturity of more than 60 days, they will be valued by a pricing service. Other fixed income and debt securities, including listed securities and securities for which price quotations are available, will normally be valued on the basis of valuations furnished by a pricing service. Foreign securities and currencies are valued in U.S. dollars, based on foreign currency exchange rate quotations supplied by an independent quotation service. The daily val uation of exchange traded foreign securities generally is determined as of the close of trading on the principal exchange on which such securities trade. Events occurring after the close of trading on foreign exchanges may result in adjustments to the valuation of foreign securities to more accurately reflect their fair value as of the close of regular trading on the New York Stock Exchange. When valuing foreign equity securities that meet certain criteria, the Trustees have approved the use of a fair value service that values such securities to reflect market trading that occurs after the close of the applicable foreign markets of comparable securities or other instruments that have a strong correlation to the fair valued securities. Investments held by the Portfolio for which valuations or market quotations are unavailable are valued at fair value using methods determined in good faith by or at the direction of the Trustees of the Port folio considering relevant factors, data and information including the market value of freely tradable securities of the same class in the principal market on which such securities are normally traded.
B Income — Dividend income is recorded on the ex-dividend date for dividends received in cash and/or securities. However, if the ex-dividend date has passed, certain dividends from foreign securities are recorded as the Portfolio is informed of the ex-dividend date. Withholding taxes on foreign dividends and capital gains have been provided for in accordance with the Portfolio's understanding of the applicable countries' tax rules and rates. Interest income is recorded on the accrual basis.
C Federal Taxes — The Portfolio has elected to be treated as a partnership for federal tax purposes. No provision is made by the Portfolio for federal or state taxes on any taxable income of the Portfolio because each investor in the Portfolio is ultimately responsible for the payment of any taxes on its share of taxable income. Since at least one of the Portfolio's investors is a regulated investment company that invests all or substantially all of its assets in the Portfolio, the Portfolio normally must satisfy the applicable source of income and diversification requirements (under the Internal Revenue Code) in order for its investors to satisfy them. The Portfolio will allocate, at least annually a mong its investors, each investor's distributive share of the Portfolio's net investment income, net realized capital gains, and any other items of income, gain, loss, deduction or credit.
D Financial Futures Contract — Upon entering a financial futures contract, the Portfolio is required to deposit either in cash or securities an amount (initial margin) equal to a certain percentage of the purchase price indicated in the financial futures contract. Subsequent payments are made or received by the Portfolio (margin
Tax-Managed Small-Cap Value Portfolio as of October 31, 2006
NOTES TO FINANCIAL STATEMENTS CONT'D
maintenance) each day, dependent on daily fluctuations in the value of the underlying security, and are recorded for book purposes as unrealized gains or losses by the Portfolio. The Portfolio's investment in financial futures contracts is designed to hedge against anticipated future changes in price of current or anticipated Portfolio positions. Should prices move unexpectedly, the Portfolio may not achieve the anticipated benefits of the financial futures contracts and may realize a loss.
E Purchased Options — Upon the purchase of a call or put option, the premium paid by the Portfolio is included in the Statement of Assets and Liabilities as an investment. The amount of the investment is subsequently marked-to-market to reflect the current market value of the option purchased, in accordance with the Portfolio's policies on investment valuations discussed above. If an option which the Portfolio has purchased expires on the stipulated expiration date, the Portfolio will realize a loss in the amount of the cost of the option. If the Portfolio enters into a closing sale transaction, the Portfolio will realize a gain or loss, depending on whether the sales proceeds from the closing sale tr ansaction are greater or less than the cost of the option. If a Portfolio exercises a put option, it will realize a gain or loss from the sale of the underlying security, and the proceeds from such sale will be decreased by the premium originally paid. If the Portfolio exercises a call option, the cost of the security which the Portfolio purchases upon exercise will be increased by the premium originally paid.
F Securities Sold Short — The Portfolio may sell individual securities short if it owns at least an equal amount of the security sold short or has at the time of sale a right to obtain securities equivalent in kind and amount to the securities sold and provided that, if such right is conditional, the sale is made upon the same conditions (a covered short sale). The Portfolio may sell short securities representing an index or basket of securities whose constituents the Portfolio holds in whole or in part. A short sale of an index or basket security will be a covered short sale if the underlying index or basket of securities is the same or substantially identical to securities held by the Portfolio.
The seller of a short position generally realizes a profit on the transaction if the price it receives on the short sale exceeds the cost of closing out the position by purchasing securities in the market, but generally realizes a loss if the cost of closing out the short position exceeds the proceeds of the short sale. The exposure to loss on covered short sales (to the extent the value of the security sold short rises instead of falls) is offset by the increase in value of the underlying security or securities retained. The profit or loss on a covered short sale is also affected by the borrowing cost of any securities borrowed in connection with the short sale (which will vary with market conditions) and use of the proceeds of the short sale. The Portfolio expects normally to close its covered short sales by delivering newly-acquired stock.
Exposure to loss on an index or basket security sold short will not be offset by gains on other securities holdings to the extent that the constituent securities of the index or basket security sold short are not held by the Portfolio. Such losses may be substantial.
G Foreign Currency Translation — Investment valuations, other assets, and liabilities initially expressed in foreign currencies are converted each business day into U.S. dollars based upon current exchange rates. Purchases and sales of foreign investment securities and income and expenses are converted into U.S. dollars based upon currency exchange rates prevailing on the respective dates of such transactions. Recognized gains or losses on investment transactions attributable to changes in foreign currency exchange rates are recorded for financial statement purposes as net realized gains and losses on investments. That portion of unrealized gains and losses on investments that results from fluctuation s in foreign currency exchange rates is not separately disclosed.
H Expense Reduction — Investors Bank & Trust Company (IBT) serves as custodian of the Portfolio. Pursuant to the custodian agreement, IBT receives a fee reduced by credits which are determined based on the average daily cash balance the Portfolio maintains with IBT. All credit balances used to reduce the Portfolio's custodian fees are reported as a reduction of expenses in the Statement of Operations.
I Indemnifications — Under the Portfolio's organizational documents, its officers and Trustees may be indemnified against certain liabilities and expenses arising out of the performance of their duties to the Portfolio. Interestholders in the Portfolio are jointly and severally liable for the liabilities and obligations of the Portfolio in the event that the Portfolio fails to satisfy such liabilities and obligations; provided, however, that, to the extent assets are available in the Portfolio, the Portfolio may, under certain circumstances, indemnify interestholders from and against any claim or liability to which such holder may become subject by reason of being or having been an interestholder in t he Portfolio. Additionally, in the normal course of business, the Portfolio enters into agreements
Tax-Managed Small-Cap Value Portfolio as of October 31, 2006
NOTES TO FINANCIAL STATEMENTS CONT'D
with service providers that may contain indemnification clauses. The Portfolio's maximum exposure under these arrangements is unknown as this would involve future claims that may be made against the Portfolio that have not yet occurred.
J Use of Estimates — The preparation of the financial statements in conformity with accounting principles generally accepted in the United States of America requires management to make estimates and assumptions that affect the reported amounts of assets and liabilities at the date of the financial statements and the reported amounts of income and expense during the reporting period. Actual results could differ from those estimates.
K Other — Investment transactions are accounted for on the date the securities are purchased or sold. Realized gains and losses on securities sold are determined on the basis of identified cost.
2 Investment Adviser Fee and Other Transactions
with Affiliates
The investment adviser fee is earned by Boston Management and Research (BMR), a wholly-owned subsidiary of EVM, as compensation for management and investment advisory services rendered to the Portfolio. Under the advisory agreement, BMR receives a monthly advisory fee in the amount of 1.00% annually of average daily net assets of the Portfolio up to $500 million, and at reduced rates as daily net assets exceed that level. For the year ended October 31, 2006, the advisory fee amounted to $536,925. Pursuant to a sub-advisory agreement, BMR has delegated the investment management of the Portfolio to Fox. BMR pays Fox a monthly fee for sub-advisory services provided to the Portfolio in the amount of 0.75% annually of average daily net assets up to $500 million, and at reduced rates as daily net assets exceed that level. Except for Trustees of the Portfolio who are not members of EVM's or BMR's organization, officers and Trustees rec eive remuneration for their services to the Portfolio out of the investment adviser fee. Trustees of the Portfolio who are not affiliated with BMR may elect to defer receipt of all or a percentage of their annual fees in accordance with the terms of the Trustees Deferred Compensation Plan. For the year ended October 31, 2006, no significant amounts have been deferred.
Certain officers and Trustees of the Portfolio are officers of the above organizations.
3 Investment Transactions
Purchases and sales of investments, other than short-term obligations, aggregated $25,043,504 and $30,248,450, respectively, for the year ended October 31, 2006.
4 Federal Income Tax Basis of Unrealized Appreciation (Depreciation)
The cost and unrealized appreciation (depreciation) in value of the investments owned at October 31, 2006, as determined on a federal income tax basis, were as follows:
| Aggregate cost | | $ | 34,970,832 | | |
| Gross unrealized appreciation | | $ | 16,037,723 | | |
| Gross unrealized depreciation | | | (30,283 | ) | |
| Net unrealized appreciation | | $ | 16,007,440 | | |
5 Financial Instruments
The Portfolio may trade in financial instruments with off-balance sheet risk in the normal course of its investing activities to assist in managing exposure to various market risks. These financial instruments include written options and financial futures contracts and may involve, to a varying degree, elements of risk in excess of the amounts recognized for financial statement purposes.
The notional or contractual amounts of these instruments represent the investment the Portfolio has in particular classes of financial instruments and does not necessarily represent the amounts potentially subject to risk. The measurement of the risks associated with these instruments is meaningful only when all related and offsetting transactions are considered. The Portfolio did not have any open obligations under these financial instruments at October 31, 2006.
6 Line of Credit
The Portfolio participates with other portfolios and funds managed by BMR and EVM and its affiliates in a $150 million unsecured line of credit agreement with a group of banks. Borrowings will be made by the Portfolio solely to facilitate the handling of unusual and/or unanticipated short-term cash requirements. Interest is charged to each participating portfolio or fund based on its borrowings at an amount above either the Eurodollar rate or Federal Funds rate. In addition, a fee computed at an annual rate of 0.10% on the daily unused portion of the line of credit is allocated among the participating portfolios and funds at the end of each quarter.
Tax-Managed Small-Cap Value Portfolio as of October 31, 2006
NOTES TO FINANCIAL STATEMENTS CONT'D
The Portfolio did not have any significant borrowings or allocated fees for the year ended October 31, 2006.
7 Recently Issued Accounting Pronouncements
In June 2006, the Financial Accounting Standards Board (FASB) issued FASB Interpretation No. 48, (FIN 48) "Accounting for Uncertainty in Income Taxes – an interpretation of FASB Statement No. 109". FIN 48 clarifies the accounting for uncertainty in income taxes recognized in accordance with FASB Statement No. 109, "Accounting for Income Taxes." This interpretation prescribes a recognition threshold and measurement attribute for the financial statement recognition and measurement of a tax position taken or expected to be taken in a tax return. It also provides guidance on de-recognition, classification, interest and penalties, accounting in interim periods, disclosure and transition. FIN 48 is effective for fiscal years beginning after December 15, 2006. Management is currently evaluating the impact of applying the various provisions of FIN 48.
In September 2006, FASB issued Statement of Financial Accounting Standards No. 157 (FAS 157) "Fair Value Measurements". FAS 157 defines fair value, establishes a framework for measuring fair value in accordance with generally accepted accounting principles and expands disclosure about fair value measurements. FAS 157 is effective for fiscal years beginning after November 15, 2007. Management is currently evaluating the impact the adoption of FAS 157 will have on the Portfolio's financial statement disclosures.
Tax-Managed Small-Cap Value Portfolio as of October 31, 2006
REPORT OF INDEPENDENT REGISTERED PUBLIC ACCOUNTING FIRM
To the Trustees and Investors
of Tax-Managed Small-Cap Value Portfolio:
We have audited the accompanying statement of assets and liabilities of Tax-Managed Small-Cap Value Portfolio (the "Portfolio"), including the portfolio of investments, as of October 31, 2006, and the related statement of operations for the year then ended, the statements of changes in net assets for each of the two years in the period then ended, and the supplementary data for each of the four years in the period then ended, and for the period from the start of business, March 1, 2002, to October 31, 2002. These financial statements and supplementary data are the responsibility of the Portfolio's management. Our responsibility is to express an opinion on these financial statements and supplementary data based on our audits.
We conducted our audits in accordance with standards of the Public Company Accounting Oversight Board (United States). Those standards require that we plan and perform the audit to obtain reasonable assurance about whether the financial statements and supplementary data are free of material misstatement. The Portfolio is not required to have, nor were we engaged to perform, an audit of its internal control over financial reporting. Our audits included consideration of internal control over financial reporting as a basis for designing audit procedures that are appropriate in the circumstances, but not for the purpose of expressing an opinion on the effectiveness of the Portfolio's internal control over financial reporting. Accordingly, we express no such opinion. An audit also includes examining, on a test basis, evidence supporting the amounts and disclosures in the financial statements, assessing the accounting principles used and significant estimates made by management, as well as evaluating the overall financial statement presentation. Our procedures included confirmation of securities owned as of October 31, 2006 by correspondence with the custodian and brokers. We believe that our audits provide a reasonable basis for our opinion.
In our opinion, the financial statements and supplementary data referred to above present fairly, in all material respects, the financial position of Tax-Managed Small-Cap Value Portfolio as of October 31, 2006, the results of its operations for the year then ended, the changes in its net assets for each of the two years in the period then ended, and the supplementary data for each of the four years in the period then ended, and for the period from the start of business, March 1, 2002, to October 31, 2002, in conformity with accounting principles generally accepted in the United States of America.
DELOITTE & TOUCHE LLP
Boston, Massachusetts
December 15, 2006
26
Eaton Vance Tax-Managed Small-Cap Value Fund
BOARD OF TRUSTEES' ANNUAL APPROVAL OF THE INVESTMENT ADVISORY AGREEMENT
Overview of the Contract Review Process
The Investment Company Act of 1940, as amended (the "1940 Act"), provides, in substance, that each investment advisory agreement between a fund and its investment adviser will continue in effect from year to year only if its continuance is approved at least annually by the fund's board of trustees, including by a vote of a majority of the trustees who are not "interested persons" of the fund ("Independent Trustees") cast in person at a meeting called for the purpose of considering such approval.
At a meeting of the Boards of Trustees (each a "Board") of the Eaton Vance group of mutual funds (the "Eaton Vance Funds") held on March 27, 2006, the Board, including a majority of the Independent Trustees, voted to approve continuation of existing advisory and sub-advisory agreements for the Eaton Vance Funds for an additional one-year period. In voting its approval, the Board relied upon the affirmative recommendation of the Special Committee of the Board, which is a committee comprised exclusively of Independent Trustees. Prior to making its recommendation, the Special Committee reviewed information furnished for a series of meetings of the Special Committee held in February and March 2006. Such information included, among other things, the following:
Information about Fees, Performance and Expenses
• An independent report comparing the advisory and related fees paid by each fund with fees paid by comparable funds;
• An independent report comparing each fund's total expense ratio and its components to comparable funds;
• An independent report comparing the investment performance of each fund to the investment performance of comparable funds over various time periods;
• Data regarding investment performance in comparison to relevant peer groups of funds and appropriate indices;
• Comparative information concerning fees charged by each adviser for managing other mutual funds and institutional accounts using investment strategies and techniques similar to those used in managing the fund;
• Profitability analyses for each adviser with respect to each fund managed by it;
Information about Portfolio Management
• Descriptions of the investment management services provided to each fund, including the investment strategies and processes employed;
• Information concerning the allocation of brokerage and the benefits received by each adviser as a result of brokerage allocation, including information concerning the acquisition of research through "soft dollar" benefits received in connection with the funds' brokerage, and the implementation of a soft dollar reimbursement program established with respect to the funds;
• Data relating to portfolio turnover rates of each fund;
• The procedures and processes used to determine the fair value of fund assets and actions taken to monitor and test the effectiveness of such procedures and processes;
Information about each Adviser
• Reports detailing the financial results and condition of each adviser;
• Descriptions of the qualifications, education and experience of the individual investment professionals whose responsibilities include portfolio management and investment research for the funds, and information relating to their compensation and responsibilities with respect to managing other mutual funds and investment accounts;
• Copies of the Codes of Ethics of each adviser and its affiliates, together with information relating to compliance with and the administration of such codes;
• Information concerning the resources devoted to compliance efforts undertaken by each adviser and its affiliates on behalf of the funds (including descriptions of various compliance programs) and their record of compliance with investment policies and restrictions, including policies with respect to market-timing, late trading and selective portfolio disclosure, and with policies on personal securities transactions;
• Descriptions of the business continuity and disaster recovery plans of each adviser and its affiliates;
Other Relevant Information
• Information concerning the nature, cost and character of the administrative and other non-investment management services provided by Eaton Vance Management and its affiliates;
• Information concerning management of the relationship with the custodian, subcustodians and fund accountants by each adviser or the funds' administrator; and
• The terms of each advisory agreement.
In addition to the information identified above, the Special Committee considered information provided from time to time by each adviser throughout the year at meetings of the Board and its committees. Over the course of the twelve month period ended March 31, 2006, the
27
Eaton Vance Tax-Managed Small-Cap Value Fund
BOARD OF TRUSTEES' ANNUAL APPROVAL OF THE INVESTMENT ADVISORY AGREEMENT CONT'D
Board met nine times and the Special Committee, the Audit Committee and the Governance Committee, each of which is a Committee comprised solely of Independent Trustees, met eight, twelve and five times, respectively. At such meetings, the Trustees received, among other things, presentations by the portfolio managers and other investment professionals of each adviser relating to the investment performance of each fund and the investment strategies used in pursuing the fund's investment objective.
For funds that invest through one or more underlying portfolios, the Board considered similar information about the portfolio(s) when considering the approval of advisory agreements. In addition, in cases where the fund's investment adviser has engaged a sub-adviser, the Board considered similar information about the sub-adviser when considering the approval of any sub-advisory agreement.
The Special Committee was assisted throughout the contract review process by Goodwin Procter LLP, legal counsel for the Independent Trustees. The members of the Special Committee relied upon the advice of such counsel and their own business judgment in determining the material factors to be considered in evaluating each advisory and sub-advisory agreement and the weight to be given to each such factor. The conclusions reached with respect to each advisory and sub-advisory agreement were based on a comprehensive evaluation of all the information provided and not any single factor. Moreover, each member of the Special Committee may have placed varying emphasis on particular factors in reaching conclusions with respect to each advisory and sub-advisory agreement.
Results of the Process
Based on its consideration of the foregoing, and such other information as it deemed relevant, including the factors and conclusions described below, the Special Committee concluded that the continuance of the investment advisory agreement of the Tax-Managed Small-Cap Value Portfolio (the "Portfolio"), the portfolio in which the Eaton Vance Tax-Managed Small-Cap Value Fund (the "Fund") invests, with Boston Management and Research (the "Adviser"), and the sub-advisory agreement with Fox Asset Management LLC (the "Sub-adviser"), including their fee structures, is in the interests of shareholders and, therefore, the Special Committee recommended to the Board approval of the respective agreements. The Board accepted the recommendation of the Special Committee as well as the factors considered and conclusions reached by the Special Committee with respect to the agreements. Accordingly, the Board, including a majority of the Independe nt Trustees, voted to approve continuation of the investment advisory agreement and the sub-advisory agreement for the Portfolio.
Nature, Extent and Quality of Services
In considering whether to approve the investment advisory agreement and sub-advisory agreements of the Portfolio, the Board evaluated the nature, extent and quality of services provided to the Portfolio by the Adviser and the Sub-adviser.
The Board considered the Adviser's and the Sub-adviser's management capabilities and investment process with respect to the types of investments held by the Portfolio, including the education, experience and number of its investment professionals and other personnel who provide portfolio management, investment research, and similar services to the Portfolio and whose responsibilities include supervising the Sub-adviser. The Board specifically noted the Adviser's in-house equity research capabilities. The Board also took into account the resources dedicated to portfolio management and other services, including the compensation paid to recruit and retain investment personnel, and the time and attention devoted to each Portfolio in the complex by senior management. With respect to the Sub-adviser, the Board took into account the resources available to the Sub-adviser in fulfilling its duties under the sub-advisory agreement and the Sub-adviser's experience in managing equity portfolios, as well as recent changes in personnel.
The Board reviewed the compliance programs of the Adviser and relevant affiliates thereof, including the Sub-adviser. Among other matters, the Board considered compliance and reporting matters relating to personal trading by investment personnel, selective disclosure of portfolio holdings, late trading, frequent trading, portfolio valuation, business continuity and the allocation of investment opportunities. The Board also evaluated the responses of the Adviser and its affiliates to requests from regulatory authorities such as the Securities and Exchange Commission and the National Association of Securities Dealers.
The Board considered shareholder and other administrative services provided or managed by Eaton Vance Management and its affiliates, including transfer agency and accounting services. The Board evaluated the benefits to shareholders of investing in a fund that is a part of a large family of funds, including the ability, in many cases, to exchange an investment among different funds without incurring additional sales charges.
After consideration of the foregoing factors, among others, the Board concluded that the nature, extent and quality of services provided by the Adviser and Sub-adviser, taken as a whole, are appropriate and consistent with the terms of the investment advisory agreement and sub-advisory agreement, respectively.
28
Eaton Vance Tax-Managed Small-Cap Value Fund
BOARD OF TRUSTEES' ANNUAL APPROVAL OF THE INVESTMENT ADVISORY AGREEMENT CONT'D
Fund Performance
The Board compared the Fund's investment performance to a relevant universe of similarly managed funds identified by an independent data provider and appropriate benchmark indices. The Board reviewed comparative performance data for the one- and three-year periods ended September 30, 2005 for the Fund. The Board noted that action was being taken to improve the performance of the Fund, including changes in personnel primarily responsible for managing the Fund, and concluded that it was appropriate to allow reasonable time to evaluate the effectiveness of this action.
Management Fees and Expenses
The Board reviewed contractual investment advisory fee rates, including administrative fees, payable by the Portfolio and the Fund (referred to collectively as "management fees").
As part of its review, the Board considered the management fees, including administrative fees, and the Fund's total expense ratio for the one-year period ended September 30, 2005, as compared to a group of similarly managed funds selected by an independent data provider. The Board considered the fact that the Adviser had waived fees and/or paid expenses for the Fund. The Board also noted the small size of the Fund relative to other similarly managed funds.
After reviewing the foregoing information, and in light of the nature, extent and quality of the services provided by the Adviser, the Board concluded that the management fees charged for advisory and related services and the Fund's total expense ratio are reasonable.
Profitability
The Board reviewed the level of profits realized by the Adviser and relevant affiliates thereof, including the Sub-adviser, in providing investment advisory and administrative services to the Portfolio, the Fund and all Eaton Vance Funds as a group. The Board considered the level of profits realized without regard to revenue sharing or other payments by the Adviser and its affiliates to third parties in respect of distribution services. The Board also considered other direct or indirect benefits received by the Adviser and its affiliates, including the Sub-adviser, in connection with its relationship with the Portfolio and the Fund, including the benefits of research services that may be available to the Adviser as a result of securities transactions effected for the Portfolio and other advisory clients.
The Board concluded that, in light of the foregoing factors and the nature, extent and quality of the services rendered, the profits realized by the Adviser and its affiliates, including the Sub-adviser, are reasonable.
Economies of Scale
In reviewing management fees and profitability, the Board also considered the extent to which the Adviser and its affiliates, including the Sub-adviser, on the one hand, and the Fund, on the other hand, can expect to realize benefits from economies of scale as the assets of the Fund and the Portfolio increase. The Board acknowledged the difficulty in accurately measuring the benefits resulting from the economies of scale with respect to the management of any specific fund or group of funds. The Board reviewed data summarizing the increases and decreases in the assets of the Fund and of all Eaton Vance Funds as a group over various time periods, and evaluated the extent to which the total expense ratio of the Fund and the profitability of the Adviser and its affiliates may have been affected by such increases or decreases. Based upon the foregoing, the Board concluded that the benefits from economies of scale are currently being shared equitably by the Adviser and its affiliates, including the Sub-adviser, and the Fund. The Board also concluded that, assuming reasonably foreseeable increases in the assets of the Portfolio, the structure of the advisory fee, which includes breakpoints at several asset levels, can be expected to cause the Adviser and its affiliates, including the Sub-adviser, and the Fund to continue to share such benefits equitably.
29
Eaton Vance Tax-Managed Small-Cap Value Fund
MANAGEMENT AND ORGANIZATION
Fund Management. The Trustees of Eaton Vance Mutual Funds Trust (the Trust) and Tax-Managed Small-Cap Value Portfolio (the Portfolio) are responsible for the overall management and supervision of the Trust's and Portfolio's affairs. The Trustees and officers of the Trust and the Portfolio are listed below. Except as indicated, each individual has held the office shown or other offices in the same company for the last five years. Trustees and officers of the Trust and the Portfolio hold indefinite terms of office. The "noninterested Trustees" consist of those Trustees who are not "interested persons" of the Trust and the Portfolio, as that term is defined under the 1940 Act. The business address of each Trustee and officer is The Eaton Vance Building, 255 State Street, Boston, Massachusetts 02109. As used below, "EVC" refers to Eaton Vance Corp., "EV" refers to Eaton Vance, Inc., "EVM" refers to Eaton Vance Management, "BMR" refers to Boston Management and Research, "Parametric" refers to Parametric Portfolio Associates, "EVD" refers to Eaton Vance Distributors, Inc. and "Fox" refers to Fox Asset Management LLC. EVC and EV are the corporate parent and trustee, respectively, of EVM and BMR. EVD is the Fund's principal underwriter, the Portfolio's placement agent and a wholly-owned subsidiary of EVM. Each officer affiliated with Eaton Vance may hold a position with other Eaton Vance affiliates that is comparable to his or her position with EVM listed below.
Name and
Date of Birth | | Position(s)
with the
Trust and
the Portfolio | | Term of
Office and
Length of
Service | | Principal Occupation(s)
During Past Five Years | | Number of Portfolios
in Fund Complex
Overseen By
Trustee(1) | | Other Directorships Held | |
| Interested Trustee | | | | | | | | | | | | | |
|
| James B. Hawkes 11/9/41 | | Trustee of the Trust; President and Trustee of the Portfolio | | Trustee of the Trust since 1991; President and Trustee of the Portfolio since 2001 | | Chairman and Chief Executive Officer of EVC, BMR, EVM and EV; Director of EV; Vice President and Director of EVD. Trustee and/or officer of 170 registered investment companies in the Eaton Vance Fund Complex. Mr. Hawkes is an interested person because of his positions with BMR, EVM, EVC and EV, which are affiliates of the Trust and the Portfolio. | | | 170 | | | Director of EVC | |
|
| Noninterested Trustee(s) | | | | | | | | | | | | | |
|
| Benjamin C. Esty 1/2/63 | | Trustee | | Since 2005 | | Roy and Elizabeth Simmons Professor of Business Administration, Harvard University Graduate School of Business Administration (since 2003). Formerly, Associate Professor, Harvard University Graduate School of Business Administration (2000-2003). | | | 170 | | | None | |
|
| Samuel L. Hayes, III 2/23/35 | | Trustee and Chairman of the Board | | Trustee of the Trust since 1986; of the Portfolio since 2001 and Chairman of the Board since 2005 | | Jacob H. Schiff Professor of Investment Banking Emeritus, Harvard University Graduate School of Business Administration. Director of Yakima Products, Inc. (manufacturer of automotive accessories) (since 2001) and Director of Telect, Inc. (telecommunications services company). | | | 170 | | | Director of Tiffany & Co. (specialty retailer) | |
|
| William H. Park 9/19/47 | | Trustee | | Since 2003 | | Vice Chairman, Commercial Industrial Finance Corp. (specialty finance company) (since 2006). Formerly, President and Chief Executive Officer, Prizm Capital Management, LLC (investment management firm) (2002-2005). Formerly, Executive Vice President and Chief Financial Officer, United Asset Management Corporation (a holding company owning institutional investment management firms) (1982-2001). | | | 170 | | | None | |
|
| Ronald A. Pearlman 7/10/40 | | Trustee | | Since 2003 | | Professor of Law, Georgetown University Law Center. | | | 170 | | | None | |
|
| Norton H. Reamer 9/21/35 | | Trustee | | Trustee of the Trust since 1986 and of the Portfolio since 2001 | | President, Chief Executive Officer and a Director of Asset Management Finance Corp. (a specialty finance company serving the investment management industry) (since October 2003). President, Unicorn Corporation (an investment and financial advisory services company) (since September 2000). Formerly, Chairman and Chief Operating Officer, Hellman, Jordan Management Co., Inc. (an investment management company) (2000-2003). Formerly, Advisory Director of Berkshire Capital Corporation (investment banking firm) (2002-2003). | | | 170 | | | None | |
|
30
Eaton Vance Tax-Managed Small-Cap Value Fund
MANAGEMENT AND ORGANIZATION CONT'D
Name and
Date of Birth | | Position(s)
with the
Trust and
the Portfolio | | Term of
Office and
Length of
Service | | Principal Occupation(s)
During Past Five Years | | Number of Portfolios
in Fund Complex
Overseen By
Trustee(1) | | Other Directorships Held | |
| Noninterested Trustee(s) (continued) | | | | | | | | | | | |
|
| Lynn A. Stout 9/14/57 | | Trustee | | Trustee of the Trust since 1998 and of the Portfolio since 2001 | | Professor of Law, University of California at Los Angeles School of Law. | | | 170 | | | None | |
|
| Ralph F. Verni 1/26/43 | | Trustee | | Since 2005 | | Consultant and private investor. | | | 170 | | | None | |
|
| Principal Officers who are not Trustees | | | | | | | | | |
|
Name and
Date of Birth | | Position(s)
with the
Trust and
the Portfolio | | Term of
Office and
Length of
Service | | Principal Occupation(s)
During Past Five Years | |
| Thomas E. Faust Jr. 5/31/58 | | President of the Trust and Vice President of the Portfolio | | President of the Trust since 2002 and Vice President of the Portfolio since 2001 | | President of EVC, EVM, BMR and EV and Director of EVC. Chief Investment Officer of EVC, EVM and BMR. Officer of 71 registered investment companies and 5 private investment companies managed by EVM or BMR. | |
|
| William H. Ahern, Jr. 7/28/59 | | Vice President of the Trust | | Since 1995 | | Vice President of EVM and BMR. Officer of 71 registered investment companies managed by EVM or BMR. | |
|
| Cynthia J. Clemson 3/2/63 | | Vice President of the Trust | | Since 2005 | | Vice President of EVM and BMR. Officer of 86 registered investment companies managed by EVM or BMR. | |
|
| Gregory R. Greene 11/13/66 | | Vice President of
the Portfolio | | Since 2005 | | Managing Director of Fox. Officer of 16 registered investment companies managed by EVM or BMR. | |
|
| Aamer Khan 6/7/60 | | Vice President of
the Trust | | Since 2005 | | Vice President of EVM and BMR. Officer of 29 registered investment companies managed by EVM or BMR. | |
|
| Thomas H. Luster 4/8/62 | | Vice President of
the Trust | | Since 2006 | | Vice President of EVM and BMR. Officer of 45 registered investment companies managed by EVM or BMR. | |
|
| Michael R. Mach 7/15/47 | | Vice President of
the Trust | | Since 1999 | | Vice President of EVM and BMR. Officer of 51 registered investment companies managed by EVM or BMR. | |
|
| Robert B. MacIntosh 1/22/57 | | Vice President of
the Trust | | Since 1998 | | Vice President of EVM and BMR. Officer of 86 registered investment companies managed by EVM or BMR. | |
|
| Robert J. Milmore 4/3/69 | | Vice President of
the Portfolio | | Since 2006 | | Assistant Vice President of Fox. Previously, Manager of International Treasury of Cendant Corporation (2001-2005). Officer of 16 registered investment companies managed by EVM or BMR. | |
|
| Cliff Quisenberry, Jr. 1/1/65 | | Vice President of
the Trust | | Since 2006 | | Vice President and Director of Research and Product Development of Parametric. Officer of 30 registered investment companies managed by EVM or BMR. | |
|
| Duncan W. Richardson 10/26/57 | | Vice President of
the Trust | | Since 2001 | | Executive Vice President and Chief Equity Investment Officer of EVC, EVM and BMR. Officer of 71 registered investment companies managed by EVM or BMR. | |
|
| Walter A. Row, III 7/20/57 | | Vice President of
the Trust | | Since 2001 | | Director of Equity Research and a Vice President of EVM and BMR. Officer of 33 registered investment companies managed by EVM or BMR. | |
|
| Judith A. Saryan 8/21/54 | | Vice President of
the Trust | | Since 2003 | | Vice President of EVM and BMR. Officer of 50 registered investment companies managed by EVM or BMR. | |
|
31
Eaton Vance Tax-Managed Small-Cap Value Fund
MANAGEMENT AND ORGANIZATION CONT'D
Name and
Date of Birth | | Position(s)
with the
Trust and
the Portfolio | | Term of
Office and
Length of
Service | | Principal Occupation(s)
During Past Five Years | |
| Principal Officers who are not Trustees (continued) | | | | | | | |
|
| Susan Schiff 3/13/61 | | Vice President of
the Trust | | Since 2002 | | Vice President of EVM and BMR. Officer of 30 registered investment companies managed by EVM or BMR. | |
|
| Barbara E. Campbell 6/19/57 | | Treasurer of the Trust | | Since 2005(2) | | Vice President of EVM and BMR. Officer of 170 registered investment companies managed by EVM or BMR. | |
|
| Alan R. Dynner 10/10/40 | | Secretary | | Secretary of the Trust since 1997 and of the Portfolio since 2001 | | Vice President, Secretary and Chief Legal Officer of BMR, EVM, EVD, EV and EVC. Officer of 170 registered investment companies managed by EVM or BMR. | |
|
| Michelle A. Green 8/25/69 | | Treasurer of
the Portfolio | | Since 2002(2) | | Vice President of EVM and BMR. Officer of 63 registered investment companies and 5 private investment companies managed by EVM or BMR. | |
|
| Paul M. O'Neil 7/11/53 | | Chief
Compliance Officer | | Since 2004 | | Vice President of EVM and BMR. Officer of 170 registered investment companies managed by EVM or BMR. | |
|
(1) Includes both master and feeder funds in a master-feeder structure.
(2) Prior to 2005, Ms. Campbell served as Assistant Treasurer of the Trust since 1995. Prior to 2002, Ms. Green served as Assistant Treasurer of the Portfolio since 2001.
The SAI for the Fund includes additional information about the Trustees and officers of the Fund and the Portfolio and can be obtained without charge by calling 1-800-225-6265.
32
Investment Adviser of Tax-Managed Small-Cap Value Portfolio
Boston Management and Research
The Eaton Vance Building
255 State Street
Boston, MA 02109
Sub-Adviser of Tax-Managed Small-Cap Value Portfolio
Fox Asset Management LLC
331 Newman Springs Road, Suite 122
Red Bank, NJ 07701
Administrator of Eaton Vance Tax-Managed Small-Cap Value Fund
Eaton Vance Management
The Eaton Vance Building
255 State Street
Boston, MA 02109
Principal Underwriter
Eaton Vance Distributors, Inc.
The Eaton Vance Building
255 State Street
Boston, MA 02109
(617) 482-8260
Custodian
Investors Bank & Trust Company
200 Clarendon Street
Boston, MA 02116
Transfer Agent
PFPC Inc.
Attn: Eaton Vance Funds
P.O. Box 9653
Providence, RI 02940-9653
(800) 262-1122
Independent Registered Public Accounting Firm
Deloitte & Touche LLP
200 Berkeley Street
Boston, MA 02116-5022
Eaton Vance Tax-Managed Small-Cap Value Fund
The Eaton Vance Building
255 State Street
Boston, MA 02109
This report must be preceded or accompanied by a current prospectus. Before investing, investors should consider carefully the Fund's investment objective(s), risks, and charges and expenses. The Fund's current prospectus contains this and other information about the Fund and is available through your financial advisor. Please read the prospectus carefully before you invest or send money. For further information please call 1-800-225-6265.
1300-12/06 TMSCVSRC

Annual Report October 31, 2006


EATON VANCE
TAX-MANAGED
MID-CAP
CORE
FUND
IMPORTANT NOTICES REGARDING PRIVACY,
DELIVERY OF SHAREHOLDER DOCUMENTS,
PORTFOLIO HOLDINGS AND PROXY VOTING
Privacy. The Eaton Vance organization is committed to ensuring your financial privacy. Each of the financial institutions identified below has in effect the following policy ("Privacy Policy") with respect to nonpublic personal information about its customers:
• Only such information received from you, through application forms or otherwise, and information about your Eaton Vance fund transactions will be collected. This may include information such as name, address, social security number, tax status, account balances and transactions.
• None of such information about you (or former customers) will be disclosed to anyone, except as permitted by law (which includes disclosure to employees necessary to service your account). In the normal course of servicing a customer's account, Eaton Vance may share information with unaffiliated third parties that perform various required services such as transfer agents, custodians and broker/dealers.
• Policies and procedures (including physical, electronic and procedural safeguards) are in place that are designed to protect the confidentiality of such information.
• We reserve the right to change our Privacy Policy at any time upon proper notification to you. Customers may want to review our Policy periodically for changes by accessing the link on our homepage: www.eatonvance.com.
Our pledge of privacy applies to the following entities within the Eaton Vance organization: the Eaton Vance Family of Funds, Eaton Vance Management, Eaton Vance Investment Counsel, Boston Management and Research, and Eaton Vance Distributors, Inc.
In addition, our Privacy Policy only applies to those Eaton Vance customers who are individuals and who have a direct relationship with us. If a customer's account (i.e., fund shares) is held in the name of a third-party financial adviser/ broker- dealer, it is likely that only such adviser's privacy policies apply to the customer. This notice supersedes all previously issued privacy disclosures.
For more information about Eaton Vance's Privacy Policy, please call 1-800-262-1122.
Delivery of Shareholder Documents. The Securities and Exchange Commission (the "SEC") permits funds to deliver only one copy of shareholder documents, including prospectuses, proxy statements and shareholder reports, to fund investors with multiple accounts at the same residential or post office box address. This practice is often called "householding" and it helps eliminate duplicate mailings to shareholders.
Eaton Vance, or your financial adviser, may household the mailing of your documents indefinitely unless you instruct Eaton Vance, or your financial adviser, otherwise.
If you would prefer that your Eaton Vance documents not be householded, please contact Eaton Vance at 1-800-262-1122, or contact your financial adviser.
Your instructions that householding not apply to delivery of your Eaton Vance documents will be effective within 30 days of receipt by Eaton Vance or your financial adviser.
Portfolio Holdings. Each Eaton Vance Fund and its underlying Portfolio (if applicable) will file a schedule of its portfolio holdings on Form N-Q with the SEC for the first and third quarters of each fiscal year. The Form N-Q will be available on the Eaton Vance website www.eatonvance.com, by calling Eaton Vance at 1-800-262-1122 or in the EDGAR database on the SEC's website at www.sec.gov. Form N-Q may also be reviewed and copied at the SEC's public reference room in Washington, D.C. (call 1-800-732-0330 for information on the operation of the public reference room).
Proxy Voting. From time to time, funds are required to vote proxies related to the securities held by the funds. The Eaton Vance Funds or their underlying Portfolios (if applicable) vote proxies according to a set of policies and procedures approved by the Funds' and Portfolios' Boards. You may obtain a description of these policies and procedures and information on how the Funds or Portfolios voted proxies relating to portfolio securities during the most recent 12 month period ended June 30, without charge, upon request, by calling 1-800-262-1122. This description is also available on the SEC's website at www.sec.gov.
Eaton Vance Tax-Managed Mid-Cap Core Fund as of October 31, 2006
M A N A G E M E N T S D I S C U S S I O N O F F U N D P E R F O R M A N C E

William R. Hackney, III, CFA
Co-Portfolio Manager

William O. Bell, IV, CFA
Co-Portfolio Manager

Marilyn Robinson Irvin, CFA
Co-Portfolio Manager
See pages 3 and 4 for more performance information, including after-tax returns.
The Fund
Performance for the Past Year
· For the year ended October 31, 2006, the Fund’s Class A shares had a total return of 12.96%. This return was the result of an increase in net asset value (NAV) per share to $13.89 on October 31, 2006, from $12.36 on October 31, 2005, and the distribution of $0.0661 per share in capital gains.(1)
· The Fund’s Class B shares had a total return of 12.15% during the same period, the result of an increase in NAV per share to $13.42 from $12.03 and the distribution of $0.0661 per share in capital gains.(1)
· The Fund’s Class C shares had a total return of 12.15% during the same period, the result of an increase in NAV per share to $13.42 from $12.03 and the distribution of $0.0661 per share in capital gains.(1)
· For comparison, the S&P MidCap 400 Index (the S&P MidCap 400), a broad-based, unmanaged index commonly used to measure U.S. midcap stock performance, had a total return of 13.43% during the same period, while the average return of funds in the Lipper Mid-Cap Core Classification was 14.46%.(2)
Management Discussion
· The stock market posted solid gains for the year ended October 31, 2006, as robust corporate profits and continued economic growth offset the negative effects of interest rate hikes by the Federal Reserve and a slowing housing market. Mid-cap stocks, as measured by the S&P MidCap 400, lagged the 16.33% return of the broader market for the year, as measured by the S&P 500 Index.(2)
· Each of the 10 economic sectors in the S&P MidCap 400 posted gains for the 12-month period. Telecom and technology stocks showed the strongest increase, each rising more than 20% for the period. Lagging sectors within the S&P MidCap 400 included consumer discretionary, energy, and health care. Consumer discretionary stocks, particularly the retailers, were buffeted by the negative impact of high gasoline prices and a slowdown in the housing market. The energy sector weakened in the second half of the year, as oil and natural gas prices fell, but still managed a 6% gain for the year ended October 31, 2006.
· The Fund currently invests its assets in a separate registered investment company, Tax-Managed Mid-Cap Core Portfolio (the Portfolio), with the same objectives and policies as the Fund. As of October 31, 2006, the Portfolio is broadly diversified across the major economic sectors of the S&P MidCap 400, with sector weights roughly in line with their respective weights in the Index.(3)
· During the past 12 months, Fund returns modestly lagged those of its benchmark, the S&P MidCap 400. Before accounting for Fund expenses, both stock selection and sector weightings were beneficial to Fund returns.(3)
Past performance is no guarantee of future results. Returns are historical and are calculated by determining the percentage change in net asset value or offering price (as applicable) with all distributions reinvested. Investment return and principal value will fluctuate so that shares, when redeemed, may be worth more or less than their original cost. Performance is for stated time period only; due to market volatility, the Fund’s current performance may be lower or higher than the quoted return. For performance as of the most recent month end, please refer to www.eatonvance.com.
Fund shares are not insured by the FDIC and are not deposits or other obligations of, or guaranteed by, any depository institution. Shares are subject to investment risks, including possible loss of principal invested.
(1) These returns do not include the 5.75% maximum sales charge for Class A shares or the applicable contingent deferred sales charges (CDSC) for Class B and Class C shares. If sales charges were deducted, the returns would be lower. Absent an allocation of certain expenses to the administrator of the Fund and sub-adviser of the Portfolio, the returns would be lower.
(2) It is not possible to invest directly in an Index or a Lipper Classification. The Index’s total return does not reflect commissions or expenses that would have been incurred if an investor individually purchased or sold the securities represented in the Index. The Lipper Average is the average total return, at net asset value, of the funds that are in the same Lipper Classification as the Fund. Lipper Averages are available as of month end only.
(3) Sector weightings are subject to change due to active management.
1
Eaton Vance Tax-Managed Mid-Cap Core Fund as of October 31, 2006
M A N A G E M E N T ‘ S D I S C U S S I O N O F F U N D P E R F O R M A N C E
· Stock selection was the primary source of Fund returns during the period, with stock selection making positive contributions to performance in six out of nine economic sectors. Portfolio holdings in the industrial sector made the largest contribution to relative performance, as airfreight and logistics stocks profited from increased transportation demand and higher margins. Stocks making negative contributions included selections in the consumer discretionary sector, due to underperformance in media and housing-related stocks. The Portfolio’s sector weightings had a modestly beneficial effect. A tilt towards consumer staples and away from consumer discretionary and energy over the course of the year accounted for the majority of our favorable sector performance.(1)
(1) Sector weightings are subject to change due to active management.
The views expressed throughout this report are those of the portfolio managers and are current only through the end of the period of the report as stated on the cover. These views are subject to change at any time based upon market or other conditions, and the investment adviser disclaims any responsibility to update such views. These views may not be relied on as investment advice and, because investment decisions for a fund are based on many factors, may not be relied on as an indication of trading intent on behalf of any Eaton Vance fund.
Top Ten Holdings* | | | |
By net assets | | | |
| | | |
Amphenol Corp. Class A | | 2.3 | % |
OGE Energy Corp. | | 2.1 | % |
FMC Technologies, Inc. | | 2.0 | % |
Cooper Industries Ltd. Class A | | 1.9 | % |
Affiliated Managers Group, Inc. | | 1.9 | % |
Questar Corp. | | 1.9 | % |
Developers Diversified Realty Corp. | | 1.9 | % |
SEI Investments Co. | | 1.8 | % |
Skywest, Inc. | | 1.8 | % |
Varian Medical Systems, Inc. | | 1.8 | % |
* Top Ten Holdings represented 19.4% of Portfolio net assets as of October 31, 2006. Holdings are subject to change due to active management.
Common Stock Investments by Sector **
By net assets

**As a percentage of the Portfolio’s net assets of October 31, 2006. Portfolio information may not be representative of the Portfolio's current or future investments and may change due to active management.
2
Eaton Vance Tax-Managed Mid-Cap Core Fund as of October 31, 2006
F U N D P E R F O R M A N C E
The line graphs and table set forth below provide information about the Fund’s performance. The line graphs compare the performance of Class A, Class B and Class C of the Fund with that of the S&P Midcap 400 Index, a broad-based, unmanaged index commonly used to measure U.S. mid-cap stock performance. The lines on the graphs represent the total returns of a hypothetical investment of $10,000 in each of Class A, Class B and Class C and the S&P Midcap 400 Index. Class A total returns are presented at net asset value and maximum public offering price. The table includes the total returns of each Class of the Fund at net asset value and public offering price. The performance presented below does not reflect the deduction of taxes, if any, that a shareholder would pay on distributions or redemptions of Fund shares.
Performance* | | Class A | | Class B | | Class C | |
| | | | | | | |
Average Annual Total Returns (at net asset value) |
One Year | | 12.96 | % | 12.15 | % | 12.15 | % |
Life of Fund† | | 7.41 | % | 6.62 | % | 6.62 | % |
SEC Average Annual Total Returns (including sales charge or applicable CDSC) |
One Year | | 6.50 | % | 7.15 | % | 11.15 | % |
Life of Fund† | | 6.05 | % | 6.28 | % | 6.62 | % |
| | | | | | | |
†Inception Dates – Class A: 3/4/02; Class B: 3/4/02; Class C: 3/4/02 | |
* Average annual total returns do not include the 5.75% maximum sales charge for Class A shares or the applicable contingent deferred sales charge (CDSC) for Class B and Class C shares. If sales charges were deducted, the returns would be lower. SEC average annual total returns for Class A reflect the maximum 5.75% sales charge. SEC returns for Class B shares reflect the applicable CDSC based on the following schedule: 5% - 1st and 2nd years; 4% - 3rd year; 3% - 4th year; 2% - 5th year; 1% - 6th year. SEC returns for Class C reflect a 1% CDSC for the first year. Absent an allocation of certain expenses to the administrator of the Fund and subadviser of the Portfolio, the returns would be lower.
Past performance is no guarantee of future results. Returns are historical and are calculated by determining the percentage change in net asset value or offering price (as applicable) with all distributions reinvested. Investment return and principal value will fluctuate so that shares, when redeemed, may be worth more or less than their original cost. Performance is for the stated time period only; due to market volatility, the Fund’s current performance may be lower or higher than the quoted return. For performance as of the most recent month end, please refer to www.eatonvance.com.
Comparison of Change in Value of a $10,000 Investment in Eaton Vance
Tax-Managed Mid-Cap Core Fund Class A vs. the S&P MidCap 400 Index(**)
March 31, 2002 – October 31, 2006
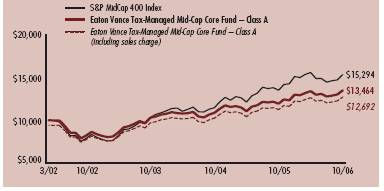
Comparison of Change in Value of a $10,000 Investment in Eaton Vance
Tax-Managed Mid-Cap Core Fund Class B vs. the S&P MidCap 400 Index(**)
March 31, 2002 – October 31, 2006
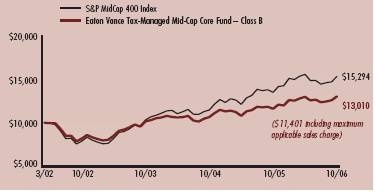
Comparison of Change in Value of a $10,000 Investment in Eaton Vance
Tax-Managed Mid-Cap Core Fund Class C vs. the S&P MidCap 400 Index(**)
March 31, 2002 – October 31, 2006
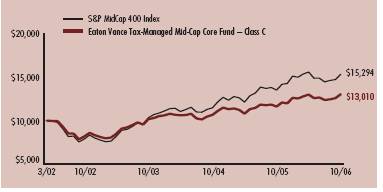
** Source: Thomson Financial. Class A, Class B, and Class C of the Fund commenced0investment operations on 3/4/02.It is not possible to invest directly in an Index.0The Index’s total returns do not reflect commissions or expenses that would have0been incurred if an investor individually purchased or sold the securities represented0in the Index.
3
Eaton Vance Tax-Managed Mid-Cap Core Fund as of October 31, 2006
F U N D P E R F O R M A N C E
“Return Before Taxes” does not take into consideration shareholder taxes. It is most relevant to tax-free or tax-deferred shareholder accounts. “Return After Taxes on Distributions” reflects the impact of federal income taxes due on Fund distributions of dividends and capital gains. It is most relevant to taxpaying shareholders who continue to hold their shares. “Return After Taxes on Distributions and Sale of Fund Shares” also reflects the impact of taxes on capital gain or loss realized upon a sale of shares. It is most relevant to taxpaying shareholders who sell their shares.
Average Annual Total Returns | | | | |
(For the periods ended October 31, 2006) | | | | |
| | | | |
Returns at Net Asset Value (NAV) (Class A) | | | | |
| | | | |
| One Year | | Life of Fund | |
| | | | |
Return Before Taxes | 12.96 | % | 7.41 | % |
Return After Taxes on Distributions | 12.87 | % | 7.39 | % |
Return After Taxes on Distributions | 8.53 | % | 6.41 | % |
and Sale of Fund Shares | | | | |
| | | | |
Returns at Public Offering Price (POP) (Class A) | | | | |
| One Year | | Life of Fund | |
| | | | |
Return Before Taxes ions | 6.50 | % | 6.05 | % |
Return After Taxes on Distributions | 6.42 | % | 6.04 | % |
Return After Taxes on Distributions | 4.32 | % | 5.22 | % |
and Sale of Fund Shares | | | | |
Average Annual Total Returns | | | | |
(For the periods ended October 31, 2006) | | | | |
| | | | |
Returns at Net Asset Value (NAV) (Class C) | | | | |
| | | | |
| One Year | | Life of Fund | |
| | | | |
Return Before Taxes | 12.15 | % | 6.62 | % |
Return After Taxes on Distributions | 12.06 | % | 6.60 | % |
Return After Taxes on Distributions | 8.00 | % | 5.72 | % |
and Sale of Fund Shares | | | | |
| | | | |
Returns at Public Offering Price (POP) (Class C) | | | | |
| One Year | | Life of Fund | |
| | | | |
Return Before Taxes | 11.15 | % | 6.62 | % |
Return After Taxes on Distributions | 11.06 | % | 6.60 | % |
Return After Taxes on Distributions | 7.35 | % | 5.72 | % |
and Sale of Fund Shares | | | | |
Average Annual Total Returns (For the periods ended October 31, 2006) | | | | |
| | | | |
Returns at Net Asset Value (NAV) (Class B) | | | | |
| One Year | | Life of Fund | |
| | | | |
Return Before Taxes | 12.15 | % | 6.62 | % |
Return After Taxes on Distributions | 12.06 | % | 6.60 | % |
Return After Taxes on Distributions | 8.00 | % | 5.72 | % |
and Sale of Fund Shares | | | | |
| | | | |
Returns at Public Offering Price (POP) (Class B) | | | | |
| | | | |
| One Year | | Life of Fund | |
| | | | |
Return Before Taxes | 7.15 | % | 6.28 | % |
Return After Taxes on Distributions | 7.06 | % | 6.26 | % |
Return After Taxes on Distributions | 4.75 | % | 5.42 | % |
and Sale of Fund Shares | | | | |
Class A, Class B and Class C of the Fund commenced investment operations on 3/4/02. Returns at Public Offering Price (POP) reflect the deduction of the maximum initial sales charge and applicable CDSC, while Returns at Net Asset Value (NAV) do not.
After-tax returns are calculated using the highest historical individual federal income tax rate and do not reflect the impact of state and local taxes. Actual after-tax returns depend on a shareholder’s tax situation and may differ from those shown. After-tax returns are not relevant for shareholders who hold Fund shares in tax-deferred accounts or to shares held by non-taxable entities. Return After Taxes on Distributions for a period may be the same as Return Before Taxes for that period because no distributions were paid during that period, or because the taxable portion of distributions made during the period was insignificant. Also, Return After Taxes on Distributions and Sale of Fund Shares for a period may be greater than Return After Taxes on Distributions for the same period because of realized losses on the sale of Fund shares. Absent an allocation of certain expenses to the administrator of the Fund and sub-adviser of the Portfolio, the returns would be lower.
Past performance is no guarantee of future results. Returns are historical and are calculated by determining the percentage change in net asset value or offering price (as applicable) with all distributions reinvested. Investment return and principal value will fluctuate so that shares, when redeemed, may be worth more or less than their original cost. Performance is for the stated time period only; due to market volatility, the Fund’s current performance may be lower or higher than the quoted return. For performance as of the most recent month end, please refer to www.eatonvance.com.
4
Eaton Vance Tax-Managed Mid-Cap Core Fund as of October 31, 2006
FUND EXPENSES
Example: As a shareholder of the Fund, you incur two types of costs: (1) transaction costs, including sales charges (loads) on purchases and redemption fees (if applicable); and (2) ongoing costs, including management fees; distribution or service fees; and other Fund expenses. This Example is intended to help you understand your ongoing costs (in dollars) of investing in the Fund and to compare these costs with the ongoing costs of investing in other mutual funds. The Example is based on an investment of $1,000 invested at the beginning of the period and held for the entire period (May 1, 2006 – October 31, 2006).
Actual Expenses: The first section of the table below provides information about actual account values and actual expenses. You may use the information in this section, together with the amount you invested, to estimate the expenses that you paid over the period. Simply divide your account value by $1,000 (for example, an $8,600 account value divided by $1,000 = 8.6), then multiply the result by the number in the first section under the heading entitled "Expenses Paid During Period" to estimate the expenses you paid on your account during this period.
Hypothetical Example for Comparison Purposes: The second section of the table below provides information about hypothetical account values and hypothetical expenses based on the Fund's actual expense ratio and an assumed rate of return of 5% per year (before expenses), which is not the actual return of the Fund. The hypothetical account values and expenses may not be used to estimate the actual ending account balance or expenses you paid for the period. You may use this information to compare the ongoing costs of investing in your Fund and other funds. To do so, compare this 5% hypothetical example with the 5% hypothetical examples that appear in the shareholder reports of the other funds.
Please note that the expenses shown in the table are meant to highlight your ongoing costs only and do not reflect any transactional costs, such as sales charges (loads) or redemption fees (if applicable). Therefore, the second section of the table is useful in comparing ongoing costs only, and will not help you determine the relative total costs of owning different funds. In addition, if these transactional costs were included, your costs would have been higher.
Eaton Vance Tax-Managed Mid-Cap Core Fund
| | | Beginning Account Value
(5/1/06) | | Ending Account Value
(10/31/06) | | Expenses Paid During Period*
(5/1/06 – 10/31/06) | |
| Actual | |
| Class A | | $ | 1,000.00 | | | $ | 1,006.50 | | | $ | 8.60 | ** | |
| Class B | | $ | 1,000.00 | | | $ | 1,003.00 | | | $ | 12.37 | ** | |
| Class C | | $ | 1,000.00 | | | $ | 1,003.00 | | | $ | 12.37 | ** | |
| Hypothetical | |
| (5% return per year before expenses) | |
| Class A | | $ | 1,000.00 | | | $ | 1,016.60 | | | $ | 8.64 | ** | |
| Class B | | $ | 1,000.00 | | | $ | 1,012.90 | | | $ | 12.43 | ** | |
| Class C | | $ | 1,000.00 | | | $ | 1,012.90 | | | $ | 12.43 | ** | |
* Expenses are equal to the Fund's annualized expense ratio of 1.70% for Class A shares, 2.45% for Class B shares, and 2.45% for Class C shares multiplied by the average account value over the period, multiplied by 184/365 (to reflect the one-half year period). The Example assumes that the $1,000 was invested at the net asset value per share determined at the close of business on April 30, 2006. The Example reflects the expenses of both the Fund and the Portfolio.
** Absent an allocation of certain expenses to the administrator of the Fund and sub-adviser of the Portfolio, expenses would be higher.
5
Eaton Vance Tax-Managed Mid-Cap Core Fund as of October 31, 2006
FINANCIAL STATEMENTS
Statement of Assets and Liabilities
As of October 31, 2006
| Assets | |
Investment in Tax-Managed Mid-Cap Core Portfolio, at value
(identified cost, $24,247,718) | | $ | 31,371,169 | | |
| Receivable for Fund shares sold | | | 14,245 | | |
| Receivable from affiliate | | | 19,077 | | |
| Total assets | | $ | 31,404,491 | | |
| Liabilities | |
| Payable for Fund shares redeemed | | $ | 1,000 | | |
| Payable to affiliate for distribution and service fees | | | 15,146 | | |
| Payable to affiliate for administration fees | | | 3,934 | | |
| Payable to affiliate for Trustees' fees | | | 239 | | |
| Other accrued expenses | | | 38,134 | | |
| Total liabilities | | $ | 58,453 | | |
| Net Assets | | $ | 31,346,038 | | |
| Sources of Net Assets | |
| Paid-in capital | | $ | 22,566,032 | | |
Accumulated undistributed net realized gain from Portfolio (computed on
the basis of identified cost) | | | 1,655,837 | | |
| Accumulated undistributed net investment income | | | 718 | | |
Net unrealized appreciation from Portfolio (computed on the basis of
identified cost) | | | 7,123,451 | | |
| Total | | $ | 31,346,038 | | |
| Class A Shares | |
| Net Assets | | $ | 17,718,289 | | |
| Shares Outstanding | | | 1,275,788 | | |
Net Asset Value and Redemption Price Per Share
(net assets ÷ shares of beneficial interest outstanding) | | $ | 13.89 | | |
Maximum Offering Price Per Share
(100 ÷ 94.25 of $13.89) | | $ | 14.74 | | |
| Class B Shares | |
| Net Assets | | $ | 6,577,203 | | |
| Shares Outstanding | | | 490,133 | | |
Net Asset Value, Offering Price and Redemption Price Per Share
(net assets ÷ shares of beneficial interest outstanding) | | $ | 13.42 | | |
| Class C Shares | |
| Net Assets | | $ | 7,050,546 | | |
| Shares Outstanding | | | 525,529 | | |
Net Asset Value, Offering Price and Redemption Price Per Share
(net assets ÷ shares of beneficial interest outstanding) | | $ | 13.42 | | |
| On sales of $50,000 or more, the offering price of Class A shares is reduced. | |
Statement of Operations
For the Year Ended
October 31, 2006
| Investment Income | |
| Dividends allocated from Portfolio | | $ | 330,843 | | |
| Interest allocated from Portfolio | | | 15,986 | | |
| Expenses allocated from Portfolio | | | (262,896 | ) | |
| Net investment income from Portfolio | | $ | 83,933 | | |
| Expenses | |
| Administration fee | | $ | 43,463 | | |
| Trustees' fees and expenses | | | 248 | | |
Distribution and service fees
Class A | | | 39,210 | | |
| Class B | | | 66,360 | | |
| Class C | | | 66,555 | | |
| Registration fees | | | 45,840 | | |
| Transfer and dividend disbursing agent fees | | | 38,103 | | |
| Legal and accounting services | | | 17,271 | | |
| Printing and postage | | | 13,528 | | |
| Custodian fee | | | 12,844 | | |
| Miscellaneous | | | 5,083 | | |
| Total expenses | | $ | 348,505 | | |
Deduct —
Allocation of Fund expenses to affiliate | | $ | 19,077 | | |
| Total expense reductions | | $ | 19,077 | | |
| Net expenses | | $ | 329,428 | | |
| Net investment loss | | $ | (245,495 | ) | |
Realized and Unrealized
Gain (Loss) from Portfolio | |
Net realized gain (loss) —
Investment transactions (identified cost basis) | | $ | 1,740,586 | | |
| Net realized gain | | $ | 1,740,586 | | |
Change in unrealized appreciation (depreciation) —
Investments (identified cost basis) | | $ | 1,876,307 | | |
| Net change in unrealized appreciation (depreciation) | | $ | 1,876,307 | | |
| Net realized and unrealized gain | | $ | 3,616,893 | | |
| Net increase in net assets from operations | | $ | 3,371,398 | | |
See notes to financial statements
6
Eaton Vance Tax-Managed Mid-Cap Core Fund as of October 31, 2006
FINANCIAL STATEMENTS CONT'D
Statements of Changes in Net Assets
Increase (Decrease)
in Net Assets | | Year Ended
October 31, 2006 | | Year Ended
October 31, 2005 | |
From operations —
Net investment loss | | $ | (245,495 | ) | | $ | (319,110 | ) | |
Net realized gain from
investment transactions | | | 1,740,586 | | | | 440,954 | | |
Net change in unrealized
appreciation (depreciation)
of investments | | | 1,876,307 | | | | 2,040,778 | | |
| Net increase in net assets from operations | | $ | 3,371,398 | | | $ | 2,162,622 | | |
Distributions to shareholders —
From net realized gain
Class A | | $ | (74,592 | ) | | $ | — | | |
| Class B | | | (34,859 | ) | | | — | | |
| Class C | | | (33,382 | ) | | | — | | |
| Total distributions to shareholders | | $ | (142,833 | ) | | $ | — | | |
Transactions in shares of beneficial interest —
Proceeds from sale of shares
Class A | | $ | 3,860,518 | | | $ | 4,562,665 | | |
| Class B | | | 916,692 | | | | 1,245,661 | | |
| Class C | | | 1,208,244 | | | | 2,067,673 | | |
Net asset value of shares issued to
shareholders in payment of
distributions declared
Class A | | | 64,988 | | | | — | | |
| Class B | | | 32,163 | | | | — | | |
| Class C | | | 28,293 | | | | — | | |
Cost of shares redeemed
Class A | | | (2,262,728 | ) | | | (3,357,260 | ) | |
| Class B | | | (1,037,730 | ) | | | (902,774 | ) | |
| Class C | | | (917,815 | ) | | | (1,970,830 | ) | |
Net asset value of shares exchanged
Class A | | | 486,142 | | | | 163,284 | | |
| Class B | | | (486,142 | ) | | | (163,284 | ) | |
Net increase in net assets from Fund
share transactions | | $ | 1,892,625 | | | $ | 1,645,135 | | |
| Net increase in net assets | | $ | 5,121,190 | | | $ | 3,807,757 | | |
| Net Assets | |
| At beginning of year | | $ | 26,224,848 | | | $ | 22,417,091 | | |
| At end of year | | $ | 31,346,038 | | | $ | 26,224,848 | | |
Accumulated undistributed
net investment income
included in net assets | |
| At end of year | | $ | 718 | | | $ | — | | |
See notes to financial statements
7
Eaton Vance Tax-Managed Mid-Cap Core Fund as of October 31, 2006
FINANCIAL STATEMENTS CONT'D
Financial Highlights
| | | Class A | |
| | | Year Ended October 31, | | Period Ended | |
| | | 2006 | | 2005 | | 2004 | | 2003 | | October 31, 2002(1) | |
| Net asset value — Beginning of year | | $ | 12.360 | | | $ | 11.270 | | | $ | 10.670 | | | $ | 8.530 | | | $ | 10.000 | | |
| Income (loss) from operations | |
| Net investment loss(2) | | $ | (0.067 | ) | | $ | (0.108 | ) | | $ | (0.102 | ) | | $ | (0.087 | ) | | $ | (0.047 | ) | |
| Net realized and unrealized gain (loss) | | | 1.663 | | | | 1.198 | | | | 0.702 | | | | 2.227 | | | | (1.423 | ) | |
| Total income (loss) from operations | | $ | 1.596 | | | $ | 1.090 | | | $ | 0.600 | | | $ | 2.140 | | | $ | (1.470 | ) | |
| Less distributions | |
| From net realized gain | | $ | (0.066 | ) | | $ | — | | | $ | — | | | $ | — | | | $ | — | | |
| Total distributions | | $ | (0.066 | ) | | $ | — | | | $ | — | | | $ | — | | | $ | — | | |
| Net asset value — End of year | | $ | 13.890 | | | $ | 12.360 | | | $ | 11.270 | | | $ | 10.670 | | | $ | 8.530 | | |
| Total Return(3) | | | 12.96 | % | | | 9.67 | % | | | 5.62 | % | | | 25.09 | % | | | (14.70 | )% | |
| Ratios/Supplemental Data | |
| Net assets, end of year (000's omitted) | | $ | 17,718 | | | $ | 13,761 | | | $ | 11,226 | | | $ | 7,054 | | | $ | 4,394 | | |
| Ratios (As a percentage of average daily net assets): | |
| Expenses(4)(5) | | | 1.70 | % | | | 1.70 | % | | | 1.70 | % | | | 1.70 | % | | | 1.65 | %(6) | |
| Net investment loss | | | (0.50 | )% | | | (0.89 | )% | | | (0.93 | )% | | | (0.93 | )% | | | (0.80 | )%(6) | |
| Portfolio Turnover of the Portfolio | | | 55 | % | | | 53 | % | | | 42 | % | | | 50 | % | | | 13 | % | |
(1) For the period from the start of business, March 4, 2002, to October 31, 2002.
(2) Net investment loss per share was computed using average shares outstanding.
(3) Returns are historical and are calculated by determining the percentage change in net asset value with all distributions reinvested. Total return is not computed on an annualized basis.
(4) Includes the Fund's share of the Portfolio's allocated expenses.
(5) The investment adviser waived a portion of its investment advisory fee and the administrator subsidized certain operating expenses (equal to 0.07%, 0.16%, 0.22%, 0.73% and 3.13% of average daily net assets for 2006, 2005, 2004, 2003 and 2002, respectively). A portion of the waiver and subsidy was borne by the sub-adviser of the Portfolio.
(6) Annualized.
See notes to financial statements
8
Eaton Vance Tax-Managed Mid-Cap Core Fund as of October 31, 2006
FINANCIAL STATEMENTS CONT'D
Financial Highlights
| | | Class B | |
| | | Year Ended October 31, | | Period Ended | |
| | | 2006 | | 2005 | | 2004 | | 2003 | | October 31, 2002(1) | |
| Net asset value — Beginning of year | | $ | 12.030 | | | $ | 11.050 | | | $ | 10.540 | | | $ | 8.490 | | | $ | 10.000 | | |
| Income (loss) from operations | |
| Net investment loss(2) | | $ | (0.161 | ) | | $ | (0.194 | ) | | $ | (0.182 | ) | | $ | (0.158 | ) | | $ | (0.089 | ) | |
| Net realized and unrealized gain (loss) | | | 1.617 | | | | 1.174 | | | | 0.692 | | | | 2.208 | | | | (1.421 | ) | |
| Total income (loss) from operations | | $ | 1.456 | | | $ | 0.980 | | | $ | 0.510 | | | $ | 2.050 | | | $ | (1.510 | ) | |
| Less distributions | |
| From net realized gain | | $ | (0.066 | ) | | $ | — | | | $ | — | | | $ | — | | | $ | — | | |
| Total distributions | | $ | (0.066 | ) | | $ | — | | | $ | — | | | $ | — | | | $ | — | | |
| Net asset value — End of year | | $ | 13.420 | | | $ | 12.030 | | | $ | 11.050 | | | $ | 10.540 | | | $ | 8.490 | | |
| Total Return(3) | | | 12.15 | % | | | 8.87 | % | | | 4.84 | % | | | 24.15 | % | | | (15.10 | )% | |
| Ratios/Supplemental Data | |
| Net assets, end of year (000's omitted) | | $ | 6,577 | | | $ | 6,436 | | | $ | 5,741 | | | $ | 4,139 | | | $ | 1,254 | | |
| Ratios (As a percentage of average daily net assets): | |
| Expenses(4)(5) | | | 2.45 | % | | | 2.45 | % | | | 2.45 | % | | | 2.45 | % | | | 2.40 | %(6) | |
| Net investment loss | | | (1.25 | )% | | | (1.64 | )% | | | (1.67 | )% | | | (1.69 | )% | | | (1.52 | )%(6) | |
| Portfolio Turnover of the Portfolio | | | 55 | % | | | 53 | % | | | 42 | % | | | 50 | % | | | 13 | % | |
(1) For the period from the start of business, March 4, 2002, to October 31, 2002.
(2) Net investment loss per share was computed using average shares outstanding.
(3) Returns are historical and are calculated by determining the percentage change in net asset value with all distributions reinvested. Total return is not computed on an annualized basis.
(4) Includes the Fund's share of the Portfolio's allocated expenses.
(5) The investment adviser waived a portion of its investment advisory fee and the administrator subsidized certain operating expenses (equal to 0.07%, 0.16%, 0.22%, 0.73% and 3.13% of average daily net assets for 2006, 2005, 2004, 2003 and 2002, respectively). A portion of the waiver and subsidy was borne by the sub-adviser of the Portfolio.
(6) Annualized.
See notes to financial statements
9
Eaton Vance Tax-Managed Mid-Cap Core Fund as of October 31, 2006
FINANCIAL STATEMENTS CONT'D
Financial Highlights
| | | Class C | |
| | | Year Ended October 31, | | Period Ended | |
| | | 2006 | | 2005 | | 2004 | | 2003 | | October 31, 2002(1) | |
| Net asset value — Beginning of year | | $ | 12.030 | | | $ | 11.050 | | | $ | 10.540 | | | $ | 8.490 | | | $ | 10.000 | | |
| Income (loss) from operations | |
| Net investment loss(2) | | $ | (0.161 | ) | | $ | (0.194 | ) | | $ | (0.182 | ) | | $ | (0.157 | ) | | $ | (0.090 | ) | |
| Net realized and unrealized gain (loss) | | | 1.617 | | | | 1.174 | | | | 0.692 | | | | 2.207 | | | | (1.420 | ) | |
| Total income (loss) from operations | | $ | 1.456 | | | $ | 0.980 | | | $ | 0.510 | | | $ | 2.050 | | | $ | (1.510 | ) | |
| Less distributions | |
| From net realized gain | | $ | (0.066 | ) | | $ | — | | | $ | — | | | $ | — | | | $ | — | | |
| Total distributions | | $ | (0.066 | ) | | $ | — | | | $ | — | | | $ | — | | | $ | — | | |
| Net asset value — End of year | | $ | 13.420 | | | $ | 12.030 | | | $ | 11.050 | | | $ | 10.540 | | | $ | 8.490 | | |
| Total Return(3) | | | 12.15 | % | | | 8.87 | % | | | 4.84 | % | | | 24.15 | % | | | (15.10 | )% | |
| Ratios/Supplemental Data | |
| Net assets, end of year (000's omitted) | | $ | 7,051 | | | $ | 6,027 | | | $ | 5,450 | | | $ | 4,056 | | | $ | 1,575 | | |
| Ratios (As a percentage of average daily net assets): | |
| Expenses(4)(5) | | | 2.45 | % | | | 2.45 | % | | | 2.45 | % | | | 2.45 | % | | | 2.40 | %(6) | |
| Net investment loss | | | (1.25 | )% | | | (1.64 | )% | | | (1.68 | )% | | | (1.70 | )% | | | (1.52 | )%(6) | |
| Portfolio Turnover of the Portfolio | | | 55 | % | | | 53 | % | | | 42 | % | | | 50 | % | | | 13 | % | |
(1) For the period from the start of business, March 4, 2002, to October 31, 2002.
(2) Net investment loss per share was computed using average shares outstanding.
(3) Returns are historical and are calculated by determining the percentage change in net asset value with all distributions reinvested. Total return is not computed on an annualized basis.
(4) Includes the Fund's share of the Portfolio's allocated expenses.
(5) The investment adviser waived a portion of its investment advisory fee and the administrator subsidized certain operating expenses (equal to 0.07%, 0.16%, 0.22%, 0.73% and 3.13% of average daily net assets for 2006, 2005, 2004, 2003 and 2002, respectively). A portion of the waiver and subsidy was borne by the sub-adviser of the Portfolio.
(6) Annualized.
See notes to financial statements
10
Eaton Vance Tax-Managed Mid-Cap Core Fund as of October 31, 2006
NOTES TO FINANCIAL STATEMENTS
1 Significant Accounting Policies
Eaton Vance Tax-Managed Mid-Cap Core Fund (the Fund) is a diversified series of Eaton Vance Mutual Funds Trust (the Trust). The Trust is an entity of the type commonly known as a Massachusetts business trust and is registered under the Investment Company Act of 1940, as amended, as an open-end management investment company. The Fund offers three classes of shares. Class A shares are generally sold subject to a sales charge imposed at time of purchase. Class B and Class C shares are sold at net asset value and are generally subject to a contingent deferred sales charge (see Note 6). Class B shares held for eight years will automatically convert to Class A shares. Each class represents a pro-rata interest in the Fund, but votes separately on class-specific matters and (as noted below) is subject to different expenses. Realized and unrealized gains and losses and net investment income and losses, other than class-specific expenses, are allocated daily to each class of shares based on the relative net assets of each class to the total net assets of the Fund. Each class of shares differs in its distribution plan and certain other class-specific expenses. The Fund invests all of its investable assets in interests of the Tax-Managed Mid-Cap Core Portfolio (the Portfolio), a New York Trust, having the same investment objective as the Fund. The value of the Fund's investment in the Portfolio reflects the Fund's proportionate interest in the net assets of the Portfolio (32.1% at October 31, 2006). The performance of the Fund is directly affected by the performance of the Portfolio. The financial statements of the Portfolio, including the Portfolio of Investments, are included elsewhere in this report and should be read in conjunction with the Fund's financial statements.
The following is a summary of significant accounting policies consistently followed by the Fund in the preparation of its financial statements. The policies are in conformity with accounting principles generally accepted in the United States of America.
A Investment Valuation — Valuation of securities by the Portfolio is discussed in Note 1A of the Portfolio's Notes to Financial Statements, which are included elsewhere in this report.
B Income — The Fund's net investment income or loss consists of the Fund's pro rata share of the net investment income or loss of the Portfolio, less all actual and accrued expenses of the Fund.
C Expenses — The majority of expenses of the Trust are directly identifiable to an individual fund. Expenses which are not readily identifiable to a specific fund are allocated taking into consideration, among other things, the nature and type of expense and the relative size of the funds.
D Federal Taxes — The Fund's policy is to comply with the provisions of the Internal Revenue Code applicable to regulated investment companies and to distribute to shareholders, each year, substantially all of its net investment income and all or substantially all of its net realized capital gains. Accordingly, no provision for federal income or excise tax is necessary.
E Expense Reduction — Investors Bank & Trust Company (IBT) serves as custodian of the Fund. Pursuant to the custodian agreement, IBT receives a fee reduced by credits which are determined based on the average daily cash balance the Fund maintains with IBT. All credit balances used to reduce the Fund's custodian fees are reported as a reduction of expenses in the Statement of Operations.
F Other — Investment transactions are accounted for on the date the securities are purchased or sold. Dividends to shareholders are recorded on the ex-dividend date.
G Use of Estimates — The preparation of the financial statements in conformity with accounting principles generally accepted in the United States of America requires management to make estimates and assumptions that affect the reported amounts of assets and liabilities at the date of the financial statements and the reported amounts of income and expense during the reporting period. Actual results could differ from those estimates.
H Indemnifications — Under the Trust's organizational documents, its officers and Trustees may be indemnified against certain liabilities and expenses arising out of the performance of their duties to the Fund, and shareholders are indemnified against personal liability for the obligations of the Trust. Additionally, in the normal course of business, the Fund enters into agreements with service providers that may contain indemnification clauses. The Fund's maximum exposure under these arrangements is unknown as this would involve future claims that may be made against the Fund that have not yet occurred.
2 Distributions to Shareholders
It is the present policy of the Fund to make at least one distribution annually (normally in December) of all or substantially all of its net investment income, if any, and at least one distribution annually of all or substantially all of
Eaton Vance Tax-Managed Mid-Cap Core Fund as of October 31, 2006
NOTES TO FINANCIAL STATEMENTS CONT'D
its net realized capital gains, if any (reduced by available capital loss carryforwards from prior years, if any). Distributions are paid in the form of additional shares of the Fund or, at the election of the shareholder, in cash. Shareholders may reinvest all distributions in additional shares of the Fund at the net asset value as of the close of business on the ex-dividend date. The Fund distinguishes between distributions on a tax basis and a financial reporting basis. Accounting principles generally accepted in the United States of America require that only distributions in excess of tax basis earnings and profits be reported in the financial statements as a return of capital. Permanent differences between book and tax accounting relating to distributions are reclassified to paid-in capital.
The tax character of the distributions paid for the year ended October 31, 2006 and the year ended October 31, 2005 was as follows:
| | | Year Ended October 31, | |
| | | 2006 | | 2005 | |
| Distributions declared from: | |
|
| Long-Term Capital Gains | | $ | 142,833 | | | | — | | |
|
During the year ended October 31, 2006, paid-in-capital was decreased by $248,155, accumulated net investment loss was decreased by $246,213 and accumulated net realized gain was increased by $1,942 primarily due to differences between book and tax accounting for net operating losses. This change had no effect on the net assets or the net asset value per share.
As of October 31, 2006, the components of distributable earnings on a tax basis were as follows:
| Undistributed capital gains | | $ | 1,696,783 | | |
| Unrealized appreciation | | $ | 7,083,223 | | |
3 Shares of Beneficial Interest
The Fund's Declaration of Trust permits the Trustees to issue an unlimited number of full and fractional shares of beneficial interest (without par value). Such shares may be issued in a number of different series (such as the Fund) and classes. Transactions in Fund shares were as follows:
| | | Year Ended October 31, | |
| Class A | | 2006 | | 2005 | |
| Sales | | | 291,430 | | | | 379,449 | | |
Issued to shareholders electing to receive
payments of distributions in Fund shares | | | 5,069 | | | | — | | |
| Redemptions | | | (171,032 | ) | | | (275,555 | ) | |
| Exchanges from Class B shares | | | 36,594 | | | | 13,329 | | |
| Net increase | | | 162,061 | | | | 117,223 | | |
| | | Year Ended October 31, | |
| Class B | | 2006 | | 2005 | |
| Sales | | | 71,659 | | | | 105,625 | | |
Issued to shareholders electing to receive
payments of distributions in Fund shares | | | 2,581 | | | | — | | |
| Redemptions | | | (81,383 | ) | | | (76,467 | ) | |
| Exchanges to Class A shares | | | (37,711 | ) | | | (13,655 | ) | |
| Net increase (decrease) | | | (44,854 | ) | | | 15,503 | | |
| | | Year Ended October 31, | |
| Class C | | 2006 | | 2005 | |
| Sales | | | 93,800 | | | | 174,945 | | |
Issued to shareholders electing to receive
payments of distributions in Fund shares | | | 2,271 | | | | — | | |
| Redemptions | | | (71,657 | ) | | | (167,143 | ) | |
| Net increase | | | 24,414 | | | | 7,802 | | |
4 Transactions with Affiliates
The administration fee is earned by Eaton Vance Management (EVM) as compensation for managing and administering the business affairs of the Fund. Under the administration agreement, EVM earns a fee in the amount of 0.15% per annum of average daily net assets of the Fund. For the year ended October 31, 2006, the administration fee amounted to $43,463. Pursuant to a voluntary expense reimbursement, EVM and Atlanta Capital Management LLC (Atlanta Capital), a majority owned subsidiary of EVM and sub-adviser to the Portfolio, were allocated $5,962 and $13,115, respectively of the Fund's operating expenses for the year ended October 31, 2006. The Portfolio has engaged Boston Management and Research (BMR), a subsidiary of EVM, to render investment advisory services. See Note 2 of the Portfolio's Notes to Financial Statements which are included
Eaton Vance Tax-Managed Mid-Cap Core Fund as of October 31, 2006
NOTES TO FINANCIAL STATEMENTS CONT'D
elsewhere in this report. EVM serves as the sub-transfer agent of the Fund and receives from the transfer agent an aggregate fee based upon the actual expenses incurred by EVM in the performance of those services. For the year ended October 31, 2006, EVM received approximately $2,790 in sub-transfer agent fees.
Eaton Vance Distributors, Inc. (EVD), a subsidiary of EVM and the Fund's principal underwriter, received $10,067 as its portion of the sales charge on sales of Class A shares for the year ended October 31, 2006.
Except for Trustees of the Fund and the Portfolio who are not members of EVM's or BMR's organization, officers and Trustees receive remuneration for their services to the Fund out of the investment adviser fee earned by BMR. Trustees of the Fund that are not affiliated with EVM or BMR may elect to defer receipt of all or a percentage of their annual fees in accordance with the terms of the Trustees Deferred Compensation Plan. For the year ended October 31, 2006, no significant amounts have been deferred.
Certain officers and Trustees of the Fund and of the Portfolio are officers of the above organizations.
5 Distribution Plans
Class A has in effect a distribution plan pursuant to Rule 12b-1 under the Investment Company Act of 1940 (Class A Plan). The Class A Plan provides that the Fund will pay EVD a distribution and service fee of 0.25% of the Fund's average daily net assets attributable to Class A shares for each fiscal year for distribution services and facilities provided to the Fund by EVD, as well as for personal services and/or the maintenance of shareholder accounts. Distribution and service fees paid or accrued for the year ended October 31, 2006 amounted to $39,210 for Class A shares. The Fund also has in effect distribution plans for Class B shares (Class B Plan) and Class C shares (Class C Plan) pursuant to Rule 12b-1 under the Investment Company Act of 1940 (collectively, "the Plans"). The Class B and Class C Plans require the Fund to pay EVD amounts equal to 1/365 of 0.75% of the Fund's average daily net assets attributable to Class B an d Class C shares, for providing ongoing distribution services and facilities to the Fund. The Fund will automatically discontinue payments to EVD during any period in which there are no outstanding Uncovered Distribution Charges, which are equivalent to the sum of (i) 6.25% of the aggregate amount received by the Fund for the Class B and Class C shares sold, respectively, plus (ii) interest calculated by applying the rate of 1% over the prevailing prime rate to the outstanding balance of Uncovered Distribution Charges of EVD, of each respective class, reduced by the aggregate amount of contingent deferred sales charges (see Note 6) and daily amounts theretofore paid to EVD by each respective class. Distribution fees paid or accrued for the year ended October 31, 2006 amounted to $49,770 and $49,916 for Class B and Class C shares, respectively. At October 31, 2006, the amount of Uncovered Distribution Charges of EVD calculated under the P lans was approximately $128,000 and $378,000 for Class B and Class C shares, respectively. The Class B and Class C Plans also authorize the Fund to make payments of service fees to EVD, investment dealers and other persons in amounts not exceeding 0.25% annually of the average daily net assets attributable to that Class. Service fees are paid for personal services and/or the maintenance of shareholder accounts. They are separate and distinct from the Class B and Class C sales commissions and distribution fees and, as such, are not subject to automatic discontinuance when there are no outstanding Uncovered Distribution Charges to EVD. Service fees paid or accrued for the year ended October 31, 2006 amounted to $16,590, and $16,639, for Class B and Class C shares, respectively.
6 Contingent Deferred Sales Charge
A contingent deferred sales charge (CDSC) generally is imposed on redemptions of Class B shares made within six years of purchase and on redemptions of Class C shares made within one year of purchase. Class A shares may be subject to a CDSC up to 1% if redeemed within two years of purchase (depending upon the circumstances of purchase). Generally, the CDSC is based upon the lower of the net asset value at date of redemption or date of purchase. No charge is levied on shares acquired by reinvestment of dividends or capital gain distributions. The Class B CDSC is imposed at declining rates that begin at 5% in the case of redemptions in the first and second year after purchase, declining one percentage point each subsequent year. Class C shares will be subject to a 1% CDSC if redeemed within one year of purchase.
No CDSC is levied on shares which have been sold to EVM or its affiliates or to their respective employees or clients and may be waived under certain other limited conditions. CDSC charges received on Class B and Class C redemptions are paid to EVD to reduce the amount of Uncovered Distribution Charges calculated under the Class B and Class C Plans, respectively (see Note 5). CDSC charges assessed on Class B and Class C shares when no Uncovered Distribution Charges exist for the respective classes will be credited to the Fund. The Fund was informed that EVD received approximately $8,000 and $100 of CDSC paid by shareholders for Class B and Class C shares, respectively, for
Eaton Vance Tax-Managed Mid-Cap Core Fund as of October 31, 2006
NOTES TO FINANCIAL STATEMENTS CONT'D
the year ended October 31, 2006. EVD did not receive any CDSC on Class A shares for the year ended October 31, 2006.
7 Investment Transactions
Increases and decreases in the Fund's investment in the Portfolio for the year ended October 31, 2006 aggregated $5,977,108 and $4,585,549, respectively.
8 Recently Issued Accounting Pronouncements
In June 2006, the Financial Accounting Standards Board (FASB) issued FASB Interpretation No. 48, (FIN 48) "Accounting for Uncertainty in Income Taxes – an interpretation of FASB Statement No. 109". FIN 48 clarifies the accounting for uncertainty in income taxes recognized in accordance with FASB Statement No. 109, "Accounting for Income Taxes." This interpretation prescribes a recognition threshold and measurement attribute for the financial statement recognition and measurement of a tax position taken or expected to be taken in a tax return. It also provides guidance on de-recognition, classification, interest and penalties, accounting in interim periods, disclosure and transition. FIN 48 is effective for fiscal years beginning after December 15, 2006. Management is currently evaluating the impact of applying the various provisions of FIN 48.
In September 2006, the Financial Accounting Standards Board (FASB) issued Statement of Financial Accounting Standards No. 157 (FAS 157) "Fair Value Measurements". FAS 157 defines fair value, establishes a framework for measuring fair value in accordance with generally accepted accounting principles and expands disclosure about fair value measurements. FAS 157 is effective for fiscal years beginning after November 15, 2007. Management is currently evaluating the impact the adoption of FAS 157 will have on the Fund's financial statement disclosures.
Eaton Vance Tax-Managed Mid-Cap Core Fund as of October 31, 2006
REPORT OF INDEPENDENT REGISTERED PUBLIC ACCOUNTING FIRM
To the Trustees of Eaton Vance Mutual Funds Trust and Shareholders of Eaton Vance Tax-Managed Mid-Cap Core Fund:
We have audited the accompanying statement of assets and liabilities of Eaton Vance Tax-Managed Mid-Cap Core Fund (the Fund) (one of the series of Eaton Vance Mutual Funds Trust) as of October 31, 2006, the related statements of operations for the year then ended, the statement of changes in net assets for each of the two years in the period then ended and the financial highlights for each of the four years in the period then ended, and for the period from the start of business, March 4, 2002, to October 31, 2002. These financial statements and financial highlights are the responsibility of the Trust's management. Our responsibility is to express an opinion on these financial statements and financial highlights based on our audits.
We conducted our audits in accordance with the standards of the Public Company Accounting Oversight Board (United States). Those standards require that we plan and perform the audit to obtain reasonable assurance about whether the financial statements and financial highlights are free of material misstatement. The Fund is not required to have, nor were we engaged to perform, an audit of its internal control over financial reporting. Our audits included consideration of internal control over financial reporting as a basis for designing audit procedures that are appropriate in the circumstances, but not for the purpose of expressing an opinion on the effectiveness of the Fund's internal control over financial reporting. Accordingly, we express no such opinion. An audit also includes examining, on a test basis, evidence supporting the amou nts and disclosures in the financial statements, assessing the accounting principles used and significant estimates made by management, as well as evaluating the overall financial statement presentation. We believe that our audits provide a reasonable basis for our opinion.
In our opinion, such financial statements and financial highlights referred to above present fairly, in all material respects, the financial position of the Eaton Vance Tax-Managed Mid-Cap Core Fund as of October 31, 2006, the results of its operations for the year then ended, the changes in its net assets for each of the two years in the period then ended and the financial highlights for each of the four years in the period then ended, and for the period from the start of business, March 4, 2002, to October 31, 2002, in conformity with accounting principles generally accepted in the United States of America.
DELOITTE & TOUCHE LLP
Boston, Massachusetts
December 15, 2006
15
Eaton Vance Tax-Managed Mid-Cap Core Fund as of October 31, 2006
FEDERAL TAX INFORMATION (Unaudited)
The Form 1099-DIV you receive in January 2007 will show the tax status of all distributions paid to your account in calendar year 2006. Shareholders are advised to consult their own tax adviser with respect to the tax consequences of their investment in the Fund. As required by the Internal Revenue Code regulations, shareholders must be notified within 60 days of the Fund's fiscal year end regarding the status of long-term capital gains distributions.
Long-term Capital Gains Distributions — The Fund designates $142,833 as a long-term capital gain distribution.
16
Tax-Managed Mid-Cap Core Portfolio as of October 31, 2006
PORTFOLIO OF INVESTMENTS
| Common Stocks — 98.4% | |
| Security | | Shares | | Value | |
| Air Freight & Logistics — 2.6% | |
| C.H. Robinson Worldwide, Inc. | | | 29,200 | | | $ | 1,218,808 | | |
| Expeditors International of Washington, Inc. | | | 27,800 | | | | 1,317,998 | | |
| | | $ | 2,536,806 | | |
| Airlines — 1.8% | |
| SkyWest, Inc. | | | 66,000 | | | $ | 1,759,560 | | |
| | | $ | 1,759,560 | | |
| Automobiles — 1.1% | |
| Thor Industries, Inc. | | | 25,000 | | | $ | 1,095,500 | | |
| | | $ | 1,095,500 | | |
| Capital Markets — 5.8% | |
| A.G. Edwards, Inc. | | | 20,800 | | | $ | 1,186,640 | | |
| Affiliated Managers Group, Inc.(1) | | | 18,800 | | | | 1,882,632 | | |
| Legg Mason, Inc. | | | 8,700 | | | | 783,174 | | |
| SEI Investments Co. | | | 31,800 | | | | 1,789,704 | | |
| | | $ | 5,642,150 | | |
| Chemicals — 3.7% | |
| Albemarle Corp. | | | 21,600 | | | $ | 1,404,648 | | |
| Ecolab, Inc. | | | 25,600 | | | | 1,160,960 | | |
| RPM International, Inc. | | | 56,000 | | | | 1,072,400 | | |
| | | $ | 3,638,008 | | |
| Commercial Banks — 4.1% | |
| City National Corp. | | | 18,000 | | | $ | 1,198,080 | | |
| Cullen/Frost Bankers, Inc. | | | 21,700 | | | | 1,175,272 | | |
| Synovus Financial Corp. | | | 57,600 | | | | 1,692,288 | | |
| | | $ | 4,065,640 | | |
| Computer Peripherals — 1.7% | |
| Diebold, Inc. | | | 38,500 | | | $ | 1,681,680 | | |
| | | $ | 1,681,680 | | |
| Construction & Engineering — 1.5% | |
| Jacobs Engineering Group, Inc.(1) | | | 19,200 | | | $ | 1,450,368 | | |
| | | $ | 1,450,368 | | |
| Security | | Shares | | Value | |
| Construction Materials — 0.6% | |
| Florida Rock Industries, Inc. | | | 14,700 | | | $ | 630,630 | | |
| | | $ | 630,630 | | |
| Containers & Packaging — 1.5% | |
| Sonoco Products Co. | | | 40,300 | | | $ | 1,429,844 | | |
| | | $ | 1,429,844 | | |
| Electric Utilities — 1.7% | |
| DPL, Inc. | | | 56,600 | | | $ | 1,625,552 | | |
| | | $ | 1,625,552 | | |
| Electrical Equipment — 4.0% | |
| AMETEK, Inc. | | | 28,000 | | | $ | 1,307,040 | | |
| Cooper Industries Ltd. Class A | | | 21,100 | | | | 1,887,395 | | |
| Genlyte Group, Inc. (The)(1) | | | 10,000 | | | | 772,600 | | |
| | | $ | 3,967,035 | | |
| Electronic Equipment & Instruments — 5.5% | |
| Amphenol Corp. Class A | | | 32,500 | | | $ | 2,206,750 | | |
| CDW Corp. | | | 24,300 | | | | 1,595,781 | | |
| National Instruments Corp. | | | 51,000 | | | | 1,590,180 | | |
| | | $ | 5,392,711 | | |
| Energy Equipment & Services — 4.1% | |
| FMC Technologies, Inc.(1) | | | 32,000 | | | $ | 1,934,400 | | |
| Hydril Co.(1) | | | 18,000 | | | | 1,080,900 | | |
| National Oilwell Varco, Inc.(1) | | | 17,000 | | | | 1,026,800 | | |
| | | $ | 4,042,100 | | |
| Food Products — 2.3% | |
| Hormel Foods Corp. | | | 26,000 | | | $ | 938,860 | | |
| Tootsie Roll Industries, Inc. | | | 42,230 | | | | 1,342,069 | | |
| | | $ | 2,280,929 | | |
| Gas Utilities — 5.2% | |
| AGL Resources, Inc. | | | 41,100 | | | $ | 1,541,250 | | |
| Piedmont Natural Gas Co., Inc. | | | 61,200 | | | | 1,652,400 | | |
| Questar Corp. | | | 23,000 | | | | 1,874,040 | | |
| | | $ | 5,067,690 | | |
See notes to financial statements
17
Tax-Managed Mid-Cap Core Portfolio as of October 31, 2006
PORTFOLIO OF INVESTMENTS CONT'D
| Security | | Shares | | Value | |
| Health Care Equipment & Supplies — 9.9% | |
| Beckman Coulter, Inc. | | | 24,900 | | | $ | 1,433,493 | | |
| Biomet, Inc. | | | 24,940 | | | | 943,730 | | |
| C.R. Bard, Inc. | | | 15,800 | | | | 1,294,968 | | |
| Cooper Cos., Inc., (The) | | | 19,000 | | | | 1,094,970 | | |
| DENTSPLY International, Inc. | | | 45,800 | | | | 1,432,624 | | |
| Respironics, Inc.(1) | | | 48,500 | | | | 1,713,020 | | |
| Varian Medical Systems, Inc.(1) | | | 32,000 | | | | 1,755,520 | | |
| | | $ | 9,668,325 | | |
| Health Care Providers & Services — 0.5% | |
| Patterson Companies, Inc.(1) | | | 16,400 | | | $ | 538,740 | | |
| | | $ | 538,740 | | |
| Hotels, Restaurants & Leisure — 3.6% | |
| Applebee's International, Inc. | | | 43,000 | | | $ | 981,260 | | |
| International Speedway Corp. Class A | | | 25,200 | | | | 1,308,132 | | |
| Sonic Corp.(1) | | | 53,850 | | | | 1,225,087 | | |
| | | $ | 3,514,479 | | |
| Household Durables — 3.5% | |
| Harman International | | | 11,000 | | | $ | 1,125,850 | | |
| Hovnanian Enterprises, Inc.(1) | | | 34,000 | | | | 1,048,900 | | |
| Mohawk Industries, Inc.(1) | | | 17,000 | | | | 1,235,900 | | |
| | | $ | 3,410,650 | | |
| Insurance — 5.1% | |
| Ambac Financial Group, Inc. | | | 9,800 | | | $ | 818,202 | | |
| Cincinnati Financial Corp. | | | 28,000 | | | | 1,278,200 | | |
| Markel Corp.(1) | | | 3,800 | | | | 1,518,100 | | |
| Protective Life Corp. | | | 31,300 | | | | 1,385,025 | | |
| | | $ | 4,999,527 | | |
| IT Services — 2.7% | |
| Cognizant Technology Solutions Corp., Class A(1) | | | 15,000 | | | $ | 1,129,200 | | |
| Fiserv, Inc.(1) | | | 31,200 | | | | 1,541,280 | | |
| | | $ | 2,670,480 | | |
| Machinery — 3.5% | |
| Dover Corp. | | | 30,300 | | | $ | 1,439,250 | | |
| Graco, Inc. | | | 34,200 | | | | 1,393,992 | | |
| Pentair, Inc. | | | 17,600 | | | | 579,744 | | |
| | | $ | 3,412,986 | | |
| Security | | Shares | | Value | |
| Media — 2.7% | |
| E.W. Scripps Co. | | | 25,300 | | | $ | 1,251,338 | | |
| Washington Post Co. (The), Class B | | | 1,900 | | | | 1,430,890 | | |
| | | $ | 2,682,228 | | |
| Multiline Retail — 0.9% | |
| Family Dollar Stores, Inc. | | | 30,000 | | | $ | 883,500 | | |
| | | $ | 883,500 | | |
| Multi-Utilities — 3.3% | |
| NSTAR | | | 33,000 | | | $ | 1,148,070 | | |
| OGE Energy Corp. | | | 52,800 | | | | 2,037,024 | | |
| | | $ | 3,185,094 | | |
| Office Electronics — 1.8% | |
| Zebra Technologies Corp. Class A(1) | | | 46,225 | | | $ | 1,722,806 | | |
| | | $ | 1,722,806 | | |
| Oil, Gas & Consumable Fuels — 1.7% | |
| Holly Corp. | | | 35,000 | | | $ | 1,664,600 | | |
| | | $ | 1,664,600 | | |
| Personal Products — 1.1% | |
| Alberto-Culver Co. | | | 9,450 | | | $ | 480,154 | | |
| Estee Lauder Cos., Inc. (The), Class A | | | 14,000 | | | | 565,460 | | |
| | | $ | 1,045,614 | | |
| Real Estate Investment Trusts (REITs) — 1.9% | |
| Developers Diversified Realty Corp. | | | 30,300 | | | $ | 1,845,270 | | |
| | | $ | 1,845,270 | | |
| Semiconductors & Semiconductor Equipment — 2.6% | |
| Microchip Technology, Inc. | | | 42,050 | | | $ | 1,384,707 | | |
| Varian Semiconductor Equipment Associates, Inc.(1) | | | 31,750 | | | | 1,158,558 | | |
| | | $ | 2,543,265 | | |
| Software — 2.6% | |
| ANSYS, Inc.(1) | | | 18,100 | | | $ | 832,600 | | |
| Jack Henry & Associates, Inc. Class A | | | 78,500 | | | | 1,710,515 | | |
| | | $ | 2,543,115 | | |
See notes to financial statements
18
Tax-Managed Mid-Cap Core Portfolio as of October 31, 2006
PORTFOLIO OF INVESTMENTS CONT'D
| Security | | Shares | | Value | |
| Specialty Retail — 2.5% | |
| O'Reilly Automotive, Inc.(1) | | | 45,000 | | | $ | 1,453,050 | | |
| Ross Stores, Inc. | | | 32,500 | | | | 956,475 | | |
| | | $ | 2,409,525 | | |
| Tobacco — 1.3% | |
| Universal Corp./Richmond, VA | | | 33,500 | | | $ | 1,233,470 | | |
| | | $ | 1,233,470 | | |
Total Common Stocks
(identified cost $74,674,629) | | | | | | $ | 96,279,877 | | |
Total Investments — 98.4%
(identified cost $74,674,629) | | | | | | $ | 96,279,877 | | |
| Other Assets, Less Liabilities — 1.6% | | | | | | $ | 1,596,875 | | |
| Net Assets — 100.0% | | | | | | $ | 97,876,752 | | |
(1) Non-income producing security.
See notes to financial statements
19
Tax-Managed Mid-Cap Core Portfolio as of October 31, 2006
FINANCIAL STATEMENTS
Statement of Assets and Liabilities
As of October 31, 2006
| Assets | |
| Investments, at value (identified cost, $74,674,629) | | $ | 96,279,877 | | |
| Cash | | | 1,648,798 | | |
| Dividends and interest receivable | | | 60,446 | | |
| Total assets | | $ | 97,989,121 | | |
| Liabilities | |
| Payable to affiliate for investment advisory fees | | $ | 64,310 | | |
| Payable to affiliate for Trustees' fees | | | 899 | | |
| Other accrued expenses | | | 47,160 | | |
| Total liabilities | | $ | 112,369 | | |
| Net Assets applicable to investors' interest in Portfolio | | $ | 97,876,752 | | |
| Sources of Net Assets | |
| Net proceeds from capital contributions and withdrawals | | $ | 76,271,504 | | |
| Net unrealized appreciation (computed on the basis of identified cost) | | | 21,605,248 | | |
| Total | | $ | 97,876,752 | | |
Statement of Operations
For the Year Ended
October 31, 2006
| Investment Income | |
| Dividends | | $ | 1,035,329 | | |
| Interest | | | 50,000 | | |
| Total investment income | | $ | 1,085,329 | | |
| Expenses | |
| Investment adviser fee | | $ | 726,984 | | |
| Trustees' fees and expenses | | | 7,198 | | |
| Custodian fee | | | 64,502 | | |
| Legal and accounting services | | | 27,811 | | |
| Miscellaneous | | | 3,004 | | |
| Total expenses | | $ | 829,499 | | |
Deduct —
Reduction of investment adviser fee | | $ | 5,640 | | |
| Total expense reductions | | $ | 5,640 | | |
| Net expenses | | $ | 823,859 | | |
| Net investment income | | $ | 261,470 | | |
| Realized and Unrealized Gain (Loss) | |
Net realized gain (loss) —
Investment transactions (identified cost basis) | | $ | 4,855,443 | | |
| Net realized gain | | $ | 4,855,443 | | |
Change in unrealized appreciation (depreciation) —
Investments (identified cost basis) | | $ | 6,129,045 | | |
| Net change in unrealized appreciation (depreciation) | | $ | 6,129,045 | | |
| Net realized and unrealized gain | | $ | 10,984,488 | | |
| Net increase in net assets from operations | | $ | 11,245,958 | | |
See notes to financial statements
20
Tax-Managed Mid-Cap Core Portfolio as of October 31, 2006
FINANCIAL STATEMENTS CONT'D
Statements of Changes in Net Assets
Increase (Decrease)
in Net Assets | | Year Ended
October 31, 2006 | | Year Ended
October 31, 2005 | |
From operations —
Net investment income (loss) | | $ | 261,470 | | | $ | (78,542 | ) | |
Net realized gain from
investment transactions | | | 4,855,443 | | | | 1,310,390 | | |
Net change in unrealized appreciation
(depreciation) of investments | | | 6,129,045 | | | | 5,930,816 | | |
| Net increase in net assets from operations | | $ | 11,245,958 | | | $ | 7,162,664 | | |
Capital transactions —
Contributions | | $ | 16,793,678 | | | $ | 8,294,624 | | |
| Withdrawals | | | (6,253,468 | ) | | | (6,496,638 | ) | |
Net increase in net assets from
capital transactions | | $ | 10,540,210 | | | $ | 1,797,986 | | |
| Net increase in net assets | | $ | 21,786,168 | | | $ | 8,960,650 | | |
| Net Assets | |
| At beginning of year | | $ | 76,090,584 | | | $ | 67,129,934 | | |
| At end of year | | $ | 97,876,752 | | | $ | 76,090,584 | | |
See notes to financial statements
21
Tax-Managed Mid-Cap Core Portfolio as of October 31, 2006
FINANCIAL STATEMENTS CONT'D
Supplementary Data
| | | Year Ended October 31, | | Period Ended | |
| | | 2006 | | 2005 | | 2004 | | 2003 | | October 31, 2002(1) | |
| Ratios/Supplemental Data | |
| Ratios (As a percentage of average daily net assets): | |
| Expenses(3) | | | 0.91 | % | | | 0.91 | % | | | 0.93 | % | | | 0.99 | % | | | 1.68 | %(2) | |
| Net investment income (loss) | | | 0.29 | % | | | (0.11 | )% | | | (0.15 | )% | | | (0.22 | )% | | | (0.81 | )%(2) | |
| Portfolio Turnover | | | 55 | % | | | 53 | % | | | 42 | % | | | 50 | % | | | 13 | % | |
| Total Return(4) | | | 13.85 | % | | | 10.54 | % | | | 6.43 | % | | | 25.97 | % | | | (14.72 | )% | |
| Net assets, end of year (000's omitted) | | $ | 97,877 | | | $ | 76,091 | | | $ | 67,130 | | | $ | 46,112 | | | $ | 17,149 | | |
(1) For the period from the start of business, March 1, 2002, to October 31, 2002.
(2) Annualized.
(3) The investment adviser waived a portion of its investment advisory fee (equal to less than 0.01% of average daily net assets for each of the years ended October 31, 2006, 2005, and 2004). A portion of the waiver was borne by the sub-adviser.
(4) Total return is not computed on an annualized basis.
See notes to financial statements
22
Tax-Managed Mid-Cap Core Portfolio as of October 31, 2006
NOTES TO FINANCIAL STATEMENTS
1 Significant Accounting Policies
Tax-Managed Mid-Cap Core Portfolio (the Portfolio) is registered under the Investment Company Act of 1940, as amended, as a diversified open-end management investment company. The Portfolio, which was organized as a trust under the laws of the State of New York on December 10, 2001, seeks to achieve long-term, after-tax returns by investing in a diversified portfolio of common stocks of mid-cap companies. The Declaration of Trust permits the Trustees to issue interests in the Portfolio. At October 31, 2006, the Eaton Vance Tax-Managed Mid-Cap Core Fund and the Eaton Vance Tax-Managed Equity Asset Allocation Fund held 32.1% and 67.9% interests in the Portfolio, respectively. The following is a summary of significant accounting policies consistently followed by the Portfolio in the preparation of its financial statements. The policies are in conformity with accounting principles generally accepted in the United States of America.
A Investment Valuation — Securities listed on a U.S. securities exchange generally are valued at the last sale price on the day of valuation or, if no sales took place on such date, at the mean between the closing bid and asked prices therefore on the exchange where such securities are principally traded. Equity securities listed on the NASDAQ National Market System generally are valued at the official NASDAQ closing price. Unlisted or listed securities for which closing sales prices or closing quotations are not available are valued at the mean between the latest available bid and asked prices, or, in the case of preferred equity securities that are not listed or traded in the over-the-counter market, by an independent pricing service. Exchange-traded options are valued at the last sale price for the day of valuation as quoted on the principal exchange or board of trade on which the options are traded or, in the absence of sales on such date, at the mean between the latest bid and asked prices therefore. Futures positions on securities and currencies generally are valued at closing settlement prices. Short-term debt securities with a remaining maturity of 60 days or less are valued at amortized cost. If short-term debt securities are acquired with a remaining maturity of more than 60 days, they will be valued by a pricing service. Other fixed income and debt securities, including listed securities and securities for which price quotations are available, will normally be valued on the basis of valuations furnished by a pricing service. Foreign securities and currencies are valued in U.S. dollars, based on foreign currency exchange rate quotations supplied by an independent quotation service. The daily valuation of exchange-traded foreign securities generally is determined as of the close of trading on the principal exchange on which such securities trade. Events occurring after the close of trading on foreign exchanges may result in adjustments to the valuation of foreign securities to more accurately reflect their fair value as of the close of regular trading on the New York Stock Exchange. When valuing foreign securities that meet certain criteria, the Trustees have approved the use of a fair value service that values such securities to reflect market trading that occurs after the close of the applicable foreign markets of comparable securities or other instruments that have a strong correlation to the fair-valued securities. Investments held by the Portfolio for which valuations or market quotations are unavailable are valued at fair value using methods determined in good faith by or at the direction of the Trustees of the Portfolio considering relevant factors, data and information including the market value of freely tradable securities of the same class in the principal market on which such securities are normally traded.
B Income — Dividend income is recorded on the ex-dividend date for dividends received in cash and/or securities. However, if the ex-dividend date has passed, certain dividends from foreign securities are recorded as the Portfolio is informed of the ex-dividend date. Withholding taxes on foreign dividends and capital gains have been provided for in accordance with the Portfolio's understanding of the applicable countries' tax rules and rates. Interest income is recorded on the accrual basis.
C Federal Taxes — The Portfolio has elected to be treated as a partnership for federal tax purposes. No provision is made by the Portfolio for federal or state taxes on any taxable income of the Portfolio because each investor in the Portfolio is ultimately responsible for the payment of any taxes on its share of taxable income. Since at least one of the Portfolio's investors is a regulated investment company that invests all or substantially all of its assets in the Portfolio, the Portfolio normally must satisfy the applicable source of income and diversification requirements (under the Internal Revenue Code) in order for its investors to satisfy them. The Portfolio will allocate, at least annually among its investors, each investor's distributive share of the Portfolio' s net investment income, net realized capital gains, and any other items of income, gain, loss, deduction or credit.
D Expense Reduction — Investors Bank & Trust Company (IBT) serves as custodian of the Portfolio. Pursuant to the custodian agreement, IBT receives a fee reduced by credits which are determined based on the average daily cash balance the Portfolio maintains with IBT. All credit balances used to reduce the Portfolio's custodian fees are reported as a reduction of expenses in the Statement of Operations.
23
Tax-Managed Mid-Cap Core Portfolio as of October 31, 2006
NOTES TO FINANCIAL STATEMENTS CONT'D
E Financial Futures Contract — Upon entering a financial futures contract, the Portfolio is required to deposit either in cash or securities an amount (initial margin) equal to a certain percentage of the purchase price indicated in the financial futures contract. Subsequent payments are made or received by the Portfolio (margin maintenance) each day, dependent on daily fluctuations in the value of the underlying security, and are recorded for book purposes as unrealized gains or losses by the Portfolio. The Portfolio's investment in financial futures contracts is designed to hedge against anticipated future changes in price of current or anticipated Portfolio positions. Should prices move unexpectedly, the Portfolio may not achieve the anticipated benefits of the financi al futures contracts and may realize a loss.
F Purchased Options — Upon the purchase of a call or put option, the premium paid by the Portfolio is included in the Statement of Assets and Liabilities as an investment. The amount of the investment is subsequently marked-to-market to reflect the current market value of the option purchased, in accordance with the Portfolio's policies on investment valuations discussed above. If an option which the Portfolio has purchased expires on the stipulated expiration date, the Portfolio will realize a loss in the amount of the cost of the option. If the Portfolio enters into a closing sale transaction, the Portfolio will realize a gain or loss, depending on whether the sales proceeds from the closing sale transaction are greater or less than the cost of the option. If a Portfoli o exercises a put option, it will realize a gain or loss from the sale of the underlying security, and the proceeds from such sale will be decreased by the premium originally paid. If the Portfolio exercises a call option, the cost of the security which the Portfolio purchases upon exercise will be increased by the premium originally paid.
G Securities Sold Short — The Portfolio may sell individual securities short if it owns at least an equal amount of the security sold short or has at the time of sale a right to obtain securities equivalent in kind and amount to the securities sold and provided that, if such right is conditional, the sale is made upon the same conditions (a covered short sale). The Portfolio may sell short securities representing an index or basket of securities whose constituents the Portfolio holds in whole or in part. A short sale of an index or basket security will be a covered short sale if the underlying index or basket of securities is the same or substantially identical to securities held by the Portfolio.
The seller of a short position generally realizes a profit on the transaction if the price it receives on the short sale exceeds the cost of closing out the position by purchasing securities in the market, but generally realizes a loss if the cost of closing out the short position exceeds the proceeds of the short sale. The exposure to loss on covered short sales (to the extent the value of the security sold short rises instead of falls) is offset by the increase in the value of the underlying security or securities retained. The profit or loss on a covered short sale is also affected by the borrowing cost of any securities borrowed in connection with the short sale (which will vary with market conditions) and use of the proceeds of the short sale. The Portfolio expects normally to close its covered short sales by delivering newly-acquired stock.
Exposure to loss on an index or basket security sold short will not be offset by gains on other securities holdings to the extent that the constituent securities of the index or basket security sold short are not held by the Portfolio. Such losses may be substantial.
H Foreign Currency Translation — Investment valuations, other assets, and liabilities initially expressed in foreign currencies are converted each business day into U.S. dollars based upon current exchange rates. Purchases and sales of foreign investment securities and income and expenses are converted into U.S. dollars based upon currency exchange rates prevailing on the respective dates of such transactions. Recognized gains or losses on investment transactions attributable to changes in foreign currency exchange rates are recorded for financial statement purposes as net realized gains and losses on investments. That portion of unrealized gains and losses on investments that results from fluctuations in foreign currency exchange rates is not separately disclosed.
I Use of Estimates — The preparation of the financial statements in conformity with accounting principles generally accepted in the United States of America requires management to make estimates and assumptions that affect the reported amounts of assets and liabilities at the date of the financial statements and the reported amounts of income and expense during the reporting period. Actual results could differ from those estimates.
J Other — Investment transactions are accounted for on the date the securities are purchased or sold. Realized gains and losses on securities sold are determined on the basis of identified cost.
K Indemnifications — Under the Portfolio's organizational documents, its officers and Trustees may be indemnified against certain liabilities and expenses arising
24
Tax-Managed Mid-Cap Core Portfolio as of October 31, 2006
NOTES TO FINANCIAL STATEMENTS CONT'D
out of the performance of their duties to the Portfolio. Interestholders in the Portfolio are jointly and severally liable for the liabilities and obligations of the Portfolio in the event that the Portfolio fails to satisfy such liabilities and obligations; provided, however, that, to the extent assets are available in the Portfolio, the Portfolio may, under certain circumstances, indemnify interestholders from and against any claim or liability to which such holder may become subject by reason of being or having been an interestholder in the Portfolio. Additionally, in the normal course of business, the Portfolio enters into agreements with service providers that may contain indemnification clauses. The Portfolio's maximum exposure under these arrangements is unknown as this would involve future claims that may be made against the Portfolio that have not yet occurred.
2 Investment Adviser Fee and Other Transactions with Affiliates
The investment adviser fee is earned by Boston Management and Research (BMR), a wholly-owned subsidiary of EVM, as compensation for management and investment advisory services rendered to the Portfolio. Under the advisory agreement, BMR receives a monthly advisory fee equal to 0.80% annually of the average daily net assets of the Portfolio up to $500 million, and at reduced rates as daily net assets exceed that level. For the year ended October 31, 2006, the advisory fee amounted to $726,984. Pursuant to a sub-advisory agreement, BMR has delegated the investment management of the Portfolio to Atlanta Capital. BMR pays Atlanta Capital a monthly fee for sub-advisory services provided to the Portfolio equal to 0.55% annually of the average daily net assets up to $500 million, and at reduced rates as daily net assets exceed that level. BMR has agreed to reduce the investment adviser fee by an amount equal to that portion of commissi ons paid to broker dealers in execution of Portfolio transactions that is consideration for third-party research services. For the year ended October 31, 2006, BMR waived $5,640 of its advisory fee. Atlanta Capital, in turn, waived $5,640 of its sub-advisory fee. Except for Trustees of the Portfolio who are not members of EVM's or BMR's organization, officers and Trustees receive remuneration for their services to the Portfolio out of the investment adviser fee and sub-adviser fees. Trustees of the Portfolio who are not affiliated with BMR may elect to defer receipt of all or a percentage of their annual fees in accordance with the terms of the Trustees Deferred Compensation Plan. For the year ended October 31, 2006, no significant amounts have been deferred.
Certain officers and Trustees of the Portfolio are officers of the above organizations.
3 Investment Transactions
Purchases and sales of investments, other than short-term obligations, aggregated $60,104,229 and $49,317,488, respectively, for the year ended October 31, 2006.
4 Federal Income Tax Basis of Unrealized Appreciation (Depreciation)
The cost and unrealized appreciation (depreciation) in value of the investments owned at October 31, 2006, as determined on a federal income tax basis, were as follows:
| Aggregate cost | | $ | 74,741,799 | | |
| Gross unrealized appreciation | | $ | 21,618,296 | | |
| Gross unrealized depreciation | | | (80,218 | ) | |
| Net unrealized appreciation | | $ | 21,538,078 | | |
5 Financial Instruments
The Portfolio may trade in financial instruments with off-balance sheet risk in the normal course of its investing activities to assist in managing exposure to various market risks. These financial instruments include written options and financial futures contracts and may involve, to a varying degree, elements of risk in excess of the amounts recognized for financial statement purposes.
The notional or contractual amounts of these instruments represent the investment the Portfolio has in particular classes of financial instruments and does not necessarily represent the amounts potentially subject to risk. The measurement of the risks associated with these instruments is meaningful only when all related and offsetting transactions are considered. The Portfolio did not have any open obligations under these financial instruments at October 31, 2006.
6 Line of Credit
The Portfolio participates with other portfolios and funds managed by BMR and EVM and its affiliates in a $150 million unsecured line of credit agreement with a group of banks. Borrowings will be made by the Portfolio solely to facilitate the handling of unusual and/or unanticipated short-term cash requirements. Interest is charged to each participating portfolio or fund based on its borrowings at an amount above either the Eurodollar rate or Federal Funds rate.
25
Tax-Managed Mid-Cap Core Portfolio as of October 31, 2006
NOTES TO FINANCIAL STATEMENTS CONT'D
In addition, a fee computed at an annual rate of 0.10% on the daily unused portion of the line of credit is allocated among the participating portfolios and funds at the end of each quarter. The Portfolio did not have any significant borrowings or allocated fees for the year ended October 31, 2006.
7 Recently Issued Accounting Pronouncements
In June 2006, the Financial Accounting Standards Board (FASB) issued FASB Interpretation No. 48, (FIN 48) "Accounting for Uncertainty in Income Taxes – an interpretation of FASB Statement No. 109". FIN 48 clarifies the accounting for uncertainty in income taxes recognized in accordance with FASB Statement No. 109, "Accounting for Income Taxes." This interpretation prescribes a recognition threshold and measurement attribute for the financial statement recognition and measurement of a tax position taken or expected to be taken in a tax return. It also provides guidance on de-recognition, classification, interest and penalties, accounting in interim periods, disclosure and transition. FIN 48 is effective for fiscal years beginning after December 15, 2006. Management is currently evaluating the impact of applying the various provisions of FIN 48.
In September 2006, the FASB Statement of Financial Accounting Standards No. 157 (FAS 157) "Fair Value Measurements". FAS 157 defines fair value, establishes a framework for measuring fair value in accordance with generally accepted accounting principles and expands disclosure about fair value measurements. FAS 157 is effective for fiscal years beginning after November 15, 2007. Management is currently evaluating the impact the adoption of FAS 157 will have on the Portfolio's financial statement disclosures.
26
Tax-Managed Mid-Cap Core Portfolio as of October 31, 2006
REPORT OF INDEPENDENT REGISTERED PUBLIC ACCOUNTING FIRM
To the Trustees and Investors
of Tax-Managed Mid-Cap Core Portfolio:
We have audited the accompanying statement of assets and liabilities of Tax-Managed Mid-Cap Core Portfolio (the "Portfolio"), including the portfolio of investments as of October 31, 2006, the related statement of operations for the year then ended, the statements of changes in net assets for each of the two years in the period then ended and the supplementary data for each of the four years in the period then ended, and for the period from the start of business, March 1, 2002, to October 31, 2002. These financial statements and supplementary data are the responsibility of the Portfolio's management. Our responsibility is to express an opinion on these financial statements and supplementary data based on our audits.
We conducted our audits in accordance with standards of the Public Company Accounting Oversight Board (United States). Those standards require that we plan and perform the audit to obtain reasonable assurance about whether the financial statements and supplementary data are free of material misstatement. The Portfolio is not required to have, nor were we engaged to perform, an audit of its internal control over financial reporting. Our audits included consideration of internal control over financial reporting as a basis for designing audit procedures that are appropriate in the circumstances, but not for the purpose of expressing an opinion on the effectiveness of the Portfolio's internal control over financial reporting. Accordingly, we express no such opinion. An audit also includes examining, on a test basis, evidence supporting the amounts and disclosures in the financial statements, assessing the accounting principles used and significant estimates made by management, as well as evaluating the overall financial statement presentation. Our procedures included confirmation of securities owned as of October 31, 2006 by correspondence with the custodian and brokers. We believe that our audits provide a reasonable basis for our opinion.
In our opinion, the financial statements and supplementary data referred to above present fairly, in all material respects, the financial position of Tax-Managed Mid-Cap Core Portfolio as of October 31, 2006, the results of its operations for the year then ended, the changes in its net assets for each of the two years in the period then ended and the supplementary data for each of the four years in the period then ended, and for the period from the start of business, March 1, 2002, to October 31, 2002 in conformity with accounting principles generally accepted in the United States of America.
DELOITTE & TOUCHE LLP
Boston, Massachusetts
December 15, 2006
27
Eaton Vance Tax-Managed Mid-Cap Core Fund
BOARD OF TRUSTEES' ANNUAL APPROVAL OF THE INVESTMENT ADVISORY AND SUB-ADVISORY AGREEMENTS
Overview of the Contract Review Process
The Investment Company Act of 1940, as amended (the "1940 Act"), provides, in substance, that each investment advisory agreement between a fund and its investment adviser will continue in effect from year to year only if its continuance is approved at least annually by the fund's board of trustees, including by a vote of a majority of the trustees who are not "interested persons" of the fund ("Independent Trustees") cast in person at a meeting called for the purpose of considering such approval.
At a meeting of the Boards of Trustees (each a "Board") of the Eaton Vance group of mutual funds (the "Eaton Vance Funds") held on March 27, 2006, the Board, including a majority of the Independent Trustees, voted to approve continuation of existing advisory and sub-advisory agreements for the Eaton Vance Funds for an additional one-year period. In voting its approval, the Board relied upon the affirmative recommendation of the Special Committee of the Board, which is a committee comprised exclusively of Independent Trustees. Prior to making its recommendation, the Special Committee reviewed information furnished for a series of meetings of the Special Committee held in February and March 2006. Such information included, among other things, the following:
Information about Fees, Performance and Expenses
• An independent report comparing the advisory and related fees paid by each fund with fees paid by comparable funds;
• An independent report comparing each fund's total expense ratio and its components to comparable funds;
• An independent report comparing the investment performance of each fund to the investment performance of comparable funds over various time periods;
• Data regarding investment performance in comparison to relevant peer groups of funds and appropriate indices;
• Comparative information concerning fees charged by each adviser for managing other mutual funds and institutional accounts using investment strategies and techniques similar to those used in managing the fund;
• Profitability analyses for each adviser with respect to each fund managed by it;
Information about Portfolio Management
• Descriptions of the investment management services provided to each fund, including the investment strategies and processes employed;
• Information concerning the allocation of brokerage and the benefits received by each adviser as a result of brokerage allocation, including information concerning the acquisition of research through "soft dollar" benefits received in connection with the funds' brokerage, and the implementation of a soft dollar reimbursement program established with respect to the funds;
• Data relating to portfolio turnover rates of each fund;
• The procedures and processes used to determine the fair value of fund assets and actions taken to monitor and test the effectiveness of such procedures and processes;
Information about each Adviser
• Reports detailing the financial results and condition of each adviser;
• Descriptions of the qualifications, education and experience of the individual investment professionals whose responsibilities include portfolio management and investment research for the funds, and information relating to their compensation and responsibilities with respect to managing other mutual funds and investment accounts;
• Copies of the Codes of Ethics of each adviser and its affiliates, together with information relating to compliance with and the administration of such codes;
• Information concerning the resources devoted to compliance efforts undertaken by each adviser and its affiliates on behalf of the funds (including descriptions of various compliance programs) and their record of compliance with investment policies and restrictions, including policies with respect to market-timing, late trading and selective portfolio disclosure, and with policies on personal securities transactions;
• Descriptions of the business continuity and disaster recovery plans of each adviser and its affiliates;
Other Relevant Information
• Information concerning the nature, cost and character of the administrative and other non-investment management services provided by Eaton Vance Management and its affiliates;
• Information concerning management of the relationship with the custodian, subcustodians and fund accountants by each adviser or the funds' administrator; and
• The terms of each advisory agreement.
In addition to the information identified above, the Special Committee considered information provided from time to time by each adviser throughout the year at meetings of the Board and its committees. Over the course of the twelve month period ended March 31,
28
Eaton Vance Tax-Managed Mid-Cap Core Fund
BOARD OF TRUSTEES' ANNUAL APPROVAL OF THE INVESTMENT ADVISORY AND SUB-ADVISORY AGREEMENTS CONT'D
2006, the Board met nine times and the Special Committee, the Audit Committee and the Governance Committee, each of which is a Committee comprised solely of Independent Trustees, met eight, twelve and five times, respectively. At such meetings, the Trustees received, among other things, presentations by the portfolio managers and other investment professionals of each adviser relating to the investment performance of each fund and the investment strategies used in pursuing the fund's investment objective.
For funds that invest through one or more underlying portfolios, the Board considered similar information about the portfolio(s) when considering the approval of advisory agreements. In addition, in cases where the fund's investment adviser has engaged a sub-adviser, the Board considered similar information about the sub-adviser when considering the approval of any sub-advisory agreement.
The Special Committee was assisted throughout the contract review process by Goodwin Procter LLP, legal counsel for the Independent Trustees. The members of the Special Committee relied upon the advice of such counsel and their own business judgment in determining the material factors to be considered in evaluating each advisory and sub-advisory agreement and the weight to be given to each such factor. The conclusions reached with respect to each advisory and sub-advisory agreement were based on a comprehensive evaluation of all the information provided and not any single factor. Moreover, each member of the Special Committee may have placed varying emphasis on particular factors in reaching conclusions with respect to each advisory and sub-advisory agreement.
Results of the Process
Based on its consideration of the foregoing, and such other information as it deemed relevant, including the factors and conclusions described below, the Special Committee concluded that the continuance of the investment advisory agreement of the Tax-Managed Mid-Cap Core Portfolio (the "Portfolio"), the portfolio in which the Eaton Vance Tax-Managed Mid-Cap Core Fund (the "Fund") invests, with Boston Management and Research (the "Adviser"), and the sub-advisory agreement with Atlanta Capital Management Company, LLC (the "Sub-adviser"), including their fee structures, is in the interests of shareholders and, therefore, the Special Committee recommended to the Board approval of the respective agreements. The Board accepted the recommendation of the Special Committee as well as the factors considered and conclusions reached by the Special Committee with respect to the agreements. Accordingly, the Board, including a majority of the Independent Trustees, voted to approve continuation of the investment advisory agreement and the sub-advisory agreement for the Portfolio.
Nature, Extent and Quality of Services
In considering whether to approve the investment advisory agreement and sub-advisory agreements of the Portfolio, the Board evaluated the nature, extent and quality of services provided to the Portfolio by the Adviser and the Sub-adviser.
The Board considered the Adviser's and the Sub-adviser's management capabilities and investment process with respect to the types of investments held by the Portfolio, including the education, experience and number of its investment professionals and other personnel who provide portfolio management, investment research, and similar services to the Portfolio and whose responsibilities include supervising the Sub-adviser. The Board specifically noted the Adviser's in-house equity research capabilities. The Board also took into account the resources dedicated to portfolio management and other services, including the compensation paid to recruit and retain investment personnel, and the time and attention devoted to each Portfolio in the complex by senior management. With respect to the Sub-adviser, the Board took into account the resources available to the Sub-adviser in fulfilling its duties under the sub-advisory agreement and the Sub-adviser's experience in managing equity portfolios, as well as recent changes in personnel.
The Board reviewed the compliance programs of the Adviser and relevant affiliates thereof, including the Sub-adviser. Among other matters, the Board considered compliance and reporting matters relating to personal trading by investment personnel, selective disclosure of portfolio holdings, late trading, frequent trading, portfolio valuation, business continuity and the allocation of investment opportunities. The Board also evaluated the responses of the Adviser and its affiliates to requests from regulatory authorities such as the Securities and Exchange Commission and the National Association of Securities Dealers.
The Board considered shareholder and other administrative services provided or managed by Eaton Vance Management and its affiliates, including transfer agency and accounting services. The Board evaluated the benefits to shareholders of investing in a fund that is a part of a large family of funds, including the ability, in many cases, to exchange an investment among different funds without incurring additional sales charges.
After consideration of the foregoing factors, among others, the Board concluded that the nature, extent and quality of services provided by the Adviser and Sub-adviser, taken as a whole, are appropriate and consistent with the terms of the investment advisory agreement and sub-advisory agreement, respectively.
29
Eaton Vance Tax-Managed Mid-Cap Core Fund
BOARD OF TRUSTEES' ANNUAL APPROVAL OF THE INVESTMENT ADVISORY AND SUB-ADVISORY AGREEMENTS CONT'D
Fund Performance
The Board compared the Fund's investment performance to a relevant universe of similarly managed funds identified by an independent data provider and appropriate benchmark indices. The Board reviewed comparative performance data for the one- and three- year periods ended September 30, 2005 for the Fund. The Board noted that action was being taken to improve the performance of the Fund, including changes in personnel, and concluded that it was appropriate to allow reasonable time to evaluate the effectiveness of this action.
Management Fees and Expenses
The Board reviewed contractual investment advisory fee rates, including administrative fee rates, payable by the Portfolio and the Fund (referred to collectively as "management fees").
As part of its review, the Board considered the management fees (including administrative fees) and the Fund's total expense ratio for the one-year period ended September 30, 2005, as compared to a group of similarly managed funds selected by an independent data provider. The Board considered the fact that the Adviser waived fees and/or paid expenses for the Fund.
After reviewing the foregoing information, and in light of the nature, extent and quality of the services provided by the Adviser, the Board concluded that the management fees charged for advisory and related services and the Fund's total expense ratio are reasonable.
Profitability
The Board reviewed the level of profits realized by the Adviser and relevant affiliates thereof, including the Sub-adviser, in providing investment advisory and administrative services to the Portfolio, the Fund and to all Eaton Vance Funds as a group. The Board considered the level of profits realized without regard to revenue sharing or other payments by the Adviser and its affiliates to third parties in respect of distribution services. The Board also considered other direct or indirect benefits received by the Adviser and its affiliates in connection with its relationship with the Portfolio and the Fund, including the benefits of research services that may be available to the Adviser or Sub-adviser as a result of securities transactions effected for the Portfolio and other advisory clients.
The Board concluded that, in light of the foregoing factors and the nature, extent and quality of the services rendered, the profits realized by the Adviser and its affiliates, including the Sub-adviser, are reasonable.
Economies of Scale
In reviewing management fees and profitability, the Board also considered the extent to which the Adviser and its affiliates, on the one hand, and the Fund, on the other hand, can expect to realize benefits from economies of scale as the assets of the Fund and the Portfolio increase. The Board acknowledged the difficulty in accurately measuring the benefits resulting from the economies of scale with respect to the management of any specific fund or group of funds. The Board reviewed data summarizing the increases and decreases in the assets of the Fund and of all Eaton Vance Funds as a group over various time periods, and evaluated the extent to which the total expense ratio of the Fund and the profitability of the Adviser and its affiliates may have been affected by such increases or decreases. Based upon the foregoing, the Board concluded that the benefits from economies of scale are currently being shared equitably by the Adv iser and its affiliates and the Fund. The Board also concluded that, assuming reasonably foreseeable increases in the assets of the Portfolio, the structure of the advisory fee, which includes breakpoints at several asset levels, can be expected to cause the Adviser and its affiliates and the Fund to continue to share such benefits equitably.
30
Eaton Vance Tax-Managed Mid-Cap Core Fund
MANAGEMENT AND ORGANIZATION
Fund Management. The Trustees of Eaton Vance Mutual Funds Trust (the Trust) and Tax-Managed Mid-Cap Core Portfolio (the Portfolio) are responsible for the overall management and supervision of the Trust's and Portfolio's affairs. The Trustees and officers of the Trust and the Portfolio are listed below. Except as indicated, each individual has held the office shown or other offices in the same company for the last five years. Trustees and officers of the Trust and the Portfolio hold indefinite terms of office. The "noninterested Trustees" consist of those Trustees who are not "interested persons" of the Trust and the Portfolio, as that term is defined under the 1940 Act. The business address of each Trustee and officer is The Eaton Vance Building, 255 State Street, Boston, Massachusetts 02109. As used below, "EVC" refers to Eaton Vance Corp., "EV" refers to Eaton Vance, Inc., "EVM" refers to Eaton Vance Management, "BMR" refers to Boston Management and Research, "Parametric" refers to Parametric Portfolio Associates, "EVD" refers to Eaton Vance Distributors, Inc. and "Atlanta Capital" refers to Atlanta Capital Management Company, LLC. EVC and EV are the corporate parent and trustee, respectively, of EVM and BMR. EVD is the Fund's principal underwriter, the Portfolio's placement agent and a wholly-owned subsidiary of EVM. Each officer affiliated with Eaton Vance may hold a position with other Eaton Vance affiliates that is comparable to his or her position with EVM listed below.
Name and
Date of Birth | | Position(s)
with the
Trust and the
Portfolio | | Term of
Office and
Length of
Service | | Principal Occupation(s)
During Past Five Years | | Number of Portfolios
in Fund Complex
Overseen By
Trustee(1) | | Other Directorships Held | |
| Interested Trustee | | | | | | | | | | | | | |
|
James B. Hawkes
11/9/41 | | Trustee of the Trust; Trustee and President of the Portfolio | | Trustee of the Trust since 1991; Trustee and President of the Portfolio since 2001 | | Chairman and Chief Executive Officer of EVC, BMR, EVM and EV; Director of EV; Vice President and Director of EVD. Trustee and/or officer of 170 registered investment companies in the Eaton Vance Fund Complex. Mr. Hawkes is an interested person because of his positions with BMR, EVM, EVC and EV, which are affiliates of the Trust and the Portfolio. | | | 170 | | | Director of EVC | |
|
| Noninterested Trustee(s) | | | | | | | | | | | | | |
|
Benjamin C. Esty
1/2/63 | | Trustee | | Since 2005 | | Roy and Elizabeth Simmons Professor of Business Administration, Harvard University Graduate School of Business Administration (since 2003). Formerly, Associate Professor, Harvard University Graduate School of Business Administration (2000-2003). | | | 170 | | | None | |
|
Samuel L. Hayes, III
2/23/35 | | Trustee and Chairman of the Board | | Trustee of the Trust since 1986; of the Portfolio since 2001 and Chairman of the Board since 2005 | | Jacob H. Schiff Professor of Investment Banking Emeritus, Harvard University Graduate School of Business Administration. Director of Yakima Products, Inc. (manufacturer of automotive accessories) (since 2001) and Director of Telect, Inc. (telecommunications services company). | | | 170 | | | Director of Tiffany & Co. (specialty retailer) | |
|
William H. Park
9/19/47 | | Trustee | | Since 2003 | | Vice Chairman, Commercial Industrial Finance Corp. (specialty finance company) (since 2006). Formerly, President and Chief Executive Officer, Prizm Capital Management, LLC (investment management firm) (2002-2005). Formerly, Executive Vice President and Chief Financial Officer, United Asset Management Corporation (a holding company owning institutional investment management firms) (1982-2001). | | | 170 | | | None | |
|
Ronald A. Pearlman
7/10/40 | | Trustee | | Since 2003 | | Professor of Law, Georgetown University Law Center. | | | 170 | | | None | |
|
31
Eaton Vance Tax-Managed Mid-Cap Core Fund
MANAGEMENT AND ORGANIZATION CONT'D
Name and
Date of Birth | | Position(s)
with the
Trust and the
Portfolios | | Term of
Office and
Length of
Service | | Principal Occupation(s)
During Past Five Years | | Number of Portfolios
in Fund Complex
Overseen By
Trustee(1) | | Other Directorships Held | |
| Noninterested Trustee(s) (continued) | | | | | | | | | | | | | |
|
| Norton H. Reamer 9/21/35 | | Trustee | | Trustee of the Trust since 1986 and of the Portfolio since 2001 | | President, Chief Executive Officer and a Director of Asset Management Finance Corp. (a specialty finance company serving the investment management industry) (since October 2003). President, Unicorn Corporation (an investment and financial advisory services company) (since September 2000). Formerly, Chairman and Chief Operating Officer, Hellman, Jordan Management Co., Inc. (an investment management company) (2000-2003). Formerly, Advisory Director of Berkshire Capital Corporation (investment banking firm) (2002-2003). | | | 170 | | | None | |
|
Lynn A. Stout
9/14/57 | | Trustee | | Trustee of the Trust since 1998 and of the Portfolio since 2001 | | Professor of Law, University of California at Los Angeles School of Law. | | | 170 | | | None | |
|
Ralph F. Verni
1/26/43 | | Trustee | | Since 2005 | | Consultant and private investor. | | | 170 | | | None | |
|
| Principal Officers who are not Trustees | |
|
Name and
Date of Birth | | Position(s)
with the
Trust and the
Portfolio | | Term of
Office and
Length of
Service | | Principal Occupation(s)
During Past Five Years | |
Thomas E. Faust Jr.
5/31/58 | | President of the Trust; Vice President of the Portfolio | | President of the Trust since 2002; Vice President of the Portfolio since 2001 | | President of EVC, EVM, BMR and EV and Director of EVC. Chief Investment Officer of EVC, EVM and BMR. Officer of 71 registered investment companies and 5 private investment companies managed by EVM or BMR. | |
|
William H. Ahern, Jr.
7/28/59 | | Vice President of the Trust | | Since 1995 | | Vice President of EVM and BMR. Officer of 71 registered investment companies managed by EVM or BMR. | |
|
| William O. Bell, IV 7/26/73 | | Vice President of the Portfolio | | Since 2005 | | Vice President of Atlanta Capital. Officer of 2 registered investment companies managed by EVM or BMR. | |
|
| Cynthia J. Clemson 3/2/63 | | Vice President of the Trust | | Since 2005 | | Vice President of EVM and BMR. Officer of 86 registered investment companies managed by EVM or BMR. | |
|
| William R. Hackney, III 4/12/48 | | Vice President of the Portfolio | | Since 2001 | | Managing Partner and member of the Executive Committee of Atlanta Capital. Officer of 3 registered investment companies managed by EVM or BMR. | |
|
| Marilyn Robinson Irvin 6/17/58 | | Vice President of the Portfolio | | Since 2005 | | Senior Vice President and Principal of Atlanta Capital. Officer of 2 registered investment companies managed by EVM or BMR. | |
|
Aamer Khan
6/7/60 | | Vice President of the Trust | | Since 2005 | | Vice President of EVM and BMR. Officer of 29 registered investment companies managed by EVM or BMR. | |
|
| Thomas H. Luster 4/8/62 | | Vice President of the Trust | | Since 2006 | | Vice President of EVM and BMR. Officer of 45 registered investment companies managed by EVM or BMR. | |
|
| Michael R. Mach 7/15/47 | | Vice President of the Trust | | Since 1999 | | Vice President of EVM and BMR. Officer of 51 registered investment companies managed by EVM or BMR. | |
|
| Robert B. MacIntosh 1/22/57 | | Vice President of the Trust | | Since 1998 | | Vice President of EVM and BMR. Officer of 86 registered investment companies managed by EVM or BMR. | |
|
32
Eaton Vance Tax-Managed Mid-Cap Core Fund
MANAGEMENT AND ORGANIZATION CONT'D
Name and
Date of Birth | | Position(s)
with the
Trust and the
Portfolio | | Term of
Office and
Length of
Service | | Principal Occupation(s)
During Past Five Years | |
| Principal Officers who are not Trustees (continued) | |
|
| Cliff Quisenberry, Jr. 1/1/65 | | Vice President of the Trust | | Since 2006 | | Vice President and Director of Research and Product Development of Parametric. Officer of 30 registered investment companies managed by EVM or BMR. | |
|
| Duncan W. Richardson 10/26/57 | | Vice President of the Trust | | Since 2001 | | Executive Vice President and Chief Equity Investment Officer of EVC, EVM and BMR. Officer of 71 registered investment companies managed by EVM or BMR. | |
|
| Walter A. Row, III 7/20/57 | | Vice President of the Trust | | Since 2001 | | Director of Equity Research and a Vice President of EVM and BMR. Officer of 33 registered investment companies managed by EVM or BMR. | |
|
| Judith A. Saryan 8/21/54 | | Vice President of the Trust | | Since 2003 | | Vice President of EVM and BMR. Officer of 50 registered investment companies managed by EVM or BMR. | |
|
| Susan Schiff 3/13/61 | | Vice President of the Trust | | Since 2002 | | Vice President Of EVM and BMR. Officer of 30 registered investment companies managed by EVM or BMR. | |
|
| Barbara E. Campbell 6/19/57 | | Treasurer of the Trust | | Since 2005(2) | | Vice President of EVM and BMR. Officer of 170 registered investment companies managed by EVM or BMR. | |
|
| Alan R. Dynner 10/10/40 | | Secretary | | Secretary of the Trust since 1997 and of the Portfolio since 2001 | | Vice President, Secretary and Chief Legal Officer of BMR, EVM, EVD, EV and EVC. Officer of 170 registered investment companies managed by EVM or BMR. | |
|
| Michelle A. Green 8/25/69 | | Treasurer of the Portfolio | | Since 2002(2) | | Vice President of EVM and BMR. Officer of 63 registered investment companies and 5 private investment companies managed by EVM or BMR. | |
|
| Paul M. O'Neil 7/11/53 | | Chief Compliance Officer | | Since 2004 | | Vice President of EVM and BMR. Officer of 170 registered investment companies managed by EVM or BMR. | |
|
(1) Includes both master and feeder funds in a master-feeder structure.
(2) Prior to 2005, Ms. Campbell served as Assistant Treasurer of the Trust since 1995. Prior to 2002, Ms. Green served as Assistant Treasurer of the Portfolio since 2001.
The SAI for the Fund includes additional information about the Trustees and officers of the Fund and the Portfolio and can be obtained without charge by calling 1-800-225-6265.
33
This Page Intentionally Left Blank
This Page Intentionally Left Blank
This Page Intentionally Left Blank
Investment Adviser of Tax-Managed Mid-Cap Core Portfolio
Boston Management and Research
The Eaton Vance Building
255 State Street
Boston, MA 02109
Sub-Adviser of Tax-Managed Mid-Cap Core Portfolio
Atlanta Capital Management Company LLC
1349 West Peachtree Street
Suite 1600
Atlanta, GA 30309
Administrator of Eaton Vance Tax-Managed Mid-Cap Core Fund
Eaton Vance Management
The Eaton Vance Building
255 State Street
Boston, MA 02109
Principal Underwriter
Eaton Vance Distributors, Inc.
The Eaton Vance Building
255 State Street
Boston, MA 02109
(617) 482-8260
Custodian
Investors Bank & Trust Company
200 Clarendon Street
Boston, MA 02116
Transfer Agent
PFPC Inc.
Attn: Eaton Vance Funds
P.O. Box 9653
Providence, RI 02940-9653
(800) 262-1122
Independent Registered Public Accounting Firm
Deloitte & Touche LLP
200 Berkeley Street
Boston, MA 02116-5022
Eaton Vance Tax-Managed Mid-Cap Core Fund
The Eaton Vance Building
255 State Street
Boston, MA 02109
This report must be preceded or accompanied by a current prospectus. Before investing, investors should consider carefully the Fund's investment
objective, risks, and charges and expenses. The Fund's current prospectus contains this and other information about the Fund and is available
through your financial advisor. Please read the prospectus carefully before you invest or send money. For further information please call 1-800-225-6265.
1301-12/06 TMMCCSRC

Annual Report October 31, 2006


EATON VANCE
TAX-MANAGED
MULTI-CAP
OPPORTUNITY
FUND
IMPORTANT NOTICES REGARDING PRIVACY,
DELIVERY OF SHAREHOLDER DOCUMENTS,
PORTFOLIO HOLDINGS AND PROXY VOTING
Privacy. The Eaton Vance organization is committed to ensuring your financial privacy. Each of the financial institutions identified below has in effect the following policy ("Privacy Policy") with respect to nonpublic personal information about
its customers:
• Only such information received from you, through application forms or otherwise, and information about your Eaton Vance fund transactions will be collected. This may include information such as name, address, social security number, tax status, account balances and transactions.
• None of such information about you (or former customers) will be disclosed to anyone, except as permitted by law (which includes disclosure to employees necessary to service your account). In the normal course of servicing a customer's account, Eaton Vance may share information with unaffiliated third parties that perform various required services such as transfer agents, custodians and broker/dealers.
• Policies and procedures (including physical, electronic and procedural safeguards) are in place that are designed to protect the confidentiality of such information.
• We reserve the right to change our Privacy Policy at any time upon proper notification to you. Customers may want to review our Policy periodically for changes by accessing the link on our homepage: www.eatonvance.com.
Our pledge of privacy applies to the following entities within the Eaton Vance organization: the Eaton Vance Family of Funds, Eaton Vance Management, Eaton Vance Investment Counsel, Boston Management and Research, and Eaton Vance Distributors, Inc.
In addition, our Privacy Policy only applies to those Eaton Vance customers who are individuals and who have a direct relationship with us. If a customer's account (i.e., fund shares) is held in the name of a third-party financial adviser/ broker-dealer, it is likely that only such adviser's privacy policies apply to the customer. This notice supersedes all previously issued privacy disclosures.
For more information about Eaton Vance's Privacy Policy, please call 1-800-262-1122.
Delivery of Shareholder Documents. The Securities and Exchange Commission (the "SEC") permits funds to deliver only one copy of shareholder documents, including prospectuses, proxy statements and shareholder reports, to fund investors with multiple accounts at the same residential or post office box address. This practice is often called "householding" and it helps eliminate duplicate mailings to shareholders.
Eaton Vance, or your financial adviser, may household the mailing of your documents indefinitely unless you instruct Eaton Vance, or your financial adviser, otherwise.
If you would prefer that your Eaton Vance documents not be householded, please contact Eaton Vance at 1-800-262-1122, or contact your financial adviser.
Your instructions that householding not apply to delivery of your Eaton Vance documents will be effective within 30 days of receipt by Eaton Vance or your financial adviser.
Portfolio Holdings. Each Eaton Vance Fund and its underlying Portfolio (if applicable) will file a schedule of its portfolio holdings on Form N-Q with the SEC for the first and third quarters of each fiscal year. The Form N-Q will be available on the Eaton Vance website www.eatonvance.com, by calling Eaton Vance at 1-800-262-1122 or in the EDGAR database on the SEC's website at www.sec.gov. Form N-Q may also be reviewed and copied at the SEC's public reference room in Washington, D.C. (call 1-800-732-0330 for information on the operation of the public reference room).
Proxy Voting. From time to time, funds are required to vote proxies related to the securities held by the funds. The Eaton Vance Funds or their underlying Portfolios (if applicable) vote proxies according to a set of policies and procedures approved by the Funds' and Portfolios' Boards. You may obtain a description of these policies and procedures and information on how the Funds or Portfolios voted proxies relating to Portfolio securities during the most recent 12 month period ended June 30, without charge, upon request, by calling 1-800-262-1122. This description is also available on the SEC's website at www.sec.gov.
Eaton Vance Tax-Managed Multi-Cap Opportunity Fund as of October 31, 2006
M A N A G E M E N T ’ S D I S C U S S I O N O F F U N D P E R F O R M A N C E

Arieh Coll
Portfolio Manager
The Fund
Performance For The Past Year
· During the year ended October 31, 2006, the Fund’s Class A shares had a total return of 19.84%. This return was the result of an increase in net asset value (NAV) per share to $12.75 on October 31, 2006, from $10.85 on October 31, 2005, plus the reinvestment of $0.225 per share in distribution from net realized gains.(1)
· The Fund’s Class B shares had a total return of 19.04% during the same period, the result of an increase in NAV per share to $12.07 from $10.35, plus the reinvestment of $0.225 per share in distribution from net realized gains.(1)
· The Fund’s Class C shares had a total return of 19.01% during the same period, the result of an increase in NAV per share to $12.09 from $10.37, plus the reinvestment of $0.225 per share in distribution from net realized gains.(1)
· For comparison, the Fund’s benchmark, the S&P 500 Index – a broad-based, unmanaged market index of common stocks – had a total return of 16.33% during the same period. The Fund’s peer group, the Lipper Mid-Cap Growth Funds Classification, had an average return of 11.52% for the same period.(2)
See pages 3 and 4 for more performance information, including after-tax returns.
Management Discussion
· During the year ended October 31, 2006, the Fund outperformed its benchmark index, the S&P 500, and it strongly outperformed the average return of funds in its Lipper Classification.(2) The Fund currently invests its assets in a separate registered investment company, Tax-Managed Multi-Cap Opportunity Portfolio (the “Portfolio”), with the same objective and policies as the Fund.
· U.S. equity markets moved upward at a solid pace during the year ended October 31, 2006. Despite a correction in May 2006, equity investors generally focused on solid economic fundamentals and strong corporate profits throughout the 12-month period and were cheered by stable interest rates and lower energy prices in the final months. The Dow Jones Industrial Average Index value surged to over 12,000 for the first time ever in October 2006.(2)
· During the period, the Portfolio benefited from the strong performance of a number of stock selections in several industry sectors. Relatively few selections proved disappointing. The strongest performance came from the information technology sector, where key Portfolio holdings in the communications equipment and semiconductor industries made significant contributions. Management has held many of these stocks for some time, believing that their long-term growth characteristics would be recognized by investors.
· In the telecommunications and materials sectors, the Portfolio was overweighted and stock selection was advantageous, so both strategies contributed to relative returns. In telecommuncations, wireless stocks performed well, while in the materials sector, metals and mining stocks had the strongest returns, benefiting from high commodity prices that have been driven by sustained global economic growth.
· During the period, the Portfolio’s disappointments included a reinsurance company that underperformed due to the impact of the devastating Fall 2005 hurricane season in the Gulf of Mexico. A maker of wireless laptop devices also declined due to stiff price competition for its products. Both of those holdings were sold during the period, creating tax losses for the Portfolio. Another disappointment was a leading provider of prescription drug management programs and other health care services that declined due to profit taking after seeing significant gains.
· The Fund’s strong performance for the period reflects its continued strategy of focusing on companies that management believes are expected, over the long term, to have earnings growth that is faster than the growth rates of the US economy and stock market as a whole.
(1) These returns do not include the 5.75% maximum sales charge for Class A shares or the applicable contingent deferred sales charge (CDSC) for Class B and Class C shares. If sales charges were deducted, the returns would be lower.
(2) It is not possible to invest directly in an Index or a Lipper Classification. The Index’s total return does not reflect commissions or expenses that would have been incurred if an investor individually purchased or sold the securities represented in the Index. The Lipper Average is the average total return, at net asset value, of the funds that are in the same Lipper Classification as the Fund.
Fund shares are not insured by the FDIC and are not deposits or other obligations of, or guaranteed by, any depository institution. Shares are subject to investment risks, including possible loss of principal invested.
Past performance is no guarantee of future results. Returns are historical and are calculated by determining the percentage change in net asset value or offering price (as applicable) with all distributions reinvested. Investment return and principal value will fluctuate so that shares, when redeemed, may be worth more or less than their original cost. Performance is for stated time period only; due to market volatility, the Fund’s current performance may be lower or higher than the quoted return. For performance as of the most recent month end, please refer to www.eatonvance.com.
The views expressed throughout this report are those of the portfolio manager and are current only through the end of the period of the report as stated on the cover. These views are subject to change at any time based upon market or other conditions, and the investment adviser disclaims any responsibility to update such views. These views may not be relied on as investment advice and, because investment decisions for a fund are based on many factors, may not be relied on as an indication of trading intent on behalf of any Eaton Vance fund.
1
Eaton Vance Tax-Managed Multi-Cap Opportunity Fund as of October 31, 2006
F U N D P E R F O R M A N C E
The line graph and table set forth below provide information about the Fund’s performance. The line graph compares the performance of Class A of the Fund with that of the S&P 500 Index, a broad-based unmanaged index of common stocks. The lines on the graph represent the total returns of a hypothetical investment of $10,000 in each of Class A and the S&P 500 Index. Class A total returns are presented at net asset value and maximum public offering price. The table includes the total returns of each Class of the Fund at net asset value and public offering price. The performance presented below does not reflect the deduction of taxes, if any, that a shareholder would pay on distributions or redemptions of Fund shares.
Performance* | | Class A | | Class B | | Class C | |
Average Annual Total Returns (at net asset value) | | | | | | | |
One Year | | 19.84 | % | 19.04 | % | 19.01 | % |
Five Years | | 9.18 | | 8.33 | | 8.34 | |
Life of Fund† | | 4.23 | | 3.36 | | 3.39 | |
SEC Average Annual Total Returns (including sales charge or applicable CDSC) | | | | | | | |
One Year | | 12.97 | % | 14.04 | % | 18.01 | % |
Five Years | | 7.90 | | 8.03 | | 8.34 | |
Life of Fund† | | 3.26 | | 3.36 | | 3.39 | |
†Inception Dates – Class A: 6/30/00; Class B: 7/10/00; Class C: 7/10/00
*Average annual total returns do not include the 5.75% maximum sales charge for Class A shares or the applicable contingent deferred sales charge (CDSC) for Class B and Class C shares. If sales charges were deducted, the returns would be lower. SEC average annual total returns for Class A reflect the maximum 5.75% sales charge. SEC returns for Class B shares reflect the applicable CDSC based on the following schedule: 5% - 1st and 2nd years; 4% - 3rd year; 3% - 4th year; 2% - 5th year; 1% - 6th year. SEC returns for Class C reflect a 1% CDSC for the first year.
Past performance is no guarantee of future results. Returns are historical and are calculated by determining the percentage change in net asset value or offering price (as applicable) with all distributions reinvested. Investment return and principal value will fluctuate so that shares, when redeemed, may be worth more or less than their original cost. Performance is for stated time period only; due to market volatility, the Fund’s current performance may be lower or higher than the quoted return. For performance as of the most recent month end, please refer to www.eatonvance.com.
Top Ten Common Stock Holdings†
By net assets | | | |
NII Holdings Inc. | | 5.1 | % |
Google Inc. | | 4.3 | |
MEMC Electronic Materials Inc. | | 3.4 | |
Shire PLC (ADS) | | 3.4 | |
Foster Wheeler Ltd. | | 3.2 | |
Celgene Corp. | | 3.1 | |
E*TRADE Financial Corp. | | 3.1 | |
Research In Motion Ltd. | | 3.1 | |
W&T Offshore Inc. | | 3.1 | |
SXR Uranium One Inc. | | 3.0 | |
†Top Ten Holdings represented 34.8% of Portfolio net assets as of October 31, 2006. Holdings are subject to change due to active management.
Comparison of Change in Value of a $10,000 Investment in Eaton Vance
Tax-Managed Multi-Cap Fund Class A vs. the Standard & Poor’s 500 Index**
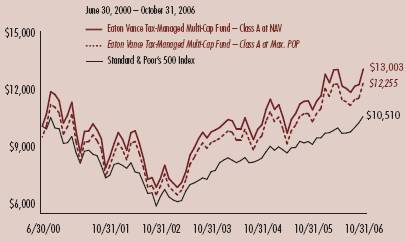
**Source: Thomson Financial. Class A of the Fund commenced investment operations on June 30, 2000.
A $10,000 hypothetical investment on 7/10/00 (inception date) at net asset value in Class B shares and Class C shares would have been valued at $12,321 and $12,341, respectively, on 10/31/06. It is not possible to invest directly in an Index. The Index’s total returns do not reflect commissions or expenses that would have been incurred if an investor individually purchased or sold the securities represented in the Index.
Common Stock Investments by Sector††
By net assets
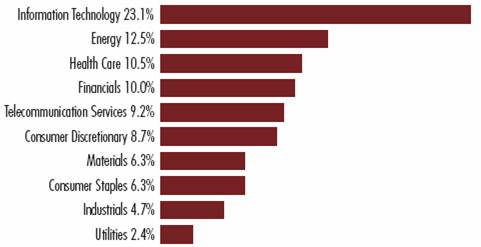
††As a percentage of the Portfolio’s net assets as of 10/31/06. Portfolio information may not be representative of the Portfolio’s current or future investments and may change due to active management.
2
“Return Before Taxes” does not take into consideration shareholder taxes. It is most relevant to tax-free or tax-deferred shareholder accounts. “Return After Taxes on Distributions” reflects the impact of federal income taxes due on Fund distributions of dividends and capital gains. It is most relevant to taxpaying shareholders who continue to hold their shares. “Return After Taxes on Distributions and Sale of Fund Shares” also reflects the impact of taxes on capital gain or loss realized upon a sale of shares. It is most relevant to taxpaying shareholders who sell their shares.
Average Annual Total Returns
(For the periods ended October 31, 2006)
Returns at Net Asset Value (NAV) (Class A)
| | One Year | | 5 Years | | Life of Fund | |
Return Before Taxes | | 19.84 | % | 9.18 | % | 4.23 | % |
Return After Taxes on Distributions | | 19.49 | % | 9.12 | % | 4.18 | % |
Return After Taxes on Distributions and Sale of Fund Shares | | 13.29 | % | 7.98 | % | 3.64 | % |
Returns at Public Offering Price (POP) (Class A)
| | One Year | | 5 Years | | Life of Fund | |
Return Before Taxes | | 12.97 | % | 7.90 | % | 3.26 | % |
Return After Taxes on Distributions | | 12.64 | % | 7.84 | % | 3.21 | % |
Return After Taxes on Distributions and Sale of Fund Shares | | 8.80 | % | 6.84 | % | 2.79 | % |
Average Annual Total Returns
(For the periods ended October 31, 2006)
Returns at Net Asset Value (NAV) (Class C)
| | One Year | | 5 Years | | Life of Fund | |
Return Before Taxes | | 19.01 | % | 8.34 | % | 3.39 | % |
Return After Taxes on Distributions | | 18.64 | % | 8.27 | % | 3.34 | % |
Return After Taxes on Distributions and Sale of Fund Shares | | 12.76 | % | 7.23 | % | 2.91 | % |
Returns at Public Offering Price (POP) (Class C)
| | One Year | | 5 Years | | Life of Fund | |
Return Before Taxes | | 18.01 | % | 8.34 | % | 3.39 | % |
Return After Taxes on Distributions | | 17.64 | % | 8.27 | % | 3.34 | % |
Return After Taxes on Distributions and Sale of Fund Shares | | 12.11 | % | 7.23 | % | 2.91 | % |
Average Annual Total Returns
(For the periods ended October 31, 2006)
Returns at Net Asset Value (NAV) (Class B)
| | One Year | | 5 Years | | Life of Fund | |
Return Before Taxes | | 19.04 | % | 8.33 | % | 3.36 | % |
Return After Taxes on Distributions | | 18.68 | % | 8.26 | % | 3.31 | % |
Return After Taxes on Distributions and Sale of Fund Shares | | 12.79 | % | 7.22 | % | 2.88 | % |
Returns at Public Offering Price (POP) (Class B)
| | One Year | | 5 Years | | Life of Fund | |
Return Before Taxes | | 14.04 | % | 8.03 | % | 3.36 | % |
Return After Taxes on Distributions | | 13.68 | % | 7.97 | % | 3.31 | % |
Return After Taxes on Distributions and Sale of Fund Shares | | 9.54 | % | 6.96 | % | 2.88 | % |
Class A of the Fund commenced investment operations on 6/30/00. Class B and Class C of the Fund commenced investment operations on 7/10/00. Returns at Public Offering Price (POP) reflect the deduction of the maximum initial sales charge and applicable CDSC, while Returns at Net Asset Value (NAV) do not.
After-tax returns are calculated using the highest historical individual federal income tax rate and do not reflect the impact of state and local taxes. Actual after-tax returns depend on a shareholder’s tax situation and may differ from those shown. After-tax returns are not relevant for shareholders who hold Fund shares in tax-deferred accounts or to shares held by non-taxable entities. Return After Taxes on Distributions for a period may be the same as Return Before Taxes for that period because no distributions were paid during that period, or because the taxable portion of distributions made during the period was insignificant. Also, Return After Taxes on Distributions and Sale of Fund Shares for a period may be greater than Return After Taxes on Distributions for the same period because of realized losses on the sale of Fund shares.
Past performance is no guarantee of future results. Returns are historical and are calculated by determining the percentage change in net asset value or offering price (as applicable) with all distributions reinvested. Investment return and principal value will fluctuate so that shares, when redeemed, may be worth more or less than their original cost. Performance is for the stated time period only; due to market volatility, the Fund’s current performance may be lower or higher than the quoted return. For performance as of the most recent month-end, please refer to www.eatonvance.com.
3
Eaton Vance Tax-Managed Multi-Cap Opportunity Fund as of October 31, 2006
FUND EXPENSES
Example: As a shareholder of the Fund, you incur two types of costs: (1) transaction costs, including sales charges (loads) on purchases and redemption fees (if applicable); and (2) ongoing costs, including management fees; distribution or service fees; and other Fund expenses. This Example is intended to help you understand your ongoing costs (in dollars) of investing in the Fund and to compare these costs with the ongoing costs of investing in other mutual funds. The Example is based on an investment of $1,000 invested at the beginning of the period and held for the entire period (May 1, 2006 – October 31, 2006).
Actual Expenses: The first section of the table below provides information about actual account values and actual expenses. You may use the information in this section, together with the amount you invested, to estimate the expenses that you paid over the period. Simply divide your account value by $1,000 (for example, an $8,600 account value divided by $1,000 = 8.6), then multiply the result by the number in the first section under the heading entitled "Expenses Paid During Period" to estimate the expenses you paid on your account during this period.
Hypothetical Example for Comparison Purposes: The second section of the table below provides information about hypothetical account values and hypothetical expenses based on the actual Fund expense ratio and an assumed rate of return of 5% per year (before expenses), which is not the actual return of the Fund. The hypothetical account values and expenses may not be used to estimate the actual ending account balance or expenses you paid for the period. You may use this information to compare the ongoing costs of investing in your Fund and other funds. To do so, compare this 5% hypothetical example with the 5% hypothetical examples that appear in the shareholder reports of the other funds.
Please note that the expenses shown in the table are meant to highlight your ongoing costs only and do not reflect any transactional costs, such as sales charges (loads) or redemption fees (if applicable). Therefore, the second section of the table is useful in comparing ongoing costs only, and will not help you determine the relative total costs of owning different funds. In addition, if these transactional costs were included, your costs would have been higher.
Eaton Vance Tax-Managed Multi-Cap Opportunity Fund
| | | Beginning Account Value
(5/1/06) | | Ending Account Value
(10/31/06) | | Expenses Paid During Period*
(5/1/06 – 10/31/06) | |
| Actual | |
| Class A | | $ | 1,000.00 | | | $ | 1,002.40 | | | $ | 7.47 | | |
| Class B | | $ | 1,000.00 | | | $ | 999.20 | | | $ | 11.24 | | |
| Class C | | $ | 1,000.00 | | | $ | 999.20 | | | $ | 11.24 | | |
| Hypothetical | |
| (5% return per year before expenses) | |
| Class A | | $ | 1,000.00 | | | $ | 1,017.70 | | | $ | 7.53 | | |
| Class B | | $ | 1,000.00 | | | $ | 1,014.00 | | | $ | 11.32 | | |
| Class C | | $ | 1,000.00 | | | $ | 1,014.00 | | | $ | 11.32 | | |
* Expenses are equal to the Fund's annualized expense ratio of 1.48% for Class A shares, 2.23% for Class B shares, and 2.23% for Class C shares, multiplied by the average account value over the period, multiplied by 184/365 (to reflect the one-half year period). The Example assumes that the $1,000 was invested at the net asset value per share determined at the close of business on April 30, 2006. The Example reflects the expenses of both the Fund and the Portfolio.
4
Eaton Vance Tax-Managed Multi-Cap Opportunity Fund as of October 31, 2006
FINANCIAL STATEMENTS
Statement of Assets and Liabilities
As of October 31, 2006
| Assets | |
Investment in Tax-Managed Multi-Cap Opportunity Portfolio, at value
(identified cost, $45,330,317) | | $ | 61,655,312 | | |
| Receivable for Fund shares sold | | | 97,738 | | |
| Total assets | | $ | 61,753,050 | | |
| Liabilities | |
| Payable for Fund shares redeemed | | $ | 82,110 | | |
| Payable to affiliate for distribution and service fees | | | 34,861 | | |
| Payable to affiliate for Administration fees | | | 7,567 | | |
| Payable to affiliate for Trustees' fees | | | 151 | | |
| Accrued expenses | | | 47,890 | | |
| Total liabilities | | $ | 172,579 | | |
| Net Assets | | $ | 61,580,471 | | |
| Sources of Net Assets | |
| Paid-in capital | | $ | 44,151,597 | | |
Undistributed net realized gain from Portfolio (computed on
the basis of identified cost) | | | 1,103,879 | | |
Net unrealized appreciation from Portfolio (computed on the basis of
identified cost) | | | 16,324,995 | | |
| Total | | $ | 61,580,471 | | |
| Class A Shares | |
| Net Assets | | $ | 25,559,375 | | |
| Shares Outstanding | | | 2,004,618 | | |
Net Asset Value and Redemption Price Per Share
(net assets ÷ shares of beneficial interest outstanding) | | $ | 12.75 | | |
Maximum Offering Price Per Share
(100 ÷ 94.25 of $12.75) | | $ | 13.53 | | |
| Class B Shares | |
| Net Assets | | $ | 17,797,097 | | |
| Shares Outstanding | | | 1,474,630 | | |
Net Asset Value, Offering Price and Redemption Price Per Share
(net assets ÷ shares of beneficial interest outstanding) | | $ | 12.07 | | |
| Class C Shares | |
| Net Assets | | $ | 18,223,999 | | |
| Shares Outstanding | | | 1,507,338 | | |
Net Asset Value, Offering Price and Redemption Price Per Share
(net assets ÷ shares of beneficial interest outstanding) | | $ | 12.09 | | |
Statement of Operations
For the Year Ended
October 31, 2006
| Investment Income | |
| Dividends allocated from Portfolio (net of foreign taxes, $7,859) | | $ | 656,809 | | |
| Interest allocated from Portfolio | | | 128,372 | | |
| Security lending income allocated from Portfolio, net | | | 37,962 | | |
| Expenses allocated from Portfolio | | | (460,728 | ) | |
| Net investment income from Portfolio | | $ | 362,415 | | |
| Expenses | |
| Administration fee | | $ | 91,024 | | |
| Trustees' fees and expenses | | | 1,721 | | |
Distribution and service fees
Class A | | | 59,844 | | |
| Class B | | | 187,049 | | |
| Class C | | | 180,673 | | |
| Transfer and dividend disbursing agent fees | | | 95,302 | | |
| Registration fees | | | 46,594 | | |
| Legal and accounting services | | | 20,456 | | |
| Custodian fee | | | 16,454 | | |
| Printing and postage | | | 16,016 | | |
| Miscellaneous | | | 4,222 | | |
| Total expenses | | $ | 719,355 | | |
| Net investment loss | | $ | (356,940 | ) | |
Realized and Unrealized
Gain (Loss) from Portfolio | |
Net realized gain (loss) —
Investment transactions (identified cost basis) | | $ | 2,688,712 | | |
| Securities sold short | | | (635,832 | ) | |
| Foreign currency transactions | | | (5,846 | ) | |
| Net realized gain | | $ | 2,047,034 | | |
Change in unrealized appreciation (depreciation) —
Investments (identified cost basis) | | $ | 8,246,436 | | |
| Securities sold short | | | 612,325 | | |
| Foreign currency | | | 135 | | |
| Net change in unrealized appreciation (depreciation) | | $ | 8,858,896 | | |
| Net realized and unrealized gain | | $ | 10,905,930 | | |
| Net increase in net assets from operations | | $ | 10,548,990 | | |
See notes to financial statements
5
Eaton Vance Tax-Managed Multi-Cap Opportunity Fund as of October 31, 2006
FINANCIAL STATEMENTS CONT'D
Statements of Changes in Net Assets
Increase (Decrease)
in Net Assets | | Year Ended
October 31, 2006 | | Year Ended
October 31, 2005 | |
From operations —
Net investment loss | | $ | (356,940 | ) | | $ | (711,852 | ) | |
Net realized gain from investment
transactions, securities sold short,
and foreign currency transactions | | | 2,047,034 | | | | 7,207,449 | | |
Net change in unrealized appreciation
(depreciation) from investments,
and securities sold short | | | 8,858,896 | | | | (2,037,904 | ) | |
| Net increase in net assets from operations | | $ | 10,548,990 | | | $ | 4,457,693 | | |
Distributions to shareholders —
From net realized gain
Class A | | $ | (447,887 | ) | | $ | — | | |
| Class B | | | (395,639 | ) | | | — | | |
| Class C | | | (366,402 | ) | | | — | | |
| Total distributions to shareholders | | $ | (1,209,928 | ) | | $ | — | | |
Transactions in shares of beneficial interest —
Proceeds from sale of shares
Class A | | $ | 3,970,806 | | | $ | 3,522,643 | | |
| Class B | | | 898,574 | | | | 1,272,535 | | |
| Class C | | | 1,548,690 | | | | 1,718,654 | | |
Net asset value of shares issued to
shareholders in payment of
distributions declared
Class A | | | 398,777 | | | | — | | |
| Class B | | | 337,218 | | | | — | | |
| Class C | | | 287,811 | | | | — | | |
Cost of shares redeemed
Class A | | | (5,412,727 | ) | | | (7,004,334 | ) | |
| Class B | | | (4,094,237 | ) | | | (4,757,175 | ) | |
| Class C | | | (3,402,799 | ) | | | (4,263,188 | ) | |
Net asset value of shares exchanged
Class A | | | 827,803 | | | | 209,697 | | |
| Class B | | | (827,803 | ) | | | (209,697 | ) | |
Net decrease in net assets from
Fund share transactions | | $ | (5,467,887 | ) | | $ | (9,510,865 | ) | |
| Net increase (decrease) in net assets | | $ | 3,871,175 | | | $ | (5,053,172 | ) | |
| Net Assets | |
| At beginning of year | | $ | 57,709,296 | | | $ | 62,762,468 | | |
| At end of year | | $ | 61,580,471 | | | $ | 57,709,296 | | |
See notes to financial statements
6
Eaton Vance Tax-Managed Multi-Cap Opportunity Fund as of October 31, 2006
FINANCIAL STATEMENTS CONT'D
Financial Highlights
| | | Class A | |
| | | Year Ended October 31, | |
| | | 2006(1) | | 2005(1) | | 2004(1) | | 2003(1) | | 2002(1) | |
| Net asset value — Beginning of year | | $ | 10.850 | | | $ | 10.060 | | | $ | 9.690 | | | $ | 7.250 | | | $ | 8.380 | | |
| Income (loss) from operations | |
| Net investment loss | | $ | (0.019 | ) | | $ | (0.072 | ) | | $ | (0.083 | ) | | $ | (0.116 | ) | | $ | (0.114 | ) | |
| Net realized and unrealized gain (loss) | | | 2.144 | | | | 0.862 | | | | 0.453 | | | | 2.556 | | | | (1.016 | ) | |
| Total income (loss) from operations | | $ | 2.125 | | | $ | 0.790 | | | $ | 0.370 | | | $ | 2.440 | | | $ | (1.130 | ) | |
| Less distributions | |
| From net realized gain | | $ | (0.225 | ) | | $ | — | | | $ | — | | | $ | — | | | $ | — | | |
| Total distributions | | $ | (0.225 | ) | | $ | — | | | $ | — | | | $ | — | | | $ | — | | |
| Net asset value — End of year | | $ | 12.750 | | | $ | 10.850 | | | $ | 10.060 | | | $ | 9.690 | | | $ | 7.250 | | |
| Total Return(2) | | | 19.84 | % | | | 7.85 | % | | | 3.82 | % | | | 33.66 | % | | | (13.48 | )% | |
| Ratios/Supplemental Data | |
| Net assets, end of year (000's omitted) | | $ | 25,559 | | | $ | 21,998 | | | $ | 23,462 | | | $ | 19,884 | | | $ | 14,289 | | |
| Ratios (As a percentage of average daily net assets): | |
| Expenses before custodian fee reduction(3) | | | 1.49 | % | | | 1.55 | % | | | 1.52 | % | | | 1.66 | % | | | 1.60 | % | |
| Expenses after custodian fee reduction(3) | | | 1.49 | % | | | 1.55 | % | | | 1.52 | % | | | 1.66 | % | | | 1.60 | % | |
| Net investment loss | | | (0.16 | )% | | | (0.67 | )% | | | (0.84 | )% | | | (1.42 | )% | | | (1.35 | )% | |
| Portfolio Turnover | | | 181 | % | | | 217 | % | | | 239 | % | | | 224 | % | | | 225 | % | |
(1) Net investment income (loss) per share was computed using average shares outstanding.
(2) Returns are historical and are calculated by determining the percentage change in net asset value with all distributions reinvested. Total return is not computed on an annualized basis.
(3) Includes the Fund's share of the Portfolio's allocated expenses. The Portfolio's advisor voluntarily waived a portion of its investment advisory fee (equal to 0.01%, 0.01%, and 0.07% of average net assets for 2006, 2004, and 2002, respectively).
See notes to financial statements
7
Eaton Vance Tax-Managed Multi-Cap Opportunity Fund as of October 31, 2006
FINANCIAL STATEMENTS CONT'D
Financial Highlights
| | | Class B | |
| | | Year Ended October 31, | |
| | | 2006(1) | | 2005(1) | | 2004(1) | | 2003(1) | | 2002(1) | |
| Net asset value — Beginning of year | | $ | 10.350 | | | $ | 9.680 | | | $ | 9.390 | | | $ | 7.080 | | | $ | 8.260 | | |
| Income (loss) from operations | |
| Net investment loss | | $ | (0.096 | ) | | $ | (0.146 | ) | | $ | (0.153 | ) | | $ | (0.173 | ) | | $ | (0.175 | ) | |
| Net realized and unrealized gain (loss) | | | 2.041 | | | | 0.816 | | | | 0.443 | | | | 2.483 | | | | (1.005 | ) | |
| Total income (loss) from operations | | $ | 1.945 | | | $ | 0.670 | | | $ | 0.290 | | | $ | 2.310 | | | $ | (1.180 | ) | |
| Less distributions | |
| From net realized gain | | $ | (0.225 | ) | | $ | — | | | $ | — | | | $ | — | | | $ | — | | |
| Total distributions | | $ | (0.225 | ) | | $ | — | | | $ | — | | | $ | — | | | $ | — | | |
| Net asset value — End of year | | $ | 12.070 | | | $ | 10.350 | | | $ | 9.680 | | | $ | 9.390 | | | $ | 7.080 | | |
| Total Return(2) | | | 19.04 | % | | | 6.92 | % | | | 3.09 | % | | | 32.63 | % | | | (14.29 | )% | |
| Ratios/Supplemental Data | |
| Net assets, end of year (000's omitted) | | $ | 17,797 | | | $ | 18,653 | | | $ | 20,928 | | | $ | 20,868 | | | $ | 11,939 | | |
| Ratios (As a percentage of average daily net assets): | |
| Expenses before custodian fee reduction(3) | | | 2.24 | % | | | 2.30 | % | | | 2.27 | % | | | 2.41 | % | | | 2.35 | % | |
| Expenses after custodian fee reduction(3) | | | 2.24 | % | | | 2.30 | % | | | 2.27 | % | | | 2.41 | % | | | 2.35 | % | |
| Net investment loss | | | (0.85 | )% | | | (1.42 | )% | | | (1.60 | )% | | | (2.16 | )% | | | (2.10 | )% | |
| Portfolio Turnover | | | 181 | % | | | 217 | % | | | 239 | % | | | 224 | % | | | 225 | % | |
(1) Net investment loss per share was computed using average shares outstanding.
(2) Returns are historical and are calculated by determining the percentage change in net asset value with all distributions reinvested. Total return is not computed on an annualized basis.
(3) Includes the Fund's share of the Portfolio's allocated expenses. The Portfolio's advisor voluntarily waived a portion of its investment advisory fee (equal to 0.01%, 0.01%, and 0.07% of average net assets for 2006, 2004, and 2002, respectively).
See notes to financial statements
8
Eaton Vance Tax-Managed Multi-Cap Opportunity Fund as of October 31, 2006
FINANCIAL STATEMENTS CONT'D
Financial Highlights
| | | Class C | |
| | | Year Ended October 31, | |
| | | 2006(1) | | 2005(1) | | 2004(1) | | 2003(1) | | 2002(1) | |
| Net asset value — Beginning of year | | $ | 10.370 | | | $ | 9.700 | | | $ | 9.410 | | | $ | 7.090 | | | $ | 8.270 | | |
| Income (loss) from operations | |
| Net investment loss | | $ | (0.100 | ) | | $ | (0.146 | ) | | $ | (0.151 | ) | | $ | (0.172 | ) | | $ | (0.175 | ) | |
| Net realized and unrealized gain (loss) | | | 2.045 | | | | 0.816 | | | | 0.441 | | | | 2.492 | | | | (1.005 | ) | |
| Total income (loss) from operations | | $ | 1.945 | | | $ | 0.670 | | | $ | 0.290 | | | $ | 2.320 | | | $ | (1.180 | ) | |
| Less distributions | |
| From net realized gain | | $ | (0.225 | ) | | $ | — | | | $ | — | | | $ | — | | | $ | — | | |
| Total distributions | | $ | (0.225 | ) | | $ | — | | | $ | — | | | $ | — | | | $ | — | | |
| Net asset value — End of year | | $ | 12.090 | | | $ | 10.370 | | | $ | 9.700 | | | $ | 9.410 | | | $ | 7.090 | | |
| Total Return(2) | | | 19.01 | % | | | 6.91 | % | | | 3.08 | % | | | 32.72 | % | | | (14.27 | )% | |
| Ratios/Supplemental Data | |
| Net assets, end of year (000's omitted) | | $ | 18,224 | | | $ | 17,058 | | | $ | 18,373 | | | $ | 15,902 | | | $ | 11,432 | | |
| Ratios (As a percentage of average daily net assets): | |
| Expenses before custodian fee reduction(3) | | | 2.24 | % | | | 2.30 | % | | | 2.27 | % | | | 2.41 | % | | | 2.35 | % | |
| Expenses after custodian fee reduction(3) | | | 2.24 | % | | | 2.30 | % | | | 2.27 | % | | | 2.41 | % | | | 2.35 | % | |
| Net investment loss | | | (0.89 | )% | | | (1.42 | )% | | | (1.57 | )% | | | (2.16 | )% | | | (2.10 | )% | |
| Portfolio Turnover | | | 181 | % | | | 217 | % | | | 239 | % | | | 224 | % | | | 225 | % | |
(1) Net investment loss per share was computed using average shares outstanding.
(2) Returns are historical and are calculated by determining the percentage change in net asset value with all distributions reinvested. Total return is not computed on an annualized basis.
(3) Includes the Fund's share of the Portfolio's allocated expenses. The Portfolio's advisor voluntarily waived a portion of its investment advisory fee (equal to 0.01%, 0.01%, and 0.07% of average net assets for 2006, 2004, and 2002, respectively).
See notes to financial statements
9
Eaton Vance Tax-Managed Multi-Cap Opportunity Fund as of October 31, 2006
NOTES TO FINANCIAL STATEMENTS
1 Significant Accounting Policies
Eaton Vance Tax-Managed Multi-Cap Opportunity Fund (the Fund) is a diversified series of Eaton Vance Mutual Funds Trust (the Trust). The Trust is an entity of the type commonly known as a Massachusetts business trust and is registered under the Investment Company Act of 1940, as amended, as an open-end management investment company. The Fund currently offers three classes of shares. Class A shares are generally sold subject to a sales charge imposed at time of purchase. Class B and Class C shares are sold at net asset value and are subject to a contingent deferred sales charge (see Note 6). Class B shares held for eight years will automatically convert to Class A shares. Each class represents a pro rata interest in the Fund, but votes separately on class-specific matters and (as noted below) is subject to different expenses. Realized and unrealized gains and losses and net investment income, other than class-specific expenses, a re allocated daily to each class of shares based on the relative net assets of each class to the total net assets of the Fund. Each class of shares differs in its distribution plan and certain other class-specific expenses. The Fund invests all of its investable assets in interests in the Tax-Managed Multi-Cap Opportunity Portfolio (the Portfolio), a New York Trust, having the same investment objective as the Fund. The value of the Fund's investment in the Portfolio reflects the Fund's proportionate interest in the net assets of the Portfolio (40.9%) at October 31, 2006. The performance of the Fund is directly affected by the performance of the Portfolio. The financial statements of the Portfolio, including the portfolio of investments, are included elsewhere in this report and should be read in conjunction with the Fund's financial statements.
The following is a summary of significant accounting policies consistently followed by the Fund in the preparation of its financial statements. The policies are in conformity with accounting principles generally accepted in the United States of America.
A Investment Valuation — Valuation of securities by the Portfolio is discussed in Note 1A of the Portfolio's Notes to Financial Statements, which are included elsewhere in this report.
B Income — The Fund's net investment income or loss consists of the Fund's pro rata share of the net investment income or loss of the Portfolio, less all actual and accrued expenses of the Fund.
C Federal Taxes — The Fund's policy is to comply with the provisions of the Internal Revenue Code applicable to regulated investment companies and to distribute to shareholders, each year, substantially all of its net investment income and all or substantially all of its net realized capital gains. Accordingly, no provision for federal income or excise tax is necessary.
D Expense Reduction — Investors Bank & Trust Company (IBT) serves as custodian of the Fund. Pursuant to the custodian agreement, IBT receives a fee reduced by credits which are determined based on the average daily cash balance the Fund maintains with IBT. All credit balances used to reduce the Fund's custodian fees are reported as a reduction of expenses in the Statement of Operations.
E Indemnifications — Under the Trust's organizational documents, its officers and Trustees may be indemnified against certain liabilities and expenses arising out of the performance of their duties to the Fund and shareholders are indemnified against personal liability for obligations of the Trust. Additionally, in the normal course of business, the Fund enters into agreements with service providers that may contain indemnification clauses. The Fund's maximum exposure under these arrangements is unknown as this would involve future claims that may be made against the Fund that have not yet occurred.
F Other — Investment transactions are accounted for on the date the securities are purchased or sold. Dividends to shareholders are recorded on the ex-dividend date.
G Use of Estimates — The preparation of the financial statements in conformity with accounting principles generally accepted in the United States of America requires management to make estimates and assumptions that affect the reported amounts of assets and liabilities at the date of the financial statements and the reported amounts of income and expense during the reporting period. Actual results could differ from those estimates.
H Expenses — The majority of expenses of the Trust are directly identifiable to an individual fund. Expenses which are not readily identifiable to a specific fund are allocated taking into consideration, among other things, the nature and type of expense and the relative size of the funds.
2 Distributions to Shareholders
It is the present policy of the Fund to make at least one distribution annually (normally in December) of all or substantially all of its net investment income and at least one distribution of all or substantially all of its net realized capital gains (reduced by available capital loss carryforwards from prior years, if any). Distributions are declared
10
Eaton Vance Tax-Managed Multi-Cap Opportunity Fund as of October 31, 2006
NOTES TO FINANCIAL STATEMENTS CONT'D
separately for each class of shares. Shareholders may reinvest income and capital gain distributions in additional shares of the same class of the Fund at the net asset value as of the ex-dividend date. Distributions are paid in the form of additional shares of the same class of the Fund or, at the election of the shareholder, in cash. The Fund distinguishes between distributions on a tax basis and those on a financial reporting basis. Accounting principles generally accepted in the United States of America require that only distributions in excess of tax basis earnings and profits be reported in the financial statements as a return of capital. Permanent differences between book and tax accounting relating to distributions are reclassified to paid-in capital.
The tax character of distributions paid for the years ended October 31, 2006 and October 31, 2005 were as follows:
| | | Year ended October 31, | |
| | | 2006 | | 2005 | |
| Distributions declared from: | |
| Long-Term Capital Gains Distribution | | $ | 1,209,928 | | | $ | — | | |
During the year ended October 31, 2006, accumulated paid-in capital was decreased by $362,233, net investment loss was increased by $356,940, and undistributed net realized gain was increased by $5,293 primarily due to differences between book and tax accounting for net operating losses. This change had no effect on the net assets or the net asset value per share.
As of October 31, 2006, the components of distributable earnings on a tax basis were as follows:
| Undistributed net realized gain | | $ | 1,247,898 | | |
| Unrealized gain | | $ | 16,180,976 | | |
3 Shares of Beneficial Interest
The Fund's Declaration of Trust permits the Trustees to issue an unlimited number of full and fractional shares of beneficial interest (without par value). Such shares may be issued in a number of different series (such as the Fund) and classes. Transactions in Fund shares were as follows:
| | | Year Ended October 31, | |
| Class A | | 2006 | | 2005 | |
| Sales | | | 329,204 | | | | 327,726 | | |
Issued to shareholders electing to
receive payments of distributions
in Fund shares | | | 35,104 | | | | — | | |
| Redemptions | | | (457,212 | ) | | | (650,284 | ) | |
| Exchange from Class B shares | | | 69,376 | | | | 19,670 | | |
| Net decrease | | | (23,528 | ) | | | (302,888 | ) | |
| | | Year Ended October 31, | |
| Class B | | 2006 | | 2005 | |
| Sales | | | 78,552 | | | | 122,117 | | |
Issued to shareholders electing to
receive payments of distributions
in Fund shares | | | 31,138 | | | | — | | |
| Redemptions | | | (363,548 | ) | | | (461,850 | ) | |
| Exchange to Class A shares | | | (73,046 | ) | | | (20,534 | ) | |
| Net decrease | | | (326,904 | ) | | | (360,267 | ) | |
| | | Year Ended October 31, | |
| Class C | | 2006 | | 2005 | |
| Sales | | | 137,125 | | | | 165,013 | | |
Issued to shareholders electing to
receive payments of distributions
in Fund shares | | | 26,551 | | | | — | | |
| Redemptions | | | (301,010 | ) | | | (415,103 | ) | |
| Net decrease | | | (137,334 | ) | | | (250,090 | ) | |
4 Transactions with Affiliates
The administration fee is earned by Eaton Vance Management (EVM) as compensation for managing and administering the business affairs of the Fund. Under the administration agreement, EVM earns a fee in the amount of 0.15% per annum of average daily net assets of the Fund. For the year ended October 31, 2006, the administration fee amounted to $91,024. The Portfolio has engaged Boston Management and Research (BMR), a subsidiary of EVM, to render investment advisory services. See Note 2 of the Portfolio's Notes to Financial Statements which are included elsewhere in this report. Except as to Trustees of the Fund and the Portfolio who are not members of EVM's or BMR's organization, officers and Trustees receive remuneration for their services to the Fund out of the investment adviser fee earned by BMR. EVM serves as the sub-transfer agent of the Fund and receives from the transfer agent an aggregate fee based upon the actual expense s incurred by EVM in the performance of those services. During the year ended October 31, 2006 EVM received $6,840 in sub-transfer agent fees. The Fund was informed that Eaton Vance Distributors, Inc. (EVD), a subsidiary of EVM and the Fund's principal underwriter, received $10,729 as its portion of the sales charge on sales of Class A shares for the year ended October 31, 2006. Certain officers and Trustees of the Fund and Portfolio are officers of the above organizations.
11
Eaton Vance Tax-Managed Multi-Cap Opportunity Fund as of October 31, 2006
NOTES TO FINANCIAL STATEMENTS CONT'D
5 Distribution Plans
Class A has in effect a distribution plan pursuant to Rule 12b-1 under the Investment Company Act of 1940 (Class A Plan). The Class A Plan provides that the Fund will pay EVD a distribution and service fee of 0.25% of the Fund's average daily net assets attributable to Class A shares for each fiscal year for distribution services and facilities provided to the Fund by EVD, as well as for personal services and/or the maintenance of shareholder accounts. Distribution and service fees paid or accrued for the year ended October 31, 2006 amounted to $59,844 for Class A shares. The Fund also has in effect distribution plans for Class B shares (Class B Plan) and Class C shares (Class C Plan) pursuant to Rule 12b-1 under the Investment Company Act of 1940 (collectively, the Plans). The Class B and Class C Plans require the Fund to pay EVD amounts equal to 1/365 of 0.75% (annualized) of the Fund's average daily net assets attributable to Class B and Class C shares, for providing ongoing distribution services and facilities to the Fund. The Fund will automatically discontinue payments to EVD during any period in which there are no outstanding Uncovered Distribution Charges, which are equivalent to the sum of (i) 6.25% of the aggregate amount received by the Fund for the Class B and Class C shares sold, plus (ii) interest calculated by applying the rate of 1% over the prevailing prime rate to the outstanding balance of Uncovered Distribution Charges of EVD, of each respective class, reduced by the aggregate amount of contingent deferred sales charges (see Note 6) and daily amounts theretofore paid to EVD by each respective class. The Fund paid or accrued $140,081 and $135,505 for Class B and Class C shares, respectively, to or payable to EVD for the year ended October 31, 2006, representing 0.75% (annualized) of the average daily net assets for Class B and Class C shares. At October 31, 2006, the amount of Uncovered Distribution Charges of EV D calculated under the Plans was approximately $645,000 and $950,000 for Class B and Class C shares, respectively. The Class B and Class C Plans also authorize the Fund to make payments of service fees to EVD, investment dealers and other persons in amounts not exceeding 0.25% annually of the average daily net assets attributable to that Class. Service fees are paid for personal services and/or the maintenance of shareholder accounts. They are separate and distinct from the Class B and Class C sales commissions and distribution fees and, as such, are not subject to automatic discontinuance when there are no outstanding Uncovered Distribution Charges to EVD. Service fees paid or accrued for the year ended October 31, 2006 amounted to $46,968 and $45,168, for Class B and Class C shares, respectively.
6 Contingent Deferred Sales Charge
A contingent deferred sales charge (CDSC) generally is imposed on redemptions of Class B shares made within six years of purchase and on redemptions of Class C shares made within one year of purchase. Prior to September 15, 2006, Class A shares purchased at net asset value in amounts of $1 million or more (other than shares purchased in a single transaction of $5 million or more) were subject to a 1% CDSC if redeemed within one year of purchase. Effective September 15, 2006, all purchases of Class A shares of $1 million or more will be subject to a 1% CDSC in the event of redemption within 18 months of purchase. Generally, the CDSC is based upon the lower of the net asset value at date of redemption or date of purchase. No charge is levied on shares acquired by reinvestment of dividends or capital gain distributions. The Class B CDSC is imposed at declining rates that begin at 5% in the first and second year of redemption after purchase, declining one percentage point in each subsequent year. Class C shares will be subject to a 1% CDSC if redeemed within one year of purchase. No CDSC is levied on shares which have been sold to EVM or its affiliates or to their respective employees or clients and may be waived under certain other limited conditions. CDSC charges received on Class B and Class C redemptions are paid to EVD to reduce the amount of Uncovered Distribution Charges calculated under the Class B and Class C Plans, respectively (see Note 5). CDSC charges received on Class B and Class C redemptions when no Uncovered Distribution Charges exist for the respective classes will be credited to the Fund. EVD received approximately $0, $32,000 and $1,000 of CDSC paid by shareholders for Class A, Class B and Class C shares, respectively, for the year ended October 31, 2006.
7 Investment Transactions
Increases and decreases in the Fund's investment in the Portfolio for the year ended October 31, 2006, aggregated $6,329,566 and $13,870,225, respectively.
8 Recently Issued Accounting Pronouncements
In June 2006, the Financial Accounting Standards Board ("FASB") issued FASB Interpretation No. 48, ("FIN 48") "Accounting for Uncertainty in Income Taxes – an interpretation of FASB Statement No. 109". FIN 48 clarifies the accounting for uncertainty in income taxes recognized in accordance with FASB Statement No. 109, "Accounting for Income Taxes." This interpretation prescribes a recognition threshold and measurement attribute for the financial statement recognition and measurement of a tax position taken or expected to be taken in a tax return. It also provides
12
Eaton Vance Tax-Managed Multi-Cap Opportunity Fund as of October 31, 2006
NOTES TO FINANCIAL STATEMENTS CONT'D
guidance on de-recognition, classification, interest and penalties, accounting in interim periods, disclosure and transition. FIN 48 is effective for fiscal years beginning after December 15, 2006. Management is currently evaluating the impact of applying the various provisions of FIN 48.
In September 2006, the Financial Accounting Standards Board ("FASB") issued Statement of Financial Accounting Standards No. 157, ("FAS 157") "Fair Value Measurements". FAS 157 defines fair value, establishes a framework for measuring fair value in accordance with generally accepted accounting principles and expands disclosure about fair value measurements. FAS 157 is effective for fiscal years beginning after November 15, 2007. Management is currently evaluating the impact the adoption of FAS 157 will have on the Fund's financial statement disclosures.
13
Eaton Vance Tax-Managed Multi-Cap Opportunity Fund as of October 31, 2006
REPORT OF INDEPENDENT REGISTERED PUBLIC ACCOUNTING FIRM
To the Trustees of Eaton Vance Mutual Funds Trust and Shareholders of the Eaton Vance Tax-Managed Multi-Cap Opportunity Fund:
We have audited the accompanying statement of assets and liabilities of Eaton Vance Tax-Managed Multi-Cap Opportunity Fund (the "Fund") (one of the series of Eaton Vance Mutual Funds Trust) as of October 31, 2006 and the related statement of operations for the year then ended, the statements of changes in net assets for each of the two years in the period then ended, and the financial highlights for each of the five years in the period then ended. These financial statements and financial highlights are the responsibility of the Fund's management. Our responsibility is to express an opinion on these financial statements and financial highlights based on our audits.
We conducted our audits in accordance with the standards of the Public Company Accounting Oversight Board (United States). Those standards require that we plan and perform the audit to obtain reasonable assurance about whether the financial statements and financial highlights are free of material misstatement. The Fund is not required to have, nor were we engaged to perform, an audit of its internal control over financial reporting. Our audits included consideration of internal control over financial reporting as a basis for designing audit procedures that are appropriate in the circumstances, but not for the purpose of expressing an opinion on the effectiveness of the Fund's internal control over financial reporting. Accordingly, we express no such opinion. An audit also includes examining, on a test basis, evidence supporting the amounts and disclosures in the financial statements, assessing the accounting principles used and significant estimates made by management, as well as evaluating the overall financial statement presentation. We believe that our audits provide a reasonable basis for our opinion.
In our opinion, such financial statements and financial highlights referred to above present fairly, in all material respects, the financial position of Eaton Vance Tax-Managed Multi-Cap Opportunity Fund as of October 31, 2006, the results of its operations for the year ended, the changes in its net assets for each of the two years in the period then ended, and the financial highlights for each of the five years in the period then ended, in conformity with accounting principles generally accepted in the United States of America.
DELOITTE & TOUCHE LLP
Boston, Massachusetts
December 15, 2006
14
Tax-Managed Multi-Cap Opportunity Portfolio as of October 31, 2006
PORTFOLIO OF INVESTMENTS
| Common Stocks — 93.7% | |
| Security | | Shares | | Value | |
| Biotechnology — 3.4% | |
| Celgene Corp.(1)(2) | | | 88,000 | | | $ | 4,702,720 | | |
| Gilead Sciences, Inc.(1) | | | 6,500 | | | | 447,850 | | |
| | | $ | 5,150,570 | | |
| Building Products — 0.6% | |
| Goodman Global, Inc.(1) | | | 55,000 | | | $ | 883,850 | | |
| | | $ | 883,850 | | |
| Capital Markets — 5.2% | |
| E*Trade Financial Corp.(1) | | | 202,000 | | | $ | 4,702,560 | | |
| Goldman Sachs Group, Inc. | | | 8,800 | | | | 1,670,152 | | |
| TD Ameritrade Holding Corp. | | | 88,500 | | | | 1,457,595 | | |
| | | $ | 7,830,307 | | |
| Chemicals — 0.0% | |
| Potash Corporation of Saskatchewan, Inc.(2) | | | 500 | | | $ | 62,450 | | |
| | | $ | 62,450 | | |
| Commercial Services & Supplies — 0.6% | |
| Copart, Inc.(1) | | | 27,734 | | | $ | 802,345 | | |
| SAIC, Inc.(1) | | | 3,493 | | | | 69,860 | | |
| | | $ | 872,205 | | |
| Communications Equipment — 3.1% | |
| Research in Motion, Ltd.(1) | | | 40,155 | | | $ | 4,717,410 | | |
| | | $ | 4,717,410 | | |
| Computer Peripherals — 1.6% | |
| Apple Computer, Inc.(1) | | | 30,000 | | | $ | 2,432,400 | | |
| | | $ | 2,432,400 | | |
| Construction & Engineering — 3.2% | |
| Foster Wheeler, Ltd.(1) | | | 106,600 | | | $ | 4,791,670 | | |
| | | $ | 4,791,670 | | |
| Construction Materials — 0.7% | |
| Martin Marietta Materials, Inc. | | | 12,700 | | | $ | 1,117,600 | | |
| | | $ | 1,117,600 | | |
| Security | | Shares | | Value | |
| Consumer Finance — 1.0% | |
| First Marblehead Corp. (The)(2) | | | 22,500 | | | $ | 1,517,625 | | |
| | | $ | 1,517,625 | | |
| Containers & Packaging — 0.0% | |
| Owens-Illinois, Inc.(1) | | | 100 | | | $ | 1,660 | | |
| | | $ | 1,660 | | |
| Diversified Consumer Services — 1.3% | |
| Bright Horizons Family Solutions, Inc.(1) | | | 1,000 | | | $ | 38,420 | | |
| DeVry, Inc.(1)(2) | | | 71,000 | | | | 1,728,850 | | |
| Laureate Education, Inc.(1) | | | 3,466 | | | | 182,728 | | |
| | | $ | 1,949,998 | | |
| Electric Utilities — 0.4% | |
| British Energy Group PLC(1) | | | 71,000 | | | $ | 570,696 | | |
| | | $ | 570,696 | | |
| Food & Staples Retailing — 1.8% | |
| Shoppers Drug Mart Corp. | | | 33,000 | | | $ | 1,347,155 | | |
| Susser Holdings Corp.(1)(2) | | | 77,232 | | | | 1,405,622 | | |
| | | $ | 2,752,777 | | |
| Health Care Equipment & Supplies — 0.3% | |
| Thoratec Corp.(1) | | | 25,625 | | | $ | 403,594 | | |
| | | $ | 403,594 | | |
| Health Care Providers & Services — 3.4% | |
| Caremark Rx, Inc. | | | 56,000 | | | $ | 2,756,880 | | |
| DaVita, Inc.(1) | | | 16,075 | | | | 894,252 | | |
| Henry Schein, Inc.(1)(2) | | | 28,000 | | | | 1,391,320 | | |
| United Surgical Partners International, Inc.(1) | | | 150 | | | | 3,723 | | |
| | | $ | 5,046,175 | | |
| Hotels, Restaurants & Leisure — 1.1% | |
| Harrah's Entertainment, Inc. | | | 11,000 | | | $ | 817,630 | | |
| Pinnacle Entertainment, Inc.(1) | | | 26,500 | | | | 801,890 | | |
| | | $ | 1,619,520 | | |
| Household Durables — 1.0% | |
| Garmin, Ltd.(2) | | | 29,000 | | | $ | 1,548,890 | | |
| | | $ | 1,548,890 | | |
See notes to financial statements
15
Tax-Managed Multi-Cap Opportunity Portfolio as of October 31, 2006
PORTFOLIO OF INVESTMENTS CONT'D
| Security | | Shares | | Value | |
Independent Power Producers &
Energy Traders — 2.0% | |
| Dynegy, Inc., Class A(1) | | | 495,000 | | | $ | 3,009,600 | | |
| | | $ | 3,009,600 | | |
| Insurance — 1.9% | |
| Admiral Group PLC | | | 165,000 | | | $ | 2,919,609 | | |
| Progressive Corp. | | | 400 | | | | 9,668 | | |
| | | $ | 2,929,277 | | |
| Internet Software & Services — 5.5% | |
| DealerTrack Holdings, Inc.(1) | | | 32,500 | | | $ | 828,425 | | |
| Equinix, Inc.(1)(2) | | | 1,000 | | | | 68,400 | | |
| Google, Inc., Class A(1) | | | 13,442 | | | | 6,403,634 | | |
| WebEx Communications, Inc.(1)(2) | | | 26,000 | | | | 999,700 | | |
| | | $ | 8,300,159 | | |
| IT Services — 6.3% | |
| CheckFree Corp.(1)(2) | | | 28,604 | | | $ | 1,129,286 | | |
| ExlService Holdings, Inc.(1)(2) | | | 8,000 | | | | 166,400 | | |
| Gartner, Inc., Class A(1) | | | 110,000 | | | | 2,046,000 | | |
| MasterCard, Inc., Class A(2) | | | 35,000 | | | | 2,593,500 | | |
| MoneyGram International, Inc. | | | 102,996 | | | | 3,523,493 | | |
| WNS Holdings, Ltd. ADR(1) | | | 1,752 | | | | 52,122 | | |
| | | $ | 9,510,801 | | |
| Marine — 0.3% | |
| American Commercial Lines, Inc.(1)(2) | | | 6,516 | | | $ | 418,001 | | |
| | | $ | 418,001 | | |
| Media — 2.1% | |
| Comcast Corp., Class A(1) | | | 78,000 | | | $ | 3,172,260 | | |
| | | $ | 3,172,260 | | |
| Metals & Mining — 5.6% | |
| Bolnisi Gold NL | | | 100 | | | $ | 209 | | |
| Gammon Lake Resources, Inc.(1)(2) | | | 247,000 | | | | 3,233,230 | | |
| Glamis Gold, Ltd.(1) | | | 75,680 | | | | 3,337,488 | | |
| Golden Star Resources, Ltd.(1)(2) | | | 203,000 | | | | 570,430 | | |
| Miramar Mining Corp.(1) | | | 240,000 | | | | 1,164,000 | | |
| Western Copper Corp.(1) | | | 110,000 | | | | 127,627 | | |
| | | $ | 8,432,984 | | |
| Security | | Shares | | Value | |
| Multiline Retail — 0.8% | |
| Big Lots, Inc.(1) | | | 56,000 | | | $ | 1,180,480 | | |
| | | $ | 1,180,480 | | |
| Oil, Gas & Consumable Fuels — 12.5% | |
| Chesapeake Energy Corp. | | | 33,363 | | | $ | 1,082,296 | | |
| Hess Corp.(2) | | | 61,400 | | | | 2,603,360 | | |
| Occidental Petroleum Corp. | | | 21,000 | | | | 985,740 | | |
| Parallel Petroleum Corp.(1) | | | 38,609 | | | | 781,832 | | |
| Quicksilver Resources, Inc.(1)(2) | | | 45,000 | | | | 1,542,600 | | |
| Southwestern Energy Co.(1) | | | 58,000 | | | | 2,063,640 | | |
| SXR Uranium One, Inc.(1) | | | 398,909 | | | | 4,503,725 | | |
| W&T Offshore, Inc. | | | 137,000 | | | | 4,626,490 | | |
| Williams Cos., Inc. (The) | | | 25,000 | | | | 610,750 | | |
| | | $ | 18,800,433 | | |
| Personal Products — 1.3% | |
| Alberto-Culver Co. | | | 12,000 | | | $ | 609,720 | | |
| Herbalife, Ltd.(1) | | | 35,730 | | | | 1,307,718 | | |
| | | $ | 1,917,438 | | |
| Pharmaceuticals — 3.4% | |
| Shire Pharmaceuticals Group PLC ADR | | | 93,000 | | | $ | 5,101,050 | | |
| | | $ | 5,101,050 | | |
| Real Estate Investment Trusts (REITs) — 0.4% | |
| Annaly Capital Management, Inc. | | | 43,210 | | | $ | 566,915 | | |
| MFA Mortgage Investments, Inc. | | | 1,000 | | | | 7,920 | | |
| | | $ | 574,835 | | |
| Real Estate Management & Development — 0.0% | |
| Move, Inc.(1) | | | 1,013 | | | $ | 4,842 | | |
| | | $ | 4,842 | | |
| Semiconductors & Semiconductor Equipment — 6.3% | |
| Atheros Communications, Inc.(1)(2) | | | 168,000 | | | $ | 3,650,640 | | |
| MEMC Electronic Materials, Inc.(1)(2) | | | 144,000 | | | | 5,112,000 | | |
| Tessera Technologies, Inc.(1) | | | 21,500 | | | | 750,565 | | |
| | | $ | 9,513,205 | | |
| Software — 0.3% | |
| i2 Technologies, Inc.(1)(2) | | | 26,000 | | | $ | 525,460 | | |
| | | $ | 525,460 | | |
See notes to financial statements
16
Tax-Managed Multi-Cap Opportunity Portfolio as of October 31, 2006
PORTFOLIO OF INVESTMENTS CONT'D
| Security | | Shares | | Value | |
| Specialty Retail — 2.4% | |
| Circuit City Stores, Inc. | | | 29,000 | | | $ | 782,420 | | |
| GameStop Corp., Class A(1)(2) | | | 36,000 | | | | 1,838,160 | | |
| OfficeMax, Inc. | | | 20,500 | | | | 975,390 | | |
| | | $ | 3,595,970 | | |
| Thrifts & Mortgage Finance — 1.5% | |
| BankUnited Financial Corp., Class A(2) | | | 29,500 | | | $ | 795,615 | | |
| W Holding Co., Inc.(2) | | | 250,000 | | | | 1,422,500 | | |
| | | $ | 2,218,115 | | |
| Tobacco — 3.2% | |
| Lowes Corp. - Carolina Group | | | 58,773 | | | $ | 3,398,255 | | |
| Reynolds American, Inc. | | | 22,000 | | | | 1,389,520 | | |
| | | $ | 4,787,775 | | |
| Wireless Telecommunication Services — 9.2% | |
| NII Holdings, Inc., Class B(1)(2) | | | 119,000 | | | $ | 7,738,570 | | |
| Philippine Long Distance Telephone Co. ADR | | | 1,000 | | | | 47,610 | | |
| Rogers Communications, Inc., Class B(2) | | | 57,000 | | | | 3,409,740 | | |
| Tim Participacoes SA ADR(2) | | | 77,000 | | | | 2,587,200 | | |
| | | $ | 13,783,120 | | |
Total Common Stocks
(identified cost $103,263,579) | | | | | | $ | 141,045,202 | | |
| Short-Term Investments — 31.0% | |
| Security | | Principal
Amount
(000's omitted) | | Value | |
Eaton Vance Cash Collateral Fund, LLC,
5.30%(3) | | $ | 42,986 | | | $ | 42,986,473 | | |
Societe Generale Time Deposit,
5.31%, 11/1/06 | | | 3,670 | | | | 3,670,000 | | |
Total Short-Term Investments
(at amortized cost, $46,656,473) | | | | | | $ | 46,656,473 | | |
Total Investments — 124.7%
(identified cost $149,920,052) | | | | | | $ | 187,701,675 | | |
| Other Assets, Less Liabilities — (24.7)% | | | | | | $ | (37,138,979 | ) | |
| Net Assets — 100.0% | | | | | | $ | 150,562,696 | | |
ADR - American Depository Receipt
(1) Non-income producing security.
(2) All or a portion of these securities were on loan at October 31, 2006.
(3) Affiliated fund that is available only to Eaton Vance portfolios and funds. The rate shown is the annualized seven-day yield as of October 31, 2006.
See notes to financial statements
17
Tax-Managed Multi-Cap Opportunity Portfolio as of October 31, 2006
FINANCIAL STATEMENTS
Statement of Assets and Liabilities
As of October 31, 2006
| Assets | |
Investments, at value including $41,421,961 of securities on loan
(identified cost, $149,920,052) | | $ | 187,701,675 | | |
| Cash | | | 493 | | |
| Receivable for investments sold | | | 7,460,059 | | |
| Interest and dividends receivable | | | 176,700 | | |
| Total assets | | $ | 195,338,927 | | |
| Liabilities | |
| Collateral for securities loaned | | $ | 42,986,473 | | |
| Payable for investments purchased | | | 1,499,260 | | |
| Payable to affiliate for investment advisory fees | | | 79,967 | | |
| Payable to affiliate for Trustees' fees | | | 822 | | |
| Accrued expenses | | | 209,709 | | |
| Total liabilities | | $ | 44,776,231 | | |
| Net Assets applicable to investors' interest in Portfolio | | $ | 150,562,696 | | |
| Sources of Net Assets | |
| Net proceeds from capital contributions and withdrawals | | $ | 112,781,073 | | |
| Net unrealized appreciation (computed on the basis of identified cost) | | | 37,781,623 | | |
| Total | | $ | 150,562,696 | | |
Statement of Operations
For the Year Ended
October 31, 2006
| Investment Income | |
| Dividends (net of foreign taxes, $18,744) | | $ | 1,553,136 | | |
| Interest | | | 307,435 | | |
| Security lending income, net | | | 89,064 | | |
| Total investment income | | $ | 1,949,635 | | |
| Expenses | |
| Investment adviser fee | | $ | 943,289 | | |
| Trustees' fees and expenses | | | 10,354 | | |
| Custodian fee | | | 104,101 | | |
| Legal and accounting services | | | 32,081 | | |
| Miscellaneous | | | 19,322 | | |
| Total expenses | | $ | 1,109,147 | | |
Deduct —
Reduction of custodian fee | | $ | 96 | | |
| Reduction of investment adviser fee | | | 8,866 | | |
| Total expense reductions | | $ | 8,962 | | |
| Net expenses | | $ | 1,100,185 | | |
| Net investment income | | $ | 849,450 | | |
| Realized and Unrealized Gain (Loss) | |
Net realized gain (loss) —
Investment transactions (identified cost basis) | | $ | 4,093,957 | | |
| Securities sold short | | | (1,498,806 | ) | |
| Foreign currency transactions | | | (14,021 | ) | |
| Net realized gain | | $ | 2,581,130 | | |
Change in unrealized appreciation (depreciation) —
Investments (identified cost basis) | | $ | 22,149,779 | | |
| Securities sold short | | | 1,443,611 | | |
| Net change in unrealized appreciation (depreciation) | | $ | 23,593,390 | | |
| Net realized and unrealized gain | | $ | 26,174,520 | | |
| Net increase in net assets from operations | | $ | 27,023,970 | | |
See notes to financial statements
18
Tax-Managed Multi-Cap Opportunity Portfolio as of October 31, 2006
FINANCIAL STATEMENTS CONT'D
Statements of Changes in Net Assets
Increase (Decrease)
in Net Assets | | Year Ended
October 31, 2006 | | Year Ended
October 31, 2005 | |
From operations —
Net investment income | | $ | 849,450 | | | $ | 119,621 | | |
Net realized gain from investment
transactions, securities sold short,
and foreign currency transactions | | | 2,581,130 | | | | 10,803,612 | | |
Net change in unrealized appreciation
(depreciation) from investments,
and securities sold short | | | 23,593,390 | | | | (1,215,747 | ) | |
| Net increase in net assets from operations | | $ | 27,023,970 | | | $ | 9,707,486 | | |
Capital transactions —
Contributions | | $ | 8,380,760 | | | $ | 33,968,812 | | |
| Withdrawals | | | (20,616,323 | ) | | | (16,795,810 | ) | |
Net increase (decrease) in
net assets from capital transactions | | $ | (12,235,563 | ) | | $ | 17,173,002 | | |
| Net increase in net assets | | $ | 14,788,407 | | | $ | 26,880,488 | | |
| Net Assets | |
| At beginning of year | | $ | 135,774,289 | | | $ | 108,893,801 | | |
| At end of year | | $ | 150,562,696 | | | $ | 135,774,289 | | |
See notes to financial statements
19
Tax-Managed Multi-Cap Opportunity Portfolio as of October 31, 2006
FINANCIAL STATEMENTS CONT'D
Supplementary Data
| | | Year Ended October 31, | |
| | | 2006 | | 2005 | | 2004 | | 2003 | | 2002 | |
| Ratios/Supplemental Data | |
| Ratios (As a percentage of average daily net assets): | |
| Expenses before custodian fee reduction(1) | | | 0.76 | % | | | 0.77 | % | | | 0.76 | % | | | 0.79 | % | | | 0.82 | % | |
| Expenses after custodian fee reduction(1) | | | 0.76 | % | | | 0.77 | % | | | 0.76 | % | | | 0.79 | % | | | 0.82 | % | |
| Net investment income (loss) | | | 0.59 | % | | | 0.10 | % | | | (0.06 | )% | | | (0.54 | )% | | | (0.58 | )% | |
| Portfolio Turnover | | | 181 | % | | | 217 | % | | | 239 | % | | | 224 | % | | | 225 | % | |
| Total Return | | | 20.69 | % | | | 8.71 | % | | | 4.60 | % | | | 34.80 | % | | | (12.80 | )% | |
| Net assets, end of year (000's omitted) | | $ | 150,563 | | | $ | 135,774 | | | $ | 108,894 | | | $ | 86,988 | | | $ | 48,896 | | |
(1) The advisor voluntarily waived a portion of its investment advisory fee (equal to 0.01% of average net assets for 2006 and 2004, respectively).
See notes to financial statements
20
Tax-Managed Multi-Cap Opportunity Portfolio as of October 31, 2006
NOTES TO FINANCIAL STATEMENTS
1 Significant Accounting Policies
Tax-Managed Multi-Cap Opportunity Portfolio (the Portfolio) is registered under the Investment Company Act of 1940, as amended, as a diversified open-end investment management company. The Portfolio, which was organized as a trust under the laws of the State of New York on February 28, 2000, seeks to achieve long-term, after-tax returns by investing in a diversified portfolio of equity securities. The Declaration of Trust permits the Trustees to issue beneficial interests in the Portfolio. At October 31, 2006, the Eaton Vance Tax-Managed Multi-Cap Opportunity Fund and the Eaton Vance Tax-Managed Equity Asset Allocation Fund held 40.9% and 58.9% interests in the Portfolio, respectively. The following is a summary of significant accounting policies consistently followed by the Portfolio in the preparation of its financial statements. The policies are in conformity with accounting principles generally accepted in the United States of America.
A Investment Valuation — Securities listed on a U.S. securities exchange generally are valued at the last sale price on the day of valuation or, if no sales took place on such date, at the mean between the closing bid and asked prices therefore on the exchange where such securities are principally traded. Equity securities listed on the NASDAQ National Market System generally are valued at the official NASDAQ closing price. Unlisted or listed securities for which closing sales prices or closing quotations are not available are valued at the mean between the latest available bid and asked prices or, in the case of preferred equity securities that are not listed or traded in the over-the-counter market, by an independent pricing service. Exchange-traded options are valued a t the last sale price for the day of valuation as quoted on the principal exchange or board of trade on which the options are traded or, in the absence of sales on such date, at the mean between the latest bid and asked prices therefore. Futures positions on securities and currencies generally are valued at closing settlement prices. Short-term debt securities with a remaining maturity of 60 days or less are valued at amortized cost. If short-term debt securities are acquired with a remaining maturity of more than 60 days, they will be valued by a pricing service. Other fixed income and debt securities, including listed securities and securities for which price quotations are available, will normally be valued on the basis of valuations furnished by a pricing service. Foreign securities and currencies are valued in U.S. dollars, based on foreign currency exchange rate quotations supplied by an independent quotation service. The daily val uation of exchange traded foreign securities generally is determined as of the close of trading on the principal exchange on which such securities trade. Events occurring after the close of trading on foreign exchanges may result in adjustments to the valuation of foreign securities to more accurately reflect their fair value as of the close of regular trading on the New York Stock Exchange. When valuing foreign equity securities that meet certain criteria, the Trustees have approved the use of a fair value service that values such securities to reflect market trading that occurs after the close of the applicable foreign markets of comparable securities or other instruments that have a strong correlation to the fair valued securities. Investments held by the Portfolio for which valuations or market quotations are unavailable are valued at fair value using methods determined in good faith by or at the direction of the Trustees of the Portfolio considering relevant factors, data and information including the m arket value of freely tradable securities of the same class in the principal market on which such securities are normally traded.
B Income — Dividend income is recorded on the ex-dividend date for dividends received in cash and/or securities. However, if the ex-dividend date has passed, certain dividends from foreign securities are recorded as the Portfolio is informed of the ex-dividend date. Withholding taxes on foreign dividends and capital gains have been provided for in accordance with the Portfolio's understanding of the applicable countries' tax rules and rates. Interest income is recorded on the basis of interest accrued, adjusted for amortization of premium or accretion of discount.
C Federal Taxes — The Portfolio has elected to be treated as a partnership for federal tax purposes. No provision is made by the Portfolio for federal or state taxes on any taxable income of the Portfolio because each investor in the Portfolio is ultimately responsible for the payment of any taxes on its share of taxable income. Since at least one of the Portfolio's investors is a regulated investment company that invests all or substantially all of its assets in the Portfolio, the Portfolio normally must satisfy the applicable source of income and diversification requirements (under the Internal Revenue Code) in order for its investors to satisfy them. The Portfolio will allocate, at least annually among its investors, each investor's distributive share of the Portfolio' s net investment income, net realized capital gains, and any other items of income, gain, loss, deduction or credit.
21
Tax-Managed Multi-Cap Opportunity Portfolio as of October 31, 2006
NOTES TO FINANCIAL STATEMENTS CONT'D
D Financial Futures Contract — Upon entering a financial futures contract, the Portfolio is required to deposit either in cash or securities an amount (initial margin) equal to a certain percentage of the purchase price indicated in the financial futures contract. Subsequent payments are made or received by the Portfolio (margin maintenance) each day, dependent on daily fluctuations in the value of the underlying security, and are recorded for book purposes as unrealized gains or losses by the Portfolio. The Portfolio's investment in financial futures contracts is designed to hedge against anticipated future changes in price of current or anticipated Portfolio positions. Should prices move unexpectedly, the Portfolio may not achieve the anticipated benefits of the financi al futures contracts and may realize a loss.
E Purchased Options — Upon the purchase of a call or put option, the premium paid by the Portfolio is included in the Statement of Assets and Liabilities as an investment. The amount of the investment is subsequently marked-to-market to reflect the current market value of the option purchased, in accordance with the Portfolio's policies on investment valuations discussed above. If an option which the Portfolio has purchased expires on the stipulated expiration date, the Portfolio will realize a loss in the amount of the cost of the option. If the Portfolio enters into a closing sale transaction, the Portfolio will realize a gain or loss, depending on whether the sales proceeds from the closing sale transaction are greater or less than the cost of the option. If a Portfoli o exercises a put option, it will realize a gain or loss from the sale of the underlying security, and the proceeds from such sale will be decreased by the premium originally paid. If the Portfolio exercises a call option, the cost of the security which the Portfolio purchases upon exercise will be increased by the premium originally paid.
F Expense Reduction — Investors Bank & Trust Company (IBT) serves as custodian to the Portfolio. Pursuant to the custodian agreement, IBT receives a fee reduced by credits which are determined based on the average daily cash balance the Portfolio maintains with IBT. All credit balances, if any, used to reduce the Portfolio's custodian fees are reported as a reduction of expenses in the Statement of Operations.
G Securities Sold Short — The Portfolio may sell a security short if it owns at least an equal amount of the security sold short or another security exchangeable for an equal amount of the security sold short without payment of further compensation (a short sale against the box) in anticipation of a decline in the market price of the securities or in order to hedge portfolio positions. The Portfolio will generally borrow the security sold in order to make the delivery to the buyer. Upon executing the transaction, the Portfolio records the proceeds as deposits with brokers in the Statement of Assets and Liabilities and establishes an offsetting payable for securities sold short for the securities due o n settlement. The proceeds are retained by the broker as collateral for the short position. The liability is marked-to-market on a daily basis and the Portfolio is required to pay the lending broker any dividend or interest income earned while the short position is open. A gain or loss is recorded when the security is delivered to the broker. The Portfolio may recognize a loss on the transaction if the market value of the securities sold increases before the securities are delivered.
H Foreign Currency Translation — Investment valuations, other assets, and liabilities initially expressed in foreign currencies are converted each business day into U.S. dollars based upon current exchange rates. Purchases and sales of foreign investment securities and income and expenses are converted into U.S. dollars based upon currency exchange rates prevailing on the respective dates of such transactions. Recognized gains or losses on investment transactions attributable to changes in foreign currency exchange rates are recorded for financial statement purposes as net realized gains and losses on investments. That portion of unrealized gains and losses on investments that results from fluctuations in foreign currency exchange rates is not separately disclosed.
I Indemnifications — Under the Portfolio's organizational documents, its officers and Trustees may be indemnified against certain liabilities and expenses arising out of the performance of their duties to the Portfolio. Interestholders in the Portfolio are jointly and severally liable for the liabilities and obligations of the Portfolio in the event that the Portfolio fails to satisfy such liabilities and obligations; provided, however, that, to the extent assets are available in the Portfolio, the Portfolio may, under certain circumstances, indemnify interestholders from and against any claim or liability to which such holder may become subject by reason of being or having been an interestholder in the Portfolio. Additionally, in the normal course of business, the Portfo lio enters into agreements with service providers that may contain indemnification clauses. The Portfolio's maximum exposure under these arrangements is
22
Tax-Managed Multi-Cap Opportunity Portfolio as of October 31, 2006
NOTES TO FINANCIAL STATEMENTS CONT'D
unknown as this would involve future claims that may be made against the Portfolio that have not yet occurred.
J Other — Investment transactions are accounted for on the date the securities are purchased or sold. Realized gains and losses on securities sold are determined on the basis of identified cost.
K Use of Estimates — The preparation of the financial statements in conformity with accounting principles generally accepted in the United States of America requires management to make estimates and assumptions that affect the reported amounts of assets and liabilities at the date of the financial statements and the reported amounts of income and expense during the reporting period. Actual results could differ from those estimates.
2 Investment Adviser Fee and Other Transactions with Affiliates
The investment adviser fee is earned by Boston Management and Research (BMR), a wholly-owned subsidiary of Eaton Vance Management (EVM), as compensation for management and investment advisory services rendered to the Portfolio. Under the advisory agreement, BMR receives a monthly advisory fee equal to 0.65% annually of average daily net assets of the Portfolio up to $500 million, and at reduced rates as daily net assets exceed that level. For the year ended October 31, 2006, the advisory fee amounted to $943,289. BMR has also agreed to reduce the investment adviser fee by an amount equal to that portion of commissions paid to broker dealers in execution of Portfolio security transactions that is consideration for third-party research services. For the year ended October 31, 2006, BMR waived $8,866 of its advisory fee. Except for Trustees of the Portfolio who are not members of EVM's or BMR's organization, officers and Trustees r eceive remuneration for their services to the Portfolio out of such investment adviser fee. Trustees of the Portfolio that are not affiliated with the Investment Adviser may elect to defer receipt of all or a percentage of their annual fees in accordance with the terms of the Trustees Deferred Compensation Plan. For the year ended October 31, 2006, no significant amounts have been deferred.
Certain officers and Trustees of the Portfolio are officers of the above organizations.
3 Investment Transactions
Purchases and sales of investments, other than short-term obligations, aggregated $251,309,789 and $261,866,951, respectively, for the year ended October 31, 2006.
4 Federal Income Tax Basis of Unrealized Appreciation (Depreciation)
The cost and unrealized appreciation (depreciation) in value of the investments owned at October 31, 2006 as determined on a federal income tax basis, were as follows:
| Aggregate cost | | $ | 150,457,454 | | |
| Gross unrealized appreciation | | $ | 37,321,790 | | |
| Gross unrealized depreciation | | | (77,569 | ) | |
| Net unrealized appreciation | | $ | 37,244,221 | | |
5 Line of Credit
The Portfolio participates with other portfolios and funds managed by BMR and EVM and its affiliates in a $150 million unsecured line of credit agreement with a group of banks. Borrowings will be made by the Portfolio solely to facilitate the handling of unusual and/or unanticipated short-term cash requirements. Interest is charged to each participating portfolio or fund based on its borrowings at an amount above either the Eurodollar rate or federal funds rate. In addition, a fee computed at an annual rate of 0.10% on the daily unused portion of the line of credit is allocated among the participating portfolios and funds at the end of each quarter. The Portfolio did not have any significant borrowings or allocated fees during the year ended October 31, 2006.
6 Financial Instruments
The Portfolio may trade in financial instruments with off-balance sheet risk in the normal course of its investing activities to assist in managing exposure to various market risks. These financial instruments include written options and financial futures contracts, and may involve, to a varying degree, elements of risk in excess of the amounts recognized for financial statement purposes. The notional or contractual amounts of these instruments represent the investment the Portfolio has in particular classes of financial instruments and does not necessarily represent the amounts potentially subject to risk. The measurement of the risks associated with these instruments is meaningful only when all related and
23
Tax-Managed Multi-Cap Opportunity Portfolio as of October 31, 2006
NOTES TO FINANCIAL STATEMENTS CONT'D
offsetting transactions are considered. At October 31, 2006 there were no outstanding obligations under these financial instruments.
7 Securities Lending Agreement
The Portfolio has established a securities lending agreement with a securities lending agent, IBT, in which the Portfolio lends portfolio securities to qualified borrowers in exchange for collateral consisting of either cash or U. S. government securities in an amount at least equal to the market value of the securities on loan. Cash collateral is invested in the Eaton Vance Cash Collateral Fund, LLC (Cash Collateral Fund). The Cash Collateral Fund invests in high quality money market instruments. Under the agreement, the Portfolio continues to earn interest on the amount invested but it must also pay the broker a loan rebate fee computed as a varying percentage of the collateral received. In addition, the Portfolio pays IBT a lending agent fee computed as a percentage of the earnings on the collateral invested less the loan rebate fee. The loan rebate fee and lending agent fee paid by the Portfolio offsets a portion of the inte rest income received and amounted to $890,783 and $15,689, respectively, for the year ended October 31, 2006. At October 31, 2006, the value of the securities loaned and the value of the collateral amounted to $41,421,961 and $42,986,473, respectively. In the event of counterparty default, the Portfolio is subject to potential loss if it is delayed or prevented from exercising its right to dispose of the collateral. The Portfolio bears risk in the event that invested collateral is not sufficient to meet obligations due on loans.
8 Recently Issued Accounting Pronouncements
In June 2006, the Financial Accounting Standards Board ("FASB") issued FASB Interpretation No. 48, ("FIN 48") "Accounting for Uncertainty in Income Taxes – an interpretation of FASB Statement No. 109". FIN 48 clarifies the accounting for uncertainty in income taxes recognized in accordance with FASB Statement No. 109, "Accounting for Income Taxes." This interpretation prescribes a recognition threshold and measurement attribute for the financial statement recognition and measurement of a tax position taken or expected to be taken in a tax return. It also provides guidance on de-recognition, classification, interest and penalties, accounting in interim periods, disclosure and transition. FIN 48 is effective for fiscal years beginning after December 15, 2006. Management is currently evaluating the impact of applying the various provisions of FIN 48.
In September 2006, the Financial Accounting Standards Board ("FASB") issued Statement of Financial Accounting Standards No. 157, ("FAS 157") "Fair Value Measurements". FAS 157 defines fair value, establishes a framework for measuring fair value in accordance with generally accepted accounting principles and expands disclosure about fair value measurements. FAS 157 is effective for fiscal years beginning after November 15, 2007. Management is currently evaluating the impact the adoption of FAS 157 will have on the Fund's financial statement disclosures.
24
Tax-Managed Multi-Cap Opportunity Portfolio as of October 31, 2006
REPORT OF INDEPENDENT REGISTERED PUBLIC ACCOUNTING FIRM
To the Trustees and Investors
of Tax-Managed Multi-Cap Opportunity Portfolio:
We have audited the accompanying statement of assets and liabilities of Tax-Managed Multi-Cap Opportunity Portfolio (the "Portfolio"), including the portfolio of investments, as of October 31, 2006, and the related statement of operations for the year then ended, the statements of changes in net assets for each of the two years in the period then ended, and the supplementary data for each of the five years in the period then ended. These financial statements and supplementary data are the responsibility of the Portfolio's management. Our responsibility is to express an opinion on these financial statements and supplementary data based on our audits.
We conducted our audits in accordance with standards of the Public Company Accounting Oversight Board (United States). Those standards require that we plan and perform the audits to obtain reasonable assurance about whether the financial statements and supplementary data are free of material misstatement. The Portfolio is not required to have, nor were we engaged to perform, an audit of its internal control over financial reporting. Our audits included consideration of internal control over financial reporting as a basis for designing audit procedures that are appropriate in the circumstances, but not for the purpose of expressing an opinion on the effectiveness of the Portfolio's internal control over financial reporting. Accordingly, we express no such opinion. An audit also includes examining, on a test basis, evidence supporting the amounts and disclosures in the financial statements, assessing the accounting principles used and significant estimates made by management, as well as evaluating the overall financial statement presentation. Our procedures included confirmation of securities owned as of October 31, 2006 by correspondence with the custodian and brokers; where replies were not received from brokers, we performed other auditing procedures. We believe that our audits provide a reasonable basis for our opinion.
In our opinion, the financial statements and supplementary data referred to above present fairly, in all material respects, the financial position of Tax-Managed Multi-Cap Opportunity Portfolio as of October 31, 2006, the results of its operations for the year then ended, the changes in its net assets for each of the two years in the period then ended, and the supplementary data for each of the five years in the period then ended, in conformity with accounting principles generally accepted in the United States of America.
DELOITTE & TOUCHE LLP
Boston, Massachusetts
December 15, 2006
25
Eaton Vance Tax-Managed Multi-Cap Opportunity Fund
BOARD OF TRUSTEES' ANNUAL APPROVAL OF THE INVESTMENT ADVISORY AGREEMENT
Overview of the Contract Review Process
The Investment Company Act of 1940, as amended (the "1940 Act"), provides, in substance, that each investment advisory agreement between a fund and its investment adviser will continue in effect from year to year only if its continuance is approved at least annually by the fund's board of trustees, including by a vote of a majority of the trustees who are not "interested persons" of the fund ("Independent Trustees") cast in person at a meeting called for the purpose of considering such approval.
At a meeting of the Boards of Trustees (each a "Board") of the Eaton Vance group of mutual funds (the "Eaton Vance Funds") held on March 27, 2006, the Board, including a majority of the Independent Trustees, voted to approve continuation of existing advisory and sub-advisory agreements for the Eaton Vance Funds for an additional one-year period. In voting its approval, the Board relied upon the affirmative recommendation of the Special Committee of the Board, which is a committee comprised exclusively of Independent Trustees. Prior to making its recommendation, the Special Committee reviewed information furnished for a series of meetings of the Special Committee held in February and March 2006. Such information included, among other things, the following:
Information about Fees, Performance and Expenses
• An independent report comparing the advisory and related fees paid by each fund with fees paid by comparable funds;
• An independent report comparing each fund's total expense ratio and its components to comparable funds;
• An independent report comparing the investment performance of each fund to the investment performance of comparable funds over various time periods;
• Data regarding investment performance in comparison to relevant peer groups of funds and appropriate indices;
• Comparative information concerning fees charged by each adviser for managing other mutual funds and institutional accounts using investment strategies and techniques similar to those used in managing the fund;
• Profitability analyses for each adviser with respect to each fund managed by it;
Information about Portfolio Management
• Descriptions of the investment management services provided to each fund, including the investment strategies and processes employed;
• Information concerning the allocation of brokerage and the benefits received by each adviser as a result of brokerage allocation, including information concerning the acquisition of research through "soft dollar" benefits received in connection with the funds' brokerage, and the implementation of a soft dollar reimbursement program established with respect to the funds;
• Data relating to portfolio turnover rates of each fund;
• The procedures and processes used to determine the fair value of fund assets and actions taken to monitor and test the effectiveness of such procedures and processes;
Information about each Adviser
• Reports detailing the financial results and condition of each adviser;
• Descriptions of the qualifications, education and experience of the individual investment professionals whose responsibilities include portfolio management and investment research for the funds, and information relating to their compensation and responsibilities with respect to managing other mutual funds and investment accounts;
• Copies of the Codes of Ethics of each adviser and its affiliates, together with information relating to compliance with and the administration of such codes;
• Information concerning the resources devoted to compliance efforts undertaken by each adviser and its affiliates on behalf of the funds (including descriptions of various compliance programs) and their record of compliance with investment policies and restrictions, including policies with respect to market-timing, late trading and selective portfolio disclosure, and with policies on personal securities transactions;
• Descriptions of the business continuity and disaster recovery plans of each adviser and its affiliates;
Other Relevant Information
• Information concerning the nature, cost and character of the administrative and other non-investment management services provided by Eaton Vance Management and its affiliates;
• Information concerning management of the relationship with the custodian, subcustodians and fund accountants by each adviser or the funds' administrator; and
• The terms of each advisory agreement.
In addition to the information identified above, the Special Committee considered information provided from time to time by each adviser throughout the year at meetings of the Board and its committees. Over the course of the twelve month period ended March 31, 2006, the
26
Eaton Vance Tax-Managed Multi-Cap Opportunity Fund
BOARD OF TRUSTEES' ANNUAL APPROVAL OF THE INVESTMENT ADVISORY AGREEMENT CONT'D
Board met nine times and the Special Committee, the Audit Committee and the Governance Committee, each of which is a Committee comprised solely of Independent Trustees, met eight, twelve and five times, respectively. At such meetings, the Trustees received, among other things, presentations by the portfolio managers and other investment professionals of each adviser relating to the investment performance of each fund and the investment strategies used in pursuing the fund's investment objective.
For funds that invest through one or more underlying portfolios, the Board considered similar information about the portfolio(s) when considering the approval of advisory agreements. In addition, in cases where the fund's investment adviser has engaged a sub-adviser, the Board considered similar information about the sub-adviser when considering the approval of any sub-advisory agreement.
The Special Committee was assisted throughout the contract review process by Goodwin Procter LLP, legal counsel for the Independent Trustees. The members of the Special Committee relied upon the advice of such counsel and their own business judgment in determining the material factors to be considered in evaluating each advisory and sub-advisory agreement and the weight to be given to each such factor. The conclusions reached with respect to each advisory and sub-advisory agreement were based on a comprehensive evaluation of all the information provided and not any single factor. Moreover, each member of the Special Committee may have placed varying emphasis on particular factors in reaching conclusions with respect to each advisory and sub-advisory agreement.
Results of the Process
Based on its consideration of the foregoing, and such other information as it deemed relevant, including the factors and conclusions described below, the Special Committee concluded that the continuance of the investment advisory agreement of the Tax-Managed Multi-Cap Opportunity Portfolio (the "Portfolio"), the portfolio in which the Eaton Vance Tax-Managed Multi-Cap Opportunity Fund (the "Fund") invests, with Boston Management and Research (the "Adviser"), including its fee structure, is in the interests of shareholders and, therefore, the Special Committee recommended to the Board approval of the agreement. The Board accepted the recommendation of the Special Committee as well as the factors considered and conclusions reached by the Special Committee with respect to the agreement. Accordingly, the Board, including a majority of the Independent Trustees, voted to approve continuation of the investment advisory agreement for th e Portfolio.
Nature, Extent and Quality of Services
In considering whether to approve the investment advisory agreement of the Portfolio, the Board evaluated the nature, extent and quality of services provided to the Portfolio by the Adviser.
The Board considered the Adviser's management capabilities and investment process with respect to the types of investments held by the Portfolio, including the education, experience and number of its investment professionals and other personnel who provide portfolio management, investment research, and similar services to the Portfolio. The Board specifically noted the Adviser's in-house equity research capabilities and experience in managing funds that seek to maximize after-tax returns. The Board also took into account the resources dedicated to portfolio management and other services, including the compensation paid to recruit and retain investment personnel, and the time and attention devoted to each Portfolio in the complex by senior management.
The Board reviewed the compliance programs of the Adviser and relevant affiliates thereof. Among other matters, the Board considered compliance and reporting matters relating to personal trading by investment personnel, selective disclosure of portfolio holdings, late trading, frequent trading, portfolio valuation, business continuity and the allocation of investment opportunities. The Board also evaluated the responses of the Adviser and its affiliates to requests from regulatory authorities such as the Securities and Exchange Commission and the National Association of Securities Dealers.
The Board considered shareholder and other administrative services provided or managed by Eaton Vance Management and its affiliates, including transfer agency and accounting services. The Board evaluated the benefits to shareholders of investing in a fund that is a part of a large family of funds, including the ability, in many cases, to exchange an investment among different funds without incurring additional sales charges.
After consideration of the foregoing factors, among others, the Board concluded that the nature, extent and quality of services provided by the Adviser, taken as a whole, are appropriate and consistent with the terms of the investment advisory agreement.
Fund Performance
The Board compared the Fund's investment performance to a relevant universe of similarly managed funds identified by an independent data provider and appropriate benchmark indices. The Board reviewed comparative performance data for the one- , three- and five-year periods ended September 30, 2005 for the Fund. The Board noted that appropriate actions were being taken to
27
Eaton Vance Tax-Managed Multi-Cap Opportunity Fund
BOARD OF TRUSTEES' ANNUAL APPROVAL OF THE INVESTMENT ADVISORY AGREEMENT CONT'D
improve portfolio performance, and that subsequent to the initiation of these changes, the performance of the Fund had improved. The Board concluded that it was appropriate to allow reasonable time to evaluate the effectiveness of this action.
Management Fees and Expenses
The Board reviewed contractual investment advisory fee rates, including administrative fee rates, payable by the Fund (referred to collectively as "management fees"). As part of its review, the Board considered the management fees (including administrative fees) and the Fund's total expense ratio for the one-year period ended September 30, 2005, as compared to a group of similarly managed funds selected by an independent data provider.
After reviewing the foregoing information, and in light of the nature, extent and quality of the services provided by the Adviser, the Board concluded that the management fees charged for advisory and related services and the Fund's total expense ratio are reasonable.
Profitability
The Board reviewed the level of profits realized by the Adviser and relevant affiliates thereof in providing investment advisory and administrative services to the Fund, the Portfolio and all Eaton Vance Funds as a group. The Board considered the level of profits realized without regard to revenue sharing or other payments by the Adviser and its affiliates to third parties in respect of distribution services. The Board also considered other direct or indirect benefits received by the Adviser and its affiliates in connection with its relationship with the Fund and the Portfolio, including the benefits of research services that may be available to the Adviser as a result of securities transactions effected for the Portfolio and other advisory clients.
The Board concluded that, in light of the foregoing factors and the nature, extent and quality of the services rendered, the profits realized by the Adviser and its affiliates are reasonable.
Economies of Scale
In reviewing management fees and profitability, the Board also considered the extent to which the Adviser and its affiliates, on the one hand, and the Fund, on the other hand, can expect to realize benefits from economies of scale as the assets of the Fund and the Portfolio increase. The Board acknowledged the difficulty in accurately measuring the benefits resulting from the economies of scale with respect to the management of any specific fund or group of funds. The Board reviewed data summarizing the increases and decreases in the assets of the Fund and of all Eaton Vance Funds as a group over various time periods, and evaluated the extent to which the total expense ratio of the Fund and the profitability of the Adviser and its affiliates may have been affected by such increases or decreases. Based upon the foregoing, the Board concluded that the benefits from economies of scale are currently being shared equitably by the Adv iser and its affiliates and the Fund. The Board also concluded that, assuming reasonably foreseeable increases in the assets of the Portfolio, the structure of the advisory fee, which includes breakpoints at several asset levels, can be expected to cause the Adviser and its affiliates and the Fund to continue to share such benefits equitably.
28
Eaton Vance Tax-Managed Multi-Cap Opportunity Fund
MANAGEMENT AND ORGANIZATION
Fund Management. The Trustees of Eaton Vance Mutual Funds Trust (the Trust) and Tax-Managed Multi-Cap Opportunity Portfolio (the Portfolio) are responsible for the overall management and supervision of the Trust's and Portfolio's affairs. The Trustees and officers of the Trust and the Portfolio are listed below. Except as indicated, each individual has held the office shown or other offices in the same company for the last five years. Trustees and officers of the Trust and the Portfolio hold indefinite terms of office. The "noninterested Trustees" consist of those Trustees who are not "interested persons" of the Trust and the Portfolio, as that term is defined under the 1940 Act. The business address of each Trustee and officer is The Eaton Vance Building, 255 State Street, Boston, Massachusetts 02109. As used below, "EVC" refers to Eaton Vance Corp., "EV" r efers to Eaton Vance, Inc., "EVM" refers to Eaton Vance Management, "BMR" refers to Boston Management and Research, and "EVD" refers to Eaton Vance Distributors, Inc. EVC and EV are the corporate parent and trustee, respectively, of EVM and BMR. EVD is the Fund's principal underwriter, the Portfolio's placement agent and wholly-owned subsidiary of EVM. Each officer affiliated with Eaton Vance may hold a position with other Eaton Vance affiliates that is comparable to his or her position with EVM listed below.
Name and
Date of Birth | | Position(s)
with the
Trust and
the Portfolio | | Term of
Office and
Length of
Service | | Principal Occupation(s)
During Past Five Years | | Number of Portfolios
in Fund Complex
Overseen By
Trustee(1) | | Other Directorships Held | |
| Interested Trustee | | | | | | | | | | | | | |
|
| James B. Hawkes 11/9/41 | | Trustee | | Trustee of the Trust since 1991 and of the Portfolio since 2000 | | Chairman and Chief Executive Officer of EVC, BMR, EVM and EV; Director of EV; Vice President and Director of EVD. Trustee and/or officer of 170 registered investment companies in the Eaton Vance Fund Complex. Mr. Hawkes is an interested person because of his positions with BMR, EVM, EVC and EV, which are affiliates of the Trust and the Portfolio. | | | 170 | | | Director of EVC | |
|
| Noninterested Trustee(s) | | | | | | | | | | | | | |
|
| Benjamin C. Esty 1/2/63 | | Trustee | | Since 2005 | | Roy and Elizabeth Simmons Professor of Business Administration, Harvard University Graduate School of Business Administration (since 2003). Formerly, Associate Professor, Harvard University Graduate School of Business Administration (2000-2003). | | | 170 | | | None | |
|
| Samuel L. Hayes, III 2/23/35 | | Trustee and Chairman of the Board | | Trustee of the Trust since 1986; of the Portfolio since 2000 and Chairman of the Board since 2005. | | Jacob H. Schiff Professor of Investment Banking Emeritus, Harvard University Graduate School of Business Administration. Director of Yakima Products, Inc. (manufacturer of automotive accessories) (since 2001) and Director of Telect, Inc. (telecommunications services company) | | | 170 | | | Director of Tiffany & Co. (specialty retailer) | |
|
| William H. Park 9/19/47 | | Trustee | | Since 2003 | | Vice Chairman, Commercial Industrial Finance Corp. (specialty finance company) (since 2006). Formerly, President and Chief Executive Officer, Prizm Capital Management, LLC (investment management firm) (2002-2005). Formerly, Executive Vice President and Chief Financial Officer, United Asset Management Corporation (a holding company owning institutional investment management firms) (1982-2001). | | | 170 | | | None | |
|
| Ronald A. Pearlman 7/10/40 | | Trustee | | Since 2003 | | Professor of Law, Georgetown University Law Center. | | | 170 | | | None | |
|
| Norton H. Reamer 9/21/35 | | Trustee | | Trustee of the Trust since 1986 and of the Portfolio since 2000 | | President, Chief Executive Officer and a Director of Asset Management Finance Corp. (a specialty finance company serving the investment management industry) (since October 2003). President, Unicorn Corporation (an investment and financial advisory services company) (since September 2000). Formerly, Chairman and Chief Operating Officer, Hellman, Jordan Management Co., Inc. (an investment management company) (2000-2003). Formerly, Advisory Director of Berkshire Capital Corporation (investment banking firm) (2002-2003). | | | 170 | | | None | |
|
29
Eaton Vance Tax-Managed Multi-Cap Opportunity Fund
MANAGEMENT AND ORGANIZATION CONT'D
Name and
Date of Birth | | Position(s)
with the
Trust and
the Portfolio | | Term of
Office and
Length of
Service | | Principal Occupation(s)
During Past Five Years | | Number of Portfolios
in Fund Complex
Overseen By
Trustee(1) | | Other Directorships Held | |
| Noninterested Trustee(s) (continued) | | | | | | | | | | | |
|
| Lynn A. Stout 9/14/57 | | Trustee | | Trustee of the Trust since 1998 and of the Portfolio since 2000 | | Professor of Law, University of California at Los Angeles School of Law. | | | 170 | | | None | |
|
| Ralph F. Verni 1/26/43 | | Trustee | | Since 2005 | | Consultant and private investor. | | | 170 | | | None | |
|
| Principal Officers who are not Trustees | | | | | | | | | | | |
|
Name and
Date of Birth | | Position(s)
with the
Trust and
the Portfolio | | Term of
Office and
Length of
Service | | Principal Occupation(s)
During Past Five Years | |
| Thomas E. Faust Jr. 5/31/58 | | President of the Trust | | Since 2002 | | President of EVC, EVM, BMR and EV and Director of EVC. Chief Investment Officer of EVC, EVM and BMR. Officer of 71 registered investment companies and 5 private investment companies managed by EVM or BMR. | |
|
| William H. Ahern, Jr. 7/28/59 | | Vice President of the Trust | | Since 1995 | | Vice President of EVM and BMR. Officer of 71 registered investment companies managed by EVM or BMR. | |
|
| Cynthia J. Clemson 3/2/63 | | Vice President of the Trust | | Since 2005 | | Vice President of EVM and BMR. Officer of 86 registered investment companies managed by EVM or BMR. | |
|
| Arieh Coll 11/9/63 | | Vice President of the Portfolio | | Since 2000 | | Vice President of EVM and BMR. Officer of 4 registered investment companies managed by EVM or BMR. | |
|
| Aamer Khan 6/7/60 | | Vice President of the Trust | | Since 2005 | | Vice President of EVM and BMR. Officer of 29 registered investment companies managed by EVM or BMR. | |
|
| Thomas H. Luster 4/8/62 | | Vice President of the Trust | | Since 2006 | | Vice President of EVM and BMR. Officer of 45 registered investment companies managed by EVM or BMR. | |
|
| Michael R. Mach 7/15/47 | | Vice President of the Trust | | Since 1999 | | Vice President of EVM and BMR. Officer of 51 registered investment companies managed by EVM or BMR. | |
|
| Robert B. MacIntosh 1/22/57 | | Vice President of the Trust | | Since 1998 | | Vice President of EVM and BMR. Officer of 86 registered investment companies managed by EVM or BMR. | |
|
| Cliff Quisenberry, Jr. 1/1/65 | | Vice President of the Trust | | Since 2006 | | Vice President and Director of Research and Product Development of Parametric. Officer of 30 registered investment companies managed by EVM or BMR. | |
|
| Duncan W. Richardson 10/26/57 | | Vice President of the Trust; President of the Portfolio | | Vice President of the Trust since 2001 and President of the Portfolio since 2002 | | Executive Vice President and Chief Equity Investment Officer of EVC, EVM and BMR. Officer of 71 registered investment companies managed by EVM or BMR. | |
|
| Walter A. Row, III 7/20/57 | | Vice President of the Trust | | Since 2001 | | Director of Equity Research and a Vice President of EVM and BMR. Officer of 33 registered investment companies managed by EVM or BMR. | |
|
| Judith A. Saryan 8/21/54 | | Vice President of the Trust | | Since 2003 | | Vice President of EVM and BMR. Officer of 50 registered investment companies managed by EVM or BMR. | |
|
| Susan Schiff 3/13/61 | | Vice President of the Trust | | Since 2002 | | Vice President Of EVM and BMR. Officer of 30 registered investment companies managed by EVM or BMR. | |
|
| Barbara E. Campbell 6/19/57 | | Treasurer of the Trust | | Since 2005(2) | | Vice President of EVM and BMR. Officer of 170 registered investment companies managed by EVM or BMR. | |
|
30
Eaton Vance Tax-Managed Multi-Cap Opportunity Fund
MANAGEMENT AND ORGANIZATION CONT'D
Name and
Date of Birth | | Position(s)
with the
Trust and
the Portfolio | | Term of
Office and
Length of
Service | | Principal Occupation(s)
During Past Five Years | |
| Principal Officers who are not Trustees (continued) | |
|
| Kevin M. Connerty 4/20/64 | | Treasurer of the Portfolio | | Since 2005 | | Vice President of EVM and BMR. Previously, Director and Vice President of PFPC Inc. (1999-2005). Officer of 97 registered investment companies managed by EVM or BMR. | |
|
| Alan R. Dynner 10/10/40 | | Secretary | | Secretary of the Trust since 1997 and of the Portfolio since 2000 | | Vice President, Secretary and Chief Legal Officer of BMR, EVM, EVD, EV and EVC. Officer of 170 registered investment companies managed by EVM or BMR. | |
|
| Paul M. O'Neil 7/11/53 | | Chief Compliance Officer | | Since 2004 | | Vice President of EVM and BMR. Officer of 170 registered investment companies managed by EVM or BMR. | |
|
(1) Includes both master and feeder funds in a master-feeder structure
(2) Prior to 2005, Ms. Campbell served as Assistant Treasurer of the Trust since 1995.
The SAI for the Fund includes additional information about the Trustees and officers of the Fund and the Portfolio and can be obtained without charge by calling 1-800-225-6265.
31
This Page Intentionally Left Blank
Investment Adviser of Tax-Managed Multi-Cap Opportunity Portfolio
Boston Management and Research
The Eaton Vance Building
255 State Street
Boston, MA 02109
Administrator of Eaton Vance Tax-Managed Multi-Cap Opportunity Fund
Eaton Vance Management
The Eaton Vance Building
255 State Street
Boston, MA 02109
Principal Underwriter
Eaton Vance Distributors, Inc.
The Eaton Vance Building
255 State Street
Boston, MA 02109
(617) 482-8260
Custodian
Investors Bank & Trust Company
200 Clarendon Street
Boston, MA 02116
Transfer Agent
PFPC Inc.
Attn: Eaton Vance Funds
P.O. Box 9653
Providence, RI 02940-9653
(800) 262-1122
Independent Registered Public Accounting Firm
Deloitte & Touche LLP
200 Berkeley Street
Boston, MA 02116-5022
Eaton Vance Tax-Managed Multi-Cap Opportunity Fund
The Eaton Vance Building
255 State Street
Boston, MA 02109
This report must be preceded or accompanied by a current prospectus. Before investing, investors should consider carefully the Fund's investment objective(s), risks, and charges and expenses. The Fund's current prospectus contains this and other information about the Fund and is available through your financial advisor. Please read the prospectus carefully before you invest or send money. For further information please call 1-800-225-6265.
824-12/06 TMCAPSRC

Annual Report October 31, 2006


EATON VANCE
TAX-MANAGED
INTERNATIONAL
EQUITY
FUND
IMPORTANT NOTICES REGARDING PRIVACY,
DELIVERY OF SHAREHOLDER DOCUMENTS,
PORTFOLIO HOLDINGS AND PROXY VOTING
Privacy. The Eaton Vance organization is committed to ensuring your financial privacy. Each of the financial institutions identified below has in effect the following policy ("Privacy Policy") with respect to nonpublic personal information about its customers:
• Only such information received from you, through application forms or otherwise, and information about your Eaton Vance fund transactions will be collected. This may include information such as name, address, social security number, tax status, account balances and transactions.
• None of such information about you (or former customers) will be disclosed to anyone, except as permitted by law (which includes disclosure to employees necessary to service your account). In the normal course of servicing a customer's account, Eaton Vance may share information with unaffiliated third parties that perform various required services such as transfer agents, custodians and broker/dealers.
• Policies and procedures (including physical, electronic and procedural safeguards) are in place that are designed to protect the confidentiality of such information.
• We reserve the right to change our Privacy Policy at any time upon proper notification to you. Customers may want to review our Policy periodically for changes by accessing the link on our homepage: www.eatonvance.com.
Our pledge of privacy applies to the following entities within the Eaton Vance organization: the Eaton Vance Family of Funds, Eaton Vance Management, Eaton Vance Investment Counsel, Boston Management and Research, and Eaton Vance Distributors, Inc.
In addition, our Privacy Policy only applies to those Eaton Vance customers who are individuals and who have a direct relationship with us. If a customer's account (i.e. fund shares) is held in the name of a third-party financial adviser/ broker-dealer, it is likely that only such adviser's privacy policies apply to the customer. This notice supersedes all previously issued privacy disclosures.
For more information about Eaton Vance's Privacy Policy, please call 1-800-262-1122.
Delivery of Shareholder Documents. The Securities and Exchange Commission (the "SEC") permits funds to deliver only one copy of shareholder documents, including prospectuses, proxy statements and shareholder reports, to fund investors with multiple accounts at the same residential or post office box address. This practice is often called "householding" and it helps eliminate duplicate mailings to shareholders.
Eaton Vance, or your financial adviser, may household the mailing of your documents indefinitely unless you instruct Eaton Vance, or your financial adviser, otherwise.
If you would prefer that your Eaton Vance documents not be householded, please contact Eaton Vance at 1-800-262-1122, or contact your financial adviser.
Your instructions that householding not apply to delivery of your Eaton Vance documents will be effective within 30 days of receipt by Eaton Vance or your financial adviser.
Portfolio Holdings. Each Eaton Vance Fund and its underlying Portfolio (if applicable) will file a schedule of its portfolio holdings on Form N-Q with the SEC for the first and third quarters of each fiscal year. The Form N-Q will be available on the Eaton Vance website www.eatonvance.com, by calling Eaton Vance at 1-800-262-1122 or in the EDGAR database on the SEC's website at www.sec.gov. Form N-Q may also be reviewed and copied at the SEC's public reference room in Washington, D.C. (call 1-800-732-0330 for information on the operation of the public reference room).
Proxy Voting. From time to time, funds are required to vote proxies related to the securities held by the funds. The Eaton Vance Funds or their underlying Portfolios (if applicable) vote proxies according to a set of policies and procedures approved by the Funds' and Portfolios' Boards. You may obtain a description of these policies and procedures and information on how the Funds or Portfolios voted proxies relating to Portfolio securities during the most recent 12 month period ended June 30, without charge, upon request, by calling 1-800-262-1122. This description is also available on the SEC's website at www.sec.gov.
Eaton Vance Tax-Managed International Equity Fund as of October 31, 2006
MANAGEMENT’S DISCUSSION OF FUND PERFORMANCE

Edward R. Allen, III
Eagle Global Advisors
Co-Portfolio Manager

Thomas N. Hunt, III
Eagle Global Advisors
Co-Portfolio Manager
The Fund
Performance for the Past Year
· For the year ended October 31, 2006, the Fund’s Class A shares had a total return of 28.85%. This return was the result of an increase in net asset value (NAV) per share to $11.08 on October 31, 2006, from $8.67 on October 31, 2005, and the reinvestment of $0.075 per share in dividend income.(1)
· The Fund’s Class B shares had a total return of 27.83% for the same period, the result of an increase in NAV per share to $10.51 from $8.23 and the reinvestment of $0.009 per share in dividend income.(1)
· The Fund’s Class C shares had a total return of 27.96% for the same period, the result of an increase in NAV per share to $10.50 from $8.22 and the reinvestment of $0.016 per share in dividend income.(1)
· For comparison, the Fund’s benchmark, the Morgan Stanley Capital International Europe, Australasia, and Far East Index (“MSCI EAFE Index”) — a broad-based, unmanaged market index of international stocks – had a total return of 27.52% for the year ended October 31, 2006. The Fund’s peer group, the Lipper International Multi-Cap Core Funds Classification, had an average return of 26.57% for the same period .(2)
Management Discussion
· The international investment environment was generally positive during the 12 months ended October 31, 2006, against a backdrop of strong foreign economies relative to the U.S. International returns significantly outpaced those of the U.S. markets: MSCI EAFE Index’s return of 27.52% compared to the S&P 500 Index’s return of 16.33% for the period.(2) In particular, Europe accelerated and Asia remained strong, while the U.S. economy showed signs of slowing. In addition to the generally favorable investment environment, foreign currency appreciation also accounted for a portion of the international markets’ outperformance versus the U.S.
· For the 12 months ended October 31, 2006, the Fund had strong positive returns, outperforming the benchmark MSCI EAFE Index. The Fund currently invests its assets in a separate registered investment company, Tax-Managed International Equity Portfolio (the “Portfolio”), with the same objectives and policies as the Fund. Individual stock selection in the Portfolio was the major driver of the Fund’s outperformance during the fiscal year. Stocks adding relative value were found in consumer finance, electric utilities, and oil and gas. Selections detracting from performance included stocks in the real estate management and development industry, as well as industrial trading companies and distributors.
· Overall, the Portfolio’s overweighting of the best-performing sectors, such as energy, telecommunications, and utilities contributed to Fund performance during the period. Additionally, the Fund’s performance was aided by the Portfolio’s overweighting in outperforming industries: energy equipment and services, diversified financial services, and office
electronics.(3)
Past performance is no guarantee of future results. Returns are historical and are calculated by determining the percentage change in net asset value or offering price (as applicable) with all distributions reinvested. Investment return and principal value will fluctuate so that shares, when redeemed, may be worth more or less than their original cost. Performance is for stated time period only; due to market volatility, the Fund’s current performance may be lower or higher than the quoted return. Fund performance during certain periods reflects the strong stock market performance and/or the strong performance of stocks held during those periods. This performance is not typical and may not be repeated. For performance as of the most recent month end, please refer to www.eatonvance.com.
(1) These returns do not include the 5.75% maximum sales charge for Class A shares or the applicable contingent deferred sales charge (CDSC) for Class B and Class C shares. Class A shares are subject to a 1% redemption fee if redeemed or exchanged within 90 days of settlement of purchase. If sales charges were deducted, the returns would be lower.
(2) It is not possible to invest directly in an Index or a Lipper Classification. The Index’s total return does not reflect commissions or expenses that would have been incurred if an investor individually purchased or sold the securities represented in the Index. The Lipper Average is the average total return, at net asset value, of the funds that are in the same Lipper Classification as the Fund.
(3) Sector weightings are subject to change due to active management.
Fund shares are not insured by the FDIC and are not deposits or other obligations of, or guaranteed by, any depository institution. Shares are subject to investment risks, including possible loss of principal invested.
See pages 3 and 4 for more performance information including after-tax returns.
1
· Regional allocation played a role in the Fund’s performance for the fiscal year, albeit to a lesser degree. Management’s underweighting of Japan relative to the MSCI EAFE Index was a plus, as was an allocation to certain emerging markets.(2) The Portfolio’s Canadian holdings, as well as an underweighting in stocks from the United Kingdom, detracted from the Fund’s performance.
· The Portfolio’s style focus detracted modestly from performance. While the Portfolio’s focus is large-cap growth, small-caps and value stocks have been outperforming for the past three years. However, towards the end of the reporting period, there were indications that large-cap growth may be coming back into favor.
· Management continued to implement tax-management strategies in making selections for the Portfolio, striving to purchase stocks primarily from a long-term perspective, emphasizing capital appreciation and dividends that qualify for federal income taxation at long-term capital gains rates.
The views expressed throughout this report are those of the portfolio managers and are current only through the end of the period of the report as stated on the cover. These views are subject to change at any time based upon market or other conditions, and the investment adviser disclaims any responsibility to update such views. These views may not be relied on as investment advice and, because investment decisions for a fund are based on many factors, may not be relied on as an indication of trading intent on behalf of any Eaton Vance fund.
Global Allocation*
By net assets
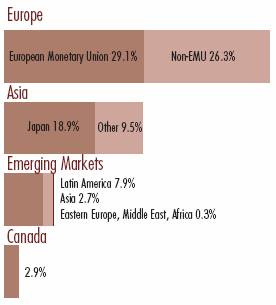
* As a percentage of the Fund’s net assets as of October 31, 2006. Portfolio information may not be representative of the Portfolio’s current or future investments and may change due to active management.
Top Ten Equity Holdings**
By net assets
Total SA | | 2.7 | % |
BT Group PLC | | 2.6 | |
RWE AG | | 2.5 | |
Acergy SA | | 2.4 | |
Barclays PLC | | 2.4 | |
Endesa SA | | 2.3 | |
ING Groep NV | | 2.3 | |
Roche Holding AG | | 2.3 | |
UBS AG | | 2.2 | |
Rio Tinto, Ltd. | | 2.2 | |
** Top Ten Equity Holdings represented 23.9% of Portfolio net assets as of October 31, 2006. Holdings are subject to change due to active management.
2
Eaton Vance Tax-Managed International Equity Fund as of October 31, 2006
FUND PERFORMANCE
The line graphs and table set forth below provide information about the Fund’s performance. The line graphs compare the performance of Class A, Class B and Class C of the Fund with that of the MSCI EAFE Index, a broad-based, unmanaged index of international stocks. The lines on the graphs represent the total returns of a hypothetical investment of $10,000 in each of Class A, Class B and Class C and the MSCI EAFE Index. Class A total returns are presented at net asset value and maximum public offering price. The table includes the total returns of each Class of the Fund at net asset value and public offering price. The performance presented below does not reflect the deduction of taxes, if any, that a shareholder would pay on distributions or redemptions of Fund shares.
Performance* | | Class A | | Class B | | Class C | |
Average Annual Total Returns (at net asset value) | | | | | | | |
One Year | | 28.85 | % | 27.83 | % | 27.96 | % |
Five Years | | 8.73 | % | 7.91 | % | 7.94 | % |
Life of Fund† | | 1.39 | % | 0.62 | % | 0.61 | % |
SEC Average Annual Total Returns (including sales charge or applicable CDSC) | | | | | | | |
One Year | | 21.42 | % | 22.83 | % | 26.96 | % |
Five Years | | 7.45 | % | 7.61 | % | 7.94 | % |
Life of Fund† | | 0.69 | % | 0.62 | % | 0.61 | % |
† Inception Dates – Class A: 4/22/98; Class B: 4/22/98; Class C: 4/22/98
* Average annual total returns do not include the 5.75% maximum sales charge for Class A shares or the applicable contingent deferred sales charge (CDSC) for Class B and Class C shares. If sales charges were deducted, the returns would be lower. Class A shares are subject to a 1% redemption fee if redeemed or exchanged within 90 days of settlement of purchase. SEC average annual total returns for Class A reflect the maximum 5.75% sales charge. SEC returns for Class B shares reflect the applicable CDSC based on the following schedule: 5% - 1st and 2nd years; 4% - 3rd year; 3% - 4th year; 2% - 5th year; 1% - 6th year. SEC returns for Class C reflect a 1% CDSC for the first year.
Past performance is no guarantee of future results. Returns are historical and are calculated by determining the percentage change in net asset value or offering price (as applicable) with all distributions reinvested. Investment return and principal value will fluctuate so that shares, when redeemed, may be worth more or less than their original cost. Performance is for stated time period only; due to market volatility, the Fund’s current performance may be lower or higher than the quoted return. Fund performance during certain periods reflects the strong stock market performance and/or the strong performance of stocks held during those periods. This performance is not typical and may not be repeated. For performance as of the most recent month end, please refer to www.eatonvance.com.
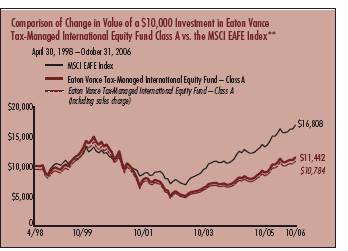
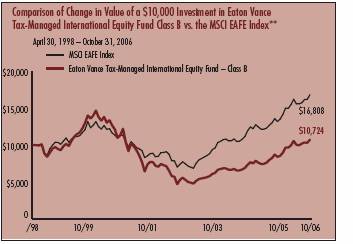

** Source: Thomson Financial. Class A, Class B and Class C of the Fund commenced investment operations on 4/22/98. It is not possible to invest directly in an Index. The Index’s total returns do not reflect commissions or expenses that would have been incurred if an investor individually purchased or sold the securities represented in the Index.
3
“Return Before Taxes” does not take into consideration shareholder taxes. It is most relevant to tax-free or tax-deferred shareholder accounts. “Return After Taxes on Distributions” reflects the impact of federal income taxes due on Fund distributions of dividends and capital gains. It is most relevant to taxpaying shareholders who continue to hold their shares. “Return After Taxes on Distributions and Sale of Fund Shares” also reflects the impact of taxes on capital gain or loss realized upon a sale of shares. It is most relevant to taxpaying shareholders who sell their shares.
Average Annual Total Returns
(For the periods ended October 31, 2006)
Returns at Net Asset Value (NAV) (Class A)
| | One Year | | Five Years | | Life of Fund | |
Return Before Taxes | | 28.85 | % | 8.73 | % | 1.39 | % |
Return After Taxes on Distributions | | 28.87 | % | 8.85 | % | 1.47 | % |
Return After Taxes on Distributions and Sale of Fund Shares | | 19.07 | % | 7.72 | % | 1.29 | % |
Returns at Public Offering Price (POP) (Class A)
| | One Year | | Five Years | | Life of Fund | |
Return Before Taxes | | 21.42 | % | 7.45 | % | 0.69 | % |
Return After Taxes on Distributions | | 21.44 | % | 7.56 | % | 0.76 | % |
Return After Taxes on Distributions and Sale of Fund Shares | | 14.23 | % | 6.58 | % | 0.68 | % |
Average Annual Total Returns
(For the periods ended October 31, 2006)
Returns at Net Asset Value (NAV) (Class B)
| | One Year | | Five Years | | Life of Fund | |
Return Before Taxes | | 27.83 | % | 7.91 | % | 0.62 | % |
Return After Taxes on Distributions | | 28.00 | % | 8.05 | % | 0.71 | % |
Return After Taxes on Distributions and Sale of Fund Shares | | 18.29 | % | 7.01 | % | 0.62 | % |
Returns at Public Offering Price (POP) (Class B)
| | One Year | | Five Years | | Life of Fund | |
Return Before Taxes | | 22.83 | % | 7.61 | % | 0.62 | % |
Return After Taxes on Distributions | | 23.00 | % | 7.76 | % | 0.71 | % |
Return After Taxes on Distributions and Sale of Fund Shares | | 15.04 | % | 6.75 | % | 0.62 | % |
Average Annual Total Returns
(For the periods ended October 31, 2006)
Returns at Net Asset Value (NAV) (Class C)
| | One Year | | Five Years | | Life of Fund | |
Return Before Taxes | | 27.96 | % | 7.94 | % | 0.61 | % |
Return After Taxes on Distributions | | 28.12 | % | 8.08 | % | 0.70 | % |
Return After Taxes on Distributions and Sale of Fund Shares | | 18.39 | % | 7.03 | % | 0.61 | % |
Returns at Public Offering Price (POP) (Class C)
| | One Year | | Five Years | | Life of Fund | |
Return Before Taxes | | 26.96 | % | 7.94 | % | 0.61 | % |
Return After Taxes on Distributions | | 27.12 | % | 8.08 | % | 0.70 | % |
Return After Taxes on Distributions and Sale of Fund Shares | | 17.74 | % | 7.03 | % | 0.61 | % |
Class A, Class B and Class C of the Fund commenced investment operations on 4/22/98. Returns at Public Offering Price (POP) reflect the deduction of the maximum initial sales charge and applicable CDSC, while Returns at Net Asset Value (NAV) do not.
After-tax returns are calculated using the highest historical individual federal income tax rate and do not reflect the impact of state and local taxes. Actual after-tax returns depend on a shareholder’s tax situation and may differ from those shown. After-tax returns are not relevant for shareholders who hold Fund shares in tax-deferred accounts or to shares held by non-taxable entities. Return After Taxes on Distributions for a period may be the same as Return Before Taxes for that period because no distributions were paid during that period, or because the taxable portion of distributions made during the period was insignificant. Also, Return After Taxes on Distributions and Sale of Fund Shares for a period may be greater than Return After Taxes on Distributions for the same period because of realized losses on the sale of Fund shares. The Fund’s after-tax returns also may reflect foreign tax credits passed by the Fund to its shareholders.
Past performance is no guarantee of future results. Returns are historical and are calculated by determining the percentage change in net asset value or offering price (as applicable) with all distributions reinvested. Investment return and principal value will fluctuate so that shares, when redeemed, may be worth more or less than their original cost. Performance is for the stated time period only; due to market volatility, the Fund’s current performance may be lower or higher than the quoted return. Fund performance during certain periods reflects the strong stock market performance and/or the strong performance of stocks held during those periods. This performance is not typical and may not be repeated. For performance as of the most recent month end, please refer to www.eatonvance.com.
4
Eaton Vance Tax-Managed International Equity Fund as of October 31, 2006
FUND EXPENSES
Example: As a shareholder of the Fund, you incur two types of costs: (1) transaction costs, including sales charges (loads) on purchases and redemption fees (if applicable); and (2) ongoing costs, including management fees; distribution or service fees; and other Fund expenses. This Example is intended to help you understand your ongoing costs (in dollars) of investing in the Fund and to compare these costs with the ongoing costs of investing in other mutual funds. The Example is based on an investment of $1,000 invested at the beginning of the period and held for the entire period (May 1, 2006 – October 31, 2006).
Actual Expenses: The first section of the table below provides information about actual account values and actual expenses. You may use the information in this section, together with the amount you invested, to estimate the expenses that you paid over the period. Simply divide your account value by $1,000 (for example, an $8,600 account value divided by $1,000 = 8.6), then multiply the result by the number in the first section under the heading entitled "Expenses Paid During Period" to estimate the expenses you paid on your account during this period.
Hypothetical Example for Comparison Purposes: The second section of the table below provides information about hypothetical account values and hypothetical expenses based on the actual Fund expense ratio and an assumed rate of return of 5% per year (before expenses), which is not the actual return of the Fund. The hypothetical account values and expenses may not be used to estimate the actual ending account balance or expenses you paid for the period. You may use this information to compare the ongoing costs of investing in your Fund and other funds. To do so, compare this 5% hypothetical example with the 5% hypothetical examples that appear in the shareholder reports of the other funds.
Please note that the expenses shown in the table are meant to highlight your ongoing costs only and do not reflect any transactional costs, such as sales charges (loads) or redemption fees (if applicable). Therefore, the second section of the table is useful in comparing ongoing costs only, and will not help you determine the relative total costs of owning different funds. In addition, if these transactional costs were included, your costs would have been higher.
Eaton Vance Tax-Managed International Equity Fund
| | | Beginning Account Value
(5/1/06) | | Ending Account Value
(10/31/06) | | Expenses Paid During Period*
(5/1/06 – 10/31/06) | |
| Actual | |
| Class A | | $ | 1,000.00 | | | $ | 1,020.30 | | | $ | 8.40 | | |
| Class B | | $ | 1,000.00 | | | $ | 1,016.40 | | | $ | 12.15 | | |
| Class C | | $ | 1,000.00 | | | $ | 1,017.40 | | | $ | 12.15 | | |
| Hypothetical | |
| (5% return per year before expenses) | |
| Class A | | $ | 1,000.00 | | | $ | 1,016.90 | | | $ | 8.39 | | |
| Class B | | $ | 1,000.00 | | | $ | 1,013.20 | | | $ | 12.13 | | |
| Class C | | $ | 1,000.00 | | | $ | 1,013.20 | | | $ | 12.13 | | |
* Expenses are equal to the Fund's annualized expense ratio of 1.65% for Class A shares, 2.39% for Class B shares, and 2.39% for Class C shares, multiplied by the average account value over the period, multiplied by 184/365 (to reflect the one-half year period). The Example assumes that the $1,000 was invested at the net asset value per share determined at the close of business on April 30, 2006. The Example reflects the expenses of both the Fund and the Portfolio.
5
Eaton Vance Tax-Managed International Equity Fund as of October 31, 2006
FINANCIAL STATEMENTS
Statement of Assets and Liabilities
As of October 31, 2006
| Assets | |
Investment in Tax-Managed International Equity Portfolio, at value
(identified cost, $75,447,856) | | $ | 116,769,007 | | |
| Receivable for Fund shares sold | | | 441,857 | | |
| Total assets | | $ | 117,210,864 | | |
| Liabilities | |
| Payable for Fund shares redeemed | | $ | 148,914 | | |
| Payable to affiliate for distribution and service fees | | | 60,134 | | |
| Payable to affiliate for Trustees' fees | | | 141 | | |
| Accrued expenses | | | 76,777 | | |
| Total liabilities | | $ | 285,966 | | |
| Net Assets | | $ | 116,924,898 | | |
| Sources of Net Assets | |
| Paid-in capital | | $ | 187,338,476 | | |
Accumulated net realized loss from Portfolio (computed on the basis
of identified cost) | | | (111,626,956 | ) | |
| Accumulated net investment loss | | | (107,773 | ) | |
Net unrealized appreciation from Portfolio (computed on the basis
of identified cost) | | | 41,321,151 | | |
| Total | | $ | 116,924,898 | | |
| Class A Shares | |
| Net Assets | | $ | 59,485,865 | | |
| Shares Outstanding | | | 5,367,962 | | |
Net Asset Value and Redemption Price Per Share
(net assets ÷ shares of beneficial interest outstanding) | | $ | 11.08 | | |
Maximum Offering Price Per Share
(100 ÷ 94.25 of $11.08) | | $ | 11.76 | | |
| Class B Shares | |
| Net Assets | | $ | 29,213,890 | | |
| Shares Outstanding | | | 2,778,358 | | |
Net Asset Value, Offering Price and Redemption Price Per Share
(net assets ÷ shares of beneficial interest outstanding) | | $ | 10.51 | | |
| Class C Shares | |
| Net Assets | | $ | 28,225,143 | | |
| Shares Outstanding | | | 2,688,540 | | |
Net Asset Value, Offering Price and Redemption Price Per Share
(net assets ÷ shares of beneficial interest outstanding) | | $ | 10.50 | | |
| On sales of $50,000 or more, the offering price of Class A shares is reduced. | |
Statement of Operations
For the Year Ended
October 31, 2006
| Investment Income | |
| Dividends allocated from Portfolio (net of foreign taxes, $230,904) | | $ | 2,263,853 | | |
| Interest allocated from Portfolio | | | 122,076 | | |
| Expenses allocated from Portfolio | | | (1,067,283 | ) | |
| Net investment income from Portfolio | | $ | 1,318,646 | | |
| Expenses | |
| Trustees' fees and expenses | | $ | 2,035 | | |
Distribution and service fees
Class A | | | 104,470 | | |
| Class B | | | 297,644 | | |
| Class C | | | 239,004 | | |
| Transfer and dividend disbursing agent fees | | | 168,426 | | |
| Registration fees | | | 51,636 | | |
| Printing and postage | | | 27,456 | | |
| Custodian fee | | | 20,183 | | |
| Legal and accounting services | | | 19,005 | | |
| Miscellaneous | | | 3,950 | | |
| Total expenses | | $ | 933,809 | | |
| Net investment income | | $ | 384,837 | | |
Realized and Unrealized
Gain (Loss) from Portfolio | |
Net realized gain (loss) —
Investment transactions (identified cost basis) | | $ | 4,293,857 | | |
| Foreign currency transactions | | | (115,026 | ) | |
| Net realized gain | | $ | 4,178,831 | | |
Change in unrealized appreciation (depreciation) —
Investments (identified cost basis) | | $ | 18,119,467 | | |
| Foreign currency | | | 5,071 | | |
| Net change in unrealized appreciation (depreciation) | | $ | 18,124,538 | | |
| Net realized and unrealized gain | | $ | 22,303,369 | | |
| Net increase in net assets from operations | | $ | 22,688,206 | | |
See notes to financial statements
6
Eaton Vance Tax-Managed International Equity Fund as of October 31, 2006
FINANCIAL STATEMENTS CONT'D
Statements of Changes in Net Assets
Increase (Decrease)
in Net Assets | | Year Ended
October 31, 2006 | | Year Ended
October 31, 2005 | |
From operations —
Net investment income | | $ | 384,837 | | | $ | 168,135 | | |
Net realized gain from investments and
foreign currency transactions | | | 4,178,831 | | | | 4,089,306 | | |
Net change in unrealized appreciation
(depreciation) from investments and
foreign currency | | | 18,124,538 | | | | 10,289,126 | | |
| Net increase in net assets from operations | | $ | 22,688,206 | | | $ | 14,546,567 | | |
Distributions to shareholders —
From net investment income
Class A | | $ | (266,710 | ) | | $ | — | | |
| Class B | | | (29,574 | ) | | | — | | |
| Class C | | | (35,806 | ) | | | — | | |
| Total distributions to shareholders | | $ | (332,090 | ) | | $ | — | | |
Transactions in shares of beneficial interest —
Proceeds from sale of shares
Class A | | $ | 26,439,564 | | | $ | 4,927,186 | | |
| Class B | | | 3,438,109 | | | | 2,024,959 | | |
| Class C | | | 8,151,469 | | | | 2,462,849 | | |
Net asset value of shares issued to
shareholders in payment of
distributions declared
Class A | | | 205,637 | | | | — | | |
| Class B | | | 25,416 | | | | — | | |
| Class C | | | 27,556 | | | | — | | |
Cost of shares redeemed
Class A | | | (8,678,616 | ) | | | (5,677,410 | ) | |
| Class B | | | (7,058,912 | ) | | | (7,027,365 | ) | |
| Class C | | | (4,128,144 | ) | | | (5,171,725 | ) | |
Net asset value of shares exchanged
Class A | | | 2,198,364 | | | | 171,122 | | |
| Class B | | | (2,198,364 | ) | | | (171,122 | ) | |
| Redemption fees | | | 4,264 | | | | 1,025 | | |
Net increase (decrease) in net assets from
Fund share transactions | | $ | 18,426,343 | | | $ | (8,460,481 | ) | |
| Net increase in net assets | | $ | 40,782,459 | | | $ | 6,086,086 | | |
| Net Assets | |
| At beginning of year | | $ | 76,142,439 | | | $ | 70,056,353 | | |
| At end of year | | $ | 116,924,898 | | | $ | 76,142,439 | | |
Accumulated net investment
loss included in net assets | |
| At end of year | | $ | (107,773 | ) | | $ | (45,494 | ) | |
See notes to financial statements
7
Eaton Vance Tax-Managed International Equity Fund as of October 31, 2006
FINANCIAL STATEMENTS CONT'D
Financial Highlights
| | | Class A | |
| | | Year Ended October 31, | |
| | | 2006(1) | | 2005(1) | | 2004(1) | | 2003(1) | | 2002(1) | |
| Net asset value — Beginning of year | | $ | 8.670 | | | $ | 7.080 | | | $ | 6.210 | | | $ | 5.330 | | | $ | 7.350 | | |
| Income (loss) from operations | |
| Net investment income (loss) | | $ | 0.082 | | | $ | 0.056 | | | $ | 0.026 | | | $ | 0.015 | | | $ | (0.044 | ) | |
| Net realized and unrealized gain (loss) | | | 2.403 | | | | 1.534 | | | | 0.844 | | | | 0.865 | | | | (1.976 | ) | |
| Total income (loss) from operations | | $ | 2.485 | | | $ | 1.590 | | | $ | 0.870 | | | $ | 0.880 | | | $ | (2.020 | ) | |
| Less distributions | |
| From net investment income | | $ | (0.075 | ) | | $ | — | | | $ | — | | | $ | — | | | $ | — | | |
| Total distributions | | $ | (0.075 | ) | | $ | — | | | $ | — | | | $ | — | | | $ | — | | |
| Redemption fees | | $ | 0.000 | (2) | | $ | 0.000 | (2) | | $ | 0.000 | (2) | | $ | — | | | $ | — | | |
| Net asset value — End of year | | $ | 11.080 | | | $ | 8.670 | | | $ | 7.080 | | | $ | 6.210 | | | $ | 5.330 | | |
| Total Return(3) | | | 28.85 | % | | | 22.46 | % | | | 14.01 | % | | | 16.51 | % | | | (27.48 | )% | |
| Ratios/Supplemental Data | |
| Net assets, end of year (000's omitted) | | $ | 59,486 | | | $ | 29,634 | | | $ | 24,714 | | | $ | 23,857 | | | $ | 27,929 | | |
| Ratios (As a percentage of average daily net assets): | |
| Expenses before custodian fee reduction(4) | | | 1.67 | % | | | 1.89 | % | | | 2.08 | % | | | 2.09 | % | | | 1.82 | % | |
| Expenses after custodian fee reduction(4) | | | 1.67 | % | | | 1.89 | % | | | 2.08 | % | | | 2.09 | % | | | 1.82 | % | |
| Net investment income (loss) | | | 0.81 | % | | | 0.70 | % | | | 0.38 | % | | | 0.28 | % | | | (0.64 | )% | |
| Portfolio Turnover | | | 25 | % | | | 39 | % | | | 62 | % | | | 100 | % | | | 128 | % | |
(1) Net investment income (loss) and redemption fees per share were computed using average shares outstanding.
(2) Amount represents less than $0.0005 per share.
(3) Returns are historical and are calculated by determining the percentage change in net asset value with all distributions reinvested. Total return is not computed on an annualized basis.
(4) Includes the Fund's share of the Portfolio's allocated expenses.
See notes to financial statements
8
Eaton Vance Tax-Managed International Equity Fund as of October 31, 2006
FINANCIAL STATEMENTS CONT'D
Financial Highlights
| | | Class B | |
| | | Year Ended October 31, | |
| | | 2006(1) | | 2005(1) | | 2004(1) | | 2003(1) | | 2002(1) | |
| Net asset value — Beginning of year | | $ | 8.230 | | | $ | 6.770 | | | $ | 5.980 | | | $ | 5.170 | | | $ | 7.190 | | |
| Income (loss) from operations | |
| Net investment income (loss) | | $ | 0.008 | | | $ | (0.004 | ) | | $ | (0.026 | ) | | $ | (0.024 | ) | | $ | (0.092 | ) | |
| Net realized and unrealized gain (loss) | | | 2.281 | | | | 1.464 | | | | 0.816 | | | | 0.834 | | | | (1.928 | ) | |
| Total income (loss) from operations | | $ | 2.289 | | | $ | 1.460 | | | $ | 0.790 | | | $ | 0.810 | | | $ | (2.020 | ) | |
| Less distributions | |
| From net investment income | | $ | (0.009 | ) | | $ | — | | | $ | — | | | $ | — | | | $ | — | | |
| Total distributions | | $ | (0.009 | ) | | $ | — | | | $ | — | | | $ | — | | | $ | — | | |
| Redemption fees | | $ | 0.000 | (2) | | $ | 0.000 | (2) | | $ | 0.000 | (2) | | $ | — | | | $ | — | | |
| Net asset value — End of year | | $ | 10.510 | | | $ | 8.230 | | | $ | 6.770 | | | $ | 5.980 | | | $ | 5.170 | | |
| Total Return(3) | | | 27.83 | % | | | 21.56 | % | | | 13.21 | % | | | 15.67 | % | | | (28.10 | )% | |
| Ratios/Supplemental Data | |
| Net assets, end of year (000's omitted) | | $ | 29,214 | | | $ | 27,861 | | | $ | 27,546 | | | $ | 27,764 | | | $ | 29,610 | | |
| Ratios (As a percentage of average daily net assets): | |
| Expenses before custodian fee reduction(4) | | | 2.42 | % | | | 2.64 | % | | | 2.83 | % | | | 2.84 | % | | | 2.57 | % | |
| Expenses after custodian fee reduction(4) | | | 2.42 | % | | | 2.64 | % | | | 2.83 | % | | | 2.84 | % | | | 2.57 | % | |
| Net investment income (loss) | | | 0.08 | % | | | (0.05 | )% | | | (0.40 | )% | | | (0.46 | )% | | | (1.38 | )% | |
| Portfolio Turnover | | | 25 | % | | | 39 | % | | | 62 | % | | | 100 | % | | | 128 | % | |
(1) Net investment income (loss) and redemption fees per share were computed using average shares outstanding.
(2) Amount represents less than $0.0005 per share.
(3) Returns are historical and are calculated by determining the percentage change in net asset value with all distributions reinvested. Total return is not computed on an annualized basis.
(4) Includes the Fund's share of the Portfolio's allocated expenses.
See notes to financial statements
9
Eaton Vance Tax-Managed International Equity Fund as of October 31, 2006
FINANCIAL STATEMENTS CONT'D
Financial Highlights
| | | Class C | |
| | | Year Ended October 31, | |
| | | 2006(1) | | 2005(1) | | 2004(1) | | 2003(1) | | 2002(1) | |
| Net asset value — Beginning of year | | $ | 8.220 | | | $ | 6.760 | | | $ | 5.970 | | | $ | 5.160 | | | $ | 7.180 | | |
| Income (loss) from operations | |
| Net investment income (loss) | | $ | 0.009 | | | $ | (0.004 | ) | | $ | (0.025 | ) | | $ | (0.023 | ) | | $ | (0.091 | ) | |
| Net realized and unrealized gain (loss) | | | 2.287 | | | | 1.464 | | | | 0.815 | | | | 0.833 | | | | (1.929 | ) | |
| Total income (loss) from operations | | $ | 2.296 | | | $ | 1.460 | | | $ | 0.790 | | | $ | 0.810 | | | $ | (2.020 | ) | |
| Less distributions | |
| From net investment income | | $ | (0.016 | ) | | $ | — | | | $ | — | | | $ | — | | | $ | — | | |
| Total distributions | | $ | (0.016 | ) | | $ | — | | | $ | — | | | $ | — | | | $ | — | | |
| Redemption fees | | $ | 0.000 | (2) | | $ | 0.000 | (2) | | $ | 0.000 | (2) | | $ | — | | | $ | — | | |
| Net asset value — End of year | | $ | 10.500 | | | $ | 8.220 | | | $ | 6.760 | | | $ | 5.970 | | | $ | 5.160 | | |
| Total Return(3) | | | 27.96 | % | | | 21.60 | % | | | 13.23 | % | | | 15.70 | % | | | (28.13 | )% | |
| Ratios/Supplemental Data | |
| Net assets, end of year (000's omitted) | | $ | 28,225 | | | $ | 18,647 | | | $ | 17,797 | | | $ | 18,616 | | | $ | 21,919 | | |
| Ratios (As a percentage of average daily net assets): | |
| Expenses before custodian fee reduction(4) | | | 2.42 | % | | | 2.64 | % | | | 2.83 | % | | | 2.84 | % | | | 2.57 | % | |
| Expenses after custodian fee reduction(4) | | | 2.42 | % | | | 2.64 | % | | | 2.83 | % | | | 2.84 | % | | | 2.57 | % | |
| Net investment income (loss) | | | 0.09 | % | | | (0.06 | )% | | | (0.39 | )% | | | (0.44 | )% | | | (1.38 | )% | |
| Portfolio Turnover | | | 25 | % | | | 39 | % | | | 62 | % | | | 100 | % | | | 128 | % | |
(1) Net investment income (loss) and redemption fees per share were computed using average shares outstanding.
(2) Amount represents less than $0.0005 per share.
(3) Returns are historical and are calculated by determining the percentage change in net asset value with all distributions reinvested. Total return is not computed on an annualized basis.
(4) Includes the Fund's share of the Portfolio's allocated expenses.
See notes to financial statements
10
Eaton Vance Tax-Managed International Equity Fund as of October 31, 2006
NOTES TO FINANCIAL STATEMENTS
1 Significant Accounting Policies
Eaton Vance Tax-Managed International Equity Fund (the Fund) is a diversified series of Eaton Vance Mutual Funds Trust (the Trust). The Trust is an entity of the type commonly known as a Massachusetts business trust and is registered under the Investment Company Act of 1940, as amended, as an open-end management investment company. The Fund offers three classes of shares. Class A shares are generally sold subject to a sales charge imposed at time of purchase. Class B and Class C shares are sold at net asset value and are subject to a contingent deferred sales charge (see Note 6). The Trustees have adopted a conversion feature pursuant to which Class B shares of the Fund automatically convert to Class A shares eight years after their purchase as described in the Fund's prospectus. Each class represents a pro-rata interest in the Fund, but votes separately on class-specific matters and (as noted below) is subject to different expe nses. Realized and unrealized gains and losses and net investment income, other than class-specific expenses, are allocated daily to each class of shares based on the relative net assets of each class to the total net assets of the Fund. Each class of shares differs in its distribution plan and certain other class specific expenses. The Fund invests all of its investable assets in interests in the Tax-Managed International Equity Portfolio (the Portfolio), a New York Trust, having the same investment objective as the Fund. The value of the Fund's investment in the Portfolio reflects the Fund's proportionate interest in the net assets of the Portfolio (51.2% at October 31, 2006). The performance of the Fund is directly affected by the performance of the Portfolio. The financial statements of the Portfolio, including the portfolio of investments, are included elsewhere in this report and should be read in conjunction with the Fund's financial statements.
The following is a summary of significant accounting policies consistently followed by the Fund in the preparation of its financial statements. The policies are in conformity with accounting principles generally accepted in the United States of America.
A Investment Valuation — Valuation of securities by the Portfolio is discussed in Note 1A of the Portfolio's Notes to Financial Statements, which are included elsewhere in this report.
B Income — The Fund's net investment income or loss consists of the Fund's pro-rata share of the net investment income or loss of the Portfolio, less all actual and accrued expenses of the Fund.
C Federal Taxes — The Fund's policy is to comply with the provisions of the Internal Revenue Code applicable to regulated investment companies and to distribute to shareholders, each year, substantially all of its net investment income and all or substantially all of its net realized capital gains. Accordingly, no provision for federal income or excise tax is necessary. At October 31, 2006, the Fund, for federal income tax purposes, had a capital loss carryover of $111,387,296 which will reduce the taxable income arising from future net realized gain on investments, if any, to the extent permitted by the Internal Revenue Code and thus will reduce the amount of distributions to shareholders which would otherwise be necessary to relieve the Fund of any liability for federal income or excise tax. Such capital loss carryover will expire on October 31, 2009 ($22,320,758), October 31, 2010 ($49,131,487) and October 31, 2011 ($39,935,051).
D Expenses — The majority of expenses of the Trust are directly identifiable to an individual fund. Expenses which are not readily identifiable to a specific fund are allocated taking into consideration, among other things, the nature and type of expense and the relative size of the funds.
E Expense Reduction — Investors Bank & Trust Company (IBT) serves as custodian of the Fund. Pursuant to the custodian agreement, IBT receives a fee reduced by credits which are determined based on the average daily cash balance the Fund maintains with IBT. All credit balances used to reduce the Fund's custodian fees are reported as a reduction of expenses in the Statement of Operations.
F Use of Estimates — The preparation of the financial statements in conformity with accounting principles generally accepted in the United States of America requires management to make estimates and assumptions that affect the reported amounts of assets and liabilities at the date of the financial statements and the reported amounts of income and expense during the reporting period. Actual results could differ from those estimates.
G Indemnifications — Under the Trust's organizational documents, its officers and Trustees may be indemnified against certain liabilities and expenses arising out of the performance of their duties to the Fund and shareholders are indemnified against personal liability for obligations of the Trust. Additionally, in the normal course of business, the Fund enters into agreements with service providers that may contain indemnification clauses. The Fund's maximum exposure under these arrangements is unknown as this would involve future claims that may be made against the Fund that have not yet occurred.
11
Eaton Vance Tax-Managed International Equity Fund as of October 31, 2006
NOTES TO FINANCIAL STATEMENTS CONT'D
H Redemption Fee — Upon the redemption or exchange of shares by Class A shareholders within 90 days of the settlement of purchase, a fee of 1% of the current net asset value of these shares will be assessed and retained by the Fund for the benefit of the remaining shareholders. The redemption fee is accounted for as an addition to paid-in capital.
I Other — Investment transactions are accounted for on the date the securities are purchased or sold. Dividends to shareholders are recorded on the ex-dividend date.
2 Distributions to Shareholders
It is the present policy of the Fund to make at least one distribution annually (normally in December) of all or substantially all of its net investment income and at least one distribution annually of all or substantially all of its net realized capital gains (reduced by available capital loss carryforward from prior years, if any). Distributions are declared separately for each class of shares. Shareholders may reinvest distributions in shares of the same class of the Fund at the net asset value as of the ex-dividend date. Distributions are paid in the form of additional shares of the same class of the Fund or, at the election of the shareholder, in cash. The Fund distinguishes between distributions on a tax basis and a financial reporting basis. Accounting principles generally accepted in the United States of America require that only distributions in excess of tax basis earnings and profits be reported in the financial state ments as a return of capital. Permanent differences between book and tax accounting relating to distributions are reclassified to paid-in capital.
During the year ended October 31, 2006, paid-in capital was increased by $1,029, accumulated net investment income was decreased by $115,026 and accumulated net realized loss was decreased by $113,997 primarily due to differences between book and tax accounting for foreign currency gain/loss. This change had no effect on the net assets or the net asset value per share.
As of October 31, 2006, the components of distributable earnings (accumulated losses) on a tax basis were as follows:
| Undistributed income | | $ | 765,778 | | |
| Capital loss carryforward | | $ | (111,387,296 | ) | |
| Unrealized gain | | $ | 40,207,940 | | |
The tax character of distributions paid for the years ended October 31, 2006 and October 31, 2005 was as follows:
| | | Year Ended October 31, | |
| | | 2006 | | 2005 | |
| Distributions declared from: | |
| Ordinary income | | $ | 332,090 | | | | — | | |
3 Shares of Beneficial Interest
The Fund's Declaration of Trust permits the Trustees to issue an unlimited number of full and fractional shares of beneficial interest (without par value). Such shares may be issued in a number of different series (such as the Fund) and classes. Transactions in Fund shares were as follows:
| | | Year Ended October 31, | |
| Class A | | 2006 | | 2005 | |
| Sales | | | 2,576,187 | | | | 615,868 | | |
Issued to shareholders electing to receive
payments of distributions in Fund shares | | | 22,400 | | | | — | | |
| Redemptions | | | (865,189 | ) | | | (711,797 | ) | |
| Exchange from Class B shares | | | 217,520 | | | | 21,573 | | |
| Net increase (decrease) | | | 1,950,918 | | | | (74,356 | ) | |
| | | Year Ended October 31, | |
| Class B | | 2006 | | 2005 | |
| Sales | | | 357,782 | | | | 264,394 | | |
Issued to shareholders electing to receive
payments of distributions in Fund shares | | | 2,901 | | | | — | | |
| Redemptions | | | (738,547 | ) | | | (926,665 | ) | |
| Exchange to Class A shares | | | (228,763 | ) | | | (22,670 | ) | |
| Net decrease | | | (606,627 | ) | | | (684,941 | ) | |
| | | Year Ended October 31, | |
| Class C | | 2006 | | 2005 | |
| Sales | | | 851,048 | | | | 324,572 | | |
Issued to shareholders electing to receive
payments of distributions in Fund shares | | | 3,149 | | | | — | | |
| Redemptions | | | (433,492 | ) | | | (688,729 | ) | |
| Net increase (decrease) | | | 420,705 | | | | (364,157 | ) | |
Class A shares are subject to a 1% redemption fee if redeemed or exchanged within 90 days of the settlement of the purchase. For the year ended October 31, 2006, the Fund received $4,264 in redemption fees on Class A shares.
12
Eaton Vance Tax-Managed International Equity Fund as of October 31, 2006
NOTES TO FINANCIAL STATEMENTS CONT'D
4 Transactions with Affiliates
Eaton Vance Management (EVM) serves as the administrator to the Fund, but receives no compensation. The Portfolio has engaged Boston Management and Research (BMR), a subsidiary of EVM, to render investment advisory services. See Note 2 of the Portfolio's Notes to Financial Statements which are included elsewhere in this report. Except for Trustees of the Fund and the Portfolio who are not members of EVM's or BMR's organization, officers and Trustees receive remuneration for their services to the Fund out of the investment adviser fees earned by BMR. The Fund was informed that Eaton Vance Distributors, Inc. (EVD), a subsidiary of EVM and the Fund's principal underwriter, received $38,107 as its portion of the sales charge on sales of Class A shares for the year ended October 31, 2006. EVM serves as the sub-transfer agent of the Fund and receives from the transfer agent an aggregate fee based upon the actual expenses incurred by E VM in the performance of those services. For the year ended October 31, 2006, EVM received $12,252 in sub-transfer agent fees.
Certain officers and Trustees of the Fund and Portfolio are officers of the above organizations.
5 Distribution Plans
Class A has in effect a distribution plan pursuant to Rule 12b-1 under the Investment Company Act of 1940 (Class A Plan). The Class A Plan provides that the Fund will pay EVD a distribution and service fee of 0.25% of the Fund's average daily net assets attributable to Class A shares for each fiscal year for distribution services and facilities provided to the Fund by EVD, as well as for personal services and/or the maintenance of shareholder accounts. Distribution and service fees paid or accrued for the year ended October 31, 2006 amounted to $104,470 for Class A shares. The Fund also has in effect distribution plans for Class B shares (Class B Plan) and Class C shares (Class C Plan) pursuant to Rule 12b-1 under the Investment Company Act of 1940 (collectively, the "Plans"). The Class B and Class C Plans require the Fund to pay EVD amounts equal to 1/365 of 0.75% of the Fund's average daily net assets attributable to Class B a nd Class C shares for providing ongoing distribution services and facilities to the Fund. The Fund will automatically discontinue payments to EVD during any period in which there are no outstanding Uncovered Distribution Charges, which are equivalent to the sum of (i) 5% and 6.25% of the aggregate amount received by the Fund for the Class B and Class C shares sold, respectively, plus (ii) interest calculated by applying the rate of 1% over the prevailing prime rate to the outstanding balance of Uncovered Distribution Charges of EVD of each respective class, reduced by the aggregate amount of contingent deferred sales charges (see Note 6) and daily amounts theretofore paid to EVD by each respective class. The Fund paid or accrued $223,233 and $179,253 for Class B and Class C shares, respectively, to or payable to EVD for the year ended October 31, 2006, representing 0.75% of the average daily net assets for Class B and Class C shares. At October 31, 2006, the amount of Uncovered Distribution Charges of EVD calculated under the Plans was approximately $3,666,000 and $7,174,000 for Class B and Class C shares, respectively. The Class B and Class C Plans also authorize the Fund to make payments of service fees to EVD, investment dealers and other persons in amounts not exceeding 0.25% annually of the average daily net assets attributable to that Class. Service fees are paid for personal services and/or the maintenance of shareholder accounts. They are separate and distinct from the Class B and Class C sales commissions and distribution fees and, as such, are not subject to automatic discontinuance when there are no outstanding Uncovered Distribution Charges to EVD. Service fees paid or accrued for the year ended October 31, 2006 amounted to $74,411, and $59,751, for Class B and Class C shares, respectively.
6 Contingent Deferred Sales Charge
A contingent deferred sales charge (CDSC) generally is imposed on redemptions of Class B shares made within six years of purchase and on redemptions of Class C shares made within one year of purchase. Class A shares may be subject to a CDSC up to 1% if redeemed within two years of purchase (depending on the circumstances of purchase). Generally, the CDSC is based upon the lower of the net asset value at date of redemption or date of purchase. No charge is levied on shares acquired by reinvestment of dividends or capital gain distributions. The Class B CDSC is imposed at declining rates that begin at 5% in the case of redemptions in the first and second year after purchase, declining one percentage point in each subsequent year. Class C shares will be subject to a 1% CDSC if redeemed within one year of purchase. No CDSC is levied on shares which have been sold to EVM or its affiliates or to their respective employees or clients a nd may be waived under certain other limited conditions. CDSCs received on Class B and Class C redemptions are paid to EVD to reduce the amount of Uncovered Distribution Charges calculated under the Class B and Class C Plans, respectively (see Note 5). CDSCs received on Class B and Class C shares when no Uncovered Distribution Charges exist for the respective classes will be credited to the Fund. EVD received approximately $300, $58,000 and $1,000 of CDSC paid by shareholders for Class A, Class B and Class C shares, respectively, for the year ended October 31, 2006.
13
Eaton Vance Tax-Managed International Equity Fund as of October 31, 2006
NOTES TO FINANCIAL STATEMENTS CONT'D
7 Investment Transactions
Increases and decreases in the Fund's investment in the Portfolio aggregated $37,823,192 and $20,787,188 respectively, for the year ended October 31, 2006.
8 Recently Issued Accounting Pronouncements
In June 2006, the Financial Accounting Standards Board ("FASB") issued FASB Interpretation No. 48, ("FIN 48") "Accounting for Uncertainty in Income Taxes – an interpretation of FASB Statement No. 109". FIN 48 clarifies the accounting for uncertainty in income taxes recognized in accordance with FASB Statement No. 109, "Accounting for Income Taxes." This interpretation prescribes a recognition threshold and measurement attribute for the financial statement recognition and measurement of a tax position taken or expected to be taken in a tax return. It also provides guidance on de-recognition, classification, interest and penalties, accounting in interim periods, disclosure and transition. FIN 48 is effective for fiscal years beginning after December 15, 2006. Management is currently evaluating the impact of applying the various provisions of FIN 48.
In September 2006, the Financial Accounting Standards Board ("FASB") issued Statement of Financial Accounting Standards No. 157, ("FAS 157") "Fair Value Measurements". FAS 157 defines fair value, establishes a framework for measuring fair value in accordance with generally accepted accounting principles and expands disclosure about fair value measurements. FAS 157 is effective for fiscal years beginning after November 15, 2007. Management is currently evaluating the impact the adoption of FAS 157 will have on the Fund's financial statement disclosures.
14
Eaton Vance Tax-Managed International Equity Fund as of October 31, 2006
REPORT OF INDEPENDENT REGISTERED PUBLIC ACCOUNTING FIRM
To the Trustees of Eaton Vance Mutual Funds Trust and the Shareholders of Eaton Vance Tax-Managed International Equity Fund:
We have audited the accompanying statement of assets and liabilities of Eaton Vance Tax-Managed International Equity Fund (the "Fund") (one of the series of Eaton Vance Mutual Funds Trust), as of October 31, 2006, and the related statement of operations for the year then ended, the statements of changes in net assets for each of the two years in the period then ended, and the financial highlights for each of the five years in the period then ended. These financial statements and financial highlights are the responsibility of the Fund's management. Our responsibility is to express an opinion on these financial statements and financial highlights based on our audits.
We conducted our audits in accordance with the standards of the Public Company Accounting Oversight Board (United States). Those standards require that we plan and perform the audit to obtain reasonable assurance about whether the financial statements and financial highlights are free of material misstatement. The Fund is not required to have, nor were we engaged to perform, an audit of its internal control over financial reporting. Our audit included consideration of internal control over financial reporting as a basis for designing audit procedures that are appropriate in the circumstances, but not for the purpose of expressing an opinion on the effectiveness of the Fund's internal control over financial reporting. Accordingly, we express no such opinion. An audit also includes examining, on a test basis, evidence supporting the amounts and disclosures in the financial statements, assessing the accounting principles used and s ignificant estimates made by management, as well as evaluating the overall financial statement presentation. We believe that our audits provide a reasonable basis for our opinion.
In our opinion, the financial statements and financial highlights referred to above present fairly, in all material respects, the financial position of the Eaton Vance Tax-Managed International Equity Fund as of October 31, 2006, the results of its operations for the year then ended, the changes in its net assets for each of the two years in the period then ended and the financial highlights for each of the five years in the period then ended, in conformity with accounting principles generally accepted in the United States of America.
DELOITTE & TOUCHE LLP
Boston, Massachusetts
December 15, 2006
15
Eaton Vance Tax-Managed International Equity Fund as of October 31, 2006
FEDERAL TAX INFORMATION (Unaudited)
The Form 1099-DIV you receive in January 2007 will show the tax status of all distributions paid to your account in calendar 2006. Shareholders are advised to consult their own tax adviser with respect to the tax consequences of their investment in the Fund. As required by the Internal Revenue Code regulations, shareholders must be notified within 60 days of the Fund's fiscal year end regarding the status of the qualified dividend income for individuals and the foreign tax credit.
Qualified Dividend Income. The Fund designates approximately $2,349,758, or up to the maximum amount of such dividends allowable pursuant to the Internal Revenue Code, as qualified dividend income eligible for the reduced tax rate of 15%.
Foreign Tax Credit. The Fund designates a foreign tax credit of $230,904 and recognizes foreign source income of $2,494,757.
16
Tax-Managed International Equity Portfolio as of October 31, 2006
PORTFOLIO OF INVESTMENTS
| Common Stocks — 97.6% | |
| Security | | Shares | | Value | |
| Airlines — 1.7% | |
| Air France-KLM | | | 62,000 | | | $ | 2,208,361 | | |
| Gol Linhas Aereas Inteligentes SA ADR | | | 56,700 | | | | 1,766,205 | | |
| | | $ | 3,974,566 | | |
| Automobiles — 2.7% | |
| Honda Motor Co., Ltd. | | | 76,000 | | | $ | 2,677,905 | | |
| Toyota Motor Corp. | | | 60,000 | | | | 3,536,681 | | |
| | | $ | 6,214,586 | | |
| Beverages — 4.3% | |
| Coca-Cola Icecek Uretim AS(1) | | | 30,000 | | | $ | 175,805 | | |
| Diageo PLC | | | 120,000 | | | | 2,218,456 | | |
| Fomento Economico Mexicano SA de CV ADR | | | 44,000 | | | | 4,254,360 | | |
| Heineken Holding NV | | | 28,000 | | | | 1,094,281 | | |
| InBev NV | | | 37,400 | | | | 2,105,692 | | |
| | | $ | 9,848,594 | | |
| Capital Markets — 3.0% | |
| Deutsche Bank AG | | | 14,000 | | | $ | 1,768,900 | | |
| UBS AG | | | 84,000 | | | | 5,016,654 | | |
| | | $ | 6,785,554 | | |
| Chemicals — 0.8% | |
| BASF AG | | | 20,000 | | | $ | 1,766,039 | | |
| | | $ | 1,766,039 | | |
| Commercial Banks — 16.7% | |
| Anglo Irish Bank Corp. PLC | | | 77,400 | | | $ | 1,389,296 | | |
| Australia and New Zealand Banking Group, Ltd. | | | 138,500 | | | | 3,100,016 | | |
| Banco Bilbao Vizcaya Argentaria SA | | | 66,700 | | | | 1,609,915 | | |
| Banco Santander Central Hispano SA | | | 200,000 | | | | 3,461,461 | | |
| Bank of Ireland | | | 66,500 | | | | 1,331,528 | | |
| Barclays PLC | | | 400,000 | | | | 5,388,592 | | |
| BNP Paribas | | | 26,500 | | | | 2,910,520 | | |
| Danske Bank A/S | | | 52,700 | | | | 2,207,331 | | |
| DBS Group Holdings, Ltd. | | | 300,000 | | | | 3,921,642 | | |
| Grupo Financiero Banorte SA de C.V. | | | 500,000 | | | | 1,812,032 | | |
| HBOS PLC | | | 50,000 | | | | 1,035,679 | | |
| HSBC Holdings PLC | | | 151,780 | | | | 2,879,652 | | |
| Mitsubishi UFJ Financial Group, Inc. | | | 350 | | | | 4,431,882 | | |
| Security | | Shares | | Value | |
| Commercial Banks (continued) | |
| Societe Generale | | | 10,300 | | | $ | 1,710,006 | | |
| Sumitomo Trust and Banking Co., Ltd. (The) | | | 90,000 | | | | 963,846 | | |
| | | $ | 38,153,398 | | |
| Communications Equipment — 0.8% | |
| Nokia Oyj | | | 90,000 | | | $ | 1,788,980 | | |
| | | $ | 1,788,980 | | |
| Construction & Engineering — 0.8% | |
| Vinci SA | | | 15,500 | | | $ | 1,746,256 | | |
| | | $ | 1,746,256 | | |
| Consumer Finance — 1.9% | |
| Orix Corp. | | | 15,300 | | | $ | 4,295,539 | | |
| | | $ | 4,295,539 | | |
| Diversified Financial Services — 2.9% | |
| Fortis | | | 35,000 | | | $ | 1,466,560 | | |
| ING Groep NV | | | 118,439 | | | | 5,245,628 | | |
| | | $ | 6,712,188 | | |
| Diversified Telecommunication Services — 4.4% | |
| BT Group PLC | | | 1,130,000 | | | $ | 6,005,726 | | |
| Philippine Long Distance Telephone Co. ADR | | | 55,300 | | | | 2,632,833 | | |
| TeliaSonera AB | | | 180,000 | | | | 1,333,536 | | |
| | | $ | 9,972,095 | | |
| Electric Utilities — 5.6% | |
| British Energy Group PLC(1) | | | 100,000 | | | $ | 803,798 | | |
| E. ON AG | | | 15,340 | | | | 1,847,191 | | |
| Endesa SA | | | 120,000 | | | | 5,265,025 | | |
| Enel SPA | | | 292,000 | | | | 2,796,680 | | |
| Scottish and Southern Energy PLC | �� | | 79,500 | | | | 1,994,151 | | |
| | | $ | 12,706,845 | | |
| Energy Equipment & Services — 3.4% | |
| Acergy SA(1) | | | 300,000 | | | $ | 5,455,580 | | |
| Tenaris SA ADR | | | 60,000 | | | | 2,315,400 | | |
| | | $ | 7,770,980 | | |
See notes to financial statements
17
Tax-Managed International Equity Portfolio as of October 31, 2006
PORTFOLIO OF INVESTMENTS CONT'D
| Security | | Shares | | Value | |
| Food & Staples Retailing — 3.0% | |
| AEON Co., Ltd. | | | 210,000 | | | $ | 4,929,861 | | |
| Controladora Comercial Mexicana SA de C.V. | | | 1,000,000 | | | | 2,031,334 | | |
| | | $ | 6,961,195 | | |
| Food Products — 2.1% | |
| Nestle SA | | | 14,000 | | | $ | 4,784,782 | | |
| | | $ | 4,784,782 | | |
| Gas Utilities — 0.5% | |
| Samchully Co., Ltd. | | | 9,000 | | | $ | 1,069,837 | | |
| | | $ | 1,069,837 | | |
| Health Care Equipment & Supplies — 0.9% | |
| Synthes, Inc. | | | 18,000 | | | $ | 2,041,149 | | |
| | | $ | 2,041,149 | | |
| Household Durables — 1.1% | |
| Sekisui House, Ltd. ADR | | | 160,000 | | | $ | 2,525,200 | | |
| | | $ | 2,525,200 | | |
| Industrial Conglomerates — 1.6% | |
| Keppel Corp., Ltd. | | | 371,000 | | | $ | 3,766,532 | | |
| | | $ | 3,766,532 | | |
| Insurance — 4.2% | |
| Aviva PLC | | | 91,700 | | | $ | 1,354,308 | | |
| AXA SA | | | 125,900 | | | | 4,789,796 | | |
| Muenchener Rueckversicherungs-Gesellschaft AG | | | 21,000 | | | | 3,415,334 | | |
| | | $ | 9,559,438 | | |
| Machinery — 3.1% | |
| AB SKF ADR | | | 50,000 | | | $ | 804,900 | | |
| Komatsu, Ltd. | | | 250,000 | | | | 4,490,699 | | |
| Vallourec SA | | | 7,000 | | | | 1,740,050 | | |
| | | $ | 7,035,649 | | |
| Marine — 0.9% | |
| Cosco Corp., Ltd. | | | 1,600,000 | | | $ | 1,971,186 | | |
| | | $ | 1,971,186 | | |
| Security | | Shares | | Value | |
| Metals & Mining — 6.0% | |
| Anglo American PLC ADR | | | 100,000 | | | $ | 2,268,000 | | |
| BHP Billiton, Ltd. | | | 100,000 | | | | 2,127,134 | | |
| Companhia Vale do Rio Doce ADR | | | 110,000 | | | | 2,389,200 | | |
| Rio Tinto, Ltd. | | | 82,500 | | | | 5,013,032 | | |
| Teck Cominco, Ltd., Class B | | | 27,000 | | | | 1,991,896 | | |
| | | $ | 13,789,262 | | |
| Multi-Utilities — 2.5% | |
| RWE AG | | | 58,000 | | | $ | 5,744,723 | | |
| | | $ | 5,744,723 | | |
| Office Electronics — 2.0% | |
| Canon, Inc. | | | 86,250 | | | $ | 4,598,428 | | |
| | | $ | 4,598,428 | | |
| Oil, Gas & Consumable Fuels — 7.5% | |
| BMB Munai, Inc.(1) | | | 100,000 | | | $ | 578,000 | | |
| EnCana Corp. | | | 24,000 | | | | 1,139,760 | | |
| ENI SPA | | | 75,000 | | | | 2,268,810 | | |
| Norsk Hydro ASA | | | 75,000 | | | | 1,734,296 | | |
| Petroleo Brasileiro SA ADR | | | 45,000 | | | | 3,643,200 | | |
| Royal Dutch Shell PLC, Class B | | | 40,858 | | | | 1,467,866 | | |
| Total SA | | | 92,000 | | | | 6,223,620 | | |
| | | $ | 17,055,552 | | |
| Pharmaceuticals — 5.0% | |
| Eisai Co., Ltd. | | | 20,000 | | | $ | 1,021,271 | | |
| Novartis AG | | | 71,000 | | | | 4,310,448 | | |
| Roche Holding AG | | | 29,500 | | | | 5,165,953 | | |
| Takeda Pharmaceutical Co., Ltd. | | | 13,000 | | | | 833,194 | | |
| | | $ | 11,330,866 | | |
| Real Estate Management & Development — 0.7% | |
| Sun Hung Kai Properties, Ltd. | | | 155,000 | | | $ | 1,692,018 | | |
| | | $ | 1,692,018 | | |
| Road & Rail — 1.9% | |
| Canadian Pacific Railway, Ltd. | | | 61,000 | | | $ | 3,451,649 | | |
| West Japan Railway Co. | | | 200 | | | | 852,584 | | |
| | | $ | 4,304,233 | | |
See notes to financial statements
18
Tax-Managed International Equity Portfolio as of October 31, 2006
PORTFOLIO OF INVESTMENTS CONT'D
| Security | | Shares | | Value | |
Semiconductors & Semiconductor
Equipment — 0.4% | |
| Samsung Electronics Co., Ltd. | | | 1,570 | | | $ | 1,016,680 | | |
| | | $ | 1,016,680 | | |
| Software — 0.3% | |
| UbiSoft Entertainment SA(1) | | | 10,000 | | | $ | 616,588 | | |
| | | $ | 616,588 | | |
| Tobacco — 2.3% | |
| British American Tobacco PLC | | | 70,000 | | | $ | 1,906,127 | | |
| Japan Tobacco, Inc. | | | 750 | | | | 3,258,770 | | |
| | | $ | 5,164,897 | | |
| Trading Companies & Distributors — 2.0% | |
| Mitsubishi Corp. | | | 240,000 | | | $ | 4,625,462 | | |
| | | $ | 4,625,462 | | |
| Wireless Telecommunication Services — 0.6% | |
| China Mobile, Ltd. ADR | | | 35,000 | | | $ | 1,427,300 | | |
| | | $ | 1,427,300 | | |
Total Common Stocks
(identified cost $143,693,051) | | | | | | $ | 222,816,597 | | |
| Short-Term Investments — 2.9% | |
| Security | | Principal
Amount
(000's omitted) | | Value | |
Societe Generale Time Deposit,
5.31%, 11/1/06 | | $ | 6,704 | | | $ | 6,704,000 | | |
Total Short-Term Investments
(at amortized cost, $6,704,000) | | | | $ | 6,704,000 | | |
Total Investments — 100.5%
(identified cost $150,397,051) | | | | $ | 229,520,597 | | |
| Other Assets, Less Liabilities — (0.5)% | | | | $ | (1,243,807 | ) | |
| Net Assets — 100.0% | | | | $ | 228,276,790 | | |
ADR - American Depository Receipt
(1) Non-income producing security.
See notes to financial statements
19
Tax-Managed International Equity Portfolio as of October 31, 2006
PORTFOLIO OF INVESTMENTS CONT'D
| Country Concentration of Portfolio | |
| Country | | Percentage
of Net Assets | | Value | |
| Japan | | | 18.9 | % | | $ | 43,041,321 | | |
| United Kingdom | | | 12.0 | % | | | 27,322,356 | | |
| France | | | 9.6 | % | | | 21,945,197 | | |
| Switzerland | | | 9.3 | % | | | 21,318,985 | | |
| Germany | | | 6.4 | % | | | 14,542,187 | | |
| Spain | | | 4.5 | % | | | 10,336,401 | | |
| Australia | | | 4.5 | % | | | 10,240,181 | | |
| Singapore | | | 4.2 | % | | | 9,659,360 | | |
| Mexico | | | 3.5 | % | | | 8,097,726 | | |
| Brazil | | | 3.4 | % | | | 7,798,605 | | |
| Norway | | | 3.1 | % | | | 7,189,876 | | |
| Canada | | | 2.9 | % | | | 6,583,305 | | |
| Netherlands | | | 2.8 | % | | | 6,339,909 | | |
| Italy | | | 2.2 | % | | | 5,065,491 | | |
| Belgium | | | 1.6 | % | | | 3,572,252 | | |
| Ireland | | | 1.2 | % | | | 2,720,825 | | |
| Philippines | | | 1.2 | % | | | 2,632,833 | | |
| Argentina | | | 1.0 | % | | | 2,315,400 | | |
| Denmark | | | 1.0 | % | | | 2,207,331 | | |
| Sweden | | | 0.9 | % | | | 2,138,437 | | |
| Republic of Korea | | | 0.9 | % | | | 2,086,516 | | |
| Finland | | | 0.8 | % | | | 1,788,980 | | |
| Hong Kong | | | 0.8 | % | | | 1,692,018 | | |
| China | | | 0.6 | % | | | 1,427,300 | | |
| Kazakhstan | | | 0.2 | % | | | 578,000 | | |
| Turkey | | | 0.1 | % | | | 175,805 | | |
| Total Common Stocks | | | 97.6 | % | | $ | 222,816,597 | | |
| Short-Term Investments | | | 2.9 | % | | $ | 6,704,000 | | |
See notes to financial statements
20
Tax-Managed International Equity Portfolio as of October 31, 2006
FINANCIAL STATEMENTS
Statement of Assets and Liabilities
As of October 31, 2006
| Assets | |
| Investments, at value (identified cost, $150,397,051) | | $ | 229,520,597 | | |
| Cash | | | 347 | | |
| Dividends and interest receivable | | | 194,079 | | |
| Tax reclaim receivable | | | 153,803 | | |
| Total assets | | $ | 229,868,826 | | |
| Liabilities | |
| Payable for investments purchased | | $ | 1,336,870 | | |
| Payable to affiliate for investment advisory fees | | | 183,223 | | |
| Payable to affiliate for Trustees' fees | | | 953 | | |
| Accrued expenses | | | 70,990 | | |
| Total liabilities | | $ | 1,592,036 | | |
| Net Assets applicable to investors' interest in Portfolio | | $ | 228,276,790 | | |
| Sources of Net Assets | |
| Net proceeds from capital contributions and withdrawals | | $ | 149,148,702 | | |
| Net unrealized appreciation (computed on the basis of identified cost) | | | 79,128,088 | | |
| Total | | $ | 228,276,790 | | |
Statement of Operations
For the Year Ended
October 31, 2006
| Investment Income | |
| Dividends (net of foreign taxes, $459,443) | | $ | 4,497,626 | | |
| Interest | | | 240,439 | | |
| Total investment income | | $ | 4,738,065 | | |
| Expenses | |
| Investment adviser fee | | $ | 1,893,653 | | |
| Trustees' fees and expenses | | | 13,129 | | |
| Custodian fee | | | 171,964 | | |
| Legal and accounting services | | | 31,924 | | |
| Miscellaneous | | | 7,431 | | |
| Total expenses | | $ | 2,118,101 | | |
Deduct —
Reduction of custodian fee | | $ | 47 | | |
| Total expense reductions | | $ | 47 | | |
| Net expenses | | $ | 2,118,054 | | |
| Net investment income | | $ | 2,620,011 | | |
| Realized and Unrealized Gain (Loss) | |
Net realized gain (loss) —
Investment transactions (identified cost basis) | | $ | 7,928,831 | | |
| Foreign currency transactions | | | (227,218 | ) | |
| Net realized gain | | $ | 7,701,613 | | |
Change in unrealized appreciation (depreciation) —
Investments (identified cost basis) | | $ | 36,891,824 | | |
| Foreign currency | | | 10,960 | | |
| Net change in unrealized appreciation (depreciation) | | $ | 36,902,784 | | |
| Net realized and unrealized gain | | $ | 44,604,397 | | |
| Net increase in net assets from operations | | $ | 47,224,408 | | |
See notes to financial statements
21
Tax-Managed International Equity Portfolio as of October 31, 2006
FINANCIAL STATEMENTS CONT'D
Statements of Changes in Net Assets
Increase (Decrease)
in Net Assets | | Year Ended
October 31, 2006 | | Year Ended
October 31, 2005 | |
From operations —
Net investment income | | $ | 2,620,011 | | | $ | 2,032,473 | | |
Net realized gain from investments and
foreign currency transactions | | | 7,701,613 | | | | 6,294,822 | | |
Net change in unrealized
appreciation (depreciation)
from investments and
foreign currency | | | 36,902,784 | | | | 21,419,197 | | |
| Net increase in net assets from operations | | $ | 47,224,408 | | | $ | 29,746,492 | | |
Capital transactions —
Contributions | | $ | 50,247,326 | | | $ | 9,201,552 | | |
| Withdrawals | | | (20,795,552 | ) | | | (19,362,515 | ) | |
Net increase (decrease) in net assets from
capital transactions | | $ | 29,451,774 | | | $ | (10,160,963 | ) | |
| Net increase in net assets | | $ | 76,676,182 | | | $ | 19,585,529 | | |
| Net Assets | |
| At beginning of year | | $ | 151,600,608 | | | $ | 132,015,079 | | |
| At end of year | | $ | 228,276,790 | | | $ | 151,600,608 | | |
See notes to financial statements
22
Tax-Managed International Equity Portfolio as of October 31, 2006
FINANCIAL STATEMENTS CONT'D
Supplementary Data
| | | Year Ended October 31, | |
| | | 2006 | | 2005 | | 2004 | | 2003 | | 2002 | |
| Ratios/Supplemental Data | |
| Ratios (As a percentage of average daily net assets): | |
| Expenses before custodian fee reduction | | | 1.12 | % | | | 1.16 | % | | | 1.21 | % | | | 1.23 | % | | | 1.20 | % | |
| Expenses after custodian fee reduction | | | 1.12 | % | | | 1.16 | % | | | 1.21 | % | | | 1.23 | % | | | 1.20 | % | |
| Net investment income (loss) | | | 1.38 | % | | | 1.42 | % | | | 1.24 | % | | | 1.15 | % | | | (0.01 | )% | |
| Portfolio Turnover | | | 25 | % | | | 39 | % | | | 62 | % | | | 100 | % | | | 128 | % | |
| Total Return(1) | | | 29.54 | % | | | 23.36 | % | | | 15.04 | % | | | 17.52 | % | | | (27.07 | )% | |
| Net assets, end of year (000's omitted) | | $ | 228,277 | | | $ | 151,601 | | | $ | 132,015 | | | $ | 108,454 | | | $ | 95,920 | | |
(1) Total return is required to be disclosed for fiscal year beginning after December 15, 2000.
See notes to financial statements
23
Tax-Managed International Equity Portfolio as of October 31, 2006
NOTES TO FINANCIAL STATEMENTS
1 Significant Accounting Policies
Tax-Managed International Equity Portfolio (the Portfolio) is registered under the Investment Company Act of 1940, as amended, as a diversified open-end management investment company. The Portfolio, which was organized as a trust under the laws of the State of New York on June 22, 1998, seeks to achieve long-term after-tax returns by investing in a diversified portfolio of foreign equity securities. The Declaration of Trust permits the Trustees to issue interests in the Portfolio. At October 31, 2006, the Eaton Vance Tax-Managed International Equity Fund and the Eaton Vance Tax-Managed Equity Asset Allocation Fund held 51.2% and 48.7% interests in the Portfolio, respectively. The following is a summary of significant accounting policies consistently followed by the Portfolio in the preparation of its financial statements. The policies are in conformity with accounting principles generally accepted in the United States of America .
A Investment Valuation — Securities listed on a U.S. securities exchange generally are valued at the last sale price on the day of valuation or, if no sales took place on such date, at the mean between the closing bid and asked prices therefore on the exchange where such securities are principally traded. Equity securities listed on the NASDAQ National Market System generally are valued at the official NASDAQ closing price. Unlisted or listed securities for which closing sales prices or closing quotations are not available are valued at the mean between the latest available bid and asked prices or, in the case of preferred equity securities that are not listed or traded in the over-the-counter market, by an independent pricing service. Exchange-traded options are valued a t the last sale price for the day of valuation as quoted on the principal exchange or board of trade on which the options are traded or, in the absence of sales on such date, at the mean between the latest bid and asked prices therefore. Futures positions on securities and currencies generally are valued at closing settlement prices. Short-term debt securities with a remaining maturity of 60 days or less are valued at amortized cost. If short-term debt securities are acquired with a remaining maturity of more than 60 days, they will be valued by a pricing service. Other fixed income and debt securities, including listed securities and securities for which price quotations are available, will normally be valued on the basis of valuations furnished by a pricing service. Foreign securities and currencies are valued in U.S. dollars, based on foreign currency exchange rate quotations supplied by an independent quotation service. The daily valuation of exchange-traded foreign securities generally is determined as of the close of trading on the principal exchange on which such securities trade. Events occurring after the close of trading on foreign exchanges may result in adjustments to the valuation of foreign securities to more accurately reflect their fair value as of the close of regular trading on the New York Stock Exchange. When valuing foreign equity securities that meet certain criteria, the Trustees have approved the use of a fair value service that values such securities to reflect market trading that occurs after the close of the applicable foreign markets of comparable securities or other instruments that have a strong correlation to the fair-valued securities. Investments held by the Portfolio for which valuations or market quotations are unavailable are valued at fair value using methods determined in good faith by or at the direction of the Trustees of the Portfolio considering relevant factors, data and information including the m arket value of freely tradable securities of the same class in the principal market on which such securities are normally traded.
B Income — Dividend income is recorded on the ex-dividend date for dividends received in cash and/or securities. However, if the ex-dividend date has passed, certain dividends from foreign securities are recorded as the Portfolio is informed of the ex-dividend date. Withholding taxes on foreign dividends and capital gains have been provided for in accordance with the Portfolio's understanding of the applicable countries' tax rules and rates. Interest income is recorded on the basis of interest accrued, adjusted for amortization of premium or accretion of discount.
C Federal Taxes — The Portfolio has elected to be treated as a partnership for federal tax purposes. No provision is made by the Portfolio for federal or state taxes on any taxable income of the Portfolio because each investor in the Portfolio is ultimately responsible for the payment of any taxes on its share of taxable income. Since at least one of the Portfolio's investors is a regulated investment company that invests all or substantially all of its assets in the Portfolio, the Portfolio normally must satisfy the applicable source of income and diversification requirements (under the Internal Revenue Code) in order for its investors to satisfy them. The Portfolio will allocate, at least annually among its investors, each investor's distributive share of the Portfolio' s net investment income, net realized capital gains, and any other items of income, gain, loss, deduction or credit.
D Financial Futures Contracts — Upon entering a financial futures contract, the Portfolio is required to deposit either in cash or securities an amount (initial margin) equal to a certain percentage of the purchase price
24
Tax-Managed International Equity Portfolio as of October 31, 2006
NOTES TO FINANCIAL STATEMENTS CONT'D
indicated in the financial futures contract. Subsequent payments are made or received by the Portfolio (margin maintenance) each day, dependent on daily fluctuations in the value of the underlying security, and are recorded for book purposes as unrealized gains or losses by the Portfolio. The Portfolio's investment in financial futures contracts is designed to hedge against anticipated future changes in price of current or anticipated Portfolio positions. Should prices move unexpectedly, the Portfolio may not achieve the anticipated benefits of the financial futures contracts and may realize a loss.
E Purchased Options — Upon the purchase of a call or put option, the premium paid by the Portfolio is included in the Statement of Assets and Liabilities as an investment. The amount of the investment is subsequently marked-to-market to reflect the current market value of the option purchased, in accordance with the Portfolio's policies on investment valuations discussed above. If an option which the Portfolio has purchased expires on the stipulated expiration date, the Portfolio will realize a loss in the amount of the cost of the option. If the Portfolio enters into a closing sale transaction, the Portfolio will realize a gain or loss, depending on whether the sales proceeds from the closing sale transaction are greater or less than the cost of the option. If the Portfo lio exercises a put option, it will realize a gain or loss from the sale of the underlying security, and the proceeds from such sale will be decreased by the premium originally paid. If the Portfolio exercises a call option, the cost of the security which the Portfolio purchases upon exercise will be increased by the premium originally paid.
F Foreign Currency Translation — Investment valuations, other assets, and liabilities initially expressed in foreign currencies are converted each business day into U.S. dollars based upon current exchange rates. Purchases and sales of foreign investment securities and income and expenses are converted into U.S. dollars based upon currency exchange rates prevailing on the respective dates of such transactions. Recognized gains or losses on investment transactions attributable to changes in foreign currency exchange rates are recorded for financial statement purposes as net realized gains and losses on investments. That portion of unrealized gains and losses on investments that results from fluctuations in foreign currency exchange rates is not separately disclosed.
G Forward Foreign Currency Exchange Contracts — The Portfolio may enter into forward foreign currency exchange contracts for the purchase or sale of a specific foreign currency at a fixed price on a future date. Risks may arise upon entering these contracts from the potential inability of counterparties to meet the terms of their contracts and from movements in the value of a foreign currency relative to the U.S. dollar. The Portfolio will enter into forward contracts for hedging purposes as well as non-hedging purposes. The forward foreign currency exchange contracts are adjusted by the daily exchange rate of the underlying currency and any gains or losses are recorded for financial statement purpose s as unrealized until such time as the contracts have been closed or offset.
H Expense Reduction — Investors Bank & Trust Company (IBT) serves as custodian to the Portfolio. Pursuant to the custodian agreement, IBT receives a fee reduced by credits which are determined based on the average daily cash balance the Portfolio maintains with IBT. All credit balances used to reduce the Portfolio's custodian fees are reported as a reduction of expenses in the Statement of Operations.
I Use of Estimates — The preparation of the financial statements in conformity with accounting principles generally accepted in the United States of America requires management to make estimates and assumptions that affect the reported amounts of assets and liabilities at the date of the financial statements and the reported amounts of income and expense during the reporting period. Actual results could differ from those estimates.
J Indemnifications — Under the Portfolio's organizational documents, its officers and Trustees may be indemnified against certain liabilities and expenses arising out of the performance of their duties to the Portfolio. Interestholders in the Portfolio are jointly and severally liable for the liabilities and obligations of the Portfolio in the event that the Portfolio fails to satisfy such liabilities and obligations; provided, however, that, to the extent assets are available in the Portfolio, the Portfolio may, under certain circumstances, indemnify interestholders from and against any claim or liability to which such holder may become subject by reason of being or having been an interestholder in the Portfolio. Additionally, in the normal course of business, the Portfo lio enters into agreements with service providers that may contain indemnification clauses. The Portfolio's maximum exposure under these arrangements is unknown as this would involve future claims that may be made against the Portfolio that have not yet occurred.
K Other — Investment transactions are accounted for on the date the securities are purchased or sold. Realized gains and losses on securities sold are determined on the basis of identified cost.
25
Tax-Managed International Equity Portfolio as of October 31, 2006
NOTES TO FINANCIAL STATEMENTS CONT'D
2 Investment Adviser Fee and Other Transactions with Affiliates
The investment adviser fee is earned by Boston Management and Research (BMR), a wholly-owned subsidiary of Eaton Vance Management (EVM), as compensation for management and investment advisory services rendered to the Portfolio. BMR receives a monthly advisory fee in the amount of 1.00% annually of the average daily net assets of the Portfolio up to $500 million and at reduced rates as daily net assets exceed that level. For the year ended October 31, 2006, the advisory fee amounted to $1,893,653. Pursuant to a sub-advisory agreement, BMR has delegated the investment management of the Portfolio to Eagle Global Advisors, L.L.C. ("Eagle"). BMR pays Eagle a monthly sub-advisory fee equal to 0.50% annually of the average daily net assets of the Portfolio up to $500 million, and at reduced rates as daily net assets exceed that level. Except for Trustees of the Portfolio who are not members of EVM's or BMR's organization, officers and Trustees receive remuneration for their services to the Portfolio out of the investment adviser and sub-adviser fees. Trustees of the Portfolio that are not affiliated with BMR may elect to defer receipt of all or a percentage of their annual fees in accordance with the terms of the Trustees Deferred Compensation Plan. For the year ended October 31, 2006, no significant amounts have been deferred. Certain officers and Trustees of the Portfolio are officers of the above organizations.
3 Investment Transactions
Purchases and sales of investments, other than short-term obligations, aggregated $73,695,992 and $46,974,031, respectively, for the year ended October 31, 2006.
4 Federal Income Tax Basis of Investments
The cost and unrealized appreciation (depreciation) in value of the investments owned at October 31, 2006, as determined on a federal income tax basis, were as follows:
| Aggregate cost | | $ | 152,159,033 | | |
| Gross unrealized appreciation | | $ | 77,736,025 | | |
| Gross unrealized depreciation | | | (374,461 | ) | |
| Net unrealized appreciation | | $ | 77,361,564 | | |
The net unrealized appreciation on foreign currency at October 31, 2006 was $4,542.
5 Financial Instruments
The Portfolio may trade in financial instruments with off-balance sheet risk in the normal course of its investing activities to assist in managing exposure to various market risks. These financial instruments include written options, forward foreign currency contracts and financial futures contracts and may involve, to a varying degree, elements of risk in excess of the amounts recognized for financial statement purposes. The notional or contractual amounts of these instruments represent the investment the Portfolio has in particular classes of financial instruments and does not necessarily represent the amounts potentially subject to risk. The measurement of the risks associated with these instruments is meaningful only when all related and offsetting transactions are considered. The Portfolio did not have any open financial instruments at October 31, 2006.
6 Line of Credit
The Portfolio participates with other portfolios and funds managed by BMR and EVM and its affiliates in a $150 million unsecured line of credit agreement with a group of banks. Borrowings will be made by the Portfolio solely to facilitate the handling of unusual and/or unanticipated short-term cash requirements. Interest is charged to each participating portfolio or fund based on its borrowings at an amount above either the Eurodollar rate or federal funds rate. In addition, a fee computed at an annual rate of 0.10% on the daily unused portion of the line of credit is allocated among the participating portfolios and funds at the end of each quarter. The Portfolio did not have any significant borrowings or allocated fees during the year ended October 31, 2006.
7 Risks Associated with Foreign Investments
Investing in securities issued by companies whose principal business activities are outside the United States may involve significant risks not present in domestic investments. For example, there is generally less publicly available information about foreign companies, particularly those not subject to the disclosure and reporting requirements of the U.S. securities laws. Foreign issuers are generally not bound by uniform accounting, auditing, and financial reporting requirements and standards of practice comparable to those applicable to domestic issuers. Investments in foreign securities also involve the risk of possible adverse changes in investment or exchange control regulations, expropriation or confiscatory taxation, limitation on the removal of funds or other assets of the Portfolio, political or financial instability or diplomatic and other developments which could affect such investments.
26
Tax-Managed International Equity Portfolio as of October 31, 2006
NOTES TO FINANCIAL STATEMENTS CONT'D
Foreign stock markets, while growing in volume and sophistication, are generally not as developed as those in the United States, and securities of some foreign issuers (particularly those located in developing countries) may be less liquid and more volatile than securities of comparable U.S. companies. In general, there is less overall governmental supervision and regulation of foreign securities markets, broker-dealers and issuers than in the United States.
8 Recently Issued Accounting Pronouncements
In June 2006, the Financial Accounting Standards Board ("FASB") issued FASB Interpretation No. 48, ("FIN 48") "Accounting for Uncertainty in Income Taxes – an interpretation of FASB Statement No. 109". FIN 48 clarifies the accounting for uncertainty in income taxes recognized in accordance with FASB Statement No. 109, "Accounting for Income Taxes." This interpretation prescribes a recognition threshold and measurement attribute for the financial statement recognition and measurement of a tax position taken or expected to be taken in a tax return. It also provides guidance on de-recognition, classification, interest and penalties, accounting in interim periods, disclosure and transition. FIN 48 is effective for fiscal years beginning after December 15, 2006. Management is currently evaluating the impact of applying the various provisions of FIN 48.
In September 2006, the Financial Accounting Standards Board ("FASB") issued Statement of Financial Accounting Standards No. 157, ("FAS 157") "Fair Value Measurements". FAS 157 defines fair value, establishes a framework for measuring fair value in accordance with generally accepted accounting principles and expands disclosure about fair value measurements. FAS 157 is effective for fiscal years beginning after November 15, 2007. Management is currently evaluating the impact the adoption of FAS 157 will have on the Portfolio's financial statement disclosures.
27
Tax-Managed International Equity Portfolio as of October 31, 2006
REPORT OF INDEPENDENT REGISTERED PUBLIC ACCOUNTING FIRM
To the Trustees and Investors
of Tax-Managed International Equity Portfolio:
We have audited the accompanying statement of assets and liabilities of Tax-Managed International Equity Portfolio (the "Portfolio"), including the portfolio of investments, as of October 31, 2006, and the related statement of operations for the year then ended, the statements of changes in net assets for each of the two years in the period then ended and the supplementary data for each of the five years in the period then ended. These financial statements and supplementary data are the responsibility of the Portfolio's management. Our responsibility is to express an opinion on these financial statements and supplementary data based on our audits.
We conducted our audits in accordance with the standards of the Public Company Accounting Oversight Board (United States). Those standards require that we plan and perform the audit to obtain reasonable assurance about whether the financial statements and supplementary data are free of material misstatement. The Portfolio is not required to have, nor were we engaged to perform, an audit of its internal control over financial reporting. Our audit included consideration of internal control over financial reporting as a basis for designing audit procedures that are appropriate in the circumstances, but not for the purpose of expressing an opinion on the effectiveness of the Portfolio's internal control over financial reporting. Accordingly, we express no such opinion. An audit also includes examining, on a test basis, evidence supporting the amounts and disclosures in the financial statements, assessing the accounting principles us ed and significant estimates made by management, as well as evaluating the overall financial statement presentation. Our procedures included confirmation of securities owned as of October 31, 2006 by correspondence with the custodian and brokers; where replies were not received from brokers, we performed other auditing procedures. We believe that our audits provide a reasonable basis for our opinion.
In our opinion, the financial statements and supplementary data referred to above present fairly, in all material respects, the financial position of the Tax-Managed International Equity Portfolio as of October 31, 2006, the results of its operations for the year then ended, the changes in its net assets for each of the two years in the period then ended, and the supplementary data for each of the five years in the period then ended, in conformity with accounting principles generally accepted in the United States of America.
DELOITTE & TOUCHE LLP
Boston, Massachusetts
December 15, 2006
28
Eaton Vance Tax-Managed International Equity Fund
BOARD OF TRUSTEES' ANNUAL APPROVAL OF THE INVESTMENT ADVISORY AND SUB-ADVISORY AGREEMENTS
Overview of the Contract Review Process
The Investment Company Act of 1940, as amended (the "1940 Act"), provides, in substance, that each investment advisory agreement between a fund and its investment adviser will continue in effect from year to year only if its continuance is approved at least annually by the fund's board of trustees, including by a vote of a majority of the trustees who are not "interested persons" of the fund ("Independent Trustees") cast in person at a meeting called for the purpose of considering such approval.
At a meeting of the Boards of Trustees (each a "Board") of the Eaton Vance group of mutual funds (the "Eaton Vance Funds") held on March 27, 2006, the Board, including a majority of the Independent Trustees, voted to approve continuation of existing advisory and sub-advisory agreements for the Eaton Vance Funds for an additional one-year period. In voting its approval, the Board relied upon the affirmative recommendation of the Special Committee of the Board, which is a committee comprised exclusively of Independent Trustees. Prior to making its recommendation, the Special Committee reviewed information furnished for a series of meetings of the Special Committee held in February and March 2006. Such information included, among other things, the following:
Information about Fees, Performance and Expenses
• An independent report comparing the advisory and related fees paid by each fund with fees paid by comparable funds;
• An independent report comparing each fund's total expense ratio and its components to comparable funds;
• An independent report comparing the investment performance of each fund to the investment performance of comparable funds over various time periods;
• Data regarding investment performance in comparison to relevant peer groups of funds and appropriate indices;
• Comparative information concerning fees charged by each adviser for managing other mutual funds and institutional accounts using investment strategies and techniques similar to those used in managing the fund;
• Profitability analyses for each adviser with respect to each fund managed by it;
Information about Portfolio Management
• Descriptions of the investment management services provided to each fund, including the investment strategies and processes employed;
• Information concerning the allocation of brokerage and the benefits received by each adviser as a result of brokerage allocation, including information concerning the acquisition of research through "soft dollar" benefits received in connection with the funds' brokerage, and the implementation of a soft dollar reimbursement program established with respect to the funds;
• Data relating to portfolio turnover rates of each fund;
• The procedures and processes used to determine the fair value of fund assets and actions taken to monitor and test the effectiveness of such procedures and processes;
Information about each Adviser
• Reports detailing the financial results and condition of each adviser;
• Descriptions of the qualifications, education and experience of the individual investment professionals whose responsibilities include portfolio management and investment research for the funds, and information relating to their compensation and responsibilities with respect to managing other mutual funds and investment accounts;
• Copies of the Codes of Ethics of each adviser and its affiliates, together with information relating to compliance with and the administration of such codes;
• Information concerning the resources devoted to compliance efforts undertaken by each adviser and its affiliates on behalf of the funds (including descriptions of various compliance programs) and their record of compliance with investment policies and restrictions, including policies with respect to market-timing, late trading and selective portfolio disclosure, and with policies on personal securities transactions;
• Descriptions of the business continuity and disaster recovery plans of each adviser and its affiliates;
Other Relevant Information
• Information concerning the nature, cost and character of the administrative and other non-investment management services provided by Eaton Vance Management and its affiliates;
• Information concerning management of the relationship with the custodian, subcustodians and fund accountants by each adviser or the funds' administrator; and
• The terms of each advisory agreement.
In addition to the information identified above, the Special Committee considered information provided from time to time by each adviser throughout the year at meetings of the Board and its committees. Over the course of the twelve month period ended March 31,
29
Eaton Vance Tax-Managed International Equity Fund
BOARD OF TRUSTEES' ANNUAL APPROVAL OF THE INVESTMENT ADVISORY AND SUB-ADVISORY AGREEMENTS CONT'D
2006, the Board met nine times and the Special Committee, the Audit Committee and the Governance Committee, each of which is a Committee comprised solely of Independent Trustees, met eight, twelve and five times, respectively. At such meetings, the Trustees received, among other things, presentations by the portfolio managers and other investment professionals of each adviser relating to the investment performance of each fund and the investment strategies used in pursuing the fund's investment objective.
For funds that invest through one or more underlying portfolios, the Board considered similar information about the portfolio(s) when considering the approval of advisory agreements. In addition, in cases where the fund's investment adviser has engaged a sub-adviser, the Board considered similar information about the sub-adviser when considering the approval of any sub-advisory agreement.
The Special Committee was assisted throughout the contract review process by Goodwin Procter LLP, legal counsel for the Independent Trustees. The members of the Special Committee relied upon the advice of such counsel and their own business judgment in determining the material factors to be considered in evaluating each advisory and sub-advisory agreement and the weight to be given to each such factor. The conclusions reached with respect to each advisory and sub-advisory agreement were based on a comprehensive evaluation of all the information provided and not any single factor. Moreover, each member of the Special Committee may have placed varying emphasis on particular factors in reaching conclusions with respect to each advisory and sub-advisory agreement.
Results of the Process
Based on its consideration of the foregoing, and such other information as it deemed relevant, including the factors and conclusions described below, the Special Committee concluded that the continuance of the investment advisory agreement of the Tax-Managed International Equity Portfolio, the portfolio in which the Eaton Vance Tax-Managed International Equity Fund (the "Fund") invests, with Boston Management and Research (the "Adviser"), and the sub-advisory agreement with Eagle Global Advisors, L.L.C. ("Eagle" or the "Sub-adviser") including the fee structures, is in the interests of shareholders and, therefore, the Special Committee recommended to the Board approval of the respective agreements. The Board accepted the recommendation of the Special Committee as well as the factors considered and conclusions reached by the Special Committee with respect to the agreements. Accordingly, the Board, including a majority of the Inde pendent Trustees, voted to approve continuation of the investment advisory agreement and the sub-advisory agreement for the Portfolio.
Nature, Extent and Quality of Services
In considering whether to approve the investment advisory agreement and sub-advisory agreements of the Portfolio, the Board evaluated the nature, extent and quality of services provided to the Portfolio by the Adviser and the Sub-adviser.
The Board considered the Adviser's and the Sub-adviser's management capabilities and investment process with respect to the types of investments held by the Portfolio, including the education, experience and number of its investment professionals and other personnel who provide portfolio management, investment research, and similar services to the Portfolio and whose responsibilities include supervising the Sub-adviser. The Board specifically noted the Adviser's in-house equity research capabilities, which aids the Adviser in supervising Eagle's management of the Portfolio. The Board also took into account the resources dedicated to portfolio management and other services, including the compensation paid to recruit and retain investment personnel, and the time and attention devoted to each Portfolio in the complex by senior management. With respect to the Sub-adviser, the Board took into consideration the resources available to the Sub-adviser in fulfilling its duties under the sub-advisory agreement and the Sub-adviser's experience in managing international equity portfolios, as well as recent changes in personnel.
The Board reviewed the compliance programs of the Adviser and relevant affiliates thereof, and of the Sub-adviser. Among other matters, the Board considered compliance and reporting matters relating to personal trading by investment personnel, selective disclosure of portfolio holdings, late trading, frequent trading, portfolio valuation, business continuity and the allocation of investment opportunities. The Board also evaluated the responses of the Adviser and its affiliates to requests from regulatory authorities such as the Securities and Exchange Commission and the National Association of Securities Dealers.
The Board considered shareholder and other administrative services provided or managed by Eaton Vance Management and its affiliates, including transfer agency and accounting services. The Board evaluated the benefits to shareholders of investing in a fund that is a part of a large family of funds, including the ability, in many cases, to exchange an investment among different funds without incurring additional sales charges.
After consideration of the foregoing factors, among others, the Board concluded that the nature, extent and quality of services provided by the Adviser and Sub-adviser, taken as a whole, are appropriate and consistent with the terms of the investment advisory agreement and sub-advisory agreement, respectively.
30
Eaton Vance Tax-Managed International Equity Fund
BOARD OF TRUSTEES' ANNUAL APPROVAL OF THE INVESTMENT ADVISORY AND SUB-ADVISORY AGREEMENTS CONT'D
Fund Performance
The Board compared the Fund's investment performance to a relevant universe of similarly managed funds identified by an independent data provider and appropriate benchmark indices. The Board reviewed comparative performance data for the one-, three- and five-year periods ended September 30, 2005 for the Fund. The Board concluded that the performance of the Fund was satisfactory.
Management Fees and Expenses
The Board reviewed contractual investment advisory fee rates payable by the Portfolio and the Fund (referred to as "management fees"). As part of its review, the Board considered the management fees and the Fund's total expense ratio for the one-year period ended September 30, 2005, as compared to a group of similarly managed funds selected by an independent data provider.
After reviewing the foregoing information, and in light of the nature, extent and quality of the services provided by the Adviser, the Board concluded that the management fees charged for advisory and related services and the Fund's total expense ratio are reasonable.
Profitability
The Board reviewed the level of profits realized by the Adviser and relevant affiliates thereof in providing investment advisory and administrative services to the Fund, to the Portfolio and to all Eaton Vance Funds as a group. The Board considered the level of profits realized without regard to revenue sharing or other payments by the Adviser and its affiliates to third parties in respect of distribution services. The Board also considered other direct or indirect benefits received by the Adviser and its affiliates in connection with its relationship with the Fund. The Board also concluded that, in light of its role as a sub-adviser not affiliated with the Adviser, the Sub-adviser's profitability in managing the Portfolio was not a material factor.
The Board concluded that, in light of the foregoing factors and the nature, extent and quality of the services rendered, the profits realized by the Adviser and its affiliates are reasonable.
Economies of Scale
In reviewing management fees and profitability, the Board also considered the extent to which the Adviser and its affiliates, on the one hand, and the Fund, on the other hand, can expect to realize benefits from economies of scale as the assets of the Fund and Portfolio increase. The Board acknowledged the difficulty in accurately measuring the benefits resulting from the economies of scale with respect to the management of any specific fund or group of funds. The Board reviewed data summarizing the increases and decreases in the assets of the Fund and of all Eaton Vance Funds as a group over various time periods, and evaluated the extent to which the total expense ratio of the Fund and the profitability of the Adviser and its affiliates may have been affected by such increases or decreases. Based upon the foregoing, the Board concluded that the benefits from economies of scale are currently being shared equitably by the Adviser and its affiliates and the Fund. The Board also concluded that, assuming reasonably foreseeable increases in the assets of the Portfolio, the structure of the advisory fee, which includes breakpoints at several asset levels, can be expected to cause the Adviser and its affiliates and the Fund to continue to share such benefits equitably.
31
Eaton Vance Tax-Managed International Equity Fund
MANAGEMENT AND ORGANIZATION
Fund Management. The Trustees of Eaton Vance Mutual Funds Trust (the Trust) and Tax-Managed International Equity Portfolio (the Portfolio) are responsible for the overall management and supervision of the Trust's and Portfolio's affairs. The Trustees and officers of the Trust and the Portfolio are listed below. Except as indicated, each individual has held the office shown or other offices in the same company for the last five years. Trustees and officers of the Trust and the Portfolio hold indefinite terms of office. The "noninterested Trustees" consist of those Trustees who are not "interested persons" of the Trust and the Portfolio, as that term is defined under the 1940 Act. The business address of each Trustee and officer is The Eaton Vance Building, 255 State Street, Boston, Massachusetts 02109. As used below, "EVC" refers to Eaton Vance Corp., "EV" re fers to Eaton Vance, Inc., "EVM" refers to Eaton Vance Management, "BMR" refers to Boston Management and Research, "Eagle" refers to Eagle Global Advisors, L.L.C., "Parametric" refers to Parametric Portfolio Associates and "EVD" refers to Eaton Vance Distributors, Inc. EVC and EV are the corporate parent and trustee, respectively, of EVM and BMR. EVD is the Fund's principal underwriter, the Portfolio's placement agent and a wholly-owned subsidiary of EVM. Each officer affiliated with Eaton Vance may hold a position with other Eaton Vance affiliates that is comparable to his or her position with EVM listed below.
Name and
Date of Birth | | Position(s)
with the
Trust and
the Portfolio | | Term of
Office and
Length of
Service | | Principal Occupation(s)
During Past Five Years | | Number of Portfolios
in Fund Complex
Overseen By
Trustee(1) | | Other Directorships Held | |
| Interested Trustee | | | | | | | | | | | | | |
|
James B. Hawkes
11/9/41 | | Trustee | | Trustee of the Trust since 1991 and of the Portfolio since 1998 | | Chairman and Chief Executive Officer of EVC, BMR, EVM and EV; Director of EV; Vice President and Director of EVD. Trustee and/or officer of 170 registered investment companies in the Eaton Vance Fund Complex. Mr. Hawkes is an interested person because of his positions with BMR, EVM, EVC and EV, which are affiliates of the Trust and the Portfolio. | | | 170 | | | Director of EVC | |
|
| Noninterested Trustees(s) | | | | | | | | | | | | | |
|
Benjamin C. Esty
1/26/63 | | Trustee | | Since 2005 | | Roy and Elizabeth Simmons Professor of Business Administration, Harvard University Graduate School of Business Administration (since 2003). Formerly, Associate Professor, Harvard University Graduate School of Business Administration (2000-2003). | | | 170 | | | None | |
|
Samuel L. Hayes, III
2/23/35 | | Trustee and Chairman of the Board | | Trustee of the Trust since 1986; of the Portfolio since 1998 and Chairman of the Board since 2005 | | Jacob H. Schiff Professor of Investment Banking Emeritus, Harvard University Graduate School of Business Administration. Director of Yakima Products, Inc. (manufacturer of automotive accessories) (since 2001) and Director of Telect, Inc. (telecommunications services company). | | | 170 | | | Director of Tiffany & Co. (specialty retailer) | |
|
William H. Park
9/19/47 | | Trustee | | Since 2003 | | Vice Chairman, Commercial Industrial Finance Corp. (specialty finance company) (since 2006). Formerly, President and Chief Executive Officer, Prizm Capital Management, LLC (investment management firm) (2002-2005). Formerly, Executive Vice President and Chief Financial Officer, United Asset Management Corporation (a holding company owning institutional investment management firms) (1982-2001). | | | 170 | | | None | |
|
| Ronald A. Pearlman 7/10/40 | | Trustee | | Since 2003 | | Professor of Law, Georgetown University Law Center. | | | 170 | | | None | |
|
32
Eaton Vance Tax-Managed International Equity Fund
MANAGEMENT AND ORGANIZATION CONT'D
Name and
Date of Birth | | Position(s)
with the
Trust and
the Portfolio | | Term of
Office and
Length of
Service | | Principal Occupation(s)
During Past Five Years | | Number of Portfolios
in Fund Complex
Overseen By
Trustee(1) | | Other Directorships Held | |
| Noninterested Trustees(s) (continued) | | | | | | | | | | | | | |
|
| Norton H. Reamer 9/21/35 | | Trustee | | Trustee of the Trust since 1986 and of the Portfolio since 1998 | | President, Chief Executive Officer and a Director of Asset Management Finance Corp. (a specialty finance company serving the investment management industry) (since October 2003). President, Unicorn Corporation (an investment and financial advisory services company) (since September 2000). Formerly, Chairman and Chief Operating Officer, Hellman, Jordan Management Co., Inc. (an investment management company) (2000-2003). Formerly, Advisory Director of Berkshire Capital Corporation (investment banking firm) (2002-2003). | | | 170 | | | None | |
|
| Lynn A. Stout 9/14/57 | | Trustee | | Since 1998 | | Professor of Law, University of California at Los Angeles School of Law. | | | 170 | | | None | |
|
| Ralph F. Verni 1/26/43 | | Trustee | | Since 2005 | | Consultant and private investor. | | | 170 | | | None | |
|
| Principal Officers who are not Trustees | | | | | | | | | | | | | |
|
Name and
Date of Birth | | Position(s)
with the
Trust and
the Portfolio | | Term of
Office and
Length of
Service | | Principal Occupation(s)
During Past Five Years | |
| Thomas E. Faust Jr. 5/31/58 | | President of the Trust | | Since 2002 | | President of EVC, EVM, BMR and EV and Director of EVC. Chief Investment Officer of EVC, EVM and BMR. Officer of 71 registered investment companies and 5 private investment companies managed by EVM or BMR. | |
|
William H. Ahern, Jr.
7/28/59 | | Vice President of the Trust | | Since 1995 | | Vice President of EVM and BMR. Officer of 71 registered investment companies managed by EVM or BMR. | |
|
Edward R. Allen, III
7/5/60 | | Vice President of the Portfolio | | Since 2004 | | Partner and Chairman of the International Investment Committee of Eagle. Officer of 3 registered investment companies managed by EVM or BMR. | |
|
Cynthia J. Clemson
3/2/63 | | Vice President of the Trust | | Since 2005 | | Vice President of EVM and BMR. Officer of 88 registered investment companies managed by EVM or BMR | |
|
| Thomas N. Hunt, III 11/6/64 | | Vice President of the Portfolio | | Since 2004 | | Partner of Eagle. Officer of 3 registered investment companies managed by EVM or BMR. | |
|
| Aamer Khan 6/7/60 | | Vice President of the Trust | | Since 2005 | | Vice President of EVM and BMR. Officer of 29 registered investment companies managed by EVM or BMR. | |
|
| Thomas H. Luster 4/8/62 | | Vice President of the Trust | | Since 2006 | | Vice President of EVM and BMR. Officer of 45 registered investment companies managed by EVM or BMR. | |
|
33
Eaton Vance Tax-Managed International Equity Fund
MANAGEMENT AND ORGANIZATION CONT'D
Name and
Date of Birth | | Position(s)
with the
Trust and
the Portfolio | | Term of
Office and
Length of
Service | | Principal Occupation(s)
During Past Five Years | |
| Principal Officers who are not Trustees (continued) | | | | | | | |
|
| Michael R. Mach 7/15/47 | | Vice President of the Trust | | Since 1999 | | Vice President of EVM and BMR. Officer of 51 registered investment companies managed by EVM or BMR. | |
|
| Robert B. MacIntosh 1/22/57 | | Vice President of the Trust | | Since 1998 | | Vice President of EVM and BMR. Officer of 86 registered investment companies managed by EVM and BMR. | |
|
| Cliff Quisenberry, Jr. 1/1/65 | | Vice President of the Trust | | Since 2006 | | Vice President and Director of Research and Product Development of Parametric. Officer of 30 registered investment companies managed by EVM or BMR. | |
|
Duncan W. Richardson
10/26/57 | | Vice President of the Trust and President of the Portfolio | | Vice President of the Trust since 2001 and President of the Portfolio since 2002 | | Executive Vice President and Chief Equity Investment Officer of EVC, EVM and BMR. Officer 71 registered investment companies managed by EVM or BMR. | |
|
| Walter A. Row, III 7/20/57 | | Vice President of the Trust | | Since 2001 | | Director of Equity Research and a Vice President of EVM and BMR. Officer of 33 registered investment companies managed by EVM or BMR. | |
|
| Judith A. Saryan 8/21/54 | | Vice President of the Trust | | Since 2003 | | Vice President of EVM and BMR. Officer of 50 registered investment companies managed by EVM or BMR. | |
|
| Susan Schiff 3/13/61 | | Vice President of the Trust | | Since 2002 | | Vice President of EVM and BMR. Officer of 30 registered investment companies managed by EVM or BMR. | |
|
Kristin S. Anagnost
6/12/65 | | Treasurer of the Portfolio | | Since 2002(2) | | Assistant Vice President of EVM and BMR. Officer of 95 registered investment companies managed by EVM or BMR. | |
|
Barbara E. Campbell
6/19/57 | | Treasurer of the Trust | | Since 2005(2) | | Vice President of EVM and BMR. Officer of 170 registered investment companies managed by EVM or BMR. | |
|
Alan R. Dynner
10/10/40 | | Secretary | | Secretary of the Trust since 1997 and of the Portfolio since 1998 | | Vice President, Secretary and Chief Legal Officer of BMR, EVM, EVD, EV and EVC. Officer of 170 registered investment companies managed by EVM or BMR. | |
|
Paul M. O'Neil
7/11/53 | | Chief Compliance Officer | | Since 2004 | | Vice President of EVM and BMR. Officer of 170 registered investment companies managed by EVM or BMR. | |
|
(1) Includes both master and feeder funds in a master-feeder structure.
(2) Prior to 2002, Ms. Anagnost served as Assistant Treasurer of the Portfolio since 1998. Prior to 2005, Ms. Campbell served as Assistant Treasurer of the Trust since 1995.
The SAI for the Fund includes additional information about the Trustees and officers of the Fund and the Portfolio and can be obtained without charge by calling 1-800-225-6265.
34
This Page Intentionally Left Blank
This Page Intentionally Left Blank
Investment Adviser of Tax-Managed International Equity Portfolio
Boston Management and Research
The Eaton Vance Building
255 State Street
Boston, MA 02109
Sub-Adviser of Tax-Managed International Equity Portfolio
Eagle Global Advisors, L.L.C.
5847 San Felipe, Suite 930
Houston, TX 77057
Administrator of Eaton Vance Tax-Managed International Equity Fund
Eaton Vance Management
The Eaton Vance Building
255 State Street
Boston, MA 02109
Principal Underwriter
Eaton Vance Distributors, Inc.
The Eaton Vance Building
255 State Street
Boston, MA 02109
(617) 482-8260
Custodian
Investors Bank & Trust Company
200 Clarendon Street
Boston, MA 02116
Transfer Agent
PFPC Inc.
Attn: Eaton Vance Funds
P.O. Box 9653
Providence, RI 02940-9653
(800) 262-1122
Independent Registered Public Accounting Firm
Deloitte & Touche LLP
200 Berkeley Street
Boston, MA 02116-5022
Eaton Vance Tax-Managed International Equity Fund
The Eaton Vance Building
255 State Street
Boston, MA 02109
This report must be preceded or accompanied by a current prospectus. Before investing, investors should consider carefully the Fund's investment objective(s), risks, and charges and expenses. The Fund's current prospectus contains this and other information about the Fund and is available through your financial advisor. Please read the prospectus carefully before you invest or send money. For further information please call 1-800-225-6265.
038-12/06 IGSRC

Annual Report October 31, 2006


EATON VANCE
TAX-MANAGED
SMALL-CAP
GROWTH FUND
IMPORTANT NOTICES REGARDING PRIVACY,
DELIVERY OF SHAREHOLDER DOCUMENTS,
PORTFOLIO HOLDINGS AND PROXY VOTING
Privacy. The Eaton Vance organization is committed to ensuring your financial privacy. Each of the financial institutions identified below has in effect the following policy ("Privacy Policy") with respect to nonpublic personal information about its customers:
• Only such information received from you, through application forms or otherwise, and information about your Eaton Vance fund transactions will be collected. This may include information such as name, address, social security number, tax status, account balances and transactions.
• None of such information about you (or former customers) will be disclosed to anyone, except as permitted by law (which includes disclosure to employees necessary to service your account). In the normal course of servicing a customer's account, Eaton Vance may share information with unaffiliated third parties that perform various required services such as transfer agents, custodians and broker/dealers.
• Policies and procedures (including physical, electronic and procedural safeguards) are in place that are designed to protect the confidentiality of such information.
• We reserve the right to change our Privacy Policy at any time upon proper notification to you. Customers may want to review our Policy periodically for changes by accessing the link on our homepage: www.eatonvance.com.
Our pledge of privacy applies to the following entities within the Eaton Vance organization: the Eaton Vance Family of Funds, Eaton Vance Management, Eaton Vance Investment Counsel, Boston Management and Research, and Eaton Vance Distributors, Inc.
In addition, our Privacy Policy only applies to those Eaton Vance customers who are individuals and who have a direct relationship with us. If a customer's account (i.e., fund shares) is held in the name of a third-party financial adviser/broker-dealer, it is likely that only such adviser's privacy policies apply to the customer. This notice supersedes all previously issued privacy disclosures.
For more information about Eaton Vance's Privacy Policy, please call 1-800-262-1122.
Delivery of Shareholder Documents. The Securities and Exchange Commission ("the SEC") permits funds to deliver only one copy of shareholder documents, including prospectuses, proxy statements and shareholder reports, to fund investors with multiple accounts at the same residential or post office box address. This practice is often called "householding" and it helps eliminate duplicate mailings to shareholders.
Eaton Vance, or your financial adviser, may household the mailing of your documents indefinitely unless you instruct Eaton Vance, or your financial adviser, otherwise.
If you would prefer that your Eaton Vance documents not be householded, please contact Eaton Vance at 1-800-262-1122, or contact your financial adviser.
Your instructions that householding not apply to delivery of your Eaton Vance documents will be effective within 30 days of receipt by Eaton Vance or your financial adviser.
Portfolio Holdings. Each Eaton Vance Fund and its underlying Portfolio (if applicable) will file a schedule of its portfolio holdings on Form N-Q with the SEC for the first and third quarters of each fiscal year. The Form N-Q will be available on the Eaton Vance website www.eatonvance.com, by calling Eaton Vance at 1-800-262-1122 or in the EDGAR database on the SEC's website at www.sec.gov. Form N-Q may also be reviewed and copied at the SEC's public reference room in Washington, D.C. (call 1-800-732-0330 for information on the operation of the public reference room).
Proxy Voting. From time to time, funds are required to vote proxies related to the securities held by the funds. The Eaton Vance Funds or their underlying Portfolios (if applicable) vote proxies according to a set of policies and procedures approved by the Funds' and Portfolios' Boards. You may obtain a description of these policies and procedures and information on how the Funds or Portfolios voted proxies relating to portfolio securities during the most recent 12 month period ended June 30, without charge, upon request, by calling 1-800-262-1122. This description is also available on the SEC's website at www.sec.gov.
Eaton Vance Tax-Managed Small-Cap Growth Fund as of October 31, 2006
MANAGEMENT‘S DISCUSSION OF PERFORMANCE

Nancy B. Tooke, CFA
Portfolio Manager
The Fund
Performance for the Past Year
· For the year ended October 31, 2006, Eaton Vance Tax-Managed Small-Cap Growth Fund’s (the “Fund”) Class A shares had a total return of 21.55%. This return was the result of an increase in net asset value (NAV) per share to $12.52 on October 31, 2006, from $10.30 on October 31, 2005.(1)
· The Fund’s Class B shares had a total return of 20.76% for the same period, the result of an increase in NAV per share to $11.69 from $9.68.(1)
· The Fund’s Class C shares had a total return of 20.72% for the same period, the result of an increase in NAV per share to $11.65 from $9.65.(1)
· For comparison, the Russell 2000 Index – an unmanaged market index of small-cap stocks – had a total return of 19.98%, while the S&P SmallCap 600 Index – a broad-based, unmanaged market index of 600 small-capitalization stocks trading in the U.S. – had a total return of 16.10%.2 The Fund’s peer group, the Lipper Small-Cap Growth Funds Classification, had an average total return of 12.82% for the same period.(2)
See pages 2 and 4 for more performance information, including after-tax returns.
Management Discussion
· The U.S. economy showed impressive strength in the first half of the fiscal year, amid high consumer confidence, strong job creation and solid corporate earnings growth. However, the economy moderated in the second half of the fiscal year ended October 31, 2006, as the combination of rising interest rates and higher energy costs finally began to take a toll on consumer spending.
· The stock market moved modestly higher through April 2006, but underwent a sharp correction in May and June, as the spike in oil prices and the flagging real estate market temporarily cooled investor sentiment. In mid-summer, the market regained its footing on signs of improving corporate earnings and extended its rally through the end of the fiscal year. Small-cap stocks outperformed their larger-cap counterparts. However, growth stocks, especially technology stocks, tended to underperform value stocks.
· For the year ended October 31, 2006, the Fund outperformed its benchmark. The Fund invests its assets in Tax-Managed Small Cap Growth Portfolio (the “Portfolio”), a separate investment company with the same objectives and investment policies as the Fund. The Portfolio remained broadly diversified among economic sectors and industry groups. Sector weightings shifted slightly during the fiscal year ended October 31, 2006. The Portfolio had a slightly increased exposure to the industrial and financial sectors, while the weighting in energy was slightly reduced during the fiscal year.(3)
· The Portfolio’s leading performers during the fiscal year were in the consumer discretionary, consumer staples and information technology sectors. Media stocks fared well for the Portfolio, including an operator of television stations in Central and Eastern Europe. Stock selection among food and personal care products also produced favorable returns. Within the technology sector, the Portfolio saw strong performances from semiconductor stocks serving the telecom industry and from enterprise software stocks with discrete niche business applications.
· Some of the the Portfolio’s less robust perfomers during the fiscal year were in the financial and health care sectors. Insurance companies struggled with a difficult interest-rate environment and increased competition. In the health care area, some makers of life care tools and supplies failed to meet earnings expectations. While energy contributed strongly through much of the year, the group detracted modestly from performance in the latter months of the fiscal year, as energy equipment stocks corrected after a lengthy period of outperformance.
· As previously announced, Eaton Vance Tax-Managed Small-Cap Growth Fund 1.2 merged into Eaton Vance Tax-Managed Small-Cap Growth Fund 1.1 at the close of business on April 28, 2006, and was renamed Eaton Vance Tax-Managed Small-Cap Growth Fund on May 1, 2006.
Past performance is no guarantee of future results. Returns are historical and are calculated by determining the percentage change in net asset value or offering price (as applicable) with all distributions reinvested. Investment return and principal value will fluctuate so that shares, when redeemed, may be worth more or less than their original cost. Performance is for stated time period only; due to market volatility, the Fund’s current performance may be lower or higher than the quoted return. Fund performance during certain periods reflects the strong stock market performance and/or the strong performance of stocks held during those periods. This performance is not typical and may not be repeated. For performance as of the most recent month end, please refer to www.eatonvance.com.
(1) These returns do not include the 5.75% maximum sales charge for Class A shares or the applicable contingent deferred sales charge (CDSC) for Class B and Class C shares. If sales charges were deducted, returns would be lower.
(2) It is not possible to invest directly in an Index or a Lipper Classification. The Indexes’ total returns do not reflect commissions or expenses that would have been incurred if an investor individually purchased or sold the securities represented in an Index or a Lipper Classification. The Lipper average is the average total return, at net asset value, of the funds that are in the same Lipper Classification as the Fund.
(3) Sector and industry weightings are subject to change due to active management.
Fund shares are not insured by the FDIC and are not deposits or other obligations of, or guaranteed by, any depository institution. Shares are subject to investment risks, including possible loss of principal invested.
1
Eaton Vance Tax-Managed Small-Cap Growth Fund as of October 31, 2006
FUND PERFORMANCE
The line graph and table set forth below provide information about the Fund’s performance. The line graph compares the performance of Class A of the Fund with that of the S&P SmallCap 600 Index, a broad-based, unmanaged market index of 600 small-capitalization stocks traded in the U.S., and the Russell 2000 Index, an unmanaged market index of smallcap growth stocks. The lines on the graph represent the total returns of a hypothetical investment of $10,000 in each of Class A, the S&P SmallCap 600 Index, and the Russell 2000 Index. Class A total returns are presented at net asset value and maximum public offering price. The table includes the total returns of each Class of the Fund at net asset value and public offering price. The performance presented below does not reflect the deduction of taxes, if any, that a shareholder would pay on distributions or redemptions of Fund shares.
Performance(1) | | Class A | | Class B | | Class C | |
Average Annual Total Returns (at net asset value) | | | | | | | |
One Year | | 21.55 | % | 20.76 | % | 20.72 | % |
Five Years | | 4.94 | | 4.15 | | 4.16 | |
Life of Fund† | | 2.50 | | 1.73 | | 1.69 | |
| | | | | | | |
SEC Average Annual Total Returns (including sales charge or applicable CDSC) | | | | | | | |
One Year | | 14.55 | % | 15.76 | % | 19.72 | % |
Five Years | | 3.70 | | 3.81 | | 4.16 | |
Life of Fund† | | 1.84 | | 1.73 | | 1.69 | |
† Inception Dates — Class A: 9/25/97; Class B: 9/29/97; Class C: 9/29/97
(1) Average annual total returns do not include the 5.75% maximum sales charge for Class A shares or the applicable contingent deferred sales charge (CDSC) for Class B and Class C shares. If sales charges were deducted, the returns would be lower. SEC average annual total returns for Class A reflect the maximum 5.75% sales charge. SEC returns for Class B shares reflect the applicable CDSC based on the following schedule: 5% - 1st and 2nd years; 4% - 3rd year; 3% - 4th year; 2% - 5th year; 1% - 6th year. SEC returns for Class C reflect a 1% CDSC for the first year.
Past performance is no guarantee of future results. Returns are historical and are calculated by determining the percentage change in net asset value or offering price (as applicable) with all distributions reinvested. Investment return and principal value will fluctuate so that shares, when redeemed, may be worth more or less than their original cost. Performance is for the stated time period only; due to market volatility, the Fund’s current performance may be lower or higher than the quoted return. Fund performance during certain periods reflects the strong stock market performance and/or the strong performance of stocks held during those periods. This performance is not typical and may not be repeated. For performance as of the most recent month end, please refer to www.eatonvance.com.
The views expressed throughout this report are those of the portfolio manager and are current only through the end of the period of the report as stated on the cover. These views are subject to change at any time based upon market or other conditions, and the investment adviser disclaims any responsibility to update such views. These views may not be relied on as investment advice and, because investment decisions for a fund are based on many factors, may not be relied on as an indication of trading intent on behalf of any Eaton Vance fund.
Comparison of Change in Value of a $10,000 Investment in
Eaton Vance Tax-Managed Small-Cap Growth Fund Class A vs. the
S&P SmallCap 600 Index and the Russell 2000 Index*
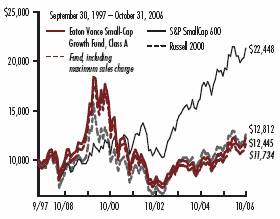
* Source: Thomson Financial. Class A of the Fund commenced investment operations on 9/25/97. A $10,000 hypothetical investment at net asset value in Class B shares and Class C shares on 9/29/97 would have been valued at $11,690 and $11,650, respectively, on 10/31/06. It is not possible to invest directly in an Index. The Indexes’ total returns do not reflect commissions or expenses that would have been incurred if an investor individually purchased or sold the securities represented in an Index.
2
Top Ten Holdings(1)
By net assets
Jarden Corp. | | 2.8 | % |
FLIR Systems, Inc. | | 2.1 | % |
MoneyGram International, Inc. | | 2.1 | % |
Parametric Technology Corp. | | 2.1 | % |
Sybase, Inc. | | 2.1 | % |
Essex Property Trust, Inc. | | 2.0 | % |
Central European Media Enterprises, Ltd. | | 1.9 | % |
RBC Bearings, Inc. | | 1.9 | % |
Analogic Corp. | | 1.8 | % |
Cooper Companies, Inc. (The) | | 1.8 | % |
(1) Top Ten Holdings represented 20.6% of Portfolio net assets as of October 31, 2006. Holdings are subject to change due to active management.
Common Stock Investments by Sector(2)
By net assets
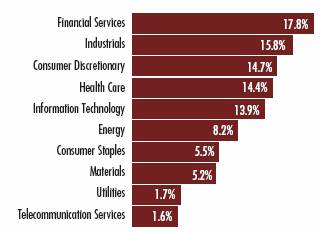
(2) As a percentage of the Portfolio’s net assets as of 10/31/06. Portfolio information may not be representative of the Portfolio’s current or future investments and may change due to active management.
3
“Return Before Taxes” does not take into consideration shareholder taxes. It is most relevant to tax-free or tax-deferred shareholder accounts. “Return After Taxes on Distributions” reflects the impact of federal income taxes due on Fund distributions of dividends and capital gains. It is most relevant to taxpaying shareholders who continue to hold their shares. “Return After Taxes on Distributions and Sale of Fund Shares” also reflects the impact of taxes on capital gain or loss realized upon a sale of shares. It is most relevant to taxpaying shareholders who sell their shares.
Average Annual Total Returns
(For the periods ended October 31, 2006)
Returns at Net Asset Value (NAV) (Class A)
| | One Year | | Five Years | | Life of Fund | |
Return Before Taxes | | 21.55 | % | 4.94 | % | 2.50 | % |
Return After Taxes on Distributions | | 21.55 | % | 4.94 | % | 2.50 | % |
Return After Taxes on Distributions and Sale of Fund Shares | | 14.01 | % | 4.25 | % | 2.16 | % |
Returns at Public Offering Price (POP) (Class A)
| | One Year | | Five Years | | Life of Fund | |
Return Before Taxes | | 14.55 | % | 3.70 | % | 1.84 | % |
Return After Taxes on Distributions | | 14.55 | % | 3.70 | % | 1.84 | % |
Return After Taxes on Distributions and Sale of Fund Shares | | 9.46 | % | 3.18 | % | 1.58 | % |
Average Annual Total Returns
(For the periods ended October 31, 2006)
Returns at Net Asset Value (NAV) (Class C)
| | One Year | | Five Years | | Life of Fund | |
Return Before Taxes | | 20.72 | % | 4.16 | % | 1.69 | % |
Return After Taxes on Distributions | | 20.72 | % | 4.16 | % | 1.69 | % |
Return After Taxes on Distributions and Sale of Fund Shares | | 13.47 | % | 3.58 | % | 1.45 | % |
Returns at Public Offering Price (POP) (Class C)
| | One Year | | Five Years | | Life of Fund | |
Return Before Taxes | | 19.72 | % | 4.16 | % | 1.69 | % |
Return After Taxes on Distributions | | 19.72 | % | 4.16 | % | 1.69 | % |
Return After Taxes on Distributions and Sale of Fund Shares | | 12.82 | % | 3.58 | % | 1.45 | % |
Average Annual Total Returns
(For the periods ended October 31, 2006)
Returns at Net Asset Value (NAV) (Class B)
| | One Year | | Five Years | | Life of Fund | |
Return Before Taxes | | 20.76 | % | 4.15 | % | 1.73 | % |
Return After Taxes on Distributions | | 20.76 | % | 4.15 | % | 1.73 | % |
Return After Taxes on Distributions and Sale of Fund Shares | | 13.50 | % | 3.57 | % | 1.49 | % |
Returns at Public Offering Price (POP) (Class B)
| | One Year | | Five Years | | Life of Fund | |
Return Before Taxes | | 15.76 | % | 3.81 | % | 1.73 | % |
Return After Taxes on Distributions | | 15.76 | % | 3.81 | % | 1.73 | % |
Return After Taxes on Distributions and Sale of Fund Shares | | 10.25 | % | 3.27 | % | 1.49 | % |
Class A of the Fund commenced invesment operations on 9/25/97, and Class B and Class C of the Fund commenced investment operations on 9/29/97. Returns at Public Offering Price (POP) reflect the deduction of the maximum initial sales charge and applicable CDSC, while Returns at Net Asset Value (NAV) do not.
After-tax returns are calculated using the highest historical individual federal income tax rate and do not reflect the impact of state and local taxes. Actual after-tax returns depend on a shareholder’s tax situation and may differ from those shown. After-tax returns are not relevant for shareholders who hold Fund shares in tax-deferred accounts or to shares held by non-taxable entities. Return After Taxes on Distributions for a period may be the same as Return Before Taxes for that period because no distributions were paid during that period, or because the taxable portion of distributions made during the period was insignificant. Also, Return After Taxes on Distributions and Sale of Fund Shares for a period may be greater than Return After Taxes on Distributions for the same period because of realized losses on the sale of Fund shares. Fund performance during certain periods reflects the strong stock market performance and/or the strong performance of stocks held during those periods. This performance is not typical and may not be repeated.
Past performance is no guarantee of future results. Returns are historical and are calculated by determining the percentage change in net asset value or offering price (as applicable) with all distributions reinvested. Investment return and principal value will fluctuate so that shares, when redeemed, may be worth more or less than their original cost. Performance is for the stated time period only; due to market volatility, the Fund’s current performance may be lower or higher than the quoted return. Fund performance during certain periods reflects the strong stock market performance and/or the strong performance of stocks held during those periods. This performance is not typical and may not be repeated. For performance as of the most recent month end, please refer to www.eatonvance.com.
4
Eaton Vance Tax-Managed Small-Cap Growth Fund as of October 31, 2006
FUND EXPENSES
Example: As a shareholder of the Fund, you incur two types of costs: (1) transaction costs, including sales charges (loads) on purchases and redemption fees (if applicable); and (2) ongoing costs, including management fees; distribution or service fees; and other Fund expenses. This Example is intended to help you understand your ongoing costs (in dollars) of investing in the Fund and to compare these costs with the ongoing costs of investing in other mutual funds. The Example is based on an investment of $1,000 invested at the beginning of the period and held for the entire period (May 1, 2006 – October 31, 2006).
Actual Expenses: The first section of the table below provides information about actual account values and actual expenses. You may use the information in this section, together with the amount you invested, to estimate the expenses that you paid over the period. Simply divide your account value by $1,000 (for example, an $8,600 account value divided by $1,000 = 8.6), then multiply the result by the number in the first section under the heading entitled "Expenses Paid During Period" to estimate the expenses you paid on your account during this period.
Hypothetical Example for Comparison Purposes: The second section of the table below provides information about hypothetical account values and hypothetical expenses based on the actual Fund expense ratio and an assumed rate of return of 5% per year (before expenses), which is not the actual return of the Fund. The hypothetical account values and expenses may not be used to estimate the actual ending account balance or expenses you paid for the period. You may use this information to compare the ongoing costs of investing in your Fund and other funds. To do so, compare this 5% hypothetical example with the 5% hypothetical examples that appear in the shareholder reports of the other funds.
Please note that the expenses shown in the table are meant to highlight your ongoing costs only and do not reflect any transactional costs, such as sales charges (loads) or redemption fees (if applicable). Therefore, the second section of the table is useful in comparing ongoing costs only, and will not help you determine the relative total costs of owning different funds. In addition, if these transactional costs were included, your costs would have been higher.
Eaton Vance Tax-Managed Small-Cap Growth Fund
| | | Beginning Account Value
(5/1/06) | | Ending Account Value
(10/31/06) | | Expenses Paid During Period*
(5/1/06 – 10/31/06) | |
| Actual | |
| Class A | | $ | 1,000.00 | | | $ | 997.60 | | | $ | 6.95 | | |
| Class B | | $ | 1,000.00 | | | $ | 994.90 | | | $ | 10.66 | | |
| Class C | | $ | 1,000.00 | | | $ | 994.00 | | | $ | 10.71 | | |
| Hypothetical | |
| (5% return per year before expenses) | |
| Class A | | $ | 1,000.00 | | | $ | 1,018.20 | | | $ | 7.02 | | |
| Class B | | $ | 1,000.00 | | | $ | 1,014.50 | | | $ | 10.76 | | |
| Class C | | $ | 1,000.00 | | | $ | 1,014.50 | | | $ | 10.82 | | |
* Expenses are equal to the Fund's annualized expense ratio of 1.38% for Class A shares, 2.12% for Class B shares, and 2.13% for Class C shares multiplied by the average account value over the period, multiplied by 184/365 (to reflect the one-half year period). The Example assumes that the $1,000 was invested at the net asset value per share determined at the close of business on April 30, 2006. The Example reflects the expenses of both the Fund and the Portfolio.
5
Eaton Vance Tax-Managed Small-Cap Growth Fund as of October 31, 2006
FINANCIAL STATEMENTS
Statement of Assets and Liabilities
As of October 31, 2006
| Assets | |
Investment in Tax-Managed Small-Cap Growth Portfolio, at value
(identified cost, $104,328,030) | | $ | 116,944,399 | | |
| Receivable for Fund shares sold | | | 56,027 | | |
| Total assets | | $ | 117,000,426 | | |
| Liabilities | |
| Payable for Fund shares redeemed | | $ | 211,311 | | |
| Payable to affiliate for distribution and service fees | | | 68,505 | | |
| Payable to affiliate for Trustees' fees | | | 156 | | |
| Other accrued expenses | | | 91,324 | | |
| Total liabilities | | $ | 371,296 | | |
| Net Assets | | $ | 116,629,130 | | |
| Sources of Net Assets | |
| Paid-in capital | | $ | 218,894,524 | | |
Accumulated net realized loss from Portfolio (computed on
the basis of identified cost) | | | (114,881,763 | ) | |
Net unrealized appreciation from Portfolio (computed on the basis of
identified cost) | | | 12,616,369 | | |
| Total | | $ | 116,629,130 | | |
| Class A Shares | |
| Net Assets | | $ | 46,894,833 | | |
| Shares Outstanding | | | 3,745,155 | | |
Net Asset Value and Redemption Price Per Share
(net assets ÷ shares of beneficial interest outstanding) | | $ | 12.52 | | |
Maximum Offering Price Per Share
(100 ÷ 94.25 of $12.52) | | $ | 13.28 | | |
| Class B Shares | |
| Net Assets | | $ | 43,052,898 | | |
| Shares Outstanding | | | 3,682,994 | | |
Net Asset Value, Offering Price and Redemption Price Per Share
(net assets ÷ shares of beneficial interest outstanding) | | $ | 11.69 | | |
| Class C Shares | |
| Net Assets | | $ | 26,681,399 | | |
| Shares Outstanding | | | 2,291,040 | | |
Net Asset Value, Offering Price and Redemption Price Per Share
(net assets ÷ shares of beneficial interest outstanding) | | $ | 11.65 | | |
| On sales of $50,000 or more, the offering price of Class A shares is reduced. | | | | | |
Statement of Operations
For the Year Ended
October 31, 2006
| Investment Income | |
| Dividends allocated from Portfolio (net of foreign taxes, $1,013) | | $ | 562,193 | | |
| Interest allocated from Portfolio | | | 242,683 | | |
| Expenses allocated from Portfolio | | | (775,816 | ) | |
| Net investment income from Portfolio | | $ | 29,060 | | |
| Expenses | |
| Trustees' fees and expenses | | | 1,549 | | |
Distribution and service fees
Class A | | | 88,943 | | |
| Class B | | | 464,677 | | |
| Class C | | | 226,812 | | |
| Transfer and dividend disbursing agent fees | | | 273,941 | | |
| Printing and postage | | | 65,046 | | |
| Registration fees | | | 45,597 | | |
| Legal and accounting services | | | 24,503 | | |
| Custodian fee | | | 18,423 | | |
| Miscellaneous | | | 3,374 | | |
| Total expenses | | $ | 1,212,865 | | |
| Net investment loss | | $ | (1,183,805 | ) | |
| Realized and Unrealized Gain from Portfolio | |
Net realized gain —
Investment transactions (identified cost basis) | | $ | 18,110,349 | | |
| Foreign currency transactions | | | 53 | | |
| Net realized gain | | $ | 18,110,402 | | |
Change in unrealized appreciation (depreciation) —
Investments (identified cost basis) | | $ | (187,670 | ) | |
| Net change in unrealized appreciation (depreciation) | | $ | (187,670 | ) | |
| Net realized and unrealized gain | | $ | 17,922,732 | | |
| Net increase in net assets from operations | | $ | 16,738,927 | | |
See notes to financial statements
6
Eaton Vance Tax-Managed Small-Cap Growth Fund as of October 31, 2006
FINANCIAL STATEMENTS CONT'D
Statements of Changes in Net Assets
Increase (Decrease)
in Net Assets | | Year Ended
October 31, 2006 | | Year Ended
October 31, 2005 | |
From operations —
Net investment loss | | $ | (1,183,805 | ) | | $ | (1,659,210 | ) | |
Net realized gain from investment
transactions and foreign
currency transactions | | | 18,110,402 | | | | 15,695,062 | | |
Net change in unrealized appreciation
(depreciation) from investments
and foreign currency | | | (187,670 | ) | | | (5,158,255 | ) | |
| Net increase in net assets from operations | | $ | 16,738,927 | | | $ | 8,877,597 | | |
Transactions in shares of beneficial interest —
Proceeds from sale of shares
Class A | | $ | 2,101,706 | | | $ | 479,543 | | |
| Class B | | | 533,172 | | | | 533,785 | | |
| Class C | | | 669,239 | | | | 394,910 | | |
Issued in reorganization of Eaton Vance
Tax-Managed Small-Cap Growth 1.2
Class A | | | 13,881,608 | | | | — | | |
| Class B | | | 12,235,505 | | | | — | | |
| Class C | | | 10,183,286 | | | | — | | |
Cost of shares redeemed
Class A | | | (10,091,563 | ) | | | (9,789,356 | ) | |
| Class B | | | (14,186,537 | ) | | | (18,896,375 | ) | |
| Class C | | | (5,854,588 | ) | | | (9,188,732 | ) | |
Net asset value of shares exchanged
Class A | | | 10,671,193 | | | | 1,537,677 | | |
| Class B | | | (10,671,193 | ) | | | (1,537,677 | ) | |
Net increase (decrease) in net assets from
Fund share transactions | | $ | 9,471,828 | | | $ | (36,466,225 | ) | |
| Net increase (decrease) in net assets | | $ | 26,210,755 | | | $ | (27,588,628 | ) | |
| Net Assets | |
| At beginning of year | | $ | 90,418,375 | | | $ | 118,007,003 | | |
| At end of year | | $ | 116,629,130 | | | $ | 90,418,375 | | |
See notes to financial statements
7
Eaton Vance Tax-Managed Small-Cap Growth Fund as of October 31, 2006
FINANCIAL STATEMENTS CONT'D
Financial Highlights
| | | Class A | |
| | | Year Ended October 31, | |
| | | 2006 | | 2005 | | 2004 | | 2003 | | 2002 | |
| Net asset value — Beginning of year | | $ | 10.300 | | | $ | 9.470 | | | $ | 9.630 | | | $ | 7.620 | | | $ | 9.840 | | |
| Income (loss) from operations | |
| Net investment loss(1) | | $ | (0.073 | ) | | $ | (0.105 | ) | | $ | (0.107 | ) | | $ | (0.100 | ) | | $ | (0.095 | ) | |
| Net realized and unrealized gain (loss) | | | 2.293 | | | | 0.935 | | | | (0.053 | ) | | | 2.110 | | | | (2.125 | ) | |
| Total income (loss) from operations | | $ | 2.220 | | | $ | 0.830 | | | $ | (0.160 | ) | | $ | 2.010 | | | $ | (2.220 | ) | |
| Net asset value — End of year | | $ | 12.520 | | | $ | 10.300 | | | $ | 9.470 | | | $ | 9.630 | | | $ | 7.620 | | |
| Total Return(2) | | | 21.55 | % | | | 8.76 | % | | | (1.66 | )%(3) | | | 26.38 | % | | | (22.56 | )% | |
| Ratios/Supplemental Data | |
| Net assets, end of year (000's omitted) | | $ | 46,895 | | | $ | 24,855 | | | $ | 30,172 | | | $ | 40,514 | | | $ | 44,208 | | |
| Ratios (As a percentage of average daily net assets): | |
| Expenses before custodian fee reduction(4) | | | 1.41 | %(5) | | | 1.44 | %(5) | | | 1.37 | % | | | 1.43 | % | | | 1.24 | % | |
| Expenses after custodian fee reduction(4) | | | 1.41 | %(5) | | | 1.44 | %(5) | | | 1.37 | % | | | 1.43 | % | | | 1.24 | % | |
| Net investment loss | | | (0.63 | )% | | | (1.04 | )% | | | (1.12 | )% | | | (1.23 | )% | | | (1.00 | )% | |
| Portfolio Turnover of the Portfolio | | | 99 | % | | | 223 | % | | | 282 | % | | | 248 | % | | | 131 | % | |
(1) Net investment loss per share was computed using average shares outstanding.
(2) Returns are historical and are calculated by determining the percentage change in net asset value with all distributions reinvested.
(3) The effect of the Fund's net increase from payments by affiliate and net gains (losses), through its investment in the Portfolio, realized on the disposal of investments purchased which did not meet the Portfolio's investment guidelines amounted to less than $0.01 per share and had no effect on total return for the year ended October 31, 2004.
(4) Includes the Fund's share of the Portfolio's allocated expenses.
(5) The investment adviser waived a portion of its investment advisory fee (equal to less than 0.01% and 0.01% of average daily net assets for 2006 and 2005, respectively).
See notes to financial statements
8
Eaton Vance Tax-Managed Small-Cap Growth Fund as of October 31, 2006
FINANCIAL STATEMENTS CONT'D
Financial Highlights
| | | Class B | |
| | | Year Ended October 31, | |
| | | 2006 | | 2005 | | 2004 | | 2003 | | 2002 | |
| Net asset value — Beginning of year | | $ | 9.680 | | | $ | 8.980 | | | $ | 9.190 | | | $ | 7.330 | | | $ | 9.540 | | |
| Income (loss) from operations | |
| Net investment loss(1) | | $ | (0.152 | ) | | $ | (0.170 | ) | | $ | (0.170 | ) | | $ | (0.155 | ) | | $ | (0.161 | ) | |
| Net realized and unrealized gain (loss) | | | 2.162 | | | | 0.870 | | | | (0.040 | ) | | | 2.015 | | | | (2.049 | ) | |
| Total income (loss) from operations | | $ | 2.010 | | | $ | 0.700 | | | $ | (0.210 | ) | | $ | 1.860 | | | $ | (2.210 | ) | |
| Net asset value — End of year | | $ | 11.690 | | | $ | 9.680 | | | $ | 8.980 | | | $ | 9.190 | | | $ | 7.330 | | |
| Total Return(2) | | | 20.76 | % | | | 7.80 | % | | | (2.28 | )%(3) | | | 25.38 | % | | | (23.16 | )% | |
| Ratios/Supplemental Data | |
| Net assets, end of year (000's omitted) | | $ | 43,053 | | | $ | 47,222 | | | $ | 62,553 | | | $ | 82,345 | | | $ | 81,353 | | |
| Ratios (As a percentage of average daily net assets): | |
| Expenses before custodian fee reduction(4) | | | 2.16 | %(5) | | | 2.19 | %(5) | | | 2.12 | % | | | 2.18 | % | | | 1.99 | % | |
| Expenses after custodian fee reduction(4) | | | 2.16 | %(5) | | | 2.19 | %(5) | | | 2.12 | % | | | 2.18 | % | | | 1.99 | % | |
| Net investment loss | | | (1.40 | )% | | | (1.79 | )% | | | (1.87 | )% | | | (1.98 | )% | | | (1.75 | )% | |
| Portfolio Turnover of the Portfolio | | | 99 | % | | | 223 | % | | | 282 | % | | | 248 | % | | | 131 | % | |
(1) Net investment loss per share was computed using average shares outstanding.
(2) Returns are historical and are calculated by determining the percentage change in net asset value with all distributions reinvested.
(3) The effect of the Fund's net increase from payments by affiliate and net gains (losses), through its investment in the Portfolio, realized on the disposal of investments purchased which did not meet the Portfolio's investment guidelines amounted to less than $0.01 per share and had no effect on total return for the year ended October 31, 2004.
(4) Includes the Fund's share of the Portfolio's allocated expenses.
(5) The investment adviser waived a portion of its investment advisory fee (equal to less than 0.01% and 0.01% of average daily net assets for 2006 and 2005, respectively).
See notes to financial statements
9
Eaton Vance Tax-Managed Small-Cap Growth Fund as of October 31, 2006
FINANCIAL STATEMENTS CONT'D
Financial Highlights
| | | Class C | |
| | | Year Ended October 31, | |
| | | 2006 | | 2005 | | 2004 | | 2003 | | 2002 | |
| Net asset value — Beginning of year | | $ | 9.650 | | | $ | 8.940 | | | $ | 9.160 | | | $ | 7.310 | | | $ | 9.500 | | |
| Income (loss) from operations | |
| Net investment loss(1) | | $ | (0.150 | ) | | $ | (0.170 | ) | | $ | (0.170 | ) | | $ | (0.154 | ) | | $ | (0.161 | ) | |
| Net realized and unrealized gain (loss) | | | 2.150 | | | | 0.880 | | | | (0.050 | ) | | | 2.004 | | | | (2.029 | ) | |
| Total income (loss) from operations | | $ | 2.000 | | | $ | 0.710 | | | $ | (0.220 | ) | | $ | 1.850 | | | $ | (2.190 | ) | |
| Net asset value — End of year | | $ | 11.650 | | | $ | 9.650 | | | $ | 8.940 | | | $ | 9.160 | | | $ | 7.310 | | |
| Total Return(2) | | | 20.72 | % | | | 7.94 | % | | | (2.40 | )%(3) | | | 25.31 | % | | | (23.05 | )% | |
| Ratios/Supplemental Data | |
| Net assets, end of year (000's omitted) | | $ | 26,681 | | | $ | 18,341 | | | $ | 25,282 | | | $ | 35,855 | | | $ | 36,789 | | |
| Ratios (As a percentage of average daily net assets): | |
| Expenses before custodian fee reduction(4) | | | 2.16 | %(5) | | | 2.19 | %(5) | | | 2.12 | % | | | 2.18 | % | | | 1.99 | % | |
| Expenses after custodian fee reduction(4) | | | 2.16 | %(5) | | | 2.19 | %(5) | | | 2.12 | % | | | 2.18 | % | | | 1.99 | % | |
| Net investment loss | | | (1.38 | )% | | | (1.79 | )% | | | (1.87 | )% | | | (1.97 | )% | | | (1.75 | )% | |
| Portfolio Turnover of the Portfolio | | | 99 | % | | | 223 | % | | | 282 | % | | | 248 | % | | | 131 | % | |
(1) Net investment loss per share was computed using average shares outstanding.
(2) Returns are historical and are calculated by determining the percentage change in net asset value with all distributions reinvested.
(3) The effect of the Fund's net increase from payments by affiliate and net gains (losses), through its investment in the Portfolio, realized on the disposal of investments purchased which did not meet the Portfolio's investment guidelines amounted to less than $0.01 per share and had no effect on total return for the year ended October 31, 2004.
(4) Includes the Fund's share of the Portfolio's allocated expenses.
(5) The investment adviser waived a portion of its investment advisory fee (equal to less than 0.01% and 0.01% of average daily net assets for 2006 and 2005, respectively).
See notes to financial statements
10
Eaton Vance Tax-Managed Small-Cap Growth Fund as of October 31, 2006
NOTES TO FINANCIAL STATEMENTS
1 Significant Accounting Policies
Eaton Vance Tax-Managed Small-Cap Growth Fund (formerly Eaton Vance Tax-Managed Small-Cap Growth Fund 1.1) (the Fund) is a diversified series of Eaton Vance Mutual Funds Trust (the Trust). The Trust is an entity of the type commonly known as a Massachusetts business trust and is registered under the Investment Company Act of 1940, as amended, as an open-end management investment company. The Fund offers three classes of shares. Class A shares are generally sold subject to a sales charge imposed at time of purchase. Class B and Class C shares are sold at net asset value and are subject to a contingent deferred sales charge (see Note 6). The Trustees have adopted a conversion feature pursuant to which Class B shares of the Fund automatically convert to Class A shares eight years after their purchase as described in the Fund's prospectus. Each class represents a pro-rata interest in the Fund, but votes separately on class-specific matters and (as noted below) is subject to different expenses. Realized and unrealized gains and losses and net investment income and losses, other than class-specific expenses, are allocated daily to each class of shares based on the relative net assets of each class to the total net assets of the Fund. Each class of shares differs in its distribution plan and certain other class-specific expenses. The Fund invests all of its investable assets in interests of the Tax-Managed Small-Cap Growth Portfolio (the Portfolio), a New York Trust, having the same investment objective as the Fund. The value of the Fund's investment in the Portfolio reflects the Fund's proportionate interest in the net assets of the Portfolio (73.5% at October 31, 2006). The performance of the Fund is directly affected by the performance of the Portfolio. The financial statements of the Portfolio, including the Portfolio of Investments, are included elsewhere in this report and should be read in conjunction with the Fund's financial stat ements.
The following is a summary of significant accounting policies consistently followed by the Fund in the preparation of its financial statements. The policies are in conformity with accounting principles generally accepted in the United States of America.
A Investment Valuation — Valuation of securities by the Portfolio is discussed in Note 1A of the Portfolio's Notes to Financial Statements, which are included elsewhere in this report.
B Income — The Fund's net investment income or loss consists of the Fund's pro rata share of the net investment income or loss of the Portfolio, less all actual and accrued expenses of the Fund.
C Expenses — The majority of expenses of the Trust are directly identifiable to an individual fund. Expenses which are not readily identifiable to a specific fund are allocated taking into consideration, among other things, the nature and type of expense and the relative size of the funds.
D Indemnifications — Under the Trust's organizational documents, its officers and Trustees may be indemnified against certain liabilities and expenses arising out of the performance of their duties to the Fund, and shareholders are indemnified against personal liability for the obligations of the Trust. Additionally, in the normal course of business, the Fund enters into agreements with service providers that may contain indemnification clauses. The Fund's maximum exposure under these arrangements is unknown as this would involve future claims that may be made against the Fund that have not yet occurred.
E Federal Taxes — The Fund's policy is to comply with the provisions of the Internal Revenue Code applicable to regulated investment companies and to distribute to shareholders, each year, substantially all of its net investment income and all or substantially all of its net realized capital gains. Accordingly, no provision for federal income or excise tax is necessary. At October 31, 2006, the Fund, for federal income tax purposes, had a capital loss carryforward of $117,595,342 which will reduce the taxable income arising from future net realized gain on investments, if any, to the extent permitted by the Internal Revenue Code and thus will reduce the amount of distributions to shareholders which wo uld otherwise be necessary to relieve the Fund of any liability for federal income or excise tax. Such capital loss carryforward will expire on October 31, 2009, ($61,649,604), and on October 31, 2010, ($55,945,738).
A capital loss carryforward of $1,555,676, included in the number above, will be available to the Fund as a result of the reorganization of Tax-Managed Small-Cap Growth Fund 1.2 on April 28, 2006 (see Note 8). Utilization of this capital loss carryforward may be limited in accordance with certain income tax regulations.
F Expense Reduction — Investors Bank & Trust Company (IBT) serves as custodian of the Fund. Pursuant to the custodian agreement, IBT receives a fee
11
Eaton Vance Tax-Managed Small-Cap Growth Fund as of October 31, 2006
NOTES TO FINANCIAL STATEMENTS CONT'D
reduced by credits which are determined based on the average daily cash balance the Fund maintains with IBT. All credit balances used to reduce the Fund's custodian fees are reported as a reduction of expenses in the Statement of Operations.
G Other — Investment transactions are accounted for on the date the securities are purchased or sold. Dividends to shareholders are recorded on the ex-dividend date.
H Use of Estimates — The preparation of the financial statements in conformity with accounting principles generally accepted in the United States of America requires management to make estimates and assumptions that affect the reported amounts of assets and liabilities at the date of the financial statements and the reported amounts of income and expense during the reporting period. Actual results could differ from those estimates.
2 Distributions to Shareholders
It is the present policy of the Fund to make at least one distribution annually (normally in December) of all or substantially all of its net investment income, if any, and at least one distribution annually of all or substantially all of its net realized capital gains (reduced by available capital loss carryforwards from prior years, if any). Distributions are declared separately for each class of shares. Shareholders may reinvest all distributions in additional shares of the same class of the Fund at the net asset value as of the close of business on the reinvestment date. Distributions are paid in the form of additional shares of the same class of the Fund, or at the election of the shareholder, in cash. The Fund distinguishes between distributions on a tax basis and a financial reporting basis. Accounting principles generally accepted in the United States of America require that only distributions in excess of tax basis earn ings and profits be reported in the financial statements as a return of capital. Permanent differences between book and tax accounting relating to distributions are reclassified to paid-in capital.
During the year ended October 31, 2006, accumulated paid-in capital was increased by $310,836, accumulated net investment loss was decreased by $1,183,805 and accumulated net realized loss was increased by $1,494,641 to differences between book and tax accounting treatment of net investment income/losses, foreign currency gains and losses. This change had no effect on the net assets or the net asset value per share.
As of October 31, 2006, the components of distributable earnings (accumulated losses) on a tax basis were as follows:
| Capital loss carryforward | | | (117,595,342 | ) | |
| Unrealized appreciation | | | 15,329,948 | | |
3 Shares of Beneficial Interest
The Fund's Declaration of Trust permits the Trustees to issue an unlimited number of full and fractional shares of beneficial interest (without par value). Such shares may be issued in a number of different series (such as the Fund) and classes. Transactions in Fund shares were as follows:
| | | Year Ended October 31, | |
| Class A | | 2006 | | 2005 | |
| Sales | | | 175,888 | | | | 47,908 | | |
| Redemptions | | | (870,120 | ) | | | (970,900 | ) | |
| Exchange from Class B shares | | | 918,538 | | | | 152,323 | | |
Issued to Eaton Vance Tax-Managed
Small-Cap Growth Fund 1.2 shareholders | | | 1,106,591 | | | | — | | |
| Net increase (decrease) | | | 1,330,897 | | | | (770,669 | ) | |
| | | Year Ended October 31, | |
| Class B | | 2006 | | 2005 | |
| Sales | | | 48,656 | | | | 56,356 | | |
| Redemptions | | | (1,302,068 | ) | | | (1,985,600 | ) | |
| Exchange to Class A shares | | | (980,419 | ) | | | (161,630 | ) | |
Issued to Eaton Vance Tax-Managed
Small-Cap Growth Fund 1.2 shareholders | | | 1,040,817 | | | | — | | |
| Net decrease | | | (1,193,014 | ) | | | (2,090,874 | ) | |
| | | Year Ended October 31, | |
| Class C | | 2006 | | 2005 | |
| Sales | | | 60,848 | | | | 41,701 | | |
| Redemptions | | | (540,263 | ) | | | (967,142 | ) | |
Issued to Eaton Vance Tax-Managed
Small-Cap Growth Fund 1.2 shareholders | | | 869,466 | | | | — | | |
| Net increase (decrease) | | | 390,051 | | | | (925,441 | ) | |
4 Transactions with Affiliates
Eaton Vance Management (EVM) serves as the administrator to the Fund, but receives no
12
Eaton Vance Tax-Managed Small-Cap Growth Fund as of October 31, 2006
NOTES TO FINANCIAL STATEMENTS CONT'D
compensation. The Portfolio has engaged Boston Management and Research (BMR), a subsidiary of EVM, to render investment advisory services. See Note 2 of the Portfolio's Notes to Financial Statements which are included elsewhere in this report. EVM serves as the sub-transfer agent of the Fund and receives from the transfer agent an aggregate fee based upon the actual expenses incurred by EVM in the performance of those services. For the year ended October 31, 2006, EVM received $17,200 in sub-transfer agent fees.
Except for Trustees of the Fund and the Portfolio who are not members of EVM's or BMR's organization, officers and Trustees receive remuneration for their services to the Fund out of the investment adviser fee earned by BMR. Trustees of the Fund who are not affiliated with EVM or BMR may elect to defer receipt of all or a percentage of their annual fees in accordance with the terms of the Trustees Deferred Compensation Plan. For the year ended October 31, 2006, no significant amounts have been deferred.
Eaton Vance Distributors, Inc. (EVD), a subsidiary of EVM and the Fund's principal underwriter, received $3,847 as its portion of the sales charge on sales of Class A shares for the year ended October 31, 2006.
Certain officers and Trustees of the Fund and Portfolio are officers of the above organizations.
5 Distribution Plans
Class A has in effect a distribution plan pursuant to Rule 12b-1 under the Investment Company Act of 1940 (Class A Plan). The Class A Plan provides that the Fund will pay EVD a distribution and service fee of 0.25% of the Fund's average daily net assets attributable to Class A shares for each fiscal year for distribution services and facilities provided to the Fund by EVD, as well as for personal services and/or the maintenance of shareholder accounts. Distribution and service fees paid or accrued for the year ended October 31, 2006 amounted to $88,943 for Class A shares. The Fund also has in effect distribution plans for Class B shares (Class B Plan) and Class C shares (Class C Plan) pursuant to Rule 12b-1 under the Investment Company Act of 1940. The Class B and Class C Plans require the Fund to pay EVD amounts equal to 1/365 of 0.75% (annualized) of the Fund's average daily net assets attributable to Class B and Class C share s, for providing ongoing distribution services and facilities to the Fund. The Fund will automatically discontinue payments to EVD during any period in which there are no outstanding Uncovered Distribution Charges, which are equivalent to the sum of (i) 5% and 6.25% of the aggregate amount received by the Fund for the Class B and Class C shares sold, respectively, plus (ii) interest calculated by applying the rate of 1% over the prevailing prime rate to the outstanding balance of Uncovered Distribution Charges of EVD, of each respective class, reduced by the aggregate amount of contingent deferred sales charges (see Note 6) and daily amounts theretofore paid to EVD by each respective class. Distribution fees paid or accrued for the year ended October 31, 2006, amounted to $348,508 and $170,109 for Class B and Class C shares, respectively. At October 31, 2006, the amount of Uncovered Distribution Charges of EVD calculated under the Plans was approximately $6,170,000 and $9,194,000 for Class B and Class C shares, respectively. The Class B and Class C Plans also authorize the Fund to make payments of service fees to EVD, investment dealers and other persons in amounts not exceeding 0.25% annually of the average daily net assets attributable to that Class. Service fees are paid for personal services and/or the maintenance of shareholder accounts. They are separate and distinct from the Class B and Class C sales commissions and distribution fees and, as such, are not subject to automatic discontinuance when there are no outstanding Uncovered Distribution Charges to EVD. Service fees paid or accrued for the year ended October 31, 2006 amounted to $116,169, and $56,703, for Class B and Class C shares, respectively.
6 Contingent Deferred Sales Charge
A contingent deferred sales charge (CDSC) generally is imposed on redemptions of Class B shares made within six years of purchase and on redemptions of Class C shares made within one year of purchase. Class A shares may be subject to a CDSC up to 1% if redeemed within two years of purchase (depending upon the circumstances of purchase). Generally, the CDSC is based upon the lower of the net asset value at date of redemption or date of purchase. No charge is levied on shares acquired by reinvestment of dividends or capital gain distributions. The Class B CDSC is imposed at declining rates that begin at 5% in the case of redemptions in the first and second year after purchase, declining one percentage point in each subsequent year. Class C shares will be subject to a 1% CDSC if redeemed within one year of purchase.
No CDSC is levied on shares which have been sold to EVM, its affiliates, or their respective employees or clients and may be waived under certain other limited conditions. CDSC pertaining to Class B and Class C redemptions are paid to EVD to reduce the amount of
13
Eaton Vance Tax-Managed Small-Cap Growth Fund as of October 31, 2006
NOTES TO FINANCIAL STATEMENTS CONT'D
Uncovered Distribution Charges calculated under the Class B and Class C Plans, respectively (see Note 5). CDSC assessed on Class B and Class C shares when no Uncovered Distribution Charges exist for the respective classes will be credited to the Fund. EVD received approximately $2,000, $77,000 and $1,000 of CDSC paid by shareholders for Class A shares, Class B shares and Class C shares, respectively for the year ended October 31, 2006.
7 Investment Transactions
Increases and decreases in the Fund's investment in the Portfolio aggregated $39,555,464 and $31,356,521 respectively for the year ended October 31, 2006.
8 Transfer of Net Assets
At the close of business on April 28, 2006, Eaton Vance Tax-Managed Small-Cap Growth Fund 1.1 acquired the net assets of Eaton Vance Tax-Managed Small-Cap Growth Fund 1.2 pursuant to an Agreement and Plan of Reorganization dated November 14, 2005. In accordance with the agreement, Eaton Vance Tax-Managed Small-Cap Growth Fund 1.1 issued 0.806895 shares of Class A, 0.829113 shares of Class B and 0.83155 shares of Class C for each share of Class A, Class B and Class C, respectively, of Eaton Vance Tax-Managed Small-Cap Growth Fund 1.2. As a result, Eaton Vance Tax-Managed Small-Cap Growth Fund 1.1 issued 1,106,591 Class A shares, 1,040,817 Class B shares and 869,466 Class C shares having a total aggregate value of $36,300,399. The transaction was structured for tax purposes to qualify as a tax free reorganization under the Internal Revenue Code. The Eaton Vance Tax-Managed Small-Cap Growth Fund 1.2's net assets at the date of the transaction amounted to $36,300,399, including $7,235,328 of unrealized appreciation. Directly after the merger, the combined net assets of the Eaton Vance Tax-Managed Small-Cap Growth Fund 1.1 was $130,106,468 with a net asset value of $12.55, $11.75 and $11.72 for Class A, Class B and Class C, respectively.
9 Recently Issued Accounting Pronouncements
In June 2006, the Financial Accounting Standards Board (FASB) issued FASB Interpretation No. 48, (FIN 48) "Accounting for Uncertainty in Income Taxes — an interpretation of FASB Statement No. 109". FIN 48 clarifies the accounting for uncertainty in income taxes recognized in accordance with FASB Statement No. 109, "Accounting for Income Taxes." This interpretation prescribes a recognition threshold and measurement attribute for the financial statement recognition and measurement of a tax position taken or expected to be taken in a tax return. It also provides guidance on de-recognition, classification, interest and penalties, accounting in interim periods, disclosure and transition. FIN 48 is effective for fiscal years beginning after December 15, 2006. Management is currently evaluating the impact of applying the various provisions of FIN 48.
In September 2006, the FASB issued Statement of Financial Accounting Standards No. 157, (FAS 157) "Fair Value Measurements". FAS 157 defines fair value, establishes a framework for measuring fair value in accordance with generally accepted accounting principles and expands disclosure about fair value measurements. FAS 157 is effective for fiscal years beginning after November 15, 2007. Management is currently evaluating the impact the adoption of FAS 157 will have on the Fund's financial statement disclosures.
10 Name Change
Effective May 1, 2006, Eaton Vance Tax-Managed Small-Cap Growth Fund 1.1 changed its name to Eaton Vance Tax-Managed Small-Cap Growth Fund.
14
Eaton Vance Tax-Managed Small-Cap Growth Fund as of October 31, 2006
REPORT OF INDEPENDENT REGISTERED PUBLIC ACCOUNTING FIRM
To the Trustees of Eaton Vance Mutual Funds Trust and Shareholders of Eaton Vance Tax-Managed Small-Cap Growth Fund:
We have audited the accompanying statement of assets and liabilities of Eaton Vance Tax-Managed Small-Cap Growth Fund (the "Fund") (one of the series of Eaton Vance Mutual Funds Trust) as of October 31, 2006, and the related statement of operations for the year then ended, the statements of changes in net assets for each of the two years in the period then ended, and the financial highlights for each of the five years in the period then ended. These financial statements and financial highlights are the responsibility of the Fund's management. Our responsibility is to express an opinion on these financial statements and financial highlights based on our audits.
We conducted our audits in accordance with standards of the Public Company Accounting Oversight Board (United States). Those standards require that we plan and perform the audits to obtain reasonable assurance about whether the financial statements and financial highlights are free of material misstatement. The Fund is not required to have, nor were we engaged to perform, an audit of its internal control over financial reporting. Our audits included consideration of internal control over financial reporting as a basis for designing audit procedures that are appropriate in the circumstances, but not for the purpose of expressing an opinion on the effectiveness of the Fund's internal control over financial reporting. Accordingly, we express no such opinion. An audit also includes examining, on a test basis, evidence supporting the amounts and disclosures in the financial statements, assessing the accounting principles used and sig nificant estimates made by management, as well as evaluating the overall financial statement presentation. We believe that our audits provide a reasonable basis for our opinion.
In our opinion, such financial statements and financial highlights referred to above present fairly, in all material respects, the financial position of Eaton Vance Tax-Managed Small-Cap Growth Fund as of October 31, 2006, the results of its operations for the year then ended, the changes in its net assets for each of the two years in the period then ended, and the financial highlights for each of the five years in the period then ended, in conformity with accounting principles generally accepted in the United States of America.
DELOITTE & TOUCHE LLP
Boston, Massachusetts
December 15, 2006
15
Tax-Managed Small-Cap Growth Portfolio as of October 31, 2006
PORTFOLIO OF INVESTMENTS
| Common Stocks — 98.8% | |
| Security | | Shares | | Value | |
| Aerospace & Defense — 1.9% | |
| Armor Holdings, Inc.(1) | | | 41,260 | | | $ | 2,123,240 | | |
| Teledyne Technologies, Inc.(1) | | | 21,500 | | | | 896,980 | | |
| | | $ | 3,020,220 | | |
| Air Freight & Logistics — 1.2% | |
| Hub Group, Inc., Class A(1) | | | 70,000 | | | $ | 1,901,200 | | |
| | | $ | 1,901,200 | | |
| Biotechnology — 1.2% | |
| Martek Biosciences Corp.(1) | | | 81,350 | | | $ | 1,929,622 | | |
| | | $ | 1,929,622 | | |
| Capital Markets — 3.5% | |
| Affiliated Managers Group, Inc.(1) | | | 15,400 | | | $ | 1,542,156 | | |
| Greenhill & Co., Inc. | | | 40,800 | | | | 2,771,952 | | |
| Lazard, Ltd., Class A(2) | | | 28,650 | | | | 1,214,760 | | |
| | | $ | 5,528,868 | | |
| Chemicals — 2.3% | |
| International Flavors & Fragrances, Inc. | | | 57,230 | | | $ | 2,431,130 | | |
| Scotts Miracle-Gro Co., Class A | | | 25,240 | | | | 1,248,370 | | |
| | | $ | 3,679,500 | | |
| Commercial Services & Supplies — 3.3% | |
| FTI Consulting, Inc.(1) | | | 99,430 | | | $ | 2,824,806 | | |
| Knoll, Inc. | | | 122,560 | | | | 2,426,688 | | |
| | | $ | 5,251,494 | | |
| Communications Equipment — 1.5% | |
| 3Com Corp.(1) | | | 492,200 | | | $ | 2,392,092 | | |
| | | $ | 2,392,092 | | |
| Construction & Engineering — 0.9% | |
| Foster Wheeler, Ltd.(1)(2) | | | 31,040 | | | $ | 1,395,248 | | |
| | | $ | 1,395,248 | | |
| Security | | Shares | | Value | |
| Consumer Finance — 0.8% | |
| Student Loan Corp. (The) | | | 5,760 | | | $ | 1,192,320 | | |
| | | $ | 1,192,320 | | |
| Diversified Consumer Services — 1.3% | |
| DeVry, Inc.(1) | | | 86,900 | | | $ | 2,116,015 | | |
| | | $ | 2,116,015 | | |
| Diversified Financial Services — 1.0% | |
| Nasdaq Stock Market, Inc.(1) | | | 43,820 | | | $ | 1,565,689 | | |
| | | $ | 1,565,689 | | |
| Electric Utilities — 0.8% | |
| ITC Holdings Corp. | | | 34,536 | | | $ | 1,226,719 | | |
| | | $ | 1,226,719 | | |
| Electrical Equipment — 1.0% | |
| AMETEK, Inc. | | | 34,900 | | | $ | 1,629,132 | | |
| | | $ | 1,629,132 | | |
| Electronic Equipment & Instruments — 5.1% | |
| Avnet, Inc.(1) | | | 115,720 | | | $ | 2,740,250 | | |
| FLIR Systems, Inc.(1) | | | 104,350 | | | | 3,332,939 | | |
| Paxar Corp.(1) | | | 39,200 | | | | 784,784 | | |
| Tektronix, Inc. | | | 40,250 | | | | 1,222,392 | | |
| | | $ | 8,080,365 | | |
| Energy Equipment & Services — 3.0% | |
| Dresser-Rand Group, Inc.(1) | | | 108,807 | | | $ | 2,360,024 | | |
| Dril-Quip, Inc.(1) | | | 61,352 | | | | 2,416,042 | | |
| | | $ | 4,776,066 | | |
| Food & Staples Retailing — 0.8% | |
| Susser Holdings Corp.(1) | | | 71,810 | | | $ | 1,306,942 | | |
| | | $ | 1,306,942 | | |
| Food Products — 1.5% | |
| Hain Celestial Group, Inc., (The)(1) | | | 86,870 | | | $ | 2,452,340 | | |
| | | $ | 2,452,340 | | |
See notes to financial statements
16
Tax-Managed Small-Cap Growth Portfolio as of October 31, 2006
PORTFOLIO OF INVESTMENTS CONT'D
| Security | | Shares | | Value | |
| Health Care Equipment & Supplies — 11.1% | |
| Analogic Corp. | | | 51,732 | | | $ | 2,887,163 | | |
| Cooper Cos., Inc., (The) | | | 49,450 | | | | 2,849,803 | | |
| DJ Orthopedics, Inc.(1) | | | 46,800 | | | | 1,882,764 | | |
| IDEXX Laboratories, Inc.(1) | | | 14,900 | | | | 1,239,829 | | |
| Respironics, Inc.(1) | | | 66,650 | | | | 2,354,078 | | |
| Sirona Dental Systems, Inc. | | | 62,470 | | | | 2,311,390 | | |
| West Pharmaceutical Services, Inc. | | | 48,100 | | | | 2,022,124 | | |
| Wright Medical Group, Inc.(1) | | | 86,350 | | | | 2,133,708 | | |
| | | $ | 17,680,859 | | |
| Health Care Providers & Services — 2.1% | |
| Chemed Corp. | | | 61,110 | | | $ | 2,168,794 | | |
| VCA Antech, Inc.(1) | | | 34,050 | | | | 1,102,198 | | |
| | | $ | 3,270,992 | | |
| Hotels, Restaurants & Leisure — 1.1% | |
| Penn National Gaming, Inc.(1) | | | 48,404 | | | $ | 1,770,134 | | |
| | | $ | 1,770,134 | | |
| Household Durables — 4.5% | |
| Jarden Corp.(1) | | | 124,700 | | | $ | 4,486,706 | | |
| Tupperware Brands Corp. | | | 128,685 | | | | 2,731,983 | | |
| | | $ | 7,218,689 | | |
| Household Products — 1.6% | |
| Church & Dwight Co., Inc. | | | 63,100 | | | $ | 2,559,967 | | |
| | | $ | 2,559,967 | | |
| Insurance — 4.0% | |
| First American Corp. | | | 54,819 | | | $ | 2,238,260 | | |
| Philadelphia Consolidated Holding Corp.(1) | | | 36,900 | | | | 1,443,528 | | |
| RLI Corp. | | | 49,650 | | | | 2,691,526 | | |
| | | $ | 6,373,314 | | |
| IT Services — 3.3% | |
| Euronet Worldwide, Inc.(1) | | | 62,900 | | | $ | 1,869,388 | | |
| MoneyGram International, Inc. | | | 100,300 | | | | 3,431,263 | | |
| | | $ | 5,300,651 | | |
| Security | | Shares | | Value | |
| Machinery — 3.0% | |
| Joy Global, Inc. | | | 48,000 | | | $ | 1,877,280 | | |
| RBC Bearings, Inc.(1) | | | 108,398 | | | | 2,946,258 | | |
| | | $ | 4,823,538 | | |
| Media — 3.5% | |
| Arbitron, Inc. | | | 20,100 | | | $ | 844,200 | | |
| Central European Media Enterprises, Ltd.(1)(2) | | | 40,300 | | | | 2,974,946 | | |
| Playboy Enterprises, Inc.(1) | | | 159,300 | | | | 1,690,173 | | |
| | | $ | 5,509,319 | | |
| Metals & Mining — 2.8% | |
| Aber Diamond Corp.(2) | | | 71,450 | | | $ | 2,651,516 | | |
| Cambior, Inc.(1)(2) | | | 276,800 | | | | 982,640 | | |
| Meridian Gold, Inc.(1)(2) | | | 28,850 | | | | 730,193 | | |
| | | $ | 4,364,349 | | |
| Multiline Retail — 1.4% | |
| Big Lots, Inc.(1) | | | 102,970 | | | $ | 2,170,608 | | |
| | | $ | 2,170,608 | | |
| Multi-Utilities — 1.0% | |
| CMS Energy Corp.(1) | | | 101,100 | | | $ | 1,505,379 | | |
| | | $ | 1,505,379 | | |
| Oil, Gas & Consumable Fuels — 5.2% | |
| Denbury Resources, Inc.(1) | | | 88,600 | | | $ | 2,546,364 | | |
| Forest Oil Corp.(1) | | | 24,440 | | | | 797,722 | | |
| Parallel Petroleum Corp.(1) | | | 120,000 | | | | 2,430,000 | | |
| Petrohawk Energy Corp.(1) | | | 108,660 | | | | 1,231,118 | | |
| Range Resources Corp. | | | 46,595 | | | | 1,265,054 | | |
| | | $ | 8,270,258 | | |
| Personal Products — 1.5% | |
| Playtex Products, Inc.(1) | | | 173,550 | | | $ | 2,419,287 | | |
| | | $ | 2,419,287 | | |
| Real Estate Investment Trusts (REITs) — 4.1% | |
| Acadia Realty Trust | | | 93,770 | | | $ | 2,395,823 | | |
| Douglas Emmett, Inc.(1) | | | 45,440 | | | | 1,083,744 | | |
| Essex Property Trust, Inc. | | | 23,271 | | | | 3,101,559 | | |
| | | $ | 6,581,126 | | |
See notes to financial statements
17
Tax-Managed Small-Cap Growth Portfolio as of October 31, 2006
PORTFOLIO OF INVESTMENTS CONT'D
| Security | | Shares | | Value | |
| Road & Rail — 3.2% | |
| Kansas City Southern(1) | | | 95,100 | | | $ | 2,699,889 | | |
| Landstar System, Inc. | | | 50,700 | | | | 2,354,508 | | |
| | | $ | 5,054,397 | | |
| Semiconductors & Semiconductor Equipment — 1.8% | |
| Intersil Corp., Class A | | | 45,860 | | | $ | 1,075,417 | | |
| Teradyne, Inc.(1) | | | 130,650 | | | | 1,831,713 | | |
| | | $ | 2,907,130 | | |
| Software — 4.8% | |
| i2 Technologies, Inc.(1) | | | 46,535 | | | $ | 940,472 | | |
| Parametric Technology Corp.(1) | | | 171,650 | | | | 3,354,041 | | |
| Sybase, Inc.(1) | | | 137,400 | | | | 3,345,690 | | |
| | | $ | 7,640,203 | | |
| Specialty Retail — 2.4% | |
| Men's Wearhouse, Inc., (The) | | | 49,040 | | | $ | 1,954,244 | | |
| Stage Stores, Inc. | | | 59,050 | | | | 1,913,811 | | |
| | | $ | 3,868,055 | | |
| Thrifts & Mortgage Finance — 0.6% | |
| WSFS Financial Corp. | | | 14,400 | | | $ | 927,936 | | |
| | | $ | 927,936 | | |
| Trading Companies & Distributors — 3.1% | |
| GATX Corp. | | | 54,450 | | | $ | 2,372,387 | | |
| Kaman Corp. | | | 121,910 | | | | 2,485,745 | | |
| | | $ | 4,858,132 | | |
| Wireless Telecommunication Services — 1.6% | |
| NII Holdings, Inc., Class B(1) | | | 39,500 | | | $ | 2,568,685 | | |
| | | $ | 2,568,685 | | |
Total Common Stocks
(identified cost $131,926,916) | | | | | | $ | 157,086,840 | | |
| Special Warrants — 0.1% | |
| Security | | Shares | | Value | |
| Metals & Mining — 0.1% | |
| Western Exploration and Development, Ltd.(1)(2)(3)(4) | | | 600,000 | | | $ | 180,000 | | |
| | | $ | 180,000 | | |
Total Special Warrants
(identified cost $480,000) | | | | | | $ | 180,000 | | |
| Private Placements — 0.0% | |
| Security | | Shares | | Value | |
| Metals & Mining — 0.0% | |
| Nevada Pacific Mining Co.(1)(3)(4) | | | 80,000 | | | $ | 56,000 | | |
| | | $ | 56,000 | | |
Total Private Placements
(identified cost $80,000) | | | | | | $ | 56,000 | | |
| Short-Term Investments — 1.2% | |
| Security | | Principal
Amount
(000's omitted) | | Value | |
| Societe Generale Time Deposit, 5.31%, 11/1/06 | | $ | 1,863 | | | $ | 1,863,000 | | |
Total Short-Term Investments
(at amortized cost, $1,863,000) | | | | | | $ | 1,863,000 | | |
Total Investments — 100.1%
(identified cost $134,349,916) | | | | | | $ | 159,185,840 | | |
| Other Assets, Less Liabilities — (0.1)% | | | | | | $ | (135,830 | ) | |
| Net Assets — 100.0% | | | | | | $ | 159,050,010 | | |
(1) Non-income producing security.
(2) Foreign security.
(3) Restricted security.
(4) Security valued at fair value using methods determined in good faith by or at the direction of the Trustees of the Portfolio.
See notes to financial statements
18
Tax-Managed Small-Cap Growth Portfolio as of October 31, 2006
FINANCIAL STATEMENTS
Statement of Assets and Liabilities
As of October 31, 2006
| Assets | |
| Investments, at value (identified cost, $134,349,916) | | $ | 159,185,840 | | |
| Cash | | | 14,354 | | |
| Dividends and interest receivable | | | 6,533 | | |
| Total assets | | $ | 159,206,727 | | |
| Liabilities | |
| Payable to affiliate for investment advisory fees | | $ | 81,444 | | |
| Payable to affiliate for Trustees' fees | | | 1,003 | | |
| Other accrued expenses | | | 74,270 | | |
| Total liabilities | | $ | 156,717 | | |
| Net Assets applicable to investors' interest in Portfolio | | $ | 159,050,010 | | |
| Sources of Net Assets | |
| Net proceeds from capital contributions and withdrawals | | $ | 134,214,086 | | |
| Net unrealized appreciation (computed on the basis of identified cost) | | | 24,835,924 | | |
| Total | | $ | 159,050,010 | | |
Statement of Operations
For the Year Ended
October 31, 2006
| Investment Income | |
| Dividends (net of foreign taxes, $1,766) | | $ | 840,892 | | |
| Interest | | | 361,674 | | |
| Total investment income | | $ | 1,202,566 | | |
| Expenses | |
| Investment adviser fee | | $ | 999,203 | | |
| Trustees' fees and expenses | | | 11,734 | | |
| Custodian fee | | | 116,824 | | |
| Legal and accounting services | | | 48,969 | | |
| Miscellaneous | | | 5,473 | | |
| Total expenses | | $ | 1,182,203 | | |
Deduct —
Reduction of custodian fee | | $ | 2 | | |
| Reduction of investment adviser fee | | | 2,264 | | |
| Total expense reductions | | $ | 2,266 | | |
| Net expenses | | $ | 1,179,937 | | |
| Net investment income | | $ | 22,629 | | |
| Realized and Unrealized Gain | |
Net realized gain —
Investment transactions (identified cost basis) | | $ | 28,418,499 | | |
| Foreign currency transactions | | | 75 | | |
| Net realized gain | | $ | 28,418,574 | | |
Change in unrealized appreciation (depreciation) —
Investments (identified cost basis) | | $ | 3,443,053 | | |
| Net change in unrealized appreciation (depreciation) | | $ | 3,443,053 | | |
| Net realized and unrealized gain | | $ | 31,861,627 | | |
| Net increase in net assets from operations | | $ | 31,884,256 | | |
See notes to financial statements
19
Tax-Managed Small-Cap Growth Portfolio as of October 31, 2006
FINANCIAL STATEMENTS CONT'D
Statements of Changes in Net Assets
Increase (Decrease)
in Net Assets | | Year Ended
October 31, 2006 | | Year Ended
October 31, 2005 | |
| From operations — | |
| Net investment income (loss) | | $ | 22,629 | | | $ | (569,621 | ) | |
Net realized gain from investment
transactions and foreign
currency transactions | | | 28,418,574 | | | | 22,768,426 | | |
Net change in unrealized appreciation
(depreciation) from investments
and foreign currency | | | 3,443,053 | | | | (6,290,354 | ) | |
Net increase in net assets
from operations | | $ | 31,884,256 | | | $ | 15,908,451 | | |
Capital transactions —
Contributions | | $ | 46,024,279 | | | $ | 5,377,839 | | |
| Withdrawals | | | (71,979,536 | ) | | | (48,942,689 | ) | |
Net decrease in net assets from
capital transactions | | $ | (25,955,257 | ) | | $ | (43,564,850 | ) | |
| Net increase (decrease) in net assets | | $ | 5,928,999 | | | $ | (27,656,399 | ) | |
| Net Assets | |
| At beginning of year | | $ | 153,121,011 | | | $ | 180,777,410 | | |
| At end of year | | $ | 159,050,010 | | | $ | 153,121,011 | | |
See notes to financial statements
20
Tax-Managed Small-Cap Growth Portfolio as of October 31, 2006
FINANCIAL STATEMENTS CONT'D
Supplementary Data
| | | Year Ended October 31, | |
| | | 2006 | | 2005 | | 2004 | | 2003 | | 2002 | |
| Ratios/Supplemental Data | |
| Ratios (As a percentage of average daily net assets): | |
| Expenses before custodian fee reduction | | | 0.74 | %(2) | | | 0.74 | %(2) | | | 0.75 | % | | | 0.73 | % | | | 0.73 | % | |
| Expenses after custodian fee reduction | | | 0.74 | %(2) | | | 0.74 | %(2) | | | 0.75 | % | | | 0.73 | % | | | 0.73 | % | |
| Net investment income (loss) | | | 0.01 | % | | | (0.34 | )% | | | (0.50 | )% | | | (0.53 | )% | | | (0.49 | )% | |
| Portfolio Turnover | | | 99 | % | | | 223 | % | | | 282 | % | | | 248 | % | | | 131 | % | |
| Total Return | | | 22.33 | % | | | 9.52 | % | | | (1.05 | )%(1) | | | 27.24 | % | | | (22.16 | )% | |
| Net assets, end of year (000's omitted) | | $ | 159,050 | | | $ | 153,121 | | | $ | 180,777 | | | $ | 226,702 | | | $ | 209,074 | | |
(1) The Portfolio's net increase from payments by affiliate and net gains (losses) realized on the disposal of investments purchased which did not meet the Portfolio's investment guidelines had no effect on total return for the year ended October 31, 2004.
(2) The investment adviser waived a portion of its investment advisory fee (equal to less than 0.01% and 0.01% of average daily net assets for 2006 and 2005, respectively).
See notes to financial statements
21
Tax-Managed Small-Cap Growth Portfolio as of October 31, 2006
NOTES TO FINANCIAL STATEMENTS
1 Significant Accounting Policies
Tax-Managed Small-Cap Growth Portfolio (the Portfolio) is registered under the Investment Company Act of 1940, as amended, as a diversified open-end management investment company. The Portfolio, which was organized as a trust under the laws of the State of New York on June 22, 1998, seeks to achieve long-term after-tax returns by investing in a diversified portfolio of equity securities of small-cap companies. The Declaration of Trust permits the Trustees to issue interests in the Portfolio. At October 31, 2006, the Eaton Vance Tax-Managed Small-Cap Growth Fund and the Eaton Vance Tax-Managed Equity Asset Allocation Fund held 73.5% and 26.4% interests in the Portfolio, respectively. The following is a summary of significant accounting policies consistently followed by the Portfolio in the preparation of its financial statements. The policies are in conformity with accounting principles generally accepted in the United States of America.
A Investment Valuation — Securities listed on a U.S. securities exchange generally are valued at the last sale price on the day of valuation or, if no sales took place on such date, at the mean between the closing bid and asked prices therefore on the exchange where such securities are principally traded. Equity securities listed on the NASDAQ National Market System generally are valued at the official NASDAQ closing price. Unlisted or listed securities for which closing sales prices or closing quotations are not available are valued at the mean between the latest available bid and asked prices or, in the case of preferred equity securities that are not listed or traded in the over-the-counter market, by an independent pricing service. Exchange-traded options are valued at the last sale price for the day of valuation as quoted on the principal exchange or board of trade on which the options are traded or, in the absence of sales on such date, at the mean between the latest bid and asked prices therefore. Futures positions on securities and currencies generally are valued at closing settlement prices. Short-term debt securities with a remaining maturity of 60 days or less are valued at amortized cost. If short-term debt securities are acquired with a remaining maturity of more than 60 days, they will be valued by a pricing service. Other fixed income and debt securities, including listed securities and securities for which price quotations are available, will normally be valued on the basis of valuations furnished by a pricing service. Foreign securities and currencies are valued in U.S. dollars, based on foreign currency exchange rate quotations supplied by an independent quotation service. The daily val uation of exchange-traded foreign securities generally is determined as of the close of trading on the principal exchange on which such securities trade. Events occurring after the close of trading on foreign exchanges may result in adjustments to the valuation of foreign securities to more accurately reflect their fair value as of the close of regular trading on the New York Stock Exchange. When valuing foreign equity securities that meet certain criteria, the Trustees have approved the use of a fair value service that values such securities to reflect market trading that occurs after the close of the applicable foreign markets of comparable securities or other instruments that have a strong correlation to the fair-valued securities. Investments held by the Portfolio for which valuations or market quotations are unavailable are valued at fair value using methods determined in good faith by or at the direction of the Trustees of the Port folio considering relevant factors, data and information including the market value of freely tradable securities of the same class in the principal market on which such securities are normally traded.
B Income — Dividend income is recorded on the ex-dividend date for dividends received in cash and/or securities. However, if the ex-dividend date has passed, certain dividends from foreign securities are recorded as the Portfolio is informed of the ex-dividend date. Withholding taxes on foreign dividends and capital gains have been provided for in accordance with the Portfolio's understanding of the applicable countries' tax rules and rates. Interest income is recorded on the accrual basis.
C Federal Taxes — The Portfolio has elected to be treated as a partnership for federal tax purposes. No provision is made by the Portfolio for federal or state taxes on any taxable income of the Portfolio because each investor in the Portfolio is ultimately responsible for the payment of any taxes on its share of taxable income. Since at least one of the Portfolio's investors is a regulated investment company that invests all or substantially all of its assets in the Portfolio, the Portfolio normally must satisfy the applicable source of income and diversification requirements (under the Internal Revenue Code) in order for its investors to satisfy them. The Portfolio will allocate, at least annually a mong its investors, each investor's distributive share of the Portfolio's net investment income, net realized capital gains, and any other items of income, gain, loss, deduction or credit.
D Financial Futures Contracts — Upon entering a financial futures contract, the Portfolio is required to deposit either in cash or securities an amount (initial margin) equal to a certain percentage of the purchase price indicated in the financial futures contract. Subsequent payments are made or received by the Portfolio (variation
22
Tax-Managed Small-Cap Growth Portfolio as of October 31, 2006
NOTES TO FINANCIAL STATEMENTS CONT'D
margin) each day, dependent on daily fluctuations in the value of the underlying security, and are recorded for book purposes as unrealized gains or losses by the Portfolio. The Portfolio's investment in financial futures contracts is designed to hedge against anticipated future changes in price of current or anticipated Portfolio positions. Should prices move unexpectedly, the Portfolio may not achieve the anticipated benefits of the financial futures contracts and may realize a loss.
E Foreign Currency Translation — Investment valuations, other assets, and liabilities initially expressed in foreign currencies are converted each business day into U.S. dollars based upon current exchange rates. Purchases and sales of foreign investment securities and income and expenses are converted into U.S. dollars based upon currency exchange rates prevailing on the respective dates of such transactions. Recognized gains or losses on investment transactions attributable to changes in foreign currency exchange rates are recorded for financial statement purposes as net realized gains and losses on investments. That portion of unrealized gains and losses on investments that results from fluctuation s in foreign currency exchange rates is not separately disclosed.
F Expense Reduction — Investors Bank & Trust Company (IBT) serves as custodian of the Portfolio. Pursuant to the custodian agreement, IBT receives a fee reduced by credits which are determined based on the average daily cash balance the Portfolio maintains with IBT. All credit balances used to reduce the Portfolio's custodian fees are reported as a reduction of expenses in the Statement of Operations.
G Securities Sold Short — The Portfolio may sell individual securities short if it owns at least an equal amount of the security sold short or has at the time of the sale a right to obtain securities in kind and amount to the securities sold short provided that, if such right is conditional, the sale is made upon the same conditions (a covered short sale). The Portfolio may sell short securities representing an index or basket of securities whose constituents the Portfolio holds in whole or in part. A short sale of an index or basket of securities will be a covered short sale if the underlying index or basket of securities is the same or substantially identical to securities held by the Portfolio. Upo n executing the transaction, the Portfolio records the proceeds as deposits with brokers on the Statement of Assets and Liabilities and establishes an offsetting payable for securities sold short for the securities due on settlement. The proceeds are retained by the broker as collateral for the short position. The liability is marked-to-market on a daily basis and the Portfolio is required to pay the lending broker any dividend or interest income earned while the short position is open. The seller of a short position generally realizes a profit on the transaction if the price it receives on the short sale exceeds the cost of closing out the position by purchasing securities in the market, but generally realizes a loss if the cost of closing out the short position exceeds the proceeds of the short sale. The exposure to loss on covered short sales (to the extent the value of the security sold short rises instead of falls) is offset by the increase in the value of the underlying security or securities retained. The profit or loss on a covered short sale is also affected by the borrowing cost of any securities borrowed in connection with the short sale (which will vary with market conditions) and use of the proceeds of the short sale. The Portfolio expects normally to close its covered short sales by delivering newly acquired stocks. Exposure to loss on an index or basket of securities sold short will not be offset by gains on other securities holdings to the extent that the constituent securities of the index or a basket of securities sold short are not held by the Portfolio. Such losses may be substantial.
H Use of Estimates — The preparation of the financial statements in conformity with accounting principles generally accepted in the United States of America requires management to make estimates and assumptions that affect the reported amounts of assets and liabilities at the date of the financial statements and the reported amounts of income and expense during the reporting period. Actual results could differ from those estimates.
I Indemnifications — Under the Portfolio's organizational documents, its officers and Trustees may be indemnified against certain liabilities and expenses arising out of the performance of their duties to the Portfolio. Interestholders in the Portfolio are jointly and severally liable for the liabilities and obligations of the Portfolio in the event that the Portfolio fails to satisfy such liabilities and obligations; provided, however, that, to the extent assets are available in the Portfolio, the Portfolio may, under certain circumstances, indemnify interestholders from and against any claim or liability to which such holder may become subject by reason of being or having been an interestholder in t he Portfolio. Additionally, in the normal course of business, the Portfolio enters into agreements with service providers that may contain indemnification clauses. The Portfolio's maximum exposure under these arrangements is unknown as this would involve future claims that may be made against the Portfolio that have not yet occurred.
23
Tax-Managed Small-Cap Growth Portfolio as of October 31, 2006
NOTES TO FINANCIAL STATEMENTS CONT'D
J Other — Investment transactions are accounted for on the date the securities are purchased or sold. Realized gains and losses on securities sold are determined on the basis of identified cost.
2 Investment Adviser Fee and Other Transactions with Affiliates
The investment adviser fee is earned by Boston Management and Research (BMR), a wholly-owned subsidiary of Eaton Vance Management (EVM), as compensation for management and investment advisory services rendered to the Portfolio. BMR receives a monthly advisory fee in the amount of 5/96th of 1% (equal to 0.625% annually) of average daily net assets of the Portfolio up to $500 million, and at reduced rates as daily net assets exceed that level. For the year ended October 31, 2006, the advisory fee amounted to $999,203. BMR has also agreed to reduce the investment adviser fee by an amount equal to that portion of commissions paid to broker dealers in execution of portfolio transactions attributed to the Portfolio that is consideration for third-party research services. For the year ended October 31, 2006, BMR waived $2,264 of its advisory fee. Except for Trustees of the Portfolio who are not members of EVM's or BMR's organization, o fficers and Trustees receive remuneration for their services to the Portfolio out of the investment adviser fee. Trustees of the Portfolio who are not affiliated with BMR may elect to defer receipt of all or a percentage of their annual fees in accordance with the terms of the Trustees Deferred Compensation Plan. For the year ended October 31, 2006, no significant amounts have been deferred.
Certain officers and Trustees of the Portfolio are officers of the above organizations.
3 Investment Transactions
Purchases and sales of investments, other than short-term obligations, aggregated $151,168,910 and $167,939,118, respectively, for the year ended October 31, 2006.
4 Federal Income Tax Basis of Unrealized Appreciation (Depreciation)
The cost and unrealized appreciation (depreciation) in value of the investments owned at October 31, 2006, as determined on a federal income tax basis, were as follows:
| Aggregate cost | | $ | 134,357,022 | | |
| Gross unrealized appreciation | | $ | 26,811,858 | | |
| Gross unrealized depreciation | | | (1,983,040 | ) | |
| Net unrealized appreciation | | $ | 24,828,818 | | |
5 Financial Instruments
The Portfolio may trade in financial instruments with off-balance sheet risk in the normal course of its investing activities to assist in managing exposure to various market risks. These financial instruments include written options, forward foreign currency exchange contracts and financial futures contracts and may involve, to a varying degree, elements of risk in excess of the amounts recognized for financial statement purposes.
The notional or contractual amounts of these instruments represent the investment the Portfolio has in particular classes of financial instruments and does not necessarily represent the amounts potentially subject to risk. The measurement of the risks associated with these instruments is meaningful only when all related and offsetting transactions are considered. The Portfolio did not have any open obligations under these financial instruments at October 31, 2006.
6 Line of Credit
The Portfolio participates with other portfolios and funds managed by BMR and EVM and its affiliates in a $150 million unsecured line of credit agreement with a group of banks. Borrowings will be made by the Portfolio solely to facilitate the handling of unusual and/or unanticipated short-term cash requirements. Interest is charged to each participating portfolio or fund based on its borrowings at an amount above either the Eurodollar rate or Federal Funds rate. In addition, a fee computed at an annual rate of 0.10% on the daily unused portion of the line of credit is allocated among the participating portfolios and funds at the end of each quarter. The Portfolio did not have any significant borrowings or allocated fees during the year ended October 31, 2006.
7 Restricted Securities
At October 31, 2006, the Portfolio owned the following securities (representing 0.15% of net assets) which were restricted as to public resale and not registered under the Securities Act of 1933. The fair value is determined using methods determined in good faith by or at the direction of the Trustees.
| Description | | Date of
Acquisition | | Shares | | Cost | | Fair Value | |
| Private Placements | |
Nevada Pacific
Mining Co. | | 12/21/98 | | | 80,000 | | | $ | 80,000 | | | $ | 56,000 | | |
| | | $ | 80,000 | | | $ | 56,000 | | |
| Special Warrants | |
Western Exploration and
Development, Ltd. | | 12/21/98 | | | 600,000 | | | $ | 480,000 | | | $ | 180,000 | | |
| | | $ | 480,000 | | | $ | 180,000 | | |
24
Tax-Managed Small-Cap Growth Portfolio as of October 31, 2006
NOTES TO FINANCIAL STATEMENTS CONT'D
8 Recently Issued Accounting Pronouncements
In June 2006, the Financial Accounting Standards Board (FASB) issued FASB Interpretation No. 48, (FIN 48) "Accounting for Uncertainty in Income Taxes — an interpretation of FASB Statement No. 109". FIN 48 clarifies the accounting for uncertainty in income taxes recognized in accordance with FASB Statement No. 109, "Accounting for Income Taxes." This interpretation prescribes a recognition threshold and measurement attribute for the financial statement recognition and measurement of a tax position taken or expected to be taken in a tax return. It also provides guidance on de-recognition, classification, interest and penalties, accounting in interim periods, disclosure and transition. FIN 48 is effective for fiscal years beginning after December 15, 2006. Management is currently evaluating the impact of applying the various provisions of FIN 48.
In September 2006, the FASB issued Statement of Financial Accounting Standards No. 157, (FAS 157) "Fair Value Measurements". FAS 157 defines fair value, establishes a framework for measuring fair value in accordance with generally accepted accounting principles and expands disclosure about fair value measurements. FAS 157 is effective for fiscal years beginning after November 15, 2007. Management is currently evaluating the impact the adoption of FAS 157 will have on the Portfolio's financial statement disclosures.
25
Tax-Managed Small-Cap Growth Portfolio as of October 31, 2006
REPORT OF INDEPENDENT REGISTERED PUBLIC ACCOUNTING FIRM
To the Trustees and Investors of
Tax-Managed Small-Cap Growth Portfolio:
We have audited the accompanying statement of assets and liabilities of Tax-Managed Small-Cap Growth Portfolio (the "Portfolio"), including the portfolio of investments, as of October 31, 2006, the related statement of operations for the year then ended, the statements of changes in net assets for each of the two years in the period then ended, and the supplementary data for each of the five years in the period then ended. These financial statements and supplementary data are the responsibility of the Portfolio's management. Our responsibility is to express an opinion on these financial statements and supplementary data based on our audits.
We conducted our audits in accordance with standards of the Public Company Accounting Oversight Board (United States). Those standards require that we plan and perform the audits to obtain reasonable assurance about whether the financial statements and supplementary data are free of material misstatement. The Portfolio is not required to have, nor were we engaged to perform, an audit of its internal control over financial reporting. Our audits included consideration of internal control over financial reporting as a basis for designing audit procedures that are appropriate in the circumstances, but not for the purpose of expressing an opinion on the effectiveness of the Portfolio's internal control over financial reporting. Accordingly, we express no such opinion. An audit includes examining, on a test basis, evidence supporting the amounts and disclosures in the financial statements, assessing the accounting principles used and significant estimates made by management, as well as evaluating the overall financial statement presentation. Our procedures included confirmation of securities held as of October 31, 2006 by correspondence with the custodian and brokers. We believe that our audits provide a reasonable basis for our opinion.
In our opinion, the financial statements and supplementary data present fairly, in all material respects, the financial position of the Tax-Managed Small-Cap Growth Portfolio as of October 31, 2006, the results of its operations for the year then ended, the changes in its net assets for each of the two years in the period then ended, and the supplementary data for each of the five years in the period then ended, in conformity with accounting principles generally accepted in the United States of America.
DELOITTE & TOUCHE LLP
Boston, Massachusetts
December 15, 2006
26
Eaton Vance Tax-Managed Small-Cap Growth Fund
BOARD OF TRUSTEES' ANNUAL APPROVAL OF THE INVESTMENT ADVISORY AGREEMENT
Overview of the Contract Review Process
The Investment Company Act of 1940, as amended (the "1940 Act"), provides, in substance, that each investment advisory agreement between a fund and its investment adviser will continue in effect from year to year only if its continuance is approved at least annually by the fund's board of trustees, including by a vote of a majority of the trustees who are not "interested persons" of the fund ("Independent Trustees") cast in person at a meeting called for the purpose of considering such approval.
At a meeting of the Boards of Trustees (each a "Board") of the Eaton Vance group of mutual funds (the "Eaton Vance Funds") held on March 27, 2006, the Board, including a majority of the Independent Trustees, voted to approve continuation of existing advisory and sub-advisory agreements for the Eaton Vance Funds for an additional one-year period. In voting its approval, the Board relied upon the affirmative recommendation of the Special Committee of the Board, which is a committee comprised exclusively of Independent Trustees. Prior to making its recommendation, the Special Committee reviewed information furnished for a series of meetings of the Special Committee held in February and March 2006. Such information included, among other things, the following:
Information about Fees, Performance and Expenses
• An independent report comparing the advisory and related fees paid by each fund with fees paid by comparable funds;
• An independent report comparing each fund's total expense ratio and its components to comparable funds;
• An independent report comparing the investment performance of each fund to the investment performance of comparable funds over various time periods;
• Data regarding investment performance in comparison to relevant peer groups of funds and appropriate indices;
• Comparative information concerning fees charged by each adviser for managing other mutual funds and institutional accounts using investment strategies and techniques similar to those used in managing the fund;
• Profitability analyses for each adviser with respect to each fund managed by it;
Information about Portfolio Management
• Descriptions of the investment management services provided to each fund, including the investment strategies and processes employed;
• Information concerning the allocation of brokerage and the benefits received by each adviser as a result of brokerage allocation, including information concerning the acquisition of research through "soft dollar" benefits received in connection with the funds' brokerage, and the implementation of a soft dollar reimbursement program established with respect to the funds;
• Data relating to portfolio turnover rates of each fund;
• The procedures and processes used to determine the fair value of fund assets and actions taken to monitor and test the effectiveness of such procedures and processes;
Information about each Adviser
• Reports detailing the financial results and condition of each adviser;
• Descriptions of the qualifications, education and experience of the individual investment professionals whose responsibilities include portfolio management and investment research for the funds, and information relating to their compensation and responsibilities with respect to managing other mutual funds and investment accounts;
• Copies of the Codes of Ethics of each adviser and its affiliates, together with information relating to compliance with and the administration of such codes;
• Information concerning the resources devoted to compliance efforts undertaken by each adviser and its affiliates on behalf of the funds (including descriptions of various compliance programs) and their record of compliance with investment policies and restrictions, including policies with respect to market-timing, late trading and selective portfolio disclosure, and with policies on personal securities transactions;
• Descriptions of the business continuity and disaster recovery plans of each adviser and its affiliates;
Other Relevant Information
• Information concerning the nature, cost and character of the administrative and other non-investment management services provided by Eaton Vance Management and its affiliates;
• Information concerning management of the relationship with the custodian, subcustodians and fund accountants by each adviser or the funds' administrator; and
• The terms of each advisory agreement.
In addition to the information identified above, the Special Committee considered information provided from time to time by each adviser throughout the year at meetings of the Board and its committees. Over the course of the twelve month period ended March 31, 2006, the Board met nine times and the Special Committee, the Audit Committee and the Governance Committee, each of which is a
27
Eaton Vance Tax-Managed Small-Cap Growth Fund
BOARD OF TRUSTEES' ANNUAL APPROVAL OF THE INVESTMENT ADVISORY AGREEMENT CONT'D
Committee comprised solely of Independent Trustees, met eight, twelve and five times, respectively. At such meetings, the Trustees received, among other things, presentations by the portfolio managers and other investment professionals of each adviser relating to the investment performance of each fund and the investment strategies used in pursuing the fund's investment objective.
For funds that invest through one or more underlying portfolios, the Board considered similar information about the portfolio(s) when considering the approval of advisory agreements. In addition, in cases where the fund's investment adviser has engaged a sub-adviser, the Board considered similar information about the sub-adviser when considering the approval of any sub-advisory agreement.
The Special Committee was assisted throughout the contract review process by Goodwin Procter LLP, legal counsel for the Independent Trustees. The members of the Special Committee relied upon the advice of such counsel and their own business judgment in determining the material factors to be considered in evaluating each advisory and sub-advisory agreement and the weight to be given to each such factor. The conclusions reached with respect to each advisory and sub-advisory agreement were based on a comprehensive evaluation of all the information provided and not any single factor. Moreover, each member of the Special Committee may have placed varying emphasis on particular factors in reaching conclusions with respect to each advisory and sub-advisory agreement.
Results of the Process
Based on its consideration of the foregoing, and such other information as it deemed relevant, including the factors and conclusions described below, the Special Committee concluded that the continuance of the investment advisory agreement of the Tax-Managed Small-Cap Growth Portfolio (the "Portfolio"), the portfolio in which the Eaton Vance Tax-Managed Small-Cap Growth Fund (which was formerly known as the Eaton Vance Tax-Managed Small-Cap Growth Fund 1.1, and also is the successor by merger to the Eaton Vance Tax-Managed Small-Cap Growth Fund 1.2) (the "Fund") invests, with Boston Management and Research (the "Adviser"), including its fee structure, is in the interests of shareholders and, therefore, the Special Committee recommended to the Board approval of the agreement. The Board accepted the recommendation of the Special Committee as well as the factors considered and conclusions reached by the Special Committee with respe ct to the agreement. Accordingly, the Board, including a majority of the Independent Trustees, voted to approve continuation of the investment advisory agreement for the Portfolio.
Nature, Extent and Quality of Services
In considering whether to approve the investment advisory agreement of the Portfolio, the Board evaluated the nature, extent and quality of services provided to the Portfolio by the Adviser.
The Board considered the Adviser's management capabilities and investment process with respect to the types of investments held by the Portfolio, including the education, experience and number of its investment professionals and other personnel who provide portfolio management, investment research, and similar services to the Portfolio, including recent changes in such personnel. The Board specifically noted the Adviser's in-house equity research capabilities and experience in managing funds that seek to maximize after-tax returns. The Board also took into account the resources dedicated to portfolio management and other services, including the compensation paid to recruit and retain investment personnel, and the time and attention devoted to each Portfolio in the complex by senior management.
The Board reviewed the compliance programs of the Adviser and relevant affiliates thereof. Among other matters, the Board considered compliance and reporting matters relating to personal trading by investment personnel, selective disclosure of portfolio holdings, late trading, frequent trading, portfolio valuation, business continuity and the allocation of investment opportunities. The Board also evaluated the responses of the Adviser and its affiliates to requests from regulatory authorities such as the Securities and Exchange Commission and the National Association of Securities Dealers.
The Board considered shareholder and other administrative services provided or managed by Eaton Vance Management and its affiliates, including transfer agency and accounting services. The Board evaluated the benefits to shareholders of investing in a fund that is a part of a large family of funds, including the ability, in many cases, to exchange an investment among different funds without incurring additional sales charges.
After consideration of the foregoing factors, among others, the Board concluded that the nature, extent and quality of services provided by the Adviser, taken as a whole, are appropriate and consistent with the terms of the investment advisory agreement.
Fund Performance
The Board compared the Fund's investment performance to a relevant universe of similarly managed funds identified by an independent data provider and appropriate benchmark indices. The Board reviewed comparative performance data for the one-,
28
Eaton Vance Tax-Managed Small-Cap Growth Fund
BOARD OF TRUSTEES' ANNUAL APPROVAL OF THE INVESTMENT ADVISORY AGREEMENT CONT'D
three- and five-year periods ended September 30, 2005 for the Fund. The Board noted that action was being taken to improve the performance of the Fund, and concluded that it was appropriate to allow reasonable time to evaluate the effectiveness of this action.
Management Fees and Expenses
The Board reviewed contractual investment advisory fee rates payable by the Portfolio and the Fund (referred to as "management fees").
As part of its review, the Board considered the management fees and the Fund's total expense ratio for the year ended September 30, 2005, as compared to a group of similarly managed funds selected by an independent data provider.
After reviewing the foregoing information, and in light of the nature, extent and quality of the services provided by the Adviser, the Board concluded that the management fees charged for advisory and related services and the Fund's total expense ratio are reasonable.
Profitability
The Board reviewed the level of profits realized by the Adviser and relevant affiliates thereof in providing investment advisory and administrative services to the Portfolio, the Fund and to all Eaton Vance Funds as a group. The Board considered the level of profits realized without regard to revenue sharing or other payments by the Adviser and its affiliates to third parties in respect of distribution services. The Board also considered other direct or indirect benefits received by the Adviser and its affiliates in connection with its relationship with the Portfolio and the Fund, including the benefits of research services that may be available to the Adviser as a result of securities transactions effected for the Portfolio and other advisory clients.
The Board concluded that, in light of the foregoing factors and the nature, extent and quality of the services rendered, the profits realized by the Adviser and its affiliates are reasonable.
Economies of Scale
In reviewing management fees and profitability, the Board also considered the extent to which the Adviser and its affiliates, on the one hand, and the Fund, on the other hand, can expect to realize benefits from economies of scale as the assets of the Fund and the Portfolio increase. The Board acknowledged the difficulty in accurately measuring the benefits resulting from the economies of scale with respect to the management of any specific fund or group of funds. The Board reviewed data summarizing the increases and decreases in the assets of the Fund and of all Eaton Vance Funds as a group over various time periods, and evaluated the extent to which the total expense ratio of the Fund and the profitability of the Adviser and its affiliates may have been affected by such increases or decreases. Based upon the foregoing, the Board concluded that the benefits from economies of scale are currently being shared equitably by the Adv iser and its affiliates and the Fund. The Board also concluded that, assuming reasonably foreseeable increases in the assets of the Portfolio, the structure of the advisory fee, which includes breakpoints at several asset levels, can be expected to cause the Adviser and its affiliates and the Fund to continue to share such benefits equitably.
29
Eaton Vance Tax-Managed Small-Cap Growth Fund
MANAGEMENT AND ORGANIZATION
Fund Management. The Trustees of Eaton Vance Mutual Funds Trust (the Trust) and Tax-Managed Small-Cap Growth Portfolio (the Portfolio) are responsible for the overall management and supervision of the Trust's and Portfolio's affairs. The Trustees and officers of the Trust and the Portfolio are listed below. Except as indicated, each individual has held the office shown or other offices in the same company for the last five years. Trustees and officers of the Trust and the Portfolio hold indefinite terms of office. The "noninterested Trustees" consist of those Trustees who are not "interested persons" of the Trust and the Portfolio, as that term is defined under the 1940 Act. The business address of each Trustee and officer is The Eaton Vance Building, 255 State Street, Boston, Massachusetts 02109. As used below, "EVC" refers to Eaton Vance Corp., "EV" refers to Eaton Vance, Inc., "EVM" refers to Eaton Vance Management, "BMR" refers to Boston Management and Research, "Parametric" refers to Parametric Portfolio Associates and "EVD" refers to Eaton Vance Distributors, Inc. EVC and EV are the corporate parent and trustee, respectively, of EVM and BMR. EVD is the Fund's principal underwriter, the Portfolio's placement agent and a wholly-owned subsidiary of EVM. Each officer affiliated with Eaton Vance may hold a position with other Eaton Vance affiliates that is comparable to his and her position with EVM listed below.
Name and
Date of Birth | | Position(s)
with the
Trust and the
Portfolio | | Term of
Office and
Length of
Service | | Principal Occupation(s)
During Past Five Years | | Number of Portfolios
in Fund Complex
Overseen By
Trustee(1) | | Other Directorships Held | |
| Interested Trustee | | | | | | | | | | | | | |
|
| James B. Hawkes 11/9/41 | | Trustee | | Trustee of the Trust since 1991 and of the Portfolio since 1998 | | Chairman and Chief Executive Officer of EVC, BMR, EVM and EV; Director of EV; Vice President and Director of EVD. Trustee and/or officer of 170 registered investment companies in the Eaton Vance Fund Complex. Mr. Hawkes is an interested person because of his positions with BMR, EVM, EVC and EV, which are affiliates of the Trust and the Portfolio. | | | 170 | | | Director of EVC | |
|
| Noninterested Trustee(s) | | | | | | | | | | | | | |
|
| Benjamin C. Esty 1/2/63 | | Trustee | | Since 2005 | | Roy and Elizabeth Simmons Professor of Business Administration, Harvard University Graduate School of Business Administration (since 2003). Formerly, Associate Professor, Harvard University Graduate School of Business Administration (2000-2003). | | | 170 | | | None | |
|
| Samuel L. Hayes, III 2/23/35 | | Trustee and Chairman of the Board | | Trustee of the Trust since 1986; of the Portfolio since 1998 and Chairman of the Board since 2005 | | Jacob H. Schiff Professor of Investment Banking Emeritus, Harvard University Graduate School of Business Administration. Director of Yakima Products, Inc. (manufacturer of automotive accessories) (since 2001) and Director of Telect, Inc. (telecommunications services company). | | | 170 | | | Director of Tiffany & Co. (specialty retailer) | |
|
| William H. Park 9/19/47 | | Trustee | | Since 2003 | | Vice Chairman, Commercial Industrial Finance Corp. (specialty finance company) (since 2006). Formerly, President and Chief Executive Officer, Prizm Capital Management, LLC (investment management firm) (2002-2005). Formerly, Executive Vice President and Chief Financial Officer, United Asset Management Corporation (a holding company owning institutional investment management firms) (1982-2001). | | | 170 | | | None | |
|
| Ronald A. Pearlman 7/10/40 | | Trustee | | Since 2003 | | Professor of Law, Georgetown University Law Center. | | | 170 | | | None | |
|
| Norton H. Reamer 9/21/35 | | Trustee | | Trustee of the Trust since 1986; of the Portfolio since 1998 | | President, Chief Executive Officer and a Director of Asset Management Finance Corp. (a specialty finance company serving the investment management industry) (since October 2003). President, Unicorn Corporation (an investment and financial advisory services company) (since September 2000). Formerly, Chairman and Chief Operating Officer, Hellman, Jordan Management Co., Inc. (an investment management company) (2000-2003). Formerly, Advisory Director of Berkshire Capital Corporation (investment banking firm) (2002-2003). | | | 170 | | | None | |
|
| Lynn A. Stout 9/14/57 | | Trustee | | Since 1998 | | Professor of Law, University of California at Los Angeles School of Law. | | | 170 | | | None | |
|
| Ralph F. Verni 1/26/43 | | Trustee | | Since 2005 | | Consultant and private investor. | | | 170 | | | None | |
|
30
Eaton Vance Tax-Managed Small-Cap Growth Fund
MANAGEMENT AND ORGANIZATION CONT'D
| Principal Officers who are not Trustees | |
|
Name and
Date of Birth | | Position(s)
with the
Trust and the
Portfolio | | Term of
Office and
Length of
Service | | Principal Occupation(s)
During Past Five Years | |
| Thomas E. Faust Jr. 5/31/58 | | President of the Trust | | Since 2002 | | President of EVC, EVM, BMR and EV and Director of EVC. Chief Investment Officer of EVC, EVM and BMR. Officer of 71 registered investment companies and 5 private investment companies managed by EVM or BMR. | |
|
| William H. Ahern, Jr. 7/28/59 | | Vice President of the Trust | | Since 1995 | | Vice President of EVM and BMR. Officer of 71 registered investment companies managed by EVM or BMR. | |
|
| Cynthia J. Clemson 3/2/63 | | Vice President | | Since 2005 | | Vice President of EVM and BMR. Officer of 86 registered investment companies managed by EVM or BMR. | |
|
| Aamer Khan 6/7/60 | | Vice President of the Trust | | Since 2005 | | Vice President of EVM and BMR. Officer of 29 registered investment companies managed by EVM or BMR. | |
|
| Thomas H. Luster 4/8/62 | | Vice President of the Trust | | Since 2006 | | Vice President of EVM and BMR. Officer of 45 registered investment companies managed by EVM or BMR. | |
|
| Michael R. Mach 7/15/47 | | Vice President of the Trust | | Since 1999 | | Vice President of EVM and BMR. Officer of 51 registered investment companies managed by EVM or BMR. | |
|
| Robert B. MacIntosh 1/22/27 | | Vice President of the Trust | | Since 1998 | | Vice President of EVM and BMR. Officer of 86 registered investment companies managed by EVM or BMR. | |
|
| Cliff Quisenberry, Jr. 1/1/65 | | Vice President of the Trust | | Since 2006 | | Vice President and Director of Research and Product Development of Parametric. Officer of 30 registered investment companies managed by EVM or BMR. | |
|
| Duncan W. Richardson 10/26/57 | | Vice President of the Trust; President of the Portfolio | | Vice President of the Trust since 2001 and President of the Portfolio since 2002 | | Executive Vice President and Chief Equity Investment Officer of EVC, EVM and BMR. Officer 71 registered investment companies managed by EVM or BMR. | |
|
| Walter A. Row, III 7/20/57 | | Vice President of the Trust | | Since 2001 | | Director of Equity Research and a Vice President of EVM and BMR. Officer of 33 registered investment companies managed by EVM or BMR. | |
|
| Judith A. Saryan 8/21/54 | | Vice President of the Trust | | Since 2003 | | Vice President of EVM and BMR. Officer of 50 registered investment companies managed by EVM or BMR. | |
|
| Susan Schiff 3/13/61 | | Vice President of the Trust | | Since 2002 | | Vice President of EVM and BMR. Officer of 30 registered investment companies managed by EVM or BMR. | |
|
| Nancy B. Tooke 10/25/46 | | Vice President of the Portfolio | | Since 2005 | | Vice President of EVM and BMR since 2006. Previously, Senior Managing Director and small- and mid-cap core portfolio manager with ForstmannLeff Associates (2004-2006). Previously, Executive Vice President and portfolio manager with Schroder Investment Management North America, Inc. (1994-2004). Officer of 3 registered investment companies managed by EVM or BMR. | |
|
| Barbara E. Campbell 6/19/57 | | Treasurer of the Trust | | Since 2005(2) | | Vice President EVM and BMR. Officer of 170 registered investment companies managed by EVM or BMR. | |
|
| Alan R. Dynner 10/10/40 | | Secretary | | Secretary of the Trust since 1997 and of the Portfolio since 1998 | | Vice President, Secretary and Chief Legal Officer of BMR, EVM, EVD, EV and EVC. Officer of 170 registered investment companies managed by EVM or BMR. | |
|
| Michelle A. Green 8/25/69 | | Treasurer of the Portfolio | | Since 2002(2) | | Vice President of EVM and BMR. Officer of 63 registered investment companies and 5 private investment companies managed by EVM or BMR. | |
|
| Paul M. O'Neil 7/11/53 | | Chief Compliance Officer | | Since 2004 | | Vice President of EVM and BMR. Officer of 170 registered investment companies managed by EVM or BMR. | |
|
(1) Includes both master feeder and feeder funds in a master-feeder structure.
(2) Prior to 2002, Ms. Green served as Assistant Treasurer of the Portfolio since 1998, and prior to 2005, Ms. Campbell served as Assitant Treasurer of the Trust since 1995.
The SAI for the Fund includes additional information about the Trustees and officers of the Fund and the Portfolio and can be obtained without charge by calling 1-800-225-6265.
31
This Page Intentionally Left Blank
Investment Adviser of Tax-Managed Small-Cap Growth Portfolio
Boston Management and Research
The Eaton Vance Building
255 State Street
Boston, MA 02109
Administrator of Eaton Vance Tax-Managed Small-Cap Growth Fund
Eaton Vance Management
The Eaton Vance Building
255 State Street
Boston, MA 02109
Principal Underwriter
Eaton Vance Distributors, Inc.
The Eaton Vance Building
255 State Street
Boston, MA 02109
(617) 482-8260
Custodian
Investors Bank & Trust Company
200 Clarendon Street
Boston, MA 02116
Transfer Agent
PFPC Inc.
Attn: Eaton Vance Funds
P.O. Box 9653
Providence, RI 02940-9653
(800) 262-1122
Independent Registered Public Accounting Firm
Deloitte & Touche LLP
200 Berkeley Street
Boston, MA 02116-5022
Eaton Vance Tax-Managed Small-Cap Growth Fund
The Eaton Vance Building
255 State Street
Boston, MA 02109
This report must be preceded or accompanied by a current prospectus. Before investing, investors should consider carefully the Fund's investment objective(s), risks, and charges and expenses. The Fund's current prospectus contains this and other information about the Fund and is available through your financial advisor. Please read the prospectus carefully before you invest or send money. For further information please call 1-800-225-6265.
130-12/06 MGSRC

Annual Report October 31, 2006


EATON VANCE
INTERNATIONAL
EQUITY
FUND
IMPORTANT NOTICES REGARDING PRIVACY,
DELIVERY OF SHAREHOLDER DOCUMENTS,
PORTFOLIO HOLDINGS AND PROXY VOTING
Privacy. The Eaton Vance organization is committed to ensuring your financial privacy. Each of the financial institutions identified below has in effect the following policy ("Privacy Policy") with respect to nonpublic personal information about its customers:
• Only such information received from you, through application forms or otherwise, and information about your Eaton Vance fund transactions will be collected. This may include information such as name, address, social security number, tax status, account balances and transactions.
• None of such information about you (or former customers) will be disclosed to anyone, except as permitted by law (which includes disclosure to employees necessary to service your account). In the normal course of servicing a customer's account, Eaton Vance may share information with unaffiliated third parties that perform various required services such as transfer agents, custodians and broker/dealers.
• Policies and procedures (including physical, electronic and procedural safeguards) are in place that are designed to protect the confidentiality of such information.
• We reserve the right to change our Privacy Policy at any time upon proper notification to you. Customers may want to review our Policy periodically for changes by accessing the link on our homepage: www.eatonvance.com.
Our pledge of privacy applies to the following entities within the Eaton Vance organization: the Eaton Vance Family of Funds, Eaton Vance Management, Eaton Vance Investment Counsel, Boston Management and Research, and Eaton Vance Distributors, Inc.
In addition, our Privacy Policy only applies to those Eaton Vance customers who are individuals and who have a direct relationship with us. If a customer's account (i.e. fund shares) is held in the name of a third-party financial adviser/ broker-dealer, it is likely that only such adviser's privacy policies apply to the customer. This notice supersedes all previously issued privacy disclosures.
For more information about Eaton Vance's Privacy Policy, please call 1-800-262-1122.
Delivery of Shareholder Documents. The Securities and Exchange Commission (the "SEC") permits funds to deliver only one copy of shareholder documents, including prospectuses, proxy statements and shareholder reports, to fund investors with multiple accounts at the same residential or post office box address. This practice is often called "householding" and it helps eliminate duplicate mailings to shareholders.
Eaton Vance, or your financial adviser, may household the mailing of your documents indefinitely unless you instruct Eaton Vance, or your financial adviser, otherwise.
If you would prefer that your Eaton Vance documents not be householded, please contact Eaton Vance at 1-800-262-1122, or contact your financial adviser.
Your instructions that householding not apply to delivery of your Eaton Vance documents will be effective within 30 days of receipt by Eaton Vance or your financial adviser.
Portfolio Holdings. Each Eaton Vance Fund and its underlying Portfolio (if applicable) will file a schedule of its portfolio holdings on Form N-Q with the SEC for the first and third quarters of each fiscal year. The Form N-Q will be available on the Eaton Vance website www.eatonvance.com, by calling Eaton Vance at 1-800-262-1122 or in the EDGAR database on the SEC's website at www.sec.gov. Form N-Q may also be reviewed and copied at the SEC's public reference room in Washington, D.C. (call 1-800-732-0330 for information on the operation of the public reference room).
Proxy Voting. From time to time, funds are required to vote proxies related to the securities held by the funds. The Eaton Vance Funds or their underlying Portfolios (if applicable) vote proxies according to a set of policies and procedures approved by the Funds' and Portfolios' Boards. You may obtain a description of these policies and procedures and information on how the Funds or Portfolios voted proxies relating to portfolio securities during the most recent 12 month period ended June 30, without charge, upon request, by calling 1-800-262-1122. This description is also available on the SEC's website at www.sec.gov.
Eaton Vance International Equity Fund as of October 31, 2006
M A N A G E M E N T ' S D I S C U S S I O N O F F U N D P E R F O R M A N C E

Edward R. Allen III, CFA
Eagle Global Advisors
Co-Portfolio Manager

Thomas N. Hunt III, CFA
Eagle Global Advisors
Co-Portfolio Manager
The Fund
Performance for the Period
· It is our pleasure to welcome shareholders to the first annual report for Eaton Vance International Equity Fund (the Fund). For the period from the start of business, May 31, 2006, through October 31, 2006, the Fund’s Class A shares had a total return of 6.50%. This return was the result of an increase in net asset value (NAV) per share to $10.65 on October 31, 2006, from $10.00 at inception on May 31, 2006.(1)
· The Fund’s Class C shares had a total return of 6.20% for the same period, the result of an increase in NAV per share to $10.62 from $10.00.1
· The Fund’s Class I shares had a total return of 6.60% for the same period, the result of an increase in NAV per share to $10.66 from $10.00.1
· For comparison, the Fund’s benchmark, the Morgan Stanley Capital International Europe, Australasia, and Far East Index (MSCI EAFE Index) – a broad-based, unmanaged market index of international stocks – had a total return of 7.96% for the period from May 31, 2006, through October 31, 2006. The Fund's peer group, the Lipper International Multi-Cap Growth Classification, had an average return of 6.60% for the same period .(2)
Management Discussion
· The international investment environment was generally positive during the five months ended October 31, 2006. European economies led performance, particularly Spain, Switzerland, and the Netherlands. Emerging markets continued to be volatile but posted positive returns for the period. Nonetheless, international markets lagged those of the U.S. (MSCI EAFE Index's return of 7.96% for the period compared to the S&P 500's return of 9.25% for same time frame.)(2)
· The Fund currently invests its assets in a separate registered investment company, International Equity Portfolio (the Portfolio), with the same objective and policies as the Fund. For the five months ended October 31, 2006, the Fund had positive returns, performing in line with its Lipper peer group, though lagging the benchmark MSCI EAFE Index. The Fund had positive relative performance from Portfolio holdings in six of the 10 economic sectors that make up the MSCI EAFE Index: consumer discretionary, consumer staples, health care, information technology, telecommunications services, and utilities.(2)
· Detracting from overall performance was an overweighting in the volatile energy sector, relative to the MSCI EAFE Index, as energy prices declined over the period.3 Overall, the Portfolio's regional allocation was neutral. An overweighting in Switzerland and an underweighting in Japan added to Fund performance, while overweightings in Norway and Brazil made negative contributions.
The views expressed throughout this report are those of the portfolio managers and are current only through the end of the period of the report as stated on the cover. These views are subject to change at any time based upon market or other conditions, and the investment adviser disclaims any responsibility to update such views.These views may not be relied on as investment advice and, because investment decisions for a fund are based on many factors, may not be relied on as an indication of trading intent on behalf of any Eaton Vance fund.
Past performance is no guarantee of future results. Returns are historical and are calculated by determining the percentage change in net asset value or offering price (as applicable) with all distributions reinvested. Investment return and principal value will fluctuate so that shares, when redeemed, may be worth more or less than their original cost. Performance is for stated time period only; due to market volatility, the Fund’s current performance may be lower or higher than the quoted return. For performance as of the most recent month end, please refer to www.eatonvance.com. Fund shares are not insured by the FDIC and are not deposits or other obligations of, or guaranteed by, any depository institution. Shares are subject to investment risks, including possible loss of principal invested.
(1)These returns do not include the 5.75% maximum sales charge for Class A shares or the applicable contingent deferred sales charge (CDSC) for Class C shares. Class A shares are subject to a 1% redemption fee if redeemed or exchanged within 90 days of settlement of purchase. If sales charges were deducted, the returns would be lower. Class I shares are offered to certain investors at net asset value. Absent an expense waiver by the adviser and sub-adviser of the Portfolio and an allocation of certain expenses to the adviser and sub-adviser of the Portfolio and administrator of the Fund, the returns would be lower.
(2)It is not possible to invest directly in an Index or Lipper Classification. The Index’s total return does not reflect commissions or expenses that would have been incurred if an investor individually purchased or sold the securities represented in the Index. The Lipper Average is the average total return, at net asset value, of the funds that are in the same Lipper Classification as the Fund
(3)Sector weightings are subject to change due to active management.
1
Eaton Vance International Equity Fund as of October 31, 2006
F U N D P E R F O R M A N C E
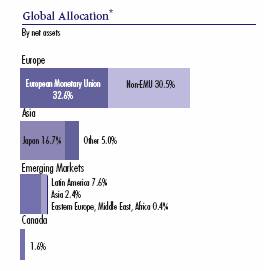
* As a percentage of the Fund's net assets as of October 31, 2006. Portfolio information may not be representative of the Portfolio’s current or future investments and may change due to active management.
Ten Largest Equity Holdings** | | | |
By net assets | | | |
| | | |
Total SA ADR | | 2.8 | % |
BT Group PLC ADR | | 2.7 | |
Roche Holdings Ltd | | 2.6 | |
RWE AG ADR | | 2.5 | |
Barclays PLC ADR | | 2.5 | |
ING Groep NV ADR | | 2.4 | |
Endesa SA | | 2.4 | |
Canon, Inc. ADR | | 2.4 | |
Acergy SA ADR | | 2.3 | |
UBS AG | | 2.3 | |
**Ten Largest Equity Holdings represented 24.9% of Portfolio net assets as of October 31, 2006. Holdings are subject to change due to active management.
2
Eaton Vance International Equity Fund as of October 31, 2006
F U N D P E R F O R M A N C E
The line graphs and table set forth below provide information about the Fund’s performance. The line graphs compare the performance of Class A, Class C and Class I of the Fund with that of the MSCI EAFE Index, a broad-based, unmanaged index of international stocks. The lines on the graphs represent the total returns of a hypothetical investment of $10,000 in each of Class A, Class C and Class I and the MSCI EAFE Index. Class A total returns are presented at net asset value and maximum public offering price. The table includes the total returns of each Class of the Fund at net asset value and public offering price. The performance presented below does not reflect the deduction of taxes, if any, that a shareholder would pay on distributions or redemptions of Fund shares.
Performance* | | Class A | | Class C | | ClassI | |
Cumulative Total Returns (at net asset value) | | | | | | | |
Life of Fund† | | 6.50 | % | 6.20 | % | 6.60 | % |
SEC Cumulative Total Returns (including sales charge or applicable CDSC) | | | | | |
Life of Fund† | | 0.38 | % | 5.20 | % | 6.60 | % |
| | | | | | | |
†Inception Dates – Class A: 5/31/06; Class C: 5/31/06;Class I: 5/31/06 | | | | | |
* Cumulative total returns at net asset value do not include the 5.75% maximum sales charge for Class A shares or the applicable contingent deferred sales charge (CDSC) for Class C shares. If sales charges were deducted, the returns would be lower. Class A and Class I shares are subject to a 1% redemption fee if redeemed or exchanged within 90 days of settlement of purchase. SEC cumulative total returns for Class A reflect the maximum 5.75% sales charge. SEC returns for Class C reflect a 1% CDSC. Class I are offered to certain investors at net asset value. Absent an expense waiver by the adviser and sub-adviser of the Portfolio and an allocation of certain expenses to the adviser and sub-adviser of the Portfolio and administrator of the Fund, the returns would be lower.
Past performance is no guarantee of future results. Returns are historical and are calculated by determining the percentage change in net asset value or offering price (as applicable) with all distributions reinvested. Investment return and principal value will fluctuate so that shares, when redeemed, may be worth more or less than their original cost. Performance is for stated time period only; due to market volatility, the Fund’s current performance may be lower or higher than the quoted return. For performance as of the most recent month end, please refer to www.eatonvance.com.
Comparison of Change in Value of a $10,000 Investment in
Eaton Vance International Equity Fund – Class A
vs. the MSCI EAFE Index**
May 31, 2006 – October 31, 2006
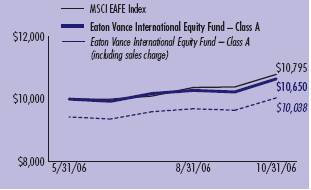
Comparison of Change in Value of a $10,000 Investment in
Eaton Vance International Equity Fund – Class C
vs. the MSCI EAFE Index**
May 31, 2006 – October 31, 2006
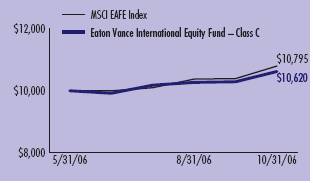
Comparison of Change in Value of a $10,000 Investment in
Eaton Vance International Equity Fund – Class I
vs. the MSCI EAFE Index**
May 31, 2006 – October 31, 2006
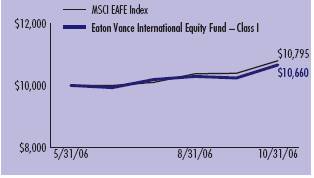
**Source: Thomson Financial. Class A, Class C and Class I of the Fund commenced
investment operations on 5/31/06. It is not possible to invest directly in an Index.
The Index’s total returns do not reflect commissions or expenses that would have
been incurred if an investor individually purchased or sold the securities represented
in the Index.
3
Eaton Vance International Equity Fund as of October 31, 2006
FUND EXPENSES
Example: As a shareholder of the Fund, you incur two types of costs: (1) transaction costs, including sales charges (loads) on purchases and redemption fees (if applicable); and (2) ongoing costs, including management fees; distribution or service fees; and other Fund expenses. This Example is intended to help you understand your ongoing costs (in dollars) of investing in the Fund and to compare these costs with the ongoing costs of investing in other mutual funds. The Example is based on an investment of $1,000 invested at the beginning of the period and held for the entire period (May 31, 2006 – October 31, 2006).
Actual Expenses: The first section of the table below provides information about actual account values and actual expenses. You may use the information in this section, together with the amount you invested, to estimate the expenses that you paid over the period. Simply divide your account value by $1,000 (for example, an $8,600 account value divided by $1,000 = 8.6), then multiply the result by the number in the first section under the heading entitled "Expenses Paid During Period" to estimate the expenses you paid on your account during this period.
Hypothetical Example for Comparison Purposes: The second section of the table below provides information about hypothetical account values and hypothetical expenses based on the Fund's actual expense ratio and an assumed rate of return of 5% per year (before expenses), which is not the actual return of the Fund. The hypothetical account values and expenses may not be used to estimate the actual ending account balance or expenses you paid for the period. You may use this information to compare the ongoing costs of investing in your Fund and other funds. To do so, compare this 5% hypothetical example with the 5% hypothetical examples that appear in the shareholder reports of the other funds.
Please note that the expenses shown in the table are meant to highlight your ongoing costs only and do not reflect any transactional costs, such as sales charges (loads) or redemption fees (if applicable). Therefore, the second section of the table is useful in comparing ongoing costs only, and will not help you determine the relative total costs of owning different funds. In addition, if these transactional costs were included, your costs would have been higher.
Eaton Vance International Equity Fund
| | | Beginning Account Value
(5/31/06) | | Ending Account Value
(10/31/06) | | Expenses Paid During Period***
(5/31/06 – 10/31/06) | |
| Actual* | |
| Class A | | $ | 1,000.00 | | | $ | 1,065.00 | | | $ | 6.53 | | |
| Class C | | $ | 1,000.00 | | | $ | 1,062.00 | | | $ | 9.79 | | |
| Class I | | $ | 1,000.00 | | | $ | 1,066.00 | | | $ | 5.45 | | |
* Actual expenses are equal to the Fund's annualized expense ratio of 1.50% for Class A shares, 2.25% for Class C shares, and 1.25% for Class I shares, multiplied by the average account value over the period, multiplied by 154/365 (to reflect the period from the start of business, May 31, 2006 to October 31, 2006). The Example assumes that the $1,000 was invested at the net asset value per share determined at the close of business on May 30, 2006. The Example reflects the expenses of both the Fund and the Portfolio.
| Hypothetical** | |
| (5% return per year before expenses) | |
| Class A | | $ | 1,000.00 | | | $ | 1,017.60 | | | $ | 7.63 | | |
| Class C | | $ | 1,000.00 | | | $ | 1,013.90 | | | $ | 11.42 | | |
| Class I | | $ | 1,000.00 | | | $ | 1,018.90 | | | $ | 6.36 | | |
** Hypothetical expenses are equal to the Fund's annualized expense ratio of 1.50% for Class A shares, 2.25% for Class C shares, and 1.25% for Class I shares multiplied by the average account value over the period, multiplied by 184/365 (to reflect the one-half year period). The example assumes that the $1,000 was invested at the net asset value per share determined at the close of business on April 30, 2006. The example reflects the expenses of both the Fund and the Portfolio.
*** Absent an expense waiver by the adviser and sub-adviser of the Portfolio and an allocation of certain expenses to the adviser and sub-adviser of the Portfolio and administrator of the Fund, expenses would be higher.
4
Eaton Vance International Equity Fund as of October 31, 2006
FINANCIAL STATEMENTS
Statement of Assets and Liabilities
As of October 31, 2006
| Assets | |
Investment in International Equity Portfolio, at value
(identified cost, $3,114,084) | | $ | 3,267,561 | | |
| Receivable from the administrator and the sub-adviser of the Portfolio | | | 94,151 | | |
| Total assets | | $ | 3,361,712 | | |
| Liabilities | |
| Payable to affiliate for distribution and service fees | | $ | 188 | | |
| Accrued expenses | | | 34,584 | | |
| Total liabilities | | $ | 34,772 | | |
| Net Assets | | $ | 3,326,940 | | |
| Sources of Net Assets | |
| Paid-in capital | | $ | 3,177,751 | | |
Accumulated net realized loss from Portfolio (computed on
the basis of identified cost) | | | (7,342 | ) | |
| Accumulated undistributed net investment income | | | 3,054 | | |
Net unrealized appreciation from Portfolio (computed on the basis of
identified cost) | | | 153,477 | | |
| Total | | $ | 3,326,940 | | |
| Class A Shares | |
| Net Assets | | $ | 430,352 | | |
| Shares Outstanding | | | 40,390 | | |
Net Asset Value and Redemption Price Per Share
(net assets ÷ shares of beneficial interest outstanding) | | $ | 10.65 | | |
Maximum Offering Price Per Share
(100 ÷ 94.25 of $10.65) | | $ | 11.30 | | |
| Class C Shares | |
| Net Assets | | $ | 170,112 | | |
| Shares Outstanding | | | 16,019 | | |
Net Asset Value, Offering Price and Redemption Price Per Share
(net assets ÷ shares of beneficial interest outstanding) | | $ | 10.62 | | |
| Class I Shares | |
| Net Assets | | $ | 2,726,476 | | |
| Shares Outstanding | | | 255,721 | | |
Net Asset Value, Offering Price and Redemption Price Per Share
(net assets ÷ shares of beneficial interest outstanding) | | $ | 10.66 | | |
| On sales of $50,000 or more, the offering price of Class A shares is reduced. | |
Statement of Operations
For the Period Ended
October 31, 2006(1)
| Investment Income | |
| Dividends allocated from Portfolio (net of foreign taxes, $335) | | $ | 9,405 | | |
| Interest allocated from Portfolio | | | 3,680 | | |
| Expenses allocated from Portfolio | | | (4,391 | ) | |
| Net investment income from Portfolio | | $ | 8,694 | | |
| Expenses | |
Distribution and service fees
Class A | | $ | 117 | | |
| Class C | | | 168 | | |
| Registration fees | | | 70,494 | | |
| Legal and accounting services | | | 18,401 | | |
| Printing and postage | | | 3,312 | | |
| Custodian fee | | | 3,211 | | |
| Transfer and dividend disbursing agent fees | | | 154 | | |
| Miscellaneous | | | 2,161 | | |
| Total expenses | | $ | 98,018 | | |
Deduct —
Allocation of expenses to the administrator and the sub-adviser
of the Portfolio | | $ | 94,151 | | |
| Total expense reductions | | $ | 94,151 | | |
| Net expenses | | $ | 3,867 | | |
| Net investment income | | $ | 4,827 | | |
Realized and Unrealized
Gain (Loss) from Portfolio | |
Net realized gain (loss) —
Investment transactions (identified cost basis) | | $ | (7,342 | ) | |
| Foreign currency transactions | | | (1,773 | ) | |
| Net realized loss | | $ | (9,115 | ) | |
Change in unrealized appreciation (depreciation) —
Investments (identified cost basis) | | $ | 153,477 | | |
| Net change in unrealized appreciation (depreciation) | | $ | 153,477 | | |
| Net realized and unrealized gain | | $ | 144,362 | | |
| Net increase in net assets from operations | | $ | 149,189 | | |
(1) For the period from the start of business, May 31, 2006, to October 31, 2006.
See notes to financial statements
5
Eaton Vance International Equity Fund as of October 31, 2006
FINANCIAL STATEMENTS CONT'D
Statement of Changes in Net Assets
Increase (Decrease)
in Net Assets | | Period Ended
October 31, 2006(1) | |
From operations —
Net investment income | | $ | 4,827 | | |
| Net realized loss from investments and foreign currency transactions | | | (9,115 | ) | |
Net change in unrealized appreciation (depreciation)
from investments and foreign currency | | | 153,477 | | |
| Net increase in net assets from operations | | $ | 149,189 | | |
Transactions in shares of beneficial interest —
Proceeds from sale of shares
Class A | | $ | 418,090 | | |
| Class C | | | 163,442 | | |
| Class I | | | 2,603,516 | | |
Cost of shares redeemed
Class A | | | (4,360 | ) | |
| Class I | | | (3,011 | ) | |
| Redemption fees | | | 44 | | |
| Net increase in net assets from Fund share transactions | | $ | 3,177,721 | | |
| Net increase in net assets | | $ | 3,326,910 | | |
| Net Assets | |
| At beginning of period | | $ | 30 | | |
| At end of period | | $ | 3,326,940 | | |
Accumulated undistributed
net investment income
included in net assets | |
| At end of period | | $ | 3,054 | | |
(1) For the period from the start of business, May 31, 2006, to October 31, 2006.
See notes to financial statements
6
Eaton Vance International Equity Fund as of October 31, 2006
FINANCIAL STATEMENTS CONT'D
Financial Highlights
| | | Class A | |
| | | Period Ended
October 31, 2006(1)(2) | |
| Net asset value — Beginning of period | | $ | 10.000 | | |
| Income (loss) from operations | |
| Net investment loss | | $ | (0.003 | ) | |
| Net realized and unrealized gain | | | 0.653 | | |
| Total income from operations | | $ | 0.650 | | |
| Redemption fees | | $ | 0.000 | (3) | |
| Net asset value — End of period | | $ | 10.650 | | |
| Total Return(4) | | | 6.50 | % | |
| Ratios/Supplemental Data | |
| Net assets, end of period (000's omitted) | | $ | 430 | | |
| Ratios (As a percentage of average daily net assets): | |
| Expenses before custodian fee reduction(5)(7) | | | 1.51 | %(6) | |
| Expenses after custodian fee reduction(5)(7) | | | 1.50 | %(6) | |
| Net investment loss | | | (0.08 | )%(6) | |
| Portfolio Turnover of the Portfolio | | | 1 | % | |
(1) For the period from the start of business, May 31, 2006, to October 31, 2006.
(2) Net investment loss and redemption fees per share were computed using average shares outstanding.
(3) Amount represents less than $0.0005 per share.
(4) Returns are historical and are calculated by determining the percentage change in net asset value with all distributions reinvested. Total return is not calculated on an annualized basis. Total return would have been lower had certain expenses not been reduced during the period shown.
(5) Includes the Fund's share of the Portfolio's allocated expenses.
(6) Annualized.
(7) The investment adviser waived its advisory fee and the investment adviser and administrator subsidized certain operating expenses (equal to 19.97% of average daily net assets for the period ended October 31, 2006). A portion of the waiver and subsidy was borne by the sub-adviser of the Portfolio.
See notes to financial statements
7
Eaton Vance International Equity Fund as of October 31, 2006
FINANCIAL STATEMENTS CONT'D
Financial Highlights
| | | Class C | |
| | | Period Ended
October 31, 2006(1)(2) | |
| Net asset value — Beginning of period | | $ | 10.000 | | |
| Income (loss) from operations | |
| Net investment loss | | $ | (0.037 | ) | |
| Net realized and unrealized gain | | | 0.657 | | |
| Total income from operations | | $ | 0.620 | | |
| Redemption fees | | $ | 0.000 | (3) | |
| Net asset value — End of period | | $ | 10.620 | | |
| Total Return(4) | | | 6.20 | % | |
| Ratios/Supplemental Data | |
| Net assets, end of period (000's omitted) | | $ | 170 | | |
| Ratios (As a percentage of average daily net assets): | |
| Expenses before custodian fee reduction(5)(7) | | | 2.26 | %(6) | |
| Expenses after custodian fee reduction(5)(7) | | | 2.25 | %(6) | |
| Net investment loss | | | (0.87 | )%(6) | |
| Portfolio Turnover of the Portfolio | | | 1 | % | |
(1) For the period from the start of business, May 31, 2006, to October 31, 2006.
(2) Net investment loss and redemption fees per share were computed using average shares outstanding.
(3) Amount represents less than $0.0005 per share.
(4) Returns are historical and are calculated by determining the percentage change in net asset value with all distributions reinvested. Total return is not calculated on an annualized basis. Total return would have been lower had certain expenses not been reduced during the period shown.
(5) Includes the Fund's share of the Portfolio's allocated expenses.
(6) Annualized.
(7) The investment adviser waived its advisory fee and the investment adviser and administrator subsidized certain operating expenses (equal to 19.97% of average daily net assets for the period ended October 31, 2006). A portion of the waiver and subsidy was borne by the sub-adviser of the Portfolio.
See notes to financial statements
8
Eaton Vance International Equity Fund as of October 31, 2006
FINANCIAL STATEMENTS CONT'D
Financial Highlights
| | | Class I | |
| | | Period Ended
October 31, 2006(1)(2) | |
| Net asset value — Beginning of period | | $ | 10.000 | | |
| Income from operations | |
| Net investment income | | $ | 0.037 | | |
| Net realized and unrealized gain | | | 0.623 | | |
| Total income from operations | | $ | 0.660 | | |
| Redemption fees | | $ | 0.000 | (3) | |
| Net asset value — End of period | | $ | 10.660 | | |
| Total Return(4) | | | 6.60 | % | |
| Ratios/Supplemental Data | |
| Net assets, end of period (000's omitted) | | $ | 2,726 | | |
| Ratios (As a percentage of average daily net assets): | |
| Expenses before custodian fee reduction(5)(7) | | | 1.26 | %(6) | |
| Expenses after custodian fee reduction(5)(7) | | | 1.25 | %(6) | |
| Net investment income | | | 0.87 | %(6) | |
| Portfolio Turnover of the Portfolio | | | 1 | % | |
(1) For the period from the start of business, May 31, 2006, to October 31, 2006.
(2) Net investment income and redemption fees per share were computed using average shares outstanding.
(3) Amount represents less than $0.0005 per share.
(4) Returns are historical and are calculated by determining the percentage change in net asset value with all distributions reinvested. Total return is not calculated on an annualized basis. Total return would have been lower had certain expenses not been reduced during the period shown.
(5) Includes the Fund's share of the Portfolio's allocated expenses.
(6) Annualized.
(7) The investment adviser waived its advisory fee and the investment adviser and administrator subsidized certain operating expenses (equal to 19.97% of average daily net assets for the period ended October 31, 2006). A portion of the waiver and subsidy was borne by the sub-adviser of the Portfolio.
See notes to financial statements
9
Eaton Vance International Equity Fund as of October 31, 2006
NOTES TO FINANCIAL STATEMENTS
1 Significant Accounting Policies
Eaton Vance International Equity Fund (the Fund) is a diversified series of Eaton Vance Mutual Funds Trust (the Trust). The Trust is an entity of the type commonly known as a Massachusetts business trust and is registered under the Investment Company Act of 1940, as amended, as an open-end management investment company. The Fund offers three classes of shares. Class A shares are generally sold subject to a sales charge imposed at time of purchase. Class C shares are sold at net asset value and are subject to a contingent deferred sales charge (see Note 6). Class I shares are sold at net asset value. Each class represents a pro-rata interest in the Fund, but votes separately on class-specific matters and (as noted below) is subject to different expenses. Realized and unrealized gains and losses and net investment income, other than class-specific expenses, are allocated daily to each class of shares based on the relative net asse ts of each class to the total net assets of the Fund. Each class of shares differs in its distribution plan and certain other class specific expenses. The Fund invests all of its investable assets in interests in the International Equity Portfolio (the Portfolio), a New York Trust, having the same investment objective as the Fund. The value of the Fund's investment in the Portfolio reflects the Fund's proportionate interest in the net assets of the Portfolio (30.1% at October 31, 2006). The performance of the Fund is directly affected by the performance of the Portfolio. The financial statements of the Portfolio, including the portfolio of investments, are included elsewhere in this report and should be read in conjunction with the Fund's financial statements.
The following is a summary of significant accounting policies consistently followed by the Fund in the preparation of its financial statements. The policies are in conformity with accounting principles generally accepted in the United States of America.
A Investment Valuation — Valuation of securities by the Portfolio is discussed in Note 1A of the Portfolio's Notes to Financial Statements, which are included elsewhere in this report.
B Income — The Fund's net investment income or loss consists of the Fund's pro rata share of the net investment income or loss of the Portfolio, less all actual and accrued expenses of the Fund.
C Federal Taxes — The Fund's policy is to comply with the provisions of the Internal Revenue Code applicable to regulated investment companies and to distribute to shareholders, each year, substantially all of its net investment income and all or substantially all of its net realized capital gains. Accordingly, no provision for federal income or excise tax is necessary. At October 31, 2006, the Fund, for federal income tax purposes, had a capital loss carryover of $7,211 which will reduce the taxable income arising from future net realized gain on investments, if any, to the extent permitted by the Internal Revenue Code and thus w ill reduce the amount of distributions to shareholders which would otherwise be necessary to relieve the Fund of any liability for federal income or excise tax. Such capital loss carryover will expire on October 31, 2014.
D Expenses — The majority of expenses of the Trust are directly identifiable to an individual fund. Expenses which are not readily identifiable to a specific fund are allocated taking into consideration, among other things, the nature and type of expense and the relative size of the funds.
E Expense Reduction — Investors Bank & Trust Company (IBT) serves as custodian of the Fund. Pursuant to the custodian agreement, IBT receives a fee reduced by credits which are determined based on the average daily cash balance the Fund maintains with IBT. All credit balances used to reduce the Fund's custodian fees are reported as a reduction of expenses in the Statement of Operations.
F Use of Estimates — The preparation of the financial statements in conformity with accounting principles generally accepted in the United States of America requires management to make estimates and assumptions that affect the reported amounts of assets and liabilities at the date of the financial statements and the reported amounts of income and expense during the reporting period. Actual results could differ from those estimates.
G Indemnifications — Under the Trust's organizational documents, its officers and Trustees may be indemnified against certain liabilities and expenses arising out of the performance of their duties to the Fund and shareholders are indemnified against personal liability for obligations of the Trust. Additionally, in the normal course of business, the Fund enters into agreements with service providers that may contain indemnification clauses. The Fund's maximum exposure under these arrangements is unknown as this would involve future claims that may be made against the Fund that have not yet occurred.
H Redemption Fee — Upon the redemption or exchange of shares by Class A and Class I shareholders within 90 days of the settlement of purchase, a fee of 1% of the current net asset value of these shares will be assessed and retained by the Fund for the benefit of the remaining
10
Eaton Vance International Equity Fund as of October 31, 2006
NOTES TO FINANCIAL STATEMENTS CONT'D
shareholders. The redemption fee is accounted for as an addition to paid-in capital.
I Other — Investment transactions are accounted for on the date the securities are purchased or sold. Dividends to shareholders are recorded on the ex-dividend date.
2 Distributions to Shareholders
It is the present policy of the Fund to make at least one distribution annually (normally in December) of all or substantially all of its net investment income and at least one distribution annually of all or substantially all of its net realized capital gains (reduced by available capital loss carryforwards from prior years, if any). Distributions are declared separately for each class of shares. Shareholders may reinvest distributions in shares of the same class of the Fund at the net asset value as of the reinvestment date. Distributions are paid in the form of additional shares of the same class of the Fund or, at the election of the shareholder, in cash. The Fund distinguishes between distributions on a tax basis and a financial reporting basis. Accounting principles generally accepted in the United States of America require that only distributions in excess of tax basis earnings and profits be reported in the financial sta tements as a return of capital. Permanent differences between book and tax accounting relating to distributions are reclassified to paid-in capital.
During the period ended October 31, 2006, accumulated net investment income was decreased by $1,773 and accumulated net realized loss was decreased by $1,773 primarily due to differences between book and tax accounting treatment for foreign currency gains and losses. This change had no effect on the net assets or the net asset value per share.
As of October 31, 2006, the components of distributable earnings (accumulated losses) on a tax basis were as follows:
| Ordinary income | | $ | 7,812 | | |
| Capital loss carryforward | | $ | (7,211 | ) | |
| Unrealized gain | | $ | 148,588 | | |
3 Shares of Beneficial Interest
The Fund's Declaration of Trust permits the Trustees to issue an unlimited number of full and fractional shares of beneficial interest (without par value). Such shares may be issued in a number of different series (such as the Fund) and classes. Transactions in Fund shares were as follows:
| Class A | | Period Ended
October 31, 2006(1) | |
| Sales | | | 40,814 | | |
| Redemptions | | | (424 | ) | |
| Net increase | | | 40,390 | | |
| Class C | | Period Ended
October 31, 2006(1) | |
| Sales | | | 16,019 | | |
| Redemptions | | | — | | |
| Net increase | | | 16,019 | | |
| Class I | | Period Ended
October 31, 2006(1) | |
| Sales | | | 256,020 | | |
| Redemptions | | | (299 | ) | |
| Net increase | | | 255,721 | | |
(1)�� For the period from the start of business, May 31, 2006 to October 31, 2006.
Class A and Class I shares are subject to a 1% redemption fee if redeemed or exchanged within 90 days of the settlement of the purchase. For the period from the start of business, May 31, 2006, to October 31, 2006, the Fund received $5 in redemption fees on Class A shares, $2 in redemption fees on Class C shares and $37 in redemption fees on Class I shares.
4 Transactions with Affiliates
Eaton Vance Management (EVM) serves as the administrator to the Fund, but receives no compensation. The Portfolio has engaged Boston Management and Research (BMR), a subsidiary of EVM, to render investment advisory services. See Note 2 of the Portfolio's Notes to Financial Statements which are included elsewhere in this report. EVM and the sub-adviser of the Portfolio, Eagle Global Advisors, L.L.C. ("Eagle") have agreed to limit the Total Annual Fund Operating Expenses of Class A, Class C and Class I to 1.50%, 2.25% and 1.25%, respectively. This expense limitation will continue for at least one year from May 31, 2006, and could be changed or terminated at any time thereafter. Pursuant to this
11
Eaton Vance International Equity Fund as of October 31, 2006
NOTES TO FINANCIAL STATEMENTS CONT'D
agreement, EVM and Eagle were allocated $47,076 and $47,075, respectively, of the Fund's operating expenses for the period from the start of business, May 31, 2006, to October 31, 2006. Except for Trustees of the Fund and the Portfolio who are not members of EVM's or BMR's organization, officers and Trustees receive remuneration for their services to the Fund out of the investment adviser fees earned by BMR. The Fund was informed that Eaton Vance Distributors, Inc. (EVD), a subsidiary of EVM and the Fund's principal underwriter, received $699 as its portion of the sales charge on sales of Class A shares for the period from the start of business, May 31, 2006, to October 31, 2006. EVM serves as the sub-transfer agent of the Fund and receives from the transfer agent an aggregate fee based upon the actual expenses incurred by EVM in the performance of those services. For the period from the start of business, May 31, 2006, to Octob er 31, 2006, EVM received $35 in sub-transfer agent fees.
Certain officers and Trustees of the Fund and Portfolio are officers of the above organizations.
5 Distribution Plans
Class A has in effect a distribution plan pursuant to Rule 12b-1 under the Investment Company Act of 1940 (Class A Plan). The Class A Plan provides that the Fund will pay EVD a distribution and service fee of 0.25% (annualized) of the Fund's average daily net assets attributable to Class A shares for each fiscal year for distribution services and facilities provided to the Fund by EVD, as well as for personal services and/or the maintenance of shareholder accounts. Distribution and service fees paid or accrued for the period from the start of business, May 31, 2006, to October 31, 2006 amounted to $117 for Class A shares. The Fund also has in effect a distribution plan for Class C shares (Class C Plan) pursuant to Rule 12b-1. The Class C Plan requires the Fund to pay EVD amounts equal to 1/365 of 0.75% (annualized) of the Fund's average daily net assets attributable to Class C shares for providing ongoing distribution services a nd facilities to the Fund. The Fund will automatically discontinue payments to EVD during any period in which there are no outstanding Uncovered Distribution Charges, which are equivalent to the sum of (i) 6.25% of the aggregate amount received by the Fund for the Class C shares sold, plus (ii) interest calculated by applying the rate of 1% over the prevailing prime rate to the outstanding balance of Uncovered Distribution Charges of EVD, reduced by the aggregate amount of contingent deferred sales charges (see Note 6) and daily amounts theretofore paid to EVD by Class C. The Fund paid or accrued $126 for Class C shares to or payable to EVD for the period from the start of business, May 31, 2006, to October 31, 2006, representing 0.75% (annualized) of the average daily net assets for Class C shares. At October 31, 2006, the amount of Uncovered Distribution Charges of EVD calculated under the Plan was approximately $8,000 for Class C shar es. The Class C Plan also authorizes the Fund to make payments of service fees to EVD, investment dealers and other persons in amounts not exceeding 0.25% annually of the average daily net assets attributable to Class C. Service fees are paid for personal services and/or the maintenance of shareholder accounts. They are separate and distinct from the Class C sales commissions and distribution fees and, as such, are not subject to automatic discontinuance when there are no outstanding Uncovered Distribution Charges to EVD. Service fees paid or accrued for the period from the start of business, May 31, 2006, to October 31, 2006 amounted to $42 for Class C shares.
6 Contingent Deferred Sales Charge
A contingent deferred sales charge (CDSC) generally is imposed on redemptions of Class C shares made within one year of purchase. Prior to September 15, 2006, Class A shares purchased at net asset value in amounts of $1 million or more (other than shares purchased in a single transaction of $5 million or more) were subject to a 1% CDSC if redeemed within 12 months of purchase. Effective September 15, 2006, all purchases of Class A shares of $1 million or more will be subject to a 1% contingent deferred sales charge in the event of redemption within 18 months of purchase. Generally, the CDSC is based upon the lower of the net asset value at date of redemption or date of purchase. No charge is levied on shares acquired by reinvestment of dividends or capital gain distributions. No CDSC is levied on shares which have been sold to EVM or its affiliates or to their respective employees or clients and may be waived under certain other limited conditions. CDSCs received on Class C redemptions are paid to EVD to reduce the amount of Uncovered Distribution Charges calculated under the Class C Plan (see Note 5). CDSCs received on Class C shares when no Uncovered Distribution Charges exist for Class C will be credited to the Fund. EVD did not receive any CDSC paid by shareholders for Class A shares and Class C shares, for the period from the start of business, May 31, 2006, to October 31, 2006.
7 Investment Transactions
Increases and decreases in the Fund's investment in the Portfolio aggregated $3,185,121 and $70,616 respectively, for the period from the start of business, May 31, 2006, to October 31, 2006.
12
Eaton Vance International Equity Fund as of October 31, 2006
NOTES TO FINANCIAL STATEMENTS CONT'D
8 Recently Issued Accounting Pronouncements
In June 2006, the Financial Accounting Standards Board (FASB) issued FASB Interpretation No. 48, (FIN 48) "Accounting for Uncertainty in Income Taxes – an interpretation of FASB Statement No. 109". FIN 48 clarifies the accounting for uncertainty in income taxes recognized in accordance with FASB Statement No. 109, "Accounting for Income Taxes." This interpretation prescribes a recognition threshold and measurement attribute for the financial statement recognition and measurement of a tax position taken or expected to be taken in a tax return. It also provides guidance on de-recognition, classification, interest and penalties, accounting in interim periods, disclosure and transition. FIN 48 is effective for fiscal years beginning after December 15, 2006. Management is currently evaluating the impact of applying the various provisions of FIN 48.
In September 2006, the FASB issued Statement of Financial Accounting Standards No. 157, ("FAS 157") "Fair Value Measurements". FAS 157 defines fair value, establishes a framework for measuring fair value in accordance with generally accepted accounting principles and expands disclosure about fair value measurements. FAS 157 is effective for fiscal years beginning after November 15, 2007. Management is currently evaluating the impact the adoption of FAS 157 will have on the Fund's financial statement disclosures.
13
Eaton Vance International Equity Fund as of October 31, 2006
REPORT OF INDEPENDENT REGISTERED PUBLIC ACCOUNTING FIRM
To the Trustees of Eaton Vance Mutual Funds Trust and the Shareholders
of Eaton Vance International Equity Fund:
We have audited the accompanying statement of assets and liabilities of Eaton Vance International Equity Fund (the Fund) (one of the series of Eaton Vance Mutual Funds Trust), as of October 31, 2006, and the related statements of operations, changes in net assets and the financial highlights for the period from the start of business, May 31, 2006 to October 31, 2006. These financial statements and financial highlights are the responsibility of the Fund's management. Our responsibility is to express an opinion on these financial statements and financial highlights based on our audit.
We conducted our audit in accordance with the standards of the Public Company Accounting Oversight Board (United States). Those standards require that we plan and perform the audit to obtain reasonable assurance about whether the financial statements and financial highlights are free of material misstatement. The Fund is not required to have, nor were we engaged to perform, an audit of its internal control over financial reporting. Our audit included consideration of internal control over financial reporting as a basis for designing audit procedures that are appropriate in the circumstances, but not for the purpose of expressing an opinion on the effectiveness of the Fund's internal control over financial reporting. Accordingly, we express no such opinion. An audit also includes examining, on a test basis, evidence supporting the amounts and disclosures in the financial statements, assessing the accounting principles used and si gnificant estimates made by management, as well as evaluating the overall financial statement presentation. We believe that our audit provides a reasonable basis for our opinion.
In our opinion, the financial statements and financial highlights referred to above present fairly, in all material respects, the financial position of the Eaton Vance International Equity Fund as of October 31, 2006, the results of its operations, changes in its net assets and the financial highlights from the start of business, May 31, 2006 to October 31, 2006, in conformity with accounting principles generally accepted in the United States of America.
DELOITTE & TOUCHE LLP
Boston, Massachusetts
December 15, 2006
14
Eaton Vance International Equity Fund as of October 31, 2006
FEDERAL TAX INFORMATION (Unaudited)
The Form 1099-DIV you receive in January 2007 will show the tax status of all distributions paid to your account in calendar 2006. Shareholders are advised to consult their own tax adviser with respect to the tax consequences of their investment in the Fund. As required by the Internal Revenue Code regulations, shareholders must be notified within 60 days of the Fund's fiscal year end regarding the status of the qualified dividend income for individuals and the foreign tax credit.
Qualified Dividend Income. The Fund designates approximately $8,892, or up to the maximum amount of such dividends allowable pursuant to the Internal Revenue Code, as qualified dividend income eligible for the reduced tax rate of 15%.
Foreign Tax Credit. The Fund designates a foreign tax credit of $335 and recognizes foreign source income of $9,740.
15
International Equity Portfolio as of October 31, 2006
PORTFOLIO OF INVESTMENTS
| Common Stocks — 96.4% | |
| Security | | Shares | | Value | |
| Airlines — 1.9% | |
| Air France-KLM | | | 3,200 | | | $ | 113,980 | | |
| Gol Linhas Aereas Inteligentes SA ADR | | | 3,000 | | | | 93,450 | | |
| | | $ | 207,430 | | |
| Automobiles — 3.2% | |
| Honda Motor Co., Ltd. ADR | | | 5,200 | | | $ | 183,716 | | |
| Toyota Motor Corp. ADR | | | 1,400 | | | | 165,200 | | |
| | | $ | 348,916 | | |
| Beverages — 5.0% | |
| Diageo PLC ADR | | | 2,200 | | | $ | 163,834 | | |
| Fomento Economico Mexicano SA de CV ADR | | | 2,000 | | | | 193,380 | | |
| Heineken Holding NV | | | 2,000 | | | | 78,163 | | |
| InBev NV | | | 1,900 | | | | 106,974 | | |
| | | $ | 542,351 | | |
| Capital Markets — 3.5% | |
| Deutsche Bank AG | | | 1,100 | | | $ | 138,985 | | |
| UBS AG | | | 4,100 | | | | 245,344 | | |
| | | $ | 384,329 | | |
| Chemicals — 1.0% | |
| BASF AG ADR | | | 1,200 | | | $ | 105,576 | | |
| | | $ | 105,576 | | |
| Commercial Banks — 19.1% | |
| Anglo Irish Bank Corp. PLC | | | 4,500 | | | $ | 80,773 | | |
| Australia and New Zealand Banking Group, Ltd ADR | | | 1,000 | | | | 111,650 | | |
| Banco Bilbao Vizcaya Argentaria SA ADR | | | 6,000 | | | | 145,200 | | |
| Banco Santander Central Hispano SA ADR | | | 13,000 | | | | 222,560 | | |
| Bank of Ireland | | | 4,000 | | | | 80,092 | | |
| Barclays PLC ADR | | | 5,000 | | | | 271,550 | | |
| BNP Paribas SA | | | 1,200 | | | | 131,797 | | |
| Commerzbank AG ADR | | | 1,160 | | | | 41,071 | | |
| Danske Bank A/S | | | 2,700 | | | | 113,089 | | |
| DBS Group Holdings, Ltd. ADR | | | 3,000 | | | | 157,210 | | |
| Grupo Financiero Banorte SA de C.V. | | | 26,000 | | | | 94,226 | | |
| HBOS PLC | | | 4,000 | | | | 82,854 | | |
| HSBC Holdings PLC ADR | | | 2,200 | | | | 210,034 | | |
| Mitsubishi UFJ Financial Group, Inc. ADR | | | 17,000 | | | | 216,750 | | |
| Security | | Shares | | Value | |
| Commercial Banks (continued) | |
| Societe Generale | | | 700 | | | $ | 116,214 | | |
| | | $ | 2,075,070 | | |
| Communications Equipment — 1.3% | |
| Nokia Oyj ADR | | | 7,200 | | | $ | 143,136 | | |
| | | $ | 143,136 | | |
| Construction & Engineering — 1.0% | |
| Vinci SA | | | 1,000 | | | $ | 112,662 | | |
| | | $ | 112,662 | | |
| Consumer Finance — 1.8% | |
| Orix Corp. ADR | | | 1,400 | | | $ | 197,540 | | |
| | | $ | 197,540 | | |
| Diversified Financial Services — 3.3% | |
| Fortis | | | 2,200 | | | $ | 92,184 | | |
| ING Groep NV ADR | | | 6,000 | | | | 265,980 | | |
| | | $ | 358,164 | | |
| Diversified Telecommunication Services — 3.3% | |
| BT Group PLC ADR | | | 5,500 | | | $ | 294,360 | | |
| TeliaSonera AB | | | 9,000 | | | | 66,677 | | |
| | | $ | 361,037 | | |
| Electric Utilities — 5.3% | |
| Endesa SA ADR | | | 5,900 | | | $ | 258,715 | | |
| Enel SPA ADR | | | 3,400 | | | | 162,928 | | |
| Scottish and Southern Energy PLC | | | 6,200 | | | | 155,519 | | |
| | | $ | 577,162 | | |
| Energy Equipment & Services — 3.2% | |
| Acergy SA ADR(1) | | | 13,600 | | | $ | 246,840 | | |
| Tenaris SA ADR | | | 2,600 | | | | 100,334 | | |
| | | $ | 347,174 | | |
| Food & Staples Retailing — 2.5% | |
| AEON Co., Ltd. ADR | | | 8,400 | | | $ | 197,534 | | |
| Controladora Comercial Mexicana SA de C.V. | | | 35,000 | | | | 71,097 | | |
| | | $ | 268,631 | | |
See notes to financial statements
16
International Equity Portfolio as of October 31, 2006
PORTFOLIO OF INVESTMENTS CONT'D
| Security | | Shares | | Value | |
| Food Products — 2.0% | |
| Nestle SA ADR | | | 2,500 | | | $ | 213,551 | | |
| | | $ | 213,551 | | |
| Household Durables — 1.5% | |
| Sekisui House, Ltd. ADR | | | 10,000 | | | $ | 157,825 | | |
| | | $ | 157,825 | | |
| Industrial Conglomerates — 1.7% | |
| Keppel Corp., Ltd. ADR | | | 9,000 | | | $ | 182,641 | | |
| | | $ | 182,641 | | |
| Insurance — 4.4% | |
| Aviva PLC | | | 5,500 | | | $ | 81,229 | | |
| AXA SA ADR | | | 6,200 | | | | 236,344 | | |
| Muenchener Rueckversicherungs-Gesellschaft AG | | | 1,000 | | | | 162,635 | | |
| | | $ | 480,208 | | |
| Machinery — 1.5% | |
| AB SKF ADR | | | 3,500 | | | $ | 56,343 | | |
| Komatsu, Ltd. ADR | | | 785 | | | | 56,552 | | |
| Vallourec SA | | | 200 | | | | 49,716 | | |
| | | $ | 162,611 | | |
| Medical Products — 1.0% | |
| Synthes, Inc. | | | 950 | | | $ | 107,727 | | |
| | | $ | 107,727 | | |
| Metals & Mining — 3.9% | |
| Anglo American PLC ADR | | | 4,200 | | | $ | 95,256 | | |
| Companhia Vale do Rio Doce ADR | | | 4,900 | | | | 106,428 | | |
| Rio Tinto PLC ADR | | | 1,000 | | | | 221,390 | | |
| | | $ | 423,074 | | |
| Multi-Utilities — 2.5% | |
| RWE AG ADR | | | 2,800 | | | $ | 275,969 | | |
| | | $ | 275,969 | | |
| Office Electronics — 2.4% | |
| Canon, Inc. ADR | | | 4,800 | | | $ | 256,272 | | |
| | | $ | 256,272 | | |
| Security | | Shares | | Value | |
| Oil, Gas & Consumable Fuels — 6.0% | |
| EnCana Corp. | | | 1,300 | | | $ | 61,737 | | |
| ENI SPA ADR | | | 900 | | | | 54,639 | | |
| Norsk Hydro ASA ADR | | | 3,000 | | | | 69,450 | | |
| Petroleo Brasileiro SA ADR | | | 2,100 | | | | 170,016 | | |
| Total SA ADR | | | 4,400 | | | | 299,816 | | |
| | | $ | 655,658 | | |
| Pharmaceuticals — 5.2% | |
| Novartis AG ADR | | | 3,900 | | | $ | 236,847 | | |
| Roche Holding AG ADR | | | 3,200 | | | | 280,034 | | |
| Takeda Pharmaceutical Co., Ltd. | | | 800 | | | | 51,273 | | |
| | | $ | 568,154 | | |
| Real Estate Management & Development — 0.8% | |
| Sun Hung Kai Properties, Ltd. ADR | | | 8,000 | | | $ | 87,452 | | |
| | | $ | 87,452 | | |
| Road & Rail — 1.0% | |
| Canadian Pacific Railway, Ltd. | | | 1,900 | | | $ | 107,331 | | |
| | | $ | 107,331 | | |
| Software — 0.6% | |
| UbiSoft Entertainment SA(1) | | | 1,100 | | | $ | 67,825 | | |
| | | $ | 67,825 | | |
| Tobacco — 3.0% | |
| British American Tobacco PLC ADR | | | 2,000 | | | $ | 110,000 | | |
| Japan Tobacco, Inc. | | | 50 | | | | 217,251 | | |
| | | $ | 327,251 | | |
| Trading Companies & Distributors — 1.1% | |
| Mitsubishi Corp. ADR | | | 3,100 | | | $ | 119,602 | | |
| | | $ | 119,602 | | |
| Wireless Telecommunication Services — 2.4% | |
| China Mobile, Ltd. ADR | | | 2,400 | | | $ | 97,872 | | |
| Philippine Long Distance Telephone Co. ADR | | | 3,400 | | | | 161,874 | | |
| | | $ | 259,746 | | |
Total Common Stocks
(identified cost $10,216,636) | | $ | 10,482,075 | | |
See notes to financial statements
17
International Equity Portfolio as of October 31, 2006
PORTFOLIO OF INVESTMENTS CONT'D
| Closed End Funds — 0.4% | |
| Security | | Shares | | Value | |
| Central Europe and Russia Fund, Inc. | | | 880 | | | $ | 43,947 | | |
| | | $ | 43,947 | | |
Total Closed End Funds
(identified cost $42,883) | | $ | 43,947 | | |
| Short-Term Investments — 3.8% | |
| Security | | Principal
Amount
(000's omitted) | | Value | |
| Societe Generale Time Deposit, 5.31%, 11/1/06 | | $ | 417 | | | $ | 417,000 | | |
Total Short-Term Investments
(at amortized cost, $417,000) | | $ | 417,000 | | |
Total Investments — 100.6%
(identified cost $10,676,519) | | $ | 10,943,022 | | |
| Other Assets, Less Liabilities — (0.6)% | | $ | (69,521 | ) | |
| Net Assets — 100.0% | | $ | 10,873,501 | | |
ADR - American Depository Receipt
(1) Non-income producing security.
| Country Concentration of Portfolio | |
| Country | | Percentage
of Net Assets | | Value | |
| Japan | | | 16.7 | % | | $ | 1,819,515 | | |
| United Kingdom | | | 15.5 | | | | 1,686,026 | | |
| France | | | 10.4 | | | | 1,128,354 | | |
| Switzerland | | | 10.0 | | | | 1,083,503 | | |
| Germany | | | 6.6 | | | | 724,236 | | |
| Spain | | | 5.8 | | | | 626,475 | | |
| Brazil | | | 3.4 | | | | 369,894 | | |
| Mexico | | | 3.3 | | | | 358,703 | | |
| Netherlands | | | 3.2 | | | | 344,143 | | |
| Singapore | | | 3.2 | | | | 339,852 | | |
| Norway | | | 2.9 | | | | 316,290 | | |
| Italy | | | 2.0 | | | | 217,567 | | |
| Belgium | | | 1.8 | | | | 199,158 | | |
| Canada | | | 1.6 | | | | 169,067 | | |
| Philippines | | | 1.5 | | | | 161,874 | | |
| Ireland | | | 1.5 | | | | 160,865 | | |
| Finland | | | 1.3 | | | | 143,136 | | |
| Sweden | | | 1.1 | | | | 123,020 | | |
| Denmark | | | 1.0 | | | | 113,089 | | |
| Australia | | | 1.0 | | | | 111,650 | | |
| Argentina | | | 0.9 | | | | 100,334 | | |
| China | | | 0.9 | | | | 97,872 | | |
| Hong Kong | | | 0.8 | | | | 87,452 | | |
| Russia | | | 0.4 | | | | 43,947 | | |
| Total Common Stocks and Closed End Funds | | | 96.8 | % | | $ | 10,526,022 | | |
| Short-Term Investments | | | 3.8 | % | | $ | 417,000 | | |
See notes to financial statements
18
International Equity Portfolio as of October 31, 2006
FINANCIAL STATEMENTS
Statement of Assets and Liabilities
As of October 31, 2006
| Assets | |
| Investments, at value (identified cost, $10,676,519) | | $ | 10,943,022 | | |
| Cash | | | 343 | | |
| Receivable from the investment adviser and the sub-adviser | | | 34,726 | | |
| Dividends and interest receivable | | | 2,137 | | |
| Tax reclaim receivable | | | 65 | | |
| Total assets | | $ | 10,980,293 | | |
| Liabilities | |
| Payable for investments purchased | | $ | 66,844 | | |
| Accrued expenses | | | 39,948 | | |
| Total liabilities | | $ | 106,792 | | |
| Net Assets applicable to investors' interest in Portfolio | | $ | 10,873,501 | | |
| Sources of Net Assets | |
| Net proceeds from capital contributions and withdrawals | | $ | 10,606,998 | | |
| Net unrealized appreciation (computed on the basis of identified cost) | | | 266,503 | | |
| Total | | $ | 10,873,501 | | |
Statement of Operations
For the Period Ended
October 31, 2006(1)
| Investment Income | |
| Dividends (net of foreign taxes, $520) | | $ | 11,168 | | |
| Interest | | | 6,712 | | |
| Total investment income | | $ | 17,880 | | |
| Expenses | |
| Investment adviser fee | | $ | 8,177 | | |
| Legal and accounting services | | | 35,335 | | |
| Custodian fee | | | 5,282 | | |
| Organization costs | | | 4,000 | | |
| Miscellaneous | | | 504 | | |
| Total expenses | | $ | 53,298 | | |
Deduct —
Reduction of custodian fee | | $ | 59 | | |
| Reduction of investment adviser fee | | | 8,177 | | |
| Allocation of expenses to the investment adviser and the sub-adviser | | | 34,726 | | |
| Total expense reductions | | $ | 42,962 | | |
| Net expenses | | $ | 10,336 | | |
| Net investment income | | $ | 7,544 | | |
| Realized and Unrealized Gain (Loss) | |
Net realized gain (loss) —
Investment transactions (identified cost basis) | | $ | (7,928 | ) | |
| Foreign currency transactions | | | (4,664 | ) | |
| Net realized loss | | $ | (12,592 | ) | |
Change in unrealized appreciation (depreciation) —
Investments (identified cost basis) | | $ | 266,503 | | |
| Net change in unrealized appreciation (depreciation) | | $ | 266,503 | | |
| Net realized and unrealized gain | | $ | 253,911 | | |
| Net increase in net assets from operations | | $ | 261,455 | | |
(1) For the period from the commencement of investment operations, May 31, 2006, to October 31, 2006.
See notes to financial statements
19
International Equity Portfolio as of October 31, 2006
FINANCIAL STATEMENTS CONT'D
Statement of Changes in Net Assets
Increase (Decrease)
in Net Assets | | Period Ended
October 31, 2006(1) | |
From operations —
Net investment income | | $ | 7,544 | | |
Net realized loss from investments and foreign
currency transactions | | | (12,592 | ) | |
Net change in unrealized appreciation (depreciation) from
investments and foreign currency | | | 266,503 | | |
| Net increase in net assets from operations | | $ | 261,455 | | |
Capital transactions —
Contributions | | $ | 10,596,807 | | |
| Withdrawals | | | (84,771 | ) | |
| Net increase in net assets from capital transactions | | $ | 10,512,036 | | |
| Net increase in net assets | | $ | 10,773,491 | | |
| Net Assets | |
| At beginning of period | | $ | 100,010 | | |
| At end of period | | $ | 10,873,501 | | |
(1) For the period from the commencement of investment operations, May 31, 2006, to October 31, 2006.
See notes to financial statements
20
International Equity Portfolio as of October 31, 2006
FINANCIAL STATEMENTS CONT'D
Supplementary Data
| | | Period Ended
October 31, 2006(1) | |
| Ratios/Supplemental Data | |
| Ratios (As a percentage of average daily net assets): | |
| Expenses before custodian fee reduction(2) | | | 1.26 | %(3) | |
| Expenses after custodian fee reduction(2) | | | 1.25 | %(3) | |
| Net investment income | | | 0.92 | %(3) | |
| Portfolio Turnover | | | 1 | % | |
| Total Return | | | 6.60 | % | |
| Net assets, end of period (000's omitted) | | $ | 10,874 | | |
(1) For the period from the commencement of investment operations, May 31, 2006, to October 31, 2006.
(2) The investment adviser waived its investment advisory fee and subsidized certain operating expenses (equal to 5.21% of average daily net assets for the period ended October 31, 2006). A portion of the waiver and subsidy was borne by the sub-adviser.
(3) Annualized.
See notes to financial statements
21
International Equity Portfolio as of October 31, 2006
NOTES TO FINANCIAL STATEMENTS
1 Significant Accounting Policies
International Equity Portfolio (the Portfolio) is registered under the Investment Company Act of 1940, as amended, as a diversified open-end management investment company. The Portfolio, which was organized as a trust under the laws of the State of New York on February 13, 2006, seeks to achieve total return by investing in a diversified portfolio of foreign equity securities. The Declaration of Trust permits the Trustees to issue interests in the Portfolio. At October 31, 2006, the Eaton Vance International Equity Fund held a 30.1% interest in the Portfolio. In addition, four other investors owned a greater than 10% interest in the Portfolio (11.5%, 11.6%, 14.0%, and 14.0%, respectively, at October 31, 2006). The following is a summary of significant accounting policies consistently followed by the Portfolio in the preparation of its financial statements. The policies are in conformity with accounting principles generally accep ted in the United States of America.
A Investment Valuation — Securities listed on a U.S. securities exchange generally are valued at the last sale price on the day of valuation or, if no sales took place on such date, at the mean between the closing bid and asked prices therefore on the exchange where such securities are principally traded. Equity securities listed on the NASDAQ National Market System generally are valued at the official NASDAQ closing price. Unlisted or listed securities for which closing sales prices or closing quotations are not available are valued at the mean between the latest available bid and asked prices or, in the case of preferred equity securities that are not listed or traded in the over-the-counter market, by an independent pricing service. Exchange-traded options are valued a t the last sale price for the day of valuation as quoted on the principal exchange or board of trade on which the options are traded or, in the absence of sales on such date, at the mean between the latest bid and asked prices therefore. Futures positions on securities and currencies generally are valued at closing settlement prices. Short-term debt securities with a remaining maturity of 60 days or less are valued at amortized cost. If short-term debt securities were acquired with a remaining maturity of more than 60 days, they will be valued by a pricing service. Other fixed income and debt securities, including listed securities and securities for which price quotations are available, will normally be valued on the basis of valuations furnished by a pricing service. Foreign securities and currencies are valued in U.S. dollars, based on foreign currency exchange rate quotations supplied by an independent quotation service. The daily va luation of exchange-traded foreign securities generally is determined as of the close of trading on the principal exchange on which such securities trade. Events occurring after the close of trading on foreign exchanges may result in adjustments to the valuation of foreign securities to more accurately reflect their fair value as of the close of regular trading on the New York Stock Exchange. When valuing foreign equity securities that meet certain criteria, the Trustees have approved the use of a fair value service that values such securities to reflect market trading that occurs after the close of the applicable foreign markets of comparable securities or other instruments that have a strong correlation to the fair-valued securities. Investments held by the Portfolio for which valuations or market quotations are unavailable are valued at fair value using methods determined in good faith by or at the direction of the Trustees of the Portfolio considering relevant factors, data and information including the market value of freely tradable securities of the same class in the principal market on which such securities are normally traded.
B Income — Dividend income is recorded on the ex-dividend date for dividends received in cash and/or securities. However, if the ex-dividend date has passed, certain dividends from foreign securities are recorded as the Portfolio is informed of the ex-dividend date. Withholding taxes on foreign dividends and capital gains have been provided for in accordance with the Portfolio's understanding of the applicable countries' tax rules and rates. Interest income is recorded on the basis of interest accrued, adjusted for amortization of premium or accretion of discount.
C Federal Taxes — The Portfolio has elected to be treated as a partnership for federal tax purposes. No provision is made by the Portfolio for federal or state taxes on any taxable income of the Portfolio because each investor in the Portfolio is ultimately responsible for the payment of any taxes on its share of taxable income. Since at least one of the Portfolio's investors is a regulated investment company that invests all or substantially all of its assets in the Portfolio, the Portfolio normally must satisfy the applicable source of income and diversification requirements (under the Internal Revenue Code) in order for its investors to satisfy them. The Portfolio will allocate, at least annually among its investors, each investor's distributive share of the Portfolio' s net investment income, net realized capital gains, and any other items of income, gain, loss, deduction or credit.
22
International Equity Portfolio as of October 31, 2006
NOTES TO FINANCIAL STATEMENTS CONT'D
D Financial Futures Contracts — Upon entering a financial futures contract, the Portfolio is required to deposit either in cash or securities an amount (initial margin) equal to a certain percentage of the purchase price indicated in the financial futures contract. Subsequent payments are made or received by the Portfolio (margin maintenance) each day, dependent on daily fluctuations in the value of the underlying security, and are recorded for book purposes as unrealized gains or losses by the Portfolio. The Portfolio's investment in financial futures contracts is designed to hedge against anticipated future changes in price of current or anticipated Portfolio positions. Should prices move unexpectedly, the Portfolio may not achieve the anticipated benefits of the financ ial futures contracts and may realize a loss.
E Purchased Options — Upon the purchase of a call or put option, the premium paid by the Portfolio is included in the Statement of Assets and Liabilities as an investment. The amount of the investment is subsequently marked-to-market to reflect the current market value of the option purchased, in accordance with the Portfolio's policies on investment valuations discussed above. If an option which the Portfolio has purchased expires on the stipulated expiration date, the Portfolio will realize a loss in the amount of the cost of the option. If the Portfolio enters into a closing sale transaction, the Portfolio will realize a gain or loss, depending on whether the sales proceeds from the closing sale transaction are greater or less than the cost of the option. If the Portfo lio exercises a put option, it will realize a gain or loss from the sale of the underlying security, and the proceeds from such sale will be decreased by the premium originally paid. If the Portfolio exercises a call option, the cost of the security which the Portfolio purchases upon exercise will be increased by the premium originally paid.
F Foreign Currency Translation — Investment valuations, other assets, and liabilities initially expressed in foreign currencies are converted each business day into U.S. dollars based upon current exchange rates. Purchases and sales of foreign investment securities and income and expenses are converted into U.S. dollars based upon currency exchange rates prevailing on the respective dates of such transactions. Recognized gains or losses on investment transactions attributable to changes in foreign currency exchange rates are recorded for financial statement purposes as net realized gains and losses on investments. That portion of unrealized gains and losses on investments that results from fluctuations in foreign currency exchange rates is not separately disclosed.
G Forward Foreign Currency Exchange Contracts — The Portfolio may enter into forward foreign currency exchange contracts for the purchase or sale of a specific foreign currency at a fixed price on a future date. Risks may arise upon entering these contracts from the potential inability of counterparties to meet the terms of their contracts and from movements in the value of a foreign currency relative to the U.S. dollar. The Portfolio will enter into forward contracts for hedging purposes as well as non-hedging purposes. The forward foreign currency exchange contracts are adjusted by the daily exchange rate of the underlying currency and any gains or losses are recorded for financial statement purposes as unrealized until such time as the contracts have been closed or off set.
H Expense Reduction — Investors Bank & Trust Company (IBT) serves as custodian to the Portfolio. Pursuant to the custodian agreement, IBT receives a fee reduced by credits which are determined based on the average daily cash balance the Portfolio maintains with IBT. All credit balances used to reduce the Portfolio's custodian fees are reported as a reduction of expenses in the Statement of Operations.
I Use of Estimates — The preparation of the financial statements in conformity with accounting principles generally accepted in the United States of America requires management to make estimates and assumptions that affect the reported amounts of assets and liabilities at the date of the financial statements and the reported amounts of income and expense during the reporting period. Actual results could differ from those estimates.
J Indemnifications — Under the Portfolio's organizational documents, its officers and Trustees may be indemnified against certain liabilities and expenses arising out of the performance of their duties to the Portfolio. Interestholders in the Portfolio are jointly and severally liable for the liabilities and obligations of the Portfolio in the event that the Portfolio fails to satisfy such liabilities and obligations; provided, however, that, to the extent assets are available in the Portfolio, the Portfolio may, under certain circumstances, indemnify interestholders from and against any claim or liability to which such holder may become subject by reason of being or having been an interestholder in the Portfolio. Additionally, in the normal course of business, the Portfo lio enters into agreements with service providers that may contain indemnification clauses. The Portfolio's maximum exposure under these arrangements is
23
International Equity Portfolio as of October 31, 2006
NOTES TO FINANCIAL STATEMENTS CONT'D
unknown as this would involve future claims that may be made against the Portfolio that have not yet occurred.
K Other — Investment transactions are accounted for on the date the securities are purchased or sold. Realized gains and losses on securities sold are determined on the basis of identified cost.
L Organization Costs — Costs incurred by the Portfolio in connection with its organization have been expensed.
2 Investment Adviser Fee and Other Transactions with Affiliates
The investment adviser fee is earned by Boston Management and Research (BMR), a wholly-owned subsidiary of Eaton Vance Management (EVM), as compensation for management and investment advisory services rendered to the Portfolio. BMR receives a monthly advisory fee in the amount of 1.00% annually of the average daily net assets of the Portfolio up to $500 million and at reduced rates as daily net assets exceed that level. For the period from the commencement of investment operations, May 31, 2006 to October 31, 2006, the advisory fee amounted to $8,177, all of which was waived. Pursuant to a sub-advisory agreement, BMR has delegated the investment management of the Portfolio to Eagle Global Advisors, L.L.C. ("Eagle"). BMR pays Eagle a monthly sub-advisory fee equal to 0.50% annually of the average daily net assets of the Portfolio up to $500 million, and at reduced rates as daily net assets exceed that level. Pursuant to an expens e reimbursement, BMR and Eagle were allocated $17,363 and $17,363, respectively, of the Portfolio's operating expenses for the period from the commencement of investment operations, May 31, 2006 to October 31, 2006. Except for Trustees of the Portfolio who are not members of EVM's or BMR's organization, officers and Trustees receive remuneration for their services to the Portfolio out of the investment adviser and sub-adviser fees. Trustees of the Portfolio that are not affiliated with BMR may elect to defer receipt of all or a percentage of their annual fees in accordance with the terms of the Trustees Deferred Compensation Plan. For the period from the commencement of investment operations, May 31, 2006 to October 31, 2006, no significant amounts have been deferred. Certain officers and Trustees of the Portfolio are officers of the above organizations.
3 Investment Transactions
Purchases and sales of investments, other than short-term obligations, aggregated $10,312,291 and $44,844, respectively, for the period from the commencement of investment operations, May 31, 2006, to October 31, 2006.
4 Federal Income Tax Basis of Investments
The cost and unrealized appreciation (depreciation) in value of the investments owned at October 31, 2006, as determined on a federal income tax basis, were as follows:
| Aggregate cost | | $ | 10,681,644 | | |
| Gross unrealized appreciation | | $ | 292,134 | | |
| Gross unrealized depreciation | | | (30,756 | ) | |
| Net unrealized appreciation | | $ | 261,378 | | |
5 Financial Instruments
The Portfolio may trade in financial instruments with off-balance sheet risk in the normal course of its investing activities to assist in managing exposure to various market risks. These financial instruments include written options, forward foreign currency contracts and financial futures contracts and may involve, to a varying degree, elements of risk in excess of the amounts recognized for financial statement purposes. The notional or contractual amounts of these instruments represent the investment the Portfolio has in particular classes of financial instruments and does not necessarily represent the amounts potentially subject to risk. The measurement of the risks associated with these instruments is meaningful only when all related and offsetting transactions are considered. The Portfolio did not have any open financial instruments at October 31, 2006.
6 Line of Credit
The Portfolio participates with other portfolios and funds managed by BMR and EVM and its affiliates in a $150 million unsecured line of credit agreement with a group of banks. Borrowings will be made by the Portfolio solely to facilitate the handling of unusual and/or unanticipated short-term cash requirements. Interest is charged to each participating portfolio or fund based on its borrowings at an amount above either the Eurodollar rate or federal funds rate. In addition, a fee computed at an annual rate of 0.10% on the daily unused portion of the line of credit is allocated among the participating
24
International Equity Portfolio as of October 31, 2006
NOTES TO FINANCIAL STATEMENTS CONT'D
portfolios and funds at the end of each quarter. The Portfolio did not have any significant borrowings or allocated fees during the period from the commencement of investment operations, May 31, 2006, to October 31, 2006.
7 Risks Associated with Foreign Investments
Investing in securities issued by companies whose principal business activities are outside the United States may involve significant risks not present in domestic investments. For example, there is generally less publicly available information about foreign companies, particularly those not subject to the disclosure and reporting requirements of the U.S. securities laws. Foreign issuers are generally not bound by uniform accounting, auditing, and financial reporting requirements and standards of practice comparable to those applicable to domestic issuers. Investments in foreign securities also involve the risk of possible adverse changes in investment or exchange control regulations, expropriation or confiscatory taxation, limitation on the removal of funds or other assets of the Portfolio, political or financial instability or diplomatic and other developments which could affect such investments. Foreign stock markets, while g rowing in volume and sophistication, are generally not as developed as those in the United States, and securities of some foreign issuers (particularly those located in developing countries) may be less liquid and more volatile than securities of comparable U.S. companies. In general, there is less overall governmental supervision and regulation of foreign securities markets, broker-dealers and issuers than in the United States.
8 Recently Issued Accounting Pronouncements
In June 2006, the Financial Accounting Standards Board (FASB) issued FASB Interpretation No. 48, (FIN 48) "Accounting for Uncertainty in Income Taxes – an interpretation of FASB Statement No. 109". FIN 48 clarifies the accounting for uncertainty in income taxes recognized in accordance with FASB Statement No. 109, "Accounting for Income Taxes." This interpretation prescribes a recognition threshold and measurement attribute for the financial statement recognition and measurement of a tax position taken or expected to be taken in a tax return. It also provides guidance on de-recognition, classification, interest and penalties, accounting in interim periods, disclosure and transition. FIN 48 is effective for fiscal years beginning after December 15, 2006. Management is currently evaluating the impact of applying the various provisions of FIN 48.
In September 2006, the FASB issued Statement of Financial Accounting Standards No. 157, ("FAS 157") "Fair Value Measurements". FAS 157 defines fair value, establishes a framework for measuring fair value in accordance with generally accepted accounting principles and expands disclosure about fair value measurements. FAS 157 is effective for fiscal years beginning after November 15, 2007. Management is currently evaluating the impact the adoption of FAS 157 will have on the Portfolio's financial statement disclosures.
25
International Equity Portfolio as of October 31, 2006
REPORT OF INDEPENDENT REGISTERED PUBLIC ACCOUNTING FIRM
To the Trustees and Investors of International Equity Portfolio:
We have audited the accompanying statement of assets and liabilities of International Equity Portfolio (the Portfolio), including the portfolio of investments, as of October 31, 2006, and the related statements of operations, changes in net assets and the supplementary data for the period from the start of business, May 31, 2006, to October 31, 2006. These financial statements and supplementary data are the responsibility of the Portfolio's management. Our responsibility is to express an opinion on these financial statements and supplementary data based on our audit.
We conducted our audit in accordance with the standards of the Public Company Accounting Oversight Board (United States). Those standards require that we plan and perform the audit to obtain reasonable assurance about whether the financial statements and supplementary data are free of material misstatement. The Portfolio is not required to have, nor were we engaged to perform, an audit of its internal control over financial reporting. Our audit included consideration of internal control over financial reporting as a basis for designing audit procedures that are appropriate in the circumstances, but not for the purpose of expressing an opinion on the effectiveness of the Portfolio's internal control over financial reporting. Accordingly, we express no such opinion. An audit also includes examining, on a test basis, evidence supporting the amounts and disclosures in the financial statements, assessing the accounting principles use d and significant estimates made by management, as well as evaluating the overall financial statement presentation. Our procedures included confirmation of securities owned as of October 31, 2006 by correspondence with the custodian and brokers; where replies were not received from brokers, we performed other auditing procedures. We believe that our audit provides a reasonable basis for our opinion.
In our opinion, the financial statements and supplementary data referred to above present fairly, in all material respects, the financial position of the International Equity Portfolio as of October 31, 2006 and the results of its operations, the changes in its net assets, and the supplementary data for the period from the start of business, May 31, 2006 to October 31, 2006, in conformity with accounting principles generally accepted in the United States of America.
DELOITTE & TOUCHE LLP
Boston, Massachusetts
December 15, 2006
26
International Equity Portfolio
CONSIDERATIONS RELATING TO APPROVAL OF ADVISORY AND SUB-ADVISORY AGREEMENTS
In considering the approval of the investment advisory agreement between International Equity Portfolio (the "Portfolio") and Boston Management and Research ("BMR" or the "investment adviser"), the Special Committee considered information that had been provided throughout the year at regular Board meetings, as well as information furnished to the Special Committee for a series of meetings held in February and March in preparation for a Board meeting held on March 21, 2005 to specifically consider the renewal of the investment advisory agreements of other Eaton Vance Funds. Such information included, among other things, the following:
• The economic outlook and the general investment outlook in the relevant investment markets;
• Eaton Vance Management's ("EVM") and Eagle Global Adviser's ("Eagle") results and financial condition and the overall organization of the investment adviser and sub-adviser;
• The procedures and processes used to determine the fair value of Fund assets and actions taken to monitor and test the effectiveness of such procedures and processes;
• The allocation of brokerage and the benefits received by the investment adviser as the result of brokerage allocation;
• EVM's management of the relationship with the custodian, subcustodians and fund accountants;
• The resources devoted to EVM's and Eagle's compliance efforts undertaken on behalf of the funds they manage and the record of compliance with the investment policies and restrictions and with policies on personal securities transactions;
• The quality, nature, cost and character of the administrative and other non-investment management services provided by EVM and its affiliates; and
• The terms of the investment advisory and sub-advisory agreements and the reasonableness and appropriateness of the particular fee paid by the Portfolio for the services described therein.
The Special Committee also considered the nature, extent and quality of the management services to be provided by the investment adviser and sub-adviser. In so doing, the Special Committee considered their management capabilities with respect to the types of investments held by the Portfolio, including information relating to the education, experience and number of investment professionals and other personnel who provide services under the investment advisory and sub-advisory agreements. The Special Committee also took into account the time and attention to be devoted by senior management to the Portfolio and the other funds in the complex. The Special Committee evaluated the level of skill required to manage the Portfolio and concluded that the human resources available at the investment adviser and sub-adviser were appropriate to fulfill effectively its duties on behalf of the Portfolio.
With respect to its review of investment advisory and sub-advisory fees, the Special Committee concluded that the fees to be paid by the Portfolio are within the range of those paid by comparable funds within the mutual fund industry. In reviewing the information regarding the estimated expense ratio of the Fund, the Special Committee concluded that such expense ratio is within a range that is competitive with comparable funds.
In addition to the factors mentioned above, the Special Committee reviewed the level of the investment adviser's and sub-adviser's expected profits in providing investment management for the Portfolio and for all Eaton Vance funds as a group. The Special Committee also considered the soft dollar reimbursement program pursuant to which the Portfolio may receive reimbursement payments in respect of third party research services obtained by the investment adviser or sub-adviser as a result of soft dollar credits generated through trading on behalf of the Portfolio. The Special Committee also reviewed the benefits to EVM and its affiliates in providing administration services for the Fund and for all Eaton Vance funds as a group. In addition, the Special Committee considered the fiduciary duty assumed by the investment adviser and sub-adviser in connection with the services rendered to the Portfolio and the business reputation of th e investment adviser, sub-adviser and their financial resources. The Special Committee concluded that in light of the services to be rendered, the profits to be realized by the investment adviser and sub-adviser are not unreasonable. The Special Committee also considered the extent to which the investment adviser and sub-adviser are expected to realize benefits from economies of scale in managing the Portfolio, and concluded that the fee breakpoints which are in place will allow for an equitable sharing of such benefits, when realized, with shareholders of the Fund.
The Special Committee did not consider any single factor as controlling in determining whether or not to approve the investment advisory and sub-advisory agreements. Nor are the items described herein all the matters considered by the Special Committee. In assessing the information provided by EVM and its affiliates, the Special Committee also took into consideration the benefits to shareholders of investing in a fund that is part of a large family of funds which provides a large variety of shareholder services.
Based on its consideration of the foregoing factors and conclusions, and such other factors and conclusions as it deemed relevant, and assisted by independent counsel, the Special Committee concluded that the approval of the investment advisory and sub-advisory agreements, including the fee structure, is in the interests of shareholders.
27
Eaton Vance International Equity Fund
MANAGEMENT AND ORGANIZATION
Fund Management. The Trustees of Eaton Vance Mutual Funds Trust (the Trust) and International Equity Portfolio (the Portfolio) are responsible for the overall management and supervision of the Trust's and Portfolio's affairs. The Trustees and officers of the Trust and the Portfolio are listed below. Except as indicated, each individual has held the office shown or other offices in the same company for the last five years. Trustees and officers of the Trust and the Portfolio hold indefinite terms of office. The "noninterested Trustees" consist of those Trustees who are not "interested persons" of the Trust and the Portfolio, as that term is defined under the 1940 Act. The business address of each Trustee and officer is The Eaton Vance Building, 255 State Street, Boston, Massachusetts 02109. As used below, "EVC" refers to Eaton Vance Corp., "EV" refers to Eato n Vance, Inc., "EVM" refers to Eaton Vance Management, "BMR" refers to Boston Management and Research, "Eagle" refers to Eagle Global Advisors, L.L.C., "Parametric" refers to Parametric Portfolio Associates and "EVD" refers to Eaton Vance Distributors, Inc. EVC and EV are the corporate parent and trustee, respectively, of EVM and BMR. EVD is the Fund's principal underwriter, the Portfolio's placement agent and a wholly-owned subsidiary of EVM. Each officer affiliated with Eaton Vance may hold a position with other Eaton Vance affiliates that is comparable to his or her position with EVM listed below.
Name and
Date of Birth | | Position(s)
with the
Trust and
the Portfolio | | Term of
Office and
Length of
Service | | Principal Occupation(s)
During Past Five Years | | Number of Portfolios
in Fund Complex
Overseen By
Trustee(1) | | Other Directorships Held | |
| Interested Trustee | | | | | | | | | | | | | |
|
| James B. Hawkes 11/9/41 | | Trustee | | Trustee of the Trust since 1991 and of the Portfolio since 2006 | | Chairman and Chief Executive Officer of EVC, BMR, EVM and EV; Director of EV; Vice President and Director of EVD. Trustee and/or officer of 170 registered investment companies in the Eaton Vance Fund Complex. Mr. Hawkes is an interested person because of his positions with BMR, EVM, EVC and EV, which are affiliates of the Trust and the Portfolio. | | | 170 | | | Director of EVC | |
|
| Noninterested Trustee(s) | | | | | | | | | | | | | |
|
| Benjamin C. Esty 1/26/63 | | Trustee | | Trustee of the Trust since 2005 and of the Portfolio since 2006 | | Roy and Elizabeth Simmons Professor of Business Administration, Harvard University Graduate School of Business Administration (since 2003). Formerly, Associate Professor, Harvard University Graduate School of Business Administration (2000-2003). | | | 170 | | | None | |
|
| Samuel L. Hayes, III 2/23/35 | | Trustee and Chairman of the Board | | Trustee of the Trust since 1986; of the Portfolio since 2006 and Chairman of the Board since 2005 | | Jacob H. Schiff Professor of Investment Banking Emeritus, Harvard University Graduate School of Business Administration. Director of Yakima Products, Inc. (manufacturer of automotive accessories) (since 2001) and Director of Telect, Inc. (telecommunications services company). | | | 170 | | | Director of Tiffany & Co. (specialty retailer) | |
|
| William H. Park 9/19/47 | | Trustee | | Trustee of the Trust since 2003 and of the Portfolio since 2006 | | Vice Chairman, Commercial Industrial Finance Corp. (specialty finance company) (since 2006). Formerly, President and Chief Executive Officer, Prizm Capital Management, LLC (investment management firm) (2002-2005). Formerly, Executive Vice President and Chief Financial Officer, United Asset Management Corporation (a holding company owning institutional investment management firms) (1982-2001). | | | 170 | | | None | |
|
| Ronald A. Pearlman 7/10/40 | | Trustee | | Trustee of the Trust since 2003 and of the Portfolio since 2006 | | Professor of Law, Georgetown University Law Center. | | | 170 | | | None | |
|
28
Eaton Vance International Equity Fund
MANAGEMENT AND ORGANIZATION CONT'D
Name and
Date of Birth | | Position(s)
with the
Trust and
the Portfolio | | Term of
Office and
Length of
Service | | Principal Occupation(s)
During Past Five Years | | Number of Portfolios
in Fund Complex
Overseen By
Trustee(1) | | Other Directorships Held | |
| Noninterested Trustee(s) (continued) | | | | | | | | | | | | | |
|
| Norton H. Reamer 9/21/35 | | Trustee | | Trustee of the Trust since 1986 and of the Portfolio since 2006 | | President, Chief Executive Officer and a Director of Asset Management Finance Corp. (a specialty finance company serving the investment management industry) (since October 2003). President, Unicorn Corporation (an investment and financial advisory services company) (since September 2000). Formerly, Chairman and Chief Operating Officer, Hellman, Jordan Management Co., Inc. (an investment management company) (2000-2003). Formerly, Advisory Director of Berkshire Capital Corporation (investment banking firm) (2002-2003). | | | 170 | | | None | |
|
| Lynn A. Stout 9/14/57 | | Trustee | | Trustee of the Trust since 1998 and of the Portfolio since 2006 | | Professor of Law, University of California at Los Angeles School of Law. | | | 170 | | | None | |
|
| Ralph F. Verni 1/26/43 | | Trustee | | Trustee of the Trust since 2005 and of the Portfolio since 2006 | | Consultant and private investor. | | | 170 | | | None | |
|
| Principal Officers who are not Trustees | | | | | | | | | | | | | |
|
Name and
Date of Birth | | Position(s)
with the
Trust and
the Portfolio | | Term of
Office and
Length of
Service | | Principal Occupation(s)
During Past Five Years | |
| Thomas E. Faust Jr. 5/31/58 | | President of the Trust | | Since 2002 | | President of EVC, EVM, BMR and EV and Director of EVC. Chief Investment Officer of EVC, EVM and BMR. Officer of 71 registered investment companies and 5 private investment companies managed by EVM or BMR. | |
|
| William H. Ahern, Jr. 7/28/59 | | Vice President of the Trust | | Since 1995 | | Vice President of EVM and BMR. Officer of 71 registered investment companies managed by EVM or BMR. | |
|
| Edward R. Allen, III 7/5/60 | | Vice President of the Portfolio | | Since 2006 | | Partner and Chairman of the International Investment Committee of Eagle. Officer of 3 registered investment companies managed by EVM or BMR. | |
|
| Cynthia J. Clemson 3/2/63 | | Vice President of the Trust | | Since 2005 | | Vice President of EVM and BMR. Officer of 86 registered investment companies managed by EVM or BMR | |
|
| Thomas N. Hunt, III 11/6/64 | | Vice President of the Portfolio | | Since 2006 | | Partner of Eagle. Officer of 3 registered investment companies managed by EVM or BMR. | |
|
| Aamer Khan 6/7/60 | | Vice President of the Trust | | Since 2005 | | Vice President of EVM and BMR. Officer of 29 registered investment companies managed by EVM or BMR. | |
|
| Thomas H. Luster 4/8/62 | | Vice President of the Trust | | Since 2006 | | Vice President of EVM and BMR. Officer of 45 registered investment companies managed by EVM or BMR. | |
|
| Michael R. Mach 7/15/47 | | Vice President of the Trust | | Since 1999 | | Vice President of EVM and BMR. Officer of 51 registered investment companies managed by EVM or BMR. | |
|
| Robert B. MacIntosh 1/22/57 | | Vice President of the Trust | | Since 1998 | | Vice President of EVM and BMR. Officer of 86 registered investment companies managed by EVM and BMR. | |
|
29
Eaton Vance International Equity Fund
MANAGEMENT AND ORGANIZATION CONT'D
| Principal Officers who are not Trustees (continued) | |
|
Name and
Date of Birth | | Position(s)
with the
Trust and
the Portfolio | | Term of
Office and
Length of
Service | | Principal Occupation(s)
During Past Five Years | |
| Cliff Quisenberry, Jr. 1/1/65 | | Vice President of the Trust | | Since 2006 | | Vice President and Director of Research and Product Development of Parametric. Officer of 30 registered investment companies managed by EVM or BMR. | |
|
| Duncan W. Richardson 10/26/57 | | Vice President of the Trust and President of the Portfolio | | Vice President of the Trust since 2001 and President of the Portfolio since 2006 | | Executive Vice President and Chief Equity Investment Officer of EVC, EVM and BMR. Officer 71 registered investment companies managed by EVM or BMR. | |
|
| Walter A. Row, III 7/20/57 | | Vice President of the Trust | | Since 2001 | | Director of Equity Research and a Vice President of EVM and BMR. Officer of 33 registered investment companies managed by EVM or BMR. | |
|
| Judith A. Saryan 8/21/54 | | Vice President of the Trust | | Since 2003 | | Vice President of EVM and BMR. Officer of 50 registered investment companies managed by EVM or BMR. | |
|
| Susan Schiff 3/13/61 | | Vice President of the Trust | | Since 2002 | | Vice President of EVM and BMR. Officer of 30 registered investment companies managed by EVM or BMR. | |
|
| Kristin S. Anagnost 6/12/65 | | Treasurer of the Portfolio | | Since 2006 | | Assistant Vice President of EVM and BMR. Officer of 95 registered investment companies managed by EVM or BMR. | |
|
| Barbara E. Campbell 6/19/57 | | Treasurer of the Trust | | Since 2005(2) | | Vice President of EVM and BMR. Officer of 170 registered investment companies managed by EVM or BMR. | |
|
| Alan R. Dynner 10/10/40 | | Secretary | | Secretary of the Trust since 1997 and of the Portfolio since 2006 | | Vice President, Secretary and Chief Legal Officer of BMR, EVM, EVD, EV and EVC. Officer of 170 registered investment companies managed by EVM or BMR. | |
|
| Paul M. O'Neil 7/11/53 | | Chief Compliance Officer | | Chief Compliance Officer of the Trust since 2004 and of the Portfolio since 2006 | | Vice President of EVM and BMR. Officer of 170 registered investment companies managed by EVM or BMR. | |
|
(1) Includes both master and feeder funds in a master-feeder structure.
(2) Prior to 2005, Ms. Campbell served as Assistant Treasurer of the Trust since 1995.
The SAI for the Fund includes additional information about the Trustees and officers of the Fund and the Portfolio and can be obtained without charge by calling 1-800-225-6265.
30
This Page Intentionally Left Blank
This Page Intentionally Left Blank
Investment Adviser of International Equity Portfolio
Boston Management and Research
The Eaton Vance Building
255 State Street
Boston, MA 02109
Sub-Adviser of International Equity Portfolio
Eagle Global Advisors, L.L.C.
5847 San Felipe, Suite 930
Houston, TX 77057
Administrator of Eaton Vance International Equity Fund
Eaton Vance Management
The Eaton Vance Building
255 State Street
Boston, MA 02109
Principal Underwriter
Eaton Vance Distributors, Inc.
The Eaton Vance Building
255 State Street
Boston, MA 02109
(617) 482-8260
Custodian
Investors Bank & Trust Company
200 Clarendon Street
Boston, MA 02116
Transfer Agent
PFPC Inc.
Attn: Eaton Vance Funds
P.O. Box 9653
Providence, RI 02940-9653
(800) 262-1122
Independent Registered Public Accounting Firm
Deloitte & Touche LLP
200 Berkeley Street
Boston, MA 02116-5022
Eaton Vance International Equity Fund
The Eaton Vance Building
255 State Street
Boston, MA 02109
This report must be preceded or accompanied by a current prospectus. Before investing, investors should consider carefully the Fund's investment
objective(s), risks, and charges and expenses. The Fund's current prospectus contains this and other information about the Fund and is available
through your financial advisor. Please read the prospectus carefully before you invest or send money. For further information please call 1-800-225-6265.
2773-12/06 IEFSRC

Annual Report October 31, 2006


EATON VANCE
TAX-MANAGED
VALUE
FUND
IMPORTANT NOTICES REGARDING PRIVACY,
DELIVERY OF SHAREHOLDER DOCUMENTS,
PORTFOLIO HOLDINGS AND PROXY VOTING
Privacy. The Eaton Vance organization is committed to ensuring your financial privacy. Each of the financial institutions identified below has in effect the following policy ("Privacy Policy") with respect to nonpublic personal information about its customers:
• Only such information received from you, through application forms or otherwise, and information about your Eaton Vance fund transactions will be collected. This may include information such as name, address, social security number, tax status, account balances and transactions.
• None of such information about you (or former customers) will be disclosed to anyone, except as permitted by law (which includes disclosure to employees necessary to service your account). In the normal course of servicing a customer's account, Eaton Vance may share information with unaffiliated third parties that perform various required services such as transfer agents, custodians and broker/dealers.
• Policies and procedures (including physical, electronic and procedural safeguards) are in place that are designed to protect the confidentiality of such information.
• We reserve the right to change our Privacy Policy at any time upon proper notification to you. Customers may want to review our Policy periodically for changes by accessing the link on our homepage: www.eatonvance.com.
Our pledge of privacy applies to the following entities within the Eaton Vance organization: the Eaton Vance Family of Funds, Eaton Vance Management, Eaton Vance Investment Counsel, Boston Management and Research, and Eaton Vance Distributors, Inc.
In addition, our Privacy Policy only applies to those Eaton Vance customers who are individuals and who have a direct relationship with us. If a customer's account (i.e., fund shares) is held in the name of a third-party financial adviser/broker-dealer, it is likely that only such adviser's privacy policies apply to the customer. This notice supersedes all previously issued privacy disclosures.
For more information about Eaton Vance's Privacy Policy, please call 1-800-262-1122.
Delivery of Shareholder Documents. The Securities and Exchange Commission (the "SEC") permits funds to deliver only one copy of shareholder documents, including prospectuses, proxy statements and shareholder reports, to fund investors with multiple accounts at the same residential or post office box address. This practice is often called "householding" and it helps eliminate duplicate mailings to shareholders.
Eaton Vance, or your financial adviser, may household the mailing of your documents indefinitely unless you instruct Eaton Vance, or your financial adviser, otherwise.
If you would prefer that your Eaton Vance documents not be householded, please contact Eaton Vance at 1-800-262-1122, or contact your financial adviser.
Your instructions that householding not apply to delivery of your Eaton Vance documents will be effective within 30 days of receipt by Eaton Vance or your financial adviser.
Portfolio Holdings. Each Eaton Vance Fund and its underlying Portfolio (if applicable) will file a schedule of its portfolio holdings on Form N-Q with the SEC for the first and third quarters of each fiscal year. The Form N-Q will be available on the Eaton Vance website www.eatonvance.com, by calling Eaton Vance at 1-800-262-1122 or in the EDGAR database on the SEC's website at www.sec.gov. Form N-Q may also be reviewed and copied at the SEC's public reference room in Washington, D.C. (call 1-800-732-0330 for information on the operation of the public reference room).
Proxy Voting. From time to time, funds are required to vote proxies related to the securities held by the funds. The Eaton Vance Funds or their underlying Portfolios (if applicable) vote proxies according to a set of policies and procedures approved by the Funds' and Portfolios' Boards. You may obtain a description of these policies and procedures and information on how the Funds or Portfolios voted proxies relating to portfolio securities during the most recent 12 month period ended June 30, without charge, upon request, by calling 1-800-262-1122. This description is also available on the SEC's website at www.sec.gov.
Eaton Vance Tax-Managed Value Fund as of October 31, 2006
MANAGEMENT’S DISCUSSION OF FUND PERFORMANCE

Michael R. Mach, CFA
Portfolio Manager
The Fund
Performance for the Past Year
· For the year ended October 31, 2006, the Fund’s Class A shares had a total return of 18.92%. This return was the result of an increase in net asset value (NAV) per share to $18.77 on October 31, 2006, from $15.92 on October 31, 2005, and the reinvestment of $0.144 per share in dividend income.(1)
· The Fund’s Class B shares had a total return of 18.00% for the same period, the result of an increase in NAV per share to $17.63 from $14.97, and the reinvestment of $0.031 per share in dividend income.(1)
· The Fund’s Class C shares had a total return of 18.02% for the same period, the result of an increase in NAV per share to $18.10 from $15.37, and the reinvestment of $0.035 per share in dividend income.(1)
· For comparison, the Fund’s benchmark, the Russell 1000 Value Index – a broad-based, unmanaged index of stocks – had a total return of 21.46% during the period. The Fund’s peer group, the Lipper Large-Cap Value Funds Classification, had an average total return of 17.73% for the same period.(2)
See pages 3 and 4 for more performance information, including after-tax returns.
Management Discussion
· For the year ended October 31, 2006, the Fund posted strong positive returns. The Fund outperformed its Lipper peer group, although its performance lagged that of its primary benchmark index.(2) The Fund currently invests its assets in a separate registered investment company, Tax-Managed Value Portfolio (the “Portfolio”), with the same objective and policies as the Fund.
· In the first part of the fiscal year, mixed economic data, coupled with geopolitical uncertainty, kept investors on the sidelines. However, the second half of the year proved to be more encouraging, as a pause in interest rate hikes and a decline in energy prices brought relief to the equity markets. Healthy consumer trends, positive earnings and corporate mergers and acquisitions helped the broad equity markets. Value stocks once again outperformed growth stocks.
· The Fund underperformed the Russell 1000 Value Index for the fiscal year primarily because of lagging performance from individual holdings in the Portfolio. In addition, despite strong long-term performance, energy stocks underperformed the broader market during the period due to a sharp decline in the price of oil in the fall of 2006. Specific holdings in the telecommunications and consumer discretionary sectors also detracted from performance.(2)
· During the fiscal year, the Fund saw positive contributions to performance in the industrials and information technology sectors. Among industrials holdings, strong performance came from machinery and industrial conglomerates. In the information technology sector, stock selection in communications equipment and computers and peripherals contributed to the overall positive return.
· In these discussions, we believe that, along with more recent results, it is important to review longer-term performance. The Fund has outperformed the Russell 1000 Value Index (9.84% average annual returns for Class A shares at net asset value, versus 7.29% average annual returns for the Russell 1000 Value Index for the period from December 31, 1999, to October 31, 2006). The Fund has also consistently outperformed its peer group average, the Lipper Large-Cap Value Funds Classification, for the 1, 3, and 5-year periods ended October 31, 2006, since its inception.(1),(2),(3)
Past performance is no guarantee of future results. Returns are historical and are calculated by determining the percentage change in net asset value or offering price (as applicable) with all distributions reinvested. Investment return and principal value will fluctuate so that shares, when redeemed, may be worth more or less than their original cost. Performance is for stated time period only; due to market volatility, the Fund’s current performance may be lower or higher than the quoted return. For performance as of the most recent month end, please refer to www.eatonvance.com.
Fund shares are not insured by the FDIC and are not deposits or other obligations of, or guaranteed by, any depository institution. Shares are subject to investment risks, including possible loss of principal invested.
(1) | | These returns do not include the 5.75% maximum sales charge for Class A shares or the applicable contingent deferred sales charge (CDSC) for Class B and Class C shares. If sales charges were deducted, the returns would be lower. Absent an allocation of certain expenses to the investment adviser, the returns would be lower. |
| | |
(2) | | It is not possible to invest directly in an Index or a Lipper Classification. The Index’s total return does not reflect commissions or expenses that would have been incurred if an investor individually purchased or sold the securities represented in the Index. Index returns available as of month end only. The Lipper Average is the average total return, at net asset value, of the funds that are in the same Lipper Classification as the Fund. Lipper Averages are available as of month end only. |
| | |
(3) | | The average annual returns at net asset value for the Fund’s Class A shares for the one, three and five year periods ended October 31, 2006 were 18.92%, 15.66% and 10.38%, respectively. The average annual returns for the Lipper Large-Cap Value Funds classification for the one, three and five year periods ended October 31, 2006 were 17.73%, 13.24%, and 8.69%, respectively. It is not possible to invest in a Lipper classification. Past performance is no guarantee of future results. |
1
· Throughout the Fund’s history, we believe the driving force behind the Fund’s performance have been its well defined investment philosophy, its disciplined investment process and its ability to draw on the insights generated by Eaton Vance’s stable seasoned team of equity analysts.
· Finally, it is important to note that our Fund is tax-managed. With the stock market having posted positive gains in each year since 2003, there is the potential for many equity funds to pay out significant capital gains distributions. For shareholders in taxable accounts, those distributions are typically taxable in the year the distributions are paid. The Fund, on the other hand, is managed for long-term, after-tax returns.
· The Fund remains committed to its strategy of investing in companies that are considered to be high in quality and attractive in their long-term investment prospects, are favorably priced in relation to their fundamental value, and which will grow in value over time. The Fund’s research-driven investment process, focus on risk management, and commitment to a long-term investment perspective are designed to help meet the Fund’s objective. As always, I wish to thank you, my fellow shareholders, for your continued confidence and participation in the Fund.
The views expressed throughout this report are those of the portfolio manager and are current only through the end of the period of the report as stated on the cover. These views are subject to change at any time based upon market or other conditions, and the investment adviser disclaims any responsibility to update such views. These views may not be relied on as investment advice and, because investment decisions for a fund are based on many factors, may not be relied on as an indication of trading intent on behalf of any Eaton Vance fund.
Common Stock Investments by Sector*
By net assets
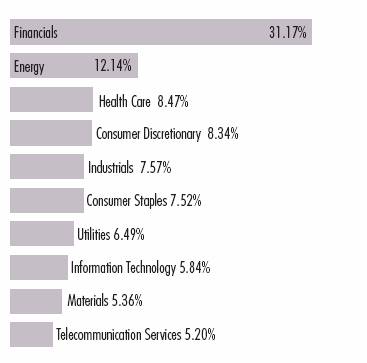
* As a percentage of the Fund’s net assets as of October 31, 2006. Portfolio information may not be representative of the Portfolio’s current or future investments and may change due to active management.
Top Ten Holdings**
By net assets
Exxon Mobil Corp. | | 2.36 | % |
Goldman Sachs, Inc. | | 2.35 | % |
Altria Group, Inc. | | 2.35 | % |
Bank of America Corp. | | 2.22 | % |
JP Morgan Chase & Co. | | 2.15 | % |
Wells Fargo & Co. | | 2.09 | % |
Hewlett-Packard Co. | | 2.08 | % |
Citigroup Inc. | | 2.07 | % |
Exelon Corp. | | 2.04 | % |
AT&T Inc. | | 1.98 | % |
** Top Ten Holdings represented 21.69% of Portfolio net assets as of October 31, 2006. Holdings are subject to change due to active management.
2
Eaton Vance Tax-Managed Value Fund as of October 31, 2006
FUND PERFORMANCE
The line graph and table set forth below provide information about the Fund’s performance. The line graph compares the performance of Class A of the Fund with that of the Russell 1000 Value Index, a broad-based, unmanaged index of value stocks, and the S&P 500 Index, a broad-based, unmanaged market index of common stocks. The lines on the graph represent the total returns of a hypothetical investment of $10,000 in each of Class A, the Russell 1000 Value Index, and the S&P 500 Index. Class A total returns are presented at net asset value and public offering price. The table includes the total returns of each Class of the Fund at net asset value and public offering price. The performance presented below does not reflect the deduction of taxes, if any, that a shareholder would pay on distributions or redemptions of Fund shares.
Performance* | | Class A | | Class B | | Class C | |
| | | | | | | |
Average Annual Total Returns (at net asset value) | | | | | | | |
One Year | | 18.92 | % | 18.00 | % | 18.02 | % |
Five Years | | 10.38 | % | 9.56 | % | 9.55 | % |
Life of Fund† | | 10.06 | % | 8.81 | % | 9.26 | % |
| | | | | | | |
SEC Average Annual Total Returns (including sales charge or applicable CDSC) | | | | | | | |
One Year | | 12.09 | % | 13.00 | % | 17.02 | % |
Five Years | | 9.08 | % | 9.28 | % | 9.55 | % |
Life of Fund† | | 9.12 | % | 8.81 | % | 9.26 | % |
† Inception Dates – Class A: 12/27/99; Class B: 1/18/00; Class C: 1/24/00
* Average annual total returns do not include the 5.75% maximum sales charge for Class A shares or the applicable contingent deferred sales charge (CDSC) for Class B and Class C shares. If sales charges were deducted, the returns would be lower. SEC average annual total returns for Class A reflect the maximum 5.75% sales charge. SEC returns for Class B shares reflect the applicable CDSC based on the following schedule: 5% - 1st and 2nd years; 4% - 3rd year; 3% - 4th year; 2% - 5th year; 1% - 6th year. SEC returns for Class C reflect a 1% CDSC for the first year. Absent an allocation of certain expenses to the investment advisor, the returns would be lower.
Past performance is no guarantee of future results. Returns are historical and are calculated by determining the percentage change in net asset value or offering price (as applicable) with all distributions reinvested. Investment return and principal value will fluctuate so that shares, when redeemed, may be worth more or less than their original cost. Performance is for stated time period only; due to market volatility, the Fund’s current performance may be lower or higher than the quoted return. For performance as of the most recent month end, please refer to www.eatonvance.com.
Comparison of Change in Value of a $10,000 Investment in Eaton Vance Tax-Managed Value Fund Class A vs. the Russell 1000 Value Index and the S&P 500 Index**
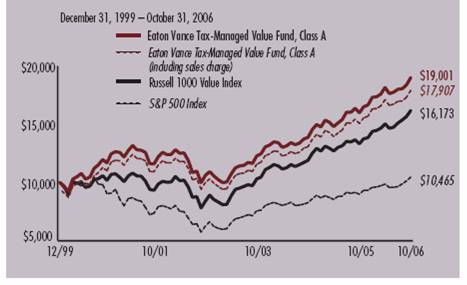
** Source: Thomson Financial. Class A of the Fund commenced investment operations on 12/27/99. A $10,000 hypothetical investment at net asset value in Class B shares on 1/18/00 and Class C shares on 1/24/00 would have been valued at $17,757 and $18,224, respectively, on October 31, 2006. It is not possible to invest directly in an Index. The Indexes’ total returns do not reflect commissions or expenses that would have been incurred if an investor individually purchased or sold the securities represented in an Index.
3
“Return Before Taxes” does not take into consideration shareholder taxes. It is most relevant to tax-free or tax-deferred shareholder accounts. “Return After Taxes on Distributions” reflects the impact of federal income taxes due on Fund distributions of dividends and capital gains. It is most relevant to taxpaying shareholders who continue to hold their shares. “Return After Taxes on Distributions and Sale of Fund Shares” also reflects the impact of taxes on capital gain or loss realized upon a sale of shares. It is most relevant to taxpaying shareholders who sell their shares.
Average Annual Total Returns
(For the periods ended October 31, 2006)
Returns at Net Asset Value (NAV) (Class A)
| | One Year | | Five Years | | Life of Fund | |
| | | | | | | |
Return Before Taxes | | 18.92 | % | 10.38 | % | 10.06 | % |
Return After Taxes on Distributions | | 18.77 | % | 10.29 | % | 10.00 | % |
Return After Taxes on Distributions and Sale of Fund Shares | | 12.47 | % | 9.04 | % | 8.85 | % |
Returns at Public Offering Price (POP) (Class A)
| | One Year | | Five Years | | Life of Fund | |
| | | | | | | |
Return Before Taxes | | 12.09 | % | 9.08 | % | 9.12 | % |
Return After Taxes on Distributions | | 11.95 | % | 8.99 | % | 9.05 | % |
Return After Taxes on Distributions and Sale of Fund Shares | | 8.02 | % | 7.88 | % | 7.99 | % |
Average Annual Total Returns
(For the periods ended October 31, 2006)
Returns at Net Asset Value (NAV) (Class C)
| | One Year | | Five Years | | Life of Fund | |
| | | | | | | |
Return Before Taxes | | 18.02 | % | 9.55 | % | 9.26 | % |
Return After Taxes on Distributions | | 17.98 | % | 9.53 | % | 9.24 | % |
Return After Taxes on Distributions and Sale of Fund Shares | | 11.75 | % | 8.31 | % | 8.13 | % |
Returns at Public Offering Price (POP) (Class C)
| | One Year | | Five Years | | Life of Fund | |
| | | | | | | |
Return Before Taxes | | 17.02 | % | 9.55 | % | 9.26 | % |
Return After Taxes on Distributions | | 16.98 | % | 9.53 | % | 9.24 | % |
Return After Taxes on Distributions and Sale of Fund Shares | | 11.10 | % | 8.31 | % | 8.13 | % |
Average Annual Total Returns
(For the periods ended October 31, 2006)
Returns at Net Asset Value (NAV) (Class B)
| | One Year | | Five Years | | Life of Fund | |
| | | | | | | |
Return Before Taxes | | 18.00 | % | 9.56 | % | 8.81 | % |
Return After Taxes on Distributions | | 17.97 | % | 9.53 | % | 8.81 | % |
Return After Taxes on Distributions and Sale of Fund Shares | | 11.74 | % | 8.32 | % | 7.74 | % |
Returns at Public Offering Price (POP) (Class B)
| | One Year | | Five Years | | Life of Fund | |
| | | | | | | |
Return Before Taxes | | 13.00 | % | 9.28 | % | 8.81 | % |
Return After Taxes on Distributions | | 12.97 | % | 9.25 | % | 8.81 | % |
Return After Taxes on Distributions and Sale of Fund Shares | | 8.49 | % | 8.07 | % | 7.74 | % |
Class A, Class B and Class C of the Fund commenced investment operations on 12/27/99, 1/18/00 and 1/24/00, respectively. Returns at Public Offering Price (POP) reflect the deduction of the maximum initial sales charge and applicable CDSC, while Returns at Net Asset Value (NAV) do not.
After-tax returns are calculated using the highest historical individual federal income tax rate and do not reflect the impact of state and local taxes. Actual after-tax returns depend on a shareholder’s tax situation and may differ from those shown. After-tax returns are not relevant for shareholders who hold Fund shares in tax-deferred accounts or to shares held by non-taxable entities. Return After Taxes on Distributions for a period may be the same as Return Before Taxes for that period because no distributions were paid during that period, or because the taxable portion of distributions made during the period was insignificant. Also, Return After Taxes on Distributions and Sale of Fund Shares for a period may be greater than Return After Taxes on Distributions for the same period because of realized losses on the sale of Fund shares.
Past performance is no guarantee of future results. Returns are historical and are calculated by determining the percentage change in net asset value or offering price (as applicable) with all distributions reinvested. Investment return and principal value will fluctuate so that shares, when redeemed, may be worth more or less than their original cost. Performance is for the stated time period only; due to market volatility, the Fund’s current performance may be lower or higher than the quoted return. For performance as of the most recent month-end, please refer to www.eatonvance.com.
4
Eaton Vance Tax-Managed Value Fund as of October 31, 2006
FUND EXPENSES
Example: As a shareholder of the Fund, you incur two types of costs: (1) transaction costs, including sales charges (loads) on purchases and redemption fees (if applicable); and (2) ongoing costs, including management fees; distribution or service fees; and other Fund expenses. This Example is intended to help you understand your ongoing costs (in dollars) of investing in the Fund and to compare these costs with the ongoing costs of investing in other mutual funds. The Example is based on an investment of $1,000 invested at the beginning of the period and held for the entire period (May 1, 2006 – October 31, 2006).
Actual Expenses: The first section of the table below provides information about actual account values and actual expenses. You may use the information in this section, together with the amount you invested, to estimate the expenses that you paid over the period. Simply divide your account value by $1,000 (for example, an $8,600 account value divided by $1,000 = 8.6), then multiply the result by the number in the first section under the heading entitled "Expenses Paid During Period" to estimate the expenses you paid on your account during this period.
Hypothetical Example for Comparison Purposes: The second section of the table below provides information about hypothetical account values and hypothetical expenses based on actual Fund expense ratio and an assumed rate of return of 5% per year (before expenses), which is not the actual return of the Fund. The hypothetical account values and expenses may not be used to estimate the actual ending account balance or expenses you paid for the period. You may use this information to compare the ongoing costs of investing in your Fund and other funds. To do so, compare this 5% hypothetical example with the 5% hypothetical examples that appear in the shareholder reports of the other funds.
Please note that the expenses shown in the table are meant to highlight your ongoing costs only and do not reflect any transactional costs, such as sales charges (loads) or redemption fees (if applicable). Therefore, the second section of the table is useful in comparing ongoing costs only, and will not help you determine the relative total costs of owning different funds. In addition, if these transactional costs were included, your costs would have been higher.
Eaton Vance Tax-Managed Value Fund
| | | Beginning Account Value
(5/1/06) | | Ending Account Value
(10/31/06) | | Expenses Paid During Period*
(5/1/06 – 10/31/06) | |
| Actual | |
| Class A | | $ | 1,000.00 | | | $ | 1,046.80 | | | $ | 6.04 | | |
| Class B | | $ | 1,000.00 | | | $ | 1,043.20 | | | $ | 9.89 | | |
| Class C | | $ | 1,000.00 | | | $ | 1,043.20 | | | $ | 9.89 | | |
| Hypothetical | |
| (5% return per year before expenses) | |
| Class A | | $ | 1,000.00 | | | $ | 1,019.30 | | | $ | 5.95 | | |
| Class B | | $ | 1,000.00 | | | $ | 1,015.50 | | | $ | 9.75 | | |
| Class C | | $ | 1,000.00 | | | $ | 1,015.50 | | | $ | 9.75 | | |
* Expenses are equal to the Fund's annualized expense ratio of 1.17% for Class A shares, 1.92% for Class B shares, and 1.92% for Class C shares, multiplied by the average account value over the period, multiplied by 184/365 (to reflect the one-half year period). The Example assumes that the $1,000 was invested at the net asset value per share determined at the close of business on April 30, 2006. The Example reflects the expenses of both the Fund and the Portfolio.
5
Eaton Vance Tax-Managed Value Fund as of October 31, 2006
FINANCIAL STATEMENTS
Statement of Assets and Liabilities
As of October 31, 2006
| Assets | |
Investment in Tax-Managed Value Portfolio, at value
(identified cost, $704,552,266) | | $ | 1,079,369,878 | | |
| Receivable for Fund shares sold | | | 1,777,455 | | |
| Total assets | | $ | 1,081,147,333 | | |
| Liabilities | |
| Payable for Fund shares redeemed | | $ | 3,642,846 | | |
| Payable to affiliate for distribution and service fees | | | 570,753 | | |
| Payable to affiliate for administration fees | | | 135,316 | | |
| Accrued expenses | | | 222,177 | | |
| Total liabilities | | $ | 4,571,092 | | |
| Net Assets | | $ | 1,076,576,241 | | |
| Sources of Net Assets | |
| Paid-in capital | | $ | 751,011,729 | | |
Accumulated net realized loss from Portfolio (computed on
the basis of identified cost) | | | (54,129,357 | ) | |
| Undistributed net investment income | | | 4,876,257 | | |
Net unrealized appreciation from Portfolio (computed on the basis of
identified cost) | | | 374,817,612 | | |
| Total | | $ | 1,076,576,241 | | |
| Class A Shares | |
| Net Assets | | $ | 529,073,367 | | |
| Shares Outstanding | | | 28,192,588 | | |
Net Asset Value and Redemption Price Per Share
(net assets ÷ shares of beneficial interest outstanding) | | $ | 18.77 | | |
Maximum Offering Price Per Share
(100 ÷ 94.25 of $18.77) | | $ | 19.92 | | |
| Class B Shares | |
| Net Assets | | $ | 250,029,919 | | |
| Shares Outstanding | | | 14,183,442 | | |
Net Asset Value, Offering Price and Redemption Price Per Share
(net assets ÷ shares of beneficial interest outstanding) | | $ | 17.63 | | |
| Class C Shares | |
| Net Assets | | $ | 297,472,955 | | |
| Shares Outstanding | | | 16,437,947 | | |
Net Asset Value, Offering Price and Redemption Price Per Share
(net assets ÷ shares of beneficial interest outstanding) | | $ | 18.10 | | |
| On sales of $50,000 or more, the offering price of Class A shares is reduced. | |
Statement of Operations
For the Year Ended
October 31, 2006
| Investment Income | |
| Dividends allocated from Portfolio (net of foreign taxes, $151,805) | | $ | 21,721,122 | | |
| Interest allocated from Portfolio | | | 926,552 | | |
| Security lending income allocated from Portfolio | | | 42,400 | | |
| Expenses allocated from Portfolio | | | (6,501,511 | ) | |
| Net investment income from Portfolio | | $ | 16,188,563 | | |
| Expenses | |
| Administration fee | | $ | 1,448,164 | | |
| Trustees' fees and expenses | | | 3,140 | | |
Distribution and service fees
Class A | | | 1,110,975 | | |
| Class B | | | 2,478,523 | | |
| Class C | | | 2,732,004 | | |
| Transfer and dividend disbursing agent fees | | | 780,767 | | |
| Printing and postage | | | 87,431 | | |
| Registration fees | | | 52,256 | | |
| Legal and accounting services | | | 36,227 | | |
| Custodian fee | | | 35,401 | | |
| Miscellaneous | | | 10,784 | | |
| Total expenses | | $ | 8,775,672 | | |
| Net investment income | | $ | 7,412,891 | | |
Realized and Unrealized
Gain (Loss) from Portfolio | |
Net realized gain (loss) —
Investment transactions (identified cost basis) | | $ | 27,538,685 | | |
| Foreign currency transactions | | | 4,695 | | |
| Net realized gain | | $ | 27,543,380 | | |
Change in unrealized appreciation (depreciation) —
Investments (identified cost basis) | | $ | 126,652,558 | | |
| Foreign currency | | | 8,570 | | |
| Net change in unrealized appreciation (depreciation) | | $ | 126,661,128 | | |
| Net realized and unrealized gain | | $ | 154,204,508 | | |
| Net increase in net assets from operations | | $ | 161,617,399 | | |
See notes to financial statements
6
Eaton Vance Tax-Managed Value Fund as of October 31, 2006
FINANCIAL STATEMENTS CONT'D
Statements of Changes in Net Assets
Increase (Decrease)
in Net Assets | | Year Ended
October 31, 2006 | | Year Ended
October 31, 2005 | |
From operations —
Net investment income | | $ | 7,412,891 | | | $ | 3,360,205 | | |
Net realized gain from investment and
foreign currency transactions | | | 27,543,380 | | | | 22,746,255 | | |
Net change in unrealized
appreciation (depreciation)
from investments and foreign currency | | | 126,661,128 | | | | 79,616,323 | | |
| Net increase in net assets from operations | | $ | 161,617,399 | | | $ | 105,722,783 | | |
Distributions to shareholders —
From net investment income
Class A | | $ | (3,358,252 | ) | | $ | (2,671,322 | ) | |
| Class B | | | (487,483 | ) | | | (688,214 | ) | |
| Class C | | | (561,668 | ) | | | (526,497 | ) | |
| Total distributions to shareholders | | $ | (4,407,403 | ) | | $ | (3,886,033 | ) | |
Transactions in shares of beneficial interest —
Proceeds from sale of shares
Class A | | $ | 144,383,450 | | | $ | 97,121,961 | | |
| Class B | | | 12,703,645 | | | | 17,784,025 | | |
| Class C | | | 37,379,842 | | | | 32,104,482 | | |
Net asset value of shares issued to
shareholders in payment of
distributions declared
Class A | | | 2,773,537 | | | | 2,220,656 | | |
| Class B | | | 362,257 | | | | 515,875 | | |
| Class C | | | 390,508 | | | | 362,191 | | |
Cost of shares redeemed
Class A | | | (63,623,564 | ) | | | (49,235,244 | ) | |
| Class B | | | (33,373,795 | ) | | | (34,766,581 | ) | |
| Class C | | | (31,140,765 | ) | | | (32,184,572 | ) | |
Net asset value of shares exchanged
Class A | | | 9,424,654 | | | | 3,151,851 | | |
| Class B | | | (9,424,654 | ) | | | (3,151,851 | ) | |
Net increase in net assets from
Fund share transactions | | $ | 69,855,115 | | | $ | 33,922,793 | | |
| Net increase in net assets | | $ | 227,065,111 | | | $ | 135,759,543 | | |
| Net Assets | |
| At beginning of year | | $ | 849,511,130 | | | $ | 713,751,587 | | |
| At end of year | | $ | 1,076,576,241 | | | $ | 849,511,130 | | |
Undistributed
net investment income
included in net assets | |
| At end of year | | $ | 4,876,257 | | | $ | 2,266,067 | | |
See notes to financial statements
7
Eaton Vance Tax-Managed Value Fund as of October 31, 2006
FINANCIAL STATEMENTS CONT'D
Financial Highlights
| | | Class A | |
| | | Year Ended October 31, | |
| | | 2006 | | 2005 | | 2004 | | 2003 | | 2002 | |
| Net asset value — Beginning of year | | $ | 15.920 | | | $ | 13.950 | | | $ | 12.460 | | | $ | 10.770 | | | $ | 11.770 | | |
| Income (loss) from operations | |
| Net investment income | | $ | 0.189 | | | $ | 0.122 | | | $ | 0.135 | | | $ | 0.101 | | | $ | 0.051 | | |
| Net realized and unrealized gain (loss) | | | 2.805 | | | | 1.984 | | | | 1.471 | | | | 1.594 | | | | (1.051 | ) | |
| Total income (loss) from operations | | $ | 2.994 | | | $ | 2.106 | | | $ | 1.606 | | | $ | 1.695 | | | $ | (1.000 | ) | |
| Less distributions | |
| From net investment income | | $ | (0.144 | ) | | $ | (0.136 | ) | | $ | (0.116 | ) | | $ | (0.005 | ) | | $ | — | | |
| Total distributions | | $ | (0.144 | ) | | $ | (0.136 | ) | | $ | (0.116 | ) | | $ | (0.005 | ) | | $ | — | | |
| Net asset value — End of period | | $ | 18.770 | | | $ | 15.920 | | | $ | 13.950 | | | $ | 12.460 | | | $ | 10.770 | | |
| Total Return(1) | | | 18.92 | % | | | 15.17 | % | | | 12.96 | % | | | 15.74 | % | | | (8.50 | )% | |
| Ratios/Supplemental Data | |
| Net assets, end of year (000's omitted) | | $ | 529,073 | | | $ | 363,527 | | | $ | 269,908 | | | $ | 211,918 | | | $ | 181,588 | | |
| Ratios (As a percentage of average daily net assets): | |
| Expenses before custodian fee reduction(2) | | | 1.18 | % | | | 1.21 | % | | | 1.22 | % | | | 1.27 | % | | | 1.26 | % | |
| Expenses after custodian fee reduction(2) | | | 1.18 | % | | | 1.21 | % | | | 1.22 | % | | | 1.27 | % | | | 1.26 | % | |
| Net investment income | | | 1.16 | % | | | 0.86 | % | | | 1.03 | % | | | 0.91 | % | | | 0.44 | % | |
| Portfolio Turnover of the Portfolio | | | 26 | % | | | 40 | % | | | 44 | % | | | 76 | % | | | 213 | % | |
(1) Returns are historical and are calculated by determining the percentage change in net asset value with all distributions reinvested. Total return is not computed on an annualized basis.
(2) Includes the Fund's share of the Portfolio's allocated expenses.
See notes to financial statements
8
Eaton Vance Tax-Managed Value Fund as of October 31, 2006
FINANCIAL STATEMENTS CONT'D
Financial Highlights
| | | Class B | |
| | | Year Ended October 31, | |
| | | 2006 | | 2005 | | 2004 | | 2003 | | 2002 | |
| Net asset value — Beginning of year | | $ | 14.970 | | | $ | 13.130 | | | $ | 11.740 | | | $ | 10.220 | | | $ | 11.250 | | |
| Income (loss) from operations | |
| Net investment income (loss) | | $ | 0.073 | | | $ | 0.018 | | | $ | 0.035 | | | $ | 0.017 | | | $ | (0.034 | ) | |
| Net realized and unrealized gain (loss) | | | 2.618 | | | | 1.862 | | | | 1.384 | | | | 1.503 | | | | (0.996 | ) | |
| Total income (loss) from operations | | $ | 2.691 | | | $ | 1.880 | | | $ | 1.419 | | | $ | 1.520 | | | $ | (1.030 | ) | |
| Less distributions | |
| From net investment income | | $ | (0.031 | ) | | $ | (0.040 | ) | | $ | (0.029 | ) | | $ | — | | | $ | — | | |
| Total distributions | | $ | (0.031 | ) | | $ | (0.040 | ) | | $ | (0.029 | ) | | $ | — | | | $ | — | | |
| Net asset value — End of year | | $ | 17.630 | | | $ | 14.970 | | | $ | 13.130 | | | $ | 11.740 | | | $ | 10.220 | | |
| Total Return(1) | | | 18.00 | % | | | 14.34 | % | | | 12.10 | % | | | 14.87 | % | | | (9.16 | )% | |
| Ratios/Supplemental Data | |
| Net assets, end of year (000's omitted) | | $ | 250,030 | | | $ | 239,392 | | | $ | 227,778 | | | $ | 203,665 | | | $ | 174,951 | | |
| Ratios (As a percentage of average daily net assets): | |
| Expenses before custodian fee reduction(2) | | | 1.93 | % | | | 1.96 | % | | | 1.97 | % | | | 2.02 | % | | | 2.01 | % | |
| Expenses after custodian fee reduction(2) | | | 1.93 | % | | | 1.96 | % | | | 1.97 | % | | | 2.02 | % | | | 2.01 | % | |
| Net investment income (loss) | | | 0.44 | % | | | 0.13 | % | | | 0.29 | % | | | 0.16 | % | | | (0.31 | )% | |
| Portfolio Turnover of the Portfolio | | | 26 | % | | | 40 | % | | | 44 | % | | | 76 | % | | | 213 | % | |
(1) Returns are historical and are calculated by determining the percentage change in net asset value with all distributions reinvested. Total return is not computed on an annualized basis.
(2) Includes the Fund's share of the Portfolio's allocated expenses.
See notes to financial statements
9
Eaton Vance Tax-Managed Value Fund as of October 31, 2006
FINANCIAL STATEMENTS CONT'D
Financial Highlights
| | | Class C | |
| | | Year Ended October 31, | |
| | | 2006 | | 2005 | | 2004 | | 2003 | | 2002 | |
| Net asset value — Beginning of year | | $ | 15.370 | | | $ | 13.470 | | | $ | 12.050 | | | $ | 10.490 | | | $ | 11.550 | | |
| Income (loss) from operations | |
| Net investment income (loss) | | $ | 0.071 | | | $ | 0.018 | | | $ | 0.038 | | | $ | 0.018 | | | $ | (0.034 | ) | |
| Net realized and unrealized gain (loss) | | | 2.694 | | | | 1.915 | | | | 1.412 | | | | 1.542 | | | | (1.026 | ) | |
| Total income (loss) from operations | | $ | 2.765 | | | $ | 1.933 | | | $ | 1.450 | | | $ | 1.560 | | | $ | (1.060 | ) | |
| Less distributions | |
| From net investment income | | $ | (0.035 | ) | | $ | (0.033 | ) | | $ | (0.030 | ) | | $ | — | | | $ | — | | |
| Total distributions | | $ | (0.035 | ) | | $ | (0.033 | ) | | $ | (0.030 | ) | | $ | — | | | $ | — | | |
| Net asset value — End of year | | $ | 18.100 | | | $ | 15.370 | | | $ | 13.470 | | | $ | 12.050 | | | $ | 10.490 | | |
| Total Return(1) | | | 18.02 | % | | | 14.37 | % | | | 12.05 | % | | | 14.87 | % | | | (9.18 | )% | |
| Ratios/Supplemental Data | |
| Net assets, end of year (000's omitted) | | $ | 297,473 | | | $ | 246,593 | | | $ | 216,066 | | | $ | 197,385 | | | $ | 173,306 | | |
| Ratios (As a percentage of average daily net assets): | |
| Expenses before custodian fee reduction(2) | | | 1.93 | % | | | 1.96 | % | | | 1.97 | % | | | 2.02 | % | | | 2.01 | % | |
| Expenses after custodian fee reduction(2) | | | 1.93 | % | | | 1.96 | % | | | 1.97 | % | | | 2.02 | % | | | 2.01 | % | |
| Net investment income (loss) | | | 0.43 | % | | | 0.12 | % | | | 0.29 | % | | | 0.16 | % | | | (0.31 | )% | |
| Portfolio Turnover of the Portfolio | | | 26 | % | | | 40 | % | | | 44 | % | | | 76 | % | | | 213 | % | |
(1) Returns are historical and are calculated by determining the percentage change in net asset value with all distributions reinvested. Total return is not computed on an annualized basis.
(2) Includes the Fund's share of the Portfolio's allocated expenses.
See notes to financial statements
10
Eaton Vance Tax-Managed Value Fund as of October 31, 2006
NOTES TO FINANCIAL STATEMENTS
1 Significant Accounting Policies
Eaton Vance Tax-Managed Value Fund (the Fund) is a diversified series of Eaton Vance Mutual Funds Trust (the Trust). The Trust is an entity of the type commonly known as a Massachusetts business trust and is registered under the Investment Company Act of 1940, as amended, as an open-end management investment company. The Fund offers three classes of shares. Class A shares are generally sold subject to a sales charge imposed at time of purchase. Class B and Class C shares are sold at net asset value and are generally subject to a contingent deferred sales charge (see Note 6). Class B shares held for eight years will automatically convert to Class A shares. Each class represents a pro rata interest in the Fund, but votes separately on class-specific matters and (as noted below) is subject to different expenses. Realized and unrealized gains and losses and net investment income, other than class-specific expenses, are allocated dai ly to each class of shares based on the relative net assets of each class to the total net assets of the Fund. Each class of shares differs in its distribution plan and certain other class-specific expenses. The Fund invests all of its investable assets in interests in the Tax-Managed Value Portfolio (the Portfolio), a New York Trust, having the same investment objective as the Fund. The value of the Fund's investment in the Portfolio reflects the Fund's proportionate interest in the net assets of the Portfolio (89.0% at October 31, 2006). The performance of the Fund is directly affected by the performance of the Portfolio. The financial statements of the Portfolio, including the Portfolio of Investments, are included elsewhere in this report and should be read in conjunction with the Fund's financial statements.
The following is a summary of significant accounting policies consistently followed by the Fund in the preparation of its financial statements. The policies are in conformity with accounting principles generally accepted in the United States of America.
A Investment Valuation — Valuation of securities by the Portfolio is discussed in Note 1A of the Portfolio's Notes to Financial Statements, which are included elsewhere in this report.
B Income — The Fund's net investment income or loss consists of the Fund's pro rata share of the net investment income or loss of the Portfolio, less all actual and accrued expenses of the Fund.
C Federal Taxes — The Fund's policy is to comply with the provisions of the Internal Revenue Code applicable to regulated investment companies and to distribute to shareholders, each year, substantially all of its net investment income and all or substantially all of its net realized capital gains. Accordingly, no provision for federal income or excise tax is necessary. At October 31, 2006, the Fund, for federal income tax purposes, had a capital loss carryforward of $52,986,546 which will reduce the Fund's taxable income arising from future net realized gain on investments, if any, to the extent permitted by the Internal Revenue Code and thus will reduce the amount of distributions to shareholders which would otherwise be necessary to relieve the Fund of any liability for federal income or excise tax. Such capital loss carryforward will expire on October 31, 2010.
D Expenses — The majority of expenses of the Trust are directly identifiable to an individual fund. Expenses which are not readily identifiable to a specific fund are allocated taking into consideration, among other things, the nature and type of expense and the relative size of the funds.
E Other — Investment transactions are accounted for on the date the securities are purchased or sold. Dividends to shareholders are recorded on the ex-dividend date.
F Use of Estimates — The preparation of the financial statements in conformity with accounting principles generally accepted in the United States of America requires management to make estimates and assumptions that affect the reported amounts of assets and liabilities at the date of the financial statements and the reported amounts of income and expense during the reporting period. Actual results could differ from those estimates.
G Indemnifications — Under the Trust's organizational documents, its officers and Trustees may be indemnified against certain liabilities and expenses arising out of the performance of their duties to the Fund, and shareholders are indemnified against personal liability for the obligations of the Trust. Additionally, in the normal course of business, the Fund enters into agreements with service providers that may contain indemnification clauses. The Fund's maximum exposure under these arrangements is unknown as this would involve future claims that may be made against the Fund that have not yet occurred.
H Expense Reduction — Investors Bank & Trust Company (IBT) serves as custodian of the Fund. Pursuant to the custodian agreement, IBT receives a fee reduced by credits which are determined based on the average daily cash balance the Fund maintains with IBT. All credit balances
11
Eaton Vance Tax-Managed Value Fund as of October 31, 2006
NOTES TO FINANCIAL STATEMENTS CONT'D
used to reduce the Fund's custodian fees are reported as a reduction of expenses in the Statement of Operations.
2 Distributions to Shareholders
It is the present policy of the Fund to make at least one distribution annually (normally in December) of all or substantially all of its net investment income and at least one distribution annually of all or substantially all of its net realized capital gains (reduced by available capital loss carryforwards from prior years, if any). Distributions are declared separately for each class of shares. Shareholders may reinvest all distributions in shares of the Fund of the same class at the net asset value as of the close of business on the reinvestment date. Distributions are paid in the form of additional shares of the same class or, at the election of the shareholder, in cash. The Fund distinguishes between distributions on a tax basis and those on a financial reporting basis. Accounting principles generally accepted in the United States of America require that only distributions in excess of tax basis earnings and profits be rep orted in the financial statements as a return of capital. Permanent differences between book and tax accounting relating to distributions are reclassified to paid-in capital.
The tax character of distributions paid for the years ended October 31, 2006 and the year ended October 31, 2005 was as follows:
| | | Year Ended October 31, | |
| | | 2006 | | 2005 | |
| Distributions declared from: | |
|
| Ordinary Income | | $ | 4,407,403 | | | $ | 3,886,033 | | |
|
During the year ended October 31, 2006, undistributed net investment income was decreased by $395,298, accumulated net realized loss was decreased by $397,702 and paid-in-capital was decreased by $2,404 primarily due to differences between book and tax accounting relating to foreign currency. This change had no effect on the net assets or the net asset value per share.
As of October 31, 2006, the components of distributable earnings (accumulated losses) on a tax basis were as follows:
| Undistributed income | | $ | 4,792,948 | | |
| Capital loss carryforwards | | $ | 52,986,546 | | |
| Unrealized gain | | $ | 373,758,110 | | |
3 Shares of Beneficial Interest
The Fund's Declaration of Trust permits the Trustees to issue an unlimited number of full and fractional shares of beneficial interest (without par value). Such shares may be issued in a number of different series (such as the Fund) and classes. Transactions in Fund shares were as follows:
| | | Year Ended October 31, | |
| Class A | | 2006 | | 2005 | |
| Sales | | | 8,295,338 | | | | 6,355,776 | | |
Issued to shareholders electing to receive
payments of distributions in Fund shares | | | 167,282 | | | | 150,052 | | |
| Redemptions | | | (3,642,704 | ) | | | (3,228,847 | ) | |
| Exchanges from Class B shares | | | 542,412 | | | | 204,339 | | |
| Net increase | | | 5,362,328 | | | | 3,481,320 | | |
| | | Year Ended October 31, | |
| Class B | | 2006 | | 2005 | |
| Sales | | | 782,720 | | | | 1,246,568 | | |
Issued to shareholders electing to receive
payments of distributions in Fund shares | | | 23,103 | | | | 36,848 | | |
| Redemptions | | | (2,038,546 | ) | | | (2,423,386 | ) | |
| Exchange to Class A shares | | | (575,596 | ) | | | (216,665 | ) | |
| Net decrease | | | (1,808,319 | ) | | | (1,356,635 | ) | |
| | | Year Ended October 31, | |
| Class C | | 2006 | | 2005 | |
| Sales | | | 2,227,927 | | | | 2,179,673 | | |
Issued to shareholders electing to receive
payments of distributions in Fund shares | | | 24,270 | | | | 25,205 | | |
| Redemptions | | | (1,857,731 | ) | | | (2,198,056 | ) | |
| Net increase | | | 394,466 | | | | 6,822 | | |
4 Transactions with Affiliates
The administrative fee is earned by Eaton Vance Management (EVM) as compensation for managing and administering the business affairs of the Fund. Under the administration agreement, EVM earns a fee in the amount of 0.15% per annum of the average daily net assets of the Fund. For the year ended October 31, 2006, the administration fee amounted to $1,448,164. The Portfolio has engaged Boston Management and Research (BMR), a subsidiary of EVM, to render investment advisory services. See Note 2 of the Portfolio's Notes to Financial Statements which are included elsewhere in this report.
12
Eaton Vance Tax-Managed Value Fund as of October 31, 2006
NOTES TO FINANCIAL STATEMENTS CONT'D
Except for Trustees of the Fund and the Portfolio who are not members of EVM's or BMR's organization, officers and Trustees receive remuneration for their services to the Fund out of the investment adviser and administrative fees earned by EVM and BMR. The Fund was informed that Eaton Vance Distributors, Inc. (EVD), a subsidiary of EVM and the Fund's principal underwriter, received $152,909 as its portion of the sales charge on sales of Class A for the year ended October 31, 2006.
EVM serves as the sub-transfer agent of the Fund and receives an aggregate fee based upon the actual expenses incurred by EVM in the performance of those services. For the year ended October 31, 2006, EVM received $51,040 in sub-transfer agent fees from the Fund.
Certain officers and Trustees of the Fund and of the Portfolio are officers of the above organizations.
5 Distribution Plans
Class A has in effect a distribution plan pursuant to Rule 12b-1 under the Investment Company Act of 1940 (Class A Plan). The Class A Plan provides that the Fund will pay EVD a distribution and service fee of 0.25% of the Fund's average daily net assets attributable to Class A shares for each fiscal year for distribution services and facilities provided to the Fund by EVD, as well as for personal services and/or the maintenance of shareholder accounts. Distribution and service fees paid or accrued for the year ended October 31, 2006 amounted to $1,110,975 for Class A shares. The Fund also has in effect distribution plans for Class B shares (Class B Plan) and Class C shares (Class C Plan) pursuant to Rule 12b-1 under the Investment Company Act of 1940 (collectively, the plans). The Class B and Class C Plans require the Fund to pay EVD amounts equal to 1/365 of 0.75% of the Fund's average daily net assets attributable to Class B a nd Class C shares, for providing ongoing distribution services and facilities to the Fund. The Fund will automatically discontinue payments to EVD during any period in which there are no outstanding Uncovered Distribution Charges, which are equivalent to the sum of (i) 5% and 6.25% of the aggregate amount received by the Fund for the Class B and Class C shares sold, respectively, plus (ii) interest calculated by applying the rate of 1% over the prevailing prime rate to the outstanding balance of Uncovered Distribution Charges of EVD, of each respective class, reduced by the aggregate amount of contingent deferred sales charges (see Note 6) and daily amounts theretofore paid to EVD by each respective class. The Fund paid or accrued $1,858,892 and $2,049,003 for Class B and Class C shares, respectively, to or payable to EVD for the year ended October 31, 2006, representing 0.75% of the average daily net assets for Class B and Class C share s. At October 31, 2006, the amount of Uncovered Distribution Charges of EVD calculated under the Plans was approximately $2,995,000 and $21,111,000 for Class B and Class C shares, respectively. The Class B and Class C Plans also authorize the Fund to make payments of service fees to EVD, investment dealers and other persons in amounts not exceeding 0.25% annually of the average daily net assets attributable to that Class. Service fees are paid for personal services and/or the maintenance of shareholder accounts. They are separate and distinct from the Class B and Class C sales commissions and distribution fees and, as such, are not subject to automatic discontinuance when there are no outstanding Uncovered Distribution Charges to EVD. Service fees paid or accrued for the year ended October 31, 2006 amounted to $619,631, and $683,001, for Class B and Class C shares, respectively.
6 Contingent Deferred Sales Charge
A contingent deferred sales charge (CDSC) generally is imposed on redemptions of Class B shares made within six years of purchase and on redemptions of Class C shares made within one year of purchase. Class A shares may be subject to a 1% CDSC if redeemed within 18 months of purchase (depending upon the circumstances of purchase). Generally, the CDSC is based upon the lower of the net asset value at date of redemption or date of purchase. No charge is levied on shares acquired by reinvestment of dividends or capital gain distributions. Class B CDSC is imposed at declining rates that begin at 5% in the case of redemptions in the first and second year after purchase, declining one percentage point each subsequent year. Class C shares will be subject to 1% CDSC if redeemed within one year of purchase.
No CDSC is levied on shares which have been sold to EVM or its affiliates or to their respective employees or clients and may be waived under certain other limited conditions. CDSC charges received on Class B and Class C redemptions are paid to EVD to reduce the amount of Uncovered Distribution Charges calculated under the Class B and Class C Plans, respectively (see Note 5). CDSC received on Class B and Class C redemptions when no Uncovered Distribution Charges exist for the respective classes will be credited to the Fund. EVD received approximately $2,000, $317,000 and $17,000 of CDSC paid by shareholders for Class A, Class B shares and Class C shares, respectively for the year ended October 31, 2006.
13
Eaton Vance Tax-Managed Value Fund as of October 31, 2006
NOTES TO FINANCIAL STATEMENTS CONT'D
7 Investment Transactions
Increases and decreases in the Fund's investment in the Portfolio aggregated $194,430,043 and $135,028,186 respectively, for the year ended October 31, 2006.
8 Recently Issued Accounting Pronouncements
In June 2006, the Financial Accounting Standards Board ("FASB") issued FASB Interpretation No. 48, ("FIN 48") "Accounting for Uncertainty in Income Taxes – an interpretation of FASB Statement No. 109". FIN 48 clarifies the accounting for uncertainty in income taxes recognized in accordance with FASB Statement No. 109, "Accounting for Income Taxes." This interpretation prescribes a recognition threshold and measurement attribute for the financial statement recognition and measurement of a tax position taken or expected to be taken in a tax return. It also provides guidance on de-recognition, classification, interest and penalties, accounting in interim periods, disclosure and transition. FIN 48 is effective for fiscal years beginning after December 15, 2006. Management is currently evaluating the impact of applying the various provisions of FIN 48.
In September 2006, the Financial Accounting Standards Board ("FASB") issued Statement of Financial Accounting Standards No. 157, ("FAS 157") "Fair Value Measurements". FAS 157 defines fair value, establishes a framework for measuring fair value in accordance with generally accepted accounting principles and expands disclosure about fair value measurements. FAS 157 is effective for fiscal years beginning after November 15, 2007. Management is currently evaluating the impact the adoption of FAS 157 will have on the Fund's financial statement disclosures.
14
Eaton Vance Tax-Managed Value Fund as of October 31, 2006
REPORT OF INDEPENDENT REGISTERED PUBLIC ACCOUNTING FIRM
To the Trustees of Eaton Vance Mutual Funds Trust and Shareholders of Eaton Vance
Tax-Managed Value Fund:
We have audited the accompanying statement of assets and liabilities of Eaton Vance Tax-Managed Value Fund (one of the series of Eaton Vance Mutual Funds Trust) as of October 31, 2006, the related statements of operations for the year then ended, and the statement of changes in net assets for each of the two years in the period then ended and the financial highlights for each of the five years in the period then ended. These financial statements and financial highlights are the responsibility of the Fund's management. Our responsibility is to express an opinion on these financial statements and financial highlights based on our audits.
We conducted our audits in accordance with the standards of the Public Company Accounting Oversight Board (United States). Those standards require that we plan and perform the audit to obtain reasonable assurance about whether the financial statements and financial highlights are free of material misstatement. The Fund is not required to have, nor were we engaged to perform, an audit of its internal control over financial reporting. Our audits included consideration of internal control over financial reporting as a basis for designing audit procedures that are appropriate in the circumstances, but not for the purpose of expressing an opinion on the effectiveness of the Fund's internal control over financial reporting. Accordingly, we express no such opinion. An audit also includes examining, on a test basis, evidence supporting the amounts and disclosures in the financial statements, assessing the accounting principles used and significant estimates made by management, as well as evaluating the overall financial statement presentation. We believe that our audits provide a reasonable basis for our opinion.
In our opinion, such financial statements and financial highlights referred to above present fairly, in all material respects, the financial position of the Eaton Vance Tax-Managed Value Fund as of October 31, 2006, the results of its operations for the year then ended, the changes in its net assets for each of the two years in the period then ended and the financial highlights for each of the five years in the period then ended, in conformity with accounting principles generally accepted in the United States of America.
DELOITTE & TOUCHE LLP
Boston, Massachusetts
December 15, 2006
15
Eaton Vance Tax-Managed Value Fund as of October 31, 2006
FEDERAL TAX INFORMATION (Unaudited)
The Form 1099-DIV you receive in January 2007 will show the tax status of all distributions paid to your account in calendar 2006. Shareholders are advised to consult their own tax adviser with respect to the tax consequences of their investment in the Fund. As required by the Internal Revenue Code regulations, shareholders must be notified within 60 days of the Fund's fiscal year end regarding the status of qualified dividend income for individuals, the dividends received deduction for corporations, and the foreign tax credit.
Qualified Dividend Income. The Fund designates approximately $19,758,439, or up to the maximum amount of such dividends allowable pursuant to the Internal Revenue Code, as qualified dividend income eligible for the reduced tax rate of 15%.
Dividends Received Deduction. Corporate shareholders are generally entitled to take the dividends received deduction on the portion of the Fund's dividend distribution that qualifies under tax law. For the Fund's fiscal 2006 ordinary income dividends, 100% qualifies for the corporate dividends received deduction.
16
Tax-Managed Value Portfolio as of October 31, 2006
PORTFOLIO OF INVESTMENTS
| Common Stocks — 98.1% | |
| Security | | Shares | | Value | |
| Aerospace & Defense — 2.3% | |
| General Dynamics Corp. | | | 200,000 | | | $ | 14,220,000 | | |
| Northrop Grumman Corp. | | | 200,000 | | | | 13,278,000 | | |
| | | $ | 27,498,000 | | |
| Air Freight & Logistics — 0.7% | |
| FedEx Corp. | | | 75,000 | | | $ | 8,590,500 | | |
| | | $ | 8,590,500 | | |
| Auto Components — 0.6% | |
| BorgWarner, Inc. | | | 125,000 | | | $ | 7,187,500 | | |
| | | $ | 7,187,500 | | |
| Capital Markets — 6.5% | |
| Franklin Resources, Inc. | | | 75,000 | | | $ | 8,547,000 | | |
| Goldman Sachs Group, Inc. (The) | | | 150,000 | | | | 28,468,500 | | |
| Lehman Brothers Holdings, Inc. | | | 260,000 | | | | 20,238,400 | | |
| Merrill Lynch & Co., Inc. | | | 250,000 | | | | 21,855,000 | | |
| | | $ | 79,108,900 | | |
| Chemicals — 1.1% | |
| Air Products and Chemicals, Inc. | | | 190,000 | | | $ | 13,237,300 | | |
| | | $ | 13,237,300 | | |
| Commercial Banks — 5.4% | |
| Marshall & Ilsley Corp. | | | 125,000 | | | $ | 5,992,500 | | |
| TCF Financial Corp. | | | 300,000 | | | | 7,809,000 | | |
| U.S. Bancorp | | | 200,000 | | | | 6,768,000 | | |
| Wachovia Corp. | | | 350,000 | | | | 19,425,000 | | |
| Wells Fargo & Co. | | | 700,000 | | | | 25,403,000 | | |
| | | $ | 65,397,500 | | |
| Communications Equipment — 0.9% | |
| Nokia Oyj ADR(1) | | | 550,000 | | | $ | 10,934,000 | | |
| | | $ | 10,934,000 | | |
| Computer Peripherals — 4.5% | |
| Hewlett-Packard Co. | | | 650,000 | | | $ | 25,181,000 | | |
| International Business Machines Corp. | | | 250,000 | | | | 23,082,500 | | |
| NCR Corp.(2) | | | 160,000 | | | | 6,643,200 | | |
| | | $ | 54,906,700 | | |
| Security | | Shares | | Value | |
| Diversified Financial Services — 6.4% | |
| Bank of America Corp. | | | 500,000 | | | $ | 26,935,000 | | |
| Citigroup, Inc. | | | 500,000 | | | | 25,080,000 | | |
| J.P.Morgan Chase & Co. | | | 550,000 | | | | 26,092,000 | | |
| | | $ | 78,107,000 | | |
| Diversified Telecommunication Services — 4.1% | |
| AT&T, Inc. | | | 700,000 | | | $ | 23,975,000 | | |
| Verizon Communications, Inc. | | | 600,000 | | | | 22,200,000 | | |
| Windstream Corp. | | | 258,481 | | | | 3,546,359 | | |
| | | $ | 49,721,359 | | |
| Electric Utilities — 4.8% | |
| Entergy Corp. | | | 200,000 | | | $ | 17,166,000 | | |
| Exelon Corp. | | | 400,000 | | | | 24,792,000 | | |
| FPL Group, Inc.(1) | | | 325,000 | | | | 16,575,000 | | |
| | | $ | 58,533,000 | | |
| Energy Equipment & Services — 1.5% | |
| GlobalSantaFe Corp. | | | 150,000 | | | $ | 7,785,000 | | |
| Transocean, Inc.(2) | | | 150,000 | | | | 10,881,000 | | |
| | | $ | 18,666,000 | | |
| Food & Staples Retailing — 2.4% | |
| Safeway, Inc. | | | 400,000 | | | $ | 11,744,000 | | |
| Wal-Mart Stores, Inc. | | | 350,000 | | | | 17,248,000 | | |
| | | $ | 28,992,000 | | |
| Food Products — 1.7% | |
| Nestle SA(3) | | | 60,000 | | | $ | 20,506,207 | | |
| | | $ | 20,506,207 | | |
| Health Care Providers & Services — 0.5% | |
| Quest Diagnostics, Inc. | | | 125,000 | | | $ | 6,217,500 | | |
| | | $ | 6,217,500 | | |
| Hotels, Restaurants & Leisure — 1.2% | |
| McDonald's Corp. | | | 350,000 | | | $ | 14,672,000 | | |
| | | $ | 14,672,000 | | |
See notes to financial statements
17
Tax-Managed Value Portfolio as of October 31, 2006
PORTFOLIO OF INVESTMENTS CONT'D
| Security | | Shares | | Value | |
| Household Durables — 0.6% | |
| Lennar Corp., Class A(1) | | | 150,000 | | | $ | 7,122,000 | | |
| | | $ | 7,122,000 | | |
| Household Products — 1.1% | |
| Kimberly-Clark Corp. | | | 200,000 | | | $ | 13,304,000 | | |
| | | $ | 13,304,000 | | |
| Insurance — 7.5% | |
| Allstate Corp. | | | 100,000 | | | $ | 6,136,000 | | |
| American International Group, Inc. | | | 300,000 | | | | 20,151,000 | | |
| AON Corp. | | | 325,000 | | | | 11,306,750 | | |
| Hartford Financial Services Group, Inc. | | | 250,000 | | | | 21,792,500 | | |
| MetLife, Inc. | | | 100,000 | | | | 5,713,000 | | |
| Progressive Corp. | | | 200,000 | | | | 4,834,000 | | |
| St. Paul Travelers Cos., Inc. (The) | | | 400,000 | | | | 20,452,000 | | |
| | | $ | 90,385,250 | | |
| Machinery — 3.0% | |
| Caterpillar, Inc. | | | 200,000 | | | $ | 12,142,000 | | |
| Deere & Co. | | | 200,000 | | | | 17,026,000 | | |
| Eaton Corp. | | | 100,000 | | | | 7,243,000 | | |
| | | $ | 36,411,000 | | |
| Media — 2.8% | |
| Time Warner, Inc. | | | 1,000,000 | | | $ | 20,010,000 | | |
| Walt Disney Co. | | | 425,000 | | | | 13,370,500 | | |
| | | $ | 33,380,500 | | |
| Metals & Mining — 2.2% | |
| Alcoa, Inc. | | | 325,000 | | | $ | 9,395,750 | | |
| Phelps Dodge Corp. | | | 170,000 | | | | 17,064,600 | | |
| | | $ | 26,460,350 | | |
| Multiline Retail — 2.4% | |
| J.C. Penney Company, Inc. | | | 300,000 | | | $ | 22,569,000 | | |
| Target Corp. | | | 100,000 | | | | 5,918,000 | | |
| | | $ | 28,487,000 | | |
| Multi-Utilities — 1.7% | |
| Dominion Resources, Inc. | | | 250,000 | | | $ | 20,247,500 | | |
| | | $ | 20,247,500 | | |
| Security | | Shares | | Value | |
| Oil, Gas & Consumable Fuels — 11.6% | |
| Apache Corp. | | | 200,000 | | | $ | 13,064,000 | | |
| Chesapeake Energy Corp. | | | 200,000 | | | | 6,488,000 | | |
| Chevron Corp. | | | 300,000 | | | | 20,160,000 | | |
| ConocoPhillips | | | 250,000 | | | | 15,060,000 | | |
| Exxon Mobil Corp. | | | 400,000 | | | | 28,568,000 | | |
| Marathon Oil Corp. | | | 100,000 | | | | 8,640,000 | | |
| Occidental Petroleum Corp. | | | 500,000 | | | | 23,470,000 | | |
| Peabody Energy Corp. | | | 300,000 | | | | 12,591,000 | | |
| Valero Energy Corp. | | | 250,000 | | | | 13,082,500 | | |
| | | $ | 141,123,500 | | |
| Paper and Forest Products — 1.0% | |
| Weyerhaeuser Co. | | | 200,000 | | | $ | 12,718,000 | | |
| | | $ | 12,718,000 | | |
| Pharmaceuticals — 8.0% | |
| Abbott Laboratories | | | 250,000 | | | $ | 11,877,500 | | |
| Eli Lilly & Co. | | | 350,000 | | | | 19,603,500 | | |
| Johnson & Johnson | | | 300,000 | | | | 20,220,000 | | |
| Merck & Co., Inc. | | | 200,000 | | | | 9,084,000 | | |
| Sanofi-Aventis ADR(1) | | | 300,000 | | | | 12,807,000 | | |
| Wyeth | | | 450,000 | | | | 22,963,500 | | |
| | | $ | 96,555,500 | | |
| Real Estate Investment Trusts (REITs) — 3.1% | |
| AMB Property Corp. | | | 110,000 | | | $ | 6,425,100 | | |
| AvalonBay Communities, Inc. | | | 100,000 | | | | 13,106,000 | | |
| General Growth Properties, Inc. | | | 100,000 | | | | 5,190,000 | | |
| Host Hotels & Resorts, Inc.(1) | | | 275,000 | | | | 6,341,500 | | |
| Public Storage, Inc.(1) | | | 75,000 | | | | 6,728,250 | | |
| | | $ | 37,790,850 | | |
| Road & Rail — 1.6% | |
| Burlington Northern Santa Fe Corp. | | | 250,000 | | | $ | 19,382,500 | | |
| | | $ | 19,382,500 | | |
| Semiconductors & Semiconductor Equipment — 0.4% | |
| Taiwan Semiconductor Manufacturing Co., Ltd. ADR | | | 514,995 | | | $ | 4,995,451 | | |
| | | $ | 4,995,451 | | |
See notes to financial statements
18
Tax-Managed Value Portfolio as of October 31, 2006
PORTFOLIO OF INVESTMENTS CONT'D
| Security | | Shares | | Value | |
| Specialty Retail — 0.9% | |
| Home Depot, Inc. | | | 160,250 | | | $ | 5,982,133 | | |
| TJX Companies, Inc. | | | 150,000 | | | | 4,342,500 | | |
| | | $ | 10,324,633 | | |
| Thrifts & Mortgage Finance — 2.2% | |
| Countrywide Financial Corp. | | | 260,000 | | | $ | 9,911,200 | | |
| Washington Mutual, Inc.(1) | | | 400,000 | | | | 16,920,000 | | |
| | | $ | 26,831,200 | | |
| Tobacco — 2.3% | |
| Altria Group, Inc. | | | 350,000 | | | $ | 28,465,500 | | |
| | | $ | 28,465,500 | | |
| Wireless Telecommunication Services — 1.1% | |
| Alltel Corp.(1) | | | 250,000 | | | $ | 13,327,500 | | |
| | | $ | 13,327,500 | | |
Total Common Stocks
(identified cost $775,520,281) | | | | | | $ | 1,189,587,700 | | |
Short-Term Investments — 5.3%
| Security | | Principal
Amount
(000's omitted) | | Value | |
Eaton Vance Cash Collateral Fund, LLC,
5.30%(4) | | $ | 41,883 | | | $ | 41,882,795 | | |
Societe Generale Time Deposit,
5.31%, 11/1/06 | | | 22,327 | | | | 22,327,000 | | |
Total Short-Term Investments
(at amortized cost, $64,209,795) | | | | $ | 64,209,795 | | |
Total Investments — 103.4%
(identified cost $839,730,076) | | | | $ | 1,253,797,495 | | |
| Other Assets, Less Liabilities — (3.4)% | | | | $ | (40,801,618 | ) | |
| Net Assets — 100.0% | | | | $ | 1,212,995,877 | | |
ADR - American Depository Receipt
(1) All or a portion of these securities were on loan at October 31, 2006.
(2) Non-income producing security.
(3) Foreign security.
(4) Affiliated fund that is available only to Eaton Vance portfolios and funds. The rate shown is the annualized seven-day yield as of October 31, 2006.
See notes to financial statements
19
Tax-Managed Value Portfolio as of October 31, 2006
FINANCIAL STATEMENTS
Statement of Assets and Liabilities
As of October 31, 2006
| Assets | |
Investments, at value including $40,507,127 of securities on loan
(identified cost, $839,730,076) | | $ | 1,253,797,495 | | |
| Cash | | | 345 | | |
| Dividends and interest receivable | | | 1,871,060 | | |
| Tax reclaim receivable | | | 238,826 | | |
| Total assets | | $ | 1,255,907,726 | | |
| Liabilities | |
| Collateral for securities loaned | | $ | 41,882,795 | | |
| Payable to affiliate for investment advisory fees | | | 640,396 | | |
| Accrued expenses | | | 388,658 | | |
| Total liabilities | | $ | 42,911,849 | | |
| Net Assets applicable to investors' interest in Portfolio | | $ | 1,212,995,877 | | |
| Sources of Net Assets | |
| Net proceeds from capital contributions and withdrawals | | $ | 798,922,220 | | |
| Net unrealized appreciation (computed on the basis of identified cost) | | | 414,073,657 | | |
| Total | | $ | 1,212,995,877 | | |
Statement of Operations
For the Year Ended
October 31, 2006
| Investment Income | |
| Dividends (net of foreign taxes, $169,605) | | $ | 24,334,408 | | |
| Interest | | | 1,038,814 | | |
| Security lending income | | | 47,503 | | |
| Total investment income | | $ | 25,420,725 | | |
| Expenses | |
| Investment adviser fee | | $ | 6,866,794 | | |
| Trustees' fees and expenses | | | 23,008 | | |
| Custodian fee | | | 306,003 | | |
| Legal and accounting services | | | 69,222 | | |
| Miscellaneous | | | 42,961 | | |
| Total expenses | | $ | 7,307,988 | | |
Deduct —
Reduction of custodian fee | | $ | 34 | | |
| Reduction of investment adviser fee | | | 23,078 | | |
| Total expense reductions | | $ | 23,112 | | |
| Net expenses | | $ | 7,284,876 | | |
| Net investment income | | $ | 18,135,849 | | |
| Realized and Unrealized Gain (Loss) | |
Net realized gain (loss) —
Investment transactions (identified cost basis) | | $ | 30,310,161 | | |
| Foreign currency transactions | | | 5,222 | | |
| Net realized gain | | $ | 30,315,383 | | |
Change in unrealized appreciation (depreciation) —
Investments (identified cost basis) | | $ | 142,139,162 | | |
| Foreign currency | | | 9,428 | | |
| Net change in unrealized appreciation (depreciation) | | $ | 142,148,590 | | |
| Net realized and unrealized gain | | $ | 172,463,973 | | |
| Net increase in net assets from operations | | $ | 190,599,822 | | |
See notes to financial statements
20
Tax-Managed Value Portfolio as of October 31, 2006
FINANCIAL STATEMENTS CONT'D
Statements of Changes in Net Assets
Increase (Decrease)
in Net Assets | | Year Ended
October 31, 2006 | | Year Ended
October 31, 2005 | |
From operations —
Net investment income | | $ | 18,135,849 | | | $ | 12,436,589 | | |
Net realized gain from investment and
foreign currency transactions | | | 30,315,383 | | | | 24,467,870 | | |
Net change in unrealized
appreciation (depreciation)
from investments and foreign currency | | | 142,148,590 | | | | 89,722,265 | | |
| Net increase in net assets from operations | | $ | 190,599,822 | | | $ | 126,626,724 | | |
Capital transactions —
Contributions | | $ | 223,007,191 | | | $ | 147,375,650 | | |
| Withdrawals | | | (146,685,668 | ) | | | (125,350,738 | ) | |
Net increase in net assets from
capital transactions | | $ | 76,321,523 | | | $ | 22,024,912 | | |
| Net increase in net assets | | $ | 266,921,345 | | | $ | 148,651,636 | | |
| Net Assets | |
| At beginning of year | | $ | 946,074,532 | | | $ | 797,422,896 | | |
| At end of year | | $ | 1,212,995,877 | | | $ | 946,074,532 | | |
See notes to financial statements
21
Tax-Managed Value Portfolio as of October 31, 2006
FINANCIAL STATEMENTS CONT'D
Supplementary Data
| | | Year Ended October 31, | |
| | | 2006 | | 2005 | | 2004 | | 2003 | | 2002 | |
| Ratios/Supplemental Data | |
| Ratios (As a percentage of average daily net assets): | |
| Expenses before custodian fee reduction(1) | | | 0.67 | % | | | 0.68 | % | | | 0.69 | % | | | 0.70 | % | | | 0.72 | % | |
| Expenses after custodian fee reduction(1) | | | 0.67 | % | | | 0.68 | % | | | 0.69 | % | | | 0.70 | % | | | 0.72 | % | |
| Net investment income | | | 1.67 | % | | | 1.40 | % | | | 1.57 | % | | | 1.47 | % | | | 0.99 | % | |
| Portfolio Turnover | | | 26 | % | | | 40 | % | | | 44 | % | | | 76 | % | | | 213 | % | |
| Total Return | | | 19.53 | % | | | 15.76 | % | | | 13.55 | % | | | 16.40 | % | | | (7.99 | )% | |
| Net assets, end of year (000's omitted) | | $ | 1,212,996 | | | $ | 946,075 | | | $ | 797,423 | | | $ | 673,412 | | | $ | 562,361 | | |
(1) The advisor voluntarily waived a portion of its investment advisory fee (equal to an amount less than 0.005% of average net assets, for 2006 and 2005, respectively).
See notes to financial statements
22
Tax-Managed Value Portfolio as of October 31, 2006
NOTES TO FINANCIAL STATEMENTS
1 Significant Accounting Policies
Tax-Managed Value Portfolio (the Portfolio) is registered under the Investment Company Act of 1940, as amended, as a diversified open-end management investment company. The Portfolio, which was organized as a trust under the laws of the State of New York on February 13, 2001, seeks to achieve long-term after-tax returns by investing in a diversified portfolio of value stocks. The Declaration of Trust permits the Trustees to issue interests in the Portfolio. At October 31, 2006, the Eaton Vance Tax-Managed Value Fund and Eaton Vance Tax-Managed Equity Asset Allocation Fund held approximately 89.0% and 11.0%, respectively, of the interest in the Portfolio. The following is a summary of significant accounting policies consistently followed by the Portfolio in the preparation of its financial statements. The policies are in conformity with accounting principles generally accepted in the United States of America.
A Investment Valuation — Securities listed on a U.S. securities exchange generally are valued at the last sale price on the day of valuation or, if no sales took place on such date, at the mean between the closing bid and asked prices therefore on the exchange where such securities are principally traded. Equity securities listed on the NASDAQ National Market System generally are valued at the official NASDAQ closing price. Unlisted or listed securities for which closing sales prices or closing quotations are not available are valued at the mean between the latest available bid and asked prices or, in the case of preferred equity securities that are not listed or traded in the over-the-counter market, by an independent pricing service. Exchange-traded options are valued at the last sale price for the day of valuation as quoted on the principal exchange or board of trade on which the options are traded or, in the absence of sales on such date, at the mean between the latest bid and asked prices therefore. Futures positions on securities and currencies generally are valued at closing settlement prices. Short-term debt securities with a remaining maturity of 60 days or less are valued at amortized cost. If short-term debt securities are acquired with a remaining maturity of more than 60 days, they will be valued by a pricing service. Other fixed income and debt securities, including listed securities and securities for which price quotations are available, will normally be valued on the basis of valuations furnished by a pricing service. Foreign securities and currencies are valued in U.S. dollars, based on foreign currency exchange rate quotations supplied by an independent quotation service. The daily val uation of exchange-traded foreign securities generally is determined as of the close of trading on the principal exchange on which such securities trade. Events occurring after the close of trading on foreign exchanges may result in adjustments to the valuation of foreign securities to more accurately reflect their fair value as of the close of regular trading on the New York Stock Exchange. When valuing foreign equity securities that meet certain criteria, the Trustees have approved the use of a fair value service that values such securities to reflect market trading that occurs after the close of the applicable foreign markets of comparable securities or other instruments that have a strong correlation to the fair-valued securities. Investments held by the Portfolio for which valuations or market quotations are unavailable are valued at fair value using methods determined in good faith by or at the direction of the Trustees of the Port folio considering relevant factors, data and information including the market value of freely tradable securities of the same class in the principal market on which such securities are normally traded.
B Income — Dividend income is recorded on the ex-dividend date for dividends received in cash and/or securities. However, if the ex-dividend date has passed, certain dividends from foreign securities are recorded as the Portfolio is informed of the ex-dividend date. Withholding taxes on foreign dividends and capital gains have been provided for in accordance with the Portfolio's understanding of the applicable countries' tax rules and rates. Interest income is recorded on the basis of interest accrued, adjusted for amortization of premium or accretion of discount.
C Federal Taxes — The Portfolio has elected to be treated as a partnership for federal tax purposes. No provision is made by the Portfolio for federal or state taxes on any taxable income of the Portfolio because each investor in the Portfolio is ultimately responsible for the payment of any taxes on its share of taxable income. Since at least one of the Portfolio's investors is a regulated investment company that invests all or substantially all of its assets in the Portfolio, the Portfolio normally must satisfy the applicable source of income and diversification requirements (under the Internal Revenue Code) in order for its investors to satisfy them. The Portfolio will allocate, at least annually a mong its investors, each investor's distributive share of the Portfolio's net investment income, net realized capital gains, and any other items of income, gain, loss, deduction or credit.
D Financial Futures Contract — Upon entering a financial futures contract, the Portfolio is required to deposit (initial margin) either in cash or securities an amount equal to a certain percentage of the purchase price indicated in the financial futures contract. Subsequent payments are made or received by the Portfolio (margin maintenance) each day, dependent on daily fluctuations in the value of the underlying security and are recorded for book purposes as unrealized gains
23
Tax-Managed Value Portfolio as of October 31, 2006
NOTES TO FINANCIAL STATEMENTS CONT'D
or losses by the Portfolio. The Portfolio's investment in financial futures contracts is designed to hedge against anticipated future changes in price of current or anticipated Portfolio positions. Should prices move unexpectedly, the Portfolio may not achieve the anticipated benefits of the financial futures contracts and may realize a loss.
E Expense Reduction — Investors Bank & Trust Company (IBT) serves as custodian of the Portfolio. Pursuant to the custodian agreement, IBT receives a fee reduced by credits which are determined based on the average daily cash balance the Portfolio maintains with IBT. All credit balances used to reduce the Portfolio's custodian fees are reported as a reduction of expenses in the Statement of Operations.
F Use of Estimates — The preparation of the financial statements in conformity with accounting principles generally accepted in the United States of America requires management to make estimates and assumptions that affect the reported amounts of assets and liabilities at the date of the financial statements and the reported amounts of income and expense during the reporting period. Actual results could differ from those estimates.
G Indemnifications — Under the Portfolio's organizational documents, its officers and Trustees may be indemnified against certain liabilities and expenses arising out of the performance of their duties to the Portfolio. Interestholders in the Portfolio are jointly and severally liable for the liabilities and obligations of the Portfolio in the event that the Portfolio fails to satisfy such liabilities and obligations; provided, however, that, to the extent assets are available in the Portfolio, the Portfolio may, under certain circumstances, indemnify interestholders from and against any claim or liability to which such holder may become subject by reason of being or having been an interestholder in t he Portfolio. Additionally, in the normal course of business, the Portfolio enters into agreements with service providers that may contain indemnification clauses. The Portfolio's maximum exposure under these arrangements is unknown as this would involve future claims that may be made against the Portfolio that have not yet occurred.
H Other — Investment transactions are accounted for on the date the securities are purchased or sold. Realized gains and losses on securities sold are determined on the basis of identified cost.
2 Investment Adviser Fee and Other Transactions with Affiliates
The investment adviser fee is earned by Boston Management and Research (BMR), a wholly-owned subsidiary of Eaton Vance Management (EVM), as compensation for management and investment advisory services rendered to the Portfolio. Under the advisory agreement, BMR receives a monthly advisory fee in the amount of 0.65% annually of average daily net assets of the Portfolio up to $500 million, 0.625% of average net assets of $500 million but less than $1 billion , 0.600% of average net assets of $1 billion but less than $2 billion, 0.575% of average net assets of $2 billion but less than $5 billion, and 0.555% of average net assets of $5 billion and over. For the year ended October 31, 2006, the advisory fee amounted to $6,866,794. EVM has also agreed to reduce the investment adviser fee by an amount equal to that portion of commissions paid to broker dealers in execution of portfolio transactions attributed to the Portfolio that is c onsideration for third-party research services. Pursuant to this agreement, EVM waived $23,078 of its advisory fee for the year ended October 31, 2006. Except for Trustees of the Portfolio who are not members of EVM's or BMR's organization, officers and Trustees receive remuneration for their services to the Portfolio out of the investment adviser fee. Trustees of the Portfolio that are not affiliated with BMR may elect to defer receipt of all or a percentage of their annual fees in accordance with the terms of the Trustees Deferred Compensation Plan. For the year ended October 31, 2006, no significant amounts have been deferred. Certain officers and Trustees of the Portfolio are officers of the above organizations.
3 Investment Transactions
Purchases and sales of investments, other than short-term obligations, aggregated $371,145,382 and $278,377,811, respectively, for the year ended October 31, 2006.
4 Securities Lending Agreement
The Portfolio has established a securities lending agreement with a securities lending agent, IBT, in which the Portfolio lends portfolio securities to qualified borrowers in exchange for collateral consisting of either cash or U. S. government securities in an amount at least equal to the market value of the securities on loan. Cash collateral is invested in the Eaton Vance Cash Collateral Fund, LLC (Cash Collateral Fund). The Cash Collateral Fund invests in high quality money market instruments. Under the agreement, the Portfolio continues to earn interest on the amount invested but it must also pay the broker a loan rebate fee computed as a varying percentage of the collateral received. In addition, the
24
Tax-Managed Value Portfolio as of October 31, 2006
NOTES TO FINANCIAL STATEMENTS CONT'D
Portfolio pays IBT a lending agent fee computed as a percentage of the earnings on the collateral invested less the loan rebate fee. The loan rebate fee and lending agent fee paid by the Portfolio offsets a portion of the interest income received and amounted to $1,766,943 and $8,373, respectively, for the year ended October 31, 2006. At October 31, 2006, the value of the securities loaned and the value of the collateral amounted to $40,507,127 and $41,882,795, respectively. In the event of counterparty default, the Portfolio is subject to potential loss if it is delayed or prevented from exercising its right to dispose of the collateral. The Portfolio bears risk in the event that invested collateral is not sufficient to meet obligations due on loans.
5 Federal Income Tax Basis of Unrealized Appreciation (Depreciation)
The cost and unrealized appreciation (depreciation) in value of the investments owned at October 31, 2006, as computed on a federal income tax basis, were as follows:
| Aggregate cost | | $ | 841,175,364 | | |
| Gross unrealized appreciation | | $ | 412,791,470 | | |
| Gross unrealized depreciation | | | (169,339 | ) | |
| Net unrealized appreciation | | $ | 412,622,131 | | |
6 Financial Instruments
The Portfolio may trade in financial instruments with off-balance sheet risk in the normal course of its investing activities to assist in managing exposure to various market risks. These financial instruments include written options, forward foreign currency exchange contracts, and financial futures contracts and may involve, to a varying degree, elements of risk in excess of the amounts recognized for financial statement purposes. The notional or contractual amounts of these instruments represent the investment the Portfolio has in particular classes of financial instruments and does not necessarily represent the amounts potentially subject to risk. The measurement of the risks associated with these instruments is meaningful only when all related and offsetting transactions are considered. The Portfolio did not have any open obligations under these financial instruments at October 31, 2006.
7 Line of Credit
The Portfolio participates with other portfolios and funds managed by BMR and EVM and its affiliates in a $150 million unsecured line of credit agreement with a group of banks. Borrowings will be made by the Portfolio solely to facilitate the handling of unusual and/or unanticipated short-term cash requirements. Interest is charged to each participating portfolio or fund based on its borrowings at an amount above either the Eurodollar rate or Federal Funds rate. In addition, a fee computed at an annual rate of 0.10% on the daily unused portion of the line of credit is allocated among the participating portfolios and funds at the end of each quarter. The Portfolio did not have any significant borrowings or allocated fees during the year ended October 31, 2006.
8 Recently Issued Accounting Pronouncements
In June 2006, the Financial Accounting Standards Board ("FASB") issued FASB Interpretation No. 48, ("FIN 48") "Accounting for Uncertainty in Income Taxes – an interpretation of FASB Statement No. 109". FIN 48 clarifies the accounting for uncertainty in income taxes recognized in accordance with FASB Statement No. 109, "Accounting for Income Taxes." This interpretation prescribes a recognition threshold and measurement attribute for the financial statement recognition and measurement of a tax position taken or expected to be taken in a tax return. It also provides guidance on de-recognition, classification, interest and penalties, accounting in interim periods, disclosure and transition. FIN 48 is effective for fiscal years beginning after December 15, 2006. Management is currently evaluating the impact of applying the various provisions of FIN 48.
In September 2006, the Financial Accounting Standards Board ("FASB") issued Statement of Financial Accounting Standards No. 157, ("FAS 157") "Fair Value Measurements". FAS 157 defines fair value, establishes a framework for measuring fair value in accordance with generally accepted accounting principles and expands disclosure about fair value measurements. FAS 157 is effective for fiscal years beginning after November 15, 2007. Management is currently evaluating the impact the adoption of FAS 157 will have on the Trusts' financial statement disclosures.
25
Tax-Managed Value Portfolio as of October 31, 2006
REPORT OF INDEPENDENT REGISTERED PUBLIC ACCOUNTING FIRM
To the Trustees and Investors
of Tax-Managed Value Portfolio:
We have audited the accompanying statement of assets and liabilities of Tax-Managed Value Portfolio (the Portfolio), including the portfolio of investments as of October 31, 2006, the related statement of operations for the year then ended, the statement of changes in net assets for each of the two years in the period then ended and the supplementary data for each of the five years in the period then ended. These financial statements and supplementary data are the responsibility of the Portfolio's management. Our responsibility is to express an opinion on these financial statements and supplementary data based on our audits.
We conducted our audits in accordance with the standards of the Public Company Accounting Oversight Board (United States). Those standards require that we plan and perform the audit to obtain reasonable assurance about whether the financial statements and supplementary data are free of material misstatement. The Portfolio is not required to have, nor were we engaged to perform, an audit of its internal control over financial reporting. Our audits included consideration of internal control over financial reporting as a basis for designing audit procedures that are appropriate in the circumstances, but not for the purpose of expressing an opinion on the effectiveness of the Portfolio's internal control over financial reporting. Accordingly, we express no such opinion. An audit also includes examining, on a test basis, evidence supporting the amounts and disclosures in the financial statements, assessing the accounting principles u sed and significant estimates made by management, as well as evaluating the overall financial statement presentation. Our procedures included confirmation of securities owned as of October 31, 2006 by correspondence with the custodian and brokers; where replies were not received from brokers, we performed other auditing procedures. We believe that our audits provide a reasonable basis for our opinion.
In our opinion, the financial statements and supplementary data referred to above present fairly, in all material respects, the financial position of the Tax-Managed Value Portfolio as of October 31, 2006, the results of its operations for the year then ended, the changes in its net assets for each of the two years in the period then ended, and the supplementary data for each of the five years in the period then ended, in conformity with accounting principles generally accepted in the
United States of America.
DELOITTE & TOUCHE LLP
Boston, Massachusetts
December 15, 2006
26
Eaton Vance Tax-Managed Value Fund
BOARD OF TRUSTEES' ANNUAL APPROVAL OF THE INVESTMENT ADVISORY AGREEMENT
Overview of the Contract Review Process
The Investment Company Act of 1940, as amended (the "1940 Act"), provides, in substance, that each investment advisory agreement between a fund and its investment adviser will continue in effect from year to year only if its continuance is approved at least annually by the fund's board of trustees, including by a vote of a majority of the trustees who are not "interested persons" of the fund ("Independent Trustees") cast in person at a meeting called for the purpose of considering such approval.
At a meeting of the Boards of Trustees (each a "Board") of the Eaton Vance group of mutual funds (the "Eaton Vance Funds") held on March 27, 2006, the Board, including a majority of the Independent Trustees, voted to approve continuation of existing advisory and sub-advisory agreements for the Eaton Vance Funds for an additional one-year period. In voting its approval, the Board relied upon the affirmative recommendation of the Special Committee of the Board, which is a committee comprised exclusively of Independent Trustees. Prior to making its recommendation, the Special Committee reviewed information furnished for a series of meetings of the Special Committee held in February and March 2006. Such information included, among other things, the following:
Information about Fees, Performance and Expenses
• An independent report comparing the advisory and related fees paid by each fund with fees paid by comparable funds;
• An independent report comparing each fund's total expense ratio and its components to comparable funds;
• An independent report comparing the investment performance of each fund to the investment performance of comparable funds over various time periods;
• Data regarding investment performance in comparison to relevant peer groups of funds and appropriate indices;
• Comparative information concerning fees charged by each adviser for managing other mutual funds and institutional accounts using investment strategies and techniques similar to those used in managing the fund;
• Profitability analyses for each adviser with respect to each fund managed by it;
Information about Portfolio Management
• Descriptions of the investment management services provided to each fund, including the investment strategies and processes employed;
• Information concerning the allocation of brokerage and the benefits received by each adviser as a result of brokerage allocation, including information concerning the acquisition of research through "soft dollar" benefits received in connection with the funds' brokerage, and the implementation of a soft dollar reimbursement program established with respect to the funds;
• Data relating to portfolio turnover rates of each fund;
• The procedures and processes used to determine the fair value of fund assets and actions taken to monitor and test the effectiveness of such procedures and processes;
Information about each Adviser
• Reports detailing the financial results and condition of each adviser;
• Descriptions of the qualifications, education and experience of the individual investment professionals whose responsibilities include portfolio management and investment research for the funds, and information relating to their compensation and responsibilities with respect to managing other mutual funds and investment accounts;
• Copies of the Codes of Ethics of each adviser and its affiliates, together with information relating to compliance with and the administration of such codes;
• Information concerning the resources devoted to compliance efforts undertaken by each adviser and its affiliates on behalf of the funds (including descriptions of various compliance programs) and their record of compliance with investment policies and restrictions, including policies with respect to market-timing, late trading and selective portfolio disclosure, and with policies on personal securities transactions;
• Descriptions of the business continuity and disaster recovery plans of each adviser and its affiliates;
Other Relevant Information
• Information concerning the nature, cost and character of the administrative and other non-investment management services provided by Eaton Vance Management and its affiliates;
• Information concerning management of the relationship with the custodian, subcustodians and fund accountants by each adviser or the funds' administrator; and
• The terms of each advisory agreement.
In addition to the information identified above, the Special Committee considered information provided from time to time by each adviser throughout the year at meetings of the Board and its committees. Over the course of the twelve month period ended March 31,
27
Eaton Vance Tax-Managed Value Fund
BOARD OF TRUSTEES' ANNUAL APPROVAL OF THE INVESTMENT ADVISORY AGREEMENT CONT'D
2006, the Board met nine times and the Special Committee, the Audit Committee and the Governance Committee, each of which is a Committee comprised solely of Independent Trustees, met eight, twelve and five times, respectively. At such meetings, the Trustees received, among other things, presentations by the portfolio managers and other investment professionals of each adviser relating to the investment performance of each fund and the investment strategies used in pursuing the fund's investment objective.
For funds that invest through one or more underlying portfolios, the Board considered similar information about the portfolio(s) when considering the approval of advisory agreements. In addition, in cases where the fund's investment adviser has engaged a sub-adviser, the Board considered similar information about the sub-adviser when considering the approval of any sub-advisory agreement.
The Special Committee was assisted throughout the contract review process by Goodwin Procter LLP, legal counsel for the Independent Trustees. The members of the Special Committee relied upon the advice of such counsel and their own business judgment in determining the material factors to be considered in evaluating each advisory and sub-advisory agreement and the weight to be given to each such factor. The conclusions reached with respect to each advisory and sub-advisory agreement were based on a comprehensive evaluation of all the information provided and not any single factor. Moreover, each member of the Special Committee may have placed varying emphasis on particular factors in reaching conclusions with respect to each advisory and sub-advisory agreement.
Results of the Process
Based on its consideration of the foregoing, and such other information as it deemed relevant, including the factors and conclusions described below, the Special Committee concluded that the continuance of the investment advisory agreement of the Tax-Managed Value Portfolio (the "Portfolio"), the portfolio in which the Eaton Vance Tax-Managed Value Fund (the "Fund") invests, with Boston Management and Research (the "Adviser"), including its fee structure, is in the interests of shareholders and, therefore, the Special Committee recommended to the Board approval of the agreement. The Board accepted the recommendation of the Special Committee as well as the factors considered and conclusions reached by the Special Committee with respect to the agreements. Accordingly, the Board, including a majority of the Independent Trustees, voted to approve continuation of the investment advisory agreement for the Portfolio.
Nature, Extent and Quality of Services
In considering whether to approve the investment advisory agreement of the Portfolio, the Board evaluated the nature, extent and quality of services provided to the Portfolio by the Adviser.
The Board considered the Adviser's management capabilities and investment process with respect to the types of investments held by the Portfolio, including the education, experience and number of its investment professionals and other personnel who provide portfolio management, investment research, and similar services to the Portfolio. The Board specifically noted the Adviser's in-house equity research capabilities and experience managing funds that seek to maximize after-tax returns. The Board also took into account the resources dedicated to portfolio management and other services, including the compensation paid to recruit and retain investment personnel, and the time and attention devoted to each Portfolio in the complex by senior management.
The Board reviewed the compliance programs of the Adviser and relevant affiliates thereof. Among other matters, the Board considered compliance and reporting matters relating to personal trading by investment personnel, selective disclosure of portfolio holdings, late trading, frequent trading, portfolio valuation, business continuity and the allocation of investment opportunities. The Board also evaluated the responses of the Adviser and its affiliates to requests from regulatory authorities such as the Securities and Exchange Commission and the National Association of Securities Dealers.
The Board considered shareholder and other administrative services provided or managed by Eaton Vance Management and its affiliates, including transfer agency and accounting services. The Board evaluated the benefits to shareholders of investing in a fund that is a part of a large family of funds, including the ability, in many cases, to exchange an investment among different funds without incurring additional sales charges.
After consideration of the foregoing factors, among others, the Board concluded that the nature, extent and quality of services provided by the Adviser, taken as a whole, are appropriate and consistent with the terms of the investment advisory agreement.
Fund Performance
The Board compared the Fund's investment performance to a relevant universe of similarly managed funds identified by an independent data provider and appropriate benchmark indices. The Board reviewed comparative performance data for the one-, three- and five-year periods ended September 30, 2005 for the Fund. The Board concluded that the Fund's performance is satisfactory.
28
Eaton Vance Tax-Managed Value Fund
BOARD OF TRUSTEES' ANNUAL APPROVAL OF THE INVESTMENT ADVISORY AGREEMENT CONT'D
Management Fees and Expenses
The Board reviewed contractual investment advisory fee rates, including administrative fees, payable by the Portfolio and the Fund (referred to collectively as "management fees").
As part of its review, the Board considered the management fees, including administrative fees, and the Fund's total expense ratio for the one-year period ended September 30, 2005, as compared to a group of similarly managed funds selected by an independent data provider. The Board noted the small size of the Fund relative to other similarly managed funds.
After reviewing the foregoing information, and in light of the nature, extent and quality of the services provided by the Adviser, the Board concluded that the management fees charged for advisory and related services and the Fund's total expense ratio are reasonable.
Profitability
The Board reviewed the level of profits realized by the Adviser and relevant affiliates thereof in providing investment advisory and administrative services to the Portfolio, the Fund and all Eaton Vance Funds as a group. The Board considered the level of profits realized without regard to revenue sharing or other payments by the Adviser and its affiliates to third parties in respect of distribution services. The Board also considered other direct or indirect benefits received by the Adviser and its affiliates in connection with its relationship with the Portfolio and the Fund, including the benefits of research services that may be available to the Adviser as a result of securities transactions effected for the Portfolio and other advisory clients.
The Board concluded that, in light of the foregoing factors and the nature, extent and quality of the services rendered, the profits realized by the Adviser and its affiliates are reasonable.
Economies of Scale
In reviewing management fees and profitability, the Board also considered the extent to which the Adviser and its affiliates, on the one hand, and the Fund, on the other hand, can expect to realize benefits from economies of scale as the assets of the Fund and the Portfolio increase. The Board acknowledged the difficulty in accurately measuring the benefits resulting from the economies of scale with respect to the management of any specific fund or group of funds. The Board reviewed data summarizing the increases and decreases in the assets of the Fund and of all Eaton Vance Funds as a group over various time periods, and evaluated the extent to which the total expense ratio of the Fund and the profitability of the Adviser and its affiliates may have been affected by such increases or decreases. The Board noted that, at its request, the Adviser had agreed to add two new breakpoints for the Tax-Managed Value Portfolio with respec t to assets that exceed $2 billion and $5 billion. Based upon the foregoing, the Board concluded that the benefits from economies of scale are currently being shared equitably by the Adviser and its affiliates and the Fund. The Board also concluded that, assuming reasonably foreseeable increases in the assets of the Portfolio, the structure of the advisory fee, which includes breakpoints at several asset levels, can be expected to cause the Adviser and its affiliates and the Fund to continue to share such benefits equitably.
29
Eaton Vance Tax-Managed Value Fund
MANAGEMENT AND ORGANIZATION
Fund Management. The Trustees of Eaton Vance Mutual Funds Trust (the Trust) and Tax-Managed Value Portfolio (the Portfolio) are responsible for the overall management and supervision of the Trust's and Portfolio's affairs. The Trustees and officers of the Trust and the Portfolio are listed below. Except as indicated, each individual has held the office shown or other offices in the same company for the last five years. Trustees and officers of the Trust and the Portfolio hold indefinite terms of office. The "noninterested Trustees" consist of those Trustees who are not "interested persons" of the Trust and the Portfolio, as that term is defined under the 1940 Act. The business address of each Trustee and officer is The Eaton Vance Building, 255 State Street, Boston, Massachusetts 02109. As used below, "EVC" refers to Eaton Vance Corp., "EV" refers to Eaton V ance, Inc., "EVM" refers to Eaton Vance Management, "BMR" refers to Boston Management and Research; "Parametric" refers to Parametric Portfolio Associates and "EVD" refers to Eaton Vance Distributors, Inc. EVC and EV are the corporate parent and trustee, respectively, of EVM and BMR. EVD is the Fund's principal underwriter, the Portfolio's placement agent and a wholly-owned subsidiary of EVM. Each officer affiliated with Eaton Vance may hold a position with other Eaton Vance affiliates that is comparable to his or her position with EVM listed below.
Name and
Date of Birth | | Position(s)
with the
Trust and the
Portfolio | | Term of
Office and
Length of
Service | | Principal Occupation(s)
During Past Five Years | | Number of Portfolios
in Fund Complex
Overseen By
Trustee(1) | | Other Directorships Held | |
| Interested Trustee | | | | | | | | | | | | | |
|
| James B. Hawkes 11/9/41 | | Trustee | | Trustee of the Trust
since 1991 and of the Portfolio since 2001 | | Chairman and Chief Executive Officer of EVC, BMR, EVM and EV; Director of EV; Vice President and Director of EVD. Trustee and/or officer of 170 registered investment companies in the Eaton Vance Fund Complex. Mr. Hawkes is an interested person because of his positions with BMR, EVM, EVC and EV, which are affiliates of the Trust and the Portfolio. | | | 170 | | | Director of EVC | |
|
| Noninterested Trustee(s) | | | | | | | | | | | | | |
|
| Benjamin C. Esty 1/2/63 | | Trustee | | Since 2005 | | Roy and Elizabeth Simmons Professor of Business Administration, Harvard University Graduate School of Business Administration (since 2003). Formerly, Associate Professor, Harvard University Graduate School of Business Administration (2000-2003). | | | 170 | | | None | |
|
| Samuel L. Hayes, III 2/23/35 | | Trustee and Chairman of the Board | | Trustee of the Trust
since 1986; of the Portfolio since 2001 and Chairman of the Board since 2005 | | Jacob H. Schiff Professor of Investment Banking Emeritus, Harvard University Graduate School of Business Administration. Director of Yakima Products, Inc. (manufacturer of automotive accessories) (since 2001) and Director of Telect, Inc. (telecommunications services company). | | | 170 | | | Director of Tiffany & Co. (specialty retailer) | |
|
| William H. Park 9/19/47 | | Trustee | | Since 2003 | | Vice Chairman, Commercial Industrial Finance Corp. (specialty finance company) (since 2006). Formerly, President and Chief Executive Officer, Prizm Capital Management, LLC (investment management firm) (2002-2005). Formerly, Executive Vice President and Chief Financial Officer, United Asset Management Corporation (a holding company owning institutional investment management firms) (1982-2001). | | | 170 | | | None | |
|
| Ronald A. Pearlman 7/10/40 | | Trustee | | Since 2003 | | Professor of Law, Georgetown University Law Center. | | | 170 | | | None | |
|
30
Eaton Vance Tax-Managed Value Fund
MANAGEMENT AND ORGANIZATION CONT'D
Name and
Date of Birth | | Position(s)
with the
Trust and the
Portfolio | | Term of
Office and
Length of
Service | | Principal Occupation(s)
During Past Five Years | | Number of Portfolios
in Fund Complex
Overseen By
Trustee(1) | | Other Directorships Held | |
| Noninterested Trustee(s) (continued) | | | | | | | | | | | | | |
|
| Norton H. Reamer 9/21/35 | | Trustee | | Trustee of the Trust since 1986 and of the Portfolio since 2001 | | President, Chief Executive Officer and a Director of Asset Management Finance Corp. (a specialty finance company serving the investment management industry) (since October 2003). President, Unicorn Corporation (an investment and financial advisory services company) (since September 2000). Formerly, Chairman and Chief Operating Officer, Hellman, Jordan Management Co., Inc. (an investment management company) (2000-2003). Formerly, Advisory Director of Berkshire Capital Corporation (investment banking firm) (2002-2003). | | | 170 | | | None | |
|
| Lynn A. Stout 9/14/57 | | Trustee | | Trustee of the Trust since 1998 and of the Portfolio since 2001 | | Professor of Law, University of California at Los Angeles School of Law. | | | 170 | | | None | |
|
| Ralph F. Verni 1/26/43 | | Trustee | | Since 2005 | | Consultant and private investor. | | | 170 | | | None | |
|
| Principal Officers who are not Trustees | | | | | | | | | | | | | |
|
Name and
Date of Birth | | Position(s)
with the
Trust and the
Portfolio | | Term of
Office and
Length of
Service | | Principal Occupation(s)
During Past Five Years | |
| Thomas E. Faust Jr. 5/31/58 | | President of the Trust | | Since 2002 | | President of EVC, EVM, BMR and EV and Director of EVC. Chief Investment Officer of EVC, EVM and BMR. Officer of 71 registered investment companies and 5 private investment companies managed by EVM or BMR. | |
|
| William H. Ahern, Jr. 7/28/59 | | Vice President
of the Trust | | Since 1995 | | Vice President of EVM and BMR. Officer of 71 registered investment companies managed by EVM or BMR. | |
|
| Cynthia J. Clemson 3/2/63 | | Vice President
of the Trust | | Since 2005 | | Vice President of EVM and BMR. Officer of 86 registered investment companies managed by EVM or BMR. | |
|
| Aamer Khan 6/7/60 | | Vice President
of the Trust | | Since 2005 | | Vice President of EVM and BMR. Officer of 29 registered investment companies managed by EVM or BMR. | |
|
| Thomas H. Luster 4/8/62 | | Vice President
of the Trust | | Since 2006 | | Vice President of EVM and BMR. Officer of 45 registered investment companies managed by EVM or BMR. | |
|
| Michael R. Mach 7/15/47 | | Vice President | | Vice President of the Trust since 1999 and of the Portfolio since 2001 | | Vice President of EVM and BMR. Officer of 51 registered investment companies managed by EVM or BMR. | |
|
| Robert B. MacIntosh 1/22/57 | | Vice President
of the Trust | | Since 1998 | | Vice President of EVM and BMR. Officer of 86 registered investment companies managed by EVM or BMR. | |
|
| Cliff Quisenberry, Jr. 1/1/65 | | Vice President
of the Trust | | Since 2006 | | Vice President and Director of Research and Product Development of Parametric. Officer of 30 registered investment companies managed by EVM or BMR. | |
|
| Duncan W. Richardson 10/26/57 | | Vice President of the Trust; President of the Portfolio | | Vice President of the Trust since 2001 and President of the Portfolio since 2002 | | Executive Vice President and Chief Equity Investment Officer of EVC, EVM and BMR. Officer of 71 registered investment companies managed by EVM or BMR. | |
|
31
Eaton Vance Tax-Managed Value Fund
MANAGEMENT AND ORGANIZATION CONT'D
| Principal Officers who are not Trustees (continued) | |
|
Name and
Date of Birth | | Position(s)
with the
Trust and the
Portfolio | | Term of
Office and
Length of
Service | | Principal Occupation(s)
During Past Five Years | |
| Walter A. Row, III 7/20/57 | | Vice President
of the Trust | | Since 2001 | | Director of Equity Research and a Vice President of EVM and BMR. Officer of 33 registered investment companies managed by EVM or BMR. | |
|
| Judith A. Saryan 8/21/54 | | Vice President
of the Trust | | Since 2003 | | Vice President of EVM and BMR. Officer of 50 registered investment companies managed by EVM or BMR. | |
|
| Susan Schiff 3/13/61 | | Vice President
of the Trust | | Since 2002 | | Vice President of EVM and BMR. Officer of 30 registered investment companies managed by EVM or BMR. | |
|
| Barbara E. Campbell 6/19/57 | | Treasurer of
the Trust | | Since 2005(2) | | Vice President of EVM and BMR. Officer of 170 registered investment companies managed by EVM or BMR. | |
|
| Kevin M. Connerty 4/20/64 | | Treasurer of
the Portfolio | | Since 2005 | | Vice President of EVM and BMR. Previously, Director and Vice President of PFPC Inc. (1999-2005). Officer of 97 registered investment companies managed by EVM or BMR. | |
|
| Alan R. Dynner 10/10/40 | | Secretary | | Secretary of the Trust
since 1997 and of the Portfolio since 2001 | | Vice President, Secretary and Chief Legal Officer of BMR, EVM, EVD, EV and EVC. Officer of 170 registered investment companies managed by EVM or BMR. | |
|
| Paul M. O'Neil 7/11/53 | | Chief
Compliance Officer | | Since 2004 | | Vice President of EVM and BMR. Officer of 170 registered investment companies managed by EVM or BMR. | |
|
(1) Includes both master and feeder funds in a master-feeder structure.
(2) Prior to 2005, Ms. Campbell served as Assistant Treasurer of the Trust since 1995.
The SAI for the Fund includes additional information about the Trustees and officers of the Fund and the Portfolio and can be obtained without charge on Eaton Vance's website at www.eatonvance.com or by calling 1-800-225-6265.
32
Investment Adviser of Tax-Managed Value Portfolio
Boston Management and Research
The Eaton Vance Building
255 State Street
Boston, MA 02109
Administrator of Eaton Vance Tax-Managed Value Fund
Eaton Vance Management
The Eaton Vance Building
255 State Street
Boston, MA 02109
Principal Underwriter
Eaton Vance Distributors, Inc.
The Eaton Vance Building
255 State Street
Boston, MA 02109
(617) 482-8260
Custodian
Investors Bank & Trust Company
200 Clarendon Street
Boston, MA 02116
Transfer Agent
PFPC Inc.
Attn: Eaton Vance Funds
P.O. Box 9653
Providence, RI 02940-9653
(800) 262-1122
Independent Registered Public Accounting Firm
Deloitte & Touche LLP
200 Berkeley Street
Boston, MA 02116-5022
Eaton Vance Tax-Managed Value Fund
The Eaton Vance Building
255 State Street
Boston, MA 02109
This report must be preceded or accompanied by a current prospectus. Before investing, investors should consider carefully the Fund's investment objective(s), risks, and charges and expenses. The Fund's current prospectus contains this and other information about the Fund and is available through your financial advisor. Please read the prospectus carefully before you invest or send money. For further information please call 1-800-225-6265.
501-12/06 TVSRC

Annual Report October 31, 2006


EATON VANCE
DIVIDEND
INCOME
FUND
IMPORTANT NOTICES REGARDING PRIVACY,
DELIVERY OF SHAREHOLDER DOCUMENTS,
PORTFOLIO HOLDINGS, AND PROXY VOTING
Privacy. The Eaton Vance organization is committed to ensuring your financial privacy. Each of the financial institutions identified below has in effect the following policy ("Privacy Policy") with respect to nonpublic personal information about its customers:
• Only such information received from you, through application forms or otherwise, and information about your Eaton Vance fund transactions will be collected. This may include information such as name, address, social security number, tax status, account balances and transactions.
• None of such information about you (or former customers) will be disclosed to anyone, except as permitted by law (which includes disclosure to employees necessary to service your account). In the normal course of servicing a customer's account, Eaton Vance may share information with unaffiliated third parties that perform various required services such as transfer agents, custodians and broker/dealers.
• Policies and procedures (including physical, electronic and procedural safeguards) are in place that are designed to protect the confidentiality of such information.
• We reserve the right to change our Privacy Policy at any time upon proper notification to you. Customers may want to review our Policy periodically for changes by accessing the link on our homepage: www.eatonvance.com.
Our pledge of privacy applies to the following entities within the Eaton Vance organization: the Eaton Vance Family of Funds, Eaton Vance Management, Eaton Vance Investment Counsel, Boston Management and Research, and Eaton Vance Distributors, Inc.
In addition, our Privacy Policy only applies to those Eaton Vance customers who are individuals and who have a direct relationship with us. If a customer's account (i.e., fund shares) is held in the name of a third-party financial adviser/broker-dealer, it is likely that only such adviser's privacy policies apply to the customer. This notice supersedes all previously issued privacy disclosures.
For more information about Eaton Vance's Privacy Policy, please call 1-800-262-1122.
Delivery of Shareholder Documents. The Securities and Exchange Commission (the "SEC") permits funds to deliver only one copy of shareholder documents, including prospectuses, proxy statements and shareholder reports, to fund investors with multiple accounts at the same residential or post office box address. This practice is often called "householding" and it helps eliminate duplicate mailings to shareholders.
Eaton Vance, or your financial adviser, may household the mailing of your documents indefinitely unless you instruct Eaton Vance, or your financial adviser, otherwise.
If you would prefer that your Eaton Vance documents not be householded, please contact Eaton Vance at 1-800-262-1122, or contact your financial adviser.
Your instructions that householding not apply to delivery of your Eaton Vance documents will be effective within 30 days of receipt by Eaton Vance or your financial adviser.
Portfolio Holdings. Each Eaton Vance Fund and its underlying Portfolio (if applicable) will file a schedule of its portfolio holdings on Form N-Q with the SEC for the first and third quarters of each fiscal year. The Form N-Q will be available on the Eaton Vance website www.eatonvance.com, by calling Eaton Vance at 1-800-262-1122 or in the EDGAR database on the SEC's website at www.sec.gov. Form N-Q may also be reviewed and copied at the SEC's public reference room in Washington, D.C. (call 1-800-732-0330 for information on the operation of the public reference room).
Proxy Voting. From time to time, funds are required to vote proxies related to the securities held by the funds. The Eaton Vance Funds or their underlying Portfolios (if applicable) vote proxies according to a set of policies and procedures approved by the Funds' and Portfolios' Boards. You may obtain a description of these policies and procedures and information on how the Funds or Portfolios voted proxies relating to portfolio securities during the most recent 12 month period ended June 30, without charge, upon request, by calling 1-800-262-1122. This description is also available on the SEC's website at www.sec.gov.
Eaton Vance Dividend Income Fund as of October 31, 2006
MANAGEMENT’S DISCUSSION OF FUND PERFORMANCE

Aamer Khan, CFA
Co-Portfolio Manager

Judith A. Saryan, CFA
Co-Portfolio Manager
The Fund
Performance Since Inception
· During the period from the Fund’s start of business on November 30, 2005, through October 31, 2006, Class A shares of Eaton Vance Dividend Income Fund (the “Fund”) had a total return of 19.26%. This return was the result of an increase in net asset value (NAV) per share to $11.41 on October 31, 2006, from $10.00 on November 30, 2005, and the reinvestment of $0.478 per share in dividend income.(1)
· During the same period, the Fund’s Class C shares had a total return of 18.25%. This return was the result of an increase in NAV per share to $11.36 on October 31, 2006, from $10.00 on November 30, 2005, and the reinvestment of $0.432 per share in dividend income.(1)
· During the period from the initial issuance of shares on January 31, 2006, through October 31, 2006, the Fund’s Class I shares had a total return of 12.62%. This return was the result of an increase in NAV per share to $11.41 on October 31, 2006, from $10.61 on January 31, 2006, and the reinvestment of $0.498 per share in dividend income.(1)
· During the period from the initial issuance of shares on January 31, 2006, through October 31, 2006, the Fund’s Class R shares had a total return of 12.15%. This return was the result of an increase in NAV per share to $11.40 on October 31, 2006, from the offering price of $10.61 on January 31, 2006, and the reinvestment of $0.462 per share in dividend income.(1)
· For comparison, the Fund’s benchmark, the Russell 1000 Value Index – a broad-based, unmanaged index of value stocks – had total returns of 17.59% from November 30, 2005, to October 31, 2006 and 12.52% from January 31, 2006 to October 31, 2006. The Fund’s Lipper Classification, Equity Income Funds, had a total return of 14.59% from November 30, 2005, to October 31, 2006, and 10.36% from January 31, 2006, to October 31, 2006.(2)
Management Discussion
· U.S. equity markets moved upward at a solid pace during the period from November 30, 2005 to October 31, 2006, driven by continued strong economic growth, low to moderate inflation, and a pause, near the end of the period, in the U.S. Federal Reserve Board’s long monetary tightening cycle that began in June 2004. The stock market also benefited from lower oil prices near the end of the period, which helped bolster consumer confidence and spending.
· As of March 24, 2006, the Fund invests in Dividend Income Portfolio (the “Portfolio”), a registered investment company that invests primarily in a diversified portfolio of equity securities that pay dividends. Reflecting its value-oriented style and a focus on higher-yielding stocks, the Fund’s Class A and Class C shares outperformed its benchmark Index during the 11-month period (the Fund’s Class I and Class R shares were in line with the Index for their shorter reporting periods).(2)
· Consumer discretionary and industrial stocks made a positive contribution to relative returns during the period, as did non-U.S. bank stocks, which performed very well. Banks in Europe have thrived because of lower interest rates relative to the United States, closer proximity to emerging markets, and a regulatory environment that has grown more favorable over the years.
· Utililities also made a strong contribution to the Fund’s performance. Management’s efforts to seek a diversified range of high-quality, integrated utilities has been beneficial, as the Portfolio’s utility holdings strongly outperformed those in the Russell 1000 Value Index during the period.(2)
· The Portfolio’s holdings in the energy, health care, and telecommunications sectors detracted from performance, as selections in these sectors generally underperformed those in the Russell 1000 Value Index during the period. Energy stocks generally fared poorly due to a sharp decline in oil prices near the end of the period.
Past performance is no guarantee of future results. Returns are historical and are calculated by determining the percentage change in net asset value or offering price (as applicable) with all distributions reinvested. Investment return and principal value will fluctuate so that shares, when redeemed, may be worth more or less than their original cost. Performance is for stated time period only; due to market volatility, the Fund’s current performance may be lower or higher than the quoted return. For performance as of the most recent month end, please refer to www.eatonvance.com.
(1) | | These returns do not include the 5.75% maximum sales charge for Class A shares or the applicable contingent deferred sales charge (CDSC) for Class C shares. If sales charges were deducted, the returns would be lower. Class I and Class R shares are offered to certain investors at net asset value. Absent an allocation of certain expenses to the administrator, the returns would be lower. |
| | |
(2) | | It is not possible to invest directly in an Index or Lipper Classification. The Index’s total return does not reflect commissions or expenses that would have been incurred if an investor individually purchased or sold the securities represented in the Index. The Lipper return is the average total return, at net asset value, of the funds that are in the same Lipper Classification as the Fund. Lipper averages are available as of month end only. |
Fund shares are not insured by the FDIC and are not deposits or other obligations of, or guaranteed by, any depository institution. Shares are subject to investment risks, including possible loss of principal invested.
The views expressed throughout this report are those of the portfolio managers and are current only through the end of the period of the report as stated on the cover. These views are subject to change at any time based upon market or other conditions, and the investment adviser disclaims any responsibility to update such views. These views may not be relied on as investment advice and, because investment decisions for a fund are based on many factors, may not be relied on as an indication of trading intent on behalf of any Eaton Vance fund.
1
The line graph and table set forth below provide information about the Fund’s performance. The line graph compares the performance of Class A of the Fund with that of the Russell 1000 Value Index, a broad-based, unmanaged index of value stocks. The lines on the graph represent the total returns of a hypothetical investment of $10,000 in each of Class A and the Russell 1000 Value Index. Class A total returns are presented at net asset value and maximum public offering price. The table includes the total returns of each Class of the Fund at net asset value and public offering price. The performance presented below does not reflect the deduction of taxes, if any, that a shareholder would pay on distributions or redemptions of Fund shares.
Performance(1) | | Class A | | Class C | | Class I | | Class R | |
| | | | | | | | | |
Average Annual Total Returns (at net asset value) | | | | | | | | | |
Life of Fund† | | 19.26 | % | 18.25 | % | 12.62 | % | 12.15 | % |
SEC Average Annual Total Returns (including sales charge or applicable CDSC) | | | | | | | | | |
Life of Fund† | | 12.41 | % | 17.25 | % | 12.62 | % | 12.15 | % |
† Inception Dates – Class A: 11/30/05; Class C: 11/30/05; Class I: 1/31/06; Class R: 1/31/06 |
|
(1) | Average annual total returns do not include the 5.75% maximum sales charge for Class A or the applicable contingent deferred sales charge (CDSC) for Class C shares. If sales charges were deducted, returns would be lower. SEC average annual total returns for Class A reflect the maximum 5.75% sales charge. Absent an allocation of certain expenses to the administrator, the returns would be lower. SEC returns for Class C reflect a 1% CDSC for the first year. Class I and Class R shares are offered to certain investors at net asset value. |
Past performance is no guarantee of future results. Returns are historical and are calculated by determining the percentage change in net asset value or offering price (as applicable) with all distributions reinvested. Investment return and principal value will fluctuate so that shares, when redeemed, may be worth more or less than their original cost. Performance is for the stated time period only; due to market volatility, the Fund’s current performance may be lower or higher than the quoted return. For performance as of the most recent month end, please refer to www.eatonvance.com.
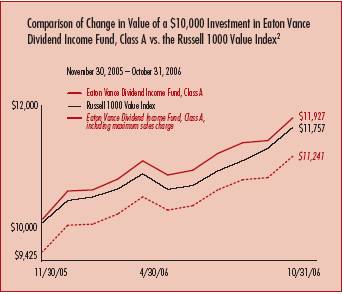
(2) Source: Thomson Financial. Class A of the Fund commenced investment operations on 11/30/05. A $10,000 hypothetical investment at net asset value in Class C shares on 11/30/05 (inception date), Class I shares on 1/31/06 (inception date) and Class R shares on 1/31/06 (inception date) would have been valued at $11,826 ($11,726 after deduction of the applicable CDSC), $11,262 and $11,214, respectively, on 10/31/06. It is not possible to invest directly in an Index. The Index’s total returns do not reflect commissions or expenses that would have been incurred if an investor individually purchased or sold the securities represented in the Index.
Common Stock Investments by Sector(3)
By net assets
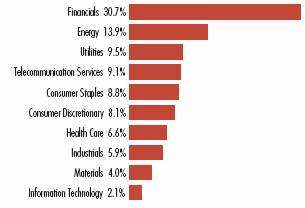
(3) | As of October 31, 2006. Portfolio information may not be representative of the Portfolio’s current or future investments and are subject to change due to active management. |
Top Ten Holdings(4)
By net assets
Exxon Mobil Corporation | | 2.9 | % |
McDonald’s Corporation | | 2.2 | |
Fidelity National Title Group, Inc. | | 2.1 | |
Wyeth | | 2.0 | |
Pfizer, Inc. | | 1.9 | |
Bank of America Corporation | | 1.9 | |
Citigroup Inc. | | 1.9 | |
KBC Groupe SA | | 1.9 | |
Starwood Hotels & Resorts | | 1.9 | |
Wachovia Corp. | | 1.9 | |
(4) | Top Ten Holdings represented 20.6% of Portfolio net assets as of October 31, 2006. Holdings are subject to change due to active management. |
2
Eaton Vance Dividend Income Fund as of October 31, 2006
FUND EXPENSES
Example: As a shareholder of the Fund, you incur two types of costs: (1) transaction costs, including sales charges (loads) on purchases and redemption fees (if applicable); and (2) ongoing costs, including management fees; distribution or service fees; and other Fund expenses. This Example is intended to help you understand your ongoing costs (in dollars) of investing in the Fund and to compare these costs with the ongoing costs of investing in other mutual funds. The Example is based on an investment of $1,000 invested at the beginning of the period and held for the entire period (May 1, 2006 – October 31, 2006).
Actual Expenses: The first section of the table below provides information about actual account values and actual expenses. You may use the information in this section, together with the amount you invested, to estimate the expenses that you paid over the period. Simply divide your account value by $1,000 (for example, an $8,600 account value divided by $1,000 = 8.6), then multiply the result by the number in the first section under the heading entitled "Expenses Paid During Period" to estimate the expenses you paid on your account during this period.
Hypothetical Example for Comparison Purposes: The second section of the table below provides information about hypothetical account values and hypothetical expenses based on the Fund's actual expense ratio and an assumed rate of return of 5% per year (before expenses), which is not the actual return of the Fund. The hypothetical account values and expenses may not be used to estimate the actual ending account balance or expenses you paid for the period. You may use this information to compare the ongoing costs of investing in your Fund and other funds. To do so, compare this 5% hypothetical example with the 5% hypothetical examples that appear in the shareholder reports of the other funds.
Please note that the expenses shown in the table are meant to highlight your ongoing costs only and do not reflect any transactional costs, such as sales charges (loads) or redemption fees (if applicable). Therefore, the second section of the table is useful in comparing ongoing costs only, and will not help you determine the relative total costs of owning different funds. In addition, if these transactional costs were included, your costs would have been higher.
Eaton Vance Dividend Income Fund
| | | Beginning Account Value
(5/1/06) | | Ending Account Value
(10/31/06) | | Expenses Paid During Period* **
(5/1/06 – 10/31/06) | |
| Actual | |
| Class A | | $ | 1,000.00 | | | $ | 1,068.90 | | | $ | 7.30 | | |
| Class C | | $ | 1,000.00 | | | $ | 1,064.70 | | | $ | 11.19 | | |
| Class I | | $ | 1,000.00 | | | $ | 1,070.10 | | | $ | 6.00 | | |
| Class R | | $ | 1,000.00 | | | $ | 1,067.80 | | | $ | 8.60 | | |
| Hypothetical | |
| (5% return per year before expenses) | |
| Class A | | $ | 1,000.00 | | | $ | 1,018.10 | | | $ | 7.12 | | |
| Class C | | $ | 1,000.00 | | | $ | 1,014.40 | | | $ | 10.92 | | |
| Class I | | $ | 1,000.00 | | | $ | 1,019.40 | | | $ | 5.85 | | |
| Class R | | $ | 1,000.00 | | | $ | 1,016.90 | | | $ | 8.39 | | |
* Expenses are equal to the Fund's annualized expense ratio of 1.40% for Class A shares, 2.15% for Class C shares, 1.15% for Class I shares, and 1.65% for Class R shares, multiplied by the average account value over the period, multiplied by 184/365 (to reflect the one-half year period). The Example assumes that the $1,000 was invested at the net asset value per share determined at the close of business on April 30, 2006. The Example reflects the expenses of both the Fund and the Portfolio.
** Absent an allocation of certain expenses to the administrator, expenses would be higher.
3
Eaton Vance Dividend Income Fund as of October 31, 2006
FINANCIAL STATEMENTS
Statement of Assets and Liabilities
As of October 31, 2006
| Assets | |
Investment in Dividend Income Portfolio, at value
(identified cost, $48,943,964) | | $ | 51,526,669 | | |
| Receivable for Fund shares sold | | | 2,204,228 | | |
| Receivable from affiliate | | | 164,488 | | |
| Total assets | | $ | 53,895,385 | | |
| Liabilities | |
| Payable for Fund shares redeemed | | $ | 14,824 | | |
| Payable to affiliate for distribution and service fees | | | 21,546 | | |
| Payable to affiliate for administration fee | | | 5,705 | | |
| Payable to affiliate for Trustees' fees | | | 739 | | |
| Other accrued expenses | | | 35,754 | | |
| Total liabilities | | $ | 78,568 | | |
| Net Assets | | $ | 53,816,817 | | |
| Sources of Net Assets | |
| Paid-in capital | | $ | 51,550,320 | | |
| Accumulated net realized loss (computed on the basis of identified cost) | | | (1,348,711 | ) | |
| Accumulated undistributed net investment income | | | 1,032,503 | | |
Net unrealized appreciation from Portfolio (computed on the basis of
identified cost) | | | 2,582,705 | | |
| Total | | $ | 53,816,817 | | |
| Class A Shares | |
| Net Assets | | $ | 29,585,886 | | |
| Shares Outstanding | | | 2,593,730 | | |
Net Asset Value and Redemption Price Per Share
(net assets ÷ shares of beneficial interest outstanding) | | $ | 11.41 | | |
Maximum Offering Price Per Share
(100 ÷ 94.25 of $11.41) | | $ | 12.11 | | |
| Class C Shares | |
| Net Assets | | $ | 23,105,027 | | |
| Shares Outstanding | | | 2,034,014 | | |
Net Asset Value, Offering Price and Redemption Price Per Share
(net assets ÷ shares of beneficial interest outstanding) | | $ | 11.36 | | |
| Class I Shares | |
| Net Assets | | $ | 1,097,724 | | |
| Shares Outstanding | | | 96,246 | | |
Net Asset Value, Offering Price and Redemption Price Per Share
(net assets ÷ shares of beneficial interest outstanding) | | $ | 11.41 | | |
| Class R Shares | |
| Net Assets | | $ | 28,180 | | |
| Shares Outstanding | | | 2,472 | | |
Net Asset Value, Offering Price and Redemption Price Per Share
(net assets ÷ shares of beneficial interest outstanding) | | $ | 11.40 | | |
| On sales of $50,000 or more, the offering price of Class A shares is reduced. | |
Statement of Operations
For the Period Ended
October 31, 2006(1)
| Investment Income | |
| Dividends (net of foreign taxes, $2,490) | | $ | 60,406 | | |
| Dividends allocated from Portfolio (net of foreign taxes, $90,616) | | | 2,014,545 | | |
| Interest | | | 857 | | |
| Interest allocated from Portfolio | | | 25,885 | | |
| Expenses allocated from Portfolio | | | (114,421 | ) | |
| Net investment income from Portfolio | | $ | 1,987,272 | | |
| Expenses | |
| Investment adviser fee | | $ | 3,960 | | |
| Administration fee | | | 20,390 | | |
| Trustees' fees and expenses | | | 1,507 | | |
Distribution and service fees
Class A | | | 20,693 | | |
| Class C | | | 52,866 | | |
| Class R | | | 53 | | |
| Registration fees | | | 107,282 | | |
| Legal and accounting services | | | 39,343 | | |
| Transfer and dividend disbursing agent fees | | | 15,359 | | |
| Printing and postage | | | 10,230 | | |
| Custodian fee | | | 5,335 | | |
| Miscellaneous | | | 3,827 | | |
| Total expenses | | $ | 280,845 | | |
Deduct —
Reduction of custodian fee | | $ | 364 | | |
| Allocation of Fund expenses to the affiliate | | | 164,488 | | |
| Total expense reductions | | $ | 164,852 | | |
| Net expenses | | $ | 115,993 | | |
| Net investment income | | $ | 1,871,279 | | |
| Realized and Unrealized Gain (Loss) | |
Net realized gain (loss) from Portfolio —
Investment transactions (identified cost basis) | | $ | (1,346,360 | ) | |
| Foreign currency transactions | | | (38,367 | ) | |
Net realized gain (loss) —
Investment transactions (identified cost basis) | | | (23,775 | ) | |
| Foreign currency transactions | | | (434 | ) | |
| Net realized loss | | $ | (1,408,936 | ) | |
Change in unrealized appreciation (depreciation) from Portfolio —
Investments (identified cost basis) | | $ | 2,428,613 | | |
| Foreign currency | | | 7,043 | | |
Change in unrealized appreciation (depreciation) —
Investments (identified cost basis) | | $ | 147,249 | | |
| Foreign currency | | | (200 | ) | |
| Net change in unrealized appreciation (depreciation) | | $ | 2,582,705 | | |
| Net realized and unrealized gain | | $ | 1,173,769 | | |
| Net increase in net assets from operations | | $ | 3,045,048 | | |
| (1) For the period from the start of business, November 30, 2005, to October 31, 2006. | |
See notes to financial statements
4
Eaton Vance Dividend Income Fund as of October 31, 2006
FINANCIAL STATEMENTS CONT'D
Statement of Changes in Net Assets
| Increase (Decrease) in Net Assets | | Period Ended
October 31, 2006(1) | |
From operations —
Net investment income | | $ | 1,871,279 | | |
Net realized loss from investment transactions and foreign
currency transactions | | | (1,408,936 | ) | |
Net change in unrealized appreciation (depreciation) from
investments and foreign currency | | | 2,582,705 | | |
| Net increase in net assets from operations | | $ | 3,045,048 | | |
Distributions to shareholders —
From net investment income
Class A | | $ | (500,351 | ) | |
| Class C | | | (298,470 | ) | |
| Class I | | | (479 | ) | |
| Class R | | | (641 | ) | |
| Total distributions to shareholders | | $ | (799,941 | ) | |
Transactions in shares of beneficial interest —
Proceeds from sale of shares
Class A | | $ | 28,606,860 | | |
| Class C | | | 22,333,000 | | |
| Class I | | | 1,095,000 | | |
| Class R | | | 26,066 | | |
Net asset value of shares issued to shareholders in payment of
distributions declared | | | | | |
| Class A | | | 352,963 | | |
| Class C | | | 151,748 | | |
| Class I | | | 479 | | |
| Class R | | | 641 | | |
Cost of shares redeemed
Class A | | | (688,263 | ) | |
| Class C | | | (306,784 | ) | |
| Net increase in net assets from Fund share transactions | | $ | 51,571,710 | | |
| Net increase in net assets | | $ | 53,816,817 | | |
| Net Assets | |
| At beginning of period | | $ | — | | |
| At end of period | | $ | 53,816,817 | | |
Accumulated undistributed net
investment income included in net assets | |
| At end of period | | $ | 1,032,503 | | |
(1) For the period from the start of business, November 30, 2005, to October 31, 2006.
See notes to financial statements
5
Eaton Vance Dividend Income Fund as of October 31, 2006
FINANCIAL STATEMENTS CONT'D
Financial Highlights
| | | Class A | |
| | | Period Ended
October 31, 2006(1) | |
| Net asset value — Beginning of period | | $ | 10.000 | | |
| Income from operations | |
| Net investment income(2) | | $ | 1.401 | | |
| Net realized and unrealized gain | | | 0.487 | | |
| Total income from operations | | $ | 1.888 | | |
| Less distributions | |
| From net investment income | | $ | (0.478 | ) | |
| Total distributions | | $ | (0.478 | ) | |
| Net asset value — End of period | | $ | 11.410 | | |
| Total Return(3) | | | 19.26 | % | |
| Ratios/Supplemental Data | |
| Net assets, end of period (000's omitted) | | $ | 29,586 | | |
| Ratios (As a percentage of average daily net assets): | |
| Expenses before custodian fee reduction(4)(5) | | | 1.41 | %(6) | |
| Expenses after custodian fee reduction(4)(5) | | | 1.40 | %(6) | |
| Net investment income(5) | | | 14.04 | %(6) | |
| Portfolio Turnover of the Fund(7) | | | 35 | % | |
| Portfolio Turnover of the Portfolio(8) | | | 170 | % | |
(1) For the period from the start of business, November 30, 2005, to October 31, 2006.
(2) Net investment income per share was computed using average shares outstanding.
(3) Return is calculated by determining the percentage change in net asset value with all distributions reinvested. Total return is not computed on an annualized basis.
(4) Includes the Fund's share of the Portfolio's allocated expenses.
(5) The administrator subsidized certain operating expenses (equal to 1.21% of average net assets for the period from the start of business, November 30, 2005, to October 31, 2006).
(6) Annualized.
(7) Represents the rate of portfolio activity for the period during which the Fund was making investments directly in securities.
(8) For the period from the Portfolio's start of business, March 24, 2006, to October 31, 2006.
See notes to financial statements
6
Eaton Vance Dividend Income Fund as of October 31, 2006
FINANCIAL STATEMENTS CONT'D
Financial Highlights
| | | Class C | |
| | | Period Ended
October 31, 2006(1) | |
| Net asset value — Beginning of period | | $ | 10.000 | | |
| Income from operations | |
| Net investment income(2) | | $ | 1.322 | | |
| Net realized and unrealized gain | | | 0.470 | | |
| Total income from operations | | $ | 1.792 | | |
| Less distributions | |
| From net investment income | | $ | (0.432 | ) | |
| Total distributions | | $ | (0.432 | ) | |
| Net asset value — End of period | | $ | 11.360 | | |
| Total Return(3) | | | 18.25 | % | |
| Ratios/Supplemental Data | |
| Net assets, end of period (000's omitted) | | $ | 23,105 | | |
| Ratios (As a percentage of average daily net assets): | |
| Expenses before custodian fee reduction(4)(5) | | | 2.16 | %(6) | |
| Expenses after custodian fee reduction(4)(5) | | | 2.15 | %(6) | |
| Net investment income(5) | | | 13.27 | %(6) | |
| Portfolio Turnover of the Fund(7) | | | 35 | % | |
| Portfolio Turnover of the Portfolio(8) | | | 170 | % | |
(1) For the period from the start of business, November 30, 2005, to October 31, 2006.
(2) Net investment income per share was computed using average shares outstanding.
(3) Return is calculated by determining the percentage change in net asset value with all distributions reinvested. Total return is not computed on an annualized basis.
(4) Includes the Fund's share of the Portfolio's allocated expenses.
(5) The administrator subsidized certain operating expenses (equal to 1.21% of average net assets for the period from the start of business, November 30, 2005, to October 31, 2006).
(6) Annualized.
(7) Represents the rate of portfolio activity for the period during which the Fund was making investments directly in securities.
(8) For the period from the Portfolio's start of business, March 24, 2006, to October 31, 2006.
See notes to financial statements
7
Eaton Vance Dividend Income Fund as of October 31, 2006
FINANCIAL STATEMENTS CONT'D
Financial Highlights
| | | Class I | |
| | | Period Ended
October 31, 2006(1) | |
| Net asset value — Beginning of period | | $ | 10.610 | | |
| Income from operations | |
| Net investment income(2) | | $ | 1.912 | | |
| Net realized and unrealized loss(3) | | | (0.614 | ) | |
| Total income from operations | | $ | 1.298 | | |
| Less distributions | |
| From net investment income | | $ | (0.498 | ) | |
| Total distributions | | $ | (0.498 | ) | |
| Net asset value — End of period | | $ | 11.410 | | |
| Total Return(4) | | | 12.62 | % | |
| Ratios/Supplemental Data | |
| Net assets, end of period (000's omitted) | | $ | 1,098 | | |
| Ratios (As a percentage of average daily net assets): | |
| Expenses before custodian fee reduction(5)(6) | | | 1.16 | %(7) | |
| Expenses after custodian fee reduction(5)(6) | | | 1.15 | %(7) | |
| Net investment income(6) | | | 25.28 | %(7) | |
| Portfolio Turnover of the Fund(8) | | | 35 | % | |
| Portfolio Turnover of the Portfolio(9) | | | 170 | % | |
(1) For the period from the initial issuance of Class I shares, January 31, 2006, to October 31, 2006.
(2) Net investment income per share was computed using average shares outstanding.
(3) The per share amount is not in accord with the net realized and unrealized gain (loss) for the period because of the timing of sales of the Fund shares and the amount of the per share realized and unrealized gains and losses at such time.
(4) Return is calculated by determining the percentage change in net asset value with all distributions reinvested. Total return is not computed on an annualized basis.
(5) Includes the Fund's share of the Portfolio's allocated expenses.
(6) The administrator subsidized certain operating expenses (equal to 1.21% of average net assets for the period from the initial issuance of shares, January 31, 2006, to October 31, 2006).
(7) Annualized.
(8) Represents the rate of portfolio activity for the period during which the Fund was making investments directly in securities.
(9) For the period from the Portfolio's start of business, March 24, 2006, to October 31, 2006.
See notes to financial statements
8
Eaton Vance Dividend Income Fund as of October 31, 2006
FINANCIAL STATEMENTS CONT'D
Financial Highlights
| | | Class R | |
| | | Period Ended
October 31, 2006(1) | |
| Net asset value — Beginning of period | | $ | 10.610 | | |
| Income from operations | |
| Net investment income(2) | | $ | 1.162 | | |
| Net realized and unrealized gain | | | 0.090 | | |
| Total income from operations | | $ | 1.252 | | |
| Less distributions | |
| From net investment income | | $ | (0.462 | ) | |
| Total distributions | | $ | (0.462 | ) | |
| Net asset value — End of period | | $ | 11.400 | | |
| Total Return(3) | | | 12.15 | % | |
| Ratios/Supplemental Data | |
| Net assets, end of period (000's omitted) | | $ | 28 | | |
| Ratios (As a percentage of average daily net assets): | |
| Expenses before custodian fee reduction(4)(5) | | | 1.66 | %(6) | |
| Expenses after custodian fee reduction(4)(5) | | | 1.65 | %(6) | |
| Net investment income(5) | | | 14.30 | %(6) | |
| Portfolio Turnover of the Fund(7) | | | 35 | % | |
| Portfolio Turnover of the Portfolio(8) | | | 170 | % | |
(1) For the period from the initial issuance of Class R shares, January 31, 2006, to October 31, 2006.
(2) Net investment income per share was computed using average shares outstanding.
(3) Return is calculated by determining the percentage change in net asset value with all distributions reinvested. Total return is not computed on an annualized basis.
(4) Includes the Fund's share of the Portfolio's allocated expenses.
(5) The administrator subsidized certain operating expenses (equal to 1.21% of average net assets for the period from the initial issuance of shares, January 31, 2006, to October 31, 2006).
(6) Annualized.
(7) Represents the rate of portfolio activity for the period during which the Fund was making investments directly in securities.
(8) For the period from the Portfolio's start of business, March 24, 2006, to October 31, 2006.
See notes to financial statements
9
Eaton Vance Dividend Income Fund as of October 31, 2006
NOTES TO FINANCIAL STATEMENTS
1 Significant Accounting Policies
Eaton Vance Dividend Income Fund (the Fund) is a diversified series of Eaton Vance Mutual Funds Trust (the Trust). The Trust is an entity of the type commonly known as a Massachusetts business trust and is registered under the Investment Company Act of 1940, as amended, as an open-end management investment company. The Fund offers four classes of shares. Class A shares are generally sold subject to a sales charge imposed at time of purchase. Class C shares are sold at net asset value and are subject to a contingent deferred sales charge (see Note 6). Class I and Class R shares are offered at net asset value and are not subject to a sales charge. Each class represents a pro rata interest in the Fund, but votes separately on class-specific matters and (as noted below) is subject to different expenses. Realized and unrealized gains and losses and net investment income and losses, other than class-specific expenses, are allocated da ily to each class of shares based on the relative net assets of each class to the total net assets of the Fund. Each class of shares differs in its distribution plan and certain other class-specific expenses. The Fund invests all of its investable assets in interests of the Dividend Income Portfolio (the Portfolio), a New York Trust, having the same investment objective as the Fund. The value of the Fund's investment in the Portfolio reflects the Fund's proportionate interest in the net assets of the Portfolio (69.0% at October 31, 2006). The performance of the Fund is directly affected by the performance of the Portfolio. The financial statements of the Portfolio, including the Portfolio of Investments, are included elsewhere in this report and should be read in conjunction with the Fund's financial statements.
The following is a summary of significant accounting policies consistently followed by the Fund in the preparation of its financial statements. The policies are in conformity with accounting principles generally accepted in the United States of America.
A Investment Valuation — Valuation of securities by the Portfolio is discussed in Note 1A of the Portfolio's Notes to Financial Statements, which are included elsewhere in this report.
B Income — The Fund's net investment income or loss consists of the Fund's pro-rata share of the net investment income of the Portfolio, less all actual and accrued expenses of the Fund, determined in accordance with accounting principles generally accepted in the United States of America. Prior to the Fund's investment in the Portfolio, the Fund held its investments directly. During this period, dividend income was recorded on the ex-dividend date. However, if the ex-dividend date had passed, certain dividends from foreign securities were recorded as the Fund was informed of the ex-dividend date. Interest income was recorded on the accrual basis.
C Expenses — The majority of expenses of the Trust are directly identifiable to an individual fund. Expenses which are not readily identifiable to a specific fund are allocated taking into consideration, among other things, the nature and type of expense and the relative size of the funds.
D Federal Taxes — The Fund's policy is to comply with the provisions of the Internal Revenue Code applicable to regulated investment companies and to distribute to shareholders, each year, substantially all of its net investment income and all or substantially all of its net realized capital gains. Accordingly, no provision for federal income or excise tax is necessary. At October 31, 2006, The Fund, for federal income tax purposes, had a capital loss carryover of $1,311,256, which will reduce the Fund's taxable income arising from future net realized gain on investments, if any, to the extent permitted by the Internal Revenue Code, and thus will reduce the amount of distributions to shareholders which would otherwise be necessary to relieve the Fund of any liability for federal income or excise tax. Such capital loss carryover will expire October 31, 2014.
E Expense Reduction — Investors Bank & Trust Company (IBT) serves as custodian of the Fund. Pursuant to the custodian agreement, IBT receives a fee reduced by credits which are determined based on the average daily cash balance the Fund maintains with IBT. All credit balances used to reduce the Fund's custodian fees are reported as a reduction of expenses in the Statement of Operations.
F Use of Estimates — The preparation of the financial statements in conformity with accounting principles generally accepted in the United States of America requires management to make estimates and assumptions that affect the reported amounts of assets and liabilities at the date of the financial statements and the reported amounts of income and expense during the reporting period. Actual results could differ from those estimates.
G Indemnifications — Under the Trust's organizational documents, its officers and Trustees may be indemnified against certain liabilities and expenses arising out of the performance of their duties to the Fund, and shareholders are indemnified against personal liability for the obligations of the Trust. Additionally, in the normal
10
Eaton Vance Dividend Income Fund as of October 31, 2006
NOTES TO FINANCIAL STATEMENTS CONT'D
course of business, the Fund enters into agreements with service providers that may contain indemnification clauses. The Fund's maximum exposure under these arrangements is unknown as this would involve future claims that may be made against the Fund that have not yet occurred.
H Other — Investment transactions are accounted for on the date the securities are purchased or sold. Dividends to shareholders are recorded on the ex-dividend date.
2 Distribution to Shareholders
It is the present policy of the Fund to make monthly distributions to shareholders and at least one distribution annually of all or substantially all of its net realized capital gains, if any (reduced by available capital loss carryforwards from prior years, if any). Distributions are declared separately for each class of shares. Distributions are paid in the form of additional shares of the same class of the Fund or, at the election of the shareholder, in cash. Shareholders may reinvest all distributions in additional shares of the same class of the Fund at the net asset value as of the close of business on the ex-dividend date. The Fund distinguishes between distributions on a tax basis and a financial reporting basis. Accounting principles generally accepted in the United States of America require that only distributions in excess of tax basis earnings and profits be reported in the financial statements as a return of capital . Permanent differences between book and tax accounting relating to distributions are reclassified to paid-in capital.
During the period from the start of business, November 30, 2005, to October 31, 2006, paid-in capital was decreased by $21,390, accumulated undistributed net investment income was decreased by $38,835, and accumulated net realized loss on investments was decreased by $60,225 primarily due to differences between book and tax accounting treatment of foreign currency gain/loss. This change had no effect on the net assets or the net asset value per share.
The tax character of distributions paid for the period from the start of business, November 30, 2005, to October 31, 2006 was as follows:
| Distributions declared from: | |
|
| Ordinary income | | $ | 799,941 | | |
|
As of October 31, 2006, the components of distributable earnings (accumulated losses) on a tax basis were as follows:
| Undistributed ordinary income | | $ | 1,032,503 | | |
| Unrealized appreciation | | $ | 2,545,250 | | |
| Capital loss carryforwards | | $ | (1,311,256 | ) | |
3 Shares of Beneficial Interest
The Fund's Declaration of Trust permits the Trustees to issue an unlimited number of full and fractional shares of beneficial interest (without par value). Such shares may be issued in a number of different series (such as the Fund) and classes. Transactions in Fund shares were as follows:
| Class A | | Period Ended
October 31, 2006(1) | |
| Sales | | | 2,624,720 | | |
Issued to shareholders electing to receive payments of
distributions in Fund shares | | | 32,394 | | |
| Redemptions | | | (63,384 | ) | |
| Net increase | | | 2,593,730 | | |
| Class C | | Period Ended
October 31, 2006(1) | |
| Sales | | | 2,048,157 | | |
Issued to shareholders electing to receive payments of
distributions in Fund shares | | | 13,936 | | |
| Redemptions | | | (28,079 | ) | |
| Net increase | | | 2,034,014 | | |
| Class I | | Period Ended
October 31, 2006(2) | |
| Sales | | | 96,202 | | |
Issued to shareholders electing to receive payments of
distributions in Fund shares | | | 44 | | |
| Net increase | | | 96,246 | | |
| Class R | | Period Ended
October 31, 2006(2) | |
| Sales | | | 2,413 | | |
Issued to shareholders electing to receive payments of
distributions in Fund shares | | | 59 | | |
| Net increase | | | 2,472 | | |
(1) For the period from the start of business, November 30, 2005, to October 31, 2006.
(2) For the period from the initial issuance of shares, January 31, 2006, to October 31, 2006.
4 Transactions with Affiliates
Prior to the Fund's investment in the Portfolio on March 24, 2006, Eaton Vance Management (EVM) earned an investment adviser fee as compensation for management and investment advisory services rendered to the Fund. The fee was at an annual rate of 0.65% of the Fund's average daily net assets up to $500 million, and
11
Eaton Vance Dividend Income Fund as of October 31, 2006
NOTES TO FINANCIAL STATEMENTS CONT'D
reduced at rates as daily net assets exceed that level, and amounted to $3,960 for the period from the start of business, November 30, 2005, to March 24, 2006. The administration fee is earned by EVM as compensation for managing and administering the business affairs of the Fund. Under the administration agreement, EVM earns a fee in the amount of 0.15% per annum of the average daily net assets of the Fund and amounted to $20,390 for the period from the start of business, November 30, 2005, to October 31, 2006. Pursuant to a voluntary expense reimbursement, EVM was allocated $164,488 of the Fund's operating expenses for the period from the start of business, November 30, 2005, to October 31, 2006. The Portfolio has engaged Boston Management and Research (BMR), a subsidiary of EVM, to render investment advisory services. See Note 2 of the Portfolio's Notes to Financial Statements which are included elsewhere in this report. EVM s erves as the sub-transfer agent of the Fund and receives an aggregate fee based upon the actual expenses incurred by EVM in the performance of those services. For the period from the start of business, November 30, 2005, to October 31, 2006, EVM earned $836 in sub-transfer agent fees.
Except for Trustees of the Fund and the Portfolio who are not members of EVM's or BMR's organization, officers and Trustees receive remuneration for their services to the Fund out of the investment adviser fee earned by EVM and BMR. Trustees of the Fund that are not affiliated with EVM or BMR may elect to defer receipt of all or a percentage of their annual fees in accordance with the terms of the Trustees Deferred Compensation Plan. For the period from the start of business November 30, 2005, to October 31, 2006, no significant amounts have been deferred.
Eaton Vance Distributors, Inc. (EVD), a subsidiary of EVM and the Fund's principal underwriter, received $89,442 as its portion of the sales charge on sales of Class A for the period from the start of business, November 30, 2005, to October 31, 2006.
Certain officers and Trustees of the Fund and of the Portfolio are officers of the above organizations.
5 Distribution Plans
Class A has in effect a distribution plan pursuant to Rule 12b-1 (Class A Plan) under the Investment Company Act of 1940. The Class A Plan provides that the Fund will pay EVD a distribution and service fee of 0.25% (annualized) of the Fund's average daily net assets attributable to Class A shares for each fiscal year for distribution services and facilities provided to the Fund by EVD, as well as for personal services and/or the maintenance of shareholder accounts. Distribution and service fees paid or accrued for the period from the start of business, November 30, 2005, to October 31, 2006 amounted to $20,693 for Class A shares. The Fund also has in effect distribution plans for Class C shares (Class C Plan) and Class R shares (Class R Plan) pursuant to Rule 12b-1. The Class C Plan requires the Fund to pay EVD amounts equal to 1/365 of 0.75% (annualized) of the Fund's average daily net assets attributable to Class C shares for providing ongoing distribution services and facilities to the Fund. The Fund will automatically discontinue payments to EVD during any period in which there are no outstanding Uncovered Distribution Charges, which are equivalent to the sum of (i) 6.25% of the aggregate amount received by the Fund for the Class C shares sold, plus (ii) interest calculated by applying the rate of 1% over the prevailing prime rate to the outstanding balance of Uncovered Distribution Charges of EVD of Class C, reduced by the aggregate amount of contingent deferred sales charges (see Note 6) and daily amounts theretofore paid to EVD by Class C. Distribution fees paid or accrued for the period from the start of business, November 30, 2005, to October 31, 2006, amounted to $39,657 for Class C shares. At October 31, 2006, the amount of Uncovered Distribution Charges of EVD calculated under the Class C Plan was approximately $1,070,000 for Class C shares. The Cla ss R Plan provides for the Fund to pay EVD amounts up to 0.50% (annualized) of the Fund's average daily net assets attributable to Class R shares for providing ongoing distribution services and facilities to the Fund. The Trustees of the Fund have currently limited the Class R distribution payments to 0.25% of average daily net assets attributable to the Class R shares. Distribution fees paid or accrued for the period from the initial issuance of shares, January 31, 2006, to October 31, 2006, amounted to $27 for Class R shares. The Class C and Class R Plans also authorize the Fund to make payments of service fees to EVD, investment dealers and other persons in amounts not exceeding 0.25% annually of the average daily net assets attributable to that Class. Service fees are paid for personal services and/or the maintenance of shareholder accounts. They are separate and distinct from sales commissions and distribution fees and, as such, are not subject to automatic discontinuance when there are no outstanding U ncovered Distribution Charges to EVD. Service fees paid or accrued for the period ended October 31, 2006 amounted to $13,209, and $26, for Class C and Class R shares, respectively.
12
Eaton Vance Dividend Income Fund as of October 31, 2006
NOTES TO FINANCIAL STATEMENTS CONT'D
6 Contingent Deferred Sales Charge
A contingent deferred sales charge (CDSC) of 1% generally is imposed on redemptions of Class C shares made within one year of purchase. Class A shares may be subject to a 1% CDSC if redeemed within eighteen months of purchase (depending upon the circumstances of purchase). Generally, the CDSC is based upon the lower of the net asset value at date of redemption or date of purchase. No charge is levied on shares acquired by reinvestment of dividends or capital gain distributions.
No CDSC is levied on shares which have been sold to EVM or its affiliates or to their respective employees or clients and may be waived under certain other limited conditions. CDSC pertaining to Class C redemptions are paid to EVD to reduce the amount of Uncovered Distribution Charges calculated under the Class C Plan (see Note 5). CDSC assessed on Class C shares when no Uncovered Distribution Charges exist with respect to that class will be credited to the Fund. EVD received approximately $1,336 of CDSC paid by shareholders for Class C shares, for the period from the start of business, November 30, 2005, to October 31, 2006. EVD did not receive any CDSC for Class A shares for the period from the start of business, November 30, 2005, to October 31, 2006.
7 Investments Transactions
During the time the Fund was making direct investments in securities, purchases and sales of investments, other than short-term obligations, aggregated $6,005,001 and $900,508, respectively. On March 24, 2006, the Fund transferred substantially all of its investable assets, and related accounts, with a value amounting to $5,112,681, including unrealized appreciation of $147,048, to the Portfolio in exchange for an interest in the Portfolio. The transaction was structured for tax purposes to qualify as a tax-free exchange under the Internal Revenue Code.
Increases and decreases in the Fund's investment in the Portfolio aggregated $44,808,683 and $1,371,633 respectively, for the period from March 24, 2006, to October 31, 2006.
8 Recently Issued Accounting Pronouncements
In June 2006, the Financial Accounting Standards Board (FASB) issued FASB Interpretation No. 48, (FIN 48) "Accounting for Uncertainty in Income Taxes – an interpretation of FASB Statement No. 109". FIN 48 clarifies the accounting for uncertainty in income taxes recognized in accordance with FASB Statement No. 109, "Accounting for Income Taxes." This interpretation prescribes a recognition threshold and measurement attribute for the financial statement recognition and measurement of a tax position taken or expected to be taken in a tax return. It also provides guidance on de-recognition, classification, interest and penalties, accounting in interim periods, disclosure and transition. FIN 48 is effective for fiscal years beginning after December 15, 2006. Management is currently evaluating the impact of applying the various provisions of FIN 48.
In September 2006, FASB issued Statement of Financial Accounting Standards No. 157, (FAS 157) "Fair Value Measurements". FAS 157 defines fair value, establishes a framework for measuring fair value in accordance with generally accepted accounting principles and expands disclosure about fair value measurements. FAS 157 is effective for fiscal years beginning after November 15, 2007. Management is currently evaluating the impact the adoption of FAS 157 will have on the Fund's financial statement disclosures.
13
Eaton Vance Dividend Income Fund as of October 31, 2006
REPORT OF INDEPENDENT REGISTERED PUBLIC ACCOUNTING FIRM
To the Trustees of Eaton Vance
Mutual Funds Trust and Shareholders
of Eaton Vance Dividend Income Fund:
We have audited the accompanying statement of assets and liabilities of Eaton Vance Dividend Income (the Fund) (one of the series of Eaton Vance Mutual Funds Trust) as of October 31, 2006, the related statement of operations, the statement of changes in net assets and the financial highlights for the period from the start of business, November 30, 2005, to October 31, 2006. These financial statements and financial highlights are the responsibility of the Fund's management. Our responsibility is to express an opinion on these financial statements and financial highlights based on our audit.
We conducted our audits in accordance with standards of the Public Company Accounting Oversight Board (United States). Those standards require that we plan and perform the audit to obtain reasonable assurance about whether the financial statements and financial highlights are free of material misstatement. The Fund is not required to have, nor were we engaged to perform, an audit of its internal control over financial reporting. Our audit included consideration of internal control over financial reporting as a basis for designing audit procedures that are appropriate in the circumstances, but not for the purpose of expressing an opinion on the effectiveness of the Fund's internal control over financial reporting. Accordingly, we express no such opinion. An audit also includes examining, on a test basis, evidence supporting the amounts and disclosures in the financial statements, assessing the accounting principles used and signi ficant estimates made by management, as well as evaluating the overall financial statement presentation. We believe that our audit provides a reasonable basis for our opinion.
In our opinion, the financial statements and financial highlights referred to above present fairly, in all material respects, the financial position of Eaton Vance Dividend Income Fund as of October 31, 2006, the results of its operations, the changes in its net assets and the financial highlights for the period from the start of business, November 30, 2005 to October 31, 2006, in conformity with accounting principles generally accepted in the United States of America.
DELOITTE & TOUCHE LLP
Boston, Massachusetts
December 15, 2006
14
Eaton Vance Dividend Income Fund as of October 31, 2006
FEDERAL TAX INFORMATION (Unaudited)
The Form 1099-DIV you receive in January 2007 will show the tax status of all distributions paid to your account in calendar 2006. Shareholders are advised to consult their own tax adviser with respect to the tax consequences of their investment in the Fund. As required by the Internal Revenue Code regulations, shareholders must be notified within 60 days of the Fund's fiscal year end regarding the status of qualified dividend income for individuals and the dividends received deduction for corporations.
Qualified Dividend Income. The Fund designates $1,229,410, or up to the maximum amount of such dividends allowable pursuant to the Internal Revenue Code, as qualified dividend income eligible for the reduced tax rate of 15%.
Dividends Received Deduction. Corporate shareholders are generally entitled to take the dividends received deduction on the portion of the Fund's dividend distribution that qualifies under tax law. For the Fund's fiscal 2006 ordinary income dividends, 39.12% qualifies for the corporate dividends received deduction.
15
Dividend Income Portfolio as of October 31, 2006
PORTFOLIO OF INVESTMENTS
| Common Stocks — 98.7% | |
| Security | | Shares | | Value | |
| Aerospace & Defense — 0.9% | |
| Honeywell International, Inc. | | | 8,040 | | | $ | 338,645 | | |
| United Technologies Corp. | | | 4,628 | | | | 304,152 | | |
| | | $ | 642,797 | | |
| Automobiles — 1.4% | |
| Harley-Davidson, Inc. | | | 14,900 | | | $ | 1,022,587 | | |
| | | $ | 1,022,587 | | |
| Beverages — 1.6% | |
| Diageo PLC ADR | | | 16,300 | | | $ | 1,213,861 | | |
| | | $ | 1,213,861 | | |
| Capital Markets — 3.0% | |
| Credit Suisse Group ADR | | | 3,000 | | | $ | 181,440 | | |
| Goldman Sachs Group, Inc. (The) | | | 3,600 | | | | 683,244 | | |
| Merrill Lynch & Co., Inc. | | | 10,000 | | | | 874,200 | | |
| UBS AG(1) | | | 7,760 | | | | 464,358 | | |
| | | $ | 2,203,242 | | |
| Chemicals — 0.9% | |
| E.I. du Pont de Nemours and Co. | | | 15,000 | | | $ | 687,000 | | |
| | | $ | 687,000 | | |
| Commercial Banks — 14.5% | |
| Allied Irish Banks PLC ADR | | | 20,997 | | | $ | 1,147,276 | | |
| Banco Bilbao Vizcaya Argentaria SA ADR | | | 38,360 | | | | 928,312 | | |
| Bank of Nova Scotia(1) | | | 4,395 | | | | 192,984 | | |
| Barclays PLC ADR | | | 23,750 | | | | 1,289,862 | | |
| BNP Paribas(1) | | | 3,800 | | | | 417,358 | | |
| HBOS PLC(1) | | | 47,591 | | | | 985,780 | | |
| HSBC Holdings PLC(1) | | | 42,794 | | | | 811,911 | | |
| Industrial and Commercial Bank of China(1)(2) | | | 306,845 | | | | 137,248 | | |
| KBC Groep NV(1) | | | 13,090 | | | | 1,429,421 | | |
| Societe Generale(1) | | | 2,455 | | | | 407,579 | | |
| Toronto-Dominion Bank (The)(1) | | | 19,900 | | | | 1,152,807 | | |
| UniCredito Italiano SPA(1) | | | 67,649 | | | | 560,613 | | |
| Wachovia Corp. | | | 25,150 | | | | 1,395,825 | | |
| | | $ | 10,856,976 | | |
| Security | | Shares | | Value | |
| Commercial Services & Supplies — 1.7% | |
| Banta Corp. | | | 8,000 | | | $ | 354,240 | | |
| Biffa PLC(1)(2) | | | 72,500 | | | | 368,505 | | |
| R.R. Donnelley & Sons Co. | | | 17,000 | | | | 575,620 | | |
| | | $ | 1,298,365 | | |
| Communications Equipment — 1.0% | |
| Nokia Oyj ADR | | | 37,000 | | | $ | 735,560 | | |
| | | $ | 735,560 | | |
| Computer Peripherals — 1.1% | |
| International Business Machines Corp. | | | 8,700 | | | $ | 803,271 | | |
| | | $ | 803,271 | | |
| Construction Materials — 0.6% | |
| Lafarge SA(1) | | | 3,080 | | | $ | 412,912 | | |
| | | $ | 412,912 | | |
| Consumer Finance — 1.5% | |
| Student Loan Corp. (The) | | | 5,285 | | | $ | 1,093,995 | | |
| | | $ | 1,093,995 | | |
| Diversified Financial Services — 4.0% | |
| Bank of America Corp. | | | 26,790 | | | $ | 1,443,177 | | |
| Citigroup, Inc. | | | 28,733 | | | | 1,441,247 | | |
| ING Groep NV ADR | | | 3,000 | | | | 132,990 | | |
| | | $ | 3,017,414 | | |
| Diversified Telecommunication Services — 9.1% | |
| Alaska Communications Systems Group, Inc. | | | 37,500 | | | $ | 539,625 | | |
| AT&T, Inc. | | | 30,800 | | | | 1,054,900 | | |
| BellSouth Corp. | | | 19,900 | | | | 897,490 | | |
| Embarq Corp. | | | 15,800 | | | | 763,930 | | |
| Telefonica SA(1) | | | 19,000 | | | | 365,799 | | |
| Telefonos de Mexico SA de CV ADR | | | 17,130 | | | | 452,061 | | |
| Telenor ASA(1) | | | 38,500 | | | | 608,635 | | |
| Telenor ASA ADR | | | 6,500 | | | | 309,855 | | |
| Verizon Communications, Inc. | | | 31,160 | | | | 1,152,920 | | |
| Windstream Corp. | | | 45,500 | | | | 624,260 | | |
| | | $ | 6,769,475 | | |
See notes to financial statements
16
Dividend Income Portfolio as of October 31, 2006
PORTFOLIO OF INVESTMENTS CONT'D
| Security | | Shares | | Value | |
| Electric Utilities — 5.4% | |
| E.ON AG ADR | | | 12,020 | | | $ | 482,363 | | |
| Endesa, SA(1) | | | 10,500 | | | | 460,690 | | |
| Enel SPA(1) | | | 77,000 | | | | 737,481 | | |
| Fortum Oyj(1) | | | 31,892 | | | | 880,490 | | |
| Iberdrola SA(1) | | | 10,800 | | | | 494,995 | | |
| Scottish and Southern Energy PLC(1) | | | 39,900 | | | | 1,000,838 | | |
| | | $ | 4,056,857 | | |
| Energy Equipment & Services — 0.5% | |
| Noble Corp.(1) | | | 5,100 | | | $ | 357,510 | | |
| | | $ | 357,510 | | |
| Food & Staples Retailing — 1.0% | |
| Wal-Mart Stores, Inc. | | | 14,500 | | | $ | 714,560 | | |
| | | $ | 714,560 | | |
| Food Products — 3.1% | |
| Cadbury Schweppes PLC ADR | | | 27,381 | | | $ | 1,111,395 | | |
| Nestle SA(1) | | | 1,300 | | | | 444,301 | | |
| Nestle SA ADR | | | 9,175 | | | | 783,731 | | |
| | | $ | 2,339,427 | | |
| Hotels, Restaurants & Leisure — 4.3% | |
| McDonald's Corp. | | | 39,400 | | | $ | 1,651,648 | | |
| Mitchells and Butlers PLC(1) | | | 13,204 | | | | 149,698 | | |
| Starwood Hotels and Resorts Worldwide, Inc. | | | 23,400 | | | | 1,397,916 | | |
| | | $ | 3,199,262 | | |
| Household Products — 0.6% | |
| Kimberly-Clark Corp. | | | 1,670 | | | $ | 111,088 | | |
| Kimberly-Clark de Mexico SA de CV(1) | | | 78,500 | | | | 328,184 | | |
| | | $ | 439,272 | | |
Independent Power Producers & Energy
Traders — 1.2% | |
| TXU Corp. | | | 14,170 | | | $ | 894,552 | | |
| | | $ | 894,552 | | |
| Industrial Conglomerates — 1.8% | |
| General Electric Co. | | | 38,150 | | | $ | 1,339,447 | | |
| | | $ | 1,339,447 | | |
| Security | | Shares | | Value | |
| Insurance — 5.3% | |
| AFLAC, Inc. | | | 5,400 | | | $ | 242,568 | | |
| Fidelity National Title Group, Inc., Class A | | | 69,925 | | | | 1,539,049 | | |
| Hartford Financial Services Group, Inc. (The) | | | 6,600 | | | | 575,322 | | |
| Markel Corp.(2) | | | 100 | | | | 39,950 | | |
| St. Paul Travelers Cos., Inc. (The) | | | 24,495 | | | | 1,252,429 | | |
| W. R. Berkley Corp. | | | 8,500 | | | | 313,310 | | |
| | | $ | 3,962,628 | | |
| Metals & Mining — 2.5% | |
| Anglo American PLC ADR | | | 23,150 | | | $ | 525,042 | | |
| BHP Billiton, Ltd. ADR | | | 11,400 | | | | 485,298 | | |
| Freeport-McMoRan Copper & Gold, Inc., Class B | | | 14,631 | | | | 884,883 | | |
| | | $ | 1,895,223 | | |
| Multiline Retail — 1.5% | |
| J.C. Penney Company, Inc. | | | 7,900 | | | $ | 594,317 | | |
| Marks & Spencer Group PLC(1) | | | 41,400 | | | | 517,804 | | |
| | | $ | 1,112,121 | | |
| Multi-Utilities — 2.1% | |
| CMS Energy Corp.(2) | | | 32,000 | | | $ | 476,480 | | |
| National Grid PLC(1) | | | 40,200 | | | | 512,515 | | |
| RWE AG(1) | | | 5,595 | | | | 554,168 | | |
| | | $ | 1,543,163 | | |
| Oil, Gas & Consumable Fuels — 13.4% | |
| Chesapeake Energy Corp. | | | 11,000 | | | $ | 356,840 | | |
| Chevron Corp. | | | 16,500 | | | | 1,108,800 | | |
| ConocoPhillips | | | 14,503 | | | | 873,661 | | |
| ENI SPA ADR | | | 12,000 | | | | 728,520 | | |
| Exxon Mobil Corp. | | | 30,589 | | | | 2,184,666 | | |
| Kinder Morgan, Inc. | | | 4,758 | | | | 500,066 | | |
| Marathon Oil Corp. | | | 12,000 | | | | 1,036,800 | | |
| Neste Oil Oyj(1) | | | 7,628 | | | | 243,361 | | |
| Occidental Petroleum Corp. | | | 15,660 | | | | 735,080 | | |
| Statoil ASA ADR | | | 20,870 | | | | 529,263 | | |
| Total SA ADR | | | 7,440 | | | | 506,962 | | |
| Williams Cos., Inc. (The) | | | 50,515 | | | | 1,234,081 | | |
| | | $ | 10,038,100 | | |
See notes to financial statements
17
Dividend Income Portfolio as of October 31, 2006
PORTFOLIO OF INVESTMENTS CONT'D
| Security | | Shares | | Value | |
| Pharmaceuticals — 6.6% | |
| GlaxoSmithKline PLC ADR | | | 19,354 | | | $ | 1,030,601 | | |
| Johnson & Johnson | | | 14,885 | | | | 1,003,249 | | |
| Pfizer, Inc. | | | 54,250 | | | | 1,445,763 | | |
| Wyeth | | | 28,725 | | | | 1,465,837 | | |
| | | $ | 4,945,450 | | |
| Real Estate Investment Trusts (REITs) — 1.8% | |
| Equity Residential | | | 12,450 | | | $ | 679,895 | | |
| Host Hotels & Resorts, Inc. | | | 122 | | | | 2,813 | | |
| Simon Property Group, Inc. | | | 6,990 | | | | 678,729 | | |
| | | $ | 1,361,437 | | |
| Road & Rail — 1.5% | |
| Burlington Northern Santa Fe Corp. | | | 14,070 | | | $ | 1,090,847 | | |
| | | $ | 1,090,847 | | |
| Specialty Retail — 1.0% | |
| Home Depot, Inc. (The) | | | 19,450 | | | $ | 726,069 | | |
| | | $ | 726,069 | | |
| Thrifts & Mortgage Finance — 0.5% | |
| IndyMac Bancorp, Inc. | | | 8,200 | | | $ | 372,690 | | |
| | | $ | 372,690 | | |
| Tobacco — 2.5% | |
| Altria Group, Inc. | | | 13,745 | | | $ | 1,117,881 | | |
| Reynolds American, Inc. | | | 11,800 | | | | 745,288 | | |
| | | $ | 1,863,169 | | |
| Water Utilities — 0.8% | |
| Severn Trent PLC(1) | | | 23,333 | | | $ | 620,948 | | |
| | | $ | 620,948 | | |
Total Common Stocks
(identified cost $69,209,484) | | | | | | $ | 73,630,187 | | |
| Short-Term Investments — 5.8% | |
| Security | | Principal
Amount
(000's omitted) | | Value | |
Abbey National North America LLC,
Commercial Paper, 5.31%, 11/1/06 | | $ | 934 | | | $ | 934,000 | | |
| Societe Generale Time Deposit, 5.31%, 11/1/06 | | | 3,400 | | | | 3,400,000 | | |
Total Short-Term Investments
(at amortized cost, $4,334,000) | | $ | 4,334,000 | | |
Total Investments — 104.5%
(identified cost $73,543,484) | | $ | 77,964,187 | | |
| Other Assets, Less Liabilities — (4.5)% | | $ | (3,325,891 | ) | |
| Net Assets — 100.0% | | $ | 74,638,296 | | |
ADR - American Depository Receipt
(1) Foreign security.
(2) Non-income producing security.
| Country Concentration of Portfolio | |
| Country | | Percentage
of Total Investments | | Value | |
| United States | | | 79.9 | % | | $ | 62,345,294 | | |
| United Kingdom | | | 6.4 | | | | 4,967,999 | | |
| Belgium | | | 1.8 | | | | 1,429,421 | | |
| Canada | | | 1.7 | | | | 1,345,791 | | |
| Spain | | | 1.7 | | | | 1,321,484 | | |
| Italy | | | 1.7 | | | | 1,298,094 | | |
| France | | | 1.6 | | | | 1,237,849 | | |
| Finland | | | 1.4 | | | | 1,123,851 | | |
| Switzerland | | | 1.2 | | | | 908,659 | | |
| Norway | | | 0.8 | | | | 608,635 | | |
| Germany | | | 0.7 | | | | 554,168 | | |
| Cayman Islands | | | 0.5 | | | | 357,510 | | |
| Mexico | | | 0.4 | | | | 328,184 | | |
| China | | | 0.2 | | | | 137,248 | | |
| Total | | | 100 | % | | $ | 77,964,187 | | |
See notes to financial statements
18
Dividend Income Portfolio as of October 31, 2006
FINANCIAL STATEMENTS
Statement of Assets and Liabilities
As of October 31, 2006
| Assets | |
| Investments, at value (identified cost, $73,543,484) | | $ | 77,964,187 | | |
| Cash | | | 15,737 | | |
| Receivable for investments sold | | | 1,160,739 | | |
| Dividends and interest receivable | | | 457,470 | | |
| Tax reclaim receivable | | | 58,284 | | |
| Total assets | | $ | 79,656,417 | | |
| Liabilities | |
| Payable for investments purchased | | $ | 4,938,514 | | |
| Payable to affiliate for investment adviser fee | | | 36,677 | | |
| Payable to affiliate for Trustees' fees | | | 1,003 | | |
| Other accrued expenses | | | 41,927 | | |
| Total liabilities | | $ | 5,018,121 | | |
| Net Assets applicable to investors' interest in Portfolio | | $ | 74,638,296 | | |
| Sources of Net Assets | |
| Net proceeds from capital contributions and withdrawals | | $ | 70,355,026 | | |
| Net unrealized appreciation (computed on the basis of identified cost) | | | 4,283,270 | | |
| Total | | $ | 74,638,296 | | |
Statement of Operations
For the Period Ended
October 31, 2006(1)
| Investment Income | |
| Dividends (net of foreign taxes, $194,867) | | $ | 3,913,688 | | |
| Interest | | | 53,840 | | |
| Total investment income | | $ | 3,967,528 | | |
| Expenses | |
| Investment adviser fee | | $ | 156,668 | | |
| Trustees' fees and expenses | | | 405 | | |
| Legal and accounting services | | | 17,038 | | |
| Custodian fee | | | 33,738 | | |
| Organization expense | | | 4,000 | | |
| Miscellaneous | | | 2,573 | | |
| Total expenses | | $ | 214,422 | | |
Deduct —
Reduction of custodian fee | | $ | 174 | | |
| Total expense reductions | | $ | 174 | | |
| Net expenses | | $ | 214,248 | | |
| Net investment income | | $ | 3,753,280 | | |
| Realized and Unrealized Gain (Loss) | |
Net realized gain (loss) —
Investment transactions (identified cost basis) | | $ | (2,640,225 | ) | |
| Foreign currency transactions | | | (88,561 | ) | |
| Net realized loss | | $ | (2,728,786 | ) | |
Change in unrealized appreciation (depreciation) —
Investments (identified cost basis) | | $ | 4,273,454 | | |
| Foreign currency | | | 9,816 | | |
| Net change in unrealized appreciation (depreciation) | | $ | 4,283,270 | | |
| Net realized and unrealized gain | | $ | 1,554,484 | | |
| Net increase in net assets from operations | | $ | 5,307,764 | | |
(1) For the period from the start of business, March 24, 2006, to October 31, 2006.
See notes to financial statements
19
Dividend Income Portfolio as of October 31, 2006
FINANCIAL STATEMENTS CONT'D
Statement of Changes in Net Assets
| Increase (Decrease) in Net Assets | | Period Ended
October 31, 2006(1) | |
From operations —
Net investment income | | $ | 3,753,280 | | |
Net realized loss from investment transactions and foreign
currency transactions | | | (2,728,786 | ) | |
Net change in unrealized appreciation (depreciation) of investments
and foreign currency | | | 4,283,270 | | |
| Net increase in net assets from operations | | $ | 5,307,764 | | |
Capital transactions —
Assets contributed by Eaton Vance Dividend Income Fund | | $ | 5,112,681 | | |
| Contributions | | | 67,092,789 | | |
| Withdrawals | | | (2,974,948 | ) | |
| Net increase in net assets from capital transactions | | $ | 69,230,522 | | |
| Net increase in net assets | | $ | 74,538,286 | | |
| Net Assets | |
| At beginning of period | | $ | 100,010 | | |
| At end of period | | $ | 74,638,296 | | |
(1) For the period from the start of business, March 24, 2006, to October 31, 2006.
See notes to financial statements
20
Dividend Income Portfolio as of October 31, 2006
FINANCIAL STATEMENTS CONT'D
Supplementary Data
| | | Period Ended
October 31, 2006(1) | |
| Ratios/Supplemental Data | |
| Ratios (As a percentage of average daily net assets): | |
| Expenses before custodian fee reduction | | | 0.88 | %(2) | |
| Expenses after custodian fee reduction | | | 0.88 | %(2) | |
| Net investment income | | | 15.44 | %(2) | |
| Portfolio Turnover | | | 170 | % | |
| Total Return(3) | | | 10.33 | % | |
| Net assets, end of period (000's omitted) | | $ | 74,638 | | |
(1) For the period from the start of business, March 24, 2006, to October 31, 2006.
(2) Annualized.
(3) Total return is not computed on an annualized basis.
See notes to financial statements
21
Dividend Income Portfolio as of October 31, 2006
NOTES TO FINANCIAL STATEMENTS
1 Significant Accounting Policies
Dividend Income Portfolio (the Portfolio) is registered under the Investment Company Act of 1940, as amended, as a diversified, open-end management investment company. The Portfolio, which was organized as a trust under the laws of the State of New York on February 13, 2006 seeks to achieve total return by investing primarily in a diversified portfolio of equity securities that pay dividends. The Declaration of Trust permits the Trustees to issue interests in the Portfolio. At October 31, 2006, the Eaton Vance Dividend Income Fund held a 69.0% interest in the Portfolio. The following is a summary of significant accounting policies consistently followed by the Portfolio in the preparation of its financial statements. The policies are in conformity with accounting principles generally accepted in the United States of America.
A Investment Valuation — Securities listed on a U.S. securities exchange generally are valued at the last sale price on the day of valuation or, if no sales took place on such date, at the mean between the closing bid and asked prices therefore on the exchange where such securities are principally traded. Equity securities listed on the NASDAQ National Market System generally are valued at the official NASDAQ closing price. Unlisted or listed securities for which closing sales prices or closing quotations are not available are valued at the mean between the latest available bid and asked prices or, in the case of preferred equity securities that are not listed or traded in the over-the-counter market, by an independent pricing service. Exchange-traded options are valued a t the last sale price for the day of valuation as quoted on the principal exchange or board of trade on which the options are traded or, in the absence of sales on such date, at the mean between the latest bid and asked prices therefore. Futures positions on securities and currencies generally are valued at closing settlement prices. Short-term debt securities with a remaining maturity of 60 days or less are valued at amortized cost. If short-term debt securities are acquired with a remaining maturity of more than 60 days, they will be valued by a pricing service. Other fixed income and debt securities, including listed securities and securities for which price quotations are available, will normally be valued on the basis of valuations furnished by a pricing service. Foreign securities and currencies are valued in U.S. dollars, based on foreign currency exchange rate quotations supplied by an independent quotation service. The daily valuation of exchange-traded foreign securities generally is determined as of the close of trading on the principal exchange on which such securities trade. Events occurring after the close of trading on foreign exchanges may result in adjustments to the valuation of foreign securities to more accurately reflect their fair value as of the close of regular trading on the New York Stock Exchange. When valuing foreign equity securities that meet certain criteria, the Trustees have approved the use of a fair value service that values such securities to reflect market trading that occurs after the close of the applicable foreign markets of comparable securities or other instruments that have a strong correlation to the fair-valued securities. Investments held by the Portfolio for which valuations or market quotations are unavailable are valued at fair value using methods determined in good faith by or at the direction of the Trustees of the Portfolio considering relevant factors, data and information including the m arket value of freely tradable securities of the same class in the principal market on which such securities are normally traded.
B Income — Dividend income is recorded on the ex-dividend date for dividends received in cash and/or securities. However, if the ex-dividend date has passed, certain dividends from foreign securities are recorded as the Portfolio is informed of the ex-dividend date. Withholding taxes on foreign dividends and capital gains have been provided for in accordance with the Portfolio's understanding of the applicable countries' tax rules and rates. Interest income is recorded on the accrual basis.
C Income Taxes — The Portfolio has elected to be treated as a partnership for federal tax purposes. No provision is made by the Portfolio for federal or state taxes on any taxable income of the Portfolio because each investor in the Portfolio is ultimately responsible for the payment of any taxes on its share of taxable income. Since at least one of the Portfolio's investors is a regulated investment company that invests all or substantially all of its assets in the Portfolio, the Portfolio normally must satisfy the applicable source of income and diversification requirements (under the Internal Revenue Code) in order for its investors to satisfy them. The Portfolio will allocate, at least annually among its investors, each investor's distributive share of the Portfolio's net investment income, net realized capital gains, and any other items of income, gain, loss, deduction or credit.
D Expense Reduction — Investors Bank & Trust Company (IBT) serves as custodian to the Portfolio. Pursuant to the custodian agreement, IBT receives a fee reduced by credits which are determined based on the average daily cash balance the Portfolio maintains with IBT. All credit balances used to reduce the Portfolio's custodian fees are reported as a reduction of expenses in the Statement of Operations.
22
Dividend Income Portfolio as of October 31, 2006
NOTES TO FINANCIAL STATEMENTS CONT'D
E Financial Futures Contracts — Upon the entering of a financial futures contract, the Portfolio is required to deposit either in cash or securities an amount (initial margin) equal to a certain percentage of the purchase price indicated in the financial futures contract. Subsequent payments are made or received by the Portfolio (margin maintenance) each day, dependent on daily fluctuations in the value of the underlying security, and are recorded for book purposes as unrealized gains or losses by the Portfolio. The Portfolio's investment in financial futures contracts is designed to hedge against anticipated future changes in the price of current or anticipated portfolio positions. Should prices move unexpectedly, the Portfolio may not achieve the anticipated benefits of the financial futures contracts and may realize a loss.
F Foreign Currency Translation — Investment valuations, other assets, and liabilities initially expressed in foreign currencies are converted each business day into U.S. dollars based upon current exchange rates. Purchases and sales of foreign investment securities and income and expenses are converted into U.S. dollars based upon currency exchange rates prevailing on the respective dates of such transactions. Recognized gains or losses on investment transactions attributable to changes in foreign currency exchange rates are recorded for financial statement purposes as net realized gains and losses on investments. That portion of unrealized gains and losses on investments that results from fluctuations in foreign currency exchange rates is not separately disclosed.
G Forward Foreign Currency Exchange Contracts — The Portfolio may enter into forward foreign currency exchange contracts for the purchase or sale of a specific foreign currency at a fixed price on a future date. Risks may arise upon entering these contracts from the potential inability of counterparties to meet the terms of their contracts and from movements in the value of a foreign currency relative to the U.S. dollar. The Portfolio will enter into forward contracts for hedging purposes as well as non-hedging purposes. The forward foreign currency exchange contracts are adjusted by the daily exchange rate of the underlying currency and any gains or losses are recorded for financial statement purposes as unrealized until such time as the contracts have been closed or off set.
H Put Options — Upon the purchase of a put option by the Portfolio, the premium paid is recorded as an investment, the value of which is marked-to-market daily. When a purchased option expires, the Portfolio will realize a loss in the amount of the cost of the option. When the Portfolio enters into a closing sale transaction, the Portfolio will realize a gain or loss depending on whether the sales proceeds from the closing sale transaction are greater or less than the cost of the option. When the Portfolio exercises a put option, settlement is made in cash. The risk associated with purchasing options is limited to the premium originally paid.
I Securities Sold Short — The Portfolio may sell individual securities short if it owns at least an equal amount of the security sold short or has at the time of the sale a right to obtain securities in kind and amount to the securities sold short provided that, if such right is conditional, the sale is made upon the same conditions (a covered short sale). The Portfolio may sell short securities representing an index or basket of securities whose constituents the Portfolio holds in whole or in part. A short sale of an index or basket of securities will be a covered short sale if the underlying index or basket of securities is the same or substantially identical to securities held by the Portfolio. Upon executing the transaction, the Portfolio records the proceeds as depos its with brokers in the Statement of Assets and Liabilities and establishes an offsetting payable for securities sold short for the securities due on settlement. The proceeds are retained by the broker as collateral for the short position. The liability is marked-to-market and the Portfolio is required to pay the lending broker any dividend or interest income earned while the short position is open. The seller of a short position generally realizes a profit on the transaction if the price it receives on the short sale exceeds the cost of closing out the position by purchasing securities in the market, but generally realizes a loss if the cost of closing out the short position exceeds the proceeds of the short sale. The exposure to loss on covered short sales (to the extent the value of the security sold short rises instead of falls) is offset by the increase in the value of the underlying security or securities retained. The profit or loss on a covered short sale is also affected by the borrowing cost of any securities borrowed in connection with the short sale (which will vary with market conditions) and use of the proceeds of the short sale. The Portfolio expects normally to close its covered short sales by delivering newly acquired stocks. Exposure to loss on an index or basket of securities sold short will not be offset by gains on other securities holdings to the extent that the constituent securities of the index or a basket of securities sold short are not held by the Portfolio. Such losses may be substantial.
J Use of Estimates — The preparation of the financial statements in conformity with accounting principles generally accepted in the United States of America requires management to make estimates and assumptions that affect the reported amounts of assets and liabilities at the date of
23
Dividend Income Portfolio as of October 31, 2006
NOTES TO FINANCIAL STATEMENTS CONT'D
the financial statements and the reported amounts of income and expense during the reporting period. Actual results could differ from those estimates.
K Indemnifications — Under the Portfolio's organizational documents, its officers and Trustees may be indemnified against certain liabilities and expenses arising out of the performance of their duties to the Portfolio. Interestholders in the Portfolio are jointly and severally liable for the liabilities and obligations of the Portfolio in the event that the Portfolio fails to satisfy such liabilities and obligations; provided, however, that, to the extent assets are available in the Portfolio, the Portfolio may, under certain circumstances, indemnify interestholders from and against any claim or liability to which such holder may become subject by reason of being or having been an interestholder in the Portfolio. Additionally, in the normal course of business, the Portfo lio enters into agreements with service providers that may contain indemnification clauses. The Portfolio's maximum exposure under these arrangements is unknown as this would involve future claims that may be made against the Portfolio that have not yet occurred.
L Other — Investment transactions are accounted for on the date the securities are purchased or sold. Realized gains and losses on securities sold are determined on the basis of identified cost.
2 Investment Adviser Fee and Other Transactions with Affiliates
The investment adviser fee is earned by Boston Management and Research (BMR), a wholly-owned subsidiary of Eaton Vance Management (EVM), as compensation for management and investment advisory services rendered to the Portfolio. Under the advisory agreement, BMR receives a monthly advisory fee of 0.65% annually of the average daily net assets of the Portfolio up to $500 Million, and at reduced rates as daily net assets exceed that level. For the period from the start of business, March 24, 2006, to October 31, 2006, the advisory fee amounted to $156,668. Except for Trustees of the Portfolio who are not members of EVM's or BMR's organization, officers and Trustees receive remuneration for their services to the Portfolio out of such investment adviser fee. Trustees of the Portfolio that are not affiliated with the investment adviser may elect to defer receipt of all or a percentage of their annual fees in accordance with the terms of the Trustees Deferred Compensation Plan. For the period from March 24, 2006 (start of business) to October 31, 2006, no significant amounts have been deferred.
Certain officers and Trustees of the Portfolio are officers of the above organizations.
3 Investments Transactions
Purchases and sales of investments, other than short-term obligations, aggregated $134,220,848 and $67,451,855 respectively, for the period from the start of business, March 24, 2006, to October 31, 2006.
4 Transfer of Assets
Investment operations began on March 24, 2006 with a transfer of investment assets, and related accounts, by Eaton Vance Dividend Income Fund of $5,112,681, in exchange for an interest in the Portfolio, including net unrealized appreciation of $147,048. The transaction was structured for tax purposes to qualify as a tax-free exchange under the Internal Revenue Code.
5 Federal Income Tax Basis of Unrealized Appreciation (Depreciation)
The cost and unrealized appreciation (depreciation) of investments owned at October 31, 2006, as determined on a federal income tax basis, were as follows:
| Aggregate cost | | $ | 73,602,468 | | |
| Gross unrealized appreciation | | $ | 4,740,064 | | |
| Gross unrealized depreciation | | | (378,345 | ) | |
| Net unrealized appreciation | | $ | 4,361,719 | | |
6 Risks Associated with Foreign Investments
Investing in securities issued by companies whose principal business activities are outside the United States may involve significant risks not present in domestic investments. For example, there is generally less publicly available information about foreign companies, particularly those not subject to the disclosure and reporting requirements of the U.S. securities laws. Foreign issuers are generally not bound by uniform accounting, auditing, and financial reporting requirements and standards of practice comparable to those applicable to domestic issuers. Investments in foreign securities also involve the risk of possible adverse changes in investment or exchange control regulations, expropriation or confiscatory taxation, limitation on the removal of funds or other assets of the Portfolio, political or financial instability or diplomatic and other developments which could affect such investments. Foreign stock markets, while g rowing in volume and
24
Dividend Income Portfolio as of October 31, 2006
NOTES TO FINANCIAL STATEMENTS CONT'D
sophistication, are generally not as developed as those in the United States, and securities of some foreign issuers (particularly those located in developing countries) may be less liquid and more volatile than securities of comparable U.S. companies. In general, there is less overall governmental supervision and regulation of foreign securities markets, broker-dealers and issuers than in the United States.
7 Financial Instruments
The Portfolio may trade in financial instruments with off-balance sheet risk in the normal course of its investing activities to assist in managing exposure to various market risks. These financial instruments include written options, forward foreign currency contracts and financial futures contracts, and may involve, to a varying degree, elements of risk in excess of the amounts recognized for financial statement purposes.
The notional or contractual amounts of these instruments represent the investment the Portfolio has in particular classes of financial instruments and does not necessarily represent the amounts potentially subject to risk. The measurement of the risks associated with these instruments is meaningful only when all related and offsetting transactions are considered. The Portfolio did not have any open obligations under these financial instruments at October 31, 2006.
8 Line of Credit
The Portfolio participates with other portfolios and funds managed by EVM and its affiliates in a $150 million unsecured line of credit agreement with a group of banks. Borrowings will be made by the Portfolio solely to facilitate the handling of unusual and/or unanticipated short term cash requirements. Interest is charged to each participating portfolio or fund based on its borrowings at an amount above either the Eurodollar rate or Federal Funds rate. In addition, a fee computed at an annual rate of 0.10% on the daily unused portion of the line of credit is allocated among the participating portfolios and funds at the end of each quarter. The Portfolio did not have any significant borrowings or allocated fees for the period from the start of business, March 24, 2006, to October 31, 2006.
9 Recently Issued Accounting Pronouncements
In June 2006, the Financial Accounting Standards Board (FASB) issued FASB Interpretation No. 48, (FIN 48) "Accounting for Uncertainty in Income Taxes – an interpretation of FASB Statement No. 109". FIN 48 clarifies the accounting for uncertainty in income taxes recognized in accordance with FASB Statement No. 109, "Accounting for Income Taxes". This interpretation prescribes a recognition threshold and measurement attribute for the financial statement recognition and measurement of a tax position taken or expected to be taken in a tax return. It also provides guidance on de-recognition, classification, interest and penalties, accounting in interim periods, disclosure and transition. FIN 48 is effective for fiscal years beginning after December 15, 2006. Management is currently evaluating the impact of applying the various provisions of FIN 48.
In September 2006, the FASB issued Statement of Financial Accounting Standards No. 157, (FAS 157) "Fair Value Measurements". FAS 157 defines fair value, establishes a framework for measuring fair value in accordance with generally accepted accounting principles and expands disclosure about fair value measurements. FAS 157 is effective for fiscal years beginning after November 15, 2007. Management is currently evaluating the impact the adoption of FAS 157 will have on the Portfolio's financial statement disclosures.
25
Dividend Income Portfolio as of October 31, 2006
REPORT OF INDEPENDENT REGISTERED PUBLIC ACCOUNTING FIRM
To the Trustees and Investors
of Dividend Income Portfolio:
We have audited the accompanying statement of assets and liabilities of Dividend Income Portfolio (the Portfolio), including the portfolio of investments, as of October 31, 2006, the related statement of operations, the statement of changes in net assets, and the supplementary data for the period from the start of business, March 24, 2006, to October 31, 2006. These financial statements and supplementary data are the responsibility of the Portfolio's management. Our responsibility is to express an opinion on these financial statements and supplementary data based on our audit.
We conducted our audit in accordance with the standards of the Public Company Accounting Oversight Board (United States). Those standards require that we plan and perform the audit to obtain reasonable assurance about whether the financial statements and supplementary data are free of material misstatement. The Portfolio is not required to have, nor were we engaged to perform, an audit of its internal control over financial reporting. Our audit included consideration of internal control over financial reporting as a basis for designing audit procedures that are appropriate in the circumstances, but not for the purpose of expressing an opinion on the effectiveness of the Portfolio's internal control over financial reporting. Accordingly, we express no such opinion. An audit also includes examining, on a test basis, evidence supporting the amounts and disclosures in the financial statements, assessing the accounting principles use d and significant estimates made by management, as well as evaluating the overall financial statement presentation. Our procedures included confirmation of securities owned as of October 31, 2006, by correspondence with the custodian and brokers; where replies were not received from brokers, we performed other auditing procedures. We believe that our audit provides a reasonable basis for our opinion.
In our opinion, the financial statements and supplementary data referred to above present fairly, in all material respects, the financial position of the Dividend Income Portfolio as of October 31, 2006, the results of its operations, the changes in its net assets and the supplementary data for the period from the start of business, March 24, 2006, to October 31, 2006, in conformity with accounting principles generally accepted in the United States of America.
DELOITTE & TOUCHE LLP
Boston, Massachusetts
December 15, 2006
26
Eaton Vance Dividend Income Fund
BOARD OF TRUSTEES' ANNUAL APPROVAL OF THE INVESTMENT ADVISORY AGREEMENT
In considering the approval of the investment advisory agreement between Dividend Income Portfolio (the "Portfolio") and Boston Management and Research ("BMR"), the Special Committee considered information that had been provided throughout the year at regular Board meetings, as well as information furnished to the Special Committee for a series of meetings held in February and March in preparation for a Board meeting held on March 21, 2005 to specifically consider the renewal of the investment advisory agreements of other Eaton Vance Funds. Such information included, among other things, the following:
• The economic outlook and the general investment outlook in relevant investment markets;
• BMR's results and financial condition and the overall organization of the investment adviser;
• The procedures and processes used to determine the fair value of Fund assets and actions taken to monitor and test the effectiveness of such procedures and processes;
• The allocation of brokerage and the benefits received by the investment adviser as a result of brokerage allocation;
• BMR's management of the relationship with the custodian, subcustodians and fund accountants;
• The resources devoted to BMR's compliance efforts undertaken on behalf of the funds it manages and the record of compliance with the investment policies and restrictions and with policies on personal securities transactions;
• The quality, nature, cost and character of the administrative and other non-investment management services provided by BMR and its affiliates; and
• The terms of the advisory agreement and the reasonableness and appropriateness of the particular fee paid by the Portfolio for the services described herein.
The Special Committee also considered the nature, extent and quality of the management services provided by BMR. In so doing, the Special Committee considered BMR's management capabilities with respect to the types of investments held by the Portfolio, including information relating to the education, experience and number of investment professionals and other personnel who provide services under the investment advisory agreement. The Special Committee specifically noted the investment adviser's in-house equity research capabilities. The Special Committee also took into account the time and attention to be devoted by senior management to the Portfolio and the other funds in the complex. The Special Committee evaluated the level of skill required to manage the Portfolio and concluded that the human resources available at the investment adviser were appropriate to fulfill effectively its duties on behalf of the Portfolio.
The Special Committee received information concerning the investment philosophy and investment process applied by BMR in managing the Portfolio. In this regard, the Special Committee considered BMR's in-house research capabilities as well as other resources available to BMR personnel, including research services that may be available to BMR as a result of securities transactions affected for the Portfolio and other investment advisory clients. The Special Committee concluded that BMR's investment process, research capabilities and philosophy were well suited to the Portfolio, given the Portfolio's investment objective and policies. The Special Committee also considered BMR's success in managing other Funds that seek to generate qualified dividend income, including one open-end fund.
With respect to its review of investment advisory fees, the Special Committee concluded that the fees to be paid by the Portfolio are within the range of those paid by comparable funds within the mutual fund industry. In reviewing the information regarding the estimated expense ratio of the Fund, the Special Committee concluded that such expense ratio is within a range that is competitive with comparable funds.
In addition to the factors mentioned above, the Special Committee reviewed the level of the investment adviser's expected profits in providing investment management and administration services for Eaton Vance Funds with a similar fee structure to that of the Fund and for all Eaton Vance funds as a group. In addition, the Special Committee considered the fiduciary duty assumed by the investment adviser in connection with the services rendered to the Fund and the business reputation of the investment adviser and its financial resources. The Trustees concluded that in light of the services to be rendered, the profits to be realized by the investment adviser are not unreasonable. The Special Committee also considered the extent to which the investment adviser is expected to realize benefits from economies of scale in managing the Portfolio, and concluded that the fee breakpoints which are in place will allow for an equitable sharing of such benefits, when realized, with shareholders of the Fund.
The Special Committee did not consider any single factor as controlling in determining whether or not to approve the investment advisory agreement. Nor are the items described herein all the matters considered by the Special Committee. In assessing the information provided by BMR and its affiliates, the Special Committee also took into consideration the benefits to shareholders of investing in a fund that is part of a large family of funds which provides a large variety of shareholder services.
Based on its consideration of the foregoing factors and conclusions, and such other factors and conclusions as it deemed relevant, and assisted by independent counsel, the Special Committee concluded that the approval of the investment advisory agreement, including the fee structure, is in the interests of shareholders.
27
Eaton Vance Dividend Income Fund
MANAGEMENT AND ORGANIZATION
Fund Management. The Trustees of Eaton Vance Mutual Funds Trust (the Trust) and Dividend Income Portfolio (the Portfolio) are responsible for the overall management and supervision of the Trust's and Portfolio's affairs. The Trustees and officers of the Trust and the Portfolio are listed below. Except as indicated, each individual has held the office shown or other offices in the same company for the last five years. Trustees and officers of the Trust and the Portfolio hold indefinite terms of office. The "noninterested Trustees" consist of those Trustees who are not "interested persons" of the Trust and the Portfolio, as that term is defined under the 1940 Act. The business address of each Trustee and officer is The Eaton Vance Building, 255 State Street, Boston, Massachusetts 02109. As used below, "EVC" refers to Eaton Vance Corp., "EV" refers to Eaton Van ce, Inc., "EVM" refers to Eaton Vance Management, "BMR" refers to Boston Management and Research, "Parametric" refers to Parametric Portfolio Associates and "EVD" refers to Eaton Vance Distributors, Inc. EVC and EV are the corporate parent and trustee, respectively, of EVM and BMR. EVD is the Fund's principal underwriter, the Portfolio's placement agent and a wholly-owned subsidiary of EVM. Each officer affiliated with Eaton Vance may hold a position with other Eaton Vance affiliates that is comparable to his or her position with EVM listed below.
Name and
Date of Birth | | Position(s)
with the
Trust and
the Portfolio | | Term of
Office and
Length of
Service | | Principal Occupation(s)
During Past Five Years | | Number of Portfolios
in Fund Complex
Overseen By
Trustee(1) | | Other Directorships Held | |
| Interested Trustee | | | | | | | | | | | | | |
|
| James B. Hawkes 11/9/41 | | Trustee | | Trustee of the Trust since 1991 and of the Portfolio since 2006. | | Chairman and Chief Executive Officer of EVC, BMR, EVM and EV; Director of EV; Vice President and Director of EVD. Trustee and/or officer of 170 registered investment companies in the Eaton Vance Fund Complex. Mr. Hawkes is an interested person because of his positions with BMR, EVM, EVC and EV, which are affiliates of the Trust and the Portfolio. | | | 170 | | | Director of EVC | |
|
| Noninterested Trustee(s) | | | | | | | | | | | | | |
|
| Benjamin C. Esty 1/2/63 | | Trustee | | Trustee of the Trust since 2005 and of the Portfolio since 2006. | | Roy and Elizabeth Simmons Professor of Business Administration, Harvard University Graduate School of Business Administration (since 2003). Formerly, Associate Professor, Harvard University Graduate School of Business Administration (2000-2003). | | | 170 | | | None | |
|
| Samuel L. Hayes, III 2/23/35 | | Trustee and Chairman of the Board | | Trustee of the Trust since 1986; of the Portfolio since 2006 and Chairman of the Board since 2005. | | Jacob H. Schiff Professor of Investment Banking Emeritus, Harvard University Graduate School of Business Administration. Director of Yakima Products, Inc. (manufacturer of automotive accessories) (since 2001) and Director of Telect, Inc. (telecommunications services company). | | | 170 | | | Director of Tiffany & Co. (specialty retailer) | |
|
| William H. Park 9/19/47 | | Trustee | | Trustee of the Trust since 2003 and of the Portfolio since 2006. | | Vice Chairman, Commercial Industrial Finance Corp. (specialty finance company) (since 2006). Formerly, President and Chief Executive Officer, Prizm Capital Management, LLC (investment management firm) (2002-2005). Formerly, Executive Vice President and Chief Financial Officer, United Asset Management Corporation (a holding company owning institutional investment management firms) (1982-2001). | | | 170 | | | None | |
|
| Ronald A. Pearlman 7/10/40 | | Trustee | | Trustee of the Trust since 2003 and of the Portfolio since 2006. | | Professor of Law, Georgetown University Law Center. | | | 170 | | | None | |
|
28
Eaton Vance Dividend Income Fund
MANAGEMENT AND ORGANIZATION CONT'D
Name and
Date of Birth | | Position(s)
with the
Trust and
the Portfolio | | Term of
Office and
Length of
Service | | Principal Occupation(s)
During Past Five Years | | Number of Portfolios
in Fund Complex
Overseen By
Trustee(1) | | Other Directorships Held | |
| Noninterested Trustee(s) (continued) | | | | | | | | | | | | | |
|
| Norton H. Reamer 9/21/35 | | Trustee | | Trustee of the Trust since 1986 and of the Portfolio since 2006. | | President, Chief Executive Officer and a Director of Asset Management Finance Corp. (a specialty finance company serving the investment management industry) (since October 2003). President, Unicorn Corporation (an investment and financial advisory services company) (since September 2000). Formerly, Chairman and Chief Operating Officer, Hellman, Jordan Management Co., Inc. (an investment management company) (2000-2003). Formerly, Advisory Director of Berkshire Capital Corporation (investment banking firm) (2002-2003). | | | 170 | | | None | |
|
| Lynn A. Stout 9/14/57 | | Trustee | | Trustee of the Trust since 1998 and of the Portfolio since 2006. | | Professor of Law, University of California at Los Angeles School of Law. | | | 170 | | | None | |
|
| Ralph F. Verni 1/26/43 | | Trustee | | Trustee of the Trust since 2005 and of the Portfolio since 2006. | | Consultant and private investor. | | | 170 | | | None | |
|
| Principal Officers who are not Trustees | | | | | | | | | | | | | |
|
Name and
Date of Birth | | Position(s)
with the
Trust and
the Portfolio | | Term of
Office and
Length of
Service | | Principal Occupation(s)
During Past Five Years | |
| Thomas E. Faust Jr. 5/31/58 | | President of the Trust | | Since 2002 | | President of EVC, EVM, BMR and EV and Director of EVC. Chief Investment Officer of EVC, EVM and BMR. Officer of 71 registered investment companies and 5 private investment companies managed by EVM or BMR. | |
|
| William H. Ahern, Jr. 7/28/59 | | Vice President of the Trust | | Since 1995 | | Vice President of EVM and BMR. Officer of 71 registered investment companies managed by EVM or BMR. | |
|
| Cynthia J. Clemson 3/2/63 | | Vice President of the Trust | | Since 2005 | | Vice President of EVM and BMR. Officer of 86 registered investment companies managed by EVM or BMR. | |
|
| Kevin S. Dyer 2/21/75 | | Vice President of the Trust | | Since 2005 | | Assistant Vice president of EVM and BMR. Officer of 25 registered investment companies managed by EVM or BMR. | |
|
| Aamer Khan 6/7/60 | | Vice President | | Vice President of the Trust since 2005 and of the Portfolio since 2006 | | Vice President of EVM and BMR. Officer of 29 registered investment companies managed by EVM or BMR. | |
|
| Thomas H. Luster 4/8/62 | | Vice President of the Trust | | Since 2006 | | Vice President of EVM and BMR. Officer of 45 registered investment companies managed by EVM or BMR. | |
|
| Michael R. Mach 7/15/47 | | Vice President of the Trust | | Since 1999 | | Vice President of EVM and BMR. Officer of 51 registered investment companies managed by EVM or BMR. | |
|
| Robert B. MacIntosh 1/22/57 | | Vice President of the Trust | | Since 1998 | | Vice President of EVM and BMR. Officer of 86 registered investment companies managed by EVM or BMR. | |
|
| Cliff Quisenberry, Jr. 1/1/65 | | Vice President of the Trust | | Since 2006 | | Vice President and Director of Research and Product Development of Parametric. Officer of 30 registered investment companies managed by EVM or BMR. | |
|
| Duncan W. Richardson 10/26/57 | | Vice President of the Trust and President of the Portfolio | | Vice President of the Trust since 2001 and President of the Portfolio since 2006 | | Executive Vice President and Chief Equity Investment Officer of EVC, EVM and BMR. Officer 71 registered investment companies managed by EVM or BMR. | |
|
29
Eaton Vance Dividend Income Fund
MANAGEMENT AND ORGANIZATION CONT'D
Name and
Date of Birth | | Position(s)
with the
Trust and
the Portfolio | | Term of
Office and
Length of
Service | | Principal Occupation(s)
During Past Five Years | |
| Principal Officers who are not Trustees (continued) | |
|
| Walter A. Row, III 7/20/57 | | Vice President of the Trust | | Since 2001 | | Director of Equity Research and a Vice President of EVM and BMR. Officer of 33 registered investment companies managed by EVM or BMR. | |
|
| Judith A. Saryan 8/21/54 | | Vice President | | Vice President of the Trust since 2003 and of the Portfolio since 2006 | | Vice President of EVM and BMR. Officer of 50 registered investment companies managed by EVM or BMR. | |
|
| Susan Schiff 3/31/61 | | Vice President of the Trust | | Since 2002 | | Vice President of EVM and BMR. Officer of 30 registered investment companies managed by EVM or BMR. | |
|
| Barbara E. Campbell 6/19/57 | | Treasurer of the Trust | | Since 2005(2) | | Vice President of EVM and BMR. Officer of 170 registered investment companies managed by EVM or BMR. | |
|
| Alan R. Dynner 10/10/40 | | Secretary | | Secretary of the Trust since 1997 and of the Portfolio since 2006 | | Vice President, Secretary and Chief Legal Officer of BMR, EVM, EVD, EV and EVC. Officer of 170 registered investment companies managed by EVM or BMR. | |
|
| Michelle A. Green 8/25/69 | | Treasurer of the Portfolio | | Since 2006 | | Vice President of EVM and BMR. Officer of 63 registered investment companies and 5 private investment companies managed by EVM or BMR. | |
|
| Paul M. O'Neil 7/11/53 | | Chief Compliance Officer | | Chief Compliance Officer of the Trust since 2004 and of the Portfolio since 2006 | | Vice President of EVM and BMR. Officer of 170 registered investment companies managed by EVM or BMR. | |
|
(1) Includes both master and feeder funds in a master-feeder structure.
(2) Prior to 2005, Ms. Campbell served as Assistant Treasurer of the Trust since 1995.
The SAI for the Fund includes additional information about the Trustees and officers of the Fund and the Portfolio and can be obtained without charge on Eaton Vance's website at www.eatonvance.com or by calling 1-800-225-6265.
30
This Page Intentionally Left Blank
This Page Intentionally Left Blank
Investment Adviser of Dividend Income Portfolio
Boston Management and Research
The Eaton Vance Building
255 State Street
Boston, MA 02109
Administrator of Eaton Vance Dividend Income Fund
Eaton Vance Management
The Eaton Vance Building
255 State Street
Boston, MA 02109
Principal Underwriter
Eaton Vance Distributors, Inc.
The Eaton Vance Building
255 State Street
Boston, MA 02109
(617) 482-8260
Custodian
Investors Bank & Trust Company
200 Clarendon Street
Boston, MA 02116
Transfer Agent
PFPC Inc.
Attn: Eaton Vance Funds
P.O. Box 9653
Providence, RI 02940-9653
(800) 262-1122
Independent Registered Public Accounting Firm
Deloitte & Touche LLP
200 Berkeley Street
Boston, MA 02116-5022
Eaton Vance Dividend Income Fund
The Eaton Vance Building
255 State Street
Boston, MA 02109
This report must be preceded or accompanied by a current prospectus. Before investing, investors should consider carefully the Fund's investment objective(s), risks, and charges and expenses. The Fund's current prospectus contains this and other information about the Fund and is available through your financial advisor. Please read the prospectus carefully before you invest or send money. For further information please call 1-800-225-6265.
2634-12/06 DIVISRC

Annual Report October 31, 2006


EATON VANCE
TAX-MANAGED
EQUITY ASSET
ALLOCATION
FUND
IMPORTANT NOTICES REGARDING PRIVACY,
DELIVERY OF SHAREHOLDER DOCUMENTS,
PORTFOLIO HOLDINGS AND PROXY VOTING
Privacy. The Eaton Vance organization is committed to ensuring your financial privacy. Each of the financial institutions identified below has in effect the following policy ("Privacy Policy") with respect to nonpublic personal information about its customers:
• Only such information received from you, through application forms or otherwise, and information about your Eaton Vance fund transactions will be collected. This may include information such as name, address, social security number, tax status, account balances and transactions.
• None of such information about you (or former customers) will be disclosed to anyone, except as permitted by law (which includes disclosure to employees necessary to service your account). In the normal course of servicing a customer's account, Eaton Vance may share information with unaffiliated third parties that perform various required services such as transfer agents, custodians and broker/dealers.
• Policies and procedures (including physical, electronic and procedural safeguards) are in place that are designed to protect the confidentiality of such information.
• We reserve the right to change our Privacy Policy at any time upon proper notification to you. Customers may want to review our Policy periodically for changes by accessing the link on our homepage: www.eatonvance.com.
Our pledge of privacy applies to the following entities within the Eaton Vance organization: the Eaton Vance Family of Funds, Eaton Vance Management, Eaton Vance Investment Counsel, Boston Management and Research, and Eaton Vance Distributors, Inc.
In addition, our Privacy Policy only applies to those Eaton Vance customers who are individuals and who have a direct relationship with us. If a customer's account (i.e., fund shares) is held in the name of a third-party financial adviser/ broker-dealer, it is likely that only such adviser's privacy policies apply to the customer. This notice supersedes all previously issued privacy disclosures.
For more information about Eaton Vance's Privacy Policy, please call 1-800-262-1122.
Delivery of Shareholder Documents. The Securities and Exchange Commission (the "SEC") permits funds to deliver only one copy of shareholder documents, including prospectuses, proxy statements and shareholder reports, to fund investors with multiple accounts at the same residential or post office box address. This practice is often called "householding" and it helps eliminate duplicate mailings to shareholders.
Eaton Vance, or your financial adviser, may household the mailing of your documents indefinitely unless you instruct Eaton Vance, or your financial adviser, otherwise.
If you would prefer that your Eaton Vance documents not be householded, please contact Eaton Vance at 1-800-262-1122, or contact your financial adviser.
Your instructions that householding not apply to delivery of your Eaton Vance documents will be effective within 30 days of receipt by Eaton Vance or your financial adviser.
Portfolio Holdings. Each Eaton Vance Fund and its underlying Portfolio (if applicable) will file a schedule of its portfolio holdings on Form N-Q with the SEC for the first and third quarters of each fiscal year. The Form N-Q will be available on the Eaton Vance website www.eatonvance.com, by calling Eaton Vance at 1-800-262-1122 or in the EDGAR database on the SEC's website at www.sec.gov. Form N-Q may also be reviewed and copied at the SEC's public reference room in Washington, D.C. (call 1-800-732-0330 for information on the operation of the public reference room).
Proxy Voting. From time to time, funds are required to vote proxies related to the securities held by the funds. The Eaton Vance Funds or their underlying Portfolios (if applicable) vote proxies according to a set of policies and procedures approved by the Funds' and Portfolios' Boards. You may obtain a description of these policies and procedures and information on how the Funds or Portfolios voted proxies relating to portfolio securities during the most recent 12 month period ended June 30, without charge, upon request, by calling 1-800-262-1122. This description is also available on the SEC's website at www.sec.gov.
Eaton Vance Tax-Managed Equity Asset Allocation Fund as of October 31, 2006
MANAGEMENT’S DISCUSSION OF FUND PERFORMANCE

Duncan W. Richardson, CFA
Portfolio Manager
The Fund
Performance for the Past Year
· For the year ended October 31, 2006, the Fund’s Class A shares had a total return of 18.96%. This return was the result of an increase in net asset value (NAV) per share to $14.04 on October 31, 2006, from $12.10 on October 31, 2005, and the distribution of $0.3142 per share in capital gains.(1)
· The Fund’s Class B shares had a total return of 17.98% for the same period, the result of an increase in NAV per share to $13.57 from $11.80, and the distribution of $0.3142 per share in capital gains.(1)
· The Fund’s Class C shares had a total return of 18.01% for the same period, the result of an increase in NAV per share to $13.55 from $11.78, and the distribution of $0.3142 per share in capital gains.(1)
· For comparison, the Russell 3000 Index, a broad-based, unmanaged index of the 3,000 largest U.S. companies, which represents approximately 98% of the investable U.S. equity market, had a total return of 16.37% during the same period. The average return of funds in the Fund’s peer group, the Lipper Multi-Cap Core Funds Classification, was 14.50%.(2)
See pages 3 and 4 for more performance information, including after-tax returns.
Management Discussion
· In the first part of the fiscal year, mixed economic data, coupled with geopolitical uncertainty, kept investors on the sidelines. However, the second half of the year proved to be more encouraging, as a pause in interest rate hikes and a decline in energy prices brought relief to the equity markets. Healthy consumer trends, positive earnings and corporate mergers and acquisitions helped the broad equity markets. Capitalization and style trends remained intact, as average small-capitalization stocks led large-cap stocks and value stocks outperformed growth stocks over the one-year period ended October 31, 2006.
· In this environment, the Fund outperformed its benchmark, the Russell 3000 Index.(2) The Fund’s performance is a function of both the performance of the underlying Portfolios in which it invests, and its asset allocation among those Portfolios. The Fund benefited from its continued emphasis on small- and mid-cap securities through the taxmanaged small- and mid-cap Portfolios, as well as an overweight exposure to international securities, which on average outpaced domestic stock investments, through Tax-Managed International Equity Portfolio.
· Management initiated three allocation changes during the 12 months ended October 31, 2006. Collectively, the new allocation targets reflected management’s recognition of exceptional relative outperformance of small- and mid-capitalization stocks and the view that larger-capitalization investments had become increasingly attractive. Relative to the allocation at October 31, 2005, the new targets reflect an increase of approximately 5% to Tax-Managed International Equity Portfolio and 2.5% to Tax-Managed Growth Portfolio, and a decrease of approximately 3.0% from Tax-Managed Multi-Cap Opportunity Portfolio and 4.5% from Tax-Managed Mid-Cap Core Portfolio.(3)
· The decision to increase international and domestic large-cap growth exposure was beneficial. International investments (characterized by the MSCI EAFE Index) outperformed U.S. investments over the year period. Large-cap growth stocks (characterized by the Russell 1000 Growth Index) on average outperformed mid-cap and small-cap growth investments (Russell Mid-Cap Growth and Russell 2000 Growth Indices) from the time of the allocation change in April through October 31, 2006.(2) The Fund retained its emphasis on growth stocks over value during the year through emphasizing growth Portfolios. Management’s view remains positive on growth investments, particularly within the large-cap universe, due to attractive valuations and reasonable earnings growth projections.(2)
Past performance is no guarantee of future results. Returns are historical and are calculated by determining the percentage change in net asset value or offering price (as applicable) with all distributions reinvested. Investment return and principal value will fluctuate so that shares, when redeemed, may be worth more or less than their original cost. Performance is for stated time period only; due to market volatility, the Fund’s current performance may be lower or higher than the quoted return. For performance as of the most recent month end, please refer to www.eatonvance.com.
(1) These returns do not include the 5.75% maximum sales charge for Class A shares or the applicable contingent deferred sales charge (CDSC) for Class B and Class C shares. If sales charges were deducted, the returns would be lower.
(2) It is not possible to invest directly in an Index or a Lipper Classification. The Index’s total return does not reflect commissions or expenses that would have been incurred if an investor individually does not reflect commissions or expenses that would have been incurred if an investor individually purchased or sold the securities represented in the Index. The Lipper Average is the average total return, at net asset value, of the funds that are in the same Lipper Classification as the Fund.
(3) Asset allocation may not be representative of the Fund’s current or future investments and may change due to active management.
Fund shares are not insured by the FDIC and are not deposits or other obligations of, or guaranteed by, any depository institution. Shares are subject to investment risks, including possible loss of principal invested.
1
· Returns among investment classes and styles continued to be unpredictable, which management believes validates the benefits of a strategy that continues to focus on broad diversification and systematic rebalancing. In allocating the Fund’s assets among the Eaton Vance Tax-Managed Portfolios, management continues to seek to maintain broad diversification and to emphasize market sectors that Eaton Vance believes offer relatively attractive risk-adjusted return prospects, based on its assessment of current and future market trends and conditions.
The views expressed throughout this report are those of the portfolio manager and are current only through the end of the period of the report as stated on the cover. These views are subject to change at any time based upon market or other conditions, and the investment adviser disclaims any responsibility to update such views. These views may not be relied on as investment advice and, because investment decisions for a fund are based on many factors, may not be relied on as an indication of trading intent on behalf of any Eaton Vance fund.
Current Allocations* By total net assets
Tax-Managed Growth | | 22.62 | % |
| | | |
Tax-Managed Value | | 22.14 | % |
| | | |
Tax-Managed International Equity | | 18.48 | % |
| | | |
Tax-Managed Multi-Cap Opportunity | | 14.76 | % |
| | | |
Tax-Managed Mid-Cap Core | | 11.06 | % |
| | | |
Tax-Managed Small-Cap Growth | | 6.98 | % |
| | | |
Tax-Managed Small-Cap Value | | 3.96 | % |
* As a percentage of the Fund’s net assets as of October 31, 2006. Fund information may not be representative of the Fund’s current or future investments and may change due to active management. You may obtain free copies of each of the Portfolios’ most recent financial statements by contacting Eaton Vance Distributors, Inc. at 1-800-836-2414 or from the EDGAR database on the Securities and Exchange Commission’s website (www.sec.gov).
2
Eaton Vance Tax-Managed Equity Asset Allocation Fund as of October 31, 2006
FUND PERFORMANCE
The line graphs and table set forth below provide information about the Fund’s performance. The line graphs compare the performance of Class A, Class B and Class C of the Fund with that of the Russell 3000 Index, a broad-based, unmanaged index of the 3,000 largest U.S. companies, which represents approximately 98% of the investable U.S. equity market. The lines on the graphs represent the total returns of a hypothetical investment of $10,000 in each of Class A, Class B and Class C and the Russell 3000 Index. Class A total returns are presented at net asset value and maximum public offering price. The table includes the total returns of each Class of the Fund at net asset value and public offering price. The performance presented below does not reflect the deduction of taxes, if any, that a shareholder would pay on distributions or redemptions of Fund shares.
Performance * | | Class A | | Class B | | Class C | |
| | | | | | | |
Average Annual Total Returns (at net asset value) | | | | | | | |
One Year | | 18.96 | % | 17.98 | % | 18.01 | % |
Life of Fund† | | 8.11 | % | 7.34 | % | 7.31 | % |
SEC Average Annual Total Returns (including sales charge or applicable CDSC) | | | | | | | |
One Year | | 12.10 | % | 12.98 | % | 17.01 | % |
Life of Fund† | | 6.75 | % | 7.01 | % | 7.31 | % |
†Inception Dates – Class A: 3/4/02; Class B: 3/4/02; Class C: 3/4/02
* Average annual total returns do not include the 5.75% maximum sales charge for Class A shares or the applicable contingent deferred sales charge (CDSC) for Class B and Class C shares. If sales charges were deducted, the returns would be lower. SEC average annual total returns for Class A reflect the maximum 5.75% sales charge. SEC returns for Class B shares reflect the applicable CDSC based on the following schedule: 5% - 1st and 2nd years; 4% - 3rd year; 3% - 4th year; 2% - 5th year; 1% - 6th year. SEC returns for Class C reflect a 1% CDSC for the first year. Absent a waiver of a portion of its investment adviser fee and an allocation of certain expenses to the administrator, the returns for certain periods would be lower.
Past performance is no guarantee of future results. Returns are historical and are calculated by determining the percentage change in historical and are calculated by determining the percentage change in net asset value or offering price (as applicable) with all distributions reinvested. Investment return and principal value will fluctuate so that shares, when redeemed, may be worth more or less than their original cost. Performance is for the stated time period only; due to market volatility, the Fund’s current performance may be lower or higher than the quoted return. For performance as of the most recent month end, please refer to www.eatonvance.com.
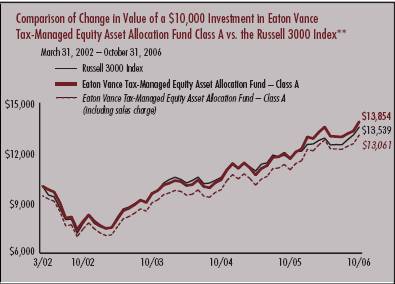
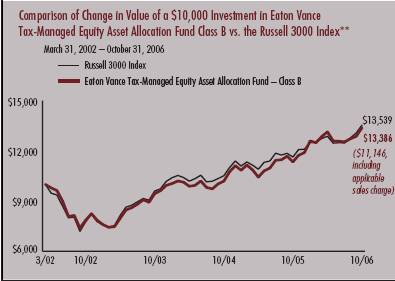

**Source: Thomson Financial. Investment operations commenced on 3/4/02. It is not possible to invest directly in an Index. The Index’s total returns do not reflect commissions or expenses that would have been incurred if an investor individually purchased or sold the securities represented in the Index.
3
“Return Before Taxes” does not take into consideration shareholder taxes. It is most relevant to tax-free or tax-deferred shareholder accounts. “Return After Taxes on Distributions” reflects the impact of federal income taxes due on Fund distributions of dividends and capital gains. It is most relevant to taxpaying shareholders who continue to hold their shares. “Return After Taxes on Distributions and Sale of Fund Shares” also reflects the impact of taxes on capital gain or loss realized upon a sale of shares. It is most relevant to taxpaying shareholders who sell their shares.
Average Annual Total Returns
(For the periods ended October 31, 2006)
Returns at Net Asset Value (NAV) (Class A)
| | One Year | | Life of Fund | |
Return Before Taxes | | 18.96 | % | 8.11 | % |
Return After Taxes on Distributions | | 18.52 | % | 8.03 | % |
Return After Taxes on Distributions and Sale of Fund Shares | | 12.81 | % | 7.01 | % |
Returns at Public Offering Price (POP) (Class A)
| | One Year | | Life of Fund | |
Return Before Taxes | | 12.10 | % | 6.75 | % |
Return After Taxes on Distributions | | 11.69 | % | 6.66 | % |
Return After Taxes on Distributions and Sale of Fund Shares | | 8.33 | % | 5.81 | % |
Average Annual Total Returns
(For the periods ended October 31, 2006)
Returns at Net Asset Value (NAV) (Class C)
| | One Year | | Life of Fund | |
Return Before Taxes | | 18.01 | % | 7.31 | % |
Return After Taxes on Distributions | | 17.56 | % | 7.22 | % |
Return After Taxes on Distributions and Sale of Fund Shares | | 12.21 | % | 6.31 | % |
Returns at Public Offering Price (POP) (Class C)
| | One Year | | Life of Fund | |
Return Before Taxes | | 17.01 | % | 7.31 | % |
Return After Taxes on Distributions | | 16.56 | % | 7.22 | % |
Return After Taxes on Distributions and Sale of Fund Shares | | 11.56 | % | 6.31 | % |
Average Annual Total Returns
(For the periods ended October 31, 2006)
Returns at Net Asset Value (NAV) (Class B)
| | One Year | | Life of Fund | |
Return Before Taxes | | 17.98 | % | 7.34 | % |
Return After Taxes on Distributions | | 17.53 | % | 7.25 | % |
Return After Taxes on Distributions and Sale of Fund Shares | | 12.19 | % | 6.33 | % |
Returns at Public Offering Price (POP) (Class B)
| | One Year | | Life of Fund | |
Return Before Taxes | | 12.98 | % | 7.01 | % |
Return After Taxes on Distributions | | 12.53 | % | 6.92 | % |
Return After Taxes on Distributions and Sale of Fund Shares | | 8.94 | % | 6.04 | % |
Class A, Class B and Class C of the Fund commenced investment operations on 3/4/02. Returns at Public Offering Price (POP) reflect the deduction of the maximum initial sales charge or applicable CDSC, while Returns at Net Asset Value (NAV) do not.
After-tax returns are calculated using the highest historical individual federal income tax rate and do not reflect the impact of state and local taxes. Actual after-tax returns depend on a shareholder’s tax situation and may differ from those shown. After-tax returns are not relevant for shareholders who hold Fund shares in tax-deferred accounts or to shares held by non-taxable entities. Return After Taxes on Distributions for a period may be the same as Return Before Taxes for that period because no distributions were paid during that period, or because the taxable portion of distributions made during the period was insignificant. Also, Return After Taxes on Distributions and Sale of Fund Shares for a period may be greater than Return After Taxes on Distributions for the same period because of realized losses on the sale of Fund shares. Absent a waiver of a portion of its investment adviser fee and an allocation of certain expenses to the administrator, the returns for certain periods would be lower.
Past performance is no guarantee of future results. Returns are historical and are calculated by determining the percentage change in net asset value offering price (as applicable) with all distributions reinvested. Investment return and principal value will fluctuate so that shares, when redeemed, may be worth more or less than their original cost. Performance is for the stated time period only; due to market volatility, the Fund’s current performance may be lower or higher than the quoted return. For performance as of the most recent month end, please refer to www.eatonvance.com.
4
Eaton Vance Tax-Managed Equity Asset Allocation Fund as of October 31, 2006
FUND EXPENSES
Example: As a shareholder of the Fund, you incur two types of costs: (1) transaction costs, including sales charges (loads) on purchases and redemption fees (if applicable); and (2) ongoing costs, including management fees; distribution or service fees; and other Fund expenses. This Example is intended to help you understand your ongoing costs (in dollars) of investing in the Fund and to compare these costs with the ongoing costs of investing in other mutual funds. The Example is based on an investment of $1,000 invested at the beginning of the period and held for the entire period (May 1, 2006 – October 31, 2006).
Actual Expenses: The first section of the table below provides information about actual account values and actual expenses. You may use the information in this section, together with the amount you invested, to estimate the expenses that you paid over the period. Simply divide your account value by $1,000 (for example, an $8,600 account value divided by $1,000 = 8.6), then multiply the result by the number in the first section under the heading entitled "Expenses Paid During Period" to estimate the expenses you paid on your account during this period.
Hypothetical Example for Comparison Purposes: The second section of the table below provides information about hypothetical account values and hypothetical expenses based on the actual Fund expense ratio and an assumed rate of return of 5% per year (before expenses), which is not the actual return of the Fund. The hypothetical account values and expenses may not be used to estimate the actual ending account balance or expenses you paid for the period. You may use this information to compare the ongoing costs of investing in your Fund and other funds. To do so, compare this 5% hypothetical example with the 5% hypothetical examples that appear in the shareholder reports of the other funds.
Please note that the expenses shown in the table are meant to highlight your ongoing costs only and do not reflect any transactional costs, such as sales charges (loads) or redemption fees (if applicable). Therefore, the second section of the table is useful in comparing ongoing costs only, and will not help you determine the relative total costs of owning different funds. In addition, if these transactional costs were included, your costs would have been higher.
Eaton Vance Tax-Managed Equity Asset Allocation Fund
| | | Beginning Account Value
(5/1/06) | | Ending Account Value
(10/31/06) | | Expenses Paid During Period*
(5/1/06 – 10/31/06) | |
| Actual | |
| Class A | | $ | 1,000.00 | | | $ | 1,023.30 | | | $ | 7.14 | | |
| Class B | | $ | 1,000.00 | | | $ | 1,018.80 | | | $ | 10.94 | | |
| Class C | | $ | 1,000.00 | | | $ | 1,019.60 | | | $ | 10.94 | | |
| Hypothetical | |
| (5% return per year before expenses) | |
| Class A | | $ | 1,000.00 | | | $ | 1,018.10 | | | $ | 7.12 | | |
| Class B | | $ | 1,000.00 | | | $ | 1,014.40 | | | $ | 10.92 | | |
| Class C | | $ | 1,000.00 | | | $ | 1,014.40 | | | $ | 10.92 | | |
* Expenses are equal to the Fund's annualized expense ratio of 1.40% for Class A shares, 2.15% for Class B shares, and 2.15% for Class C shares multiplied by the average account value over the period, multiplied by 184/365 (to reflect the one-half year period). The Example assumes that the $1,000 was invested at the net asset value per share determined at the close of business on April 30, 2006. The Example reflects the expenses of both the Fund and the Portfolios.
5
Eaton Vance Tax-Managed Equity Asset Allocation Fund as of October 31, 2006
FINANCIAL STATEMENTS
Statement of Assets and Liabilities
As of October 31, 2006
| Assets | |
Investment in Tax-Managed Growth Portfolio, at value
(identified cost, $113,383,532) | | $ | 136,012,567 | | |
Investment in Tax-Managed Value Portfolio, at value
(identified cost, $94,055,965) | | | 133,116,308 | | |
Investment in Tax-Managed International Equity Portfolio, at value
(identified cost, $73,477,931) | | | 111,138,641 | | |
Investment in Tax-Managed Multi-Cap Opportunity Portfolio,
at value (identified cost, $67,309,474) | | | 88,731,732 | | |
Investment in Tax-Managed Mid-Cap Core Portfolio, at value
(identified cost, $52,057,359) | | | 66,505,465 | | |
Investment in Tax-Managed Small-Cap Growth Portfolio,
at value (identified cost, $36,990,259) | | | 41,955,214 | | |
Investment in Tax-Managed Small-Cap Value Portfolio,
at value (identified cost, $15,416,763) | | | 23,831,567 | | |
| Receivable for Fund shares sold | | | 1,556,319 | | |
| Total assets | | $ | 602,847,813 | | |
| Liabilities | |
| Payable for Fund shares redeemed | | $ | 867,040 | | |
| Payable to affiliate for distribution and service fees | | | 345,366 | | |
| Payable to affiliate for administration fee | | | 74,857 | | |
| Payable to affiliate for investment adviser fee | | | 55,914 | | |
| Payable to affiliate for Trustees' fees | | | 359 | | |
| Other accrued expenses | | | 199,883 | | |
| Total liabilities | | $ | 1,543,419 | | |
| Net Assets | | $ | 601,304,394 | | |
| Sources of Net Assets | |
| Paid-in capital | | $ | 431,985,965 | | |
Accumulated undistributed net realized gain from Portfolios
(computed on the basis of identified cost) | | | 18,850,321 | | |
| Accumulated undistributed net investment income | | | 1,867,897 | | |
Net unrealized appreciation from Portfolios
(computed on the basis of identified cost) | | | 148,600,211 | | |
| Total | | $ | 601,304,394 | | |
| Class A Shares | |
| Net Assets | | $ | 247,710,116 | | |
| Shares Outstanding | | | 17,648,807 | | |
Net Asset Value and Redemption Price Per Share
(net assets ÷ shares of beneficial interest outstanding) | | $ | 14.04 | | |
Maximum Offering Price Per Share
(100 ÷ 94.25 of $14.04) | | $ | 14.90 | | |
| Class B Shares | |
| Net Assets | | $ | 139,585,740 | | |
| Shares Outstanding | | | 10,282,639 | | |
Net Asset Value, Offering Price and Redemption Price Per Share
(net assets ÷ shares of beneficial interest outstanding) | | $ | 13.57 | | |
| Class C Shares | |
| Net Assets | | $ | 214,008,538 | | |
| Shares Outstanding | | | 15,794,438 | | |
Net Asset Value, Offering Price and Redemption Price Per Share
(net assets ÷ shares of beneficial interest outstanding) | | $ | 13.55 | | |
| On sales of $50,000 or more, the offering price of Class A shares is reduced. | | | | | |
Statement of Operations
For the Year Ended
October 31, 2006
| Investment Income | |
| Dividends allocated from Portfolios (net of foreign taxes, $288,143) | | $ | 8,968,671 | | |
| Interest allocated from Portfolios | | | 636,208 | | |
| Expenses allocated from Portfolios | | | (4,079,083 | ) | |
| Net investment income from Portfolios | | $ | 5,525,796 | | |
| Expenses | |
| Investment adviser fee | | $ | 558,727 | | |
| Administration fee | | | 795,801 | | |
| Trustees' fees and expenses | | | 3,775 | | |
Distribution and service fees
Class A | | | 523,218 | | |
| Class B | | | 1,343,109 | | |
| Class C | | | 1,869,359 | | |
| Transfer and dividend disbursing agent fees | | | 400,971 | | |
| Legal and accounting services | | | 73,039 | | |
| Registration fees | | | 67,184 | | |
| Custodian fee | | | 54,777 | | |
| Printing and postage | | | 53,011 | | |
| Miscellaneous | | | 10,003 | | |
| Total expenses | | $ | 5,752,974 | | |
| Net investment loss | | $ | (227,178 | ) | |
Realized and Unrealized
Gain (Loss) from Portfolios | |
Net realized gain (loss) —
Investment transactions (identified cost basis) | | $ | 22,134,028 | | |
| Securities sold short | | | (861,301 | ) | |
| Foreign currency transactions | | | (119,527 | ) | |
| Net realized gain | | $ | 21,153,200 | | |
Change in unrealized appreciation (depreciation) —
Investments (identified cost basis) | | $ | 65,249,074 | | |
| Securities sold short | | | 829,704 | | |
| Foreign currency | | | 6,867 | | |
| Net change in unrealized appreciation (depreciation) | | $ | 66,085,645 | | |
| Net realized and unrealized gain | | $ | 87,238,845 | | |
| Net increase in net assets from operations | | $ | 87,011,667 | | |
See notes to financial statements
6
Eaton Vance Tax-Managed Equity Asset Allocation Fund as of October 31, 2006
FINANCIAL STATEMENTS CONT'D
Statements of Changes in Net Assets
Increase (Decrease)
in Net Assets | | Year Ended
October 31, 2006 | | Year Ended
October 31, 2005 | |
From operations —
Net investment loss | | $ | (227,178 | ) | | $ | (1,353,703 | ) | |
Net realized gain from investment
transactions,securities sold short
and foreign currency transactions | | | 21,153,200 | | | | 13,849,915 | | |
Net change in unrealized appreciation
(depreciation) of investments,
securities sold short and
foreign currency | | | 66,085,645 | | | | 31,888,236 | | |
| Net increase in net assets from operations | | $ | 87,011,667 | | | $ | 44,384,448 | | |
Distributions to shareholders —
From net realized gain
Class A | | $ | (4,516,935 | ) | | $ | — | | |
| Class B | | | (3,269,325 | ) | | | — | | |
| Class C | | | (4,277,799 | ) | | | — | | |
| Total distributions to shareholders | | $ | (12,064,059 | ) | | $ | — | | |
Transactions in shares of beneficial interest —
Proceeds from sale of shares
Class A | | $ | 65,245,218 | | | $ | 42,975,393 | | |
| Class B | | | 17,625,159 | | | | 20,001,051 | | |
| Class C | | | 49,334,856 | | | | 37,613,007 | | |
Net asset value of shares issued to
shareholders in payment of
distributions declared
Class A | | | 3,962,987 | | | | — | | |
| Class B | | | 2,809,766 | | | | — | | |
| Class C | | | 3,313,882 | | | | — | | |
Cost of shares redeemed
Class A | | | (28,203,263 | ) | | | (26,271,557 | ) | |
| Class B | | | (16,417,077 | ) | | | (16,721,504 | ) | |
| Class C | | | (22,588,349 | ) | | | (19,027,014 | ) | |
Net asset value of shares exchanged
Class A | | | 6,419,182 | | | | 1,863,233 | | |
| Class B | | | (6,419,182 | ) | | | (1,863,233 | ) | |
Net increase in net assets from Fund
share transactions | | $ | 75,083,179 | | | $ | 38,569,376 | | |
| Net increase in net assets | | $ | 150,030,787 | | | $ | 82,953,824 | | |
| Net Assets | |
| At beginning of year | | $ | 451,273,607 | | | $ | 368,319,783 | | |
| At end of year | | $ | 601,304,394 | | | $ | 451,273,607 | | |
Accumulated undistributed
net investment income
included in net assets | |
| At end of year | | $ | 1,867,897 | | | $ | 762,518 | | |
See notes to financial statements
7
Eaton Vance Tax-Managed Equity Asset Allocation Fund as of October 31, 2006
FINANCIAL STATEMENTS CONT'D
Financial Highlights
| | | Class A | |
| | | Year Ended October 31, | | Period Ended | |
| | | 2006 | | 2005 | | 2004 | | 2003 | | October 31, 2002(1) | |
| Net asset value — Beginning of year | | $ | 12.100 | | | $ | 10.790 | | | $ | 9.930 | | | $ | 8.190 | | | $ | 10.000 | | |
| Income (loss) from operations | |
| Net investment income (loss)(2) | | $ | 0.053 | | | $ | 0.018 | | | $ | 0.002 | | | $ | (0.012 | ) | | $ | (0.024 | ) | |
| Net realized and unrealized gain (loss) | | | 2.201 | | | | 1.292 | | | | 0.858 | | | | 1.752 | | | | (1.786 | ) | |
| Total income (loss) from operations | | $ | 2.254 | | | $ | 1.310 | | | $ | 0.860 | | | $ | 1.740 | | | $ | (1.810 | ) | |
| Less Distributions | |
| From net realized gain | | $ | (0.314 | ) | | $ | — | | | $ | — | | | $ | — | | | $ | — | | |
| Total distributions | | $ | (0.314 | ) | | $ | — | | | $ | — | | | $ | — | | | $ | — | | |
| Net asset value — End of year | | $ | 14.040 | | | $ | 12.100 | | | $ | 10.790 | | | $ | 9.930 | | | $ | 8.190 | | |
| Total Return(3) | | | 18.96 | % | | | 12.14 | % | | | 8.66 | %(4) | | | 21.25 | % | | | (18.10 | )% | |
| Ratios/Supplemental Data | |
| Net assets, end of year (000's omitted) | | $ | 247,710 | | | $ | 169,704 | | | $ | 134,070 | | | $ | 82,868 | | | $ | 38,528 | | |
| Ratios (As a percentage of average daily net assets): | |
| Expenses(5)(6) | | | 1.40 | % | | | 1.43 | % | | | 1.46 | % | | | 1.52 | % | | | 1.55 | %(7) | |
| Net investment income (loss) | | | 0.41 | % | | | 0.15 | % | | | 0.02 | % | | | (0.14 | )% | | | (0.43 | )%(7) | |
| Portfolio Turnover of the Tax-Managed Growth Portfolio | | | 1 | % | | | 1 | % | | | 4 | % | | | 19 | % | | | 21 | % | |
| Portfolio Turnover of the Tax-Managed Value Portfolio | | | 26 | % | | | 40 | % | | | 44 | % | | | 76 | % | | | 213 | % | |
| Portfolio Turnover of the Tax-Managed International Equity Portfolio | | | 25 | % | | | 39 | % | | | 62 | % | | | 100 | % | | | 128 | % | |
| Portfolio Turnover of the Tax-Managed Multi-Cap Opportunity Portfolio | | | 181 | % | | | 217 | % | | | 239 | % | | | 224 | % | | | 225 | % | |
| Portfolio Turnover of the Tax-Managed Mid-Cap Core Portfolio | | | 55 | % | | | 53 | % | | | 42 | % | | | 50 | % | | | 13 | % | |
| Portfolio Turnover of the Tax-Managed Small-Cap Growth Portfolio | | | 99 | % | | | 223 | % | | | 282 | % | | | 248 | % | | | 131 | % | |
| Portfolio Turnover of the Tax-Managed Small-Cap Value Portfolio | | | 49 | % | | | 24 | % | | | 12 | % | | | 21 | % | | | 5 | % | |
(1) For the period from the start of business, March 4, 2002, to October 31, 2002.
(2) Net investment income (loss) per share was computed using average shares outstanding.
(3) Returns are historical and are calculated by determining the percentage change in net asset value with all distributions reinvested. Total return is not computed on an annualized basis.
(4) The effect of the net increase from payments by affiliate and net gains (losses) realized through the Fund's investment in Tax-Managed Small-Cap Growth Portfolio (the Portfolio) on the disposal of investments purchased which did not meet the Portfolio's investment guidelines amounted to less than $0.01 per share and had no effect on total return for the year ended October 31, 2004.
(5) Includes the Fund's share of the Portfolios' allocated expenses.
(6) The investment adviser waived a portion of its investment adviser fee and/or the administrator subsidized certain operating expenses (equal to 0.01%, 0.01% and 0.22% for 2005, 2004 and 2002, respectively).
(7) Annualized.
See notes to financial statements
8
Eaton Vance Tax-Managed Equity Asset Allocation Fund as of October 31, 2006
FINANCIAL STATEMENTS CONT'D
Financial Highlights
| | | Class B | |
| | | Year Ended October 31, | | Period Ended | |
| | | 2006 | | 2005 | | 2004 | | 2003 | | October 31, 2002(1) | |
| Net asset value — Beginning of year | | $ | 11.800 | | | $ | 10.600 | | | $ | 9.830 | | | $ | 8.170 | | | $ | 10.000 | | |
| Income (loss) from operations | |
| Net investment loss(2) | | $ | (0.042 | ) | | $ | (0.068 | ) | | $ | (0.076 | ) | | $ | (0.077 | ) | | $ | (0.065 | ) | |
| Net realized and unrealized gain (loss) | | | 2.126 | | | | 1.268 | | | | 0.846 | | | | 1.737 | | | | (1.765 | ) | |
| Total income (loss) from operations | | $ | 2.084 | | | $ | 1.200 | | | $ | 0.770 | | | $ | 1.660 | | | $ | (1.830 | ) | |
| Less Distributions | |
| From net realized gain | | $ | (0.314 | ) | | $ | — | | | $ | — | | | $ | — | | | $ | — | | |
| Total distributions | | $ | (0.314 | ) | | $ | — | | | $ | — | | | $ | — | | | $ | — | | |
| Net asset value — End of year | | $ | 13.570 | | | $ | 11.800 | | | $ | 10.600 | | | $ | 9.830 | | | $ | 8.170 | | |
| Total Return(3) | | | 17.98 | % | | | 11.32 | % | | | 7.83 | %(4) | | | 20.32 | % | | | (18.30 | )% | |
| Ratios/Supplemental Data | |
| Net assets, end of year (000's omitted) | | $ | 139,586 | | | $ | 123,431 | | | $ | 109,471 | | | $ | 79,854 | | | $ | 31,101 | | |
| Ratios (As a percentage of average daily net assets): | |
| Expenses(5)(6) | | | 2.15 | % | | | 2.18 | % | | | 2.21 | % | | | 2.27 | % | | | 2.30 | %(7) | |
| Net investment loss | | | (0.33 | )% | | | (0.59 | )% | | | (0.73 | )% | | | (0.88 | )% | | | (1.17 | )%(7) | |
| Portfolio Turnover of the Tax-Managed Growth Portfolio | | | 1 | % | | | 1 | % | | | 4 | % | | | 19 | % | | | 21 | % | |
| Portfolio Turnover of the Tax-Managed Value Portfolio | | | 26 | % | | | 40 | % | | | 44 | % | | | 76 | % | | | 213 | % | |
| Portfolio Turnover of the Tax-Managed International Equity Portfolio | | | 25 | % | | | 39 | % | | | 62 | % | | | 100 | % | | | 128 | % | |
| Portfolio Turnover of the Tax-Managed Multi-Cap Opportunity Portfolio | | | 181 | % | | | 217 | % | | | 239 | % | | | 224 | % | | | 225 | % | |
| Portfolio Turnover of the Tax-Managed Mid-Cap Core Portfolio | | | 55 | % | | | 53 | % | | | 42 | % | | | 50 | % | | | 13 | % | |
| Portfolio Turnover of the Tax-Managed Small-Cap Growth Portfolio | | | 99 | % | | | 223 | % | | | 282 | % | | | 248 | % | | | 131 | % | |
| Portfolio Turnover of the Tax-Managed Small-Cap Value Portfolio | | | 49 | % | | | 24 | % | | | 12 | % | | | 21 | % | | | 5 | % | |
(1) For the period from the start of business, March 4, 2002, to October 31, 2002.
(2) Net investment loss per share was computed using average shares outstanding.
(3) Returns are historical and are calculated by determining the percentage change in net asset value with all distributions reinvested. Total return is not computed on an annualized basis.
(4) The effect of the net increase from payments by affiliate and net gains (losses) realized through the Fund's investment in Tax-Managed Small-Cap Growth Portfolio (the Portfolio) on the disposal of investments purchased which did not meet the Portfolio's investment guidelines amounted to less than $0.01 per share and had no effect on total return for the year ended October 31, 2004.
(5) Includes the Fund's share of the Portfolios' allocated expenses.
(6) The investment adviser waived a portion of its investment adviser fee and/or the administrator subsidized certain operating expenses (equal to 0.01%, 0.01% and 0.22% for 2005, 2004 and 2002, respectively).
(7) Annualized.
See notes to financial statements
9
Eaton Vance Tax-Managed Equity Asset Allocation Fund as of October 31, 2006
FINANCIAL STATEMENTS CONT'D
Financial Highlights
| | | Class C | |
| | | Year Ended October 31, | | Period Ended | |
| | | 2006 | | 2005 | | 2004 | | 2003 | | October 31, 2002(1) | |
| Net asset value — Beginning of year | | $ | 11.780 | | | $ | 10.580 | | | $ | 9.810 | | | $ | 8.150 | | | $ | 10.000 | | |
| Income (loss) from operations | |
| Net investment loss(2) | | $ | (0.043 | ) | | $ | (0.068 | ) | | $ | (0.076 | ) | | $ | (0.076 | ) | | $ | (0.065 | ) | |
| Net realized and unrealized gain (loss) | | | 2.127 | | | | 1.268 | | | | 0.846 | | | | 1.736 | | | | (1.785 | ) | |
| Total income (loss) from operations | | $ | 2.084 | | | $ | 1.200 | | | $ | 0.770 | | | $ | 1.660 | | | $ | (1.850 | ) | |
| Less Distributions | |
| From net realized gain | | $ | (0.314 | ) | | $ | — | | | $ | — | | | $ | — | | | $ | — | | |
| Total distributions | | $ | (0.314 | ) | | $ | — | | | $ | — | | | $ | — | | | $ | — | | |
| Net asset value — End of year | | $ | 13.550 | | | $ | 11.780 | | | $ | 10.580 | | | $ | 9.810 | | | $ | 8.150 | | |
| Total Return(3) | | | 18.01 | % | | | 11.34 | % | | | 7.85 | %(4) | | | 20.37 | % | | | (18.50 | )% | |
| Ratios/Supplemental Data | |
| Net assets, end of year (000's omitted) | | $ | 214,009 | | | $ | 158,138 | | | $ | 124,779 | | | $ | 85,040 | | | $ | 31,903 | | |
| Ratios (As a percentage of average daily net assets): | |
| Expenses(5)(6) | | | 2.15 | % | | | 2.18 | % | | | 2.21 | % | | | 2.27 | % | | | 2.30 | %(7) | |
| Net investment loss | | | (0.34 | )% | | | (0.59 | )% | | | (0.73 | )% | | | (0.88 | )% | | | (1.17 | )%(7) | |
| Portfolio Turnover of the Tax-Managed Growth Portfolio | | | 1 | % | | | 1 | % | | | 4 | % | | | 19 | % | | | 21 | % | |
| Portfolio Turnover of the Tax-Managed Value Portfolio | | | 26 | % | | | 40 | % | | | 44 | % | | | 76 | % | | | 213 | % | |
| Portfolio Turnover of the Tax-Managed International Equity Portfolio | | | 25 | % | | | 39 | % | | | 62 | % | | | 100 | % | | | 128 | % | |
| Portfolio Turnover of the Tax-Managed Multi-Cap Opportunity Portfolio | | | 181 | % | | | 217 | % | | | 239 | % | | | 224 | % | | | 225 | % | |
| Portfolio Turnover of the Tax-Managed Mid-Cap Core Portfolio | | | 55 | % | | | 53 | % | | | 42 | % | | | 50 | % | | | 13 | % | |
| Portfolio Turnover of the Tax-Managed Small-Cap Growth Portfolio | | | 99 | % | | | 223 | % | | | 282 | % | | | 248 | % | | | 131 | % | |
| Portfolio Turnover of the Tax-Managed Small-Cap Value Portfolio | | | 49 | % | | | 24 | % | | | 12 | % | | | 21 | % | | | 5 | % | |
(1) For the period from the start of business, March 4, 2002, to October 31, 2002.
(2) Net investment loss per share was computed using average shares outstanding.
(3) Returns are historical and are calculated by determining the percentage change in net asset value with all distributions reinvested. Total return is not computed on an annualized basis.
(4) The effect of the net increase from payments by affiliate and net gains (losses) realized through the Fund's investment in Tax-Managed Small-Cap Growth Portfolio (the Portfolio) on the disposal of investments purchased which did not meet the Portfolio's investment guidelines amounted to less than $0.01 per share and had no effect on total return for the year ended October 31, 2004.
(5) Includes the Fund's share of the Portfolios' allocated expenses.
(6) The investment adviser waived a portion of its investment adviser fee and/or the administrator subsidized certain operating expenses (equal to 0.01%, 0.01% and 0.22% for 2005, 2004 and 2002, respectively).
(7) Annualized.
See notes to financial statements
10
Eaton Vance Tax-Managed Equity Asset Allocation Fund as of October 31, 2006
NOTES TO FINANCIAL STATEMENTS
1 Significant Accounting Policies
Eaton Vance Tax-Managed Equity Asset Allocation Fund (the Fund) is a diversified series of Eaton Vance Mutual Funds Trust (the Trust). The Trust is an entity of the type commonly known as a Massachusetts business trust and is registered under the Investment Company Act of 1940, as amended, as an open-end management investment company. The Fund offers three classes of shares. Class A shares are generally sold subject to a sales charge imposed at time of purchase. Class B and Class C shares are sold at net asset value and are generally subject to a contingent deferred sales charge (see Note 6). Class B shares held for eight years will automatically convert to Class A shares. Each class represents a pro-rata interest in the Fund, but votes separately on class-specific matters and (as noted below) is subject to different expenses. Realized and unrealized gains and losses and net investment income and losses, other than class-specifi c expenses, are allocated daily to each class of shares based on the relative net assets of each class to the total net assets of the Fund. Each class of shares differs in its distribution plan and certain other class-specific expenses. The Fund currently invests all of its investable assets in the following seven tax-managed equity portfolios managed by Eaton Vance or its affiliates: Tax-Managed Growth Portfolio, Tax-Managed Value Portfolio, Tax-Managed International Equity Portfolio, Tax-Managed Multi-Cap Opportunity Portfolio, Tax-Managed Mid-Cap Core Portfolio, Tax-Managed Small-Cap Growth Portfolio and Tax-Managed Small-Cap Value Portfolio (the Portfolios). Each Portfolio is organized as a New York Trust. The investment objectives and policies of the Portfolios together are the same as those of the Fund. The value of the Fund's investment in each Portfolio reflects the Fund's proportionate interest in the net assets of the Tax-Managed Growth Portfolio, Tax-Managed Value Portfolio, Tax-Managed Internatio nal Equity Portfolio, Tax-Managed Multi-Cap Opportunity Portfolio, Tax-Managed Mid-Cap Core Portfolio, Tax-Managed Small-Cap Growth Portfolio and Tax-Managed Small-Cap Value Portfolio (0.7%, 11.0%, 48.7%, 58.9%, 67.9%, 26.4% and 43.9%, respectively, at October 31, 2006). The performance of the Fund is directly affected by the performance of the Portfolios. A copy of each Portfolio's financial statements is available on the EDGAR Database on the Securities and Exchange Commission's website (www.sec.gov), at the Commission's public reference room in Washington, DC or upon request from the Fund's principal underwriter, Eaton Vance Distributors Inc. (EVD), by calling 1-800-225-6265.
The following is a summary of significant accounting policies consistently followed by the Fund in the preparation of its financial statements. The policies are in conformity with accounting principles generally accepted in the United States of America.
A Investment Valuation — The valuation policy of each Portfolio is as follows: Securities listed on a U.S. securities exchange generally are valued at the last sale price on the day of valuation or, if no sales took place on such date, at the mean between the closing bid and asked prices therefore on the exchange where such securities are principally traded. Equity securities listed on the NASDAQ National Market System generally are valued at the official NASDAQ closing price. Unlisted or listed securities for which closing sales prices or closing quotations are not available are valued at the mean between the latest available bid and asked prices or, in the case of preferred equity securities that ar e not listed or traded in the over-the-counter market, by an independent pricing service. Exchange-traded options are valued at the last sale price for the day of valuation as quoted on the principal exchange or board of trade on which the options are traded or, in the absence of sales on such date, at the mean between the latest bid and asked prices therefore. Futures positions on securities and currencies generally are valued at closing settlement prices. Short-term debt securities with a remaining maturity of 60 days or less are valued at amortized cost. If short-term debt securities are acquired with a remaining maturity of more than 60 days, they will be valued by a pricing service. Other fixed income and debt securities, including listed securities and securities for which price quotations are available, will normally be valued on the basis of valuations furnished by a pricing service. Foreign securities and currencies are valued in U.S. dollars, based on foreign currency exchange rate quotations and s upplied by an independent quotation service. The daily valuation of exchange-traded foreign securities generally is determined as of the close of trading on the principal exchange on which such securities trade. Events occurring after the close of trading on foreign exchanges may result in adjustments to the valuation of foreign securities to more accurately reflect their fair value as of the close of regular trading on the New York Stock Exchange. When valuing foreign equity securities that meet certain criteria, the Trustees have approved the use of a fair value service that values such securities to reflect market trading that occurs after the close of the applicable foreign markets of comparable securities or other instruments that have a strong correlation to the fair-valued securities. Investments held by the Portfolios for which valuations or market quotations are unavailable are valued at fair value using methods determined in good faith by or at the direction of the Trustees of the Portfolios consid ering relevant factors, data and information including the market value of freely tradable securities of the same class in the principal market on which such securities are normally traded.
11
Eaton Vance Tax-Managed Equity Asset Allocation Fund as of October 31, 2006
NOTES TO FINANCIAL STATEMENTS CONT'D
B Income — The Fund's net investment income or loss consists of the Fund's pro rata share of the net investment income or loss of the Portfolios, less all actual and accrued expenses of the Fund.
C Expenses — The majority of expenses of the Trust are directly identifiable to an individual fund. Expenses which are not readily identifiable to a specific fund are allocated taking into consideration, among other things, the nature and type of expense and the relative size of the funds.
D Federal Taxes — The Fund's policy is to comply with the provisions of the Internal Revenue Code applicable to regulated investment companies and to distribute to shareholders, each year, substantially all of its net investment income and all or substantially all of its net realized capital gains. Accordingly, no provision for federal income or excise tax is necessary.
E Expense Reduction — Investors Bank & Trust Company (IBT) serves as custodian of the Fund. Pursuant to the custodian agreement, IBT receives a fee reduced by credits which are determined based on the average daily cash balance the Fund maintains with IBT. All credit balances used to reduce the Fund's custodian fees are reported as a reduction of expenses in the Statement of Operations.
F Other — Investment transactions are accounted for on the date the securities are purchased or sold. Dividends to shareholders are recorded on the ex-dividend date.
G Indemnifications — Under the Trust's organizational documents, its officers and Trustees may be indemnified against certain liabilities and expenses arising out of the performance of their duties to the Fund, and shareholders are indemnified against personal liability for the obligations of the Trust. Additionally, in the normal course of business, the Fund enters into agreements with service providers that may contain indemnification clauses. The Fund's maximum exposure under these arrangements is unknown as this would involve future claims that may be made against the Fund that have not yet occurred.
H Use of Estimates — The preparation of the financial statements in conformity with accounting principles generally accepted in the United States of America requires management to make estimates and assumptions that affect the reported amounts of assets and liabilities at the date of the financial statements and the reported amounts of income and expense during the reporting period. Actual results could differ from those estimates.
2 Distributions to Shareholders
It is the present policy of the Fund to make at least one distribution annually (normally in December) of all or substantially all of its net investment income, if any, and at least one distribution annually of all or substantially all of its net realized capital gains, if any (reduced by available capital loss carryforwards from prior year, if any). Shareholders may reinvest all distributions in shares of the same class of the Fund at the net asset value as of the close of business on the ex-dividend date. Distributions are paid in the form of additional shares of the same class of the Fund or, at the election of the shareholder, in cash. The Fund distinguishes between distributions on a tax basis and a financial reporting basis. Accounting principles generally accepted in the United States of America require that only distributions in excess of tax basis earnings and profits be reported in the financial statements as a return of capital. Permanent differences between book and tax accounting relating to distributions are reclassified to paid-in capital.
The tax character of distributions paid for the years ended October 31, 2006 and the year ended October 31, 2005 was as follows:
| | | Year Ended October 31, | |
| | | 2006 | | 2005 | |
| Distributions declared from: | |
| Long-Term Capital Gains | | $ | 12,064,059 | | | | — | | |
During the year ended October 31, 2006, accumulated paid-in capital was decreased by $1,272,801, accumulated net investment income was increased by $1,332,557 and accumulated net realized gain was decreased by $59,756 primarily due to differences between book and tax accounting treatment of net investment income/losses, foreign currency gains and losses, passive foreign investment companies and real estate investment trusts. This change had no effect on the net assets or the net asset value per share.
As of October 31, 2006, the components of distributable earnings on a tax basis were as follows:
| Undistributed capital gain | | $ | 17,166,207 | | |
| Unrealized appreciation | | $ | 146,470,047 | | |
| Other temporary differences | | $ | 5,682,175 | | |
12
Eaton Vance Tax-Managed Equity Asset Allocation Fund as of October 31, 2006
NOTES TO FINANCIAL STATEMENTS CONT'D
3 Shares of Beneficial Interest
The Fund's Declaration of Trust permits the Trustees to issue an unlimited number of full and fractional shares of beneficial interest (without par value). Such shares may be issued in a number of different series (such as the Fund) and classes. Transactions in Fund shares were as follows:
| | | Year Ended October 31, | |
| Class A | | 2006 | | 2005 | |
| Sales | | | 4,978,140 | | | | 3,682,231 | | |
Issued to shareholders electing to
receive payments of distributions
in Fund shares | | | 317,801 | | | | — | | |
| Redemptions | | | (2,162,067 | ) | | | (2,239,692 | ) | |
| Exchanges from Class B shares | | | 490,894 | | | | 157,175 | | |
| Net increase | | | 3,624,768 | | | | 1,599,714 | | |
| | | Year Ended October 31, | |
| Class B | | 2006 | | 2005 | |
| Sales | | | 1,386,326 | | | | 1,754,278 | | |
Issued to shareholders electing to
receive payments of distributions
in Fund shares | | | 231,447 | | | | — | | |
| Redemptions | | | (1,289,718 | ) | | | (1,458,508 | ) | |
| Exchanges to Class A shares | | | (506,003 | ) | | | (160,784 | ) | |
| Net increase (decrease) | | | (177,948 | ) | | | 134,986 | | |
| | | Year Ended October 31, | |
| Class C | | 2006 | | 2005 | |
| Sales | | | 3,879,369 | | | | 3,298,523 | | |
Issued to shareholders electing to
receive payments of distributions
in Fund shares | | | 273,672 | | | | — | | |
| Redemptions | | | (1,784,560 | ) | | | (1,663,691 | ) | |
| Net increase | | | 2,368,481 | | | | 1,634,832 | | |
4 Transactions with Affiliates
The investment adviser fee is earned by Eaton Vance Management (EVM), as compensation for management and investment advisory services rendered to the Fund. Under the advisory agreement, EVM receives a monthly advisory fee in the amount of 0.80% of average daily net assets of the Fund up to $500 million and at reduced rates as daily net assets exceed that level. The advisory fee payable by the Fund is reduced by the Fund's allocable portion of the advisory fees paid by the Portfolios in which it invests. For the year ended October 31, 2006, the Fund's advisory fee, including the Fund's allocated portion of the advisory fees paid by the Portfolios in which it invests, was 0.79% of the Fund's average daily net assets. The Fund's allocated portion of the advisory fees paid by the Portfolios totaled $3,671,485 for the year ended October 31, 2006. For the year end ed October 31, 2006, the advisory fee paid directly by the Fund amounted to $558,727.
An administrative fee is earned by EVM for managing and administering the business affairs of the Fund. Under the administration agreement, EVM earns a fee in the amount of 0.15% per annum of the average daily net assets of the Fund. For the year ended October 31, 2006, the administration fee amounted to $795,801.
Except for Trustees of the Fund and the Portfolios who are not members of EVM's organization, officers and Trustees receive remuneration for their services to the Fund out of the investment adviser fee earned by EVM. Trustees of the Fund who are not affiliated with EVM may elect to defer receipt of all or a percentage of their annual fees in accordance with the terms of the Trustees Deferred Compensation Plan. For the year ended October 31, 2006, no significant amounts have been deferred. Certain officers and Trustees of the Fund and Portfolios are officers of the above organization.
EVM serves as the sub-transfer agent of the Fund and receives from the transfer agent an aggregate fee based upon the actual expenses incurred by EVM in the performance of those activities. During the year ended October 31, 2006, EVM received $26,901 in sub-transfer agent fees.
The Fund was informed that EVD, a subsidiary of EVM and the Fund's principal underwriter, received $241,192, as its portion of the sales charge on sales of Class A for the year ended October 31, 2006.
5 Distribution Plans
Class A has in effect a distribution plan pursuant to Rule 12b-1 under the Investment Company Act of 1940 (Class A Plan). The Class A Plan provides that the Fund will pay EVD a distribution and service fee of 0.25% of the Fund's average daily net assets attributable to Class A shares for each fiscal year for distribution services and facilities provided to the Fund by EVD, as well as for personal services and/or the maintenance of shareholder accounts. Distribution and service fees paid or accrued for the year ended October 31, 2006 amounted to $523,218 for Class A shares. The Fund also has in effect distribution plans for Class B shares (Class B Plan) and Class C shares (Class C Plan) pursuant to Rule 12b-1 under the Investment Company Act of 1940 (collectively, "the Plans"). The Class B and Class C Plans require the Fund to
13
Eaton Vance Tax-Managed Equity Asset Allocation Fund as of October 31, 2006
NOTES TO FINANCIAL STATEMENTS CONT'D
pay EVD amounts equal to 1/365 of 0.75% of the Fund's average daily net assets attributable to Class B and Class C shares for providing ongoing distribution services and facilities to the Fund. The Fund will automatically discontinue payments to EVD during any period in which there are no outstanding Uncovered Distribution Charges, which are equivalent to the sum of (i) 6.25% of the aggregate amount received by the Fund for the Class B and Class C shares sold, respectively, plus (ii) interest calculated by applying the rate of 1% over the prevailing prime rate to the outstanding balance of Uncovered Distribution Charges of EVD of each respective class, reduced by the aggregate amount of contingent deferred sales charges (see Note 6) and daily amounts theretofore paid to EVD by each respective class. Distribution fees paid or accrued for the year ended October 31, 2006 amounted to $335,777 and $467,340 for Class B and Class C sha res, respectively. At October 31, 2006, the amount of Uncovered Distribution Charges of EVD calculated under the Plans was approximately $3,356,000 and $7,453,000 for Class B and Class C shares, respectively. The Class B and Class C Plans also authorize the Fund to make payments of service fees to EVD, investment dealers and other persons in amounts not exceeding 0.25% annually of the average daily net assets attributable to that Class. Service fees are paid for personal services and/or the maintenance of shareholder accounts. They are separate and distinct from the Class B and Class C sales commissions and distribution fees and, as such, are not subject to automatic discontinuance when there are no outstanding Uncovered Distribution Charges to EVD. Service fees paid or accrued for the year ended October 31, 2006 amounted to $1,007,332, and $1,402,019, for Class B and Class C shares, respectively.
6 Contingent Deferred Sales Charge
A contingent deferred sales charge (CDSC) generally is imposed on redemptions of Class B shares made within six years of purchase and on redemptions of Class C shares made within one year of purchase. Class A shares may be subject to a CDSC up to 1% if redeemed within two years of purchase (depending upon the circumstances of purchase). Generally, the CDSC is based upon the lower of the net asset value at date of redemption or date of purchase. No charge is levied on shares acquired by reinvestment of dividends or capital gain distributions. The Class B CDSC is imposed at declining rates that begin at 5% in the case of redemptions in the first and second year after purchase, declining one percentage point each subsequent year. Class C shares will be subject to a 1% CDSC if redeemed within one year of purchase.
No CDSC is levied on shares which have been sold to EVM or its affiliates or to their respective employees or clients and may be waived under certain other limited conditions. CDSC on Class B and Class C redemptions are paid to EVD to reduce the amount of Uncovered Distribution Charges calculated under the Class B and Class C Plans, respectively (see Note 5). CDSC assessed on Class B and Class C shares when no Uncovered Distribution Charges exist for the respective classes will be credited to the Fund. EVD received approximately $121, $232,000 and $12,000 of CDSC paid by shareholders for Class A, Class B and Class C shares, respectively, for the year ended October 31, 2006.
7 Investment Transactions
For the year ended October 31, 2006, increases and decreases in the Fund's investment in the Portfolios were as follows:
| Portfolio | | Contributions | | Withdrawals | |
| Tax-Managed Growth Portfolio | | $ | 17,666,327 | | | $ | — | | |
| Tax-Managed Value Portfolio | | | 28,577,148 | | | | 11,645,089 | | |
| Tax-Managed International Equity Portfolio | | | 12,424,134 | | | | — | | |
| Tax-Managed Multi-Cap Opportunity Portfolio | | | 2,051,195 | | | | 6,741,763 | | |
| Tax-Managed Mid-Cap Core Portfolio | | | 10,816,570 | | | | 1,526,899 | | |
| Tax-Managed Small-Cap Growth Portfolio | | | 5,493,358 | | | | — | | |
| Tax-Managed Small-Cap Value Portfolio | | | — | | | | 210,140 | | |
8 Recently Issued Accounting Pronouncements
In June 2006, the Financial Accounting Standards Board (FASB) issued FASB Interpretation No. 48, (FIN 48) "Accounting for Uncertainty in Income Taxes – an interpretation of FASB Statement No. 109". FIN 48 clarifies the accounting for uncertainty in income taxes recognized in accordance with FASB Statement No. 109, "Accounting for Income Taxes." This interpretation prescribes a recognition threshold and measurement attribute for the financial statement recognition and measurement of a tax position taken or expected to be taken in a tax return. It also provides guidance on de-recognition, classification, interest and penalties, accounting in interim periods, disclosure and transition. FIN 48 is effective for fiscal years beginning after December 15, 2006. Management is currently evaluating the impact of applying the various provisions of FIN 48.
In September 2006, the FASB Statement of Financial Accounting Standards No. 157 (FAS 157) "Fair Value Measurements". FAS 157 defines fair value, establishes a framework for measuring fair value in accordance with generally accepted accounting principles and expands disclosure about fair value measurements. FAS 157 is effective for fiscal years beginning after November 15, 2007. Management is currently evaluating the impact the adoption of FAS 157 will have on the Fund's financial statement disclosures.
14
Eaton Vance Tax-Managed Equity Asset Allocation Fund as of October 31, 2006
REPORT OF INDEPENDENT REGISTERED PUBLIC ACCOUNTING FIRM
To the Trustees of Eaton Vance Mutual Funds Trust and Shareholders of Eaton Vance Tax-Managed Equity Asset Allocation Fund:
We have audited the accompanying statement of assets and liabilities of Eaton Vance Tax-Managed Equity Asset Allocation Fund (the Fund) (one of the series of Eaton Vance Mutual Funds Trust) as of October 31, 2006, the related statement of operations for the year then ended, the statement of changes in net assets for each of the two years in the period then ended and the financial highlights for each of the four years in the period then ended, and for the period from the start of business, March 4, 2002 to October 31, 2002. These financial statements and financial highlights are the responsibility of the Fund's management. Our responsibility is to express an opinion on these financial statements and financial highlights based on our audits.
We conducted our audits in accordance with standards of the Public Company Accounting Oversight Board (United States). Those standards require that we plan and perform the audits to obtain reasonable assurance about whether the financial statements and financial highlights are free of material misstatement. The Fund is not required to have, nor were we engaged to perform, an audit of its internal control over financial reporting. Our audits included consideration of internal control over financial reporting as a basis for designing audit procedures that are appropriate in the circumstances, but not for the purpose of expressing an opinion of the Fund's internal control over financial reporting. Accordingly, we express no such opinion. An audit also includes examining, on a test basis, evidence supporting the amounts and disclosures in the financial statements, assessing the accounting principles used and significant estimates ma de by management, as well as evaluating the overall financial statement presentation. We believe that our audits provide a reasonable basis for our opinion.
In our opinion, such financial statements and financial highlights referred to above present fairly, in all material respects, the financial position of Eaton Vance Tax-Managed Equity Asset Allocation Fund as of October 31, 2006, the results of its operations for the year then ended, the changes in its net assets for each of the two years in the period then ended and the financial highlights for each of the four years in the period then ended, and for the period from the start of business, March 4, 2002 to October 31, 2002, in conformity with accounting principles generally accepted in the United States of America.
DELOITTE & TOUCHE LLP
Boston, Massachusetts
December 15, 2006
15
Eaton Vance Tax-Managed Equity Asset Allocation Fund as of October 31, 2006
FEDERAL TAX INFORMATION (Unaudited)
The Form 1099-DIV you receive in January 2007 will show the tax status of all distributions paid to your account in calendar 2006. Shareholders are advised to consult their own tax adviser with respect to the tax consequences of their investment in the Fund. As required by the Internal Revenue Code regulations, shareholders must be notified within 60 days of the Fund's fiscal year end regarding the status of the long-term capital gains distribution.
Long-Term Capital Gains Distribution — The Fund designates $12,064,059 as long-term capital gains distribution.
16
Eaton Vance Tax-Managed Equity Asset Allocation Fund
BOARD OF TRUSTEES' ANNUAL APPROVAL OF THE INVESTMENT ADVISORY AGREEMENT
Overview of the Contract Review Process
The Investment Company Act of 1940, as amended (the "1940 Act"), provides, in substance, that each investment advisory agreement between a fund and its investment adviser will continue in effect from year to year only if its continuance is approved at least annually by the fund's board of trustees, including by a vote of a majority of the trustees who are not "interested persons" of the fund ("Independent Trustees") cast in person at a meeting called for the purpose of considering such approval.
At a meeting of the Boards of Trustees (each a "Board") of the Eaton Vance group of mutual funds (the "Eaton Vance Funds") held on March 27, 2006, the Board, including a majority of the Independent Trustees, voted to approve continuation of existing advisory and sub-advisory agreements for the Eaton Vance Funds for an additional one-year period. In voting its approval, the Board relied upon the affirmative recommendation of the Special Committee of the Board, which is a committee comprised exclusively of Independent Trustees. Prior to making its recommendation, the Special Committee reviewed information furnished for a series of meetings of the Special Committee held in February and March 2006. Such information included, among other things, the following:
Information about Fees, Performance and Expenses
• An independent report comparing the advisory and related fees paid by each fund with fees paid by comparable funds;
• An independent report comparing each fund's total expense ratio and its components to comparable funds;
• An independent report comparing the investment performance of each fund to the investment performance of comparable funds over various time periods;
• Data regarding investment performance in comparison to relevant peer groups of funds and appropriate indices;
• Comparative information concerning fees charged by each adviser for managing other mutual funds and institutional accounts using investment strategies and techniques similar to those used in managing the fund;
• Profitability analyses for each adviser with respect to each fund managed by it;
Information about Portfolio Management
• Descriptions of the investment management services provided to each fund, including the investment strategies and processes employed;
• Information concerning the allocation of brokerage and the benefits received by each adviser as a result of brokerage allocation, including information concerning the acquisition of research through "soft dollar" benefits received in connection with the funds' brokerage, and the implementation of a soft dollar reimbursement program established with respect to the funds;
• Data relating to portfolio turnover rates of each fund;
• The procedures and processes used to determine the fair value of fund assets and actions taken to monitor and test the effectiveness of such procedures and processes;
Information about each Adviser
• Reports detailing the financial results and condition of each adviser;
• Descriptions of the qualifications, education and experience of the individual investment professionals whose responsibilities include portfolio management and investment research for the funds, and information relating to their compensation and responsibilities with respect to managing other mutual funds and investment accounts;
• Copies of the Codes of Ethics of each adviser and its affiliates, together with information relating to compliance with and the administration of such codes;
• Information concerning the resources devoted to compliance efforts undertaken by each adviser and its affiliates on behalf of the funds (including descriptions of various compliance programs) and their record of compliance with investment policies and restrictions, including policies with respect to market-timing, late trading and selective portfolio disclosure, and with policies on personal securities transactions;
• Descriptions of the business continuity and disaster recovery plans of each adviser and its affiliates;
Other Relevant Information
• Information concerning the nature, cost and character of the administrative and other non-investment management services provided by Eaton Vance Management and its affiliates;
• Information concerning management of the relationship with the custodian, subcustodians and fund accountants by each adviser or the funds' administrator; and
• The terms of each advisory agreement.
In addition to the information identified above, the Special Committee considered information provided from time to time by each adviser throughout the year at meetings of the Board and its committees. Over the course of the twelve month period ended March 31, 2006, the Board met nine times and the Special Committee, the Audit Committee and the Governance Committee, each of which is a
17
Eaton Vance Tax-Managed Equity Asset Allocation Fund
BOARD OF TRUSTEES' ANNUAL APPROVAL OF THE INVESTMENT ADVISORY AGREEMENT CONT'D
Committee comprised solely of Independent Trustees, met eight, twelve and five times, respectively. At such meetings, the Trustees received, among other things, presentations by the portfolio managers and other investment professionals of each adviser relating to the investment performance of each fund and the investment strategies used in pursuing the fund's investment objective.
For funds that invest through one or more underlying portfolios, the Board considered similar information about the portfolio(s) when considering the approval of advisory agreements. In addition, in cases where the fund's investment adviser has engaged a sub-adviser, the Board considered similar information about the sub-adviser when considering the approval of any sub-advisory agreement.
The Special Committee was assisted throughout the contract review process by Goodwin Procter LLP, legal counsel for the Independent Trustees. The members of the Special Committee relied upon the advice of such counsel and their own business judgment in determining the material factors to be considered in evaluating each advisory and sub-advisory agreement and the weight to be given to each such factor. The conclusions reached with respect to each advisory and sub-advisory agreement were based on a comprehensive evaluation of all the information provided and not any single factor. Moreover, each member of the Special Committee may have placed varying emphasis on particular factors in reaching conclusions with respect to each advisory and sub-advisory agreement.
Results of the Process
Based on its consideration of the foregoing, and such other information as it deemed relevant, including the factors and conclusions described below, the Special Committee concluded that the continuance of the investment advisory agreement of the Eaton Vance Tax-Managed Equity Asset Allocation Fund (the "Fund") with Eaton Vance Management ("EVM"), as well as the investment advisory agreements of the Tax-Managed Growth Portfolio, the Tax-Managed Mid-Cap Core Portfolio, the Tax-Managed International Equity Portfolio, Tax-Managed Multi-Cap Opportunity Portfolio, Tax-Managed Small-Cap Growth Portfolio, Tax-Managed Small-Cap Value Portfolio and the Tax-Managed Value Portfolio (the "Portfolios"), the portfolios in which the Fund invests, each with Boston Management and Research ("BMR"), including their fee structures, is in the interests of shareholders and, therefore, the Special Committee recommended to the Board approval of each ag reement. In addition, the Special Committee concluded that each of the investment sub-advisory agreements between BMR and Atlanta Capital Management Company, LLC ("Atlanta Capital"), with respect to the Tax-Managed Mid-Cap Core Portfolio, between BMR and Eagle Global Advisors, L.L.C. ("Eagle"), with respect to the Tax-Managed International Equity Portfolio, and between BMR and Fox Asset Management LLC ("Fox"), with respect to the Tax-Managed Small-Cap Value Portfolio, including their fee structures, is in the interests of shareholders and, therefore, the Special Committee recommended to the Board approval of each agreement. The Board accepted the recommendation of the Special Committee as well as the factors considered and conclusions reached by the Special Committee with respect to each agreement. Accordingly, the Board, including a majority of the Independent Trustees, voted to approve continuation of the investment advisory agreements for the Fund and the Portfolios. EVM and BMR are each referred to as an "Adviser" herein; EVM with respect to the Fund and BMR with respect to the Portfolios. EVM and BMR are affiliates. Eagle, Fox and Atlanta Capital are referred to herein as the "Sub-advisers." Fox and Atlanta Capital are affiliates of EVM and BMR.
Nature, Extent and Quality of Services
In considering whether to approve the investment advisory agreement of the Fund and each Portfolio and the sub-advisory agreements of the relevant Portfolio, the Board evaluated the nature, extent and quality of services provided to each Portfolio by BMR and to the relevant Portfolio by the Sub-adviser and to the Fund by EVM. BMR manages the Portfolios, while EVM allocates the assets of the Fund among the Portfolios.
The Board considered BMR's and the Sub-advisers' management capabilities and investment process with respect to the types of investments held by the Portfolios, including the education, experience and number of its investment professionals and other personnel who provide portfolio management, investment research, and similar services to the Portfolios. The Board specifically noted BMR's in-house equity research capabilities and experience in managing funds that seek to maximize after-tax returns. For all the Portfolios, the Board also took into account the resources dedicated to portfolio management and other services, including the compensation paid to recruit and retain investment personnel, and the time and attention devoted to the Fund and each Portfolio by senior management. The Board also considered the capabilities of each Sub-adviser.
The Board reviewed the compliance programs of the Adviser and relevant affiliates thereof. Among other matters, the Board considered compliance and reporting matters relating to personal trading by investment personnel, selective disclosure of portfolio holdings, late trading, frequent trading, portfolio valuation, business continuity and the allocation of investment opportunities. The Board also evaluated the responses of the Adviser and its affiliates to requests from regulatory authorities such as the Securities and Exchange Commission and the National Association of Securities Dealers.
18
Eaton Vance Tax-Managed Equity Asset Allocation Fund
BOARD OF TRUSTEES' ANNUAL APPROVAL OF THE INVESTMENT ADVISORY AGREEMENT CONT'D
The Board considered shareholder and other administrative services provided or managed by Eaton Vance Management and its affiliates, including transfer agency and accounting services. The Board evaluated the benefits to shareholders of investing in a fund that is a part of a large family of funds, including the ability, in many cases, to exchange an investment among different funds without incurring additional sales charges.
After consideration of the foregoing factors, among others, the Board concluded that the nature, extent and quality of services provided by the Adviser and Sub-advisers, taken as a whole, are appropriate and consistent with the terms of the investment advisory and sub-advisory agreements.
Fund Performance
The Board compared the Fund's investment performance to a relevant universe of similarly managed funds identified by an independent data provider and appropriate benchmark indices for the one- and three-year periods ended September 30, 2005 for the Fund. The Board also considered the performance of the underlying Portfolios. The Board concluded that the Fund's performance was satisfactory.
Management Fees and Expenses
The Board reviewed contractual investment advisory fee rates, including administrative fee rates, payable by the Portfolios and the Fund (referred to collectively as "management fees"). As part of its review, the Board considered the management fees, including administrative fees, and the Fund's total expense ratio for the one-year period ended September 30, 2005, as compared to a group of similarly managed funds selected by an independent data provider.
After reviewing the foregoing information, and in light of the nature, extent and quality of the services provided by the Adviser, the Board concluded that the management fees charged for advisory and related services and the Fund's total expense ratio are reasonable.
Profitability
The Board reviewed the level of profits realized by the Adviser and relevant affiliates thereof in providing investment advisory and administrative services to the Fund, the Portfolios and all Eaton Vance Funds as a group. The Board considered the level of profits realized without regard to revenue sharing or other payments by the Adviser and its affiliates to third parties in respect of distribution services. The Board also considered other direct or indirect benefits received by the Adviser and its affiliates in connection with its relationship with the Fund and the Portfolios, including the benefits of research services that may be available to BMR or the Sub-advisers as a result of securities transactions effected for the Portfolios and other investment advisory clients. The Board also concluded that, in light of its role as a sub-adviser not affiliated with the Adviser, Eagle's profitability in managing the Tax-Managed Inte rnational Equity Portfolio was not a material factor.
The Board concluded that, in light of the foregoing factors and the nature, extent and quality of the services rendered, the profits realized by the Adviser and its affiliates are reasonable.
Economies of Scale
In reviewing management fees and profitability, the Board also considered the extent to which the Adviser and its affiliates, on the one hand, and the Fund, on the other hand, can expect to realize benefits from economies of scale as the assets of the Fund and the Portfolios increase. The Board acknowledged the difficulty in accurately measuring the benefits resulting from the economies of scale with respect to the management of any specific fund or group of funds. The Board reviewed data summarizing the increases and decreases in the assets of the Portfolios and of all Eaton Vance Funds as a group over various time periods, and evaluated the extent to which the total expense ratio of the Fund and the profitability of the Adviser and its affiliates may have been affected by such increases or decreases. The Board noted that, at its request, the Adviser had agreed to add two new breakpoints for the Tax-Managed Value Portfolio with respect to assets that exceed $2 billion and $5 billion, and one new breakpoint for the Tax-Managed Growth Portfolio for assets over $25 billion. Based upon the foregoing, the Board concluded that the benefits from economies of scale are currently being shared equitably by the Adviser and its affiliates and the Fund. The Board also concluded that, assuming reasonably foreseeable increases in the assets of the Portfolios, the structure of the advisory fees, which include breakpoints at several asset levels, can be expected to cause the Adviser and its affiliates and the Fund to continue to share such benefits equitably.
19
Eaton Vance Tax-Managed Equity Asset Allocation Fund
MANAGEMENT AND ORGANIZATION
Fund Management. The Trustees of Eaton Vance Mutual Funds Trust (the Trust) are responsible for the overall management and supervision of the Trust's affairs. The Trustees and officers of the Trust are listed below. Except as indicated, each individual has held the office shown or other offices in the same company for the last five years. Trustees and officers of the Trust hold indefinite terms of office. The "noninterested Trustees" consist of those Trustees who are not "interested persons" of the Trust, as that term is defined under the 1940 Act. The business address of each Trustee and officer is The Eaton Vance Building, 255 State Street, Boston, Massachusetts 02109. As used below, "EVC" refers to Eaton Vance Corp., "EV" refers to Eaton Vance, Inc., "EVM" refers to Eaton Vance Management, "BMR" refers to Boston Management and Research, "Parametric" refer s to Parametric Portfolio Associates and "EVD" refers to Eaton Vance Distributors, Inc. EVC and EV are the corporate parent and trustee, respectively, of EVM and BMR. EVD is the Fund's principal underwriter a wholly-owned subsidiary of EVM. Each officer affiliated with Eaton Vance may hold a position with other Eaton Vance affiliates that is comparable to his or her position with EVM listed below.
Name and
Date of Birth | | Position
with the
Trust | | Term of
Office and
Length of
Service | | Principal Occupation(s)
During Past Five Years | | Number of Portfolios
in Fund Complex
Overseen By
Trustee(1) | | Other Directorships Held | |
| Interested Trustee(s) | | | | | | | | | | | | | |
|
| James B. Hawkes 11/9/41 | | Trustee | | Since 1991 | | Chairman and Chief Executive Officer of EVC, BMR, EVM and EV; Director of EV; Vice President and Director of EVD. Trustee and/or officer of 170 registered investment companies in the Eaton Vance Fund Complex. Mr. Hawkes is an interested person because of his positions with BMR, EVM, EVC and EV, which are affiliates of the Trust. | | | 170 | | | Director of EVC | |
|
Name and
Date of Birth | | Position
with the
Trust | | Term of
Office and
Length of
Service | | Principal Occupation(s)
During Past Five Years | | Number of Portfolios
in Fund Complex
Overseen By
Trustee(1) | | Other Directorships Held | |
| Noninterested Trustee(s) | | | | | | | | | | | | | |
|
| Benjamin C. Esty 1/2/63 | | Trustee | | Since 2005 | | Roy and Elizabeth Simmons Professor of Business Administration, Harvard University Graduate School of Business Administration (since 2003). Formerly, Associate Professor, Harvard University Graduate School of Business Administration (2000-2003). | | | 170 | | | None | |
|
| Samuel L. Hayes, III 2/23/35 | | Trustee and Chairman of the Board | | Trustee since 1986 and Chairman of the Board since 2005 | | Jacob H. Schiff Professor of Investment Banking Emeritus, Harvard University Graduate School of Business Administration. Director of Yakima Products, Inc. (manufacturer of automotive accessories) (since 2001) and Director of Telect, Inc. (telecommunications services company). | | | 170 | | | Director of Tiffany & Co. (specialty retailer) | |
|
| William H. Park 9/19/47 | | Trustee | | Since 2003 | | Vice Chairman, Commercial Industrial Finance Corp. (specialty finance company) (since 2006). Formerly, President and Chief Executive Officer, Prizm Capital Management, LLC (investment management firm) (2002-2005). Formerly, Executive Vice President and Chief Financial Officer, United Asset Management Corporation (a holding company owning institutional investment management firms) (1982-2001). | | | 170 | | | None | |
|
| Ronald A. Pearlman 7/10/40 | | Trustee | | Since 2003 | | Professor of Law, Georgetown University Law Center. | | | 170 | | | None | |
|
20
Eaton Vance Tax-Managed Equity Asset Allocation Fund
MANAGEMENT AND ORGANIZATION CONT'D
Name and
Date of Birth | | Position
with the
Trust | | Term of
Office and
Length of
Service | | Principal Occupation(s)
During Past Five Years | | Number of Portfolios
in Fund Complex
Overseen By
Trustee(1) | | Other Directorships Held | |
| Noninterested Trustee(s) (continued) | | | | | | | | | | | | | |
|
| Norton H. Reamer 9/21/35 | | Trustee | | Since 1986 | | President, Chief Executive Officer and a Director of Asset Management Finance Corp. (a specialty finance company serving the investment management industry) (since October 2003). President, Unicorn Corporation (an investment and financial advisory services company) (since September 2000). Formerly, Chairman and Chief Operating Officer, Hellman, Jordan Management Co., Inc. (an investment management company) (2000-2003). Formerly, Advisory Director of Berkshire Capital Corporation (investment banking firm) (2002-2003). | | | 170 | | | None | |
|
| Lynn A. Stout 9/14/57 | | Trustee | | Since 1998 | | Professor of Law, University of California at Los Angeles School of Law. | | | 170 | | | None | |
|
| Ralph F. Verni 1/26/43 | | Trustee | | Since 2005 | | Consultant and private investor. | | | 170 | | | None | |
|
| Principal Officers who are not Trustees | | | | | | | | | | | | | |
|
Name and
Date of Birth | | Position
with the
Trust | | Term of
Office and
Length of
Service | | Principal Occupation(s)
During Past Five Years | |
| Thomas E. Faust Jr. 5/31/58 | | President | | Since 2002 | | President of EVC, EVM, BMR and EV and Director of EVC. Chief Investment Officer of EVC, EVM and BMR. Officer of 71 registered investment companies and 5 private investment companies managed by EVM or BMR. | |
|
| William H. Ahern, Jr. 7/28/59 | | Vice President | | Since 1995 | | Vice President of EVM and BMR. Officer of 71 registered investment companies managed by EVM or BMR. | |
|
| Cynthia J. Clemson 3/2/63 | | Vice President | | Since 2004 | | Vice President of EVM and BMR. Officer of 86 registered investment companies managed by EVM or BMR. | |
|
| Aamer Khan 6/7/60 | | Vice President | | Since 2005 | | Vice President of EVM and BMR. Officer of 29 registered investment companies managed by EVM or BMR. | |
|
| Thomas H. Luster 4/8/62 | | Vice President | | Since 2006 | | Vice President of EVM and BMR. Officer of 45 registered investment companies managed by EVM or BMR. | |
|
| Michael R. Mach 7/15/47 | | Vice President | | Since 1999 | | Vice President of EVM and BMR. Officer of 51 registered investment companies managed by EVM or BMR. | |
|
| Robert B. MacIntosh 1/22/57 | | Vice President | | Since 1998 | | Vice President of EVM and BMR. Officer of 86 registered investment companies managed by EVM or BMR. | |
|
| Cliff Quisenberry, Jr. 1/1/65 | | Vice President | | Since 2006 | | Vice President and Director of Research and Product Development of Parametric. Officer of 30 registered investment companies managed by EVM or BMR. | |
|
| Duncan W. Richardson 10/26/57 | | Vice President | | Since 2001 | | Executive Vice President and Chief Equity Investment Officer of EVC, EVM and BMR. Officer 71 registered investment companies managed by EVM or BMR. | |
|
| Walter A. Row, III 7/20/57 | | Vice President | | Since 2001 | | Director of Equity Research and a Vice President of EVM and BMR. Officer of 33 registered investment companies managed by EVM or BMR. | |
|
| Judith A. Saryan 8/21/54 | | Vice President | | Since 2003 | | Vice President of EVM and BMR. Officer of 50 registered investment companies managed by EVM or BMR. | |
|
21
Eaton Vance Tax-Managed Equity Asset Allocation Fund
MANAGEMENT AND ORGANIZATION CONT'D
| Principal Officers who are not Trustees (continued) | |
|
Name and
Date of Birth | | Position
with the
Trust | | Term of
Office and
Length of
Service | | Principal Occupation(s)
During Past Five Years | |
| Susan Schiff 3/13/61 | | Vice President | | Since 2002 | | Vice President of EVM and BMR. Officer of 30 registered investment companies managed by EVM or BMR. | |
|
| Barbara E. Campbell 6/19/57 | | Treasurer | | Since 2005(2) | | Vice President of EVM and BMR. Officer of 170 registered investment companies managed by EVM or BMR. | |
|
| Alan R. Dynner 10/10/40 | | Secretary | | Since 1997 | | Vice President, Secretary and Chief Legal Officer of BMR, EVM, EVD, EV and EVC. Officer of 170 registered investment companies managed by EVM or BMR. | |
|
| Paul M. O'Neil 7/11/53 | | Chief Compliance Officer | | Since 2004 | | Vice President of EVM and BMR. Officer of 170 registered investment companies managed by EVM or BMR. | |
|
(1) Includes both master and feeder funds in a master-feeder structure.
(2) Prior to 2005, Ms. Campbell served as Assistant Treasurer of the Trust since 1995.
The SAI for the Fund includes additional information about the Trustees and officers of the Fund and can be obtained without charge by calling 1-800-225-6265.
22
This Page Intentionally Left Blank
This Page Intentionally Left Blank
Investment Adviser of Eaton Vance Tax-Managed Equity Asset Allocation Fund
Eaton Vance Management
The Eaton Vance Building
255 State Street
Boston, MA 02109
Administrator of Eaton Vance Tax-Managed Equity Asset Allocation Fund
Eaton Vance Management
The Eaton Vance Building
255 State Street
Boston, MA 02109
Principal Underwriter
Eaton Vance Distributors, Inc.
The Eaton Vance Building
255 State Street
Boston, MA 02109
(617) 482-8260
Custodian
Investors Bank & Trust Company
200 Clarendon Street
Boston, MA 02116
Transfer Agent
PFPC Inc.
Attn: Eaton Vance Funds
P.O. Box 9653
Providence, RI 02940-9653
(800) 262-1122
Independent Registered Public Accounting Firm
Deloitte & Touche LLP
200 Berkeley Street
Boston, MA 02116-5022
Eaton Vance Tax-Managed Equity Asset Allocation Fund
The Eaton Vance Building
255 State Street
Boston, MA 02109
This report must be preceded or accompanied by a current prospectus. Before investing, investors should consider carefully the Fund's investment objective, risks, and charges and expenses. The Fund's current prospectus contains this and other information about the Fund and is available through your financial advisor. Please read the prospectus carefully before you invest or send money. For further information please call 1-800-225-6265.
1299-12/06 TMEAASRC

Annual Report October 31, 2006


EATON VANCE
HIGH
INCOME
FUND
IMPORTANT NOTICES REGARDING PRIVACY,
DELIVERY OF SHAREHOLDER DOCUMENTS,
PORTFOLIO HOLDINGS AND PROXY VOTING
Privacy. The Eaton Vance organization is committed to ensuring your financial privacy. Each of the financial institutions identified below has in effect the following policy ("Privacy Policy") with respect to nonpublic personal information about its customers:
• Only such information received from you, through application forms or otherwise, and information about your Eaton Vance fund transactions will be collected. This may include information such as name, address, social security number, tax status, account balances and transactions.
• None of such information about you (or former customers) will be disclosed to anyone, except as permitted by law (which includes disclosure to employees necessary to service your account). In the normal course of servicing a customer's account, Eaton Vance may share information with unaffiliated third parties that perform various required services such as transfer agents, custodians and broker/dealers.
• Policies and procedures (including physical, electronic and procedural safeguards) are in place that are designed to protect the confidentiality of such information.
• We reserve the right to change our Privacy Policy at any time upon proper notification to you. Customers may want to review our Policy periodically for changes by accessing the link on our homepage: www.eatonvance.com.
Our pledge of privacy applies to the following entities within the Eaton Vance organization: the Eaton Vance Family of Funds, Eaton Vance Management, Eaton Vance Investment Counsel, Boston Management and Research, and Eaton Vance Distributors, Inc.
In addition, our Privacy Policy only applies to those Eaton Vance customers who are individuals and who have a direct relationship with us. If a customer's account (i.e., fund shares) is held in the name of a third-party financial adviser/broker-dealer, it is likely that only such adviser's privacy policies apply to the customer. This notice supersedes all previously issued privacy disclosures.
For more information about Eaton Vance's Privacy Policy, please call 1-800-262-1122.
Delivery of Shareholder Documents. The Securities and Exchange Commission (the "SEC") permits funds to deliver only one copy of shareholder documents, including prospectuses, proxy statements and shareholder reports, to fund investors with multiple accounts at the same residential or post office box address. This practice is often called "householding" and it helps eliminate duplicate mailings to shareholders.
Eaton Vance, or your financial adviser, may household the mailing of your documents indefinitely unless you instruct Eaton Vance, or your financial adviser, otherwise.
If you would prefer that your Eaton Vance documents not be householded, please contact Eaton Vance at 1-800-262-1122, or contact your financial adviser.
Your instructions that householding not apply to delivery of your Eaton Vance documents will be effective within 30 days of receipt by Eaton Vance or your financial adviser.
Portfolio Holdings. Each Eaton Vance Fund and Portfolio (if applicable) will file a schedule of its portfolio holdings on Form N-Q with the SEC for the first and third quarters of each fiscal year. The Form N-Q will be available on the Eaton Vance website www.eatonvance.com, by calling Eaton Vance at 1-800-262-1122 or in the EDGAR database on the SEC's website at www.sec.gov. Form N-Q may also be reviewed and copied at the SEC's public reference room in Washington, D.C. (call 1-800-732-0330 for information on the operation of the public reference room).
Proxy Voting. From time to time, funds are required to vote proxies related to the securities held by the funds. The Eaton Vance Funds or their underlying Portfolios (if applicable) vote proxies according to a set of policies and procedures approved by the Funds' and Portfolios' Boards. You may obtain a description of these policies and procedures and information on how the Funds or Portfolios voted proxies relating to Portfolio securities during the most recent 12 month period ended June 30, without charge, upon request, by calling 1-800-262-1122. This description is also available on the SEC's website at www.sec.gov.
Eaton Vance High Income Fund as of October 31, 2006
MANAGEMENT’S DISCUSSION OF FUND PERFORMANCE
The Fund
Performance for the Past Year
· The Fund’s Class A shares had a total return of 11.04% for the year ended October 31, 2006.(1) This return resulted from an increase in net asset value per share (NAV) to $5.23 on October 31, 2006 from $5.10 on October 31, 2005, and the reinvestment of $0.413 in dividends.
· The Fund’s Class B shares had a total return of 10.41% for the year ended October 31, 2006.(1) This return resulted from an increase in NAV to $5.22 on October 31, 2006 from $5.08 on October 31, 2005, and the reinvestment of $0.372 in dividends.
· The Fund’s Class C shares had a total return of 10.41% for the year ended October 31, 2006.(1) This return resulted from an increase in NAV to $5.22 on October 31, 2006 from $5.08 on October 31, 2005, and the reinvestment of $0.372 in dividends. The Class C beginning NAV and certain dividends per share have been restated to reflect the effects of a stock split effective on November 11, 2005.
· In comparison, the Merrill Lynch U.S. High Yield Master II Index – an unmanaged index of below-investment grade U.S. dollar-denominated corporate bonds publicly issued in the U.S. domestic market–had a return of 10.34% for the year ended October 31, 2006.(2) The Fund’s peer group, the Lipper High Current Yield Funds Classification, had an average total return of 9.18% for the same period.(2)
· Based on the Fund’s most recent dividends and NAVs on October 31, 2006 of $5.23 per share for Class A, $5.22 for Class B and $5.22 for Class C, the Fund’s distribution rates were 7.90%, 7.13% and 7.13%, respectively.(3) The SEC 30-day yields for Class A, Class B and Class C were 8.34%, 8.00% and 7.99%, respectively.(4)
Recent Fund Developments
· The Fund currently invests its assets in a separate registered investment company with the same objective and policies as the Fund (the Portfolio). The high-yield market saw narrow spreads and record new issuance during the fiscal year. Technical conditions, which weakened at mid-year with the stock market decline, finished the year strongly, as large new offerings from merger and leveraged buyouts met strong demand. High-yield spreads, which fell as low as 299 basis points (2.99%) over Treasuries, were around 338 basis points (3.38%) at October 31, 2006. The market rallied in the final three months of the fiscal year, due in part to an infusion of investment from non-traditional investors, such as hedge funds and structured investment vehicles.
· Amid narrow high-yield spreads, the Portfolio out-performed through the first nine months of the fiscal year, by paring its lower quality high-yield bonds and emphasizing shorter maturities. Excluding cash, the Portfolio had a duration of 3.22 years at October 31, 2006. Shorter maturity bonds and floating-rate notes fare better when spreads widen or interest rates rise.
· Finance subsidiaries of auto companies were among the Portfolio’s leading performers, as they responded well to the prospect of company reorganizations. Health care, telecom and energy bonds were also strong contributors. Health care companies were helped by cost cuts and improving margins, while telecom providers enjoyed strong free cash flow and energy companies benefited from surging oil prices.(5)
· In the final three months of the period, the Portfolio’s avoidance of speculative credits inhibited its ability to participate fully in the market rally. Homebuilders – pinched by a nationwide housing slump – were among the Portfolio’s least successful performers, although the Portfolio was helped on a relative basis by an underweighting in that industry.(5)
(1) These returns do not include the 4.75% maximum sales charge for the Fund’s Class A shares or the applicable contingent deferred sales charges (CDSC) for Class B shares and Class C shares. If sales charges were deducted, returns would be lower. Class A shares are subject to a 1% redemption fee if redeemed or exchanged within 90 days of the settlement of the purchase.
(2) It is not possible to invest directly in an Index or Lipper Classification. The Index’s total return does not reflect commissions or expenses that would have been incurred if an investor individually purchased or sold the securities represented in the Index. The Lipper average is the average total return, at net asset value, of the funds that are in the same Lipper Classification as the Fund.
(3) The Fund’s distribution rate represents actual distributions paid to shareholders and is calculated daily by dividing the last distribution per share (annualized) by the net asset value.
(4) The Fund’s SEC yield is calculated by dividing the net investment income per share for the 30-day period by the offering price at the end of the period and annualizing the result.
(5) Portfolio investments may not be representative of the Portfolio’s current or future investments due to active management.
The views expressed throughout this report are those of the portfolio managers and are current only through the end of the period of the report as stated on the cover. These views are subject to change at any time based upon market or other conditions, and the investment adviser disclaims any responsibility to update such views. These views may not be relied on as investment advice and, because investment decisions for a fund are based on many factors, may not be relied on as an indication of trading intent on behalf of any Eaton Vance fund.
Past performance is no guarantee of future results. Returns are historical and are calculated by determining the percentage change in net asset value or offering price (as applicable) with all distributions reinvested. Investment return and principal value will fluctuate so that shares, when redeemed, may be worth more or less than their original cost. Performance is for the stated time period only; due to market volatility, the Fund’s current performance may be lower or higher than the quoted return. For performance as of the most recent month-end, please refer to www.eatonvance.com.
Fund shares are not insured by the FDIC and are not deposits or other obligations of, or guaranteed by, any depository institution. Shares are subject to investment risks, including possible loss of principal invested.
1
Eaton Vance High Income Fund as of October 31, 2006
FUND PERFORMANCE
The line graph and table set forth below provide information about the Fund’s performance. The line graph compares the performance of Class B of the Fund with that of the Merrill Lynch U.S. High Yield Master II Index, an unmanaged market index of below investment grade U.S. dollar-denominated corporate bonds publicly issued in the U.S. domestic market. The lines on the graph represent the total returns of a hypothetical investment of $10,000 in each of Class B of the Fund and the Merrill Lynch U.S. High Yield Master II Index. The table includes the total returns of each Class of the Fund at net asset value and public offering price. The performance presented below does not reflect the deduction of taxes, if any, that a shareholder would pay on Fund distributions or the redemption of Fund shares.
Performance(1) | | Class A | | Class B | | Class C | |
| | | | | | | |
Average Annual Total Returns (at net asset value) | | | | | | | |
One Year | | 11.04 | % | 10.41 | % | 10.41 | % |
Five Years | | N.A. | | 10.33 | | 10.30 | |
Ten Years | | N.A. | | 6.06 | | 6.01 | |
Life of Fund† | | 8.43 | | 7.51 | | 6.55 | |
| | | | | | | |
SEC Average Annual Total Returns (including sales charge or applicable CDSC) | | | | | | | |
One Year | | 5.86 | % | 5.41 | % | 9.41 | % |
Five Years | | N.A. | | 10.06 | | 10.30 | |
Ten Years | | N.A. | | 6.06 | | 6.01 | |
Life of Fund† | | 6.46 | | 7.51 | | 6.55 | |
† | | Inception dates: Class A: 3/11/04; Class B: 8/19/86; Class C: 6/8/94 |
| | |
(1) | | Average annual total returns do not include the 4.75% maximum sales charge for Class A shares or the applicable contingent deferred sales charges (CDSC) for Class B or Class C shares. If sales charges were deducted, returns would be lower. SEC returns for Class A reflect the maximum 4.75% sales charge. SEC returns for Class B reflect applicable CDSC based on the following schedule: 5% - 1st and 2nd years; 4% - 3rd year; 3% - 4th year; 2% - 5th year; 1% - 6th year. SEC 1-Year return for Class C reflects 1% CDSC. Class A shares are subject to a 1% redemption fee if redeemed or exchanged within 90 days of the settlement of the purchase. |
Past performance is no guarantee of future results. Returns are historical and are calculated by determining the percentage change in net asset value or offering price (as applicable) with all distributions reinvested. Investment return and principal value will fluctuate so that shares, when redeemed, may be worth more or less than their original cost. Performance is for the stated time period only; due to market volatility, the Fund’s current performance may be lower or higher than the quoted return. For performance as of the most recent month end, please refer to www.eatonvance.com. .
Comparison of Change in Value of a $10,000 Investment in Eaton Vance High Income Fund Class B vs. the Merrill Lynch U.S. High Yield Master II Index*
October 31, 1996 – October 31, 2006

* Sources: Thomson Financial; Bloomberg, L.P. Class B of the Fund commenced operations on 8/19/86.
A $10,000 hypothetical investment at net asset value in Class A on 3/11/04 and Class C on 10/31/96 of the Fund would have been valued at $12,384 and $17,928, respectively, on 10/31/06. A $10,000 hypothetical investment in Class A shares of the Fund at maximum offering price would have been valued at $11,797. It is not possible to invest directly in an Index. The Index’s total return does not reflect commissions or expenses that would have been incurred if an investor individually purchased or sold the securities represented in the Index.
Portfolio Credit Quality Ratings(2)
By total investments
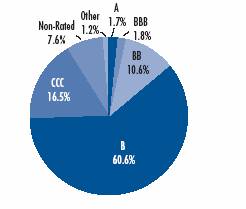
(2) Credit Quality ratings are those provided by Standard & Poor’s, a nationally recognized bond rating service. As a percentage of the Portfolio’s total investments as of October 31, 2006. Portfolio information may not be representative of the Portfolio’s current or future investments and may change due to active management.
2
Eaton Vance High Income Fund as of October 31, 2006
FUND EXPENSES
Example: As a shareholder of the Fund, you incur two types of costs: (1) transaction costs, including sales charges (loads) on purchases and redemption fees (if applicable); and (2) ongoing costs, including management fees; distribution or service fees; and other Fund expenses. This Example is intended to help you understand your ongoing costs (in dollars) of investing in the Fund and to compare these costs with the ongoing costs of investing in other mutual funds. The Example is based on an investment of $1,000 invested at the beginning of the period and held for the entire period (May 1, 2006 – October 31, 2006).
Actual Expenses: The first section of the table below provides information about actual account values and actual expenses. You may use the information in this section, together with the amount you invested, to estimate the expenses that you paid over the period. Simply divide your account value by $1,000 (for example, an $8,600 account value divided by $1,000 = 8.6), then multiply the result by the number in the first section under the heading entitled "Expenses Paid During Period" to estimate the expenses you paid on your account during this period.
Hypothetical Example for Comparison Purposes: The second section of the table below provides information about hypothetical account values and hypothetical expenses based on the Fund's actual expense ratio and an assumed rate of return of 5% per year (before expenses), which is not the actual return of the Fund. The hypothetical account values and expenses may not be used to estimate the actual ending account balance or expenses you paid for the period. You may use this information to compare the ongoing costs of investing in your Fund and other funds. To do so, compare this 5% hypothetical example with the 5% hypothetical examples that appear in the shareholder reports of the other funds.
Please note that the expenses shown in the table are meant to highlight your ongoing costs only and do not reflect any transactional costs, such as sales charges (loads) or redemption fees (if applicable). Therefore, the second section of the table is useful in comparing ongoing costs only, and will not help you determine the relative total costs of owning different funds. In addition, if these transactional costs were included, your costs would have been higher.
Eaton Vance High Income Fund
| | | Beginning Account Value
(5/1/06) | | Ending Account Value
(10/31/06) | | Expenses Paid During Period*
(5/1/06 – 10/31/06) | |
| Actual | |
| Class A | | $ | 1,000.00 | | | $ | 1,044.90 | | | $ | 4.95 | | |
| Class B | | $ | 1,000.00 | | | $ | 1,042.80 | | | $ | 8.80 | | |
| Class C | | $ | 1,000.00 | | | $ | 1,042.80 | | | $ | 8.80 | | |
| Hypothetical | |
| (5% return per year before expenses) | |
| Class A | | $ | 1,000.00 | | | $ | 1,020.40 | | | $ | 4.89 | | |
| Class B | | $ | 1,000.00 | | | $ | 1,016.60 | | | $ | 8.69 | | |
| Class C | | $ | 1,000.00 | | | $ | 1,016.60 | | | $ | 8.69 | | |
* Expenses are equal to the Fund's annualized expense ratio of 0.96% for Class A shares, 1.71% for Class B shares and 1.71% for Class C shares, multiplied by the average account value over the period, multiplied by 184/365 ( to reflect the one-half-year period). The example assumes that the $1,000 was invested at the net asset value per share determined at the close of business on April 30, 2006. The Example reflects the expenses of both the Fund and the Portfolio.
3
Eaton Vance High Income Fund as of October 31, 2006
FINANCIAL STATEMENTS
Statement of Assets and Liabilities
As of October 31, 2006
| Assets | |
Investment in High Income Portfolio, at value
(identified cost, $652,434,363) | | $ | 680,759,456 | | |
| Receivable for Fund shares sold | | | 1,235,308 | | |
| Total assets | | $ | 681,994,764 | | |
| Liabilities | |
| Dividends payable | | $ | 2,484,246 | | |
| Payable for Fund shares redeemed | | | 1,355,840 | | |
| Payable to affiliate for distribution and service fees | | | 447,020 | | |
| Payable to affiliate for Trustees' fees | | | 282 | | |
| Accrued expenses | | | 177,271 | | |
| Total liabilities | | $ | 4,464,659 | | |
| Net Assets | | $ | 677,530,105 | | |
| Sources of Net Assets | |
| Paid-in capital | | $ | 1,042,392,009 | | |
Accumulated net realized loss from Portfolio (computed on
the basis of identified cost) | | | (390,702,751 | ) | |
| Accumulated distributions in excess of net investment income | | | (2,484,246 | ) | |
Net unrealized appreciation from Portfolio (computed on the basis of
identified cost) | | | 28,325,093 | | |
| Total | | $ | 677,530,105 | | |
| Class A Shares | |
| Net Assets | | $ | 199,811,765 | | |
| Shares Outstanding | | | 38,190,220 | | |
Net Asset Value and Redemption Price Per Share
(net assets ÷ shares of beneficial interest outstanding) | | $ | 5.23 | | |
Maximum Offering Price Per Share
(100 ÷ 95.25 of $5.23) | | $ | 5.49 | | |
| Class B Shares | |
| Net Assets | | $ | 305,518,651 | | |
| Shares Outstanding | | | 58,540,106 | | |
Net Asset Value, Offering Price and Redemption Price Per Share
(net assets ÷ shares of beneficial interest outstanding) | | $ | 5.22 | | |
| Class C Shares | |
| Net Assets | | $ | 172,199,689 | | |
| Shares Outstanding | | | 33,001,610 | | |
Net Asset Value, Offering Price and Redemption Price Per Share
(net assets ÷ shares of beneficial interest outstanding) | | $ | 5.22 | | |
| On sales of $25,000 or more, the offering price of Class A shares is reduced. | |
Statement of Operations
For the Year Ended
October 31, 2006
| Investment Income | |
| Interest allocated from Portfolio | | $ | 58,508,030 | | |
| Dividends allocated from Portfolio | | | 510,490 | | |
| Miscellaneous income allocated from Portfolio | | | 1,292,915 | | |
| Expenses allocated from Portfolio | | | (4,061,937 | ) | |
| Net investment income from Portfolio | | $ | 56,249,498 | | |
| Expenses | |
| Trustees' fees and expenses | | $ | 3,422 | | |
Distribution and service fees
Class A | | | 442,210 | | |
| Class B | | | 3,361,028 | | |
| Class C | | | 1,753,025 | | |
| Transfer and dividend disbursing agent fees | | | 636,850 | | |
| Printing and postage | | | 100,789 | | |
| Registration fees | | | 66,788 | | |
| Custodian fee | | | 35,658 | | |
| Legal and accounting services | | | 35,528 | | |
| Miscellaneous | | | 3,871 | | |
| Total expenses | | $ | 6,439,169 | | |
| Net investment income | | $ | 49,810,329 | | |
| Realized and Unrealized Gain (Loss) from Portfolio | |
Net realized gain —
Investment transactions (identified cost basis) | | $ | 16,304,968 | | |
| Swap contracts | | | 204,590 | | |
Foreign currency and forward foreign currency exchange
contract transactions | | | 14,905 | | |
| Net realized gain | | $ | 16,524,463 | | |
Change in unrealized appreciation (depreciation) —
Investments (identified cost basis) | | $ | 3,227,387 | | |
| Swap contracts | | | (116,047 | ) | |
| Foreign currency and forward foreign currency exchange contracts | | | 34,024 | | |
| Net change in unrealized appreciation (depreciation) | | $ | 3,145,364 | | |
| Net realized and unrealized gain | | $ | 19,669,827 | | |
| Net increase in net assets from operations | | $ | 69,480,156 | | |
See notes to financial statements
4
Eaton Vance High Income Fund as of October 31, 2006
FINANCIAL STATEMENTS CONT'D
Statements of Changes in Net Assets
Increase (Decrease)
in Net Assets | | Year Ended
October 31, 2006 | | Year Ended
October 31, 2005 | |
From operations —
Net investment income | | $ | 49,810,329 | | | $ | 57,060,141 | | |
Net realized gain from investments, swap
contracts, foreign currency and
forward foreign currency
exchange contract transactions | | | 16,524,463 | | | | 18,266,672 | | |
Net change in unrealized appreciation
(depreciation) from investments,
swap contracts, foreign currency and
forward foreign currency
exchange contracts | | | 3,145,364 | | | | (32,814,917 | ) | |
| Net increase in net assets from operations | | $ | 69,480,156 | | | $ | 42,511,896 | | |
Distributions to shareholders —
From net investment income
Class A | | $ | (14,147,508 | ) | | $ | (12,730,268 | ) | |
| Class B | | | (24,307,320 | ) | | | (30,883,089 | ) | |
| Class C | | | (12,679,760 | ) | | | (15,750,677 | ) | |
| Total distributions to shareholders | | $ | (51,134,588 | ) | | $ | (59,364,034 | ) | |
Transactions in shares of beneficial interest —
Proceeds from sale of shares
Class A | | $ | 33,549,505 | | | $ | 26,164,140 | | |
| Class B | | | 16,275,549 | | | | 23,213,445 | | |
| Class C | | | 27,908,844 | | | | 32,396,910 | | |
Net asset value of shares issued to
shareholders in payment of
distributions declared
Class A | | | 5,740,369 | | | | 5,227,870 | | |
| Class B | | | 10,193,029 | | | | 13,457,467 | | |
| Class C | | | 5,185,071 | | | | 6,751,299 | | |
Cost of shares redeemed
Class A | | | (30,098,777 | ) | | | (33,057,651 | ) | |
| Class B | | | (79,092,598 | ) | | | (112,454,552 | ) | |
| Class C | | | (54,096,757 | ) | | | (85,450,104 | ) | |
Net asset value of shares exchanged
Class A | | | 20,770,613 | | | | 20,572,317 | | |
| Class B | | | (20,770,613 | ) | | | (20,572,317 | ) | |
| Redemption Fees | | | 4,435 | | | | 8,009 | | |
Net decrease in net assets from
Fund share transactions | | $ | (64,431,330 | ) | | $ | (123,743,167 | ) | |
| Net decrease in net assets | | $ | (46,085,762 | ) | | $ | (140,595,305 | ) | |
| Net Assets | |
| At beginning of year | | $ | 723,615,867 | | | $ | 864,211,172 | | |
| At end of year | | $ | 677,530,105 | | | $ | 723,615,867 | | |
Accumulated distributions
in excess of net investment
income included in net assets | |
| At end of year | | $ | (2,484,246 | ) | | $ | (2,716,717 | ) | |
See notes to financial statements
5
Eaton Vance High Income Fund as of October 31, 2006
FINANCIAL STATEMENTS CONT'D
Financial Highlights
| | | Class A | |
| | | Year Ended October 31, | |
| | | 2006(1) | | 2005(1) | | 2004(1)(2) | |
| Net asset value — Beginning of year | | $ | 5.100 | | | $ | 5.210 | | | $ | 5.230 | | |
| Income (loss) from operations | |
| Net investment income | | $ | 0.401 | | | $ | 0.402 | | | $ | 0.262 | | |
| Net realized and unrealized gain (loss) | | | 0.142 | | | | (0.095 | ) | | | (0.001 | ) | |
| Total income from operations | | $ | 0.543 | | | $ | 0.307 | | | $ | 0.261 | | |
| Less distributions | |
| From net investment income | | $ | (0.413 | ) | | $ | (0.417 | ) | | $ | (0.281 | ) | |
| Total distributions | | $ | (0.413 | ) | | $ | (0.417 | ) | | $ | (0.281 | ) | |
| Redemption fees | | $ | 0.000 | (3) | | $ | 0.000 | (3) | | $ | 0.000 | (3) | |
| Net asset value — End of period | | $ | 5.230 | | | $ | 5.100 | | | $ | 5.210 | | |
| Total Return(4) | | | 11.04 | % | | | 6.01 | % | | | 5.20 | % | |
| Ratios/Supplemental Data | |
| Net assets, end of year (000's omitted) | | $ | 199,812 | | | $ | 165,125 | | | $ | 150,042 | | |
| Ratios (As a percentage of average daily net assets): | |
| Expenses before custodian fee reduction(5) | | | 0.97 | % | | | 0.97 | % | | | 0.96 | %(6) | |
| Expenses after custodian fee reduction(5) | | | 0.97 | % | | | 0.97 | % | | | 0.96 | %(6) | |
| Net investment income | | | 7.77 | % | | | 7.70 | % | | | 7.98 | %(6) | |
| Portfolio Turnover of the Portfolio | | | 62 | % | | | 62 | % | | | 80 | % | |
(1) Net investment income per share was computed using average shares outstanding.
(2) For the period from the commencement of offering of Class A shares, March 11, 2004, to October 31, 2004.
(3) Amounts represent less than $0.0005.
(4) Returns are historical and are calculated by determining the percentage change in net asset value with all distributions reinvested.
Total return is not computed on an annualized basis.
(5) Includes the Fund's share of the Portfolio's allocated expenses.
(6) Annualized.
See notes to financial statements
6
Eaton Vance High Income Fund as of October 31, 2006
FINANCIAL STATEMENTS CONT'D
Financial Highlights
| | | Class B | |
| | | Year Ended October 31, | |
| | | 2006(1) | | 2005(1) | | 2004(1) | | 2003 | | 2002(2) | |
| Net asset value — Beginning of year | | $ | 5.080 | | | $ | 5.200 | | | $ | 5.050 | | | $ | 4.150 | | | $ | 4.860 | | |
| Income (loss) from operations | |
| Net investment income | | $ | 0.363 | | | $ | 0.363 | | | $ | 0.392 | | | $ | 0.416 | | | $ | 0.431 | | |
| Net realized and unrealized gain (loss) | | | 0.149 | | | | (0.106 | ) | | | 0.169 | | | | 0.904 | | | | (0.672 | ) | |
| Total income (loss) from operations | | $ | 0.512 | | | $ | 0.257 | | | $ | 0.561 | | | $ | 1.320 | | | $ | (0.241 | ) | |
| Less distributions | |
| From net investment income | | $ | (0.372 | ) | | $ | (0.377 | ) | | $ | (0.411 | ) | | $ | (0.420 | ) | | $ | (0.429 | ) | |
| From tax return of capital | | | — | | | | — | | | | — | | | | — | | | | (0.040 | ) | |
| Total distributions | | $ | (0.372 | ) | | $ | (0.377 | ) | | $ | (0.411 | ) | | $ | (0.420 | ) | | $ | (0.469 | ) | |
| Redemption fees | | $ | 0.000 | (3) | | $ | 0.000 | (3) | | $ | 0.000 | (3) | | $ | — | | | $ | — | | |
| Net asset value — End of year | | $ | 5.220 | | | $ | 5.080 | | | $ | 5.200 | | | $ | 5.050 | | | $ | 4.150 | | |
| Total Return(4) | | | 10.41 | % | | | 5.34 | %(5) | | | 11.55 | % | | | 33.26 | % | | | (5.46 | )% | |
| Ratios/Supplemental Data | |
| Net assets, end of year (000's omitted) | | $ | 305,519 | | | $ | 370,036 | | | $ | 474,861 | | | $ | 662,381 | | | $ | 530,326 | | |
| Ratios (As a percentage of average daily net assets): | |
| Expenses before custodian fee reduction(6) | | | 1.72 | % | | | 1.72 | % | | | 1.71 | % | | | 1.80 | % | | | 1.79 | % | |
| Expenses after custodian fee reduction(6) | | | 1.72 | % | | | 1.72 | % | | | 1.71 | % | | | 1.80 | % | | | 1.79 | % | |
| Net investment income | | | 7.05 | % | | | 6.95 | % | | | 7.60 | % | | | 8.96 | % | | | 9.30 | % | |
| Portfolio Turnover of the Portfolio | | | 62 | % | | | 62 | % | | | 80 | % | | | 122 | % | | | 88 | % | |
(1) Net investment income per share was computed using average shares outstanding.
(2) The Fund, through its investment in the Portfolio, has adopted the provisions of the revised AICPA Audit and Accounting Guide for Investment Companies and began using the interest method to amortize premiums on fixed-income securities. The effect of this change for the year ended October 31, 2002 was to decrease net investement income per share by $0.010, decrease net realized and unrealized losses per share by $0.010 and decrease the ratio of net investment income to average net assets from 9.52% to 9.30%. Per-share data and ratios for the periods prior to November 1, 2001 have not been restated to reflect this change in presentation.
(3) Amounts represent less than $0.0005.
(4) Returns are historical and are calculated by determining the percentage change in net asset value with all distributions reinvested. Total return is not computed on an annualized basis.
(5) Total return reflects an increase of 0.33% due to a change in the timing of the payment and reinvestment of distributions.
(6) Includes the Fund's share of the Portfolio's allocated expenses.
See notes to financial statements
7
Eaton Vance High Income Fund as of October 31, 2006
FINANCIAL STATEMENTS CONT'D
Financial Highlights
| | | Class C | |
| | | Year Ended October 31, | |
| | | 2006(1)(2) | | 2005(1)(2) | | 2004(1)(2) | | 2003(2) | | 2002(2)(3) | |
| Net asset value — Beginning of year | | $ | 5.080 | | | $ | 5.200 | | | $ | 5.050 | | | $ | 4.150 | | | $ | 4.850 | | |
| Income (loss) from operations | |
| Net investment income | | $ | 0.363 | | | $ | 0.363 | | | $ | 0.389 | | | $ | 0.417 | | | $ | 0.429 | | |
| Net realized and unrealized gain (loss) | | | 0.149 | | | | (0.107 | ) | | | 0.171 | | | | 0.903 | | | | (0.660 | ) | |
| Total income (loss) from operations | | $ | 0.512 | | | $ | 0.256 | | | $ | 0.560 | | | $ | 1.320 | | | $ | (0.231 | ) | |
| Less distributions | |
| From net investment income | | $ | (0.372 | ) | | $ | (0.376 | ) | | $ | (0.410 | ) | | $ | (0.420 | ) | | $ | (0.433 | ) | |
| From tax return of capital | | | — | | | | — | | | | — | | | | — | | | | (0.036 | ) | |
| Total distributions | | $ | (0.372 | ) | | $ | (0.376 | ) | | $ | (0.410 | ) | | $ | (0.420 | ) | | $ | (0.469 | ) | |
| Redemption fees | | | 0.000 | (4) | | $ | 0.000 | (4) | | $ | 0.000 | (4) | | $ | — | | | $ | — | | |
| Net asset value — End of year | | $ | 5.220 | | | $ | 5.080 | | | $ | 5.200 | | | $ | 5.050 | | | $ | 4.150 | | |
| Total Return(5) | | | 10.41 | % | | | 5.32 | %(6) | | | 11.38 | % | | | 33.24 | % | | | (5.37 | )% | |
| Ratios/Supplemental Data | |
| Net assets, end of year (000's omitted) | | $ | 172,200 | | | $ | 188,454 | | | $ | 239,308 | | | $ | 281,103 | | | $ | 195,037 | | |
| Ratios (As a percentage of average daily net assets): | |
| Expenses before custodian fee reduction(7) | | | 1.72 | % | | | 1.72 | % | | | 1.71 | % | | | 1.80 | % | | | 1.79 | % | |
| Expenses after custodian fee reduction(7) | | | 1.72 | % | | | 1.72 | % | | | 1.71 | % | | | 1.80 | % | | | 1.79 | % | |
| Net investment income | | | 7.05 | % | | | 6.96 | % | | | 7.56 | % | | | 8.93 | % | | | 9.28 | % | |
| Portfolio Turnover of the Portfolio | | | 62 | % | | | 62 | % | | | 80 | % | | | 122 | % | | | 88 | % | |
(1) Net investment income per share was computed using average shares outstanding.
(2) Per share data have been restated to reflect the effects of a 1.3204633-for-1 stock split effective on November 11, 2005.
(3) The Fund, through its investment in the Portfolio, has adopted the provisions of the revised AICPA Audit and Accounting Guide for Investment Companies and began using the interest method to amortize premiums on fixed-income securities. The effect of this change for the year ended October 31, 2002 was to decrease net investement income per share by $0.010, decrease net realized and unrealized losses per share by $0.010 and decrease the ratio of net investment income to average net assets from 9.50% to 9.28%. Per-share data and ratios for the periods prior to November 1, 2001 have not been restated to reflect this c hange in presentation.
(4) Amounts represent less than $0.0005.
(5) Returns are historical and are calculated by determining the percentage change in net asset value with all distributions reinvested. Total return is not computed on an annualized basis.
(6) Total return reflects an increase of 0.20% due to a change in the timing of the payment and reinvestment of distributions.
(7) Includes the Fund's share of the Portfolio's allocated expenses.
See notes to financial statements
8
Eaton Vance High Income Fund as of October 31, 2006
NOTES TO FINANCIAL STATEMENTS
1 Significant Accounting Policies
Eaton Vance High Income Fund (the Fund) is a series of Eaton Vance Mutual Funds Trust (the Trust). The Trust is an entity of the type commonly known as a Massachusetts business trust and is registered under the Investment Company Act of 1940, as amended, as an open-end, management investment company. The Fund offers three classes of shares. Class A shares are generally sold subject to a sales charge imposed at time of purchase and assess a redemption fee of 1% for shares redeemed or exchanged within 90 days of the settlement of the purchase. Class B shares and Class C shares are sold at net asset value and are subject to a contingent deferred sales charge (see Note 6). The Trustees have adopted a conversion feature pursuant to which Class B shares of the Fund automatically convert to Class A shares eight years after their purchase as described in the Fund's prospectus. Each class represents a pro rata interest in the Fund, but v otes separately on class-specific matters and (as noted below) is subject to different expenses. Realized and unrealized gains and losses are allocated daily to each class of shares based on the relative net assets of each class to the total net assets of the Fund. Net investment income, other than class specific expenses, is allocated daily to each class of shares based upon the ratio of the value of each class's paid shares to the total value of all paid shares. Each class of shares differs in its distribution plan and certain other class specific expenses. The Fund invests all of its investable assets in interests in the High Income Portfolio (the Portfolio), a New York Trust, having the same investment objective and policies as the Fund. The value of the Fund's investment in the Portfolio reflects the Fund's proportionate interest in the net assets of the Portfolio (62.6% at October 31, 2006). The performance of the Fund is directly affected by the performance of the Portfolio. The financial statements o f the Portfolio, including the portfolio of investments, are included elsewhere in this report and should be read in conjunction with the Fund's financial statements.
The following is a summary of significant accounting policies consistently followed by the Fund in the preparation of its financial statements. The policies are in conformity with accounting principles generally accepted in the United States of America.
A Investment Valuation — Valuation of securities by the Portfolio is discussed in Note 1A of the Portfolio's Notes to Financial Statements, which are included elsewhere in this report.
B Income — The Fund's net investment income or loss consists of the Fund's pro rata share of the net investment income or loss of the Portfolio, less all actual and accrued expenses of the Fund.
C Federal Taxes — The Fund's policy is to comply with the provisions of the Internal Revenue Code applicable to regulated investment companies and to distribute to shareholders, each year, substantially all of its net investment income and all or substantially all of its net realized capital gains. Accordingly, no provision for federal income or excise tax is necessary. At October 31, 2006, the Fund, for federal income tax purposes, had a capital loss carryforward of $385,510,998, which will reduce the Fund's taxable income arising from future net realized gain on investments, if any, to the extent permitted by the Internal Revenue Code and thus will reduce the amount of distributions to shareholders which would otherwise be necessary to relieve the Fund of any liability for federal income or excise tax. Such capital loss carryforward will expire on October 31, 2008 ($6,464,837), October 31, 2009 ($235,765,703), and October 31, 2010 ($143,280,458), respectively. During the year ended October 31, 2006, capital loss carryovers in the amount of $14,398,632 expired or were utilized to offset net realized gains.
D Other — Investment transactions are accounted for on the date the securities are purchased or sold. Dividends to shareholders are recorded on the ex-dividend date.
E Use of Estimates — The preparation of the financial statements in conformity with accounting principles generally accepted in the United States of America requires management to make estimates and assumptions that affect the reported amounts of assets and liabilities at the date of the financial statements and the reported amounts of income and expense during the reporting period. Actual results could differ from those estimates.
F Indemnifications — Under the Trust's organizational documents, its officers and Trustees may be indemnified against certain liabilities and expenses arising out of the performance of their duties to the Fund, and shareholders are indemnified against personal liability for the obligations of the Trust. Additionally, in the normal course of business, the Fund enters into agreements with service providers that may contain indemnification clauses. The Fund's maximum exposure under these arrangements is unknown as this would involve future claims that may be made against the Fund that have not yet occurred.
9
Eaton Vance High Income Fund as of October 31, 2006
NOTES TO FINANCIAL STATEMENTS CONT'D
G Expenses — The majority of expenses of the Trust are directly identifiable to an individual fund. Expenses which are not readily identifiable to a specific fund are allocated taking into consideration, among other things, the nature and type of expense and the relative size of the funds.
H Expense Reduction — Investors Bank & Trust Company (IBT) serves as custodian of the Fund. Pursuant to the custodian agreement, IBT receives a fee reduced by credits which are determined based on the average daily cash balance the Fund maintains with IBT. All credit balances used to reduce the Fund's custodian fees are reported as a reduction of expenses in the Statement of Operations.
I Redemption Fees — Upon the redemption or exchange of shares by Class A shareholders within 90 days of the settlement of the purchase, a fee of 1% of the current net asset value of these shares will be assessed and retained by the Fund for the benefit of the remaining shareholders. The redemption fee is accounted for as an addition to paid-in-capital.
2 Distributions to Shareholders
The net income of the Fund is determined daily and substantially all of the net income so determined is declared as a dividend to shareholders of record at the time of declaration. Such daily dividends are paid monthly. Distributions of realized capital gains, if any, are made at least annually. Shareholders may reinvest capital gain distributions in additional shares of the Fund at the net asset value as of the ex-dividend date. Distributions are paid in the form of additional shares of the Fund or, at the election of the shareholder, in cash. The Fund distinguishes between distributions on a tax basis and a financial reporting basis. Accounting principles generally accepted in the United States of America require that only distributions in excess of tax basis earnings and profits be reported in the financial statements as a return of capital. Permanent differences between book and tax accounting relating to distributions are r eclassified to paid-in capital. These differences relate primarily to the method for amortizing premiums.
The tax character of distributions declared for the years ended October 31, 2006 and October 31, 2005 was as follows:
| | | Year Ended
October 31, 2006 | | Year Ended
October 31, 2005 | |
| Distributions declared from: | |
|
| Ordinary income | | $ | 51,134,588 | | | $ | 59,364,034 | | |
|
During the year ended October 31, 2006, accumulated distributions in excess of paid-in capital was increased by $989,003, distribution in excess of net investment income was decreased by $1,556,730 and accumulated net realized loss was increased by $2,545,733 primarily due to differences between book and tax accounting for foreign currency gain/loss and accounting for swaps. This change had no effect on the net assets or the net asset value per share.
As of October 31, 2006, the components of distributable earnings (accumulated losses) on a tax basis were as follows:
| Capital loss carryforwards | | $ | (385,510,998 | ) | |
| Unrealized appreciation | | $ | 23,133,340 | | |
| Other temporary differences | | $ | (2,484,246 | ) | |
The differences between components of distributable earnings (accumulated loss) on a tax basis and the amounts reflected in the statement of assets and liabilities are primarily due to differences in book and tax policies for wash sales, the timing of recognizing distributions to shareholders, and accounting for swaps.
3 Shares of Beneficial Interest
The Fund's Declaration of Trust permits the Trustees to issue an unlimited number of full and fractional shares of beneficial interest (without par value). Such shares may be issued in a number of different series (such as the Fund) and classes. Transactions in Fund shares were as follows:
| Class A | | Year Ended
October 31, 2006 | | Year Ended
October 31, 2005 | |
| Sales | | | 10,492,618 | | | | 5,007,428 | | |
Issued to shareholders electing to
receive payments of distributions
in Fund shares | | | 1,109,833 | | | | 1,003,044 | | |
| Redemptions | | | (5,808,810 | ) | | | (6,327,933 | ) | |
| Exchange from Class B shares | | | 4,022,524 | | | | 3,929,337 | | |
| Net increase | | | 9,816,165 | | | | 3,611,876 | | |
| Class B | | Year Ended
October 31, 2006 | | Year Ended
October 31, 2005 | |
| Sales | | | 3,159,504 | | | | 4,446,355 | | |
Issued to shareholders electing to
receive payments of distributions
in Fund shares | | | 1,976,003 | | | | 2,584,766 | | |
| Redemptions | | | (19,394,106 | ) | | | (21,621,794 | ) | |
| Exchange to Class A shares | | | (4,029,508 | ) | | | (3,937,314 | ) | |
| Net decrease | | | (18,288,107 | ) | | | (18,527,987 | ) | |
10
Eaton Vance High Income Fund as of October 31, 2006
NOTES TO FINANCIAL STATEMENTS CONT'D
| Class C | | Year Ended
October 31, 2006 | | Year Ended
October 31, 2005(1) | |
| Sales | | | 5,414,798 | | | | 6,223,895 | | |
Issued to shareholders electing to
receive payments of distributions
in Fund shares | | | 1,005,116 | | | | 1,297,087 | | |
| Redemptions | | | (10,502,329 | ) | | | (16,478,015 | ) | |
| Net decrease | | | (4,082,415 | ) | | | (8,957,033 | ) | |
(1) Transactions have been restated to reflect the effects of a 1.3204633-for-1 stock split effective on November 11, 2005.
Redemptions or exchanges of Class A shares made within 90 days of the settlement of the purchase are subject to a redemption fee equal to 1% of the amount redeemed. For the year ended October 31, 2006 the Fund received redemption fees of $4,435 on Class A shares, which was less than $0.001 per share.
4 Transactions with Affiliates
Eaton Vance Management (EVM) serves as the administrator of the Fund, but receives no compensation. The Portfolio has engaged Boston Management and Research (BMR), a subsidiary of EVM, to render investment advisory services. See Note 2 of the Portfolio's Notes to Financial Statements which are included elsewhere in this report. EVM serves as the sub-transfer agent of the Fund and receives from the transfer agent an aggregate fee based upon the actual expenses incurred by EVM in the performance of those services. During the year ended October 31, 2006, EVM earned $37,211 in sub-transfer agent fees. Except as to Trustees of the Fund and the Portfolio who are not members of EVM's or BMR's organization, officers and Trustees receive remuneration for their services to the Fund out of the investment adviser fee earned by BMR. The Fund was informed that Eaton Vance Distributors, Inc. (EVD), a subsidiary of EVM and the Fund's principal underwriter, received $30,723 as its portion of the sales charge on sales of Class A shares for the year ended October 31, 2006.
Certain officers and Trustees of the Fund and of the Portfolio are officers of the above organizations.
5 Distribution Plans
Class A has in effect a distribution plan pursuant to Rule 12b-1 (Class A Plan). The Class A Plan provides that the Fund will pay EVD a distribution and service fee of 0.25% of the Fund's average daily net assets attributable to Class A shares for each fiscal year for distribution services and facilities provided to the Fund by EVD, as well as for personal services and/or the maintenance of shareholder accounts. Distribution and service fees paid or accrued for the year ended October 31, 2006 amounted to $442,210 for Class A shares. The Fund also has in effect distribution plans for Class B shares (Class B Plan) and Class C shares (Class C Plan) pursuant to Rule 12b-1 under the Investment Company Act of 1940. The Class B and Class C Plans require the Fund to pay EVD amounts equal to 1/365 of 0.75% of the Fund's average daily net assets attributable to Class B and Class C shares for providing ongoing distribution services and facilities to the Fund. The Fund will automatically discontinue payments to EVD during any period in which there are no outstanding Uncovered Distribution Charges, which are equivalent to the sum of (i) 5% and 6.25% of the aggregate amount received by the Fund for the Class B and Class C shares sold, respectively, plus (ii) interest calculated by applying the rate of 1% over the prevailing prime rate to the outstanding balance of Uncovered Distribution Charges of EVD of each respective class, reduced by the aggregate amount of contingent deferred sales charges (see Note 6) and daily amounts theretofore paid to EVD by each respective class. The Fund paid or accrued $2,520,771 and $1,314,769 for Class B and Class C shares, respectively, to or payable to EVD for the year ended October 31, 2006, representing 0.75% of the average daily net assets for Class B and Class C shares. At October 31, 2006, the amount of Uncovered Distribution Charges of EVD calculated under the Plans was approximately $22,227,309 and $39,633,792 for Class B and Class C shares, respectively. The Class B and Class C Plans also authorize the Fund to make payments of service fees to EVD, investment dealers and other persons in amounts not exceeding 0.25% annually of the average daily net assets attributable to that Class. Service fees are paid for personal services and/or the maintenance of shareholder accounts. They are separate and distinct from the Class B and Class C sales commissions and distribution fees and, as such, are not subject to automatic discontinuance when there are no outstanding Uncovered Distribution Charges to EVD. Service fees paid or accrued for the year ended October 31, 2006 amounted to $840,257 and $438,256 for Class B and Class C shares, respectively.
Certain officers and Trustees of the Fund are officers or directors of EVD.
6 Contingent Deferred Sales Charge
Effective September 15, 2006, all purchases of Class A shares of $1 million or more will be subject 1% contingent deferred sales charge (CDSC) in the event of redemptions within 18 months of purchase. Prior to September 15,
11
Eaton Vance High Income Fund as of October 31, 2006
NOTES TO FINANCIAL STATEMENTS CONT'D
2006, Class A sales purchased at net asset value in amounts of $1 million or more (other than shares purchased in a single transaction of $5 million or more) were subject to a 1% CDSC if redeemed within 12 months of purchase. CDSC generally is imposed on redemptions of Class B shares made within six years of purchase and on redemptions of Class C shares made within one year of purchase. Generally, the CDSC is based upon the lower of the net asset value at date of redemption or date of purchase. No charge is levied on shares acquired by reinvestment of dividends or capital gains distributions. The Class B CDSC is imposed at declining rates that begin at 5% in the case of redemptions in the first and second year after purchase, declining one percentage point each subsequent year. Class C shares will be subject to a 1% CDSC if redeemed within one year of purchase. No CDSC is levied on shares which have been sold to EVM or its affil iates or to their respective employees or clients and may be waived under certain other limited conditions. CDSC charges are paid to EVD to reduce the amount of Uncovered Distribution Charges calculated under the Fund's Distribution Plan. CDSC charges received when no Uncovered Distribution Charges exist will be retained by the Fund. EVD received approximately $2,212, $708,295 and $13,663 of CDSC paid by shareholders for Class A, Class B and Class C shares, respectively, for the year ended October 31, 2006.
7 Investment Transactions
Increases and decreases in the Fund's investment in the Portfolio for the year ended October 31, 2006, aggregated $77,250,759 and $200,519,164, respectively.
8 Stock Split
On October 17, 2005, the Trustees of the Fund approved a 1.3204633-for-1 stock split for Class C shares, effective November 11, 2005. The stock split had no impact on the overall value of a shareholder's investment in the Fund.
9 Recently Issued Accounting Pronouncements
In June 2006, the Financial Accounting Standards Board ("FASB") issued FASB Interpretation No. 48, ("FIN 48") "Accounting for Uncertainty in Income Taxes – an interpretation of FASB Statement No. 109". FIN 48 clarifies the accounting for uncertainty in income taxes recognized in accordance with FASB Statement No. 109, "Accounting for Income Taxes." This interpretation prescribes a recognition threshold and measurement attribute for the financial statement recognition and measurement of a tax position taken or expected to be taken in a tax return. It also provides guidance on de-recognition, classification, interest and penalties, accounting in interim periods, disclosure and transition. FIN 48 is effective for fiscal years beginning after December 15, 2006. Management is currently evaluating the impact of applying the various provisions of FIN 48.
In September 2006, the Financial Accounting Standards Board ("FASB") issued Statement of Financial Accounting Standards No. 157, ("FAS 157") "Fair Value Measurements". FAS 157 defines fair value, establishes a framework for measuring fair value in accordance with generally accepted accounting principles and expands disclosure about fair value measurements. FAS 157 is effective for fiscal years beginning after November 15, 2007. Management is currently evaluating the impact the adoption of FAS 157 will have on the Fund's financial statement disclosures.
12
Eaton Vance High Income Fund as of October 31, 2006
REPORT OF INDEPENDENT REGISTERED PUBLIC ACCOUNTING FIRM
To the Trustees of Eaton Vance Mutual Funds Trust and Shareholders of Eaton Vance High Income Fund:
We have audited the accompanying statement of assets and liabilities of Eaton Vance High Income Fund (the Fund) (one of the series of Eaton Vance Mutual Funds Trust) as of October 31, 2006, and the related statements of operations for the year then ended, the statement of changes in net assets for each of the two years in the period then ended, and the financial highlights for each of the five years in the period then ended. These financial statements and financial highlights are the responsibility of the Fund's management. Our responsibility is to express an opinion on these financial statements and financial highlights based on our audits.
We conducted our audits in accordance with standards of the Public Company Accounting Oversight Board (United States). Those standards require that we plan and perform the audits to obtain reasonable assurance about whether the financial statements and financial highlights are free of material misstatement. The Fund is not required to have, nor were we engaged to perform, an audit of its internal control over financial reporting. Our audits included consideration of internal control over financial reporting as a basis for designing audit procedures that are appropriate in the circumstances, but not for the purpose of expressing an opinion on the effectiveness of the Fund's internal control over financial reporting. Accordingly, we express no such opinion. An audit also includes examining, on a test basis, evidence supporting the amounts and disclosures in the financial statements, assessing the accounting principles used and sig nificant estimates made by management, as well as evaluating the overall financial statement presentation. We believe that our audits provide a reasonable basis for our opinion.
In our opinion, the financial statements and financial highlights referred to above present fairly, in all material respects, the financial position of the Eaton Vance High Income Fund at October 31, 2006, the results of its operations for the year then ended, the changes in its net assets for each of the two years in the period then ended, and the financial highlights for each of the five years in the period then ended, in conformity with accounting principles generally accepted in the United States of America.
DELOITTE & TOUCHE LLP
Boston, Massachusetts
December 15, 2006
13
High Income Portfolio as of October 31, 2006
PORTFOLIO OF INVESTMENTS
| Senior, Floating Rate Interests — 5.2%(1) | |
| Security | | Principal
Amount | | Value | |
| Broadcasting — 0.9% | |
Hit Entertainment Inc., Term Loan,
10.83%. Maturing 2/5/13 | | $ | 9,180,000 | | | $ | 9,271,800 | | |
| | | $ | 9,271,800 | | |
| Business Equipment and Services — 1.5% | |
Nielsen Finance, LLC, Term Loan,
8.19%, Maturing 8/9/13 | | $ | 16,000,000 | | | $ | 16,076,256 | | |
| | | $ | 16,076,256 | | |
| Forest Products — 1.6% | |
Georgia Pacific Corp., Term Loan,
8.39%, Maturing 12/23/13 | | $ | 16,800,000 | | | $ | 17,035,586 | | |
| | | $ | 17,035,586 | | |
| Gaming — 0.5% | |
BLB Worldwide Holdings, Term Loan,
9.70%, Maturing 6/30/12 | | $ | 5,410,000 | | | $ | 5,487,769 | | |
| | | $ | 5,487,769 | | |
| Textiles / Apparel — 0.7% | |
Hanesbrands, Inc., Term Loan,
9.65%, Maturing 10/15/07 | | $ | 8,100,000 | | | $ | 8,110,125 | | |
| | | $ | 8,110,125 | | |
Total Senior, Floating Rate Interests
(identified cost $55,440,816) | | | | | | $ | 55,981,536 | | |
| Corporate Bonds & Notes — 87.9% | |
| Security | | Principal
Amount
(000's omitted) | | Value | |
| Aerospace — 0.3% | |
| Argo Tech Corp., Sr. Notes, 9.25%, 6/1/11 | | $ | 2,015 | | | $ | 2,100,637 | | |
DRS Technologies, Inc., Sr. Sub. Notes,
7.625%, 2/1/18 | | | 935 | | | | 960,712 | | |
| | | $ | 3,061,349 | | |
| Air Transportation — 0.2% | |
| Continental Airlines, 7.033%, 6/15/11 | | $ | 2,054 | | | $ | 2,009,555 | | |
| | | $ | 2,009,555 | | |
| Security | | Principal
Amount
(000's omitted) | | Value | |
| Automotive & Auto Parts — 6.2% | |
| Altra Industrial Motion, Inc., 9.00%, 12/1/11 | | $ | 2,675 | | | $ | 2,741,875 | | |
Commercial Vehicle Group, Inc., Sr. Notes,
8.00%, 7/1/13 | | | 1,230 | | | | 1,199,250 | | |
| Ford Motor Credit Co., 6.625%, 6/16/08 | | | 2,270 | | | | 2,227,982 | | |
| Ford Motor Credit Co., 7.375%, 10/28/09 | | | 9,280 | | | | 9,038,813 | | |
| Ford Motor Credit Co., 7.875%, 6/15/10 | | | 4,405 | | | | 4,301,773 | | |
| Ford Motor Credit Co., Sr. Notes, 9.875%, 8/10/11 | | | 8,445 | | | | 8,734,587 | | |
| Ford Motor Credit Co., Variable Rate, 8.466%, 11/2/07 | | | 11,690 | | | | 11,855,250 | | |
| General Motors Acceptance Corp., 5.125%, 5/9/08 | | | 2,325 | | | | 2,284,264 | | |
| General Motors Acceptance Corp., 5.85%, 1/14/09 | | | 1,140 | | | | 1,124,564 | | |
| General Motors Acceptance Corp., 7.00%, 2/1/12 | | | 470 | | | | 473,705 | | |
| General Motors Acceptance Corp., 8.00%, 11/1/31 | | | 10,250 | | | | 11,013,328 | | |
| Tenneco Automotive, Inc., Series B, 10.25%, 7/15/13 | | | 4,960 | | | | 5,456,000 | | |
Tenneco Automotive, Inc., Sr. Sub. Notes,
8.625%, 11/15/14 | | | 2,965 | | | | 3,002,062 | | |
TRW Automotive, Inc., Sr. Sub. Notes,
11.00%, 2/15/13 | | | 2,142 | | | | 2,361,555 | | |
United Components, Inc., Sr. Sub. Notes,
9.375%, 6/15/13 | | | 1,670 | | | | 1,695,050 | | |
| Venture Holding Trust, Sr. Notes, 9.50%, 2/1/07(2) | | | 3,811 | | | | 19,055 | | |
| | | $ | 67,529,113 | | |
| Broadcasting — 1.7% | |
Rainbow National Services, LLC, Sr. Notes,
8.75%, 9/1/12(3) | | $ | 2,200 | | | $ | 2,323,750 | | |
Rainbow National Services, LLC, Sr. Sub. Debs.,
10.375%, 9/1/14(3) | | | 7,400 | | | | 8,269,500 | | |
| Sinclair Broadcast, 4.875%, 7/15/18 | | | 1,275 | | | | 1,157,062 | | |
| Sirius Satellite Radio, Sr. Notes, 9.625%, 8/1/13 | | | 6,180 | | | | 6,056,400 | | |
| XM Satellite Radio, Inc., 9.75%, 5/1/14 | | | 435 | | | | 415,425 | | |
| | | $ | 18,222,137 | | |
| Brokers / Dealers / Investment Houses — 0.5% | |
Residential Capital Corp., Sub. Notes, Variable Rate,
7.204%, 4/17/09(3) | | $ | 5,710 | | | $ | 5,723,544 | | |
| | | $ | 5,723,544 | | |
| Building and Development — 0.5% | |
Mueller Group, Inc., Sr. Sub. Notes,
10.00%, 5/1/12 | | $ | 1,745 | | | $ | 1,910,775 | | |
Mueller Holdings, Inc., Disc. Notes, 14.75%,
(0.00% until 2009), 4/15/14 | | | 2,643 | | | | 2,339,055 | | |
| Stanley-Martin Co., 9.75%, 8/15/15 | | | 955 | | | | 761,612 | | |
| | | $ | 5,011,442 | | |
See notes to financial statements
14
High Income Portfolio as of October 31, 2006
PORTFOLIO OF INVESTMENTS CONT'D
| Security | | Principal
Amount
(000's omitted) | | Value | |
| Building Materials — 3.2% | |
| General Cable Corp., Sr. Notes, 9.50%, 11/15/10 | | $ | 2,745 | | | $ | 2,937,150 | | |
Goodman Global Holdings, Inc., Sr. Notes,
Variable Rate, 8.329%, 6/15/12 | | | 3,749 | | | | 3,814,607 | | |
| Interface, Inc., Sr. Sub. Notes, 9.50%, 2/1/14 | | | 745 | | | | 776,662 | | |
Interline Brands, Inc., Sr. Sub. Notes,
8.125%, 6/15/14 | | | 1,555 | | | | 1,597,762 | | |
Masonite Corp., Sr. Sub. Notes,
11.00%, 4/6/15(3) | | | 3,500 | | | | 3,167,500 | | |
| Nortek, Inc., Sr. Sub. Notes, 8.50%, 9/1/14 | | | 10,505 | | | | 10,084,800 | | |
Panolam Industries International, Sr. Sub. Notes,
10.75%, 10/1/13(3) | | | 3,735 | | | | 3,828,375 | | |
RMCC Acquisition Co., Sr. Sub. Notes,
10.00%, 11/1/12(3) | | | 8,095 | | | | 8,418,800 | | |
| | | $ | 34,625,656 | | |
| Business Equipment and Services — 0.3% | |
| Affinion Group, Inc., 10.125%, 10/15/13 | | $ | 1,125 | | | $ | 1,198,125 | | |
| Affinion Group, Inc., 11.50%, 10/15/15 | | | 1,580 | | | | 1,655,050 | | |
| | | $ | 2,853,175 | | |
| Cable / Satellite TV — 4.4% | |
Adelphia Communications, Sr. Notes,
10.25%, 11/1/06(2) | | $ | 3,555 | | | $ | 2,755,125 | | |
Adelphia Communications, Sr. Notes, Series B,
9.25%, 10/1/32(2) | | | 7,585 | | | | 5,878,375 | | |
Cablevision Systems Corp., Sr. Notes, Series B,
Variable Rate, 9.87%, 4/1/09 | | | 4,810 | | | | 5,062,525 | | |
| CCH I, LLC/CCH I Capital Co., 11.00%, 10/1/15 | | | 1,080 | | | | 1,046,250 | | |
CCO Holdings, LLC / CCO Capital Corp., Sr. Notes,
8.75%, 11/15/13 | | | 5,240 | | | | 5,357,900 | | |
| CSC Holdings, Inc., Series B, 8.125%, 8/15/09 | | | 1,505 | | | | 1,559,556 | | |
| CSC Holdings, Inc., Sr. Notes, 7.875%, 12/15/07 | | | 15 | | | | 15,244 | | |
| CSC Holdings, Inc., Sr. Notes, 8.125%, 7/15/09 | | | 245 | | | | 253,881 | | |
CSC Holdings, Inc., Sr. Notes, Series B,
7.625%, 4/1/11 | | | 205 | | | | 207,819 | | |
Insight Communications, Sr. Disc. Notes,
12.25%, 2/15/11 | | | 16,840 | | | | 17,808,300 | | |
| Kabel Deutschland GMBH, 10.625%, 7/1/14(3) | | | 3,065 | | | | 3,329,356 | | |
Mediacom Broadband Corp., LLC, Sr. Notes, 8.50%,
10/15/15(3) | | | 2,820 | | | | 2,830,575 | | |
| National Cable, PLC, 8.75%, 4/15/14 | | | 1,570 | | | | 1,658,312 | | |
| | | $ | 47,763,218 | | |
| Security | | Principal
Amount
(000's omitted) | | Value | |
| Chemicals — 4.4% | |
BCP Crystal Holdings Corp., Sr. Sub. Notes,
9.625%, 6/15/14 | | $ | 3,783 | | | $ | 4,170,757 | | |
Crystal US Holdings / US Holdings 3, LLC,
Sr. Disc. Notes, Series B, 10.50%,
(0.00% until 2009) 10/1/14 | | | 3,465 | | | | 2,927,925 | | |
| Equistar Chemical, Sr. Notes, 10.625%, 5/1/11 | | | 5,205 | | | | 5,595,375 | | |
| IMC Global, Inc., Sr. Notes, 10.875%, 8/1/13 | | | 6,000 | | | | 6,862,500 | | |
| Ineos Group Holdings PLC, 8.50%, 2/15/16(3) | | | 6,335 | | | | 6,129,112 | | |
| Koppers, Inc., 9.875%, 10/15/13 | | | 41 | | | | 44,485 | | |
| Lyondell Chemical Co., 11.125%, 7/15/12 | | | 1,170 | | | | 1,272,375 | | |
Nova Chemicals Corp., Senior Notes,
Variable Rate, 8.405%, 11/15/13 | | | 2,325 | | | | 2,377,312 | | |
| OM Group, Inc., 9.25%, 12/15/11 | | | 10,260 | | | | 10,747,350 | | |
| Polyone Corp., Sr. Notes, 8.875%, 5/1/12 | | | 730 | | | | 744,600 | | |
| Polyone Corp., Sr. Notes, 10.625%, 5/15/10 | | | 3,665 | | | | 3,949,037 | | |
| Reichhold Industries, Inc., Sr. Notes, 9.00%, 8/15/14(3) | | | 1,545 | | | | 1,545,000 | | |
Rockwood Specialties Group, Sr. Sub. Notes,
10.625%, 5/15/11 | | | 1,505 | | | | 1,621,637 | | |
| | | $ | 47,987,465 | | |
| Conglomerates — 0.8% | |
Amsted Industries, Inc., Sr. Notes,
10.25%, 10/15/11(3) | | $ | 7,765 | | | $ | 8,386,200 | | |
| | | $ | 8,386,200 | | |
| Containers — 1.1% | |
| Berry Plastics Holding Corp., 8.875%, 9/15/14(3) | | $ | 1,740 | | | $ | 1,766,100 | | |
Berry Plastics Holding Corp., Variable Rate,
9.265%, 9/15/14(3) | | | 1,310 | | | | 1,331,287 | | |
Intertape Polymer US, Inc., Sr. Sub. Notes,
8.50%, 8/1/14 | | | 3,855 | | | | 3,488,775 | | |
| Pliant Corp. (PIK), 11.85%, 6/15/09 | | | 5,115 | | | | 5,581,545 | | |
| | | $ | 12,167,707 | | |
| Cosmetics / Toiletries — 0.2% | |
Jafra Cosmetics/Distribution, Sr. Sub. Notes,
10.75%, 5/15/11 | | $ | 1,260 | | | $ | 1,359,225 | | |
| Samsonite Corp., Sr. Sub. Notes, 8.875%, 6/1/11 | | | 1,305 | | | | 1,373,512 | | |
| | | $ | 2,732,737 | | |
| Ecological Services and Equipment — 0.5% | |
Waste Services, Inc., Sr. Sub. Notes,
9.50%, 4/15/14 | | $ | 5,390 | | | $ | 5,551,700 | | |
| | | $ | 5,551,700 | | |
See notes to financial statements
15
High Income Portfolio as of October 31, 2006
PORTFOLIO OF INVESTMENTS CONT'D
| Security | | Principal
Amount
(000's omitted) | | Value | |
| Energy — 6.6% | |
Allis-Chalmers Energy, Inc., Sr. Notes,
9.00%, 1/15/14(3) | | $ | 5,210 | | | $ | 5,223,025 | | |
Clayton Williams Energy, Inc., Sr. Notes,
7.75%, 8/1/13 | | | 1,450 | | | | 1,344,875 | | |
| Copano Energy, LLC, Sr. Notes, 8.125%, 3/1/16 | | | 805 | | | | 823,112 | | |
| El Paso Corp., Sr. Notes, 9.625%, 5/15/12 | | | 2,880 | | | | 3,211,200 | | |
| El Paso Production Holding Co., 7.75%, 6/1/13 | | | 630 | | | | 648,900 | | |
| Encore Acquisition Co., Sr. Sub. Notes, 7.25%, 12/1/17 | | | 1,870 | | | | 1,809,225 | | |
| Giant Industries, 8.00%, 5/15/14 | | | 2,845 | | | | 3,093,937 | | |
| Inergy L.P. / Finance, Sr. Notes, 6.875%, 12/15/14 | | | 4,700 | | | | 4,570,750 | | |
| Kinder Morgan Finance Co., 5.35%, 1/5/11 | | | 3,325 | | | | 3,250,390 | | |
| Northwest Pipeline Corp., 8.125%, 3/1/10 | | | 825 | | | | 858,000 | | |
| Ocean Rig Norway AS, Sr. Notes, 8.375%, 7/1/13(3) | | | 2,315 | | | | 2,451,006 | | |
| Parker Drilling Co., Sr. Notes, 9.625%, 10/1/13 | | | 665 | | | | 726,512 | | |
| Petrobras International Finance Co., 7.75%, 9/15/14 | | | 670 | | | | 746,045 | | |
Petrohawk Energy Corp., Sr. Notes,
9.125%, 7/15/13(3) | | | 9,200 | | | | 9,430,000 | | |
| Premcor Refining Group, Sr. Notes, 9.50%, 2/1/13 | | | 5,035 | | | | 5,471,212 | | |
| Quicksilver Resources, Inc., 7.125%, 4/1/16 | | | 2,445 | | | | 2,322,750 | | |
| Ram Energy, Inc., Sr. Notes, 11.50%, 2/15/08 | | | 4,602 | | | | 4,763,070 | | |
| Semgroup L.P., Sr. Notes, 8.75%, 11/15/15(3) | | | 6,330 | | | | 6,409,125 | | |
| Sesi, LLC, Sr. Notes, 6.875%, 6/1/14(3) | | | 700 | | | | 698,250 | | |
| Southern Natural Gas, 8.875%, 3/15/10 | | | 1,200 | | | | 1,266,592 | | |
Stewart & Stevenson, LLC, Sr. Notes,
10.00%, 7/15/14(3) | | | 2,205 | | | | 2,243,587 | | |
| United Refining Co., Sr. Notes, 10.50%, 8/15/12 | | | 5,960 | | | | 6,228,200 | | |
| VeraSun Energy Corp., 9.875%, 12/15/12(3) | | | 3,555 | | | | 3,750,525 | | |
| | | $ | 71,340,288 | | |
| Entertainment / Film — 1.1% | |
AMC Entertainment, Inc., Sr. Sub. Notes,
9.875%, 2/1/12 | | $ | 5,070 | | | $ | 5,266,462 | | |
AMC Entertainment, Inc., Variable Rate,
9.655%, 8/15/10 | | | 695 | | | | 721,062 | | |
Marquee Holdings, Inc., Sr. Disc. Notes,
12.00%, (0.00% until 2009) 8/15/14 | | | 7,210 | | | | 5,677,875 | | |
| | | $ | 11,665,399 | | |
| Food & Drug Retail — 1.3% | |
| Rite Aid Corp., 6.125%, 12/15/08(3) | | $ | 10,300 | | | $ | 10,094,000 | | |
| Rite Aid Corp., 8.125%, 5/1/10 | | | 3,495 | | | | 3,547,425 | | |
| | | $ | 13,641,425 | | |
| Security | | Principal
Amount
(000's omitted) | | Value | |
| Food Products — 0.1% | |
Nutro Products, Inc., Sr. Notes, Variable Rate,
9.40%, 10/15/13(3) | | $ | 915 | | | $ | 944,737 | | |
| | | $ | 944,737 | | |
| Food Service — 0.9% | |
| Buffets, Inc., 12.50%, 11/1/14(3) | | $ | 2,595 | | | $ | 2,620,950 | | |
| EPL Finance Corp., Sr. Notes, 11.75%, 11/15/13(3) | | | 3,020 | | | | 3,231,400 | | |
NPC International, Inc., Sr. Sub. Notes,
9.50%, 5/1/14(3) | | | 4,045 | | | | 4,115,787 | | |
| | | $ | 9,968,137 | | |
| Food / Beverage / Tobacco — 1.4% | |
ASG Consolidated, LLC / ASG Finance, Inc.,
Sr. Disc. Notes, 11.50%,
(0.00% until 2008) 11/1/11 | | $ | 6,270 | | | $ | 5,501,925 | | |
| Pierre Foods, Inc., Sr. Sub. Notes, 9.875%, 7/15/12 | | | 3,900 | | | | 3,997,500 | | |
Pinnacle Foods Holdings Corp., Sr. Sub. Notes,
8.25%, 12/1/13 | | | 6,060 | | | | 6,105,450 | | |
| | | $ | 15,604,875 | | |
| Forest Products — 2.5% | |
| Domtar, Inc., 7.125%, 8/1/15 | | $ | 3,925 | | | $ | 3,768,000 | | |
| Georgia-Pacific Corp., 9.50%, 12/1/11 | | | 5,330 | | | | 5,823,025 | | |
| JSG Funding PLC, Sr. Notes, 9.625%, 10/1/12 | | | 7,995 | | | | 8,504,681 | | |
| NewPage Corp., 10.00%, 5/1/12 | | | 5,060 | | | | 5,325,650 | | |
| NewPage Corp., Variable Rate, 11.739%, 5/1/12 | | | 1,655 | | | | 1,795,675 | | |
| Stone Container Corp., 7.375%, 7/15/14 | | | 2,630 | | | | 2,429,462 | | |
| | | $ | 27,646,493 | | |
| Gaming — 6.9% | |
| CCM Merger, Inc., 8.00%, 8/1/13(3) | | $ | 2,435 | | | $ | 2,358,906 | | |
Chukchansi EDA, Sr. Notes, Variable Rate,
8.78%, 11/15/12(3) | | | 3,320 | | | | 3,452,800 | | |
| Eldorado Casino Shreveport (PIK), 10.00%, 8/1/12 | | | 990 | | | | 944,983 | | |
| Galaxy Entertainment Finance, 9.875%, 12/15/12(3) | | | 5,505 | | | | 5,849,062 | | |
Galaxy Entertainment Finance, Variable Rate,
10.42%, 12/15/10(3) | | | 2,800 | | | | 2,964,500 | | |
Greektown Holdings, LLC, Sr. Notes,
10.75%, 12/1/13(3) | | | 2,385 | | | | 2,534,062 | | |
Inn of the Mountain Gods, Sr. Notes,
12.00%, 11/15/10 | | | 3,920 | | | | 4,214,000 | | |
| Las Vegas Sands Corp., 6.375%, 2/15/15 | | | 3,340 | | | | 3,156,300 | | |
See notes to financial statements
16
High Income Portfolio as of October 31, 2006
PORTFOLIO OF INVESTMENTS CONT'D
| Security | | Principal
Amount
(000's omitted) | | Value | |
| Gaming (continued) | |
Majestic HoldCo, LLC, 12.50%,
(0.00% until 2008) 10/15/11(3) | | $ | 1,620 | | | $ | 1,053,000 | | |
| Majestic Star Casino, LLC, 9.50%, 10/15/10 | | | 2,040 | | | | 2,070,600 | | |
| Majestic Star Casino, LLC, 9.75%, 1/15/11 | | | 2,285 | | | | 2,102,200 | | |
Mohegan Tribal Gaming Authority, Sr. Sub. Notes,
8.00%, 4/1/12 | | | 1,570 | | | | 1,644,575 | | |
| OED Corp./Diamond Jo, LLC, 8.75%, 4/15/12 | | | 5,725 | | | | 5,746,469 | | |
| San Pasqual Casino, 8.00%, 9/15/13(3) | | | 3,740 | | | | 3,833,500 | | |
| Station Casinos, Inc., 7.75%, 8/15/16 | | | 1,465 | | | | 1,512,612 | | |
| Station Casinos, Inc., Sr. Notes, 6.00%, 4/1/12 | | | 1,100 | | | | 1,054,625 | | |
| Trump Entertainment Resorts, Inc., 8.50%, 6/1/15 | | | 15,550 | | | | 15,297,312 | | |
Tunica-Biloxi Gaming Authority, Sr. Notes,
9.00%, 11/15/15 | | | 3,605 | | | | 3,740,187 | | |
Turning Stone Resort Casinos, Sr. Notes,
9.125%, 9/15/14(3) | | | 875 | | | | 894,687 | | |
Waterford Gaming, LLC, Sr. Notes,
8.625%, 9/15/12(3) | | | 9,837 | | | | 10,476,405 | | |
| | | $ | 74,900,785 | | |
| Healthcare — 5.0% | |
| Accellent, Inc., 10.50%, 12/1/13 | | $ | 5,150 | | | $ | 5,407,500 | | |
AMR HoldCo, Inc./EmCare HoldCo, Inc., Sr. Sub. Notes,
10.00%, 2/15/15 | | | 4,860 | | | | 5,236,650 | | |
CDRV Investors, Inc., Sr. Disc. Notes, 9.625%,
(0.00% until 2010) 1/1/15 | | | 4,270 | | | | 3,330,600 | | |
| Encore Medical IHC, Inc., 9.75%, 10/1/12 | | | 3,230 | | | | 3,641,825 | | |
| HCA, Inc., 8.75%, 9/1/10 | | | 490 | | | | 496,125 | | |
Inverness Medical Innovations, Inc., Sr. Sub. Notes,
8.75%, 2/15/12 | | | 3,715 | | | | 3,677,850 | | |
| Multiplan, Inc., Sr. Sub. Notes, 10.375%, 4/15/16(3) | | | 3,275 | | | | 3,291,375 | | |
National Mentor Holdings, Inc., Sr. Sub. Notes,
11.25%, 7/1/14(3) | | | 2,230 | | | | 2,352,650 | | |
| Res-Care, Inc., Sr. Notes, 7.75%, 10/15/13 | | | 2,370 | | | | 2,370,000 | | |
Service Corp. International, Sr. Notes,
7.625%, 10/1/18(3) | | | 2,055 | | | | 2,121,788 | | |
Service Corp. International, Sr. Notes,
8.00%, 6/15/17(3) | | | 1,240 | | | | 1,202,800 | | |
| Triad Hospitals, Inc., Sr. Notes, 7.00%, 5/15/12 | | | 2,235 | | | | 2,229,413 | | |
Triad Hospitals, Inc., Sr. Sub. Notes,
7.00%, 11/15/13 | | | 2,665 | | | | 2,605,038 | | |
| US Oncology, Inc., 9.00%, 8/15/12 | | | 2,665 | | | | 2,774,931 | | |
| US Oncology, Inc., 10.75%, 8/15/14 | | | 6,350 | | | | 7,016,750 | | |
VWR International, Inc., Sr. Sub. Notes,
8.00%, 4/15/14 | | | 6,215 | | | | 6,416,988 | | |
| | | $ | 54,172,283 | | |
| Security | | Principal
Amount
(000's omitted) | | Value | |
| Home Furnishings — 0.2% | |
Steinway Musical Instruments, Sr. Notes,
7.00%, 3/1/14(3) | | $ | 1,855 | | | $ | 1,827,175 | | |
| | | $ | 1,827,175 | | |
| Hotel — 0.2% | |
Host Hotels & Resorts L.P., Sr. Notes,
6.875%, 11/1/14(3) | | $ | 2,150 | | | $ | 2,166,125 | | |
| | | $ | 2,166,125 | | |
| Industrial Equipment — 2.3% | |
| Case New Holland, Inc., Sr. Notes, 7.125%, 3/1/14 | | $ | 6,965 | | | $ | 7,052,063 | | |
| Case New Holland, Inc., Sr. Notes, 9.25%, 8/1/11 | | | 5,575 | | | | 5,944,344 | | |
Chart Industries, Inc., Sr. Sub. Notes,
9.125%, 10/15/15(3) | | | 2,370 | | | | 2,488,500 | | |
| Dresser, Inc., 10.125%, 4/15/11 | | | 8,975 | | | | 9,356,438 | | |
| Manitowoc Co., Inc. (The), 10.50%, 8/1/12 | | | 589 | | | | 639,065 | | |
| | | $ | 25,480,410 | | |
| Leisure — 3.2% | |
HRP Myrtle Beach Capital Corp., Sr. Notes, (PIK),
14.50%, 4/1/14(3) | | $ | 2,551 | | | $ | 2,697,999 | | |
HRP Myrtle Beach Operations, LLC/HRP
Myrtle Beach Capital Corp., 12.50%, 4/1/13(3) | | | 2,315 | | | | 2,320,788 | | |
HRP Myrtle Beach Operations, LLC/HRP Myrtle Beach
Capital Corp., Variable Rate, 10.12%, 4/1/12(3) | | | 3,985 | | | | 3,994,963 | | |
Six Flags Theme Parks, Inc., Sr. Notes,
9.625%, 6/1/14 | | | 5,295 | | | | 4,871,400 | | |
Universal City Developement Partners, Sr. Notes,
11.75%, 4/1/10 | | | 10,675 | | | | 11,555,688 | | |
Universal City Florida Holdings, Sr. Notes,
Variable Rate, 10.239%, 5/1/10 | | | 9,385 | | | | 9,701,744 | | |
| | | $ | 35,142,582 | | |
| Leisure Goods / Activities / Movies — 0.2% | |
Amscan Holdings, Inc., Sr. Sub. Notes,
8.75%, 5/1/14 | | $ | 1,875 | | | $ | 1,781,250 | | |
| | | $ | 1,781,250 | | |
| Metals / Mining — 0.8% | |
Alpha Natural Resources, Sr. Notes,
10.00%, 6/1/12 | | $ | 1,665 | | | $ | 1,798,200 | | |
| FMG Finance PTY, Ltd., 10.625%, 9/1/16(3) | | | 2,205 | | | | 2,182,950 | | |
| Novelis, Inc., Sr. Notes, 8.25%, 2/15/15(3) | | | 5,040 | | | | 4,838,400 | | |
| | | $ | 8,819,550 | | |
See notes to financial statements
17
High Income Portfolio as of October 31, 2006
PORTFOLIO OF INVESTMENTS CONT'D
| Security | | Principal
Amount
(000's omitted) | | Value | |
| Publishing / Printing — 2.2% | |
American Media Operations, Inc., Series B,
10.25%, 5/1/09 | | $ | 6,219 | | | $ | 5,923,598 | | |
| CBD Media, Inc., Sr. Sub. Notes, 8.625%, 6/1/11 | | | 1,615 | | | | 1,625,094 | | |
Dex Media West, LLC, Sr. Sub. Notes,
9.875%, 8/15/13 | | | 740 | | | | 807,525 | | |
Houghton Mifflin Co., Sr. Sub. Notes,
9.875%, 2/1/13 | | | 6,950 | | | | 7,479,938 | | |
MediaNews Group, Inc., Sr. Sub. Notes,
6.875%, 10/1/13 | | | 1,135 | | | | 1,059,806 | | |
R.H. Donnelley Corp., Sr. Disc. Notes,
6.875%, 1/15/13 | | | 2,480 | | | | 2,346,700 | | |
R.H. Donnelley Corp., Sr. Disc. Notes,
6.875%, 1/15/13 | | | 4,470 | | | | 4,229,738 | | |
| | | $ | 23,472,399 | | |
| Radio and Television — 3.3% | |
Advanstar Communications, Inc.,
10.75%, 8/15/10 | | $ | 8,960 | | | $ | 9,688,000 | | |
| CanWest Media, Inc., 8.00%, 9/15/12 | | | 19,508 | | | | 19,824,851 | | |
Lamar Media Corp., Sr. Sub. Notes,
6.625%, 8/15/15(3) | | | 1,535 | | | | 1,485,113 | | |
| LBI Media, Inc., 10.125%, 7/15/12 | | | 2,020 | | | | 2,158,875 | | |
LBI Media, Inc., Sr. Disc. Notes, 11.00%,
(0.00% until 2008), 10/15/13 | | | 2,760 | | | | 2,349,450 | | |
| | | $ | 35,506,289 | | |
| Railroad — 0.9% | |
| Kansas City Southern Railway, 9.50%, 10/1/08 | | $ | 1,095 | | | $ | 1,156,594 | | |
| TFM SA de C.V., Sr. Notes, 9.375%, 5/1/12 | | | 6,050 | | | | 6,488,625 | | |
| TFM SA de C.V., Sr. Notes, 12.50%, 6/15/12 | | | 1,830 | | | | 2,013,000 | | |
| | | $ | 9,658,219 | | |
| Services — 3.9% | |
Education Management, LLC, Sr. Notes,
8.75%, 6/1/14(3) | | $ | 3,235 | | | $ | 3,332,050 | | |
Education Management, LLC, Sr. Sub. Notes,
10.25%, 6/1/16(3) | | | 4,495 | | | | 4,686,038 | | |
| Hertz Corp., Sr. Sub. Notes, 8.875%, 1/1/14(3) | | | 6,240 | | | | 6,552,000 | | |
Hydrochem Industrial Services, Inc., Sr. Sub Notes,
9.25%, 2/15/13(3) | | | 1,220 | | | | 1,216,950 | | |
Knowledge Learning Center, Sr. Sub. Notes,
7.75%, 2/1/15(3) | | | 2,545 | | | | 2,424,113 | | |
Muzak, LLC/Muzak Finance, Sr. Notes,
10.00%, 2/15/09 | | | 2,640 | | | | 2,392,500 | | |
| Security | | Principal
Amount
(000's omitted) | | Value | |
| Services (continued) | |
Norcross Safety Products, LLC/Norcross
Capital Corp., Sr. Sub. Notes, Series B,
9.875%, 8/15/11 | | $ | 5,555 | | | $ | 5,916,075 | | |
Safety Products Holdings, Inc., Sr. Notes (PIK),
11.75%, 1/1/12(3) | | | 4,410 | | | | 4,611,070 | | |
| United Rentals North America, Inc., 6.50%, 2/15/12 | | | 5,765 | | | | 5,649,700 | | |
| West Corp., Sr. Notes, 9.50%, 10/15/14(3) | | | 5,400 | | | | 5,413,500 | | |
| West Corp., Sr. Sub. Notes, 11.00%, 10/15/16(3) | | | 650 | | | | 654,875 | | |
| | | $ | 42,848,871 | | |
| Steel — 1.0% | |
| AK Steel Corp., 7.875%, 2/15/09 | | $ | 2,615 | | | $ | 2,637,881 | | |
| Ispat Inland ULC, Sr. Notes, 9.75%, 4/1/14 | | | 2,915 | | | | 3,269,184 | | |
| RathGibson, Inc., Sr. Notes, 11.25%, 2/15/14(3) | | | 5,020 | | | | 5,245,900 | | |
| | | $ | 11,152,965 | | |
| Super Retail — 3.9% | |
| Autonation, Inc., Variable Rate, 7.374%, 4/15/13 | | $ | 1,595 | | | $ | 1,614,938 | | |
| Bon-Ton Department Stores, Inc., 10.25%, 3/15/14 | | | 3,675 | | | | 3,743,906 | | |
| GameStop Corp., 8.00%, 10/1/12 | | | 15,065 | | | | 15,705,263 | | |
| GameStop Corp., Variable Rate, 9.247%, 10/1/11 | | | 4,515 | | | | 4,718,175 | | |
| General Nutrition Centers, Inc., 8.625%, 1/15/11 | | | 1,150 | | | | 1,193,125 | | |
| Michaels Stores, Inc., Sr. Notes,10.00%, 11/1/14(3) | | | 2,585 | | | | 2,604,388 | | |
Michaels Stores, Inc., Sr. Sub. Notes,
11.375%, 11/1/16(3) | | | 2,160 | | | | 2,178,900 | | |
| Neiman Marcus Group, Inc., 9.00%, 10/15/15 | | | 5,790 | | | | 6,238,725 | | |
| Neiman Marcus Group, Inc., 10.375%, 10/15/15 | | | 3,700 | | | | 4,065,375 | | |
| Toys "R" Us, 7.375%, 10/15/18 | | | 1,100 | | | | 827,750 | | |
| | | $ | 42,890,545 | | |
| Surface Transport — 0.4% | |
H-Lines Finance Holding Corp., Sr. Disc. Notes,
11.00%, (0.00% until 2008) 4/1/13 | | $ | 1,785 | | | $ | 1,619,888 | | |
| Horizon Lines, LLC, 9.00%, 11/1/12 | | | 2,837 | | | | 2,978,850 | | |
| | | $ | 4,598,738 | | |
| Technology — 2.7% | |
| Activant Solutions, Inc., 9.50%, 5/1/16(3) | | $ | 1,130 | | | $ | 1,056,550 | | |
Avago Technologies Finance, Sr. Notes,
10.125%, 12/1/13(3) | | | 1,555 | | | | 1,656,075 | | |
CPI Holdco, Inc., Sr. Notes, Variable Rate,
11.298%, 2/1/15 | | | 1,545 | | | | 1,614,525 | | |
See notes to financial statements
18
High Income Portfolio as of October 31, 2006
PORTFOLIO OF INVESTMENTS CONT'D
| Security | | Principal
Amount
(000's omitted) | | Value | |
| Technology (continued) | |
NXP BV/NXP Funding, LLC, Sr. Notes,
9.50%, 10/15/15(3) | | $ | 5,400 | | | $ | 5,474,250 | | |
| Sungard Data Systems, Inc., 9.125%, 8/15/13 | | | 3,375 | | | | 3,518,438 | | |
| Sungard Data Systems, Inc., 10.25%, 8/15/15 | | | 640 | | | | 673,600 | | |
Sungard Data Systems, Inc., Variable Rate,
9.973%, 8/15/13 | | | 1,170 | | | | 1,222,650 | | |
| UGS Corp., 10.00%, 6/1/12 | | | 12,660 | | | | 13,736,100 | | |
| | | $ | 28,952,188 | | |
| Telecommunications — 6.1% | |
Centennial Cellular Operating Co./Centennial
Communication Corp., Sr. Notes,
10.125%, 6/15/13 | | $ | 4,105 | | | $ | 4,423,138 | | |
| Digicel Ltd., Sr. Notes, 9.25%, 9/1/12(3) | | | 3,475 | | | | 3,622,688 | | |
| Intelsat Bermuda Ltd., 9.25%, 6/15/16(3) | | | 3,770 | | | | 4,043,325 | | |
Intelsat Bermuda Ltd., Sr. Notes, Variable Rate,
10.484%, 1/15/12 | | | 7,410 | | | | 7,548,938 | | |
| Intelsat Ltd., Sr. Notes, 5.25%, 11/1/08 | | | 15,905 | | | | 15,467,613 | | |
| IWO Holdings, Inc., 14.00%, 1/15/11(2) | | | 7,490 | | | | 0 | | |
| IWO Holdings, Inc., Variable Rate, 9.124%, 1/15/12 | | | 675 | | | | 693,563 | | |
| Qwest Capital Funding, Inc., 7.00%, 8/3/09 | | | 1,265 | | | | 1,285,556 | | |
Qwest Communications International, Inc.,
7.50%, 2/15/14 | | | 7,810 | | | | 8,005,250 | | |
Qwest Communications International, Inc., Sr. Notes,
7.50%, 11/1/08 | | | 710 | | | | 724,200 | | |
| Qwest Corp., Sr. Notes, 7.625%, 6/15/15 | | | 2,510 | | | | 2,654,325 | | |
| Qwest Corp., Sr. Notes, Variable Rate, 8.64%, 6/15/13 | | | 685 | | | | 741,513 | | |
| Rogers Wireless, Inc., Sr. Sub. Notes, 8.00%, 12/15/12 | | | 380 | | | | 403,750 | | |
| Rogers Wireless, Inc., Variable Rate, 8.515%, 12/15/10 | | | 3,870 | | | | 3,961,913 | | |
Telemig Celular SA/Amazonia Celular SA,
8.75%, 1/20/09(3) | | | 2,030 | | | | 2,139,113 | | |
| U.S. West Communications, Debs., 7.20%, 11/10/26 | | | 585 | | | | 574,031 | | |
| UbiquiTel Operating Co., Sr. Notes, 9.875%, 3/1/11 | | | 5,915 | | | | 6,432,563 | | |
| Windstream Corp., Sr. Notes, 8.125%, 8/1/13(3) | | | 3,325 | | | | 3,566,063 | | |
| | | $ | 66,287,542 | | |
| Textiles / Apparel — 3.8% | |
| Levi Strauss & Co., Sr. Notes, 8.875%, 4/1/16 | | $ | 4,405 | | | $ | 4,548,163 | | |
| Levi Strauss & Co., Sr. Notes, 9.75%, 1/15/15 | | | 1,110 | | | | 1,182,150 | | |
| Levi Strauss & Co., Sr. Notes, 12.25%, 12/15/12 | | | 11,260 | | | | 12,611,200 | | |
Levi Strauss & Co., Sr. Notes, Variable Rate,
10.122%, 4/1/12 | | | 5,320 | | | | 5,512,850 | | |
| Oxford Industries, Inc., Sr. Notes, 8.875%, 6/1/11 | | | 8,555 | | | | 8,822,344 | | |
| Security | | Principal
Amount
(000's omitted) | | Value | |
| Textiles / Apparel (continued) | |
Perry Ellis International, Inc., Sr. Sub. Notes,
8.875%, 9/15/13 | | $ | 3,650 | | | $ | 3,677,375 | | |
| Phillips Van-Heusen, Sr. Notes, 7.25%, 2/15/11 | | | 1,350 | | | | 1,366,875 | | |
| Phillips Van-Heusen, Sr. Notes, 8.125%, 5/1/13 | | | 3,615 | | | | 3,786,713 | | |
| | | $ | 41,507,670 | | |
| Utilities — 2.7% | |
| AES Corp., Sr. Notes, 8.75%, 5/15/13(3) | | $ | 2,030 | | | $ | 2,189,863 | | |
| AES Corp., Sr. Notes, 8.875%, 2/15/11 | | | 457 | | | | 493,560 | | |
| AES Corp., Sr. Notes, 9.00%, 5/15/15(3) | | | 1,585 | | | | 1,713,781 | | |
| AES Eastern Energy, Series 99-A, 9.00%, 1/2/17 | | | 2,434 | | | | 2,666,807 | | |
| Dynegy Holdings, Inc., 8.375%, 5/1/16 | | | 2,320 | | | | 2,395,400 | | |
| Mission Energy Holding Co., 13.50%, 7/15/08 | | | 3,895 | | | | 4,362,400 | | |
| NGC Corp., 7.625%, 10/15/26 | | | 3,205 | | | | 2,996,675 | | |
| NRG Energy, Inc., 7.25%, 2/1/14 | | | 1,550 | | | | 1,571,313 | | |
| NRG Energy, Inc., Sr. Notes, 7.375%, 2/1/16 | | | 2,145 | | | | 2,174,494 | | |
| Orion Power Holdings, Inc., Sr. Notes, 12.00%, 5/1/10 | | | 6,490 | | | | 7,398,600 | | |
| Reliant Energy, Inc., 9.25%, 7/15/10 | | | 1,875 | | | | 1,950,000 | | |
| | | $ | 29,912,893 | | |
Total Corporate Bonds & Notes
(identified cost $927,282,715) | | | | | | $ | 955,514,831 | | |
| Convertible Bonds — 0.6% | |
| Security | | Principal
Amount
(000's omitted) | | Value | |
| Aerospace — 0.4% | |
| L-3 Communications Corp., 3.00%, 8/1/35(3) | | $ | 3,890 | | | $ | 4,050,462 | | |
| | | $ | 4,050,462 | | |
| Broadcasting — 0.2% | |
XM Satellite Radio Holdings, Inc.,
1.75%, 12/1/09 | | $ | 1,185 | | | $ | 970,219 | | |
| XM Satellite Radio, Inc., 1.75%, 12/1/09(3) | | | 2,450 | | | | 2,005,938 | | |
| | | $ | 2,976,157 | | |
Total Convertible Bonds
(identified cost, $7,506,207) | | | | | | $ | 7,026,619 | | |
See notes to financial statements
19
High Income Portfolio as of October 31, 2006
PORTFOLIO OF INVESTMENTS CONT'D
| Common Stocks — 0.9% | |
| Security | | Shares | | Value | |
| Food Service — 0.0% | |
| New World Restaurant Group, Inc.(5) | | | 633 | | | $ | 5,064 | | |
| | | $ | 5,064 | | |
| Gaming — 0.8% | |
| Shreveport Gaming Holdings, Inc.(4)(5) | | | 6,014 | | | $ | 107,350 | | |
| Trump Entertainment Resorts, Inc.(5) | | | 409,960 | | | | 8,334,487 | | |
| | | $ | 8,441,837 | | |
| Healthcare — 0.1% | |
| Triad Hospitals, Inc.(5) | | | 38,152 | | | $ | 1,412,768 | | |
| | | $ | 1,412,768 | | |
| Leisure — 0.0% | |
| HRP, Class B(5) | | | 2,375 | | | $ | 24 | | |
| | | $ | 24 | | |
Total Common Stocks
(identified cost $6,610,655) | | | | | | $ | 9,859,693 | | |
| Convertible Preferred Stocks — 1.4% | |
| Security | | Shares | | Value | |
| Energy — 0.7% | |
| Chesapeake Energy Corp., 4.50% | | | 61,160 | | | $ | 6,130,067 | | |
| Chesapeake Energy Corp., 5.00%(3) | | | 14,401 | | | | 1,569,709 | | |
| | | $ | 7,699,776 | | |
| Telecommunications — 0.7% | |
| Crown Castle International Corp., (PIK) | | | 138,027 | | | $ | 7,643,245 | | |
| | | $ | 7,643,245 | | |
Total Convertible Preferred Stocks
(identified cost $13,591,828) | | | | | | $ | 15,343,021 | | |
| Miscellaneous — 0.0% | |
| Security | | Shares | | Value | |
| Utilities — 0.0% | |
| Mirant Corp., Escrow Certificate(3) | | | 1,440,000 | | | $ | 21,269 | | |
| Mirant Corp., Escrow Certificate(6) | | | 3,200,000 | | | | 40,000 | | |
| | | $ | 61,269 | | |
Total Miscellaneous
(identified cost $0) | | | | | | $ | 61,269 | | |
| Warrants — 0.3% | |
| Security | | Shares | | Value | |
| Consumer Products — 0.0% | |
| HF Holdings, Inc., Exp. 9/27/09(4)(5) | | | 13,600 | | | $ | 0 | | |
| | | $ | 0 | | |
| Gaming — 0.0% | |
Peninsula Gaming LLC, Convertible Preferred
Membership Interests(4)(5)(6) | | | 25,351 | | | $ | 152,107 | | |
| | | $ | 152,107 | | |
| Technology — 0.0% | |
| ASAT Finance, Exp. 11/1/06(3)(4)(5) | | | 5,660 | | | $ | 57 | | |
| | | $ | 57 | | |
| Telecommunications — 0.3% | |
| American Tower Corp., Exp. 8/1/08(3)(5) | | | 5,070 | | | $ | 2,581,641 | | |
| | | $ | 2,581,641 | | |
Total Warrants
(identified cost $1,070,114) | | | | | | $ | 2,733,805 | | |
See notes to financial statements
20
High Income Portfolio as of October 31, 2006
PORTFOLIO OF INVESTMENTS CONT'D
| Short-Term Investments — 1.8% | |
| Security | | Principal
Amount
(000's omitted) | | Value | |
| Societe Generale Time Deposit, 5.31%, 11/1/06 | | $ | 19,643 | | | $ | 19,643,000 | | |
Total Short-Term Investments
(at amortized cost, $19,643,000) | | | | $ | 19,643,000 | | |
Total Investments — 98.1%
(identified cost $1,031,145,335) | | | | $ | 1,066,163,774 | | |
Other Assets, Less Liabilities — 1.9%
excluding securities sold short — 1.9% | |
| | | $21,160,702
$21,160,702 | | |
| Net Assets — 100.0% | | | | $ | 1,087,324,476 | | |
PIK - Payment In Kind.
Note: The Portfolio has made commitments to fund specified amounts under certain existing credit arrangements. Pursuant to the terms of these arrangements, the Portfolio had unfunded loan commitments of $24,350,000 as of October 31, 2006.
(1) Senior floating-rate loans often require prepayments from excess cash flows or permit the borrower to repay at its election. The degree to which borrowers repay, whether as a contractual requirement or at their election, cannot be predicted with accuracy. As a result, the actual remaining maturity may be substantially less than the stated maturities shown. However, it is anticipated that the senior floating-rate interests will have an expected average life of approximately two to three years. The stated interest rate represents the weighted average interest rate of all contracts within the senior loan facility. Senior Loans typically have rates of interest which are redetermined either daily, monthly, quarterly or semi-annually by reference to a base lending rate, plus a premium. These base lending rates are primarily the London-Int erbank Offered Rate ("LIBOR"), and secondarily the prime rate offered by one or more major United States banks (the "Prime Rate") and the certificate of deposit ("CD") rate or other base lending rates used by commercial lenders.
(2) Defaulted security.
(3) Security exempt from registration under Rule 144A of the Securities Act of 1933. These securities may be sold in transactions exempt from registration, normally to qualified institutional buyers. At October 31, 2006, the aggregate value of the securities is $252,999,794 or 23.3% of the Fund's net assets.
(4) Security valued at fair value using methods determined in good faith by or at the direction of the Trustees.
(5) Non-income producing security.
(6) Restricted security.
See notes to financial statements
21
High Income Portfolio as of October 31, 2006
FINANCIAL STATEMENTS
Statement of Assets and Liabilities
As of October 31, 2006
| Assets | |
| Investments, at value (identified cost, $1,031,145,335) | | $ | 1,066,163,774 | | |
| Cash | | | 1,792,060 | | |
| Receivable for investments sold | | | 4,468,812 | | |
| Interest and dividends receivable | | | 22,755,773 | | |
| Receivable for open swap contracts | | | 79,544 | | |
| Total assets | | $ | 1,095,259,963 | | |
| Liabilities | |
| Payable for investments purchased | | $ | 7,297,040 | | |
| Payable to affiliate for investment advisory fees | | | 483,516 | | |
| Payable to affiliate for Trustees' fees | | | 2,138 | | |
| Accrued expenses | | | 152,793 | | |
| Total liabilities | | $ | 7,935,487 | | |
| Net Assets applicable to investors' interest in Portfolio | | $ | 1,087,324,476 | | |
| Sources of Net Assets | |
| Net proceeds from capital contributions and withdrawals | | $ | 1,052,226,493 | | |
| Net unrealized appreciation (computed on the basis of identified cost) | | | 35,097,983 | | |
| Total | | $ | 1,087,324,476 | | |
Statement of Operations
For the Year Ended
October 31, 2006
| Investment Income | |
| Interest | | $ | 92,025,269 | | |
| Dividends | | | 804,321 | | |
| Miscellaneous | | | 2,023,098 | | |
| Total investment income | | $ | 94,852,688 | | |
| Expenses | |
| Investment adviser fee | | $ | 5,856,825 | | |
| Trustees' fees and expenses | | | 26,014 | | |
| Custodian fee | | | 321,840 | | |
| Legal and accounting services | | | 135,006 | | |
| Miscellaneous | | | 50,905 | | |
| Total expenses | | $ | 6,390,590 | | |
| Net investment income | | $ | 88,462,098 | | |
| Realized and Unrealized Gain (Loss) | |
Net realized gain —
Investment transactions (identified cost basis) | | $ | 21,708,830 | | |
| Swap contracts | | | 307,756 | | |
Foreign currency and forward foreign currency exchange
contract transactions | | | 22,332 | | |
| Net realized gain | | $ | 22,038,918 | | |
Change in unrealized appreciation (depreciation) —
Investments (identified cost basis) | | $ | 8,954,548 | | |
| Swap contracts | | | (174,688 | ) | |
| Foreign currency and forward foreign currency exchange contracts | | | (32,808 | ) | |
| Net change in unrealized appreciation (depreciation) | | $ | 8,747,052 | | |
| Net realized and unrealized gain | | $ | 30,785,970 | | |
| Net increase in net assets from operations | | $ | 119,248,068 | | |
See notes to financial statements
22
High Income Portfolio as of October 31, 2006
FINANCIAL STATEMENTS CONT'D
Statements of Changes in Net Assets
Increase (Decrease)
in Net Assets | | Year Ended
October 31, 2006 | | Year Ended
October 31, 2005 | |
From operations —
Net investment income | | $ | 88,462,098 | | | $ | 95,770,195 | | |
Net realized gain from investments,
swap contracts, foreign currency
and forward foreign currency
exchange contract transactions | | | 22,038,918 | | | | 21,644,924 | | |
Net change in unrealized appreciation
(depreciation) from investments,
swap contracts, foreign currency
and forward foreign currency
exchange contracts | | | 8,747,052 | | | | (43,655,366 | ) | |
| Net increase in net assets from operations | | $ | 119,248,068 | | | $ | 73,759,753 | | |
Capital transactions —
Contributions | | $ | 116,555,183 | | | $ | 158,885,097 | | |
| Withdrawals | | | (258,617,627 | ) | | | (414,478,617 | ) | |
Net decrease in net assets from
capital transactions | | $ | (142,062,444 | ) | | $ | (255,593,520 | ) | |
| Net decrease in net assets | | $ | (22,814,376 | ) | | $ | (181,833,767 | ) | |
| Net Assets | |
| At beginning of year | | $ | 1,110,138,852 | | | $ | 1,291,972,619 | | |
| At end of year | | $ | 1,087,324,476 | | | $ | 1,110,138,852 | | |
See notes to financial statements
23
High Income Portfolio as of October 31, 2006
FINANCIAL STATEMENTS CONT'D
Supplementary Data
| | | Year Ended October 31, | |
| | | 2006 | | 2005 | | 2004 | | 2003 | | 2002(1) | |
| Ratios/Supplemental Data | |
| Ratios (As a percentage of average daily net assets): | |
| Expenses before custodian fee reduction | | | 0.59 | % | | | 0.58 | % | | | 0.59 | % | | | 0.66 | % | | | 0.64 | % | |
| Expenses after custodian fee reduction | | | 0.59 | % | | | 0.58 | % | | | 0.59 | % | | | 0.66 | % | | | 0.64 | % | |
| Net investment income | | | 8.13 | % | | | 8.06 | % | | | 8.61 | % | | | 10.04 | % | | | 10.38 | % | |
| Portfolio Turnover | | | 62 | % | | | 62 | % | | | 80 | % | | | 122 | % | | | 88 | % | |
| Total Return | | | 11.66 | % | | | 6.54 | % | | | 12.79 | % | | | 34.76 | % | | | (4.36 | )% | |
| Net assets, end of year (000's omitted) | | $ | 1,087,324 | | | $ | 1,110,139 | | | $ | 1,291,973 | | | $ | 1,164,043 | | | $ | 889,653 | | |
(1) The Portfolio has adopted the provisions of the revised AICPA Audit and Accounting Guide for Investment Companies and began using the interest method to amortize premiums on fixed-income securities. The effect of this change for the year ended October 31, 2002 was to decrease the ratio of net investment income to average net assets from 10.59% to 10.38%. Ratios for the periods prior to November 1, 2001 have not been restated to reflect this change in presentation.
See notes to financial statements
24
High Income Portfolio as of October 31, 2006
NOTES TO FINANCIAL STATEMENTS
1 Significant Accounting Policies
High Income Portfolio (the Portfolio) is registered under the Investment Company Act of 1940 as an open-end management investment company which was organized as a trust under the laws of the State of New York on May 1, 1992. The Declaration of Trust permits the Trustees to issue interests in the Portfolio. At October 31, 2006 Eaton Vance High Income Fund, Eaton Vance Floating-Rate & High Income Fund, Eaton Vance Strategic Income Fund and Eaton Vance Medallion Strategic Income Fund held an approximate 62.6%, 22.7%, 6.3% and 0.9% interest in the Portfolio, respectively. The following is a summary of significant accounting policies of the Portfolio. The policies are in conformity with accounting principles generally accepted in the United States of America.
A Investment Valuations — Investments listed on securities exchanges are valued at closing sale prices. Investments listed on the NASDAQ National Market System are valued at the NASDAQ official closing price. Listed or unlisted investments for which closing sale prices are not available are valued at the mean between the latest bid and ask prices. Fixed income investments (other than short-term obligations), including listed investments and investments for which price quotations are available, will normally be valued on the basis of market valuations furnished by a pricing service. Financial futures contracts listed on commodity exchanges are valued at closing settlement prices. Short-term obligations, maturing in sixty days or less, are valued at amortized cost, which ap proximates fair value. If short-term debt securities are acquired with a remaining maturity more than 60 days, they will be valued by a pricing service. The Portfolio also invests in interests in senior floating rate loans (Senior Loans). The Portfolio's investment adviser, Boston Management and Research (BMR) a wholly owned subsidiary of Eaton Vance Management (EVM), has characterized certain Senior Loans as liquid based on a predetermined acceptable number and range of market quotations available. Such loans are valued on the basis of market valuations furnished by a pricing service. Investments for which there are no quotations or valuations are valued at fair value using methods determined in good faith by or at the direction of the Trustees. Other Senior Loans are valued at fair value by BMR under procedures established by the Trustees as permitted by section 2(a)(41) of the Investment Company Act of 1940.
B Income — Interest income is recorded on the basis of interest accrued, adjusted for amortization of premium or accretion of discount. Fees associated with loan commitments are recognized immediately. Dividend income is recorded on the ex-dividend date for dividends received in cash and/or securities.
C Federal Taxes — The Portfolio has elected to be treated as a partnership for federal tax purposes. No provision is made by the Portfolio for federal or state taxes on any taxable income of the Portfolio because each investor in the Portfolio is ultimately responsible for the payment of any taxes on its share of taxable income. Since at least one of the Portfolio's investors is a regulated investment company that invests all or substantially all of its assets in the Portfolio, the Portfolio normally must satisfy the applicable source of income and diversification requirements (under the Internal Revenue Code) in order for its investors to satisfy them. The Portfolio will allocate, at least annually among its investors, each investor's distributive share of the Portfolio's net inves tment income, net realized capital gains, and any other items of income, gain, loss, deduction or credit.
D Expense Reduction — Investors Bank & Trust Company (IBT) serves as custodian of the Portfolio. Pursuant to the custodian agreement, IBT receives a fee reduced by credits which are determined based on the average daily cash balance the Portfolio maintains with IBT. All credit balances used to reduce the Portfolio's custodian fees are reported as a reduction of expenses in the Statement of Operations.
E Financial Futures Contracts — Upon the entering of a financial futures contract, the Portfolio is required to deposit (initial margin) either in cash or securities an amount equal to a certain percentage of the purchase price indicated in the financial futures contract. Subsequent payments are made or received by the Portfolio (margin maintenance) each day, dependent on the daily fluctuations in the value of the underlying security, and are recorded for book purposes as unrealized gains or losses by the Portfolio. The Portfolio's investment in financial futures contracts is designed only to hedge against anticipated future changes in interest rates. Should interest rates move unexpectedly, the Portfolio may not achieve the anticipated benefits of the financial futures contracts an d may realize a loss.
F Foreign Currency Translation — Investment valuations, other assets, and liabilities initially expressed in
25
High Income Portfolio as of October 31, 2006
NOTES TO FINANCIAL STATEMENTS CONT'D
foreign currencies are converted each business day into U.S. dollars based upon current exchange rates. Purchases and sales of foreign investment securities and income and expenses are converted into U.S. dollars based upon currency exchange rates prevailing on the respective dates of such transactions. Recognized gains or losses on investment transactions attributable to changes in foreign currency exchange rates are recorded for financial statement purposes as net realized gains and losses on investments. That portion of unrealized gains and losses on investments that results from fluctuations in foreign currency exchange rates is not separately disclosed.
G Forward Foreign Currency Exchange Contracts — The Portfolio may enter into forward foreign currency exchange contracts for the purchase or sale of a specific foreign currency at a fixed price on a future date. Risks may arise upon entering these contracts from the potential inability of counterparties to meet the terms of their contracts and from movements in the value of a foreign currency relative to the U.S. dollar. The Portfolio will enter into forward contracts for hedging purposes as well as non-hedging purposes. The forward foreign currency exchange contracts are adjusted by the daily exchange rate of the underlying currency and any gains or losses are recorded for financial statement purposes as unrealized until such time as the contracts have been closed.
H Credit Default Swaps — The Portfolio may enter into credit default swaps to buy or sell credit protection on an individual issuer or a basket of issuers of bonds. When the Portfolio is the buyer of a credit default swap contract, the Portfolio is entitled to receive the par or other agreed-upon value, of a referenced debt obligation from the counterparty to the contract in the event of a default by a third party, such as a U.S. or foreign corporate issuer, on the debt obligation. In return, the Portfolio would pay the counterparty a periodic stream of payments over the term of the contract provided that no event of default has occurred. If no default occurs, the Portfolio would have spent the stream of payments and received no benefit from the contract. When the Portfol io is the seller of a credit default swap contract, it receives the stream of payments, but is obligated to pay upon default of the referenced debt obligation. As the seller, the Portfolio would effectively add leverage to its portfolio because, in addition to its total net assets, the Portfolio would be subject to investment exposure on the notional amount of the swap. During the period that the credit default swap contract is open, the contract is marked to market in accordance with the terms of the contract based on the current interest rate spreads and credit risk of the referred obligation of the underlying issuer and interest accrual through valuation date. Changes in the value of credit default swap contracts are recorded as unrealized gains or losses and periodic cash settlements are recorded as realized gains or losses. The Portfolio will segregate assets in the form of cash and cash equivalents in an amount equal to the aggrega te market value of the credit default swaps of which it is the seller, marked to market on a daily basis. These transactions involve certain risks, including the risk that the seller may be unable to fulfill the transaction.
I Use of Estimates — The preparation of the financial statements in conformity with accounting principles generally accepted in the United States of America requires management to make estimates and assumptions that affect the reported amounts of assets and liabilities at the date of the financial statements and the reported amounts of income and expense during the reporting period. Actual results could differ from those estimates.
J Indemnifications — Under the Portfolio's organizational documents, its officers and Trustees may be indemnified against certain liabilities and expenses arising out of the performance of their duties to the Portfolio. Interestholders in the Portfolio are jointly and severally liable for the liabilities and obligations of the Portfolio in the event that the Portfolio fails to satisfy such liabilities and obligations; provided, however, that, to the extent assets are available in the Portfolio, the Portfolio may, under certain circumstances, indemnify interestholders from and against any claim or liability to which such holder may become subject by reason of being or having been an interestholder in the Portfolio. Additionally, in the normal course of business, the Portfo lio enters into agreements with service providers that may contain indemnification clauses. The Portfolio's maximum exposure under these arrangements is unknown as this would involve future claims that may be made against the Portfolio that have not yet occurred.
K Other — Investment transactions are accounted for on the date the securities are purchased or sold. Realized gains and losses on securities sold are determined on the basis of identified cost.
26
High Income Portfolio as of October 31, 2006
NOTES TO FINANCIAL STATEMENTS CONT'D
2 Investment Adviser Fee and Other Transactions with Affiliates
The investment adviser fee is earned by Boston Management and Research (BMR), a wholly-owned subsidiary of Eaton Vance Management (EVM), as compensation for management and investment advisory services rendered to the Portfolio. The fee is based upon 0.3% of average daily net assets plus 3% of gross daily income (i.e., income other than gains from the sale of securities). The advisory fee rate is reduced as daily net assets exceed $500 million. For the year ended October 31, 2006, the fee was equivalent to 0.54% of the Portfolio's average daily net assets and amounted to $5,856,825. Except as to Trustees of the Portfolio who are not members of EVM's or BMR's organization, officers and Trustees receive remuneration for their services to the Portfolio out of such investment adviser fee. Certain officers and Trustees of the Portfolio are officers of the above organizations. Trustees of the Portfolio that are not affiliated with the investment adviser may elect to defer receipt of all or a portion of their annual fees in accordance with the terms of the Trustees Deferred Compensation Plan. For the year ended October 31, 2006, no significant amounts have been deferred.
3 Investments
The Portfolio invests primarily in debt securities. The ability of the issuers of the debt securities held by the Portfolio to meet their obligations may be affected by economic developments in a specific industry. Purchases and sales of investments, other than U.S. Government securities and short-term obligations, aggregated $647,659,001 and $707,752,805, respectively, for the year ended October 31, 2006.
4 Line of Credit
The Portfolio participates with other portfolios and funds managed by BMR and EVM and its affiliates in a $150 million unsecured line of credit agreement with a group of banks. Borrowings will be made by the Portfolio solely to facilitate the handling of unusual and/or unanticipated short-term cash requirements. Interest is charged to each participating portfolio or fund based on its borrowings at an amount above either the Eurodollar rate or federal funds rate. In addition, a fee computed at an annual rate of 0.10% on the daily unused portion of the line of credit is allocated among the participating portfolios and funds at the end of each quarter. The Portfolio did not have any significant borrowings or allocated fees during the year ended October 31, 2006.
5 Financial Instruments
The Portfolio may regularly trade in financial instruments with off-balance sheet risk in the normal course of its investing activities to assist in managing exposure to various market risks. These financial instruments include written options, forward foreign currency contracts, financial futures contracts and swap contracts and may involve, to a varying degree, elements of risk in excess of the amounts recognized for financial statement purposes. The notional or contractual amounts of these instruments represent the investment the Portfolio has in particular classes of financial instruments and does not necessarily represent the amounts potentially subject to risk. The measurement of the risks associated with these instruments is meaningful only when all related and offsetting transactions are considered. A summary of obligations under these financial instruments at October 31, 2006 is as follows:
Credit Default Swaps
Notional
Amount | | Expiration
Date | |
Description | | Net Unrealized
Appreciation | |
3,800,000 USD
| | 9/20/2013
| | Agreement with Lehman Brothers
dated 8/08/2006 to pay
2.87% per year times the notional
amount. In exchange for that
periodic payment, upon a default
event by Station Casinos, Inc.,
Lehman Brothers agrees to pay the
Portfolio the notional amount of the
swaps. To receive that payment, the
portfolio must deliver a bond (with
par value equal to the notional
amount of the swap issued by
Stations Casinos, Inc, to Lehman
Brothers. | | | $79,544
| | |
At October 31, 2006, the Portfolio had sufficient cash and/or securities to cover any commitments under these contracts.
6 Federal Income Tax Basis of Unrealized Appreciation (Depreciation)
The cost and unrealized appreciation (depreciation) in value of the investments owned at October 31, 2006 as determined on a federal income tax basis, were as follows:
| Aggregate cost | | $ | 1,034,351,844 | | |
| Gross unrealized appreciation | | $ | 39,964,465 | | |
| Gross unrealized depreciation | | | (8,152,535 | ) | |
| Net unrealized appreciation | | $ | 31,811,930 | | |
27
High Income Portfolio as of October 31, 2006
NOTES TO FINANCIAL STATEMENTS CONT'D
7 Restricted Securities
At October 31, 2006, the Portfolio owned the following securities (representing less than 0.1% of net assets) which were restricted as to public resale and not registered under the Securities Act of 1933 (excluding Rule 144A securities). The Portfolio has various registration rights (exercisable under a variety of circumstances) with respect to these securities. The fair value of these securities is determined based on valuations provided by brokers when available, or if not available, they are valued at fair value using methods determined in good faith by or at the direction of the Trustees.
| Description | | Date of
Acquisition | | Shares | | Cost | | Fair Value | |
| Common Stocks and Warrants | |
Mirant Corp.,
Escrow Certificate | | 1/5/06 | | | 3,200,000 | | | $ | 0 | | | $ | 40,000 | | |
Peninsula Gaming LLC,
Convertible Preferred
Membership Interests | | 7/08/99 | | | 25,351 | | | | 0 | (1) | | | 152,107 | | |
| | | $ | 0 | | | $ | 192,107 | | |
(1) Less than $0.50.
8 Recently Issued Accounting Pronouncements
In June 2006, the Financial Accounting Standards Board ("FASB") issued FASB Interpretation No. 48, ("FIN 48") "Accounting for Uncertainty in Income Taxes – an interpretation of FASB Statement No. 109". FIN 48 clarifies the accounting for uncertainty in income taxes recognized in accordance with FASB Statement No. 109, "Accounting for Income Taxes." This interpretation prescribes a recognition threshold and measurement attribute for the financial statement recognition and measurement of a tax position taken or expected to be taken in a tax return. It also provides guidance on de-recognition, classification, interest and penalties, accounting in interim periods, disclosure and transition. FIN 48 is effective for fiscal years beginning after December 15, 2006. Management is currently evaluating the impact of applying the various provisions of FIN 48.
In September 2006, the Financial Accounting Standards Board ("FASB") issued Statement of Financial Accounting Standards No. 157, ("FAS 157") "Fair Value Measurements". FAS 157 defines fair value, establishes a framework for measuring fair value in accordance with generally accepted accounting principles and expands disclosure about fair value measurements. FAS 157 is effective for fiscal years beginning after November 15, 2007. Management is currently evaluating the impact the adoption of FAS 157 will have on the Portfolio's financial statement disclosures.
28
High Income Portfolio as of October 31, 2006
REPORT OF INDEPENDENT REGISTERED PUBLIC ACCOUNTING FIRM
To the Trustees and Shareholders
of High Income Portfolio:
We have audited the accompanying statement of assets and liabilities, including the portfolio of investments, of High Income Portfolio (the Portfolio) as of October 31, 2006 and the related statements of operations for the year then ended, the statement of changes in net assets for each of the two years in the period then ended, and the supplementary data for each of the years in the five years in the period then ended. These financial statements and supplementary data are the responsibility of the Portfolio's management. Our responsibility is to express an opinion on these financial statements and supplementary data based on our audits.
We conducted our audits in accordance with standards of the Public Company Accounting Oversight Board (United States). Those standards require that we plan and perform the audits to obtain reasonable assurance about whether the financial statements and supplementary data are free of material misstatement. The Portfolio is not required to have, nor were we engaged to perform, an audit of its internal control over financial reporting. Our audits included consideration of internal control over financial reporting as a basis for designing audit procedures that are appropriate in the circumstances, but not for the purpose of expressing an opinion on the effectiveness of the Portfolio's internal control over financial reporting. Accordingly, we express no such opinion. An audit also includes examining, on a test basis, evidence supporting the amounts and disclosures in the financial statements, assessing the accounting principles used and significant estimates made by management, as well as evaluating the overall financial statement presentation. Our procedures included confirmation of securities held at October 31, 2006 by correspondence with the custodian, brokers and agent banks; where replies were not received from brokers and agent banks, we performed other auditing procedures. We believe that our audits provide a reasonable basis for our opinion.
In our opinion, the financial statements and supplementary data referred to above present fairly, in all material respects, the financial position of the High Income Portfolio at October 31, 2006, the results of its operations for the year then ended, the changes in its net assets for each of the two years in the period then ended, and the supplementary data for each of the five years in the period then ended, in conformity with accounting principles generally accepted in the United States of America.
DELOITTE & TOUCHE LLP
Boston, Massachusetts
December 15, 2006
29
Eaton Vance High Income Fund as of October 31, 2006
FEDERAL TAX INFORMATION (Unaudited)
The Form 1099-DIV you receive in January 2007 will show the tax status of all distributions paid to your account in calendar 2006. Shareholders are advised to consult their own tax adviser with respect to the tax consequences of their investment in the Fund.
30
Eaton Vance High Income Fund
BOARD OF TRUSTEES' ANNUAL APPROVAL OF THE INVESTMENT ADVISORY AGREEMENT
Overview of the Contract Review Process
The Investment Company Act of 1940, as amended (the "1940 Act"), provides, in substance, that each investment advisory agreement between a fund and its investment adviser will continue in effect from year to year only if its continuance is approved at least annually by the fund's board of trustees, including by a vote of a majority of the trustees who are not "interested persons" of the fund ("Independent Trustees") cast in person at a meeting called for the purpose of considering such approval.
At a meeting of the Boards of Trustees (each a "Board") of the Eaton Vance group of mutual funds (the "Eaton Vance Funds") held on March 27, 2006, the Board, including a majority of the Independent Trustees, voted to approve continuation of existing advisory and sub-advisory agreements for the Eaton Vance Funds for an additional one-year period. In voting its approval, the Board relied upon the affirmative recommendation of the Special Committee of the Board, which is a committee comprised exclusively of Independent Trustees. Prior to making its recommendation, the Special Committee reviewed information furnished for a series of meetings of the Special Committee held in February and March 2006. Such information included, among other things, the following:
Information about Fees, Performance and Expenses
• An independent report comparing the advisory and related fees paid by each fund with fees paid by comparable funds;
• An independent report comparing each fund's total expense ratio and its components to comparable funds;
• An independent report comparing the investment performance of each fund to the investment performance of comparable funds over various time periods;
• Data regarding investment performance in comparison to relevant peer groups of funds and appropriate indices;
• Comparative information concerning fees charged by each adviser for managing other mutual funds and institutional accounts using investment strategies and techniques similar to those used in managing the fund;
• Profitability analyses for each adviser with respect to each fund managed by it;
Information about Portfolio Management
• Descriptions of the investment management services provided to each fund, including the investment strategies and processes employed;
• Information concerning the allocation of brokerage and the benefits received by each adviser as a result of brokerage allocation, including information concerning the acquisition of research through "soft dollar" benefits received in connection with the funds' brokerage, and the implementation of a soft dollar reimbursement program established with respect to the funds;
• Data relating to portfolio turnover rates of each fund;
• The procedures and processes used to determine the fair value of fund assets and actions taken to monitor and test the effectiveness of such procedures and processes;
Information about each Adviser
• Reports detailing the financial results and condition of each adviser;
• Descriptions of the qualifications, education and experience of the individual investment professionals whose responsibilities include portfolio management and investment research for the funds, and information relating to their compensation and responsibilities with respect to managing other mutual funds and investment accounts;
• Copies of the Codes of Ethics of each adviser and its affiliates, together with information relating to compliance with and the administration of such codes;
• Information concerning the resources devoted to compliance efforts undertaken by each adviser and its affiliates on behalf of the funds (including descriptions of various compliance programs) and their record of compliance with investment policies and restrictions, including policies with respect to market-timing, late trading and selective portfolio disclosure, and with policies on personal securities transactions;
• Descriptions of the business continuity and disaster recovery plans of each adviser and its affiliates;
Other Relevant Information
• Information concerning the nature, cost and character of the administrative and other non-investment management services provided by Eaton Vance Management and its affiliates;
• Information concerning management of the relationship with the custodian, subcustodians and fund accountants by each adviser or the funds' administrator; and
• The terms of each advisory agreement.
In addition to the information identified above, the Special Committee considered information provided from time to time by each adviser throughout the year at meetings of the Board and its committees. Over the course of the twelve month period ended March 31, 2006, the Board met nine times and the Special Committee, the Audit Committee and the Governance Committee, each of
31
Eaton Vance High Income Fund
BOARD OF TRUSTEES' ANNUAL APPROVAL OF THE INVESTMENT ADVISORY AGREEMENT CONT'D
which is a Committee comprised solely of Independent Trustees, met eight, twelve and five times, respectively. At such meetings, the Trustees received, among other things, presentations by the portfolio managers and other investment professionals of each adviser relating to the investment performance of each fund and the investment strategies used in pursuing the fund's investment objective.
For funds that invest through one or more underlying portfolios, the Board considered similar information about the portfolio(s) when considering the approval of advisory agreements. In addition, in cases where the fund's investment adviser has engaged a sub-adviser, the Board considered similar information about the sub-adviser when considering the approval of any sub-advisory agreement.
The Special Committee was assisted throughout the contract review process by Goodwin Procter LLP, legal counsel for the Independent Trustees. The members of the Special Committee relied upon the advice of such counsel and their own business judgment in determining the material factors to be considered in evaluating each advisory and sub-advisory agreement and the weight to be given to each such factor. The conclusions reached with respect to each advisory and sub-advisory agreement were based on a comprehensive evaluation of all the information provided and not any single factor. Moreover, each member of the Special Committee may have placed varying emphasis on particular factors in reaching conclusions with respect to each advisory and sub-advisory agreement.
Results of the Process
Based on its consideration of the foregoing, and such other information as it deemed relevant, including the factors and conclusions described below, the Special Committee concluded that the continuance of the investment advisory agreement of the High Income Portfolio (the "Portfolio"), the portfolio in which the High Income Fund (the "Fund") invests, with Boston Management and Research (the "Adviser"), including the fee structure, is in the interests of shareholders and, therefore, the Special Committee recommended to the Board approval of the agreement. The Board accepted the recommendation of the Special Committee as well as the factors considered and conclusions reached by the Special Committee with respect to the agreement. Accordingly, the Board, including a majority of the Independent Trustees, voted to approve continuation of the investment advisory agreement for the Portfolio.
Nature, Extent and Quality of Services
In considering whether to approve the investment advisory agreement of the Portfolio, the Board evaluated the nature, extent and quality of services provided to the Portfolio by the Adviser.
The Board considered the Adviser's management capabilities and investment process with respect to the types of investments held by the Portfolio, including the education, experience and number of its investment professionals and other personnel who provide portfolio management, investment research, and similar services to the Portfolio. In particular, the Board evaluated the abilities and experience of such investment personnel in analyzing special considerations relevant to investing in high-yield debt. The Board also took into account the resources dedicated to portfolio management and other services, including the compensation paid to recruit and retain investment personnel, and the time and attention devoted to each Portfolio in the complex by senior management.
The Board reviewed the compliance programs of the Adviser and and relevant affiliates thereof. Among other matters, the Board considered compliance and reporting matters relating to personal trading by investment personnel, selective disclosure of portfolio holdings, late trading, frequent trading, portfolio valuation, business continuity and the allocation of investment opportunities. The Board also evaluated the responses of the Adviser and its affiliates to requests from regulatory authorities such as the Securities and Exchange Commission and the National Association of Securities Dealers.
The Board considered shareholder and other administrative services provided or managed by Eaton Vance Management and its affiliates, including transfer agency and accounting services. The Board evaluated the benefits to shareholders of investing in a fund that is a part of a large family of funds, including the ability, in many cases, to exchange an investment among different funds without incurring additional sales charges.
After consideration of the foregoing factors, among others, the Board concluded that the nature, extent and quality of services provided by the Adviser, taken as a whole, are appropriate and consistent with the terms of the investment advisory agreement.
Fund Performance
The Board compared the Fund's investment performance to a relevant universe of similarly managed funds identified by an independent data provider and appropriate benchmark indices. The Board reviewed comparative performance data for the one-, three-, five- and ten-year periods ended September 30, 2005 for the Fund. The Board concluded that the performance of the Fund was satisfactory.
Management Fees and Expenses
The Board reviewed contractual investment advisory fee rates payable by the Fund (referred to as "management fees").
32
Eaton Vance High Income Fund
BOARD OF TRUSTEES' ANNUAL APPROVAL OF THE INVESTMENT ADVISORY AGREEMENT CONT'D
As part of its review, the Board considered the management fees and the Fund's total expense ratio for the one-year period ended September 30, 2005, as compared to a group of similarly managed funds selected by an independent data provider.
After reviewing the foregoing information, and in light of the nature, extent and quality of the services provided by the Adviser, the Board concluded that the management fees charged for advisory and related services and the Fund's total expense ratio are reasonable.
Profitability
The Board reviewed the level of profits realized by the Adviser and its affiliates in providing investment advisory and administrative services to the Fund, the Portfolio and all Eaton Vance Funds as a group. The Board considered the level of profits realized without regard to revenue sharing or other payments by the Adviser and its affiliates to third parties in respect of distribution services. The Board also considered other direct or indirect benefits received by the Adviser and its affiliates in connection with its relationship with the Fund and the Portfolio.
The Board concluded that, in light of the foregoing factors and the nature, extent and quality of the services rendered, the profits realized by the Adviser and its affiliates are reasonable.
Economies of Scale
In reviewing management fees and profitability, the Board also considered the extent to which the Adviser and its affiliates, on the one hand, and the Fund, on the other hand, can expect to realize benefits from economies of scale as the assets of the Fund and the Portfolio increase. The Board acknowledged the difficulty in accurately measuring the benefits resulting from the economies of scale with respect to the management of any specific fund or group of funds. The Board reviewed data summarizing the increases and decreases in the assets of the Fund and of all Eaton Vance Funds as a group over various time periods, and evaluated the extent to which the total expense ratio of the Fund and the profitability of the Adviser and its affiliates may have been affected by such increases or decreases. Based upon the foregoing, the Board concluded that the benefits from economies of scale are currently being shared equitably by the Adv iser and its affiliates and the Fund. The Board also concluded that, assuming reasonably foreseeable increases in the assets of the Portfolio, the structure of the advisory fee, which includes breakpoints at several asset levels, can be expected to cause the Adviser and its affiliates and the Fund to continue to share such benefits equitably.
33
Eaton Vance High Income Fund
MANAGEMENT AND ORGANIZATION
Fund Management. The Trustees of Eaton Vance Mutual Funds Trust (the Trust) and High Income Portfolio (the Portfolio) are responsible for the overall management and supervision of the Trust's and Portfolio's affairs. The Trustees and officers of the Trust and the Portfolio are listed below. Except as indicated, each individual has held the office shown or other offices in the same company for the last five years. Trustees and officers of the Trust and the Portfolio hold indefinite terms of office. The "noninterested Trustees" consist of those Trustees who are not "interested persons" of the Trust and the Portfolio, as that term is defined under the 1940 Act. The business address of each Trustee and officer is The Eaton Vance Building, 255 State Street, Boston, Massachusetts 02109. As used below, "EVC" refers to Eaton Vance Corp., "EV" refers to Eaton Vance, Inc., "EVM" refers to Eaton Vance Management, "BMR" refers to Boston Management and Research "Parametric" refers to Parametric Portfolio Associates and "EVD" refers to Eaton Vance Distributors, Inc. EVC and EV are the corporate parent and trustee, respectively, of EVM and BMR. EVD is the Fund's principal underwriter, the Portfolio's placement agent and a wholly-owned subsidiary of EVM. Each officer affiliated with Eaton Vance may hold a position with other Eaton Vance affiliates that is comparable to his or her position with EVM listed below.
Name and
Date of Birth | | Position(s)
with the
Trust and
Portfolio | | Term of
Office and
Length of
Service | | Principal Occupation(s)
During Past Five Years | | Number of Portfolios
in Fund Complex
Overseen By
Trustee(1) | | Other Directorships Held | |
| Interested Trustee | | | | | | | | | | | | | |
|
| James B. Hawkes 11/9/41 | | Trustee | | Trustee of the Trust since 1991 and of the Portfolio since 1992 | | Chairman and Chief Executive Officer of EVC, BMR, EVM and EV; Director of EV; Vice President and Director of EVD. Trustee and/or officer of 170 registered investment companies in the Eaton Vance Fund Complex. Mr. Hawkes is an interested person because of his positions with BMR, EVM, EVC and EV, which are affiliates of the Trust and the Portfolio. | | | 170 | | | Director of EVC | |
|
| Noninterested Trustee(s) | | | | | | | | | | | | | |
|
| Benjamin C. Esty 1/2/63 | | Trustee | | Since 2005 | | Roy and Elizabeth Simmons Professor of Business Administration, Harvard University Graduate School of Business Administration (since 2003). Formerly, Associate Professor, Harvard University Graduate School of Business Administration (2000-2003). | | | 170 | | | None | |
|
| Samuel L. Hayes, III 2/23/35 | | Trustee and Chairman of the Board | | Trustee of the Trust since 1986; of the Portfolio since 1993 and Chairman of the Board since 2005 | | Jacob H. Schiff Professor of Investment Banking Emeritus, Harvard University Graduate School of Business Administration. Director of Yakima Products, Inc. (manufacturer of automotive accessories) (since 2001) and Director of Telect, Inc. (telecommunications services company). | | | 170 | | | Director of Tiffany & Co. (specialty retailer) | |
|
| William H. Park 9/19/47 | | Trustee | | Since 2003 | | Vice Chairman, Commercial Industrial Finance Corp. (specialty finance company) (since 2006). Formerly, President and Chief Executive Officer, Prizm Capital Management, LLC (investment management firm) (2002-2005). Formerly, Executive Vice President and Chief Financial Officer, United Asset Management Corporation (a holding company owning institutional investment management firms) (1982-2001). | | | 170 | | | None | |
|
34
Eaton Vance High Income Fund
MANAGEMENT AND ORGANIZATION CONT'D
Name and
Date of Birth | | Position(s)
with the
Trust and
Portfolio | | Term of
Office and
Length of
Service | | Principal Occupation(s)
During Past Five Years | | Number of Portfolios
in Fund Complex
Overseen By
Trustee(1) | | Other Directorships Held | |
| Noninterested Trustee(s) (continued) | | | | | | | | | | | | | |
|
| Ronald A. Pearlman 40 | | Trustee | | Since 2003 | | Professor of Law, Georgetown University Law Center. | | | 170 | | | None | |
|
| Norton H. Reamer 9/21/35 | | Trustee | | Trustee of the Trust since 1986 and of the Portfolio since 1993 | | President, Chief Executive Officer and a Director of Asset Management Finance Corp. (a specialty finance company serving the investment management industry) (since October 2003). President, Unicorn Corporation (an investment and financial advisory services company) (since September 2000). Formerly, Chairman and Chief Operating Officer, Hellman, Jordan Management Co., Inc. (an investment management company) (2000-2003). Formerly, Advisory Director of Berkshire Capital Corporation (investment banking firm) (2002-2003). | | | 170 | | | None | |
|
| Lynn A. Stout 9/14/57 | | Trustee | | Since 1998 | | Professor of Law, University of California at Los Angeles School of Law. | | | 170 | | | None | |
|
| Ralph F. Verni 1/26/43 | | Trustee | | Since 2005 | | Consultant and private investor. | | | 170 | | | None | |
|
| Principal Officers who are not Trustees | | | | | | | | | | | | | |
|
Name and
Date of Birth | | Position(s)
with the
Trust and the
Portfolios | | Term of
Office and
Length of
Service | | Principal Occupation(s)
During Past Five Years | |
| Thomas E. Faust Jr. 5/31/58 | | President of the Trust | | Since 2002 | | President of EVC, EVM, BMR, and EV and Director of EVC. Chief Investment Officer of EVC, EVM and BMR. Officer of 71 registered investment companies and 5 private investment companies managed by EVM or BMR. | |
|
| William H. Ahern, Jr. 7/28/59 | | Vice President of the Trust | | Since 1995 | | Vice President of EVM and BMR. Officer of 71 registered investment companies managed by EVM or BMR. | |
|
| Cynthia J. Clemson 3/2/63 | | Vice President of the Trust | | Since 2005 | | Vice President of EVM and BMR. Officer of 86 registered investment companies managed by EVM or BMR. | |
|
| Kevin S. Dyer 2/21/75 | | Vice President of the Trust | | Since 2005 | | Assistant Vice President of EVM and BMR. Officer of 25 registered investment companies managed by EVM or BMR. | |
|
| Thomas P. Huggins 3/7/66 | | Vice President of the Portfolio | | Since 2000 | | Vice President of EVM and BMR. Officer of 4 registered investment companies managed by EVM or BMR. | |
|
| Aamer Khan 6/7/60 | | Vice President of the Trust | | Since 2005 | | Vice President of EVM and BMR. Officer of 29 registered investment companies managed by EVM or BMR. | |
|
| Thomas H. Luster 4/8/62 | | Vice President of the Trust | | Since 2006 | | Vice President of EVM and BMR. Officer of 45 registered investment companies managed by EVM or BMR. | |
|
| Michael R. Mach 7/15/47 | | Vice President of the Trust | | Since 1999 | | Vice President of EVM and BMR. Officer of 51 registered investment companies managed by EVM or BMR. | |
|
| Robert B. MacIntosh 1/22/57 | | Vice President of the Trust | | Since 1998 | | Vice President of EVM and BMR. Officer of 86 registered investment companies managed by EVM or BMR. | |
|
| Cliff Quisenberry, Jr. 1/1/65 | | Vice President of the Trust | | Since 2006 | | Vice President and Director of Research and Product Development of Parametric. Officer of 30 registered investment companies managed by EVM or BMR. | |
|
35
Eaton Vance High Income Fund
MANAGEMENT AND ORGANIZATION CONT'D
Name and
Date of Birth | | Position(s)
with the
Trust and the
Portfolios | | Term of
Office and
Length of
Service | | Principal Occupation(s)
During Past Five Years | |
| Duncan W. Richardson 10/26/57 | | Vice President of the Trust | | Since 2001 | | Executive Vice President and Chief Equity Investment Officer of EVC, EVM and BMR. Officer 71 registered investment companies managed by EVM or BMR. | |
|
| Walter A. Row, III 7/20/57 | | Vice President of the Trust | | Since 2001 | | Director of Equity Research and a Vice President of EVM and BMR. Officer of 33 registered investment companies managed by EVM or BMR. | |
|
| Judith A. Saryan 8/21/54 | | Vice President of the Trust | | Since 2003 | | Vice President of EVM and BMR. Officer of 50 registered investment companies managed by EVM or BMR. | |
|
| Susan Schiff 3/13/61 | | Vice President of the Trust | | Since 2002 | | Vice President of EVM and BMR. Officer of 30 registered investment companies managed by EVM or BMR. | |
|
| Michael W. Weilheimer 2/11/61 | | President of the Portfolio | | Since 2002(2) | | Vice President of EVM and BMR. Officer of 24 registered investment companies managed by EVM or BMR. | |
|
| Barbara E. Campbell 6/19/57 | | Treasurer of the Trust | | Since 2005(2) | | Vice President of EVM and BMR. Officer of 170 registered investment companies managed by EVM or BMR. | |
|
| Dan A. Maalouly 3/25/62 | | Treasurer of the Portfolio | | Since 2005 | | Vice President of EVM and BMR. Previously Senior Manager at Pricewaterhouse Coopers LLP (1997-2005). Officer of 71 registered investment companies managed by EVM or BMR. | |
|
| Alan R. Dynner 10/10/40 | | Secretary | | Since 1997 | | Vice President, Secretary and Chief Legal Officer of BMR, EVM, EVD, EV and EVC. Officer of 170 registered investment companies managed by EVM or BMR. | |
|
| Paul M. O'Neil 7/11/53 | | Chief Compliance Officer | | Since 2004 | | Vice President of EVM and BMR. Officer of 170 registered investment companies managed by EVM or BMR. | |
|
(1) Includes both master and feeder funds in a master-feeder structure.
(2) Prior to 2002, Mr. Weilheimer served as Vice President of the Portfolio since 1995. Prior to 2005, Ms. Campbell served as Assistant Treasurer of the Trust since 1995.
The SAI for the Fund includes additional information about the Trustees and officers of the Fund and the Portfolio and can be obtained without charge on Eaton Vance's website at www.eatonvance.com or by calling 1-800-225-6265.
36
Investment Adviser of High Income Portfolio
Boston Management and Research
The Eaton Vance Building
255 State Street
Boston, MA 02109
Administrator of Eaton Vance High Income Fund
Eaton Vance Management
The Eaton Vance Building
255 State Street
Boston, MA 02109
Principal Underwriter
Eaton Vance Distributors, Inc.
The Eaton Vance Building
255 State Street
Boston, MA 02109
(617) 482-8260
Custodian
Investors Bank & Trust Company
200 Clarendon Street
Boston, MA 02116
Transfer Agent
PFPC Inc.
Attn: Eaton Vance Funds
P.O. Box 9653
Providence, RI 02940-9653
(800) 262-1122
Independent Registered Public Accounting Firm
Deloitte & Touche LLP
200 Berkeley Street
Boston, MA 02116-5022
Eaton Vance High Income Fund
The Eaton Vance Building
255 State Street
Boston, MA 02109
This report must be preceded or accompanied by a current prospectus. Before investing, investors should consider carefully the Fund's investment objective(s), risks, and charges and expenses. The Fund's current prospectus contains this and other information about the Fund and is available through your financial advisor. Please read the prospectus carefully before you invest or send money. For further information please call 1-800-225-6265.
446-12/06 HISRC

Annual Report October 31, 2006


EATON VANCE
GOVERNMENT
OBLIGATIONS
FUND
IMPORTANT NOTICES REGARDING PRIVACY,
DELIVERY OF SHAREHOLDER DOCUMENTS,
PORTFOLIO HOLDINGS AND PROXY VOTING
Privacy. The Eaton Vance organization is committed to ensuring your financial privacy. Each of the financial institutions identified below has in effect the following policy ("Privacy Policy") with respect to nonpublic personal information about its customers:
• Only such information received from you, through application forms or otherwise, and information about your Eaton Vance fund transactions will be collected. This may include information such as name, address, social security number, tax status, account balances and transactions.
• None of such information about you (or former customers) will be disclosed to anyone, except as permitted by law (which includes disclosure to employees necessary to service your account). In the normal course of servicing a customer's account, Eaton Vance may share information with unaffiliated third parties that perform various required services such as transfer agents, custodians and broker/dealers.
• Policies and procedures (including physical, electronic and procedural safeguards) are in place that are designed to protect the confidentiality of such information.
• We reserve the right to change our Privacy Policy at any time upon proper notification to you. Customers may want to review our Policy periodically for changes by accessing the link on our homepage: www.eatonvance.com.
Our pledge of privacy applies to the following entities within the Eaton Vance organization: the Eaton Vance Family of Funds, Eaton Vance Management, Eaton Vance Investment Counsel, Boston Management and Research, and Eaton Vance Distributors, Inc.
In addition, our Privacy Policy only applies to those Eaton Vance customers who are individuals and who have a direct relationship with us. If a customer's account (i.e., fund shares) is held in the name of a third-party financial adviser/broker-dealer, it is likely that only such adviser's privacy policies apply to the customer. This notice supersedes all previously issued privacy disclosures.
For more information about Eaton Vance's Privacy Policy, please call 1-800-262-1122.
Delivery of Shareholder Documents. The Securities and Exchange Commission (the "SEC") permits funds to deliver only one copy of shareholder documents, including prospectuses, proxy statements and shareholder reports, to fund investors with multiple accounts at the same residential or post office box address. This practice is often called "householding" and it helps eliminate duplicate mailings to shareholders.
Eaton Vance, or your financial adviser, may household the mailing of your documents indefinitely unless you instruct Eaton Vance, or your financial adviser, otherwise.
If you would prefer that your Eaton Vance documents not be householded, please contact Eaton Vance at 1-800-262-1122, or contact your financial adviser.
Your instructions that householding not apply to delivery of your Eaton Vance documents will be effective within 30 days of receipt by Eaton Vance or your financial adviser.
Portfolio Holdings. Each Eaton Vance Fund and its underlying Portfolio (if applicable) will file a schedule of its portfolio holdings on Form N-Q with the SEC for the first and third quarters of each fiscal year. The Form N-Q will be available on the Eaton Vance website www.eatonvance.com, by calling Eaton Vance at 1-800-262-1122 or in the EDGAR database on the SEC's website at www.sec.gov. Form N-Q may also be reviewed and copied at the SEC's public reference room in Washington, D.C. (call 1-800-732-0330 for information on the operation of the public reference room).
Proxy Voting. From time to time, funds are required to vote proxies related to the securities held by the funds. The Eaton Vance Funds or their underlying Portfolios (if applicable) vote proxies according to a set of policies and procedures approved by the Funds' and Portfolios' Boards. You may obtain a description of these policies and procedures and information on how the Fund or Portfolio voted proxies relating to portfolio securities during the 12 month period ended June 30, without charge, upon request, by calling 1-800-262-1122. This description is also available on the SEC's website at www.sec.gov.
Eaton Vance Government Obligations Fund as of October 31, 2006
MANAGEMENT’S DISCUSSION OF FUND PERFORMANCE

Susan Schiff, CFA
Co-Portfolio Manager

Christine Johnston, CFA
Co-Portfolio Manager
Performance for the Past Year
· The Fund’s Class A shares had a total return of 4.28% for the year ended October 31, 2006.(1) This return resulted from a decrease in net asset value (NAV) per share to $7.20 on October 31, 2006, from $7.34 on October 31, 2005, and the reinvestment of $0.443 in distribution payments during the year. The Class A beginning NAV and certain dividends have been restated to reflect the effects of a stock split effective on November 11, 2005.
· The Fund’s Class B shares had a total return of 3.50% for the year ended October 31, 2006.(1) This return resulted from a decrease in NAV per share to $7.20 on October 31, 2006, from $7.34 on October 31, 2005, and the reinvestment of $0.388 in distribution payments during the year.
· The Fund’s Class C shares had a total return of 3.36% during the year ended October 31, 2006.(1) This return resulted from a decrease in NAV per share to $7.19 on October 31, 2006, from $7.34 on October 31, 2005, and the reinvestment of $0.388 in distribution payments during the year.
· The Fund’s Class R shares had a total return of 3.87% during the year ended October 31, 2006.(1) This return resulted from a decrease in NAV per share to $7.17 on October 31, 2006, from $7.32 on October 31, 2005, and the reinvestment of $0.424 in distribution payments during the year.
· In comparison, the Lehman Brothers Intermediate Government Bond Index – a broad-based, unmanaged market index of intermediate maturity U.S. Government bonds – had a total return of 4.47% during the year ended October 31, 2006.(2) For comparision, the Fund’s peer group, the Lipper Short-Intermediate U.S. Government Funds Classification, had an average total return of 3.81% during the same period.(2)
Recent Fund Developments
· The Fund currently invests its assets in a separate registered investment company with the same objective and policies as the Fund, Government Obligations Portfolio (the Portfolio). The fiscal year ended October 31, 2006 was favorable for the mortgage-backed securities (MBS) market, as spreads tightened further. During the 12 months ended October 31, 2006, the Federal Reserve raised the Federal Funds rate by 150 basis points (1.50%), from 3.75% to 5.25%. While yields in the short end of the yield curve rose with these changes, yields in the intermediate- to-long end of the curve were only slightly higher. Five-year Treasury bond yields rose by only 12 basis points (0.12%). Spreads on seasoned MBS – the Portfolio’s current focus when investing in MBS – narrowed by approximately 25 basis points (0.25%) relative to Treasuries. Spreads on MBS versus Treasuries remain at relatively tight levels historically; however, the market continued to be well-supported by strong demand from foreign buyers.
· Prepayment rates for MBS continued to edge lower during the fiscal year. Prepayment rates experienced by the Portfolio fell to around 15% by October 31, 2006, from around 18% a year ago. Lower prepayment rates were a favorable development for the Portfolio’s seasoned MBS, which have historically had more stable prepayment rates than generic MBS.
· The Portfolio’s duration was 3.20 years at October 31, 2006, up from 2.75 years on October 31, 2005. As a slower economy reduced the prospect of high inflation, management chose to extend modestly the Portfolio’s duration. Duration is an indicator – stated in years – that measures cash flows and expected maturity of a fixed-income security or portfolio, and is used to determine price sensitivity to changes in interest rates. A longer duration increases the Portfolio’s interest rate exposure. Management hopes to benefit from this exposure if interest rates decline in response to a weaker economy.
· Within its seasoned MBS holdings, the Portfolio reduced its exposure to premium high coupon MBS. Management added exposure to seasoned adjustablerate MBS, which benefited from rising interest rates in the short end of the yield curve.(3)
The views expressed throughout this report are those of the portfolio managers and are current only through the end of the period of the report as stated on the cover. These views are subject to change at any time based upon market or other conditions, and the investment adviser disclaims any responsibility to update such views. These views may not be relied on as investment advice and, because investment decisions for a fund are based on many factors, may not be relied on as an indication of trading intent on behalf of any Eaton Vance fund.
Fund shares are not insured by the FDIC and are not deposits or other obligations of, or guaranteed by, any depository institution. Shares are subject to investment risks, including possible loss of principal invested.
(1) | | These returns do not include the 4.75% maximum sales charge for the Fund’s Class A shares or the applicable contingent deferred sales charges (CDSC) for Class B shares and Class C shares. If sales charges were deducted, returns would be lower. Class R shares are offered to certain investors at net asset value. |
(2) | | It is not possible to invest directly in an Index or a Lipper Classification. The Index’s total returns do not reflect the commissions or expenses that would have been incurred if an investor individually purchased or sold the securities represented in the Index. The Lipper average is the average total return, at net asset value, of the funds that are in the same Lipper Classification as the Fund. |
(3) | | Portfolio investments may not be representative of the Portfolio’s current or future investments and may change due to active management. |
Past performance is no guarantee of future results. Returns are historical and are calculated by determining the percentage change in net asset value or offering price (as applicable) with all distributions reinvested. Investment return and principal value will fluctuate so that shares, when redeemed, may be worth more or less than their original cost. Performance is for the stated time period only; due to market volatility, the Fund’s current performance may be lower or higher than the quoted return. For performance as of the most recent month end, please refer to www.eatonvance.com
1
Eaton Vance Government Obligations Fund as of October 31, 2006
FUND PERFORMANCE
The line graph and table set forth below provide information about the Fund’s performance. The line graph compares the performance of Class A of the Fund with that of the Lehman Brothers Intermediate Government Bond Index, a broad-based, unmanaged market index of intermediate-maturity, U.S. Government bonds. The lines on the graph represent the total returns of a hypothetical investment of $10,000 in Class A of the Fund and in the Lehman Brothers Intermediate Government Bond Index. The chart also offers a comparison with the Lipper Short-Intermediate U.S. Government Funds Classification, the Fund’s peer Classification. Class A total returns are presented at net asset value and public offering price. The table includes the total returns of each Class of the Fund at net asset value and public offering price. The performance presented below does not reflect the deduction of taxes, if any, that a shareholder would pay on Fund distributions or the redemption of Fund shares.
Performance(1) | | Class A | | Class B | | Class C | | Class R | |
| | | | | | | | | |
Average Annual Total Returns (at net asset value) | | | | | | | | | |
One Year | | 4.28 | % | 3.50 | % | 3.36 | % | 3.87 | % |
Five Years | | 2.71 | | 1.93 | | 1.88 | | N.A. | |
Ten Years | | 4.77 | | 3.98 | | 3.91 | | N.A. | |
Life of Fund† | | 7.18 | | 4.13 | | 4.01 | | 3.06 | |
| | | | | | | | | |
SEC Average Annual Total Returns (including sales charge or applicable CDSC) | | | | | | | | | |
One Year | | -0.63 | % | -1.41 | % | 2.38 | % | 3.87 | % |
Five Years | | 1.72 | | 1.62 | | 1.88 | | N.A. | |
Ten Years | | 4.26 | | 3.98 | | 3.91 | | N.A. | |
Life of Fund† | | 6.95 | | 4.13 | | 4.01 | | 3.06 | |
† Inception Dates – Class A: 8/24/84; Class B: 11/1/93; Class C: 11/1/93; Class R: 8/12/05
(1) | | Average Annual Total Returns do not include the 4.75% maximum sales charge for Class A shares or the applicable contingent deferred sales charges (CDSC) for Class B or Class C shares. If sales charges were deducted, returns would be lower. Class R shares are offered to certain investors at net asset value. SEC Average Annual Total Returns for Class A reflect the maximum 4.75% sales charge. SEC Average Annual Total Returns for Class B reflect applicable CDSC based on the following schedule: 5% - 1st and 2nd years; 4% - 3rd year; 3% - 4th year; 2% - 5th year; 1% - 6th year. SEC 1-year return for Class C reflects a 1% CDSC. |
Past performance is no guarantee of future results. Returns are historical and are calculated by determining the percentage change in net asset value or offering price (as applicable) with all distributions reinvested. Investment return and principal value will fluctuate so that shares, when redeemed, may be worth more or less than their original cost. Performance is for the stated time period only; due to market volatility, the Fund’s current performance may be lower or higher than the quoted return. For performance as of the most recent month end, please refer to www.eatonvance.com
Diversification by Sectors(2)
By total investments
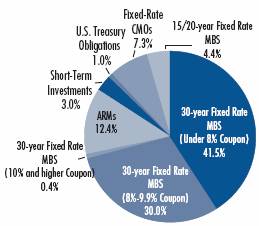
(2) As a percentage of the Portfolio’s total investments as of October 31, 2006. Portfolio information may not be representative of the Portfolio’s current or future investments and may change due to active management.
Comparison of Change in Value of a $10,000 Investment in Eaton Vance
Government Obligations Fund Class A vs. the Lehman Brothers Intermediate
Government Bond Index and Lipper Short-Intermediate U.S. Government Funds
Classification*

* Sources: Thomson Financial; Bloomberg, L.P. Class A of the Fund commenced operations on 8/24/84.
A $10,000 hypothetical investment at net asset value in Class B shares on 10/31/96, Class C shares on 10/31/96 and Class R shares on 8/12/05 would have been valued at $14,772, $14,679 and $10,375, respectively, on 10/31/06. The Index’s total return does not reflect the commissions or expenses that would have been incurred if an investor individually purchased or sold the securities represented in the Index. The Lipper average is the average total return, at net asset value, of the funds that are in the same Lipper Classification as the Fund. It is not possible to invest directly in an Index or Classification.
2
Eaton Vance Government Obligations Fund as of October 31, 2006
FUND EXPENSES
Example: As a shareholder of the Fund, you incur two types of costs: (1) transaction costs, including sales charges (loads) on purchases and redemption fees (if applicable); and (2) ongoing costs, including management fees; distribution or service fees; and other Fund expenses. This Example is intended to help you understand your ongoing costs (in dollars) of investing in the Fund and to compare these costs with the ongoing costs of investing in other mutual funds. The Example is based on an investment of $1,000 invested at the beginning of the period and held for the entire period (May 1, 2006 – October 31, 2006).
Actual Expenses: The first section of the table below provides information about actual account values and actual expenses. You may use the information in this section, together with the amount you invested, to estimate the expenses that you paid over the period. Simply divide your account value by $1,000 (for example, an $8,600 account value divided by $1,000 = 8.6), then multiply the result by the number in the first section under the heading entitled "Expenses Paid During Period" to estimate the expenses you paid on your account during this period.
Hypothetical Example for Comparison Purposes: The second section of the table below provides information about hypothetical account values and hypothetical expenses based on the Fund's actual expense ratio and an assumed rate of return of 5% per year (before expenses), which is not the actual return of the Fund. The hypothetical account values and expenses may not be used to estimate the actual ending account balance or expenses you paid for the period. You may use this information to compare the ongoing costs of investing in your Fund and other funds. To do so, compare this 5% hypothetical example with the 5% hypothetical examples that appear in the shareholder reports of the other funds.
Please note that the expenses shown in the table are meant to highlight your ongoing costs only and do not reflect any transactional costs, such as sales charges (loads) or redemption fees (if applicable). Therefore, the second section of the table is useful in comparing ongoing costs only, and will not help you determine the relative total costs of owning different funds. In addition, if these transactional costs were included, your costs would have been higher.
Eaton Vance Government Obligations Fund
| | | Beginning Account Value
(5/1/06) | | Ending Account Value
(10/31/06) | | Expenses Paid During Period*
(5/1/06 – 10/31/06) | |
| Actual | |
| Class A | | $ | 1,000.00 | | | $ | 1,029.30 | | | $ | 6.14 | | |
| Class B | | $ | 1,000.00 | | | $ | 1,025.40 | | | $ | 9.95 | | |
| Class C | | $ | 1,000.00 | | | $ | 1,025.50 | | | $ | 9.96 | | |
| Class R | | $ | 1,000.00 | | | $ | 1,028.00 | | | $ | 7.41 | | |
| Hypothetical | |
| (5% return per year before expenses) | |
| Class A | | $ | 1,000.00 | | | $ | 1,019.20 | | | $ | 6.11 | | |
| Class B | | $ | 1,000.00 | | | $ | 1,015.40 | | | $ | 9.91 | | |
| Class C | | $ | 1,000.00 | | | $ | 1,015.40 | | | $ | 9.91 | | |
| Class R | | $ | 1,000.00 | | | $ | 1,017.90 | | | $ | 7.38 | | |
* Expenses are equal to the Fund's annualized expense ratio of 1.20% for Class A shares, 1.95% for Class B shares, 1.95% for Class C shares and 1.45% for Class R shares, multiplied by the average account value over the period, multiplied by 184/365 (to reflect the one-half-year period). The example assumes that the $1,000 was invested at the net asset value per share determined at the close of business on April 30, 2006. The example reflects the expenses of both the Fund and the Portfolio.
3
Eaton Vance Government Obligations Fund as of October 31, 2006
FINANCIAL STATEMENTS
Statement of Assets and Liabilities
As of October 31, 2006
| Assets | |
Investment in Government Obligations Portfolio, at value
(identified cost, $602,580,990) | | $ | 601,026,666 | | |
| Receivable for Fund shares sold | | | 273,974 | | |
| Total assets | | $ | 601,300,640 | | |
| Liabilities | |
| Payable for Fund shares redeemed | | $ | 1,827,025 | | |
| Dividends payable | | | 1,140,328 | | |
| Payable to affiliate for distribution and service fees | | | 349,478 | | |
| Payable to affiliate for Trustees' fees | | | 282 | | |
| Accrued expenses | | | 184,488 | | |
| Total liabilities | | $ | 3,501,601 | | |
| Net Assets | | $ | 597,799,039 | | |
| Sources of Net Assets | |
| Paid-in capital | | $ | 831,852,944 | | |
Accumulated net realized loss from Portfolio (computed on
the basis of identified cost) | | | (231,359,256 | ) | |
| Accumulated distributions in excess of net investment income | | | (1,140,325 | ) | |
Net unrealized depreciation from Portfolio (computed on the basis of
identified cost) | | | (1,554,324 | ) | |
| Total | | $ | 597,799,039 | | |
| Class A Shares | |
| Net Assets | | $ | 251,751,250 | | |
| Shares Outstanding | | | 34,960,369 | | |
Net Asset Value and Redemption Price Per Share
(net assets ÷ shares of beneficial interest outstanding) | | $ | 7.20 | | |
Maximum Offering Price Per Share
(100 ÷ 95.25 of $7.20) | | $ | 7.56 | | |
| Class B Shares | |
| Net Assets | | $ | 215,849,991 | | |
| Shares Outstanding | | | 29,969,658 | | |
Net Asset Value, Offering Price and Redemption Price Per Share
(net assets ÷ shares of beneficial interest outstanding) | | $ | 7.20 | | |
| Class C Shares | |
| Net Assets | | $ | 129,963,246 | | |
| Shares Outstanding | | | 18,066,942 | | |
Net Asset Value, Offering Price and Redemption Price Per Share
(net assets ÷ shares of beneficial interest outstanding) | | $ | 7.19 | | |
| Class R Shares | |
| Net Assets | | $ | 234,552 | | |
| Shares Outstanding | | | 32,696 | | |
Net Asset Value, Offering Price and Redemption Price Per Share
(net assets ÷ shares of beneficial interest outstanding) | | $ | 7.17 | | |
| On sales of $25,000 or more, the offering price of Class A shares is reduced. | | | | | |
Statement of Operations
For the Year Ended
October 31, 2006
| Investment Income | |
| Interest allocated from Portfolio | | $ | 29,371,864 | | |
| Security lending income allocated from Portfolio, net | | | 3,272,549 | | |
| Expenses allocated from Portfolio | | | (5,311,346 | ) | |
| Net investment income from Portfolio | | $ | 27,333,067 | | |
| Expenses | |
| Trustees' fees and expenses | | | 3,422 | | |
Distribution and service fees
Class A | | | 661,467 | | |
| Class B | | | 2,500,708 | | |
| Class C | | | 1,529,872 | | |
| Class R | | | 516 | | |
| Transfer and dividend disbursing agent fees | | | 720,318 | | |
| Printing and postage | | | 101,576 | | |
| Registration fees | | | 73,121 | | |
| Legal and accounting services | | | 59,349 | | |
| Custodian fee | | | 35,943 | | |
| Miscellaneous | | | 8,291 | | |
| Total expenses | | $ | 5,694,583 | | |
| Net investment income | | $ | 21,638,484 | | |
Realized and Unrealized
Gain (Loss) from Portfolio | |
Net realized gain (loss) —
Investment transactions (identified cost basis) | | $ | 315,905 | | |
| Financial futures contracts | | | 2,112,959 | | |
| Net realized gain | | $ | 2,428,864 | | |
Change in unrealized appreciation (depreciation) —
Investments (identified cost basis) | | $ | 135,852 | | |
| Financial futures contracts | | | (174,127 | ) | |
| Net change in unrealized appreciation (depreciation) | | $ | (38,275 | ) | |
| Net realized and unrealized gain | | $ | 2,390,589 | | |
| Net increase in net assets from operations | | $ | 24,029,073 | | |
See notes to financial statements
4
Eaton Vance Government Obligations Fund as of October 31, 2006
FINANCIAL STATEMENTS CONT'D
Statements of Changes in Net Assets
Increase (Decrease)
in Net Assets | | Year Ended
October 31, 2006 | | Year Ended
October 31, 2005 | |
From operations —
Net investment income | | $ | 21,638,484 | | | $ | 20,261,321 | | |
Net realized gain from investment
transactions and financial
futures contracts | | | 2,428,864 | | | | 244,032 | | |
Net change in unrealized appreciation
(depreciation) from investments and
financial futures contracts | | | (38,275 | ) | | | (10,273,993 | ) | |
| Net increase in net assets from operations | | $ | 24,029,073 | | | $ | 10,231,360 | | |
Distributions to shareholders —
From net investment income
Class A | | $ | (15,568,109 | ) | | $ | (21,581,086 | ) | |
| Class B | | | (12,880,618 | ) | | | (20,634,084 | ) | |
| Class C | | | (7,901,783 | ) | | | (13,604,205 | ) | |
| Class R | | | (5,156 | ) | | | (23 | ) | |
Tax return of capital
Class A | | | (709,824 | ) | | | (115,024 | ) | |
| Class B | | | (670,288 | ) | | | (143,932 | ) | |
| Class C | | | (410,475 | ) | | | (94,653 | ) | |
| Class R | | | (282 | ) | | | (1 | ) | |
| Total distributions to shareholders | | $ | (38,146,535 | ) | | $ | (56,173,008 | ) | |
Transactions in shares of beneficial interest —
Proceeds from sale of shares
Class A | | $ | 41,089,168 | | | $ | 52,685,718 | | |
| Class B | | | 6,411,194 | | | | 14,632,405 | | |
| Class C | | | 13,857,350 | | | | 28,073,452 | | |
| Class R | | | 293,484 | | | | 2,045 | | |
Net asset value of shares issued to
shareholders in payment of
distributions declared
Class A | | | 9,120,793 | | | | 12,638,811 | | |
| Class B | | | 7,275,805 | | | | 11,588,822 | | |
| Class C | | | 4,138,553 | | | | 7,056,869 | | |
| Class R | | | 5,438 | | | | 24 | | |
Cost of shares redeemed
Class A | | | (92,544,876 | ) | | | (116,893,744 | ) | |
| Class B | | | (75,976,705 | ) | | | (102,325,855 | ) | |
| Class C | | | (66,912,717 | ) | | | (113,209,077 | ) | |
| Class R | | | (67,280 | ) | | | — | | |
Net asset value of shares exchanged
Class A | | | 7,553,835 | | | | 5,995,992 | | |
| Class B | | | (7,553,835 | ) | | | (5,995,992 | ) | |
Net decrease in net assets from Fund
share transactions | | $ | (153,309,793 | ) | | $ | (205,750,530 | ) | |
| Net decrease in net assets | | $ | (167,427,255 | ) | | $ | (251,692,178 | ) | |
| Net Assets | | Year Ended
October 31, 2006 | | Year Ended
October 31, 2005 | |
| At beginning of year | | $ | 765,226,294 | | | $ | 1,016,918,472 | | |
| At end of year | | $ | 597,799,039 | | | $ | 765,226,294 | | |
Accumulated
distributions in excess of
net investment income
included in net assets | |
| At end of year | | $ | (1,140,325 | ) | | $ | (1,936,789 | ) | |
See notes to financial statements
5
Eaton Vance Government Obligations Fund as of October 31, 2006
FINANCIAL STATEMENTS CONT'D
Financial Highlights
| | | Class A | |
| | | Year Ended October 31, | | Period Ended | | Year Ended December 31, | |
| | | 2006(1) | | 2005(1)(2) | | October 31, 2004(1)(2)(3) | | 2003(1)(2) | | 2002(1)(2) | | 2001(1)(2)(4) | |
| Net asset value — Beginning of period | | $ | 7.340 | (2) | | $ | 7.740 | | | $ | 8.050 | | | $ | 8.620 | | | $ | 8.580 | | | $ | 8.460 | | |
| Income (loss) from operations | |
| Net investment income | | $ | 0.266 | | | $ | 0.212 | | | $ | 0.215 | | | $ | 0.159 | | | $ | 0.346 | | | $ | 0.473 | | |
| Net realized and unrealized gain (loss) | | | 0.037 | | | | (0.090 | ) | | | (0.065 | ) | | | (0.177 | ) | | | 0.298 | | | | 0.268 | | |
| Total income (loss) from operations | | $ | 0.303 | | | $ | 0.122 | | | $ | 0.150 | | | $ | (0.018 | ) | | $ | 0.644 | | | $ | 0.741 | | |
| Less distributions | |
| From net investment income | | $ | (0.424 | )(2) | | $ | (0.519 | ) | | $ | (0.460 | ) | | $ | (0.548 | ) | | $ | (0.581 | ) | | $ | (0.621 | ) | |
| From tax return of capital | | | (0.019 | ) | | | (0.003 | ) | | | — | | | | (0.004 | ) | | | (0.023 | ) | | | — | | |
| Total distributions | | $ | (0.443 | ) | | $ | (0.522 | ) | | $ | (0.460 | ) | | $ | (0.552 | ) | | $ | (0.604 | ) | | $ | (0.621 | ) | |
| Net asset value — End of period | | $ | 7.200 | | | $ | 7.340 | | | $ | 7.740 | | | $ | 8.050 | | | $ | 8.620 | | | $ | 8.580 | | |
| Total Return(5) | | | 4.28 | % | | | 2.03 | %(6) | | | 1.91 | % | | | (0.35 | )% | | | 7.84 | % | | | 9.06 | % | |
| Ratios/Supplemental Data | |
| Net assets, end of period (000's omitted) | | $ | 251,751 | | | $ | 291,931 | | | $ | 354,083 | | | $ | 435,022 | | | $ | 474,595 | | | $ | 291,249 | | |
| Ratios (As a percentage of average daily net assets): | |
| Expenses before custodian fee reduction(7) | | | 1.20 | % | | | 1.18 | % | | | 1.13 | %(9) | | | 1.06 | % | | | 1.11 | % | | | 1.25 | % | |
| Expenses after custodian fee reduction(7) | | | 1.20 | % | | | 1.18 | % | | | 1.13 | %(9) | | | 1.06 | % | | | 1.11 | % | | | 1.25 | % | |
| Interest expense(7) | | | 0.00 | %(8) | | | 0.00 | %(8) | | | 0.00 | %(8)(9) | | | 0.01 | % | | | 0.00 | %(8) | | | 0.02 | % | |
| Net investment income | | | 3.69 | % | | | 2.82 | % | | | 3.27 | %(9) | | | 1.90 | % | | | 4.03 | % | | | 5.50 | % | |
| Portfolio Turnover of the Portfolio | | | 2 | % | | | 30 | % | | | 5 | % | | | 67 | % | | | 41 | % | | | 21 | % | |
(1) Net investment income per share was computed using average shares outstanding.
(2) Per share data have been restated to reflect the effects of a 1.1594595-for-1 stock split effective on November 11, 2005.
(3) For the ten-month period ended October 31, 2004.
(4) The Fund, through its investment in the Portfolio, adopted the provisions of the revised AICPA Audit and Accounting Guide for Investment Companies and began amortizing market premium on fixed-income securities. Additionally, the Portfolio reclassified net losses realized on prepayments received on mortgage-backed securities that were previously included in realized gains/losses to interest income. The effect of these changes on net investment income per share and on the ratio of net investment income to average net assets for the year ended December 31, 2001 was a decrease of $0.139 per share and 1.61%, respectively.
(5) Returns are historical and are calculated by determining the percentage change in net asset value with all distributions reinvested. Total return is not computed on an annualized basis.
(6) Total return reflects an increase of 0.31% due to the change in the timing of the payment and reinvestment of distributions.
(7) Includes the Fund's share of the Portfolio's allocated expenses.
(8) Represents less than 0.01%.
(9) Annualized.
See notes to financial statements
6
Eaton Vance Government Obligations Fund as of October 31, 2006
FINANCIAL STATEMENTS CONT'D
Financial Highlights
| | | Class B | |
| | | Year Ended October 31, | | Period Ended | | Year Ended December 31, | |
| | | 2006(1) | | 2005(1) | | October 31, 2004(1)(2) | | 2003(1) | | 2002(1) | | 2001(1)(3) | |
| Net asset value — Beginning of period | | $ | 7.340 | | | $ | 7.740 | | | $ | 8.040 | | | $ | 8.610 | | | $ | 8.570 | | | $ | 8.450 | | |
| Income (loss) from operations | |
| Net investment income | | $ | 0.213 | | | $ | 0.156 | | | $ | 0.166 | | | $ | 0.096 | | | $ | 0.282 | | | $ | 0.409 | | |
| Net realized and unrealized gain (loss) | | | 0.035 | | | | (0.094 | ) | | | (0.060 | ) | | | (0.179 | ) | | | 0.297 | | | | 0.266 | | |
| Total income (loss) from operations | | $ | 0.248 | | | $ | 0.062 | | | $ | 0.106 | | | $ | (0.083 | ) | | $ | 0.579 | | | $ | 0.675 | | |
| Less distributions | |
| From net investment income | | $ | (0.369 | ) | | $ | (0.459 | ) | | $ | (0.406 | ) | | $ | (0.483 | ) | | $ | (0.512 | ) | | $ | (0.555 | ) | |
| From tax return of capital | | | (0.019 | ) | | | (0.003 | ) | | | — | | | | (0.004 | ) | | | (0.027 | ) | | | — | | |
| Total distributions | | $ | (0.388 | ) | | $ | (0.462 | ) | | $ | (0.406 | ) | | $ | (0.487 | ) | | $ | (0.539 | ) | | $ | (0.555 | ) | |
| Net asset value — End of period | | $ | 7.200 | | | $ | 7.340 | | | $ | 7.740 | | | $ | 8.040 | | | $ | 8.610 | | | $ | 8.570 | | |
| Total Return(4) | | | 3.50 | % | | | 1.15 | %(5) | | | 1.35 | % | | | (1.03 | )% | | | 7.00 | % | | | 8.23 | % | |
| Ratios/Supplemental Data | |
| Net assets, end of period (000's omitted) | | $ | 215,850 | | | $ | 291,079 | | | $ | 390,836 | | | $ | 555,947 | | | $ | 583,804 | | | $ | 240,472 | | |
| Ratios (As a percentage of average daily net assets): | | | | | | | | | | | | | | | | | | | | | | | | | |
| Expenses before custodian fee reduction(6) | | | 1.95 | % | | | 1.93 | % | | | 1.88 | %(8) | | | 1.81 | % | | | 1.86 | % | | | 1.99 | % | |
| Expenses after custodian fee reduction(6) | | | 1.95 | % | | | 1.93 | % | | | 1.88 | %(8) | | | 1.81 | % | | | 1.86 | % | | | 1.99 | % | |
| Interest expense(6) | | | 0.00 | %(7) | | | 0.00 | %(7) | | | 0.00 | %(7)(8) | | | 0.01 | % | | | 0.00 | %(7) | | | 0.02 | % | |
| Net investment income | | | 2.95 | % | | | 2.07 | % | | | 2.52 | %(8) | | | 1.15 | % | | | 3.29 | % | | | 4.75 | % | |
| Portfolio Turnover of the Portfolio | | | 2 | % | | | 30 | % | | | 5 | % | | | 67 | % | | | 41 | % | | | 21 | % | |
(1) Net investment income per share was computed using average shares outstanding.
(2) For the ten-month period ended October 31, 2004.
(3) The Fund, through its investment in the Portolio, adopted the provisions of the revised AICPA Audit and Accounting Guide for Investment Companies and began amortizing market premium on fixed-income securities. Additionally, the Portfolio reclassified net losses realized on prepayments received on mortgage-backed securities that were previously included in realized gains/losses to interest income. The effect of these changes on net investment income per share and on the ratio of net investment income to average net assets for the year ended December 31, 2001 was a decrease of $0.138 per share and 1.61%, respectively.
(4) Returns are historical and are calculated by determining the percentage change in net asset value with all distributions reinvested. Total return in not computed on an annualized basis.
(5) Total return reflects an increase of 0.24% due to the change in the timing of the payment and reinvestment of distributions.
(6) Includes the Fund's share of the Portfolio's allocated expenses.
(7) Represents less than 0.01%.
(8) Annualized.
See notes to financial statements
7
Eaton Vance Government Obligations Fund as of October 31, 2006
FINANCIAL STATEMENTS CONT'D
Financial Highlights
| | | Class C | |
| | | Year Ended October 31, | | Period Ended | | Year Ended December 31, | |
| | | 2006(1) | | 2005(1) | | October 31, 2004(1)(2) | | 2003(1) | | 2002(1) | | 2001(1)(3) | |
| Net asset value — Beginning of period | | $ | 7.340 | | | $ | 7.730 | | | $ | 8.040 | | | $ | 8.610 | | | $ | 8.570 | | | $ | 8.450 | | |
| Income (loss) from operations | |
| Net investment income | | $ | 0.213 | | | $ | 0.157 | | | $ | 0.166 | | | $ | 0.096 | | | $ | 0.282 | | | $ | 0.392 | | |
| Net realized and unrealized gain (loss) | | | 0.025 | | | | (0.085 | ) | | | (0.070 | ) | | | (0.179 | ) | | | 0.297 | | | | 0.283 | | |
| Total income (loss) from operations | | $ | 0.238 | | | $ | 0.072 | | | $ | 0.096 | | | $ | (0.083 | ) | | $ | 0.579 | | | $ | 0.675 | | |
| Less distributions | |
| From net investment income | | $ | (0.369 | ) | | $ | (0.459 | ) | | $ | (0.406 | ) | | $ | (0.483 | ) | | $ | (0.512 | ) | | $ | (0.555 | ) | |
| From tax return of capital | | | (0.019 | ) | | | (0.003 | ) | | | — | | | | (0.004 | ) | | | (0.027 | ) | | | — | | |
| Total distributions | | $ | (0.388 | ) | | $ | (0.462 | ) | | $ | (0.406 | ) | | $ | (0.487 | ) | | $ | (0.539 | ) | | $ | (0.555 | ) | |
| Net asset value — End of period | | $ | 7.190 | | | $ | 7.340 | | | $ | 7.730 | | | $ | 8.040 | | | $ | 8.610 | | | $ | 8.570 | | |
| Total Return(4) | | | 3.36 | % | | | 1.16 | %(5) | | | 1.22 | % | | | (1.02 | )% | | | 6.99 | % | | | 8.18 | % | |
| Ratios/Supplemental Data | |
| Net assets, end of period (000's omitted) | | $ | 129,963 | | | $ | 182,214 | | | $ | 272,000 | | | $ | 436,960 | | | $ | 472,515 | | | $ | 133,176 | | |
| Ratios (As a percentage of average daily net assets): | | | | | | | | | | | | | | | | | | | | | | | | | |
| Expenses before custodian fee reduction(6) | | | 1.95 | % | | | 1.93 | % | | | 1.88 | %(8) | | | 1.81 | % | | | 1.85 | % | | | 1.99 | % | |
| Expenses after custodian fee reduction(6) | | | 1.95 | % | | | 1.93 | % | | | 1.88 | %(8) | | | 1.81 | % | | | 1.85 | % | | | 1.99 | % | |
| Interest expense(6) | | | 0.00 | %(7) | | | 0.00 | %(7) | | | 0.00 | %(7)(8) | | | 0.01 | % | | | 0.00 | %(7) | | | 0.02 | % | |
| Net investment income | | | 2.95 | % | | | 2.08 | % | | | 2.52 | %(8) | | | 1.15 | % | | | 3.29 | % | | | 4.55 | % | |
| Portfolio Turnover of the Portfolio | | | 2 | % | | | 30 | % | | | 5 | % | | | 67 | % | | | 41 | % | | | 21 | % | |
(1) Net investment income per share was computed using average shares outstanding.
(2) For the ten-month period ended October 31, 2004.
(3) The Fund, through its investment in the Portfolio, adopted the provisions of the revised AICPA Audit and Accounting Guide for Investment Companies and began amortizing market premium on fixed-income securities. Additionally, the Portfolio reclassified net losses realized on prepayments received on mortgage-backed securities that were previously included in realized gains/losses to interest income. The effect of these changes on net investment income per share and on the ratio of net investment income to average net assets for the year ended December 31, 2001 was a decrease of $0.139 per share and 1.61%, respectively.
(4) Returns are historical and are calculated by determining the percentage change in net asset value with all distributions reinvested. Total return is not computed on an annualized basis.
(5) Total return reflects an increase of 0.11% due to the change in the timing of the payment and reinvestment of distributions.
(6) Includes the Fund's share of the Portfolio's allocated expenses.
(7) Represents less than 0.01%.
(8) Annualized.
See notes to financial statements
8
Eaton Vance Government Obligations Fund as of October 31, 2006
FINANCIAL STATEMENTS CONT'D
Financial Highlights
| | | Class R | |
| | | Year Ended
October 31, 2006(1) | | Period Ended
October 31, 2005(1)(2) | |
| Net asset value — Beginning of year | | $ | 7.320 | | | $ | 7.430 | | |
| Income (loss) from operations | |
| Net investment income | | $ | 0.214 | | | $ | 0.083 | | |
| Net realized and unrealized gain (loss) | | | 0.060 | | | | (0.091 | ) | |
| Total income (loss) from operations | | $ | 0.274 | | | $ | (0.008 | ) | |
| Less distributions | |
| From net investment income | | $ | (0.405 | ) | | $ | (0.099 | ) | |
| From tax return of capital | | | (0.019 | ) | | | (0.003 | ) | |
| Total distributions | | $ | (0.424 | ) | | $ | (0.102 | ) | |
| Net asset value — End of year | | $ | 7.170 | | | $ | 7.320 | | |
| Total Return(3) | | | 3.87 | % | | | (0.12 | )% | |
| Ratios/Supplemental Data | |
| Net assets, end of year (000's omitted) | | $ | 235 | | | $ | 2 | | |
| Ratios (As a percentage of average daily net assets): | | | | | | | | | |
| Expenses before custodian fee reduction(4) | | | 1.45 | % | | | 1.43 | %(6) | |
| Expenses after custodian fee reduction(4) | | | 1.45 | % | | | 1.43 | %(6) | |
| Interest expense(4) | | | 0.00 | %(5) | | | 0.00 | %(5)(6) | |
| Net investment income | | | 3.01 | % | | | 4.57 | %(6) | |
| Portfolio Turnover of the Portfolio | | | 2 | % | | | 30 | % | |
(1) Net investment income per share was computed using average shares outstanding.
(2) For the period from the commencement of operations, August 12, 2005, to October 31, 2005.
(3) Returns are historical and are calculated by determining the percentage change in net asset value with all distributions reinvested. Total return is not computed on an annualized basis.
(4) Includes the Fund's share of the Portfolio's allocated expenses.
(5) Represents less than 0.01%.
(6) Annualized.
See notes to financial statements
9
Eaton Vance Government Obligations Fund as of October 31, 2006
NOTES TO FINANCIAL STATEMENTS
1 Significant Accounting Policies
Eaton Vance Government Obligations Fund (the Fund) is a diversified entity of the type commonly known as a Massachusetts business trust and is registered under the Investment Company Act of 1940, as amended, as an open-end management investment company. The Fund is a series of Eaton Vance Mutual Funds Trust. The Fund offers four classes of shares. Class A shares are generally sold subject to an initial sales charge imposed at time of purchase. Class B and Class C shares are sold at net asset value and are subject to a contingent deferred sales charge (see Note 7). Class R shares are offered at net asset value and are not subject to an initial sales charge. The Trustees have adopted a conversion feature pursuant to which Class B shares of the Fund automatically convert to Class A shares eight years after their purchase as described in the Fund's prospectus. Each class represents a pro rata interest in the Fund, but votes separate ly on class-specific matters and (as noted below) is subject to different expenses. Realized and unrealized gains and losses are allocated daily to each class of shares based on the relative net assets of each class to the total net assets of the Fund. Net investment income, other than class-specific expenses, is allocated daily to each class based upon the ratio of the value of each class' paid shares to the total value of all paid shares. Each class of shares differs in its distribution plan and certain other class-specific expenses. The Fund invests all of its investable assets in interests in the Government Obligations Portfolio (the Portfolio), a New York Trust, having the same investment objective and policies as the Fund. The value of the Fund's investment in the Portfolio reflects the Fund's proportionate interest in the net assets of the Portfolio (82.6% at October 31, 2006). The performance of the Fund is directly affected by the performance of the Portfolio. The financial statements of the Portfol io, including the portfolio of investments, are included elsewhere in this report and should be read in conjunction with the Fund's financial statements.
The following is a summary of significant accounting policies consistently followed by the Fund in the preparation of its financial statements. The policies are in conformity with accounting principles generally accepted in the United States of America.
A Investment Valuation — Valuation of securities by the Portfolio is discussed in Note 1A of the Portfolio's Notes to Financial Statements, which are included elsewhere in this report.
B Income — The Fund's net investment income or loss consists of the Fund's pro rata share of the net investment income or loss of the Portfolio, less all actual and accrued expenses of the Fund.
C Federal Taxes — The Fund's policy is to comply with the provisions of the Internal Revenue Code applicable to regulated investment companies and to distribute to shareholders, each year, substantially all of its net investment income and all or substantially all of its net realized capital gains. Accordingly, no provision for federal income or excise tax is necessary. At October 31, 2006, the Fund, for federal income tax purposes, had a capital loss carryover of $228,084,029 which will reduce the Fund's taxable income arising from future net realized gain on investments, if any, to the extent permitted by the Internal Revenue Code and thus will reduce the amount of distributions to shareholders which would otherwise be necessary to relieve the Fund of any liability for federal income tax or excise tax. Such capital loss carryovers will expire on October 31, 2007 ($16,400,527), October 31, 2008 ($4,071,870), October 31, 2010 ($21,056,795), October 31, 2011 ($78,339,789), October 31, 2012 ($67,101,638), October 31, 2013 ($23,607,593), and October 31, 2014 ($17,505,817). During the year ended October 31, 2006, capital loss carryovers in the amount of $3,525,680 had expired.
D Expense Reduction — Investors Bank & Trust Company (IBT) serves as custodian of the Fund. Pursuant to the custodian agreement, IBT receives a fee reduced by credits which are determined based on the average daily cash balance the Fund maintains with IBT. All credit balances used to reduce the Fund's custodian fees are reported as a reduction of expenses in the Statement of Operations.
E Other — Investment transactions are accounted for on the date the securities are purchased or sold. Dividends to shareholders are recorded on the ex-dividend date.
F Expenses — The majority of expenses of the Trust are directly identifiable to an individual fund. Expenses which are not readily identifiable to a specific fund are allocated taking into consideration, among other things, the nature and type of expense and the relative size of the funds.
G Use of Estimates — The preparation of the financial statements in conformity with accounting principles generally accepted in the United States of America requires management to make estimates and assumptions that affect the reported amounts of assets and liabilities at the date of
10
Eaton Vance Government Obligations Fund as of October 31, 2006
NOTES TO FINANCIAL STATEMENTS CONT'D
the financial statements and the reported amounts of income and expense during the reporting period. Actual results could differ from those estimates.
H Indemnifications — Under the Trust's organizational documents, its officers and Trustees may be indemnified against certain liabilities and expenses arising out of the performance of their duties to the Fund, and shareholders are indemnified against personal liability for the obligations of the Trust. Additionally, in the normal course of business, the Fund enters into agreements with service providers that may contain indemnification clauses. The Fund's maximum exposure under these arrangements is unknown as this would involve future claims that may be made against the Fund that have not yet occurred.
2 Distributions to Shareholders
The Fund declares dividends daily to shareholders of record at the time of declaration. Distributions are paid monthly. Distributions are paid in the form of additional shares or, at the election of the shareholder, in cash. Distributions of allocated realized capital gains, if any, are made at least annually. Shareholders may reinvest capital gain distributions in additional shares of the Fund at the net asset value as of the ex-dividend date. The Fund distinguishes between distributions on a tax basis and a financial reporting basis. Accounting principles generally accepted in the United States of America require that only distributions in excess of tax basis earnings and profits be reported in the financial statements as a return of capital. Permanent differences between book and tax accounting relating to distributions are reclassified to paid-in capital. The differences relate primarily to the method of amortizing premium.
The tax character of the distributions declared for the years ended October 31, 2006 and October 31, 2005 was as follows:
| | | Year Ended October 31, | |
| | | 2006 | | 2005 | |
| Distributions declared from: | |
| Ordinary income | | $ | 36,355,666 | | | $ | 55,819,398 | | |
| Tax return of capital | | $ | 1,790,869 | | | $ | 353,610 | | |
During the year ended October 31, 2006, accumulated distributions in excess of net investment income was decreased by $15,513,646, accumulated net realized loss was increased by $16,199,431, and paid-in capital was increased by $685,785 due to differences between book and tax accounting for paydown gain/losses on mortgage-backed securities, expired capital loss carryforwards, mixed straddle adjustments and premium amortization. This change had no effect on net assets or net asset value per share.
At October 31, 2006, the components of distributable earnings (accumulated loss) on a tax basis were as follows:
| Capital loss carryforwards | | $ | (228,084,029 | ) | |
The differences between components of distributable earnings (accumulated loss) on a tax basis and the amounts reflected in the statement of assets and liabilities are primarily due to differences in book and tax policies for mixed straddle amounts and futures, and the timing of recognizing distributions to shareholders.
3 Shares of Beneficial Interest
The Fund's Declaration of Trust permits the Trustees to issue an unlimited number of full and fractional shares of beneficial interest (without par value). Such shares may be issued in a number of different series (such as the Fund) and classes. Transactions in Fund shares were as follows:
| | | Year Ended October 31, | |
| Class A | | 2006 | | 2005(1) | |
| Sales | | | 5,690,166 | | | | 6,998,330 | | |
Issued to shareholders
electing to receive
payments of distributions
in Fund shares | | | 1,262,328 | | | | 1,677,716 | | |
| Redemptions | | | (12,796,297 | ) | | | (15,470,971 | ) | |
| Exchange from Class B shares | | | 1,047,866 | | | | 799,022 | | |
| Net decrease | | | (4,795,937 | ) | | | (5,995,903 | ) | |
| | | Year Ended October 31, | |
| Class B | | 2006 | | 2005 | |
| Sales | | | 887,301 | | | | 1,940,075 | | |
Issued to shareholders
electing to receive
payments of distributions
in Fund shares | | | 1,006,297 | | | | 1,537,815 | | |
| Redemptions | | | (10,510,683 | ) | | | (13,563,248 | ) | |
| Exchange to Class A shares | | | (1,046,540 | ) | | | (798,427 | ) | |
| Net decrease | | | (9,663,625 | ) | | | (10,883,785 | ) | |
11
Eaton Vance Government Obligations Fund as of October 31, 2006
NOTES TO FINANCIAL STATEMENTS CONT'D
| | | Year Ended October 31, | |
| Class C | | 2006 | | 2005 | |
| Sales | | | 1,921,049 | | | | 3,724,161 | | |
Issued to shareholders
electing to receive
payments of distributions
in Fund shares | | | 572,991 | | | | 937,421 | | |
| Redemptions | | | (9,265,880 | ) | | | (15,017,783 | ) | |
| Net decrease | | | (6,771,840 | ) | | | (10,356,201 | ) | |
| | | Year Ended October 31, | |
| Class R | | 2006 | | 2005(2) | |
| Sales | | | 41,111 | | | | 276 | | |
Issued to shareholders
electing to receive
payments of distributions
in Fund shares | | | 760 | | | | 3 | | |
| Redemptions | | | (9,454 | ) | | | — | | |
| Net increase | | | 32,417 | | | | 279 | | |
(1) Transactions have been restated to reflect the effects of a 1.1594595-for-1 stock split effective November 11, 2005.
(2) For the period from August 12, 2005, commencement of operations, to October 31, 2005.
4 Investment Transactions
Increases and decreases in the Fund's investment in the Portfolio for the year ended October 31, 2006 aggregated $69,992,749, and $268,202,477, respectively.
5 Transactions with Affiliates
Eaton Vance Management (EVM) serves as the administrator of the Fund, but receives no compensation. The Portfolio has engaged Boston Management and Research (BMR), a subsidiary of EVM, to render investment advisory services. See Note 3 of the Portfolio's Notes to Financial Statements which are included elsewhere in this report. Certain officers and Trustees of the Fund and Portfolio are officers of the above organizations. Except as to Trustees of the Fund and the Portfolio who are not members of EVM's or BMR's organization, officers and Trustees receive remuneration for their services to the Fund out of the investment adviser fee earned by BMR. EVM serves as the sub-transfer agent of the Fund and receives from the transfer agent an aggregate fee based upon the actual expenses incurred by EVM in the performance of those services. For the year ended October 31, 2006, EVM earned $45,243 in sub-transfer agent fees. The Fund was informed that Eaton Vance Distributors, Inc. (EVD), a subsidiary of EVM and the Fund's principal underwriter, received $29,349 as its portion of the sales charge on sales of Class A shares for the year ended October 31, 2006. Certain Officers and Trustees of the Fund and the Portfolio are Officers of the above organizations.
6 Distribution Plans
Class A has in effect a distribution plan pursuant to Rule 12b-1 under the Investment Company Act of 1940 (Class A Plan). The Class A Plan provides that the Fund will pay EVD a distribution and service fee of 0.25% of the Fund's average daily net assets attributable to Class A shares for each fiscal year for distribution services and facilities provided to the Fund by EVD, as well as for personal services and/or the maintenance of shareholder accounts. Distribution and service fees paid or accrued for the year ended October 31, 2006 amounted to $661,467 for Class A shares. The Fund also has in effect distribution plans for Class B shares (Class B Plan), Class C shares (Class C Plan) and Class R shares (Class R Plan) pursuant to Rule 12b-1. The Class B and Class C Plans require the Fund to pay EVD amounts equal to 1/365 of 0.75% of the Fund's average daily net assets attributable to Class B and Class C shares for providing ongoin g distribution services and facilities to the Fund. The Fund will automatically discontinue payments to EVD during any period in which there are no outstanding Uncovered Distribution Charges, which are equivalent to the sum of (i) 5% and 6.25% of the aggregate amount received by the Fund for the Class B and Class C shares sold, respectively, plus (ii) interest calculated by applying the rate of 1% over the prevailing prime rate to the outstanding balance of Uncovered Distribution Charges of EVD of each respective class, reduced by the aggregate amount of contingent deferred sales charges (see Note 7) and daily amounts therefore paid to EVD by each respective class. The Fund paid or accrued $1,875,531 and $1,147,404 for Class B and Class C shares, respectively, to or payable to EVD for the year ended October 31, 2006, representing 0.75% of the average daily net assets for Class B and Class C shares. At October 31, 2006, the amount of Uncovered Distribution Charges of EVD calculated under the Plans was approxi mately $14,001,000 and $59,724,000 for Class B and Class C shares, respectively. The Class R Plan provides for the Fund to pay EVD an amount equal to 0.50% of the Fund's average daily net assets attributable to Class R shares for providing ongoing distribution services and facilities to the Fund. The Trustees of the Trust have currently limited Class R distribution payments to 0.25% of average daily net assets attributable to Class R shares. For the year ended October 31, 2006 the Fund paid or accrued $258 for Class R
12
Eaton Vance Government Obligations Fund as of October 31, 2006
NOTES TO FINANCIAL STATEMENTS CONT'D
shares to or payable to EVD, representing 0.25% of the average daily net assets for Class R shares. The Class B, Class C and Class R Plans also authorize the Fund to make payments of service fees to EVD, investment dealers, and other persons in an amount not exceeding 0.25% annually of the average daily net assets attributable to that Class. Service fees are paid for personal services and/or the maintenance of shareholder accounts. They are separate and distinct from the Class B and C sales commissions and distribution fees and, as such are not subject to automatic discontinuance when there are no outstanding Uncovered Distribution Charges of EVD. Service fees for year ended October 31, 2006 amounted to $625,177, $382,468 and $258 for Class B, Class C and Class R shares, respectively.
7 Contingent Deferred Sales Charge
Effective September 15, 2006 all purchases of Class A shares of $1 million or more will be subject to a 1% contingent deferred sales charge (CDSC) in the event of redemption within 18 months of purchase. Prior to September 15, 2006, Class A shares purchased at net asset value in amounts of $1 million or more (other than shares purchased in a single transaction of $5 million or more) were subject to a 1% CDSC if redeemed within 12 months of purchase. A CDSC generally is imposed on redemptions of Class B shares made within six years of purchase and on redemptions of Class C shares made within one year of purchase. Generally, the CDSC is based upon the lower of the net asset value at date of redemption or date of purchase. No charge is levied on shares acquired by reinvestment of dividends or capital gain distributions. The Class B CDSC is imposed at declining rates that begin at 5% in the first and second year of redemption after purchase, declining one percentage point in each subsequent year. Class C shares will be subject to a 1% CDSC if redeemed within one year of purchase. No CDSC is levied on shares which have been sold to EVM or its affiliates or to their respective employees or clients and may be waived under certain other limited conditions. CDSC charges are paid to EVD to reduce the amount of Uncovered Distribution Charges calculated under the Fund's Distribution Plans (see Note 6). CDSC charges received when no Uncovered Distribution Charges exist will be credited to the Fund. The Fund was informed that EVD received approximately $239, $1,055,000, and $13,000 of CDSC paid by shareholders for Class A shares, Class B shares, and Class C shares, respectively, for the year ended October 31, 2006.
8 Stock Split
On October 17, 2005, the Trustees of the Fund approved a 1.1594595-for-1 stock split for Class A shares, effective November 11, 2005. The stock split had no impact on the overall value of a shareholder's investment in the Fund.
9 Recently Issued Accounting Pronouncements
In June 2006, the Financial Accounting Standards Board ("FASB") issued FASB Interpretation No. 48, ("FIN 48") "Accounting for Uncertainty in Income Taxes – an interpretation of FASB Statement No. 109". FIN 48 clarifies the accounting for uncertainty in income taxes recognized in accordance with FASB Statement No. 109, "Accounting for Income Taxes." This interpretation prescribes a recognition threshold and measurement attribute for the financial statement recognition and measurement of a tax position taken or expected to be taken in a tax return. It also provides guidance on de-recognition, classification, interest and penalties, accounting in interim periods, disclosure and transition. FIN 48 is effective for fiscal years beginning after December 15, 2006. Management is currently evaluating the impact of applying the various provisions of FIN 48.
In September 2006, the Financial Accounting Standards Board ("FASB") issued Statement of Financial Accounting Standards No. 157, ("FAS 157") "Fair Value Measurements". FAS 157 defines fair value, establishes a framework for measuring fair value in accordance with generally accepted accounting principles and expands disclosure about fair value measurements. FAS 157 is effective for fiscal years beginning after November 15, 2007. Management is currently evaluating the impact the adoption of FAS 157 will have on the Fund's financial statement disclosures.
13
Eaton Vance Government Obligations Fund as of October 31, 2006
REPORT OF INDEPENDENT REGISTERED PUBLIC ACCOUNTING FIRM
To the Trustees and Shareholders
of Eaton Vance Government Obligations Fund:
In our opinion, the accompanying statement of assets and liabilities, and the related statements of operations and of changes in net assets and the financial highlights present fairly, in all material respects, the financial position of Eaton Vance Government Obligations Fund, a series of Eaton Vance Mutual Funds Trust (the "Fund") at October 31, 2006, and the results of its operations, the changes in its net assets and the financial highlights for each of the periods indicated in conformity with accounting principles generally accepted in the United States of America. These financial statements and financial highlights (hereafter referred to as "financial statements") are the responsibility of the Fund's management; our responsibility is to express an opinion on these financial statements based on our audits. We conducted our audits of these financial statements in accordance with standards of the Public Company Accounting Over sight Board (United States). Those standards require that we plan and perform the audit to obtain reasonable assurance about whether the financial statements are free of material misstatement. An audit includes examining, on a test basis, evidence supporting the amounts and disclosures in the financial statements, assessing the accounting principles used and significant estimates made by management, and evaluating the overall financial statement presentation. We believe that our audits provide a reasonable basis for our opinion.
PricewaterhouseCoopers LLP
Boston, Massachusetts
December 27, 2006
14
Eaton Vance Government Obligations Fund as of October 31, 2006
FEDERAL TAX INFORMATION (Unaudited)
The Form 1099-DIV you receive in January 2007 will show the tax status of all distributions paid to your account in calendar 2006. Shareholders are advised to consult their own tax adviser with respect to the tax consequences of their investment in the Fund.
15
Government Obligations Portfolio as of October 31, 2006
PORTFOLIO OF INVESTMENTS
| Mortgage Pass-Throughs — 95.5% | |
| Security | | Principal
Amount
(000's omitted) | | Value | |
| Federal Home Loan Mortgage Corp.: | |
| 6.00%, with maturity at 2026 | | $ | 1,675 | | | $ | 1,705,035 | | |
| 6.50%, with various maturities to 2028 | | | 27,356 | | | | 28,306,227 | | |
| 6.87%, with maturity at 2024 | | | 637 | | | | 666,858 | | |
| 7.00%, with various maturities to 2026 | | | 19,207 | | | | 20,192,770 | | |
| 7.09%, with maturity at 2023 | | | 1,743 | | | | 1,835,025 | | |
| 7.25%, with maturity at 2022 | | | 2,615 | | | | 2,764,786 | | |
| 7.31%, with maturity at 2027 | | | 678 | | | | 717,400 | | |
| 7.50%, with various maturities to 2029 | | | 22,296 | | | | 23,730,260 | | |
| 7.63%, with maturity at 2019 | | | 1,130 | | | | 1,200,859 | | |
| 7.75%, with various maturities to 2018 | | | 73 | | | | 77,245 | | |
| 7.78%, with maturity at 2022 | | | 310 | | | | 333,239 | | |
| 7.85%, with maturity at 2020 | | | 895 | | | | 959,912 | | |
| 8.00%, with various maturities to 2028 | | | 32,591 | | | | 34,920,728 | | |
| 8.13%, with maturity at 2019 | | | 1,789 | | | | 1,928,556 | | |
| 8.15%, with maturity at 2021 | | | 554 | | | | 586,666 | | |
| 8.25%, with various maturities to 2017 | | | 620 | | | | 647,312 | | |
| 8.50%, with various maturities to 2027 | | | 14,598 | | | | 15,866,203 | | |
| 8.75%, with various maturities to 2016 | | | 275 | | | | 280,855 | | |
| 9.00%, with various maturities to 2032 | | | 28,263 | | | | 31,341,193 | | |
| 9.25%, with various maturities to 2017 | | | 1,032 | | | | 1,080,865 | | |
| 9.50%, with various maturities to 2026 | | | 6,680 | | | | 7,422,155 | | |
| 9.75%, with various maturities to 2018 | | | 312 | | | | 319,978 | | |
| 11.00%, with various maturities to 2016 | | | 56 | | | | 62,194 | | |
| 13.00%, with maturity at 2015 | | | 5 | | | | 4,722 | | |
| 13.50%, with maturity at 2010 | | | 22 | | | | 23,605 | | |
| 15.00%, with maturity at 2011 | | | 1 | | | | 881 | | |
| | | $ | 176,975,529 | | |
| Federal National Mortgage Assn.: | |
| 0.25%, with maturity at 2014 | | $ | 4 | | | $ | 3,479 | | |
| 5.134%, with maturity at 2033(1) | | | 8,467 | | | | 8,470,803 | | |
| 5.32%, with maturity at 2035(1) | | | 4,002 | | | | 4,002,932 | | |
| 5.34%, with various maturities to 2035(1) | | | 59,867 | | | | 59,808,890 | | |
| 5.358%, with maturity at 2036(1) | | | 4,011 | | | | 4,010,776 | | |
| 5.381%, with maturity at 2036(1) | | | 1,638 | | | | 1,638,063 | | |
| 5.408%, with maturity at 2022(1) | | | 4,411 | | | | 4,410,389 | | |
| 5.427%, with various maturities to 2026(1) | | | 6,182 | | | | 6,179,953 | | |
| 5.50%, with maturity at 2014 | | | 17,988 | | | | 18,064,367 | | |
| 6.00%, with various maturities to 2024 | | | 1,019 | | | | 1,033,187 | | |
| 6.50%, with various maturities to 2026 | | | 89,145 | | | | 92,164,024 | | |
| 7.00%, with various maturities to 2029 | | | 45,510 | | | | 47,711,294 | | |
| 7.25%, with various maturities to 2023 | | | 150 | | | | 154,494 | | |
| 7.50%, with various maturities to 2029 | | | 23,405 | | | | 24,736,665 | | |
| 7.75%, with maturity at 2008 | | | 15 | | | | 14,731 | | |
| 7.875%, with maturity at 2021 | | | 1,708 | | | | 1,838,277 | | |
| 7.897%, with maturity at 2030 | | | 82 | | | | 88,411 | | |
| 8.00%, with various maturities to 2027 | | | 29,597 | | | | 31,784,348 | | |
| 8.25%, with various maturities to 2025(1) | | | 1,101 | | | | 1,171,820 | | |
| 8.33%, with maturity at 2020 | | | 1,806 | | | | 1,961,359 | | |
| 8.50%, with various maturities to 2027 | | | 11,200 | | | | 12,150,543 | | |
| Security | | Principal
Amount
(000's omitted) | | Value | |
| 8.679%, with maturity at 2021 | | $ | 429 | | | $ | 469,770 | | |
| 8.75%, with various maturities to 2017 | | | 496 | | | | 508,464 | | |
| 8.946%, with maturity at 2010 | | | 157 | | | | 162,629 | | |
| 9.00%, with various maturities to 2030 | | | 4,593 | | | | 4,960,009 | | |
| 9.125%, with maturity at 2011 | | | 106 | | | | 111,225 | | |
| 9.25%, with various maturities to 2016 | | | 174 | | | | 179,213 | | |
| 9.50%, with various maturities to 2030 | | | 6,057 | | | | 6,674,449 | | |
| 9.75%, with maturity at 2019 | | | 56 | | | | 63,086 | | |
| 9.946%, with maturity at 2021 | | | 156 | | | | 176,177 | | |
| 9.982%, with maturity at 2025 | | | 131 | | | | 148,675 | | |
| 10.00%, with maturity at 2012 | | | 48 | | | | 50,522 | | |
| 10.105%, with maturity at 2021 | | | 179 | | | | 202,636 | | |
| 10.195%, with maturity at 2023 | | | 279 | | | | 315,681 | | |
| 10.356%, with maturity at 2021 | | | 279 | | | | 314,633 | | |
| 10.407%, with maturity at 2020 | | | 246 | | | | 270,556 | | |
| 10.883%, with maturity at 2025 | | | 143 | | | | 158,821 | | |
| 11.00%, with maturity at 2010 | | | 14 | | | | 14,593 | | |
| 11.396%, with maturity at 2019 | | | 215 | | | | 242,052 | | |
| 11.50%, with maturity at 2012 | | | 95 | | | | 103,632 | | |
| 11.634%, with maturity at 2018 | | | 415 | | | | 468,089 | | |
| 12.135%, with maturity at 2025 | | | 126 | | | | 143,948 | | |
| 12.397%, with maturity at 2021 | | | 164 | | | | 185,665 | | |
| 12.672%, with maturity at 2015 | | | 352 | | | | 407,388 | | |
| 13.00%, with maturity at 2010 | | | 109 | | | | 115,294 | | |
| | | $ | 337,846,012 | | |
| Government National Mortgage Assn.: | |
| 5.125%, with various maturities to 2027(1) | | $ | 1,618 | | | $ | 1,649,996 | | |
| 6.50%, with maturity at 2024 | | | 145 | | | | 150,466 | | |
| 7.00%, with various maturities to 2025 | | | 44,293 | | | | 46,658,277 | | |
| 7.25%, with maturity at 2022 | | | 140 | | | | 147,727 | | |
| 7.50%, with various maturities to 2024 | | | 11,775 | | | | 12,468,292 | | |
| 8.00%, with various maturities to 2027 | | | 27,775 | | | | 29,864,323 | | |
| 8.25%, with various maturities to 2019 | | | 280 | | | | 301,857 | | |
| 8.30%, with maturity at 2020 | | | 94 | | | | 102,540 | | |
| 8.50%, with various maturities to 2018 | | | 4,816 | | | | 5,241,256 | | |
| 9.00%, with various maturities to 2027 | | | 15,895 | | | | 17,657,663 | | |
| 9.50%, with various maturities to 2026 | | | 12,294 | | | | 13,671,869 | | |
| | | $ | 127,914,266 | | |
| Collateralized Mortgage Obligations: | |
Federal Home Loan Mortgage Corp.,
Series 1822, Class Z, 6.90%, due 2026 | | $ | 3,856 | | | $ | 3,970,035 | | |
Federal Home Loan Mortgage Corp.,
Series 1896, Class Z, 6.00%, due 2026 | | | 2,023 | | | | 2,034,408 | | |
Federal Home Loan Mortgage Corp.,
Series 2115, Class K, 6.00%, due 2029 | | | 5,729 | | | | 5,765,546 | | |
Federal Home Loan Mortgage Corp.,
Series 2245, Class A, 8.00%, due 2027 | | | 20,946 | | | | 22,219,634 | | |
Federal Home Loan Mortgage Corp.,
Series 30, Class I, 7.50%, due 2024 | | | 599 | | | | 621,449 | | |
Federal National Mortgage Assn.,
Series 1993-149, Class M, 7.00%, due 2023 | | | 1,422 | | | | 1,475,630 | | |
Federal National Mortgage Assn.,
Series 1993-16, Class Z, 7.50%, due 2023 | | | 1,180 | | | | 1,241,182 | | |
See notes to financial statements
16
Government Obligations Portfolio as of October 31, 2006
PORTFOLIO OF INVESTMENTS CONT'D
| Security | | Principal
Amount
(000's omitted) | | Value | |
Federal National Mortgage Assn.,
Series 1993-250, Class Z, 7.00%, due 2023 | | $ | 892 | | | $ | 918,223 | | |
Federal National Mortgage Assn.,
Series 1993-39, Class Z, 7.50%, due 2023 | | | 2,705 | | | | 2,826,728 | | |
Federal National Mortgage Assn.,
Series 1994-82, Class Z, 8.00%, due 2024 | | | 4,761 | | | | 5,094,605 | | |
Federal National Mortgage Assn.,
Series 2000-49, Class A, 8.00%, due 2027 | | | 2,280 | | | | 2,416,920 | | |
| Federal National Mortgage Assn., | |
| Series 2002-1, Class G, 7.00%, due 2023 | | | 1,861 | | | | 1,939,896 | | |
Federal National Mortgage Assn.,
Series G-8, Class E, 9.00%, due 2021 | | | 812 | | | | 894,179 | | |
Federal National Mortgage Assn.,
Series G92-44, Class ZQ, 8.00%, due 2022 | | | 1,013 | | | | 1,071,885 | | |
| | | $ | 52,490,320 | | |
Total Mortgage Pass-Throughs
(identified cost, $698,414,296) | | | | | | $ | 695,226,127 | | |
| U.S. Treasury Obligations — 1.0% | |
| Security | | Principal
Amount
(000's omitted) | | Value | |
| U.S. Treasury Bond, 7.125%, 2/15/23(2) | | $ | 6,000 | | | $ | 7,554,378 | | |
Total U.S. Treasury Obligations
(identified cost, $6,253,254) | | | | | | $ | 7,554,378 | | |
| Short-Term Investments — 3.0% | |
| Security | | Principal
Amount
(000's omitted) | | Value | |
Investors Bank and Trust Company Time
Deposit, 5.31%, 11/1/06 | | $ | 21,680 | | | $ | 21,680,000 | | |
Total Short-Term Investments
(at amortized cost, $21,680,000) | | | | | | $ | 21,680,000 | | |
Total Investments — 99.5%
(identified cost, $726,347,550) | | | | | | $ | 724,460,505 | | |
| Other Assets, Less Liabilities — 0.5% | | | | | | $ | 3,343,615 | | |
| Net Assets — 100.0% | | | | | | $ | 727,804,120 | | |
(1) Adjustable rate mortgage.
(2) Security (or a portion thereof) has been segregated to cover margin requirements on open financial futures contracts.
See notes to financial statements
17
Government Obligations Portfolio as of October 31, 2006
FINANCIAL STATEMENTS
Statement of Assets and Liabilities
As of October 31, 2006
| Assets | |
| Investments, at value (identified cost, $726,347,550) | | $ | 724,460,505 | | |
| Cash | | | 10,660 | | |
| Receivable for investments sold | | | 613,685 | | |
| Interest receivable | | | 4,187,948 | | |
| Receivable for daily variation margin on open financial futures contracts | | | 234,375 | | |
| Total assets | | $ | 729,507,173 | | |
| Liabilities | |
| Payable for investments purchased | | $ | 1,172,427 | | |
| Payable to affiliate for investment advisory fees | | | 442,982 | | |
| Payable to affiliate for Trustees' fees | | | 1,969 | | |
| Accrued expenses | | | 85,675 | | |
| Total liabilities | | $ | 1,703,053 | | |
| Net Assets applicable to investors' interest in Portfolio | | $ | 727,804,120 | | |
| Sources of Net Assets | |
| Net proceeds from capital contributions and withdrawals | | $ | 729,058,355 | | |
| Net unrealized depreciation (computed on the basis of identified cost) | | | (1,254,235 | ) | |
| Total | | $ | 727,804,120 | | |
Statement of Operations
For the Year Ended
October 31, 2006
| Investment Income | |
| Interest | | $ | 34,294,016 | | |
| Security lending income, net | | | 3,842,437 | | |
| Total investment income | | $ | 38,136,453 | | |
| Expenses | |
| Investment adviser fee | | $ | 5,690,735 | | |
| Trustees' fees and expenses | | | 23,961 | | |
| Custodian fee | | | 349,170 | | |
| Legal and accounting services | | | 88,038 | | |
| Interest expense | | | 7,128 | | |
| Miscellaneous | | | 34,087 | | |
| Total expenses | | $ | 6,193,119 | | |
Deduct —
Reduction of custodian fee | | $ | 889 | | |
| Total expense reductions | | $ | 889 | | |
| Net expenses | | $ | 6,192,230 | | |
| Net investment income | | $ | 31,944,223 | | |
| Realized and Unrealized Gain (Loss) | |
Net realized gain (loss) —
Investment transactions (identified cost basis) | | $ | (1,130,884 | ) | |
| Financial futures contracts | | | 2,479,378 | | |
| Net realized gain | | $ | 1,348,494 | | |
Change in unrealized appreciation (depreciation) —
Investments (identified cost basis) | | $ | 1,803,335 | | |
| Financial futures contracts | | | (191,406 | ) | |
| Net change in unrealized appreciation (depreciation) | | $ | 1,611,929 | | |
| Net realized and unrealized gain | | $ | 2,960,423 | | |
| Net increase in net assets from operations | | $ | 34,904,646 | | |
See notes to financial statements
18
Government Obligations Portfolio as of October 31, 2006
FINANCIAL STATEMENTS CONT'D
Statements of Changes in Net Assets
Increase (Decrease)
in Net Assets | | Year Ended
October 31, 2006 | | Year Ended
October 31, 2005 | |
From operations —
Net investment income | | $ | 31,944,223 | | | $ | 29,976,667 | | |
Net realized gain from investment
transactions and financial
futures contracts | | | 1,348,494 | | | | 273,338 | | |
Net change in unrealized
appreciation (depreciation)
from investments and financial
futures contracts | | | 1,611,929 | | | | (10,980,194 | ) | |
| Net increase in net assets from operations | | $ | 34,904,646 | | | $ | 19,269,811 | | |
Capital transactions —
Contributions | | $ | 113,001,226 | | | $ | 180,309,793 | | |
| Withdrawals | | | (286,374,607 | ) | | | (394,108,150 | ) | |
Net decrease in net assets
from capital transactions | | $ | (173,373,381 | ) | | $ | (213,798,357 | ) | |
| Net decrease in net assets | | $ | (138,468,735 | ) | | $ | (194,528,546 | ) | |
| Net Assets | |
| At beginning of year | | $ | 866,272,855 | | | $ | 1,060,801,401 | | |
| At end of year | | $ | 727,804,120 | | | $ | 866,272,855 | | |
Statement of Cash Flows
| Increase (Decrease) in Cash | | Year Ended
October 31, 2006 | |
Cash Flows From (Used For) Operating Activities —
Purchase of investments | | $ | (160,818,269 | ) | |
| Proceeds from sales of investments and principal repayments | | | 527,140,978 | | |
| Interest received, including net securities lending income | | | 58,806,483 | | |
| Interest paid | | | (9,751 | ) | |
| Operating expenses paid | | | (6,429,164 | ) | |
| Net purchase of short-term investments | | | (21,575,000 | ) | |
| Financial futures contracts transactions | | | 2,045,782 | | |
| Payment of collateral for securities loaned, net | | | (225,777,406 | ) | |
| Net cash from operating activities | | $ | 173,383,653 | | |
Cash Flows From (Used For) Financing Activities —
Proceeds from capital contributions | | $ | 113,001,226 | | |
| Payments for capital withdrawals | | | (286,374,607 | ) | |
| Net cash used for financing activities | | $ | (173,373,381 | ) | |
| Net increase in cash | | $ | 10,272 | | |
| Cash at beginning of period | | $ | 388 | | |
| Cash at end of period | | $ | 10,660 | | |
Reconciliation of Net Increase in Net Assets
From Operations to Net Cash From
Operating Activities | |
| Net increase in net assets from operations | | $ | 34,904,646 | | |
| Decrease in receivable for investments sold | | | 583,616 | | |
| Decrease in payable for investments purchased | | | (140,172,798 | ) | |
| Decrease in interest receivable | | | 2,819,330 | | |
| Increase in receivable for daily variation margin | | | (242,190 | ) | |
| Decrease in payable to affiliate | | | (82,679 | ) | |
| Decrease in accrued expenses | | | (164,006 | ) | |
| Decrease in collateral for securities loaned | | | (225,777,406 | ) | |
| Net decrease in investments | | | 501,515,140 | | |
| Net cash from operating activities | | $ | 173,383,653 | | |
See notes to financial statements
19
Government Obligations Portfolio as of October 31, 2006
FINANCIAL STATEMENTS CONT'D
Supplementary Data
| | | Year Ended October 31, | | Period Ended | | Year Ended December 31, | |
| | | 2006 | | 2005 | | October 31, 2004(1) | | 2003 | | 2002 | | 2001(2) | |
| Ratios/Supplemental Data | |
| Ratios (As a percentage of average daily net assets): | |
| Expenses | | | 0.79 | % | | | 0.77 | % | | | 0.75 | %(4) | | | 0.70 | % | | | 0.75 | % | | | 0.81 | % | |
| Expenses after custodian fee reduction | | | 0.79 | % | | | 0.77 | % | | | 0.75 | %(4) | | | 0.70 | % | | | 0.75 | % | | | 0.81 | % | |
| Interest expense | | | 0.00 | %(3) | | | 0.00 | %(3) | | | 0.00 | %(3)(4) | | | 0.01 | % | | | 0.00 | %(3) | | | 0.02 | % | |
| Net investment income | | | 4.09 | % | | | 3.21 | % | | | 3.63 | %(4) | | | 2.26 | % | | | 4.41 | % | | | 5.91 | % | |
| Portfolio Turnover | | | 2 | % | | | 30 | % | | | 5 | % | | | 67 | % | | | 41 | % | | | 21 | % | |
| Total Return | | | 4.71 | % | | | 2.46 | % | | | 2.23 | % | | | 0.01 | % | | | 8.24 | % | | | 9.52 | % | |
| Net assets, end of period (000's omitted) | | $ | 727,804 | | | $ | 866,273 | | | $ | 1,060,801 | | | $ | 1,521,288 | | | $ | 1,572,812 | | | $ | 675,520 | | |
(1) For the ten-month period ended October 31, 2004.
(2) The Portfolio adopted the provisions of the revised AICPA Audit and Accounting Guide for Investment Companies and began amortizing market premium on fixed income securities. Additionally, the Portfolio reclassified net losses realized on prepayments received on mortgage-backed securities that were previously included in realized gains/losses to interest income. The effect of these changes for the year ended December 31, 2001 was a decrease in the ratio of net investment income to average net assest from 7.51% to 5.91%.
(3) Represents less than 0.01%.
(4) Annualized.
See notes to financial statements
20
Government Obligations Portfolio as of October 31, 2006
NOTES TO FINANCIAL STATEMENTS
1 Significant Accounting Policies
Government Obligations Portfolio (the Portfolio) is registered under the Investment Company Act of 1940, as amended, as a diversified open-end management investment company. The Portfolio, which was organized as a trust under the laws of the State of New York in 1992, seeks to achieve a high current return by investing primarily in mortgage-backed securities (MBS) issued, backed or otherwise guaranteed by the U.S. government or its agencies or instrumentalities. The Declaration of Trust permits the Trustees to issue beneficial interests in the Portfolio. At October 31, 2006, the Eaton Vance Government Obligations Fund had a 82.6% interest in the Portfolio. The following is a summary of significant accounting policies of the Portfolio. The policies are in conformity with accounting principles generally accepted in the United States of America.
A Investment Valuation — Debt securities (including collateralized mortgage obligations and certain mortgage backed securities ("MBS") normally are valued by independent pricing services. The pricing services consider various factors relating to bonds or loans and/or market transactions to determine market value. Seasoned 30-year fixed rate MBS are valued by the investment adviser's matrix pricing system. The matrix pricing system also considers various factors relating to bonds and market transactions to determine market value. Options are valued at last sale price on a U.S. exchange or board of trade or, in the absence of a sale, at the mean between the last bid and asked price. Financial futures contracts listed on commodity exchanges are valued at closing settlement p rices. Securities for which there is no such quotation or valuation are valued at fair value using methods determined in good faith by or at the direction of the Trustees. Short-term obligations having remaining maturities of 60 days or less are valued at amortized cost, which approximates value. If short-term debt securities are acquired with a remaining maturity of more than 60 days, they will be valued by a pricing service.
B Income — Interest income is determined on the basis of interest accrued, adjusted for amortization of premium or accretion of discount.
C Federal Taxes — The Portfolio has elected to be treated as a partnership for federal tax purposes. No provision is made by the Portfolio for federal or state taxes on any taxable income of the Portfolio because each investor in the Portfolio is ultimately responsible for the payment of any taxes on its share of taxable income. Since at least one of the Portfolio's investors is a regulated investment company that invests all or substantially all of its assets in the Portfolio, the Portfolio normally must satisfy the applicable source of income and diversification requirements (under the Internal Revenue Code) in order for its investors to satisfy them. The Portfolio will allocate, at least annually a mong its investors, each investor's distributive share of the Portfolio's net investment income, net realized capital gains, and any other items of income, gain, loss, deduction or credit.
D Expense Reduction — Investors Bank & Trust Company (IBT) serves as custodian to the Portfolio. Pursuant to the custodian agreement, IBT receives a fee reduced by credits which are determined based on the average daily cash balance the Portfolio maintains with IBT. All credit balances used to reduce the Portfolio's custodian fees are reported as a reduction of expenses in the Statement of Operations.
E Written Options — Upon the writing of a call or a put option, an amount equal to the premium received by the Portfolio is included in the Statement of Assets and Liabilities as a liability. The amount of the liability is subsequently marked-to-market to reflect the current value of the option written in accordance with the Portfolio's policies on investment valuations discussed above. Premiums received from writing options which expire are treated as realized gains. Premiums received from writing options which are exercised or are closed are added to or offset against the proceeds or amount paid on the transaction to determine the realized gain or loss. If a put option is exercised, the premium reduces the cost basis of the securities purchased by the Portfolio. The Por tfolio, as writer of an option, may have no control over whether the underlying securities may be sold (call) or purchased (put) and, as a result, bears the market risk of an unfavorable change in the price of the securities underlying the written option.
F Purchased Options — Upon the purchase of a call or put option, the premium paid by the Portfolio is included in the Statement of Assets and Liabilities as an investment. The amount of the investment is subsequently marked-to-market to reflect the current market value of the option purchased, in accordance with the Portfolio's policies on investment valuations discussed above. If an option which the Portfolio has purchased expires on the stipulated expiration date, the Portfolio will realize a loss in the amount of the cost of the option. If the Portfolio enters into a closing sale transaction, the Portfolio will realize a gain or loss, depending on whether the sales proceeds from
21
Government Obligations Portfolio as of October 31, 2006
NOTES TO FINANCIAL STATEMENTS CONT'D
the closing sale transaction are greater or less than the cost of the option. If a Portfolio exercises a put option, it will realize a gain or loss from the sale of the underlying security, and the proceeds from such sale will be decreased by the premium originally paid. If the Portfolio exercises a call option, the cost of the security which the Portfolio purchases upon exercise will be increased by the premium originally paid.
G Financial Futures Contracts — Upon entering into a financial futures contract, the Portfolio is required to deposit an amount (initial margin) either in cash or securities equal to a certain percentage of the purchase price indicated in the financial futures contract. Subsequent payments are made or received by the Portfolio (margin maintenance) each day, dependent on the daily fluctuations in the value of the underlying securities, and are recorded for book purposes as unrealized gains or losses by the Portfolio.
If the Portfolio enters into a closing transaction, the Portfolio will realize, for book purposes, a gain or loss equal to the difference between the value of the financial futures contract to sell and the financial futures contract to buy. The Portfolio's investment in financial futures contracts is designed only to hedge against anticipated future changes in interest rates. Should interest rates move unexpectedly, the Portfolio may not achieve the anticipated benefits of the financial futures contracts and may realize a loss.
H Other — Investment transactions are accounted for on the date the securities are purchased or sold. Realized gains and losses on securities sold are determined on the basis of identified cost.
I Use of Estimates — The preparation of the financial statements in conformity with accounting principles generally accepted in the United States of America requires management to make estimates and assumptions that affect the reported amounts of assets and liabilities at the date of the financial statements and the reported amounts of income and expense during the reporting period. Actual results could differ from those estimates.
J Indemnifications — Under the Portfolio's organizational documents, its officers and Trustees may be indemnified against certain liabilities and expenses arising out of the performance of their duties to the Portfolio. Interestholders in the Portfolio are jointly and severally liable for the liabilities and obligations of the Portfolio in the event that the Portfolio fails to satisfy such liabilities and obligations; provided, however, that, to the extent assets are available in the Portfolio, the Portfolio may, under certain circumstances, indemnify interestholders from and against any claim or liability to which such holder may become subject by reason of being or having been an interestholder in t he Portfolio. Additionally, in the normal course of business, the Portfolio enters into agreements with service providers that may contain indemnification clauses. The Portfolio's maximum exposure under these arrangements is unknown as this would involve future claims that may be made against the Portfolio that have not yet occurred.
K Statement of Cash Flows — The cash amount shown in the Statement of Cash Flows is the amount included in the Portfolio's Statement of Assets and Liabilities and represents cash on hand at its custodian and does not include any short-term investments at October 31, 2006.
2 Purchases and Sales of Investments
Purchases and sales of investments, other than short-term obligations and including paydowns, aggregated $20,645,471 and $526,557,362, respectively.
3 Investment Adviser Fee and Other Transactions with Affiliates
The investment adviser fee is earned by Boston Management and Research (BMR), a wholly-owned subsidiary of Eaton Vance Management (EVM), as compensation for management and investment advisory services rendered to the Portfolio. Under its investment advisory agreement with the Portfolio, BMR receives a fee computed at the monthly rate of 0.0625% (0.75% per annum) of the Portfolio's average daily net assets up to $500 million. On net assets of $500 million or more, BMR has contractually agreed to reduce its advisory fee as follows: 0.6875% annually on average daily net assets of $500 million but less than $1 billion; 0.6250% of average daily net assets of $1 billion but less than $1.5 billion; 0.5625% of average daily net assets of $1.5 billion but less than $2 billion; 0.5000% of average daily net assets of $2 billion but less than $2.5 billion; and 0.4375% of average daily net assets of $2.5 billion and over. These contractual f ee reductions cannot be terminated or decreased without the express consent of the Portfolio's Board of Trustees and its shareholders and are intended to continue indefinitely. For the year ended October 31, 2006, the fee was equivalent to 0.73% of the Portfolio's average net assets for such period and amounted to $5,690,735. Except as to Trustees of the Portfolio who are not members of EVM's or BMR's organization, officers and Trustees receive
22
Government Obligations Portfolio as of October 31, 2006
NOTES TO FINANCIAL STATEMENTS CONT'D
remuneration for their services to the Portfolio out of such investment adviser fee. Trustees of the Portfolio that are not affiliated with the Investment Adviser may elect to defer receipt of all or a percentage of their annual fees in accordance with the terms of the Trustees Deferred Compensation Plan. For the year ended October 31, 2006, no significant amounts have been deferred.
Certain officers and Trustees of the Portfolio are officers of the above organizations.
4 Line of Credit
The Portfolio participates with other portfolios and funds managed by BMR and EVM and its affiliates in a $150 million unsecured line of credit agreement with a group of banks. Borrowings will be made by the Portfolio solely to facilitate the handling of unusual and/or unanticipated short term cash requirements. Interest is charged to each participating portfolio or fund based on its borrowings at an amount above either the Eurodollar rate or Federal Funds rate. In addition, a fee computed at an annual rate of 0.10% on the daily unused portion of the line of credit is allocated among the participating portfolios and funds at the end of each quarter. The average daily loan balance for the year ended October 31, 2006 was $150,137 and the average interest rate was 4.75%.
5 Securities Lending Agreement
The Portfolio has established a securities lending agreement with brokers in which the Portfolio lends portfolio securities to a broker in exchange for collateral consisting of either cash or U.S. government securities in an amount at least equal to the market value of the securities on loan. Under the agreement, the Portfolio continues to earn interest on the securities loaned. Collateral received is generally cash, and the Portfolio invests the cash in accordance with the Portfolio's investment objective and policies and receives any interest on the amount invested but it must also pay the broker a loan rebate fee computed as a varying percentage of the collateral received. The loan rebate fee paid by the Portfolio offsets a portion of the interest income received and amounted to $8,911,169 for the year ended October 31, 2006. In the event of counterparty default, the Portfolio is subject to potential loss if it is delayed or prevented from exercising its right to dispose of the collateral. The Portfolio bears risk in the event that invested collateral is not sufficient to meet obligations due on the loans. At October 31, 2006, the Portfolio had no outstanding securities on loan.
6 Federal Income Tax Basis of Unrealized Appreciation (Depreciation)
The cost and unrealized appreciation (depreciation) in value of the investments owned at October 31, 2006, as determined on a federal income tax basis, were as follows:
| Aggregate cost | | $ | 735,513,609 | | |
| Gross unrealized appreciation | | $ | 8,076,118 | | |
| Gross unrealized depreciation | | | (19,129,222 | ) | |
| Net unrealized depreciation | | $ | (11,053,104 | ) | |
7 Financial Instruments
The Portfolio may trade in financial instruments with off-balance sheet risk in the normal course of its investing activities to assist in managing exposure to various market risks. These financial instruments include written options and financial futures contracts, and may involve, to a varying degree, elements of risk in excess of the amounts recognized for financial statement purposes. The notional or contractual amounts of these instruments represent the investment the Portfolio has in particular classes of financial instruments and does not necessarily represent the amounts potentially subject to risk. The measurement of the risks associated with these instruments is meaningful only when all related and offsetting transactions are considered. A summary of obligations under these financial instruments at October 31, 2006 is as follows:
Futures Contracts
Expiration
Date(s) | | Contracts | | Position | | Aggregate
Cost | | Value | | Net
Unrealized
Appreciation | |
| | 12/06 | | | 500
U.S. Ten Year Treasury Note | | Long | | | $53,476,565 | | | $ | 54,109,375 | | | | $632,810 | | |
At October 31, 2006, the Portfolio had sufficient cash and/or securities to cover margin requirements on any open futures contracts.
8 Recently Issued Accounting Pronouncements
In June 2006, the Financial Accounting Standards Board ("FASB") issued FASB Interpretation No. 48, ("FIN 48") "Accounting for Uncertainty in Income Taxes – an interpretation of FASB Statement No. 109". FIN 48 clarifies the accounting for uncertainty in income taxes recognized in accordance with FASB Statement No. 109, "Accounting for Income Taxes." This interpretation prescribes a recognition threshold and measurement attribute for the
23
Government Obligations Portfolio as of October 31, 2006
NOTES TO FINANCIAL STATEMENTS CONT'D
financial statement recognition and measurement of a tax position taken or expected to be taken in a tax return. It also provides guidance on de-recognition, classification, interest and penalties, accounting in interim periods, disclosure and transition. FIN 48 is effective for fiscal years beginning after December 15, 2006. Management is currently evaluating the impact of applying the various provisions of FIN 48.
In September 2006, the Financial Accounting Standards Board ("FASB") issued Statement of Financial Accounting Standards No. 157, ("FAS 157") "Fair Value Measurements". FAS 157 defines fair value, establishes a framework for measuring fair value in accordance with generally accepted accounting principles and expands disclosure about fair value measurements. FAS 157 is effective for fiscal years beginning after November 15, 2007. Management is currently evaluating the impact the adoption of FAS 157 will have on the Portfolio's financial statement disclosures.
24
Government Obligations Portfolio as of October 31, 2006
REPORT OF INDEPENDENT REGISTERED PUBLIC ACCOUNTING FIRM
To the Trustees and Investors
of Government Obligations Portfolio:
In our opinion, the accompanying statement of assets and liabilities, including the portfolio of investments, and the related statements of operations, changes in net assets and of cash flows and the supplementary data present fairly, in all material respects, the financial position of Government Obligations Portfolio (the "Portfolio") at October 31, 2006, and the results of its operations, the changes in its net assets, its cash flows and the supplementary data for each of the periods indicated, in conformity with accounting principles generally accepted in the United States of America. These financial statements and supplementary data (hereafter referred to as "financial statements") are the responsibility of the Portfolio's management; our responsibility is to express an opinion on these financial statements based on our audits. We conducted our audits of these financial statements in accordance with standards of the Public C ompany Accounting Oversight Board (United States). Those standards require that we plan and perform the audit to obtain reasonable assurance about whether the financial statements are free of material misstatement. An audit includes examining, on a test basis, evidence supporting the amounts and disclosures in the financial statements, assessing the accounting principles used and significant estimates made by management, and evaluating the overall financial statement presentation. We believe that our audits, which included confirmation of securities at October 31, 2006 by correspondence with the custodian and brokers, provide a reasonable basis for our opinion.
PricewaterhouseCoopers LLP
Boston, Massachusetts
December 27, 2006
25
Eaton Vance Government Obligations Fund
BOARD OF TRUSTEES' ANNUAL APPROVAL OF THE INVESTMENT ADVISORY AGREEMENT
Overview of the Contract Review Process
The Investment Company Act of 1940, as amended (the "1940 Act"), provides, in substance, that each investment advisory agreement between a fund and its investment adviser will continue in effect from year to year only if its continuance is approved at least annually by the fund's board of trustees, including by a vote of a majority of the trustees who are not "interested persons" of the fund ("Independent Trustees") cast in person at a meeting called for the purpose of considering such approval.
At a meeting of the Boards of Trustees (each a "Board") of the Eaton Vance group of mutual funds (the "Eaton Vance Funds") held on March 27, 2006, the Board, including a majority of the Independent Trustees, voted to approve continuation of existing advisory and sub-advisory agreements for the Eaton Vance Funds for an additional one-year period. In voting its approval, the Board relied upon the affirmative recommendation of the Special Committee of the Board, which is a committee comprised exclusively of Independent Trustees. Prior to making its recommendation, the Special Committee reviewed information furnished for a series of meetings of the Special Committee held in February and March 2006. Such information included, among other things, the following:
Information about Fees, Performance and Expenses
• An independent report comparing the advisory and related fees paid by each fund with fees paid by comparable funds;
• An independent report comparing each fund's total expense ratio and its components to comparable funds;
• An independent report comparing the investment performance of each fund to the investment performance of comparable funds over various time periods;
• Data regarding investment performance in comparison to relevant peer groups of funds and appropriate indices;
• Comparative information concerning fees charged by each adviser for managing other mutual funds and institutional accounts using investment strategies and techniques similar to those used in managing the fund;
• Profitability analyses for each adviser with respect to each fund managed by it;
Information about Portfolio Management
• Descriptions of the investment management services provided to each fund, including the investment strategies and processes employed;
• Information concerning the allocation of brokerage and the benefits received by each adviser as a result of brokerage allocation, including information concerning the acquisition of research through "soft dollar" benefits received in connection with the funds' brokerage, and the implementation of a soft dollar reimbursement program established with respect to the funds;
• Data relating to portfolio turnover rates of each fund;
• The procedures and processes used to determine the fair value of fund assets and actions taken to monitor and test the effectiveness of such procedures and processes;
Information about each Adviser
• Reports detailing the financial results and condition of each adviser;
• Descriptions of the qualifications, education and experience of the individual investment professionals whose responsibilities include portfolio management and investment research for the funds, and information relating to their compensation and responsibilities with respect to managing other mutual funds and investment accounts;
• Copies of the Codes of Ethics of each adviser and its affiliates, together with information relating to compliance with and the administration of such codes;
• Information concerning the resources devoted to compliance efforts undertaken by each adviser and its affiliates on behalf of the funds (including descriptions of various compliance programs) and their record of compliance with investment policies and restrictions, including policies with respect to market-timing, late trading and selective portfolio disclosure, and with policies on personal securities transactions;
• Descriptions of the business continuity and disaster recovery plans of each adviser and its affiliates;
Other Relevant Information
• Information concerning the nature, cost and character of the administrative and other non-investment management services provided by Eaton Vance Management and its affiliates;
• Information concerning management of the relationship with the custodian, subcustodians and fund accountants by each adviser or the funds' administrator; and
• The terms of each advisory agreement.
In addition to the information identified above, the Special Committee considered information provided from time to time by each adviser throughout the year at meetings of the Board and its committees. Over the course of the twelve month period ended March 31,
26
Eaton Vance Government Obligations Fund
BOARD OF TRUSTEES' ANNUAL APPROVAL OF THE INVESTMENT ADVISORY AGREEMENT CONT'D
2006, the Board met nine times and the Special Committee, the Audit Committee and the Governance Committee, each of which is a Committee comprised solely of Independent Trustees, met eight, twelve and five times, respectively. At such meetings, the Trustees received, among other things, presentations by the portfolio managers and other investment professionals of each adviser relating to the investment performance of each fund and the investment strategies used in pursuing the fund's investment objective.
For funds that invest through one or more underlying portfolios, the Board considered similar information about the portfolio(s) when considering the approval of advisory agreements. In addition, in cases where the fund's investment adviser has engaged a sub-adviser, the Board considered similar information about the sub-adviser when considering the approval of any sub-advisory agreement.
The Special Committee was assisted throughout the contract review process by Goodwin Procter LLP, legal counsel for the Independent Trustees. The members of the Special Committee relied upon the advice of such counsel and their own business judgment in determining the material factors to be considered in evaluating each advisory and sub-advisory agreement and the weight to be given to each such factor. The conclusions reached with respect to each advisory and sub-advisory agreement were based on a comprehensive evaluation of all the information provided and not any single factor. Moreover, each member of the Special Committee may have placed varying emphasis on particular factors in reaching conclusions with respect to each advisory and sub-advisory agreement.
Results of the Process
Based on its consideration of the foregoing, and such other information as it deemed relevant, including the factors and conclusions described below, the Special Committee concluded that the continuance of the investment advisory agreement of the Government Obligations Portfolio (the "Portfolio"), the portfolio in which the Government Obligations Fund (the "Fund") invests, with Boston Management and Research (the "Adviser"), including the fee structure, is in the interests of shareholders and, therefore, the Special Committee recommended to the Board approval of the agreement. The Board accepted the recommendation of the Special Committee as well as the factors considered and conclusions reached by the Special Committee with respect to the agreement. Accordingly, the Board, including a majority of the Independent Trustees, voted to approve continuation of the investment advisory agreement for the Portfolio.
Nature, Extent and Quality of Services
In considering whether to approve the investment advisory agreement of the Portfolio, the Board evaluated the nature, extent and quality of services provided to the Portfolio by the Adviser.
The Board considered the Adviser's management capabilities and investment process with respect to the types of investments held by the Portfolio, including the education, experience and number of its investment professionals and other personnel who provide portfolio management, investment research, and similar services to the Portfolio, including recent changes to such personnel. The Board specifically noted the Adviser's experience in investing in mortgage-backed securities, including seasoned mortgage-backed securities. The Board also took into account the resources dedicated to portfolio management and other services, including the compensation paid to recruit and retain investment personnel, and the time and attention devoted to each Portfolio in the complex by senior management.
The Board reviewed the compliance programs of the Adviser and relevant affiliates thereof. Among other matters, the Board considered compliance and reporting matters relating to personal trading by investment personnel, selective disclosure of portfolio holdings, late trading, frequent trading, portfolio valuation, business continuity and the allocation of investment opportunities. The Board also evaluated the responses of the Adviser and its affiliates to requests from regulatory authorities such as the Securities and Exchange Commission and the National Association of Securities Dealers.
The Board considered shareholder and other administrative services provided or managed by Eaton Vance Management and its affiliates, including transfer agency and accounting services. The Board evaluated the benefits to shareholders of investing in a fund that is a part of a large family of funds, including the ability, in many cases, to exchange an investment among different funds without incurring additional sales charges.
After consideration of the foregoing factors, among others, the Board concluded that the nature, extent and quality of services provided by the Adviser, taken as a whole, are appropriate and consistent with the terms of the investment advisory agreement.
Fund Performance
The Board compared the Fund's investment performance to a relevant universe of similarly managed funds identified by an independent data provider and appropriate benchmark indices. The Board reviewed comparative performance data for the one-, three-, five- and ten-year periods ended September 30, 2005 for the Fund. The Board concluded that the Fund's performance was satisfactory.
27
Eaton Vance Government Obligations Fund
BOARD OF TRUSTEES' ANNUAL APPROVAL OF THE INVESTMENT ADVISORY AGREEMENT CONT'D
Management Fees and Expenses
The Board reviewed contractual investment advisory fee rates payable by the Portfolio and the Fund (referred to as "management fees"). As part of its review, the Board considered the management fees and the Fund's total expense ratio for the one-year period ended September 30, 2005, as compared to a group of similarly managed funds selected by an independent data provider.
After reviewing the foregoing information, and in light of the nature, extent and quality of the services provided by the Adviser, the Board concluded that the management fees charged for advisory and related services and the Fund's total expense ratio are reasonable.
Profitability
The Board reviewed the level of profits realized by the Adviser and relevant affiliates thereof in providing investment advisory and administrative services to the Fund, the Portfolio and to all Eaton Vance Funds as a group. The Board considered the level of profits realized without regard to revenue sharing or other payments by the Adviser and its affiliates to third parties in respect of distribution services. The Board also considered other direct or indirect benefits received by the Adviser and its affiliates in connection with its relationship with the Fund.
The Board concluded that, in light of the foregoing factors and the nature, extent and quality of the services rendered, the profits realized by the Adviser and its affiliates are reasonable.
Economies of Scale
In reviewing management fees and profitability, the Board also considered the extent to which the Adviser and its affiliates, on the one hand, and the Fund, on the other hand, can expect to realize benefits from economies of scale as the assets of the Portfolio increase. The Board acknowledged the difficulty in accurately measuring the benefits resulting from the economies of scale with respect to the management of any specific fund or group of funds. The Board reviewed data summarizing the increases and decreases in the assets of the Fund and of all Eaton Vance Funds as a group over various time periods, and evaluated the extent to which the total expense ratio of the Fund and the profitability of the Adviser and its affiliates may have been affected by such increases or decreases. Based upon the foregoing, the Board concluded that the benefits from economies of scale are currently being shared equitably by the Adviser and its affiliates and the Fund. The Board also concluded that, assuming reasonably foreseeable increases in the assets of the Portfolio, the structure of the advisory fee, which includes breakpoints at several asset levels, can be expected to cause the Adviser and its affiliates and the Fund to continue to share such benefits equitably.
28
Eaton Vance Government Obligations Fund
MANAGEMENT AND ORGANIZATION
Fund Management. The Trustees of Eaton Vance Mutual Funds Trust (the Trust) and Government Obligations Portfolio (the Portfolio) are responsible for the overall management and supervision of the Trust's and Portfolio's affairs. The Trustees and officers of the Trust and the Portfolio are listed below. Except as indicated, each individual has held the office shown or other offices in the same company for the last five years. Trustees and officers of the Trust and the Portfolio hold indefinite terms of office. The "noninterested Trustees" consist of those Trustees who are not "interested persons" of the Trust and the Portfolio, as that term is defined under the 1940 Act. The business address of each Trustee and officer is The Eaton Vance Building, 255 State Street, Boston, Massachusetts 02109. As used below, "EVC" refers to Eaton Vance Corp., "EV" refers to Ea ton Vance, Inc., "EVM" refers to Eaton Vance Management, "BMR" refers to Boston Management and Research, "Parametric" refers to Parametric Portfolio Associates and "EVD" refers to Eaton Vance Distributors, Inc. EVC and EV are the corporate parent and trustee, respectively, of EVM and BMR. EVD is the Fund's principal underwriter, the Portfolio's placement agent and a wholly-owned subsidiary of EVM. Each officer affiliated with Eaton Vance may hold a position with other Eaton Vance affiliates that is comparable to his or her position with EVM listed below.
Name and
Date of Birth | | Position(s)
with the
Trust and the
Portfolio | | Term of
Office and
Length of
Service | | Principal Occupation(s)
During Past Five Years | | Number of Portfolios
in Fund Complex
Overseen By
Trustee(1) | | Other Directorships Held | |
| Interested Trustee | | | | | | | | | | | | | |
|
| James B. Hawkes 11/9/41 | | Trustee | | Trustee of the Trust since 1991 and of the Portfolio since 1992 | | Chairman and Chief Executive Officer of EVC, BMR, EVM and EV; Director of EV; Vice President and Director of EVD. Trustee and/or officer of 170 registered investment companies in the Eaton Vance Fund Complex. Mr. Hawkes is an interested person because of his positions with BMR, EVM, EVC and EV, which are affiliates of the Trust and the Portfolio. | | | 170 | | | Director of EVC | |
|
| Noninterested Trustee(s) | | | | | | | | | | | | | |
|
| Benjamin C. Esty 1/2/63 | | Trustee | | Since 2005 | | Roy and Elizabeth Simmons Professor of Business Administration, Harvard University Graduate School of Business Administration (since 2003). Formerly, Associate Professor, Harvard University Graduate School of Business Administration (2000-2003). | | | 170 | | | None | |
|
| Samuel L. Hayes, III 2/23/35 | | Trustee and Chairman of the Board | | Trustee of the Trust since 1986; of the Portfolio since 1993 and Chairman of the Board since 2005 | | Jacob H. Schiff Professor of Investment Banking Emeritus, Harvard University Graduate School of Business Administration. Director of Yakima Products, Inc. (manufacturer of automotive accessories) (since 2001) and Director of Telect, Inc. (telecommunications services company). | | | 170 | | | Director of Tiffany & Co. (specialty retailer) | |
|
| William H. Park 9/19/47 | | Trustee | | Since 2003 | | Vice Chairman, Commercial Industrial Finance Corp. (specialty finance company) (since 2006). Formerly, President and Chief Executive Officer, Prizm Capital Management, LLC (investment management firm) (2002-2005). Formerly, Executive Vice President and Chief Financial Officer, United Asset Management Corporation (a holding company owning institutional investment management firms) (1982-2001). | | | 170 | | | None | |
|
| Ronald A. Pearlman 7/10/40 | | Trustee | | Since 2003 | | Professor of Law, Georgetown University Law Center. | | | 170 | | | None | |
|
29
Eaton Vance Government Obligations Fund
MANAGEMENT AND ORGANIZATION CONT'D
Name and
Date of Birth | | Position(s)
with the
Trust and the
Portfolio | | Term of
Office and
Length of
Service | | Principal Occupation(s)
During Past Five Years | | Number of Portfolios
in Fund Complex
Overseen By
Trustee(1) | | Other Directorships Held | |
| Noninterested Trustee(s) (continued) | | | | | | | | | | | | | |
|
| Norton H. Reamer 9/21/35 | | Trustee | | Trustee of the Trust since 1986 and of the Portfolio since 1993 | | President, Chief Executive Officer and a Director of Asset Management Finance Corp. (a specialty finance company serving the investment management industry) (since October 2003). President, Unicorn Corporation (an investment and financial advisory services company) (since September 2000). Formerly, Chairman and Chief Operating Officer, Hellman, Jordan Management Co., Inc. (an investment management company) (2000-2003). Formerly, Advisory Director of Berkshire Capital Corporation (investment banking firm) (2002-2003). | | | 170 | | | None | |
|
| Lynn A. Stout 9/14/57 | | Trustee | | Since 1998 | | Professor of Law, University of California at Los Angeles School of Law. | | | 170 | | | None | |
|
| Ralph F. Verni 1/26/43 | | Trustee | | Since 2005 | | Consultant and private investor. | | | 170 | | | None | |
|
| Principal Officers who are not Trustees | | | | | | | |
|
Name and
Date of Birth | | Position(s)
with the
Trust and the
Portfolio | | Term of
Office and
Length of
Service | | Principal Occupation(s) During
Past Five Years | |
| Thomas E. Faust Jr. 5/31/58 | | President of the Trust | | Since 2002 | | President of EVC, EVM, BMR, and EV and Director of EVC. Chief Investment Officer of EVC, EVM and BMR. Officer of 71 registered investment companies and 5 private investment companies managed by EVM or BMR. | |
|
| William H. Ahern, Jr. 7/28/59 | | Vice President
of the Trust | | Since 1995 | | Vice President of EVM and BMR. Officer of 71 registered investment companies managed by EVM or BMR. | |
|
| Cynthia J. Clemson 3/2/63 | | Vice President
of the Trust | | Since 2005 | | Vice President of EVM and BMR. Officer of 86 registered investment companies managed by EVM or BMR. | |
|
| Kevin S. Dyer 2/21/75 | | Vice President
of the Trust | | Since 2005 | | Assistant Vice president of EVM and BMR. Officer of 25 registered investment companies managed by EVM or BMR. | |
|
Aamer Khan
6/7/60 | | Vice President
of the Trust | | Since 2005 | | Vice President of EVM and BMR. Officer of 29 registered investment companies managed by EVM or BMR. | |
|
| Thomas H. Luster 4/8/62 | | Vice President
of the Trust | | Since 2006 | | Vice President of EVM and BMR. Officer of 45 registered investment companies managed by EVM or BMR. | |
|
| Christine Johnston 11/9/72 | | Vice President
of the Portfolio | | Since 2006 | | Vice President of EVM and BMR. Officer of 3 registered investment companies managed by EVM or BMR. | |
|
| Michael R. Mach 7/15/47 | | Vice President
of the Trust | | Since 1999 | | Vice President of EVM and BMR. Officer of 51 registered investment companies managed by EVM or BMR. | |
|
| Robert B MacIntosh 1/22/57 | | Vice President
of the Trust | | Since 1998 | | Vice President of EVM and BMR. Officer of 86 registered investment companies managed by EVM or BMR. | |
|
| Cliff Quisenberry, Jr. 1/1/65 | | Vice President
of the Trust | | Since 2006 | | Vice President and Director of Research and Product Development of Parametric. Officer of 30 registered investment companies managed by EVM or BMR. | |
|
| Duncan W. Richardson 10/26/57 | | Vice President
of the Trust | | Since 2001 | | Executive Vice President and Chief Equity Investment Officer of EVC, EVM and BMR. Officer 71 registered investment companies managed by EVM or BMR. | |
|
| Walter A. Row, III 7/20/57 | | Vice President
of the Trust | | Since 2001 | | Director of Equity Research and a Vice President of EVM and BMR. Officer of 33 registered investment companies managed by EVM or BMR. | |
|
| Judith A. Saryan 8/21/54 | | Vice President
of the Trust | | Since 2003 | | Vice President of EVM and BMR. Officer of 50 registered investment companies managed by EVM or BMR. | |
|
30
Eaton Vance Government Obligations Fund
MANAGEMENT AND ORGANIZATION CONT'D
Name and
Date of Birth | | Position(s)
with the
Trust and the
Portfolio | | Term of
Office and
Length of
Service | | Principal Occupation(s) During
Past Five Years | |
| Susan Schiff 3/13/61 | | Vice President | | Vice President of the Trust since 2002 and of the Portfolio since 1993 | | Vice President of EVM and BMR. Officer of 30 registered investment companies managed by EVM or BMR. | |
|
| Mark Venezia 5/23/49 | | President of
the Portfolio | | Since 2002(2) | | Vice President of EVM and BMR. Officer of 5 registered investment companies managed by EVM or BMR. | |
|
| Barbara E. Campbell 6/19/57 | | Treasurer of the Trust | | Since 2005(2) | | Vice President of EVM and BMR. Officer of 170 registered investment companies managed by EVM or BMR. | |
|
| Alan R. Dynner 10/10/40 | | Secretary | | Since 1997 | | Vice President, Secretary and Chief Legal Officer of BMR, EVM, EVD, EV and EVC. Officer of 170 registered investment companies managed by EVM or BMR. | |
|
| Dan A. Maalouly 3/05/62 | | Treasurer of
the Portfolio | | Since 2005 | | Vice President of EVM and BMR. Previously, Senior Manager at PricewaterhouseCoopers LLP (1997-2005). Officer of 71 registered investment companies managed by EVM or BMR. | |
|
| Paul M. O'Neil 7/11/53 | | Chief
Compliance Officer | | Since 2004 | | Vice President of EVM and BMR. Officer of 170 registered investment companies managed by EVM or BMR. | |
|
(1) Includes both master and feeder funds in a master-feeder structure.
(2) Prior to 2002, Mr. Venezia served as Vice President of the Portfolio since 1993. Prior to 2005, Ms. Campbell served as Assistant Treasurer of the Trust since 1995.
The SAI for the Fund includes additional information about the Trustees and officers of the Fund and the Portfolio and can be obtained without charge on Eaton Vance's website at www.eatonvance.com or by calling 1-800-225-6265.
31
This Page Intentionally Left Blank
Investment Adviser of Government Obligations Portfolio
Boston Management and Research
The Eaton Vance Building
255 State Street
Boston, MA 02109
Administrator of Eaton Vance Government Obligations Fund
Eaton Vance Management
The Eaton Vance Building
255 State Street
Boston, MA 02109
Principal Underwriter
Eaton Vance Distributors, Inc.
The Eaton Vance Building
255 State Street
Boston, MA 02109
(617) 482-8260
Custodian
Investors Bank & Trust Company
200 Clarendon Street
Boston, MA 02116
Transfer Agent
PFPC Inc.
Attn: Eaton Vance Funds
P.O. Box 9653
Providence, RI 02940-9653
(800) 262-1122
Independent Registered Public Accounting Firm
PricewaterhouseCoopers LLP
125 High Street
Boston, MA 02110
Eaton Vance Government Obligations Fund
The Eaton Vance Building
255 State Street
Boston, MA 02109
This report must be preceded or accompanied by a current prospectus. Before investing, investors should consider carefully the Fund's investment objective, risks, and charges and expenses. The Fund's current prospectus contains this and other information about the Fund and is available through your financial advisor. Please read the prospectus carefully before you invest or send money. For further information please call 1-800-225-6265.
140-12/06 GOSRC

Annual Report October 31, 2006


EATON VANCE
LOW
DURATION
FUND
IMPORTANT NOTICES REGARDING PRIVACY,
DELIVERY OF SHAREHOLDER DOCUMENTS,
PORTFOLIO HOLDINGS AND PROXY VOTING
Privacy. The Eaton Vance organization is committed to ensuring your financial privacy. Each of the financial institutions identified below has in effect the following policy ("Privacy Policy") with respect to nonpublic personal information about its customers:
• Only such information received from you, through application forms or otherwise, and information about your Eaton Vance fund transactions will be collected. This may include information such as name, address, social security number, tax status, account balances and transactions.
• None of such information about you (or former customers) will be disclosed to anyone, except as permitted by law (which includes disclosure to employees necessary to service your account). In the normal course of servicing a customer's account, Eaton Vance may share information with unaffiliated third parties that perform various required services such as transfer agents, custodians and broker/dealers.
• Policies and procedures (including physical, electronic and procedural safeguards) are in place that are designed to protect the confidentiality of such information.
• We reserve the right to change our Privacy Policy at any time upon proper notification to you. Customers may want to review our Policy periodically for changes by accessing the link on our homepage: www.eatonvance.com.
Our pledge of privacy applies to the following entities within the Eaton Vance organization: the Eaton Vance Family of Funds, Eaton Vance Management, Eaton Vance Investment Counsel, Boston Management and Research, and Eaton Vance Distributors, Inc.
In addition, our Privacy Policy only applies to those Eaton Vance customers who are individuals and who have a direct relationship with us. If a customer's account (i.e., fund shares) is held in the name of a third-party financial adviser/broker-dealer, it is likely that only such adviser's privacy policies apply to the customer. This notice supersedes all previously issued privacy disclosures.
For more information about Eaton Vance's Privacy Policy, please call 1-800-262-1122.
Delivery of Shareholder Documents. The Securities and Exchange Commission (the "SEC") permits funds to deliver only one copy of shareholder documents, including prospectuses, proxy statements and shareholder reports, to fund investors with multiple accounts at the same residential or post office box address. This practice is often called "householding" and it helps eliminate duplicate mailings to shareholders.
Eaton Vance, or your financial adviser, may household the mailing of your documents indefinitely unless you instruct Eaton Vance, or your financial adviser, otherwise.
If you would prefer that your Eaton Vance documents not be householded, please contact Eaton Vance at 1-800-262-1122, or contact your financial adviser.
Your instructions that householding not apply to delivery of your Eaton Vance documents will be effective within 30 days of receipt by Eaton Vance or your financial adviser.
Portfolio Holdings. Each Eaton Vance Fund and its underlying Portfolio (if applicable) will file a schedule of its portfolio holdings on Form N-Q with the SEC for the first and third quarters of each fiscal year. The Form N-Q will be available on the Eaton Vance website www.eatonvance.com, by calling Eaton Vance at 1-800-262-1122 or in the EDGAR database on the SEC's website at www.sec.gov. Form N-Q may also be reviewed and copied at the SEC's public reference room in Washington, D.C.
(call 1-800-732-0330 for information on the operation of the public reference room).
Proxy Voting. From time to time, funds are required to vote proxies related to the securities held by the funds. The Eaton Vance Funds or their underlying Portfolios (if applicable) vote proxies according to a set of policies and procedures approved by the Funds' and Portfolios' Boards. You may obtain a description of these policies and procedures and information on how the Funds or Portfolios voted proxies relating to portfolio securities during the most recent 12 month period ended June 30, without charge, upon request, by calling 1-800-262-1122. This description is also available on the SEC's website at www.sec.gov.
Eaton Vance Low Duration Fund as of October 31, 2006
MANAGEMENT’S DISCUSSION OF FUND PERFORMANCE

Susan Schiff, CFA
Co-Portfolio Manager

Christine Johnston, CFA
Co-Portfolio Manager
The Fund
Performance for the Past Year
· The Fund’s Class A shares had a total return of 3.74% for the year ended October 31, 2006.(1) This return resulted from a decrease in net asset value (NAV) per share to $9.06 on October 31, 2006 from $9.22 on October 31, 2005, and the reinvestment of $0.495 in dividends.
· The Fund’s Class B shares had a total return of 3.07% for the year ended October 31, 2006.(1) This return resulted from a decrease in NAV per share to $9.06 on October 31, 2006 from $9.21 on October 31, 2005, and the reinvestment of $0.426 in dividends.
· The Fund’s Class C shares had a total return of 3.12% for the year ended October 31, 2006.(1) This return resulted from a decrease in NAV per share to $9.06 on October 31, 2006 from $9.22 on October 31, 2005, and the reinvestment of $0.440 in dividends.
· In comparison, the Merrill Lynch 1-3 Year Treasury Index – an unmanaged market index of short-term U.S. Treasury securities – had a total return of 4.15% for the year ended October 31, 2006.(2) The Fund’s peer group, the Lipper Short U.S. Government Funds Classification, had an average total return of 3.86% for the same period.(2)
Recent Fund Developments
· Low Duration Fund seeks total return, an objective it pursues primarily through investments in securities issued by the U.S. government (or its agencies and instrumentalities) and at least 90% of the Fund’s net assets is invested in investment grade securities. The Fund currently pursues its objective by investing in one or more registered investment companies (each a “Portfolio”), that are managed by Eaton Vance Management or its affiliates: Floating Rate Portfolio and Investment Portfolio.
· With interest rates in the short end of the yield curve rising through much of the fiscal year, the Fund benefited from a continuing exposure to adjustable-rate mortgage-backed securities (MBS) and other floating rate instruments, for which interest rates are reset periodically to reflect changes in benchmark rates. At October 31, 2006, 45% of the Fund’s total investments were invested in such vehicles.
· The Fund was invested predominantly in three market sectors at October 31, 2006: mortgage-backed securities, with the largest segments invested in seasoned adjustable-rate MBS and seasoned fixed-rate MBS (78% of total investments); short-term investments (13% of total investments); and senior floating-rate loans (9% of total investments). These weightings represented the Fund’s investments in Investment Portfolio and Floating Rate Portfolio.(3)
· During the 12 months ended October 31, 2006, the Federal Reserve raised the Federal Funds rate by 150 basis points (1.50%), from 3.75% to 5.25%. While yields in the short end of the yield curve rose with these changes, yields in the intermediate-to-long end of the curve were only slightly higher. Five-year Treasury bond yields rose by only 12 basis points (0.12%). Spreads on seasoned MBS – the Investment Portfolio’s current focus when investing in MBS – narrowed, while prepayment rates continued to fall. Spreads on MBS versus Treasuries remained at relatively tight levels historically; however, the market continued to be well-supported by strong demand from foreign buyers.
· The Fund’s duration was 1.73 years at October 31, 2006. As the economy slowed and the prospect of inflation subsided, management chose to extend modestly the Fund’s duration. Duration is an indicator – stated in years – that measures cash flows and expected maturity of a fixed-income security or portfolio, and is used to determine price sensitivity to changes in interest rates. A longer duration increases the Portfolio’s interest rate exposure. Management hopes to benefit from this exposure if interest rates decline in response to a weaker economy.
(1) These returns do not include the 2.25% maximum sales charge for the Fund’s Class A shares or the applicable contingent deferred sales charges (CDSC) for Class B shares and Class C shares. If sales charges were deducted, the returns would be lower.
(2) It is not possible to invest directly in an Index or Lipper Classification. The Index’s total return does not reflect the commissions or expenses that would have been incurred if an investor individually purchased or sold the securities represented in the Index. The Lipper average is the average total return, at net asset value, of the funds that are in the same Lipper Classification as the Fund.
(3) Portfolio investments may not be representative of the Portfolios’ current or future investments and may change due to active management.
Past performance is no guarantee of future results. Returns are historical and are calculated by determining the percentage change in net asset value or offering price (as applicable) with all distributions reinvested. Investment return and principal value will fluctuate so that shares, when redeemed, may be worth more or less than their original cost. Performance is for the stated time period only; due to market volatility, the Fund’s current performance may be lower or higher than the quoted return. For performance as of the most recent month-end, please refer to www.eatonvance.com.
Fund shares are not insured by the FDIC and are not deposits or other obligations of, or guaranteed by, any depository institution. Shares are subject to investment risks, including possible loss of principal invested.
The views expressed throughout this report are those of the portfolio managers and are current only through the end of the period of the report as stated on the cover. These views are subject to change at any time based upon market or other conditions, and the investment adviser disclaims any responsibility to update such views. These views may not be relied on as investment advice and, because investment decisions for a fund are based on many factors, may not be relied on as an indication of trading intent on behalf of any Eaton Vance funds.
1
Eaton Vance Low Duration Fund as of October 31, 2006
FUND PERFORMANCE
The line graphs and table set forth below provide information about the Fund’s performance. The line graphs compare the performance of each class of the Fund with that of the Merrill Lynch 1-3 Year Treasury Index, an unmanaged market index of short-term U.S. Treasury securities. The lines on the graph represent the total returns of a hypothetical investment of $10,000 in each Class and in the Merrill Lynch 1-3 Year Treasury Index (ML 1-3 Year Treasury Index). Class A total returns are presented at net asset value and maximum public offering price. The table includes the total returns of each Class of the Fund at net asset value and public offering price. The performance presented below does not reflect the deduction of taxes, if any, that a shareholder would pay on Fund distributions or the redemption of Fund shares.
Performance(1) | | Class A | | Class B | | Class C | |
Average Annual Total Returns (at net asset value) | | | | | | | |
One year | | 3.74 | % | 3.07 | % | 3.12 | % |
Life of Fund† | | 1.88 | | 1.11 | | 1.26 | |
| | | | | | | |
SEC Average Annual Total Returns (including sales charge or applicable CDSC) | | | | | | | |
One year | | 1.43 | % | 0.12 | % | 2.14 | % |
Life of Fund† | | 1.31 | | 1.11 | | 1.26 | |
†Inception Dates – Class A: 9/30/02; Class B: 9/30/02; Class C: 9/30/02
(1) Average Annual Total Returns do not include the 2.25% maximum sales charge for Class A shares or the applicable contingent deferred sales charge (CDSC) for Class B and Class C shares. If sales charges were deducted, returns would be lower. SEC returns for Class A reflect the maximum 2.25% sales charge. SEC Average Annual Total Returns for Class B reflect applicable CDSC based on the following schedule: 3% - 1st year; 2.5% - 2nd year; 2.0% - 3rd year; 1% - 4th year. SEC 1-Year return for Class C reflects a 1% CDSC.
Past performance is no guarantee of future results. Returns are historical and are calculated by determining the percentage change in net asset value or offering price (as applicable) with all distributions reinvested. Investment return and principal value will fluctuate so that shares, when redeemed, may be worth more or less than their original cost. Performance is for the stated time period only; due to market volatility, the Fund’s current performance may be lower or higher than the quoted return. For performance as of the most recent month-end, please refer to www.eatonvance.com.
Diversification by Sectors(2)
By total investments
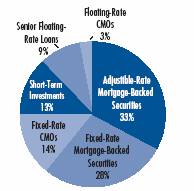
(2) The Diversification by Sectors breakdown reflects the Fund’s investments in Investment Portfolio and Floating Rate Portfolio, as of October 31, 2006. Sectors are shown as a percentage of the Fund’s total investments. Portfolio information may not be representative of the Portfolios’ current or future investments and may change due to active management.
Comparison of Change in Value of a $10,000 Investment in Eaton Vance Low Duration Fund Class A vs. Merrill Lynch 1-3 Yr. Treasury Index*
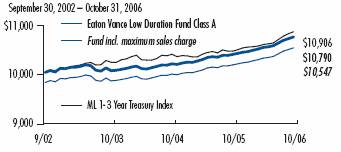
Comparison of Change in Value of a $10,000 Investment in Eaton Vance Low Duration Fund Class B vs. Merrill Lynch 1-3 Yr. Treasury Index*
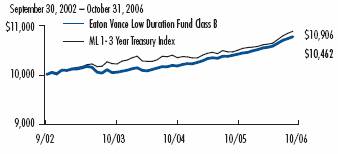
Comparison of Change in Value of a $10,000 Investment in Eaton Vance Low Duration Fund Class C vs. Merrill Lynch 1-3 Yr. Treasury Index*
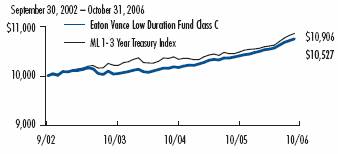
* Sources: Thomson Financial; Bloomberg, L.P. Class A, Class B and Class C of the Fund commenced operations on 9/30/02.
The Index’s total return does not reflect the commissions or expenses that would have been incurred if an investor individually purchased or sold the securities represented in the Index. It is not possible to invest directly in an Index.
2
Eaton Vance Low Duration Fund as of October 31, 2006
FUND EXPENSES
Example: As a shareholder of the Fund, you incur two types of costs: (1) transaction costs, including sales charges (loads) on purchases and redemption fees (if applicable); and (2) ongoing costs, including management fees; distribution or service fees; and other Fund expenses. This Example is intended to help you understand your ongoing costs (in dollars) of investing in the Fund and to compare these costs with the ongoing costs of investing in other mutual funds. The Example is based on an investment of $1,000 invested at the beginning of the period and held for the entire period (May 1, 2006 – October 31, 2006).
Actual Expenses: The first section of the table below provides information about actual account values and actual expenses. You may use the information in this section, together with the amount you invested, to estimate the expenses that you paid over the period. Simply divide your account value by $1,000 (for example, an $8,600 account value divided by $1,000 = 8.6), then multiply the result by the number in the first section under the heading entitled "Expenses Paid During Period" to estimate the expenses you paid on your account during this period.
Hypothetical Example for Comparison Purposes: The second section of the table below provides information about hypothetical account values and hypothetical expenses based on the Fund's actual expense ratio and an assumed rate of return of 5% per year (before expenses), which is not the actual return of the Fund. The hypothetical account values and expenses may not be used to estimate the actual ending account balance or expenses you paid for the period. You may use this information to compare the ongoing costs of investing in your Fund and other funds. To do so, compare this 5% hypothetical example with the 5% hypothetical examples that appear in the shareholder reports of the other funds.
Please note that the expenses shown in the table are meant to highlight your ongoing costs only and do not reflect any transactional costs, such as sales charges (loads) or redemption fees (if applicable). Therefore, the second section of the table is useful in comparing ongoing costs only, and will not help you determine the relative total costs of owning different funds. In addition, if these transactional costs were included, your costs would have been higher.
Eaton Vance Low Duration Fund
| | | Beginning Account Value
(5/1/06) | | Ending Account Value
(10/31/06) | | Expenses Paid During Period*
(5/1/06 – 10/31/06) | |
| Actual | |
| Class A | | $ | 1,000.00 | | | $ | 1,022.20 | | | $ | 7.14 | | |
| Class B | | $ | 1,000.00 | | | $ | 1,018.30 | | | $ | 10.94 | | |
| Class C | | $ | 1,000.00 | | | $ | 1,019.10 | | | $ | 10.13 | | |
| Hypothetical | |
| (5% return per year before expenses) | |
| Class A | | $ | 1,000.00 | | | $ | 1,018.10 | | | $ | 7.12 | | |
| Class B | | $ | 1,000.00 | | | $ | 1,014.40 | | | $ | 10.92 | | |
| Class C | | $ | 1,000.00 | | | $ | 1,015.20 | | | $ | 10.11 | | |
* Expenses are equal to the Fund's annualized expense ratio of 1.40% for Class A shares, 2.15% for Class B shares, and 1.99% for Class C shares multiplied by the average account value over the period, multiplied by 184/365 (to reflect the one-half period). The example assumes that the $1,000 was invested at the net asset value per share determined at the close of business on April 30, 2006. The example reflects the expenses of both the Fund and the Portfolios.
3
Eaton Vance Low Duration Fund as of October 31, 2006
FINANCIAL STATEMENTS
Statement of Assets and Liabilities
As of October 31, 2006
| Assets | |
Investment in Investment Portfolio, at value
(identified cost, $38,908,843) | | $ | 38,726,299 | | |
Investment in Floating Rate Portfolio, at value
(identified cost, $3,990,303) | | | 4,005,253 | | |
| Receivable for Fund shares sold | | | 11,826 | | |
| Total assets | | $ | 42,743,378 | | |
| Liabilities | |
| Dividends payable | | $ | 68,340 | | |
| Payable for Fund shares redeemed | | | 38,964 | | |
| Payable to affiliate for distribution and service fees | | | 20,954 | | |
| Payable to affiliate for Trustees' fees | | | 15 | | |
| Accrued expenses | | | 30,080 | | |
| Total liabilities | | $ | 158,353 | | |
| Net Assets | | $ | 42,585,025 | | |
| Sources of Net Assets | |
| Paid-in capital | | $ | 52,389,287 | | |
Accumulated net realized loss from Portfolios (computed on
the basis of identified cost) | | | (9,587,468 | ) | |
| Accumulated distributions in excess of net investment income | | | (49,200 | ) | |
Net unrealized depreciation from Portfolios (computed on the basis of
identified cost) | | | (167,594 | ) | |
| Total | | $ | 42,585,025 | | |
| Class A Shares | |
| Net Assets | | $ | 21,156,914 | | |
| Shares Outstanding | | | 2,336,116 | | |
Net Asset Value and Redemption Price Per Share
(net assets ÷ shares of beneficial interest outstanding) | | $ | 9.06 | | |
Maximum Offering Price Per Share
(100 ÷ 97.75 of $9.06) | | $ | 9.27 | | |
| Class B Shares | |
| Net Assets | | $ | 6,491,100 | | |
| Shares Outstanding | | | 716,671 | | |
Net Asset Value, Offering Price and Redemption Price Per Share
(net assets ÷ shares of beneficial interest outstanding) | | $ | 9.06 | | |
| Class C Shares | |
| Net Assets | | $ | 14,937,011 | | |
| Shares Outstanding | | | 1,649,452 | | |
Net Asset Value, Offering Price and Redemption Price Per Share
(net assets ÷ shares of beneficial interest outstanding) | | $ | 9.06 | | |
Statement of Operations
For the Year Ended
October 31, 2006
| Investment Income | |
| Interest allocated from Portfolios | | $ | 2,355,387 | | |
| Dividends allocated from Portfolios | | | 3,694 | | |
| Security lending income allocated from Government Obligations Portfolio, net | | | 18,934 | | |
| Expenses allocated from Portfolios | | | (318,046 | ) | |
| Net investment income from Portfolios | | $ | 2,059,969 | | |
| Expenses | |
| Investment advisor and administration fees | | $ | 72,322 | | |
| Trustees' fees and expenses | | | 823 | | |
Distribution and service fees
Class A | | | 54,205 | | |
| Class B | | | 77,983 | | |
| Class C | | | 159,242 | | |
| Transfer and dividend disbursing agent fees | | | 46,408 | | |
| Legal and accounting services | | | 45,829 | | |
| Registration fees | | | 44,996 | | |
| Custodian fee | | | 25,039 | | |
| Printing and postage | | | 14,946 | | |
| Miscellaneous | | | 4,092 | | |
| Total expenses | | $ | 545,885 | | |
Deduct —
Reduction of investment adviser and administration fee | | $ | 72,322 | | |
| Total expense reductions | | $ | 72,322 | | |
| Net expenses | | $ | 473,563 | | |
| Net investment income | | $ | 1,586,406 | | |
Realized and Unrealized
Gain (Loss) from Portfolios | |
Net realized gain (loss) —
Investment transactions (identified cost basis) | | $ | (1,216,771 | ) | |
| Financial futures contracts | | | 31,167 | | |
| Swap contracts | | | 927 | | |
| Foreign currency transactions | | | (12,702 | ) | |
| Net realized loss | | $ | (1,197,379 | ) | |
Change in unrealized appreciation (depreciation) —
Investments (identified cost basis) | | $ | 1,182,657 | | |
| Financial futures contracts | | | 1,734 | | |
| Swap contracts | | | 776 | | |
| Foreign currency | | | (6,922 | ) | |
| Net change in unrealized appreciation (depreciation) | | $ | 1,178,245 | | |
| Net realized and unrealized loss | | $ | (19,134 | ) | |
| Net increase in net assets from operations | | $ | 1,567,272 | | |
See notes to financial statements
4
Eaton Vance Low Duration Fund as of October 31, 2006
FINANCIAL STATEMENTS CONT'D
Statements of Changes in Net Assets
Increase (Decrease)
in Net Assets | | Year Ended
October 31, 2006 | | Year Ended
October 31, 2005 | |
From operations —
Net investment income | | $ | 1,586,406 | | | $ | 1,333,225 | | |
Net realized gain (loss)
from investments, financial futures
contracts, swap contracts and
forward foreign currency exchange
contract transactions | | | (1,197,379 | ) | | | 10,081 | | |
Net change in unrealized appreciation
(depreciation) from investments,
financial futures contracts,
swap contracts and forward foreign
currency exchange contract transactions | | | 1,178,245 | | | | (305,835 | ) | |
| Net increase in net assets from operations | | $ | 1,567,272 | | | $ | 1,037,471 | | |
Distributions to shareholders —
From net investment income
Class A | | $ | (1,178,013 | ) | | $ | (1,092,847 | ) | |
| Class B | | | (364,800 | ) | | | (386,878 | ) | |
| Class C | | | (905,762 | ) | | | (1,022,112 | ) | |
| Total distributions to shareholders | | $ | (2,448,575 | ) | | $ | (2,501,837 | ) | |
Transactions in shares of beneficial interest —
Proceeds from sale of shares
Class A | | $ | 7,381,939 | | | $ | 7,037,975 | | |
| Class B | | | 1,429,030 | | | | 2,175,401 | | |
| Class C | | | 1,810,127 | | | | 6,583,382 | | |
Net asset value of shares issued to
shareholders in payment of
distributions declared
Class A | | | 728,317 | | | | 678,931 | | |
| Class B | | | 220,006 | | | | 224,368 | | |
| Class C | | | 565,649 | | | | 648,264 | | |
Cost of shares redeemed
Class A | | | (12,378,340 | ) | | | (22,874,695 | ) | |
| Class B | | | (2,779,941 | ) | | | (4,993,301 | ) | |
| Class C | | | (12,140,360 | ) | | | (16,050,143 | ) | |
Net asset value of shares exchanged
Class A | | | 1,942,840 | | | | 1,477,467 | | |
| Class B | | | (1,942,840 | ) | | | (1,477,467 | ) | |
Net decrease in net assets from
Fund share transactions | | $ | (15,163,573 | ) | | $ | (26,569,818 | ) | |
| Net decrease in net assets | | $ | (16,044,876 | ) | | $ | (28,034,184 | ) | |
| Net Assets | | Year Ended
October 31, 2006 | | Year Ended
October 31, 2005 | |
| At beginning of year | | $ | 58,629,901 | | | $ | 86,664,085 | | |
| At end of year | | $ | 42,585,025 | | | $ | 58,629,901 | | |
Accumulated undistributed
(distributions in excess of)
net investment income
included in net assets | |
| At end of year | | $ | (49,200 | ) | | $ | 97,740 | | |
See notes to financial statements
5
Eaton Vance Low Duration Fund as of October 31, 2006
FINANCIAL STATEMENTS CONT'D
Financial Highlights
| | | Class A | |
| | | Year Ended October 31, | | Period Ended | | Year Ended December 31, | |
| | | 2006(1) | | 2005(1) | | October 31, 2004(1)(2) | | 2003(1) | | 2002(1)(3) | |
| Net asset value — Beginning of year | | $ | 9.220 | | | $ | 9.420 | | | $ | 9.590 | | | $ | 9.990 | | | $ | 10.000 | | |
| Income (loss) from operations | |
| Net investment income | | $ | 0.333 | | | $ | 0.224 | | | $ | 0.142 | | | $ | 0.098 | | | $ | 0.056 | | |
| Net realized and unrealized gain (loss) | | | 0.002 | | | | (0.033 | ) | | | (0.027 | ) | | | (0.120 | ) | | | 0.035 | | |
| Total income (loss) from operations | | $ | 0.335 | | | $ | 0.191 | | | $ | 0.115 | | | $ | (0.022 | ) | | $ | 0.091 | | |
| Less distributions | |
| From net investment income | | $ | (0.495 | ) | | $ | (0.391 | ) | | $ | (0.285 | ) | | $ | (0.378 | ) | | $ | (0.101 | ) | |
| Total distributions | | $ | (0.495 | ) | | $ | (0.391 | ) | | $ | (0.285 | ) | | $ | (0.378 | ) | | $ | (0.101 | ) | |
| Net asset value — End of year | | $ | 9.060 | | | $ | 9.220 | | | $ | 9.420 | | | $ | 9.590 | | | $ | 9.990 | | |
| Total Return(4) | | | 3.74 | % | | | 2.06 | % | | | 1.22 | % | | | (0.23 | )% | | | 0.91 | % | |
| Ratios/Supplemental Data | |
| Net assets, end of year (000's omitted) | | $ | 21,157 | | | $ | 23,876 | | | $ | 38,147 | | | $ | 63,709 | | | $ | 27,033 | | |
| Ratios (As a percentage of average daily net assets): | | | | | | | | | | | | | | | | | | | | | |
| Expenses before custodian fee reduction(5)(6) | | | 1.29 | % | | | 1.24 | % | | | 1.20 | %(7) | | | 1.21 | % | | | 1.16 | %(7) | |
| Expenses after custodian fee reduction(5)(6) | | | 1.29 | % | | | 1.24 | % | | | 1.20 | %(7) | | | 1.21 | % | | | 1.16 | %(7) | |
| Net investment income | | | 3.65 | % | | | 2.41 | % | | | 1.80 | %(7) | | | 1.00 | % | | | 2.18 | %(7) | |
| Portfolio Turnover of the Investment Portfolio | | | 46 | % | | | 67 | % | | | 92 | % | | | 43 | % | | | 0 | % | |
| Portfolio Turnover of the Floating Rate Portfolio | | | 50 | % | | | 57 | % | | | 67 | % | | | — | | | | — | | |
| Portfolio Turnover of the Government Obligations Portfolio | | | 2 | % | | | 30 | % | | | 5 | % | | | 67 | % | | | 41 | % | |
(1) Net investment income per share was computed using average shares outstanding.
(2) For the ten-month period ended October 31, 2004.
(3) For the period from the start of business, September 30, 2002, to December 31, 2002.
(4) Returns are historical and are calculated by determining the percentage change in net asset value with all distributions reinvested. Total return is not computed on an annualized basis. Total returns would have been lower had certain expenses not been reduced during the periods shown.
(5) Includes the Fund's share of the Portfolios' allocated expenses.
(6) The investment adviser waived a portion of its investment adviser and administration fees and subsidized certain operating expenses (equal to 0.15%, 0.15%, 0.11%, 0.02% and 1.04% of daily net assets for the years ended October 31, 2006 and 2005, the period ended October 31, 2004 and the years ended December 31, 2003 and 2002, respectively.)
(7) Annualized.
See notes to financial statements
6
Eaton Vance Low Duration Fund as of October 31, 2006
FINANCIAL STATEMENTS CONT'D
Financial Highlights
| | | Class B | |
| | | Year Ended October 31, | | Period Ended | | Year Ended December 31, | |
| | | 2006(1) | | 2005(1) | | October 31, 2004(1)(2) | | 2003(1) | | 2002(1)(3) | |
| Net asset value — Beginning of year | | $ | 9.210 | | | $ | 9.420 | | | $ | 9.590 | | | $ | 9.990 | | | $ | 10.000 | | |
| Income (loss) from operations | |
| Net investment income | | $ | 0.266 | | | $ | 0.153 | | | $ | 0.083 | | | $ | 0.024 | | | $ | 0.039 | | |
| Net realized and unrealized gain (loss) | | | 0.010 | | | | (0.043 | ) | | | (0.028 | ) | | | (0.121 | ) | | | 0.033 | | |
| Total income (loss) from operations | | $ | 0.276 | | | $ | 0.110 | | | $ | 0.055 | | | $ | (0.097 | ) | | $ | 0.072 | | |
| Less distributions | |
| From net investment income | | $ | (0.426 | ) | | $ | (0.320 | ) | | $ | (0.225 | ) | | $ | (0.303 | ) | | $ | (0.082 | ) | |
| Total distributions | | $ | (0.426 | ) | | $ | (0.320 | ) | | $ | (0.225 | ) | | $ | (0.303 | ) | | $ | (0.082 | ) | |
| Net asset value — End of year | | $ | 9.060 | | | $ | 9.210 | | | $ | 9.420 | | | $ | 9.590 | | | $ | 9.990 | | |
| Total Return(4) | | | 3.07 | % | | | 1.18 | % | | | 0.58 | % | | | (0.98 | )% | | | 0.72 | % | |
| Ratios/Supplemental Data | |
| Net assets, end of year (000's omitted) | | $ | 6,491 | | | $ | 9,704 | | | $ | 14,022 | | | $ | 17,547 | | | $ | 10,725 | | |
| Ratios (As a percentage of average daily net assets): | | | | | | | | | | | | | | | | | | | | | |
| Expenses before custodian fee reduction(5)(6) | | | 2.04 | % | | | 1.99 | % | | | 1.95 | %(7) | | | 1.96 | % | | | 1.91 | %(7) | |
| Expenses after custodian fee reduction(5)(6) | | | 2.04 | % | | | 1.99 | % | | | 1.95 | %(7) | | | 1.96 | % | | | 1.91 | %(7) | |
| Net investment income | | | 2.91 | % | | | 1.64 | % | | | 1.05 | %(7) | | | 0.25 | % | | | 1.49 | %(7) | |
| Portfolio Turnover of the Investment Portfolio | | | 46 | % | | | 67 | % | | | 92 | % | | | 43 | % | | | 0 | % | |
| Portfolio Turnover of the Floating Rate Portfolio | | | 50 | % | | | 57 | % | | | 67 | % | | | — | | | | — | | |
| Portfolio Turnover of the Government Obligations Portfolio | | | 2 | % | | | 30 | % | | | 5 | % | | | 67 | % | | | 41 | % | |
(1) Net investment income per share was computed using average shares outstanding.
(2) For the ten-month period ended October 31, 2004.
(3) For the period from the start of business, September 30, 2002, to December 31, 2002.
(4) Returns are historical and are calculated by determining the percentage change in net asset value with all distributions reinvested. Total return is not computed on an annualized basis. Total returns would have been lower had certain expenses not been reduced during the periods shown.
(5) Includes the Fund's share of the Portfolios' allocated expenses.
(6) The investment adviser waived a portion of its investment adviser and administration fees and subsidized certain operating expenses (equal to 0.15%, 0.15%, 0.11%, 0.02% and 1.04% of daily net assets for the years ended October 31, 2006 and 2005, the period ended October 31, 2004 and the years ended December 31, 2003 and 2002, respectively.)
(7) Annualized.
See notes to financial statements
7
Eaton Vance Low Duration Fund as of October 31, 2006
FINANCIAL STATEMENTS CONT'D
Financial Highlights
| | | Class C | |
| | | Year Ended October 31, | | Period Ended | | Year Ended December 31, | |
| | | 2006(1) | | 2005(1) | | October 31, 2004(1)(2) | | 2003(1) | | 2002(1)(3) | |
| Net asset value — Beginning of year | | $ | 9.220 | | | $ | 9.420 | | | $ | 9.590 | | | $ | 9.980 | | | $ | 10.000 | | |
| Income (loss) from operations | |
| Net investment income | | $ | 0.277 | | | $ | 0.167 | | | $ | 0.095 | | | $ | 0.040 | | | $ | 0.041 | | |
| Net realized and unrealized gain (loss) | | | 0.003 | | | | (0.033 | ) | | | (0.028 | ) | | | (0.112 | ) | | | 0.025 | | |
| Total income (loss) from operations | | $ | 0.280 | | | $ | 0.134 | | | $ | 0.067 | | | $ | (0.072 | ) | | $ | 0.066 | | |
| Less distributions | |
| From net investment income | | $ | (0.440 | ) | | $ | (0.334 | ) | | $ | (0.237 | ) | | $ | (0.318 | ) | | $ | (0.086 | ) | |
| Total distributions | | $ | (0.440 | ) | | $ | (0.334 | ) | | $ | (0.237 | ) | | $ | (0.318 | ) | | $ | (0.086 | ) | |
| Net asset value — End of year | | $ | 9.060 | | | $ | 9.220 | | | $ | 9.420 | | | $ | 9.590 | | | $ | 9.980 | | |
| Total Return(4) | | | 3.12 | % | | | 1.45 | % | | | 0.71 | % | | | (0.74 | )% | | | 0.66 | % | |
| Ratios/Supplemental Data | |
| Net assets, end of year (000's omitted) | | $ | 14,937 | | | $ | 25,050 | | | $ | 34,495 | | | $ | 55,078 | | | $ | 18,387 | | |
| Ratios (As a percentage of average daily net assets): | | | | | | | | | | | | | | | | | | | | | |
| Expenses before custodian fee reduction(5)(6) | | | 1.89 | % | | | 1.84 | % | | | 1.80 | %(7) | | | 1.81 | % | | | 1.76 | %(7) | |
| Expenses after custodian fee reduction(5)(6) | | | 1.89 | % | | | 1.84 | % | | | 1.80 | %(7) | | | 1.81 | % | | | 1.76 | %(7) | |
| Net investment income | | | 3.04 | % | | | 1.79 | % | | | 1.20 | %(7) | | | 0.41 | % | | | 1.56 | %(7) | |
| Portfolio Turnover of the Investment Portfolio | | | 46 | % | | | 67 | % | | | 92 | % | | | 43 | % | | | 0 | % | |
| Portfolio Turnover of the Floating Rate Portfolio | | | 50 | % | | | 57 | % | | | 67 | % | | | — | | | | — | | |
| Portfolio Turnover of the Government Obligations Portfolio | | | 2 | % | | | 30 | % | | | 5 | % | | | 67 | % | | | 41 | % | |
(1) Net investment income per share was computed using average shares outstanding.
(2) For the ten-month period ended October 31, 2004.
(3) For the period from the start of business, September 30, 2002, to December 31, 2002.
(4) Returns are historical and are calculated by determining the percentage change in net asset value with all distributions reinvested. Total return is not computed on an annualized basis. Total returns would have been lower had certain expenses not been reduced during the periods shown.
(5) Includes the Fund's share of the Portfolios' allocated expenses.
(6) The investment adviser waived a portion of its investment adviser and administration fees and subsidized certain operating expenses (equal to 0.15%, 0.15%, 0.11%, 0.02% and 1.04% of daily net assets for the years ended October 31, 2006 and 2005, the period ended October 31, 2004 and the years ended December 31, 2003 and 2002, respectively.)
(7) Annualized.
See notes to financial statements
8
Eaton Vance Low Duration Fund as of October 31, 2006
NOTES TO FINANCIAL STATEMENTS
1 Significant Accounting Policies
Eaton Vance Low Duration Fund (the Fund) is a diversified series of Eaton Vance Mutual Funds Trust (the Trust). The Trust is an entity of the type commonly known as a Massachusetts business trust and is registered under the Investment Company Act of 1940, as amended, as an open-end management investment company. The Fund offers three classes of shares. Class A shares are generally sold subject to a sales charge imposed at time of purchase. Class B and Class C shares are sold at net asset value and are generally subject to a contingent deferred sales charge (see Note 6). After the longer of four years or the time when the CDSC applicable to Class B shares expires, Class B shares will automatically convert to Class A shares. Each class represents a pro rata interest in the Fund, but votes separately on class-specific matters and (as noted below) is subject to different expenses. Realized and unrealized gains and losses are allocat ed daily to each class of shares based on the relative net assets of each class to the total net assets of the Fund. Net investment income, other than class specific expenses, is allocated daily to each class of shares based on the ratio of the value of each class' paid shares to the total value of all paid shares. Each class of shares differs in its distribution plan and certain other class-specific expenses. The Fund is structured as a fund of funds and as of October 31, 2006, invested all of its investable assets in interests in two Portfolios: Investment Portfolio and Floating Rate Portfolio (the Portfolios), which are New York Trusts. Since July 25, 2006, the Fund has not been invested in the Government Obligations Portfolio. Each Portfolio has an investment objective and investment policies that are similar to or complementary to those of the Fund. The value of the Fund's investment in the Portfolios reflects the Fund's proportionate interest in the net assets of the Investment Portfolio and Floating R ate Portfolio, (99.7% and 0.1%, respectively, at October 31, 2006). The performance of the Fund is directly affected by the performance of the Portfolios. The financial statements of the Investment Portfolio, including the portfolio of investments, are included elsewhere in this report and should be read in conjunction with the Fund's financial statements. A copy of the Government Obligations Portfolio's and Floating Rate Portfolio's financial statements are available on the EDGAR Database on the Securities and Exchange Commission's website (www.sec.gov), at the Commission's public reference room in Washington, DC or upon request from the Fund's principal underwriter, Eaton Vance Distributors Inc. (EVD) by calling 1-800-225-6265.
The following is a summary of significant accounting policies consistently followed by the Fund in the preparation of its financial statements. The policies are in conformity with accounting principles generally accepted in the United States of America.
A Investment Valuation — Valuation of securities held by the Investment Portfolio is discussed in note 1A of the Portfolio's notes to the financial statements which are included elsewhere in this report. The valuation policies of the Government Obligations Portfolio are as follows: Debt securities (including collateralized mortgage obligations and certain mortgage backed securities ("MBS")) normally are valued by independent pricing services. The pricing services consider various factors relating to bonds or loans and/or market transactions to determine market value. Most 30-year fixed rate MBS are valued by the investment adviser's matrix pricing system. The matrix pricing system also considers vario us factors relating to bonds and market transactions to determine market value. Options are valued at last sale price on a U.S. exchange or board of trade or, in the absence of a sale, at the mean between the last bid and asked price. Financial futures contracts listed on commodity exchanges are valued at closing settlement prices. Securities for which there is no such quotation or valuation are valued at fair value using methods determined in good faith by or at the direction of the Trustees. Short-term obligations and money market securities having remaining maturities of 60 days or less are valued at amortized cost, which approximates value. If short-term debt securities are acquired with a remaining maturity of more than 60 days, they will be valued by a pricing service.
Floating Rate Portfolio's valuation policies are as follows: Certain Senior Loans are deemed to be liquid because reliable market quotations are readily available for them. Liquid Senior Loans are valued on the basis of prices furnished by a pricing service. Other Senior Loans are valued at fair value by the Portfolio's investment adviser, Boston Management and Research (BMR), under procedures approved by the Trustees. In connection with determining the fair value of a Senior Loan, the investment adviser makes an assessment of the likelihood that the borrower will make a full repayment of the Senior Loan. The primary factors considered by the investment adviser when making this assessment are (i) the creditworthiness of the borrower, (ii) the value of the collateral backing the Senior Loan, and (iii) the priority of the Senior Loan versus other creditors of the borrower. If, based on its assessment, the investment adviser believ es there is a reasonable likelihood that the borrower will make a full repayment of the Senior Loan, the investment adviser will determine the fair value of the Senior Loan using a matrix pricing approach that considers the yield on the Senior Loan relative to yields on other loan interests issued by companies of comparable credit quality. If, based on its assessment, the investment adviser believes there is not a reasonable likelihood that the borrower will make a full repayment of the Senior Loan, the investment adviser will determine the fair value of the Senior Loan using analyses that include, but are not limited to (i) a comparison of the value of the borrower's outstanding equity and debt to that
9
Eaton Vance Low Duration Fund as of October 31, 2006
NOTES TO FINANCIAL STATEMENTS CONT'D
of comparable public companies; (ii) a discounted cash flow analysis; or (iii) when the investment adviser believes it is likely that a borrower will be liquidated or sold, an analysis of the terms of such liquidation or sale. In certain cases, the investment adviser will use a combination of analytical methods to determine fair value, such as when only a portion of a borrower's assets are likely to be sold. In conducting its assessment and analyses for purposes of determining fair value of a Senior Loan, the investment adviser will use its discretion and judgment in considering and appraising such factors, data and information and the relative weight to be given thereto as it deems relevant, including without limitation, some or all of the following: (i) the fundamental characteristics of and fundamental analytical data relating to the Senior Loan, including the cost, size, current interest rate, maturity and base lending rate of the Senior Loan, the terms and conditions of the Senior Loan and any related agreements, and the position of the Senior Loan in the borrower's debt structure; (ii) the nature, adequacy and value of the collateral securing the Senior Loan, including the Portfolio's rights, remedies and interests with respect to the collateral; (iii) the creditworthiness of the borrower, based on an evaluation of, among other things, its financial condition, financial statements and information about the borrower's business, cash flows, capital structure and future prospects; (iv) information relating to the market for the Senior Loan, including price quotations for and trading in the Senior Loan and interests in similar Senior Loans and the market environment and investor attitudes towards the Senior Loan and interests in similar Senior Loans; (v) the experience, reputation, stability and financial condition of the agent and any intermediate participants in the Senior Loan; and (vi) general economic and market conditions a ffecting the fair value of the Senior Loan.
Other portfolio securities (other than short-term obligations, but including listed issues) may be valued on the basis of prices furnished by one or more pricing services which determine prices for normal, institutional-size trading units of such securities which may use market information, transactions for comparable securities and various relationships between securities which are generally recognized by institutional traders. The value of interest rate swaps will be based on dealer quotations. Short-term obligations which mature in sixty days or less are valued at amortized cost, which approximates value. If short-term debt securities are acquired with a remaining maturity of more than 60 days, they will be valued by a pricing service. Over-the-counter options are valued at the mean between the bid and the asked price provided by dealers. Marketable securities listed on the NASDAQ National Market System are valued at the NASD AQ official closing price. Financial futures contracts listed on the commodity exchanges and options thereon are valued at closing settlement prices. Repurchase agreements are valued at cost plus accrued
interest. Other portfolio securities for which there are no quotations or valuations and investments for which the price of the security is not believed to represent its fair market value, are valued at fair value using methods determined in good faith by or at the direction of the Trustees of the Fund. Occasionally, events affecting the value of foreign securities may occur between the time trading is completed abroad and the close of the Exchange which will not be reflected in the computation of the Fund's net asset value (unless the Fund deems that such event would materially affect its net asset value in which case an adjustment would be made and reflected in such computation). The Fund may rely on an independent fair valuation service in making any such adjustment as to the value of a foreign equity security.
B Income — The Fund's net investment income or loss consists of the Fund's pro rata share of the net investment income or loss of the Portfolios, less all actual and accrued expenses of the Fund.
C Federal Taxes — The Fund's policy is to comply with the provisions of the Internal Revenue Code applicable to regulated investment companies and to distribute to shareholders, each year, substantially all of its net investment income and all or substantially all of its net realized capital gains. Accordingly, no provision for federal income or excise tax is necessary. At October 31, 2006, the Fund, for federal income tax purposes, had a capital loss carryforwards of $9,613,410 which will reduce the Fund's taxable income arising from future net realized gain on investment transactions, if any, to the extent permitted by the Internal Revenue Code and thus will reduce the amount of distributions to sha reholders which would otherwise be necessary to relieve the Fund of any liability for federal income or excise tax. Such capital loss carryforwards will expire on October 31, 2010 ($5,478), October 31, 2011 ($4,082,489), October 31, 2012 ($3,697,770), October 31, 2013 ($1,016,104) and October 31, 2014 ($811,569), respectively.
D Use of Estimates — The preparation of the financial statements in conformity with accounting principles generally accepted in the United States of America requires management to make estimates and assumptions that affect the reported amounts of assets and liabilities at the date of the financial statements and the reported amounts of income and expense during the reporting period. Actual results could differ from those estimates.
E Expenses — The majority of expenses of the Trust are directly identifiable to an individual fund. Expenses which are not readily identifiable to a specific fund are allocated taking into consideration, among other things, the nature and type of expense and the relative size of the funds.
10
Eaton Vance Low Duration Fund as of October 31, 2006
NOTES TO FINANCIAL STATEMENTS CONT'D
F Indemnifications — Under the Trust's organizational documents, its officers and Trustees may be indemnified against certain liabilities and expenses arising out of the performance of their duties to the Fund, and shareholders are indemnified against personal liability for the obligations of the Trust. Additionally, in the normal course of business, the Fund enters into agreements with service providers that may contain indemnification clauses. The Fund's maximum exposure under these arrangements is unknown as this would involve future claims that may be made against the Fund that have not yet occurred.
G Expense Reduction — Investors Bank & Trust Company (IBT) serves as custodian to the Fund. Pursuant to the custodian agreement, IBT receives a fee reduced by credits which are determined based on the average daily cash balance the Fund maintains with IBT. All credit balances used to reduce the Fund's custodian fees are reported as a reduction of expenses in the Statement of Operations.
H Other — Investment transactions are accounted for on the date the securities are purchased or sold. Dividends to shareholders are recorded on the ex-dividend date.
2 Distributions to Shareholders
The Fund declares dividends daily to shareholders of record at the time of declaration. Distributions are ordinarily paid monthly. Distributions of allocated realized capital gains, if any (reduced by any available capital loss carryforwards from prior years), are made at least annually. Shareholders may reinvest income and capital gain distributions in additional shares of the Fund at the net asset value as of the ex-dividend date. Distributions are paid in the form of additional shares of the Fund or, at the election of the shareholder, in cash. The Fund distinguishes between distributions on a tax basis and a financial reporting basis. Accounting principles generally accepted in the United States of America require that only distributions in excess of tax basis earnings and profits be reported in the financial statements as a return of capital. Permanent differences between book and tax accounting relating to distributions ar e reclassified to paid-in capital.
The tax character of the distributions declared for the years ended October 31, 2006 and October 31, 2005 was as follows:
| | | Year Ended October 31, | |
| | | 2006 | | 2005 | |
| Distributions declared from: | |
|
| Ordinary Income | | $ | 2,448,575 | | | $ | 2,501,837 | | |
|
During the year ended October 31, 2006, accumulated paid-in capital was decreased by $1,066,526, accumulated distributions in excess of net investment income was decreased by $715,229, and accumulated net realized loss was decreased by $351,297 primarily due to differences between book and tax accounting treatment of foreign currency gains and losses, swaps contracts, paydown gains and losses and amortization/accretion. This change had no effect on the net assets or the net asset value per share.
As of October 31, 2006, the components of distributable earnings (accumulated losses) on a tax basis were as follows:
| Undistributed ordinary income | | $ | 19,140 | | |
| Capital loss carryforward | | | (9,613,410 | ) | |
The differences between components of distributable earnings (accumulated losses) on a tax basis and the amounts reflected in the statement of assets and liabilities are primarily due to differences in book and tax policies for financial future contracts and the timing of recognizing distributions.
3 Shares of Beneficial Interest
The Fund's Declaration of Trust permits the Trustees to issue an unlimited number of full and fractional shares of beneficial interest (without par value). Such shares may be issued in a number of different series (such as the Fund) and classes. Transactions in Fund shares were as follows:
| | | Year Ended October 31, | |
| Class A | | 2006 | | 2005 | |
| Sales | | | 811,742 | | | | 754,454 | | |
Issued to shareholders electing to receive
payments of distribution in Fund shares | | | 79,915 | | | | 72,890 | | |
| Redemptions | | | (1,359,274 | ) | | | (2,444,476 | ) | |
| Exchange from Class B shares | | | 212,880 | | | | 158,437 | | |
| Net decrease | | | (254,737 | ) | | | (1,458,695 | ) | |
| | | Year Ended October 31, | |
| Class B | | 2006 | | 2005 | |
| Sales | | | 156,749 | | | | 233,464 | | |
Issued to shareholders electing to receive
payments of distribution in Fund shares | | | 24,141 | | | | 24,088 | | |
| Redemptions | | | (304,470 | ) | | | (534,993 | ) | |
| Exchange to Class A shares | | | (212,880 | ) | | | (158,333 | ) | |
| Net decrease | | | (336,460 | ) | | | (435,774 | ) | |
11
Eaton Vance Low Duration Fund as of October 31, 2006
NOTES TO FINANCIAL STATEMENTS CONT'D
| | | Year Ended October 31, | |
| Class C | | 2006 | | 2005 | |
| Sales | | | 198,848 | | | | 705,716 | | |
Issued to shareholders electing to receive
payments of distribution in Fund shares | | | 62,045 | | | | 69,577 | | |
| Redemptions | | | (1,329,515 | ) | | | (1,718,945 | ) | |
| Net decrease | | | (1,068,622 | ) | | | (943,652 | ) | |
4 Transactions with Affiliates
Eaton Vance Management (EVM) serves as the investment adviser and administrator of the Fund, providing the Fund with investment advisory services (relating to the investment of the Fund's assets in the Portfolios), and administering the business affairs of the Fund. Under the investment advisory and administrative agreement, EVM earns a fee in the amount of 0.15% per annum of average daily net assets of the Fund. Effective March 15, 2004, Eaton Vance agreed to waive its 0.15% fee in its entirety, such agreement being memorialized in a Fee Waiver Agreement between EVM and the Fund. This fee waiver cannot be eliminated or decreased without the express consent of the Fund's Board of Trustees and shareholders and is intended to continue indefinitely. For the year ended October 31, 2006, the advisory and administration fee amounted to $72,322. Pursuant to the waiver, EVM waived $72,322 of the Fund's investment advisory and administra tive fee for the year ended October 31, 2006. The Portfolios have engaged Boston Management and Research (BMR), a subsidiary of EVM, to render investment advisory services and the Fund is allocated its share of the investment advisory fee paid by each Portfolio in which it invests. EVM serves as the sub-transfer agent of the Fund and receives from the transfer agent an aggregate fee based upon the actual expenses incurred by EVM in the performance of those services. For the year ended October 31, 2006, EVM earned $2,761 in sub-transfer agent fees. Certain officers and Trustees of the Fund and Portfolios are officers of the above organizations. Except as to Trustees of the Fund and the Portfolios who are not members of EVM's or BMR's organization, officers and Trustees receive remuneration for their services to the Fund out of the investment adviser fee earned by BMR. The Fund was informed that Eaton Vance Distributors, Inc. (EVD), a subsidiary of EVM, received $3,216 as its portion of the sales charge on sal es of Class A shares for the year ended October 31, 2006.
5 Distribution Plans
Class A has in effect a distribution plan pursuant to Rule 12b-1 under the Investment Company Act of 1940 (Class A Plan). The Class A Plan provides that the Fund will pay EVD a distribution and service fee of 0.25% of the Fund's average daily net assets attributable to Class A shares for each fiscal year for distribution services and facilities provided to the Fund by EVD, as well as for personal services and/or the maintenance of shareholder accounts. Distribution and service fees paid or accrued for the year ended October 31, 2006 amounted to $54,205 for Class A shares. The Fund also has in effect distribution plans for Class B shares (Class B Plan) and Class C shares (Class C Plan) pursuant to Rule 12b-1. The Class B Plan requires the Fund to pay EVD amounts equal to 1/365 of 0.75% of the Fund's average daily net assets attributable to Class B shares for providing ongoing distribution services and facilities to the Fund. The Class C Plan requires the Fund to pay EVD amounts equal to 1/365 of 0.60% of the Fund's average daily net assets attributable to Class C shares for providing ongoing distribution services and facilities to the Fund. The Fund will automatically discontinue payments to EVD during any period in which there are no outstanding Uncovered Distribution Charges, which are equivalent to the sum of (i) 6.25% of the aggregate amount received by the Fund for the Class B and Class C shares sold, respectively, plus (ii) interest calculated by applying the rate of 1% over the prevailing prime rate to the outstanding balance of Uncovered Distribution Charges of EVD of each respective class, reduced by the aggregate amount of contingent deferred sales charges (see Note 6) and daily amounts theretofore paid to EVD by each respective class. The Fund paid or accrued $58,487 and $112,406 for Class B and Class C shares, respectively, to or payable to EVD for t he year ended October 31, 2006, representing 0.75% and 0.60% of the average daily net assets for Class B and Class C shares, respectively. At October 31, 2006, the amount of Uncovered Distribution Charges of EVD calculated under the Plans was approximately $757,000 and $4,584,000 for Class B and Class C shares, respectively. The Class B and Class C Plans also authorize the Fund to make payments of service fees to EVD, investment dealers and other persons in amounts not exceeding 0.25% annually of the average daily net assets attributable to that Class. Service fees are paid for personal services and/or the maintenance of shareholder accounts. They are separate and distinct from the Class B and Class C sales commissions and distribution fees and, as such, are not subject to automatic discontinuance when there are no outstanding Uncovered Distribution Charges to EVD. Service fees paid or accrued for the year ended October 31, 2006 amounted to $19,496, and $46,836, for Class B and Class C shares, respectively.
6 Contingent Deferred Sales Charge
Effective September 15, 2006, all purchases of Class A shares of $1 million or more will be subject to a 1% contingent deferred sales charge (CDSC) in the event of redemption within 18 months of purchase. Prior to September 15, 2006, Class A shares purchased at net asset value in amounts of $1 million or more other than shares purchased in a single transaction of $5 million or more were subject to a 1% CDSC if redeemed within 12 months of purchase. A CDSC generally is imposed on redemptions of Class B shares made within four years of purchase and on redemptions of Class C shares made within one year of purchase. Generally, the CDSC is based upon the lower of the net asset value at date of redemption or date of purchase. No charge is levied on shares acquired by reinvestment of dividends or capital gain distributions. The Class B CDSC is imposed at declining rates that begin at 3%
12
Eaton Vance Low Duration Fund as of October 31, 2006
NOTES TO FINANCIAL STATEMENTS CONT'D
in the case of redemptions in the first year after purchase, declining to 2.5% in the second year, 2.0% in the third year, 1.0% in the fourth year and 0.0% thereafter. Class C shares will be subject to a 1% CDSC if redeemed within 12 months of purchase.
No CDSC is levied on shares which have been sold to EVM or its affiliates or to their respective employees or clients and may be waived under certain other limited conditions. CDSC charges are paid to EVD to reduce the amount of Uncovered Distribution Charges calculated under the Fund's Distribution Plans (see Note 5). CDSC charges received when no Uncovered Distribution Charges exist will be retained by the Fund. The Fund was informed that EVD received approximately $5,000, $21,000, and $1,000 of CDSC paid by shareholders for redemptions of Class A, Class B shares, and Class C shares, respectively, for the year ended October 31, 2006.
7 Investment Transactions
Increases and decreases in the Fund's investment in the Investment Portfolio for the year ended October 31, 2006 aggregated $23,127,039, and $31,997,057, respectively. Increases and decreases in the Fund's investment in the Floating Rate Portfolio for the year ended October 31, 2006 aggregated $584,298 and $2,412,091 respectively. Increases and decreases in the Fund's investment in the Government Obligations Portfolio for the year ended October 31, 2006 aggregated $595,589, and $8,168,544, respectively.
8 Investment in Portfolios
For the year ended October 31, 2006, the Fund was allocated net investment income and realized and unrealized gain (loss) from the Portfolios as follows:
| | | Investment
Portfolio | | Government
Obligations
Portfolio | | Floating
Rate
Portfolio | | Total | |
| Interest income | | $ | 1,874,563 | | | $ | 166,628 | | | $ | 314,196 | | | $ | 2,355,387 | | |
| Dividend income | | | 3,690 | | | | — | | | | 4 | | | | 3,694 | | |
| Security lending income | | | — | | | | 18,934 | | | | — | | | | 18,934 | | |
| Expenses | | | (263,536 | ) | | | (29,832 | ) | | | (24,678 | ) | | | (318,046 | ) | |
| Net investment income | | $ | 1,614,717 | | | $ | 155,730 | | | $ | 289,522 | | | $ | 2,059,969 | | |
| Net realized gain (loss) | |
| Investment transactions | | $ | (132,279 | ) | | $ | (1,081,674 | ) | | $ | (2,818 | ) | | $ | (1,216,771 | ) | |
| Financial futures contracts | | | (52 | ) | | | 31,219 | | | | — | | | | 31,167 | | |
| Swap contracts | | | — | | | | — | | | | 927 | | | | 927 | | |
| Forward foreign currency | | | — | | | | — | | | | (12,702 | ) | | | (12,702 | ) | |
| Net realized gain (loss) | | $ | (132,331 | ) | | $ | (1,050,455 | ) | | $ | (14,593 | ) | | $ | (1,197,379 | ) | |
Change in unrealized
appreciation (depreciation) | |
| Investments | | $ | 149,773 | | | $ | 1,026,055 | | | $ | 6,829 | | | $ | 1,182,657 | | |
| Financial futures contracts | | | 27,268 | | | | (25,534 | ) | | | — | | | | 1,734 | | |
| Swap contracts | | | — | | | | — | | | | 776 | | | | 776 | | |
| Forward foreign currency | | | — | | | | — | | | | (6,922 | ) | | | (6,922 | ) | |
Net change in unrealized
appreciation (depreciation) | | $ | 177,041 | | | $ | 1,000,521 | | | $ | 683 | | | $ | 1,178,245 | | |
9 Recently Issued Accounting Pronouncements
In June 2006, the Financial Accounting Standards Board ("FASB") issued FASB Interpretation No. 48, ("FIN 48") "Accounting for Uncertainty in Income Taxes – an interpretation of FASB Statement No. 109". FIN 48 clarifies the accounting for uncertainty in income taxes recognized in accordance with FASB Statement No. 109, "Accounting for Income Taxes." This interpretation prescribes a recognition threshold and measurement attribute for the financial statement recognition and measurement of a tax position taken or expected to be taken in a tax return. It also provides guidance on de-recognition, classification, interest and penalties, accounting in interim periods, disclosure and transition. FIN 48 is effective for fiscal years beginning after December 15, 2006. Management is currently evaluating the impact of applying the various provisions of FIN 48.
In September 2006, the Financial Accounting Standards Board ("FASB") issued Statement of Financial Accounting Standards No. 157, ("FAS 157") "Fair Value Measurements". FAS 157 defines fair value, establishes a framework for measuring fair value in accordance with generally accepted accounting principles and expands disclosure about fair value measurements. FAS 157 is effective for fiscal years beginning after November 15, 2007. Management is currently evaluating the impact the adoption of FAS 157 will have on the Fund's financial statement disclosures.
13
Eaton Vance Low Duration Fund as of October 31, 2006
REPORT OF INDEPENDENT REGISTERED PUBLIC ACCOUNTING FIRM
To the Trustees and Shareholders
of Eaton Vance Low Duration Fund:
In our opinion, the accompanying statement of assets and liabilities, and the related statements of operations and of changes in net assets and the financial highlights present fairly, in all material respects, the financial position of Eaton Vance Low Duration Fund ("the Fund"), a series of Eaton Vance Mutual Funds Trust at October 31, 2006, and the results of its operations, the changes in its net assets and the financial highlights for each of the periods indicated, in conformity with accounting principles generally accepted in the United States of America. These financial statements and financial highlights (hereafter referred to as "financial statements") are the responsibility of the Fund's management; our responsibility is to express an opinion on these financial statements based on our audits. We conducted our audits of these financial statements in accordance with the standards of the Public Company Accounting Oversight Board (United States). Those standards require that we plan and perform the audit to obtain reasonable assurance about whether the financial statements are free of material misstatement. An audit includes examining, on a test basis, evidence supporting the amounts and disclosures in the financial statements, assessing the accounting principles used and significant estimates made by management, and evaluating the overall financial statement presentation. We believe that our audits provide a reasonable basis for our opinion.
PricewaterhouseCoopers LLP
Boston, Massachusetts
December 27, 2006
14
Eaton Vance Low Duration Fund as of October 31, 2006
FEDERAL TAX INFORMATION (Unaudited)
The Form 1099-DIV you receive in January 2007 will show the tax status of all distributions paid to your account in calendar 2006. Shareholders are advised to consult their own tax adviser with respect to the tax consequences of their investment in the Fund.
15
Investment Portfolio as of October 31, 2006
PORTFOLIO OF INVESTMENTS
| Mortgage Pass-Throughs — 89.3% | |
| Security | | Principal
Amount
(000's omitted) | | Value | |
| FHLMC: | |
| 5.134%, with various maturities to 2037(1) | | $ | 1,548 | | | $ | 1,542,595 | | |
| 5.345%, with maturity at 2022(1) | | | 1,072 | | | | 1,073,853 | | |
| 6.50%, with maturity at 2019 | | | 813 | | | | 839,789 | | |
| 8.00%, with various maturities to 2025 | | | 1,828 | | | | 1,928,454 | | |
| 9.25%, with maturity at 2017 | | | 208 | | | | 214,285 | | |
| | | $ | 5,598,976 | | |
| FNMA: | |
| 4.906%, with maturity at 2018(1) | | $ | 241 | | | $ | 240,037 | | |
| 5.00%, with various maturities to 2018(1) | | | 1,999 | | | | 1,980,733 | | |
| 5.34%, with various maturities to 2035(1) | | | 2,817 | | | | 2,814,637 | | |
| 5.358%, with maturity at 2036(1) | | | 1,337 | | | | 1,336,925 | | |
| 5.381%, with maturity at 2036(1) | | | 1,570 | | | | 1,569,543 | | |
| 5.427%, with maturity at 2027(1) | | | 2,124 | | | | 2,123,323 | | |
| 6.323%, with maturity at 2032(1) | | | 1,430 | | | | 1,456,110 | | |
| 8.00%, with maturity at 2023 | | | 450 | | | | 485,926 | | |
| 9.00%, with maturity at 2011 | | | 866 | | | | 890,028 | | |
| 9.50%, with various maturities to 2022 | | | 2,746 | | | | 2,969,567 | | |
| 9.587%, with maturity at 2018(1) | | | 1,281 | | | | 1,431,082 | | |
| | | $ | 17,297,911 | | |
| GNMA: | |
| 5.125%, with various maturities to 2027(1) | | $ | 2,387 | | | $ | 2,433,043 | | |
| 8.25%, with maturity at 2020 | | | 676 | | | | 733,953 | | |
| 9.00%, with maturity at 2017 | | | 930 | | | | 1,025,877 | | |
| | | $ | 4,192,873 | | |
| Collateralized Mortgage Obligations: | |
| FHLMC, Series 1395, Class F, 4.927%, due 2022(2) | | $ | 243 | | | $ | 236,217 | | |
| FHLMC, Series 1543, Class VN, 7.00%, due 2023 | | | 2,150 | | | | 2,255,654 | | |
| FHLMC, Series 1694, Class PQ, 6.50%, due 2023 | | | 309 | | | | 309,713 | | |
| FNMA, Series 1993-140, Class J, 6.65%, due 2013 | | | 1,936 | | | | 1,947,690 | | |
| FNMA, Series 1993-250, Class Z, 7.00%, due 2023 | | | 1,061 | | | | 1,093,122 | | |
| FNMA, Series 2001-4, Class GA, 10.262%, due 2025(2) | | | 705 | | | | 785,084 | | |
| FNMA, Series G93-17, Class FA, 6.344%, due 2023 | | | 489 | | | | 500,143 | | |
| FNMA, Series G97-4, Class FA, 6.144%, due 2027(2) | | | 448 | | | | 455,886 | | |
| | | $ | 7,583,509 | | |
Total Mortgage Pass-Throughs
(identified cost $34,886,075) | | | | | | $ | 34,673,269 | | |
| Short-Term Investments — 15.0% | |
| Security | | Principal
Amount
(000's omitted) | | Value | |
Investors Bank and Trust Company Time Deposit,(3)
5.31%, 11/1/06 | | $ | 5,840 | | | $ | 5,840,000 | | |
Total Short-Term Investments
(at amortized cost, $5,840,000) | | | | $ | 5,840,000 | | |
Total Investments — 104.3%
(identified cost $40,726,075) | | | | $ | 40,513,269 | | |
| Other Assets, Less Liabilities — (4.3)% | | | | $ | (1,678,009 | ) | |
| Net Assets — 100.0% | | | | $ | 38,835,260 | | |
FHLMC - Federal Home Loan Mortgage Corporation (Freddie Mac)
FNMA - Federal National Mortgage Association (Fannie Mae)
GNMA - Government National Mortgage Association (Ginnie Mae)
(1) Adjustable rate mortgage.
(2) Floating-rate security
(3) Security (or a portion thereof) has been segregated to cover requirements on open financial futures contracts.
See notes to financial statements
16
Investment Portfolio as of October 31, 2006
FINANCIAL STATEMENTS
Statement of Assets and Liabilities
As of October 31, 2006
| Assets | |
| Investments, at value (identified cost, $40,726,075) | | $ | 40,513,269 | | |
| Cash | | | 4,093 | | |
| Receivable for investments sold | | | 29,740 | | |
| Interest receivable | | | 195,717 | | |
| Receivable for daily variation margin on open financial futures contracts | | | 16,406 | | |
| Total assets | | $ | 40,759,225 | | |
| Liabilities | |
| Payable for investments purchased | | $ | 1,889,574 | | |
| Payable to affiliate for investment advisory fees | | | 16,320 | | |
| Payable to affiliate for Trustees' fees | | | 141 | | |
| Accrued expenses | | | 17,930 | | |
| Total liabilities | | $ | 1,923,965 | | |
| Net Assets applicable to investors' interest in Portfolio | | $ | 38,835,260 | | |
| Sources of Net Assets | |
| Net proceeds from capital contributions and withdrawals | | $ | 39,020,722 | | |
| Net unrealized depreciation (computed on the basis of identified cost) | | | (185,462 | ) | |
| Total | | $ | 38,835,260 | | |
Statement of Operations
For the Year Ended
October 31, 2006
| Investment Income | |
| Interest | | $ | 1,879,583 | | |
| Dividends | | | 3,699 | | |
| Total investment income | | $ | 1,883,282 | | |
| Expenses | |
| Investment adviser fee | | $ | 200,763 | | |
| Trustees' fees and expenses | | | 1,711 | | |
| Custodian fee | | | 37,658 | | |
| Accounting services | | | 21,265 | | |
| Miscellaneous | | | 2,978 | | |
| Total expenses | | $ | 264,375 | | |
Deduct —
Reduction of custodian fee | | $ | 197 | | |
| Total expense reductions | | $ | 197 | | |
| Net expenses | | $ | 264,178 | | |
| Net investment income | | $ | 1,619,104 | | |
| Realized and Unrealized Gain (Loss) | |
Net realized loss —
Investment transactions (identified cost basis) | | $ | (132,540 | ) | |
| Financial futures contracts | | | (53 | ) | |
| Net realized loss | | $ | (132,593 | ) | |
Change in unrealized appreciation (depreciation) —
Investments (identified cost basis) | | $ | 150,053 | | |
| Financial futures contracts | | | 27,344 | | |
| Net change in unrealized appreciation (depreciation) | | $ | 177,397 | | |
| Net realized and unrealized gain | | $ | 44,804 | | |
| Net increase in net assets from operations | | $ | 1,663,908 | | |
See notes to financial statements
17
Investment Portfolio as of October 31, 2006
FINANCIAL STATEMENTS CONT'D
Statements of Changes in Net Assets
Increase (Decrease)
in Net Assets | | Year Ended
October 31, 2006 | | Year Ended
October 31, 2005 | |
From operations —
Net investment income | | $ | 1,619,104 | | | $ | 1,241,354 | | |
Net realized loss from investment
transactions and financial futures contracts | | | (132,593 | ) | | | — | | |
Net change in unrealized
appreciation (depreciation)
from investments and financial
futures contracts | | | 177,397 | | | | (179,862 | ) | |
| Net increase in net assets from operations | | $ | 1,663,908 | | | $ | 1,061,492 | | |
Capital transactions —
Contributions | | $ | 23,127,039 | | | $ | 37,719,129 | | |
| Withdrawals | | | (31,997,057 | ) | | | (51,083,812 | ) | |
Net decrease in net assets from
capital transactions | | $ | (8,870,018 | ) | | $ | (13,364,683 | ) | |
| Net decrease in net assets | | $ | (7,206,110 | ) | | $ | (12,303,191 | ) | |
| Net Assets | |
| At beginning of year | | $ | 46,041,370 | | | $ | 58,344,561 | | |
| At end of year | | $ | 38,835,260 | | | $ | 46,041,370 | | |
See notes to financial statements
18
Investment Portfolio as of October 31, 2006
FINANCIAL STATEMENTS CONT'D
Supplementary Data
| | | Year Ended October 31, | | Period Ended | | Year Ended December 31, | |
| | | 2006 | | 2005 | | October 31, 2004(1) | | 2003 | | 2002(2) | |
| Ratios/Supplemental Data | |
| Ratios (As a percentage of average daily net assets): | |
| Expenses before custodian fee reduction | | | 0.66 | % | | | 0.65 | % | | | 0.62 | %(4) | | | 0.59 | % | | | 0.50 | %(3)(4) | |
| Expenses after custodian fee reduction | | | 0.66 | % | | | 0.64 | % | | | 0.62 | %(4) | | | 0.59 | % | | | 0.50 | %(3)(4) | |
| Net investment income | | | 4.03 | % | | | 2.65 | % | | | 1.51 | %(4) | | | 0.92 | % | | | 0.84 | % | |
| Portfolio Turnover | | | 46 | % | | | 67 | % | | | 92 | % | | | 43 | % | | | 0 | % | |
| Total Return | | | 4.29 | % | | | 2.32 | % | | | 1.12 | % | | | 0.74 | % | | | 0.23 | % | |
| Net assets, end of year (000's omitted) | | $ | 38,835 | | | $ | 46,041 | | | $ | 58,345 | | | $ | 72,157 | | | $ | 25,058 | | |
(1) For the ten-month period ended October 31, 2004.
(2) For the period from the start of business, September 30, 2002, to December 31, 2002.
(3) The investment adviser waived a portion of its investment advisory fee (equal to 0.57% of average daily net assets for the year ended December 31, 2002).
(4) Annualized.
See notes to financial statements
19
Investment Portfolio as of October 31, 2006
NOTES TO FINANCIAL STATEMENTS
1 Significant Accounting Policies
Investment Portfolio (the Portfolio) is registered under the Investment Company Act of 1940, as amended, as a diversified open-end management investment company. The Portfolio was organized as a trust under the laws of the State of New York on June 18, 2002. The Portfolio seeks total return by investing in a broad range of fixed income securities, including MBS issued, backed or otherwise guaranteed by the U.S. Government or its agencies or instrumentalities, U.S. Government obligations, corporate bonds, preferred stocks, asset-backed securities and/or money market instruments. The Declaration of Trust permits the Trustees to issue interests in the Portfolio. At October 31, 2006, Eaton Vance Low Duration Fund held an approximate 99.7% interest in the Portfolio. The following is a summary of significant accounting policies of the Portfolio. The policies are in conformity with accounting principles generally accepted in the United States of America.
A Investment Valuation — Debt securities (including collateralized mortgage obligations and certain mortgage backed securities ("MBS")) normally are valued by an independent pricing service. The pricing service considers various factors relating to bonds or loans and/or market transactions to determine market value. Most seasoned MBS are valued by the investment adviser's matrix pricing system. The matrix pricing system also considers various factors relating to bonds and market transactions to determine market value. Short-term obligations and money market securities maturing in 60 days or less are valued at amortized cost which approximates value. If short-term debt securities are acquired with a re maining maturity of more than 60 days, they will be valued by a pricing service. Investments for which valuations or market quotations are unavailable are valued at fair value using methods determined in good faith by or at the direction of the Trustees.
B Income — Interest income is determined on the basis of interest accrued adjusted for amortization of premium or accretion of discount. Dividend income is recorded on the ex-dividend date for dividend, received in cash and/or securities.
C Federal Taxes — The Portfolio has elected to be treated as a partnership for federal tax purposes. No provision is made by the Portfolio for federal or state taxes on any taxable income of the Portfolio because each investor in the Portfolio is ultimately responsible for the payment of any taxes on its share of taxable income. Since at least one of the Portfolio's investors is a regulated investment company that invests all or substantially all of its assets in the Portfolio, the Portfolio normally must satisfy the applicable source of income and diversification requirements (under the Internal Revenue Code) in order for its inv estors to satisfy them. The Portfolio will allocate, at least annually among its investors, each investor's distributive share of the Portfolio's net investment income, net realized capital gains, and any other items of income, gain, loss, deduction or credit.
D Use of Estimates — The preparation of the financial statements in conformity with accounting principles generally accepted in the United States of America requires management to make estimates and assumptions that affect the reported amounts of assets and liabilities at the date of the financial statements and the reported amounts of income and expense during the reporting period. Actual results could differ from those estimates.
E Indemnifications — Under the Portfolio's organizational documents, its officers and Trustees may be indemnified against certain liabilities and expenses arising out of the performance of their duties to the Portfolio. Interestholders in the Portfolio are jointly and severally liable for the liabilities and obligations of the Portfolio in the event that the Portfolio fails to satisfy such liabilities and obligations; provided, however, that, to the extent assets are available in the Portfolio, the Portfolio may, under certain circumstances, indemnify interestholders from and against any claim or liability to which such holder may become subject by reason of being or having been an interestholder in t he Portfolio. Additionally, in the normal course of business, the Portfolio enters into agreements with service providers that may contain indemnification clauses. The Portfolio's maximum exposure under these arrangements is unknown as this would involve future claims that may be made against the Portfolio that have not yet occurred.
F ��Expense Reduction — Investors Bank & Trust Company (IBT) serves as custodian to the Portfolio. Pursuant to the custodian agreement, IBT receives a fee reduced by credits which are determined based on the average daily cash balance the Portfolio maintains with IBT. All credit balances used to reduce the Portfolio's custodian fees are reported as a reduction of expenses in the Statement of Operations.
G Other — Investment transactions are accounted for on the date the securities are purchased or sold. Realized
20
Investment Portfolio as of October 31, 2006
NOTES TO FINANCIAL STATEMENTS CONT'D
gains and losses on securities sold are determined on the basis of identified cost.
2 Investment Adviser Fee and Other Transactions with Affiliates
The investment adviser fee is earned by Boston Management and Research (BMR), a wholly-owned subsidiary of Eaton Vance Management (EVM), as compensation for management and investment advisory services rendered to the Portfolio. The fee is computed at the monthly rate of 0.0417% (0.50% per annum) of the Portfolio's average daily net assets. For the year ended October 31, 2006, the fee was equivalent to 0.50% of the Portfolio's average net assets for such period and amounted to $200,763. Except as to Trustees of the Portfolio who are not members of EVM's or BMR's organization, officers and Trustees receive remuneration for their services to the Portfolio out of such investment adviser fee. Trustees of the Portfolio that are not affiliated with the Investment Adviser may elect to defer receipt of all or a percentage of their annual fees in accordance with the terms of the Trustees Deferred Compensation Plan. For the year ended Octo ber 31, 2006, no significant amounts have been deferred.
Certain officers and Trustees of the Portfolio are officers of the above organizations.
3 Investment Transactions
Purchases and sales of investments, other than short-term obligations and including paydowns on mortgage backed securities in Investment Portfolio, aggregated $17,043,795 and $24,421,967, respectively.
4 Federal Income Tax Basis of Unrealized Appreciation (Depreciation)
The cost and unrealized appreciation (depreciation) in value of the investments owned at October 31, 2006, as determined on a federal income tax basis, were as follows:
| Aggregate cost | | $ | 40,958,627 | | |
| Gross unrealized appreciation | | $ | 320,757 | | |
| Gross unrealized depreciation | | | (766,115 | ) | |
| Net unrealized depreciation | | $ | (445,358 | ) | |
5 Line of Credit
The Portfolio participates with other portfolios and funds managed by BMR and EVM and its affiliates in a $150 million unsecured line of credit agreement with a group of banks. Borrowings will be made by the Portfolio solely to facilitate the handling of unusual and/or unanticipated short term cash requirements. Interest is charged to each participating portfolio or fund based on its borrowings at an amount above either the Eurodollar rate or Federal Funds rate. In addition, a fee computed at an annual rate of 0.10% on the daily unused portion of the line of credit is allocated among the participating portfolios and funds at the end of each quarter. The Portfolio did not have any significant borrowings or allocated fees during the year ended October 31, 2006.
6 Financial Instruments
The Portfolio may trade in financial instruments with off-balance sheet risk in the normal course of its investing activities to assist in managing exposure to various market risks. These financial instruments include written options and financial futures contracts, and may involve, to a varying degree, elements of risk in excess of the amounts recognized for financial statement purposes. The notional or contractual amounts of these instruments represent the investment the Portfolio has in particular classes of financial instruments and does not necessarily represent the amounts potentially subject to risk. The measurement of the risks associated with these instruments is meaningful only when all related and offsetting transactions are considered. A summary of obligations under these financial instruments at October 31, 2006 is as follows:
Futures Contracts
Expiration
Date(s) | | Contracts | | Position | | Aggregate
Cost | | Value | | Net Unrealized
Appreciation | |
| | 12/06 | | | 35 U.S Treasury Note | | Long | | $ | 3,787,656 | | | $ | 3,815,000 | | | $ | 27,344 | | |
At October 31, 2006, the Portfolio had sufficient cash and/or securities to cover margin requirements on any open futures contracts.
7 Recently Issued Accounting Pronouncements
In June 2006, the Financial Accounting Standards Board ("FASB") issued FASB Interpretation No. 48, ("FIN 48") "Accounting for Uncertainty in Income Taxes – an interpretation of FASB Statement No. 109". FIN 48 clarifies the accounting for uncertainty in income taxes recognized in accordance with FASB Statement No. 109, "Accounting for Income Taxes." This interpretation prescribes a
21
Investment Portfolio as of October 31, 2006
NOTES TO FINANCIAL STATEMENTS CONT'D
recognition threshold and measurement attribute for the financial statement recognition and measurement of a tax position taken or expected to be taken in a tax return. It also provides guidance on de-recognition, classification, interest and penalties, accounting in interim periods, disclosure and transition. FIN 48 is effective for fiscal years beginning after December 15, 2006. Management is currently evaluating the impact of applying the various provisions of FIN 48.
In September 2006, the Financial Accounting Standards Board ("FASB") issued Statement of Financial Accounting Standards No. 157, ("FAS 157") "Fair Value Measurements". FAS 157 defines fair value, establishes a framework for measuring fair value in accordance with generally accepted accounting principles and expands disclosure about fair value measurements. FAS 157 is effective for fiscal years beginning after November 15, 2007. Management is currently evaluating the impact the adoption of FAS 157 will have on the Portfolio's financial statement disclosures.
22
Investment Portfolio as of October 31, 2006
REPORT OF INDEPENDENT REGISTERED PUBLIC ACCOUNTING FIRM
To the Trustees and Investors of
Investment Portfolio:
In our opinion, the accompanying statement of assets and liabilities, including the portfolio of investments, and the related statements of operations and of changes in net assets and the supplementary data present fairly, in all material respects, the financial position of Investment Portfolio (the "Portfolio") at October 31, 2006, and the results of its operations, the changes in its net assets and the supplementary data for each of the periods indicated, in conformity with accounting principles generally accepted in the United States of America. These financial statements and supplementary data (hereafter referred to as "financial statements") are the responsibility of the Portfolio's management; our responsibility is to express an opinion on these financial statements based on our audits. We conducted our audits of these financial statements in accordance with the standards of the Public Company Accounting Oversight Board (U nited States). Those standards require that we plan and perform the audit to obtain reasonable assurance about whether the financial statements are free of material misstatement. An audit includes examining, on a test basis, evidence supporting the amounts and disclosures in the financial statements, assessing the accounting principles used and significant estimates made by management, and evaluating the overall financial statement presentation. We believe that our audits, which included confirmation of securities at October 31, 2006 by correspondence with the custodian and brokers, provide a reasonable basis for our opinion.
PricewaterhouseCoopers LLP
Boston, Massachusetts
December 27, 2006
23
Eaton Vance Low Duration Fund
BOARD OF TRUSTEES' ANNUAL APPROVAL OF THE INVESTMENT ADVISORY AGREEMENT
Overview of the Contract Review Process
The Investment Company Act of 1940, as amended (the "1940 Act"), provides, in substance, that each investment advisory agreement between a fund and its investment adviser will continue in effect from year to year only if its continuance is approved at least annually by the fund's board of trustees, including by a vote of a majority of the trustees who are not "interested persons" of the fund ("Independent Trustees") cast in person at a meeting called for the purpose of considering such approval.
At a meeting of the Boards of Trustees (each a "Board") of the Eaton Vance group of mutual funds (the "Eaton Vance Funds") held on March 27, 2006, the Board, including a majority of the Independent Trustees, voted to approve continuation of existing advisory and sub-advisory agreements for the Eaton Vance Funds for an additional one-year period. In voting its approval, the Board relied upon the affirmative recommendation of the Special Committee of the Board, which is a committee comprised exclusively of Independent Trustees. Prior to making its recommendation, the Special Committee reviewed information furnished for a series of meetings of the Special Committee held in February and March 2006. Such information included, among other things, the following:
Information about Fees, Performance and Expenses
• An independent report comparing the advisory and related fees paid by each fund with fees paid by comparable funds;
• An independent report comparing each fund's total expense ratio and its components to comparable funds;
• An independent report comparing the investment performance of each fund to the investment performance of comparable funds over various time periods;
• Data regarding investment performance in comparison to relevant peer groups of funds and appropriate indices;
• Comparative information concerning fees charged by each adviser for managing other mutual funds and institutional accounts using investment strategies and techniques similar to those used in managing the fund;
• Profitability analyses for each adviser with respect to each fund managed by it;
Information about Portfolio Management
• Descriptions of the investment management services provided to each fund, including the investment strategies and processes employed;
• Information concerning the allocation of brokerage and the benefits received by each adviser as a result of brokerage allocation, including information concerning the acquisition of research through "soft dollar" benefits received in connection with the funds' brokerage, and the implementation of a soft dollar reimbursement program established with respect to the funds;
• Data relating to portfolio turnover rates of each fund;
• The procedures and processes used to determine the fair value of fund assets and actions taken to monitor and test the effectiveness of such procedures and processes;
Information about each Adviser
• Reports detailing the financial results and condition of each adviser;
• Descriptions of the qualifications, education and experience of the individual investment professionals whose responsibilities include portfolio management and investment research for the funds, and information relating to their compensation and responsibilities with respect to managing other mutual funds and investment accounts;
• Copies of the Codes of Ethics of each adviser and its affiliates, together with information relating to compliance with and the administration of such codes;
• Information concerning the resources devoted to compliance efforts undertaken by each adviser and its affiliates on behalf of the funds (including descriptions of various compliance programs) and their record of compliance with investment policies and restrictions, including policies with respect to market-timing, late trading and selective portfolio disclosure, and with policies on personal securities transactions;
• Descriptions of the business continuity and disaster recovery plans of each adviser and its affiliates;
Other Relevant Information
• Information concerning the nature, cost and character of the administrative and other non-investment management services provided by Eaton Vance Management and its affiliates;
• Information concerning management of the relationship with the custodian, subcustodians and fund accountants by each adviser or the funds' administrator; and
• The terms of each advisory agreement.
In addition to the information identified above, the Special Committee considered information provided from time to time by each adviser throughout the year at meetings of the Board and its committees. Over the course of the twelve month period ended March 31,
24
Eaton Vance Low Duration Fund
BOARD OF TRUSTEES' ANNUAL APPROVAL OF THE INVESTMENT ADVISORY AGREEMENT CONT'D
2006, the Board met nine times and the Special Committee, the Audit Committee and the Governance Committee, each of which is a Committee comprised solely of Independent Trustees, met eight, twelve and five times, respectively. At such meetings, the Trustees received, among other things, presentations by the portfolio managers and other investment professionals of each adviser relating to the investment performance of each fund and the investment strategies used in pursuing the fund's investment objective.
For funds that invest through one or more underlying portfolios, the Board considered similar information about the portfolio(s) when considering the approval of advisory agreements. In addition, in cases where the fund's investment adviser has engaged a sub-adviser, the Board considered similar information about the sub-adviser when considering the approval of any sub-advisory agreement.
The Special Committee was assisted throughout the contract review process by Goodwin Procter LLP, legal counsel for the Independent Trustees. The members of the Special Committee relied upon the advice of such counsel and their own business judgment in determining the material factors to be considered in evaluating each advisory and sub-advisory agreement and the weight to be given to each such factor. The conclusions reached with respect to each advisory and sub-advisory agreement were based on a comprehensive evaluation of all the information provided and not any single factor. Moreover, each member of the Special Committee may have placed varying emphasis on particular factors in reaching conclusions with respect to each advisory and sub-advisory agreement.
Results of the Process
Based on its consideration of the foregoing, and such other information as it deemed relevant, including the factors and conclusions described below, the Special Committee concluded that the continuance of the investment advisory agreement of the Low Duration Fund (the "Fund") with Eaton Vance Management ("EVM"), as well as the investment advisory agreements of the Floating Rate Portfolio, the Government Obligations Portfolio and the Investment Portfolio (the "Portfolios"), the portfolios in which the Fund invests, each with Boston Management and Research ("BMR"), including their fee structures, is in the interests of shareholders and, therefore, the Special Committee recommended to the Board approval of each agreement. The Board accepted the recommendation of the Special Committee as well as the factors considered and conclusions reached by the Special Committee with respect to each agreement. Accordingly, the Board, including a majority of the Independent Trustees, voted to approve continuation of the investment advisory agreements for the Fund and the Portfolios. EVM and BMR are each referred to as an "Adviser" herein; EVM with respect to the Fund and BMR with respect to the Portfolios. EVM and BMR are affiliates.
Nature, Extent and Quality of Services
In considering whether to approve the investment advisory agreement of the Fund and each Portfolio, the Board evaluated the nature, extent and quality of services provided to each Portfolio by BMR and to the Fund by EVM. BMR manages the Portfolios, while EVM allocates the assets of the Fund among the Portfolios.
The Board considered BMR's management capabilities and investment process with respect to the types of investments held by the Portfolios, including the education, experience and number of its investment professionals and other personnel who provide portfolio management, investment research, and similar services to the Portfolios. In particular, the Board evaluated the abilities and experience of such investment personnel in analyzing special considerations relevant to investing in investment grade securities. With respect to the Floating Rate Portfolio, the Board noted the experience of BMR's 29 bank loan investment professionals and other personnel who provide services to the Portfolios, including four portfolio managers and 15 analysts. With respect to the Government Obligations Portfolio, the Board noted the Adviser's experience in investing in mortgage-backed securities, including seasoned mortgage-backed securities. For al l the Portfolios, the Board also took into account the resources dedicated to portfolio management and other services, including the compensation paid to recruit and retain investment personnel, and the time and attention devoted to the Fund by senior management.
The Board reviewed the compliance programs of the Adviser and relevant affiliates thereof. Among other matters, the Board considered compliance and reporting matters relating to personal trading by investment personnel, selective disclosure of portfolio holdings, late trading, frequent trading, portfolio valuation, business continuity and the allocation of investment opportunities. The Board also evaluated the responses of the Adviser and its affiliates to requests from regulatory authorities such as the Securities and Exchange Commission and the National Association of Securities Dealers.
The Board considered shareholder and other administrative services provided or managed by Eaton Vance Management and its affiliates, including transfer agency and accounting services. The Board evaluated the benefits to shareholders of investing in a fund that is a part of a large family of funds, including the ability, in many cases, to exchange an investment among different funds without incurring additional sales charges.
After consideration of the foregoing factors, among others, the Board concluded that the nature, extent and quality of services provided by the Adviser, taken as a whole, are appropriate and consistent with the terms of the investment advisory agreements.
25
Eaton Vance Low Duration Fund
BOARD OF TRUSTEES' ANNUAL APPROVAL OF THE INVESTMENT ADVISORY AGREEMENT CONT'D
Fund Performance
The Board compared the Fund's investment performance to a relevant universe of similarly managed funds identified by an independent data provider and appropriate benchmark indices for the one- and three-year periods ended September 30, 2005 for the Fund. The Board also considered the performance of the underlying Portfolios. The Board concluded that the Fund's performance was satisfactory.
Management Fees and Expenses
The Board reviewed contractual investment advisory fee rates payable by the Portfolios and the Fund (referred to collectively as "management fees"). As part of its review, the Board considered the management fees and the Fund's total expense ratio for the one-year period ended September 30, 2005, as compared to a group of similarly managed funds selected by an independent data provider. The Board considered that EVM is waiving its investment advisory and administration fee in its entirety.
After reviewing the foregoing information, and in light of the nature, extent and quality of the services provided by the Adviser, the Board concluded that, given the small asset size of the Fund, the management fees charged for advisory and related services and the Fund's total expense ratio are reasonable.
Profitability
The Board reviewed the level of profits realized by the Adviser and relevant affiliates thereof in providing investment advisory and administrative services to the Fund, the Portfolios and all Eaton Vance Funds as a group. The Board considered the level of profits realized without regard to revenue sharing or other payments by the Adviser and its affiliates to third parties in respect of distribution services. The Board also considered other direct or indirect benefits received by the Adviser and its affiliates in connection with its relationship with the Fund and the Portfolios.
The Board concluded that, in light of the foregoing factors and the nature, extent and quality of the services rendered, the profits realized by the Adviser and its affiliates are reasonable.
Economies of Scale
In reviewing management fees and profitability, the Board also considered the extent to which the Adviser and its affiliates, on the one hand, and the Fund, on the other hand, can expect to realize benefits from economies of scale as the assets of the Fund and the Portfolios increase. The Board acknowledged the difficulty in accurately measuring the benefits resulting from the economies of scale with respect to the management of any specific fund or group of funds. The Board reviewed data summarizing the increases and decreases in the assets of the Fund and of all Eaton Vance Funds as a group over various time periods, and evaluated the extent to which the total expense ratio of the Fund and the profitability of the Adviser and its affiliates may have been affected by such increases or decreases. The Board noted that, at its request, the Adviser had agreed to add a breakpoint for the Floating Rate Portfolio with respect to asset s that exceed $10 billion. Based upon the foregoing, the Board concluded that the benefits from economies of scale are currently being shared equitably by the Adviser and its affiliates and the Fund. The Board also concluded that, assuming reasonably foreseeable increases in the assets of the Portfolios, the structure of the advisory fees, which include breakpoints at several asset levels, can be expected to cause the Adviser and its affiliates and the Fund to continue to share such benefits equitably.
26
Eaton Vance Low Duration Fund
MANAGEMENT AND ORGANIZATION
Fund Management. The Trustees of Eaton Vance Mutual Funds Trust (the Trust), Floating Rate Portfolio (FRP), Government Obligations Portfolio (GOP), and Investment Portfolio (IP), are responsible for the overall management and supervision of the Trust's and Portfolios' affairs. The Trustees and officers of the Trust and the Portfolios are listed below. Except as indicated, each individual has held the office shown or other offices in the same company for the last five years. Trustees and officers of the Trust and the Portfolios hold indefinite terms of office. The "noninterested Trustees" consist of those Trustees who are not "interested persons" of the Trust and the Portfolios, as that term is defined under the 1940 Act. The business address of each Trustee and officer is The Eaton Vance Building, 255 State Street, Boston, Massachusetts 02109. As used below, "EVC" refers to Eaton Vance Corp., "EV" refers to Eaton Vance, Inc., "EVM" refers to Eaton Vance Management, "BMR" refers to Boston Management and Research, "Parametric" refers to Parametric Portfolio Associates, and "EVD" refers to Eaton Vance Distributors, Inc. EVC and EV are the corporate parent and trustee, respectively, of EVM and BMR. EVD is the Fund's principal underwriter, the Portfolios' placement agent and a wholly-owned subsidiary of EVM. Each officer affiliated with Eaton Vance may hold a position with other Eaton Vance affiliates that is comparable to his or her position with EVM listed below.
Name and
Date of Birth | | Position(s)
with the
Trust and
the Portfolios | | Term of
Office and
Length of
Service | | Principal Occupation(s)
During Past Five Years | | Number of Portfolios
in Fund Complex
Overseen By
Trustee(1) | | Other Directorships Held | |
| Interested Trustee | | | | | | | | | | | | | |
|
James B. Hawkes
11/9/41 | | Trustee | | Trustee of the Trust since 1991; of GOP since 1992; of FRP since 2000 and of IP since 2002 | | Chairman and Chief Executive Officer of EVC, BMR, EVM and EV; Director of EV; Vice President and Director of EVD. Trustee and/or officer of 170 registered investment companies in the Eaton Vance Fund Complex. Mr. Hawkes is an interested person because of his positions with BMR, EVM, EVC and EV, which are affiliates of the Fund and the Portfolios. | | | 170 | | | Director of EVC | |
|
| Noninterested Trustee(s) | | | | | | | | | | | | | |
|
Benjamin C. Esty
1/2/63 | | Trustee | | Since 2005 | | Roy and Elizabeth Simmons Professor of Business Administration, Harvard University Graduate School of Business Administration (since 2003). Formerly, Associate Professor, Harvard University Graduate School of Business Administration (2000-2003). | | | 170 | | | None | |
|
Samuel L. Hayes, III
2/23/35 | | Trustee and Chairman of
the Board | | Trustee of the Trust since 1986; of GOP since 1993; of FRP since 2000; of IP since 2002 and Chairman of the Board since 2005 | | Jacob H. Schiff Professor of Investment Banking Emeritus, Harvard University Graduate School of Business Administration. Director of Yakima Products, Inc. (manufacturer of automotive accessories) (since 2001) and Director of Telect, Inc. (telecommunications services company). | | | 170 | | | Director of Tiffany & Co. (specialty retailer) | |
|
William H. Park
9/19/47 | | Trustee | | Since 2003 | | Vice Chairman, Commercial Industrial Finance Corp. (specialty finance company) (since 2006). Formerly, President and Chief Executive Officer, Prizm Capital Management, LLC (investment management firm) (2002-2005). Formerly, Executive Vice President and Chief Financial Officer, United Asset Management Corporation (a holding company owning institutional investment management firms) (1982-2001). | | | 170 | | | None | |
|
Ronald A. Pearlman
7/10/40 | | Trustee | | Since 2003 | | Professor of Law, Georgetown University Law Center. | | | 170 | | | None | |
|
27
Eaton Vance Low Duration Fund
MANAGEMENT AND ORGANIZATION CONT'D
Name and
Date of Birth | | Position(s)
with the
Trust and
the Portfolios | | Term of
Office and
Length of
Service | | Principal Occupation(s)
During Past Five Years | | Number of Portfolios
in Fund Complex
Overseen By
Trustee(1) | | Other Directorships Held | |
| Noninterested Trustee(s) (continued) | | | | | | | | | | | | | |
|
Norton H. Reamer
9/21/35 | | Trustee | | Trustee of the Trust since 1986; of GOP since 1993; of FRP since 2000 and of IP since 2002 | | President, Chief Executive Officer and a Director of Asset Management Finance Corp. (a specialty finance company serving the investment management industry) (since October 2003). President, Unicorn Corporation (an investment and financial advisory services company) (since September 2000). Formerly, Chairman and Chief Operating Officer, Hellman, Jordan Management Co., Inc. (an investment management company) (2000-2003). Formerly, Advisory Director of Berkshire Capital Corporation (investment banking firm) (2002-2003). | | | 170 | | | None | |
|
Lynn A. Stout
9/14/57 | | Trustee | | Trustee of the Trust since 1986; of GOP since 1993; of FRP since 2000 and of IP since 2002 | | Trustee of the Trust, and GOP since 1998; of FRP since 2000 and of IP since 2002 Professor of Law, University of California at Los Angeles School of Law. | | | 170 | | | None | |
|
Ralph F. Verni
1/26/43 | | Trustee | | Since 2005 | | Consultant and private investor. | | | 170 | | | None | |
|
| Principal Officers who are not Trustees | | | | | | | | | | | | | |
|
Name and
Date of Birth | | Position(s)
with the
Trust and
the Portfolios | | Term of
Office and
Length of
Service | | Principal Occupation(s)
During Past Five Years | |
Thomas E. Faust Jr.
5/31/58 | | President of the Trust | | Since 2002 | | President of EVC, EVM, BMR, and EV and Director of EVC. Chief Investment Officer of EVC, EVM and BMR. Officer of 71 registered investment companies and 5 private investment companies managed by EVM or BMR. | |
|
William H. Ahern, Jr.
7/28/59 | | Vice President of the Trust | | Since 1995 | | Vice President of EVM and BMR. Officer of 71 registered investment companies managed by EVM or BMR. | |
|
Cynthia J. Clemson
3/2/63 | | Vice President of the Trust | | Since 2005 | | Vice President of EVM and BMR. Officer of 86 registered investment companies managed by EVM or BMR. | |
|
Kevin S. Dyer
2/21/75 | | Vice President of the Trust | | Since 2005 | | Assistant Vice President of EVM and BMR. Officer of 25 registered investment companies managed by EMV or BMR. | |
|
Armer Khan
6/7/60 | | Vice President of the Trust | | Since 2005 | | Vice President of EVM and BMR. Officer of 29 registered investment companies managed by EVM or BMR. | |
|
Thomas H. Luster
4/8/62 | | Vice President of the Trust | | Since 2006 | | Vice President of EVM and BMR. Officer of 45 registered investment companies managed by EVM or BMR. | |
|
Christine Johnston
11/9/72 | | Vice President of GOP and IP | | Vice President of IP since 2003 and of GOP since 2006 | | Vice President of EVM and BMR. Officer of 3 registered investment companies managed by EVM or BMR. | |
|
Michael R. Mach
7/15/47 | | Vice President of the Trust | | Since 1999 | | Vice President of EVM and BMR. Officer of 51 registered investment companies managed by EVM or BMR. | |
|
Robert B. MacIntosh
1/22/57 | | Vice President of the Trust | | Since 1998 | | Vice President of EVM and BMR. Officer of 86 registered investment companies managed by EVM or BMR. | |
|
Cliff Quisenberry, Jr.
1/1/65 | | Vice President of the Trust | | Since 2006 | | Vice President and Director of Research and Product Development of Parametric. Officer of 30 registered investment companies managed by EMV or BMR. | |
|
28
Eaton Vance Low Duration Fund
MANAGEMENT AND ORGANIZATION CONT'D
Name and
Date of Birth | | Position(s)
with the
Trust and
the Portfolios | | Term of
Office and
Length of
Service | | Principal Occupation(s)
During Past Five Years | |
| Principal Officers who are not Trustees (continued) | |
|
Scott H. Page
11/30/59 | | Vice President of FRP | | Since 2000 | | Vice President of EVM and BMR. Officer of 15 registered investment companies managed by EMV or BMR. | |
|
Duncan W. Richardson
10/26/57 | | Vice President the Trust | | Since 2001 | | Executive Vice President and Chief Equity Investment Officer of EVC, EVM and BMR. Officer of 71 registered investment companies managed by EVM or BMR. | |
|
Walter A. Row, III
7/20/57 | | Vice President of the Trust | | Since 2001 | | Director of Equity Research and a Vice President of EVM and BMR. Officer of 33 registered investment companies managed by EVM or BMR. | |
|
Judith A. Saryan
8/21/54 | | Vice President of the Trust | | Since 2003 | | Vice President of EVM and BMR. Officer of 50 registered investment companies managed by EVM or BMR. | |
|
Susan Schiff
3/13/61 | | Vice President of the Trust, GOP and IP | | Vice President of the Trust and IP since 2002; of GOP since 1993 | | Vice President of EVM and BMR. Officer of 30 registered investment companies managed by EVM or BMR. | |
|
Payson F. Swoffield
8/13/56 | | President of FRP | | Since 2002(2) | | Vice President of EVM and BMR. Officer of 15 registered investment companies managed by EVM or BMR. | |
|
Mark S. Venezia
5/23/49 | | President of GOP and IP | | Since 2002(2) | | Vice President of EVM and BMR. Officer of 5 registered investment companies managed by EVM or BMR. | |
|
Barbara E. Campbell
6/19/57 | | Treasurer of the Trust | | Treasurer of the Trust since 2005(2) | | Vice President of EVM and BMR. Officer of 170 registered investment companies managed by EVM or BMR. | |
|
Alan R. Dynner
10/10/40 | | Secretary | | Secretary of the Trust, and GOP since 1997; of FRP since 2000 and of IP since 2002 | | Vice President, Secretary and Chief Legal Officer of BMR, EVM, EVD, EV and EVC. Officer of 170 registered investment companies managed by EVM or BMR. | |
|
Dan A. Maalouly
3/25/62 | | Treasurer of
the Portfolios | | Since 2005 | | Vice President of EVM and BMR. Previously Senior Manager at PricewaterhouseCoopers LLP (1997-2005). Officer of 71 registered investment companies managed by EVM and BMR. | |
|
Paul M. O'Neil
7/11/53 | | Chief
Compliance Officer | | Since 2004 | | Vice President of EVM and BMR. Officer of 170 registered investment companies managed by EVM or BMR. | |
|
(1) Includes both master and feeder funds in a master-feeder structure.
(2) Prior to 2002, Mr. Venezia served as Vice President of GOP since 1993 and Mr. Swaffield served as Vice President of FRP since 2000. Prior to 2005, Ms. Campbell served as Assistant Treasurer of the Trust since 1995.
The SAI for the Fund includes additional information about the Trustees and officers of the Fund and the Portfolios and can be obtained without charge on Eaton Vance's website at www.eatonvance.com or by calling 1-800-225-6265.
29
This Page Intentionally Left Blank
This Page Intentionally Left Blank
This Page Intentionally Left Blank
Investment Adviser of Investment Portfolio
Boston Management and Research
The Eaton Vance Building
255 State Street
Boston, MA 02109
Investment Adviser and Administrator of Eaton Vance Low Duration Fund
Eaton Vance Management
The Eaton Vance Building
255 State Street
Boston, MA 02109
Principal Underwriter
Eaton Vance Distributors, Inc.
The Eaton Vance Building
255 State Street
Boston, MA 02109
(617) 482-8260
Custodian
Investors Bank & Trust Company
200 Clarendon Street
Boston, MA 02116
Transfer Agent
PFPC Inc.
Attn: Eaton Vance Funds
P.O. Box 9653
Providence, RI 02940-9653
(800) 262-1122
Independent Registered Public Accounting Firm
PricewaterhouseCoopers LLP
125 High Street
Boston, MA 02110
Eaton Vance Low Duration Fund
The Eaton Vance Building
255 State Street
Boston, MA 02109
This report must be preceded or accompanied by a current prospectus. Before investing, investors should consider carefully the Fund's investment objective, risks, and charges and expenses. The Fund's current prospectus contains this and other information about the Fund and is available
through your financial advisor. Please read the prospectus carefully before you invest or send money. For further information please call 1-800-225-6265.
1560-12/06 LDSRC

Annual Report October 31, 2006


EATON VANCE
STRATEGIC
INCOME
FUND
IMPORTANT NOTICES REGARDING PRIVACY,
DELIVERY OF SHAREHOLDER DOCUMENTS,
PORTFOLIO HOLDINGS AND PROXY VOTING
Privacy. The Eaton Vance organization is committed to ensuring your financial privacy. Each of the financial institutions identified below has in effect the following policy ("Privacy Policy") with respect to nonpublic personal information about its customers:
• Only such information received from you, through application forms or otherwise, and information about your Eaton Vance fund transactions will be collected. This may include information such as name, address, social security number, tax status, account balances and transactions.
• None of such information about you (or former customers) will be disclosed to anyone, except as permitted by law (which includes disclosure to employees necessary to service your account). In the normal course of servicing a customer's account, Eaton Vance may share information with unaffiliated third parties that perform various required services such as transfer agents, custodians and broker/dealers.
• Policies and procedures (including physical, electronic and procedural safeguards) are in place that are designed to protect the confidentiality of such information.
• We reserve the right to change our Privacy Policy at any time upon proper notification to you. Customers may want to review our Policy periodically for changes by accessing the link on our homepage: www.eatonvance.com.
Our pledge of privacy applies to the following entities within the Eaton Vance organization: the Eaton Vance Family of Funds, Eaton Vance Management, Eaton Vance Investment Counsel, Boston Management and Research, and Eaton Vance Distributors, Inc.
In addition, our Privacy Policy only applies to those Eaton Vance customers who are individuals and who have a direct relationship with us. If a customer's account (i.e. fund shares) is held in the name of a third-party financial adviser/ broker-dealer, it is likely that only such adviser's privacy policies apply to the customer. This notice supersedes all previously issued privacy disclosures.
For more information about Eaton Vance's Privacy Policy, please call 1-800-262-1122.
Delivery of Shareholder Documents. The Securities and Exchange Commission (the "SEC") permits funds to deliver only one copy of shareholder documents, including prospectuses, proxy statements and shareholder reports, to fund investors with multiple accounts at the same residential or post office box address. This practice is often called "householding" and it helps eliminate duplicate mailings to shareholders.
Eaton Vance, or your financial adviser, may household the mailing of your documents indefinitely unless you instruct Eaton Vance, or your financial adviser, otherwise.
If you would prefer that your Eaton Vance documents not be householded, please contact Eaton Vance at 1-800-262-1122, or contact your financial adviser.
Your instructions that householding not apply to delivery of your Eaton Vance documents will be effective within 30 days of receipt by Eaton Vance or your financial adviser.
Portfolio Holdings. Each Eaton Vance Fund and its underlying Portfolio (if applicable) will file a schedule of its portfolio holdings on Form N-Q with the SEC for the first and third quarters of each fiscal year. The Form N-Q will be available on the Eaton Vance website www.eatonvance.com, by calling Eaton Vance at 1-800-262-1122 or in the EDGAR database on the SEC's website at www.sec.gov. Form N-Q may also be reviewed and copied at the SEC's public reference room in Washington, D.C. (call 1-800-732-0330 for information on the operation of the public reference room).
Proxy Voting. From time to time, funds are required to vote proxies related to the securities held by the funds. The Eaton Vance Funds or their underlying Portfolios (if applicable) vote proxies according to a set of policies and procedures approved by the Funds' and Portfolios' Boards. You may obtain a description of these policies and procedures and information on how the Funds or Portfolios voted proxies relating to portfolio securities during the most recent 12 month period ended June 30, without charge, upon request, by calling 1-800-262-1122. This description is also available on the SEC's website at www.sec.gov.
Eaton Vance Strategic Income Fund as of October 31, 2006
MANAGEMENT’S DISCUSSION OF FUND PERFORMANCE

Mark S. Venezia, CFA
Portfolio Manager
Performance for the Past Year
· The Fund’s Class A shares had a total return of 7.30% during the year ended October 31, 2006.(1) This return resulted from a decrease in net asset value (NAV) per share to $7.89 on October 31, 2006, from $7.90 on October 31, 2005, and the reinvestment of $0.569 in distribution payments during the year.
· The Fund’s Class B shares had a total return of 6.50% during the year ended October 31, 2006.(1) This return resulted from a decrease in NAV to $7.47 on October 31, 2006, from $7.48 on October 31, 2005, and the reinvestment of $0.483 in distribution payments during the year.
· The Fund’s Class C shares had a total return of 6.50% during the year ended October 31, 2006.(1) This return resulted from a decrease in NAV to $7.47 on October 31, 2006, from $7.48 on October 31, 2005, and the reinvestment of $0.483 in distribution payments during the year. The Class C beginning NAV and certain dividends have been restated to reflect the effects of a stock split effective on November 11, 2005.
· In comparison, the Lehman Brothers Aggregate Bond Index, an unmanaged, broad-based index of investment-grade, fixed-income securities traded in the U.S., had a return of 5.19% for the year ended October 31, 2006,(2) and the Fund’s peer group, the Lipper Multi-Sector Income Funds Classification, had an average return of 6.66%.(2)
Recent Fund Developments
· The Fund seeks to provide a high level of income and total return by investing in a global portfolio consisting primarily of high-grade debt securities. The Fund also invests in non-investment-grade debt securities, senior floating-rate loans of various credit ratings, including those below-investment-grade quality, and derivative instruments in different countries and currencies. At October 31, 2006, the Fund was invested in these positions through its holdings in Strategic Income Portfolio, High Income Portfolio and Floating Rate Portfolio.
· While its starting and ending NAVs suggested little change during the fiscal year, the Fund did encounter some volatility in May and June, when the markets reacted to conflicting statements from the Federal Reserve (the Fed) that confused investors about the direction of interest rates. However, with its conservative portfolio, the Fund again had lower volatility than the average for its Lipper peer group.(2)
· Tighter spreads provided a more challenging environment for emerging markets investing. Strategic Income Portfolio (“SIP”) was overweighted in Asia. Some of the larger foreign exchange positions were held in Indonesia, Malaysia, India, the Philippines and Korea. SIP partially balanced these Asian positions with a short position in the Japanese yen. In Euro-related exposures, SIP eliminated Slovakia in favor of a larger currency exposure in Romania and a T-bill position in Egypt. Management found Romania attractive because of its economic reforms, compelling yield spreads over the Euro and its anticipated membership in the European Union. Egyptian T-bills were attractive due to the inflow of petro-dollars into its local financial markets. SIP cross-hedged most of its European positions by shorting the Euro, which protected the Fund from the Euro’s decline against the dollar during the fiscal year.
· Mortgage-backed securities (MBS) yield spreads narrowed during the fiscal year, as prepayment rates fell and pension funds and central banks reached for yield. The Fund pared its MBS holdings (held through its investment in SIP), reducing its exposure to fixed-rate MBS, while increasing its holdings in adjustable-rate MBS.(3) With high-yield spreads near all-time lows, management also reduced the Fund’s investments in below-investment grade-bonds).
· The Fund increased its investment in Floating Rate Portfolio, which invests primarily in senior floating-rate loans. Floating-rate loans benefited from a rise in interest rates during much of the the fiscal year, with loan rates rising in lockstep with the Fed’s rate hikes.(3)
· The Fund’s duration rose somewhat during the year, from 1.5 years at October 31, 2005, to 1.9 years at October 31, 2006. Management favored a slightly higher duration, given its conviction that the Fed’s rate hikes would hurt the housing market and, over time, slow the economy. Duration is a measure of the sensitivity of a fund or a fixed-income security to changes in interest rates.
Fund shares are not insured by the FDIC and are not deposits or other obligations of, or guaranteed by, any depository institution. Shares are subject to investment risks, including possible loss of principal invested.
The views expressed throughout this report are those of the portfolio manager and are current only through the end of the period of the report as stated on the cover. These views are subject to change at any time based upon market or other conditions, and the investment adviser disclaims any responsibility to update such views. These views may not be relied on as investment advice and, because investment decisions for a fund are based on many factors, may not be relied on as an indication of trading intent on behalf of any Eaton Vance fund.
(1) These returns do not include the 4.75% maximum sales charge for the Fund’s Class A shares or the applicable contingent deferred sales charges (CDSC) for Class B shares and Class C shares. If sales charges were reflected, performance would have been lower.
(2) It is not possible to invest directly in an Index or Lipper Classification. The Index’s total return does not reflect the expenses that would have been incurred if an investor individually purchased or sold the securities represented in the Index. The Lipper average is the average total return, at net asset value, of the funds that are in the same Lipper Classification as the Fund.
(3) Fund allocations are subject to change due to active management.
Past performance is no guarantee of future results. Returns are historical and are calculated by determining the percentage change in net asset value or offering price (as applicable) with all distributions reinvested. Investment return and principal value will fluctuate so that shares, when redeemed, may be worth more or less than their original cost. Performance is for the stated time period only; due to market volatility, the Fund’s current performance may be lower or higher than the quoted return. For performance as of the most recent month end, please refer to www.eatonvance.com.
1
Eaton Vance Strategic Income Fund as of October 31, 2006
FUND PERFORMANCE
The line graph and table set forth below provide information about the Fund’s performance. The line graph compares the performance of Class B of the Fund with that of the Lehman Brothers Aggregate Bond Index, an unmanaged, broad-based index containing only investment-grade, fixed-income securities traded in the U.S. The lines on the graph represent the total returns of a hypothetical investment of $10,000 in Class B of the Fund and in the Lehman Brothers Aggregate Bond Index. The graph also offers a comparison to a Composite of two Lipper Fund Classification averages, reflecting the total returns of the funds in the same classifications as this Fund. The fund classifications are established by Lipper Inc., a nationally recognized monitor of mutual fund performance. Funds within a classification have similar investment policies. The Composite is provided because the Fund amended its investment policies on March 1, 1997, allowing the Fund to invest in a portfolio with a dollar-weighted average maturity of any duration. In connection with this change, the Fund’s Lipper Classification also changed. Reflecting that change, the performance of the Composite is based on the Lipper Short World Multi-Market Income Funds Classification from January 1, 1996, through March 1, 1997, and thereafter, on the Lipper Multi-Sector Income Funds Classification. The table includes the total returns of each Class of the Fund at net asset value and public offering price. The performance presented below does not reflect the deduction of taxes, if any, that a shareholder would pay on Fund distributions or the redemption of Fund shares.
Performance(1) | | Class A | | Class B | | Class C | |
| | | | | | | |
Average Annual Total Returns (at net asset value) | | | | | | | |
One Year | | 7.30 | % | 6.50 | % | 6.50 | % |
Five Years | | 7.83 | | 7.04 | | 7.06 | |
Ten Years | | N.A. | | 5.71 | | 5.70 | |
Life of Fund† | | 5.98 | | 6.08 | | 6.90 | |
| | | | | | | |
SEC Average Annual Total Returns (including sales charge or applicable CDSC) | | | | | | | |
One Year | | 2.25 | % | 1.51 | % | 5.50 | % |
Five Years | | 6.79 | | 6.74 | | 7.06 | |
Ten Years | | N.A. | | 5.71 | | 5.70 | |
Life of Fund† | | 5.39 | | 6.08 | | 6.90 | |
†Inception Dates – Class A: 1/23/98; Class B: 11/26/90; Class C: 5/25/94
(1) Average Annual Total Returns do not include the 4.75% maximum sales charge for Class A shares or the applicable contingent deferred sales charges (CDSC) for Class B or Class C shares. If sales charges were deducted, returns would be lower. SEC returns for Class A reflect the maximum 4.75% sales charge. SEC Average Annual Total Returns for Class B reflect applicable CDSC based on the following schedule: 5% - 1st and 2nd years; 4% - 3rd year; 3% - 4th year; 2% - 5th year; 1% - 6th year. SEC 1-Year return for Class C reflects 1% CDSC.
Sector Breakdown(2)
By total investments
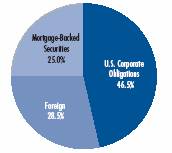
(2) The Fund Sector Breakdown reflects the Fund’s investments in Strategic Income Portfolio, High Income Portfolio and Floating Rate Portfolio as of 10/31/06. Indicated positions equal 133% of net assets as of 10/31/06. In addition to Sector net assets, the Global position includes the notional value of long forward currency contracts, long equity derivatives, and short credit default swap positions; and the U.S. Corporate Obligations position includes the notional value of long high-yield total-return swap positions. All of the aforementioned derivatives are added to the net assets of the Fund to get the gross assets of the Fund. Then each sector is divided by the amount of gross assets to calculate its percentage allocation in the Fund Sector Breakdown. Fund Statistics may not be representative of the Fund’s current or future investments and are subject to change due to active management.
Past performance is no guarantee of future results. Returns are historical and are calculated by determining the percentage change in net asset value or offering price (as applicable) with all distributions reinvested. Investment return and principal value will fluctuate so that shares, when redeemed, may be worth more or less than their original cost. Performance is for the stated time period only; due to market volatility, the Fund’s current performance may be lower or higher than the quoted return. For performance as of the most recent month end, please refer to www.eatonvance.com.
Comparison of Change in Value of a $10,000 Investment in Eaton Vance Strategic Income Fund, Class B vs. the Lehman Brothers Aggregate Bond Index & the Composite of Lipper Fund Averages*

* Sources: Thomson Financial; Lipper. Class B of the Fund commenced operations on 11/26/90.
A $10,000 hypothetical investment at net asset value in Class A shares on 1/23/98 and Class C shares on 10/31/96 would have been valued at $16,636 ($15,844 at maximum offering price after investment at net asset value) and $17,403, respectively, on 10/31/06. It is not possible to invest directly in an Index or Classification. The Index’s total return does not reflect the expenses that would have been incurred if an investor individually purchased or sold the securities represented in the Index. The Lipper average is the average total return, at net asset value, of the funds that are in the same Lipper Classification as the Fund.
Foreign Positions
By total net assets. Positions are in Local Currency unless otherwise noted. Positions in Europe other than Turkey are cross-hedged with short euro.
Mexico | | 6.8 | % |
Japan* | | 6.3 | |
Malaysia | | 4.0 | |
Romania | | 3.3 | |
Indonesia* | | 2.9 | |
Iceland | | 2.5 | |
Philippines* | | 2.4 | |
Egypt | | 1.7 | |
Turkey | | 1.6 | |
Brazil | | 1.0 | |
Australia | | 1.0 | |
India | | 1.0 | |
Singapore | | 0.8 | |
Colombia | | 0.7 | |
South Africa | | 0.5 | |
Serbia | | 0.5 | |
Kazakhstan | | 0.4 | |
Chile | | 0.3 | |
China | | 0.1 | |
*Position is in Local Currency and Hard Currency.
2
Eaton Vance Strategic Income Fund as of October 31, 2006
FUND EXPENSES
Example: As a shareholder of the Fund, you incur two types of costs: (1) transaction costs, including sales charges (loads) on purchases and redemption fees (if applicable); and (2) ongoing costs, including management fees; distribution or service fees; and other Fund expenses. This Example is intended to help you understand your ongoing costs (in dollars) of investing in the Fund and to compare these costs with the ongoing costs of investing in other mutual funds. The Example is based on an investment of $1,000 invested at the beginning of the period and held for the entire period (May 1 2006 – October 31, 2006).
Actual Expenses: The first section of the table below provides information about actual account values and actual expenses. You may use the information in this section, together with the amount you invested, to estimate the expenses that you paid over the period. Simply divide your account value by $1,000 (for example, an $8,600 account value divided by $1,000 = 8.6), then multiply the result by the number in the first section under the heading entitled "Expenses Paid During Period" to estimate the expenses you paid on your account during this period.
Hypothetical Example for Comparison Purposes: The second section of the table below provides information about hypothetical account values and hypothetical expenses based on the Fund's actual expense ratio and an assumed rate of return of 5% per year (before expenses), which is not the actual return of the Fund. The hypothetical account values and expenses may not be used to estimate the actual ending account balance or expenses you paid for the period. You may use this information to compare the ongoing costs of investing in your Fund and other funds. To do so, compare this 5% hypothetical example with the 5% hypothetical examples that appear in the shareholder reports of the other funds.
Please note that the expenses shown in the table are meant to highlight your ongoing costs only and do not reflect any transactional costs, such as sales charges (loads) or redemption fees (if applicable). Therefore, the second section of the table is useful in comparing ongoing costs only, and will not help you determine the relative total costs of owning different funds. In addition, if these transactional costs were included, your costs would have been higher.
Eaton Vance Strategic Income Fund
| | | Beginning Account Value
(5/1/06) | | Ending Account Value
(10/31/06) | | Expenses Paid During Period*
(5/1/06 – 10/31/06) | |
| Actual | |
| Class A | | $ | 1,000.00 | | | $ | 1,028.20 | | | $ | 5.06 | | |
| Class B | | $ | 1,000.00 | | | $ | 1,023.90 | | | $ | 8.88 | | |
| Class C | | $ | 1,000.00 | | | $ | 1,023.90 | | | $ | 8.83 | | |
| Hypothetical | |
| (5% return per year before expenses) | |
| Class A | | $ | 1,000.00 | | | $ | 1,020.20 | | | $ | 5.04 | | |
| Class B | | $ | 1,000.00 | | | $ | 1,016.40 | | | $ | 8.84 | | |
| Class C | | $ | 1,000.00 | | | $ | 1,016.50 | | | $ | 8.79 | | |
* Expenses are equal to the Fund's annualized expense ratio of 0.99% for Class A shares, 1.74% for Class B shares and 1.73% for Class C shares mulitiplied by 184/365 (to reflect the one-half-year period). The example assumes that the $1,000 was invested at the net asset value per share determined at the close of business on April 30, 2006. The example reflects the expenses of both the Fund and the Portfolios.
3
Eaton Vance Strategic Income Fund as of October 31, 2006
FINANCIAL STATEMENTS
Statement of Assets and Liabilities
As of October 31, 2006
| Assets | |
Investment in Strategic Income Portfolio, at value
(identified cost, $500,679,834) | | $ | 495,339,819 | | |
Investment in High Income Portfolio, at value
(identified cost, $66,137,238) | | | 68,168,725 | | |
Investment in Floating Rate Portfolio, at value
(identified cost, $273,662,051) | | | 273,896,252 | | |
| Receivable for Fund shares sold | | | 5,775,793 | | |
| Total assets | | $ | 843,180,589 | | |
| Liabilities | |
| Payable for Fund shares redeemed | | $ | 5,270,501 | | |
| Dividends payable | | | 2,079,769 | | |
| Payable to affiliate for distribution and service fees | | | 435,823 | | |
| Payable to affiliate for Trustees' fees | | | 282 | | |
| Accrued expenses | | | 175,328 | | |
| Total liabilities | | $ | 7,961,703 | | |
| Net Assets | | $ | 835,218,886 | | |
| Sources of Net Assets | |
| Paid-in capital | | $ | 878,249,516 | | |
Accumulated net realized loss from Portfolio (computed on the basis
of identified cost) | | | (39,639,404 | ) | |
| Accumulated distributions in excess of net investment income | | | (316,899 | ) | |
Net unrealized depreciation from Portfolios (computed on the basis
of identified cost) | | | (3,074,327 | ) | |
| Total | | $ | 835,218,886 | | |
| Class A Shares | |
| Net Assets | | $ | 414,882,493 | | |
| Shares Outstanding | | | 52,565,368 | | |
Net Asset Value and Redemption Price Per Share
(net assets ÷ shares of beneficial interest outstanding) | | $ | 7.89 | | |
Maximum Offering Price Per Share
(100 ÷ 95.25 of $7.89) | | $ | 8.28 | | |
| Class B Shares | |
| Net Assets | | $ | 194,351,119 | | |
| Shares Outstanding | | | 26,023,079 | | |
Net Asset Value, Offering Price and Redemption Price Per Share
(net assets ÷ shares of beneficial interest outstanding) | | $ | 7.47 | | |
| Class C Shares | |
| Net Assets | | $ | 225,985,274 | | |
| Shares Outstanding | | | 30,238,494 | | |
Net Asset Value, Offering Price and Redemption Price Per Share
(net assets ÷ shares of beneficial interest outstanding) | | $ | 7.47 | | |
On sales of $25,000 or more, the offering price of Class A shares is reduced.
Statement of Operations
For the Year Ended October 31, 2006
| Investment Income | |
| Interest allocated from Portfolios (net of foreign taxes, $50,771) | | $ | 42,416,628 | | |
| Dividends allocated from Portfolios | | | 75,094 | | |
| Expenses allocated from Portfolios | | | (4,417,744 | ) | |
| Net investment income from Portfolios | | $ | 38,073,978 | | |
| Expenses | |
| Trustees' fees and expenses | | $ | 3,422 | | |
Distribution and service fees
Class A | | | 818,765 | | |
| Class B | | | 1,970,585 | | |
| Class C | | | 1,801,497 | | |
| Transfer and dividend disbursing agent fees | | | 544,707 | | |
| Legal and accounting services | | | 81,338 | | |
| Registration fees | | | 68,884 | | |
| Printing and postage | | | 56,811 | | |
| Custodian fee | | | 42,721 | | |
| Miscellaneous | | | 7,917 | | |
| Total expenses | | $ | 5,396,647 | | |
| Net investment income | | $ | 32,677,331 | | |
Realized and Unrealized
Gain (Loss) from Portfolios | |
Net realized gain (loss) —
Investment transactions (identified cost basis) | | $ | (1,259,343 | ) | |
| Financial futures contracts | | | 1,642,648 | | |
| Swap contracts | | | 1,273,888 | | |
Foreign currency and forward foreign currency exchange
contract transactions | | | 7,907,780 | | |
| Net realized gain | | $ | 9,564,973 | | |
Change in unrealized appreciation (depreciation) —
Investments (identified cost basis) | | $ | 3,833,397 | | |
| Financial futures contracts | | | 396,529 | | |
| Swap contracts | | | (489,069 | ) | |
| Foreign currency and forward foreign currency exchange contracts | | | 542,621 | | |
| Net change in unrealized appreciation (depreciation) | | $ | 4,283,478 | | |
| Net realized and unrealized gain | | $ | 13,848,451 | | |
| Net increase in net assets from operations | | $ | 46,525,782 | | |
See notes to financial statements
4
Eaton Vance Strategic Income Fund as of October 31, 2006
FINANCIAL STATEMENTS CONT'D
Statements of Changes in Net Assets
Increase (Decrease)
in Net Assets | | Year Ended
October 31, 2006 | | Year Ended
October 31, 2005 | |
From operations —
Net investment income | | $ | 32,677,331 | | | $ | 17,106,069 | | |
Net realized gain from investments,
financial futures contracts, swap
contracts, and foreign currency | | | 9,564,973 | | | | 17,545,998 | | |
Net change in unrealized appreciation
(depreciation) from investments,
financial futures contracts, swap
contracts, foreign currency and
forward foreign currency
exchange contracts | | | 4,283,478 | | | | (8,013,037 | ) | |
| Net increase in net assets from operations | | $ | 46,525,782 | | | $ | 26,639,030 | | |
Distributions to shareholders —
From net investment income | |
| Class A | | $ | (23,178,195 | ) | | $ | (15,134,992 | ) | |
| Class B | | | (12,559,493 | ) | | | (12,983,253 | ) | |
| Class C | | | (11,396,339 | ) | | | (8,531,282 | ) | |
| Tax Return of Capital | |
| Class A | | | (250,996 | ) | | | — | | |
| Class B | | | (159,237 | ) | | | — | | |
| Class C | | | (145,751 | ) | | | — | | |
| Total distributions to shareholders | | $ | (47,690,011 | ) | | $ | (36,649,527 | ) | |
Transactions in shares of beneficial interest —
Proceeds from sale of shares | |
| Class A | | $ | 254,028,611 | | | $ | 142,688,114 | | |
| Class B | | | 38,705,907 | | | | 47,794,361 | | |
| Class C | | | 111,040,586 | | | | 67,794,237 | | |
Net asset value of shares issued to
shareholders in payment of
distributions declared | | | | | | | | | |
| Class A | | | 13,809,763 | | | | 8,356,311 | | |
| Class B | | | 5,282,097 | | | | 5,084,301 | | |
| Class C | | | 5,632,409 | | | | 4,022,854 | | |
| Cost of shares redeemed | |
| Class A | | | (100,111,423 | ) | | | (74,405,319 | ) | |
| Class B | | | (37,304,209 | ) | | | (40,134,237 | ) | |
| Class C | | | (38,980,835 | ) | | | (24,052,318 | ) | |
| Net asset value of shares exchanged | |
| Class A | | | 8,801,199 | | | | 4,464,177 | | |
| Class B | | | (8,801,199 | ) | | | (4,464,177 | ) | |
Net increase in net assets from
Fund share transactions | | $ | 252,102,906 | | | $ | 137,148,304 | | |
| Net increase in net assets | | $ | 250,938,677 | | | $ | 127,137,807 | | |
| Net Assets | | Year Ended
October 31, 2006 | | Year Ended
October 31, 2005 | |
| At beginning of year | | $ | 584,280,209 | | | $ | 457,142,402 | | |
| At end of year | | $ | 835,218,886 | | | $ | 584,280,209 | | |
Accumulated undistributed
(distributions in excess of)
net investment income
included in net assets | |
| At end of year | | $ | (316,899 | ) | | $ | 1,445,991 | | |
See notes to financial statements
5
Eaton Vance Strategic Income Fund as of October 31, 2006
FINANCIAL STATEMENTS CONT'D
Financial Highlights
| | | Class A | |
| | | Year Ended October 31, | |
| | | 2006(1) | | 2005(1) | | 2004(1) | | 2003(1) | | 2002(1)(2) | |
| Net asset value — Beginning of year | | $ | 7.900 | | | $ | 8.030 | | | $ | 8.100 | | | $ | 7.550 | | | $ | 8.030 | | |
| Income (loss) from operations | |
| Net investment income | | $ | 0.398 | | | $ | 0.294 | | | $ | 0.286 | | | $ | 0.336 | | | $ | 0.504 | | |
| Net realized and unrealized gain (loss) | | | 0.161 | | | | 0.166 | | | | 0.273 | | | | 0.883 | | | | (0.286 | ) | |
| Total income from operations | | $ | 0.559 | | | $ | 0.460 | | | $ | 0.559 | | | $ | 1.219 | | | $ | 0.218 | | |
| Less distributions | |
| From net investment income | | $ | (0.563 | ) | | $ | (0.590 | ) | | $ | (0.629 | ) | | $ | (0.669 | ) | | $ | (0.670 | ) | |
| From paid-in capital | | | — | | | | — | | | | — | | | | — | | | | (0.028 | ) | |
| From tax return of capital | | | (0.006 | ) | | | — | | | | — | | | | — | | | | — | | |
| Total distributions | | $ | (0.569 | ) | | $ | (0.590 | ) | | $ | (0.629 | ) | | $ | (0.669 | ) | | $ | (0.698 | ) | |
| Net asset value — End of year | | $ | 7.890 | | | $ | 7.900 | | | $ | 8.030 | | | $ | 8.100 | | | $ | 7.550 | | |
| Total Return(3) | | | 7.30 | % | | | 5.85 | % | | | 7.18 | % | | | 16.65 | % | | | 2.68 | % | |
| Ratios/Supplemental Data | |
| Net assets, end of year (000's omitted) | | $ | 414,882 | | | $ | 238,973 | | | $ | 162,022 | | | $ | 48,738 | | | $ | 17,418 | | |
| Ratios (As a percentage of average daily net assets): | |
| Expenses before custodian fee reduction(4) | | | 0.99 | % | | | 1.02 | % | | | 1.06 | % | | | 1.11 | % | | | 1.17 | % | |
| Expenses after custodian fee reduction(4) | | | 0.99 | % | | | 1.02 | % | | | 1.06 | % | | | 1.11 | % | | | 1.17 | % | |
| Net investment income | | | 5.04 | % | | | 3.66 | % | | | 3.57 | % | | | 4.19 | % | | | 6.39 | % | |
| Portfolio Turnover of the Strategic Income Portfolio | | | 41 | % | | | 59 | % | | | 55 | % | | | 71 | % | | | 63 | % | |
| Portfolio Turnover of the High Income Portfolio | | | 62 | % | | | 62 | % | | | 80 | % | | | 122 | % | | | 88 | % | |
| Portfolio Turnover of the Floating Rate Portfolio | | | 50 | % | | | 57 | % | | | 67 | % | | | — | | | | — | | |
(1) Net investment income per share was computed using average shares outstanding.
(2) The Fund, through its investment in the Portfolios, adopted the provisions of the revised AICPA Audit and Accounting Guide for Investment Companies and began amortizing market premiums on fixed-income securities, excluding mortgage-backed securities, and accreting certain discounts using a different methodology. Additionally, the Portfolios reclassified net losses realized on prepayments received on mortgage-backed securities that were previously included in realized gains/losses to interest income. The effect of these changes for the year ended October 31, 2002 was to decrease net investment income per share by $0.095, decrease net realized and unrealized loss per share by $0.095 and decrease the ratio of net investment income to average net assets from 7.58% to 6.39%.
(3) Returns are historical and are calculated by determining the percentage change in net asset value with all distributions reinvested.
(4) Includes the Fund's share of the Portfolios' allocated expenses.
See notes to financial statements
6
Eaton Vance Strategic Income Fund as of October 31, 2006
FINANCIAL STATEMENTS CONT'D
Financial Highlights
| | | Class B | |
| | | Year Ended October 31, | |
| | | 2006(1) | | 2005(1) | | 2004(1) | | 2003(1) | | 2002(1)(2) | |
| Net asset value — Beginning of year | | $ | 7.480 | | | $ | 7.600 | | | $ | 7.660 | | | $ | 7.150 | | | $ | 7.600 | | |
| Income (loss) from operations | |
| Net investment income | | $ | 0.320 | | | $ | 0.223 | | | $ | 0.224 | | | $ | 0.269 | | | $ | 0.425 | | |
| Net realized and unrealized gain (loss) | | | 0.153 | | | | 0.159 | | | | 0.254 | | | | 0.817 | | | | (0.272 | ) | |
| Total income from operations | | $ | 0.473 | | | $ | 0.382 | | | $ | 0.478 | | | $ | 1.086 | | | $ | 0.153 | | |
| Less distributions | |
| From net investment income | | $ | (0.477 | ) | | $ | (0.502 | ) | | $ | (0.538 | ) | | $ | (0.576 | ) | | $ | (0.575 | ) | |
| From paid-in capital | | | — | | | | — | | | | — | | | | — | | | | (0.028 | ) | |
| From tax return of capital | | | (0.006 | ) | | | — | | | | — | | | | — | | | | — | | |
| Total distributions | | $ | (0.483 | ) | | $ | (0.502 | ) | | $ | (0.538 | ) | | $ | (0.576 | ) | | $ | (0.603 | ) | |
| Net asset value — End of year | | $ | 7.470 | | | $ | 7.480 | | | $ | 7.600 | | | $ | 7.660 | | | $ | 7.150 | | |
| Total Return(3) | | | 6.50 | % | | | 5.12 | % | | | 6.47 | % | | | 15.61 | % | | | 1.96 | % | |
| Ratios/Supplemental Data | |
| Net assets, end of year (000's omitted) | | $ | 194,351 | | | $ | 196,766 | | | $ | 191,765 | | | $ | 217,341 | | | $ | 173,780 | | |
| Ratios (As a percentage of average daily net assets): | |
| Expenses before custodian fee reduction(4) | | | 1.74 | % | | | 1.77 | % | | | 1.81 | % | | | 1.86 | % | | | 1.93 | % | |
| Expenses after custodian fee reduction(4) | | | 1.74 | % | | | 1.77 | % | | | 1.81 | % | | | 1.86 | % | | | 1.93 | % | |
| Net investment income | | | 4.27 | % | | | 2.94 | % | | | 2.95 | % | | | 3.57 | % | | | 5.68 | % | |
| Portfolio Turnover of the Strategic Income Portfolio | | | 41 | % | | | 59 | % | | | 55 | % | | | 71 | % | | | 63 | % | |
| Portfolio Turnover of the High Income Portfolio | | | 62 | % | | | 62 | % | | | 80 | % | | | 122 | % | | | 88 | % | |
| Portfolio Turnover of the Floating Rate Portfolio | | | 50 | % | | | 57 | % | | | 67 | % | | | — | | | | — | | |
(1) Net investment income per share was computed using average shares outstanding.
(2) The Fund, through its investment in the Portfolios, adopted the provisions of the revised AICPA Audit and Accounting Guide for Investment Companies and began amortizing market premiums on fixed-income securities, excluding mortgage-backed securities, and accreting certain discounts using a different methodology. Additionally, the Portfolios reclassified net losses realized on prepayments received on mortgage-backed securities that were previously included in realized gains/losses to interest income. The effect of these changes for the year ended October 31, 2002 was to decrease net investment income per share by $0.090, decrease net realized and unrealized loss per share by $0.090 and decrease the ratio of net investment income to average net assets from 6.86% to 5.68%.
(3) Returns are historical and are calculated by determining the percentage change in net asset value with all distributions reinvested.
(4) Includes the Fund's share of the Portfolios' allocated expenses.
See notes to financial statements
7
Eaton Vance Strategic Income Fund as of October 31, 2006
FINANCIAL STATEMENTS CONT'D
Financial Highlights
| | | Class C | |
| | | Year Ended October 31, | |
| | | 2006(1) | | 2005(1)(2) | | 2004(1)(2) | | 2003(1)(2) | | 2002(1)(2)(3) | |
| Net asset value — Beginning of year | | $ | 7.480 | (2) | | $ | 7.610 | | | $ | 7.670 | | | $ | 7.160 | | | $ | 7.610 | | |
| Income (loss) from operations | |
| Net investment income | | $ | 0.320 | | | $ | 0.222 | | | $ | 0.219 | | | $ | 0.267 | | | $ | 0.426 | | |
| Net realized and unrealized gain (loss) | | | 0.153 | | | | 0.150 | | | | 0.260 | | | | 0.819 | | | | (0.273 | ) | |
| Total income from operations | | $ | 0.473 | | | $ | 0.372 | | | $ | 0.479 | | | $ | 1.086 | | | $ | 0.153 | | |
| Less distributions | |
| From net investment income | | $ | (0.477 | )(2) | | $ | (0.502 | ) | | $ | (0.539 | ) | | $ | (0.576 | ) | | $ | (0.581 | ) | |
| From paid-in capital | | | — | | | | — | | | | — | | | | — | | | | (0.022 | ) | |
| From tax return of capital | | | (0.006 | ) | | | — | | | | — | | | | — | | | | — | | |
| Total distributions | | $ | (0.483 | ) | | $ | (0.502 | ) | | $ | (0.539 | ) | | $ | (0.576 | ) | | $ | (0.603 | ) | |
| Net asset value — End of year | | $ | 7.470 | | | $ | 7.480 | | | $ | 7.610 | | | $ | 7.670 | | | $ | 7.160 | | |
| Total Return(4) | | | 6.50 | % | | | 5.21 | %(5) | | | 6.45 | % | | | 15.68 | % | | | 1.95 | % | |
| Ratios/Supplemental Data | |
| Net assets, end of year (000's omitted) | | $ | 225,985 | | | $ | 148,541 | | | $ | 103,355 | | | $ | 74,117 | | | $ | 45,414 | | |
| Ratios (As a percentage of average daily net assets): | |
| Expenses before custodian fee reduction(6) | | | 1.74 | % | | | 1.77 | % | | | 1.81 | % | | | 1.86 | % | | | 1.93 | % | |
| Expenses after custodian fee reduction(6) | | | 1.74 | % | | | 1.77 | % | | | 1.81 | % | | | 1.86 | % | | | 1.93 | % | |
| Net investment income | | | 4.29 | % | | | 2.91 | % | | | 2.89 | % | | | 3.53 | % | | | 5.69 | % | |
| Portfolio Turnover of the Strategic Income Portfolio | | | 41 | % | | | 59 | % | | | 55 | % | | | 71 | % | | | 63 | % | |
| Portfolio Turnover of the High Income Portfolio | | | 62 | % | | | 62 | % | | | 80 | % | | | 122 | % | | | 88 | % | |
| Portfolio Turnover of the Floating Rate Portfolio | | | 50 | % | | | 57 | % | | | 67 | % | | | — | | | | — | | |
(1) Net investment income per share was computed using average shares outstanding.
(2) Per share data have been restated to reflect the effects of a 1.2632979-for-1 stock split effective on November 11, 2005.
(3) The Fund, through its investment in the Portfolios, adopted the provisions of the revised AICPA Audit and Accounting Guide for Investment Companies and began amortizing market premiums on fixed-income securities, excluding mortgage-backed securities, and accreting certain discounts using a different methodology. Additionally, the Portfolios reclassified net losses realized on prepayments received on mortgage-backed securities that were previously included in realized gains/losses to interest income. The effect of these changes for the year ended October 31, 2002 was to decrease net investment income per share by $0.089, decrease net realized and unrealized loss per share by $0.089 and decrease the ratio of net investment income to average net assets from 6.88% to 5.69%.
(4) Returns are historical and are calculated by determining the percentage change in net asset value with all distributions reinvested.
(5) Total return reflects an increase of 0.17% due to a change in the timing of the payment and reinvestment of distributions.
(6) Includes the Fund's share of the Portfolios' allocated expenses.
See notes to financial statements
8
Eaton Vance Strategic Income Fund as of October 31, 2006
NOTES TO FINANCIAL STATEMENTS
1 Significant Accounting Policies
Eaton Vance Strategic Income Fund (the Fund) is a series of Eaton Vance Mutual Funds Trust (the Trust). The Trust is registered under the Investment Company Act of 1940, as amended, as an open-end management investment company. The Fund offers three classes of shares. Class A shares are generally sold subject to a sales charge imposed at the time of purchase. Class B and Class C shares are sold at net asset value and are generally subject to a contingent deferred sales charge (see Note 6). The Trustees have adopted a conversion feature pursuant to which Class B shares of the Fund automatically convert to Class A shares eight years after their purchase as described in the Fund's prospectus. Each class represents a pro rata interest in the Fund, but votes separately on class-specific matters and (as noted below) is subject to different expenses. Realized and unrealized gains and losses are allocated daily to each class of shares b ased on the relative net assets of each class to the total net assets of the Fund. Net investment income, other than class specific expenses, is allocated daily to each class of shares based upon the ratio of the value of each class' paid shares to the total value of all paid shares. Each class of shares differs in its distribution plan and certain other class specific expenses. The Fund is structured as a fund-of-funds and as of October 31, 2006, invested all of its investable assets in interests in three Portfolios: Strategic Income Portfolio, High Income Portfolio, and Floating Rate Portfolio (the Portfolios), which are New York Trusts. The value of the Fund's investment in the Portfolios reflects the Fund's proportionate interest in the net assets of the Strategic Income Portfolio, High Income Portfolio, and Floating Rate Portfolio (87.9%, 6.3%, and 3.7%, respectively, at October 31, 2006). The performance of the Fund is directly affected by the performance of the Portfolios. The financial statements of the Strategic Income Portfolio, including the portfolio of investments, are included elsewhere in this report and should be read in conjunction with the Fund's financial statements. See Note 8 for further information on the results of operations of High Income Portfolio and Floating Rate Portfolio. A copy of the financial statements of High Income Portfolio and Floating Rate Portfolio are available on the EDGAR Database on the Securities and Exchange Commission's website (www.sec.gov), at the Commission's public reference room in Washington, DC or upon request from the Fund's principal underwriter, Eaton Vance Distributors Inc. (EVD) by calling 1-800-225-6265.
The following is a summary of significant accounting policies of the Fund. The policies are in conformity with accounting principles generally accepted in the United States of America.
A Investment Valuation — Valuation of securities by the Strategic Income Portfolio is discussed in Note 1A of the Portfolio's Notes to Financial Statements, which are included elsewhere in this report. High Income Portfolio's valuation policies are as follows: Investments listed on securities exchanges are valued at closing sale prices. Investments listed on the NASDAQ National Market System are valued at the NASDAQ official closing price. Listed or unlisted investments for which closing sale prices are not available are valued at the mean between the latest bid and asked prices. Fixed income investments (other than short-term obligations), including listed investments and investments for which price quotations are available, will normally be valued on the basis of market valuations furnished by a pricing service. Financial futures contracts listed on commodity exchanges are valued at closing settlement prices. Short-term obligations, maturing in sixty days or less, are valued at amortized cost, which approximates fair value. The Portfolio also invests in interests in senior floating rate loans (Senior Loans). The Portfolio's investment adviser, Boston Management and Research (BMR) a wholly owned subsidiary of Eaton Vance Management (EVM), has characterized certain Senior Loans as liquid based on a predetermined acceptable number and range of market quotations available. Such loans are valued on the basis of market valuations furnished by a pricing service. Investments for which there are no quotations or valuations are valued at fair value using methods determined in good faith by or at the direction of the Trustees. Other Senior Loans are valued at fair value by BMR under procedures established by the Trustees as permitted by section 2(a)(41) of the Investment Company Act of 1940. Floating Rate Portfolio's valuation policies are as follows: Certain Senior Loans are deemed to be liquid because reliable market quotations are readily available for them. Liquid Senior Loans are valued on the basis of prices furnished by a pricing service. Other Senior Loans are valued at fair value by the Portfolio's investment adviser under procedures approved by the Trustees. In connection with determining the fair value of a Senior Loan, the investment adviser makes an assessment of the likelihood that the borrower will make a full repayment of the Senior Loan. The primary factors considered by the investment adviser when making this assessment are (i) the creditworthiness of the borrower, (ii) the value of the collateral backing the Senior Loan, and (iii) the priority of the Senior Loan versus other creditors of the borrower. If, based on its assessment, the investment adviser believes there is a reasonable likelihood that the borrower will make a full repayment of the Senior Loan, the invest ment adviser will determine the fair value of the Senior Loan using a Matrix pricing approach that considers the yield on the Senior Loan relative to yields on other loan interests issued by companies of comparable credit quality. If, based on its assessment, the investment adviser
9
Eaton Vance Strategic Income Fund as of October 31, 2006
NOTES TO FINANCIAL STATEMENTS CONT'D
believes there is not a reasonable likelihood that the borrower will make a full repayment of the Senior Loan, the investment adviser will determine the fair value of the Senior Loan using analyses that include but are not limited to (i) a comparison of the value of the borrower's outstanding equity and debt to that of comparable public companies; (ii) a discounted cash flow analysis; or (iii) when the investment adviser believes it is likely that a borrower will be liquidated or sold, an analysis of the terms of such liquidation or sale. In certain cases, the investment adviser will use a combination of analytical methods to determine fair value, such as when only a portion of a borrower's assets are likely to be sold. In conducting its assessment and analyses for purposes of determining fair value of a Senior Loan, the investment adviser will use its discretion and judgment in considering and appraising such factors, data and information and the relative weight to be given thereto as it deems relevant, including without limitation, some or all of the following: (i) the fundamental characteristics of and fundamental analytical data relating to the Senior Loan, including the cost, size, current interest rate, maturity and base lending rate of the Senior Loan, the terms and conditions of the Senior Loan and any related agreements, and the position of the Senior Loan in the borrower's debt structure; (ii) the nature, adequacy and value of the collateral securing the Senior Loan, including the Portfolio's rights, remedies and interests with respect to the collateral; (iii) the creditworthiness of the borrower, based on an evaluation of, among other things, its financial condition, financial statements and information about the borrower's business, cash flows, capital structure and future prospects; (iv) information relating to the market for the Senior Loan including price quotations for and trading in the Senior Loan and interests in similar Senior Loans and the market environment and investor attitudes towards the Senior Loan and interests in similar Senior Loans; (v) the experience, reputation, stability and financial condition of the Agent and any intermediate participants in the Senior Loan; and (vi) general economic and market conditions affecting the fair value of the Senior Loan. Fair value determinations are made by the portfolio managers of a Trust based on information available to such managers. The portfolio managers of other trusts managed by Eaton Vance that invest in Senior Loans may not possess the same information about a Senior Loan borrower as the portfolio managers of Floating Rate Portfolio. At times, the fair value of a Senior Loan determined by the portfolio managers of other trusts managed by Eaton Vance that invest in Senior Loans may vary from the fair value of the same Senior Loan determined by the portfolio managers of Floating Rate Portfolio. The fair value of each Senior Loan is periodically reviewed and app roved by the investment adviser's Valuation Committee and by the Trustees based upon procedures approved by the Trustees. Junior Loans are valued in the same manner as Senior Loans.
Other portfolio securities (other than short-term obligations, but including listed issues) may be valued on the basis of prices furnished by one or more pricing services which determine prices for normal, institutional-size trading units of such securities which may use market information, transactions for comparable securities and various relationships between securities which are generally recognized by institutional traders. The value of interest rate swaps will be based on dealer quotations. Short-term obligations which mature in sixty days or less are valued at amortized cost. If short-term debt securities were acquired with a remaining maturity of more than sixty days they will be valued by a pricing service. Over-the-counter options are valued at the mean between the bid and the asked price provided by dealers. Marketable securities listed on the NASDAQ National Market System are valued at the NASDAQ official closing pri ce. Financial futures contracts listed on the commodity exchanges and options thereon are valued at closing settlement prices. Repurchase agreements are valued at cost plus accrued interest. Other portfolio securities for which there are no quotations or valuations, and investments for which the price of the security is not believed to represent its fair market value, are valued at fair value as determined in good faith by or at the direction of the Trustees. Occasionally, events affecting the value of foreign securities may occur between the time trading is completed abroad and the close of the Exchange which will not be reflected in the computation of the Fund's net asset value (unless the Fund deems that such event would materially affect its net asset value in which case an adjustment would be made and reflected in such computation). The Fund may rely on an independent fair valuation service in making any such adjustment as to the value of a foreign equity security.
B Income — The Fund's net investment income or loss consists of the Fund's pro rata share of the net investment income or loss of the Portfolios, less all actual and accrued expenses of the Fund.
C Federal Taxes — The Fund's policy is to comply with the provisions of the Internal Revenue Code applicable to regulated investment companies and to distribute to shareholders, each year, substantially all of its net investment income and all or substantially all of its net realized capital gains. Accordingly, no provision for federal income or excise tax is necessary. At October 31, 2006, the Fund, for Federal income tax purposes, had a capital loss carryover of $37,131,458 which will reduce the Fund's taxable income arising from future net realized gains on investment transactions, if any, to the extent permitted by the Internal Revenue Code, and thus will reduce the amount of the distributions to shareholders which would otherwise be necessary to relieve the Fund of a ny liability for federal income or excise tax. Such capital loss
10
Eaton Vance Strategic Income Fund as of October 31, 2006
NOTES TO FINANCIAL STATEMENTS CONT'D
carryover will expire on October 31, 2007 ($7,933,008), October 31, 2009 ($9,854,300), October 31, 2010 ($14,208,464), October 31, 2011 ($1,234,272), October 31, 2012 ($2,342,991) and October 31, 2014 ($1,558,423). At October 31, 2006, the amount of the tax basis capital loss carryforward differed from the accumulated net realized loss due primarily to the timing of recording gain/loss on certain futures contracts. During the year ended October 31, 2006, capital loss carryovers in the amount of ($1,611,493) has expired.
D Expense Reduction — Investors Bank & Trust Company (IBT) serves as custodian of the Fund. Pursuant to the custodian agreement, IBT receives a fee reduced by credits which are determined based on the average daily cash balance the Fund maintains with IBT. All credit balances used to reduce the Fund's custodian fees are reported as a reduction of expenses in the Statement of Operations.
E Use of Estimates — The preparation of the financial statements in conformity with accounting principles generally accepted in the United States of America requires management to make estimates and assumptions that affect the reported amounts of assets and liabilities at the date of the financial statements and the reported amounts of income and expense during the reporting period. Actual results could differ from those estimates.
F Expenses — The majority of expenses of the Trust are directly identifiable to an individual fund. Expenses which are not readily identifiable to a specific fund are allocated taking into consideration, among other things, the nature and type of expense and the relative size of the funds.
G Indemnifications — Under the Trust's organizational documents, its officers and Trustees may be indemnified against certain liabilities and expenses arising out of the performance of their duties to the Fund, and shareholders are indemnified against personal liability for the obligations of the Trust. Additionally, in the normal course of business, the Fund enters into agreements with service providers that may contain indemnification clauses. The Fund's maximum exposure under these arrangements is unknown as this would involve future claims that may be made against the Fund that have not yet occurred.
H Other — Investment transactions are accounted for on the date the securities are purchased or sold. Dividends to shareholders are recorded on the ex-dividend date.
2 Distributions to Shareholders
The Fund declares dividends daily to shareholders of record at the time of declaration. Distributions are ordinarily paid monthly. Distributions of allocated realized capital gains, if any, are made at least annually. Shareholders may reinvest income and capital gain distributions in additional shares of the Fund at the net asset value as of the ex-dividend date. Distributions are paid in the form of additional shares of the Fund or, at the election of the shareholder, in cash. The Fund distinguishes between distributions on a tax basis and a financial reporting basis. Accounting principles generally accepted in the United States of America require that only distributions in excess of tax basis earnings and profits be reported in the financial statements as a return of capital. Permanent differences between book and tax accounting relating to distributions are reclassified to paid-in capital.
The tax character of distributions declared for the years ended October 31, 2006 and October 31, 2005 was as follows:
| | | Year Ended October 31, | |
| | | 2006 | | 2005 | |
| Distributions declared from: | |
| Ordinary income | | $ | 47,134,027 | | | $ | 36,649,527 | | |
| Tax return of capital | | | 555,984 | | | | — | | |
During the year ended October 31, 2006, distributions in excess of net investment income was decreased by $12,693,806 and accumulated net realized loss was increased by $(11,317,995) and paid-in capital was decreased by $1,375,811, primarily due to differences between book and tax accounting for financial futures contracts, swaps, foreign currency transactions; amortization/accretion; expired capital loss carryovers and paydown losses. This change had no effect on the net assets or the net asset value per share.
As of October 31, 2006, the components of distributable earnings (accumulated losses) on a tax basis were as follows:
| Capital loss carryforwards | | $ | (37,131,458 | ) | |
The differences between components of distributable earnings (accumulated loss) on a tax basis and the amounts reflected in the statement of assets and liabilities are primarily due to differences between book and tax policies for swap contracts, financial futures contracts, straddles and the timing of recognizing distributions to shareholders.
11
Eaton Vance Strategic Income Fund as of October 31, 2006
NOTES TO FINANCIAL STATEMENTS CONT'D
3 Shares of Beneficial Interest
The Fund's Declaration of Trust permits the Trustees to issue an unlimited number of full and fractional shares of beneficial interest (without par value). Such shares may be issued in a number of different series (such as the Fund) and classes. Transactions in Fund shares were as follows:
| | | Year Ended October 31, | |
| Class A | | 2006 | | 2005 | |
| Sales | | | 32,136,571 | | | | 17,751,914 | | |
Issued to shareholders electing to
receive payments of distributions
in Fund shares | | | 1,747,890 | | | | 1,041,682 | | |
| Redemptions | | | (12,677,736 | ) | | | (9,285,301 | ) | |
| Exchange from Class B shares | | | 1,115,186 | | | | 557,285 | | |
| Net increase | | | 22,321,911 | | | | 10,065,580 | | |
| | | Year Ended October 31, | |
| Class B | | 2006 | | 2005 | |
| Sales | | | 5,168,892 | | | | 6,285,187 | | |
Issued to shareholders electing to
receive payments of distributions
in Fund shares | | | 705,805 | | | | 669,200 | | |
| Redemptions | | | (4,988,803 | ) | | | (5,280,517 | ) | |
| Exchange to Class A shares | | | (1,177,540 | ) | | | (588,236 | ) | |
| Net increase (decrease) | | | (291,646 | ) | | | 1,085,634 | | |
| | | Year Ended October 31, | |
| Class C | | 2006(1) | | 2005(1) | |
| Sales | | | 14,847,438 | | | | 8,902,060 | | |
Issued to shareholders electing to
receive payments of distributions
in Fund shares | | | 753,078 | | | | 529,300 | | |
| Redemptions | | | (5,216,478 | ) | | | (3,167,321 | ) | |
| Net increase | | | 10,384,038 | | | | 6,264,039 | | |
(1) Transactions have been restated to reflect the effects of a 1.2632979-for-1 stock split effective on November 11, 2005.
4 Investment Adviser Fee and Other Transactions with Affiliates
Eaton Vance Management (EVM) serves as the administrator of the Fund, but receives no compensation. The Portfolios have engaged Boston Management and Research (BMR), a subsidiary of EVM, to render investment advisory services. See Note 2 of each of the Portfolio's Notes to financial statements. Except as to Trustees of the Fund and the Portfolios who are not members of EVM's organization, officers and Trustees receive remuneration for their services to the Fund out of such investment adviser fee. Certain officers and Trustees of the Fund and of the Portfolios are officers of the above organizations. EVM serves as the sub-transfer agent of the Fund and receives an aggregate fee based upon the actual expenses incurred by EVM in the performance of those services. During the year ended October 31, 2006, EVM received $31,441 in sub-transfer agent fees. The Fund w as informed that EVD, a subsidiary of EVM and the Fund's principal underwriter, received $188,220 as its portion of the sales charge on sales of Class A shares for the year ended October 31, 2006.
5 Distribution Plans
Class A has in effect a distribution plan pursuant to Rule 12b-1 (Class A Plan). The Class A Plan provides that the Fund will pay EVD a distribution and service fee of 0.25% of the Fund's average daily net assets attributable to Class A shares for each fiscal year for distribution services and facilities provided to the Fund by EVD, as well as for personal services and/or the maintenance of shareholder accounts. Distribution and service fees paid or accrued for the year ended October 31, 2006 amounted to $818,765 for Class A shares. The Fund also has in effect distribution plans for Class B shares (Class B Plan) and Class C shares (Class C Plan) pursuant to Rule 12b-1 under the Investment Company Act of 1940. The Class B and Class C Plans require the Fund to pay EVD amounts equal to 1/365 of 0.75% of the Fund's average daily net assets attributable to Class B and Class C shares for providing ongoing distribution services and fac ilities to the Fund. The Fund will automatically discontinue payments to EVD during any period in which there are no outstanding Uncovered Distribution Charges, which are equivalent to the sum of (i) 4.5% and 6.25% of the aggregate amount received by the Fund for the Class B and Class C shares sold, respectively, plus (ii) interest calculated by applying the rate of 1% over the prevailing prime rate to the outstanding balance of Uncovered Distribution Charges due EVD, of each respective class reduced by the aggregate amount of contingent deferred sales charges (see Note 6) and daily amounts theretofore paid to EVD by each respective class. The Fund paid or accrued $1,477,939 and $1,351,123 for Class B and Class C shares, respectively, to or payable to EVD for the year ended October 31, 2006, representing 0.75% of the average daily net assets for Class B and Class C shares. At October 31, 2006, the amount of Uncovered Distribution Charges of EVD calculated under the Plans was approximately $37,932,000 and $16 ,498,000 for Class B and Class C shares, respectively. The Class B and Class C Plans also authorize
12
Eaton Vance Strategic Income Fund as of October 31, 2006
NOTES TO FINANCIAL STATEMENTS CONT'D
the Fund to make payments of service fees to EVD, investment dealers and other persons in amounts not exceeding 0.25% annually of the average daily net assets attributable to that Class. Service fees are paid for personal services and/or the maintenance of shareholder accounts. They are separate and distinct from the Class B and Class C sales commissions and distribution fees and, as such, are not subject to automatic discontinuance when there are no outstanding Uncovered Distribution Charges to EVD. Service fees paid or accrued for the year ended October 31, 2006 amounted to $492,646 and $450,374 for Class B and Class C shares, respectively.
6 Contingent Deferred Sales Charge
Effective September 15, 2006, all purchases of Class A shares of $1 million of more will be subject to a 1% contingent deferred sales charge (CDSC) in the event of a redemption within 18 months of purchase. Prior to September 15, 2006, Class A shares purchased at net asset value in amounts of $1 million or more (other than shares purchased in a single transaction of $5 million or more) were subject to a 1% CDSC if redeemed within 12 months of purchase. A CDSC generally is imposed on redemptions of Class B shares made within six years of purchase and on redemptions of Class C shares made within one year of purchase. Generally, the CDSC is based upon the lower of the net asset value at date of redemption or date of purchase. No charge is levied on shares acquired by reinvestment of dividends or capital gain distributions. The Class B CDSC is imposed at declining rates that begin at 5% in the first and second year of redemption aft er purchase, declining one percentage point in each subsequent year. Class C shares will be subject to a 1% CDSC if redeemed within one year of purchase. No CDSC is levied on shares which have been sold to EVM or its affiliates or to their respective employees or clients and may be waived under certain other limited conditions. CDSC charges received on Class B and Class C redemptions are paid to EVD to reduce the amount of Uncovered Distribution Charges calculated under the Class B and Class C Plans, respectively (see Note 5). CDSC charges received on Class B and Class C redemptions when no Uncovered Distribution Charges exist for the respective classes will be retained by to the Fund. The Fund has been informed that EVD received approximately $16,000, $557,000 and $51,000 of CDSC paid by shareholders of Class A, Class B and Class C shares, respectively, during the year ended October 31, 2006.
7 Investment Transactions
Increases and decreases in the Fund's investment in the Strategic Income Portfolio for the year ended October 31, 2006, aggregated $408,680,053 and $357,524,690, respectively. Increases and decreases in the Fund's investment in the Floating Rate Portfolio for the year ended October 31, 2006 aggregated $148,200,000 and $0, respectively. There were no changes to the Fund's investment in the High Income Portfolio for the year ended October 31, 2006.
8 Investment in Portfolios
For the year ended October 31, 2006, the Fund was allocated net investment income and realized and unrealized gain (loss) from the Portfolios as follows:
| | | Strategic
Income
Portfolio | | High
Income
Portfolio | | Floating
Rate
Portfolio | | Total | |
Interest income (net
of foreign taxes
of $50,771, $0,
$0 and $50,771,
respectively) | | $ | 23,604,621 | | | $ | 5,579,453 | | | $ | 13,232,554 | | | $ | 42,416,628 | | |
| Dividend income | | | 26,902 | | | | 48,021 | | | | 171 | | | | 75,094 | | |
| Expenses | | | (3,025,897 | ) | | | (379,475 | ) | | | (1,012,372 | ) | | | (4,417,744 | ) | |
Net investment
income | | $ | 20,605,626 | | | $ | 5,247,999 | | | $ | 12,220,353 | | | $ | 38,073,978 | | |
| Net realized gain (loss) — | |
Investment
transactions | | $ | (2,447,048 | ) | | $ | 1,271,354 | | | $ | (83,649 | ) | | $ | (1,259,343 | ) | |
Financial futures
contracts | | | 1,642,648 | | | | | | | | | | | | 1,642,648 | | |
| Swap contracts | | | 1,220,994 | | | | 16,483 | | | | 36,411 | | | | 1,273,888 | | |
Foreign currency
and forward
foreign currency
exchange
contracts | | | 8,711,626 | | | | 1,152 | | | | (804,998 | ) | | | 7,907,780 | | |
| Net realized gain (loss) | | $ | 9,128,220 | | | $ | 1,288,989 | | | $ | (852,236 | ) | | $ | 9,564,973 | | |
Change in unrealized
appreciation
(depreciation) | |
| Investments | | $ | 3,139,820 | | | $ | 534,640 | | | $ | 158,937 | | | $ | 3,833,397 | | |
Financial futures
contracts | | | 396,529 | | | | — | | | | — | | | | 396,529 | | |
| Swap contracts | | | (512,535 | ) | | | (9,192 | ) | | | 32,658 | | | | (489,069 | ) | |
Foreign currency
and forward
foreign currency
exchange contracts | | | 747,108 | | | | 5,620 | | | | (210,107 | ) | | | 542,621 | | |
Net change in unrealized
appreciation
(depreciation) | | $ | 3,770,922 | | | $ | 531,068 | | | $ | (18,512 | ) | | $ | 4,283,478 | | |
13
Eaton Vance Strategic Income Fund as of October 31, 2006
NOTES TO FINANCIAL STATEMENTS CONT'D
9 Stock Split
On October 17, 2005, the Trustees of the Fund approved a 1.2632979-for-1 stock split for Class C shares, effective November 11, 2005. The stock split had no impact on the overall value of a shareholder's investment in the Fund.
10 Recently Issued Accounting Pronouncements
In June 2006, the Financial Accounting Standards Board ("FASB") issued FASB Interpretation No. 48, ("FIN 48") "Accounting for Uncertainty in Income Taxes – an interpretation of FASB Statement No. 109". FIN 48 clarifies the accounting for uncertainty in income taxes recognized in accordance with FASB Statement No. 109, "Accounting for Income Taxes." This interpretation prescribes a recognition threshold and measurement attribute for the financial statement recognition and measurement of a tax position taken or expected to be taken in a tax return. It also provides guidance on de-recognition, classification, interest and penalties, accounting in interim periods, disclosure and transition. FIN 48 is effective for fiscal years beginning after December 15, 2006. Management is currently evaluating the impact of applying the various provisions of FIN 48.
In September 2006, the Financial Accounting Standards Board ("FASB") issued Statement of Financial Accounting Standards No. 157, ("FAS 157") "Fair Value Measurements". FAS 157 defines fair value, establishes a framework for measuring fair value in accordance with generally accepted accounting principles and expands disclosure about fair value measurements. FAS 157 is effective for fiscal years beginning after November 15, 2007. Management is currently evaluating the impact the adoption of FAS 157 will have on the Fund's financial statement disclosures.
14
Eaton Vance Strategic Income Fund as of October 31, 2006
REPORT OF INDEPENDENT REGISTERED PUBLIC ACCOUNTING FIRM
To the Trustees and Shareholders
of Eaton Vance Strategic Income Fund:
In our opinion, the accompanying statement of assets and liabilities, and the related statements of operations and of changes in net assets and the financial highlights present fairly, in all material respects, the financial position of Eaton Vance Strategic Income Fund (the "Fund"), a series of Eaton Vance Mutual Funds Trust, at October 31, 2006, and the results of its operations, the changes in its net assets and the financial highlights for each of the periods indicated, in conformity with accounting principles generally accepted in the United States of America. These financial statements and financial highlights (hereafter referred to as "financial statements") are the responsibility of the Fund's management; our responsibility is to express an opinion on these financial statements based on our audits. We conducted our audits of these financial statements in accordance with standards of the Public Company Accounting Oversigh t Board (United States). Those standards require that we plan and perform the audit to obtain reasonable assurance about whether the financial statements are free of material misstatement. An audit includes examining, on a test basis, evidence supporting the amounts and disclosures in the financial statements, assessing the accounting principles used and significant estimates made by management, and evaluating the overall financial statement presentation. We believe that our audits provide a reasonable basis for our opinion.
PricewaterhouseCoopers LLP
Boston, Massachusetts
December 27, 2006
15
Eaton Vance Strategic Income Fund as of October 31, 2006
FEDERAL TAX INFORMATION
The Form 1099-DIV you receive in January 2007 will show the tax status of all distributions paid to your account in calendar 2006. Shareholders are advised to consult their own tax adviser with respect to the tax consequences of their investment in the Fund.
16
Strategic Income Portfolio as of October 31, 2006
PORTFOLIO OF INVESTMENTS
| Bonds & Notes — 66.2% | |
| Security | | Principal | | U.S. $ Value | |
| Brazil — 0.7% | |
| Nota Do Tesouro Nacional, 10.00%, 1/1/14 | | BRL | 9,627,000 | | | $ | 3,774,432 | | |
| Total Brazil (identified cost $3,623,899) | | | | | | $ | 3,774,432 | | |
| Chile — 0.6% | |
JP Morgan Chilean Inflation Linked Note,
7.433%, 11/17/15(1) | | $ | 3,000,000 | | | $ | 3,221,100 | | |
| Total Chile (identified cost $3,000,000) | | | | | | $ | 3,221,100 | | |
| Colombia — 1.1% | |
| Republic of Colombia, 11.75%, 3/1/10 | | COP | 13,690,000,000 | | | $ | 6,398,942 | | |
| Total Colombia (identified cost $6,465,272) | | | | | | $ | 6,398,942 | | |
| Egypt — 2.9% | |
| Egyptian Treasury Bill, 0.00%, 11/21/06 | | EGP | 16,275,000 | | | $ | 2,824,131 | | |
| Egyptian Treasury Bill, 0.00%, 12/5/06 | | EGP | 16,000,000 | | | | 2,766,493 | | |
| Egyptian Treasury Bill, 0.00%, 12/12/06 | | EGP | 27,200,000 | | | | 4,694,668 | | |
| Egyptian Treasury Bill, 0.00%, 12/26/06 | | EGP | 20,475,000 | | | | 3,521,379 | | |
| Egyptian Treasury Bill, 0.00%, 2/27/07 | | EGP | 15,410,000 | | | | 2,607,850 | | |
| Total Egypt (identified cost $16,439,400) | | | | | | $ | 16,414,521 | | |
| Indonesia — 3.3% | |
| APP Finance VI, 0.00%, 11/18/12(2)(3)(4) | | $ | 4,000,000 | | | $ | 50,000 | | |
| APP Finance VII, 3.50%, 4/30/24(2)(3)(4) | | | 2,000,000 | | | | 50,000 | | |
| Indonesia Recapital, 14.00%, 6/15/09 | | IDR | 76,000,000,000 | | | | 9,182,411 | | |
| Republic of Indonesia, 12.00%, 9/15/11 | | IDR | 80,000,000,000 | | | | 9,405,000 | | |
| Total Indonesia (identified cost $21,666,177) | | | | | | $ | 18,687,411 | | |
| United States — 57.6% | |
| Corporate Bonds & Notes — 0.4% | |
| Baltimore Gas and Electric, 6.73%, 6/12/12 | | $ | 400,000 | | | $ | 420,648 | | |
| BellSouth Capital Funding, 6.04%, 11/15/26 | | | 300,000 | | | | 300,020 | | |
| Security | | Principal | | U.S. $ Value | |
| United States (continued) | |
| Eaton Corp., 8.875%, 6/15/19 | | $ | 500,000 | | | $ | 640,089 | | |
| Ingersoll-Rand Co., 6.48%, 6/1/25 | | | 1,050,000 | | | | 1,147,486 | | |
Total Corporate Bonds & Notes
(identified cost, $2,235,760) | | | | | | $ | 2,508,243 | | |
| Collateralized Mortgage Obligations — 7.6% | |
Federal Home Loan Mortgage Corp.,
Series 1548, Class Z, 7.00%, 7/15/23 | | $ | 982,007 | | | $ | 1,010,213 | | |
Federal Home Loan Mortgage Corp.,
Series 1817, Class Z, 6.50%, 2/15/26 | | | 864,018 | | | | 884,830 | | |
Federal Home Loan Mortgage Corp.,
Series 1927, Class ZA, 6.50%, 1/15/27 | | | 3,271,938 | | | | 3,355,042 | | |
Federal Home Loan Mortgage Corp.,
Series 4, Class D, 8.00%, 12/25/22 | | | 748,302 | | | | 776,308 | | |
Federal National Mortgage Association,
Series 1992-180, Class F, 6.494%, 10/25/22(5) | | | 3,418,657 | | | | 3,525,633 | | |
Federal National Mortgage Association,
Series 1993-104, Class ZB, 6.50%, 7/25/23 | | | 1,052,722 | | | | 1,076,591 | | |
Federal National Mortgage Association,
Series 1993-141, Class Z, 7.00%, 8/25/23 | | | 2,481,705 | | | | 2,580,204 | | |
Federal National Mortgage Association,
Series 1993-16, Class Z, 7.50%, 2/25/23 | | | 3,358,646 | | | | 3,533,256 | | |
Federal National Mortgage Association,
Series 1993-79, Class PL, 7.00%, 6/25/23 | | | 2,300,015 | | | | 2,385,704 | | |
Federal National Mortgage Association,
Series 1994-63, Class PJ, 7.00%, 12/25/23 | | | 4,696,356 | | | | 4,721,095 | | |
Federal National Mortgage Association,
Series 1994-79, Class Z, 7.00%, 4/25/24 | | | 2,996,836 | | | | 3,115,949 | | |
Federal National Mortgage Association,
Series 1994-89, Class ZQ, 8.00%, 7/25/24 | | | 1,924,323 | | | | 2,070,853 | | |
Federal National Mortgage Association,
Series 1996-35, Class Z, 7.00%, 7/25/26 | | | 753,312 | | | | 786,000 | | |
Federal National Mortgage Association,
Series 2000-49, Class A, 8.00%, 3/18/27 | | | 2,451,977 | | | | 2,598,698 | | |
Federal National Mortgage Association,
Series 2001-37, Class GA, 8.00%, 7/25/16 | | | 571,231 | | | | 596,993 | | |
Federal National Mortgage Association,
Series G93-1, Class K, 6.675%, 1/25/23 | | | 3,623,109 | | | | 3,744,615 | | |
Government National Mortgage Association,
Series 2001-35, Class K, 6.45%, 10/26/23 | | | 816,550 | | | | 835,258 | | |
Government National Mortgage Association,
Series 2002-48, Class OC, 6.00%, 9/16/30 | | | 5,000,000 | | | | 5,039,438 | | |
Total Collateralized Mortgage Obligations
(identified cost, $43,780,947) | | | | | | $ | 42,636,680 | | |
See notes to financial statements
17
Strategic Income Portfolio as of October 31, 2006
PORTFOLIO OF INVESTMENTS CONT'D
| Security | | Principal | | U.S. $ Value | |
| United States (continued) | |
| Mortgage Pass-Throughs — 48.3% | |
| Federal Home Loan Mortgage Corp.: | |
| 5.463% with maturity at 2023(6) | | $ | 1,857,189 | | | $ | 1,868,218 | | |
| 6.00% with maturity at 2024 | | | 7,464,934 | | | | 7,606,319 | | |
| 6.50% with various maturities to 2024 | | | 9,114,423 | | | | 9,429,172 | | |
| 7.00% with various maturities to 2024 | | | 3,474,196 | | | | 3,654,639 | | |
| 7.31% with maturity at 2026 | | | 784,032 | | | | 829,158 | | |
| 7.50% with various maturities to 2026 | | | 7,680,666 | | | | 8,206,056 | | |
| 7.95% with maturity at 2022 | | | 919,927 | | | | 993,549 | | |
| 8.00% with various maturities to 2021 | | | 222,944 | | | | 233,573 | | |
| 8.15% with maturity at 2021 | | | 673,905 | | | | 678,788 | | |
| 8.30% with maturity at 2021 | | | 508,568 | | | | 553,514 | | |
| 8.47% with maturity at 2018 | | | 474,170 | | | | 515,198 | | |
| 8.50% with various maturities to 2028 | | | 3,308,041 | | | | 3,634,526 | | |
| 9.00% with various maturities to 2027 | | | 1,912,679 | | | | 2,117,035 | | |
| 9.25% with various maturities to 2016 | | | 227,174 | | | | 232,213 | | |
| 9.50% with various maturities to 2027 | | | 698,720 | | | | 781,497 | | |
| 9.75% with various maturities to 2020 | | | 63,336 | | | | 67,659 | | |
| 10.50% with maturity at 2021 | | | 1,123,543 | | | | 1,283,147 | | |
| 11.00% with maturity at 2016 | | | 1,723,063 | | | | 1,954,430 | | |
| 13.25% with maturity at 2013 | | | 4,042 | | | | 4,528 | | |
| | | $ | 44,643,219 | | |
| Federal National Mortgage Association: | |
| 5.134% with various maturities to 2033(6) | | $ | 43,774,009 | | | $ | 43,790,027 | | |
| 5.32% with maturity at 2035(6) | | | 12,755,177 | | | | 12,756,918 | | |
| 5.34% with various maturities to 2035(6) | | | 88,999,935 | | | | 88,954,873 | | |
| 5.382% with maturity at 2022(6) | | | 4,868,466 | | | | 4,869,530 | | |
| 5.49% with maturity at 2025(6) | | | 3,153,814 | | | | 3,167,598 | | |
| 5.534% with maturity at 2023(6) | | | 666,590 | | | | 676,773 | | |
| 5.69% with maturity at 2024(6) | | | 2,957,648 | | | | 2,985,404 | | |
| 6.322% with maturity at 2032(6) | | | 9,324,852 | | | | 9,496,369 | | |
| 6.50% with various maturities to 2028 | | | 7,198,270 | | | | 7,435,468 | | |
| 6.622% with maturity at 2028(6) | | | 731,984 | | | | 748,368 | | |
| 7.00% with various maturities to 2024 | | | 1,764,358 | | | | 1,845,311 | | |
| 7.50% with various maturities to 2027 | | | 11,294,862 | | | | 11,886,196 | | |
| 8.00% with various maturities to 2028 | | | 13,143,289 | | | | 14,199,062 | | |
| 8.50% with various maturities to 2026 | | | 332,055 | | | | 347,412 | | |
| 8.946% with maturity at 2010 | | | 156,978 | | | | 162,306 | | |
| 9.00% with various maturities to 2024 | | | 1,166,130 | | | | 1,264,470 | | |
| 9.013% with maturity at 2028 | | | 2,013,757 | | | | 2,214,603 | | |
| 9.50% with various maturities to 2030 | | | 2,725,455 | | | | 3,048,893 | | |
| | | $ | 209,849,581 | | |
| Government National Mortgage Association: | |
| 5.125% with maturity at 2024(6) | | $ | 1,338,795 | | | $ | 1,364,866 | | |
| 7.00% with various maturities to 2024 | | | 3,418,716 | | | | 3,597,573 | | |
| 7.50% with various maturities to 2028 | | | 4,254,006 | | | | 4,543,789 | | |
| 7.75% with maturity at 2019 | | | 47,724 | | | | 51,203 | | |
| Security | | Principal | | U.S. $ Value | |
| United States (continued) | |
| 8.00% with various maturities to 2023 | | $ | 1,664,532 | | | $ | 1,801,695 | | |
| 8.30% with various maturities to 2020 | | | 418,687 | | | | 453,320 | | |
| 8.50% with various maturities to 2021 | | | 319,230 | | | | 346,353 | | |
| 9.00% with various maturities to 2025 | | | 1,242,546 | | | | 1,374,207 | | |
| 9.50% with various maturities to 2026 | | | 3,728,870 | | | | 4,210,560 | | |
| | | $ | 17,743,566 | | |
Total Mortgage Pass-Throughs
(identified cost, $273,440,906) | | | | | | $ | 272,236,366 | | |
| Auction Rate Certificates — 0.9% | |
Colorado Educational and Cultural Facilities Authority,
(The Nature Conservancy), Variable Rate Demand Note,
5.30%, 7/1/33(6) | | $ | 2,575,000 | | | $ | 2,575,000 | | |
Colorado Educational and Cultural Facilities Authority,
(The Nature Conservancy), Variable Rate Demand Note,
5.40%, 7/1/32(6) | | | 2,425,000 | | | | 2,425,000 | | |
Total Auction Rate Certificates
(identified cost, $5,000,000) | | | | | | $ | 5,000,000 | | |
| U.S. Treasury Obligations — 0.4% | |
United States Treasury Bond,
7.875%, 2/15/21(7)—
(identified cost, $1,814,074) | | $ | 1,500,000 | | | $ | 1,975,196 | | |
Total United States
(identified cost $326,271,687) | | | | | | $ | 324,356,485 | | |
Total Bonds & Notes
(identified cost, $377,466,435) | | | | | | $ | 372,852,891 | | |
| Common Stocks — 0.2% | |
| Security | | Shares | | Value | |
| China — 0.2% | |
| Commercial Banks — 0.2% | |
| Industrial and Commercial Bank of China(2) | | | 2,191,752 | | | HKD | 980,341 | | |
| | | | | | | | 980,341 | | |
| Total China (identified cost $873,015) | | | | | | | 980,341 | | |
See notes to financial statements
18
Strategic Income Portfolio as of October 31, 2006
PORTFOLIO OF INVESTMENTS CONT'D
| Security | | Shares | | Value | |
| Indonesia — 0.0% | |
| Business Services — 0.0% | |
| APP China(2) | | | 8,155 | | | $ | 326,200 | | |
| | | $ | 326,200 | | |
| Total Indonesia (identified cost $1,522,635) | | | | | | $ | 326,200 | | |
Total Common Stocks
(identified cost $2,395,650) | | | | | | $ | 1,306,541 | | |
| Short-Term Investments — 33.5% | |
| Security | | Principal | | Value | |
Bavaria TRR Corp., Commercial Paper,
5.27%, 11/1/06 | | $ | 22,000,000 | | | $ | 22,000,000 | | |
Golden Fish, LLC, Commercial Paper,
5.29%, 11/20/06 | | | 25,000,000 | | | | 24,930,201 | | |
Investors Bank and Trust Company Time Deposit,
5.31%, 11/1/06 | | | 578,711 | | | | 578,711 | | |
Investors Bank and Trust Company Time Deposit,
5.31%, 11/1/06(8) | | | 31,405,000 | | | | 31,405,000 | | |
La Fayette Asset Securitization, LLC, Commercial Paper,
5.28%, 11/14/06 | | | 20,000,000 | | | | 19,961,866 | | |
| Polonius Inc., Commercial Paper, 5.28%, 11/16/06 | | | 20,000,000 | | | | 19,956,000 | | |
Rhineland Funding Capital Corp., Commercial Paper,
5.30%, 11/3/06 | | | 20,000,000 | | | | 19,994,111 | | |
Starbird Funding Corp., Commercial Paper,
5.27%, 11/7/06 | | | 25,000,000 | | | | 24,978,042 | | |
World Omni Vehicles Leasing, Commercial Paper,
5.29%, 11/8/06 | | | 25,000,000 | | | | 24,974,285 | | |
Total Short-Term Investments
(at amortized cost, $188,778,216) | | | | | | $ | 188,778,216 | | |
| Call Options Purchased — 0.4% | |
| Security | | Principal
Amount
(000's omitted) | | Value | |
Euro Call Option, Expires 10/02/2008,
Strike Price 1.2738(9) | | $ | 800 | | | $ | 49,525 | | |
Euro Call Option, Expires 10/14/2008,
Strike Price 1.2950(9) | | | 800 | | | | 41,333 | | |
Euro Call Option, Expires 10/20/2008,
Strike Price 1.2990(9) | | | 800 | | | | 40,050 | | |
Euro Call Option, Expires 10/30/2008,
Strike Price 1.3155(9) | | | 800 | | | | 34,778 | | |
Kospi 200 Index, Expires 3/12/07,
Strike Price 143.946 | | | 37,083 | | | | 1,255,753 | | |
| Call Options Purchased (continued) | |
| Security | | Principal
Amount
(000's omitted) | | Value | |
Taiwan SE Index, Expires 3/12/07,
Strike Price 6808.125 | | $ | 32 | | | $ | 401,874 | | |
Total Call Options Purchased
(identified cost, $808,350) | | | | | | $ | 1,823,313 | | |
| Put Options Purchased — 0.0% | |
| Security | | Principal
Amount
(000's omitted) | | Value | |
Euro Put Option, Expires 10/02/2008,
Strike Price 1.2738(9) | | $ | 800 | | | $ | 25,818 | | |
Euro Put Option, Expires 10/14/2008,
Strike Price 1.2950(9) | | | 800 | | | | 32,847 | | |
Euro Put Option, Expires 10/20/2008,
Strike Price 1.2990(9) | | | 800 | | | | 34,346 | | |
Euro Put Option, Expires 10/30/2008,
Strike Price 1.3155(9) | | | 800 | | | | 40,732 | | |
Total Put Options Purchased
(identified cost, $166,880) | | | | | | $ | 133,743 | | |
Total Investments — 100.3%
(identified cost $569,615,531) | | | | | | $ | 564,894,704 | | |
| Other Assets, Less Liabilities — (0.3)% | | | | | | $ | (1,668,866 | ) | |
| Net Assets — 100.0% | | | | | | $ | 563,225,838 | | |
BRL - Brazilian Real
COP - Colombian Peso
EGP - Egyptian Pound
HKD - Hong Kong Dollar
IDR - Indonesian Rupiah
(1) Security pays 3.8% coupon and accrues principal based on annual increases in the Chilean UF Rate, for an effective yield of 7.433%.
(2) Non-income producing security.
(3) Convertible bond.
(4) Defaulted security.
(5) Floating-Rate.
(6) Adjustable rate securities. Rates shown are the rates at period end.
(7) Security (or a portion thereof) has been segregated to cover margin requirements on open financial futures contracts.
(8) Security (or a portion thereof) has been segregated to cover swap contracts.
(9) Security valued at fair value using methods determined in good faith by or at the direction of the Trustees.
See notes to financial statements
19
Strategic Income Portfolio as of October 31, 2006
FINANCIAL STATEMENTS CONT'D
Statement of Assets and Liabilities
As of October 31, 2006
| Assets | |
| Investments, at value (identified cost, $569,615,531) | | $ | 564,894,704 | | |
| Cash | | | 870 | | |
| Receivable for investments sold | | | 399,371 | | |
| Interest receivable | | | 2,890,657 | | |
| Receivable for daily variation margin on open financial futures contracts | | | 493,688 | | |
| Receivable for open forward foreign currency contracts | | | 1,949,700 | | |
| Receivable for open swap contracts | | | 718,352 | | |
| Total assets | | $ | 571,347,342 | | |
| Liabilities | |
| Payable for investments purchased | | $ | 3,525,592 | | |
| Payable for open swap contracts | | | 2,751,968 | | |
| Payable for open forward foreign currency contracts | | | 1,419,839 | | |
| Payable for options purchased | | | 78,530 | | |
| Payable to affiliate for investment advisory fees | | | 220,246 | | |
| Payable to affiliate for administration fees | | | 72,020 | | |
| Payable to affiliate for Trustees' fees | | | 1,629 | | |
| Accrued expenses | | | 51,680 | | |
| Total liabilities | | $ | 8,121,504 | | |
| Net Assets applicable to investors' interest in Portfolio | | $ | 563,225,838 | | |
| Sources of Net Assets | |
| Net proceeds from capital contributions and withdrawals | | $ | 568,340,173 | | |
| Net unrealized depreciation (computed on the basis of identified cost) | | | (5,114,335 | ) | |
| Total | | $ | 563,225,838 | | |
Statement of Operations
For the Year Ended
October 31, 2006
| Investment Income | |
| Interest (net of foreign taxes, $52,362) | | $ | 25,189,818 | | |
| Dividends | | | 27,396 | | |
| Total investment income | | $ | 25,217,214 | | |
| Expenses | |
| Investment adviser fee | | $ | 2,172,996 | | |
| Administration fee | | | 732,529 | | |
| Trustees' fees and expenses | | | 20,040 | | |
| Custodian fee | | | 173,095 | | |
| Legal and accounting services | | | 131,482 | | |
| Miscellaneous | | | 20,043 | | |
| Total expenses | | $ | 3,250,185 | | |
Deduct —
Reduction of custodian fee | | $ | 2,126 | | |
| Total expense reductions | | $ | 2,126 | | |
| Net expenses | | $ | 3,248,059 | | |
| Net investment income | | $ | 21,969,155 | | |
| Realized and Unrealized Gain (Loss) | |
Net realized gain (loss) —
Investment transactions (identified cost basis) | | $ | (2,390,296 | ) | |
| Financial futures contracts | | | 1,634,027 | | |
| Swap contracts | | | 1,207,227 | | |
Foreign currency and forward foreign currency exchange contract
transactions | | | 9,182,615 | | |
| Net realized gain | | $ | 9,633,573 | | |
Change in unrealized appreciation (depreciation) —
Investments (identified cost basis) | | $ | 3,432,128 | | |
| Financial futures contracts | | | 448,501 | | |
| Swap contracts | | | (613,963 | ) | |
| Foreign currency and forward foreign currency exchange contracts | | | 729,936 | | |
| Net change in unrealized appreciation (depreciation) | | $ | 3,996,602 | | |
| Net realized and unrealized gain | | $ | 13,630,175 | | |
| Net increase in net assets from operations | | $ | 35,599,330 | | |
See notes to financial statements
20
Strategic Income Portfolio as of October 31, 2006
FINANCIAL STATEMENTS CONT'D
Statements of Changes in Net Assets
Increase (Decrease)
in Net Assets | | Year Ended
October 31, 2006 | | Year Ended
October 31, 2005 | |
From operations —
Net investment income | | $ | 21,969,155 | | | $ | 12,219,840 | | |
Net realized gain from investments,
financial futures contracts, swap
contracts, and foreign currency,
and forward foreign currency
exchange contract transactions | | | 9,633,573 | | | | 16,473,681 | | |
Net change in unrealized appreciation
(depreciation) from investments,
financial futures contracts, swap
contracts, and foreign currency and
forward foreign currency exchange
contracts | | | 3,996,602 | | | | (6,003,853 | ) | |
| Net increase in net assets from operations | | $ | 35,599,330 | | | $ | 22,689,668 | | |
Capital transactions —
Contributions | | $ | 547,451,590 | | | $ | 258,350,420 | | |
| Withdrawals | | | (430,504,785 | ) | | | (194,304,717 | ) | |
Net increase in net assets from
capital transactions | | $ | 116,946,805 | | | $ | 64,045,703 | | |
| Net increase in net assets | | $ | 152,546,135 | | | $ | 86,735,371 | | |
| Net Assets | |
| At beginning of year | | $ | 410,679,703 | | | $ | 323,944,332 | | |
| At end of year | | $ | 563,225,838 | | | $ | 410,679,703 | | |
See notes to financial statements
21
Strategic Income Portfolio as of October 31, 2006
FINANCIAL STATEMENTS CONT'D
Supplementary Data
| | | Year Ended October 31, | |
| | | 2006 | | 2005 | | 2004 | | 2003 | | 2002(1) | |
| Ratios/Supplemental Data | |
| Ratios (As a percentage of average daily net assets): | |
| Expenses before custodian fee reduction | | | 0.66 | % | | | 0.66 | % | | | 0.68 | % | | | 0.71 | % | | | 0.77 | % | |
| Expenses after custodian fee reduction | | | 0.66 | % | | | 0.66 | % | | | 0.68 | % | | | 0.71 | % | | | 0.77 | % | |
| Net investment income | | | 4.49 | % | | | 3.23 | % | | | 3.10 | % | | | 3.36 | % | | | 5.88 | % | |
| Portfolio Turnover | | | 41 | % | | | 59 | % | | | 55 | % | | | 71 | % | | | 63 | % | |
| Total Return | | | 7.60 | % | | | 6.48 | % | | | 6.97 | % | | | 12.97 | % | | | 5.25 | % | |
| Net assets, end of year (000's omitted) | | $ | 563,226 | | | $ | 410,680 | | | $ | 323,944 | | | $ | 277,081 | | | $ | 190,453 | | |
(1) The Portfolio adopted the provisions of the AICPA Audit and Accounting Guide for Investment Companies and began amortizing market premiums on fixed-income securities, excluding mortgage-backed securities, and accreting certain discounts using a different methodology. Additionally, the Portfolio reclassified net losses realized on prepayments received on mortgage-backed securities that were previously included in realized gains/losses to interest income. The effect of these changes for the year ended October 31, 2002 was a decrease in the ratio of net investment income to average net assets from 7.32% to 5.88%.
See notes to financial statements
22
Strategic Income Portfolio as of October 31, 2006
NOTES TO FINANCIAL STATEMENTS
1 Significant Accounting Policies
Strategic Income Portfolio (the Portfolio) is registered under the Investment Company Act of 1940 as an open-end investment company. The Portfolio was organized as a trust under the laws of the State of New York in 1992. The Portfolio's investment objective is to provide a high level of income and total return by investing in a global portfolio consisting primarily of high grade debt securities. The Declaration of Trust permits the Trustees to issue beneficial interests in the Portfolio. At October 31, 2006, Eaton Vance Strategic Income Fund and Eaton Vance Medallion Strategic Income Fund held an approximate 87.9% and 12.1% interest in the Portfolio, respectively. The following is a summary of significant accounting policies of the Portfolio. The policies are in conformity with accounting principles generally accepted in the United States of America.
A Investment Valuation — Most seasoned mortgage backed securities ("MBS") are valued by the investment adviser's matrix pricing system. The matrix pricing system also considers various factors relating to bonds and market transactions to determine market value. Debt securities (other than short-term obligations maturing in sixty days or less but including collateralized mortgage obligations and certain MBS), including listed securities and securities for which price quotations are available and forward contracts, will normally be valued on the basis of market valuations furnished by pricing services. The pricing services consider various factors relating to bonds or loans and/or market transactions to determine market value. Marketable securities that are listed on foreig n or U.S. securities exchanges are valued at closing sale prices on the exchange where such securities are principally traded. Marketable securities listed in the NASDAQ National Market System are valued at the NASDAQ official closing price. Unlisted or listed securities for which closing sale prices are not available are valued at the mean between the latest available bid and ask prices. When valuing foreign investments that meet certain criteria, the Trustees have approved the use of a fair value service that values such securities to reflect market trading that occurs after the close of the applicable foreign markets of comparable or other instruments that have strong correlation to the fair-valued securities. Financial futures contracts and options thereon listed on commodity exchanges and exchange-traded options are valued at closing settlement prices. Short-term obligations and money-market securities maturing in sixty days or less are valued at amortized cost which approximates value. If short-term de bt securities are acquired with a remaining maturity of more than sixty days, they will be valued by a pricing service. Non-U.S. dollar denominated short-term obligations are valued at amortized cost as calculated in the base currency and translated to U.S. dollars at the current exchange rate. Investments for which market quotations are unavailable and investments for which the price of the security is not believed to represent its fair market value, are valued at fair value using methods determined in good faith by or at the direction of the Trustees.
B Income — Interest income is determined on the basis of interest accrued, adjusted for amortization of premium or accretion of discount. Dividend income is recorded on the ex-dividend date for dividends received in cash and/or securities. However, if the ex-dividend date has passed, certain dividends from foreign securities are recorded as the Portfolio is informed of the ex-dividend date.
C Federal Taxes — The Portfolio has elected to be treated as a partnership for federal tax purposes. No provision is made by the Portfolio for federal or state taxes on any taxable income of the Portfolio because each investor in the Portfolio is ultimately responsible for the payment of any taxes on its share of taxable income. Since at least one of the Portfolio's investors is a regulated investment company that invests all or substantially all of its assets in the Portfolio, the Portfolio normally must satisfy the applicable source of income and diversification requirements (under the Internal Revenue Code) in order for its investors to satisfy them. The Portfolio will allocate, at least annually among its investors, each investor's distributive share of the Portfolio' s net investment income, net realized capital gains, and any other items of income, gain, loss, deduction or credit.
D Financial Futures Contracts — Upon entering into a financial futures contract, the Portfolio is required to deposit an amount (initial margin), either in cash or securities, equal to a certain percentage of the purchase price indicated in the financial futures contract. Subsequent payments are made or received by the Portfolio (variation margin) each day, dependent on the daily fluctuations in the value of the underlying security, and are recorded for book purposes as unrealized gains or losses by the Portfolio. The Portfolio's investment in financial futures contracts is designed for both hedging against anticipated future changes in interest or currency exchange rates and investment purposes. Should interest or currency exchange rates move unexpectedly, the Portfolio may not achieve the anticipated benefits of the financial futures contracts and may realize a loss. If the Portfolio enters into a closing transaction, the Portfolio will realize, for book purposes, a gain or loss equal to the
23
Strategic Income Portfolio as of October 31, 2006
NOTES TO FINANCIAL STATEMENTS CONT'D
difference between the value of the financial futures contract to sell and financial futures contract to buy.
E When-Issued and Delayed Delivery Transactions — The Portfolio may engage in when-issued and delayed delivery transactions. The Portfolio records when-issued securities on trade date and maintains security positions such that sufficient liquid assets will be available to make payments for the securities purchased. Securities purchased on a when-issued or delayed delivery basis are marked-to-market daily and begin earning interest on settlement date.
F Foreign Currency Translation — Investment valuations, other assets, and liabilities initially expressed in foreign currencies are converted each business day into U.S. dollars based upon current exchange rates. Purchases and sales of foreign investment securities and income and expenses are converted into U.S. dollars based upon currency exchange rates prevailing on the respective dates of such transactions. Recognized gains or losses on investment transactions attributable to changes in foreign currency exchange rates are recorded for financial statement purposes as net realized gains and losses on investments. That portion of unrealized gains and losses on investments that results from fluctuations in foreign currency exchange rates is not separately disclosed.
G Written Options — The Portfolio may write call or put options for which premiums are received and are recorded as liabilities, and are subsequently adjusted to the current value of the options written. Premiums received from writing options which expire are treated as realized gains. Premiums received from writing options which are exercised or closed are offset against the proceeds or amount paid on the transaction to determine the realized gain or loss. If a put option is exercised, the premium reduces the cost basis of the securities purchased by the Portfolio. The Portfolio as writer of an option may have no control over whether the underlying securities may be sold (call) or purchased (put) and as a result bears the market risk of an unfavorable change in the price of the securities underlying the written option.
H Purchased Options — Upon the purchase of a call or put option, the premium paid by the Portfolio is included in the Statement of Assets and Liabilities as an investment. The amount of the investment is subsequently marked-to-market to reflect the current market value of the option purchased, in accordance with the Portfolio's policies on investment valuations discussed above. If an option which the Portfolio has purchased expires on the stipulated expiration date, the Portfolio will realize a loss in the amount of the cost of the option. If the Portfolio enters into a closing sale transaction, the Portfolio will realize a gain or loss, depending on whether the sales proceeds from the closing sale tr ansaction are greater or less than the cost of the option. If a Portfolio exercises a put option, it will realize a gain or loss from the sale of the underlying security, and the proceeds from such sale will be decreased by the premium originally paid. If the Portfolio exercises a call option, the cost of the security which the Portfolio purchases upon exercise will be increased by the premium originally paid.
I Forward Foreign Currency Exchange Contracts — The Portfolio may enter into forward foreign currency exchange contracts for the purchase or sale of a specific foreign currency at a fixed price on a future date. Risks may arise upon entering these contracts from the potential inability of counterparties to meet the terms of their contracts and from movements in the value of a foreign currency relative to the U.S. dollar. The Portfolio will enter into forward contracts for hedging purposes as well as non-hedging purposes. The forward foreign currency exchange contracts are adjusted by the daily exchange rate of the underlying currency and any gains or losses are recorded for financial statement purposes as unrealized until such time as the contracts have been closed.
J Reverse Repurchase Agreements — The Portfolio may enter into reverse repurchase agreements. Under such an agreement, the Portfolio temporarily transfers possession, but not ownership, of a security to a counterparty, in return for cash. At the same time, the Portfolio agrees to repurchase the security at an agreed-upon price and time in the future. The Portfolio may enter into reverse repurchase agreements for temporary purposes, such as to fund withdrawals, or for use as hedging instruments where the underlying security is denominated in a foreign currency. As a form of leverage, reverse repurchase agreements may increase the risk of fluctuation in the market value of the Portfolio's assets or in its yield. Liabilities to counterparties under reverse repurchase agreeme nts are recognized in the Statement of Assets and Liabilities at the same time at which cash is received by the Portfolio. The securities underlying such agreements continue to be treated as owned by the Portfolio and remain in the Portfolio of Investments. Interest charged on amounts borrowed by the Portfolio under reverse repurchase agreements is accrued daily.
24
Strategic Income Portfolio as of October 31, 2006
NOTES TO FINANCIAL STATEMENTS CONT'D
K Total Return Swaps — The Portfolio may enter into swap agreements to enhance return, to hedge against fluctuations in securities prices or interest rates or as substitution for the purchase or sale of securities. In a total return swap, the Portfolio makes payments at a rate equal to a predetermined spread to the one or three-month LIBOR. In exchange, the Portfolio receives payments based on the rate of return of a benchmark industry index or basket of securities. During the term of the outstanding swap agreement, changes in the underlying value of the swap are recorded as unrealized gains and losses. Periodic payments received or made are recorded as realized gains or losses. The value of the swap is determined by changes in the relationship between the rate of interes t and the benchmark industry index or basket of securities. The Portfolio is exposed to credit loss in the event of nonperformance by the swap counterparty. However, the Portfolio does not anticipate nonperformance by the counterparty. Risk may also arise from the unanticipated movements in value of interest rates, securities, or the index.
L Interest Rate Swaps — The Portfolio may enter into interest rate swap agreements for risk management purposes and not as a speculative investment. Pursuant to these agreements the Portfolio receives quarterly payments at a rate equal to a predetermined three-month London Interbank Offering Rate (LIBOR). In exchange, the Portfolio makes semi-annual payments at a predetermined fixed rate of interest. During the term of the outstanding swap agreement, changes in the underlying value of the swap are recorded as unrealized gains and losses. The value of the swap is determined by changes in the relationship between two rates of interest. The Portfolio is exposed to credit loss in the event of non-performance by the swap counterparty. The Portfolio does not anticipate non-perf ormance by the counterparty. Risk may also arise from the unanticipated movements in value of interest rates.
M Credit Default Swaps — The Portfolio may enter into credit default swaps to buy or sell credit protection on an individual issuer or a basket of issuers of bonds. When the Portfolio is the buyer of a credit default swap contract, the Portfolio is entitled to receive the par or other agreed-upon value, of a referenced debt obligation from the counterparty to the contract in the event of a default by a third party, such as a U.S. or foreign corporate issuer, on the debt obligation. In return, the Portfolio would pay the counterparty a periodic stream of payments over the term of the contract provided that no event of default has occurred. If no default occurs, the Portfolio would have spent the stream of payments and received no benefit from the contract. When the Portfolio is the seller of a credit default swap contract, it receives the stream of payments, but is obligated to pay upon default of the referenced debt obligation. As the seller, the Portfolio would effectively add leverage to its portfolio because, in addition to its total net assets, the Portfolio would be subject to investment exposure on the notional amount of the swap. During the period that the credit default swap contract is open, the contract is marked to market in accordance with the terms of the contract based on the current interest rate spreads and credit risk of the referred obligation of the underlying issuer and interest accrual through valuation date. Changes in the value of credit default swap contracts are recorded as unrealized gains or losses and periodic cash settlements are recorded as realized gains or losses. The Portfolio will segregate assets in the form of cash and cash equivalents in an amount equal to the aggrega te market value of the credit default swaps of which it is the seller, marked to market on a daily basis. These transactions involve certain risks, including the risk that the seller may be unable to fulfill the transaction.
N Expense Reduction — Investors Bank & Trust Company (IBT) serves as custodian of the Portfolio. Pursuant to the custodian agreement, IBT receives a fee reduced by credits which are determined based on the average daily cash balance the Portfolio maintains with IBT. All credit balances used to reduce the Portfolio's custodian fees are reported as a reduction of expenses in the Statement of Operations.
O Use of Estimates — The preparation of the financial statements in conformity with accounting principles generally accepted in the United States of America requires management to make estimates and assumptions that affect the reported amounts of assets and liabilities at the date of the financial statements and the reported amounts of income and expense during the reporting period. Actual results could differ from those estimates.
P Other — Investment transactions are accounted for on the date the securities are purchased or sold. Realized gains and losses on securities sold are determined on the basis of identified cost.
Q Indemnifications — Under the Portfolio's organizational documents, its officers and Trustees may be indemnified against certain liabilities and expenses arising out of the performance of their duties to the Portfolio. Interestholders in the Portfolio are jointly and severally liable for the liabilities and obligations of the
25
Strategic Income Portfolio as of October 31, 2006
NOTES TO FINANCIAL STATEMENTS CONT'D
Portfolio in the event that the Portfolio fails to satisfy such liabilities and obligations; provided, however, that, to the extent assets are available in the Portfolio, the Portfolio may, under certain circumstances, indemnify interestholders from and against any claim or liability to which such holder may become subject by reason of being or having been an interestholder in the Portfolio. Additionally, in the normal course of business, the Portfolio enters into agreements with service providers that may contain indemnification clauses. The Portfolio's maximum exposure under these arrangements is unknown as this would involve future claims that may be made against the Portfolio that have not yet occurred.
2 Investment Adviser Fee and Other Transactions with Affiliates
The investment adviser fee is earned by Boston Management and Research (BMR), a wholly-owned subsidiary of Eaton Vance Management (EVM), as compensation for management and investment advisory services rendered to the Portfolio. The fee is based upon a percentage of average daily net assets (0.275% annually up to $500 million of average net assets) plus a percentage of gross income (i.e., income other than gains from the sale of investments and paydown gains/losses). Such percentages are reduced as average daily net assets and gross income exceed certain levels. For the year ended October 31, 2006, the fee was equivalent to 0.44% of the Portfolio's average net assets for such period and amounted to $2,172,996. An administration fee, computed at an effective annual rate of 0.15% of average daily net assets was also paid to BMR for administrative services and office facilities. Such fee amounted to $732,529 for the year ended Octob er 31, 2006.
Except as to Trustees of the Portfolio who are not members of EVM's or BMR's organization, officers and Trustees receive remuneration for their services to the Portfolio out of such investment adviser fee. Trustees of the Portfolio that are not affiliated with the Investment Adviser may elect to defer receipt of all or a portion of their annual fees in accordance with the terms of the Trustees Deferred Compensation Plan. For the year ended October 31, 2006, no significant amounts have been deferred. Certain officers and Trustees of the Portfolio are officers of the above organizations.
3 Line of Credit
The Portfolio participates with other portfolios and funds managed by BMR or EVM and its affiliates in a $150 million unsecured line of credit agreement with a group of banks. Borrowings will be made by the Portfolio solely to facilitate the handling of unusual and/or unanticipated short-term cash requirements. Interest is charged to each portfolio or fund based on its borrowings at an amount above the Eurodollar rate or Federal Funds rate. In addition, a fee computed at an annual rate of 0.10% on the daily unused portion of the line of credit is allocated among the participating portfolios and funds at the end of each quarter. The Portfolio did not have any significant borrowings or allocated fees during the year ended October 31, 2006.
4 Investment Transactions
The Portfolio invests primarily in foreign government and U.S. Government debt securities. The ability of the issuers of the debt securities to meet their obligations may be affected by economic developments in a specific industry or country. The Portfolio regularly invests in lower rated and comparable quality unrated high yield securities. These investments have different risks than investments in debt securities rated investment grade and held by the Portfolio. Risk of loss upon default by the borrower is significantly greater with respect to such debt securities than with other debt securities because these securities are generally unsecured and are more sensitive to adverse economic conditions, such as recession or increasing interest rates, than are investment grade issuers. At October 31, 2006, the Portfolio had invested approximately 8.04% of its net assets or approximately $45,275,000 in high yield securities. Purchases and sales of investments, other than short-term obligations, and including paydowns on mortgage backed securities, for the year ended October 31, 2006 were as follows:
| Purchases | |
| Investments (non-U.S. Government) | | $ | 28,413,752 | | |
| U.S. Government Securities | | | 133,483,759 | | |
| | | $ | 161,897,511 | | |
| Sales | |
| Investments (non-U.S. Government) | | $ | 86,559,364 | | |
| U.S. Government Securities | | | 130,750,665 | | |
| | | $ | 217,310,029 | | |
26
Strategic Income Portfolio as of October 31, 2006
NOTES TO FINANCIAL STATEMENTS CONT'D
5 Financial Instruments
The Portfolio may trade in financial instruments with off-balance sheet risk in the normal course of its investing activities and to assist in managing exposure to various market risks. These financial instruments include written options, forward foreign currency exchange contracts, financial futures contracts and swaps and may involve, to a varying degree, elements of risk in excess of the amounts recognized for financial statement purposes. The notional or contractual amounts of these instruments represent the investment the Portfolio has in particular classes of financial instruments and does not necessarily represent the amounts potentially subject to risk. The measurement of the risks associated with these instruments is meaningful only when all related and offsetting transactions are considered. As of October 31, 2006, the Portfolio had sufficient cash and/or securities to cover potential obligations arising from forward c ontracts, swap contracts, open futures as well as margin requirements on open futures contracts. A summary of obligations under these financial instruments at October 31, 2006 is as follows:
Forward Foreign Currency Exchange Contracts
| Sales | |
Settlement
Date(s) | | Deliver | | In exchange for | | Net Unrealized
Appreciation
(Depreciation) | |
| 11/03/06 | | Brazilian Real
12,800,000 | | United States Dollar
5,967,366 | | $ | (19,538 | ) | |
| 11/10/06 | | Canadian Dollar
8,500,000 | | United States Dollar
7,538,803 | | (49,425) | |
| 11/02/06 | | Serbian Dinar
171,000,000 | | Euro
2,164,557 | | (8,743) | |
| 11/02/06 | | Euro
50,706 | | United States Dollar
64,720 | | 3 | |
| 11/16/06 | | Japanese Yen
1,100,000,000 | | United States Dollar
9,439,467 | | 32,154 | |
| 11/14/06 | | New Zealand Dollar
13,823,278 | | Australian Dollar
11,900,000 | | (42,750) | |
| 01/08/07 | | Thai Bhat
338,000,000 | | United States Dollar
8,963,140 | | (246,251) | |
| | | | | | | $ | (334,550 | ) | |
| Purchases | |
Settlement
Date(s) | | In exchange for | | Deliver | | Net Unrealized
Appreciation
(Depreciation) | |
| 11/03/06 | | Brazilian Real
12,800,000 | | United States Dollar
5,824,006 | | $162,898 | |
| 12/04/06 | | Brazilian Real
12,800,000 | | United States Dollar
5,933,068 | | 19,590 | |
| 11/02/06 | | Serbian Dinar
171,000,000 | | Euro
2,113,851 | | 73,461 | |
| 11/14/06 | | Serbian Dinar
115,000,000 | | Euro
1,432,397 | | 34,436 | |
| 11/16/06 | | Serbian Dinar
171,000,000 | | Euro
2,159,909 | | 12,596 | |
| 11/06/06 | | Egyptian Pound
20,219,267 | | United States Dollar
3,532,058 | | (7,634) | |
| 11/03/06 | | Indonesian Rupiah
75,000,000,000 | | United States Dollar
8,109,862 | | 120,591 | |
| 11/03/06 | | Indian Rupee
410,000,000 | | United States Dollar
8,926,627 | | 177,700 | |
| 11/09/06 | | Icelandic Kroner
812,296,000 | | Euro
9,421,196 | | (38,969) | |
| 11/27/06 | | Icelandic Kroner
773,754,000 | | Euro
8,925,219 | | (35,742) | |
| 11/28/06 | | Kazakhstan Tenge
354,300,000 | | United States Dollar
2,777,734 | | (4,104) | |
| 08/03/07 | | Kazakhstan Tenge
163,000,000 | | United States Dollar
1,376,689 | | (98,936) | |
| 11/09/06 | | Mexican Peso
86,070,000 | | United States Dollar
7,950,819 | | 44,594 | |
| 11/21/06 | | Mexican Peso
62,200,000 | | United States Dollar
5,739,967 | | 34,821 | |
| 11/10/06 | | Malaysian Ringgit
52,900,000 | | United States Dollar
14,421,242 | | 67,542 | |
| 11/13/06 | | Malaysian Ringgit
43,200,000 | | United States Dollar
11,711,126 | | 122,627 | |
| 12/01/06 | | Malaysian Ringgit
41,000,000 | | United States Dollar
11,185,377 | | 55,430 | |
| 11/03/06 | | Phillippines Peso
563,800,000 | | United States Dollar
11,305,847 | | 6,352 | |
| 12/01/06 | | Phillippines Peso
562,000,000 | | United States Dollar
11,235,730 | | 21,584 | |
| 11/03/06 | | Romanian Leu
27,425,000 | | Euro
7,777,715 | | 25,385 | |
27
Strategic Income Portfolio as of October 31, 2006
NOTES TO FINANCIAL STATEMENTS CONT'D
Settlement
Date(s) | | In exchange for | | Deliver | | Net Unrealized
Appreciation
(Depreciation) | |
| 11/13/06 | | Romanian Leu
24,100,000 | | Euro
6,825,262 | | $21,833 | |
| 11/20/06 | | Romanian Leu
35,652,000 | | Euro
10,136,686 | | (31,603) | |
| 11/03/06 | | Singapore Dollar
12,300,000 | | United States Dollar
7,809,028 | | 90,380 | |
| 11/02/06 | | Turkish Lira
3,415,000 | | United States Dollar
2,332,332 | | 7,446 | |
| 11/03/06 | | Turkish Lira
9,500,000 | | United States Dollar
6,474,036 | | 32,454 | |
| 11/30/06 | | Turkish Lira
9,723,000 | | United States Dollar
6,643,662 | | (50,321) | |
| | | | | | | $ | 864,411 | | |
| Futures Contracts | |
Expiration
Date(s) | | Contracts | | Position | | Aggregate
Cost | | Value | | Net
Unrealized
Appreciation | |
| 12/06 | | 80 Nikkei
225 | | Long | | $ | 6,514,000 | | | $ | 6,546,000 | | | $ | 32,000 | | |
| 12/06 | | 1,653 U.S.
10 Year
Treasury Note | | Long | | | 177,273,322 | | | | 178,885,594 | | | | 1,612,272 | | |
| 12/06 | | 46 Japan
10 Year Bond | | Short | | | (53,098,411 | ) | | | (53,255,468 | ) | | | (157,057 | ) | |
| 12/06 | | 165 FTSE/
JSE Africa
Top 40 Index | | Short | | | (4,483,198 | ) | | | (4,838,074 | ) | | | (354,876 | ) | |
| | | $ | 1,132,339 | | |
Descriptions of the underlying instruments to Futures Contracts: Nikkei 225: The Nikkei 225 Stock Average is a price-weighted average of 225 top-rated Japanese companies listed in the First Section of the Tokyo Stock Exchange. Japan 10 Year Bond: Japanese Government Bonds (JGB) having a maturity of 7 years or more but less than 11 years. FTSE/JSE Africa Top 40 Index: Index designed to reflect the overall performance of the stocks of the largest companies on the JSE. The index is Co-owned and Co-managed by JSE and FTSE.
Interest Rate Swaps
As of October 31, 2006, the Portfolio had entered into an interest rate swap with JPMorgan Chase Bank N.A. whereby the Portfolio makes a payment every 28 days at a rate equal to the MXN-TIIE-BANXICO on the notional amount of 45,500,000 MXN. In exchange, the Portfolio receives payments every 28 days at a fixed rate equal to 9.870% on the same notional amount. The effective date of the interest rate swap is June 8, 2006. The value of the contract, which terminates June 26, 2016, is recorded as a receivable for open swap contracts of $403,094, on October 31, 2006.
As of October 31, 2006, the Portfolio had entered into an interest rate swap with JPMorgan Chase Bank N.A. whereby the Portfolio makes a payment every 28 days at a rate equal to the MXN-TIIE-BANXICO on the notional amount of 500,000,000 MXN. In exchange, the Portfolio receives payments every 28 days at a fixed rate equal to 7.620% on the same notional amount. The effective date of the interest rate swap is October 13, 2006. The value of the contract, which terminates October 12, 2007, is recorded as a receivable for open swap contracts of $41,400, on October 31, 2006.
28
Strategic Income Portfolio as of October 31, 2006
NOTES TO FINANCIAL STATEMENTS CONT'D
| Credit Default Swaps | |
Notional
Amount | | Expiration
Date | | Description | | Net Unrealized
Appreciation
(Depreciation) | |
| | 4,000,000 | USD | | 4/6/2009 | | Agreement with JP Morgan Chase Bank dated 4/6/2004 to pay 3.60% per year times the notional amount. In exchange for that periodic payment, upon a default event in Turkey, JP Morgan Chase Bank agrees to pay the Portfolio the notional amount of the swap. To receive that payment, the Portfolio must deliver a bond (with par value equal to the notional amount of the swap) issued by Turkey to JP Morgan Chase Bank. | | $ | (234,818 | ) | |
|
| | 10,000,000 | USD | | 4/20/2010 | | Agreement with JP Morgan Chase Bank dated 4/1/2005 to pay 3.16% per year times the notional amount. In exchange for that periodic payment, upon a default event in Turkey, JP Morgan Chase Bank agrees to pay the Portfolio the notional amount of the swap. To receive that payment, the Portfolio must deliver a bond (with par value equal to the notional amount of the swap) issued by Turkey to JP Morgan Chase Bank. | | (569,613) | |
|
| | 5,000,000 | USD | | 6/20/2011 | | Agreement with JP Morgan Chase Bank dated 4/26/2006 to pay 1.88% per year times the notional amount. In exchange for that periodic payment, upon a default event in the Republic of the Philippines, JP Morgan Chase Bank agrees to pay the Portfolio the notional amount of the swap. To receive that payment, the Portfolio must deliver a bond (with par value equal to the notional amount of the swap) issued by the Republic of the Philippines to JP Morgan Chase Bank. | | $ | (114,227 | ) | |
|
| | 5,000,000 | USD | | 9/20/2011 | | Agreement with JP Morgan Chase Bank dated 7/21/2006 to pay 2.09% per year times the notional amount. In exchange for that periodic payment, upon a default event in the Republic of Indonesia, JP Morgan Chase Bank agrees to pay the Portfolio the notional amount of the swap. To receive that payment, the Portfolio must deliver a bond (with par value equal to the notional amount of the swap) issued by the Republic of Indonesia to JP Morgan Chase Bank | | (161,378) | |
|
| | 5,000,000 | USD | | 4/6/2014 | | Agreement with Morgan Stanley Capital Services Inc. dated 4/6/2004 to pay 4.05% per year times the notional amount. In exchange for that periodic payment, upon a default event in Turkey, Morgan Stanley Capital Services Inc. agrees to pay the Portfolio the notional amount of the swap. To receive that payment, the Portfolio must deliver a bond (with par value equal to the notional amount of the swap) issued by Turkey to Morgan Stanley Capital Services Inc. | | (478,294) | |
|
| | 3,000,000 | USD | | 1/29/2009 | | Agreement with Morgan Stanley Capital Services Inc. dated 1/29/2004 to pay 3.40% per year times the notional amount. In exchange for that periodic payment, upon a default event in Turkey, Morgan Stanley Capital Services Inc. agrees to pay the Portfolio the notional amount of the swap. To receive that payment, the Portfolio must deliver a bond (with par value equal to the notional amount of the swap) issued by Turkey to Morgan Stanley Capital Services Inc. | | (152,715) | |
|
| | 50,000,000 | USD | | 6/20/2015 | | Agreement with Goldman Sachs Capital Markets L.P., dated 6/16/2005 to pay 0.29% per year times the notional amount. In exchange for that periodic payment, upon a default event in Greece, Goldman Sachs Capital Markets L.P. agrees to pay the Portfolio the notional amount of the swap. To receive that payment, the Portfolio must deliver a bond (with par value equal to the notional amount of the swap) issued by Greece to Goldman Sachs Capital Markets L.P. | | (401,531) | |
|
| | 30,000,000 | USD | | 6/20/2020 | | Agreement with Goldman Sachs Capital Markets L.P., dated 3/23/2005 to pay 0.20% per year times the notional amount. In exchange for that periodic payment, upon a default event in Greece, Goldman Sachs Capital Markets L.P. agrees to pay the Portfolio the notional amount of the swap. To receive that payment, the Portfolio must deliver a bond (with par value equal to the notional amount of the swap) issued by Greece to Goldman Sachs Capital Markets L.P. | | 53,681 | |
|
| | 6,000,000 | USD | | 1/20/2011 | | Agreement with Barclays Bank, PLC dated 1/18/2006 to pay 0.75% per year times the notional amount. In exchange for that periodic payment, upon a default event in the Arab Republic of Egypt, Barclays Bank, PLC agrees to pay the Portfolio the notional amount of the swap. To receive that payment, the Portfolio must deliver a bond (with par value equal to the notional amount of the swap) issued by the Arab Republic of Egypt to Barclays Bank, PLC. | | (2,404) | |
|
29
Strategic Income Portfolio as of October 31, 2006
NOTES TO FINANCIAL STATEMENTS CONT'D
Notional
Amount | | Expiration
Date | | Description | | Net Unrealized
Appreciation
(Depreciation) | |
| | 20,000,000 | USD | | 6/20/2020 | | Agreement with Credit Suisse First Boston dated 3/23/2005 to pay 0.195% per year times the notional amount. In exchange for that periodic payment, upon a default event in Greece, Credit Suisse First Boston agrees to pay the Portfolio the notional amount of the swap. To receive that payment, the Portfolio must deliver a bond (with par value equal to the notional amount of the swap) issued by Greece to Credit Suisse First Boston. | | 45,546 | |
|
| | 5,000,000 | USD | | 6/20/2011 | | Agreement with Credit Suisse First Boston dated 4/26/2006 to pay 1.88% per year times the notional amount. In exchange for that periodic payment, upon a default event in the Republic of the Philippines, Credit Suisse First Boston agrees to pay the Portfolio the notional amount of the swap. To receive that payment, the Portfolio must deliver a bond (with par value equal to the notional amount of the swap) issued by the Republic of the Philippines to Credit Suisse First Boston. | | $ | (114,227 | ) | |
|
| | 5,000,000 | USD | | 7/20/2011 | | Agreement with Credit Suisse First Boston dated 7/18/2006 to pay 2.87% per year times the notional amount. In exchange for that periodic payment, upon default event Turkey, Credit Suisse First Boston agrees to pay the Portfolio the notional amount of the swap. To receive that payment, the Portfolio must deliver a bond (with par value equal to the notional amount of the swap) issued by Turkey Credit Suisse First Boston. | | (221,191) | |
|
| | 5,000,000 | USD | | 6/20/2011 | | Agreement with Citigroup Global Markets, Inc. dated 4/26/2006 to pay 1.88% per year times the notional amount. In exchange for that periodic payment, upon a default event in the Republic of the Philippines, Citigroup Global Markets, Inc. agrees to pay the Portfolio the notional amount of the swap. To receive that payment, the Portfolio must deliver a bond (with par value equal to the notional amount of the swap) issued by the Republic of the Philippines to Citigroup Global Markets, Inc. | | (114,227) | |
|
| | 10,000,000 | USD | | 6/20/2011 | | Agreement with Citigroup Global Markets, Inc. dated 5/16/2006 to pay 1.73% per year times the notional amount. In exchange for that periodic payment, upon a default event in the Republic of the Indonesia, Citigroup Global Markets, Inc. agrees to pay the Portfolio the notional amount of the swap. To receive that payment, the Portfolio must deliver a bond (with par value equal to the notional amount of the swap) issued by the Republic of Indonesia to Citigroup Global Markets, Inc. | | (182,887) | |
|
| | 7,000,000 | USD | | 5/20/2011 | | Agreement with HSBC Bank USA dated 5/5/2006 to pay 1.30% per year times the notional amount. In exchange for that periodic payment, upon a default event in the Republic of Serbia, HSBC Bank USA agrees to pay the Portfolio the notional amount of the swap. To receive that payment, the Portfolio must deliver a bond (with par value equal to the notional amount of the swap) issued by the Republic of Serbia to HSBC Bank USA. | | 116,181 | |
|
| | 13,112,000 | USD | | 8/20/2009 | | Agreement with JP Morgan Chase Bank whereby the Portfolio makes a payment every 3 months at a fixed rate equal to 0.61% times the notional amount. In exchange for that periodic payment, upon a default event in the Republic of Brazil, JP Morgan Chase Bank agrees to pay the Portfolio the notional amount of the swap. To receive that payment, the Portfolio must deliver a bond (with par value equal to the notional amount of the swap) issued by the Republic of Brazil to JP Morgan Chase Bank | | (4,456) | |
|
| | 8,434,000 | USD | | 8/20/2011 | | Agreement with JP Morgan Chase Bank whereby the Portfolio receives a payment every 3 months at a fixed rate equal to 1.25% times the notional amount. In exchange for that periodic payment, upon a default event in the Republic of Brazil the portfolio agrees to pay JP Morgan Chase Bank the notional amount of the swap. To receive that payment, JP Morgan Chase Bank must deliver a bond (with par value equal to the notional amount of the swap) issued by the Republic of Brazil to JP Morgan Chase Bank | | 45,023 | |
|
| | 18,200,000 | USD | | 12/20/2016 | | Agreement with Credit Suisse First Boston dated 10/19/2006 to pay 0.20% per year times the notional amount. In exchange for that periodic payment, upon a default event in the Republic of the Italy, Credit Suisse First Boston agrees to pay the Portfolio the notional amount of the swap. To receive that payment, the Portfolio must deliver a bond (with par value equal to the notional amount of the swap) issued by the Republic of the Italy to Credit Suisse First Boston. | | 13,427 | |
|
30
Strategic Income Portfolio as of October 31, 2006
NOTES TO FINANCIAL STATEMENTS CONT'D
6 Federal Income Tax Basis of Unrealized Appreciation (Depreciation)
The cost and unrealized appreciation (depreciation) in value of the investments at October 31, 2006, as determined on a federal income tax basis, were as follows:
| Aggregate cost | | $ | 571,907,420 | | |
| Gross unrealized appreciation | | $ | 2,438,306 | | |
| Gross unrealized depreciation | | | (9,451,022 | ) | |
| Net unrealized depreciation | | $ | (7,012,716 | ) | |
The net unrealized depreciation on foreign currency, swaps, forwards and futures contracts at October 31, 2006 on a federal income tax basis was $(393,508).
7 Recently Issued Accounting Pronouncements
In June 2006, the Financial Accounting Standards Board ("FASB") issued FASB Interpretation No. 48, ("FIN 48") "Accounting for Uncertainty in Income Taxes – an interpretation of FASB Statement No. 109". FIN 48 clarifies the accounting for uncertainty in income taxes recognized in accordance with FASB Statement No. 109, "Accounting for Income Taxes." This interpretation prescribes a recognition threshold and measurement attribute for the financial statement recognition and measurement of a tax position taken or expected to be taken in a tax return. It also provides guidance on de-recognition, classification, interest and penalties, accounting in interim periods, disclosure and transition. FIN 48 is effective for fiscal years beginning after December 15, 2006. Management is currently evaluating the impact of applying the various provisions of FIN 48.
In September 2006, the Financial Accounting Standards Board ("FASB") issued Statement of Financial Accounting Standards No. 157, ("FAS 157") "Fair Value Measurements". FAS 157 defines fair value, establishes a framework for measuring fair value in accordance with generally accepted accounting principles and expands disclosure about fair value measurements. FAS 157 is effective for fiscal years beginning after November 15, 2007. Management is currently evaluating the impact the adoption of FAS 157 will have on the Portfolio's financial statement disclosures.
31
Strategic Income Portfolio as of October 31, 2006
REPORT OF INDEPENDENT REGISTERED PUBLIC ACCOUNTING FIRM
To the Trustees and Investors
of Strategic Income Portfolio:
In our opinion, the accompanying statement of assets and liabilities, including the portfolio of investments, and the related statements of operations, changes in net assets and the supplementary data present fairly, in all material respects, the financial position of Strategic Income Portfolio (the "Portfolio") at October 31, 2006, and the results of its operations, the changes in its net assets, and the supplementary data for each of the periods indicated, in conformity with accounting principles generally accepted in the United States of America. These financial statements and supplementary data (hereafter referred to as "financial statements") are the responsibility of the Portfolio's management; our responsibility is to express an opinion on these financial statements based on our audits. We conducted our audits of these financial statements in accordance with standards of the Public Company Accounting Oversight Board (Unit ed States). Those standards require that we plan and perform the audit to obtain reasonable assurance about whether the financial statements are free of material misstatement. An audit includes examining, on a test basis, evidence supporting the amounts and disclosures in the financial statements, assessing the accounting principles used and significant estimates made by management, and evaluating the overall financial statement presentation. We believe that our audits, which included confirmation of securities at October 31, 2006 by correspondence with the custodian, provide a reasonable basis for our opinion.
PricewaterhouseCoopers LLP
Boston, Massachusetts
December 27, 2006
32
Eaton Vance Strategic Income Fund
BOARD OF TRUSTEES' ANNUAL APPROVAL OF THE INVESTMENT ADVISORY AGREEMENT
Overview of the Contract Review Process
The Investment Company Act of 1940, as amended (the "1940 Act"), provides, in substance, that each investment advisory agreement between a fund and its investment adviser will continue in effect from year to year only if its continuance is approved at least annually by the fund's board of trustees, including by a vote of a majority of the trustees who are not "interested persons" of the fund ("Independent Trustees") cast in person at a meeting called for the purpose of considering such approval.
At a meeting of the Boards of Trustees (each a "Board") of the Eaton Vance group of mutual funds (the "Eaton Vance Funds") held on March 27, 2006, the Board, including a majority of the Independent Trustees, voted to approve continuation of existing advisory and sub-advisory agreements for the Eaton Vance Funds for an additional one-year period. In voting its approval, the Board relied upon the affirmative recommendation of the Special Committee of the Board, which is a committee comprised exclusively of Independent Trustees. Prior to making its recommendation, the Special Committee reviewed information furnished for a series of meetings of the Special Committee held in February and March 2006. Such information included, among other things, the following:
Information about Fees, Performance and Expenses
• An independent report comparing the advisory and related fees paid by each fund with fees paid by comparable funds;
• An independent report comparing each fund's total expense ratio and its components to comparable funds;
• An independent report comparing the investment performance of each fund to the investment performance of comparable funds over various time periods;
• Data regarding investment performance in comparison to relevant peer groups of funds and appropriate indices;
• Comparative information concerning fees charged by each adviser for managing other mutual funds and institutional accounts using investment strategies and techniques similar to those used in managing the fund;
• Profitability analyses for each adviser with respect to each fund managed by it;
Information about Portfolio Management
• Descriptions of the investment management services provided to each fund, including the investment strategies and processes employed;
• Information concerning the allocation of brokerage and the benefits received by each adviser as a result of brokerage allocation, including information concerning the acquisition of research through "soft dollar" benefits received in connection with the funds' brokerage, and the implementation of a soft dollar reimbursement program established with respect to the funds;
• Data relating to portfolio turnover rates of each fund;
• The procedures and processes used to determine the fair value of fund assets and actions taken to monitor and test the effectiveness of such procedures and processes;
Information about each Adviser
• Reports detailing the financial results and condition of each adviser;
• Descriptions of the qualifications, education and experience of the individual investment professionals whose responsibilities include portfolio management and investment research for the funds, and information relating to their compensation and responsibilities with respect to managing other mutual funds and investment accounts;
• Copies of the Codes of Ethics of each adviser and its affiliates, together with information relating to compliance with and the administration of such codes;
• Information concerning the resources devoted to compliance efforts undertaken by each adviser and its affiliates on behalf of the funds (including descriptions of various compliance programs) and their record of compliance with investment policies and restrictions, including policies with respect to market-timing, late trading and selective portfolio disclosure, and with policies on personal securities transactions;
• Descriptions of the business continuity and disaster recovery plans of each adviser and its affiliates;
Other Relevant Information
• Information concerning the nature, cost and character of the administrative and other non-investment management services provided by Eaton Vance Management and its affiliates;
• Information concerning management of the relationship with the custodian, subcustodians and fund accountants by each adviser or the funds' administrator; and
• The terms of each advisory agreement.
In addition to the information identified above, the Special Committee considered information provided from time to time by each adviser throughout the year at meetings of the Board and its committees. Over the course of the twelve month period ended March 31,
33
Eaton Vance Strategic Income Fund
BOARD OF TRUSTEES' ANNUAL APPROVAL OF THE INVESTMENT ADVISORY AGREEMENT CONT'D
2006, the Board met nine times and the Special Committee, the Audit Committee and the Governance Committee, each of which is a Committee comprised solely of Independent Trustees, met eight, twelve and five times, respectively. At such meetings, the Trustees received, among other things, presentations by the portfolio managers and other investment professionals of each adviser relating to the investment performance of each fund and the investment strategies used in pursuing the fund's investment objective.
For funds that invest through one or more underlying portfolios, the Board considered similar information about the portfolio(s) when considering the approval of advisory agreements. In addition, in cases where the fund's investment adviser has engaged a sub-adviser, the Board considered similar information about the sub-adviser when considering the approval of any sub-advisory agreement.
The Special Committee was assisted throughout the contract review process by Goodwin Procter LLP, legal counsel for the Independent Trustees. The members of the Special Committee relied upon the advice of such counsel and their own business judgment in determining the material factors to be considered in evaluating each advisory and sub-advisory agreement and the weight to be given to each such factor. The conclusions reached with respect to each advisory and sub-advisory agreement were based on a comprehensive evaluation of all the information provided and not any single factor. Moreover, each member of the Special Committee may have placed varying emphasis on particular factors in reaching conclusions with respect to each advisory and sub-advisory agreement.
Results of the Process
Based on its consideration of the foregoing, and such other information as it deemed relevant, including the factors and conclusions described below, the Special Committee concluded that the continuance of the investment advisory agreements of the Strategic Income Portfolio, the Boston Income Portfolio, the Floating Rate Portfolio, the High Income Portfolio and the Investment Grade Income Portfolio (the "Portfolios"), the portfolios in which the Eaton Vance Strategic Income Fund (the "Fund") invests, each with Boston Management and Research (the "Adviser"), including their fee structures, is in the interests of shareholders and, therefore, the Special Committee recommended to the Board approval of each agreement. The Board accepted the recommendation of the Special Committee as well as the factors considered and conclusions reached by the Special Committee with respect to each agreement. Accordingly, the Board, including a major ity of the Independent Trustees, voted to approve continuation of the investment advisory agreements for the Portfolios.
Nature, Extent and Quality of Services
In considering whether to approve the investment advisory agreement of the Portfolios, the Board evaluated the nature, extent and quality of services provided to the Portfolios by the Adviser.
The Board considered the Adviser's management capabilities and investment process with respect to the types of investments held by the Portfolios, including the education, experience and number of its investment professionals and other personnel who provide portfolio management, investment research, and similar services to the Portfolios. In particular, the Board evaluated the abilities and experience of such investment personnel in analyzing special considerations relevant to investing in high grade debt securities. With respect to the Floating Rate Portfolio, the Board noted the experience of the Adviser's 29 bank loan investment professionals and other personnel who provide services to the Portfolios, including four portfolio managers and 15 analysts. With respect to the Boston Income Portfolio and High Income Portfolios, the Board evaluated the abilities and experience of such investment personnel in analyzing special consid erations relevant to investing in high-yield debt. For all the Portfolios, the Board also took into account the resources dedicated to portfolio management and other services, including the compensation paid to recruit and retain investment personnel, and the time and attention devoted to the Fund by senior management.
The Board reviewed the compliance programs of the Adviser and relevant affiliates thereof. Among other matters, the Board considered compliance and reporting matters relating to personal trading by investment personnel, selective disclosure of portfolio holdings, late trading, frequent trading, portfolio valuation, business continuity and the allocation of investment opportunities. The Board also evaluated the responses of the Adviser and its affiliates to requests from regulatory authorities such as the Securities and Exchange Commission and the National Association of Securities Dealers.
The Board considered shareholder and other administrative services provided or managed by Eaton Vance Management and its affiliates, including transfer agency and accounting services. The Board evaluated the benefits to shareholders of investing in a fund that is a part of a large family of funds, including the ability, in many cases, to exchange an investment among different funds without incurring additional sales charges.
After consideration of the foregoing factors, among others, the Board concluded that the nature, extent and quality of services provided by the Adviser, taken as a whole, are appropriate and consistent with the terms of the investment advisory agreements.
34
Eaton Vance Strategic Income Fund
BOARD OF TRUSTEES' ANNUAL APPROVAL OF THE INVESTMENT ADVISORY AGREEMENT CONT'D
Fund Performance
The Board compared the Fund's investment performance to a relevant universe of similarly managed funds identified by an independent data provider and appropriate benchmark indices. The Board reviewed comparative performance data for the one-, three-, five-and ten-year periods ended September 30, 2005 for the Fund. The Board also considered the performance of the underlying Portfolios. The Board concluded that on a risk-adjusted basis, the Fund's performance was satisfactory.
Management Fees and Expenses
The Board reviewed contractual investment advisory fee rates payable by the Portfolios and the Fund (referred to as "management fees"). As part of its review, the Board considered the management fees and the Fund's total expense ratio for the one-year period ended September 30, 2005, as compared to a group of similarly managed funds selected by an independent data provider.
After reviewing the foregoing information, and in light of the nature, extent and quality of the services provided by the Adviser, the Board concluded that the management fees charged for advisory and related services and the Fund's total expense ratio are reasonable.
Profitability
The Board reviewed the level of profits realized by the Adviser and relevant affiliates thereof in providing investment advisory and administrative services to the Fund, the Portfolios and to all Eaton Vance Funds as a group. The Board considered the level of profits realized without regard to revenue sharing or other payments by the Adviser and its affiliates to third parties in respect of distribution services. The Board also considered other direct or indirect benefits received by the Adviser and its affiliates in connection with its relationship with the Fund and the Portfolios.
The Board concluded that, in light of the foregoing factors and the nature, extent and quality of the services rendered, the profits realized by the Adviser and its affiliates are reasonable.
Economies of Scale
In reviewing management fees and profitability, the Board also considered the extent to which the Adviser and its affiliates, on the one hand, and the Fund, on the other hand, can expect to realize benefits from economies of scale as the assets of the Fund and Portfolios increase. The Board acknowledged the difficulty in accurately measuring the benefits resulting from the economies of scale with respect to the management of any specific fund or group of funds. The Board reviewed data summarizing the increases and decreases in the assets of the Fund and of all Eaton Vance Funds as a group over various time periods, and evaluated the extent to which the total expense ratio of the Fund and the profitability of the Adviser and its affiliates may have been affected by such increases or decreases. The Board noted that, at its request, the Adviser had agreed to add a breakpoint for the Floating Rate Portfolio with respect to assets th at exceed $10 billion, and for the Boston Income Portfolio with respect to assets that exceed $5 billion. Based upon the foregoing, the Board concluded that the benefits from economies of scale are currently being shared equitably by the Adviser and its affiliates and the Fund. The Board also concluded that, assuming reasonably foreseeable increases in the assets of the Portfolios, the structure of the advisory fees, several of which include breakpoints at several asset levels, can be expected to cause the Adviser and its affiliates and the Fund to continue to share such benefits equitably.
35
Eaton Vance Strategic Income Fund
MANAGEMENT AND ORGANIZATION
Fund Management. The Trustees of Eaton Vance Mutual Funds Trust (the Trust), Boston Income Portfolio (BIP), Floating Rate Portfolio (FRP), High Income Portfolio (HIP), Investment Grade Income Portfolio (IGIP) and Strategic Income Portfolio (SIP) (the Portfolios) are responsible for the overall management and supervision of the Trust's and Portfolios' affairs. The Trustees and officers of the Trust and the Portfolios are listed below. Except as indicated, each individual has held the office shown or other offices in the same company for the last five years. Trustees and officers of the Trust and the Portfolios hold indefinite terms of office. The "noninterested Trustees" consist of those Trustees who are not "interested persons" of the Trust and the Portfolios, as that term is defined under the 1940 Act. The business address of each Trustee and officer is The Eaton Vance Building, 255 State Street, Boston, Massachusetts 02109. As used below, "EVC" refers to Eaton Vance Corp., "EV" refers to Eaton Vance, Inc., "EVM" refers to Eaton Vance Management, "BMR" refers to Boston Management and Research, "Parametric" refers to Parametric Portfolio Associates and "EVD" refers to Eaton Vance Distributors, Inc. EVC and EV are the corporate parent and trustee, respectively, of EVM and BMR. EVD is the Fund's principal underwriter, the Portfolios' placement agent and a wholly-owned subsidiary of EVM. Each officer affiliated with Eaton Vance may hold a position with other Eaton Vance affiliates that is comparable to his or her position with EVM listed below.
Name and
Date of Birth | | Position(s)
with the
Trust and
the Portfolios | | Term of
Office and
Length of
Service | | Principal Occupation(s)
During Past Five Years | | Number of Portfolios
in Fund Complex
Overseen By
Trustee (1) | | Other Directorships Held | |
| Interested Trustee | | | |
|
| James B. Hawkes 11/9/41 | | Trustee | | Trustee of the Trust since 1991; of HIP and SIP since 1992; of FRP and IGIP since 2000 and BIP since 2001 | | Chairman and Chief Executive Officer of EVC, BMR, EVM and EV; Director of EV; Vice President and Director of EVD. Trustee and/or officer of 170 registered investment companies in the Eaton Vance Fund Complex. Mr. Hawkes is an interested person because of his positions with BMR, EVM, EVC and EV, which are affiliates of the Trust and the Portfolios. | | | 170 | | | Director of EVC | |
|
| Noninterested Trustee(s) | | | |
|
| Benjamin C. Esty 1/2/63 | | Trustee | | Since 2005 | | Roy and Elizabeth Simmons Professor of Business Administration, Harvard University Graduate School of Business Administration (since 2003). Formerly, Associate Professor, Harvard University Graduate School of Business Administration (2000-2003). | | | 170 | | | None | |
|
| Samuel L. Hayes, III 2/23/35 | | Trustee and Chairman of the Board | | Trustee of the Trust since 1986; of HIP and SIP since 1993; of FRP and IGIP since 2000; of BIP since 2001 and Chairman of the Board since 2005 | | Jacob H. Schiff Professor of Investment Banking Emeritus, Harvard University Graduate School of Business Administration. Director of Yakima Products, Inc. (manufacturer of automotive accessories) (since 2001) and Director of Telect, Inc. (telecommunications services company). | | | 170 | | | Director of Tiffany & Co. (specialty retailer) | |
|
| William H. Park 9/19/47 | | Trustee | | Since 2003 | | Vice Chairman, Commercial Industrial Finance Corp. (specialty finance company) (since 2006). Formerly, President and Chief Executive Officer, Prizm Capital Management, LLC (investment management firm) (2002-2005). Formerly, Executive Vice President and Chief Financial Officer, United Asset Management Corporation (a holding company owning institutional investment management firms) (1982-2001). | | | 170 | | | None | |
|
| Ronald A. Pearlman 7/10/40 | | Trustee | | Since 2003 | | Professor of Law, Georgetown University Law Center. | | | 170 | | | None | |
|
36
Eaton Vance Strategic Income Fund
MANAGEMENT AND ORGANIZATION CONT'D
Name and
Date of Birth | | Position(s)
with the
Trust and
the Portfolios | | Term of
Office and
Length of
Service | | Principal Occupation(s)
During Past Five Years | | Number of Portfolios
in Fund Complex
Overseen By
Trustee (1) | | Other Directorships Held | |
| Noninterested Trustee(s) (continued) | | | |
|
| Norton H. Reamer 9/21/35 | | Trustee | | Trustee of the Trust since 1986; of HIP and SIP since 1993; of FRP and IGIP since 2000 and BIP since 2001 | | President, Chief Executive Officer and a Director of Asset Management Finance Corp. (a specialty finance company serving the investment management industry) (since October 2003). President, Unicorn Corporation (an investment and financial advisory services company) (since September 2000). Formerly, Chairman and Chief Operating Officer, Hellman, Jordan Management Co., Inc. (an investment management company) (2000-2003). Formerly, Advisory Director of Berkshire Capital Corporation (investment banking firm) (2002-2003). | | | 170 | | | None | |
|
| Lynn A. Stout 9/14/57 | | Trustee | | Trustee of the Trust, HIP and SIP since 1998; of FRP and IGIP since 2000 and of BIP since 2001 | | Professor of Law, University of California at Los Angeles School of Law. | | | 170 | | | None | |
|
| Ralph F. Verni 1/26/43 | | Trustee | | Since 2005 | | Consultant and private investor. | | | 170 | | | None | |
|
| Principal Officers who are not Trustees | | | | | |
|
Name and
Date of Birth | | Position(s)
with the
Trust and
the Portfolios | | Term of
Office and
Length of
Service | | Principal Occupation(s)
During Past Five Years | |
| Thomas E. Faust Jr. 5/31/58 | | President of the Trust | | Since 2002 | | President of EVC, EVM, BMR and EV and Director of EVC. Chief Investment Officer of EVC, EVM and BMR. Officer of 71 registered investment companies and 5 private investment companies managed by EVM or BMR. | |
|
| William H. Ahern, Jr. 7/28/59 | | Vice President of the Trust | | Since 1995 | | Vice President of EVM and BMR. Officer of 71 registered investment companies managed by EVM or BMR. | |
|
| Cynthia J. Clemson 3/2/63 | | Vice President of the Trust | | Since 2005 | | Vice President of EVM and BMR. Officer of 86 registered investment companies managed by EVM or BMR. | |
|
| Thomas P. Huggins 3/7/66 | | Vice President of BIP and HIP | | Vice President of HIP since 2000 and of BIP since 2001 | | Vice President of EVM and BMR. Officer of 4 registered investment companies managed by EVM or BMR. | |
|
| Elizabeth S. Kenyon 9/8/59 | | President of IGIP | | Since 2002(2) | | Vice President of EVM and BMR. Officer of 17 registered investment companies managed by EVM or BMR. | |
|
| Aamer Khan 6/7/60 | | Vice President of the Trust | | Since 2005 | | Vice President of EVM and BMR. Officer of 29 registered investment companies managed by EVM or BMR. | |
|
| Duke E. Laflamme 7/8/69 | | Vice President of IGIP | | Since 2006 | | Vice President of EVM and BMR. Officer of 16 registered investment companies managed by EVM or BMR. | |
|
| Thomas H. Luster 4/8/62 | | Vice President of the Trust and IGIP | | Vice President of the Trust since 2006 and of IGIP since 2002 | | Vice President of EVM and BMR. Officer of 45 registered investment companies managed by EVM or BMR. | |
|
| Michael R. Mach 7/15/47 | | Vice President of the Trust | | Since 1999 | | Vice President of EVM and BMR. Officer of 51 registered investment companies managed by EVM or BMR. | |
|
| Robert B. MacIntosh 1/22/57 | | Vice President of the Trust | | Since 1998 | | Vice President of EVM and BMR. Officer of 86 registered investment companies managed by EVM or BMR. | |
|
37
Eaton Vance Strategic Income Fund
MANAGEMENT AND ORGANIZATION CONT'D
Name and
Date of Birth | | Position(s)
with the
Trust and
the Portfolios | | Term of
Office and
Length of
Service | | Principal Occupation(s)
During Past Five Years | |
| Principal Officers who are not Trustees (continued) | | | | | |
|
| Scott H. Page 11/30/59 | | Vice President of FRP | | Since 2000 | | Vice President of EVM and BMR. Officer of 15 registered investment companies managed by EVM or BMR. | |
|
| Cliff Quisenberry, Jr. 1/1/65 | | Vice President of the Trust | | Since 2006 | | Vice President and Director of Research and Product Development of Parametric. Officer of 30 registered investment companies managed by EVM or BMR. | |
|
| Duncan W. Richardson 10/26/57 | | Vice President of the Trust | | Since 2001 | | Executive Vice President and Chief Equity Investment Officer of EVC, EVM and BMR. Officer of 71 registered investment companies managed by EVM or BMR. | |
|
| Walter A. Row, III 7/20/57 | | Vice President of the Trust | | Since 2001 | | Director of Equity Research and a Vice President of EVM and BMR. Officer of 33 registered investment companies managed by EVM or BMR. | |
|
| Judith A. Saryan 8/21/54 | | Vice President of the Trust | | Since 2003 | | Vice President of EVM and BMR. Officer of 50 registered investment companies managed by EVM or BMR. | |
|
| Susan Schiff 3/13/61 | | Vice President of the Trust and SIP | | Since 2002 | | Vice President of EVM and BMR. Officer of 30 registered investment companies managed by EVM or BMR. | |
|
| Payson F. Swaffield 8/13/56 | | Vice President of FRP | | Since 2002(2) | | Vice President of EVM and BMR. Officer of 15 registered investment companies managed by EVM or BMR. | |
|
| Mark S. Venezia 5/23/49 | | President of SIP | | Since 2002(2) | | Vice President of EVM and BMR. Officer of 5 registered investment companies managed by EVM or BMR. | |
|
| Michael W. Weilheimer 2/11/61 | | President of BIP and HIP | | Since 2002(2) | | Vice President of EVM and BMR. Officer of 24 registered investment companies managed by EVM or BMR. | |
|
| William J. Austin, Jr. 12/27/51 | | Treasurer of IGIP | | Since 2002(2) | | Vice President of EVM and BMR. Officer of 52 registered investment companies managed by EVM or BMR. | |
|
| Barbara E. Campbell 6/19/57 | | Treasurer of the Trust | | Since 2005(2) | | Vice President of EVM and BMR. Officer of 170 registered investment companies managed by EVM or BMR. | |
|
| Dan A. Maalouly 3/25/62 | | Treasurer of BIP, FRP, HIP and SIP | | Since 2005 | | Vice President of EVM and BMR. Previously, Senior Manager at PricewaterhouseCoopers, LLP (1997-2005). Officer of 71 registered investment companies managed by EVM or BMR. | |
|
| Alan R. Dynner 10/10/40 | | Secretary | | Since 1997 | | Vice President, Secretary and Chief Legal Officer of BMR, EVM, EVD, EV and EVC. Officer of 170 registered investment companies managed by EVM or BMR. | |
|
| Paul M. O'Neil 7/11/53 | | Chief Compliance Officer | | Since 2004 | | Vice President of EVM and BMR. Officer of 170 registered investment companies managed by EVM or BMR. | |
|
(1) Includes both master and feeder funds in a master-feeder structure.
(2) Prior to 2002, Ms Kenyon served as Vice President of IGIP since 2001, Mr. Swaffield served as Vice President of FRP since 2000, Mr. Venezia served as Vice President of SIP since 1992, Mr. Weilheimer served as Vice President of HIP since 1995 and BIP since 2001 and Mr. Austin served as Assistant Treasurer of IGIP since 2000. Prior to 2005, Ms. Campbell served as Assistant Treasurer of the Trust since 1995.
The SAI for the Fund includes additional information about the Trustees and officers of the Fund and the Portfolios and can be obtained without charge on Eaton Vance's website at www.eatonvance.com or by calling 1-800-225-6265.
38
This Page Intentionally Left Blank
This Page Intentionally Left Blank
Investment Adviser of Strategic Income Portfolio
Boston Management and Research
The Eaton Vance Building
255 State Street
Boston, MA 02109
Administrator of Eaton Vance Strategic Income Fund
Eaton Vance Management
The Eaton Vance Building
255 State Street
Boston, MA 02109
Principal Underwriter
Eaton Vance Distributors, Inc.
The Eaton Vance Building
255 State Street
Boston, MA 02109
(617) 482-8260
Custodian
Investors Bank & Trust Company
200 Clarendon Street
Boston, MA 02116
Transfer and Dividend Disbursing Agent
PFPC Inc.
Attn: Eaton Vance Funds
P.O. Box 9653
Providence, RI 02940-9653
(800) 262-1122
Independent Registered Public Accounting Firm
PricewaterhouseCoopers, LLP
125 High Street
Boston, MA 02110
Eaton Vance Strategic Income Fund
The Eaton Vance Building
255 State Street
Boston, MA 02109
This report must be preceded or accompanied by a current prospectus. Before investing, investors should consider carefully the Fund's investment
objective(s), risks, and charges and expenses. The Fund's current prospectus contains this and other information about the Fund and is available
through your financial advisor. Please read the prospectus carefully before you invest or send money. For further information please call 1-800-225-6265.
028-12/06 SISRC

Annual Report October 31, 2006


EATON VANCE
FLOATING-RATE
& HIGH INCOME
FUND
IMPORTANT NOTICES REGARDING PRIVACY,
DELIVERY OF SHAREHOLDER DOCUMENTS,
PORTFOLIO HOLDINGS, AND PROXY VOTING
Privacy. The Eaton Vance organization is committed to ensuring your financial privacy. Each of the financial institutions identified below has in effect the following policy ("Privacy Policy") with respect to nonpublic personal information about its customers:
• Only such information received from you, through application forms or otherwise, and information about your Eaton Vance fund transactions will be collected. This may include information such as name, address, social security number, tax status, account balances and transactions.
• None of such information about you (or former customers) will be disclosed to anyone, except as permitted by law (which includes disclosure to employees necessary to service your account). In the normal course of servicing a customer's account, Eaton Vance may share information with unaffiliated third parties that perform various required services such as transfer agents, custodians and broker/dealers.
• Policies and procedures (including physical, electronic and procedural safeguards) are in place that are designed to protect the confidentiality of such information.
• We reserve the right to change our Privacy Policy at any time upon proper notification to you. Customers may want to review our Policy periodically for changes by accessing the link on our homepage: www.eatonvance.com.
Our pledge of privacy applies to the following entities within the Eaton Vance organization: the Eaton Vance Family of Funds, Eaton Vance Management, Eaton Vance Investment Counsel, Boston Management and Research, and Eaton Vance Distributors, Inc.
In addition, our Privacy Policy only applies to those Eaton Vance customers who are individuals and who have a direct relationship with us. If a customer's account (i.e., fund shares) is held in the name of a third-party financial adviser/broker-dealer, it is likely that only such adviser's privacy policies apply to the customer. This notice supersedes all previously issued privacy disclosures.
For more information about Eaton Vance's Privacy Policy, please call 1-800-262-1122.
Delivery of Shareholder Documents. The Securities and Exchange Commission permits funds to deliver only one copy of shareholder documents, including prospectuses, proxy statements and shareholder reports, to fund investors with multiple accounts at the same residential or post office box address. This practice is often called "householding" and it helps eliminate duplicate mailings to shareholders.
Eaton Vance, or your financial adviser, may household the mailing of your documents indefinitely unless you instruct Eaton Vance, or your financial adviser, otherwise.
If you would prefer that your Eaton Vance documents not be householded, please contact Eaton Vance at
1-800-262-1122, or contact your financial adviser.
Your instructions that householding not apply to delivery of your Eaton Vance documents will be effective within 30 days of receipt by Eaton Vance or your financial adviser.
Portfolio Holdings. Each Eaton Vance Fund and its underlying Portfolio (if applicable) will file a schedule of its portfolio holdings on Form N-Q with the Securities and Exchange Commission for the first and third quarters of each fiscal year. The Form N-Q will be available on the Eaton Vance website www.eatonvance.com, by calling Eaton Vance at 1-800-262-1122 or in the EDGAR database on the Securities and Exchange Commision's website at www.sec.gov. Form N-Q may also be reviewed and copied at the SEC's public reference room in Washington, D.C. (call 1-800-732-0330 for information on the operation of the public reference room).
Proxy Voting. From time to time, funds are required to vote proxies related to the securities held by the funds. The Eaton Vance Funds or their underlying Portfolios (if applicable) vote proxies according to a set of policies and procedures approved by the Funds' and Portfolios' Boards. You may obtain a description of these policies and procedures and information on how the Funds or Portfolios voted proxies relating to portfolio securities during the most recent 12 month period ended June 30, without charge, upon request, by calling 1-800-262-1122. This description is also available on the Securities and Exchange Commission's website at www.sec.gov.
Eaton Vance Floating-Rate Fund as of October 3 1,2006
MANAGEMENT’S DISCUSSION OF FUND PERFORMANCE
The Fund
Performance for the Past Year
· The Fund’s Class A shares had a total return of 5.75% for the year ended October 31, 2006.(1) This return resulted from a decrease in net asset value per share (NAV) to $10.18 on October 31, 2006, from $10.22 on October 31, 2005, and the reinvestment of $0.612 in dividends.
· The Fund’s Class B shares had a total return of 5.06% for the year ended October 31, 2006.(1) This return resulted from a decrease in NAV to $9.84 on October 31, 2006, from $9.87 on October 31, 2005, and the reinvestment of $0.518 in dividends.
· The Fund’s Class C shares had a total return of 5.06% for the year ended October 31, 2006.(1) This return resulted from a decrease in NAV to $9.84 on October 31, 2006, from $9.87 on October 31, 2005, and the reinvestment of $0.518 in dividends.
· The Fund’s Class I shares had a total return of 6.00% for the year ended October 31, 2006.(1) This return resulted from a decrease in NAV to $9.84 on October 31, 2006, from $9.88 on October 31, 2005, and the reinvestment of $0.617 in dividends.
· The Fund’s Advisers Class shares had a total return of 5.74% for the year ended October 31, 2006.(1) This return resulted from a decrease in NAV to $9.84 on October 31, 2006, from $9.88 on October 31, 2005, and the reinvestment of $0.592 in dividends.
· For comparison, the S&P/LSTA Leveraged Loan Index – an unmanaged index of U.S. dollar-denominated leveraged loans – had a total return of 6.49% for the same period.(2) The Lipper Loan Participation Funds Classification – the Fund’s peer group – had an average total return of 5.80% for the same period.(2) The lower total return performance of certain share classes relative to the Fund’s benchmark and peer group reflects the relatively conservative positioning of the Fund (and the lower average yield on its loan portfolio).
· Based on the Fund’s most recent dividends and NAVs on October 31, 2006 of $10.18 per share for Class A, $9.84 for Class B, $9.84 for Class C, $9.84 for Class I and $9.84 for Advisers Class, the Fund’s distribution rates were 6.73%, 5.98%, 5.98%, 6.99% and 6.73%, respectively.(3) The SEC 30-day yields for Class A, Class B, Class C, Class I and Advisers Class shares were 6.60%, 5.99%, 5.99%, 7.01% and 6.76%, respectively.(4)
The Fund’s Investments
· Floating Rate Portfolio’s investments included 562 borrowers spanning 38 industries at October 31, 2006, with an average loan size of just 0.17% of total investments, and no industry constituting more than 8% of total investments. Chemicals/plastics, building and development (including manufacturers of building products and companies that manage/own apartments, shopping malls and commercial office buildings, among others), business equipment and services, health care and cable and satellite television were the largest industry weightings.
· The loan market enjoyed relatively stable fundamentals during the fiscal year. Technical factors came more into balance, as record new issuance from strong merger and acquisition activity met robust investor demand. As a result, credit spreads stabilized after a period during which they had narrowed. The Fund also benefited from an increase in the London Inter-Bank Offered Rate – the benchmark over which loan interest rates are typically set – which rose in response to rate hikes from the U.S. Federal Reserve.
· The Floating Rate Portfolio had a 12.5% exposure in European loans at October 31, 2006. European loan issuance has grown significantly in 2006 and now represents roughly 25% of the global loan market. European loans increased the Portfolio’s investment universe, presenting further opportunities for diversification. In addition, because European spreads were slightly wider than the U.S.market, European exposure provided selected opportunities for yield enhancement. All of the Portfolio’s foreign loans were either dollar-denominated or hedged to help protect against foreign currency risk.
The views expressed in this report are those of the portfolio managers and are current only through the end of the period of the report as stated on the cover. These views are subject to change at any time based upon market or other conditions, and the investment adviser disclaims any responsibility to update such views. These views may not be relied on as investment advice and, because investment decisions for a fund are based on many factors, may not be relied on as an indication of trading intent on behalf of any Eaton Vance fund.
Past performance is no guarantee of future results. Returns are historical and are calculated by determining the percentage change in net asset value or offering price (as applicable) with all distributions reinvested. Investment return and principal value will fluctuate so that shares, when redeemed, may be worth more or less than their original cost. Performance is for the stated time period only; due to market volatility, the Fund’s current performance may be lower or higher than the quoted return. For performance as of the most recent month end, please refer to www.eatonvance.com.
(1) | | These returns do not include the 2.25% maximum sales charge for Class A shares or the applicable contingent deferred sales charges (CDSC) for Class B or Class C shares. If sales charges were deducted, the returns would be lower. Advisers Class and Class I shares are offered to certain investors at net asset value |
(2) | | It is not possible to invest directly in an Index or Lipper Classification. The Index’s total return does not reflect commissions or expenses that would have been incurred if an investor individually purchased or sold the securities represented in the Index. The Lipper average is the average total return, at net asset value, of the funds that are in the same Lipper Classification as the Fund. |
(3) | | The Fund’s distribution rate represents actual distributions paid to shareholders and is calculated daily by dividing the last distribution per share (annualized) by the net asset value. |
(4) | | The Fund’s SEC yield is calculated by dividing the net investment income per share for the 30- day period by the offering price at the end of the period and annualizing the result. |
Fund shares are not insured by the FDIC and are not deposits or other obligations of, or guaranteed by, any depository institution. Shares are subject to investment risks, including possible loss of principal invested.
1
Eaton Vance Floating-Rate Fund as of October 31,2006
FUND PERFORMANCE
The line graph and table set forth below provide information about the Fund’s performance. The line graph compares the performance of Class B of the Fund with that of the S&P/LSTA Leveraged Loan Index, an unmanaged loan market index. The lines on the graph represent the total returns of a hypothetical investment of $10,000 in Class B of the Fund and the S&P/LSTA Leveraged Loan Index. The table includes the total returns of each Class of the Fund at net asset value and public offering price. Theperformance presented below does not reflect the deduction of taxes, if any, that a shareholder would pay on Fund distributions or the redemption of Fund shares.
| | | | | | | | | | Advisers | |
Performance(1) | | Class A | | Class B | | Class C | | Class I | | Class | |
Average Annual Total Returns (at net asset value) | | | | | | | | | | | |
One Year | | 5.75 | % | 5.06 | % | 5.06 | % | 6.00 | % | 5.74 | % |
Five Years | | N.A. | | 3.53 | | 3.51 | | 4.55 | | 4.29 | |
Life of Fund† | | 4.77 | | 3.44 | | 3.45 | | 4.48 | | 4.20 | |
SEC Average Annual Total Returns (including sales charge or applicable CDSC) | | | | | | | | | | | |
One Year | | 3.33 | % | 0.08 | % | 4.06 | % | 6.00 | % | 5.74 | % |
Five Years | | N.A. | | 3.18 | | 3.51 | | 4.55 | | 4.29 | |
Life of Fund† | | 4.09 | | 3.29 | | 3.45 | | 4.48 | | 4.20 | |
† Inception Dates – Class A: 5/5/03; Class B: 2/5/01; Class C: 2/1/01; Class I: 1/30/01; Advisers Class: 2/7/01
(1) | | Average Annual Total Returns at net asset value do not include the 2.25% maximum sales charge for Class A shares or the applicable contingent deferred sales charges (CDSC) for Class B or Class C shares. If sales charges were deducted, returns would be lower. SEC Average Annual Total Returns for Class A reflect the maximum 2.25% sales charge. Adviser Class and Class I shares are offered to certain investors at net asset value. SEC returns for Class B reflect applicable CDSC based on the following schedule: 5% - 1st and 2nd years; 4% - 3rd year; 3% - 4th year; 2% - 5th year; 1% - 6th year. 1-year SEC returns for Class C reflect 1% CDSC. Class A, Advisers Class and Class I shares are subject to a 1% redemption fee if redeemed or exchanged within 90 days of settlement of purchase. |
Past performance is no guarantee of future results. Returns are historical and are calculated by determining the percentage change in net asset value or offering price (as applicable) with all distributions reinvested. Investment return and principal value will fluctuate so that shares, when redeemed, may be worth more or less than their original cost. Performance is for the stated time period only; due to market volatility, the Fund’s current performance may be lower or higher than the quoted return. For performance as of the most recent month end, please refer to www.eatonvance.com.
Diversification by Industries(2)
By total investments
Chemicals & Plastics | | 6.7 | % |
Building & Development | | 6.6 | |
Business Equip. & Services | | 5.8 | |
Health Care | | 5.6 | |
Cable & Satellite Television | | 5.0 | |
Leisure Goods/Activities/Movies | | 5.0 | |
Publishing | | 4.8 | |
Radio & Television | | 4.3 | |
Automotive | | 3.8 | |
Lodging & Casinos | | 3.6 | |
Containers & Glass Products | | 3.6 | |
Telecommunications | | 3.4 | |
Electronics/Electrical | | 3.1 | |
Financial Intermediaries | | 2.7 | |
Retailers (Except Food & Drug) | | 2.5 | |
Utilities | | 2.5 | |
Conglomerates | | 2.4 | |
Oil & Gas | | 2.4 | |
Forest Products | | 2.4 | |
Food Products | | 2.3 | % |
Food Service | | 2.0 | |
Aerospace & Defense | | 1.8 | |
Ecological Services & Equip. | | 1.7 | |
Food/Drug Retailers | | 1.7 | |
Nonferrous Metals/Minerals | | 1.6 | |
Industrial Equipment | | 1.5 | |
Equipment Leasing | | 1.3 | |
Beverage & Tobacco | | 1.3 | |
Home Furnishings | | 1.1 | |
Air Transport | | 0.9 | |
Insurance | | 0.8 | |
Surface Transport | | 0.5 | |
Clothing/Textiles | | 0.5 | |
Rail Industries | | 0.5 | |
Drugs | | 0.4 | |
Farming/Agriculture | | 0.3 | |
Cosmetics/Toiletries | | 0.3 | |
Real Estate | | 0.1 | |
(2) Reflects the Fund’s investments in Floating Rate Portfolio as of October 31, 2006. Industries are shown as a percentage of the Portfolio’s total investments. Statistics may not be representative of current or future investments and are subject to change due to active management.
Comparison of Change in Value of a $10,000 Investment in Eaton Vance Floating-Rate Fund Class B vs. the S&P/LSTA Leveraged Loan Index.*
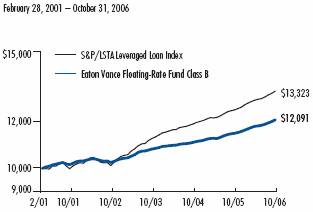
* Sources: Standard & Poor’s; Thomson Financial. Class B of the Fund commenced operations on 2/5/01.
The investment in Class B shares would have been valued at $11,410 after the deduction of the applicable CDSC. A $10,000 hypothetical investment at net asset value in Class A on 5/5/03, Class C on 2/1/01, Class I on 1/30/01 and Advisers Class on 2/7/01 would have been valued at $11,765, $12,151, $12,869 and $12,661, respectively, on 10/31/06. A $10,000 hypothetical investment in Class A shares of the Fund at maximum offering price would have been valued at $11,501. It is not possible to invest directly in an Index. The Index’s total return does not reflect the expenses that would have been incurred if an investor individually purchased or sold the securities represented in the Index.
Fund Allocations(3)
By total investments

(3) Reflects the Fund’s investment in Floating Rate Portfolio as of October 31, 2006. Allocations are shown as a percentage of the Fund’s total investments. Statistics may not be representative of current or future investments and are subject to change due to active management.
2
Eaton Vance Floating-Rate & High Income Fund as of October 31, 2006
FUND EXPENSES
Example: As a shareholder of the Fund, you incur two types of costs: (1) transaction costs, including sales charges (loads) on purchases and redemption fees (if applicable); and (2) ongoing costs, including management fees; distribution or service fees; and other Fund expenses. This Example is intended to help you understand your ongoing costs (in dollars) of investing in the Fund and to compare these costs with the ongoing costs of investing in other mutual funds. The Example is based on an investment of $1,000 invested at the beginning of the period and held for the entire period (May 1, 2006 – October 31, 2006).
Actual Expenses: The first section of the table below provides information about actual account values and actual expenses. You may use the information in this section, together with the amount you invested, to estimate the expenses that you paid over the period. Simply divide your account value by $1,000 (for example, an $8,600 account value divided by $1,000 = 8.6), then multiply the result by the number in the first section under the heading entitled "Expenses Paid During Period" to estimate the expenses you paid on your account during this period.
Hypothetical Example for Comparison Purposes: The second section of the table below provides information about hypothetical account values and hypothetical expenses based on the Fund's actual expense ratio and an assumed rate of return of 5% per year before expenses, which is not the Fund's actual return. The hypothetical account values and expenses may not be used to estimate the actual ending account balance or expenses you paid for the period. You may use this information to compare the ongoing costs of investing in the Fund and other funds. To do so, compare this 5% hypothetical example with the 5% hypothetical examples that appear in the shareholder reports of the other funds.
Please note that the expenses shown in the table are meant to highlight your ongoing costs only and do not reflect any transactional costs, such as sales charges (loads) or redemption fees (if applicable). Therefore, the second section of the table is useful in comparing ongoing costs only, and will not help you determine the relative total costs of owning different funds. In addition, if these transactional costs were included, your costs would have been higher.
Eaton Vance Floating-Rate & High Income Fund
| | | Beginning Account Value
(5/1/06) | | Ending Account Value
(10/31/06) | | Expenses Paid During Period*
(5/1/06 – 10/31/06) | |
| Actual | |
| Advisers Class | | $ | 1,000.00 | | | $ | 1,030.20 | | | $ | 5.32 | | |
| Class A | | $ | 1,000.00 | | | $ | 1,029.50 | | | $ | 5.32 | | |
| Class B | | $ | 1,000.00 | | | $ | 1,025.30 | | | $ | 9.14 | | |
| Class C | | $ | 1,000.00 | | | $ | 1,025.30 | | | $ | 9.14 | | |
| Class I | | $ | 1,000.00 | | | $ | 1,030.50 | | | $ | 4.04 | | |
| Hypothetical | |
| (5% return per year before expenses) | |
| Advisers Class | | $ | 1,000.00 | | | $ | 1,020.00 | | | $ | 5.30 | | |
| Class A | | $ | 1,000.00 | | | $ | 1,020.00 | | | $ | 5.30 | | |
| Class B | | $ | 1,000.00 | | | $ | 1,016.20 | | | $ | 9.10 | | |
| Class C | | $ | 1,000.00 | | | $ | 1,016.20 | | | $ | 9.10 | | |
| Class I | | $ | 1,000.00 | | | $ | 1,021.20 | | | $ | 4.02 | | |
* Expenses are equal to the Fund's annualized expense ratio of 1.04% for Advisers Class shares, 1.04% for Class A shares, 1.79% for Class B shares, 1.79% for Class C shares and 0.79% for Class I shares multiplied by the average account value over the period, multiplied by 184/365 (to reflect the one-half-year period). The example assumes that the $1,000 was invested at the net asset value per share determined at the close of business on April 30, 2006. The example reflects the expenses of both the Fund and the Portfolios.
3
Eaton Vance Floating-Rate & High Income Fund as of October 31, 2006
FINANCIAL STATEMENTS
Statement of Assets and Liabilities
As of October 31, 2006
| Assets | |
Investment in Floating Rate Portfolio, at value
(identified cost, $1,650,178,510) | | $ | 1,658,162,884 | | |
| Investment in High Income Portfolio, at value (identified cost, $242,401,158) | | | 246,318,833 | | |
| Receivable for Fund shares sold | | | 6,691,279 | | |
| Total assets | | $ | 1,911,172,996 | | |
| Liabilities | |
| Payable for Fund shares redeemed | | $ | 8,822,689 | | |
| Dividends payable | | | 2,954,622 | | |
| Payable to affiliate for distribution and service fees | | | 768,121 | | |
| Payable to affiliate for administration fee | | | 244,006 | | |
| Payable to affiliate for Trustees' fees | | | 282 | | |
| Accrued expenses | | | 374,317 | | |
| Total liabilities | | $ | 13,164,037 | | |
| Net Assets | | $ | 1,898,008,959 | | |
| Sources of Net Assets | |
| Paid-in capital | | $ | 1,913,336,300 | | |
Accumulated net realized loss from Portfolio (computed on the basis
of identified cost) | | | (28,760,213 | ) | |
| Accumulated undistributed net investment income | | | 1,530,823 | | |
Net unrealized appreciation from Portfolios (computed on the basis of
identified cost) | | | 11,902,049 | | |
| Total | | $ | 1,898,008,959 | | |
| Advisers Shares | |
| Net Assets | | $ | 841,865,365 | | |
| Shares Outstanding | | | 86,923,976 | | |
Net Asset Value, Offering Price and Redemption Price Per Share
(net assets ÷ shares of beneficial interest outstanding) | | $ | 9.69 | | |
| Class A Shares | |
| Net Assets | | $ | 423,213,795 | | |
| Shares Outstanding | | | 41,094,902 | | |
Net Asset Value and Redemption Price Per Share
(net assets ÷ shares of beneficial interest outstanding) | | $ | 10.30 | | |
Maximum Offering Price Per Share
(100 ÷ 97.75 of $10.54) | | $ | 10.54 | | |
| Class B Shares | |
| Net Assets | | $ | 134,212,627 | | |
| Shares Outstanding | | | 13,863,571 | | |
Net Asset Value, Offering Price and Redemption Price Per Share
(net assets ÷ shares of beneficial interest outstanding) | | $ | 9.68 | | |
| Class C Shares | |
| Net Assets | | $ | 445,986,913 | | |
| Shares Outstanding | | | 46,078,452 | | |
Net Asset Value, Offering Price and Redemption Price Per Share
(net assets ÷ shares of beneficial interest outstanding) | | $ | 9.68 | | |
| Class I Shares | |
| Net Assets | | $ | 52,730,259 | | |
| Shares Outstanding | | | 5,442,030 | | |
Net Asset Value, Offering Price and Redemption Price Per Share
(net assets ÷ shares of beneficial interest outstanding) | | $ | 9.69 | | |
| On sales of $100,000 or more, the offering price of Class A shares is reduced. | | | | | |
Statement of Operations
For the Year Ended
October 31, 2006
| Investment Income | |
| Interest allocated from Portfolios | | $ | 137,405,009 | | |
| Dividends allocated from Portfolios (Note 8) | | | 183,697 | | |
| Miscellaneous income allocated from Portfolio (Note 8) | | | 454,854 | | |
| Expenses allocated from Portfolios | | | (10,564,750 | ) | |
| Net investment income from Portfolios | | $ | 127,478,810 | | |
| Expenses | |
| Administration fee | | $ | 2,880,285 | | |
| Trustees' fees and expenses | | | 3,422 | | |
Distribution and service fees
Advisers | | | 1,992,924 | | |
| Class A | | | 1,114,776 | | |
| Class B | | | 1,494,948 | | |
| Class C | | | 4,814,027 | | |
| Transfer and dividend disbursing agent fees | | | 1,314,137 | | |
| Printing and postage | | | 270,058 | | |
| Registration fees | | | 148,338 | | |
| Legal and accounting services | | | 53,196 | | |
| Custodian fee | | | 35,102 | | |
| Miscellaneous | | | 13,550 | | |
| Total expenses | | $ | 14,134,763 | | |
| Net investment income | | $ | 113,344,047 | | |
Realized and Unrealized
Gain (Loss) from Portfolios | |
Net realized gain (loss) —
Investment transactions (identified cost basis) | | $ | 2,684,929 | | |
| Swap contracts | | | 403,778 | | |
Foreign currency and forward foreign currency exchange
contract transactions | | | (4,917,893 | ) | |
| Net realized loss | | $ | (1,829,186 | ) | |
Change in unrealized appreciation (depreciation) —
Investments (identified cost basis) | | $ | 5,324,135 | | |
| Swap contracts | | | 256,280 | | |
Foreign currency and forward foreign currency exchange
contract transactions | | | (2,018,493 | ) | |
| Net change in unrealized appreciation (depreciation) | | $ | 3,561,922 | | |
| Net realized and unrealized gain | | $ | 1,732,736 | | |
| Net increase in net assets from operations | | $ | 115,076,783 | | |
See notes to financial statements
4
Eaton Vance Floating-Rate & High Income Fund as of October 31, 2006
FINANCIAL STATEMENTS CONT'D
Statements of Changes in Net Assets
Increase (Decrease)
in Net Assets | | Year Ended
October 31, 2006 | | Year Ended
October 31, 2005 | |
From operations —
Net investment income | | $ | 113,344,047 | | | $ | 80,218,394 | | |
Net realized loss from investment transactions,
swap contracts, and foreign currency and
forward foreign currency exchange
contract transactions | | | (1,829,186 | ) | | | (1,163,130 | ) | |
Net change in unrealized
appreciation (depreciation) from
investments, swap contracts, and
foreign currency and forward foreign
currency exchange contract transactions | | | 3,561,922 | | | | (4,287,530 | ) | |
| Net increase in net assets from operations | | $ | 115,076,783 | | | $ | 74,767,734 | | |
Distributions to shareholders —
From net investment income
Advisers | | $ | (49,695,417 | ) | | $ | (29,088,136 | ) | |
| Class A | | | (27,632,711 | ) | | | (22,151,961 | ) | |
| Class B | | | (8,134,859 | ) | | | (6,796,120 | ) | |
| Class C | | | (26,223,644 | ) | | | (21,148,762 | ) | |
| Class I | | | (3,003,963 | ) | | | (1,774,593 | ) | |
| Total distributions to shareholders | | $ | (114,690,594 | ) | | $ | (80,959,572 | ) | |
Transactions in shares of beneficial interest —
Proceeds from sale of shares
Advisers | | $ | 424,664,578 | | | $ | 497,649,282 | | |
| Class A | | | 158,084,702 | | | | 310,332,995 | | |
| Class B | | | 7,842,985 | | | | 16,819,856 | | |
| Class C | | | 87,555,753 | | | | 172,756,357 | | |
| Class I | | | 28,205,944 | | | | 31,368,361 | | |
Net asset value of shares issued to shareholders in
payment of distributions declared
Advisers | | | 35,008,954 | | | | 20,738,789 | | |
| Class A | | | 21,321,139 | | | | 16,645,366 | | |
| Class B | | | 5,292,881 | | | | 4,314,073 | | |
| Class C | | | 18,122,229 | | | | 14,359,632 | | |
| Class I | | | 2,612,359 | | | | 1,499,535 | | |
Cost of shares redeemed
Advisers | | | (328,160,050 | ) | | | (279,958,379 | ) | |
| Class A | | | (235,600,058 | ) | | | (283,905,387 | ) | |
| Class B | | | (37,976,945 | ) | | | (37,221,398 | ) | |
| Class C | | | (185,720,529 | ) | | | (173,248,556 | ) | |
| Class I | | | (15,289,389 | ) | | | (19,115,507 | ) | |
Net asset value of shares exchanged
Class A | | | 4,793,984 | | | | 1,763,637 | | |
| Class B | | | (4,793,984 | ) | | | (1,763,637 | ) | |
| Redemption Fees | | | 98,648 | | | | 119,705 | | |
Net increase (decrease) in net assets from
Fund share transactions | | $ | (13,936,799 | ) | | $ | 293,154,724 | | |
| Net increase (decrease) in net assets | | $ | (13,550,610 | ) | | $ | 286,962,886 | | |
| Net Assets | | Year Ended
October 31, 2006 | | Year Ended
October 31, 2005 | |
| At beginning of year | | $ | 1,911,559,569 | | | $ | 1,624,596,683 | | |
| At end of year | | $ | 1,898,008,959 | | | $ | 1,911,559,569 | | |
Accumulated undistributed
net investment income
included in net assets | |
| At end of year | | $ | 1,530,823 | | | $ | 338,829 | | |
See notes to financial statements
5
Eaton Vance Floating-Rate & High Income Fund as of October 31, 2006
FINANCIAL STATEMENTS CONT'D
Financial Highlights
| | | Advisers Class | |
| | | Year Ended October 31, | |
| | | 2006(1) | | 2005(1) | | 2004(1) | | 2003(1) | | 2002(1)(2) | |
| Net asset value — Beginning of year | | $ | 9.680 | | | $ | 9.710 | | | $ | 9.610 | | | $ | 9.140 | | | $ | 9.550 | | |
| Income (loss) from operations | |
| Net investment income | | $ | 0.597 | | | $ | 0.451 | | | $ | 0.347 | | | $ | 0.407 | | | $ | 0.472 | | |
| Net realized and unrealized gain (loss) | | | 0.014 | | | | (0.031 | ) | | | 0.103 | | | | 0.486 | | | | (0.408 | ) | |
| Total income from operations | | $ | 0.611 | | | $ | 0.420 | | | $ | 0.450 | | | $ | 0.893 | | | $ | 0.064 | | |
| Less distributions | |
| From net investment income | | $ | (0.601 | ) | | $ | (0.451 | ) | | $ | (0.350 | ) | | $ | (0.423 | ) | | $ | (0.474 | ) | |
| Total distributions | | $ | (0.601 | ) | | $ | (0.451 | ) | | $ | (0.350 | ) | | $ | (0.423 | ) | | $ | (0.474 | ) | |
| Redemption fees | | $ | 0.000 | (3) | | $ | 0.001 | | | $ | 0.000 | (3) | | $ | 0.000 | (3) | | $ | — | | |
| Net asset value — End of year | | $ | 9.690 | | | $ | 9.680 | | | $ | 9.710 | | | $ | 9.610 | | | $ | 9.140 | | |
| Total Return(4) | | | 6.49 | % | | | 4.42 | % | | | 4.76 | % | | | 9.98 | % | | | 0.62 | % | |
| Ratios/Supplemental Data | |
| Net assets, end of year (000's omitted) | | $ | 841,865 | | | $ | 710,286 | | | $ | 474,219 | | | $ | 68,258 | | | $ | 30,960 | | |
| Ratios (As a percentage of average daily net assets): | |
| Expenses before custodian fee reduction(5) | | | 1.05 | % | | | 1.05 | % | | | 1.06 | % | | | 1.12 | % | | | 1.15 | % | |
| Expenses after custodian fee reduction(5) | | | 1.05 | % | | | 1.05 | % | | | 1.06 | % | | | 1.12 | % | | | 1.15 | % | |
| Net investment income | | | 6.16 | % | | | 4.65 | % | | | 3.59 | % | | | 4.32 | % | | | 4.98 | % | |
| Portfolio Turnover of the Floating-Rate Portfolio | | | 50 | % | | | 57 | % | | | 67 | % | | | 64 | % | | | 76 | % | |
| Portfolio Turnover of the High Income Portfolio | | | 62 | % | | | 62 | % | | | 80 | % | | | 118 | % | | | 88 | % | |
(1) Net investment income per share was computed using average shares outstanding.
(2) The Fund, through its investment in the High Income Portfolio, has adopted the provisions of the revised AICPA Audit and Accounting Guide for Investment Companies and began using the interest method to amortize premiums on fixed-income securities. The effect of this change for the year ended October 31, 2002 was to decrease net investment income per share by $0.003, decrease net realized and unrealized losses per share by $0.003, and decrease the ratio of net investment income to average net assets from 5.01% to 4.98%.
(3) Amounts represent less than $0.0005 per share.
(4) Returns are historical and are calculated by determining the percentage change in net asset value with all distributions reinvested. Total return is not computed on an annualized basis.
(5) Includes the Fund's share of the Portfolios' allocated expenses.
See notes to financial statements
6
Eaton Vance Floating-Rate & High Income Fund as of October 31, 2006
FINANCIAL STATEMENTS CONT'D
Financial Highlights
| | | Class A | |
| | | Year Ended October 31, | |
| | | 2006(1) | | 2005(1) | | 2004(1) | | 2003(1)(2) | |
| Net asset value — Beginning of year | | $ | 10.290 | | | $ | 10.320 | | | $ | 10.220 | | | $ | 10.000 | | |
| Income (loss) from operations | |
| Net investment income | | $ | 0.631 | | | $ | 0.475 | | | $ | 0.363 | | | $ | 0.179 | | |
| Net realized and unrealized gain (loss) | | | 0.018 | | | | (0.027 | ) | | | 0.109 | | | | 0.241 | | |
| Total income from operations | | $ | 0.649 | | | $ | 0.448 | | | $ | 0.472 | | | $ | 0.420 | | |
| Less distributions | |
| From net investment income | | $ | (0.639 | ) | | $ | (0.479 | ) | | $ | (0.372 | ) | | $ | (0.200 | ) | |
| Total distributions | | $ | (0.639 | ) | | $ | (0.479 | ) | | $ | (0.372 | ) | | $ | (0.200 | ) | |
| Redemption fees | | $ | 0.000 | (3) | | $ | 0.001 | | | $ | 0.000 | (3) | | $ | — | | |
| Net asset value — End of year | | $ | 10.300 | | | $ | 10.290 | | | $ | 10.320 | | | $ | 10.220 | | |
| Total Return(4) | | | 6.49 | % | | | 4.43 | % | | | 4.69 | % | | | 4.23 | % | |
| Ratios/Supplemental Data | |
| Net assets, end of year (000's omitted) | | $ | 423,214 | | | $ | 474,435 | | | $ | 431,257 | | | $ | 39,128 | | |
| Ratios (As a percentage of average daily net assets): | |
| Expenses before custodian fee reduction(5) | | | 1.05 | % | | | 1.05 | % | | | 1.07 | % | | | 1.12 | %(6) | |
| Expenses after custodian fee reduction(5) | | | 1.05 | % | | | 1.05 | % | | | 1.07 | % | | | 1.12 | %(6) | |
| Net investment income | | | 6.13 | % | | | 4.60 | % | | | 3.52 | % | | | 3.68 | %(6) | |
| Portfolio Turnover of the Floating-Rate Portfolio | | | 50 | % | | | 57 | % | | | 67 | % | | | 64 | % | |
| Portfolio Turnover of the High Income Portfolio | | | 62 | % | | | 62 | % | | | 80 | % | | | 118 | % | |
(1) Net investment income per share was computed using average shares outstanding.
(2) For the period from the start of business, May 7, 2003, to October 31, 2003.
(3) Amounts represent less than $0.005 per share.
(4) Returns are historical and are calculated by determining the percentage change in net asset value with all distributions reinvested. Total return is not computed on an annualized basis.
(5) Includes the Fund's share of the Portfolios' allocated expenses.
(6) Annualized.
See notes to financial statements
7
Eaton Vance Floating-Rate & High Income Fund as of October 31, 2006
FINANCIAL STATEMENTS CONT'D
Financial Highlights
| | | Class B | |
| | | Year Ended October 31, | |
| | | 2006(1) | | 2005(1) | | 2004(1) | | 2003(1) | | 2002(1)(2) | |
| Net asset value — Beginning of year | | $ | 9.680 | | | $ | 9.700 | | | $ | 9.600 | | | $ | 9.140 | | | $ | 9.550 | | |
| Income (loss) from operations | |
| Net investment income | | $ | 0.520 | | | $ | 0.373 | | | $ | 0.275 | | | $ | 0.348 | | | $ | 0.400 | | |
| Net realized and unrealized gain (loss) | | | 0.008 | | | | (0.017 | ) | | | 0.102 | | | | 0.465 | | | | (0.407 | ) | |
| Total income (loss) from operations | | $ | 0.528 | | | $ | 0.356 | | | $ | 0.377 | | | $ | 0.813 | | | $ | (0.007 | ) | |
| Less distributions | |
| From net investment income | | $ | (0.528 | ) | | $ | (0.377 | ) | | $ | (0.277 | ) | | $ | (0.353 | ) | | $ | (0.403 | ) | |
| Total distributions | | $ | (0.528 | ) | | $ | (0.377 | ) | | $ | (0.277 | ) | | $ | (0.353 | ) | | $ | (0.403 | ) | |
| Redemption fees | | $ | 0.000 | (3) | | $ | 0.001 | | | $ | 0.000 | (3) | | $ | — | | | $ | — | | |
| Net asset value — End of year | | $ | 9.680 | | | $ | 9.680 | | | $ | 9.700 | | | $ | 9.600 | | | $ | 9.140 | | |
| Total Return(4) | | | 5.60 | % | | | 3.74 | % | | | 3.98 | % | | | 9.05 | % | | | (0.13 | )% | |
| Ratios/Supplemental Data | |
| Net assets, end of year (000's omitted) | | $ | 134,213 | | | $ | 163,795 | | | $ | 182,045 | | | $ | 161,457 | | | $ | 165,834 | | |
| Ratios (As a percentage of average daily net assets): | |
| Expenses before custodian fee reduction(5) | | | 1.80 | % | | | 1.80 | % | | | 1.82 | % | | | 1.87 | % | | | 1.90 | % | |
| Expenses after custodian fee reduction(5) | | | 1.80 | % | | | 1.80 | % | | | 1.82 | % | | | 1.87 | % | | | 1.90 | % | |
| Net investment income | | | 5.37 | % | | | 3.84 | % | �� | | 2.84 | % | | | 3.71 | % | | | 4.22 | % | |
| Portfolio Turnover of the Floating-Rate Portfolio | | | 50 | % | | | 57 | % | | | 67 | % | | | 64 | % | | | 76 | % | |
| Portfolio Turnover of the High Income Portfolio | | | 62 | % | | | 62 | % | | | 80 | % | | | 118 | % | | | 88 | % | |
(1) Net investment income per share was computed using average shares outstanding.
(2) The Fund, through its investment in the High Income Portfolio, has adopted the provisions of the revised AICPA Audit and Accounting Guide for Investment Companies and began using the interest method to amortize premiums on fixed-income securities. The effect of this change for the year ended October 31, 2002 was to decrease net investment income per share by $0.003, decrease net realized and unrealized losses per share by $0.003, and decrease the ratio of net investment income to average net assets from 4.25% to 4.22%.
(3) Amounts represent less than $0.0005 per share.
(4) Returns are historical and are calculated by determining the percentage change in net asset value with all distributions reinvested. Total return is not computed on an annualized basis.
(5) Includes the Fund's share of the Portfolios' allocated expenses.
See notes to financial statements
8
Eaton Vance Floating-Rate & High Income Fund as of October 31, 2006
FINANCIAL STATEMENTS CONT'D
Financial Highlights
| | | Class C | |
| | | Year Ended October 31, | |
| | | 2006(1) | | 2005(1) | | 2004(1) | | 2003(1) | | 2002(1)(2) | |
| Net asset value — Beginning of year | | $ | 9.680 | | | $ | 9.700 | | | $ | 9.600 | | | $ | 9.140 | | | $ | 9.540 | | |
| Income (loss) from operations | |
| Net investment income | | $ | 0.521 | | | $ | 0.374 | | | $ | 0.273 | | | $ | 0.346 | | | $ | 0.401 | | |
| Net realized and unrealized gain (loss) | | | 0.007 | | | | (0.018 | ) | | | 0.104 | | | | 0.467 | | | | (0.398 | ) | |
| Total income from operations | | $ | 0.528 | | | $ | 0.356 | | | $ | 0.377 | | | $ | 0.813 | | | $ | 0.003 | | |
| Less distributions | |
| From net investment income | | $ | (0.528 | ) | | $ | (0.377 | ) | | $ | (0.277 | ) | | $ | (0.353 | ) | | $ | (0.403 | ) | |
| Total distributions | | $ | (0.528 | ) | | $ | (0.377 | ) | | $ | (0.277 | ) | | $ | (0.353 | ) | | $ | (0.403 | ) | |
| Redemption fees | | $ | 0.000 | (3) | | $ | 0.001 | | | $ | 0.000 | (3) | | $ | — | | | $ | — | | |
| Net asset value — End of year | | $ | 9.680 | | | $ | 9.680 | | | $ | 9.700 | | | $ | 9.600 | | | $ | 9.140 | | |
| Total Return(4) | | | 5.59 | % | | | 3.74 | % | | | 3.98 | % | | | 9.06 | % | | | (0.03 | )% | |
| Ratios/Supplemental Data | |
| Net assets, end of year (000's omitted) | | $ | 445,987 | | | $ | 525,843 | | | $ | 513,459 | | | $ | 303,297 | | | $ | 279,061 | | |
| Ratios (As a percentage of average daily net assets): | |
| Expenses before custodian fee reduction(5) | | | 1.80 | % | | | 1.80 | % | | | 1.82 | % | | | 1.87 | % | | | 1.91 | % | |
| Expenses after custodian fee reduction(5) | | | 1.80 | % | | | 1.80 | % | | | 1.82 | % | | | 1.87 | % | | | 1.91 | % | |
| Net investment income | | | 5.38 | % | | | 3.85 | % | | | 2.83 | % | | | 3.69 | % | | | 4.23 | % | |
| Portfolio Turnover of the Floating-Rate Portfolio | | | 50 | % | | | 57 | % | | | 67 | % | | | 64 | % | | | 76 | % | |
| Portfolio Turnover of the High Income Portfolio | | | 62 | % | | | 62 | % | | | 80 | % | | | 118 | % | | | 88 | % | |
(1) Net investment income per share was computed using average shares outstanding.
(2) The Fund, through its investment in the High Income Portfolio, has adopted the provisions of the revised AICPA Audit and Accounting Guide for Investment Companies and began using the interest method to amortize premiums on fixed-income securities. The effect of this change for the year ended October 31, 2002 was to decrease net investment income per share by $0.003, decrease net realized and unrealized losses per share by $0.003, and decrease the ratio of net investment income to average net assets from 4.26% to 4.23%.
(3) Amounts represent less than $0.0005 per share.
(4) Returns are historical and are calculated by determining the percentage change in net asset value with all distributions reinvested. Total return is not computed on an annualized basis.
(5) Includes the Fund's share of the Portfolios' allocated expenses.
See notes to financial statements
9
Eaton Vance Floating-Rate & High Income Fund as of October 31, 2006
FINANCIAL STATEMENTS CONT'D
Financial Highlights
| | | Class I | |
| | | Year Ended October 31, | |
| | | 2006(1) | | 2005(1) | | 2004(1) | | 2003(1) | | 2002(1)(2) | |
| Net asset value — Beginning of year | | $ | 9.690 | | | $ | 9.710 | | | $ | 9.610 | | | $ | 9.150 | | | $ | 9.550 | | |
| Income (loss) from operations | |
| Net investment income | | $ | 0.623 | | | $ | 0.474 | | | $ | 0.373 | | | $ | 0.432 | | | $ | 0.500 | | |
| Net realized and unrealized gain (loss) | | | 0.003 | | | | (0.020 | ) | | | 0.102 | | | | 0.476 | | | | (0.402 | ) | |
| Total income from operations | | $ | 0.626 | | | $ | 0.454 | | | $ | 0.475 | | | $ | 0.908 | | | $ | 0.098 | | |
| Less distributions | |
| From net investment income | | $ | (0.626 | ) | | $ | (0.475 | ) | | $ | (0.375 | ) | | $ | (0.448 | ) | | $ | (0.498 | ) | |
| Total distributions | | $ | (0.626 | ) | | $ | (0.475 | ) | | $ | (0.375 | ) | | $ | (0.448 | ) | | $ | (0.498 | ) | |
| Redemption fees | | $ | 0.000 | (3) | | $ | 0.001 | | | $ | 0.000 | (3) | | $ | — | | | $ | — | | |
| Net asset value — End of year | | $ | 9.690 | | | $ | 9.690 | | | $ | 9.710 | | | $ | 9.610 | | | $ | 9.150 | | |
| Total Return(4) | | | 6.65 | % | | | 4.78 | % | | | 5.02 | % | | | 10.14 | % | | | 0.98 | % | |
| Ratios/Supplemental Data | |
| Net assets, end of year (000's omitted) | | $ | 52,730 | | | $ | 37,200 | | | $ | 23,618 | | | $ | 3,355 | | | $ | 1,681 | | |
| Ratios (As a percentage of average daily net assets): | |
| Expenses before custodian fee reduction(5) | | | 0.80 | % | | | 0.80 | % | | | 0.82 | % | | | 0.87 | % | | | 0.94 | % | |
| Expenses after custodian fee reduction(5) | | | 0.80 | % | | | 0.80 | % | | | 0.82 | % | | | 0.87 | % | | | 0.94 | % | |
| Net investment income | | | 6.42 | % | | | 4.88 | % | | | 3.85 | % | | | 4.59 | % | | | 5.24 | % | |
| Portfolio Turnover of the Floating-Rate Portfolio | | | 50 | % | | | 57 | % | | | 67 | % | | | 64 | % | | | 76 | % | |
| Portfolio Turnover of the High Income Portfolio | | | 62 | % | | | 62 | % | | | 80 | % | | | 118 | % | | | 88 | % | |
(1) Net investment income per share was computed using average shares outstanding.
(2) The Fund, through its investment in the High Income Portfolio, has adopted the provisions of the revised AICPA Audit and Accounting Guide for Investment Companies and began using the interest method to amortize premiums on fixed-income securities. The effect of this change for the year ended October 31, 2002 was to decrease net investment income per share by $0.003, decrease net realized and unrealized losses per share by $0.003, and decrease the ratio of net investment income to average net assets from 5.27% to 5.24%.
(3) Amounts represent less than $0.0005 per share.
(4) Returns are historical and are calculated by determining the percentage change in net asset value with all distributions reinvested. Total return is not computed on an annualized basis.
(5) Includes the Fund's share of the Portfolios' allocated expenses.
See notes to financial statements
10
Eaton Vance Floating-Rate & High Income Fund as of October 31, 2006
NOTES TO FINANCIAL STATEMENTS
1 Significant Accounting Policies
Eaton Vance Floating-Rate & High Income Fund (the Fund) is a series of Eaton Vance Mutual Funds Trust (the Trust). The Trust is an entity of the type commonly known as a Massachusetts business trust and is registered under the Investment Company Act of 1940, as amended, as an open-end management investment company. The Fund offers five classes of shares. The Advisers Class and Class I shares are generally sold at net asset value per share and assess a redemption fee of 1% for shares redeemed or exchanged within 90 days of purchase. Class A shares are generally sold subject to a sales charge imposed at time of purchase and assess a redemption fee of 1% for shares redeemed or exchanged within 90 days of purchase. Class B and Class C shares are sold at net asset value and are generally subject to a contingent deferred sales charge (see Note 6). Class B shares held for eight years will automatically convert to Class A shares. Ea ch class represents a pro rata interest in the Fund, but votes separately on class-specific matters and (as noted below) is subject to different expenses. Realized and unrealized gains and losses are allocated daily to each class of shares based on the relative net assets of each class to the total net assets of the Fund. Net investment income, other than class specific expenses, is allocated daily to each class of shares based upon the ratio of the value of each class' paid shares to the total value of all paid shares. Each class of shares differs in its distribution plan and certain other class specific expenses. The Fund invests all of its investable assets in interests in two Portfolios, Floating Rate Portfolio and High Income Portfolio (the Portfolios), New York trusts having the same investment objectives as the Fund. The value of the Fund's investment in the Portfolios reflects the Fund's proportionate interest in the net assets of the Floating Rate Portfolio and the High Income Portfolio (22.3% and 2 2.7% at October 31, 2006, respectively). The performance of the Fund is directly affected by the performance of the Portfolios. The financial statements of the Floating Rate Portfolio (Portfolio), including the portfolio of investments, are included elsewhere in this report and should be read in conjunction with the Fund's financial statements. See Note 8 for further information on the results of operations of High Income Portfolio. A copy of the financial statements of High Income Portfolio is available on the EDGAR Database on The Securities and Exchange Commission's website (www.sec.gov), at the Commission's public reference room in Washington, D.C. or upon request from the Fund's principal underwriter, Eaton Vance Distributors, Inc. (EVD), by calling 1-800-225-6265.
The following is a summary of significant accounting policies consistently followed by the Fund in the preparation of its financial statements. The policies are in conformity with accounting principles generally accepted in the United States of America.
A Investment Valuation — Valuation of securities by the Floating Rate Portfolio is discussed in Note 1A of the Portfolio's Notes to Financial Statements, which are included elsewhere in this report. High Income Portfolio's valuation policies are as follows: investments listed on securities exchanges are valued at closing sale prices. Investments listed on the NASDAQ National Market System are valued at the NASDAQ official closing price. Listed or unlisted investments for which closing sale prices are not available are valued at the mean between the latest bid and asked prices. Fixed income investments (other than short-term obligations), including listed investments and investments for which price quotations are available, will normally be valued on the basis of market va luations furnished by a pricing service. Financial futures contracts listed on commodity exchanges are valued at closing settlement prices. Short-term obligations, maturing in sixty days or less, are valued at amortized cost, which approximates fair value. High Income Portfolio also invests in interests in senior floating rate loans (Senior Loans). High Income Portfolio's investment adviser, Boston Management and Research (BMR) a wholly owned subsidiary of Eaton Vance Management (EVM), has characterized certain Senior Loans as liquid based on a predetermined acceptable number and range of market quotations available. Such loans are valued on the basis of market valuations furnished by a pricing service. Investments for which there are no quotations or valuations are valued at fair value using methods determined in good faith by or at the direction of the Trustees. Other Senior Loans are valued at fair value by BMR under procedures established by the Trustees as permitted by section 2(a)(41) of the Investment Company Act of 1940.
B Income — The Fund's net investment income or loss consists of the Fund's pro rata share of the net investment income or loss of the Portfolios, less all actual and accrued expenses of the Fund.
C Federal Taxes — The Fund's policy is to comply with the provisions of the Internal Revenue Code applicable to regulated investment companies and to distribute to shareholders, each year, substantially all of its net investment income and all or substantially all of its net realized capital gains. Accordingly, no provision for federal income or excise tax is necessary. At October 31, 2006, the Fund, for Federal income tax purposes, had a capital loss carryover of $28,625,900 which will reduce the Fund's taxable income arising from future net realized gains on investments, if any, to the extent permitted by the Internal Revenue Code, and thus will reduce the amount of the distributions to shareholders which would otherwise be necessary to relieve the Fund of any liability for federal
11
Eaton Vance Floating-Rate & High Income Fund as of October 31, 2006
NOTES TO FINANCIAL STATEMENTS CONT'D
income or excise tax. Such capital loss carryover will expire on October 31, 2009 ($4,920,615), October 31, 2010 ($16,168,986), October 31, 2011 ($2,993,864), October 31, 2012 ($2,290,023) and October 31, 2013 ($2,252,412).
D Use of Estimates — The preparation of the financial statements in conformity with accounting principles generally accepted in the United States of America requires management to make estimates and assumptions that affect the reported amounts of assets and liabilities at the date of the financial statements and the reported amounts of income and expense during the reporting period. Actual results could differ from those estimates.
E Expenses — The majority of expenses of the Trust are directly identifiable to an individual fund. Expenses which are not readily identifiable to a specific fund are allocated taking into consideration, among other things, the nature and type of expense and the relative size of the funds.
F Indemnifications — Under the Trust's organizational documents, its officers and Trustees may be indemnified against certain liabilities and expenses arising out of the performance of their duties to the Fund, and shareholders are indemnified against personal liability for the obligations of the Trust. Additionally, in the normal course of business, the Fund enters into agreements with service providers that may contain indemnification clauses. The Fund's maximum exposure under these arrangements is unknown as this would involve future claims that may be made against the Fund that have not yet occurred.
2 Distributions to Shareholders
The net income of the Fund is determined daily and substantially all of the net income so determined is declared as a dividend to shareholders of record at the time of declaration. Distributions are paid monthly. Distributions of allocated realized capital gains, if any, are made at least annually. Shareholders may reinvest all distributions in additional shares of the Fund at the net asset value as of the ex-dividend date. Distributions are paid in the form of additional shares or, at the election of the shareholder, in cash. The Fund distinguishes between distributions on a tax basis and a financial reporting basis. Accounting principles generally accepted in the United States of America require that only distributions in excess of tax basis earnings and profits be reported in the financial statements as a return of capital. Permanent differences between book and tax accounting relating to distributions are reclassified to pai d-in capital.
The tax character of distributions declared for the years ended October 31, 2006 and October 31, 2005 was as follows:
| | | Year Ended October 31, | |
| | | 2006 | | 2005 | |
| Distributions declared from: | |
|
| Ordinary income | | $ | 114,690,594 | | | $ | 80,959,572 | | |
|
During the year ended October 31, 2006, accumulated undistributed net investment income was increased by $2,538,541, accumulated net realized loss was decreased by $4,585,439 and paid in capital was decreased by $7,123,980 primarily due to differences between book and tax accounting for foreign currency gain/loss, and accounting for mixed straddles and swaps. This change had no effect on the net assets or the net asset value per share.
As of October 31, 2006, the components of distributable earnings (accumulated losses) on a tax basis were as follows:
| Undistributed income | | $ | 4,485,445 | | |
| Capital loss carryforwards | | $ | (28,625,900 | ) | |
| Unrealized gain | | $ | 11,767,736 | | |
| Other temporary differences | | $ | (2,954,622 | ) | |
The differences between components of distributable earnings (accumulated loss) on a tax basis and the amounts reflected in the statement of assets and liabilities are primarily due to differences in book and tax policies for forward currency contracts, wash sales and the timing of recognizing distributions to shareholders.
3 Shares of Beneficial Interest
The Fund's Declaration of Trust permits the Trustees to issue an unlimited number of full and fractional shares of beneficial interest (without par value). Such shares may be issued in a number of different series (such as the Fund) and classes. Transactions in Fund shares were as follows:
| | | Year Ended October 31, | |
| Advisers | | 2006 | | 2005 | |
| Sales | | | 43,826,477 | | | | 51,182,623 | | |
Issued to shareholders electing to receive
payments of distributions in Fund shares | | | 3,614,358 | | | | 2,135,355 | | |
| Redemptions | | | (33,879,133 | ) | | | (28,816,968 | ) | |
| Net increase | | | 13,561,702 | | | | 24,501,010 | | |
12
Eaton Vance Floating-Rate & High Income Fund as of October 31, 2006
NOTES TO FINANCIAL STATEMENTS CONT'D
| | | Year Ended October 31, | |
| Class A | | 2006 | | 2005 | |
| Sales | | | 15,347,691 | | | | 30,010,219 | | |
Issued to shareholders electing to receive
payments of distributions in Fund shares | | | 2,070,077 | | | | 1,611,517 | | |
| Redemptions | | | (22,872,887 | ) | | | (27,503,909 | ) | |
| Exchange from Class B shares | | | 465,766 | | | | 170,680 | | |
| Net increase (decrease) | | | (4,989,353 | ) | | | 4,288,507 | | |
| | | Year Ended October 31, | |
| Class B | | 2006 | | 2005 | |
| Sales | | | 810,096 | | | | 1,730,075 | | |
Issued to shareholders electing to receive
payments of distributions in Fund shares | | | 546,656 | | | | 444,269 | | |
| Redemptions | | | (3,922,996 | ) | | | (3,832,405 | ) | |
| Exchange to Class A shares | | | (494,760 | ) | | | (181,411 | ) | |
| Net decrease | | | (3,061,004 | ) | | | (1,839,472 | ) | |
| | | Year Ended October 31, | |
| Class C | | 2006 | | 2005 | |
| Sales | | | 9,042,842 | | | | 17,775,075 | | |
Issued to shareholders electing to receive
payments of distributions in Fund shares | | | 1,872,062 | | | | 1,479,069 | | |
| Redemptions | | | (19,183,297 | ) | | | (17,848,184 | ) | |
| Net increase (decrease) | | | (8,268,393 | ) | | | 1,405,960 | | |
| | | Year Ended October 31, | |
| Class I | | 2006 | | 2005 | |
| Sales | | | 2,909,649 | | | | 3,222,632 | | |
Issued to shareholders electing to receive
payments of distributions in Fund shares | | | 269,587 | | | | 154,291 | | |
| Redemptions | | | (1,577,675 | ) | | | (1,969,142 | ) | |
| Net increase | | | 1,601,561 | | | | 1,407,781 | | |
Redemptions or exchanges of Advisers Class, Class A and Class I shares made within 90 days of purchase are subject to a redemption fee equal to 1.00% of the amount redeemed. For the year ended October 31, 2006 the Fund received $98,648 in redemption fees.
4 Transactions with Affiliates
The Fund is authorized to pay Eaton Vance Management, (EVM), a fee as compensation for administrative services necessary to conduct the Fund's business. The fee is computed at the annual rate of 0.15% (annualized) of the Fund's average daily net assets. For the year ended October 31, 2006, the fee amounted to $2,880,285. The Portfolios have engaged Boston Management and Research, (BMR), a subsidiary of EVM, to render investment advisory services. See Note 2 of each of the Portfolio's Notes to Financial Statements. Except as to Trustees of the Fund and the Portfolios who are not members of EVM's or BMR's organization, officers and Trustees receive remuneration for their services to the Fund out of the investment adviser fee earned by BMR. EVM serves as the sub-transfer agent of the Fund and receives from the transfer agent an aggregate fee based upon the actu al expenses incurred by EVM in the performance of those services. During the year ended October 31, 2006, EVM earned $58,522 in sub-transfer agent fees. Certain officers and Trustees of the Fund and the Portfolios are officers of the above organizations. The Fund was informed that EVD, a subsidiary of EVM and the Fund's principal underwriter, received $35,775 from the Fund as its portion of the sales charge on sales of Class A shares for the year ended October 31, 2006.
5 Distribution Plans
The Fund has in effect a distribution plan pursuant to Rule 12b-1 for the Adviser Class shares and Class A shares. The Plan provides that the Fund will pay EVD a distribution and service fee of 0.25% (annualized) of the Fund's average daily net assets attributable to Advisers Class shares and Class A shares for each fiscal year for distribution services and facilities provided to the Fund by EVD, as well as for personal services and/or the maintenance of shareholder accounts. Distribution and service fees paid or accrued for the year ended October 31, 2006 amounted to $1,992,924 and $1,114,776 for Adviser Class shares and Class A shares, respectively. The Fund also has in effect distribution plans for Class B shares (Class B Plan) and Class C shares (Class C Plan) pursuant to Rule 12b-1 under the Investment Company Act of 1940. The Class B and Class C Plans require the Fund to pay EVD amounts equal to 1/365 of 0.75% of the Fund' s average daily net assets attributable to Class B and Class C shares for providing ongoing distribution services and facilities to the Fund. The Fund will automatically discontinue payments to EVD during any period in which there are no outstanding Uncovered Distribution Charges, which are equivalent to the sum of (i) 6.25% of the aggregate amount received by the Fund for the Class B and Class C shares sold, respectively, plus (ii) interest calculated by applying the rate of 1% over the prevailing prime rate to the outstanding balance of Uncovered Distribution Charges of EVD of each respective class, reduced by the aggregate
13
Eaton Vance Floating-Rate & High Income Fund as of October 31, 2006
NOTES TO FINANCIAL STATEMENTS CONT'D
amount of contingent deferred sales charges (see Note 6) and daily amounts theretofore paid to EVD by each respective class. The Fund paid or accrued $1,121,211 and $3,610,520 for Class B and Class C shares, respectively, to or payable to EVD for the year ended October 31, 2006, representing 0.75% of the average daily net assets for Class B and Class C shares. At October 31, 2006, the amount of Uncovered Distribution Charges of EVD calculated under the Plans was approximately $7,505,000 and $51,679,000 for Class B and Class C shares, respectively. The Class B and Class C Plans also authorize the Fund to make payments of service fees to EVD, investment dealers and other persons in amounts not exceeding 0.25% annually of the average daily net assets attributable to that Class. Service fees are paid for personal services and/or the maintenance of shareholder accounts. They are separate and distinct from the Class B and Class C sale s commissions and distribution fees and, as such, are not subject to automatic discontinuance when there are no outstanding Uncovered Distribution Charges to EVD. Service fees paid or accrued for the year ended October 31, 2006 amounted to $373,737, and $1,203,507, for Class B and Class C shares, respectively.
6 Contingent Deferred Sales Charge
Effective September 15, 2006 all purchases of Class A shares of $1 million or more will be subject to a 1% contingent deferred sales charge (CDSC) in the event of redemption within 18 months of purchase. Prior to September 15, 2006, Class A shares purchased at net asset value in amounts of $1 million or more (other than shares purchased in a single transaction of $5 million or more) were subject to a 1% CDSC if redeemed within 12 months of purchase. A CDSC is generally imposed on redemptions of Class B shares made within six years of purchase and on redemptions of Class C shares made within one year of purchase. Generally, the CDSC is based on the lower of the net asset value at the date of redemption or date of purchase. No charge is levied on shares acquired by reinvestment of dividends or capital gains distributions. Class B CDSC is imposed at declining rates that begin at 5% in the case of redemptions in the first and second years of redemption after purchase, declining one percentage point each subsequent year. Class C shares will be subject to a 1% CDSC if redeemed within one year of purchase. No CDSC is levied on shares which have been sold to EVM or its affiliates or to their respective employees or clients and may be waived under certain other limited conditions. CDSC charges are paid to EVD to reduce the amount of Uncovered Distribution Charges calculated under each Class' Distribution Plan. CDSC charges received when no Uncovered Distribution Charges exist will be credited to the Fund. The Fund has been informed that EVD received approximately $24,000, $478,000, and $154,000 of CDSC paid by shareholders of Class A, Class B, and Class C shares, respectively, for the year ended October 31, 2006.
7 Investment Transactions
Increases and decreases in the Fund's investment in the Floating Rate Portfolio for the year ended October 31, 2006, aggregated $98,564,013 and $221,661,384, respectively. Increases and decreases in the Fund's investment in the High Income Portfolio for the year ended October 31, 2006, aggregated $17,837,814 and $39,560,879, respectively.
8 Investment in Portfolios
For the year ended October 31, 2006, the Fund was allocated net investment income and realized and unrealized gain (loss) from the Portfolios as follows:
| | | Floating Rate
Portfolio | | High Income
Portfolio | | Total | |
| Dividend income | | $ | 1,573 | | | $ | 182,124 | | | $ | 183,697 | | |
| Interest income | | | 116,583,292 | | | | 20,821,717 | | | | 137,405,009 | | |
| Miscellaneous income | | | — | | | | 454,854 | | | | 454,854 | | |
| Expenses | | | (9,118,427 | ) | | | (1,446,323 | ) | | | (10,564,750 | ) | |
| Net investment income | | $ | 107,466,438 | | | $ | 20,012,372 | | | $ | 127,478,810 | | |
| Net realized gain (loss) — | | | | | | | | | | | | | |
Investments
(identified cost basis) | | $ | (644,288 | ) | | $ | 3,329,217 | | | $ | 2,684,929 | | |
| Swap contracts | | | 338,400 | | | | 65,378 | | | | 403,778 | | |
Foreign currency, and
forward foreign currency
exchange contracts | | | (4,922,652 | ) | | | 4,759 | | | | (4,917,893 | ) | |
Net realized gain (loss)
on investments | | $ | (5,228,540 | ) | | $ | 3,399,354 | | | $ | (1,829,186 | ) | |
Change in unrealized
appreciation (depreciation) | | | | | | | | | | | | | |
| Investment transactions | | $ | 1,788,208 | | | $ | 3,535,927 | | | $ | 5,324,135 | | |
| Swap contracts | | | 293,845 | | | | (37,565 | ) | | | 256,280 | | |
Foreign currency, and
forward foreign currency
exchange contracts | | | (2,011,311 | ) | | | (7,182 | ) | | | (2,018,493 | ) | |
Net change in unrealized
appreciation (depreciation) | | $ | 70,742 | | | $ | 3,491,180 | | | $ | 3,561,922 | | |
14
Eaton Vance Floating-Rate & High Income Fund as of October 31, 2006
NOTES TO FINANCIAL STATEMENTS CONT'D
9 Recently Issued Accounting Pronouncements
In June 2006, the Financial Accounting Standards Board ("FASB") issued FASB Interpretation No. 48, ("FIN 48") "Accounting for Uncertainty in Income Taxes – an interpretation of FASB Statement No. 109". FIN 48 clarifies the accounting for uncertainty in income taxes recognized in accordance with FASB Statement No. 109, "Accounting for Income Taxes." This interpretation prescribes a recognition threshold and measurement attribute for the financial statement recognition and measurement of a tax position taken or expected to be taken in a tax return. It also provides guidance on de-recognition, classification, interest and penalties, accounting in interim periods, disclosure and transition. FIN 48 is effective for fiscal years beginning after December 15, 2006. Management is currently evaluating the impact of applying the various provisions of FIN 48.
In September 2006, the Financial Accounting Standards Board ("FASB") issued Statement of Financial Accounting Standards No. 157, ("FAS 157") "Fair Value Measurements". FAS 157 defines fair value, establishes a framework for measuring fair value in accordance with generally accepted accounting principles and expands disclosure about fair value measurements. FAS 157 is effective for fiscal years beginning after November 15, 2007. Management is currently evaluating the impact the adoption of FAS 157 will have on the Fund's financial statement disclosures.
15
Eaton Vance Floating-Rate & High Income Fund as of October 31, 2006
REPORT OF INDEPENDENT REGISTERED PUBLIC ACCOUNTING FIRM
To the Trustees and Shareholders of Eaton Vance Floating-Rate & High Income Fund:
We have audited the accompanying statement of assets and liabilities of Eaton Vance Floating-Rate & High Income Fund (the Fund) as of October 31, 2006, and the related statement of operations for the year then ended, the statements of changes in net assets for each of the two years in the period then ended, and the financial highlights for each of the five years in the period then ended. These financial statements and financial highlights are the responsibility of the Fund's management. Our responsibility is to express an opinion on these financial statements and financial highlights based on our audits.
We conducted our audits in accordance with the standards of the Public Company Accounting Oversight Board (United States). Those standards require that we plan and perform the audit to obtain reasonable assurance about whether the financial statements and financial highlights are free of material misstatement. The Fund is not required to have, nor were we engaged to perform, an audit of its internal control over financial reporting. Our audits included consideration of internal control over financial reporting as a basis for designing audit procedures that are appropriate in the circumstances, but not for the purpose of expressing an opinion on the effectiveness of the Fund's internal control over financial reporting. Accordingly, we express no such opinion. An audit also includes examining, on a test basis, evidence supporting the amounts and disclosures in the financial statements, assessing the accounting principles used and significant estimates made by management, as well as evaluating the overall financial statement presentation. We believe that our audits provide a reasonable basis for our opinion.
In our opinion, the financial statements and financial highlights referred to above present fairly, in all material respects, the financial position of the Eaton Vance Floating-Rate & High Income Fund as of October 31, 2006, the results of its operations for the year then ended, the changes in its net assets for each of the two years in the period then ended, and the financial highlights for each of the five years in the period then ended, in conformity with accounting principles generally accepted in the United States of America.
DELOITTE & TOUCHE LLP
Boston, Massachusetts
December 15, 2006
16
Eaton Vance Floating-Rate & High Income Fund as of October 31, 2006
FEDERAL TAX INFORMATION (Unaudited)
The Form 1099-DIV you receive in January 2007 will show the tax status of all distributions paid to your account in calendar 2006. Shareholders are advised to consult their own tax adviser with respect to the tax consequences of their investment in the Fund.
17
Floating Rate Portfolio as of October 31, 2006
PORTFOLIO OF INVESTMENTS
| Senior Floating Rate Interests — 98.7%(1) | | | |
Principal
Amount | | Borrower/Tranche Description | | Value | |
| Aerospace and Defense — 1.9% | | | |
| Alliant Techsystems, Inc. | | | |
| $ | 3,748,500 | | | Term Loan, 6.46%, Maturing March 31, 2009 | | $ | 3,754,749 | | |
| BE Aerospace, Inc. | | | |
| | 4,550,000 | | | Term Loan, 7.63%, Maturing August 24, 2012 | | | 4,579,384 | | |
| CACI International, Inc. | | | |
| | 11,189,159 | | | Term Loan, 6.93%, Maturing May 3, 2011 | | | 11,222,235 | | |
| Dresser Rand Group, Inc. | | | |
| EUR | 787,623 | | | Term Loan, 5.51%, Maturing October 29, 2011 | | | 1,009,053 | | |
| | 2,965,758 | | | Term Loan, 7.48%, Maturing October 29, 2011 | | | 2,983,182 | | |
| DRS Technologies, Inc. | | | |
| | 3,218,763 | | | Term Loan, 6.81%, Maturing January 31, 2013 | | | 3,229,829 | | |
| Forgings International Holding | | | |
| GBP | 750,000 | | | Term Loan, 6.58%, Maturing August 11, 2014 | | | 1,446,978 | | |
| | 2,855,850 | | | Term Loan, 7.83%, Maturing August 11, 2014 | | | 2,891,548 | | |
| GBP | 750,000 | | | Term Loan, 6.83%, Maturing August 11, 2015 | | | 1,453,236 | | |
| | 2,855,850 | | | Term Loan, 8.08%, Maturing August 11, 2015 | | | 2,902,258 | | |
| | | Hexcel Corp. | |
| | 12,899,804 | | | Term Loan, 7.13%, Maturing March 1, 2012 | | | 12,932,054 | | |
| IAP Worldwide Services, Inc. | | | |
| | 7,840,750 | | | Term Loan, 8.44%, Maturing December 30, 2012 | | | 7,850,551 | | |
| Jet Aviation Holding, AG | | | |
| | 4,415,888 | | | Term Loan, 7.62%, Maturing May 15, 2013 | | | 4,404,848 | | |
| K&F Industries, Inc. | | | |
| | 9,247,075 | | | Term Loan, 7.32%, Maturing November 18, 2012 | | | 9,291,868 | | |
| Spirit Aerosystems, Inc. | | | |
| | 8,295,200 | | | Term Loan, 7.57%, Maturing December 31, 2011 | | | 8,369,077 | | |
| Standard Aero Holdings, Inc. | | | |
| | 8,323,870 | | | Term Loan, 7.61%, Maturing August 24, 2012 | | | 8,339,477 | | |
| Transdigm, Inc. | | | |
| | 15,650,000 | | | Term Loan, 7.39%, Maturing June 23, 2013 | | | 15,765,419 | | |
| Vought Aircraft Industries, Inc. | | | |
| | 10,000,000 | | | Revolving Loan, 7.80%, Maturing December 22, 2009(2) | | | 9,575,000 | | |
| | 4,000,000 | | | Term Loan, 7.33%, Maturing December 22, 2010 | | | 4,023,752 | | |
| | 9,045,008 | | | Term Loan, 7.88%, Maturing December 22, 2011 | | | 9,106,252 | | |
| Wam Aquisition, S.A. | | | |
| | 4,714,710 | | | Term Loan, 8.12%, Maturing April 8, 2013 | | | 4,753,554 | | |
| | 4,714,710 | | | Term Loan, 8.62%, Maturing April 8, 2014 | | | 4,771,767 | | |
| EUR | 500,000 | | | Term Loan, 6.13%, Maturing May 4, 2014 | | | 645,948 | | |
| EUR | 500,000 | | | Term Loan, 6.63%, Maturing May 4, 2015 | | | 648,545 | | |
| Wyle Laboratories, Inc. | | | |
| | 4,282,929 | | | Term Loan, 8.22%, Maturing January 28, 2011 | | | 4,307,020 | | |
| | | | | | | $ | 140,257,584 | | |
Principal
Amount | | Borrower/Tranche Description | | Value | |
| Air Transport — 0.9% | | | |
| Airport Development and Investment | | | |
| GBP | 11,000,000 | | | Term Loan, 9.12%, Maturing April 7, 2011 | | $ | 21,030,164 | | |
| Delta Air Lines, Inc. | | | |
| | 9,900,000 | | | Term Loan, 8.02%, Maturing March 16, 2008 | | | 10,011,415 | | |
| | 8,800,000 | | | Term Loan, 10.02%, Maturing March 16, 2008 | | | 8,984,967 | | |
| Northwest Airlines, Inc. | | | |
| | 18,000,000 | | | DIP Loan, 7.90%, Maturing August 21, 2008 | | | 18,078,750 | | |
| United Airlines, Inc. | | | |
| | 1,430,313 | | | Term Loan, 9.13%, Maturing February 1, 2012 | | | 1,455,343 | | |
| | 10,012,188 | | | Term Loan, 9.25%, Maturing February 1, 2012 | | | 10,187,401 | | |
| | | | | | | $ | 69,748,040 | | |
| Automotive — 3.9% | | | |
| AA Acquisitions Co., Ltd. | | | |
| GBP | 3,000,000 | | | Term Loan, 7.58%, Maturing June 25, 2012 | | $ | 5,812,686 | | |
| GBP | 3,000,000 | | | Term Loan, 8.08%, Maturing June 25, 2013 | | | 5,837,718 | | |
| Accuride Corp. | | | |
| $ | 12,740,655 | | | Term Loan, 7.44%, Maturing January 31, 2012 | | | 12,780,470 | | |
| Affina Group, Inc. | | | |
| | 5,395,056 | | | Term Loan, 8.38%, Maturing November 30, 2011 | | | 5,423,720 | | |
| Arvinmeritor, Inc. | | | |
| | 3,494,853 | | | Term Loan, 7.13%, Maturing June 23, 2012 | | | 3,499,948 | | |
| Collins & Aikman Products Co. | | | |
| | 4,723,070 | | | Term Loan, 6.34%, Maturing August 31, 2011(3) | | | 1,718,017 | | |
| CSA Acquisition Corp. | | | |
| | 4,033,823 | | | Term Loan, 7.88%, Maturing December 23, 2011 | | | 4,042,649 | | |
| | 5,446,498 | | | Term Loan, 7.88%, Maturing December 23, 2011 | | | 5,458,415 | | |
| | 3,721,875 | | | Term Loan, 7.88%, Maturing December 23, 2012 | | | 3,724,666 | | |
| Dana Corp. | | | |
| | 13,700,000 | | | DIP Loan, 7.65%, Maturing April 13, 2008 | | | 13,720,550 | | |
| Dayco Products, LLC | | | |
| | 14,735,563 | | | Term Loan, 8.02%, Maturing June 21, 2011 | | | 14,861,434 | | |
| Dura Operating Corp. | | | |
| | 2,500,000 | | | Revolving Loan, 9.50%, Maturing May 3, 2011(2) | | | 2,462,500 | | |
| Exide Technologies, Inc. | | | |
| | 8,671,518 | | | Term Loan, 11.75%, Maturing May 5, 2010 | | | 9,105,094 | | |
| Federal-Mogul Corp. | | | |
| | 4,982,950 | | | Revolving Loan, 7.07%,
Maturing December 9, 2006(2) | | | 4,851,255 | | |
| | 9,650,000 | | | DIP Loan, 7.38%, Maturing December 9, 2006 | | | 9,675,630 | | |
| | 4,108,827 | | | Term Loan, 7.57%, Maturing December 9, 2006 | | | 4,003,539 | | |
| | 6,000,000 | | | Term Loan, 7.59%, Maturing December 9, 2006 | | | 5,861,250 | | |
| | 17,933,096 | | | Revolving Loan, 9.07%, Maturing December 9, 2006(2) | | | 18,009,977 | | |
See notes to financial statements
18
Floating Rate Portfolio as of October 31, 2006
PORTFOLIO OF INVESTMENTS CONT'D
Principal
Amount | | Borrower/Tranche Description | | Value | |
| Automotive (continued) | | | |
| Goodyear Tire & Rubber Co. | | | |
| $ | 8,890,000 | | | Term Loan, 5.23%, Maturing April 30, 2010 | | $ | 8,918,572 | | |
| | 13,000,000 | | | Revolving Loan, 7.48%, Maturing April 30, 2010(2) | | | 12,947,194 | | |
| | 19,720,000 | | | Term Loan, 8.14%, Maturing April 30, 2010 | | | 19,903,120 | | |
| | 1,000,000 | | | Term Loan, 8.89%, Maturing March 1, 2011 | | | 1,014,583 | | |
| HLI Operating Co., Inc. | | | |
| | 6,754,073 | | | Term Loan, 8.96%, Maturing June 3, 2009 | | | 6,796,286 | | |
| Insurance Auto Auctions, Inc. | | | |
| | 6,127,717 | | | Term Loan, 7.90%, Maturing May 19, 2012(2) | | | 6,166,016 | | |
| Key Automotive Group | | | |
| | 3,922,508 | | | Term Loan, 8.85%, Maturing June 29, 2010 | | | 3,966,636 | | |
| Keystone Automotive Operations, Inc. | | | |
| | 10,386,881 | | | Term Loan, 7.88%, Maturing October 30, 2009 | | | 10,412,848 | | |
| R.J. Tower Corp. | | | |
| | 12,000,000 | | | DIP Revolving Loan, 8.45%,
Maturing February 2, 2007(2) | | | 11,430,000 | | |
| | 1,000,000 | | | DIP Revolving Loan, 8.94%,
Maturing February 2, 2007 | | | 970,625 | | |
| Speedy 1, Ltd. | | | |
| EUR | 1,978,627 | | | Term Loan, 5.76%, Maturing August 31, 2013 | | | 2,554,148 | | |
| EUR | 1,978,627 | | | Term Loan, 6.26%, Maturing August 31, 2014 | | | 2,567,090 | | |
| Tenneco Automotive, Inc. | | | |
| | 11,860,733 | | | Term Loan, 7.40%, Maturing December 12, 2009 | | | 11,929,300 | | |
| | 4,505,755 | | | Term Loan, 7.31%, Maturing December 10, 2010 | | | 4,531,803 | | |
| Teutates Vermogensverwaltung | | | |
| EUR | 2,000,000 | | | Term Loan, 5.75%, Maturing March 11, 2014 | | | 2,575,947 | | |
| | 2,619,256 | | | Term Loan, 7.90%, Maturing March 11, 2014 | | | 2,638,901 | | |
| EUR | 2,000,000 | | | Term Loan, 6.25%, Maturing March 11, 2015 | | | 2,587,800 | | |
| | 2,619,256 | | | Term Loan, 8.40%, Maturing March 11, 2015 | | | 2,651,997 | | |
| The Goodyear Dunlop Tires | | | |
| EUR | 990,000 | | | Term Loan, 5.91%, Maturing April 30, 2010 | | | 1,269,642 | | |
| Trimas Corp. | | | |
| | 1,893,750 | | | Term Loan, 8.13%, Maturing August 2, 2011 | | | 1,907,953 | | |
| | 8,206,250 | | | Term Loan, 8.25%, Maturing August 2, 2013 | | | 8,267,797 | | |
| TRW Automotive, Inc. | | | |
| | 9,863,402 | | | Term Loan, 6.75%, Maturing October 31, 2010 | | | 9,856,212 | | |
| | 10,897,374 | | | Term Loan, 7.19%, Maturing June 30, 2012 | | | 10,887,163 | | |
| United Components, Inc. | | | |
| | 11,724,242 | | | Term Loan, 7.70%, Maturing June 29,2012 | | | 11,797,519 | | |
| | | | | | | $ | 289,398,670 | | |
| Beverage and Tobacco — 1.3% | | | |
| Alliance One International, Inc. | | | |
| $ | 4,800,750 | | | Term Loan, 8.82%, Maturing May 13, 2010 | | $ | 4,860,759 | | |
| Constellation Brands, Inc. | | | |
| | 25,729,167 | | | Term Loan, 6.93%, Maturing June 5, 2013 | | | 25,864,065 | | |
Principal
Amount | | Borrower/Tranche Description | | Value | |
| Beverage and Tobacco (continued) | | | |
| Culligan International Co. | | | |
| $ | 6,088,121 | | | Term Loan, 7.07%, Maturing September 30, 2011 | | $ | 6,112,857 | | |
| National Dairy Holdings, L.P. | | | |
| | 8,444,181 | | | Term Loan, 7.32%, Maturing March 15, 2012 | | | 8,475,847 | | |
| National Distribution Co. | | | |
| | 4,734,400 | | | Term Loan, 11.82%, Maturing June 22, 2010 | | | 4,746,236 | | |
| Reynolds American, Inc. | | | |
| | 19,523,563 | | | Term Loan, 7.31%, Maturing May 31, 2012 | | | 19,656,264 | | |
| Southern Wine & Spirits of America, Inc. | | | |
| | 24,212,161 | | | Term Loan, 6.87%, Maturing May 31, 2012 | | | 24,295,403 | | |
| Sunny Delight Beverages Co. | | | |
| | 1,734,548 | | | Term Loan, 11.39%, Maturing August 20, 2010 | | | 1,715,578 | | |
| | | | | | | $ | 95,727,009 | | |
| Building and Development — 6.8% | | | |
| 401 North Wabash Venture, LLC | | | |
| $ | 9,498,461 | | | Term Loan, 9.07%, Maturing May 7, 2008(2) | | $ | 9,580,090 | | |
| AP-Newkirk Holdings, LLC | | | |
| | 11,656,285 | | | Term Loan, 7.82%, Maturing December 21, 2007 | | | 11,674,503 | | |
| Armstrong World Industries, Inc. | | | |
| | 1,000,000 | | | Term Loan, 7.12%, Maturing October 2, 2013 | | | 1,002,344 | | |
| Biomed Realty, L.P. | | | |
| | 21,175,000 | | | Term Loan, 7.57%, Maturing May 31, 2010 | | | 21,122,062 | | |
| Capital Automotive REIT | | | |
| | 11,328,306 | | | Term Loan, 7.08%, Maturing December 16, 2010 | | | 11,392,470 | | |
| Contech Construction Products | | | |
| | 5,958,333 | | | Term Loan, 7.36%, Maturing January 31, 2013 | | | 5,989,990 | | |
| DMB / CH II, LLC | | | |
| | 1,200,000 | | | Term Loan, 7.82%, Maturing September 9, 2009 | | | 1,203,000 | | |
| Empire Hawkeye Partners, L.P. | | | |
| | 12,000,000 | | | Term Loan, 6.97%, Maturing December 1, 2009(2) | | | 11,970,000 | | |
| Epco / Fantome, LLC | | | |
| | 10,750,000 | | | Term Loan, 8.37%, Maturing November 23, 2010 | | | 10,803,750 | | |
| Formica Corp. | | | |
| EUR | 2,504,825 | | | Term Loan, 6.36%, Maturing March 15, 2013 | | | 3,209,022 | | |
| | 5,472,500 | | | Term Loan, 8.49%, Maturing March 15, 2013 | | | 5,470,793 | | |
| FT-FIN Acquisition, LLC | | | |
| | 7,831,703 | | | Term Loan, 7.06%, Maturing November 17, 2007(2) | | | 7,851,282 | | |
| Gables GP, Inc. | | | |
| | 721,895 | | | Term Loan, 7.07%, Maturing March 30, 2007 | | | 723,323 | | |
| General Growth Properties, Inc. | | | |
| | 25,500,000 | | | Term Loan, 6.57%, Maturing February 24, 2010 | | | 25,352,890 | | |
| Hearthstone Housing Partners II, LLC | | | |
| | 30,000,000 | | | Revolving Loan, 7.32%,
Maturing December 1, 2007(2) | | | 29,925,000 | | |
See notes to financial statements
19
Floating Rate Portfolio as of October 31, 2006
PORTFOLIO OF INVESTMENTS CONT'D
Principal
Amount | | Borrower/Tranche Description | | Value | |
| Building and Development (continued) | | | |
| Hovstone Holdings, LLC | | | |
| $ | 8,520,000 | | | Term Loan, 7.37%, Maturing February 28, 2009 | | $ | 8,392,200 | | |
| Kyle Acquisition Group, LLC | | | |
| | 86,795 | | | Term Loan, 8.25%, Maturing July 20, 2008 | | | 86,687 | | |
| | 3,268,843 | | | Term Loan, 8.25%, Maturing July 20, 2010 | | | 3,268,843 | | |
| Landsource Communities, LLC | | | |
| | 18,000,000 | | | Term Loan, 7.88%, Maturing March 31, 2010 | | | 17,688,744 | | |
| Lanoga Corp. | | | |
| | 9,775,500 | | | Term Loan, 7.12%, Maturing June 29, 2013 | | | 9,759,204 | | |
| LNR Property Corp. | | | |
| | 22,175,000 | | | Term Loan, 8.22%, Maturing July 12, 2011 | | | 22,283,569 | | |
| MAAX Corp. | | | |
| | 6,443,722 | | | Term Loan, 8.38%, Maturing June 4, 2011 | | | 6,411,503 | | |
| Materis | | | |
| EUR | 1,695,089 | | | Term Loan, 5.93%, Maturing April 27, 2014 | | | 2,191,923 | | |
| EUR | 1,804,911 | | | Term Loan, 6.30%, Maturing April 27, 2015 | | | 2,343,373 | | |
| Mattamy Funding Partnership | | | |
| | 3,640,875 | | | Term Loan, 7.69%, Maturing April 11, 2013 | | | 3,629,497 | | |
| Mueller Group, Inc. | | | |
| | 13,323,513 | | | Term Loan, 7.39%, Maturing October 3, 2012 | | | 13,413,727 | | |
| NCI Building Systems, Inc. | | | |
| | 9,417,430 | | | Term Loan, 6.84%, Maturing May 3, 2010 | | | 9,423,316 | | |
| Newkirk Master, L.P. | | | |
| | 21,727,465 | | | Term Loan, 7.07%, Maturing August 11, 2008 | | | 21,761,424 | | |
| Nortek, Inc. | | | |
| | 21,109,188 | | | Term Loan, 7.32%, Maturing August 27, 2011 | | | 21,082,801 | | |
| November 2005 Land Investors | | | |
| | 1,990,000 | | | Term Loan, 8.12%, Maturing May 9, 2011 | | | 1,930,300 | | |
| Panolam Industries Holdings, Inc. | | | |
| | 4,474,721 | | | Term Loan, 8.12%, Maturing September 30, 2012 | | | 4,497,095 | | |
| Ply Gem Industries, Inc. | | | |
| | 12,213,625 | | | Term Loan, 8.40%, Maturing August 15, 2011 | | | 12,205,991 | | |
| Ristretto Investissements SAS | | | |
| EUR | 1,232,601 | | | Term Loan, 5.76%, Maturing September 30, 2013 | | | 1,589,356 | | |
| GBP | 523,980 | | | Term Loan, 7.45%, Maturing September 30, 2013 | | | 1,009,355 | | |
| EUR | 1,232,601 | | | Term Loan, 6.13%, Maturing September 30, 2014 | | | 1,597,222 | | |
| GBP | 523,980 | | | Term Loan, 7.82%, Maturing September 30, 2014 | | | 1,013,519 | | |
| Rubicon GSA II, LLC | | | |
| | 19,075,000 | | | Term Loan, 8.07%, Maturing July 31, 2008 | | | 19,075,000 | | |
| Shea Capital I, LLC | | | |
| | 1,625,000 | | | Term Loan, 7.35%, Maturing October 27, 2011 | | | 1,576,250 | | |
| South Edge, LLC | | | |
| | 4,261,607 | | | Term Loan, 7.13%, Maturing October 31, 2007 | | | 4,160,394 | | |
| | 8,794,643 | | | Term Loan, 7.38%, Maturing October 31, 2009 | | | 8,585,770 | | |
Principal
Amount | | Borrower/Tranche Description | | Value | |
| Building and Development (continued) | | | |
| Standard Pacific Corp. | | | |
| $ | 5,200,000 | | | Term Loan, 6.93%, Maturing May 5, 2013 | | $ | 5,109,000 | | |
| Stile Acquisition Corp. | | | |
| | 19,655,386 | | | Term Loan, 7.38%, Maturing April 6, 2013 | | | 19,245,394 | | |
| Stile U.S. Acquisition Corp. | | | |
| | 19,685,514 | | | Term Loan, 7.38%, Maturing April 6, 2013 | | | 19,274,894 | | |
| TE / Tousa Senior, LLC | | | |
| | 8,389,406 | | | Term Loan, 8.25%, Maturing August 1, 2008 | | | 6,455,648 | | |
| | 3,000,000 | | | Revolving Loan, 9.75%, Maturing August 1, 2008(2) | | | 2,265,000 | | |
| The Woodlands Commercial Property, Inc. | | | |
| | 9,825,000 | | | Term Loan, 7.35%, Maturing August 29, 2009 | | | 9,837,281 | | |
| Tousa / Kolter, LLC | | | |
| | 12,620,000 | | | Term Loan, 6.60%, Maturing January 7, 2008(2) | | | 12,635,775 | | |
| TRU 2005 RE Holding Co. | | | |
| | 29,325,000 | | | Term Loan, 8.32%, Maturing December 9, 2008 | | | 29,416,641 | | |
| Trustreet Properties, Inc. | | | |
| | 10,050,000 | | | Term Loan, 7.32%, Maturing April 8, 2010 | | | 10,075,125 | | |
| United Subcontractors, Inc. | | | |
| | 5,925,000 | | | Term Loan, 12.86%, Maturing June 27, 2013 | | | 5,747,250 | | |
| WCI Communities, Inc. | | | |
| | 28,625,000 | | | Term Loan, 7.32%, Maturing December 23, 2010 | | | 27,649,975 | | |
| | | | | | | $ | 503,959,565 | | |
| Business Equipment and Services — 5.9% | | | |
| Acco Brands Corp. | | | |
| $ | 5,743,764 | | | Term Loan, 7.14%, Maturing August 17, 2012 | | $ | 5,768,893 | | |
| Activant Solutions, Inc. | | | |
| | 5,746,125 | | | Term Loan, 7.50%, Maturing May 1, 2013 | | | 5,717,394 | | |
| Acxiom Corp. | | | |
| | 11,800,000 | | | Term Loan, 7.09%, Maturing September 15, 2012 | | | 11,877,443 | | |
| Affiliated Computer Services | | | |
| | 6,054,250 | | | Term Loan, 7.39%, Maturing March 20, 2013 | | | 6,072,219 | | |
| | 17,107,125 | | | Term Loan, 7.40%, Maturing March 20, 2013 | | | 17,156,291 | | |
| Affinion Group, Inc. | | | |
| | 16,796,075 | | | Term Loan, 8.17%, Maturing October 17, 2012 | | | 16,908,928 | | |
| Allied Security Holdings, LLC | | | |
| | 10,203,409 | | | Term Loan, 8.37%, Maturing June 30, 2010 | | | 10,292,689 | | |
| Audatex North America, Inc. | | | |
| EUR | 2,000,000 | | | Term Loan, 9.13%, Maturing January 13, 2013 | | | 2,614,126 | | |
| EUR | 1,995,000 | | | Term Loan, 5.75%, Maturing April 13, 2013 | | | 2,569,660 | | |
| BSG Clearing Solutions GmbH | | | |
| EUR | 1,950,000 | | | Term Loan, 5.74%, Maturing May 5, 2012 | | | 2,501,327 | | |
| Buhrmann US, Inc. | | | |
| EUR | 989,873 | | | Term Loan, 5.08%, Maturing December 23, 2010 | | | 1,280,797 | | |
| | 10,778,399 | | | Term Loan, 7.18%, Maturing December 23, 2010 | | | 10,812,081 | | |
See notes to financial statements
20
Floating Rate Portfolio as of October 31, 2006
PORTFOLIO OF INVESTMENTS CONT'D
Principal
Amount | | Borrower/Tranche Description | | Value | |
| Business Equipment and Services (continued) | | | |
| DynCorp International, LLC | | | |
| $ | 8,012,975 | | | Term Loan, 7.75%, Maturing February 11, 2011 | | $ | 8,063,056 | | |
| Education Management, LLC | | | |
| | 11,970,000 | | | Term Loan, 7.88%, Maturing June 1, 2013 | | | 12,065,760 | | |
| Gate Gourmet Borrower, LLC | | | |
| | 3,982,222 | | | Term Loan, 8.12%, Maturing March 9, 2012 | | | 4,028,622 | | |
| EUR | 8,126,390 | | | Term Loan, 6.13%, Maturing March 9, 2013 | | | 10,511,499 | | |
| Info USA, Inc. | | | |
| | 4,416,625 | | | Term Loan, 7.07%, Maturing February 14, 2012 | | | 4,411,104 | | |
| Iron Mountain, Inc. | | | |
| | 19,953,750 | | | Term Loan, 7.09%, Maturing April 2, 2011 | | | 20,011,955 | | |
| | 19,715,223 | | | Term Loan, 7.16%, Maturing April 2, 2011 | | | 19,764,511 | | |
| La Petite Academy, Inc. | | | |
| | 1,000,000 | | | Term Loan, 12.61%, Maturing August 15, 2013 | | | 1,012,500 | | |
| Language Line, Inc. | | | |
| | 11,181,803 | | | Term Loan, 9.63%, Maturing June 10, 2011 | | | 11,263,922 | | |
| Mitchell International, Inc. | | | |
| | 7,153,386 | | | Term Loan, 7.37%, Maturing August 15, 2011 | | | 7,180,211 | | |
| N.E.W. Holdings I, LLC | | | |
| | 7,082,250 | | | Term Loan, 8.11%, Maturing August 8, 2013 | | | 7,128,731 | | |
| Nielsen Finance, LLC | | | |
| | 55,950,000 | | | Term Loan, 8.19%, Maturing August 9, 2013 | | | 56,216,658 | | |
| Protection One, Inc. | | | |
| | 8,412,410 | | | Term Loan, 7.86%, Maturing March 31, 2012 | | | 8,449,214 | | |
| Quantum Corp. | | | |
| | 3,000,000 | | | Term Loan, 9.44%, Maturing August 22, 2012 | | | 3,003,750 | | |
| Quintiles Transnational Corp. | | | |
| | 13,407,625 | | | Term Loan, 7.37%, Maturing March 31, 2013 | | | 13,422,709 | | |
| RGIS Holdings, LLC | | | |
| | 8,238,394 | | | Term Loan, 7.87%, Maturing February 15, 2013 | | | 8,235,823 | | |
| Serena Software, Inc. | | | |
| | 4,125,000 | | | Term Loan, 7.62%, Maturing March 10, 2013 | | | 4,131,703 | | |
| SS&C Technologies, Inc. | | | |
| | 435,419 | | | Term Loan, 8.00%, Maturing November 23, 2012 | | | 438,141 | | |
| | 5,122,581 | | | Term Loan, 8.00%, Maturing November 28, 2012 | | | 5,154,597 | | |
| Sungard Data Systems, Inc. | | | |
| | 88,224,409 | | | Term Loan, 8.00%, Maturing February 11, 2013 | | | 89,158,088 | | |
| TDS Investor Corp. | | | |
| EUR | 2,000,000 | | | Term Loan, 6.13%, Maturing August 23, 2013 | | | 2,560,412 | | |
| | 22,450,678 | | | Term Loan, 8.37%, Maturing August 23, 2013 | | | 22,546,902 | | |
| | 2,199,322 | | | Term Loan, 8.37%, Maturing August 23, 2013 | | | 2,208,748 | | |
| Transaction Network Services, Inc. | | | |
| | 5,448,918 | | | Term Loan, 7.39%, Maturing May 4, 2012 | | | 5,448,918 | | |
Principal
Amount | | Borrower/Tranche Description | | Value | |
| Business Equipment and Services (continued) | | | |
| US Investigations Services, Inc. | | | |
| $ | 6,531,652 | | | Term Loan, 7.89%, Maturing October 14, 2012 | | $ | 6,568,392 | | |
| | 3,857,377 | | | Term Loan, 7.89%, Maturing October 14, 2012 | | | 3,876,664 | | |
| Western Inventory Services | | | |
| | 1,457,449 | | | Term Loan, 7.86%, Maturing March 31, 2011 | | | 1,464,736 | | |
| | 1,661,492 | | | Term Loan, 7.87%, Maturing March 31, 2011 | | | 1,669,799 | | |
| Williams Scotsman, Inc. | | | |
| | 6,750,000 | | | Term Loan, 6.82%, Maturing June 27, 2010 | | | 6,733,125 | | |
| | | | | | | $ | 440,302,098 | | |
| Cable and Satellite Television — 5.4% | | | |
| Atlantic Broadband Finance, LLC | | | |
| $ | 9,898,586 | | | Term Loan, 8.14%, Maturing February 1, 2011 | | $ | 10,034,692 | | |
| Bragg Communications, Inc. | | | |
| | 7,569,775 | | | Term Loan, 7.08%, Maturing August 31, 2011 | | | 7,588,700 | | |
| Bresnan Broadband Holdings, LLC | | | |
| | 13,650,000 | | | Term Loan, 7.16%, Maturing March 29, 2014 | | | 13,645,741 | | |
| | | Cablecom Luxembourg SCA | |
| CHF | 12,500,000 | | | Term Loan, 4.20%, Maturing September 28, 2012 | | | 10,047,564 | | |
| Charter Communications Operating, LLC | | | |
| | 81,463,117 | | | Term Loan, 8.01%, Maturing April 28, 2013 | | | 82,257,382 | | |
| CSC Holdings, Inc. | | | |
| | 5,000,000 | | | Term Loan, 6.65%, Maturing March 29, 2012 | | | 4,987,760 | | |
| | 22,862,619 | | | Term Loan, 7.15%, Maturing March 29, 2013 | | | 22,871,810 | | |
| Insight Midwest Holdings, LLC | | | |
| | 10,737,500 | | | Term Loan, 0.00%, Maturing April 7, 2014(2) | | | 10,822,219 | | |
| | 32,212,500 | | | Term Loan, 7.57%, Maturing April 7, 2014 | | | 32,466,657 | | |
| Kabel Deutschland GmbH | | | |
| EUR | 15,600,000 | | | Term Loan, 5.38%, Maturing March 31, 2012 | | | 19,952,833 | | |
| MCC Iowa, LLC | | | |
| | 2,083,563 | | | Term Loan, 6.50%, Maturing March 31, 2010 | | | 2,049,488 | | |
| Mediacom Broadband Group | | | |
| | 14,464,877 | | | Term Loan, 6.98%, Maturing January 31, 2015 | | | 14,424,202 | | |
| | 8,000,000 | | | Term Loan, 7.38%, Maturing January 31, 2015 | | | 7,981,664 | | |
| Mediacom Illinois, LLC | | | |
| | 2,000,000 | | | Term Loan, 6.72%, Maturing September 30, 2012 | | | 1,966,608 | | |
| | 18,614,375 | | | Term Loan, 7.22%, Maturing January 31, 2015 | | | 18,588,613 | | |
| NTL Investment Holdings, Ltd. | | | |
| GBP | 4,095,825 | | | Term Loan, 7.07%, Maturing March 30, 2012 | | | 7,806,349 | | |
| GBP | 3,504,175 | | | Term Loan, 7.07%, Maturing March 30, 2012 | | | 6,678,706 | | |
| | 9,000,000 | | | Term Loan, 7.32%, Maturing March 30, 2012 | | | 9,056,250 | | |
| GBP | 3,500,000 | | | Term Loan, 7.64%, Maturing March 30, 2013 | | | 6,767,161 | | |
See notes to financial statements
21
Floating Rate Portfolio as of October 31, 2006
PORTFOLIO OF INVESTMENTS CONT'D
Principal
Amount | | Borrower/Tranche Description | | Value | |
| Cable and Satellite Television (continued) | | | |
| Persona Communications Corp. | | | |
| $ | 2,854,178 | | | Term Loan, 0.00%, Maturing October 12, 2013(2) | | $ | 2,872,016 | | |
| | 4,595,822 | | | Term Loan, 8.12%, Maturing October 12, 2013 | | | 4,624,546 | | |
| | 2,000,000 | | | Term Loan, 11.37%, Maturing April 12, 2014 | | | 2,012,500 | | |
| PKS Media (Netherlands) B.V. | | | |
| EUR | 1,930,000 | | | Term Loan, 5.24%, Maturing October 5, 2012 | | | 2,472,233 | | |
| EUR | 4,000,000 | | | Term Loan, 5.74%, Maturing October 5, 2013 | | | 5,178,280 | | |
| EUR | 4,000,000 | | | Term Loan, 6.24%, Maturing October 5, 2014 | | | 5,202,617 | | |
| San Juan Cable, LLC | | | |
| | 992,500 | | | Term Loan, 7.39%, Maturing October 31, 2012 | | | 995,292 | | |
| UGS Corp. | | | |
| | 24,886,750 | | | Term Loan, 7.13%, Maturing March 31, 2012 | | | 24,891,926 | | |
| UPC Broadband Holding B.V. | | | |
| EUR | 5,609,167 | | | Term Loan, 5.51%, Maturing March 31, 2013 | | | 7,167,078 | | |
| | 6,545,000 | | | Term Loan, 7.64%, Maturing March 31, 2013 | | | 6,552,887 | | |
| EUR | 6,350,000 | | | Term Loan, 5.51%, Maturing December 31, 2013 | | | 8,114,889 | | |
| | 6,545,000 | | | Term Loan, 7.64%, Maturing December 31, 2013 | | | 6,551,722 | | |
| Ypso Holding SA | | | |
| EUR | 30,000,000 | | | Term Loan, 5.84%, Maturing July 28, 2014 | | | 37,534,952 | | |
| | | | | | | $ | 404,165,337 | | |
| Chemicals and Plastics — 6.9% | | | |
| Basell Af S.A.R.L. | | | |
| EUR | 961,538 | | | Term Loan, 5.69%, Maturing September 20, 2013 | | $ | 1,240,108 | | |
| EUR | 538,462 | | | Term Loan, 5.78%, Maturing September 20, 2013 | | | 694,460 | | |
| | 1,000,000 | | | Term Loan, 7.60%, Maturing August 1, 2013 | | | 1,013,125 | | |
| EUR | 961,538 | | | Term Loan, 6.43%, Maturing August 1, 2014 | | | 1,245,764 | | |
| EUR | 538,462 | | | Term Loan, 6.52%, Maturing August 1, 2014 | | | 697,628 | | |
| | 833,333 | | | Term Loan, 8.35%, Maturing August 1, 2014 | | | 844,271 | | |
| | 166,667 | | | Term Loan, 8.35%, Maturing August 1, 2014 | | | 168,854 | | |
| Brenntag Holding GmbH and Co. KG | | | |
| EUR | 5,294,118 | | | Term Loan, 6.03%, Maturing Januaary 18, 2014 | | | 6,852,470 | | |
| EUR | 1,500,000 | | | Term Loan, 6.14%, Maturing December 23, 2013 | | | 1,936,338 | | |
| | 10,000,000 | | | Term Loan, 8.08%, Maturing December 23, 2013 | | | 10,102,454 | | |
| EUR | 2,205,882 | | | Term Loan, 6.28%, Maturing January 18, 2015 | | | 2,875,132 | | |
| GBP | 2,000,000 | | | Term Loan, 7.59%, Maturing December 23, 2013 | | | 3,859,004 | | |
| EUR | 1,000,000 | | | Term Loan, 9.58%, Maturing June 23, 2015 | | | 1,309,854 | | |
| Celanese Holdings, LLC | | | |
| | 7,250,000 | | | Term Loan, 5.32%, Maturing April 6, 2009 | | | 7,310,414 | | |
| | 25,472,653 | | | Term Loan, 7.37%, Maturing April 6, 2011 | | | 25,645,510 | | |
| Columbian Chemical Acquisition | | | |
| | 4,700,000 | | | Term Loan, 7.12%, Maturing March 16, 2013 | | | 4,700,000 | | |
| Ferro Corp. | | | |
| | 24,000,000 | | | Term Loan, 8.57%, Maturing June 6, 2012(2) | | | 24,022,512 | | |
Principal
Amount | | Borrower/Tranche Description | | Value | |
| Chemicals and Plastics (continued) | | | |
| Gentek, Inc. | | | |
| $ | 4,144,492 | | | Term Loan, 7.37%, Maturing February 28, 2011 | | $ | 4,167,805 | | |
| Georgia Gulf Corp. | | | |
| | 12,150,000 | | | Term Loan, 7.32%, Maturing October 3, 2013 | | | 12,223,410 | | |
| Hercules, Inc. | | | |
| | 9,948,645 | | | Term Loan, 6.87%, Maturing October 8, 2010 | | | 9,962,324 | | |
| Hexion Specialty Chemicals, Inc. | | | |
| | 10,000,000 | | | Term Loan, 5.23%, Maturing May 5, 2013 | | | 9,986,610 | | |
| | 4,588,347 | | | Term Loan, 7.37%, Maturing May 5, 2013 | | | 4,582,203 | | |
| | 21,122,216 | | | Term Loan, 7.38%, Maturing May 5, 2013 | | | 21,093,933 | | |
| Huntsman, LLC | | | |
| EUR | 3,648,000 | | | Term Loan, 5.36%, Maturing August 26, 2012 | | | 4,650,305 | | |
| | 37,812,531 | | | Term Loan, 7.07%, Maturing August 16, 2012 | | | 37,836,202 | | |
| Ineos Group | | | |
| EUR | 3,000,000 | | | Term Loan, 6.03%, Maturing December 14, 2011 | | | 3,866,893 | | |
| EUR | 3,000,000 | | | Term Loan, 6.53%, Maturing December 14, 2011 | | | 3,883,644 | | |
| EUR | 2,000,000 | | | Term Loan, 7.28%, Maturing December 14, 2012 | | | 2,598,490 | | |
| | 7,050,000 | | | Term Loan, 7.61%, Maturing December 14, 2012 | | | 7,107,281 | | |
| | 6,525,000 | | | Term Loan, 7.61%, Maturing December 14, 2013 | | | 6,611,319 | | |
| | 6,525,000 | | | Term Loan, 8.11%, Maturing December 14, 2014 | | | 6,611,319 | | |
| Innophos, Inc. | | | |
| | 10,035,729 | | | Term Loan, 7.57%, Maturing August 13, 2010 | | | 10,082,777 | | |
| Invista B.V. | | | |
| | 3,771,500 | | | Term Loan, 6.88%, Maturing April 30, 2010 | | | 3,747,928 | | |
| | 10,371,760 | | | Term Loan, 6.88%, Maturing April 29, 2011 | | | 10,375,006 | | |
| | 6,377,424 | | | Term Loan, 6.88%, Maturing April 29, 2011 | | | 6,379,420 | | |
| ISP Chemo, Inc. | | | |
| | 20,301,741 | | | Term Loan, 7.45%, Maturing February 15, 2013 | | | 20,392,368 | | |
| Kranton Polymers, LLC | | | |
| | 13,765,323 | | | Term Loan, 7.38%, Maturing May 12, 2013 | | | 13,825,546 | | |
| Lucite International Group Holdings | | | |
| | 1,712,977 | | | Term Loan, 0.00%, Maturing July 7, 2013(2) | | | 1,727,452 | | |
| | 4,874,805 | | | Term Loan, 8.07%, Maturing July 7, 2013 | | | 4,915,997 | | |
| Lyondell Chemical Co. | | | |
| | 31,700,000 | | | Term Loan, 7.11%, Maturing August 16, 2013 | | | 31,901,422 | | |
| Mosaic Co. | | | |
| | 14,905,980 | | | Term Loan, 6.99%, Maturing February 21, 2012 | | | 14,917,160 | | |
| Nalco Co. | | | |
| | 29,485,604 | | | Term Loan, 7.16%, Maturing November 4, 2010 | | | 29,602,869 | | |
| PQ Corp. | | | |
| | 12,475,697 | | | Term Loan, 7.38%, Maturing February 10, 2012 | | | 12,530,279 | | |
| Professional Paint, Inc. | | | |
| | 5,610,938 | | | Term Loan, 7.63%, Maturing May 31, 2012 | | | 5,621,458 | | |
| Propex Fabrics, Inc. | | | |
| | 6,686,203 | | | Term Loan, 7.63%, Maturing July 31, 2012 | | | 6,702,919 | | |
See notes to financial statements
22
Floating Rate Portfolio as of October 31, 2006
PORTFOLIO OF INVESTMENTS CONT'D
Principal
Amount | | Borrower/Tranche Description | | Value | |
| Chemicals and Plastics (continued) | | | |
| Rockwood Specialties Group, Inc. | | | |
| EUR | 3,026,277 | | | Term Loan, 5.81%, Maturing July 30, 2011 | | $ | 3,858,969 | | |
| | 27,526,024 | | | Term Loan, 7.38%, Maturing December 10, 2012 | | | 27,687,739 | | |
| Sigmakalon (BC) Holdco B.V. | | | |
| EUR | 9,000,000 | | | Term Loan, 5.99%, Maturing September 9, 2013 | | | 11,578,048 | | |
| EUR | 8,724,586 | | | Term Loan, 6.49%, Maturing September 9, 2014 | | | 11,270,172 | | |
| GBP | 183,030 | | | Term Loan, 8.08%, Maturing September 9, 2014 | | | 352,575 | | |
| Solo Cup Co. | | | |
| | 19,519,640 | | | Term Loan, 8.61%, Maturing February 27, 2011 | | | 19,643,160 | | |
| | 2,675,000 | | | Term Loan, 11.37%, Maturing March 31, 2012 | | | 2,745,219 | | |
| Solutia, Inc. | | | |
| | 5,550,000 | | | DIP Loan, 8.96%, Maturing March 31, 2007 | | | 5,570,812 | | |
| TPG Spring UK, Ltd. | | | |
| EUR | 8,713,441 | | | Term Loan, 6.12%, Maturing June 27, 2013 | | | 11,142,721 | | |
| EUR | 8,713,441 | | | Term Loan, 6.62%, Maturing June 27, 2013 | | | 11,181,646 | | |
| Wellman, Inc. | | | |
| | 6,250,000 | | | Term Loan, 9.49%, Maturing February 10, 2009 | | | 6,283,206 | | |
| | | | | | | $ | 513,736,504 | | |
| Clothing / Textiles — 0.5% | | | |
| Hanesbrands, Inc. | | | |
| $ | 16,000,000 | | | Term Loan, 7.68%, Maturing September 5, 2013 | | $ | 16,156,000 | | |
| | 5,000,000 | | | Term Loan, 9.19%, Maturing March 5, 2014 | | | 5,132,145 | | |
| St. John Knits International, Inc. | | | |
| | 3,964,412 | | | Term Loan, 9.32%, Maturing March 23, 2012 | | | 3,944,590 | | |
| The William Carter Co. | | | |
| | 4,989,815 | | | Term Loan, 6.87%, Maturing July 14, 2012 | | | 4,987,475 | | |
| Warnaco, Inc. | | | |
| | 5,397,875 | | | Term Loan, 6.97%, Maturing January 31, 2013 | | | 5,377,633 | | |
| | | | | | | $ | 35,597,843 | | |
| Conglomerates — 2.5% | | | |
| American Greetings Corp. | | | |
| $ | 13,500,000 | | | Term Loan, 0.00%, Maturing April 4, 2013(2) | | $ | 13,470,475 | | |
| Amsted Industries, Inc. | | | |
| | 12,869,478 | | | Term Loan, 7.37%, Maturing April 5, 2013 | | | 12,925,782 | | |
| | 10,500,000 | | | Term Loan, 7.37%, Maturing April 5, 2013(2) | | | 10,368,750 | | |
| Blount, Inc. | | | |
| | 3,601,792 | | | Term Loan, 7.10%, Maturing August 9, 2010 | | | 3,613,047 | | |
| Bushnell Performance Optics | | | |
| | 742,678 | | | Term Loan, 8.37%, Maturing August 19, 2011 | | | 747,320 | | |
| Dundee Holdco 4 Limited | | | |
| EUR | 1,457,800 | | | Term Loan, 6.13%, Maturing February 17, 2014 | | | 1,860,663 | | |
| EUR | 2,186,700 | | | Term Loan, 9.13%, Maturing August 17, 2015 | | | 2,825,882 | | |
Principal
Amount | | Borrower/Tranche Description | | Value | |
| Conglomerates (continued) | | | |
| Dundee Holding, Inc. | | | |
| $ | 2,761,950 | | | Term Loan, 8.07%, Maturing February 17, 2014 | | $ | 2,768,855 | | |
| Euramax International, Inc. | | | |
| | 4,617,639 | | | Term Loan, 8.19%, Maturing June 29, 2012 | | | 4,646,499 | | |
| GBP | 937,321 | | | Term Loan, 7.99%, Maturing June 29, 2012 | | | 1,781,748 | | |
| Goodman Global Holdings, Inc. | | | |
| | 11,287,723 | | | Term Loan, 7.25%, Maturing December 23, 2011 | | | 11,283,016 | | |
| ISS Holdings A/S | | | |
| EUR | 6,510,926 | | | Term Loan, 5.97%, Maturing December 31, 2013 | | | 8,442,012 | | |
| GBP | 5,068,562 | | | Term Loan, 7.68%, Maturing December 31, 2013 | | | 9,778,186 | | |
| Jarden Corp. | | | |
| | 8,151,778 | | | Term Loan, 7.12%, Maturing January 24, 2012 | | | 8,153,816 | | |
| | 20,025,345 | | | Term Loan, 7.37%, Maturing January 24, 2012 | | | 20,086,362 | | |
| Johnson Diversey, Inc. | | | |
| | 2,500,000 | | | Term Loan, 7.83%, Maturing December 16, 2010 | | | 2,516,407 | | |
| | 13,146,136 | | | Term Loan, 7.97%, Maturing December 16, 2011 | | | 13,267,330 | | |
| Platinum 100, Ltd. | | | |
| GBP | 3,000,000 | | | Term Loan, 7.81%, Maturing January 15, 2013 | | | 5,756,853 | | |
| GBP | 3,000,000 | | | Term Loan, 8.31%, Maturing January 15, 2014 | | | 5,778,550 | | |
| Polymer Group, Inc. | | | |
| | 3,000,000 | | | Revolving Loan, 9.50%,
Maturing November 22, 2010(2) | | | 2,940,000 | | |
| | 19,611,850 | | | Term Loan, 7.61%, Maturing November 22, 2012 | | | 19,652,701 | | |
| Rexnord Corp. | | | |
| | 10,900,000 | | | Term Loan, 7.88%, Maturing July 19, 2013 | | | 10,974,937 | | |
| Terex Corp. | | | |
| | 5,685,750 | | | Term Loan, 7.12%, Maturing July 13, 2013 | | | 5,707,072 | | |
| Walter Industries, Inc. | | | |
| | 2,301,374 | | | Term Loan, 7.15%, Maturing October 3, 2012 | | | 2,308,565 | | |
| | | | | | | $ | 181,654,828 | | |
| Containers and Glass Products — 3.7% | | | |
| Berry Plastics Corp. | | | |
| $ | 20,800,000 | | | Term Loan, 7.12%, Maturing September 20, 2013 | | $ | 20,849,400 | | |
| Bluegrass Container Co. | | | |
| | 13,491,187 | | | Term Loan, 7.60%, Maturing June 30, 2013 | | | 13,632,427 | | |
| Consolidated Container Holding | | | |
| | 5,498,438 | | | Term Loan, 8.63%, Maturing December 15, 2008 | | | 5,525,930 | | |
| Crown Americas, Inc. | | | |
| EUR | 4,500,000 | | | Term Loan, 4.86%, Maturing November 15, 2012 | | | 5,739,985 | | |
| | 1,450,000 | | | Term Loan, 7.07%, Maturing November 15, 2012 | | | 1,454,079 | | |
| | 9,950,000 | | | Term Loan, 7.25%, Maturing November 15, 2012 | | | 9,977,989 | | |
See notes to financial statements
23
Floating Rate Portfolio as of October 31, 2006
PORTFOLIO OF INVESTMENTS CONT'D
Principal
Amount | | Borrower/Tranche Description | | Value | |
| Containers and Glass Products (continued) | | | |
| Graham Packaging Holdings Co. | | | |
| $ | 2,711,203 | | | Term Loan, 7.69%, Maturing October 7, 2011 | | $ | 2,727,180 | | |
| | 32,181,983 | | | Term Loan, 7.73%, Maturing October 7, 2011 | | | 32,371,632 | | |
| | 1,071,429 | | | Term Loan, 9.69%, Maturing April 7, 2012 | | | 1,081,809 | | |
| Graphic Packaging International, Inc. | | | |
| | 10,500,000 | | | Revolving Loan, 8.71%, Maturing August 8, 2007(2) | | | 10,276,875 | | |
| | 40,397,298 | | | Term Loan, 7.88%, Maturing August 8, 2010 | | | 40,913,090 | | |
| IPG (US), Inc. | | | |
| | 11,336,457 | | | Term Loan, 7.64%, Maturing July 28, 2011 | | | 11,350,627 | | |
| JSG Acquisitions | | | |
| EUR | 17,250,000 | | | Term Loan, 5.81%, Maturing December 31, 2014 | | | 22,171,707 | | |
| EUR | 17,250,000 | | | Term Loan, 6.26%, Maturing December 31, 2014 | | | 22,270,233 | | |
| OI European Group B.V. | | | |
| EUR | 12,600,000 | | | Term Loan, 5.10%, Maturing June 14, 2013 | | | 16,004,945 | | |
| Owens-Brockway Glass Container | | | |
| | 10,525,000 | | | Term Loan, 7.07%, Maturing June 14, 2013 | | | 10,549,997 | | |
| Picnal Acquisition, Inc. | | | |
| GBP | 1,836,844 | | | Term Loan, 7.84%, Maturing June 30, 2011 | | | 3,504,264 | | |
| GBP | 2,172,616 | | | Term Loan, 8.34%, Maturing June 30, 2012 | | | 4,161,443 | | |
| Pregis Corp. | | | |
| | 2,673,000 | | | Term Loan, 7.62%, Maturing October 12, 2011 | | | 2,694,718 | | |
| Smurfit-Stone Container Corp. | | | |
| | 3,225,483 | | | Term Loan, 4.73%, Maturing November 1, 2010 | | | 3,249,490 | | |
| | 4,600,210 | | | Term Loan, 7.63%, Maturing November 1, 2011 | | | 4,634,450 | | |
| | 16,780,522 | | | Term Loan, 7.66%, Maturing November 1, 2011 | | | 16,905,420 | | |
| | 10,542,434 | | | Term Loan, 7.67%, Maturing November 1, 2011 | | | 10,620,901 | | |
| | | | | | | $ | 272,668,591 | | |
| Cosmetics / Toiletries — 0.4% | | | |
| American Safety Razor Co. | | | |
| $ | 3,491,250 | | | Term Loan, 7.87%, Maturing July 31, 2013 | | $ | 3,534,891 | | |
| Prestige Brands, Inc. | | | |
| | 15,591,968 | | | Term Loan, 7.66%, Maturing April 7, 2011 | | | 15,686,175 | | |
| Revlon Consumer Products Corp. | | | |
| | 6,820,234 | | | Term Loan, 11.44%, Maturing July 9, 2010 | | | 7,002,109 | | |
| | | | | | | $ | 26,223,175 | | |
| Drugs — 0.4% | | | |
| Warner Chilcott Corp. | | | |
| $ | 7,214,629 | | | Term Loan, 7.87%, Maturing January 18, 2012 | | $ | 7,258,212 | | |
| | 21,598,885 | | | Term Loan, 7.93%, Maturing January 18, 2012 | | | 21,737,744 | | |
| | | | | | | $ | 28,995,956 | | |
Principal
Amount | | Borrower/Tranche Description | | Value | |
| Ecological Services and Equipment — 1.7% | | | |
| Alderwoods Group, Inc. | | | |
| $ | 4,459,166 | | | Term Loan, 7.32%, Maturing August 19, 2010 | | $ | 4,465,667 | | |
| Allied Waste Industries, Inc. | | | |
| | 9,113,375 | | | Term Loan, 5.33%, Maturing January 15, 2012 | | | 9,129,041 | | |
| | 26,568,697 | | | Term Loan, 7.15%, Maturing January 15, 2012 | | | 26,608,284 | | |
| AVR Acquisitions B.V. | | | |
| EUR | 3,500,000 | | | Term Loan, 5.88%, Maturing March 31, 2014 | | | 4,544,705 | | |
| EUR | 3,500,000 | | | Term Loan, 5.63%, Maturing March 31, 2015 | | | 4,523,762 | | |
| Casella Waste Systems, Inc. | | | |
| | 3,000,000 | | | Term Loan, 7.46%, Maturing April 28, 2010 | | | 3,007,500 | | |
| Duratek, Inc. | | | |
| | 4,564,792 | | | Term Loan, 7.76%, Maturing June 7, 2013 | | | 4,606,163 | | |
| Energysolutions, LLC | | | |
| | 479,560 | | | Term Loan, 7.57%, Maturing June 7, 2013 | | | 483,906 | | |
| | 10,075,233 | | | Term Loan, 7.76%, Maturing June 7, 2013 | | | 10,166,545 | | |
| Environmental Systems, Inc. | | | |
| | 5,011,748 | | | Term Loan, 8.88%, Maturing December 12, 2008 | | | 5,043,071 | | |
| | 1,000,000 | | | Term Loan, 15.37%, Maturing December 12, 2010 | | | 1,025,000 | | |
| IESI Corp. | | | |
| | 9,267,647 | | | Term Loan, 7.13%, Maturing January 20, 2012 | | | 9,282,132 | | |
| PHS Group PIC | | | |
| GBP | 1,500,000 | | | Term Loan, 7.69%, Maturing December 14, 2010 | | | 2,875,179 | | |
| GBP | 1,500,000 | | | Term Loan, 8.19%, Maturing December 14, 2010 | | | 2,891,629 | | |
| Sensus Metering Systems, Inc. | | | |
| | 3,000,000 | | | Revolving Loan, 0.00%,
Maturing December 17, 2009(2) | | | 2,895,000 | | |
| | 9,164,596 | | | Term Loan, 7.45%, Maturing December 17, 2010 | | | 9,164,596 | | |
| | 1,217,330 | | | Term Loan, 7.50%, Maturing December 17, 2010 | | | 1,217,330 | | |
| Sulo GmbH | | | |
| EUR | 7,250,000 | | | Term Loan, 6.12%, Maturing January 19, 2014 | | | 9,352,319 | | |
| EUR | 7,250,000 | | | Term Loan, 6.62%, Maturing January 19, 2015 | | | 9,396,394 | | |
| Synagro Technologies, Inc. | | | |
| | 8,210,000 | | | Term Loan, 7.57%, Maturing June 21, 2012 | | | 8,212,199 | | |
| | | | | | | $ | 128,890,422 | | |
| Electronics / Electrical — 3.1% | | | |
| Advanced Micro Devices, Inc. | | | |
| $ | 21,875,000 | | | Term Loan, 7.57%, Maturing December 31, 2013 | | $ | 21,875,000 | | |
| AMI Semiconductor, Inc. | | | |
| | 7,707,709 | | | Term Loan, 6.82%, Maturing April 1, 2012 | | | 7,683,623 | | |
| Aspect Software, Inc. | | | |
| | 16,100,000 | | | Term Loan, 8.44%, Maturing July 11, 2011 | | | 16,162,387 | | |
| Communications & Power, Inc. | | | |
| | 4,262,060 | | | Term Loan, 7.57%, Maturing July 23, 2010 | | | 4,280,706 | | |
See notes to financial statements
24
Floating Rate Portfolio as of October 31, 2006
PORTFOLIO OF INVESTMENTS CONT'D
Principal
Amount | | Borrower/Tranche Description | | Value | |
| Electronics / Electrical (continued) | | | |
| Enersys Capital, Inc. | | | |
| $ | 10,304,705 | | | Term Loan, 7.45%, Maturing March 17, 2011 | | $ | 10,356,229 | | |
| Fairchild Semiconductor Corp. | | | |
| | 16,533,563 | | | Term Loan, 6.82%, Maturing June 26, 2013 | | | 16,512,896 | | |
| FCI International S.A.S. | | | |
| EUR | 750,000 | | | Term Loan, 5.99%, Maturing November 1, 2013 | | | 972,135 | | |
| | 735,755 | | | Term Loan, 8.33%, Maturing November 1, 2013 | | | 745,872 | | |
| | 764,245 | | | Term Loan, 8.33%, Maturing November 1, 2013 | | | 766,872 | | |
| | 764,245 | | | Term Loan, 8.83%, Maturing November 1, 2013 | | | 770,693 | | |
| | 735,755 | | | Term Loan, 8.83%, Maturing November 1, 2013 | | | 745,872 | | |
| EUR | 750,000 | | | Term Loan, 6.49%, Maturing October 31, 2014 | | | 967,690 | | |
| Ganymed 347 VV GmbH | | | |
| EUR | 494,190 | | | Term Loan, 5.75%, Maturing April 30, 2013 | | | 636,249 | | |
| EUR | 1,005,810 | | | Term Loan, 6.46%, Maturing April 30, 2013 | | | 1,294,936 | | |
| EUR | 494,190 | | | Term Loan, 6.25%, Maturing April 30, 2014 | | | 639,263 | | |
| EUR | 1,005,810 | | | Term Loan, 6.96%, Maturing April 30, 2014 | | | 1,301,071 | | |
| Infor Enterprise Solutions Holdings | | | |
| | 21,258,571 | | | Term Loan, 9.12%, Maturing July 28, 2012 | | | 21,449,006 | | |
| | 11,091,429 | | | Term Loan, 9.12%, Maturing July 28, 2012 | | | 11,190,786 | | |
| Invensys International Holding | | | |
| EUR | 1,001,757 | | | Term Loan, 5.43%, Maturing December 15, 2010 | | | 1,287,383 | | |
| | 2,166,667 | | | Term Loan, 7.45%, Maturing December 15, 2010 | | | 2,176,146 | | |
| | 2,333,333 | | | Term Loan, 7.40%, Maturing January 15, 2011 | | | 2,343,542 | | |
| Network Solutions, LLC | | | |
| | 6,848,250 | | | Term Loan, 10.37%, Maturing January 9, 2012 | | | 6,933,853 | | |
| Open Solutions, Inc. | | | |
| | 8,334,585 | | | Term Loan, 7.90%, Maturing September 30, 2011 | | | 8,381,468 | | |
| Rayovac Corp. | | | |
| | 29,461,073 | | | Term Loan, 8.39%, Maturing February 7, 2012 | | | 29,582,070 | | |
| Securityco, Inc. | | | |
| | 12,477,065 | | | Term Loan, 8.63%, Maturing June 28, 2010 | | | 12,570,643 | | |
| Sensata Technologies Finance Co. | | | |
| | 5,935,125 | | | Term Loan, 7.13%, Maturing April 26, 2013 | | | 5,906,375 | | |
| Spectrum Brands, Inc. | | | |
| EUR | 9,303,777 | | | Term Loan, 6.52%, Maturing February 7, 2012 | | | 11,800,658 | | |
| Symrise Holding GmbH | | | |
| EUR | 1,000,000 | | | Term Loan, 5.88%, Maturing August 12, 2013 | | | 1,281,455 | | |
| EUR | 1,000,000 | | | Term Loan, 6.38%, Maturing August 12, 2014 | | | 1,286,898 | | |
| Telcordia Technologies, Inc. | | | |
| | 19,108,251 | | | Term Loan, 8.15%, Maturing September 15, 2012 | | | 18,427,520 | | |
| Vertafore, Inc. | | | |
| | 1,091,446 | | | Term Loan, 7.89%, Maturing January 31, 2012 | | | 1,098,609 | | |
| | 8,469,621 | | | Term Loan, 7.90%, Maturing January 31, 2012 | | | 8,525,208 | | |
| | | | | | | $ | 229,953,114 | | |
Principal
Amount | | Borrower/Tranche Description | | Value | |
| Equipment Leasing — 1.3% | | | |
| AWAS Capital, Inc. | | | |
| $ | 19,810,666 | | | Term Loan, 7.19%, Maturing March 22, 2013 | | $ | 19,340,162 | | |
| Maxim Crane Works, L.P. | | | |
| | 7,628,102 | | | Term Loan, 7.33%, Maturing January 28, 2010 | | | 7,656,707 | | |
| The Hertz Corp. | | | |
| | 29,500,000 | | | Revolving Loan, 0.00%,
Maturing December 21, 2010(2) | | | 29,456,989 | | |
| | 2,875,000 | | | Term Loan, 5.39%, Maturing December 21, 2012 | | | 2,899,797 | | |
| | 22,842,280 | | | Term Loan, 7.65%, Maturing December 21, 2012 | | | 23,039,294 | | |
| United Rentals, Inc. | | | |
| | 5,212,716 | | | Term Loan, 6.00%, Maturing February 14, 2011 | | | 5,236,064 | | |
| | 11,436,141 | | | Term Loan, 7.32%, Maturing February 14, 2011 | | | 11,487,363 | | |
| | | | | | | $ | 99,116,376 | | |
| Farming / Agriculture — 0.4% | | | |
| BF Bolthouse HoldCo, LLC | | | |
| $ | 6,401,625 | | | Term Loan, 7.63%, Maturing December 17, 2012 | | $ | 6,422,962 | | |
| Central Garden & Pet Co. | | | |
| | 16,969,737 | | | Term Loan, 6.82%, Maturing February 28, 2014 | | | 16,987,420 | | |
| United Agri Products, Inc. | | | |
| | 2,992,500 | | | Term Loan, 7.37%, Maturing June 8, 2012 | | | 2,999,981 | | |
| | | | | | | $ | 26,410,363 | | |
| Financial Intermediaries — 2.4% | | | |
| AIMCO Properties, L.P. | | | |
| $ | 34,718,750 | | | Term Loan, 6.91%, Maturing March 23, 2011 | | $ | 34,805,547 | | |
| Ameritrade Holding Corp. | | | |
| | 24,197,282 | | | Term Loan, 6.82%, Maturing December 31, 2012 | | | 24,214,922 | | |
| Blitz F04-506 GmbH | | | |
| EUR | 1,500,000 | | | Term Loan, 6.35%, Maturing June 30, 2014 | | | 1,944,782 | | |
| Citgo III, Ltd. | | | |
| | 1,725,000 | | | Term Loan, 8.14%, Maturing August 3, 2013 | | | 1,738,477 | | |
| | 1,725,000 | | | Term Loan, 8.64%, Maturing August 3, 2014 | | | 1,744,946 | | |
| Coinstar, Inc. | | | |
| | 8,423,476 | | | Term Loan, 7.37%, Maturing July 7, 2011 | | | 8,481,387 | | |
| E.A. Viner International Co. | | | |
| | 1,496,250 | | | Term Loan, 8.12%, Maturing July 31, 2013 | | | 1,511,212 | | |
| Fidelity National Information Solutions, Inc. | | | |
| | 44,962,700 | | | Term Loan, 7.07%, Maturing March 8, 2013 | | | 45,118,810 | | |
| IPayment, Inc. | | | |
| | 7,114,250 | | | Term Loan, 7.36%, Maturing May 10, 2013 | | | 7,114,250 | | |
| LPL Holdings, Inc. | | | |
| | 25,730,563 | | | Term Loan, 8.30%, Maturing June 30, 2013 | | | 26,056,208 | | |
See notes to financial statements
25
Floating Rate Portfolio as of October 31, 2006
PORTFOLIO OF INVESTMENTS CONT'D
Principal
Amount | | Borrower/Tranche Description | | Value | |
| Financial Intermediaries (continued) | | | |
| Oxford Acquisition III, Ltd. | | | |
| EUR | 1,000,000 | | | Term Loan, 5.72%, Maturing September 20, 2013 | | $ | 1,293,235 | | |
| $ | 10,025,000 | | | Term loan, 7.69%, Maturing September 20, 2013 | | | 10,111,155 | | |
| The Macerich Partnership, L.P. | | | |
| | 11,280,000 | | | Term Loan, 6.88%, Maturing April 26, 2010 | | | 11,258,850 | | |
| | | | | | | $ | 175,393,781 | | |
| Food Products — 2.4% | | | |
| Acosta, Inc. | | | |
| $ | 17,955,000 | | | Term Loan, 8.08%, Maturing July 28, 2013 | | $ | 18,138,285 | | |
| American Seafoods Group, LLC | | | |
| | 3,991,434 | | | Term Loan, 7.12%, Maturing September 28, 2012 | | | 3,990,189 | | |
| BL Marketing, Ltd. | | | |
| GBP | 2,200,000 | | | Term Loan, 7.75%, Maturing December 20, 2013 | | | 4,257,840 | | |
| GBP | 2,200,000 | | | Term Loan, 8.25%, Maturing December 20, 2014 | | | 4,277,007 | | |
| GBP | 2,500,000 | | | Term Loan, 9.63%, Maturing June 30, 2015 | | | 4,895,844 | | |
| Black Lion Beverages III B.V. | | | |
| EUR | 1,500,000 | | | Term Loan, 6.06%, Maturing December 31, 2013 | | | 1,937,444 | | |
| EUR | 1,500,000 | | | Term Loan, 6.17%, Maturing December 31, 2014 | | | 1,945,469 | | |
| EUR | 3,000,000 | | | Term Loan, 8.31%, Maturing January 30, 2015 | | | 3,910,019 | | |
| Bumble Bee Seafood, LLC | | | |
| | 3,000,000 | | | Term Loan, 7.15%, Maturing May 2, 2012 | | | 3,000,000 | | |
| Charden International B.V. | | | |
| EUR | 1,000,000 | | | Term Loan, 6.06%, Maturing March 14, 2014 | | | 1,278,876 | | |
| EUR | 1,000,000 | | | Term Loan, 6.56%, Maturing March 14, 2015 | | | 71,284,327 | | |
| EUR | 1,500,000 | | | Term Loan, 9.06%, Maturing March 14, 2016 | | | 1,924,496 | | |
| Chiquita Brands, LLC | | | |
| | 9,635,761 | | | Term Loan, 7.62%, Maturing June 28, 2012 | | | 9,637,264 | | |
| Del Monte Corp. | | | |
| | 5,729,928 | | | Term Loan, 6.95%, Maturing February 8, 2012 | | | 5,745,279 | | |
| Dole Food Company, Inc. | | | |
| | 1,190,698 | | | Term Loan, 5.24%, Maturing April 12, 2013 | | | 1,183,256 | | |
| | 8,885,581 | | | Term Loan, 7.47%, Maturing April 12, 2013 | | | 8,830,047 | | |
| | 2,665,674 | | | Term Loan, 7.55%, Maturing April 12, 2013 | | | 2,649,014 | | |
| Foodvest Limited | | | |
| EUR | 632,918 | | | Term Loan, 5.57%, Maturing March 16, 2014 | | | 815,146 | | |
| GBP | 437,500 | | | Term Loan, 7.55%, Maturing March 16, 2014 | | | 839,289 | | |
| EUR | 632,918 | | | Term Loan, 6.07%, Maturing March 16, 2015 | | | 819,185 | | |
| GBP | 437,500 | | | Term Loan, 8.05%, Maturing March 16, 2015 | | | 843,461 | | |
| GBP | 500,000 | | | Term Loan, 7.55%, Maturing September 16, 2015 | | | 972,697 | | |
| Michael Foods, Inc. | | | |
| | 18,483,554 | | | Term Loan, 7.54%, Maturing November 21, 2010 | | | 18,525,918 | | |
| Nash-Finch Co. | | | |
| | 6,120,000 | | | Term Loan, 7.63%, Maturing November 12, 2010 | | | 6,131,475 | | |
Principal
Amount | | Borrower/Tranche Description | | Value | |
| Food Products (continued) | | | |
| Nutro Products, Inc. | | | |
| $ | 3,631,750 | | | Term Loan, 7.37%, Maturing April 26, 2013 | | $ | 3,640,829 | | |
| Picard Surgeles S.A. | | | |
| EUR | 6,500,000 | | | Term Loan, 5.44%, Maturing June 4, 2014 | | | 8,364,719 | | |
| Pinnacle Foods Holdings Corp. | | | |
| | 1,000,000 | | | Revolving Loan, 0.00%,
Maturing November 25, 2009(2) | | | 972,500 | | |
| | 26,043,685 | | | Term Loan, 7.37%, Maturing November 25, 2010 | | | 26,118,561 | | |
| QCE Finance, LLC | | | |
| | 9,177,000 | | | Term Loan, 7.63%, Maturing May 5, 2013 | | | 9,160,610 | | |
| Reddy Ice Group, Inc. | | | |
| | 14,335,000 | | | Term Loan, 7.12%, Maturing August 12, 2012 | | | 14,352,919 | | |
| Ruby Acquisitions, Ltd. | | | |
| GBP | 2,539,204 | | | Term Loan, 7.66%, Maturing January 1, 2015 | | | 4,897,379 | | |
| United Biscuits, Ltd. | | | |
| GBP | 1,547,559 | | | Term Loan, 9.37%, Maturing January 14, 2011 | | | 2,971,873 | | |
| | | | | | | $ | 178,311,217 | | |
| Food Service — 2.0% | | | |
| AFC Enterprises, Inc. | | | |
| $ | 3,540,071 | | | Term Loan, 7.63%, Maturing May 11, 2011 | | $ | 3,557,771 | | |
| Buffets, Inc. | | | |
| | 227,273 | | | Term Loan, 4.88%, Maturing June 28, 2009 | | | 228,125 | | |
| | 9,637,119 | | | Term Loan, 10.75%, Maturing June 28, 2009 | | | 9,673,258 | | |
| Burger King Corp. | | | |
| | 7,254,573 | | | Term Loan, 6.88%, Maturing June 30, 2012 | | | 7,259,608 | | |
| Carrols Corp. | | | |
| | 11,433,788 | | | Term Loan, 7.88%, Maturing December 31, 2010 | | | 11,488,099 | | |
| CBRL Group, Inc. | | | |
| | 3,882,759 | | | Term Loan, 0.00%, Maturing April 27, 2013(2) | | | 3,862,133 | | |
| | 10,757,560 | | | Term Loan, 6.93%, Maturing April 27, 2013 | | | 10,741,424 | | |
| CKE Restaurants, Inc. | | | |
| | 3,104,522 | | | Term Loan, 7.38%, Maturing May 1, 2010 | | | 3,116,164 | | |
| Denny's, Inc. | | | |
| | 5,496,518 | | | Term Loan, 8.59%, Maturing September 21, 2009 | | | 5,519,422 | | |
| Domino's, Inc. | | | |
| | 6,592,593 | | | Revolving Loan, 0.00%, Maturing June 25, 2009(2) | | | 6,460,741 | | |
| | 34,498,921 | | | Term Loan, 6.88%, Maturing June 25, 2010 | | | 34,527,659 | | |
| Elior Sca | | | |
| EUR | 701,754 | | | Term Loan, 5.76%, Maturing June 30, 2014 | | | 905,387 | | |
| EUR | 701,754 | | | Term Loan, 6.26%, Maturing June 30, 2015 | | | 909,493 | | |
| Holding Bercy Investissement | | | |
| EUR | 1,096,491 | | | Term Loan, 6.01%, Maturing June 30, 2011 | | | 1,416,126 | | |
| Jack in the Box, Inc. | | | |
| | 12,615,115 | | | Term Loan, 6.88%, Maturing January 8, 2011 | | | 12,666,370 | | |
See notes to financial statements
26
Floating Rate Portfolio as of October 31, 2006
PORTFOLIO OF INVESTMENTS CONT'D
Principal
Amount | | Borrower/Tranche Description | | Value | |
| Food Service (continued) | | | |
| Landry's Restaurants, Inc. | | | |
| $ | 7,914,038 | | | Term Loan, 7.12%, Maturing December 28, 2010 | | $ | 7,920,630 | | |
| Maine Beverage Co., LLC | | | |
| | 3,633,929 | | | Term Loan, 7.12%, Maturing June 30, 2010 | | | 3,624,844 | | |
| NPC International, Inc. | | | |
| | 3,368,535 | | | Term Loan, 7.10%, Maturing May 3, 2013 | | | 3,360,113 | | |
| Sagittarius Restaurants, LLC | | | |
| | 4,855,612 | | | Term Loan, 7.62%, Maturing March 29, 2013 | | | 4,878,376 | | |
| Sonic Corp. | | | |
| | 5,292,000 | | | Term Loan, 7.32%, Maturing September 22, 2013 | | | 5,311,845 | | |
| SSP Financing, Ltd. | | | |
| EUR | 1,025,146 | | | Term Loan, 5.93%, Maturing June 15, 2014 | | | 1,319,152 | | |
| | 3,954,516 | | | Term Loan, 7.83%, Maturing June 15, 2014 | | | 3,977,583 | | |
| EUR | 1,025,146 | | | Term Loan, 6.43%, Maturing June 15, 2015 | | | 1,324,954 | | |
| | 3,954,516 | | | Term Loan, 8.33%, Maturing June 15, 2015 | | | 3,994,061 | | |
| Weightwatchers.com, Inc. | | | |
| | 3,290,062 | | | Term Loan, 7.61%, Maturing December 16, 2010 | | | 3,306,512 | | |
| | | | | | | $ | 151,349,850 | | |
| Food / Drug Retailers — 1.8% | | | |
| Cumberland Farms, Inc. | | | |
| $ | 6,000,000 | | | Term Loan, 7.37%, Maturing September 30, 2013 | | $ | 6,030,000 | | |
| General Nutrition Centers, Inc. | | | |
| | 9,000,000 | | | Revolving Loan, 0.00%, Maturing December 5, 2009(2) | | | 8,752,500 | | |
| | 4,866,579 | | | Term Loan, 8.11%, Maturing December 5, 2011 | | | 4,910,685 | | |
| Giant Eagle, Inc. | | | |
| | 13,051,375 | | | Term Loan, 6.90%, Maturing November 7, 2012 | | | 13,065,653 | | |
| Roundy's Supermarkets, Inc. | | | |
| | 24,241,813 | | | Term Loan, 8.42%, Maturing November 3, 2011 | | | 24,463,019 | | |
| Supervalu, Inc. | | | |
| | 14,427,500 | | | Term Loan, 7.19%, Maturing June 1, 2012 | | | 14,480,709 | | |
| The Jean Coutu Group (PJC), Inc. | | | |
| | 26,942,468 | | | Term Loan, 7.94%, Maturing July 30, 2011 | | | 27,064,248 | | |
| The Pantry, Inc. | | | |
| | 5,756,500 | | | Term Loan, 7.07%, Maturing January 2, 2012 | | | 5,776,291 | | |
| Winn-Dixie Stores, Inc. | | | |
| | 23,000,000 | | | DIP Revolving Loan, 7.44%, Maturing
February 22, 2007(2) | | | 22,885,000 | | |
| | | | | | | $ | 127,428,105 | | |
| Forest Products — 2.4% | | | |
| Appleton Papers, Inc. | | | |
| $ | 12,644,414 | | | Term Loan, 7.65%, Maturing June 11, 2010 | | $ | 12,707,636 | | |
Principal
Amount | | Borrower/Tranche Description | | Value | |
| Forest Products (continued) | | | |
| Boise Cascade Holdings, LLC | | | |
| $ | 18,677,451 | | | Term Loan, 7.11%, Maturing October 28, 2011 | | $ | 18,783,688 | | |
| Buckeye Technologies, Inc. | | | |
| | 9,685,044 | | | Term Loan, 7.38%, Maturing April 15, 2010 | | | 9,693,112 | | |
| Georgia-Pacific Corp. | | | |
| | 65,639,037 | | | Term Loan, 7.39%, Maturing December 20, 2012 | | | 66,053,810 | | |
| | 18,700,000 | | | Term Loan, 8.39%, Maturing December 23, 2013 | | | 18,962,230 | | |
| NewPage Corp. | | | |
| | 11,785,714 | | | Revolving Loan, 0.00%, Maturing May 2, 2010(2) | | | 11,608,929 | | |
| | 13,705,851 | | | Term Loan, 8.36%, Maturing May 2, 2011 | | | 13,877,175 | | |
| RLC Industries Co. | | | |
| | 15,951,708 | | | Term Loan, 6.82%, Maturing February 24, 2010 | | | 15,931,768 | | |
| Xerium Technologies, Inc. | | | |
| EUR | 1,975,000 | | | Term Loan, 5.63%, Maturing May 18, 2012 | | | 2,537,597 | | |
| | 10,014,466 | | | Term Loan, 7.62%, Maturing May 18, 2012 | | | 10,001,948 | | |
| | | | | | | $ | 180,157,893 | | |
| Healthcare — 5.7% | | | |
| Accellent, Inc. | | | |
| $ | 3,225,625 | | | Term Loan, 7.40%, Maturing November 22, 2012 | | $ | 3,233,689 | | |
| Alliance Imaging, Inc. | | | |
| | 10,040,194 | | | Term Loan, 7.94%, Maturing December 29, 2011 | | | 10,068,438 | | |
| | | American Medical Systems | |
| | 13,550,000 | | | Term Loan, 7.81%, Maturing July 20, 2012 | | | 13,566,937 | | |
| AMN Healthcare, Inc. | | | |
| | 3,176,171 | | | Term Loan, 7.12%, Maturing November 2, 2011 | | | 3,187,091 | | |
| AMR HoldCo, Inc. | | | |
| | 6,068,680 | | | Term Loan, 7.28%, Maturing February 10, 2012 | | | 6,080,059 | | |
| Carl Zeiss Topco GMBH | | | |
| | 3,140,000 | | | Term Loan, 8.12%, Maturing February 28, 2013 | | | 3,167,475 | | |
| | 6,280,000 | | | Term Loan, 8.62%, Maturing February 28, 2014 | | | 6,366,350 | | |
| | 2,875,000 | | | Term Loan, 10.87%, Maturing August 31, 2014 | | | 2,917,766 | | |
| Community Health Systems, Inc. | | | |
| | 47,978,227 | | | Term Loan, 7.15%, Maturing August 19, 2011 | | | 48,059,598 | | |
| Concentra Operating Corp. | | | |
| | 17,431,491 | | | Term Loan, 7.62%, Maturing September 30, 2011 | | | 17,532,263 | | |
| Conmed Corp. | | | |
| | 8,109,250 | | | Term Loan, 7.32%, Maturing April 12, 2013 | | | 8,119,387 | | |
| CRC Health Corp. | | | |
| | 3,955,125 | | | Term Loan, 7.62%, Maturing February 6, 2013 | | | 3,960,069 | | |
| Davita, Inc. | | | |
| | 47,516,567 | | | Term Loan, 7.43%, Maturing October 5, 2012 | | | 47,807,179 | | |
| DJ Orthopedics, LLC | | | |
| | 2,515,607 | | | Term Loan, 6.88%, Maturing April 7, 2013 | | | 2,512,463 | | |
See notes to financial statements
27
Floating Rate Portfolio as of October 31, 2006
PORTFOLIO OF INVESTMENTS CONT'D
Principal
Amount | | Borrower/Tranche Description | | Value | |
| Healthcare (continued) | | | |
| Encore Medical IHC, Inc. | | | |
| $ | 7,952,608 | | | Term Loan, 8.30%, Maturing October 4, 2010 | | $ | 7,972,489 | | |
| FGX International, Inc. | | | |
| | 4,000,000 | | | Term Loan, 9.39%, Maturing December 12, 2012 | | | 3,980,000 | | |
| FHC Health Systems, Inc. | | | |
| | 2,000,000 | | | Term Loan, 11.49%, Maturing June 27, 2008 | | | 2,075,000 | | |
| | 2,321,429 | | | Term Loan, 11.40%, Maturing December 18, 2009 | | | 2,408,482 | | |
| | 1,625,000 | | | Term Loan, 13.40%, Maturing December 18, 2009 | | | 1,685,937 | | |
| | 3,250,000 | | | Term Loan, 14.40%, Maturing February 7, 2011 | | | 3,371,875 | | |
| | | Fresenius Medical Care Holdings | |
| | 26,564,006 | | | Term Loan, 6.75%, Maturing March 31, 2013 | | | 26,433,019 | | |
| Hanger Orthopedic Group, Inc. | | | |
| | 5,461,313 | | | Term Loan, 7.87%, Maturing May 26, 2011 | | | 5,487,483 | | |
| HealthSouth Corp. | | | |
| | 17,456,250 | | | Term Loan, 8.62%, Maturing March 10, 2013 | | | 17,548,384 | | |
| Iasis Healthcare, LLC | | | |
| | 12,864,299 | | | Term Loan, 7.62%, Maturing June 16, 2011 | | | 12,944,701 | | |
| Kinetic Concepts, Inc. | | | |
| | 7,771,163 | | | Term Loan, 7.12%, Maturing August 11, 2010 | | | 7,793,024 | | |
| Leiner Health Products, Inc. | | | |
| | 8,162,125 | | | Term Loan, 8.88%, Maturing May 27, 2011 | | | 8,209,735 | | |
| Lifecare Holdings, Inc. | | | |
| | 9,157,500 | | | Term Loan, 7.57%, Maturing August 11, 2012 | | | 8,459,241 | | |
| Lifepoint Hospitals, Inc. | | | |
| | 31,523,355 | | | Term Loan, 6.95%, Maturing April 15, 2012 | | | 31,420,904 | | |
| Magellan Health Services, Inc. | | | |
| | 3,679,054 | | | Term Loan, 5.20%, Maturing August 15, 2008 | | | 3,688,252 | | |
| | 3,219,172 | | | Term Loan, 7.17%, Maturing August 15, 2008 | | | 3,227,220 | | |
| Matria Healthcare, Inc. | | | |
| | 3,330,892 | | | Term Loan, 7.63%, Maturing January 19, 2012 | | | 3,341,301 | | |
| Medcath Holdings Corp. | | | |
| | 1,517,702 | | | Term Loan, 7.86%, Maturing June 30, 2011 | | | 1,519,125 | | |
| Moon Acquisition Co. AB | | | |
| EUR | 3,054,298 | | | Term Loan, 5.88%, Maturing November 4, 2013 | | | 3,950,659 | | |
| EUR | 2,242,000 | | | Term Loan, 6.38%, Maturing November 4, 2014 | | | 2,913,503 | | |
| Multiplan Merger Corp. | | | |
| | 4,640,588 | | | Term Loan, 7.85%, Maturing April 12, 2013 | | | 4,652,190 | | |
| National Mentor Holdings, Inc. | | | |
| | 484,400 | | | Term Loan, 5.32%, Maturing June 29, 2013 | | | 486,822 | | |
| | 8,145,186 | | | Term Loan, 7.87%, Maturing June 29, 2013 | | | 8,185,912 | | |
| P&F Capital S.A.R.L. | | | |
| EUR | 836,893 | | | Term Loan, 5.63%, Maturing February 21, 2014 | | | 1,084,025 | | |
| EUR | 500,938 | | | Term Loan, 5.63%, Maturing February 21, 2014 | | | 648,863 | | |
| EUR | 401,974 | | | Term Loan, 5.63%, Maturing February 21, 2014 | | | 520,676 | | |
| EUR | 260,194 | | | Term Loan, 6.13%, Maturing February 21, 2014 | | | 337,028 | | |
Principal
Amount | | Borrower/Tranche Description | | Value | |
| Healthcare (continued) | | | |
| EUR | 378,378 | | | Term Loan, 6.13%, Maturing February 21, 2015 | | $ | 492,150 | | |
| EUR | 140,541 | | | Term Loan, 6.13%, Maturing February 21, 2015 | | | 182,798 | | |
| EUR | 291,892 | | | Term Loan, 6.13%, Maturing February 21, 2015 | | | 379,658 | | |
| EUR | 1,189,189 | | | Term Loan, 6.13%, Maturing February 21, 2015 | | | 1,546,756 | | |
| PER-SE Technologies, Inc. | | | |
| | 8,991,954 | | | Term Loan, 7.57%, Maturing January 6, 2013 | | | 9,045,348 | | |
| Renal Advantage, Inc. | | | |
| | 2,327,221 | | | Term Loan, 7.89%, Maturing October 5, 2012 | | | 2,346,130 | | |
| Select Medical Holding Corp. | | | |
| | 9,800,750 | | | Term Loan, 7.15%, Maturing February 24, 2012 | | | 9,631,079 | | |
| Sirona Dental Systems GmbH | | | |
| EUR | 1,500,000 | | | Term Loan, 5.85%, Maturing June 30, 2013 | | | 1,937,773 | | |
| Sunrise Medical Holdings, Inc. | | | |
| | 8,236,913 | | | Term Loan, 8.89%, Maturing May 13, 2010 | | | 8,216,321 | | |
| Talecris Biotherapeutics, Inc. | | | |
| | 7,520,475 | | | Term Loan, 8.64%, Maturing March 31, 2010 | | | 7,558,077 | | |
| | 1,531,250 | | | Term Loan, 8.89%, Maturing May 31, 2010 | | | 1,531,250 | | |
| Vanguard Health Holding Co., LLC | | | |
| | 14,948,278 | | | Term Loan, 7.87%, Maturing September 23, 2011 | | | 14,980,985 | | |
| Ventiv Health, Inc. | | | |
| | 3,441,429 | | | Term Loan, 6.87%, Maturing October 5, 2011 | | | 3,430,674 | | |
| VWR International, Inc. | | | |
| EUR | 2,424,905 | | | Term Loan, 6.28%, Maturing April 7, 2011 | | | 3,124,688 | | |
| | 10,198,914 | | | Term Loan, 7.63%, Maturing April 7, 2011 | | | 10,227,604 | | |
| | | | | | | $ | 425,555,905 | | |
| Home Furnishings — 1.2% | | | |
| Interline Brands, Inc. | | | |
| $ | 6,039,212 | | | Term Loan, 7.11%, Maturing June 23, 2013 | | $ | 6,050,535 | | |
| | 7,850,976 | | | Term Loan, 7.12%, Maturing June 23, 2013 | | | 7,865,696 | | |
| Knoll, Inc. | | | |
| | 9,009,340 | | | Term Loan, 7.12%, Maturing October 3, 2012 | | | 9,062,837 | | |
| National Bedding Co., LLC | | | |
| | 6,594,037 | | | Term Loan, 7.39%, Maturing August 31, 2011 | | | 6,622,886 | | |
| | 1,500,000 | | | Term Loan, 10.37%, Maturing August 31, 2012 | | | 1,514,062 | | |
| Oreck Corp. | | | |
| | 4,277,960 | | | Term Loan, 8.12%, Maturing February 2, 2012 | | | 4,281,972 | | |
| Sanitec, Ltd. Oy | | | |
| EUR | 4,478,261 | | | Term Loan, 5.89%, Maturing April 7, 2013 | | | 5,688,678 | | |
| EUR | 4,478,261 | | | Term Loan, 6.39%, Maturing April 7, 2014 | | | 5,714,828 | | |
| Sealy Mattress Co. | | | |
| | 5,000,000 | | | Revolving Loan, 0.00%, Maturing April 6, 2012(2) | | | 4,925,000 | | |
| | 12,125,000 | | | Term Loan, 7.37%, Maturing August 25, 2012 | | | 12,125,000 | | |
See notes to financial statements
28
Floating Rate Portfolio as of October 31, 2006
PORTFOLIO OF INVESTMENTS CONT'D
Principal
Amount | | Borrower/Tranche Description | | Value | |
| Home Furnishings (continued) | | | |
| Simmons Co. | | | |
| $ | 21,880,243 | | | Term Loan, 7.17%, Maturing December 19, 2011 | | $ | 22,047,758 | | |
| | | | | | | $ | 85,899,252 | | |
| Industrial Equipment — 1.6% | | | |
| Aearo Technologies, Inc. | | | |
| $ | 6,268,500 | | | Term Loan, 7.87%, Maturing March 22, 2013 | | $ | 6,328,571 | | |
| Alliance Laundry Holdings, LLC | | | |
| | 3,777,766 | | | Term Loan, 7.57%, Maturing January 27, 2012 | | | 3,804,921 | | |
| Colfax Corp. | | | |
| | 2,013,432 | | | Term Loan, 7.38%, Maturing November 30, 2011 | | | 2,024,757 | | |
| EUR | 4,962,500 | | | Term Loan, 5.63%, Maturing December 19, 2011 | | | 6,357,639 | | |
| Douglas Dynamics Holdings, Inc. | | | |
| | 4,145,273 | | | Term Loan, 7.12%, Maturing December 16, 2010 | | | 4,134,910 | | |
| Flowserve Corp. | | | |
| | 13,777,287 | | | Term Loan, 6.88%, Maturing August 10, 2012 | | | 13,805,268 | | |
| Gleason Corp. | | | |
| | 5,650,000 | | | Term Loan, 7.91%, Maturing June 30, 2013 | | | 5,692,375 | | |
| GSCP Athena (Finnish) Holdings | | | |
| EUR | 6,108,696 | | | Term Loan, 5.57%, Maturing August 31, 2013 | | | 7,833,650 | | |
| EUR | 5,891,304 | | | Term Loan, 6.07%, Maturing August 31, 2014 | | | 7,588,296 | | |
| Heating Finance PLC (Baxi) | | | |
| EUR | 3,253,597 | | | Term Loan, 0.00%, Maturing December 27, 2010(2) | | | 4,137,156 | | |
| GBP | 2,944,670 | | | Term Loan, 7.10%, Maturing December 27, 2010 | | | 5,605,691 | | |
| John Maneely Co. | | | |
| | 2,838,461 | | | Term Loan, 8.37%, Maturing March 24, 2013 | | | 2,867,734 | | |
| MTD Products, Inc. | | | |
| | 10,772,259 | | | Term Loan, 6.88%, Maturing June 1, 2010 | | | 10,691,467 | | |
| Nacco Materials Handling Group, Inc. | | | |
| | 3,561,063 | | | Term Loan, 7.36%, Maturing March 22, 2013 | | | 3,556,611 | | |
| PP Acquisition Corp. | | | |
| | 20,538,819 | | | Term Loan, 8.32%, Maturing November 12, 2011 | | | 20,701,425 | | |
| Prysmian S.R.L. | | | |
| EUR | 2,000,000 | | | Term Loan, 7.88%, Maturing August 22, 2014 | | | 2,564,754 | | |
| EUR | 1,400,000 | | | Term Loan, 5.79%, Maturing August 22, 2014 | | | 1,795,328 | | |
| EUR | 300,000 | | | Term Loan, 6.29%, Maturing August 22, 2015 | | | 386,415 | | |
| TFS Acquisition Corp. | | | |
| | 5,500,000 | | | Term Loan, 8.92%, Maturing August 11, 2013 | | | 5,541,250 | | |
| | | | | | | $ | 115,418,218 | | |
| Insurance — 0.8% | | | |
| ARG Holding, Inc. | | | |
| $ | 7,890,375 | | | Term Loan, 8.38%, Maturing November 30, 2011 | | $ | 7,924,895 | | |
| | 500,000 | | | Term Loan, 12.62%, Maturing November 30, 2012 | | | 506,250 | | |
Principal
Amount | | Borrower/Tranche Description | | Value | |
| Insurance (continued) | | | |
| CCC Information Services Group | | | |
| $ | 5,275,000 | | | Term Loan, 7.87%, Maturing February 10, 2013 | | $ | 5,304,672 | | |
| Conseco, Inc. | | | |
| | 21,450,000 | | | Term Loan, 7.32%, Maturing September 25, 2013 | | | 21,530,437 | | |
| Hilb, Rogal & Hobbs Co. | | | |
| | 5,671,500 | | | Term Loan, 6.87%, Maturing April 26, 2013 | | | 5,673,865 | | |
| U.S.I. Holdings Corp. | | | |
| | 1,737,500 | | | Term Loan, 0.00%, Maturing March 24, 2011(2) | | | 1,746,187 | | |
| | 16,924,312 | | | Term Loan, 7.69%, Maturing March 24, 2011 | | | 17,008,933 | | |
| | | | | | | $ | 59,695,239 | | |
| Leisure Goods / Activities / Movies — 5.1% | | | |
| 24 Hour Fitness Worldwide, Inc. | | | |
| $ | 11,472,350 | | | Term Loan, 7.99%, Maturing June 2, 2012 | | $ | 11,558,393 | | |
| Alliance Atlantis Communications, Inc. | | | |
| | 6,502,970 | | | Term Loan, 6.87%, Maturing December 31, 2011 | | | 6,509,746 | | |
| Alpha D2, Ltd. | | | |
| | 40,355,828 | | | Term Loan, 7.33%, Maturing December 31, 2007 | | | 40,406,273 | | |
| AMC Entertainment, Inc. | | | |
| | 15,368,912 | | | Term Loan, 7.45%, Maturing January 26, 2013 | | | 15,510,199 | | |
| AMF Bowling Worldwide, Inc. | | | |
| | 3,513,711 | | | Term Loan, 8.43%, Maturing August 27, 2009 | | | 3,542,260 | | |
| Bombardier Recreational Product | | | |
| | 15,800,000 | | | Term Loan, 8.13%, Maturing June 28, 2013 | | | 15,800,000 | | |
| Butterfly Wendel US, Inc. | | | |
| | 1,237,500 | | | Term Loan, 8.15%, Maturing June 22, 2013 | | | 1,254,709 | | |
| | 1,237,500 | | | Term Loan, 7.90%, Maturing June 22, 2014 | | | 1,248,521 | | |
| Carmike Cinemas, Inc. | | | |
| | 6,726,411 | | | Term Loan, 8.64%, Maturing May 19, 2012 | | | 6,804,888 | | |
| | 9,383,031 | | | Term Loan, 8.65%, Maturing May 19, 2012 | | | 9,484,678 | | |
| Cedar Fair, L.P. | | | |
| | 4,987,500 | | | Term Loan, 7.82%, Maturing August 31, 2011 | | | 5,015,555 | | |
| | 19,201,875 | | | Term Loan, 7.87%, Maturing August 30, 2012 | | | 19,434,390 | | |
| Cinemark, Inc. | | | |
| | 29,450,000 | | | Term Loan, 7.32%, Maturing October 5, 2013 | | | 29,668,578 | | |
| Corleone Capital, Ltd. | | | |
| GBP | 697,341 | | | Term Loan, 6.82%,
Maturing November 30, 2011 | | | 1,322,798 | | |
| GBP | 772,711 | | | Term Loan, 7.57%,
Maturing November 30, 2012 | | | 1,474,059 | | |
| Dave & Buster's, Inc. | | | |
| | 1,490,006 | | | Term Loan, 7.88%, Maturing March 8, 2013 | | | 1,501,181 | | |
| | 1,496,250 | | | Term Loan, 7.94%, Maturing March 8, 2013 | | | 1,507,472 | | |
| Deluxe Entertainment Services | | | |
| | 3,900,000 | | | Term Loan, 5.27%, Maturing January 28, 2011 | | | 3,841,500 | | |
| | 3,227,249 | | | Term Loan, 9.12%, Maturing January 28, 2011 | | | 3,260,868 | | |
See notes to financial statements
29
Floating Rate Portfolio as of October 31, 2006
PORTFOLIO OF INVESTMENTS CONT'D
Principal
Amount | | Borrower/Tranche Description | | Value | |
| Leisure Goods / Activities / Movies (continued) | | | |
| Easton-Bell Sports, Inc. | | | |
| $ | 7,064,500 | | | Term Loan, 7.12%, Maturing March 16, 2012 | | $ | 7,082,161 | | |
| Fender Musical Instruments Co. | | | |
| | 1,966,804 | | | Term Loan, 8.13%, Maturing March 30, 2012 | | | 1,979,096 | | |
| | 500,000 | | | Term Loan, 11.38%, Maturing October 1, 2012 | | | 505,000 | | |
| Lions Gate Entertainment, Inc. | | | |
| | 1,022,500 | | | Revolving Loan, 0.00%,
Maturing December 31, 2008(2) | | | 1,007,162 | | |
| Metro-Goldwyn-Mayer Holdings, Inc. | | | |
| | 3,882,784 | | | Term Loan, 8.62%, Maturing April 8, 2011 | | | 3,838,023 | | |
| | 64,500,900 | | | Term Loan, 8.62%, Maturing April 8, 2012 | | | 63,781,005 | | |
| Regal Cinemas Corp. | | | |
| | 32,500,000 | | | Term Loan, 7.12%, Maturing November 10, 2010 | | | 32,491,290 | | |
| Six Flags Theme Parks, Inc. | | | |
| | 3,275,000 | | | Revolving Loan, 8.57%, Maturing June 30, 2008(2) | | | 3,258,625 | | |
| | 25,517,824 | | | Term Loan, 8.66%, Maturing June 30, 2009 | | | 25,830,826 | | |
| Southwest Sports Group, LLC | | | |
| | 9,500,000 | | | Term Loan, 7.88%, Maturing December 22, 2010 | | | 9,502,973 | | |
| Universal City Development Partners, Ltd. | | | |
| | 18,996,088 | | | Term Loan, 7.39%, Maturing June 9, 2011 | | | 19,079,196 | | |
| WMG Acquisition Corp. | | | |
| | 4,390,000 | | | Revolving Loan, 0.00%, Maturing February 28, 2010(2) | | | 4,270,372 | | |
| | 29,923,260 | | | Term Loan, 7.37%, Maturing February 28, 2011 | | | 30,071,022 | | |
| | | | | | | $ | 381,842,819 | | |
| Lodging and Casinos — 3.7% | | | |
| Ameristar Casinos, Inc. | | | |
| $ | 8,138,500 | | | Term Loan, 6.90%, Maturing November 10, 2012 | | $ | 8,148,673 | | |
| Aztar Corp. | | | |
| | 1,955,000 | | | Term Loan, 6.82%, Maturing July 27, 2009 | | | 1,955,000 | | |
| Bally Technologies, Inc. | | | |
| | 15,460,019 | | | Term Loan, 9.33%, Maturing September 4, 2009 | | | 15,514,778 | | |
| Boyd Gaming Corp. | | | |
| | 25,899,261 | | | Term Loan, 6.87%, Maturing June 30, 2011 | | | 25,938,110 | | |
| CCM Merger, Inc. | | | |
| | 11,072,406 | | | Term Loan, 7.38%, Maturing April 25, 2012 | | | 11,077,942 | | |
| Choctaw Resort Development Enterprise | | | |
| | 3,845,183 | | | Term Loan, 7.12%, Maturing January 4, 2011 | | | 3,849,989 | | |
| Columbia Entertainment Co. | | | |
| | 3,129,107 | | | Term Loan, 7.82%, Maturing October 24, 2011 | | | 3,144,753 | | |
| Fairmont Hotels and Resorts, Inc. | | | |
| | 6,358,471 | | | Term Loan, 8.57%, Maturing May 12, 2011 | | | 6,414,107 | | |
| Gala Electric Casinos, Ltd. | | | |
| GBP | 5,000,000 | | | Term Loan, 7.30%, Maturing December 12, 2012(2) | | | 9,554,130 | | |
| GBP | 13,498,333 | | | Term Loan, 7.55%, Maturing December 12, 2014 | | | 25,991,922 | | |
| GBP | 12,498,333 | | | Term Loan, 8.05%, Maturing December 12, 2014 | | | 24,168,715 | | |
Principal
Amount | | Borrower/Tranche Description | | Value | |
| Lodging and Casinos (continued) | | | |
| Globalcash Access, LLC | | | |
| $ | 2,989,729 | | | Term Loan, 9.00%, Maturing March 10, 2010 | | $ | 2,989,729 | | |
| Green Valley Ranch Gaming, LLC | | | |
| | 2,967,263 | | | Term Loan, 7.37%, Maturing December 24, 2010 | | | 2,972,827 | | |
| Herbst Gaming, Inc. | | | |
| | 3,181,550 | | | Term Loan, 7.37%, Maturing January 31, 2011 | | | 3,186,523 | | |
| Isle of Capri Casinos, Inc. | | | |
| | 4,937,500 | | | Term Loan, 7.12%, Maturing February 4, 2012 | | | 4,956,016 | | |
| | 15,599,044 | | | Term Loan, 7.18%, Maturing February 4, 2012 | | | 15,657,540 | | |
| Penn National Gaming, Inc. | | | |
| | 47,593,920 | | | Term Loan, 7.13%, Maturing October 3, 2012 | | | 47,903,281 | | |
| Pinnacle Entertainment, Inc. | | | |
| | 7,500,000 | | | Term Loan, 7.32%, Maturing December 14, 2011 | | | 7,529,063 | | |
| Trump Entertainment Resorts Holdings, L.P. | | | |
| | 5,406,563 | | | Term Loan, 0.00%, Maturing May 20, 2012(2) | | | 5,453,026 | | |
| | 5,406,563 | | | Term Loan, 8.03%, Maturing May 20, 2012 | | | 5,453,026 | | |
| Venetian Casino Resort, LLC | | | |
| | 32,347,836 | | | Term Loan, 7.12%, Maturing June 15, 2011 | | | 32,464,093 | | |
| VML US Finance, LLC | | | |
| | 3,333,333 | | | Term Loan, 0.00%, Maturing May 25, 2012(2) | | | 3,331,943 | | |
| | 6,666,667 | | | Term Loan, 8.12%, Maturing May 25, 2013 | | | 6,718,227 | | |
| | | | | | | $ | 274,373,413 | | |
| Nonferrous Metals / Minerals — 1.6% | | | |
| Almatis Holdings 5 BV | | | |
| EUR | 1,007,336 | | | Term Loan, 5.74%, Maturing December 21, 2013 | | $ | 1,303,874 | | |
| | 1,000,000 | | | Term Loan, 8.12%, Maturing December 21, 2013 | | | 1,013,672 | | |
| EUR | 1,007,336 | | | Term Loan, 6.24%, Maturing December 21, 2014 | | | 1,309,017 | | |
| | 1,000,000 | | | Term Loan, 8.62%, Maturing December 21, 2014 | | | 1,018,203 | | |
| Alpha Natural Resources, LLC | | | |
| | 9,235,237 | | | Term Loan, 7.12%, Maturing October 26, 2012 | | | 9,259,766 | | |
| Carmeuse Lime, Inc. | | | |
| | 6,958,479 | | | Term Loan, 7.19%, Maturing May 2, 2011 | | | 6,958,479 | | |
| CII Carbon, LLC | | | |
| | 3,604,375 | | | Term Loan, 7.44%, Maturing August 23, 2012 | | | 3,613,386 | | |
| Compass Minerals Group, Inc. | | | |
| | 7,402,870 | | | Term Loan, 6.88%, Maturing December 22, 2012 | | | 7,414,441 | | |
| | | Magnum Coal Co. | |
| | 1,375,000 | | | Term Loan, 8.57%, Maturing March 21, 2013 | | | 1,380,156 | | |
| | 13,681,250 | | | Term Loan, 8.62%, Maturing March 21, 2013 | | | 13,732,555 | | |
| Murray Energy Corp. | | | |
| | 10,795,600 | | | Term Loan, 8.40%, Maturing January 28, 2010 | | | 10,903,556 | | |
| Novelis, Inc. | | | |
| | 20,364,070 | | | Term Loan, 7.72%, Maturing January 9, 2012 | | | 20,454,527 | | |
See notes to financial statements
30
Floating Rate Portfolio as of October 31, 2006
PORTFOLIO OF INVESTMENTS CONT'D
Principal
Amount | | Borrower/Tranche Description | | Value | |
| Nonferrous Metals / Minerals (continued) | | | |
| Severstal North America, Inc. | | | |
| $ | 15,200,000 | | | Revolving Loan, 0.00%, Maturing April 7, 2007(2) | | $ | 15,124,000 | | |
| Stillwater Mining Co. | | | |
| | 4,360,000 | | | Revolving Loan, 5.32%, Maturing June 30, 2007(2) | | | 4,430,850 | | |
| | 5,692,413 | | | Term Loan, 7.63%, Maturing June 30, 2007 | | | 5,720,875 | | |
| Tube City IMS Corp. | | | |
| | 15,401,863 | | | Term Loan, 8.12%, Maturing December 31, 2010 | | | 15,459,620 | | |
| | 3,000,000 | | | Term Loan, 11.37%, Maturing October 26, 2011 | | | 3,007,500 | | |
| | | | | | | $ | 122,104,477 | | |
| Oil and Gas — 2.4% | | | |
| Cavallo Energy L.P. | | | |
| $ | 20,781,250 | | | Revolving Loan, 6.81%, Maturing October 5, 2010(2) | | $ | 20,755,273 | | |
| | 2,127,604 | | | Term Loan, 8.32%, Maturing December 5, 2010 | | | 2,126,274 | | |
| Citgo Petroleum Corp. | | | |
| | 8,052,264 | | | Term Loan, 6.68%, Maturing November 15, 2012 | | | 8,064,004 | | |
| Coffeyville Resources, LLC | | | |
| | 1,600,000 | | | Term Loan, 5.27%, Maturing July 8, 2011 | | | 1,611,798 | | |
| | 2,370,150 | | | Term Loan, 7.63%, Maturing July 8, 2012 | | | 2,387,627 | | |
| Concho Resources, Inc. | | | |
| | 17,181,938 | | | Term Loan, 9.37%, Maturing July 6, 2011(4) | | | 17,128,673 | | |
| El Paso Corp. | | | |
| | 10,960,000 | | | Term Loan, 5.33%, Maturing July 31, 2011 | | | 11,047,088 | | |
| Epco Holdings, Inc. | | | |
| | 4,333,334 | | | Revolving Loan, 7.07%,
Maturing August 18, 2008(2) | | | 4,279,167 | | |
| | 7,506,760 | | | Term Loan, 7.13%, Maturing August 18, 2008 | | | 7,527,877 | | |
| | 10,063,450 | | | Term Loan, 7.37%, Maturing August 18, 2010 | | | 10,132,636 | | |
| Key Energy Services, Inc. | | | |
| | 9,851,303 | | | Term Loan, 9.19%, Maturing June 30, 2012 | | | 9,911,337 | | |
| LB Pacific, L.P. | | | |
| | 7,968,650 | | | Term Loan, 8.07%, Maturing March 3, 2012 | | | 7,988,572 | | |
| Niska Gas Storage | | | |
| | 1,321,515 | | | Term Loan, 0.00%, Maturing May 12, 2013(2) | | | 1,323,167 | | |
| | 1,887,879 | | | Term Loan, 7.14%, Maturing May 13, 2011 | | | 1,890,239 | | |
| | 1,972,361 | | | Term Loan, 7.16%, Maturing May 12, 2013 | | | 1,972,054 | | |
| | 10,333,777 | | | Term Loan, 7.17%, Maturing May 12, 2013 | | | 10,332,164 | | |
| Petroleum Geo-Services ASA | | | |
| | 4,049,951 | | | Term Loan, 7.61%, Maturing December 16, 2012 | | | 4,081,844 | | |
| Primary Natural Resources, Inc. | | | |
| | 13,382,750 | | | Term Loan, 9.35%, Maturing July 28, 2010(4) | | | 13,341,263 | | |
| Targa Resources, Inc. | | | |
| | 11,750,000 | | | Term Loan, 7.62%, Maturing October 31, 2007 | | | 11,766,521 | | |
| | 3,434,480 | | | Term Loan, 7.62%, Maturing October 31, 2012 | | | 3,455,946 | | |
| | 19,333,381 | | | Term Loan, 7.63%, Maturing October 31, 2012 | | | 19,454,214 | | |
Principal
Amount | | Borrower/Tranche Description | | Value | |
| Oil and Gas (continued) | | | |
| W&T Offshore, Inc. | | | |
| $ | 10,850,000 | | | Term Loan, 7.65%, Maturing May 26, 2010 | | $ | 10,924,594 | | |
| | | | | | | $ | 181,502,332 | | |
| Publishing — 4.9% | | | |
| American Media Operations, Inc. | | | |
| $ | 23,000,000 | | | Term Loan, 8.37%, Maturing January 31, 2013 | | $ | 23,170,108 | | |
| Black Press US Partnership | | | |
| | 4,550,000 | | | Term Loan, 7.50%, Maturing August 2, 2013 | | | 4,584,125 | | |
| CBD Media, LLC | | | |
| | 7,452,219 | | | Term Loan, 7.70%, Maturing December 31, 2009 | | | 7,514,318 | | |
| Dex Media East, LLC | | | |
| | 8,980,144 | | | Term Loan, 6.92%, Maturing May 8, 2009 | | | 8,963,306 | | |
| Dex Media West, LLC | | | |
| | 15,207,322 | | | Term Loan, 6.88%, Maturing March 9, 2010 | | | 15,168,437 | | |
| | 2,450,015 | | | Term Loan, 6.91%, Maturing September 9, 2010 | | | 2,445,115 | | |
| Gatehouse Media Operating, Inc. | | | |
| | 13,680,789 | | | Term Loan, 7.57%, Maturing June 6, 2013 | | | 13,714,991 | | |
| Hanley-Wood, LLC | | | |
| | 984,132 | | | Term Loan, 7.61%, Maturing August 1, 2012 | | | 984,748 | | |
| | 8,239,414 | | | Term Loan, 7.69%, Maturing August 1, 2012 | | | 8,244,564 | | |
| Medianews Group, Inc. | | | |
| | 12,163,805 | | | Term Loan, 6.57%, Maturing December 30, 2010 | | | 12,039,637 | | |
| | 7,655,813 | | | Term Loan, 7.07%, Maturing August 2, 2013 | | | 7,670,167 | | |
| Merrill Communications, LLC | | | |
| | 16,534,006 | | | Term Loan, 7.59%, Maturing May 15, 2011 | | | 16,596,008 | | |
| Nebraska Book Co., Inc. | | | |
| | 11,142,790 | | | Term Loan, 7.88%, Maturing March 4, 2011 | | | 11,191,539 | | |
| Newspaper Holdings, Inc. | | | |
| | 2,500,000 | | | Term Loan, 6.69%, Maturing August 24, 2011 | | | 2,493,750 | | |
| | 16,050,000 | | | Term Loan, 6.94%, Maturing August 24, 2012 | | | 15,989,813 | | |
| Philadelphia Newspapers, LLC | | | |
| | 6,334,125 | | | Term Loan, 8.12%, Maturing June 29, 2013 | | | 6,310,372 | | |
| R.H. Donnelley Corp. | | | |
| | 999,946 | | | Term Loan, 6.62%, Maturing December 31, 2009 | | | 992,715 | | |
| | 39,958,852 | | | Term Loan, 6.89%, Maturing June 30, 2011 | | | 39,845,090 | | |
| | 10,420,455 | | | Term Loan, 6.89%, Maturing June 30, 2011 | | | 10,402,104 | | |
| Retos Cartera, SA | | | |
| EUR | 1,000,000 | | | Term Loan, 5.07%, Maturing March 15, 2013 | | | 1,288,316 | | |
| EUR | 1,000,000 | | | Term Loan, 6.28%, Maturing March 15, 2014 | | | 1,292,304 | | |
| Seat Pagine Gialle Spa | | | |
| EUR | 16,090,393 | | | Term Loan, 5.88%, Maturing May 25, 2012 | | | 20,726,776 | | |
| SGS International, Inc. | | | |
| | 4,000,000 | | | Term Loan, 0.00%, Maturing December 30, 2011(2) | | | 4,022,500 | | |
| | 1,215,813 | | | Term Loan, 8.06%, Maturing December 30, 2011 | | | 1,222,651 | | |
See notes to financial statements
31
Floating Rate Portfolio as of October 31, 2006
PORTFOLIO OF INVESTMENTS CONT'D
Principal
Amount | | Borrower/Tranche Description | | Value | |
| Publishing (continued) | | | |
| Siegwerk Druckfarben AG | | | |
| EUR | 2,598,750 | | | Term Loan, 6.24%, Maturing September 8, 2013 | | $ | 3,349,049 | | |
| EUR | 2,624,814 | | | Term Loan, 6.92%, Maturing September 8, 2014 | | | 3,397,295 | | |
| Source Media, Inc. | | | |
| | 13,128,877 | | | Term Loan, 7.61%, Maturing November 8, 2011 | | | 13,202,727 | | |
| SP Newsprint Co. | | | |
| | 8,463,065 | | | Term Loan, 5.32%, Maturing January 9, 2010 | | | 8,505,380 | | |
| | 989,114 | | | Term Loan, 8.48%, Maturing January 9, 2010 | | | 994,060 | | |
| Springer Science+Business Media | | | |
| | 2,790,582 | | | Term Loan, 7.62%, Maturing May 5, 2010 | | | 2,797,558 | | |
| EUR | 1,399,585 | | | Term Loan, 5.63%, Maturing May 5, 2011 | | | 1,804,473 | | |
| | 3,097,232 | | | Term Loan, 7.99%, Maturing May 5, 2011 | | | 3,124,011 | | |
| EUR | 1,210,414 | | | Term Loan, 6.00%, Maturing May 5, 2012 | | | 1,567,788 | | |
| | 6,452,567 | | | Term Loan, 8.37%, Maturing May 5, 2012 | | | 6,542,662 | | |
| Sun Media Corp. | | | |
| | 9,047,123 | | | Term Loan, 7.13%, Maturing February 7, 2009 | | | 9,067,859 | | |
| Thomas Nelson, Inc. | | | |
| | 1,995,000 | | | Term Loan, 7.60%, Maturing June 12, 2012 | | | 2,002,481 | | |
| World Directories ACQI Corp. | | | |
| EUR | 1,500,000 | | | Term Loan, 6.01%, Maturing November 29, 2012 | | | 1,927,517 | | |
| EUR | 7,006,198 | | | Term Loan, 6.51%, Maturing November 29, 2013 | | | 9,041,361 | | |
| Xsys US, Inc. | | | |
| EUR | 2,750,000 | | | Term Loan, 6.06%, Maturing September 27, 2013 | | | 3,532,998 | | |
| | 7,701,575 | | | Term Loan, 7.87%, Maturing September 27, 2013 | | | 7,752,120 | | |
| EUR | 2,750,000 | | | Term Loan, 6.56%, Maturing September 27, 2014 | | | 3,550,548 | | |
| | 7,866,565 | | | Term Loan, 8.37%, Maturing September 27, 2014 | | | 7,957,526 | | |
| YBR Acquisition BV | | | |
| EUR | 1,250,000 | | | Term Loan, 5.74%, Maturing June 30, 2013 | | | 1,618,771 | | |
| EUR | 6,000,000 | | | Term Loan, 5.78%, Maturing June 30, 2013 | | | 7,770,100 | | |
| EUR | 7,250,000 | | | Term Loan, 6.24%, Maturing June 30, 2014 | | | 9,425,422 | | |
| Yell Group, PLC | | | |
| | 21,025,000 | | | Term Loan, 7.32%, Maturing October 27, 2012 | | | 21,150,498 | | |
| | | | | | | $ | 366,955,658 | | |
| Radio and Television — 4.4% | | | |
| Adams Outdoor Advertising, L.P. | | | |
| $ | 16,972,119 | | | Term Loan, 7.13%, Maturing November 18, 2012 | | $ | 17,019,861 | | |
| ALM Media Holdings, Inc. | | | |
| | 7,869,028 | | | Term Loan, 7.87%, Maturing March 4, 2010 | | | 7,876,409 | | |
| Block Communications, Inc. | | | |
| | 7,051,737 | | | Term Loan, 7.37%, Maturing December 22, 2011 | | | 7,073,774 | | |
| Cequel Communications, LLC | | | |
| | 37,850,000 | | | Term Loan, 7.62%, Maturing November 5, 2013 | | | 37,826,344 | | |
Principal
Amount | | Borrower/Tranche Description | | Value | |
| Radio and Television (continued) | | | |
| CMP Susquehanna Corp. | | | |
| $ | 2,000,000 | | | Term Loan, 0.00%, Maturing May 5, 2011(2) | | $ | 1,900,000 | | |
| | 13,620,087 | | | Term Loan, 7.40%, Maturing May 5, 2013 | | | 13,658,400 | | |
| Cumulus Media, Inc. | | | |
| | 11,371,500 | | | Term Loan, 7.45%, Maturing June 7, 2013 | | | 11,439,024 | | |
| DirecTV Holdings, LLC | | | |
| | 15,558,231 | | | Term Loan, 6.82%, Maturing April 13, 2013 | | | 15,581,210 | | |
| Emmis Operating Co. | | | |
| | 7,800,000 | | | Term Loan, 9.00%, Maturing November 10, 2011 | | | 7,818,104 | | |
| Entravision Communications Corp. | | | |
| | 8,963,500 | | | Term Loan, 6.87%, Maturing September 29, 2013 | | | 8,970,034 | | |
| Gray Television, Inc. | | | |
| | 8,064,062 | | | Term Loan, 6.88%, Maturing November 22, 2012 | | | 8,060,465 | | |
| HEI Acquisition, LLC | | | |
| | 5,425,000 | | | Term Loan, 8.38%, Maturing December 31, 2011 | | | 5,425,000 | | |
| HIT Entertainment, Inc. | | | |
| | 841,500 | | | Term Loan, 7.62%, Maturing March 20, 2012 | | | 844,656 | | |
| Intelsat Subsuduary Holding Co. | | | |
| | 7,825,000 | | | Term Loan, 7.62%, Maturing July 3, 2013 | | | 7,884,908 | | |
| NEP Supershooters, L.P. | | | |
| | 2,888,645 | | | Term Loan, 8.87%, Maturing February 3, 2011 | | | 2,919,336 | | |
| | 4,897,947 | | | Term Loan, 9.42%, Maturing February 3, 2011 | | | 4,957,643 | | |
| Nexstar Broadcasting, Inc. | | | |
| | 24,647,800 | | | Term Loan, 7.12%, Maturing October 1, 2012 | | | 24,593,896 | | |
| NextMedia Operating, Inc. | | | |
| | 2,871,000 | | | Term Loan, 7.32%, Maturing November 14, 2012 | | | 2,867,770 | | |
| P7S1 Holding II S.A.R.L. | | | |
| EUR | 24,000,000 | | | Term Loan, 7.26%, Maturing July 18, 2011 | | | 30,766,417 | | |
| PanAmSat Corp. | | | |
| | 19,675,000 | | | Term Loan, 7.87%, Maturing January 3, 2014 | | | 19,862,188 | | |
| Patriot Media and Communications CNJ, Inc. | | | |
| | 488,095 | | | Term Loan, 7.65%, Maturing March 31, 2013 | | | 491,527 | | |
| Paxson Communications Corp. | | | |
| | 17,925,000 | | | Term Loan, 8.62%, Maturing January 15, 2012 | | | 18,249,891 | | |
| Raycom TV Broadcasting, LLC | | | |
| | 20,241,115 | | | Term Loan, 6.88%, Maturing August 28, 2013 | | | 20,127,259 | | |
| SFX Entertainment | | | |
| | 9,974,625 | | | Term Loan, 7.62%, Maturing June 21, 2013 | | | 9,980,859 | | |
| Spanish Broadcasting System | | | |
| | 12,287,875 | | | Term Loan, 7.12%, Maturing June 10, 2012 | | | 12,300,679 | | |
| TDF SA | | | |
| EUR | 4,151,899 | | | Term Loan, 5.54%, Maturing March 11, 2013 | | | 5,324,267 | | |
| EUR | 4,151,899 | | | Term Loan, 6.42%, Maturing March 11, 2014 | | | 5,339,322 | | |
| EUR | 4,661,720 | | | Term Loan, 7.17%, Maturing March 11, 2015 | | | 5,999,925 | | |
See notes to financial statements
32
Floating Rate Portfolio as of October 31, 2006
PORTFOLIO OF INVESTMENTS CONT'D
Principal
Amount | | Borrower/Tranche Description | | Value | |
| Radio and Television (continued) | | | |
| Young Broadcasting, Inc. | | | |
| $ | 9,472,688 | | | Term Loan, 8.00%, Maturing November 3, 2012 | | $ | 9,465,289 | | |
| | | | | | | $ | 324,624,457 | | |
| Rail Industries — 0.5% | | | |
| Kansas City Southern Railway Co. | | | |
| $ | 15,162,000 | | | Term Loan, 7.11%, Maturing April 26, 2013 | | $ | 15,193,582 | | |
| Railamerica, Inc. | | | |
| | 19,967,084 | | | Term Loan, 7.44%, Maturing September 29, 2011 | | | 20,073,169 | | |
| | | | | | | $ | 35,266,751 | | |
| Retailers (Except Food and Drug) — 2.5% | | | |
| Advantage Sales & Marketing, Inc. | | | |
| $ | 5,273,500 | | | Term Loan, 7.43%, Maturing March 29, 2013 | | $ | 5,259,219 | | |
| American Achievement Corp. | | | |
| | 6,235,482 | | | Term Loan, 7.68%, Maturing March 25, 2011 | | | 6,282,249 | | |
| Amscan Holdings, Inc. | | | |
| | 10,248,500 | | | Term Loan, 8.32%, Maturing December 23, 2012 | | | 10,331,769 | | |
| Coinmach Laundry Corp. | | | |
| | 24,999,115 | | | Term Loan, 7.91%, Maturing December 19, 2012 | | | 25,227,232 | | |
| FTD, Inc. | | | |
| | 5,037,375 | | | Term Loan, 7.35%, Maturing July 28, 2013 | | | 5,059,414 | | |
| Harbor Freight Tools USA, Inc. | | | |
| | 14,416,229 | | | Term Loan, 7.22%, Maturing July 15, 2010 | | | 14,421,636 | | |
| Home Interiors & Gifts, Inc. | | | |
| | 3,608,011 | | | Term Loan, 10.39%, Maturing March 31, 2011 | | | 2,651,888 | | |
| Josten's Corp. | | | |
| | 4,000,000 | | | Revolving Loan, 7.10%, Maturing October 4, 2009(2) | | | 3,960,000 | | |
| | 24,875,233 | | | Term Loan, 7.37%, Maturing October 4, 2011 | | | 25,025,529 | | |
| Mapco Express, Inc. | | | |
| | 3,606,958 | | | Term Loan, 8.07%, Maturing April 28, 2011 | | | 3,640,773 | | |
| | | Mauser Werke GMBH & Co. KG | |
| | 8,325,000 | | | Term Loan, 8.10%, Maturing December 3, 2011 | | | 8,377,031 | | |
| Movie Gallery, Inc. | | | |
| | 3,089,658 | | | Term Loan, 10.62%, Maturing April 27, 2011 | | | 2,898,272 | | |
| Neiman Marcus Group, Inc. | | | |
| | 4,408,228 | | | Term Loan, 7.64%, Maturing April 6, 2013 | | | 4,448,180 | | |
| Oriental Trading Co., Inc. | | | |
| | 2,000,000 | | | Term Loan, 11.47%, Maturing January 31, 2014 | | | 2,008,334 | | |
| | 12,967,500 | | | Term Loan, 8.18%, Maturing July 31, 2013 | | | 12,997,222 | | |
| Pep Boys - Manny, Moe, & Jack, (The) | | | |
| | 4,179,000 | | | Term Loan, 8.07%, Maturing January 27, 2011 | | | 4,231,238 | | |
| Petro Stopping Center, L.P. | | | |
| | 531,250 | | | Term Loan, 7.88%, Maturing February 9, 2007 | | | 533,906 | | |
Principal
Amount | | Borrower/Tranche Description | | Value | |
| Retailers (Except Food and Drug) (continued) | | | |
| Rent-A-Center, Inc. | | | |
| $ | 6,583,500 | | | Term Loan, 6.85%, Maturing July 30, 2012 | | $ | 6,583,500 | | |
| Savers, Inc. | | | |
| | 6,200,000 | | | Term Loan, 8.16%, Maturing August 11, 2012 | | | 6,242,625 | | |
| Shopko Stores, Inc. | | | |
| | 11,802,000 | | | Revolving Loan, 7.00%,
Maturing December 28, 2010(2) | | | 11,765,119 | | |
| Stewert Enterprises, Inc. | | | |
| | 3,115,849 | | | Term Loan, 7.23%, Maturing November 19, 2011 | | | 3,117,796 | | |
| Travelcenters of America, Inc. | | | |
| | 23,045,900 | | | Term Loan, 7.11%, Maturing December 1, 2011 | | | 23,078,302 | | |
| | | | | | | $ | 188,141,234 | | |
| Steel — 0.0% | | | |
| Gibraltar Industries, Inc. | | | |
| $ | 3,367,590 | | | Term Loan, 7.13%, Maturing December 8, 2010 | | $ | 3,365,485 | | |
| | | | | | | $ | 3,365,485 | | |
| Surface Transport — 0.5% | | | |
| Horizon Lines, LLC | | | |
| $ | 5,767,250 | | | Term Loan, 7.62%, Maturing July 7, 2011 | | $ | 5,794,287 | | |
| Laidlaw International, Inc. | | | |
| | 2,587,266 | | | Term Loan, 7.12%, Maturing July 31, 2013 | | | 2,610,442 | | |
| | 7,761,797 | | | Term Loan, 7.12%, Maturing July 31, 2013 | | | 7,831,327 | | |
| Ozburn-Hessey Holding Co., LLC | | | |
| | 3,988,210 | | | Term Loan, 8.78%, Maturing August 9, 2012 | | | 3,993,195 | | |
| Sirva Worldwide, Inc. | | | |
| | 6,983,153 | | | Term Loan, 11.61%, Maturing December 1, 2010 | | | 6,457,238 | | |
| Vanguard Car Rental USA | | | |
| | 11,781,000 | | | Term Loan, 8.35%, Maturing June 14, 2013 | | | 11,881,139 | | |
| | | | | | | $ | 38,567,628 | | |
| Telecommunications — 3.3% | | | |
| Alaska Communications Systems Holdings, Inc. | | | |
| $ | 19,775,000 | | | Term Loan, 7.12%, Maturing February 1, 2012 | | $ | 19,789,832 | | |
| American Cellular Corp. | | | |
| | 3,500,000 | | | Term Loan, 7.63%, Maturing August 7, 2013(2) | | | 3,517,501 | | |
| Asurion Corp. | | | |
| | 10,392,988 | | | Term Loan, 8.32%, Maturing July 13, 2012 | | | 10,451,448 | | |
| BCM Luxembourg, Ltd. | | | |
| EUR | 7,000,000 | | | Term Loan, 5.93%, Maturing September 30, 2014 | | | 8,932,717 | | |
| EUR | 7,000,000 | | | Term Loan, 6.31%, Maturing September 30, 2015 | | | 8,996,384 | | |
| Cellular South, Inc. | | | |
| | 6,905,180 | | | Term Loan, 7.14%, Maturing May 4, 2011 | | | 6,911,657 | | |
See notes to financial statements
33
Floating Rate Portfolio as of October 31, 2006
PORTFOLIO OF INVESTMENTS CONT'D
Principal
Amount | | Borrower/Tranche Description | | Value | |
| Telecommunications (continued) | | | |
| Centennial Cellular Operating Co., LLC | | | |
| $ | 4,500,000 | | | Revolving Loan, 0.00%,
Maturing February 9, 2010(2) | | $ | 4,387,500 | | |
| | 16,147,788 | | | Term Loan, 7.62%, Maturing February 9, 2011 | | | 16,289,081 | | |
| Cincinnati Bell, Inc. | | | |
| | 4,380,750 | | | Term Loan, 6.93%, Maturing August 31, 2012 | | | 4,380,067 | | |
| Consolidated Communications, Inc. | | | |
| | 21,847,842 | | | Term Loan, 7.38%, Maturing July 27, 2015 | | | 21,916,117 | | |
| | | Crown Castle Operating Co. | |
| | 8,977,500 | | | Term Loan, 7.65%, Maturing June 1, 2014 | | | 9,022,388 | | |
| Epicor Software Corp. | | | |
| | 2,487,500 | | | Term Loan, 7.83%, Maturing March 30, 2012 | | | 2,498,383 | | |
| Fairpoint Communications, Inc. | | | |
| | 21,785,000 | | | Term Loan, 7.13%, Maturing February 8, 2012 | | | 21,776,482 | | |
| Hawaiian Telcom Communications, Inc. | | | |
| | 1,450,000 | | | Term Loan, 7.62%, Maturing October 31, 2011 | | | 1,448,188 | | |
| | 5,152,000 | | | Term Loan, 7.62%, Maturing October 31, 2012 | | | 5,168,100 | | |
| Iowa Telecommunications Services | | | |
| | 9,998,000 | | | Term Loan, 7.12%, Maturing November 23, 2011 | | | 10,020,915 | | |
| Madison River Capital, LLC | | | |
| | 3,625,143 | | | Term Loan, 7.62%, Maturing July 29, 2012 | | | 3,647,234 | | |
| NTelos, Inc. | | | |
| | 13,157,325 | | | Term Loan, 7.57%, Maturing August 24, 2011 | | | 13,216,533 | | |
| Stratos Global Corp. | | | |
| | 7,575,000 | | | Term Loan, 8.11%, Maturing February 13, 2012 | | | 7,581,310 | | |
| Syniverse Holdings, Inc. | | | |
| | 3,374,461 | | | Term Loan, 7.37%, Maturing February 15, 2012 | | | 3,382,897 | | |
| TDC AS (Nordic Telephone Company) | | | |
| EUR | 3,000,000 | | | Term Loan, 5.54%, Maturing January 30, 2014 | | | 3,866,544 | | |
| EUR | 3,000,000 | | | Term Loan, 6.04%, Maturing January 30, 2015 | | | 3,882,818 | | |
| Triton PCS, Inc. | | | |
| | 14,949,636 | | | Term Loan, 8.57%, Maturing November 18, 2009 | | | 15,092,899 | | |
| Westcom Corp. | | | |
| | 4,058,202 | | | Term Loan, 8.29%, Maturing December 17, 2010 | | | 4,065,811 | | |
| Windstream Corp. | | | |
| | 34,300,000 | | | Term Loan, 7.12%, Maturing July 17, 2013 | | | 34,520,515 | | |
| Winstar Communications, Inc. | | | |
| | 127,026 | | | DIP Loan, 10.25%, Maturing December 31, 2006(3) | | | 176,883 | | |
| | | | | | | $ | 244,940,204 | | |
| Utilities — 2.5% | | | |
| Astoria Generating Co. | | | |
| $ | 681,049 | | | Term Loan, 7.32%, Maturing February 23, 2011 | | $ | 686,423 | | |
| | 3,455,930 | | | Term Loan, 7.39%, Maturing February 23, 2013 | | | 3,483,201 | | |
Principal
Amount | | Borrower/Tranche Description | | Value | |
| Utilities (continued) | | | |
| BRSP, LLC | | | |
| $ | 15,175,000 | | | Term Loan, 8.58%, Maturing July 13, 2009 | | $ | 15,250,875 | | |
| Calpine Corp. | | | |
| | 7,350,000 | | | DIP Revolving Loan, 0.00%,
Maturing February 27, 2008(2) | | | 7,304,063 | | |
| | 2,880,969 | | | DIP Loan, 7.62%, Maturing February 27, 2008 | | | 2,900,055 | | |
| | 7,275,000 | | | DIP Loan, 9.37%, Maturing February 27, 2008 | | | 7,417,466 | | |
| Cellnet Technology, Inc. | | | |
| | 3,822,633 | | | Term Loan, 8.37%, Maturing April 26, 2012 | | | 3,856,081 | | |
| Cogentrix Delaware Holdings, Inc. | | | |
| | 8,057,380 | | | Term Loan, 6.87%, Maturing April 14, 2012 | | | 8,076,686 | | |
| Covanta Energy Corp. | | | |
| | 6,790,244 | | | Term Loan, 5.37%, Maturing June 24, 2012 | | | 6,855,315 | | |
| | 997,500 | | | Term Loan, 7.62%, Maturing June 24, 2012 | | | 997,500 | | |
| | 4,853,735 | | | Term Loan, 7.62%, Maturing May 27, 2013 | | | 4,900,248 | | |
| KGen, LLC | | | |
| | 5,646,000 | | | Term Loan, 7.99%, Maturing August 5, 2011 | | | 5,667,173 | | |
| La Paloma Generating Co., LLC | | | |
| | 616,677 | | | Term Loan, 7.07%, Maturing August 16, 2012 | | | 615,135 | | |
| | 3,820,773 | | | Term Loan, 7.12%, Maturing August 16, 2012 | | | 3,811,221 | | |
| LSP General Finance Co., LLC | | | |
| | 9,743,449 | | | Term Loan, 7.12%, Maturing May 6, 2013 | | | 9,745,475 | | |
| Mirant North America, LLC. | | | |
| | 7,741,500 | | | Term Loan, 7.07%, Maturing January 3, 2013 | | | 7,744,264 | | |
| NRG Energy, Inc. | | | |
| | 69,740,750 | | | Term Loan, 7.37%, Maturing February 1, 2013 | | | 70,183,903 | | |
| Pike Electric, Inc. | | | |
| | 3,969,263 | | | Term Loan, 6.88%, Maturing July 2, 2012 | | | 3,970,088 | | |
| | 3,018,039 | | | Term Loan, 6.88%, Maturing December 10, 2012 | | | 3,018,667 | | |
| Reliant Energy, Inc. | | | |
| | 10,000,000 | | | Revolving Loan, 0.00%, Maturing April 30, 2008(2) | | | 9,905,000 | | |
| Vulcan Energy Corp. | | | |
| | 10,926,847 | | | Term Loan, 6.90%, Maturing July 23, 2010 | | | 10,947,335 | | |
| | | | | | | $ | 187,336,174 | | |
| | | Total Senior Floating Rate Interests
(identified cost $7,301,619,958) | | $ | 7,335,035,567 | | |
See notes to financial statements
34
Floating Rate Portfolio as of October 31, 2006
PORTFOLIO OF INVESTMENTS CONT'D
| Corporate Bonds & Notes — 1.0% | | | |
Principal
Amount
(000's omitted) | | Security | | Value | |
| Cable and Satellite Television — 0.2% | | | |
| Iesy Hessen & ISH NRW, Variable Rate | | | |
| EUR | 13,500 | | | 6.429%, 4/15/13 | | $ | 17,036,879 | | |
| | | | | | | $ | 17,036,879 | | |
| Electronics / Electrical — 0.1% | | | |
| NXP BV / NXP Funding LLC, Variable Rate | | | |
| $ | 6,300 | | | 8.118%, 10/15/13(5) | | $ | 6,386,625 | | |
| | | | | | | $ | 6,386,625 | | |
| Financial Intermediaries — 0.4% | | | |
| Alzette, Variable Rate | | | |
| $ | 1,180 | | | 8.636%, 12/15/20(5) | | $ | 1,213,925 | | |
| Avalon Capital Ltd. 3, Series 1A, Class D, Variable Rate | | | |
| | 1,140 | | | 7.35%, 2/24/19(5) | | | 1,146,892 | | |
| Babson Ltd., 2005-1A, Class C1, Variable Rate | | | |
| | 1,500 | | | 7.324%, 4/15/19(5) | | | 1,524,010 | | |
| Bryant Park CDO Ltd., Series 2005-1A, Class C, Variable Rate | | | |
| | 1,500 | | | 7.424%, 1/15/19(5) | | | 1,527,758 | | |
| Carlyle High Yield Partners, Series 2004-6A, Class C, Variable Rate | | | |
| | 1,500 | | | 7.854%, 8/11/16(5) | | | 1,525,145 | | |
| Centurion CDO 8 Ltd., Series 2005-8A, Class D, Variable Rate | | | |
| | 1,000 | | | 10.89%, 3/8/17 | | | 1,055,867 | | |
Morgan Stanley Investment Management Croton, Ltd.,
Series 2005-1A, Class D, Variable Rate | | | |
| | 2,000 | | | 7.324%, 1/15/18(5) | | | 2,019,226 | | |
| Sonata Securities S.A., Series 2006-5 | | | |
| | 7,000 | | | 8.999%, 6/27/07 | | | 7,049,700 | | |
| Sonata Securities S.A., Series 2006-6 | | | |
| | 10,000 | | | 8.999%, 6/27/07 | | | 10,069,100 | | |
| | | | | | | $ | 27,131,623 | | |
| Radio and Television — 0.0% | | | |
| Paxson Communications Corp., Variable Rate | | | |
| $ | 3,000 | | | 8.624%, 1/15/12(5) | | $ | 3,048,750 | | |
| | | | | | | $ | 3,048,750 | | |
| Real Estate — 0.1% | | | |
| Assemblies of God, Variable Rate | | | |
| $ | 9,916 | | | 7.555%, 6/15/29(5) | | $ | 9,916,478 | | |
| | | | | | | $ | 9,916,478 | | |
Principal
Amount
(000's omitted) | | Security | | Value | |
| Telecommunications — 0.2% | | | |
| Qwest Corp., Sr. Notes, Variable Rate | | | |
| $ | 5,850 | | | 8.64%, 6/15/13(5) | | $ | 6,332,625 | | |
| Rogers Wireless, Inc., Variable Rate | | | |
| | 6,589 | | | 8.515%, 12/15/10 | | | 6,745,489 | | |
| | | | | | | $ | 13,078,114 | | |
| | | Total Corporate Bonds & Notes
(identified cost $74,967,174) | | $ | 76,598,469 | | |
| Common Stocks — 0.1% | | | |
| Shares | | Security | | Value | |
| | 105,145 | | | Hayes Lemmerz International(6) | | $ | 225,010 | | |
| | 86,020 | | | Maxim Crane Works, L.P.(6) | | | 4,053,673 | | |
| | | Total Common Stocks
(identified cost $2,549,911) | | $ | 4,278,683 | | |
| Preferred Stocks — 0.0% | | | |
| Shares | | Security | | Value | |
| | 350 | | | Hayes Lemmerz International(4)(6)(7) | | $ | 3,236 | | |
| | | Total Preferred Stocks
(identified cost $17,500) | | $ | 3,236 | | |
| Closed-End Investment Companies — 0.0% | | | |
| Shares | | Security | | Value | |
| | 4,000 | | | Pioneer Floating Rate Trust | | $ | 76,080 | | |
| | | Total Closed-End Investment Companies
(identified cost $72,148) | | $ | 76,080 | | |
| Short-Term Investments — 2.8% | | | |
Principal
Amount | | Maturity
Date | | Borrower | | Rate | | Amount | |
| $ | 67,587,000 | | | 11/01/06 | | Abbey National North
America LLC,
Commercial Paper | | | 5.31 | % | | $ | 67,587,000 | | |
| | 142,465,000 | | | 11/01/06 | | HSBC Finance Corp.,
Commercial Paper | | | 5.31 | % | | | 142,465,000 | | |
| | | Total Short-Term Investments
(at amortized cost $210,052,000) | | $ | 210,052,000 | | |
See notes to financial statements
35
Floating Rate Portfolio as of October 31, 2006
PORTFOLIO OF INVESTMENTS CONT'D
| | | Amount | |
Total Investments — 102.6%
(identified cost $7,589,278,691) | | $ | 7,626,044,035 | | |
Less Unfunded Loan
Commitments — (3.7)% | | $ | (277,946,866 | ) | |
Net Investments — 98.9%
(identified cost $7,311,331,825) | | $ | 7,348,097,169 | | |
| Other Assets, Less Liabilities — 1.1% | | $ | 82,395,970 | | |
| Net Assets — 100.0% | | $ | 7,430,493,139 | | |
CHF - Swiss Franc
EUR - Euro
GBP - British Pound
(1) Senior floating-rate interests often require prepayments from excess cash flows or permit the borrower to repay at its election. The degree to which borrowers repay, whether as a contractual requirement or at their election, cannot be predicted with accuracy. As a result, the actual remaining maturity may be substantially less than the stated maturities shown. However, it is anticipated that the senior floating-rate interests will have an expected average life of approximately two to three years. The stated interest rate represents the weighted average interest rate of all contracts within the senior loan facility. Senior Loans typically have rates of interest which are redetermined either daily, monthly, quarterly or semi-annually by reference to a base lending rate, plus a premium. These base lending rates are primarily the London - -Interbank Offered Rate ("LIBOR"), and secondarily the prime rate offered by one or more major United States banks (the "Prime Rate") and the certificate of deposit ("CD") rate or other base lending rates used by commercial lenders.
(2) Unfunded loan commitments. See Note 1E for description.
(3) Defaulted security. Currently the issuer is in default with respect to interest payments.
(4) Security valued at fair value using methods determined in good faith by or at the direction of the Trustees.
(5) Security exempt from registration under Rule 144A of the Securities Act of 1933. These securities may be sold in transactions exempt from registration, normally to qualified institutional buyers. At October 31, 2006, the aggregate value of the securities is $34,641,434 or 0.5% of the Portfolio's net assets.
(6) Non-income producing security.
(7) Restricted security.
See notes to financial statements
36
Floating Rate Portfolio as of October 31, 2006
FINANCIAL STATEMENTS
Statement of Assets and Liabilities
As of October 31, 2006
| Assets | |
| Investments, at value (identified cost, $7,311,331,825) | | $ | 7,348,097,169 | | |
| Cash | | | 28,339,272 | | |
| Foregn currency, at value (identified cost, $17,947) | | | 17,576 | | |
| Receivable for investments sold | | | 5,105,400 | | |
| Interest and dividends receivable | | | 54,414,214 | | |
| Receivable for open swap contracts | | | 1,494,324 | | |
| Prepaid expenses | | | 676,600 | | |
| Total assets | | $ | 7,438,144,555 | | |
| Liabilities | |
| Payable for open forward foreign currency contracts | | $ | 4,084,652 | | |
| Payable to affiliate for investment advisory fees | | | 3,197,568 | | |
| Payable to affiliate for Trustees' fees | | | 2,533 | | |
| Accrued expenses | | | 366,663 | | |
| Total liabilities | | $ | 7,651,416 | | |
| Net Assets applicable to investors' interest in Portfolio | | $ | 7,430,493,139 | | |
| Sources of Net Assets | |
| Net proceeds from capital contributions and withdrawals | | $ | 7,396,708,123 | | |
| Net unrealized appreciation (computed on the basis of identified cost) | | | 33,785,016 | | |
| Total | | $ | 7,430,493,139 | | |
Statement of Operations
For the Year Ended
October 31, 2006
| Investment Income | |
| Interest | | $ | 490,026,227 | | |
| Dividends | | | 6,574 | | |
| Total investment income | | $ | 490,032,801 | | |
| Expenses | |
| Investment adviser fee | | $ | 35,804,388 | | |
| Trustees' fees and expenses | | | 30,804 | | |
| Custodian fee | | | 975,491 | | |
| Legal and accounting services | | | 816,329 | | |
| Miscellaneous | | | 725,288 | | |
| Total expenses | | $ | 38,352,300 | | |
Deduct —
Reduction of custodian fee | | $ | 130,282 | | |
| Total expense reductions | | $ | 130,282 | | |
| Net expenses | | $ | 38,222,018 | | |
| Net investment income | | $ | 451,810,783 | | |
| Realized and Unrealized Gain (Loss) | |
Net realized gain (loss) —
Investment transactions (identified cost basis) | | $ | (2,465,912 | ) | |
| Swap contracts | | | 1,411,162 | | |
Foreign currency and forward foreign currency exchange
contract transactions | | | (21,129,036 | ) | |
| Net realized loss | | $ | (22,183,786 | ) | |
Change in unrealized appreciation (depreciation) —
Investments (identified cost basis) | | $ | 7,061,625 | | |
| Swap contracts | | | 1,255,356 | | |
| Foreign currency and forward foreign currency exchange contracts | | | (8,347,803 | ) | |
| Net change in unrealized appreciation (depreciation) | | $ | (30,822 | ) | |
| Net realized and unrealized loss | | $ | (22,214,608 | ) | |
| Net increase in net assets from operations | | $ | 429,596,175 | | |
See notes to financial statements
37
Floating Rate Portfolio as of October 31, 2006
FINANCIAL STATEMENTS CONT'D
Statements of Changes in Net Assets
Increase (Decrease)
in Net Assets | | Year Ended
October 31, 2006 | | Year Ended
October 31, 2005 | |
From operations —
Net investment income | | $ | 451,810,783 | | | $ | 286,479,439 | | |
Net realized loss from investment
transactions, swap contracts,
foreign currency, and forward
foreign currency exchange
contract transactions | | | (22,183,786 | ) | | | (6,260,828 | ) | |
Net change in unrealized appreciation
(depreciation) from investments,
swap contracts, foreign currency,
and forward foreign currency
exchange contracts | | | (30,822 | ) | | | 5,235,160 | | |
| Net increase in net assets from operations | | $ | 429,596,175 | | | $ | 285,453,771 | | |
Capital transactions —
Contributions | | $ | 2,989,478,752 | | | $ | 2,972,303,225 | | |
| Withdrawals | | | (2,494,639,771 | ) | | | (2,141,337,314 | ) | |
Net increase in net assets from
capital transactions | | $ | 494,838,981 | | | $ | 830,965,911 | | |
| Net increase in net assets | | $ | 924,435,156 | | | $ | 1,116,419,682 | | |
| Net Assets | |
| At beginning of year | | $ | 6,506,057,983 | | | $ | 5,389,638,301 | | |
| At end of year | | $ | 7,430,493,139 | | | $ | 6,506,057,983 | | |
See notes to financial statements
38
Floating Rate Portfolio as of October 31, 2006
FINANCIAL STATEMENTS CONT'D
Supplementary Data
| | | Year Ended October 31, | |
| | | 2006 | | 2005 | | 2004 | | 2003 | | 2002 | |
| Ratios/Supplemental Data | |
| Ratios (As a percentage of average daily net assets): | |
| Expenses before custodian fee reduction | | | 0.54 | % | | | 0.54 | % | | | 0.56 | % | | | 0.61 | % | | | 0.62 | % | |
| Expenses after custodian fee reduction | | | 0.54 | % | | | 0.54 | % | | | 0.56 | % | | | 0.61 | % | | | 0.62 | % | |
| Net investment income | | | 6.44 | % | | | 4.68 | % | | | 3.27 | % | | | 4.05 | % | | | 4.72 | % | |
| Portfolio Turnover | | | 50 | % | | | 57 | % | | | 67 | % | | | 64 | % | | | 76 | % | |
| Total Return | | | 6.36 | % | | | 4.77 | % | | | 3.93 | % | | | 6.91 | % | | | 2.19 | % | |
| Net assets, end of year (000's omitted) | | $ | 7,430,493 | | | $ | 6,506,058 | | | $ | 5,389,638 | | | $ | 2,217,874 | | | $ | 1,326,128 | | |
See notes to financial statements
39
Floating Rate Portfolio as of October 31, 2006
NOTES TO FINANCIAL STATEMENTS
1 Significant Accounting Policies
Floating Rate Portfolio (the Portfolio) is registered under the Investment Company Act of 1940 as an open-end management investment company. The Portfolio was organized as a trust under the laws of the State of New York on June 19, 2000. The Portfolio's investment objective is to provide a high level of current income. The Portfolio normally primarily invests in interests of senior floating rate loans. The Declaration of Trust permits the Trustees to issue interests in the Portfolio. At October 31, 2006, the Eaton Vance Floating-Rate Fund, Eaton Vance Floating-Rate & High Income Fund, Eaton Vance Medallion Floating-Rate Income Fund, Eaton Vance Strategic Income Fund, Eaton Vance Diversified Income Fund, Eaton Vance Medallion Strategic Income Fund and Eaton Vance Low Duration Fund held an approximate 66.9%, 22.3%, 3.8%, 3.7%, 1.4%, 0.5% and 0.1% interest in the Portfolio, respectively. The following is a summary of significan t accounting policies of the Portfolio. The policies are in conformity with accounting principles generally accepted in the United States of America.
A Investment Valuation — The Portfolio's investments are primarily in interests in senior floating rate loans (Senior Loans). Certain Senior Loans are deemed to be liquid because reliable market quotations are readily available for them. Liquid Senior Loans are valued on the basis of prices furnished by a pricing service. Other Senior Loans are valued at fair value by the investment adviser under procedures approved by the Trustees. In connection with determining the fair value of a Senior Loan, the investment adviser makes an assessment of the likelihood that the borrower will make a full repayment of the Senior Loan. The primary factors considered by the investment adviser when making this assessment are (i) the creditworthiness of the borrower, (ii) the value of the co llateral backing the Senior Loan, and (iii) the priority of the Senior Loan versus other creditors of the borrower. If, based on its assessment, the investment adviser believes there is a reasonable likelihood that the borrower will make a full repayment of the Senior Loan, the investment adviser will determine the fair value of the Senior Loan using a matrix pricing approach that considers the yield on the Senior Loan relative to yields on other loan interests issued by companies of comparable credit quality. If, based on its assessment, the investment adviser believes there is not a reasonable likelihood that the borrower will make a full repayment of the Senior Loan, the investment adviser will determine the fair value of the Senior Loan using analyses that include but are not limited to (i) a comparison of the value of the borrower's outstanding equity and debt to that of comparable public companies; (ii) a discounted cash flow analysis; or (iii) when the investment adviser believes it is likely that a borrower will be liquidated or sold, an analysis of the terms of such liquidation or sale. In certain cases, the investment adviser will use a combination of analytical methods to determine fair value, such as when only a portion of a borrower's assets are likely to be sold. In conducting its assessment and analyses for purposes of determining fair value of a Senior Loan, the investment adviser will use its discretion and judgment in considering and appraising such factors, data and information and the relative weight to be given thereto as it deems relevant, including without limitation, some or all of the following: (i) the fundamental characteristics of and fundamental analytical data relating to the Senior Loan, including the cost, size, current interest rate, maturity and base lending rate of the Senior Loan, the terms and conditions of the Senior Loan and any related agreements, and the position of the Senior Loan in the borrower's debt structure; (ii) the nature, adequacy and value of the collateral securing the Senior Loan, including the Portfolio's rights, remedies and interests with respect to the collateral; (iii) the creditworthiness of the borrower, based on an evaluation of, among other things, its financial condition, financial statements and information about the borrower's business, cash flows, capital structure and future prospects; (iv) information relating to the market for the Senior Loan including price quotations for and trading in the Senior Loan, interests in similar Senior Loans and the market environment, investor attitudes towards the Senior Loan and interests in similar Senior Loans; (v) the experience, reputation, stability and financial condition of the Agent and any intermediate participants in the Senior Loan; and (vi) general economic and market conditions affecting the fair value of the Senior Loan. Fair value determinations are made by the portfolio managers of a Trust based on information available to suc h managers. The portfolio managers of other trusts managed by Eaton Vance that invest in Senior Loans may not possess the same information about a Senior Loan borrower as the portfolio managers of Floating Rate Portfolio. At times, the fair value of a Senior Loan determined by the portfolio managers of other trusts managed by Eaton Vance that invest in Senior Loans may vary from the fair value of the same Senior Loan determined by the portfolio managers of Floating Rate Portfolio. The fair value of each Senior Loan is periodically reviewed and approved by the investment adviser's Valuation Committee and by the Trustees based upon procedures approved by the Trustees. Junior Loans are valued in the same manner as Senior Loans.
Other portfolio securities (other than short-term obligations, but including listed issues) may be valued on the basis of prices furnished by one or more pricing services which determine prices for normal, institutional-size trading units
40
Floating Rate Portfolio as of October 31, 2006
NOTES TO FINANCIAL STATEMENTS CONT'D
of such securities which may use market information, transactions for comparable securities and various relationships between securities which are generally recognized by institutional traders. The value of interest rate swaps will be based on dealer quotations. Short-term obligations which mature in sixty days or less are valued at amortized cost, which approximates value. If short-term debt securities are acquired with a remaining maturity of more than 60 days, they will be valued by a pricing service. Over-the-counter options are valued at the mean between the bid and the asked price provided by dealers. Marketable securities listed on the NASDAQ National Market System are valued at the NASDAQ official closing price. Financial futures contracts listed on the commodity exchanges and options thereon are valued at closing settlement prices. Repurchase agreements are valued at cost plus accrued interest. Other portfolio securitie s for which there are no quotations or valuations and investments for which the price of the security is not believed to represent its fair market value, are valued at fair value using methods determined in good faith by or at the direction of the Trustees of the Trust. Occasionally, events affecting the value of foreign securities may occur between the time trading is completed abroad and the close of the Exchange which will not be reflected in the computation of the Trust's net asset value (unless the Trust deems that such event would materially affect its net asset value in which case an adjustment would be made and reflected in such computation). The Trust may rely on an independent fair valuation service in making any such adjustment as to the value of a foreign equity security.
B Foreign Currency Translation — Investment valuations, other assets, and liabilities initially expressed in foreign currencies are converted each business day into U.S. dollars based upon current exchange rates. Purchases and sales of foreign investment securities and income and expenses are converted into U.S. dollars based upon currency exchange rates prevailing on the respective dates of such transactions. Recognized gains or losses on investment transactions attributable to changes in foreign currency exchange rates are recorded for financial statement purposes as net realized gains and losses on investments. That portion of unrealized gains and losses on investments that results from fluctuations in foreign currency exchange rates is not separately disclosed.
C Income — Interest income is recorded on the basis of interest accrued, adjusted for amortization of premium or accretion of discount. Fees associated with loan amendments are recognized immediately. Dividend income is recorded on the ex-dividend date for dividends received in cash and/or securities.
D Federal Taxes — The Portfolio has elected to be treated as a partnership for federal tax purposes. No provision is made by the Portfolio for federal or state taxes on any taxable income of the Portfolio because each investor in the Portfolio is ultimately responsible for the payment of any taxes on its share of taxable income. Since at least one of the Portfolio's investors is a regulated investment company that invests all or substantially all of its assets in the Portfolio, the Portfolio normally must satisfy the applicable source of income and diversification requirements (under the Internal Revenue Code) in order for its investors to satisfy them. The Portfolio will allocate, at least annually among its investors, each investor's distributive share of the Portfolio' s net investment income, net realized capital gains, and any other items of income, gain, loss, deduction or credit.
E Unfunded Loan Commitments — The Portfolio may enter into certain credit agreements all or a portion of which may be unfunded. The Portfolio is obligated to fund these commitments at the borrower's discretion. These commitments are disclosed in the accompanying Portfolio of Investments.
F Forward Foreign Currency Exchange Contracts — The Portfolio may enter into forward foreign currency exchange contracts for the purchase or sale of a specific foreign currency at a fixed price on a future date. Risks may arise upon entering these contracts from the potential inability of counterparties to meet the terms of their contracts and from movements in the value of a foreign currency relative to the U.S. dollar. The Portfolio will enter into forward contracts for hedging purposes as well as non-hedging purposes. The forward foreign currency exchange contracts are adjusted by the daily exchange rate of the underlying currency and any gains or losses are recorded for financial statement purposes as unrealized until such time as the contracts have been closed.
G Interest Rate Swaps — The Portfolio may enter into interest rate swap agreements for risk management purposes and not as a speculative investment. Pursuant to these agreements the Portfolio receives quarterly payments at a rate equal to a predetermined three-month London Interbank Offering Rate (LIBOR). In exchange, the Portfolio makes semi-annual payments at a predetermined fixed rate of interest. During the term of the outstanding swap agreement, changes in the underlying value of the swap are recorded as unrealized gains and losses. The value of the swap is determined by changes in the relationship between two rates of interest. The Portfolio is exposed to
41
Floating Rate Portfolio as of October 31, 2006
NOTES TO FINANCIAL STATEMENTS CONT'D
credit loss in the event of non-performance by the swap counterparty. The Portfolio does not anticipate non-performance by the counterparty. Risk may also arise from the unanticipated movements in value of interest rates.
H Credit Default Swaps — The Portfolio may enter into credit default swap contracts for risk management purposes, including diversification. When the Portfolio is the buyer of a credit default swap contract, the Portfolio is entitled to receive the par (or other agreed-upon) value of a referenced debt obligation from the counterparty to the contract in the event of a default by a third party, such as a U.S or foreign corporate issuer, on the debt obligation. In return, the Portfolio would pay the counterparty a periodic stream of payments over the term of the contract provided that no event of default has occurred. If no default occurs, the Portfolio would have made a stream of payments and received no benefit from the contract reducing exposure to the credit by the notio nal amount of the contract upon default of the referenced debt obligation. As the seller, the Portfolio would effectively add leverage to its portfolio because, in addition to its total net assets, the Portfolio would be subject to investment exposure on the notional amount of the swap. The Portfolio will segregate assets in the form of cash and cash equivalents in an amount equal to the aggregate market value of the credit default swaps of which it is the seller, marked to market on a daily basis. These transactions involve certain risks, including the risk that the seller may be unable to fulfill the transaction.
I Expense Reduction — Investors Bank & Trust Company (IBT) serves as custodian of the Portfolio. Pursuant to the custodian agreement, IBT receives a fee reduced by credits which are determined based on the average daily cash balance the Portfolio maintains with IBT. All credit balances used to reduce the Portfolio's custodian fees are reported as a reduction of expenses in the Statement of Operations.
J Use of Estimates — The preparation of the financial statements in conformity with accounting principles generally accepted in the United States of America requires management to make estimates and assumptions that affect the reported amounts of assets and liabilities at the date of the financial statements and the reported amounts of income and expense during the reporting period. Actual results could differ from those estimates.
K Indemnifications — Under the Portfolio's organizational documents, its officers and Trustees may be indemnified against certain liabilities and expenses arising out of the performance of their duties to the Portfolio. Interestholders in the Portfolio are jointly and severally liable for the liabilities and obligations of the Portfolio in the event that the Portfolio fails to satisfy such liabilities and obligations; provided, however, that, to the extent assets are available in the Portfolio, the Portfolio may, under certain circumstances, indemnify interestholders from and against any claim or liability to which such holder may become subject by reason of being or having been an interestholder in t he Portfolio. Additionally, in the normal course of business, the Portfolio enters into agreements with service providers that may contain indemnification clauses. The Portfolio's maximum exposure under these arrangements is unknown as this would involve future claims that may be made against the Portfolio that have not yet occurred.
L Other — Investment transactions are accounted for on the date the securities are purchased or sold. Realized gains and losses on securities sold are determined on the basis of identified cost.
2 Investment Adviser Fee and Other Transactions with Affiliates
The investment adviser fee is earned by BMR, as compensation for management and investment advisory services rendered to the Portfolio. The fee is equivalent to 0.575% of the Portfolio's average daily net assets up to $1 billion and at reduced rates as daily net assets exceed that level. Due to an agreement effective as of March 27, 2006, if the Portfolio's average daily net assets exceed $5 billion but are less than $10 billion the fee is equivalent to 0.480% and if average daily net assets exceed $10 billion the fee is equivalent to 0.460%. For the year ended October 31, 2006, the fee was equivalent to 0.510% of the Portfolio's average net assets for such period and amounted to $35,804,388.
Except as to Trustees of the Portfolio who are not members of EVM's or BMR's organization, officers and Trustees receive remuneration for their services to the Portfolio out of such investment adviser fee. Trustees of the Portfolio that are not affiliated with the Investment Adviser may elect to defer receipt of all or a portion of their annual fees in accordance with the terms of the Trustees Deferred Compensation Plan. For the year ended October 31, 2006, no significant amounts have been deferred. Certain officers and Trustees of the Portfolio are officers of the above organizations.
3 Investments
The Portfolio invests primarily in Senior Loans. The ability of the issuers of the Senior Loans to meet their obligations
42
Floating Rate Portfolio as of October 31, 2006
NOTES TO FINANCIAL STATEMENTS CONT'D
may be affected by economic developments in a specific industry. The cost of purchases and the proceeds from principal repayments and sales of Senior Loans for the year ended October 31, 2006 aggregated $4,461,606,319, $2,838,240,323 and $584,362,726, respectively.
4 Line of Credit
The Portfolio participates with other portfolios managed by BMR in a $550 million unsecured line of credit agreement with a group of banks to permit the Portfolio to invest in accordance with its investment practices. Interest is charged under the credit agreement at the bank's base rate or at an amount above LIBOR. In addition, a fee computed at the annual rate of 0.08% of the daily unused portion of the line of credit is allocated among the participating portfolios at the end of each quarter. As of October 31, 2006, the Portfolio had no borrowings outstanding. The Portfolio did not have any significant borrowings or allocated fees during the year ended October 31, 2006.
5 Federal Income Tax Unrealized Appreciation (Depreciation)
The cost and unrealized appreciation/depreciation in the value of the investments owned at October 31, 2006, as determined on a federal income tax basis, were as follows:
| Aggregate Cost | | $ | 7,311,337,977 | | |
| Gross unrealized appreciation | | $ | 60,613,798 | | |
| Gross unrealized depreciation | | | (23,854,606 | ) | |
| Net unrealized appreciation | | $ | 36,759,192 | | |
The net unrealized depreciation on foreign currency, forward foreign currency exchange contracts and swap contracts at October 31, 2006 on a federal income tax basis was $2,980,338.
6 Financial Instruments
The Portfolio may trade in financial instruments with off-balance sheet risk in the normal course of its investing activities and to assist in managing exposure to various market risks. These financial instruments include written options, financial futures contracts, forward foreign currency contracts, credit default swaps, and interest rate swaps and may involve, to a varying degree, elements of risk in excess of the amounts recognized for financial statement purposes. The notional or contractual amounts of these instruments represent the investment the Portfolio has in particular classes of financial instruments and does not necessarily represent the amounts potentially subject to risk. The measurement of the risks associated with these instruments is meaningful only when all related and offsetting transactions are considered. A summary of obligations unde r these financial instruments at October 31, 2006 was as follows:
Forward Foreign Currency Exchange Contracts
| Sales | |
| Settlement Date | | Deliver | | In exchange for | | Net Unrealized
Depreciation | |
11/30/06
| | Swiss Franc
12,494,538 | | United States Dollar
10,019,677 | | $(53,365) | |
11/30/06
| | Euro
1,000,000 | | United States Dollar
1,262,500 | | (15,775) | |
11/30/06
| | Euro
471,533,063 | | United States Dollar
599,893,793 | | (2,855,133) | |
11/30/06
| | British Pound
1,500,000 | | United States Dollar
2,816,430 | | (45,127) | |
11/30/06
| | British Pound
98,987,264 | | United States Dollar
187,729,347 | | (1,109,152) | |
| | | | | | | $ | (4,078,552 | ) | |
| Purchases | |
| Settlement Date | | In exchange for | | Deliver | | Net Unrealized
Depreciation | |
| 11/30/06 | | Euro
2,000,000 | | United States Dollar
2,559,600 | | $(3,050) | |
| 11/30/06 | | Euro
2,000,000 | | United States Dollar
2,559,600 | | (3,050) | |
| | | | | | | $ | (6,100 | ) | |
Credit Default Swaps
Notional
Amount | | Expiration
Date | | Description | | Net Unrealized
Appreciation | |
| | 10,000,000 USD
| | | 12/20/2009
| | Agreement with Lehman
Brothers dated 10/28/2004
whereby the Portfolio will
receive 2.35% per year times
the notional amount. The
Portfolio makes a payment of
the notional amount only upon
a default event on the reference
entity, a Revolving Credit
Agreement issued by Crown
Americas, Inc. | | | $257,166
| | |
| | 5,000,000 USD
| | | 3/20/2010
| | Agreement with Lehman
Brothers dated 12/21/2004
whereby the Portfolio will receive
2.70% per year times the
notional amount. The Portfolio
makes a payment of the
notional amount only upon a
default event on the reference
entity, a Revolving Credit
Agreement issued by Six Fl ags
Theme Parks. | | | 85,606
| | |
43
Floating Rate Portfolio as of October 31, 2006
NOTES TO FINANCIAL STATEMENTS CONT'D
Notional
Amount | | Expiration
Date | | Description | | Net Unrealized
Appreciation | |
3,000,000 USD
| | 3/20/2011
| | Agreement with Lehman
Brothers dated 3/3/2005
whereby the Portfolio will receive
1.85% per year times the
notional amount. The Portfolio
makes a payment of the
notional amount only upon a
default event on the reference
entity, a Revolving Credit
Agreement issued by Synivers e
Technologies, Inc. | | $4,369
| |
6,500,000 USD
| | 3/20/2010
| | Agreement with Lehman
Brothers dated 3/16/2005
whereby the Portfolio will receive
2.2% per year times the
notional amount. The Portfolio
makes a payment of the
notional amount only upon a
default event on the reference
entity, a Revolving Credit
Agreement issued by Inergy, L.P. | | 274,538
| |
3,000,000 USD
| | 6/20/2010
| | Agreement with Lehman
Brothers dated 4/1/2005
whereby the Portfolio will receive
2% per year times the notional
amount. The Portfolio makes a
payment of the notional amount
only upon a default event on
the reference entity, a Revolving
Credit Agreement issued by
Pinnacle En tertainment, Inc. | | 41,084
| |
3,000,000 USD
| | 3/20/2010
| | Agreement with Lehman
Brothers dated 5/19/2005
whereby the Portfolio will
receive 2.4% per year times the
notional amount. The Portfolio
makes a payment of the
notional amount only upon a
default event on the reference
entity, a Revolving Credit
Agreement issued by Inergy, L.P. | | 144,854
| |
3,000,000 USD
| | 6/20/2010
| | Agreement with Lehman
Brothers dated 5/19/2005
whereby the Portfolio will
receive 3.25% per year times
the notional amount. The
Portfolio makes a payment of
the notional amount only upon
a default event on the reference
entity, a Revolving Credit
Agreement issued by Rural
Cellular Corp. | | 44,541
| |
Notional
Amount | | Expiration
Date | | Description | | Net Unrealized
Appreciation | |
3,000,000 USD
| | 6/20/2011
| | Agreement with Lehman
Brothers dated 6/2/2005
whereby the Portfolio will
receive 2.3% per year times
the notional amount. The
Portfolio makes a payment of
the notional amount only upon
a default event on the reference
entity, a Revolving Credit
Agreement issued by Syniverse
Technologies, Inc. | | $48,080
| |
7,000,000 USD
| | 9/21/2009
| | Agreement with Lehman
Brothers dated 7/9/2005
whereby the Portfolio will
receive 2.15% per year times
the notional amount. The
Portfolio makes a payment of
the notional amount only upon
a default event on the reference
entity, a Revolving Credit
Agreement issued by CSG
Systems, Inc. | | 118,018
| |
2,000,000 USD
| | 9/20/2010
| | Agreement with Lehman
Brothers dated 7/9/2005
whereby the Portfolio will
receive 1.95% per year times
the notional amount. The
Portfolio makes a payment of
the notional amount only upon
a default event on the reference
entity, a Revolving Credit
Agreement issued by Pinnacle
Entertainment, Inc. | | 23,602
| |
5,000,000 USD
| | 12/20/2010
| | Agreement with Lehman
Brothers dated 10/26/2005
whereby the Portfolio will
receive 2.15% per year times
the notional amount. The
Portfolio makes a payment of
the notional amount only upon
a default event on the
reference entity, a Revolving
Credit Agreement issued by
EPCO Holdings, Inc. | | 126,030
| |
5,000,000 USD
| | 12/20/2010
| | Agreement with Lehman
Brothers dated 12/3/2005
whereby the Portfolio will
receive 2.10% per year times
the notional amount. The
Portfolio makes a payment of
the notional amount only upon
a default event on the reference
entity, a Revolving Credit
Agreement issued by Avago Technologies, Inc. | | 120,738
| |
44
Floating Rate Portfolio as of October 31, 2006
NOTES TO FINANCIAL STATEMENTS CONT'D
Notional
Amount | | Expiration
Date | | Description | | Net Unrealized
Appreciation | |
| | 5,000,000 USD
| | | 3/20/2011
| | Agreement with Lehman
Brothers dated 1/6/2006
whereby the Portfolio will
receive 1.80% per year times
the notional amount. The
Portfolio makes a payment of
the notional amount only upon
a default event on the reference
entity, a Revolving Credit
Agreement issued by The
Hertz Corp. | | | $98,884
| | |
| | 5,000,000 USD
| | | 9/20/2011
| | Agreement with Lehman
Brothers dated 7/1/2006
whereby the Portfolio will
receive 1.95% per year times
the notional amount. The
Portfolio makes a payment of
the notional amount only upon
a default event on the reference
entity, a Revolving Credit
Agreement issued by
Owens-Illinois, Inc. | | | 106,814
| | |
At October 31, 2006, the Portfolio had sufficient cash and/or securities to cover commitments under these contracts.
8 Restricted Securities
At October 31, 2006, the Portfolio owned the following securities (representing less than 0.1% of net assets) which were restricted as to public resale and not registered under the Securities Act of 1933 (excluding Rule 144A securities). The Portfolio has various registration rights (exercisable under a variety of circumstances) with respect to these securities. The fair value of these securities is determined based on valuations provided by brokers when available, or if not available, they are valued at fair value using methods determined in good faith by or at the direction of the Trustees.
Restricted Securities
| Description | | Date of
Acquisition | | Shares/Face | | Cost | | Fair Value | |
| Preferred Stocks | |
Hayes Lemmerz
International | | 6/23/03 | | | 350 | | | $ | 17,500 | | | $ | 3,236 | | |
| | | $ | 17,500 | | | $ | 3,236 | | |
9 Recently Issued Accounting Pronouncements
In June 2006, the Financial Accounting Standards Board ("FASB") issued FASB Interpretation No. 48, ("FIN 48") "Accounting for Uncertainty in Income Taxes – an interpretation of FASB Statement No. 109". FIN 48 clarifies the accounting for uncertainty in income taxes recognized in accordance with FASB Statement No. 109, "Accounting for Income Taxes." This interpretation prescribes a recognition threshold and measurement attribute for the financial statement recognition and measurement of a tax position taken or expected to be taken in a tax return. It also provides guidance on de-recognition, classification, interest and penalties, accounting in interim periods, disclosure and transition. FIN 48 is effective for fiscal years beginning after December 15, 2006. Management is currently evaluating the impact of applying the various provisions of FIN 48.
In September 2006, the Financial Accounting Standards Board ("FASB") issued Statement of Financial Accounting Standards No. 157, ("FAS 157") "Fair Value Measurements". FAS 157 defines fair value, establishes a framework for measuring fair value in accordance with generally accepted accounting principles and expands disclosure about fair value measurements. FAS 157 is effective for fiscal years beginning after November 15, 2007. Management is currently evaluating the impact the adoption of FAS 157 will have on the Fund's financial statement disclosures.
45
Floating Rate Portfolio as of October 31, 2006
REPORT OF INDEPENDENT REGISTERED PUBLIC ACCOUNTING FIRM
To the Trustees and Investors
of Floating Rate Portfolio:
We have audited the accompanying statement of assets and liabilities of Floating Rate Portfolio (the Portfolio), including the portfolio of investments, as of October 31, 2006, and the related statement of operations for the year then ended, the statements of changes in net assets for each of the two years in the period then ended, and the supplementary data for each of the five years in the period then ended. These financial statements and supplementary data are the responsibility of the Portfolio's management. Our responsibility is to express an opinion on these financial statements and supplementary data based on our audits.
We conducted our audits in accordance with standards of the Public Company Accounting Oversight Board (United States). Those standards require that we plan and perform the audit to obtain reasonable assurance about whether the financial statements and supplementary data are free of material misstatement. The Portfolio is not required to have, nor were we engaged to perform, an audit of its internal control over financial reporting. Our audits included consideration of internal control over financial reporting as a basis for designing audit procedures that are appropriate in the circumstances, but not for the purpose of expressing an opinion on the effectiveness of the Portfolio's internal control over financial reporting. Accordingly, we express no such opinion. An audit also includes examining, on a test basis, evidence supporting the amounts and disclosures in the financial statements, assessing the accounting principles used and significant estimates made by management, as well as evaluating the overall financial statement presentation. Our procedures included confirmation of securities and senior loans owned as of October 31, 2006 by correspondence with the custodian and selling or agent banks; where replies were not received from selling or agent banks, we performed other auditing procedures. We believe that our audits provide a reasonable basis for our opinion.
In our opinion, the financial statements and supplementary data referred to above present fairly, in all material respects, the financial position of Floating-Rate Portfolio as of October 31, 2006, the results of its operations for the year then ended, the changes in its net assets for each of the two years in the period then ended, and the supplementary data for each of the five years in the period then ended, in conformity with accounting principles generally accepted in the United States of America.
DELOITTE & TOUCHE LLP
Boston, Massachusetts
December 15, 2006
46
Eaton Vance Floating-Rate & High Income Fund
BOARD OF TRUSTEES' ANNUAL APPROVAL OF THE INVESTMENT ADVISORY AGREEMENT
Overview of the Contract Review Process
The Investment Company Act of 1940, as amended (the "1940 Act"), provides, in substance, that each investment advisory agreement between a fund and its investment adviser will continue in effect from year to year only if its continuance is approved at least annually by the fund's board of trustees, including by a vote of a majority of the trustees who are not "interested persons" of the fund ("Independent Trustees") cast in person at a meeting called for the purpose of considering such approval.
At a meeting of the Boards of Trustees (each a "Board") of the Eaton Vance group of mutual funds (the "Eaton Vance Funds") held on March 27, 2006, the Board, including a majority of the Independent Trustees, voted to approve continuation of existing advisory and sub-advisory agreements for the Eaton Vance Funds for an additional one-year period. In voting its approval, the Board relied upon the affirmative recommendation of the Special Committee of the Board, which is a committee comprised exclusively of Independent Trustees. Prior to making its recommendation, the Special Committee reviewed information furnished for a series of meetings of the Special Committee held in February and March 2006. Such information included, among other things, the following:
Information about Fees, Performance and Expenses
• An independent report comparing the advisory and related fees paid by each fund with fees paid by comparable funds;
• An independent report comparing each fund's total expense ratio and its components to comparable funds;
• An independent report comparing the investment performance of each fund to the investment performance of comparable funds over various time periods;
• Data regarding investment performance in comparison to relevant peer groups of funds and appropriate indices;
• Comparative information concerning fees charged by each adviser for managing other mutual funds and institutional accounts using investment strategies and techniques similar to those used in managing the fund;
• Profitability analyses for each adviser with respect to each fund managed by it;
Information about Portfolio Management
• Descriptions of the investment management services provided to each fund, including the investment strategies and processes employed;
• Information concerning the allocation of brokerage and the benefits received by each adviser as a result of brokerage allocation, including information concerning the acquisition of research through "soft dollar" benefits received in connection with the funds' brokerage, and the implementation of a soft dollar reimbursement program established with respect to the funds;
• Data relating to portfolio turnover rates of each fund;
• The procedures and processes used to determine the fair value of fund assets and actions taken to monitor and test the effectiveness of such procedures and processes;
Information about each Adviser
• Reports detailing the financial results and condition of each adviser;
• Descriptions of the qualifications, education and experience of the individual investment professionals whose responsibilities include portfolio management and investment research for the funds, and information relating to their compensation and responsibilities with respect to managing other mutual funds and investment accounts;
• Copies of the Codes of Ethics of each adviser and its affiliates, together with information relating to compliance with and the administration of such codes;
• Information concerning the resources devoted to compliance efforts undertaken by each adviser and its affiliates on behalf of the funds (including descriptions of various compliance programs) and their record of compliance with investment policies and restrictions, including policies with respect to market-timing, late trading and selective portfolio disclosure, and with policies on personal securities transactions;
• Descriptions of the business continuity and disaster recovery plans of each adviser and its affiliates;
Other Relevant Information
• Information concerning the nature, cost and character of the administrative and other non-investment management services provided by Eaton Vance Management and its affiliates;
• Information concerning management of the relationship with the custodian, subcustodians and fund accountants by each adviser or the funds' administrator; and
• The terms of each advisory agreement.
In addition to the information identified above, the Special Committee considered information provided from time to time by each adviser throughout the year at meetings of the Board and its committees. Over the course of the twelve month period ended March 31,
47
Eaton Vance Floating-Rate & High Income Fund
BOARD OF TRUSTEES' ANNUAL APPROVAL OF THE INVESTMENT ADVISORY AGREEMENT CONT'D
2006, the Board met nine times and the Special Committee, the Audit Committee and the Governance Committee, each of which is a Committee comprised solely of Independent Trustees, met eight, twelve and five times, respectively. At such meetings, the Trustees received, among other things, presentations by the portfolio managers and other investment professionals of each adviser relating to the investment performance of each fund and the investment strategies used in pursuing the fund's investment objective.
For funds that invest through one or more underlying portfolios, the Board considered similar information about the portfolio(s) when considering the approval of advisory agreements. In addition, in cases where the fund's investment adviser has engaged a sub-adviser, the Board considered similar information about the sub-adviser when considering the approval of any sub-advisory agreement.
The Special Committee was assisted throughout the contract review process by Goodwin Procter LLP, legal counsel for the Independent Trustees. The members of the Special Committee relied upon the advice of such counsel and their own business judgment in determining the material factors to be considered in evaluating each advisory and sub-advisory agreement and the weight to be given to each such factor. The conclusions reached with respect to each advisory and sub-advisory agreement were based on a comprehensive evaluation of all the information provided and not any single factor. Moreover, each member of the Special Committee may have placed varying emphasis on particular factors in reaching conclusions with respect to each advisory and sub-advisory agreement.
Results of the Process
Based on its consideration of the foregoing, and such other information as it deemed relevant, including the factors and conclusions described below, the Special Committee concluded that the continuance of the investment advisory agreements of the Floating Rate Portfolio and the High Income Portfolio, the portfolios in which the Eaton Vance Floating-Rate & High Income Fund (the "Fund") invests (the "Portfolios"), each with Boston Management and Research (the "Adviser"), including their fee structures, is in the interests of shareholders and, therefore, the Special Committee recommended to the Board approval of each agreement. The Board accepted the recommendation of the Special Committee as well as the factors considered and conclusions reached by the Special Committee with respect to each agreement. Accordingly, the Board, including a majority of the Independent Trustees, voted to approve continuation of the investment advi sory agreements for the Portfolios.
Nature, Extent and Quality of Services
In considering whether to approve the investment advisory agreements of the Portfolios, the Board evaluated the nature, extent and quality of services provided to the Portfolios by the Adviser.
The Board considered the Adviser's management capabilities and investment process with respect to the types of investments held by the Portfolios, including the education, experience and number of its investment professionals and other personnel who provide portfolio management, investment research, and similar services to the Portfolios. In particular, the Board evaluated the abilities and experience of such investment personnel in analyzing special considerations relevant to investing in senior secured floating rate loans. For both Portfolios, the Board noted the experience of the Adviser's 29 bank loan investment professionals and other personnel who provide services to the Portfolios, including four portfolio managers and 15 analysts. The Board also took into account the resources dedicated to portfolio management and other services, including the compensation paid to recruit and retain investment personnel, and the time and attention devoted to the Fund by senior management.
The Board reviewed the compliance programs of the Adviser and relevant affiliates thereof. Among other matters, the Board considered compliance and reporting matters relating to personal trading by investment personnel, selective disclosure of portfolio holdings, late trading, frequent trading, portfolio valuation, business continuity and the allocation of investment opportunities. The Board also evaluated the responses of the Adviser and its affiliates to requests from regulatory authorities such as the Securities and Exchange Commission and the National Association of Securities Dealers.
The Board considered shareholder and other administrative services provided or managed by Eaton Vance Management and its affiliates, including transfer agency and accounting services. The Board evaluated the benefits to shareholders of investing in a fund that is a part of a large family of funds, including the ability, in many cases, to exchange an investment among different funds without incurring additional sales charges.
After consideration of the foregoing factors, among others, the Board concluded that the nature, extent and quality of services provided by the Adviser, taken as a whole, are appropriate and consistent with the terms of the investment advisory agreements.
Fund Performance
The Board compared the Fund's investment performance to a relevant universe of similarly managed funds identified by an independent data provider and appropriate benchmark indices. The Board also considered the performance of the underlying Portfolios.
48
Eaton Vance Floating-Rate & High Income Fund
BOARD OF TRUSTEES' ANNUAL APPROVAL OF THE INVESTMENT ADVISORY AGREEMENT CONT'D
The Board reviewed comparative performance data for the one-, three- and five-year periods ended September 30, 2005 for the Fund. The Board noted that the Fund's performance relative to its peers is affected by management's focus on preserving capital. The Board concluded that the Fund's performance is satisfactory.
Management Fees and Expenses
The Board reviewed contractual investment advisory fee rates, including administrative fee rates, payable by the Portfolios and the Fund (referred to collectively as "management fees"). As part of its review, the Board considered the management fees (including administrative fees) and the Fund's total expense ratio for the one-year period ended September 30, 2005, as compared to a group of similarly managed funds selected by an independent data provider.
After reviewing the foregoing information, and in light of the nature, extent and quality of the services provided by the Adviser, the Board concluded that the management fees charged for advisory and related services and the Fund's total expense ratio are reasonable.
Profitability
The Board reviewed the level of profits realized by the Adviser and relevant affiliates thereof in providing investment advisory and administrative services to the Fund, the Portfolios and to all Eaton Vance Funds as a group. The Board considered the level of profits realized without regard to revenue sharing or other payments by the Adviser and its affiliates to third parties in respect of distribution services. The Board also considered other direct or indirect benefits received by the Adviser and its affiliates in connection with its relationship with the Fund and the Portfolios.
The Board concluded that, in light of the foregoing factors and the nature, extent and quality of the services rendered, the profits realized by the Adviser and its affiliates are reasonable.
Economies of Scale
In reviewing management fees and profitability, the Board also considered the extent to which the Adviser and its affiliates, on the one hand, and the Fund, on the other hand, can expect to realize benefits from economies of scale as the assets of the Fund and the Portfolios increase. The Board acknowledged the difficulty in accurately measuring the benefits resulting from the economies of scale with respect to the management of any specific fund or group of funds. The Board reviewed data summarizing the increases and decreases in the assets of the Fund and of all Eaton Vance Funds as a group over various time periods, and evaluated the extent to which the total expense ratio of the Fund and the profitability of the Adviser and its affiliates may have been affected by such increases or decreases. The Board noted that, at its request, the Adviser had agreed to add a breakpoint for the Floating Rate Portfolio with respect to asset s that exceed $10 billion. Based upon the foregoing, the Board concluded that the benefits from economies of scale are currently being shared equitably by the Adviser and its affiliates and the Fund. The Board also concluded that, assuming reasonably foreseeable increases in the assets of the Portfolios, the structure of the advisory fees, which include breakpoints at several asset levels, can be expected to cause the Adviser and its affiliates and the Fund to continue to share such benefits equitably.
49
Eaton Vance Floating-Rate & High Income Fund
MANAGEMENT AND ORGANIZATION
Fund Management. The Trustees of Eaton Vance Mutual Funds Trust (the Trust), Floating Rate Portfolio (FRP) and High Income Portfolio (HIP) (the Portfolios) are responsible for the overall management and supervision of the Trust's and Portfolios' affairs. The Trustees and officers of the Trust and the Portfolios are listed below. Except as indicated, each individual has held the office shown or other offices in the same company for the last five years. Trustees and officers of the Trust and the Portfolios hold indefinite terms of office. The "noninterested Trustees" consist of those Trustees who are not "interested persons" of the Trust and the Portfolios, as that term is defined under the 1940 Act. The business address of each Trustee and officer is The Eaton Vance Building, 255 State Street, Boston, Massachusetts 02109. As used below, "EVC" refers to Eaton Vance Corp., "EV" refers to Eaton Vance, Inc., "EVM" refers to Eaton Vance Management, "BMR" refers to Boston Management and Research, "Parametric" refers to Parametric Portfolio Associates and "EVD" refers to Eaton Vance Distributors, Inc. EVC and EV are the corporate parent and trustee, respectively, of EVM and BMR. EVD is the Fund's principal underwriter, the Portfolios' placement agent and a wholly-owned subsidiary of EVM. Each officer affiliated with Eaton Vance may hold a position with other Eaton Vance affiliates that is comparable to his or her position with EVM listed below.
Name and
Date of Birth | | Position(s)
with the
Trust and
the Portfolios | | Term of
Office and
Length of
Service | | Principal Occupation(s)
During Past Five Years | | Number of Portfolios
in Fund Complex
Overseen By
Trustee (1) | | Other Directorships Held | |
| Interested Trustee | | | | | | | | | | | | | |
|
James B. Hawkes
11/9/41 | | Trustee | | Trustee of the Trust since 1991; of FRP since 2000 and of HIP since 1992 | | Chairman and Chief Executive Officer of EVC, BMR, EVM and EV; Director of EV; Vice President and Director of EVD. Trustee and/or officer of 170 registered investment companies in the Eaton Vance Fund Complex. Mr. Hawkes is an interested person because of his positions with BMR, EVM, EVC and EV, which are affiliates of the Trust and the Portfolios. | | | 170 | | | Director of EVC | |
|
| Noninterested Trustee(s) | | | | | | | | | | | | | |
|
Benjamin C. Esty
1/2/63 | | Trustee | | Since 2005 | | Roy and Elizabeth Simmons Professor of Business Administration, Harvard University Graduate School of Business Administration (since 2003). Formerly, Associate Professor, Harvard University Graduate School of Business Administration (2000-2003). | | | 170 | | | None | |
|
Samuel L. Hayes, III
2/23/35 | | Trustee and Chairman of the Board | | Trustee of the Trust since 1986; of FRP since 2000; of HIP since 1993 and Chairman of the Board since 2005 | | Jacob H. Schiff Professor of Investment Banking Emeritus, Harvard University Graduate School of Business Administration. Director of Yakima Products, Inc. (manufacturer of automotive accessories) (since 2001) and Director of Telect, Inc. (telecommunications services company). | | | 170 | | | Director of Tiffany & Co. (specialty retailer) | |
|
William H. Park
9/19/47 | | Trustee | | Since 2003 | | Vice Chairman, Commercial Industrial Finance Corp. (specialty finance company) (since 2006). Formerly, President and Chief Executive Officer, Prizm Capital Management, LLC (investment management firm) (2002-2005). Formerly, Executive Vice President and Chief Financial Officer, United Asset Management Corporation (a holding company owning institutional investment management firms) (1982-2001). | | | 170 | | | None | |
|
Ronald A. Pearlman
7/10/40 | | Trustee | | Since 2003 | | Professor of Law, Georgetown University Law Center. | | | 170 | | | None | |
|
50
Eaton Vance Floating-Rate & High Income Fund
MANAGEMENT AND ORGANIZATION CONT'D
Name and
Date of Birth | | Position(s)
with the
Trust and
the Portfolios | | Term of
Office and
Length of
Service | | Principal Occupation(s)
During Past Five Years | | Number of Portfolios
in Fund Complex
Overseen By
Trustee (1) | | Other Directorships Held | |
| Noninterested Trustee(s) (continued) | | | | | | | | | | | | | |
|
Norton H. Reamer
9/21/35 | | Trustee | | Trustee of the Trust since 1986; of FRP since 2000 and of HIP since 1993 | | President, Chief Executive Officer and a Director of Asset Management Finance Corp. (a specialty finance company serving the investment management industry) (since October 2003). President, Unicorn Corporation (an investment and financial advisory services company) (since September 2000). Formerly, Chairman and Chief Operating Officer, Hellman, Jordan Management Co., Inc. (an investment management company) (2000-2003). Formerly, Advisory Director of Berkshire Capital Corporation (investment banking firm) (2002-2003). | | | 170 | | | None | |
|
Lynn A. Stout
9/14/57 | | Trustee | | Trustee of the Trust and HIP since 1998; of FRP since 2000 | | Professor of Law, University of California at Los Angeles School of Law. | | | 170 | | | None | |
|
Ralph F. Verni
1/26/43 | | Trustee | | Since 2005 | | Consultant and private investor. | | | 170 | | | None | |
|
| Principal Officers who are not Trustees | | | | | | | | | | | | | |
|
Name and
Date of Birth | | Position(s)
with the
Trust and
the Portfolio | | Term of
Office and
Length of
Service | | Principal Occupation(s)
During Past Five Years | |
Thomas E. Faust Jr.
5/31/58 | | President of the Trust | | Since 2002 | | President of EVC, EVM, BMR and EV and Director of EVC. Chief Investment Officer of EVC, EVM and BMR. Officer of 71 registered investment companies and 5 private investment companies managed by EVM or BMR. | |
|
William H. Ahern, Jr.
7/28/59 | | Vice President
of the Trust | | Since 1995 | | Vice President of EVM and BMR. Officer of 71 registered investment companies managed by EVM or BMR. | |
|
Cynthia J. Clemson
3/2/63 | | Vice President
of the Trust | | Since 2005 | | Vice President of EVM and BMR. Officer of 86 registered investment companies managed by EVM or BMR. | |
|
Kevin S. Dyer
2/21/75 | | Vice President
of the Trust | | Since 2005 | | Assistant Vice President of EVM and BMR. Officer of 25 registered investment companies managed by EVM or BMR. | |
|
Thomas P. Huggins
3/7/66 | | Vice President of HIP | | Since 2000 | | Vice President of EVM and BMR. Officer of 4 registered investment companies managed by EVM or BMR. | |
|
Aamer Khan
6/7/60 | | Vice President
of the Trust | | Since 2005 | | Vice President of EVM and BMR. Officer of 29 registered investment companies managed by EVM or BMR. | |
|
Thomas H. Luster
4/8/62 | | Vice President
of the Trust | | Since 2006 | | Vice President of EVM and BMR. Officer of 45 registered investment companies managed by EVM or BMR. | |
|
Michael R. Mach
7/14/47 | | Vice President
of the Trust | | Since 1999 | | Vice President of EVM and BMR. Officer of 51 registered investment companies managed by EVM or BMR. | |
|
Robert B. MacIntosh
1/22/57 | | Vice President
of the Trust | | Since 1998 | | Vice President of EVM and BMR. Officer of 86 registered investment companies managed by EVM or BMR. | |
|
Scott H. Page
11/30/59 | | Vice President of FRP | | Since 2000 | | Vice President of EVM and BMR. Officer of 15 registered investment companies managed by EVM or BMR. | |
|
51
Eaton Vance Floating-Rate & High Income Fund
MANAGEMENT AND ORGANIZATION CONT'D
| Principal Officers who are not Trustees (continued) | |
|
Name and
Date of Birth | | Position(s)
with the
Trust and
the Portfolio | | Term of
Office and
Length of
Service | | Principal Occupation(s)
During Past Five Years | |
Cliff Quisenberry, Jr.
1/1/65 | | Vice President
of the Trust | | Since 2006 | | Vice President and Director of Research and Product Development of Parametric. Officer of 30 registered investment companies managed by EVM or BMR. | |
|
Duncan W. Richardson
10/26/57 | | Vice President
of the Trust | | Since 2001 | | Executive Vice President and Chief Equity Investment Officer of EVC, EVM and BMR. Officer of 71 registered investment companies managed by EVM or BMR. | |
|
Walter A. Row, III
7/20/57 | | Vice President
of the Trust | | Since 2001 | | Director of Equity Research and a Vice President of EVM and BMR. Officer of 33 registered investment companies managed by EVM or BMR. | |
|
Judith A. Saryan
8/21/54 | | Vice President
of the Trust | | Since 2003 | | Vice President of EVM and BMR. Officer of 50 registered investment companies managed by EVM or BMR. | |
|
Susan Schiff
3/31/61 | | Vice President
of the Trust | | Since 2002 | | Vice President of EVM and BMR. Officer of 30 registered investment companies managed by EVM or BMR. | |
|
Payson F. Swaffield
8/13/56 | | President of FRP | | Since 2002(2) | | Vice President of EVM and BMR. Officer of 15 registered investment companies managed by EVM or BMR. | |
|
Michael W. Weilheimer
2/11/61 | | President of HIP | | Since 2002(2) | | Vice President of EVM and BMR. Officer of 24 registered investment companies managed by EVM or BMR. | |
|
Barbara E. Campbell
6/19/57 | | Treasurer of the Trust since 2005 | | Since 2005(2) | | Vice President of EVM and BMR. Officer of 170 registered investment companies managed by EVM or BMR. | |
|
Alan R. Dynner
10/10/40 | | Secretary | | Secretary of the Trust and HIP since 1997; of FRP since 2000 | | Vice President, Secretary and Chief Legal Officer of BMR, EVM, EVD, EV and EVC. Officer of 170 registered investment companies managed by EVM or BMR. | |
|
Dan A. Maalouly
3/25/62 | | Treasurer of the Portfolios | | Since 2005 | | Vice President of EVM and BMR. Previously, Senior Manager at PricewaterhouseCoopers LLP (1997-2005). Officer of 71 registered investment companies managed by EVM or BMR. | |
|
Paul M. O'Neil
7/11/53 | | Chief Compliance Officer | | Since 2004 | | Vice President of EVM and BMR. Officer of 170 registered investment companies managed by EVM or BMR. | |
|
(1) Includes both master and feeder funds in a master-feeder structure.
(2) Prior to 2002, Mr. Swaffield served as Vice President of Floating Rate Portfolio since 2000 and Mr. Weilheimer served as Vice President of High Income Portfolio since 1995. Prior to 2005, Ms. Campbell served as Assistant Treasurer of the Trust since 1995.
The SAI for the Fund includes additional information about the Trustees and officers of the Fund and the Portfolios and can be obtained without charge on Eaton Vance's website at www.eatonvance.com or by calling 1-800-225-6265.
52
This Page Intentionally Left Blank
This Page Intentionally Left Blank
Investment Adviser of Floating Rate Portfolio
Boston Management and Research
The Eaton Vance Building
255 State Street
Boston, MA 02109
Administrator of Eaton Vance Floating-Rate & High Income Fund
Eaton Vance Management
The Eaton Vance Building
255 State Street
Boston, MA 02109
Principal Underwriter
Eaton Vance Distributors, Inc.
The Eaton Vance Building
255 State Street
Boston, MA 02109
(617) 482-8260
Custodian
Investors Bank & Trust Company
200 Clarendon Street
Boston, MA 02116
Transfer Agent
PFPC Inc.
Attn: Eaton Vance Funds
P.O. Box 9653
Providence, RI 02940-9653
(800) 262-1122
Independent Registered Public Accounting Firm
Deloitte & Touche LLP
200 Berkeley Street
Boston, MA 02116-5022
Eaton Vance Floating-Rate & High Income Fund
The Eaton Vance Building
255 State Street
Boston, MA 02109
This report must be preceded or accompanied by a current prospectus. Before investing, investors should consider carefully the Fund's investment objective(s), risks, and charges and expenses. The Fund's current prospectus contains this and other information about the Fund and is available through your financial advisor. Please read the prospectus carefully before you invest or send money. For further information please call 1-800-225-6265.
811-12/06 FRHSRC

Annual Report October 31, 2006


EATON VANCE
FLOATING-RATE
FUND
IMPORTANT NOTICES REGARDING PRIVACY,
DELIVERY OF SHAREHOLDER DOCUMENTS,
PORTFOLIO HOLDINGS, AND PROXY VOTING
Privacy. The Eaton Vance organization is committed to ensuring your financial privacy. Each of the financial institutions identified below has in effect the following policy ("Privacy Policy") with respect to nonpublic personal information about its customers:
• Only such information received from you, through application forms or otherwise, and information about your Eaton Vance fund transactions will be collected. This may include information such as name, address, social security number, tax status, account balances and transactions.
• None of such information about you (or former customers) will be disclosed to anyone, except as permitted by law (which includes disclosure to employees necessary to service your account). In the normal course of servicing a customer's account, Eaton Vance may share information with unaffiliated third parties that perform various required services such as transfer agents, custodians and broker/dealers.
• Policies and procedures (including physical, electronic and procedural safeguards) are in place that are designed to protect the confidentiality of such information.
• We reserve the right to change our Privacy Policy at any time upon proper notification to you. Customers may want to review our Policy periodically for changes by accessing the link on our homepage: www.eatonvance.com.
Our pledge of privacy applies to the following entities within the Eaton Vance organization: the Eaton Vance Family of Funds, Eaton Vance Management, Eaton Vance Investment Counsel, Boston Management and Research, and Eaton Vance Distributors, Inc.
In addition, our Privacy Policy only applies to those Eaton Vance customers who are individuals and who have a direct relationship with us. If a customer's account (i.e., fund shares) is held in the name of a third-party financial adviser/
broker-dealer, it is likely that only such adviser's privacy policies apply to the customer. This notice supersedes all previously issued privacy disclosures.
For more information about Eaton Vance's Privacy Policy, please call 1-800-262-1122.
Delivery of Shareholder Documents. The Securities and Exchange Commission (the "SEC") permits funds to deliver only one copy of shareholder documents, including prospectuses, proxy statements and shareholder reports, to fund investors with multiple accounts at the same residential or post office box address. This practice is often called "householding" and it helps eliminate duplicate mailings to shareholders.
Eaton Vance, or your financial adviser, may household the mailing of your documents indefinitely unless you instruct Eaton Vance, or your financial adviser, otherwise.
If you would prefer that your Eaton Vance documents not be householded, please contact Eaton Vance at
1-800-262-1122, or contact your financial adviser.
Your instructions that householding not apply to delivery of your Eaton Vance documents will be effective within 30 days of receipt by Eaton Vance or your financial adviser.
Portfolio Holdings. Each Eaton Vance Fund and its underlying Portfolio (if applicable) will file a schedule of its portfolio holdings on Form N-Q with the SEC for the first and third quarters of each fiscal year. The Form N-Q will be available on the Eaton Vance website www.eatonvance.com, by calling Eaton Vance at 1-800-262-1122 or in the EDGAR database on the SEC's website at www.sec.gov. Form N-Q may also be reviewed and copied at the SEC's public reference room in Washington, D.C. (call 1-800-732-0330 for information on the operation of the public reference room).
Proxy Voting. From time to time, funds are required to vote proxies related to the securities held by the funds. The Eaton Vance Funds or their underlying Portfolios (if applicable) vote proxies according to a set of policies and procedures approved by the Funds' and Portfolios' Boards. You may obtain a description of these policies and procedures and information on how the Funds or Portfolios voted proxies relating to portfolio securities during the most recent 12 month period ended June 30, without charge, upon request, by calling 1-800-262-1122. This description is also available on the SEC's website at www.sec.gov.
Eaton Vance Floating-Rate & High Income Fund as of October 31,2006
MANAGEMENT’S DISCUSSION OF FUND PERFORMANCE
The Fund
Performance for the Past Year
· The Fund’s Class A shares had a total return of 6.49% for the year ended October 31, 2006.(1) This return resulted from an increase in net asset value per share (NAV) to $10.30 on October 31, 2006, from $10.29 on October 31, 2005, and the reinvestment of $0.639 in dividends.
· The Fund’s Class B shares had a total return of 5.60% for the year ended October 31, 2006.(1) This return resulted from no change in NAV of $9.68 on October 31, 2006, and on October 31, 2005, and the reinvestment of $0.528 in dividends.
· The Fund’s Class C shares had a total return of 5.59% for the year ended October 31, 2006.(1) This return resulted from no change in NAV of $9.68 on October 31, 2006, and on October 31, 2005, and the reinvestment of $0.528 in dividends.
· The Fund’s Class I shares had a total return of 6.65% for the year ended October 31, 2006.(1) This return resulted from no change in NAV of $9.69 on October 31, 2006, and on October 31, 2005, and the reinvestment of $0.626 in dividends.
· The Fund’s Advisers Class shares had a total return of 6.49% for the year ended October 31, 2006.(1) This return resulted from an increase in NAV to $9.69 on October 31, 2006, from $9.68 on October 31, 2005, and the reinvestment of $0.601 in dividends.
· For comparison, the S&P/LSTA Leveraged Loan Index – an unmanaged index of U.S. dollar-denominated leveraged loans – had a total return of 6.49% for the same period.(2) The Lipper Loan Participation Funds Classification – the Fund’s peer group – had an average total return of 5.80% for the same period.(2)
· Based on the Fund’s most recent dividends and NAVs on October 31, 2006 of $10.30 per share for Class A, $9.68 for Class B, $9.68 for Class C, $9.69 for Class I and $9.69 for Advisers Class, the Fund’s distribution rates were 6.81%, 6.05%, 6.05%, 7.06% and 6.79%, respectively.(3) The SEC 30-day yields for Class A, Class B, Class C, Class I and Advisers Class shares were 6.81%, 6.21%, 6.21%, 7.22% and 6.97%, respectively.(4)
· Floating Rate Portfolio’s investments included 562 borrowers spanning 38 industries at October 31, 2006, with an average loan size of just 0.17% of total investments, and no industry constituting more than 8% of total investments. Chemicals/plastics, building and development (including manufacturers of building products and companies that manage/own apartments, shopping malls and commercial office buildings, among others), business equipment and services, health care and cable and satellite television were the largest industry weightings.
· The loan market enjoyed relatively stable fundamentals during the fiscal year. Technical factors came more into balance, as record new issuance from strong merger and acquisition activity met robust investor demand. As a result, credit spreads stabilized after a period during which they had narrowed. The Fund’s shareholders also benefited from an increase in the London Inter-Bank Offered Rate – the benchmark over which loan interest rates are typically set.
· The Floating Rate Portfolio had a 12.5% exposure in European loans at October 31, 2006. European loan issuance has grown significantly in 2006 and now represents roughly 25% of the global loan market. European loans increased the Portfolio’s investment universe, presenting further opportunities for diversification. In addition, because European spreads were slightly wider than the U.S.market, European exposure provided selected opportunities for yield enhancement. All of the Portfolio’s foreign loans were either dollar-denominated or hedged to help protect against foreign currency risk.
· The Fund’s 13% investment in High Income Portfolio boosted performance during the fiscal year. High Income Portfolio had a defensive posture that served it well, especially through the first nine months of the fiscal year, as high-yield spreads were historically narrow. The Portfolio focused on shorter duration bonds and on more senior bonds in the high-yield universe because of concerns about overleveraging among many high-yield issuers coming to market.
The views expressed in this report are those of the portfolio managers and are current only through the end of the period of the report as stated on the cover. These views are subject to change at any time based upon market or other conditions, and the investment adviser disclaims any responsibility to update such views. These views may not be relied on as investment advice and, because investment decisions for a fund are based on many factors, may not be relied on as an indication of trading intent on behalf of any Eaton Vance fund.
Past performance is no guarantee of future results. Returns are historical and are calculated by determining the percentage change in net asset value or offering price (as applicable) with all distributions reinvested. Investment return and principal value will fluctuate so that shares, when redeemed, may be worth more or less than their original cost. Performance is for the stated time period only; due to market volatility, the Fund’s current performance may be lower or higher than the quoted return. For performance as of the most recent month end, please refer to www.eatonvance.com.
(1) | | These returns do not include the 2.25% maximum sales charge for Class A shares or the applicable contingent deferred sales charges (CDSC) for Class B or Class C shares. If sales charges were deducted, the returns would be lower. |
(2) | | It is not possible to invest directly in an Index or Lipper Classification. The Index’s total return does not reflect commissions or expenses that would have been incurred if an investor individually purchased or sold the securities represented in the Index. The Lipper average is the average total return, at net asset value, of the funds that are in the same Lipper Classification as the Fund. |
(3) | | The Fund’s distribution rate represents actual distributions paid to shareholders and is calculated daily by dividing the last distribution per share (annualized) by the net asset value |
(4) | | The Fund’s SEC yield is calculated by dividing the net investment income per share for the 30-day period by the offering price at the end of the period and annualizing the result. |
Fund shares are not insured by the FDIC and are not deposits or other obligations of, or guaranteed by, any depository institution. Shares are subject to investment risks, including possible loss of principal invested.
1
Eaton Vance Floating-Rate & High Income Fund as of October 31,2006
FUND PERFORMANCE
The line graph and table set forth below provide information about the Fund’s performance. The line graph compares the performance of Class B of the Fund with that of the S&P/LSTA Leveraged Loan Index, an unmanaged loan market index. The lines on the graph represent the total returns of a hypothetical investment of $10,000 in Class B of the Fund and the S&P/LSTA Leveraged Loan Index. The table includes the total returns of each Class of the Fund at net asset value and public offering price. Theperformance presented below does not reflect the deduction of taxes, if any, that a shareholder would pay on Fund distributions or the redemption of Fund shares.
| | | | | | | | | | Advisers | |
Performance(1) | | Class A | | Class B | | Class C | | Class I | | Class | |
Average Annual Total Returns (at net asset value) | | | | | | | | | | | |
One Year | | 6.49 | % | 5.60 | % | 5.59 | % | 6.65 | % | 6.49 | % |
Five Years | | N.A. | | 4.40 | | 4.43 | | 5.47 | | 5.21 | |
Life of Fund† | | 5.70 | | 4.13 | | 4.14 | | 5.11 | | 4.87 | |
SEC Average Annual Total Returns (including sales charge or applicable CDSC) | | | | | | | | | | | |
One Year | | 4.06 | % | 0.60 | % | 4.59 | % | 6.65 | % | 6.49 | % |
Five Years | | N.A. | | 4.07 | | 4.43 | | 5.47 | | 5.21 | |
Life of Fund† | | 5.01 | | 4.13 | | 4.14 | | 5.11 | | 4.87 | |
† Inception Dates — Class A: 5/7/03; Class B: 9/5/00; Class C: 9/5/00; Class I: 9/15/00; Advisers Class: 9/7/00
(1) | | Average Annual Total Returns at net asset value do not include the 2.25% maximum sales charge for Class A shares or the applicable contingent deferred sales charges (CDSC) for Class B or Class C shares. If sales charges were deducted, returns would be lower. SEC Average Annual Total Returns for Class A reflect the maximum 2.25% sales charge. Adviser Class and Class I shares are offered to certain investors at net asset value. SEC returns for Class B reflect applicable CDSC based on the following schedule: 5% - 1st and 2nd years; 4% - 3rd year; 3% - 4th year; 2% - 5th year; 1% - 6th year. 1-year SEC returns for Class C reflect 1% CDSC. Class A, Advisers Class and Class I shares are subject to a 1% redemption fee if redeemed or exchanged within 90 days of the settlement of the purchase. |
Past performance is no guarantee of future results. Returns are historical and are calculated by determining the percentage change in net asset value or offering price (as applicable) with all distributions reinvested. Investment return and principal value will fluctuate so that shares, when redeemed, may be worth more or less than their original cost. Performance is for the stated time period only; due to market volatility, the Fund’s current performance may be lower or higher than the quoted return. For performance as of the most recent month end, please refer to www.eatonvance.com.
Diversification of Floating Rate Portfolio by Industries(2)
By total investments
Chemicals & Plastics | | 6.7 | % |
Building & Development | | 6.6 | |
Business Equip. & Services | | 5.8 | |
Health Care | | 5.6 | |
Cable & Satellite Television | | 5.0 | |
Leisure Goods/Activities/Movies | | 5.0 | |
Publishing | | 4.8 | |
Radio & Television | | 4.3 | |
Automotive | | 3.8 | |
Lodging & Casinos | | 3.6 | |
Containers & Glass Products | | 3.6 | |
Telecommunications | | 3.4 | |
Electronics/Electrical | | 3.1 | |
Financial Intermediaries | | 2.7 | |
Retailers (Except Food & Drug) | | 2.5 | |
Utilities | | 2.5 | |
Conglomerates | | 2.4 | |
Oil & Gas | | 2.4 | |
Forest Products | | 2.4 | |
Food Products | | 2.3 | % |
Food Service | | 2.0 | |
Aerospace & Defense | | 1.8 | |
Ecological Services & Equip. | | 1.7 | |
Food/Drug Retailers | | 1.7 | |
Nonferrous Metals/Minerals | | 1.6 | |
Industrial Equipment | | 1.5 | |
Equipment Leasing | | 1.3 | |
Beverage & Tobacco | | 1.3 | |
Home Furnishings | | 1.1 | |
Air Transport | | 0.9 | |
Insurance | | 0.8 | |
Surface Transport | | 0.5 | |
Clothing/Textiles | | 0.5 | |
Rail Industries | | 0.5 | |
Drugs | | 0.4 | |
Farming/Agriculture | | 0.3 | |
Cosmetics/Toiletries | | 0.3 | |
Real Estate | | 0.1 | |
(2) Reflects the Fund’s investments in Floating Rate Portfolio as of October 31, 2006. Industries are shown as a percentage of the Portfolio’s total investments. Statistics may not be representative of current or future investments and are subject to change due to active management.
Comparison of Change in Value of a $10,000 Investment in Eaten Vance Floating-Rate & High Income Class B vs. the S&P/LSTA Leveraged Loan Index.*
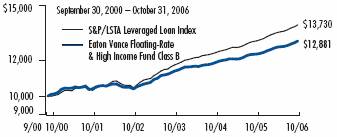
* Sources: Standard & Poor’s; Thomson Financial. Class B of the Fund commenced operations on 9/5/00.
A $10,000 hypothetical investment at net asset value in Class A on 5/7/03, Class C on 9/5/00, Class I on 9/15/00 and Advisers Class on 9/7/00 would have been valued at $12,135, $12,883, $13,470 and $13,400, respectively, on 10/31/06. A $10,000 hypothetical investment in Class A shares of the Fund at maximum offering price would have been valued at $11,862. It is not possible to invest directly in an Index. The Index’s total return does not reflect the expenses that would have been incurred if an investor individually purchased or sold the securities represented in the Index.
Fund Allocation(3)
By total investments

(3) Reflects the Fund’s investments in Floating Rate Portfolio and High Income Portfolio as of October 31, 2006. Allocations are shown as a percentage of the Portfolio’s total investments. Statistics may not be representative of current or future investments and are subject to change due to active management.
2
Eaton Vance Floating-Rate Fund as of October 31, 2006
FUND EXPENSES
Example: As a shareholder of the Fund, you incur two types of costs: (1) transaction costs, including sales charges (loads) on purchases and redemption fees (if applicable); and (2) ongoing costs, including management fees; distribution or service fees; and other Fund expenses. This Example is intended to help you understand your ongoing costs (in dollars) of investing in the Fund and to compare these costs with the ongoing costs of investing in other mutual funds. The Example is based on an investment of $1,000 invested at the beginning of the period and held for the entire period (May 1, 2006 – October 31, 2006).
Actual Expenses: The first section of the table below provides information about actual account values and actual expenses. You may use the information in this section, together with the amount you invested, to estimate the expenses that you paid over the period. Simply divide your account value by $1,000 (for example, an $8,600 account value divided by $1,000 = 8.6), then multiply the result by the number in the first section under the heading entitled "Expenses Paid During Period" to estimate the expenses you paid on your account during this period.
Hypothetical Example for Comparison Purposes: The second section of the table below provides information about hypothetical account values and hypothetical expenses based on the Fund's actual expense ratio and an assumed rate of return of 5% per year before expenses, which is not the Fund's actual return. The hypothetical account values and expenses may not be used to estimate the actual ending account balance or expenses you paid for the period. You may use this information to compare the ongoing costs of investing in the Fund and other funds. To do so, compare this 5% hypothetical example with the 5% hypothetical examples that appear in the shareholder reports of the other funds.
Please note that the expenses shown in the table are meant to highlight your ongoing costs only and do not reflect any transactional costs, such as sales charges (loads) or redemption fees (if applicable). Therefore, the second section of the table is useful in comparing ongoing costs only, and will not help you determine the relative total costs of owning different funds. In addition, if these transactional costs were included, your costs would have been higher.
Eaton Vance Floating-Rate Fund
| | | Beginning Account Value
(5/1/06) | | Ending Account Value
(10/31/06) | | Expenses Paid During Period*
(5/1/06 – 10/31/06) | |
| Actual | |
| Advisers Class | | $ | 1,000.00 | | | $ | 1,026.50 | | | $ | 5.16 | | |
| Class A | | $ | 1,000.00 | | | $ | 1,027.70 | | | $ | 5.16 | | |
| Class B | | $ | 1,000.00 | | | $ | 1,023.70 | | | $ | 8.98 | | |
| Class C | | $ | 1,000.00 | | | $ | 1,023.70 | | | $ | 8.98 | | |
| Class I | | $ | 1,000.00 | | | $ | 1,027.80 | | | $ | 3.88 | | |
| Hypothetical | |
| (5% return per year before expenses) | |
| Advisers Class | | $ | 1,000.00 | | | $ | 1,020.10 | | | $ | 5.14 | | |
| Class A | | $ | 1,000.00 | | | $ | 1,020.10 | | | $ | 5.14 | | |
| Class B | | $ | 1,000.00 | | | $ | 1,016.30 | | | $ | 8.94 | | |
| Class C | | $ | 1,000.00 | | | $ | 1,016.30 | | | $ | 8.94 | | |
| Class I | | $ | 1,000.00 | | | $ | 1,021.40 | | | $ | 3.87 | | |
* Expenses are equal to the Fund's annualized expense ratio of 1.01% for Advisers Class shares, 1.01% for Class A shares, 1.76% for Class B shares, 1.76% for Class C shares and 0.76% for Class I shares, multiplied by the average account value over the period, multiplied by 184/365 (to reflect the one-half-year period). The example assumes that the $1,000 was invested at the net asset value per share determined at the close of business on April 30, 2006. The example reflects the expenses of both the Fund and the Portfolio.
3
Eaton Vance Floating-Rate Fund as of October 31, 2006
FINANCIAL STATEMENTS
Statement of Assets and Liabilities
As of October 31, 2006
| Assets | |
Investment in Floating Rate Portfolio, at value
(identified cost, $4,950,684,029) | | $ | 4,974,343,244 | | |
| Receivable for Fund shares sold | | | 29,287,531 | | |
| Total assets | | $ | 5,003,630,775 | | |
| Liabilities | |
| Payable for Fund shares redeemed | | $ | 27,864,534 | | |
| Dividends payable | | | 8,542,165 | | |
| Payable to affiliate for distribution and service fees | | | 1,851,428 | | |
| Payable to affiliate for administration fees | | | 634,677 | | |
| Payable to affiliate for Trustees' fees | | | 282 | | |
| Accrued expenses | | | 693,302 | | |
| Total liabilities | | $ | 39,586,388 | | |
| Net Assets | | $ | 4,964,044,387 | | |
| Sources of Net Assets | | | | | |
| Paid-in capital | | $ | 4,964,958,217 | | |
Accumulated net realized loss from Portfolio (computed on
the basis of identified cost) | | | (28,661,941 | ) | |
| Accumulated undistributed net investment income | | | 4,088,896 | | |
Net unrealized appreciation from Portfolio (computed on the basis of
identified cost) | | | 23,659,215 | | |
| Total | | $ | 4,964,044,387 | | |
| Advisers Shares | | | | | |
| Net Assets | | $ | 1,238,348,972 | | |
| Shares Outstanding | | | 125,787,173 | | |
Net Asset Value, Offering Price and Redemption Price Per Share
(net assets ÷ shares of beneficial interest outstanding) | | $ | 9.84 | | |
| Class A Shares | | | | | |
| Net Assets | | $ | 1,839,718,878 | | |
| Shares Outstanding | | | 180,713,219 | | |
Net Asset Value and Redemption Price Per Share
(net assets ÷ shares of beneficial interest outstanding) | | $ | 10.18 | | |
Maximum Offering Price Per Share
(100 ÷ 97.75 of $10.18) | | $ | 10.41 | | |
| Class B Shares | | | | | |
| Net Assets | | $ | 230,454,491 | | |
| Shares Outstanding | | | 23,425,302 | | |
Net Asset Value, Offering Price and Redemption Price Per Share
(net assets ÷ shares of beneficial interest outstanding) | | $ | 9.84 | | |
| Class C Shares | | | | | |
| Net Assets | | $ | 1,170,248,321 | | |
| Shares Outstanding | | | 118,940,650 | | |
Net Asset Value, Offering Price and Redemption Price Per Share
(net assets ÷ shares of beneficial interest outstanding) | | $ | 9.84 | | |
| Class I Shares | | | | | |
| Net Assets | | $ | 485,273,725 | | |
| Shares Outstanding | | | 49,292,528 | | |
Net Asset Value, Offering Price and Redemption Price Per Share
(net assets ÷ shares of beneficial interest outstanding) | | $ | 9.84 | | |
| On sales of $100,000 or more, the offering price of Class A shares is reduced. | |
Statement of Operations
For the Year Ended
October 31, 2006
| Investment Income | |
| Interest allocated from Portfolio | | $ | 332,184,184 | | |
| Dividends allocated from Portfolio | | | 4,457 | | |
| Expenses allocated from Portfolio | | | (25,909,492 | ) | |
| Net investment income from Portfolio | | $ | 306,279,149 | | |
| Expenses | |
| Administration fee | | $ | 7,144,492 | | |
| Trustees' fees and expenses | | | 3,422 | | |
Distribution and service fees
Advisers | | | 2,927,330 | | |
| Class A | | | 4,274,646 | | |
| Class B | | | 2,484,040 | | |
| Class C | | | 11,964,048 | | |
| Transfer and dividend disbursing agent fees | | | 2,594,679 | | |
| Printing and postage | | | 347,965 | | |
| Registration fees | | | 202,629 | | |
| Legal and accounting services | | | 105,940 | | |
| Custodian fee | | | 29,852 | | |
| Miscellaneous | | | 30,179 | | |
| Total expenses | | $ | 32,109,222 | | |
| Net investment income | | $ | 274,169,927 | | |
Realized and Unrealized
Gain (Loss) from Portfolio | |
Net realized gain (loss) —
Investment transactions (identified cost basis) | | $ | (1,613,598 | ) | |
| Swap contracts | | | 957,296 | | |
Foreign currency and forward foreign currency exchange
contract transactions | | | (14,227,243 | ) | |
| Net realized loss | | $ | (14,883,545 | ) | |
Change in unrealized appreciation (depreciation) —
Investments (identified cost basis) | | $ | 4,625,592 | | |
| Swap contracts | | | 852,111 | | |
Foreign currency and forward foreign currency
exchange contracts | | | (5,636,411 | ) | |
| Net change in unrealized appreciation (depreciation) | | $ | (158,708 | ) | |
| Net realized and unrealized loss | | $ | (15,042,253 | ) | |
| Net increase in net assets from operations | | $ | 259,127,674 | | |
See notes to financial statements
4
Eaton Vance Floating-Rate Fund as of October 31, 2006
FINANCIAL STATEMENTS CONT'D
Statements of Changes in Net Assets
Increase (Decrease)
in Net Assets | | Year Ended
October 31, 2006 | | Year Ended
October 31, 2005 | |
From operations —
Net investment income | | $ | 274,169,927 | | | $ | 162,904,408 | | |
Net realized loss from investment
transactions, swap contracts, and
foreign currency and forward
foreign currency exchange
contract transactions | | | (14,883,545 | ) | | | (3,913,083 | ) | |
Net change in unrealized appreciation
(depreciation) from investments,
swap contracts, and foreign currency
and forward foreign currency
exchange contracts | | | (158,708 | ) | | | 3,380,783 | | |
| Net increase in net assets from operations | | $ | 259,127,674 | | | $ | 162,372,108 | | |
Distributions to shareholders —
From net investment income
Advisers | | $ | (70,673,479 | ) | | $ | (39,001,842 | ) | |
| Class A | | | (103,047,869 | ) | | | (57,324,898 | ) | |
| Class B | | | (13,007,797 | ) | | | (9,668,329 | ) | |
| Class C | | | (62,803,641 | ) | | | (42,958,112 | ) | |
| Class I | | | (27,488,865 | ) | | | (14,430,342 | ) | |
| Total distributions to shareholders | | $ | (277,021,651 | ) | | $ | (163,383,523 | ) | |
Transactions in shares of beneficial interest —
Proceeds from sale of shares
Advisers | | $ | 801,542,199 | | | $ | 747,625,730 | | |
| Class A | | | 1,017,522,188 | | | | 972,878,427 | | |
| Class B | | | 24,277,462 | | | | 30,913,245 | | |
| Class C | | | 327,275,996 | | | | 376,985,189 | | |
| Class I | | | 234,079,444 | | | | 194,042,649 | | |
Net asset value of shares issued to
shareholders in payment of
distributions declared
Advisers | | | 48,260,518 | | | | 26,241,048 | | |
| Class A | | | 73,890,874 | | | | 38,568,305 | | |
| Class B | | | 8,328,153 | | | | 6,058,271 | | |
| Class C | | | 39,440,391 | | | | 26,630,813 | | |
| Class I | | | 18,682,236 | | | | 11,171,692 | | |
Cost of shares redeemed
Advisers | | | (628,533,183 | ) | | | (534,004,863 | ) | |
| Class A | | | (773,541,104 | ) | | | (649,174,855 | ) | |
| Class B | | | (58,696,661 | ) | | | (66,392,552 | ) | |
| Class C | | | (412,928,596 | ) | | | (410,788,362 | ) | |
| Class I | | | (137,589,950 | ) | | | (104,184,545 | ) | |
Net asset value of shares exchanged
Class A | | | 6,988,095 | | | | 4,410,804 | | |
| Class B | | | (6,988,095 | ) | | | (4,410,804 | ) | |
| Redemption Fees | | | 129,528 | | | | 224,908 | | |
Net increase in net assets from
Fund share transactions | | $ | 582,139,495 | | | $ | 666,795,100 | | |
| Net increase in net assets | | $ | 564,245,518 | | | $ | 665,783,685 | | |
Net Assets | | Year Ended
October 31, 2006 | | Year Ended
October 31, 2005 | |
| At beginning of year | | $ | 4,399,798,869 | | | $ | 3,734,015,184 | | |
| At end of year | | $ | 4,964,044,387 | | | $ | 4,399,798,869 | | |
Accumulated undistributed
net investment income
included in net assets | |
| At end of year | | $ | 4,088,896 | | | $ | 1,065,027 | | |
See notes to financial statements
5
Eaton Vance Floating-Rate Fund as of October 31, 2006
FINANCIAL STATEMENTS CONT'D
Financial Highlights
| | | Advisers Class | |
| | | Year Ended October 31, | |
| | | 2006(1) | | 2005(1) | | 2004(1) | | 2003(1) | | 2002(1) | |
| Net asset value — Beginning of year | | $ | 9.880 | | | $ | 9.880 | | | $ | 9.820 | | | $ | 9.560 | | | $ | 9.820 | | |
| Income (loss) from operations | |
| Net investment income | | $ | 0.589 | | | $ | 0.417 | | | $ | 0.274 | | | $ | 0.331 | | | $ | 0.413 | | |
| Net realized and unrealized gain (loss) | | | (0.037 | ) | | | (0.005 | ) | | | 0.058 | | | | 0.283 | | | | (0.256 | ) | |
| Total income from operations | | $ | 0.552 | | | $ | 0.412 | | | $ | 0.332 | | | $ | 0.614 | | | $ | 0.157 | | |
| Less distributions | |
| From net investment income | | $ | (0.592 | ) | | $ | (0.413 | ) | | $ | (0.272 | ) | | $ | (0.354 | ) | | $ | (0.415 | ) | |
| From net realized gain | | | — | | | | — | | | | — | | | | — | | | | (0.002 | ) | |
| Total distributions | | $ | (0.592 | ) | | $ | (0.413 | ) | | $ | (0.272 | ) | | $ | (0.354 | ) | | $ | (0.417 | ) | |
| Redemptions Fees | | $ | 0.000 | (2) | | $ | 0.001 | | | $ | 0.000 | (2) | | $ | — | | | $ | — | | |
| Net asset value — End of year | | $ | 9.840 | | | $ | 9.880 | | | $ | 9.880 | | | $ | 9.820 | | | $ | 9.560 | | |
| Total Return(3) | | | 5.74 | % | | | 4.26 | % | | | 3.43 | % | | | 6.54 | % | | | 1.56 | % | |
| Ratios/Supplemental Data | |
| Net assets, end of year (000's omitted) | | $ | 1,238,349 | | | $ | 1,021,526 | | | $ | 782,259 | | | $ | 271,723 | | | $ | 70,694 | | |
| Ratios (As a percentage of average daily net assets): | |
| Expenses before custodian fee reduction(4) | | | 1.01 | % | | | 1.03 | % | | | 1.05 | % | | | 1.09 | % | | | 1.13 | % | |
| Expenses after custodian fee reduction(4) | | | 1.01 | % | | | 1.03 | % | | | 1.05 | % | | | 1.09 | % | | | 1.13 | % | |
| Net investment income | | | 5.97 | % | | | 4.21 | % | | | 2.78 | % | | | 3.40 | % | | | 4.22 | % | |
| Portfolio Turnover of the Portfolio | | | 50 | % | | | 57 | % | | | 67 | % | | | 64 | % | | | 76 | % | |
(1) Net investment income per share was computed using average shares outstanding.
(2) Amount represents less than $0.0005 per share.
(3) Returns are historical and are calculated by determining the percentage change in net asset value with all distributions reinvested. Total return is not computed on an annualized basis.
(4) Includes the Fund's share of the Portfolio's allocated expenses.
See notes to financial statements
6
Eaton Vance Floating-Rate Fund as of October 31, 2006
FINANCIAL STATEMENTS CONT'D
Financial Highlights
| | | Class A | |
| | | Year Ended October 31, | |
| | | 2006(1) | | 2005(1) | | 2004(1) | | 2003(1)(2) | |
| Net asset value — Beginning of year | | $ | 10.220 | | | $ | 10.210 | | | $ | 10.150 | | | $ | 10.000 | | |
| Income (loss) from operations | |
| Net investment income | | $ | 0.608 | | | $ | 0.430 | | | $ | 0.282 | | | $ | 0.138 | | |
| Net realized and unrealized gain (loss) | | | (0.036 | ) | | | 0.006 | (3) | | | 0.060 | | | | 0.169 | | |
| Total income from operations | | $ | 0.572 | | | $ | 0.436 | | | $ | 0.342 | | | $ | 0.307 | | |
| Less distributions | |
| From net investment income | | $ | (0.612 | ) | | $ | (0.427 | ) | | $ | (0.282 | ) | | $ | (0.157 | ) | |
| Total distributions | | $ | (0.612 | ) | | $ | (0.427 | ) | | $ | (0.282 | ) | | $ | (0.157 | ) | |
| Redemption Fees | | $ | 0.000 | (4) | | $ | 0.001 | | | $ | 0.000 | (4) | | $ | — | | |
| Net asset value — End of year | | $ | 10.180 | | | $ | 10.220 | | | $ | 10.210 | | | $ | 10.150 | | |
| Total Return(5) | | | 5.75 | % | | | 4.36 | % | | | 3.40 | % | | | 3.09 | % | |
| Ratios/Supplemental Data | |
| Net assets, end of year (000's omitted) | | $ | 1,839,719 | | | $ | 1,521,460 | | | $ | 1,155,058 | | | $ | 273,365 | | |
| Ratios (As a percentage of average daily net assets): | |
| Expenses before custodian fee reduction(6) | | | 1.01 | % | | | 1.03 | % | | | 1.05 | % | | | 1.09 | %(7) | |
| Expenses after custodian fee reduction(6) | | | 1.01 | % | | | 1.03 | % | | | 1.05 | % | | | 1.09 | %(7) | |
| Net investment income | | | 5.96 | % | | | 4.21 | % | | | 2.76 | % | | | 2.81 | %(7) | |
| Portfolio Turnover of the Portfolio | | | 50 | % | | | 57 | % | | | 67 | % | | | 64 | % | |
(1) Net investment income per share was computed using average shares outstanding.
(2) For the period from the start of business, May 5, 2003 to October 31, 2003.
(3) The per share amount is not in accord with the net realized and unrealized gain (loss) for the period because of the timing of sales of Fund shares and the amount of the per share realized and unrealized gains and losses at such time.
(4) Amount represents less than $0.0005 per share.
(5) Returns are historical and are calculated by determining the percentage change in net asset value with all distributions reinvested. Total return is not computed on an annualized basis.
(6) Includes the Fund's share of the Portfolio's allocated expenses.
(7) Annualized.
See notes to financial statements
7
Eaton Vance Floating-Rate Fund as of October 31, 2006
FINANCIAL STATEMENTS CONT'D
Financial Highlights
| | | Class B | |
| | | Year Ended October 31, | |
| | | 2006(1) | | 2005(1) | | 2004(1) | | 2003(1) | | 2002(1) | |
| Net asset value — Beginning of year | | $ | 9.870 | | | $ | 9.870 | | | $ | 9.810 | | | $ | 9.560 | | | $ | 9.810 | | |
| Income (loss) from operations | |
| Net investment income | | $ | 0.511 | | | $ | 0.336 | | | $ | 0.198 | | | $ | 0.278 | | | $ | 0.339 | | |
| Net realized and unrealized gain (loss) | | | (0.023 | ) | | | 0.002 | (2) | | | 0.060 | | | | 0.253 | | | | (0.246 | ) | |
| Total income from operations | | $ | 0.488 | | | $ | 0.338 | | | $ | 0.258 | | | $ | 0.531 | | | $ | 0.093 | | |
| Less distributions | |
| From net investment income | | $ | (0.518 | ) | | $ | (0.339 | ) | | $ | (0.198 | ) | | $ | (0.281 | ) | | $ | (0.341 | ) | |
| From net realized gain | | | — | | | | — | | | | — | | | | — | | | | (0.002 | ) | |
| Total distributions | | $ | (0.518 | ) | | $ | (0.339 | ) | | $ | (0.198 | ) | | $ | (0.281 | ) | | $ | (0.343 | ) | |
| Redemption Fees | | $ | 0.000 | (3) | | $ | 0.001 | | | $ | 0.000 | (3) | | $ | — | | | $ | — | | |
| Net asset value — End of year | | $ | 9.840 | | | $ | 9.870 | | | $ | 9.870 | | | $ | 9.810 | | | $ | 9.560 | | |
| Total Return(4) | | | 5.06 | % | | | 3.48 | % | | | 2.65 | % | | | 5.63 | % | | | 0.91 | % | |
| Ratios/Supplemental Data | |
| Net assets, end of year (000's omitted) | | $ | 230,454 | | | $ | 264,403 | | | $ | 298,187 | | | $ | 247,494 | | | $ | 203,683 | | |
| Ratios (As a percentage of average daily net assets): | |
| Expenses before custodian fee reduction(5) | | | 1.77 | % | | | 1.78 | % | | | 1.80 | % | | | 1.84 | % | | | 1.89 | % | |
| Expenses after custodian fee reduction(5) | | | 1.77 | % | | | 1.78 | % | | | 1.80 | % | | | 1.84 | % | | | 1.89 | % | |
| Net investment income | | | 5.18 | % | | | 3.40 | % | | | 2.01 | % | | | 2.87 | % | | | 3.47 | % | |
| Portfolio Turnover of the Portfolio | | | 50 | % | | | 57 | % | | | 67 | % | | | 64 | % | | | 76 | % | |
(1) Net investment income per share was computed using average shares outstanding.
(2) The per share amount is not in accord with the net realized and unrealized gain (loss) for the period because of the timing of sales of Fund shares and the amount of the per share realized and unrealized gains and losses at such time.
(3) Amount represents less than $0.0005 per share.
(4) Returns are historical and are calculated by determining the percentage change in net asset value with all distributions reinvested. Total return is not computed on an annualized basis.
(5) Includes the Fund's share of the Portfolio's allocated expenses.
See notes to financial statements
8
Eaton Vance Floating-Rate Fund as of October 31, 2006
FINANCIAL STATEMENTS CONT'D
Financial Highlights
| | | Class C | |
| | | Year Ended October 31, | |
| | | 2006(1) | | 2005(1) | | 2004(1) | | 2003(1) | | 2002(1) | |
| Net asset value — Beginning of year | | $ | 9.870 | | | $ | 9.870 | | | $ | 9.810 | | | $ | 9.560 | | | $ | 9.820 | | |
| Income (loss) from operations | |
| Net investment income | | $ | 0.512 | | | $ | 0.338 | | | $ | 0.198 | | | $ | 0.275 | | | $ | 0.339 | | |
| Net realized and unrealized gain (loss) | | | (0.024 | ) | | | (0.000 | )(2) | | | 0.060 | | | | 0.256 | | | | (0.256 | ) | |
| Total income from operations | | $ | 0.488 | | | $ | 0.338 | | | $ | 0.258 | | | $ | 0.531 | | | $ | 0.083 | | |
| Less distributions | |
| From net investment income | | $ | (0.518 | ) | | $ | (0.339 | ) | | $ | (0.198 | ) | | $ | (0.281 | ) | | $ | (0.341 | ) | |
| From net realized gain | | | — | | | | — | | | | — | | | | — | | | | (0.002 | ) | |
| Total distributions | | $ | (0.518 | ) | | $ | (0.339 | ) | | $ | (0.198 | ) | | $ | (0.281 | ) | | $ | (0.343 | ) | �� |
| Redemption Fees | | $ | 0.000 | (3) | | $ | 0.001 | | | $ | 0.000 | (3) | | $ | — | | | $ | — | | |
| Net asset value — End of year | | $ | 9.840 | | | $ | 9.870 | | | $ | 9.870 | | | $ | 9.810 | | | $ | 9.560 | | |
| Total Return(4) | | | 5.06 | % | | | 3.48 | % | | | 2.65 | % | | | 5.63 | % | | | 0.80 | % | |
| Ratios/Supplemental Data | |
| Net assets, end of year (000's omitted) | | $ | 1,170,248 | | | $ | 1,220,713 | | | $ | 1,227,737 | | | $ | 724,521 | | | $ | 521,312 | | |
| Ratios (As a percentage of average daily net assets): | |
| Expenses before custodian fee reduction(5) | | | 1.76 | % | | | 1.78 | % | | | 1.80 | % | | | 1.84 | % | | | 1.89 | % | |
| Expenses after custodian fee reduction(5) | | | 1.76 | % | | | 1.78 | % | | | 1.80 | % | | | 1.84 | % | | | 1.89 | % | |
| Net investment income | | | 5.19 | % | | | 3.42 | % | | | 2.01 | % | | | 2.84 | % | | | 3.46 | % | |
| Portfolio Turnover of the Portfolio | | | 50 | % | | | 57 | % | | | 67 | % | | | 64 | % | | | 76 | % | |
(1) Net investment income per share was computed using average shares outstanding.
(2) Amount represents less than $(0.0005) per share.
(3) Amount represents less than $0.0005 per share.
(4) Returns are historical and are calculated by determining the percentage change in net asset value with all distributions reinvested. Total return is not computed on an annualized basis.
(5) Includes the Fund's share of the Portfolio's allocated expenses.
See notes to financial statements
9
Eaton Vance Floating-Rate Fund as of October 31, 2006
FINANCIAL STATEMENTS CONT'D
Financial Highlights
| | | Class I | |
| | | Year Ended October 31, | |
| | | 2006(1) | | 2005(1) | | 2004(1) | | 2003(1) | | 2002(1) | |
| Net asset value — Beginning of year | | $ | 9.880 | | | $ | 9.880 | | | $ | 9.820 | | | $ | 9.560 | | | $ | 9.820 | | |
| Income (loss) from operations | |
| Net investment income | | $ | 0.614 | | | $ | 0.440 | | | $ | 0.299 | | | $ | 0.359 | | | $ | 0.437 | | |
| Net realized and unrealized gain (loss) | | | (0.037 | ) | | | (0.003 | ) | | | 0.058 | | | | 0.279 | | | | (0.255 | ) | |
| Total income from operations | | $ | 0.577 | | | $ | 0.437 | | | $ | 0.357 | | | $ | 0.638 | | | $ | 0.182 | | |
| Less distributions | |
| From net investment income | | $ | (0.617 | ) | | $ | (0.438 | ) | | $ | (0.297 | ) | | $ | (0.378 | ) | | $ | (0.440 | ) | |
| From net realized gain | | | — | | | | — | | | | — | | | | — | | | | (0.002 | ) | |
| Total distributions | | $ | (0.617 | ) | | $ | (0.438 | ) | | $ | (0.297 | ) | | $ | (0.378 | ) | | $ | (0.442 | ) | |
| Redemption Fees | | $ | 0.000 | (2) | | $ | 0.001 | | | $ | 0.000 | (2) | | $ | — | | | $ | — | | |
| Net asset value — End of year | | $ | 9.840 | | | $ | 9.880 | | | $ | 9.880 | | | $ | 9.820 | | | $ | 9.560 | | |
| Total Return(3) | | | 6.00 | % | | | 4.52 | % | | | 3.69 | % | | | 6.79 | % | | | 1.82 | % | |
| Ratios/Supplemental Data | |
| Net assets, end of year (000's omitted) | | $ | 485,274 | | | $ | 371,698 | | | $ | 270,774 | | | $ | 98,545 | | | $ | 31,661 | | |
| Ratios (As a percentage of average daily net assets): | |
| Expenses before custodian fee reduction(4) | | | 0.76 | % | | | 0.78 | % | | | 0.80 | % | | | 0.84 | % | | | 0.89 | % | |
| Expenses after custodian fee reduction(4) | | | 0.76 | % | | | 0.78 | % | | | 0.80 | % | | | 0.84 | % | | | 0.89 | % | |
| Net investment income | | | 6.22 | % | | | 4.45 | % | | | 3.03 | % | | | 3.69 | % | | | 4.46 | % | |
| Portfolio Turnover of the Portfolio | | | 50 | % | | | 57 | % | | | 67 | % | | | 64 | % | | | 76 | % | |
(1) Net investment income per share was computed using average shares outstanding.
(2) Amount represents less than $0.0005 per share.
(3) Returns are historical and are calculated by determining the percentage change in net asset value with all distributions reinvested. Total return is not computed on an annualized basis.
(4) Includes the Fund's share of the Portfolio's allocated expenses.
See notes to financial statements
10
Eaton Vance Floating-Rate Fund as of October 31, 2006
NOTES TO FINANCIAL STATEMENTS
1 Significant Accounting Policies
Eaton Vance Floating-Rate Fund (the Fund) is a series of Eaton Vance Mutual Funds Trust (the Trust). The Trust is an entity of the type commonly known as a Massachusetts business trust and is registered under the Investment Company Act of 1940, as amended, as an open-end management investment company. The Fund offers five classes of shares. The Advisers Class and Class I shares are generally sold at net asset value per share and assess a redemption fee of 1% for shares redeemed or exchanged within 90 days of purchase. Class A shares are generally sold subject to a sales charge imposed at time of the settlement of purchase and assess a redemption fee of 1% for shares redeemed or exchanged within 90 days of the settlement of purchase. Class B and Class C shares are sold at net asset value and are generally subject to a contingent deferred sales charge (see Note 6). Class B shares held for eight years will automatically convert to Class A shares. Each class represents a pro rata interest in the Fund, but votes separately on class-specific matters and (as noted below) is subject to different expenses. Realized and unrealized gains and losses are allocated daily to each class of shares based on the relative net assets of each class to the total net assets of the Fund. Net investment income, other than class specific expenses, is allocated daily to each class of shares based upon the ratio of the value of each class' paid shares to the total value of all paid shares. Each class of shares differs in its distribution plan and certain other class specific expenses. The Fund invests all of its investable assets in interests in Floating Rate Portfolio (the Portfolio), a New York Trust having the same investment objective as the Fund. The value of the Fund's investment in the Portfolio reflects the Fund's proportionate interest in the net assets of the Portfolio (approximately 66.9% at October 31, 2006). The performance of the Fund is directly affected by the performance of the Portfolio. The financial statements of the Portfolio, including the portfolio of investments, are included elsewhere in this report and should be read in conjunction with the Fund's financial statements.
The following is a summary of significant accounting policies consistently followed by the Fund in the preparation of its financial statements. The policies are in conformity with accounting principles generally accepted in the United States of America.
A Investment Valuation — Valuation of securities by the Portfolio is discussed in Note 1A of the Portfolio's Notes to Financial Statements, which are included elsewhere in this report.
B Income — The Fund's net investment income or loss consists of the Fund's pro rata share of the net investment income or loss of the Portfolio, less all actual and accrued expenses of the Fund.
C Federal Taxes — The Fund's policy is to comply with the provisions of the Internal Revenue Code applicable to regulated investment companies and to distribute to shareholders, each year, substantially all of its net investment income and all or substantially all of its net realized capital gains. Accordingly, no provision for federal income or excise tax is necessary. At October 31, 2006, the Fund, for federal income tax purposes, had a capital loss carryover of $29,173,703, which will reduce the Fund's taxable income arising from future net realized gains on investments, if any, to the extent permitted by Internal Revenue Code, and thus will reduce the amount of the distributions to shareholders which would otherwise be necessary to relieve the Fund of any liability fo r federal income or excise tax. Such capital loss carryover will expire on October 31, 2010 ($8,217,006), October 31, 2011 ($8,406,344), October 31, 2012 ($4,215,434), October 31, 2013 ($7,255,003) and October 31, 2014 ($1,079,916).
D Use of Estimates — The preparation of the financial statements in conformity with accounting principles generally accepted in the United States of America requires management to make estimates and assumptions that affect the reported amounts of assets and liabilities at the date of the financial statements and the reported amounts of income and expense during the reporting period. Actual results could differ from those estimates.
E Expenses — The majority of expenses of the Trust are directly identifiable to an individual fund. Expenses which are not readily identifiable to a specific fund are allocated taking into consideration, among other things, the nature and type of expense and the relative size of the funds.
F Indemnifications — Under the Trust's organizational documents, its officers and Trustees may be indemnified against certain liabilities and expenses arising out of the performance of their duties to the Fund, and shareholders are indemnified against personal liability for the obligations of the Trust. Additionally, in the normal course of business, the Fund enters into agreements with service providers that may contain indemnification clauses. The Fund's maximum exposure under these arrangements is unknown as this would involve future claims that may be made against the Fund that have not yet occurred.
11
Eaton Vance Floating-Rate Fund as of October 31, 2006
NOTES TO FINANCIAL STATEMENTS CONT'D
2 Distributions to Shareholders
The net income of the Fund is determined daily and substantially all of the net income so determined is declared as a dividend to shareholders of record at the time of declaration. Distributions are paid monthly. Distributions of allocated realized capital gains, if any, are made at least annually. Shareholders may reinvest all distributions in additional shares of the Fund at the net asset value as of the ex-dividend date. Distributions are paid in the form of additional shares of the Fund or, at the election of the shareholder, in cash. The Fund distinguishes between distributions on a tax basis and a financial reporting basis. Accounting principles generally accepted in the United States of America require that only distributions in excess of tax basis earnings and profits be reported in the financial statements as a return of capital. Permanent differences between book and tax accounting relating to distributions are reclass ified to paid-in capital. These differences are primarily related to swaps and foreign currency transactions.
The tax character of distributions declared for the years ended October 31, 2006 and October 31, 2005 was as follows:
| | | Year Ended October 31, | |
| | | 2006 | | 2005 | |
| Distributions declared from: | |
|
| Ordinary income | | $ | 277,021,651 | | | $ | 163,383,523 | | |
|
During the year ended October 31, 2006, accumulated undistributed net investment income was increased by $5,875,593, paid in capital was decreased by $19,712,102 and accumulated net realized loss was decreased by $13,836,509 primarily due to differences between book and tax accounting for mixed straddles, swap contracts and foreign currency transactions. This change had no effect on the net assets or the net asset value per share.
At October 31, 2006, the components of distributable earnings (accumulated losses) on a tax basis were as follows:
| Undistributed income | | $ | 12,631,061 | | |
| Capital loss carryforwards | | $ | (29,173,703 | ) | |
| Unrealized gain | | $ | 24,170,977 | | |
| Other temporary differences | | $ | (8,542,165 | ) | |
The differences between components of distributable earnings (accumulated loss) on a tax basis and the amounts reflected in the statement of assets and liabilities are primarily due to differences in book and tax policies for wash sales and the timing of recognizing distributions to shareholders.
3 Shares of Beneficial Interest
The Fund's Declaration of Trust permits the Trustees to issue an unlimited number of full and fractional shares of beneficial interest (without par value). Such shares may be issued in a number of different series (such as the Fund) and classes. Transactions in Fund shares were as follows:
| | | Year Ended October 31, | |
| Advisers | | 2006 | | 2005 | |
| Sales | | | 81,237,285 | | | | 75,588,907 | | |
Issued to shareholders electing to
receive payments of distributions in
Fund shares | | | 4,894,076 | | | | 2,654,296 | | |
| Redemptions | | | (63,738,296 | ) | | | (54,037,669 | ) | |
| Net increase | | | 22,393,065 | | | | 24,205,534 | | |
| | | Year Ended October 31, | |
| Class A | | 2006 | | 2005 | |
| Sales | | | 99,686,666 | | | | 95,138,078 | | |
Issued to shareholders electing to
receive payments of distributions in
Fund shares | | | 7,244,918 | | | | 3,772,581 | | |
| Redemptions | | | (75,822,964 | ) | | | (63,501,201 | ) | |
| Exchange from Class B shares | | | 685,169 | | | | 431,412 | | |
| Net increase | | | 31,793,789 | | | | 35,840,870 | | |
| | | Year Ended October 31, | |
| Class B | | 2006 | | 2005 | |
| Sales | | | 2,462,298 | | | | 3,128,445 | | |
Issued to shareholders electing to
receive payments of distributions in
Fund shares | | | 845,007 | | | | 613,276 | | |
| Redemptions | | | (5,954,887 | ) | | | (6,720,684 | ) | |
| Exchange to Class A shares | | | (708,211 | ) | | | (446,088 | ) | |
| Net decrease | | | (3,355,793 | ) | | | (3,425,051 | ) | |
12
Eaton Vance Floating-Rate Fund as of October 31, 2006
NOTES TO FINANCIAL STATEMENTS CONT'D
| | | Year Ended October 31, | |
| Class C | | 2006 | | 2005 | |
| Sales | | | 33,190,416 | | | | 38,149,013 | | |
Issued to shareholders electing to
receive payments of distributions in
Fund shares | | | 4,001,360 | | | | 2,695,648 | | |
| Redemptions | | | (41,880,646 | ) | | | (41,576,308 | ) | |
| Net decrease | | | (4,688,870 | ) | | | (731,647 | ) | |
| | | Year Ended October 31, | |
| Class I | | 2006 | | 2005 | |
| Sales | | | 23,724,123 | | | | 19,621,704 | | |
Issued to shareholders electing to
receive payments of distributions in
Fund shares | | | 1,894,462 | | | | 1,129,870 | | |
| Redemptions | | | (13,946,763 | ) | | | (10,541,404 | ) | |
| Net increase | | | 11,671,822 | | | | 10,210,170 | | |
Redemptions or exchanges of Advisers Class, Class A and Class I shares made within 90 days of purchase are subject to a redemption fee equal to 1.00% of the amount redeemed. For the year ended October 31, 2006 the fund received $129,528 in redemption fees.
4 Transactions with Affiliates
The Fund is authorized to pay Eaton Vance Management, (EVM), a fee as compensation for administrative services necessary to conduct the Fund's business. The fee is computed at the annual rate of 0.15% of the Fund's average daily net assets. For the year ended October 31, 2006, the fee amounted to $7,144,492. The Portfolio has engaged Boston Management and Research, (BMR), a subsidiary of EVM, to render investment advisory services. See Note 2 of the Portfolio's Notes to Financial Statements which are included elsewhere in this report. Except as to Trustees of the Fund and the Portfolio who are not members of EVM's or BMR's organization, officers and Trustees receive remuneration for their services to the Fund out of the investment adviser fee earned by BMR. EVM serves as the sub-transfer agent of the Fund and receives from the transfer agent an aggregate fee based upon the actual expenses incurred by EVM in the performance of th ose services. During the year ended October 31, 2006, EVM received $142,857 in sub-transfer agent fees. Certain officers and Trustees of the Fund and the Portfolio are officers of the above organizations. The Fund was informed that Eaton Vance Distributors, Inc. (EVD), a principal underwriter, received $115,540 from the Fund as its portion of the sales charge on sales of Class A shares for the year ended October 31, 2006.
5 Distribution Plans
The Fund has in effect distribution plans pursuant to Rule 12b-1 for the Advisers Class shares and Class A shares. The Plans provide that the Fund will pay EVD a distribution and service fee of 0.25% of the Fund's average daily net assets attributable to Advisers Class shares and Class A shares for each fiscal year for distribution services and facilities provided to the Fund by EVD, as well as for personal services and/or the maintenance of shareholder accounts. Distribution and service fees paid or accrued for the year ended October 31, 2006 amounted to $2,927,330 and $4,274,646 for Advisers shares and Class A shares, respectively. The Fund also has in effect distribution plans for Class B shares (Class B Plan) and Class C shares (Class C Plan) pursuant to Rule 12b-1 under the Investment Company Act of 1940. The Class B and Class C Plans require the Fund to pay EVD amounts equal to 1/365 of 0.75% of the Fund's average daily ne t assets attributable to Class B and Class C shares for providing ongoing distribution services and facilities to the Fund. The Fund will automatically discontinue payments to EVD during any period in which there are no outstanding Uncovered Distribution Charges, which are equivalent to the sum of (i) 6.25% of the aggregate amount received by the Fund for the Class B and Class C shares sold, respectively, plus (ii) interest calculated by applying the rate of 1% over the prevailing prime rate to the outstanding balance of Uncovered Distribution Charges of EVD of each respective class, reduced by the aggregate amount of contingent deferred sales charges (see Note 6) and daily amounts theretofore paid to EVD by each respective class. The Fund paid or accrued $1,863,030 and $8,973,036 for Class B and Class C shares, respectively, to or payable to EVD for the year ended October 31, 2006, representing 0.75% of the average daily net assets for Class B and Class C shares. At October 31, 2006, the amount of Uncovered Distribution Charges of EVD calculated under the Plans was approximately $11,670,000 and $127,228,000 for Class B and Class C shares, respectively. The Class B and Class C Plans also authorize the Fund to make payments of service fees to EVD, investment dealers and other persons in amounts not exceeding 0.25% annually of the average daily net assets attributable to that Class. Service fees are paid for personal services and/or the maintenance of shareholder accounts. They are separate and distinct from the Class B and Class C sales commissions and distribution fees and, as such, are not subject to automatic discontinuance when there are no outstanding Uncovered Distribution Charges to EVD. Service fees paid or accrued for the year ended
13
Eaton Vance Floating-Rate Fund as of October 31, 2006
NOTES TO FINANCIAL STATEMENTS CONT'D
October 31, 2006 amounted to $621,010, and $2,991,012, for Class B and Class C shares, respectively.
6 Contingent Deferred Sales Charge
Effective September 15, 2006, all purchases of Class A shares of $1 million or more will be subject to a 1% contingent deferred sales charge (CDSC) in the event of redemption within 18 months of purchase. Prior to September 15, 2006, Class A shares purchased at net asset value in amounts of $1 million or more (other than shares purchased in a single transaction of $5 million or more) were subject to a 1% CDSC if redeemed within 12 months of purchase. A CDSC generally is imposed on redemptions of Class B shares made within six years of purchase and on redemptions of Class C shares made within one year of purchase. Generally, the CDSC is based on the lower of the net asset value at the date of redemption or date of purchase. No charge is levied on shares acquired by reinvestment of dividends or capital gains distributions. Class B CDSC is imposed at declining rates that begin at 5% in the case of redemptions in the first and secon d years of redemption after purchase, declining one percentage point each subsequent year. Class C shares will be subject to a 1% CDSC if redeemed within one year of purchase. No CDSC is levied on shares which have been sold to EVM or its affiliates or to their respective employees or clients and may be waived under certain other limited conditions. CDSC charges are paid to EVD to reduce the amount of Uncovered Distribution Charges calculated under each Class' Distribution Plan. CDSC charges received when no Uncovered Distribution Charges exist will be retained by the Fund. The Fund has been informed that EVD received approximately $306,000, $831,000, and $343,000 of CDSC paid by shareholders of Class A, Class B, and Class C shares, respectively, for the year ended October 31, 2006.
7 Investment Transactions
Increases and decreases in the Fund's investment in the Floating Rate Portfolio for the year ended October 31, 2006, aggregated $2,409,498,763 and $2,117,518,637, respectively.
8 Recently Issued Accounting Pronouncements
In June 2006, the Financial Accounting Standards Board ("FASB") issued FASB Interpretation No. 48, ("FIN 48") "Accounting for Uncertainty in Income Taxes – an interpretation of FASB Statement No. 109". FIN 48 clarifies the accounting for uncertainty in income taxes recognized in accordance with FASB Statement No. 109, "Accounting for Income Taxes." This interpretation prescribes a recognition threshold and measurement attribute for the financial statement recognition and measurement of a tax position taken or expected to be taken in a tax return. It also provides guidance on de-recognition, classification, interest and penalties, accounting in interim periods, disclosure and transition. FIN 48 is effective for fiscal years beginning after December 15, 2006. Management is currently evaluating the impact of applying the various provisions of FIN 48.
In September 2006, the Financial Accounting Standards Board ("FASB") issued Statement of Financial Accounting Standards No. 157, ("FAS 157") "Fair Value Measurements". FAS 157 defines fair value, establishes a framework for measuring fair value in accordance with generally accepted accounting principles and expands disclosure about fair value measurements. FAS 157 is effective for fiscal years beginning after November 15, 2007. Management is currently evaluating the impact the adoption of FAS 157 will have on the Fund's financial statement disclosures.
14
Eaton Vance Floating-Rate Fund as of October 31, 2006
REPORT OF INDEPENDENT REGISTERED PUBLIC ACCOUNTING FIRM
To the Trustees and Shareholders
of Eaton Vance Floating Rate Fund:
We have audited the accompanying statement of assets and liabilities of Eaton Vance Floating-Rate Fund (the Fund) as of October 31, 2006, the related statement of operations for the year then ended, the statements of changes in net assets for each of the two years in the period then ended, and the financial highlights for each of the five years in the period then ended. These financial statements and financial highlights are the responsibility of the Fund's management. Our responsibility is to express an opinion on these financial statements and financial highlights based on our audits.
We conducted our audits in accordance with the standards of the Public Company Accounting Oversight Board (United States). Those standards require that we plan and perform the audit to obtain reasonable assurance about whether the financial statements and financial highlights are free of material misstatement. The Fund is not required to have, nor were we engaged to perform, an audit of its internal control over financial reporting. Our audits included consideration of internal control over financial reporting as a basis for designing audit procedures that are appropriate in the circumstances, but not for the purpose of expressing an opinion on the effectiveness of the Fund's internal control over financial reporting. Accordingly, we express no such opinion. An audit also includes examining, on a test basis, evidence supporting the amounts and disclosures in the financial statements, assessing the accounting principles used and significant estimates made by management, as well as evaluating the overall financial statement presentation. We believe that our audits provide a reasonable basis for our opinion.
In our opinion, such financial statements and financial highlights referred to above present fairly, in all material respects, the financial position of the Eaton Vance Floating-Rate Fund as of October 31, 2006, the results of its operations for the year then ended, the changes in its net assets for each of the two years in the period then ended, and the financial highlights for each of the five years in the period then ended, in conformity with accounting principles generally accepted in the United States of America.
DELOITTE & TOUCHE LLP
Boston, Massachusetts
December 15, 2006
15
Eaton Vance Floating-Rate Fund as of October 31, 2006
FEDERAL TAX INFORMATION (Unaudited)
The Form 1099-DIV you receive in January 2007 will show the tax status of all distributions paid to your account in calendar 2006. Shareholders are advised to consult their own tax adviser with respect to the tax consequences of their investment in the Fund.
16
Floating Rate Portfolio as of October 31, 2006
PORTFOLIO OF INVESTMENTS
| Senior Floating Rate Interests — 98.7%(1) | | | |
Principal
Amount | | Borrower/Tranche Description | | Value | |
| Aerospace and Defense — 1.9% | | | |
| Alliant Techsystems, Inc. | | | |
| $ | 3,748,500 | | | Term Loan, 6.46%, Maturing March 31, 2009 | | $ | 3,754,749 | | |
| BE Aerospace, Inc. | | | |
| | 4,550,000 | | | Term Loan, 7.63%, Maturing August 24, 2012 | | | 4,579,384 | | |
| CACI International, Inc. | | | |
| | 11,189,159 | | | Term Loan, 6.93%, Maturing May 3, 2011 | | | 11,222,235 | | |
| Dresser Rand Group, Inc. | | | |
| EUR | 787,623 | | | Term Loan, 5.51%, Maturing October 29, 2011 | | | 1,009,053 | | |
| | 2,965,758 | | | Term Loan, 7.48%, Maturing October 29, 2011 | | | 2,983,182 | | |
| DRS Technologies, Inc. | | | |
| | 3,218,763 | | | Term Loan, 6.81%, Maturing January 31, 2013 | | | 3,229,829 | | |
| Forgings International Holding | | | |
| GBP | 750,000 | | | Term Loan, 6.58%, Maturing August 11, 2014 | | | 1,446,978 | | |
| | 2,855,850 | | | Term Loan, 7.83%, Maturing August 11, 2014 | | | 2,891,548 | | |
| GBP | 750,000 | | | Term Loan, 6.83%, Maturing August 11, 2015 | | | 1,453,236 | | |
| | 2,855,850 | | | Term Loan, 8.08%, Maturing August 11, 2015 | | | 2,902,258 | | |
| | | Hexcel Corp. | |
| | 12,899,804 | | | Term Loan, 7.13%, Maturing March 1, 2012 | | | 12,932,054 | | |
| IAP Worldwide Services, Inc. | | | |
| | 7,840,750 | | | Term Loan, 8.44%, Maturing December 30, 2012 | | | 7,850,551 | | |
| Jet Aviation Holding, AG | | | |
| | 4,415,888 | | | Term Loan, 7.62%, Maturing May 15, 2013 | | | 4,404,848 | | |
| K&F Industries, Inc. | | | |
| | 9,247,075 | | | Term Loan, 7.32%, Maturing November 18, 2012 | | | 9,291,868 | | |
| Spirit Aerosystems, Inc. | | | |
| | 8,295,200 | | | Term Loan, 7.57%, Maturing December 31, 2011 | | | 8,369,077 | | |
| Standard Aero Holdings, Inc. | | | |
| | 8,323,870 | | | Term Loan, 7.61%, Maturing August 24, 2012 | | | 8,339,477 | | |
| Transdigm, Inc. | | | |
| | 15,650,000 | | | Term Loan, 7.39%, Maturing June 23, 2013 | | | 15,765,419 | | |
| Vought Aircraft Industries, Inc. | | | |
| | 10,000,000 | | | Revolving Loan, 7.80%, Maturing December 22, 2009(2) | | | 9,575,000 | | |
| | 4,000,000 | | | Term Loan, 7.33%, Maturing December 22, 2010 | | | 4,023,752 | | |
| | 9,045,008 | | | Term Loan, 7.88%, Maturing December 22, 2011 | | | 9,106,252 | | |
| Wam Aquisition, S.A. | | | |
| | 4,714,710 | | | Term Loan, 8.12%, Maturing April 8, 2013 | | | 4,753,554 | | |
| | 4,714,710 | | | Term Loan, 8.62%, Maturing April 8, 2014 | | | 4,771,767 | | |
| EUR | 500,000 | | | Term Loan, 6.13%, Maturing May 4, 2014 | | | 645,948 | | |
| EUR | 500,000 | | | Term Loan, 6.63%, Maturing May 4, 2015 | | | 648,545 | | |
| Wyle Laboratories, Inc. | | | |
| | 4,282,929 | | | Term Loan, 8.22%, Maturing January 28, 2011 | | | 4,307,020 | | |
| | | | | | | $ | 140,257,584 | | |
Principal
Amount | | Borrower/Tranche Description | | Value | |
| Air Transport — 0.9% | | | |
| Airport Development and Investment | | | |
| GBP | 11,000,000 | | | Term Loan, 9.12%, Maturing April 7, 2011 | | $ | 21,030,164 | | |
| Delta Air Lines, Inc. | | | |
| | 9,900,000 | | | Term Loan, 8.02%, Maturing March 16, 2008 | | | 10,011,415 | | |
| | 8,800,000 | | | Term Loan, 10.02%, Maturing March 16, 2008 | | | 8,984,967 | | |
| Northwest Airlines, Inc. | | | |
| | 18,000,000 | | | DIP Loan, 7.90%, Maturing August 21, 2008 | | | 18,078,750 | | |
| United Airlines, Inc. | | | |
| | 1,430,313 | | | Term Loan, 9.13%, Maturing February 1, 2012 | | | 1,455,343 | | |
| | 10,012,188 | | | Term Loan, 9.25%, Maturing February 1, 2012 | | | 10,187,401 | | |
| | | | | | | $ | 69,748,040 | | |
| Automotive — 3.9% | | | |
| AA Acquisitions Co., Ltd. | | | |
| GBP | 3,000,000 | | | Term Loan, 7.58%, Maturing June 25, 2012 | | $ | 5,812,686 | | |
| GBP | 3,000,000 | | | Term Loan, 8.08%, Maturing June 25, 2013 | | | 5,837,718 | | |
| Accuride Corp. | | | |
| $ | 12,740,655 | | | Term Loan, 7.44%, Maturing January 31, 2012 | | | 12,780,470 | | |
| Affina Group, Inc. | | | |
| | 5,395,056 | | | Term Loan, 8.38%, Maturing November 30, 2011 | | | 5,423,720 | | |
| Arvinmeritor, Inc. | | | |
| | 3,494,853 | | | Term Loan, 7.13%, Maturing June 23, 2012 | | | 3,499,948 | | |
| Collins & Aikman Products Co. | | | |
| | 4,723,070 | | | Term Loan, 6.34%, Maturing August 31, 2011(3) | | | 1,718,017 | | |
| CSA Acquisition Corp. | | | |
| | 4,033,823 | | | Term Loan, 7.88%, Maturing December 23, 2011 | | | 4,042,649 | | |
| | 5,446,498 | | | Term Loan, 7.88%, Maturing December 23, 2011 | | | 5,458,415 | | |
| | 3,721,875 | �� | | Term Loan, 7.88%, Maturing December 23, 2012 | | | 3,724,666 | | |
| Dana Corp. | | | |
| | 13,700,000 | | | DIP Loan, 7.65%, Maturing April 13, 2008 | | | 13,720,550 | | |
| Dayco Products, LLC | | | |
| | 14,735,563 | | | Term Loan, 8.02%, Maturing June 21, 2011 | | | 14,861,434 | | |
| Dura Operating Corp. | | | |
| | 2,500,000 | | | Revolving Loan, 9.50%, Maturing May 3, 2011(2) | | | 2,462,500 | | |
| Exide Technologies, Inc. | | | |
| | 8,671,518 | | | Term Loan, 11.75%, Maturing May 5, 2010 | | | 9,105,094 | | |
| Federal-Mogul Corp. | | | |
| | 4,982,950 | | | Revolving Loan, 7.07%,
Maturing December 9, 2006(2) | | | 4,851,255 | | |
| | 9,650,000 | | | DIP Loan, 7.38%, Maturing December 9, 2006 | | | 9,675,630 | | |
| | 4,108,827 | | | Term Loan, 7.57%, Maturing December 9, 2006 | | | 4,003,539 | | |
| | 6,000,000 | | | Term Loan, 7.59%, Maturing December 9, 2006 | | | 5,861,250 | | |
| | 17,933,096 | | | Revolving Loan, 9.07%, Maturing December 9, 2006(2) | | | 18,009,977 | | |
See notes to financial statements
17
Floating Rate Portfolio as of October 31, 2006
PORTFOLIO OF INVESTMENTS CONT'D
Principal
Amount | | Borrower/Tranche Description | | Value | |
| Automotive (continued) | | | |
| Goodyear Tire & Rubber Co. | | | |
| $ | 8,890,000 | | | Term Loan, 5.23%, Maturing April 30, 2010 | | $ | 8,918,572 | | |
| | 13,000,000 | | | Revolving Loan, 7.48%, Maturing April 30, 2010(2) | | | 12,947,194 | | |
| | 19,720,000 | | | Term Loan, 8.14%, Maturing April 30, 2010 | | | 19,903,120 | | |
| | 1,000,000 | | | Term Loan, 8.89%, Maturing March 1, 2011 | | | 1,014,583 | | |
| HLI Operating Co., Inc. | | | |
| | 6,754,073 | | | Term Loan, 8.96%, Maturing June 3, 2009 | | | 6,796,286 | | |
| Insurance Auto Auctions, Inc. | | | |
| | 6,127,717 | | | Term Loan, 7.90%, Maturing May 19, 2012(2) | | | 6,166,016 | | |
| Key Automotive Group | | | |
| | 3,922,508 | | | Term Loan, 8.85%, Maturing June 29, 2010 | | | 3,966,636 | | |
| Keystone Automotive Operations, Inc. | | | |
| | 10,386,881 | | | Term Loan, 7.88%, Maturing October 30, 2009 | | | 10,412,848 | | |
| R.J. Tower Corp. | | | |
| | 12,000,000 | | | DIP Revolving Loan, 8.45%,
Maturing February 2, 2007(2) | | | 11,430,000 | | |
| | 1,000,000 | | | DIP Revolving Loan, 8.94%,
Maturing February 2, 2007 | | | 970,625 | | |
| Speedy 1, Ltd. | | | |
| EUR | 1,978,627 | | | Term Loan, 5.76%, Maturing August 31, 2013 | | | 2,554,148 | | |
| EUR | 1,978,627 | | | Term Loan, 6.26%, Maturing August 31, 2014 | | | 2,567,090 | | |
| Tenneco Automotive, Inc. | | | |
| | 11,860,733 | | | Term Loan, 7.40%, Maturing December 12, 2009 | | | 11,929,300 | | |
| | 4,505,755 | | | Term Loan, 7.31%, Maturing December 10, 2010 | | | 4,531,803 | | |
| Teutates Vermogensverwaltung | | | |
| EUR | 2,000,000 | | | Term Loan, 5.75%, Maturing March 11, 2014 | | | 2,575,947 | | |
| | 2,619,256 | | | Term Loan, 7.90%, Maturing March 11, 2014 | | | 2,638,901 | | |
| EUR | 2,000,000 | | | Term Loan, 6.25%, Maturing March 11, 2015 | | | 2,587,800 | | |
| | 2,619,256 | | | Term Loan, 8.40%, Maturing March 11, 2015 | | | 2,651,997 | | |
| The Goodyear Dunlop Tires | | | |
| EUR | 990,000 | | | Term Loan, 5.91%, Maturing April 30, 2010 | | | 1,269,642 | | |
| Trimas Corp. | | | |
| | 1,893,750 | | | Term Loan, 8.13%, Maturing August 2, 2011 | | | 1,907,953 | | |
| | 8,206,250 | | | Term Loan, 8.25%, Maturing August 2, 2013 | | | 8,267,797 | | |
| TRW Automotive, Inc. | | | |
| | 9,863,402 | | | Term Loan, 6.75%, Maturing October 31, 2010 | | | 9,856,212 | | |
| | 10,897,374 | | | Term Loan, 7.19%, Maturing June 30, 2012 | | | 10,887,163 | | |
| United Components, Inc. | | | |
| | 11,724,242 | | | Term Loan, 7.70%, Maturing June 29, 2012 | | | 11,797,519 | | |
| | | | | | | $ | 289,398,670 | | |
| Beverage and Tobacco — 1.3% | | | |
| Alliance One International, Inc. | | | |
| $ | 4,800,750 | | | Term Loan, 8.82%, Maturing May 13, 2010 | | $ | 4,860,759 | | |
| Constellation Brands, Inc. | | | |
| | 25,729,167 | | | Term Loan, 6.93%, Maturing June 5, 2013 | | | 25,864,065 | | |
Principal
Amount | | Borrower/Tranche Description | | Value | |
| Beverage and Tobacco (continued) | | | |
| Culligan International Co. | | | |
| $ | 6,088,121 | | | Term Loan, 7.07%, Maturing September 30, 2011 | | $ | 6,112,857 | | |
| National Dairy Holdings, L.P. | | | |
| | 8,444,181 | | | Term Loan, 7.32%, Maturing March 15, 2012 | | | 8,475,847 | | |
| National Distribution Co. | | | |
| | 4,734,400 | | | Term Loan, 11.82%, Maturing June 22, 2010 | | | 4,746,236 | | |
| Reynolds American, Inc. | | | |
| | 19,523,563 | | | Term Loan, 7.31%, Maturing May 31, 2012 | | | 19,656,264 | | |
| Southern Wine & Spirits of America, Inc. | | | |
| | 24,212,161 | | | Term Loan, 6.87%, Maturing May 31, 2012 | | | 24,295,403 | | |
| Sunny Delight Beverages Co. | | | |
| | 1,734,548 | | | Term Loan, 11.39%, Maturing August 20, 2010 | | | 1,715,578 | | |
| | | | | | | $ | 95,727,009 | | |
| Building and Development — 6.8% | | | |
| 401 North Wabash Venture, LLC | | | |
| $ | 9,498,461 | | | Term Loan, 9.07%, Maturing May 7, 2008(2) | | $ | 9,580,090 | | |
| AP-Newkirk Holdings, LLC | | | |
| | 11,656,285 | | | Term Loan, 7.82%, Maturing December 21, 2007 | | | 11,674,503 | | |
| Armstrong World Industries, Inc. | | | |
| | 1,000,000 | | | Term Loan, 7.12%, Maturing October 2, 2013 | | | 1,002,344 | | |
| Biomed Realty, L.P. | | | |
| | 21,175,000 | | | Term Loan, 7.57%, Maturing May 31, 2010 | | | 21,122,062 | | |
| Capital Automotive REIT | | | |
| | 11,328,306 | | | Term Loan, 7.08%, Maturing December 16, 2010 | | | 11,392,470 | | |
| Contech Construction Products | | | |
| | 5,958,333 | | | Term Loan, 7.36%, Maturing January 31, 2013 | | | 5,989,990 | | |
| DMB / CH II, LLC | | | |
| | 1,200,000 | | | Term Loan, 7.82%, Maturing September 9, 2009 | | | 1,203,000 | | |
| Empire Hawkeye Partners, L.P. | | | |
| | 12,000,000 | | | Term Loan, 6.97%, Maturing December 1, 2009(2) | | | 11,970,000 | | |
| Epco / Fantome, LLC | | | |
| | 10,750,000 | | | Term Loan, 8.37%, Maturing November 23, 2010 | | | 10,803,750 | | |
| Formica Corp. | | | |
| EUR | 2,504,825 | | | Term Loan, 6.36%, Maturing March 15, 2013 | | | 3,209,022 | | |
| | 5,472,500 | | | Term Loan, 8.49%, Maturing March 15, 2013 | | | 5,470,793 | | |
| FT-FIN Acquisition, LLC | | | |
| | 7,831,703 | | | Term Loan, 7.06%, Maturing November 17, 2007(2) | | | 7,851,282 | | |
| Gables GP, Inc. | | | |
| | 721,895 | | | Term Loan, 7.07%, Maturing March 30, 2007 | | | 723,323 | | |
| General Growth Properties, Inc. | | | |
| | 25,500,000 | | | Term Loan, 6.57%, Maturing February 24, 2010 | | | 25,352,890 | | |
| Hearthstone Housing Partners II, LLC | | | |
| | 30,000,000 | | | Revolving Loan, 7.32%,
Maturing December 1, 2007(2) | | | 29,925,000 | | |
See notes to financial statements
18
Floating Rate Portfolio as of October 31, 2006
PORTFOLIO OF INVESTMENTS CONT'D
Principal
Amount | | Borrower/Tranche Description | | Value | |
| Building and Development (continued) | | | |
| Hovstone Holdings, LLC | | | |
| $ | 8,520,000 | | | Term Loan, 7.37%, Maturing February 28, 2009 | | $ | 8,392,200 | | |
| Kyle Acquisition Group, LLC | | | |
| | 86,795 | | | Term Loan, 8.25%, Maturing July 20, 2008 | | | 86,687 | | |
| | 3,268,843 | | | Term Loan, 8.25%, Maturing July 20, 2010 | | | 3,268,843 | | |
| Landsource Communities, LLC | | | |
| | 18,000,000 | | | Term Loan, 7.88%, Maturing March 31, 2010 | | | 17,688,744 | | |
| Lanoga Corp. | | | |
| | 9,775,500 | | | Term Loan, 7.12%, Maturing June 29, 2013 | | | 9,759,204 | | |
| LNR Property Corp. | | | |
| | 22,175,000 | | | Term Loan, 8.22%, Maturing July 12, 2011 | | | 22,283,569 | | |
| MAAX Corp. | | | |
| | 6,443,722 | | | Term Loan, 8.38%, Maturing June 4, 2011 | | | 6,411,503 | | |
| Materis | | | |
| EUR | 1,695,089 | | | Term Loan, 5.93%, Maturing April 27, 2014 | | | 2,191,923 | | |
| EUR | 1,804,911 | | | Term Loan, 6.30%, Maturing April 27, 2015 | | | 2,343,373 | | |
| Mattamy Funding Partnership | | | |
| | 3,640,875 | | | Term Loan, 7.69%, Maturing April 11, 2013 | | | 3,629,497 | | |
| Mueller Group, Inc. | | | |
| | 13,323,513 | | | Term Loan, 7.39%, Maturing October 3, 2012 | | | 13,413,727 | | |
| NCI Building Systems, Inc. | | | |
| | 9,417,430 | | | Term Loan, 6.84%, Maturing May 3, 2010 | | | 9,423,316 | | |
| Newkirk Master, L.P. | | | |
| | 21,727,465 | | | Term Loan, 7.07%, Maturing August 11, 2008 | | | 21,761,424 | | |
| Nortek, Inc. | | | |
| | 21,109,188 | | | Term Loan, 7.32%, Maturing August 27, 2011 | | | 21,082,801 | | |
| November 2005 Land Investors | | | |
| | 1,990,000 | | | Term Loan, 8.12%, Maturing May 9, 2011 | | | 1,930,300 | | |
| Panolam Industries Holdings, Inc. | | | |
| | 4,474,721 | | | Term Loan, 8.12%, Maturing September 30, 2012 | | | 4,497,095 | | |
| Ply Gem Industries, Inc. | | | |
| | 12,213,625 | | | Term Loan, 8.40%, Maturing August 15, 2011 | | | 12,205,991 | | |
| Ristretto Investissements SAS | | | |
| EUR | 1,232,601 | | | Term Loan, 5.76%, Maturing September 30, 2013 | | | 1,589,356 | | |
| GBP | 523,980 | | | Term Loan, 7.45%, Maturing September 30, 2013 | | | 1,009,355 | | |
| EUR | 1,232,601 | | | Term Loan, 6.13%, Maturing September 30, 2014 | | | 1,597,222 | | |
| GBP | 523,980 | | | Term Loan, 7.82%, Maturing September 30, 2014 | | | 1,013,519 | | |
| Rubicon GSA II, LLC | | | |
| | 19,075,000 | | | Term Loan, 8.07%, Maturing July 31, 2008 | | | 19,075,000 | | |
| Shea Capital I, LLC | | | |
| | 1,625,000 | | | Term Loan, 7.35%, Maturing October 27, 2011 | | | 1,576,250 | | |
| South Edge, LLC | | | |
| | 4,261,607 | | | Term Loan, 7.13%, Maturing October 31, 2007 | | | 4,160,394 | | |
| | 8,794,643 | | | Term Loan, 7.38%, Maturing October 31, 2009 | | | 8,585,770 | | |
Principal
Amount | | Borrower/Tranche Description | | Value | |
| Building and Development (continued) | | | |
| Standard Pacific Corp. | | | |
| $ | 5,200,000 | | | Term Loan, 6.93%, Maturing May 5, 2013 | | $ | 5,109,000 | | |
| Stile Acquisition Corp. | | | |
| | 19,655,386 | | | Term Loan, 7.38%, Maturing April 6, 2013 | | | 19,245,394 | | |
| Stile U.S. Acquisition Corp. | | | |
| | 19,685,514 | | | Term Loan, 7.38%, Maturing April 6, 2013 | | | 19,274,894 | | |
| TE / Tousa Senior, LLC | | | |
| | 8,389,406 | | | Term Loan, 8.25%, Maturing August 1, 2008 | | | 6,455,648 | | |
| | 3,000,000 | | | Revolving Loan, 9.75%, Maturing August 1, 2008(2) | | | 2,265,000 | | |
| The Woodlands Commercial Property, Inc. | | | |
| | 9,825,000 | | | Term Loan, 7.35%, Maturing August 29, 2009 | | | 9,837,281 | | |
| Tousa / Kolter, LLC | | | |
| | 12,620,000 | | | Term Loan, 6.60%, Maturing January 7, 2008(2) | | | 12,635,775 | | |
| TRU 2005 RE Holding Co. | | | |
| | 29,325,000 | | | Term Loan, 8.32%, Maturing December 9, 2008 | | | 29,416,641 | | |
| Trustreet Properties, Inc. | | | |
| | 10,050,000 | | | Term Loan, 7.32%, Maturing April 8, 2010 | | | 10,075,125 | | |
| United Subcontractors, Inc. | | | |
| | 5,925,000 | | | Term Loan, 12.86%, Maturing June 27, 2013 | | | 5,747,250 | | |
| WCI Communities, Inc. | | | |
| | 28,625,000 | | | Term Loan, 7.32%, Maturing December 23, 2010 | | | 27,649,975 | | |
| | | | | | | $ | 503,959,565 | | |
| Business Equipment and Services — 5.9% | | | |
| Acco Brands Corp. | | | |
| $ | 5,743,764 | | | Term Loan, 7.14%, Maturing August 17, 2012 | | $ | 5,768,893 | | |
| Activant Solutions, Inc. | | | |
| | 5,746,125 | | | Term Loan, 7.50%, Maturing May 1, 2013 | | | 5,717,394 | | |
| Acxiom Corp. | | | |
| | 11,800,000 | | | Term Loan, 7.09%, Maturing September 15, 2012 | | | 11,877,443 | | |
| Affiliated Computer Services | | | |
| | 6,054,250 | | | Term Loan, 7.39%, Maturing March 20, 2013 | | | 6,072,219 | | |
| | 17,107,125 | | | Term Loan, 7.40%, Maturing March 20, 2013 | | | 17,156,291 | | |
| Affinion Group, Inc. | | | |
| | 16,796,075 | | | Term Loan, 8.17%, Maturing October 17, 2012 | | | 16,908,928 | | |
| Allied Security Holdings, LLC | | | |
| | 10,203,409 | | | Term Loan, 8.37%, Maturing June 30, 2010 | | | 10,292,689 | | |
| Audatex North America, Inc. | | | |
| EUR | 2,000,000 | | | Term Loan, 9.13%, Maturing January 13, 2013 | | | 2,614,126 | | |
| EUR | 1,995,000 | | | Term Loan, 5.75%, Maturing April 13, 2013 | | | 2,569,660 | | |
| BSG Clearing Solutions GmbH | | | |
| EUR | 1,950,000 | | | Term Loan, 5.74%, Maturing May 5, 2012 | | | 2,501,327 | | |
| Buhrmann US, Inc. | | | |
| EUR | 989,873 | | | Term Loan, 5.08%, Maturing December 23, 2010 | | | 1,280,797 | | |
| | 10,778,399 | | | Term Loan, 7.18%, Maturing December 23, 2010 | | | 10,812,081 | | |
See notes to financial statements
19
Floating Rate Portfolio as of October 31, 2006
PORTFOLIO OF INVESTMENTS CONT'D
Principal
Amount | | Borrower/Tranche Description | | Value | |
| Business Equipment and Services (continued) | | | |
| DynCorp International, LLC | | | |
| $ | 8,012,975 | | | Term Loan, 7.75%, Maturing February 11, 2011 | | $ | 8,063,056 | | |
| Education Management, LLC | | | |
| | 11,970,000 | | | Term Loan, 7.88%, Maturing June 1, 2013 | | | 12,065,760 | | |
| Gate Gourmet Borrower, LLC | | | |
| | 3,982,222 | | | Term Loan, 8.12%, Maturing March 9, 2012 | | | 4,028,622 | | |
| EUR | 8,126,390 | | | Term Loan, 6.13%, Maturing March 9, 2013 | | | 10,511,499 | | |
| Info USA, Inc. | | | |
| | 4,416,625 | | | Term Loan, 7.07%, Maturing February 14, 2012 | | | 4,411,104 | | |
| Iron Mountain, Inc. | | | |
| | 19,953,750 | | | Term Loan, 7.09%, Maturing April 2, 2011 | | | 20,011,955 | | |
| | 19,715,223 | | | Term Loan, 7.16%, Maturing April 2, 2011 | | | 19,764,511 | | |
| La Petite Academy, Inc. | | | |
| | 1,000,000 | | | Term Loan, 12.61%, Maturing August 15, 2013 | | | 1,012,500 | | |
| Language Line, Inc. | | | |
| | 11,181,803 | | | Term Loan, 9.63%, Maturing June 10, 2011 | | | 11,263,922 | | |
| Mitchell International, Inc. | | | |
| | 7,153,386 | | | Term Loan, 7.37%, Maturing August 15, 2011 | | | 7,180,211 | | |
| N.E.W. Holdings I, LLC | | | |
| | 7,082,250 | | | Term Loan, 8.11%, Maturing August 8, 2013 | | | 7,128,731 | | |
| Nielsen Finance, LLC | | | |
| | 55,950,000 | | | Term Loan, 8.19%, Maturing August 9, 2013 | | | 56,216,658 | | |
| Protection One, Inc. | | | |
| | 8,412,410 | | | Term Loan, 7.86%, Maturing March 31, 2012 | | | 8,449,214 | | |
| Quantum Corp. | | | |
| | 3,000,000 | | | Term Loan, 9.44%, Maturing August 22, 2012 | | | 3,003,750 | | |
| Quintiles Transnational Corp. | | | |
| | 13,407,625 | | | Term Loan, 7.37%, Maturing March 31, 2013 | | | 13,422,709 | | |
| RGIS Holdings, LLC | | | |
| | 8,238,394 | | | Term Loan, 7.87%, Maturing February 15, 2013 | | | 8,235,823 | | |
| Serena Software, Inc. | | | |
| | 4,125,000 | | | Term Loan, 7.62%, Maturing March 10, 2013 | | | 4,131,703 | | |
| SS&C Technologies, Inc. | | | |
| | 435,419 | | | Term Loan, 8.00%, Maturing November 23, 2012 | | | 438,141 | | |
| | 5,122,581 | | | Term Loan, 8.00%, Maturing November 28, 2012 | | | 5,154,597 | | |
| Sungard Data Systems, Inc. | | | |
| | 88,224,409 | | | Term Loan, 8.00%, Maturing February 11, 2013 | | | 89,158,088 | | |
| TDS Investor Corp. | | | |
| EUR | 2,000,000 | | | Term Loan, 6.13%, Maturing August 23, 2013 | | | 2,560,412 | | |
| | 22,450,678 | | | Term Loan, 8.37%, Maturing August 23, 2013 | | | 22,546,902 | | |
| | 2,199,322 | | | Term Loan, 8.37%, Maturing August 23, 2013 | | | 2,208,748 | | |
| Transaction Network Services, Inc. | | | |
| | 5,448,918 | | | Term Loan, 7.39%, Maturing May 4, 2012 | | | 5,448,918 | | |
Principal
Amount | | Borrower/Tranche Description | | Value | |
| Business Equipment and Services (continued) | | | |
| US Investigations Services, Inc. | | | |
| $ | 6,531,652 | | | Term Loan, 7.89%, Maturing October 14, 2012 | | $ | 6,568,392 | | |
| | 3,857,377 | | | Term Loan, 7.89%, Maturing October 14, 2012 | | | 3,876,664 | | |
| Western Inventory Services | | | |
| | 1,457,449 | | | Term Loan, 7.86%, Maturing March 31, 2011 | | | 1,464,736 | | |
| | 1,661,492 | | | Term Loan, 7.87%, Maturing March 31, 2011 | | | 1,669,799 | | |
| Williams Scotsman, Inc. | | | |
| | 6,750,000 | | | Term Loan, 6.82%, Maturing June 27, 2010 | | | 6,733,125 | | |
| | | | | | | $ | 440,302,098 | | |
| Cable and Satellite Television — 5.4% | | | |
| Atlantic Broadband Finance, LLC | | | |
| $ | 9,898,586 | | | Term Loan, 8.14%, Maturing February 1, 2011 | | $ | 10,034,692 | | |
| Bragg Communications, Inc. | | | |
| | 7,569,775 | | | Term Loan, 7.08%, Maturing August 31, 2011 | | | 7,588,700 | | |
| Bresnan Broadband Holdings, LLC | | | |
| | 13,650,000 | | | Term Loan, 7.16%, Maturing March 29, 2014 | | | 13,645,741 | | |
| | | Cablecom Luxembourg SCA | |
| CHF | 12,500,000 | | | Term Loan, 4.20%, Maturing September 28, 2012 | | | 10,047,564 | | |
| Charter Communications Operating, LLC | | | |
| | 81,463,117 | | | Term Loan, 8.01%, Maturing April 28, 2013 | | | 82,257,382 | | |
| CSC Holdings, Inc. | | | |
| | 5,000,000 | | | Term Loan, 6.65%, Maturing March 29, 2012 | | | 4,987,760 | | |
| | 22,862,619 | | | Term Loan, 7.15%, Maturing March 29, 2013 | | | 22,871,810 | | |
| Insight Midwest Holdings, LLC | | | |
| | 10,737,500 | | | Term Loan, 0.00%, Maturing April 7, 2014(2) | | | 10,822,219 | | |
| | 32,212,500 | | | Term Loan, 7.57%, Maturing April 7, 2014 | | | 32,466,657 | | |
| Kabel Deutschland GmbH | | | |
| EUR | 15,600,000 | | | Term Loan, 5.38%, Maturing March 31, 2012 | | | 19,952,833 | | |
| MCC Iowa, LLC | | | |
| | 2,083,563 | | | Term Loan, 6.50%, Maturing March 31, 2010 | | | 2,049,488 | | |
| Mediacom Broadband Group | | | |
| | 14,464,877 | | | Term Loan, 6.98%, Maturing January 31, 2015 | | | 14,424,202 | | |
| | 8,000,000 | | | Term Loan, 7.38%, Maturing January 31, 2015 | | | 7,981,664 | | |
| Mediacom Illinois, LLC | | | |
| | 2,000,000 | | | Term Loan, 6.72%, Maturing September 30, 2012 | | | 1,966,608 | | |
| | 18,614,375 | | | Term Loan, 7.22%, Maturing January 31, 2015 | | | 18,588,613 | | |
| NTL Investment Holdings, Ltd. | | | |
| GBP | 4,095,825 | | | Term Loan, 7.07%, Maturing March 30, 2012 | | | 7,806,349 | | |
| GBP | 3,504,175 | | | Term Loan, 7.07%, Maturing March 30, 2012 | | | 6,678,706 | | |
| | 9,000,000 | | | Term Loan, 7.32%, Maturing March 30, 2012 | | | 9,056,250 | | |
| GBP | 3,500,000 | | | Term Loan, 7.64%, Maturing March 30, 2013 | | | 6,767,161 | | |
See notes to financial statements
20
Floating Rate Portfolio as of October 31, 2006
PORTFOLIO OF INVESTMENTS CONT'D
Principal
Amount | | Borrower/Tranche Description | | Value | |
| Cable and Satellite Television (continued) | | | |
| Persona Communications Corp. | | | |
| $ | 2,854,178 | | | Term Loan, 0.00%, Maturing October 12, 2013(2) | | $ | 2,872,016 | | |
| | 4,595,822 | | | Term Loan, 8.12%, Maturing October 12, 2013 | | | 4,624,546 | | |
| | 2,000,000 | | | Term Loan, 11.37%, Maturing April 12, 2014 | | | 2,012,500 | | |
| PKS Media (Netherlands) B.V. | | | |
| EUR | 1,930,000 | | | Term Loan, 5.24%, Maturing October 5, 2012 | | | 2,472,233 | | |
| EUR | 4,000,000 | | | Term Loan, 5.74%, Maturing October 5, 2013 | | | 5,178,280 | | |
| EUR | 4,000,000 | | | Term Loan, 6.24%, Maturing October 5, 2014 | | | 5,202,617 | | |
| San Juan Cable, LLC | | | |
| | 992,500 | | | Term Loan, 7.39%, Maturing October 31, 2012 | | | 995,292 | | |
| UGS Corp. | | | |
| | 24,886,750 | | | Term Loan, 7.13%, Maturing March 31, 2012 | | | 24,891,926 | | |
| UPC Broadband Holding B.V. | | | |
| EUR | 5,609,167 | | | Term Loan, 5.51%, Maturing March 31, 2013 | | | 7,167,078 | | |
| | 6,545,000 | | | Term Loan, 7.64%, Maturing March 31, 2013 | | | 6,552,887 | | |
| EUR | 6,350,000 | | | Term Loan, 5.51%, Maturing December 31, 2013 | | | 8,114,889 | | |
| | 6,545,000 | | | Term Loan, 7.64%, Maturing December 31, 2013 | | | 6,551,722 | | |
| Ypso Holding SA | | | |
| EUR | 30,000,000 | | | Term Loan, 5.84%, Maturing July 28, 2014 | | | 37,534,952 | | |
| | | | | | | $ | 404,165,337 | | |
| Chemicals and Plastics — 6.9% | | | |
| Basell Af S.A.R.L. | | | |
| EUR | 961,538 | | | Term Loan, 5.69%, Maturing September 20, 2013 | | $ | 1,240,108 | | |
| EUR | 538,462 | | | Term Loan, 5.78%, Maturing September 20, 2013 | | | 694,460 | | |
| | 1,000,000 | | | Term Loan, 7.60%, Maturing August 1, 2013 | | | 1,013,125 | | |
| EUR | 961,538 | | | Term Loan, 6.43%, Maturing August 1, 2014 | | | 1,245,764 | | |
| EUR | 538,462 | | | Term Loan, 6.52%, Maturing August 1, 2014 | | | 697,628 | | |
| | 833,333 | | | Term Loan, 8.35%, Maturing August 1, 2014 | | | 844,271 | | |
| | 166,667 | | | Term Loan, 8.35%, Maturing August 1, 2014 | | | 168,854 | | |
| Brenntag Holding GmbH and Co. KG | | | |
| EUR | 5,294,118 | | | Term Loan, 6.03%, Maturing January 18, 2014 | | | 6,852,470 | | |
| EUR | 1,500,000 | | | Term Loan, 6.14%, Maturing December 23, 2013 | | | 1,936,338 | | |
| | 10,000,000 | | | Term Loan, 8.08%, Maturing December 23, 2013 | | | 10,102,454 | | |
| EUR | 2,205,882 | | | Term Loan, 6.28%, Maturing January 18, 2015 | | | 2,875,132 | | |
| GBP | 2,000,000 | | | Term Loan, 7.59%, Maturing December 23, 2013 | | | 3,859,004 | | |
| EUR | 1,000,000 | | | Term Loan, 9.58%, Maturing June 23, 2015 | | | 1,309,854 | | |
| Celanese Holdings, LLC | | | |
| | 7,250,000 | | | Term Loan, 5.32%, Maturing April 6, 2009 | | | 7,310,414 | | |
| | 25,472,653 | | | Term Loan, 7.37%, Maturing April 6, 2011 | | | 25,645,510 | | |
| Columbian Chemical Acquisition | | | |
| | 4,700,000 | | | Term Loan, 7.12%, Maturing March 16, 2013 | | | 4,700,000 | | |
| Ferro Corp. | | | |
| | 24,000,000 | | | Term Loan, 8.57%, Maturing June 6, 2012(2) | | | 24,022,512 | | |
Principal
Amount | | Borrower/Tranche Description | | Value | |
| Chemicals and Plastics (continued) | | | |
| Gentek, Inc. | | | |
| $ | 4,144,492 | | | Term Loan, 7.37%, Maturing February 28, 2011 | | $ | 4,167,805 | | |
| Georgia Gulf Corp. | | | |
| | 12,150,000 | | | Term Loan, 7.32%, Maturing October 3, 2013 | | | 12,223,410 | | |
| Hercules, Inc. | | | |
| | 9,948,645 | | | Term Loan, 6.87%, Maturing October 8, 2010 | | | 9,962,324 | | |
| Hexion Specialty Chemicals, Inc. | | | |
| | 10,000,000 | | | Term Loan, 5.23%, Maturing May 5, 2013 | | | 9,986,610 | | |
| | 4,588,347 | | | Term Loan, 7.37%, Maturing May 5, 2013 | | | 4,582,203 | | |
| | 21,122,216 | | | Term Loan, 7.38%, Maturing May 5, 2013 | | | 21,093,933 | | |
| Huntsman, LLC | | | |
| EUR | 3,648,000 | | | Term Loan, 5.36%, Maturing August 26, 2012 | | | 4,650,305 | | |
| | 37,812,531 | | | Term Loan, 7.07%, Maturing August 16, 2012 | | | 37,836,202 | | |
| Ineos Group | | | |
| EUR | 3,000,000 | | | Term Loan, 6.03%, Maturing December 14, 2011 | | | 3,866,893 | | |
| EUR | 3,000,000 | | | Term Loan, 6.53%, Maturing December 14, 2011 | | | 3,883,644 | | |
| EUR | 2,000,000 | | | Term Loan, 7.28%, Maturing December 14, 2012 | | | 2,598,490 | | |
| | 7,050,000 | | | Term Loan, 7.61%, Maturing December 14, 2012 | | | 7,107,281 | | |
| | 6,525,000 | | | Term Loan, 7.61%, Maturing December 14, 2013 | | | 6,611,319 | | |
| | 6,525,000 | | | Term Loan, 8.11%, Maturing December 14, 2014 | | | 6,611,319 | | |
| Innophos, Inc. | | | |
| | 10,035,729 | | | Term Loan, 7.57%, Maturing August 13, 2010 | | | 10,082,777 | | |
| Invista B.V. | | | |
| | 3,771,500 | | | Term Loan, 6.88%, Maturing April 30, 2010 | | | 3,747,928 | | |
| | 10,371,760 | | | Term Loan, 6.88%, Maturing April 29, 2011 | | | 10,375,006 | | |
| | 6,377,424 | | | Term Loan, 6.88%, Maturing April 29, 2011 | | | 6,379,420 | | |
| ISP Chemo, Inc. | | | |
| | 20,301,741 | | | Term Loan, 7.45%, Maturing February 15, 2013 | | | 20,392,368 | | |
| Kranton Polymers, LLC | | | |
| | 13,765,323 | | | Term Loan, 7.38%, Maturing May 12, 2013 | | | 13,825,546 | | |
| Lucite International Group Holdings | | | |
| | 1,712,977 | | | Term Loan, 0.00%, Maturing July 7, 2013(2) | | | 1,727,452 | | |
| | 4,874,805 | | | Term Loan, 8.07%, Maturing July 7, 2013 | | | 4,915,997 | | |
| Lyondell Chemical Co. | | | |
| | 31,700,000 | | | Term Loan, 7.11%, Maturing August 16, 2013 | | | 31,901,422 | | |
| Mosaic Co. | | | |
| | 14,905,980 | | | Term Loan, 6.99%, Maturing February 21, 2012 | | | 14,917,160 | | |
| Nalco Co. | | | |
| | 29,485,604 | | | Term Loan, 7.16%, Maturing November 4, 2010 | | | 29,602,869 | | |
| PQ Corp. | | | |
| | 12,475,697 | | | Term Loan, 7.38%, Maturing February 10, 2012 | | | 12,530,279 | | |
| Professional Paint, Inc. | | | |
| | 5,610,938 | | | Term Loan, 7.63%, Maturing May 31, 2012 | | | 5,621,458 | | |
| Propex Fabrics, Inc. | | | |
| | 6,686,203 | | | Term Loan, 7.63%, Maturing July 31, 2012 | | | 6,702,919 | | |
See notes to financial statements
21
Floating Rate Portfolio as of October 31, 2006
PORTFOLIO OF INVESTMENTS CONT'D
Principal
Amount | | Borrower/Tranche Description | | Value | |
| Chemicals and Plastics (continued) | | | |
| Rockwood Specialties Group, Inc. | | | |
| EUR | 3,026,277 | | | Term Loan, 5.81%, Maturing July 30, 2011 | | $ | 3,858,969 | | |
| | 27,526,024 | | | Term Loan, 7.38%, Maturing December 10, 2012 | | | 27,687,739 | | |
| Sigmakalon (BC) Holdco B.V. | | | |
| EUR | 9,000,000 | | | Term Loan, 5.99%, Maturing September 9, 2013 | | | 11,578,048 | | |
| EUR | 8,724,586 | | | Term Loan, 6.49%, Maturing September 9, 2014 | | | 11,270,172 | | |
| GBP | 183,030 | | | Term Loan, 8.08%, Maturing September 9, 2014 | | | 352,575 | | |
| Solo Cup Co. | | | |
| | 19,519,640 | | | Term Loan, 8.61%, Maturing February 27, 2011 | | | 19,643,160 | | |
| | 2,675,000 | | | Term Loan, 11.37%, Maturing March 31, 2012 | | | 2,745,219 | | |
| Solutia, Inc. | | | |
| | 5,550,000 | | | DIP Loan, 8.96%, Maturing March 31, 2007 | | | 5,570,812 | | |
| TPG Spring UK, Ltd. | | | |
| EUR | 8,713,441 | | | Term Loan, 6.12%, Maturing June 27, 2013 | | | 11,142,721 | | |
| EUR | 8,713,441 | | | Term Loan, 6.62%, Maturing June 27, 2013 | | | 11,181,646 | | |
| Wellman, Inc. | | | |
| | 6,250,000 | | | Term Loan, 9.49%, Maturing February 10, 2009 | | | 6,283,206 | | |
| | | | | | | $ | 513,736,504 | | |
| Clothing / Textiles — 0.5% | | | |
| Hanesbrands, Inc. | | | |
| $ | 16,000,000 | | | Term Loan, 7.68%, Maturing September 5, 2013 | | $ | 16,156,000 | | |
| | 5,000,000 | | | Term Loan, 9.19%, Maturing March 5, 2014 | | | 5,132,145 | | |
| St. John Knits International, Inc. | | | |
| | 3,964,412 | | | Term Loan, 9.32%, Maturing March 23, 2012 | | | 3,944,590 | | |
| The William Carter Co. | | | |
| | 4,989,815 | | | Term Loan, 6.87%, Maturing July 14, 2012 | | | 4,987,475 | | |
| Warnaco, Inc. | | | |
| | 5,397,875 | | | Term Loan, 6.97%, Maturing January 31, 2013 | | | 5,377,633 | | |
| | | | | | | $ | 35,597,843 | | |
| Conglomerates — 2.5% | | | |
| American Greetings Corp. | | | |
| $ | 13,500,000 | | | Term Loan, 0.00%, Maturing April 4, 2013(2) | | $ | 13,470,475 | | |
| Amsted Industries, Inc. | | | |
| | 12,869,478 | | | Term Loan, 7.37%, Maturing April 5, 2013 | | | 12,925,782 | | |
| | 10,500,000 | | | Term Loan, 7.37%, Maturing April 5, 2013(2) | | | 10,368,750 | | |
| Blount, Inc. | | | |
| | 3,601,792 | | | Term Loan, 7.10%, Maturing August 9, 2010 | | | 3,613,047 | | |
| Bushnell Performance Optics | | | |
| | 742,678 | | | Term Loan, 8.37%, Maturing August 19, 2011 | | | 747,320 | | |
| Dundee Holdco 4 Limited | | | |
| EUR | 1,457,800 | | | Term Loan, 6.13%, Maturing February 17, 2014 | | | 1,860,663 | | |
| EUR | 2,186,700 | | | Term Loan, 9.13%, Maturing August 17, 2015 | | | 2,825,882 | | |
Principal
Amount | | Borrower/Tranche Description | | Value | |
| Conglomerates (continued) | | | |
| Dundee Holding, Inc. | | | |
| $ | 2,761,950 | | | Term Loan, 8.07%, Maturing February 17, 2014 | | $ | 2,768,855 | | |
| Euramax International, Inc. | | | |
| | 4,617,639 | | | Term Loan, 8.19%, Maturing June 29, 2012 | | | 4,646,499 | | |
| GBP | 937,321 | | | Term Loan, 7.99%, Maturing June 29, 2012 | | | 1,781,748 | | |
| Goodman Global Holdings, Inc. | | | |
| | 11,287,723 | | | Term Loan, 7.25%, Maturing December 23, 2011 | | | 11,283,016 | | |
| ISS Holdings A/S | | | |
| EUR | 6,510,926 | | | Term Loan, 5.97%, Maturing December 31, 2013 | | | 8,442,012 | | |
| GBP | 5,068,562 | | | Term Loan, 7.68%, Maturing December 31, 2013 | | | 9,778,186 | | |
| Jarden Corp. | | | |
| | 8,151,778 | | | Term Loan, 7.12%, Maturing January 24, 2012 | | | 8,153,816 | | |
| | 20,025,345 | | | Term Loan, 7.37%, Maturing January 24, 2012 | | | 20,086,362 | | |
| Johnson Diversey, Inc. | | | |
| | 2,500,000 | | | Term Loan, 7.83%, Maturing December 16, 2010 | | | 2,516,407 | | |
| | 13,146,136 | | | Term Loan, 7.97%, Maturing December 16, 2011 | | | 13,267,330 | | |
| Platinum 100, Ltd. | | | |
| GBP | 3,000,000 | | | Term Loan, 7.81%, Maturing January 15, 2013 | | | 5,756,853 | | |
| GBP | 3,000,000 | | | Term Loan, 8.31%, Maturing January 15, 2014 | | | 5,778,550 | | |
| Polymer Group, Inc. | | | |
| | 3,000,000 | | | Revolving Loan, 9.50%,
Maturing November 22, 2010(2) | | | 2,940,000 | | |
| | 19,611,850 | | | Term Loan, 7.61%, Maturing November 22, 2012 | | | 19,652,701 | | |
| Rexnord Corp. | | | |
| | 10,900,000 | | | Term Loan, 7.88%, Maturing July 19, 2013 | | | 10,974,937 | | |
| Terex Corp. | | | |
| | 5,685,750 | | | Term Loan, 7.12%, Maturing July 13, 2013 | | | 5,707,072 | | |
| Walter Industries, Inc. | | | |
| | 2,301,374 | | | Term Loan, 7.15%, Maturing October 3, 2012 | | | 2,308,565 | | |
| | | | | | | $ | 181,654,828 | | |
| Containers and Glass Products — 3.7% | | | |
| Berry Plastics Corp. | | | |
| $ | 20,800,000 | | | Term Loan, 7.12%, Maturing September 20, 2013 | | $ | 20,849,400 | | |
| Bluegrass Container Co. | | | |
| | 13,491,187 | | | Term Loan, 7.60%, Maturing June 30, 2013 | | | 13,632,427 | | |
| Consolidated Container Holding | | | |
| | 5,498,438 | | | Term Loan, 8.63%, Maturing December 15, 2008 | | | 5,525,930 | | |
| Crown Americas, Inc. | | | |
| EUR | 4,500,000 | | | Term Loan, 4.86%, Maturing November 15, 2012 | | | 5,739,985 | | |
| | 1,450,000 | | | Term Loan, 7.07%, Maturing November 15, 2012 | | | 1,454,079 | | |
| | 9,950,000 | | | Term Loan, 7.25%, Maturing November 15, 2012 | | | 9,977,989 | | |
See notes to financial statements
22
Floating Rate Portfolio as of October 31, 2006
PORTFOLIO OF INVESTMENTS CONT'D
Principal
Amount | | Borrower/Tranche Description | | Value | |
| Containers and Glass Products (continued) | | | |
| Graham Packaging Holdings Co. | | | |
| $ | 2,711,203 | | | Term Loan, 7.69%, Maturing October 7, 2011 | | $ | 2,727,180 | | |
| | 32,181,983 | | | Term Loan, 7.73%, Maturing October 7, 2011 | | | 32,371,632 | | |
| | 1,071,429 | | | Term Loan, 9.69%, Maturing April 7, 2012 | | | 1,081,809 | | |
| Graphic Packaging International, Inc. | | | |
| | 10,500,000 | | | Revolving Loan, 8.71%, Maturing August 8, 2007(2) | | | 10,276,875 | | |
| | 40,397,298 | | | Term Loan, 7.88%, Maturing August 8, 2010 | | | 40,913,090 | | |
| IPG (US), Inc. | | | |
| | 11,336,457 | | | Term Loan, 7.64%, Maturing July 28, 2011 | | | 11,350,627 | | |
| JSG Acquisitions | | | |
| EUR | 17,250,000 | | | Term Loan, 5.81%, Maturing December 31, 2014 | | | 22,171,707 | | |
| EUR | 17,250,000 | | | Term Loan, 6.26%, Maturing December 31, 2014 | | | 22,270,233 | | |
| OI European Group B.V. | | | |
| EUR | 12,600,000 | | | Term Loan, 5.10%, Maturing June 14, 2013 | | | 16,004,945 | | |
| Owens-Brockway Glass Container | | | |
| | 10,525,000 | | | Term Loan, 7.07%, Maturing June 14, 2013 | | | 10,549,997 | | |
| Picnal Acquisition, Inc. | | | |
| GBP | 1,836,844 | | | Term Loan, 7.84%, Maturing June 30, 2011 | | | 3,504,264 | | |
| GBP | 2,172,616 | | | Term Loan, 8.34%, Maturing June 30, 2012 | | | 4,161,443 | | |
| Pregis Corp. | | | |
| | 2,673,000 | | | Term Loan, 7.62%, Maturing October 12, 2011 | | | 2,694,718 | | |
| Smurfit-Stone Container Corp. | | | |
| | 3,225,483 | | | Term Loan, 4.73%, Maturing November 1, 2010 | | | 3,249,490 | | |
| | 4,600,210 | | | Term Loan, 7.63%, Maturing November 1, 2011 | | | 4,634,450 | | |
| | 16,780,522 | | | Term Loan, 7.66%, Maturing November 1, 2011 | | | 16,905,420 | | |
| | 10,542,434 | | | Term Loan, 7.67%, Maturing November 1, 2011 | | | 10,620,901 | | |
| | | | | | | $ | 272,668,591 | | |
| Cosmetics / Toiletries — 0.4% | | | |
| American Safety Razor Co. | | | |
| $ | 3,491,250 | | | Term Loan, 7.87%, Maturing July 31, 2013 | | $ | 3,534,891 | | |
| Prestige Brands, Inc. | | | |
| | 15,591,968 | | | Term Loan, 7.66%, Maturing April 7, 2011 | | | 15,686,175 | | |
| Revlon Consumer Products Corp. | | | |
| | 6,820,234 | | | Term Loan, 11.44%, Maturing July 9, 2010 | | | 7,002,109 | | |
| | | | | | | $ | 26,223,175 | | |
| Drugs — 0.4% | | | |
| Warner Chilcott Corp. | | | |
| $ | 7,214,629 | | | Term Loan, 7.87%, Maturing January 18, 2012 | | $ | 7,258,212 | | |
| | 21,598,885 | | | Term Loan, 7.93%, Maturing January 18, 2012 | | | 21,737,744 | | |
| | | | | | | $ | 28,995,956 | | |
Principal
Amount | | Borrower/Tranche Description | | Value | |
| Ecological Services and Equipment — 1.7% | | | |
| Alderwoods Group, Inc. | | | |
| $ | 4,459,166 | | | Term Loan, 7.32%, Maturing August 19, 2010 | | $ | 4,465,667 | | |
| Allied Waste Industries, Inc. | | | |
| | 9,113,375 | | | Term Loan, 5.33%, Maturing January 15, 2012 | | | 9,129,041 | | |
| | 26,568,697 | | | Term Loan, 7.15%, Maturing January 15, 2012 | | | 26,608,284 | | |
| AVR Acquisitions B.V. | | | |
| EUR | 3,500,000 | | | Term Loan, 5.88%, Maturing March 31, 2014 | | | 4,544,705 | | |
| EUR | 3,500,000 | | | Term Loan, 5.63%, Maturing March 31, 2015 | | | 4,523,762 | | |
| Casella Waste Systems, Inc. | | | |
| | 3,000,000 | | | Term Loan, 7.46%, Maturing April 28, 2010 | | | 3,007,500 | | |
| Duratek, Inc. | | | |
| | 4,564,792 | | | Term Loan, 7.76%, Maturing June 7, 2013 | | | 4,606,163 | | |
| Energysolutions, LLC | | | |
| | 479,560 | | | Term Loan, 7.57%, Maturing June 7, 2013 | | | 483,906 | | |
| | 10,075,233 | | | Term Loan, 7.76%, Maturing June 7, 2013 | | | 10,166,545 | | |
| Environmental Systems, Inc. | | | |
| | 5,011,748 | | | Term Loan, 8.88%, Maturing December 12, 2008 | | | 5,043,071 | | |
| | 1,000,000 | | | Term Loan, 15.37%, Maturing December 12, 2010 | | | 1,025,000 | | |
| IESI Corp. | | | |
| | 9,267,647 | | | Term Loan, 7.13%, Maturing January 20, 2012 | | | 9,282,132 | | |
| PHS Group PIC | | | |
| GBP | 1,500,000 | | | Term Loan, 7.69%, Maturing December 14, 2010 | | | 2,875,179 | | |
| GBP | 1,500,000 | | | Term Loan, 8.19%, Maturing December 14, 2010 | | | 2,891,629 | | |
| Sensus Metering Systems, Inc. | | | |
| | 3,000,000 | | | Revolving Loan, 0.00%,
Maturing December 17, 2009(2) | | | 2,895,000 | | |
| | 9,164,596 | | | Term Loan, 7.45%, Maturing December 17, 2010 | | | 9,164,596 | | |
| | 1,217,330 | | | Term Loan, 7.50%, Maturing December 17, 2010 | | | 1,217,330 | | |
| Sulo GmbH | | �� | |
| EUR | 7,250,000 | | | Term Loan, 6.12%, Maturing January 19, 2014 | | | 9,352,319 | | |
| EUR | 7,250,000 | | | Term Loan, 6.62%, Maturing January 19, 2015 | | | 9,396,394 | | |
| Synagro Technologies, Inc. | | | |
| | 8,210,000 | | | Term Loan, 7.57%, Maturing June 21, 2012 | | | 8,212,199 | | |
| | | | | | | $ | 128,890,422 | | |
| Electronics / Electrical — 3.1% | | | |
| Advanced Micro Devices, Inc. | | | |
| $ | 21,875,000 | | | Term Loan, 7.57%, Maturing December 31, 2013 | | $ | 21,875,000 | | |
| AMI Semiconductor, Inc. | | | |
| | 7,707,709 | | | Term Loan, 6.82%, Maturing April 1, 2012 | | | 7,683,623 | | |
| Aspect Software, Inc. | | | |
| | 16,100,000 | | | Term Loan, 8.44%, Maturing July 11, 2011 | | | 16,162,387 | | |
| Communications & Power, Inc. | | | |
| | 4,262,060 | | | Term Loan, 7.57%, Maturing July 23, 2010 | | | 4,280,706 | | |
See notes to financial statements
23
Floating Rate Portfolio as of October 31, 2006
PORTFOLIO OF INVESTMENTS CONT'D
Principal
Amount | | Borrower/Tranche Description | | Value | |
| Electronics / Electrical (continued) | | | |
| Enersys Capital, Inc. | | | |
| $ | 10,304,705 | | | Term Loan, 7.45%, Maturing March 17, 2011 | | $ | 10,356,229 | | |
| Fairchild Semiconductor Corp. | | | |
| | 16,533,563 | | | Term Loan, 6.82%, Maturing June 26, 2013 | | | 16,512,896 | | |
| FCI International S.A.S. | | | |
| EUR | 750,000 | | | Term Loan, 5.99%, Maturing November 1, 2013 | | | 972,135 | | |
| | 735,755 | | | Term Loan, 8.33%, Maturing November 1, 2013 | | | 745,872 | | |
| | 764,245 | | | Term Loan, 8.33%, Maturing November 1, 2013 | | | 766,872 | | |
| | 764,245 | | | Term Loan, 8.83%, Maturing November 1, 2013 | | | 770,693 | | |
| | 735,755 | | | Term Loan, 8.83%, Maturing November 1, 2013 | | | 745,872 | | |
| EUR | 750,000 | | | Term Loan, 6.49%, Maturing October 31, 2014 | | | 967,690 | | |
| Ganymed 347 VV GmbH | | | |
| EUR | 494,190 | | | Term Loan, 5.75%, Maturing April 30, 2013 | | | 636,249 | | |
| EUR | 1,005,810 | | | Term Loan, 6.46%, Maturing April 30, 2013 | | | 1,294,936 | | |
| EUR | 494,190 | | | Term Loan, 6.25%, Maturing April 30, 2014 | | | 639,263 | | |
| EUR | 1,005,810 | | | Term Loan, 6.96%, Maturing April 30, 2014 | | EUR | 1,301,071 | | |
| Infor Enterprise Solutions Holdings | | | |
| | 21,258,571 | | | Term Loan, 9.12%, Maturing July 28, 2012 | | | 21,449,006 | | |
| | 11,091,429 | | | Term Loan, 9.12%, Maturing July 28, 2012 | | | 11,190,786 | | |
| Invensys International Holding | | | |
| EUR | 1,001,757 | | | Term Loan, 5.43%, Maturing December 15, 2010 | | | 1,287,383 | | |
| | 2,166,667 | | | Term Loan, 7.45%, Maturing December 15, 2010 | | | 2,176,146 | | |
| | 2,333,333 | | | Term Loan, 7.40%, Maturing January 15, 2011 | | | 2,343,542 | | |
| Network Solutions, LLC | | | |
| | 6,848,250 | | | Term Loan, 10.37%, Maturing January 9, 2012 | | | 6,933,853 | | |
| Open Solutions, Inc. | | | |
| | 8,334,585 | | | Term Loan, 7.90%, Maturing September 30, 2011 | | | 8,381,468 | | |
| Rayovac Corp. | | | |
| | 29,461,073 | | | Term Loan, 8.39%, Maturing February 7, 2012 | | | 29,582,070 | | |
| Securityco, Inc. | | | |
| | 12,477,065 | | | Term Loan, 8.63%, Maturing June 28, 2010 | | | 12,570,643 | | |
| Sensata Technologies Finance Co. | | | |
| | 5,935,125 | | | Term Loan, 7.13%, Maturing April 26, 2013 | | | 5,906,375 | | |
| Spectrum Brands, Inc. | | | |
| EUR | 9,303,777 | | | Term Loan, 6.52%, Maturing February 7, 2012 | | | 11,800,658 | | |
| Symrise Holding GmbH | | | |
| EUR | 1,000,000 | | | Term Loan, 5.88%, Maturing August 12, 2013 | | | 1,281,455 | | |
| EUR | 1,000,000 | | | Term Loan, 6.38%, Maturing August 12, 2014 | | | 1,286,898 | | |
| Telcordia Technologies, Inc. | | | |
| | 19,108,251 | | | Term Loan, 8.15%, Maturing September 15, 2012 | | | 18,427,520 | | |
| Vertafore, Inc. | | | |
| | 1,091,446 | | | Term Loan, 7.89%, Maturing January 31, 2012 | | | 1,098,609 | | |
| | 8,469,621 | | | Term Loan, 7.90%, Maturing January 31, 2012 | | | 8,525,208 | | |
| | | | | | | $ | 229,953,114 | | |
Principal
Amount | | Borrower/Tranche Description | | Value | |
| Equipment Leasing — 1.3% | | | |
| AWAS Capital, Inc. | | | |
| $ | 19,810,666 | | | Term Loan, 7.19%, Maturing March 22, 2013 | | $ | 19,340,162 | | |
| Maxim Crane Works, L.P. | | | |
| | 7,628,102 | | | Term Loan, 7.33%, Maturing January 28, 2010 | | | 7,656,707 | | |
| The Hertz Corp. | | | |
| | 29,500,000 | | | Revolving Loan, 0.00%,
Maturing December 21, 2010(2) | | | 29,456,989 | | |
| | 2,875,000 | | | Term Loan, 5.39%, Maturing December 21, 2012 | | | 2,899,797 | | |
| | 22,842,280 | | | Term Loan, 7.65%, Maturing December 21, 2012 | | | 23,039,294 | | |
| United Rentals, Inc. | | | |
| | 5,212,716 | | | Term Loan, 6.00%, Maturing February 14, 2011 | | | 5,236,064 | | |
| | 11,436,141 | | | Term Loan, 7.32%, Maturing February 14, 2011 | | | 11,487,363 | | |
| | | | | | | $ | 99,116,376 | | |
| Farming / Agriculture — 0.4% | | | |
| BF Bolthouse HoldCo, LLC | | | |
| $ | 6,401,625 | | | Term Loan, 7.63%, Maturing December 17, 2012 | | $ | 6,422,962 | | |
| Central Garden & Pet Co. | | | |
| | 16,969,737 | | | Term Loan, 6.82%, Maturing February 28, 2014 | | | 16,987,420 | | |
| United Agri Products, Inc. | | | |
| | 2,992,500 | | | Term Loan, 7.37%, Maturing June 8, 2012 | | | 2,999,981 | | |
| | | | | | | $ | 26,410,363 | | |
| Financial Intermediaries — 2.4% | | | |
| AIMCO Properties, L.P. | | | |
| $ | 34,718,750 | | | Term Loan, 6.91%, Maturing March 23, 2011 | | $ | 34,805,547 | | |
| Ameritrade Holding Corp. | | | |
| | 24,197,282 | | | Term Loan, 6.82%, Maturing December 31, 2012 | | | 24,214,922 | | |
| Blitz F04-506 GmbH | | | |
| EUR | 1,500,000 | | | Term Loan, 6.35%, Maturing June 30, 2014 | | | 1,944,782 | | |
| Citgo III, Ltd. | | | |
| | 1,725,000 | | | Term Loan, 8.14%, Maturing August 3, 2013 | | | 1,738,477 | | |
| | 1,725,000 | | | Term Loan, 8.64%, Maturing August 3, 2014 | | | 1,744,946 | | |
| Coinstar, Inc. | | | |
| | 8,423,476 | | | Term Loan, 7.37%, Maturing July 7, 2011 | | | 8,481,387 | | |
| E.A. Viner International Co. | | | |
| | 1,496,250 | | | Term Loan, 8.12%, Maturing July 31, 2013 | | | 1,511,212 | | |
| Fidelity National Information Solutions, Inc. | | | |
| | 44,962,700 | | | Term Loan, 7.07%, Maturing March 8, 2013 | | | 45,118,810 | | |
| IPayment, Inc. | | | |
| | 7,114,250 | | | Term Loan, 7.36%, Maturing May 10, 2013 | | | 7,114,250 | | |
| LPL Holdings, Inc. | | | |
| | 25,730,563 | | | Term Loan, 8.30%, Maturing June 30, 2013 | | | 26,056,208 | | |
See notes to financial statements
24
Floating Rate Portfolio as of October 31, 2006
PORTFOLIO OF INVESTMENTS CONT'D
Principal
Amount | | Borrower/Tranche Description | | Value | |
| Financial Intermediaries (continued) | | | |
| Oxford Acquisition III, Ltd. | | | |
| EUR | 1,000,000 | | | Term Loan, 5.72%, Maturing September 20, 2013 | | $ | 1,293,235 | | |
| $ | 10,025,000 | | | Term loan, 7.69%, Maturing September 20, 2013 | | | 10,111,155 | | |
| The Macerich Partnership, L.P. | | | |
| | 11,280,000 | | | Term Loan, 6.88%, Maturing April 26, 2010 | | | 11,258,850 | | |
| | | | | | | $ | 175,393,781 | | |
| Food Products — 2.4% | | | |
| Acosta, Inc. | | | |
| $ | 17,955,000 | | | Term Loan, 8.08%, Maturing July 28, 2013 | | $ | 18,138,285 | | |
| American Seafoods Group, LLC | | | |
| | 3,991,434 | | | Term Loan, 7.12%, Maturing September 28, 2012 | | | 3,990,189 | | |
| BL Marketing, Ltd. | | | |
| GBP | 2,200,000 | | | Term Loan, 7.75%, Maturing December 20, 2013 | | | 4,257,840 | | |
| GBP | 2,200,000 | | | Term Loan, 8.25%, Maturing December 20, 2014 | | | 4,277,007 | | |
| GBP | 2,500,000 | | | Term Loan, 9.63%, Maturing June 30, 2015 | | | 4,895,844 | | |
| Black Lion Beverages III B.V. | | | |
| EUR | 1,500,000 | | | Term Loan, 6.06%, Maturing December 31, 2013 | | | 1,937,444 | | |
| EUR | 1,500,000 | | | Term Loan, 6.17%, Maturing December 31, 2014 | | | 1,945,469 | | |
| EUR | 3,000,000 | | | Term Loan, 8.31%, Maturing January 30, 2015 | | | 3,910,019 | | |
| Bumble Bee Seafood, LLC | | | |
| | 3,000,000 | | | Term Loan, 7.15%, Maturing May 2, 2012 | | | 3,000,000 | | |
| Charden International B.V. | | | |
| EUR | 1,000,000 | | | Term Loan, 6.06%, Maturing March 14, 2014 | | | 1,278,876 | | |
| EUR | 1,000,000 | | | Term Loan, 6.56%, Maturing March 14, 2015 | | | 1,284,327 | | |
| EUR | 1,500,000 | | | Term Loan, 9.06%, Maturing March 14, 2016 | | | 1,924,496 | | |
| Chiquita Brands, LLC | | | |
| | 9,635,761 | | | Term Loan, 7.62%, Maturing June 28, 2012 | | | 9,637,264 | | |
| Del Monte Corp. | | | |
| | 5,729,928 | | | Term Loan, 6.95%, Maturing February 8, 2012 | | | 5,745,279 | | |
| Dole Food Company, Inc. | | | |
| | 1,190,698 | | | Term Loan, 5.24%, Maturing April 12, 2013 | | | 1,183,256 | | |
| | 8,885,581 | | | Term Loan, 7.47%, Maturing April 12, 2013 | | | 8,830,047 | | |
| | 2,665,674 | | | Term Loan, 7.55%, Maturing April 12, 2013 | | | 2,649,014 | | |
| Foodvest Limited | | | |
| EUR | 632,918 | | | Term Loan, 5.57%, Maturing March 16, 2014 | | | 815,146 | | |
| GBP | 437,500 | | | Term Loan, 7.55%, Maturing March 16, 2014 | | | 839,289 | | |
| EUR | 632,918 | | | Term Loan, 6.07%, Maturing March 16, 2015 | | | 819,185 | | |
| GBP | 437,500 | | | Term Loan, 8.05%, Maturing March 16, 2015 | | | 843,461 | | |
| GBP | 500,000 | | | Term Loan, 7.55%, Maturing September 16, 2015 | | | 972,697 | | |
| Michael Foods, Inc. | | | |
| | 18,483,554 | | | Term Loan, 7.54%, Maturing November 21, 2010 | | | 18,525,918 | | |
| Nash-Finch Co. | | | |
| | 6,120,000 | | | Term Loan, 7.63%, Maturing November 12, 2010 | | | 6,131,475 | | |
Principal
Amount | | Borrower/Tranche Description | | Value | |
| Food Products (continued) | | | |
| Nutro Products, Inc. | | | |
| $ | 3,631,750 | | | Term Loan, 7.37%, Maturing April 26, 2013 | | $ | 3,640,829 | | |
| Picard Surgeles S.A. | | | |
| EUR | 6,500,000 | | | Term Loan, 5.44%, Maturing June 4, 2014 | | | 8,364,719 | | |
| Pinnacle Foods Holdings Corp. | | | |
| | 1,000,000 | | | Revolving Loan, 0.00%,
Maturing November 25, 2009(2) | | | 972,500 | | |
| | 26,043,685 | | | Term Loan, 7.37%, Maturing November 25, 2010 | | | 26,118,561 | | |
| QCE Finance, LLC | | | |
| | 9,177,000 | | | Term Loan, 7.63%, Maturing May 5, 2013 | | | 9,160,610 | | |
| Reddy Ice Group, Inc. | | | |
| | 14,335,000 | | | Term Loan, 7.12%, Maturing August 12, 2012 | | | 14,352,919 | | |
| Ruby Acquisitions, Ltd. | | | |
| GBP | 2,539,204 | | | Term Loan, 7.66%, Maturing January 1, 2015 | | | 4,897,379 | | |
| United Biscuits, Ltd. | | | |
| GBP | 1,547,559 | | | Term Loan, 9.37%, Maturing January 14, 2011 | | | 2,971,873 | | |
| | | | | | | $ | 178,311,217 | | |
| Food Service — 2.0% | | | |
| AFC Enterprises, Inc. | | | |
| $ | 3,540,071 | | | Term Loan, 7.63%, Maturing May 11, 2011 | | $ | 3,557,771 | | |
| Buffets, Inc. | | | |
| | 227,273 | | | Term Loan, 4.88%, Maturing June 28, 2009 | | | 228,125 | | |
| | 9,637,119 | | | Term Loan, 10.75%, Maturing June 28, 2009 | | | 9,673,258 | | |
| Burger King Corp. | | | |
| | 7,254,573 | | | Term Loan, 6.88%, Maturing June 30, 2012 | | | 7,259,608 | | |
| Carrols Corp. | | | |
| | 11,433,788 | | | Term Loan, 7.88%, Maturing December 31, 2010 | | | 11,488,099 | | |
| CBRL Group, Inc. | | | |
| | 3,882,759 | | | Term Loan, 0.00%, Maturing April 27, 2013(2) | | | 3,862,133 | | |
| | 10,757,560 | | | Term Loan, 6.93%, Maturing April 27, 2013 | | | 10,741,424 | | |
| CKE Restaurants, Inc. | | | |
| | 3,104,522 | | | Term Loan, 7.38%, Maturing May 1, 2010 | | | 3,116,164 | | |
| Denny's, Inc. | | | |
| | 5,496,518 | | | Term Loan, 8.59%, Maturing September 21, 2009 | | | 5,519,422 | | |
| Domino's, Inc. | | | |
| | 6,592,593 | | | Revolving Loan, 0.00%, Maturing June 25, 2009(2) | | | 6,460,741 | | |
| | 34,498,921 | | | Term Loan, 6.88%, Maturing June 25, 2010 | | | 34,527,659 | | |
| Elior Sca | | | |
| EUR | 701,754 | | | Term Loan, 5.76%, Maturing June 30, 2014 | | | 905,387 | | |
| EUR | 701,754 | | | Term Loan, 6.26%, Maturing June 30, 2015 | | | 909,493 | | |
| Holding Bercy Investissement | | | |
| EUR | 1,096,491 | | | Term Loan, 6.01%, Maturing June 30, 2011 | | | 1,416,126 | | |
| Jack in the Box, Inc. | | | |
| | 12,615,115 | | | Term Loan, 6.88%, Maturing January 8, 2011 | | | 12,666,370 | | |
See notes to financial statements
25
Floating Rate Portfolio as of October 31, 2006
PORTFOLIO OF INVESTMENTS CONT'D
Principal
Amount | | Borrower/Tranche Description | | Value | |
| Food Service (continued) | | | |
| Landry's Restaurants, Inc. | | | |
| $ | 7,914,038 | | | Term Loan, 7.12%, Maturing December 28, 2010 | | $ | 7,920,630 | | |
| Maine Beverage Co., LLC | | | |
| | 3,633,929 | | | Term Loan, 7.12%, Maturing June 30, 2010 | | | 3,624,844 | | |
| NPC International, Inc. | | | |
| | 3,368,535 | | | Term Loan, 7.10%, Maturing May 3, 2013 | | | 3,360,113 | | |
| Sagittarius Restaurants, LLC | | | |
| | 4,855,612 | | | Term Loan, 7.62%, Maturing March 29, 2013 | | | 4,878,376 | | |
| Sonic Corp. | | | |
| | 5,292,000 | | | Term Loan, 7.32%, Maturing September 22, 2013 | | | 5,311,845 | | |
| SSP Financing, Ltd. | | | |
| EUR | 1,025,146 | | | Term Loan, 5.93%, Maturing June 15, 2014 | | | 1,319,152 | | |
| | 3,954,516 | | | Term Loan, 7.83%, Maturing June 15, 2014 | | | 3,977,583 | | |
| EUR | 1,025,146 | | | Term Loan, 6.43%, Maturing June 15, 2015 | | | 1,324,954 | | |
| | 3,954,516 | | | Term Loan, 8.33%, Maturing June 15, 2015 | | | 3,994,061 | | |
| Weightwatchers.com, Inc. | | | |
| | 3,290,062 | | | Term Loan, 7.61%, Maturing December 16, 2010 | | | 3,306,512 | | |
| | | | | | | $ | 151,349,850 | | |
| Food / Drug Retailers — 1.8% | | | |
| Cumberland Farms, Inc. | | | |
| $ | 6,000,000 | | | Term Loan, 7.37%, Maturing September 30, 2013 | | $ | 6,030,000 | | |
| General Nutrition Centers, Inc. | | | |
| | 9,000,000 | | | Revolving Loan, 0.00%, Maturing December 5, 2009(2) | | | 8,752,500 | | |
| | 4,866,579 | | | Term Loan, 8.11%, Maturing December 5, 2011 | | | 4,910,685 | | |
| Giant Eagle, Inc. | | | |
| | 13,051,375 | | | Term Loan, 6.90%, Maturing November 7, 2012 | | | 13,065,653 | | |
| Roundy's Supermarkets, Inc. | | | |
| | 24,241,813 | | | Term Loan, 8.42%, Maturing November 3, 2011 | | | 24,463,019 | | |
| Supervalu, Inc. | | | |
| | 14,427,500 | | | Term Loan, 7.19%, Maturing June 1, 2012 | | | 14,480,709 | | |
| The Jean Coutu Group (PJC), Inc. | | | |
| | 26,942,468 | | | Term Loan, 7.94%, Maturing July 30, 2011 | | | 27,064,248 | | |
| The Pantry, Inc. | | | |
| | 5,756,500 | | | Term Loan, 7.07%, Maturing January 2, 2012 | | | 5,776,291 | | |
| Winn-Dixie Stores, Inc. | | | |
| | 23,000,000 | | | DIP Revolving Loan, 7.44%, Maturing
February 22, 2007(2) | | | 22,885,000 | | |
| | | | | | | $ | 127,428,105 | | |
| Forest Products — 2.4% | | | |
| Appleton Papers, Inc. | | | |
| $ | 12,644,414 | | | Term Loan, 7.65%, Maturing June 11, 2010 | | $ | 12,707,636 | | |
Principal
Amount | | Borrower/Tranche Description | | Value | |
| Forest Products (continued) | | | |
| Boise Cascade Holdings, LLC | | | |
| $ | 18,677,451 | | | Term Loan, 7.11%, Maturing October 28, 2011 | | $ | 18,783,688 | | |
| Buckeye Technologies, Inc. | | | |
| | 9,685,044 | | | Term Loan, 7.38%, Maturing April 15, 2010 | | | 9,693,112 | | |
| Georgia-Pacific Corp. | | | |
| | 65,639,037 | | | Term Loan, 7.39%, Maturing December 20, 2012 | | | 66,053,810 | | |
| | 18,700,000 | | | Term Loan, 8.39%, Maturing December 23, 2013 | | | 18,962,230 | | |
| NewPage Corp. | | | |
| | 11,785,714 | | | Revolving Loan, 0.00%, Maturing May 2, 2010(2) | | | 11,608,929 | | |
| | 13,705,851 | | | Term Loan, 8.36%, Maturing May 2, 2011 | | | 13,877,175 | | |
| RLC Industries Co. | | | |
| | 15,951,708 | | | Term Loan, 6.82%, Maturing February 24, 2010 | | | 15,931,768 | | |
| Xerium Technologies, Inc. | | | |
| EUR | 1,975,000 | | | Term Loan, 5.63%, Maturing May 18, 2012 | | | 2,537,597 | | |
| | 10,014,466 | | | Term Loan, 7.62%, Maturing May 18, 2012 | | | 10,001,948 | | |
| | | | | | | $ | 180,157,893 | | |
| Healthcare — 5.7% | | | |
| Accellent, Inc. | | | |
| $ | 3,225,625 | | | Term Loan, 7.40%, Maturing November 22, 2012 | | $ | 3,233,689 | | |
| Alliance Imaging, Inc. | | | |
| | 10,040,194 | | | Term Loan, 7.94%, Maturing December 29, 2011 | | | 10,068,438 | | |
| | | American Medical Systems | |
| | 13,550,000 | | | Term Loan, 7.81%, Maturing July 20, 2012 | | | 13,566,937 | | |
| AMN Healthcare, Inc. | | | |
| | 3,176,171 | | | Term Loan, 7.12%, Maturing November 2, 2011 | | | 3,187,091 | | |
| AMR HoldCo, Inc. | | | |
| | 6,068,680 | | | Term Loan, 7.28%, Maturing February 10, 2012 | | | 6,080,059 | | |
| Carl Zeiss Topco GMBH | | | |
| | 3,140,000 | | | Term Loan, 8.12%, Maturing February 28, 2013 | | | 3,167,475 | | |
| | 6,280,000 | | | Term Loan, 8.62%, Maturing February 28, 2014 | | | 6,366,350 | | |
| | 2,875,000 | | | Term Loan, 10.87%, Maturing August 31, 2014 | | | 2,917,766 | | |
| Community Health Systems, Inc. | | | |
| | 47,978,227 | | | Term Loan, 7.15%, Maturing August 19, 2011 | | | 48,059,598 | | |
| Concentra Operating Corp. | | | |
| | 17,431,491 | | | Term Loan, 7.62%, Maturing September 30, 2011 | | | 17,532,263 | | |
| Conmed Corp. | | | |
| | 8,109,250 | | | Term Loan, 7.32%, Maturing April 12, 2013 | | | 8,119,387 | | |
| CRC Health Corp. | | | |
| | 3,955,125 | | | Term Loan, 7.62%, Maturing February 6, 2013 | | | 3,960,069 | | |
| Davita, Inc. | | | |
| | 47,516,567 | | | Term Loan, 7.43%, Maturing October 5, 2012 | | | 47,807,179 | | |
| DJ Orthopedics, LLC | | | |
| | 2,515,607 | | | Term Loan, 6.88%, Maturing April 7, 2013 | | | 2,512,463 | | |
See notes to financial statements
26
Floating Rate Portfolio as of October 31, 2006
PORTFOLIO OF INVESTMENTS CONT'D
Principal
Amount | | Borrower/Tranche Description | | Value | |
| Healthcare (continued) | | | |
| Encore Medical IHC, Inc. | | | |
| $ | 7,952,608 | | | Term Loan, 8.30%, Maturing October 4, 2010 | | $ | 7,972,489 | | |
| FGX International, Inc. | | | |
| | 4,000,000 | | | Term Loan, 9.39%, Maturing December 12, 2012 | | | 3,980,000 | | |
| FHC Health Systems, Inc. | | | |
| | 2,000,000 | | | Term Loan, 11.49%, Maturing June 27, 2008 | | | 2,075,000 | | |
| | 2,321,429 | | | Term Loan, 11.40%, Maturing December 18, 2009 | | | 2,408,482 | | |
| | 1,625,000 | | | Term Loan, 13.40%, Maturing December 18, 2009 | | | 1,685,937 | | |
| | 3,250,000 | | | Term Loan, 14.40%, Maturing February 7, 2011 | | | 3,371,875 | | |
| | | Fresenius Medical Care Holdings | |
| | 26,564,006 | | | Term Loan, 6.75%, Maturing March 31, 2013 | | | 26,433,019 | | |
| Hanger Orthopedic Group, Inc. | | | |
| | 5,461,313 | | | Term Loan, 7.87%, Maturing May 26, 2011 | | | 5,487,483 | | |
| HealthSouth Corp. | | | |
| | 17,456,250 | | | Term Loan, 8.62%, Maturing March 10, 2013 | | | 17,548,384 | | |
| Iasis Healthcare, LLC | | | |
| | 12,864,299 | | | Term Loan, 7.62%, Maturing June 16, 2011 | | | 12,944,701 | | |
| Kinetic Concepts, Inc. | | | |
| | 7,771,163 | | | Term Loan, 7.12%, Maturing August 11, 2010 | | | 7,793,024 | | |
| Leiner Health Products, Inc. | | | |
| | 8,162,125 | | | Term Loan, 8.88%, Maturing May 27, 2011 | | | 8,209,735 | | |
| Lifecare Holdings, Inc. | | | |
| | 9,157,500 | | | Term Loan, 7.57%, Maturing August 11, 2012 | | | 8,459,241 | | |
| Lifepoint Hospitals, Inc. | | | |
| | 31,523,355 | | | Term Loan, 6.95%, Maturing April 15, 2012 | | | 31,420,904 | | |
| Magellan Health Services, Inc. | | | |
| | 3,679,054 | | | Term Loan, 5.20%, Maturing August 15, 2008 | | | 3,688,252 | | |
| | 3,219,172 | | | Term Loan, 7.17%, Maturing August 15, 2008 | | | 3,227,220 | | |
| Matria Healthcare, Inc. | | | |
| | 3,330,892 | | | Term Loan, 7.63%, Maturing January 19, 2012 | | | 3,341,301 | | |
| Medcath Holdings Corp. | | | |
| | 1,517,702 | | | Term Loan, 7.86%, Maturing June 30, 2011 | | | 1,519,125 | | |
| Moon Acquisition Co. AB | | | |
| EUR | 3,054,298 | | | Term Loan, 5.88%, Maturing November 4, 2013 | | | 3,950,659 | | |
| EUR | 2,242,000 | | | Term Loan, 6.38%, Maturing November 4, 2014 | | | 2,913,503 | | |
| Multiplan Merger Corp. | | | |
| | 4,640,588 | | | Term Loan, 7.85%, Maturing April 12, 2013 | | | 4,652,190 | | |
| National Mentor Holdings, Inc. | | | |
| | 484,400 | | | Term Loan, 5.32%, Maturing June 29, 2013 | | | 486,822 | | |
| | 8,145,186 | | | Term Loan, 7.87%, Maturing June 29, 2013 | | | 8,185,912 | | |
| P&F Capital S.A.R.L. | | | |
| EUR | 836,893 | | | Term Loan, 5.63%, Maturing February 21, 2014 | | | 1,084,025 | | |
| EUR | 500,938 | | | Term Loan, 5.63%, Maturing February 21, 2014 | | | 648,863 | | |
| EUR | 401,974 | | | Term Loan, 5.63%, Maturing February 21, 2014 | | | 520,676 | | |
| EUR | 260,194 | | | Term Loan, 6.13%, Maturing February 21, 2014 | | | 337,028 | | |
Principal
Amount | | Borrower/Tranche Description | | Value | |
| Healthcare (continued) | | | |
| EUR | 378,378 | | | Term Loan, 6.13%, Maturing February 21, 2015 | | $ | 492,150 | | |
| EUR | 140,541 | | | Term Loan, 6.13%, Maturing February 21, 2015 | | | 182,798 | | |
| EUR | 291,892 | | | Term Loan, 6.13%, Maturing February 21, 2015 | | | 379,658 | | |
| EUR | 1,189,189 | | | Term Loan, 6.13%, Maturing February 21, 2015 | | | 1,546,756 | | |
| PER-SE Technologies, Inc. | | | |
| | 8,991,954 | | | Term Loan, 7.57%, Maturing January 6, 2013 | | | 9,045,348 | | |
| Renal Advantage, Inc. | | | |
| | 2,327,221 | | | Term Loan, 7.89%, Maturing October 5, 2012 | | | 2,346,130 | | |
| Select Medical Holding Corp. | | | |
| | 9,800,750 | | | Term Loan, 7.15%, Maturing February 24, 2012 | | | 9,631,079 | | |
| Sirona Dental Systems GmbH | | | |
| EUR | 1,500,000 | | | Term Loan, 5.85%, Maturing June 30, 2013 | | | 1,937,773 | | |
| Sunrise Medical Holdings, Inc. | | | |
| | 8,236,913 | | | Term Loan, 8.89%, Maturing May 13, 2010 | | | 8,216,321 | | |
| Talecris Biotherapeutics, Inc. | | | |
| | 7,520,475 | | | Term Loan, 8.64%, Maturing March 31, 2010 | | | 7,558,077 | | |
| | 1,531,250 | | | Term Loan, 8.89%, Maturing May 31, 2010 | | | 1,531,250 | | |
| Vanguard Health Holding Co., LLC | | | |
| | 14,948,278 | | | Term Loan, 7.87%, Maturing September 23, 2011 | | | 14,980,985 | | |
| Ventiv Health, Inc. | | | |
| | 3,441,429 | | | Term Loan, 6.87%, Maturing October 5, 2011 | | | 3,430,674 | | |
| VWR International, Inc. | | | |
| EUR | 2,424,905 | | | Term Loan, 6.28%, Maturing April 7, 2011 | | | 3,124,688 | | |
| | 10,198,914 | | | Term Loan, 7.63%, Maturing April 7, 2011 | | | 10,227,604 | | |
| | | | | | | $ | 425,555,905 | | |
| Home Furnishings — 1.2% | | | |
| Interline Brands, Inc. | | | |
| $ | 6,039,212 | | | Term Loan, 7.11%, Maturing June 23, 2013 | | $ | 6,050,535 | | |
| | 7,850,976 | | | Term Loan, 7.12%, Maturing June 23, 2013 | | | 7,865,696 | | |
| Knoll, Inc. | | | |
| | 9,009,340 | | | Term Loan, 7.12%, Maturing October 3, 2012 | | | 9,062,837 | | |
| National Bedding Co., LLC | | | |
| | 6,594,037 | | | Term Loan, 7.39%, Maturing August 31, 2011 | | | 6,622,886 | | |
| | 1,500,000 | | | Term Loan, 10.37%, Maturing August 31, 2012 | | | 1,514,062 | | |
| Oreck Corp. | | | |
| | 4,277,960 | | | Term Loan, 8.12%, Maturing February 2, 2012 | | | 4,281,972 | | |
| Sanitec, Ltd. Oy | | | |
| EUR | 4,478,261 | | | Term Loan, 5.89%, Maturing April 7, 2013 | | | 5,688,678 | | |
| EUR | 4,478,261 | | | Term Loan, 6.39%, Maturing April 7, 2014 | | | 5,714,828 | | |
| Sealy Mattress Co. | | | |
| | 5,000,000 | | | Revolving Loan, 0.00%, Maturing April 6, 2012(2) | | | 4,925,000 | | |
| | 12,125,000 | | | Term Loan, 7.37%, Maturing August 25, 2012 | | | 12,125,000 | | |
See notes to financial statements
27
Floating Rate Portfolio as of October 31, 2006
PORTFOLIO OF INVESTMENTS CONT'D
Principal
Amount | | Borrower/Tranche Description | | Value | |
| Home Furnishings (continued) | | | |
| Simmons Co. | | | |
| $ | 21,880,243 | | | Term Loan, 7.17%, Maturing December 19, 2011 | | $ | 22,047,758 | | |
| | | | | | | $ | 85,899,252 | | |
| Industrial Equipment — 1.6% | | | |
| Aearo Technologies, Inc. | | | |
| $ | 6,268,500 | | | Term Loan, 7.87%, Maturing March 22, 2013 | | $ | 6,328,571 | | |
| Alliance Laundry Holdings, LLC | | | |
| | 3,777,766 | | | Term Loan, 7.57%, Maturing January 27, 2012 | | | 3,804,921 | | |
| Colfax Corp. | | | |
| | 2,013,432 | | | Term Loan, 7.38%, Maturing November 30, 2011 | | | 2,024,757 | | |
| EUR | 4,962,500 | | | Term Loan, 5.63%, Maturing December 19, 2011 | | | 6,357,639 | | |
| Douglas Dynamics Holdings, Inc. | | | |
| | 4,145,273 | | | Term Loan, 7.12%, Maturing December 16, 2010 | | | 4,134,910 | | |
| Flowserve Corp. | | | |
| | 13,777,287 | | | Term Loan, 6.88%, Maturing August 10, 2012 | | | 13,805,268 | | |
| Gleason Corp. | | | |
| | 5,650,000 | | | Term Loan, 7.91%, Maturing June 30, 2013 | | | 5,692,375 | | |
| GSCP Athena (Finnish) Holdings | | | |
| EUR | 6,108,696 | | | Term Loan, 5.57%, Maturing August 31, 2013 | | | 7,833,650 | | |
| EUR | 5,891,304 | | | Term Loan, 6.07%, Maturing August 31, 2014 | | | 7,588,296 | | |
| Heating Finance PLC (Baxi) | | | |
| EUR | 3,253,597 | | | Term Loan, 0.00%, Maturing December 27, 2010(2) | | | 4,137,156 | | |
| GBP | 2,944,670 | | | Term Loan, 7.10%, Maturing December 27, 2010 | | | 5,605,691 | | |
| John Maneely Co. | | | |
| | 2,838,461 | | | Term Loan, 8.37%, Maturing March 24, 2013 | | | 2,867,734 | | |
| MTD Products, Inc. | | | |
| | 10,772,259 | | | Term Loan, 6.88%, Maturing June 1, 2010 | | | 10,691,467 | | |
| Nacco Materials Handling Group, Inc. | | | |
| | 3,561,063 | | | Term Loan, 7.36%, Maturing March 22, 2013 | | | 3,556,611 | | |
| PP Acquisition Corp. | | | |
| | 20,538,819 | | | Term Loan, 8.32%, Maturing November 12, 2011 | | | 20,701,425 | | |
| Prysmian S.R.L. | | | |
| EUR | 2,000,000 | | | Term Loan, 7.88%, Maturing August 22, 2014 | | | 2,564,754 | | |
| EUR | 1,400,000 | | | Term Loan, 5.79%, Maturing August 22, 2014 | | | 1,795,328 | | |
| EUR | 300,000 | | | Term Loan, 6.29%, Maturing August 22, 2015 | | | 386,415 | | |
| TFS Acquisition Corp. | | | |
| | 5,500,000 | | | Term Loan, 8.92%, Maturing August 11, 2013 | | | 5,541,250 | | |
| | | | | | | $ | 115,418,218 | | |
| Insurance — 0.8% | | | |
| ARG Holding, Inc. | | | |
| $ | 7,890,375 | | | Term Loan, 8.38%, Maturing November 30, 2011 | | $ | 7,924,895 | | |
| | 500,000 | | | Term Loan, 12.62%, Maturing November 30, 2012 | | | 506,250 | | |
Principal
Amount | | Borrower/Tranche Description | | Value | |
| Insurance (continued) | | | |
| CCC Information Services Group | | | |
| $ | 5,275,000 | | | Term Loan, 7.87%, Maturing February 10, 2013 | | $ | 5,304,672 | | |
| Conseco, Inc. | | | |
| | 21,450,000 | | | Term Loan, 7.32%, Maturing September 25, 2013 | | | 21,530,437 | | |
| Hilb, Rogal & Hobbs Co. | | | |
| | 5,671,500 | | | Term Loan, 6.87%, Maturing April 26, 2013 | | | 5,673,865 | | |
| U.S.I. Holdings Corp. | | | |
| | 1,737,500 | | | Term Loan, 0.00%, Maturing March 24, 2011(2) | | | 1,746,187 | | |
| | 16,924,312 | | | Term Loan, 7.69%, Maturing March 24, 2011 | | | 17,008,933 | | |
| | | | | | | $ | 59,695,239 | | |
| Leisure Goods / Activities / Movies — 5.1% | | | |
| 24 Hour Fitness Worldwide, Inc. | | | |
| $ | 11,472,350 | | | Term Loan, 7.99%, Maturing June 2, 2012 | | $ | 11,558,393 | | |
| Alliance Atlantis Communications, Inc. | | | |
| | 6,502,970 | | | Term Loan, 6.87%, Maturing December 31, 2011 | | | 6,509,746 | | |
| Alpha D2, Ltd. | | | |
| | 40,355,828 | | | Term Loan, 7.33%, Maturing December 31, 2007 | | | 40,406,273 | | |
| AMC Entertainment, Inc. | | | |
| | 15,368,912 | | | Term Loan, 7.45%, Maturing January 26, 2013 | | | 15,510,199 | | |
| AMF Bowling Worldwide, Inc. | | | |
| | 3,513,711 | | | Term Loan, 8.43%, Maturing August 27, 2009 | | | 3,542,260 | | |
| Bombardier Recreational Product | | | |
| | 15,800,000 | | | Term Loan, 8.13%, Maturing June 28, 2013 | | | 15,800,000 | | |
| Butterfly Wendel US, Inc. | | | |
| | 1,237,500 | | | Term Loan, 8.15%, Maturing June 22, 2013 | | | 1,254,709 | | |
| | 1,237,500 | | | Term Loan, 7.90%, Maturing June 22, 2014 | | | 1,248,521 | | |
| Carmike Cinemas, Inc. | | | |
| | 6,726,411 | | | Term Loan, 8.64%, Maturing May 19, 2012 | | | 6,804,888 | | |
| | 9,383,031 | | | Term Loan, 8.65%, Maturing May 19, 2012 | | | 9,484,678 | | |
| Cedar Fair, L.P. | | | |
| | 4,987,500 | | | Term Loan, 7.82%, Maturing August 31, 2011 | | | 5,015,555 | | |
| | 19,201,875 | | | Term Loan, 7.87%, Maturing August 30, 2012 | | | 19,434,390 | | |
| Cinemark, Inc. | | | |
| | 29,450,000 | | | Term Loan, 7.32%, Maturing October 5, 2013 | | | 29,668,578 | | |
| Corleone Capital, Ltd. | | | |
| GBP | 697,341 | | | Term Loan, 6.82%,
Maturing November 30, 2011 | | | 1,322,798 | | |
| GBP | 772,711 | | | Term Loan, 7.57%,
Maturing November 30, 2012 | | | 1,474,059 | | |
| Dave & Buster's, Inc. | | | |
| | 1,490,006 | | | Term Loan, 7.88%, Maturing March 8, 2013 | | | 1,501,181 | | |
| | 1,496,250 | | | Term Loan, 7.94%, Maturing March 8, 2013 | | | 1,507,472 | | |
| Deluxe Entertainment Services | | | |
| | 3,900,000 | | | Term Loan, 5.27%, Maturing January 28, 2011 | | | 3,841,500 | | |
| | 3,227,249 | | | Term Loan, 9.12%, Maturing January 28, 2011 | | | 3,260,868 | | |
See notes to financial statements
28
Floating Rate Portfolio as of October 31, 2006
PORTFOLIO OF INVESTMENTS CONT'D
Principal
Amount | | Borrower/Tranche Description | | Value | |
| Leisure Goods / Activities / Movies (continued) | | | |
| Easton-Bell Sports, Inc. | | | |
| $ | 7,064,500 | | | Term Loan, 7.12%, Maturing March 16, 2012 | | $ | 7,082,161 | | |
| Fender Musical Instruments Co. | | | |
| | 1,966,804 | | | Term Loan, 8.13%, Maturing March 30, 2012 | | | 1,979,096 | | |
| | 500,000 | | | Term Loan, 11.38%, Maturing October 1, 2012 | | | 505,000 | | |
| Lions Gate Entertainment, Inc. | | | |
| | 1,022,500 | | | Revolving Loan, 0.00%,
Maturing December 31, 2008(2) | | | 1,007,162 | | |
| Metro-Goldwyn-Mayer Holdings, Inc. | | | |
| | 3,882,784 | | | Term Loan, 8.62%, Maturing April 8, 2011 | | | 3,838,023 | | |
| | 64,500,900 | | | Term Loan, 8.62%, Maturing April 8, 2012 | | | 63,781,005 | | |
| Regal Cinemas Corp. | | | |
| | 32,500,000 | | | Term Loan, 7.12%, Maturing November 10, 2010 | | | 32,491,290 | | |
| Six Flags Theme Parks, Inc. | | | |
| | 3,275,000 | | | Revolving Loan, 8.57%, Maturing June 30, 2008(2) | | | 3,258,625 | | |
| | 25,517,824 | | | Term Loan, 8.66%, Maturing June 30, 2009 | | | 25,830,826 | | |
| Southwest Sports Group, LLC | | | |
| | 9,500,000 | | | Term Loan, 7.88%, Maturing December 22, 2010 | | | 9,502,973 | | |
| Universal City Development Partners, Ltd. | | | |
| | 18,996,088 | | | Term Loan, 7.39%, Maturing June 9, 2011 | | | 19,079,196 | | |
| WMG Acquisition Corp. | | | |
| | 4,390,000 | | | Revolving Loan, 0.00%, Maturing February 28, 2010(2) | | | 4,270,372 | | |
| | 29,923,260 | | | Term Loan, 7.37%, Maturing February 28, 2011 | | | 30,071,022 | | |
| | | | | | | $ | 381,842,819 | | |
| Lodging and Casinos — 3.7% | | | |
| Ameristar Casinos, Inc. | | | |
| $ | 8,138,500 | | | Term Loan, 6.90%, Maturing November 10, 2012 | | $ | 8,148,673 | | |
| Aztar Corp. | | | |
| | 1,955,000 | | | Term Loan, 6.82%, Maturing July 27, 2009 | | | 1,955,000 | | |
| Bally Technologies, Inc. | | | |
| | 15,460,019 | | | Term Loan, 9.33%, Maturing September 4, 2009 | | | 15,514,778 | | |
| Boyd Gaming Corp. | | | |
| | 25,899,261 | | | Term Loan, 6.87%, Maturing June 30, 2011 | | | 25,938,110 | | |
| CCM Merger, Inc. | | | |
| | 11,072,406 | | | Term Loan, 7.38%, Maturing April 25, 2012 | | | 11,077,942 | | |
| Choctaw Resort Development Enterprise | | | |
| | 3,845,183 | | | Term Loan, 7.12%, Maturing January 4, 2011 | | | 3,849,989 | | |
| Columbia Entertainment Co. | | | |
| | 3,129,107 | | | Term Loan, 7.82%, Maturing October 24, 2011 | | | 3,144,753 | | |
| Fairmont Hotels and Resorts, Inc. | | | |
| | 6,358,471 | | | Term Loan, 8.57%, Maturing May 12, 2011 | | | 6,414,107 | | |
| Gala Electric Casinos, Ltd. | | | |
| GBP | 5,000,000 | | | Term Loan, 7.30%, Maturing December 12, 2012(2) | | | 9,554,130 | | |
| GBP | 13,498,333 | | | Term Loan, 7.55%, Maturing December 12, 2014 | | | 25,991,922 | | |
| GBP | 12,498,333 | | | Term Loan, 8.05%, Maturing December 12, 2014 | | | 24,168,715 | | |
Principal
Amount | | Borrower/Tranche Description | | Value | |
| Lodging and Casinos (continued) | | | |
| Globalcash Access, LLC | | | |
| $ | 2,989,729 | | | Term Loan, 9.00%, Maturing March 10, 2010 | | $ | 2,989,729 | | |
| Green Valley Ranch Gaming, LLC | | | |
| | 2,967,263 | | | Term Loan, 7.37%, Maturing December 24, 2010 | | | 2,972,827 | | |
| Herbst Gaming, Inc. | | | |
| | 3,181,550 | | | Term Loan, 7.37%, Maturing January 31, 2011 | | | 3,186,523 | | |
| Isle of Capri Casinos, Inc. | | | |
| | 4,937,500 | | | Term Loan, 7.12%, Maturing February 4, 2012 | | | 4,956,016 | | |
| | 15,599,044 | | | Term Loan, 7.18%, Maturing February 4, 2012 | | | 15,657,540 | | |
| Penn National Gaming, Inc. | | | |
| | 47,593,920 | | | Term Loan, 7.13%, Maturing October 3, 2012 | | | 47,903,281 | | |
| Pinnacle Entertainment, Inc. | | | |
| | 7,500,000 | | | Term Loan, 7.32%, Maturing December 14, 2011 | | | 7,529,063 | | |
| Trump Entertainment Resorts Holdings, L.P. | | | |
| | 5,406,563 | | | Term Loan, 0.00%, Maturing May 20, 2012(2) | | | 5,453,026 | | |
| | 5,406,563 | | | Term Loan, 8.03%, Maturing May 20, 2012 | | | 5,453,026 | | |
| Venetian Casino Resort, LLC | | | |
| | 32,347,836 | | | Term Loan, 7.12%, Maturing June 15, 2011 | | | 32,464,093 | | |
| VML US Finance, LLC | | | |
| | 3,333,333 | | | Term Loan, 0.00%, Maturing May 25, 2012(2) | | | 3,331,943 | | |
| | 6,666,667 | | | Term Loan, 8.12%, Maturing May 25, 2013 | | | 6,718,227 | | |
| | | | | | | $ | 274,373,413 | | |
| Nonferrous Metals / Minerals — 1.6% | | | |
| Almatis Holdings 5 BV | | | |
| EUR | 1,007,336 | | | Term Loan, 5.74%, Maturing December 21, 2013 | | $ | 1,303,874 | | |
| | 1,000,000 | | | Term Loan, 8.12%, Maturing December 21, 2013 | | | 1,013,672 | | |
| EUR | 1,007,336 | | | Term Loan, 6.24%, Maturing December 21, 2014 | | | 1,309,017 | | |
| | 1,000,000 | | | Term Loan, 8.62%, Maturing December 21, 2014 | | | 1,018,203 | | |
| Alpha Natural Resources, LLC | | | |
| | 9,235,237 | | | Term Loan, 7.12%, Maturing October 26, 2012 | | | 9,259,766 | | |
| Carmeuse Lime, Inc. | | | |
| | 6,958,479 | | | Term Loan, 7.19%, Maturing May 2, 2011 | | | 6,958,479 | | |
| CII Carbon, LLC | | | |
| | 3,604,375 | | | Term Loan, 7.44%, Maturing August 23, 2012 | | | 3,613,386 | | |
| Compass Minerals Group, Inc. | | | |
| | 7,402,870 | | | Term Loan, 6.88%, Maturing December 22, 2012 | | | 7,414,441 | | |
| | | Magnum Coal Co. | |
| | 1,375,000 | | | Term Loan, 8.57%, Maturing March 21, 2013 | | | 1,380,156 | | |
| | 13,681,250 | | | Term Loan, 8.62%, Maturing March 21, 2013 | | | 13,732,555 | | |
| Murray Energy Corp. | | | |
| | 10,795,600 | | | Term Loan, 8.40%, Maturing January 28, 2010 | | | 10,903,556 | | |
| Novelis, Inc. | | | |
| | 20,364,070 | | | Term Loan, 7.72%, Maturing January 9, 2012 | | | 20,454,527 | | |
See notes to financial statements
29
Floating Rate Portfolio as of October 31, 2006
PORTFOLIO OF INVESTMENTS CONT'D
Principal
Amount | | Borrower/Tranche Description | | Value | |
| Nonferrous Metals / Minerals (continued) | | | |
| Severstal North America, Inc. | | | |
| $ | 15,200,000 | | | Revolving Loan, 0.00%, Maturing April 7, 2007(2) | | $ | 15,124,000 | | |
| Stillwater Mining Co. | | | |
| | 4,360,000 | | | Revolving Loan, 5.32%, Maturing June 30, 2007(2) | | | 4,430,850 | | |
| | 5,692,413 | | | Term Loan, 7.63%, Maturing June 30, 2007 | | | 5,720,875 | | |
| Tube City IMS Corp. | | | |
| | 15,401,863 | | | Term Loan, 8.12%, Maturing December 31, 2010 | | | 15,459,620 | | |
| | 3,000,000 | | | Term Loan, 11.37%, Maturing October 26, 2011 | | | 3,007,500 | | |
| | | | | | | $ | 122,104,477 | | |
| Oil and Gas — 2.4% | | | |
| Cavallo Energy L.P. | | | |
| $ | 20,781,250 | | | Revolving Loan, 6.81%, Maturing October 5, 2010(2) | | $ | 20,755,273 | | |
| | 2,127,604 | | | Term Loan, 8.32%, Maturing December 5, 2010 | | | 2,126,274 | | |
| Citgo Petroleum Corp. | | | |
| | 8,052,264 | | | Term Loan, 6.68%, Maturing November 15, 2012 | | | 8,064,004 | | |
| Coffeyville Resources, LLC | | | |
| | 1,600,000 | | | Term Loan, 5.27%, Maturing July 8, 2011 | | | 1,611,798 | | |
| | 2,370,150 | | | Term Loan, 7.63%, Maturing July 8, 2012 | | | 2,387,627 | | |
| Concho Resources, Inc. | | | |
| | 17,181,938 | | | Term Loan, 9.37%, Maturing July 6, 2011(4) | | | 17,128,673 | | |
| El Paso Corp. | | | |
| | 10,960,000 | | | Term Loan, 5.33%, Maturing July 31, 2011 | | | 11,047,088 | | |
| Epco Holdings, Inc. | | | |
| | 4,333,334 | | | Revolving Loan, 7.07%,
Maturing August 18, 2008(2) | | | 4,279,167 | | |
| | 7,506,760 | | | Term Loan, 7.13%, Maturing August 18, 2008 | | | 7,527,877 | | |
| | 10,063,450 | | | Term Loan, 7.37%, Maturing August 18, 2010 | | | 10,132,636 | | |
| Key Energy Services, Inc. | | | |
| | 9,851,303 | | | Term Loan, 9.19%, Maturing June 30, 2012 | | | 9,911,337 | | |
| LB Pacific, L.P. | | | |
| | 7,968,650 | | | Term Loan, 8.07%, Maturing March 3, 2012 | | | 7,988,572 | | |
| Niska Gas Storage | | | |
| | 1,321,515 | | | Term Loan, 0.00%, Maturing May 12, 2013(2) | | | 1,323,167 | | |
| | 1,887,879 | | | Term Loan, 7.14%, Maturing May 13, 2011 | | | 1,890,239 | | |
| | 1,972,361 | | | Term Loan, 7.16%, Maturing May 12, 2013 | | | 1,972,054 | | |
| | 10,333,777 | | | Term Loan, 7.17%, Maturing May 12, 2013 | | | 10,332,164 | | |
| Petroleum Geo-Services ASA | | | |
| | 4,049,951 | | | Term Loan, 7.61%, Maturing December 16, 2012 | | | 4,081,844 | | |
| Primary Natural Resources, Inc. | | | |
| | 13,382,750 | | | Term Loan, 9.35%, Maturing July 28, 2010(4) | | | 13,341,263 | | |
| Targa Resources, Inc. | | | |
| | 11,750,000 | | | Term Loan, 7.62%, Maturing October 31, 2007 | | | 11,766,521 | | |
| | 3,434,480 | | | Term Loan, 7.62%, Maturing October 31, 2012 | | | 3,455,946 | | |
| | 19,333,381 | | | Term Loan, 7.63%, Maturing October 31, 2012 | | | 19,454,214 | | |
Principal
Amount | | Borrower/Tranche Description | | Value | |
| Oil and Gas (continued) | | | |
| W&T Offshore, Inc. | | | |
| $ | 10,850,000 | | | Term Loan, 7.65%, Maturing May 26, 2010 | | $ | 10,924,594 | | |
| | | | | | | $ | 181,502,332 | | |
| Publishing — 4.9% | | | |
| American Media Operations, Inc. | | | |
| $ | 23,000,000 | | | Term Loan, 8.37%, Maturing January 31, 2013 | | $ | 23,170,108 | | |
| Black Press US Partnership | | | |
| | 4,550,000 | | | Term Loan, 7.50%, Maturing August 2, 2013 | | | 4,584,125 | | |
| CBD Media, LLC | | | |
| | 7,452,219 | | | Term Loan, 7.70%, Maturing December 31, 2009 | | | 7,514,318 | | |
| Dex Media East, LLC | | | |
| | 8,980,144 | | | Term Loan, 6.92%, Maturing May 8, 2009 | | | 8,963,306 | | |
| Dex Media West, LLC | | | |
| | 15,207,322 | | | Term Loan, 6.88%, Maturing March 9, 2010 | | | 15,168,437 | | |
| | 2,450,015 | | | Term Loan, 6.91%, Maturing September 9, 2010 | | | 2,445,115 | | |
| Gatehouse Media Operating, Inc. | | | |
| | 13,680,789 | | | Term Loan, 7.57%, Maturing June 6, 2013 | | | 13,714,991 | | |
| Hanley-Wood, LLC | | | |
| | 984,132 | | | Term Loan, 7.61%, Maturing August 1, 2012 | | | 984,748 | | |
| | 8,239,414 | | | Term Loan, 7.69%, Maturing August 1, 2012 | | | 8,244,564 | | |
| Medianews Group, Inc. | | | |
| | 12,163,805 | | | Term Loan, 6.57%, Maturing December 30, 2010 | | | 12,039,637 | | |
| | 7,655,813 | | | Term Loan, 7.07%, Maturing August 2, 2013 | | | 7,670,167 | | |
| Merrill Communications, LLC | | | |
| | 16,534,006 | | | Term Loan, 7.59%, Maturing May 15, 2011 | | | 16,596,008 | | |
| Nebraska Book Co., Inc. | | | |
| | 11,142,790 | | | Term Loan, 7.88%, Maturing March 4, 2011 | | | 11,191,539 | | |
| Newspaper Holdings, Inc. | | | |
| | 2,500,000 | | | Term Loan, 6.69%, Maturing August 24, 2011 | | | 2,493,750 | | |
| | 16,050,000 | | | Term Loan, 6.94%, Maturing August 24, 2012 | | | 15,989,813 | | |
| Philadelphia Newspapers, LLC | | | |
| | 6,334,125 | | | Term Loan, 8.12%, Maturing June 29, 2013 | | | 6,310,372 | | |
| R.H. Donnelley Corp. | | | |
| | 999,946 | | | Term Loan, 6.62%, Maturing December 31, 2009 | | | 992,715 | | |
| | 39,958,852 | | | Term Loan, 6.89%, Maturing June 30, 2011 | | | 39,845,090 | | |
| | 10,420,455 | | | Term Loan, 6.89%, Maturing June 30, 2011 | | | 10,402,104 | | |
| Retos Cartera, SA | | | |
| EUR | 1,000,000 | | | Term Loan, 5.07%, Maturing March 15, 2013 | | | 1,288,316 | | |
| EUR | 1,000,000 | | | Term Loan, 6.28%, Maturing March 15, 2014 | | | 1,292,304 | | |
| Seat Pagine Gialle Spa | | | |
| EUR | 16,090,393 | | | Term Loan, 5.88%, Maturing May 25, 2012 | | | 20,726,776 | | |
| SGS International, Inc. | | | |
| | 4,000,000 | | | Term Loan, 0.00%, Maturing December 30, 2011(2) | | | 4,022,500 | | |
| | 1,215,813 | | | Term Loan, 8.06%, Maturing December 30, 2011 | | | 1,222,651 | | |
See notes to financial statements
30
Floating Rate Portfolio as of October 31, 2006
PORTFOLIO OF INVESTMENTS CONT'D
Principal
Amount | | Borrower/Tranche Description | | Value | |
| Publishing (continued) | | | |
| Siegwerk Druckfarben AG | | | |
| EUR | 2,598,750 | | | Term Loan, 6.24%, Maturing September 8, 2013 | | $ | 3,349,049 | | |
| EUR | 2,624,814 | | | Term Loan, 6.92%, Maturing September 8, 2014 | | | 3,397,295 | | |
| Source Media, Inc. | | | |
| | 13,128,877 | | | Term Loan, 7.61%, Maturing November 8, 2011 | | | 13,202,727 | | |
| SP Newsprint Co. | | | |
| | 8,463,065 | | | Term Loan, 5.32%, Maturing January 9, 2010 | | | 8,505,380 | | |
| | 989,114 | | | Term Loan, 8.48%, Maturing January 9, 2010 | | | 994,060 | | |
| Springer Science+Business Media | | | |
| | 2,790,582 | | | Term Loan, 7.62%, Maturing May 5, 2010 | | | 2,797,558 | | |
| EUR | 1,399,585 | | | Term Loan, 5.63%, Maturing May 5, 2011 | | | 1,804,473 | | |
| | 3,097,232 | | | Term Loan, 7.99%, Maturing May 5, 2011 | | | 3,124,011 | | |
| EUR | 1,210,414 | | | Term Loan, 6.00%, Maturing May 5, 2012 | | | 1,567,788 | | |
| | 6,452,567 | | | Term Loan, 8.37%, Maturing May 5, 2012 | | | 6,542,662 | | |
| Sun Media Corp. | | | |
| | 9,047,123 | | | Term Loan, 7.13%, Maturing February 7, 2009 | | | 9,067,859 | | |
| Thomas Nelson, Inc. | | | |
| | 1,995,000 | | | Term Loan, 7.60%, Maturing June 12, 2012 | | | 2,002,481 | | |
| World Directories ACQI Corp. | | | |
| EUR | 1,500,000 | | | Term Loan, 6.01%, Maturing November 29, 2012 | | | 1,927,517 | | |
| EUR | 7,006,198 | | | Term Loan, 6.51%, Maturing November 29, 2013 | | | 9,041,361 | | |
| Xsys US, Inc. | | | |
| EUR | 2,750,000 | | | Term Loan, 6.06%, Maturing September 27, 2013 | | | 3,532,998 | | |
| | 7,701,575 | | | Term Loan, 7.87%, Maturing September 27, 2013 | | | 7,752,120 | | |
| EUR | 2,750,000 | | | Term Loan, 6.56%, Maturing September 27, 2014 | | | 3,550,548 | | |
| | 7,866,565 | | | Term Loan, 8.37%, Maturing September 27, 2014 | | | 7,957,526 | | |
| YBR Acquisition BV | | | |
| EUR | 1,250,000 | | | Term Loan, 5.74%, Maturing June 30, 2013 | | | 1,618,771 | | |
| EUR | 6,000,000 | | | Term Loan, 5.78%, Maturing June 30, 2013 | | | 7,770,100 | | |
| EUR | 7,250,000 | | | Term Loan, 6.24%, Maturing June 30, 2014 | | | 9,425,422 | | |
| Yell Group, PLC | | | |
| | 21,025,000 | | | Term Loan, 7.32%, Maturing October 27, 2012 | | | 21,150,498 | | |
| | | | | | | $ | 366,955,658 | | |
| Radio and Television — 4.4% | | | |
| Adams Outdoor Advertising, L.P. | | | |
| $ | 16,972,119 | | | Term Loan, 7.13%, Maturing November 18, 2012 | | $ | 17,019,861 | | |
| ALM Media Holdings, Inc. | | | |
| | 7,869,028 | | | Term Loan, 7.87%, Maturing March 4, 2010 | | | 7,876,409 | | |
| Block Communications, Inc. | | | |
| | 7,051,737 | | | Term Loan, 7.37%, Maturing December 22, 2011 | | | 7,073,774 | | |
| Cequel Communications, LLC | | | |
| | 37,850,000 | | | Term Loan, 7.62%, Maturing November 5, 2013 | | | 37,826,344 | | |
Principal
Amount | | Borrower/Tranche Description | | Value | |
| Radio and Television (continued) | | | |
| CMP Susquehanna Corp. | | | |
| $ | 2,000,000 | | | Term Loan, 0.00%, Maturing May 5, 2011(2) | | $ | 1,900,000 | | |
| | 13,620,087 | | | Term Loan, 7.40%, Maturing May 5, 2013 | | | 13,658,400 | | |
| Cumulus Media, Inc. | | | |
| | 11,371,500 | | | Term Loan, 7.45%, Maturing June 7, 2013 | | | 11,439,024 | | |
| DirecTV Holdings, LLC | | | |
| | 15,558,231 | | | Term Loan, 6.82%, Maturing April 13, 2013 | | | 15,581,210 | | |
| Emmis Operating Co. | | | |
| | 7,800,000 | | | Term Loan, 9.00%, Maturing November 10, 2011 | | | 7,818,104 | | |
| Entravision Communications Corp. | | | |
| | 8,963,500 | | | Term Loan, 6.87%, Maturing September 29, 2013 | | | 8,970,034 | | |
| Gray Television, Inc. | | | |
| | 8,064,062 | | | Term Loan, 6.88%, Maturing November 22, 2012 | | | 8,060,465 | | |
| HEI Acquisition, LLC | | | |
| | 5,425,000 | | | Term Loan, 8.38%, Maturing December 31, 2011 | | | 5,425,000 | | |
| HIT Entertainment, Inc. | | | |
| | 841,500 | | | Term Loan, 7.62%, Maturing March 20, 2012 | | | 844,656 | | |
| Intelsat Subsuduary Holding Co. | | | |
| | 7,825,000 | | | Term Loan, 7.62%, Maturing July 3, 2013 | | | 7,884,908 | | |
| NEP Supershooters, L.P. | | | |
| | 2,888,645 | | | Term Loan, 8.87%, Maturing February 3, 2011 | | | 2,919,336 | | |
| | 4,897,947 | | | Term Loan, 9.42%, Maturing February 3, 2011 | | | 4,957,643 | | |
| Nexstar Broadcasting, Inc. | | | |
| | 24,647,800 | | | Term Loan, 7.12%, Maturing October 1, 2012 | | | 24,593,896 | | |
| NextMedia Operating, Inc. | | | |
| | 2,871,000 | | | Term Loan, 7.32%, Maturing November 14, 2012 | | | 2,867,770 | | |
| P7S1 Holding II S.A.R.L. | | | |
| EUR | 24,000,000 | | | Term Loan, 7.26%, Maturing July 18, 2011 | | | 0,766,417 | | |
| PanAmSat Corp. | | | |
| | 19,675,000 | | | Term Loan, 7.87%, Maturing January 3, 2014 | | | 19,862,188 | | |
| Patriot Media and Communications CNJ, Inc. | | | |
| | 488,095 | | | Term Loan, 7.65%, Maturing March 31, 2013 | | | 491,527 | | |
| Paxson Communications Corp. | | | |
| | 17,925,000 | | | Term Loan, 8.62%, Maturing January 15, 2012 | | | 18,249,891 | | |
| Raycom TV Broadcasting, LLC | | | |
| | 20,241,115 | | | Term Loan, 6.88%, Maturing August 28, 2013 | | | 20,127,259 | | |
| SFX Entertainment | | | |
| | 9,974,625 | | | Term Loan, 7.62%, Maturing June 21, 2013 | | | 9,980,859 | | |
| Spanish Broadcasting System | | | |
| | 12,287,875 | | | Term Loan, 7.12%, Maturing June 10, 2012 | | | 12,300,679 | | |
| TDF SA | | | |
| EUR | 4,151,899 | | | Term Loan, 5.54%, Maturing March 11, 2013 | | | 5,324,267 | | |
| EUR | 4,151,899 | | | Term Loan, 6.42%, Maturing March 11, 2014 | | | 5,339,322 | | |
| EUR | 4,661,720 | | | Term Loan, 7.17%, Maturing March 11, 2015 | | | 5,999,925 | | |
See notes to financial statements
31
Floating Rate Portfolio as of October 31, 2006
PORTFOLIO OF INVESTMENTS CONT'D
Principal
Amount | | Borrower/Tranche Description | | Value | |
| Radio and Television (continued) | | | |
| Young Broadcasting, Inc. | | | |
| $ | 9,472,688 | | | Term Loan, 8.00%, Maturing November 3, 2012 | | $ | 9,465,289 | | |
| | | | | | | $ | 324,624,457 | | |
| Rail Industries — 0.5% | | | |
| Kansas City Southern Railway Co. | | | |
| $ | 15,162,000 | | | Term Loan, 7.11%, Maturing April 26, 2013 | | $ | 15,193,582 | | |
| Railamerica, Inc. | | | |
| | 19,967,084 | | | Term Loan, 7.44%, Maturing September 29, 2011 | | | 20,073,169 | | |
| | | | | | | $ | 35,266,751 | | |
| Retailers (Except Food and Drug) — 2.5% | | | |
| Advantage Sales & Marketing, Inc. | | | |
| $ | 5,273,500 | | | Term Loan, 7.43%, Maturing March 29, 2013 | | $ | 5,259,219 | | |
| American Achievement Corp. | | | |
| | 6,235,482 | | | Term Loan, 7.68%, Maturing March 25, 2011 | | | 6,282,249 | | |
| Amscan Holdings, Inc. | | | |
| | 10,248,500 | | | Term Loan, 8.32%, Maturing December 23, 2012 | | | 10,331,769 | | |
| Coinmach Laundry Corp. | | | |
| | 24,999,115 | | | Term Loan, 7.91%, Maturing December 19, 2012 | | | 25,227,232 | | |
| FTD, Inc. | | | |
| | 5,037,375 | | | Term Loan, 7.35%, Maturing July 28, 2013 | | | 5,059,414 | | |
| Harbor Freight Tools USA, Inc. | | | |
| | 14,416,229 | | | Term Loan, 7.22%, Maturing July 15, 2010 | | | 14,421,636 | | |
| Home Interiors & Gifts, Inc. | | | |
| | 3,608,011 | | | Term Loan, 10.39%, Maturing March 31, 2011 | | | 2,651,888 | | |
| Josten's Corp. | | | |
| | 4,000,000 | | | Revolving Loan, 7.10%, Maturing October 4, 2009(2) | | | 3,960,000 | | |
| | 24,875,233 | | | Term Loan, 7.37%, Maturing October 4, 2011 | | | 25,025,529 | | |
| Mapco Express, Inc. | | | |
| | 3,606,958 | | | Term Loan, 8.07%, Maturing April 28, 2011 | | | 3,640,773 | | |
| | | Mauser Werke GMBH & Co. KG | |
| | 8,325,000 | | | Term Loan, 8.10%, Maturing December 3, 2011 | | | 8,377,031 | | |
| Movie Gallery, Inc. | | | |
| | 3,089,658 | | | Term Loan, 10.62%, Maturing April 27, 2011 | | | 2,898,272 | | |
| Neiman Marcus Group, Inc. | | | |
| | 4,408,228 | | | Term Loan, 7.64%, Maturing April 6, 2013 | | | 4,448,180 | | |
| Oriental Trading Co., Inc. | | | |
| | 2,000,000 | | | Term Loan, 11.47%, Maturing January 31, 2014 | | | 2,008,334 | | |
| | 12,967,500 | | | Term Loan, 8.18%, Maturing July 31, 2013 | | | 12,997,222 | | |
| Pep Boys - Manny, Moe, & Jack, (The) | | | |
| | 4,179,000 | | | Term Loan, 8.07%, Maturing January 27, 2011 | | | 4,231,238 | | |
| Petro Stopping Center, L.P. | | | |
| | 531,250 | | | Term Loan, 7.88%, Maturing February 9, 2007 | | | 533,906 | | |
Principal
Amount | | Borrower/Tranche Description | | Value | |
| Retailers (Except Food and Drug) (continued) | | | |
| Rent-A-Center, Inc. | | | |
| $ | 6,583,500 | | | Term Loan, 6.85%, Maturing June 30, 2012 | | $ | 6,583,500 | | |
| Savers, Inc. | | | |
| | 6,200,000 | | | Term Loan, 8.16%, Maturing August 11, 2012 | | | 6,242,625 | | |
| Shopko Stores, Inc. | | | |
| | 11,802,000 | | | Revolving Loan, 7.00%,
Maturing December 28, 2010(2) | | | 11,765,119 | | |
| Stewert Enterprises, Inc. | | | |
| | 3,115,849 | | | Term Loan, 7.23%, Maturing November 19, 2011 | | | 3,117,796 | | |
| Travelcenters of America, Inc. | | | |
| | 23,045,900 | | | Term Loan, 7.11%, Maturing December 1, 2011 | | | 23,078,302 | | |
| | | | | | | $ | 188,141,234 | | |
| Steel — 0.0% | | | |
| Gibraltar Industries, Inc. | | | |
| $ | 3,367,590 | | | Term Loan, 7.13%, Maturing December 8, 2010 | | $ | 3,365,485 | | |
| | | | | | | $ | 3,365,485 | | |
| Surface Transport — 0.5% | | | |
| Horizon Lines, LLC | | | |
| $ | 5,767,250 | | | Term Loan, 7.62%, Maturing July 7, 2011 | | $ | 5,794,287 | | |
| Laidlaw International, Inc. | | | |
| | 2,587,266 | | | Term Loan, 7.12%, Maturing July 31, 2013 | | | 2,610,442 | | |
| | 7,761,797 | | | Term Loan, 7.12%, Maturing July 31, 2013 | | | 7,831,327 | | |
| Ozburn-Hessey Holding Co., LLC | | | |
| | 3,988,210 | | | Term Loan, 8.78%, Maturing August 9, 2012 | | | 3,993,195 | | |
| Sirva Worldwide, Inc. | | | |
| | 6,983,153 | | | Term Loan, 11.61%, Maturing December 1, 2010 | | | 6,457,238 | | |
| Vanguard Car Rental USA | | | |
| | 11,781,000 | | | Term Loan, 8.35%, Maturing June 14, 2013 | | | 11,881,139 | | |
| | | | | | | $ | 38,567,628 | | |
| Telecommunications — 3.3% | | | |
| Alaska Communications Systems Holdings, Inc. | | | |
| $ | 19,775,000 | | | Term Loan, 7.12%, Maturing February 1, 2012 | | $ | 19,789,832 | | |
| American Cellular Corp. | | | |
| | 3,500,000 | | | Term Loan, 7.63%, Maturing August 7, 2013(2) | | | 3,517,501 | | |
| Asurion Corp. | | | |
| | 10,392,988 | | | Term Loan, 8.32%, Maturing July 13, 2012 | | | 10,451,448 | | |
| BCM Luxembourg, Ltd. | | | |
| EUR | 7,000,000 | | | Term Loan, 5.93%, Maturing September 30, 2014 | | | 8,932,717 | | |
| EUR | 7,000,000 | | | Term Loan, 6.31%, Maturing September 30, 2015 | | | 8,996,384 | | |
| Cellular South, Inc. | | | |
| | 6,905,180 | | | Term Loan, 7.14%, Maturing May 4, 2011 | | | 6,911,657 | | |
See notes to financial statements
32
Floating Rate Portfolio as of October 31, 2006
PORTFOLIO OF INVESTMENTS CONT'D
Principal
Amount | | Borrower/Tranche Description | | Value | |
| Telecommunications (continued) | | | |
| Centennial Cellular Operating Co., LLC | | | |
| $ | 4,500,000 | | | Revolving Loan, 0.00%,
Maturing February 9, 2010(2) | | $ | 4,387,500 | | |
| | 16,147,788 | | | Term Loan, 7.62%, Maturing February 9, 2011 | | | 16,289,081 | | |
| Cincinnati Bell, Inc. | | | |
| | 4,380,750 | | | Term Loan, 6.93%, Maturing August 31, 2012 | | | 4,380,067 | | |
| Consolidated Communications, Inc. | | | |
| | 21,847,842 | | | Term Loan, 7.38%, Maturing July 27, 2015 | | | 21,916,117 | | |
| | | Crown Castle Operating Co. | |
| | 8,977,500 | | | Term Loan, 7.65%, Maturing June 1, 2014 | | | 9,022,388 | | |
| Epicor Software Corp. | | | |
| | 2,487,500 | | | Term Loan, 7.83%, Maturing March 30, 2012 | | | 2,498,383 | | |
| Fairpoint Communications, Inc. | | | |
| | 21,785,000 | | | Term Loan, 7.13%, Maturing February 8, 2012 | | | 21,776,482 | | |
| Hawaiian Telcom Communications, Inc. | | | |
| | 1,450,000 | | | Term Loan, 7.62%, Maturing October 31, 2011 | | | 1,448,188 | | |
| | 5,152,000 | | | Term Loan, 7.62%, Maturing October 31, 2012 | | | 5,168,100 | | |
| Iowa Telecommunications Services | | | |
| | 9,998,000 | | | Term Loan, 7.12%, Maturing November 23, 2011 | | | 10,020,915 | | |
| Madison River Capital, LLC | | | |
| | 3,625,143 | | | Term Loan, 7.62%, Maturing July 29, 2012 | | | 3,647,234 | | |
| NTelos, Inc. | | | |
| | 13,157,325 | | | Term Loan, 7.57%, Maturing August 24, 2011 | | | 13,216,533 | | |
| Stratos Global Corp. | | | |
| | 7,575,000 | | | Term Loan, 8.11%, Maturing February 13, 2012 | | | 7,581,310 | | |
| Syniverse Holdings, Inc. | | | |
| | 3,374,461 | | | Term Loan, 7.37%, Maturing February 15, 2012 | | | 3,382,897 | | |
| TDC AS (Nordic Telephone Company) | | | |
| EUR | 3,000,000 | | | Term Loan, 5.54%, Maturing January 30, 2014 | | | 3,866,544 | | |
| EUR | 3,000,000 | | | Term Loan, 6.04%, Maturing January 30, 2015 | | | 3,882,818 | | |
| Triton PCS, Inc. | | | |
| | 14,949,636 | | | Term Loan, 8.57%, Maturing November 18, 2009 | | | 15,092,899 | | |
| Westcom Corp. | | | |
| | 4,058,202 | | | Term Loan, 8.29%, Maturing December 17, 2010 | | | 4,065,811 | | |
| Windstream Corp. | | | |
| | 34,300,000 | | | Term Loan, 7.12%, Maturing July 17, 2013 | | | 34,520,515 | | |
| Winstar Communications, Inc. | | | |
| | 127,026 | | | DIP Loan, 10.25%, Maturing December 31, 2006(3) | | | 176,883 | | |
| | | | | | | $ | 244,940,204 | | |
| Utilities — 2.5% | | | |
| Astoria Generating Co. | | | |
| $ | 681,049 | | | Term Loan, 7.32%, Maturing February 23, 2011 | | $ | 686,423 | | |
| | 3,455,930 | | | Term Loan, 7.39%, Maturing February 23, 2013 | | | 3,483,201 | | |
Principal
Amount | | Borrower/Tranche Description | | Value | |
| Utilities (continued) | | | |
| BRSP, LLC | | | |
| $ | 15,175,000 | | | Term Loan, 8.58%, Maturing July 13, 2009 | | $ | 15,250,875 | | |
| Calpine Corp. | | | |
| | 7,350,000 | | | DIP Revolving Loan, 0.00%,
Maturing February 27, 2008(2) | | | 7,304,063 | | |
| | 2,880,969 | | | DIP Loan, 7.62%, Maturing February 27, 2008 | | | 2,900,055 | | |
| | 7,275,000 | | | DIP Loan, 9.37%, Maturing February 27, 2008 | | | 7,417,466 | | |
| Cellnet Technology, Inc. | | | |
| | 3,822,633 | | | Term Loan, 8.37%, Maturing April 26, 2012 | | | 3,856,081 | | |
| Cogentrix Delaware Holdings, Inc. | | | |
| | 8,057,380 | | | Term Loan, 6.87%, Maturing April 14, 2012 | | | 8,076,686 | | |
| Covanta Energy Corp. | | | |
| | 6,790,244 | | | Term Loan, 5.37%, Maturing June 24, 2012 | | | 6,855,315 | | |
| | 997,500 | | | Term Loan, 7.62%, Maturing June 24, 2012 | | | 997,500 | | |
| | 4,853,735 | | | Term Loan, 7.62%, Maturing May 27, 2013 | | | 4,900,248 | | |
| KGen, LLC | | | |
| | 5,646,000 | | | Term Loan, 7.99%, Maturing August 5, 2011 | | | 5,667,173 | | |
| La Paloma Generating Co., LLC | | | |
| | 616,677 | | | Term Loan, 7.07%, Maturing August 16, 2012 | | | 615,135 | | |
| | 3,820,773 | | | Term Loan, 7.12%, Maturing August 16, 2012 | | | 3,811,221 | | |
| LSP General Finance Co., LLC | | | |
| | 9,743,449 | | | Term Loan, 7.12%, Maturing May 6, 2013 | | | 9,745,475 | | |
| Mirant North America, LLC. | | | |
| | 7,741,500 | | | Term Loan, 7.07%, Maturing January 3, 2013 | | | 7,744,264 | | |
| NRG Energy, Inc. | | | |
| | 69,740,750 | | | Term Loan, 7.37%, Maturing February 1, 2013 | | | 70,183,903 | | |
| Pike Electric, Inc. | | | |
| | 3,969,263 | | | Term Loan, 6.88%, Maturing July 2, 2012 | | | 3,970,088 | | |
| | 3,018,039 | | | Term Loan, 6.88%, Maturing December 10, 2012 | | | 3,018,667 | | |
| Reliant Energy, Inc. | | | |
| | 10,000,000 | | | Revolving Loan, 0.00%, Maturing April 30, 2008(2) | | | 9,905,000 | | |
| Vulcan Energy Corp. | | | |
| | 10,926,847 | | | Term Loan, 6.90%, Maturing July 23, 2010 | | | 10,947,335 | | |
| | | | | | | $ | 187,336,174 | | |
Total Senior Floating Rate Interests
(identified cost $7,301,619,958) | | $ | 7,335,035,567 | | |
See notes to financial statements
33
Floating Rate Portfolio as of October 31, 2006
PORTFOLIO OF INVESTMENTS CONT'D
| Corporate Bonds & Notes — 1.0% | | | |
Principal
Amount
(000's omitted) | | Security | | Value | |
| Cable and Satellite Television — 0.2% | | | |
| Iesy Hessen & ISH NRW, Variable Rate | | | |
| EUR | 13,500 | | | 6.429%, 4/15/13 | | $ | 17,036,879 | | |
| | | | | | | $ | 17,036,879 | | |
| Electronics / Electrical — 0.1% | | | |
| NXP BV / NXP Funding LLC, Variable Rate | | | |
| $ | 6,300 | | | 8.118%, 10/15/13(5) | | $ | 6,386,625 | | |
| | | | | | | $ | 6,386,625 | | |
| Financial Intermediaries — 0.4% | | | |
| Alzette, Variable Rate | | | |
| $ | 1,180 | | | 8.636%, 12/15/20(5) | | $ | 1,213,925 | | |
| Avalon Capital Ltd. 3, Series 1A, Class D, Variable Rate | | | |
| | 1,140 | | | 7.35%, 2/24/19(5) | | | 1,146,892 | | |
| Babson Ltd., 2005-1A, Class C1, Variable Rate | | | |
| | 1,500 | | | 7.324%, 4/15/19(5) | | | 1,524,010 | | |
| Bryant Park CDO Ltd., Series 2005-1A, Class C, Variable Rate | | | |
| | 1,500 | | | 7.424%, 1/15/19(5) | | | 1,527,758 | | |
| Carlyle High Yield Partners, Series 2004-6A, Class C, Variable Rate | | | |
| | 1,500 | | | 7.854%, 8/11/16(5) | | | 1,525,145 | | |
| Centurion CDO 8 Ltd., Series 2005-8A, Class D, Variable Rate | | | |
| | 1,000 | | | 10.89%, 3/8/17 | | | 1,055,867 | | |
Morgan Stanley Investment Management Croton, Ltd.,
Series 2005-1A, Class D, Variable Rate | | | |
| | 2,000 | | | 7.324%, 1/15/18(5) | | | 2,019,226 | | |
| Sonata Securities S.A., Series 2006-5 | | | |
| | 7,000 | | | 8.999%, 6/27/07 | | | 7,049,700 | | |
| Sonata Securities S.A., Series 2006-6 | | | |
| | 10,000 | | | 8.999%, 6/27/07 | | | 10,069,100 | | |
| | | | | | | $ | 27,131,623 | | |
| Radio and Television — 0.0% | | | |
| Paxson Communications Corp., Variable Rate | | | |
| $ | 3,000 | | | 8.624%, 1/15/12(5) | | $ | 3,048,750 | | |
| | | | | | | $ | 3,048,750 | | |
| Real Estate — 0.1% | | | |
| Assemblies of God, Variable Rate | | | |
| $ | 9,916 | | | 7.555%, 6/15/29(5) | | $ | 9,916,478 | | |
| | | | | | | $ | 9,916,478 | | |
Principal
Amount
(000's omitted) | | Security | | Value | |
| Telecommunications — 0.2% | | | |
| Qwest Corp., Sr. Notes, Variable Rate | | | |
| $ | 5,850 | | | 8.64%, 6/15/13(5) | | $ | 6,332,625 | | |
| Rogers Wireless, Inc., Variable Rate | | | |
| | 6,589 | | | 8.515%, 12/15/10 | | | 6,745,489 | | |
| | | | | | | $ | 13,078,114 | | |
Total Corporate Bonds & Notes
(identified cost $74,967,174) | | $ | 76,598,469 | | |
| Common Stocks — 0.1% | | | |
| Shares | | Security | | Value | |
| | 105,145 | | | Hayes Lemmerz International(6) | | $ | 225,010 | | |
| | 86,020 | | | Maxim Crane Works, L.P.(6) | | | 4,053,673 | | |
Total Common Stocks
(identified cost $2,549,911) | | $ | 4,278,683 | | |
| Preferred Stocks — 0.0% | | | |
| Shares | | Security | | Value | |
| | 350 | | | Hayes Lemmerz International(4)(6)(7) | | $ | 3,236 | | |
Total Preferred Stocks
(identified cost $17,500) | | $ | 3,236 | | |
| Closed-End Investment Companies — 0.0% | | | |
| Shares | | Security | | Value | |
| | 4,000 | | | Pioneer Floating Rate Trust | | $ | 76,080 | | |
Total Closed-End Investment Companies
(identified cost $72,148) | | $ | 76,080 | | |
| Short-Term Investments — 2.8% | | | |
Principal
Amount | | Maturity
Date | | Borrower | | Rate | | Amount | |
| $ | 67,587,000 | | | 11/01/06 | | Abbey National North
America LLC,
Commercial Paper | | | 5.31 | % | | $ | 67,587,000 | | |
| | 142,465,000 | | | 11/01/06 | | HSBC Finance Corp.,
Commercial Paper | | | 5.31 | % | | | 142,465,000 | | |
Total Short-Term Investments
(at amortized cost $210,052,000) | | $ | 210,052,000 | | |
See notes to financial statements
34
Floating Rate Portfolio as of October 31, 2006
PORTFOLIO OF INVESTMENTS CONT'D
| | | Amount | |
Total Investments — 102.6%
(identified cost $7,589,278,691) | | $ | 7,626,044,035 | | |
Less Unfunded Loan
Commitments — (3.7)% | | $ | (277,946,866 | ) | |
Net Investments — 98.9%
(identified cost $7,311,331,825) | | $ | 7,348,097,169 | | |
| Other Assets, Less Liabilities — 1.1% | | $ | 82,395,970 | | |
| Net Assets — 100.0% | | $ | 7,430,493,139 | | |
CHF - Swiss Franc
EUR - Euro
GBP - British Pound
(1) Senior floating-rate interests often require prepayments from excess cash flows or permit the borrower to repay at its election. The degree to which borrowers repay, whether as a contractual requirement or at their election, cannot be predicted with accuracy. As a result, the actual remaining maturity may be substantially less than the stated maturities shown. However, it is anticipated that the senior floating-rate interests will have an expected average life of approximately two to three years. The stated interest rate represents the weighted average interest rate of all contracts within the senior loan facility. Senior Loans typically have rates of interest which are redetermined either daily, monthly, quarterly or
semi-annually by reference to a base lending rate, plus a premium. These base lending rates are primarily the London-Interbank Offered Rate ("LIBOR"), and secondarily the prime rate offered by one or more major United States banks (the "Prime Rate") and the certificate of deposit ("CD") rate or other base lending rates used by commercial lenders.
(2) Unfunded loan commitments. See Note 1E for description.
(3) Defaulted security. Currently the issuer is in default with respect to interest payments.
(4) Security valued at fair value using methods determined in good faith by or at the direction of the Trustees.
(5) Security exempt from registration under Rule 144A of the Securities Act of 1933. These securities may be sold in transactions exempt from registration, normally to qualified institutional buyers. At October 31, 2006, the aggregate value of the securities is $34,641,434 or 0.5% of the Portfolio's net assets.
(6) Non-income producing security.
(7) Restricted security.
See notes to financial statements
35
Floating Rate Portfolio as of October 31, 2006
FINANCIAL STATEMENTS
Statement of Assets and Liabilities
As of October 31, 2006
| Assets | |
| Investments, at value (identified cost, $7,311,331,825) | | $ | 7,348,097,169 | | |
| Cash | | | 28,339,272 | | |
| Foregn currency, at value (identified cost, $17,947) | | | 17,576 | | |
| Receivable for investments sold | | | 5,105,400 | | |
| Interest and dividends receivable | | | 54,414,214 | | |
| Receivable for open swap contracts | | | 1,494,324 | | |
| Prepaid expenses | | | 676,600 | | |
| Total assets | | $ | 7,438,144,555 | | |
| Liabilities | |
| Payable for open forward foreign currency contracts | | $ | 4,084,652 | | |
| Payable to affiliate for investment advisory fees | | | 3,197,568 | | |
| Payable to affiliate for Trustees' fees | | | 2,533 | | |
| Accrued expenses | | | 366,663 | | |
| Total liabilities | | $ | 7,651,416 | | |
| Net Assets applicable to investors' interest in Portfolio | | $ | 7,430,493,139 | | |
| Sources of Net Assets | |
| Net proceeds from capital contributions and withdrawals | | $ | 7,396,708,123 | | |
| Net unrealized appreciation (computed on the basis of identified cost) | | | 33,785,016 | | |
| Total | | $ | 7,430,493,139 | | |
Statement of Operations
For the Year Ended
October 31, 2006
| Investment Income | |
| Interest | | $ | 490,026,227 | | |
| Dividends | | | 6,574 | | |
| Total investment income | | $ | 490,032,801 | | |
| Expenses | |
| Investment adviser fee | | $ | 35,804,388 | | |
| Trustees' fees and expenses | | | 30,804 | | |
| Custodian fee | | | 975,491 | | |
| Legal and accounting services | | | 816,329 | | |
| Miscellaneous | | | 725,288 | | |
| Total expenses | | $ | 38,352,300 | | |
Deduct —
Reduction of custodian fee | | $ | 130,282 | | |
| Total expense reductions | | $ | 130,282 | | |
| Net expenses | | $ | 38,222,018 | | |
| Net investment income | | $ | 451,810,783 | | |
| Realized and Unrealized Gain (Loss) | |
Net realized gain (loss) —
Investment transactions (identified cost basis) | | $ | (2,465,912 | ) | |
| Swap contracts | | | 1,411,162 | | |
Foreign currency and forward foreign currency exchange
contract transactions | | | (21,129,036 | ) | |
| Net realized loss | | $ | (22,183,786 | ) | |
Change in unrealized appreciation (depreciation) —
Investments (identified cost basis) | | $ | 7,061,625 | | |
| Swap contracts | | | 1,255,356 | | |
| Foreign currency and forward foreign currency exchange contracts | | | (8,347,803 | ) | |
| Net change in unrealized appreciation (depreciation) | | $ | (30,822 | ) | |
| Net realized and unrealized loss | | $ | (22,214,608 | ) | |
| Net increase in net assets from operations | | $ | 429,596,175 | | |
See notes to financial statements
36
Floating Rate Portfolio as of October 31, 2006
FINANCIAL STATEMENTS CONT'D
Statements of Changes in Net Assets
Increase (Decrease)
in Net Assets | | Year Ended
October 31, 2006 | | Year Ended
October 31, 2005 | |
From operations —
Net investment income | | $ | 451,810,783 | | | $ | 286,479,439 | | |
Net realized loss from investment
transactions, swap contracts,
foreign currency, and forward
foreign currency exchange
contract transactions | | | (22,183,786 | ) | | | (6,260,828 | ) | |
Net change in unrealized appreciation
(depreciation) from investments,
swap contracts, foreign currency,
and forward foreign currency
exchange contracts | | | (30,822 | ) | | | 5,235,160 | | |
| Net increase in net assets from operations | | $ | 429,596,175 | | | $ | 285,453,771 | | |
Capital transactions —
Contributions | | $ | 2,989,478,752 | | | $ | 2,972,303,225 | | |
| Withdrawals | | | (2,494,639,771 | ) | | | (2,141,337,314 | ) | |
Net increase in net assets from
capital transactions | | $ | 494,838,981 | | | $ | 830,965,911 | | |
| Net increase in net assets | | $ | 924,435,156 | | | $ | 1,116,419,682 | | |
| Net Assets | |
| At beginning of year | | $ | 6,506,057,983 | | | $ | 5,389,638,301 | | |
| At end of year | | $ | 7,430,493,139 | | | $ | 6,506,057,983 | | |
See notes to financial statements
37
Floating Rate Portfolio as of October 31, 2006
FINANCIAL STATEMENTS CONT'D
Supplementary Data
| | | Year Ended October 31, | |
| | | 2006 | | 2005 | | 2004 | | 2003 | | 2002 | |
| Ratios/Supplemental Data | |
| Ratios (As a percentage of average daily net assets): | |
| Expenses before custodian fee reduction | | | 0.54 | % | | | 0.54 | % | | | 0.56 | % | | | 0.61 | % | | | 0.62 | % | |
| Expenses after custodian fee reduction | | | 0.54 | % | | | 0.54 | % | | | 0.56 | % | | | 0.61 | % | | | 0.62 | % | |
| Net investment income | | | 6.44 | % | | | 4.68 | % | | | 3.27 | % | | | 4.05 | % | | | 4.72 | % | |
| Portfolio Turnover | | | 50 | % | | | 57 | % | | | 67 | % | | | 64 | % | | | 76 | % | |
| Total Return | | | 6.36 | % | | | 4.77 | % | | | 3.93 | % | | | 6.91 | % | | | 2.19 | % | |
| Net assets, end of year (000's omitted) | | $ | 7,430,493 | | | $ | 6,506,058 | | | $ | 5,389,638 | | | $ | 2,217,874 | | | $ | 1,326,128 | | |
See notes to financial statements
38
Floating Rate Portfolio as of October 31, 2006
NOTES TO FINANCIAL STATEMENTS
1 Significant Accounting Policies
Floating Rate Portfolio (the Portfolio) is registered under the Investment Company Act of 1940 as an open-end management investment company. The Portfolio was organized as a trust under the laws of the State of New York on June 19, 2000. The Portfolio's investment objective is to provide a high level of current income. The Portfolio normally primarily invests in interests of senior floating rate loans. The Declaration of Trust permits the Trustees to issue interests in the Portfolio. At October 31, 2006, the Eaton Vance Floating-Rate Fund, Eaton Vance Floating-Rate & High Income Fund, Eaton Vance Medallion Floating-Rate Income Fund, Eaton Vance Strategic Income Fund, Eaton Vance Diversified Income Fund, Eaton Vance Medallion Strategic Income Fund and Eaton Vance Low Duration Fund held an approximate 66.9%, 22.3%, 3.8%, 3.7%, 1.4%, 0.5% and 0.1% interest in the Portfolio, respectively. The following is a summary of significan t accounting policies of the Portfolio. The policies are in conformity with accounting principles generally accepted in the United States of America.
A Investment Valuation — The Portfolio's investments are primarily in interests in senior floating rate loans (Senior Loans). Certain Senior Loans are deemed to be liquid because reliable market quotations are readily available for them. Liquid Senior Loans are valued on the basis of prices furnished by a pricing service. Other Senior Loans are valued at fair value by the investment adviser under procedures approved by the Trustees. In connection with determining the fair value of a Senior Loan, the investment adviser makes an assessment of the likelihood that the borrower will make a full repayment of the Senior Loan. The primary factors considered by the investment adviser when making this assessment are (i) the creditworthiness of the borrower, (ii) the value of the co llateral backing the Senior Loan, and (iii) the priority of the Senior Loan versus other creditors of the borrower. If, based on its assessment, the investment adviser believes there is a reasonable likelihood that the borrower will make a full repayment of the Senior Loan, the investment adviser will determine the fair value of the Senior Loan using a matrix pricing approach that considers the yield on the Senior Loan relative to yields on other loan interests issued by companies of comparable credit quality. If, based on its assessment, the investment adviser believes there is not a reasonable likelihood that the borrower will make a full repayment of the Senior Loan, the investment adviser will determine the fair value of the Senior Loan using analyses that include but are not limited to (i) a comparison of the value of the borrower's outstanding equity and debt to that of comparable public companies; (ii) a discounted cash flow analysis; or (iii) when the investment adviser believes it is likely that a borrower will be liquidated or sold, an analysis of the terms of such liquidation or sale. In certain cases, the investment adviser will use a combination of analytical methods to determine fair value, such as when only a portion of a borrower's assets are likely to be sold. In conducting its assessment and analyses for purposes of determining fair value of a Senior Loan, the investment adviser will use its discretion and judgment in considering and appraising such factors, data and information and the relative weight to be given thereto as it deems relevant, including without limitation, some or all of the following: (i) the fundamental characteristics of and fundamental analytical data relating to the Senior Loan, including the cost, size, current interest rate, maturity and base lending rate of the Senior Loan, the terms and conditions of the Senior Loan and any related agreements, and the position of the Senior Loan in the borrower's debt structure; (ii) the nature, adequacy and value of the collateral securing the Senior Loan, including the Portfolio's rights, remedies and interests with respect to the collateral; (iii) the creditworthiness of the borrower, based on an evaluation of, among other things, its financial condition, financial statements and information about the borrower's business, cash flows, capital structure and future prospects; (iv) information relating to the market for the Senior Loan including price quotations for and trading in the Senior Loan, interests in similar Senior Loans and the market environment, investor attitudes towards the Senior Loan and interests in similar Senior Loans; (v) the experience, reputation, stability and financial condition of the Agent and any intermediate participants in the Senior Loan; and (vi) general economic and market conditions affecting the fair value of the Senior Loan. Fair value determinations are made by the portfolio managers of a Trust based on information available to suc h managers. The portfolio managers of other trusts managed by Eaton Vance that invest in Senior Loans may not possess the same information about a Senior Loan borrower as the portfolio managers of Floating Rate Portfolio. At times, the fair value of a Senior Loan determined by the portfolio managers of other trusts managed by Eaton Vance that invest in Senior Loans may vary from the fair value of the same Senior Loan determined by the portfolio managers of Floating Rate Portfolio. The fair value of each Senior Loan is periodically reviewed and approved by the investment adviser's Valuation Committee and by the Trustees based upon procedures approved by the Trustees. Junior Loans are valued in the same manner as Senior Loans.
Other portfolio securities (other than short-term obligations, but including listed issues) may be valued on the basis of prices furnished by one or more pricing services which determine prices for normal, institutional-size trading units
39
Floating Rate Portfolio as of October 31, 2006
NOTES TO FINANCIAL STATEMENTS CONT'D
of such securities which may use market information, transactions for comparable securities and various relationships between securities which are generally recognized by institutional traders. The value of interest rate swaps will be based on dealer quotations. Short-term obligations which mature in sixty days or less are valued at amortized cost, which approximates value. If short-term debt securities are acquired with a remaining maturity of more than 60 days, they will be valued by a pricing service. Over-the-counter options are valued at the mean between the bid and the asked price provided by dealers. Marketable securities listed on the NASDAQ National Market System are valued at the NASDAQ official closing price. Financial futures contracts listed on the commodity exchanges and options thereon are valued at closing settlement prices. Repurchase agreements are valued at cost plus accrued interest. Other portfolio securitie s for which there are no quotations or valuations and investments for which the price of the security is not believed to represent its fair market value, are valued at fair value using methods determined in good faith by or at the direction of the Trustees of the Trust. Occasionally, events affecting the value of foreign securities may occur between the time trading is completed abroad and the close of the Exchange which will not be reflected in the computation of the Trust's net asset value (unless the Trust deems that such event would materially affect its net asset value in which case an adjustment would be made and reflected in such computation). The Trust may rely on an independent fair valuation service in making any such adjustment as to the value of a foreign equity security.
B Foreign Currency Translation — Investment valuations, other assets, and liabilities initially expressed in foreign currencies are converted each business day into U.S. dollars based upon current exchange rates. Purchases and sales of foreign investment securities and income and expenses are converted into U.S. dollars based upon currency exchange rates prevailing on the respective dates of such transactions. Recognized gains or losses on investment transactions attributable to changes in foreign currency exchange rates are recorded for financial statement purposes as net realized gains and losses on investments. That portion of unrealized gains and losses on investments that results from fluctuations in foreign currency exchange rates is not separately disclosed.
C Income — Interest income is recorded on the basis of interest accrued, adjusted for amortization of premium or accretion of discount. Fees associated with loan amendments are recognized immediately. Dividend income is recorded on the ex-dividend date for dividends received in cash and/or securities.
D Federal Taxes — The Portfolio has elected to be treated as a partnership for federal tax purposes. No provision is made by the Portfolio for federal or state taxes on any taxable income of the Portfolio because each investor in the Portfolio is ultimately responsible for the payment of any taxes on its share of taxable income. Since at least one of the Portfolio's investors is a regulated investment company that invests all or substantially all of its assets in the Portfolio, the Portfolio normally must satisfy the applicable source of income and diversification requirements (under the Internal Revenue Code) in order for its investors to satisfy them. The Portfolio will allocate, at least annually among its investors, each investor's distributive share of the Portfolio' s net investment income, net realized capital gains, and any other items of income, gain, loss, deduction or credit.
E Unfunded Loan Commitments — The Portfolio may enter into certain credit agreements all or a portion of which may be unfunded. The Portfolio is obligated to fund these commitments at the borrower's discretion. These commitments are disclosed in the accompanying Portfolio of Investments.
F Forward Foreign Currency Exchange Contracts — The Portfolio may enter into forward foreign currency exchange contracts for the purchase or sale of a specific foreign currency at a fixed price on a future date. Risks may arise upon entering these contracts from the potential inability of counterparties to meet the terms of their contracts and from movements in the value of a foreign currency relative to the U.S. dollar. The Portfolio will enter into forward contracts for hedging purposes as well as non-hedging purposes. The forward foreign currency exchange contracts are adjusted by the daily exchange rate of the underlying currency and any gains or losses are recorded for financial statement purposes as unrealized until such time as the contracts have been closed.
G Interest Rate Swaps — The Portfolio may enter into interest rate swap agreements for risk management purposes and not as a speculative investment. Pursuant to these agreements the Portfolio receives quarterly payments at a rate equal to a predetermined three-month London Interbank Offering Rate (LIBOR). In exchange, the Portfolio makes semi-annual payments at a predetermined fixed rate of interest. During the term of the outstanding swap agreement, changes in the underlying value of the swap are recorded as unrealized gains and losses. The value of the swap is determined by changes in the relationship between two rates of interest. The Portfolio is exposed to
40
Floating Rate Portfolio as of October 31, 2006
NOTES TO FINANCIAL STATEMENTS CONT'D
credit loss in the event of non-performance by the swap counterparty. The Portfolio does not anticipate non-performance by the counterparty. Risk may also arise from the unanticipated movements in value of interest rates.
H Credit Default Swaps — The Portfolio may enter into credit default swap contracts for risk management purposes, including diversification. When the Portfolio is the buyer of a credit default swap contract, the Portfolio is entitled to receive the par (or other agreed-upon) value of a referenced debt obligation from the counterparty to the contract in the event of a default by a third party, such as a U.S or foreign corporate issuer, on the debt obligation. In return, the Portfolio would pay the counterparty a periodic stream of payments over the term of the contract provided that no event of default has occurred. If no default occurs, the Portfolio would have made a stream of payments and received no benefit from the contract reducing exposure to the credit by the notio nal amount of the contract upon default of the referenced debt obligation. As the seller, the Portfolio would effectively add leverage to its portfolio because, in addition to its total net assets, the Portfolio would be subject to investment exposure on the notional amount of the swap. The Portfolio will segregate assets in the form of cash and cash equivalents in an amount equal to the aggregate market value of the credit default swaps of which it is the seller, marked to market on a daily basis. These transactions involve certain risks, including the risk that the seller may be unable to fulfill the transaction.
I Expense Reduction — Investors Bank & Trust Company (IBT) serves as custodian of the Portfolio. Pursuant to the custodian agreement, IBT receives a fee reduced by credits which are determined based on the average daily cash balance the Portfolio maintains with IBT. All credit balances used to reduce the Portfolio's custodian fees are reported as a reduction of expenses in the Statement of Operations.
J Use of Estimates — The preparation of the financial statements in conformity with accounting principles generally accepted in the United States of America requires management to make estimates and assumptions that affect the reported amounts of assets and liabilities at the date of the financial statements and the reported amounts of income and expense during the reporting period. Actual results could differ from those estimates.
K Indemnifications — Under the Portfolio's organizational documents, its officers and Trustees may be indemnified against certain liabilities and expenses arising out of the performance of their duties to the Portfolio. Interestholders in the Portfolio are jointly and severally liable for the liabilities and obligations of the Portfolio in the event that the Portfolio fails to satisfy such liabilities and obligations; provided, however, that, to the extent assets are available in the Portfolio, the Portfolio may, under certain circumstances, indemnify interestholders from and against any claim or liability to which such holder may become subject by reason of being or having been an interestholder in t he Portfolio. Additionally, in the normal course of business, the Portfolio enters into agreements with service providers that may contain indemnification clauses. The Portfolio's maximum exposure under these arrangements is unknown as this would involve future claims that may be made against the Portfolio that have not yet occurred.
L Other — Investment transactions are accounted for on the date the securities are purchased or sold. Realized gains and losses on securities sold are determined on the basis of identified cost.
2 Investment Adviser Fee and Other Transactions with Affiliates
The investment adviser fee is earned by BMR, as compensation for management and investment advisory services rendered to the Portfolio. The fee is equivalent to 0.575% of the Portfolio's average daily net assets up to $1 billion and at reduced rates as daily net assets exceed that level. Due to an agreement effective as of March 27, 2006, if the Portfolio's average daily net assets exceed $5 billion but are less than $10 billion the fee is equivalent to 0.480% and if average daily net assets exceed $10 billion the fee is equivalent to 0.460%. For the year ended October 31, 2006, the fee was equivalent to 0.510% of the Portfolio's average net assets for such period and amounted to $35,804,388.
Except as to Trustees of the Portfolio who are not members of EVM's or BMR's organization, officers and Trustees receive remuneration for their services to the Portfolio out of such investment adviser fee. Trustees of the Portfolio that are not affiliated with the Investment Adviser may elect to defer receipt of all or a portion of their annual fees in accordance with the terms of the Trustees Deferred Compensation Plan. For the year ended October 31, 2006, no significant amounts have been deferred. Certain officers and Trustees of the Portfolio are officers of the above organizations.
3 Investments
The Portfolio invests primarily in Senior Loans. The ability of the issuers of the Senior Loans to meet their obligations
41
Floating Rate Portfolio as of October 31, 2006
NOTES TO FINANCIAL STATEMENTS CONT'D
may be affected by economic developments in a specific industry. The cost of purchases and the proceeds from principal repayments and sales of Senior Loans for the year ended October 31, 2006 aggregated $4,461,606,319, $2,838,240,323 and $584,362,726, respectively.
4 Line of Credit
The Portfolio participates with other portfolios managed by BMR in a $550 million unsecured line of credit agreement with a group of banks to permit the Portfolio to invest in accordance with its investment practices. Interest is charged under the credit agreement at the bank's base rate or at an amount above LIBOR. In addition, a fee computed at the annual rate of 0.08% of the daily unused portion of the line of credit is allocated among the participating portfolios at the end of each quarter. As of October 31, 2006, the Portfolio had no borrowings outstanding. The Portfolio did not have any significant borrowings or allocated fees during the year ended October 31, 2006.
5 Federal Income Tax Unrealized Appreciation (Depreciation)
The cost and unrealized appreciation/depreciation in the value of the investments owned at October 31, 2006, as determined on a federal income tax basis, were as follows:
| Aggregate Cost | | $ | 7,311,337,977 | | |
| Gross unrealized appreciation | | $ | 60,613,798 | | |
| Gross unrealized depreciation | | | (23,854,606 | ) | |
| Net unrealized appreciation | | $ | 36,759,192 | | |
The net unrealized depreciation on foreign currency, forward foreign currency exchange contracts and swap contracts at October 31, 2006 on a federal income tax basis was $2,980,338.
6 Financial Instruments
The Portfolio may trade in financial instruments with
off-balance sheet risk in the normal course of its investing activities and to assist in managing exposure to various market risks. These financial instruments include written options, financial futures contracts, forward foreign currency contracts, credit default swaps, and interest rate swaps and may involve, to a varying degree, elements of risk in excess of the amounts recognized for financial statement purposes. The notional or contractual amounts of these instruments represent the investment the Portfolio has in particular classes of financial instruments and does not necessarily represent the amounts potentially subject to risk. The measurement of the risks associated with these instruments is meaningful only when all related and offsetting transactions are considered. A summary of obligations under these financial instruments at October 31, 2006 was as follows:
Forward Foreign Currency Exchange Contracts
| Sales | |
| Settlement Date | | Deliver | | In exchange for | | Net Unrealized
Depreciation | |
11/30/06
| | Swiss Franc
12,494,538 | | United States Dollar
10,019,677 | | $(53,365) | |
11/30/06
| | Euro
1,000,000 | | United States Dollar
1,262,500 | | (15,775) | |
11/30/06
| | Euro
471,533,063 | | United States Dollar
599,893,793 | | (2,855,133) | |
11/30/06
| | British Pound
1,500,000 | | United States Dollar
2,816,430 | | (45,127) | |
11/30/06
| | British Pound
98,987,264 | | United States Dollar
187,729,347 | | (1,109,152) | |
| | | | | | | $ | (4,078,552 | ) | |
| Purchases | |
| Settlement Date | | In exchange for | | Deliver | | Net Unrealized
Depreciation | |
| 11/30/06 | | Euro
2,000,000 | | United States Dollar
2,559,600 | | $(3,050) | |
| 11/30/06 | | Euro
2,000,000 | | United States Dollar
2,559,600 | | (3,050) | |
| | | | | | | $ | (6,100 | ) | |
Credit Default Swaps
Notional
Amount | | Expiration
Date | | Description | | Net Unrealized
Appreciation | |
| | 10,000,000 USD
| | | 12/20/2009
| | Agreement with Lehman
Brothers dated 10/28/2004
whereby the Portfolio will
receive 2.35% per year times
the notional amount. The
Portfolio makes a payment of
the notional amount only upon
a default event on the reference
entity, a Revolving Credit
Agreement issued by Crown
Americas, Inc. | | | $257,166
| | |
| | 5,000,000 USD
| | | 3/20/2010
| | Agreement with Lehman
Brothers dated 12/21/2004
whereby the Portfolio will receive
2.70% per year times the
notional amount. The Portfolio
makes a payment of the
notional amount only upon a
default event on the reference
entity, a Revolving Credit
Agreement issued by Six Fl ags
Theme Parks. | | | 85,606
| | |
42
Floating Rate Portfolio as of October 31, 2006
NOTES TO FINANCIAL STATEMENTS CONT'D
Notional
Amount | | Expiration
Date | | Description | | Net Unrealized
Appreciation | |
3,000,000 USD
| | 3/20/2011
| | Agreement with Lehman
Brothers dated 3/3/2005
whereby the Portfolio will receive
1.85% per year times the
notional amount. The Portfolio
makes a payment of the
notional amount only upon a
default event on the reference
entity, a Revolving Credit
Agreement issued by Synivers e
Technologies, Inc. | | $4,369
| |
6,500,000 USD
| | 3/20/2010
| | Agreement with Lehman
Brothers dated 3/16/2005
whereby the Portfolio will receive
2.2% per year times the
notional amount. The Portfolio
makes a payment of the
notional amount only upon a
default event on the reference
entity, a Revolving Credit
Agreement issued by Inergy, L.P. | | 274,538
| |
3,000,000 USD
| | 6/20/2010
| | Agreement with Lehman
Brothers dated 4/1/2005
whereby the Portfolio will receive
2% per year times the notional
amount. The Portfolio makes a
payment of the notional amount
only upon a default event on
the reference entity, a Revolving
Credit Agreement issued by
Pinnacle En tertainment, Inc. | | 41,084
| |
3,000,000 USD
| | 3/20/2010
| | Agreement with Lehman
Brothers dated 5/19/2005
whereby the Portfolio will
receive 2.4% per year times the
notional amount. The Portfolio
makes a payment of the
notional amount only upon a
default event on the reference
entity, a Revolving Credit
Agreement issued by Inergy, L.P. | | 144,854
| |
3,000,000 USD
| | 6/20/2010
| | Agreement with Lehman
Brothers dated 5/19/2005
whereby the Portfolio will
receive 3.25% per year times
the notional amount. The
Portfolio makes a payment of
the notional amount only upon
a default event on the reference
entity, a Revolving Credit
Agreement issued by Rural
Cellular Corp. | | 44,541
| |
Notional
Amount | | Expiration
Date | | Description | | Net Unrealized
Appreciation | |
3,000,000 USD
| | 6/20/2011
| | Agreement with Lehman
Brothers dated 6/2/2005
whereby the Portfolio will
receive 2.3% per year times
the notional amount. The
Portfolio makes a payment of
the notional amount only upon
a default event on the reference
entity, a Revolving Credit
Agreement issued by Syniverse
Technologies, Inc. | | $48,080
| |
7,000,000 USD
| | 9/21/2009
| | Agreement with Lehman
Brothers dated 7/9/2005
whereby the Portfolio will
receive 2.15% per year times
the notional amount. The
Portfolio makes a payment of
the notional amount only upon
a default event on the reference
entity, a Revolving Credit
Agreement issued by CSG
Systems, Inc. | | 118,018
| |
2,000,000 USD
| | 9/20/2010
| | Agreement with Lehman
Brothers dated 7/9/2005
whereby the Portfolio will
receive 1.95% per year times
the notional amount. The
Portfolio makes a payment of
the notional amount only upon
a default event on the reference
entity, a Revolving Credit
Agreement issued by Pinnacle
Entertainment, Inc. | | 23,602
| |
5,000,000 USD
| | 12/20/2010
| | Agreement with Lehman
Brothers dated 10/26/2005
whereby the Portfolio will
receive 2.15% per year times
the notional amount. The
Portfolio makes a payment of
the notional amount only upon
a default event on the
reference entity, a Revolving
Credit Agreement issued by
EPCO Holdings, Inc. | | 126,030
| |
5,000,000 USD
| | 12/20/2010
| | Agreement with Lehman
Brothers dated 12/3/2005
whereby the Portfolio will
receive 2.10% per year times
the notional amount. The
Portfolio makes a payment of
the notional amount only upon
a default event on the reference
entity, a Revolving Credit
Agreement issued by Avago Technologies, Inc. | | 120,738
| |
43
Floating Rate Portfolio as of October 31, 2006
NOTES TO FINANCIAL STATEMENTS CONT'D
Notional
Amount | | Expiration
Date | | Description | | Net Unrealized
Appreciation | |
| | 5,000,000 USD
| | | 3/20/2011
| | Agreement with Lehman
Brothers dated 1/6/2006
whereby the Portfolio will
receive 1.80% per year times
the notional amount. The
Portfolio makes a payment of
the notional amount only upon
a default event on the reference
entity, a Revolving Credit
Agreement issued by The
Hertz Corp. | | | $98,884
| | |
| | 5,000,000 USD
| | | 9/20/2011
| | Agreement with Lehman
Brothers dated 7/1/2006
whereby the Portfolio will
receive 1.95% per year times
the notional amount. The
Portfolio makes a payment of
the notional amount only upon
a default event on the reference
entity, a Revolving Credit
Agreement issued by
Owens-Illinois, Inc. | | | 106,814
| | |
At October 31, 2006, the Portfolio had sufficient cash and/or securities to cover commitments under these contracts.
8 Restricted Securities
At October 31, 2006, the Portfolio owned the following securities (representing less than 0.1% of net assets) which were restricted as to public resale and not registered under the Securities Act of 1933 (excluding Rule 144A securities). The Portfolio has various registration rights (exercisable under a variety of circumstances) with respect to these securities. The fair value of these securities is determined based on valuations provided by brokers when available, or if not available, they are valued at fair value using methods determined in good faith by or at the direction of the Trustees.
Restricted Securities
| Description | | Date of
Acquisition | | Shares/Face | | Cost | | Fair Value | |
| Preferred Stocks | |
Hayes Lemmerz
International | | 6/23/03 | | | 350 | | | $ | 17,500 | | | $ | 3,236 | | |
| | | $ | 17,500 | | | $ | 3,236 | | |
9 Recently Issued Accounting Pronouncements
In June 2006, the Financial Accounting Standards Board ("FASB") issued FASB Interpretation No. 48, ("FIN 48") "Accounting for Uncertainty in Income Taxes – an interpretation of FASB Statement No. 109". FIN 48 clarifies the accounting for uncertainty in income taxes recognized in accordance with FASB Statement No. 109, "Accounting for Income Taxes." This interpretation prescribes a recognition threshold and measurement attribute for the financial statement recognition and measurement of a tax position taken or expected to be taken in a tax return. It also provides guidance on de-recognition, classification, interest and penalties, accounting in interim periods, disclosure and transition. FIN 48 is effective for fiscal years beginning after December 15, 2006. Management is currently evaluating the impact of applying the various provisions of FIN 48.
In September 2006, the Financial Accounting Standards Board ("FASB") issued Statement of Financial Accounting Standards No. 157, ("FAS 157") "Fair Value Measurements". FAS 157 defines fair value, establishes a framework for measuring fair value in accordance with generally accepted accounting principles and expands disclosure about fair value measurements. FAS 157 is effective for fiscal years beginning after November 15, 2007. Management is currently evaluating the impact the adoption of FAS 157 will have on the Fund's financial statement disclosures.
44
Floating Rate Portfolio as of October 31, 2006
REPORT OF INDEPENDENT REGISTERED PUBLIC ACCOUNTING FIRM
To the Trustees and Investors
of Floating Rate Portfolio:
We have audited the accompanying statement of assets and liabilities of Floating Rate Portfolio (the Portfolio), including the portfolio of investments, as of October 31, 2006, and the related statement of operations for the year then ended, the statements of changes in net assets for each of the two years in the period then ended, and the supplementary data for each of the five years in the period then ended. These financial statements and supplementary data are the responsibility of the Portfolio's management. Our responsibility is to express an opinion on these financial statements and supplementary data based on our audits.
We conducted our audits in accordance with standards of the Public Company Accounting Oversight Board (United States). Those standards require that we plan and perform the audit to obtain reasonable assurance about whether the financial statements and supplementary data are free of material misstatement. The Portfolio is not required to have, nor were we engaged to perform, an audit of its internal control over financial reporting. Our audits included consideration of internal control over financial reporting as a basis for designing audit procedures that are appropriate in the circumstances, but not for the purpose of expressing an opinion on the effectiveness of the Portfolio's internal control over financial reporting. Accordingly, we express no such opinion. An audit also includes examining, on a test basis, evidence supporting the amounts and disclosures in the financial statements, assessing the accounting principles used and significant estimates made by management, as well as evaluating the overall financial statement presentation. Our procedures included confirmation of securities and senior loans owned as of October 31, 2006 by correspondence with the custodian and selling or agent banks; where replies were not received from selling or agent banks, we performed other auditing procedures. We believe that our audits provide a reasonable basis for our opinion.
In our opinion, the financial statements and supplementary data referred to above present fairly, in all material respects, the financial position of Floating-Rate Portfolio as of October 31, 2006, the results of its operations for the year then ended, the changes in its net assets for each of the two years in the period then ended, and the supplementary data for each of the five years in the period then ended, in conformity with accounting principles generally accepted in the United States of America.
DELOITTE & TOUCHE LLP
Boston, Massachusetts
December 15, 2006
45
Eaton Vance Floating-Rate Fund
BOARD OF TRUSTEES' ANNUAL APPROVAL OF THE INVESTMENT ADVISORY AGREEMENT
Overview of the Contract Review Process
The Investment Company Act of 1940, as amended (the "1940 Act"), provides, in substance, that each investment advisory agreement between a fund and its investment adviser will continue in effect from year to year only if its continuance is approved at least annually by the fund's board of trustees, including by a vote of a majority of the trustees who are not "interested persons" of the fund ("Independent Trustees") cast in person at a meeting called for the purpose of considering such approval.
At a meeting of the Boards of Trustees (each a "Board") of the Eaton Vance group of mutual funds (the "Eaton Vance Funds") held on March 27, 2006, the Board, including a majority of the Independent Trustees, voted to approve continuation of existing advisory and sub-advisory agreements for the Eaton Vance Funds for an additional one-year period. In voting its approval, the Board relied upon the affirmative recommendation of the Special Committee of the Board, which is a committee comprised exclusively of Independent Trustees. Prior to making its recommendation, the Special Committee reviewed information furnished for a series of meetings of the Special Committee held in February and March 2006. Such information included, among other things, the following:
Information about Fees, Performance and Expenses
• An independent report comparing the advisory and related fees paid by each fund with fees paid by comparable funds;
• An independent report comparing each fund's total expense ratio and its components to comparable funds;
• An independent report comparing the investment performance of each fund to the investment performance of comparable funds over various time periods;
• Data regarding investment performance in comparison to relevant peer groups of funds and appropriate indices;
• Comparative information concerning fees charged by each adviser for managing other mutual funds and institutional accounts using investment strategies and techniques similar to those used in managing the fund;
• Profitability analyses for each adviser with respect to each fund managed by it;
Information about Portfolio Management
• Descriptions of the investment management services provided to each fund, including the investment strategies and processes employed;
• Information concerning the allocation of brokerage and the benefits received by each adviser as a result of brokerage allocation, including information concerning the acquisition of research through "soft dollar" benefits received in connection with the funds' brokerage, and the implementation of a soft dollar reimbursement program established with respect to the funds;
• Data relating to portfolio turnover rates of each fund;
• The procedures and processes used to determine the fair value of fund assets and actions taken to monitor and test the effectiveness of such procedures and processes;
Information about each Adviser
• Reports detailing the financial results and condition of each adviser;
• Descriptions of the qualifications, education and experience of the individual investment professionals whose responsibilities include portfolio management and investment research for the funds, and information relating to their compensation and responsibilities with respect to managing other mutual funds and investment accounts;
• Copies of the Codes of Ethics of each adviser and its affiliates, together with information relating to compliance with and the administration of such codes;
• Information concerning the resources devoted to compliance efforts undertaken by each adviser and its affiliates on behalf of the funds (including descriptions of various compliance programs) and their record of compliance with investment policies and restrictions, including policies with respect to market-timing, late trading and selective portfolio disclosure, and with policies on personal securities transactions;
• Descriptions of the business continuity and disaster recovery plans of each adviser and its affiliates;
Other Relevant Information
• Information concerning the nature, cost and character of the administrative and other non-investment management services provided by Eaton Vance Management and its affiliates;
• Information concerning management of the relationship with the custodian, subcustodians and fund accountants by each adviser or the funds' administrator; and
• The terms of each advisory agreement.
46
Eaton Vance Floating-Rate Fund
BOARD OF TRUSTEES' ANNUAL APPROVAL OF THE INVESTMENT ADVISORY AGREEMENT CONT'D
In addition to the information identified above, the Special Committee considered information provided from time to time by each adviser throughout the year at meetings of the Board and its committees. Over the course of the twelve month period ended March 31, 2006, the Board met nine times and the Special Committee, the Audit Committee and the Governance Committee, each of which is a Committee comprised solely of Independent Trustees, met eight, twelve and five times, respectively. At such meetings, the Trustees received, among other things, presentations by the portfolio managers and other investment professionals of each adviser relating to the investment performance of each fund and the investment strategies used in pursuing the fund's investment objective.
For funds that invest through one or more underlying portfolios, the Board considered similar information about the portfolio(s) when considering the approval of advisory agreements. In addition, in cases where the fund's investment adviser has engaged a sub-adviser, the Board considered similar information about the sub-adviser when considering the approval of any sub-advisory agreement.
The Special Committee was assisted throughout the contract review process by Goodwin Procter LLP, legal counsel for the Independent Trustees. The members of the Special Committee relied upon the advice of such counsel and their own business judgment in determining the material factors to be considered in evaluating each advisory and sub-advisory agreement and the weight to be given to each such factor. The conclusions reached with respect to each advisory and sub-advisory agreement were based on a comprehensive evaluation of all the information provided and not any single factor. Moreover, each member of the Special Committee may have placed varying emphasis on particular factors in reaching conclusions with respect to each advisory and sub-advisory agreement.
Results of the Process
Based on its consideration of the foregoing, and such other information as it deemed relevant, including the factors and conclusions described below, the Special Committee concluded that the continuance of the investment advisory agreement of the Floating Rate Portfolio (the "Portfolio"), the portfolio in which the Eaton Vance Floating-Rate Fund (the "Fund") invests, with Boston Management and Research (the "Adviser"), including the fee structure, is in the interests of shareholders and, therefore, the Special Committee recommended to the Board approval of the agreement. The Board accepted the recommendation of the Special Committee as well as the factors considered and conclusions reached by the Special Committee with respect to the agreement. Accordingly, the Board, including a majority of the Independent Trustees, voted to approve continuation of the investment advisory agreement for the Portfolio.
Nature, Extent and Quality of Services
In considering whether to approve the investment advisory agreement of the Portfolio, the Board evaluated the nature, extent and quality of services provided to the Portfolio by the Adviser.
The Board considered the Adviser's management capabilities and investment process with respect to the types of investments held by the Portfolio, including the education, experience and number of its investment professionals and other personnel who provide portfolio management, investment research, and similar services to the Portfolio. In particular, the Board evaluated the experience and abilities of such personnel in analyzing factors such as the special considerations relevant to investing in senior floating-rate loans. Specifically, the Board noted the experience of the Adviser's 29 bank loan investment professionals and other personnel who provide services to the Portfolio, including four portfolio managers and 15 analysts. The Board also took into account the resources dedicated to portfolio management and other services, including the compensation paid to recruit and retain investment personnel, and the time and attentio n devoted to each Portfolio in the complex by senior management.
The Board reviewed the compliance programs of the Adviser and relevant affiliates thereof. Among other matters, the Board considered compliance and reporting matters relating to personal trading by investment personnel, selective disclosure of portfolio holdings, late trading, frequent trading, portfolio valuation, business continuity and the allocation of investment opportunities. The Board also evaluated the responses of the Adviser and its affiliates to requests from regulatory authorities such as the Securities and Exchange Commission and the National Association of Securities Dealers.
The Board considered shareholder and other administrative services provided or managed by Eaton Vance Management and its affiliates, including transfer agency and accounting services. The Board evaluated the benefits to shareholders of investing in a fund that is a part of a large family of funds, including the ability, in many cases, to exchange an investment among different funds without incurring additional sales charges.
After consideration of the foregoing factors, among others, the Board concluded that the nature, extent and quality of services provided by the Adviser, taken as a whole, are appropriate and consistent with the terms of the investment advisory agreement.
47
Eaton Vance Floating-Rate Fund
BOARD OF TRUSTEES' ANNUAL APPROVAL OF THE INVESTMENT ADVISORY AGREEMENT CONT'D
Fund Performance
The Board compared the Fund's investment performance to a relevant universe of similarly managed funds identified by an independent data provider and appropriate benchmark indices. The Board reviewed comparative performance data for the one- and three-year periods ended September 30, 2005 for the Fund. The Board concluded that the performance of the Fund was satisfactory.
Management Fees and Expenses
The Board reviewed contractual investment advisory fee rates, including administrative fee rates, payable by the Portfolio and the Fund (referred to collectively as "management fees"). As part of its review, the Board considered the management fees (including administrative fees) and the Fund's total expense ratio for the one-year period ended September 30, 2005, as compared to a group of similarly managed funds selected by an independent data provider.
After reviewing the foregoing information, and in light of the nature, extent and quality of the services provided by the Adviser, the Board concluded that the management fees charged for advisory and related services and the Fund's total expense ratio are reasonable.
Profitability
The Board reviewed the level of profits realized by the Adviser and relevant affiliates thereof in providing investment advisory and administrative services to the Fund, the Portfolio and to all Eaton Vance Funds as a group. The Board considered the level of profits realized without regard to revenue sharing or other payments by the Adviser and its affiliates to third parties in respect of distribution services. The Board also considered other direct or indirect benefits received by the Adviser and its affiliates in connection with its relationship with the Fund.
The Board concluded that, in light of the foregoing factors and the nature, extent and quality of the services rendered, the profits realized by the Adviser and its affiliates are reasonable.
Economies of Scale
In reviewing management fees and profitability, the Board also considered the extent to which the Adviser and its affiliates, on the one hand, and the Fund, on the other hand, can expect to realize benefits from economies of scale as the assets of the Fund and Portfolio increase. The Board acknowledged the difficulty in accurately measuring the benefits resulting from the economies of scale with respect to the management of any specific fund or group of funds. The Board reviewed data summarizing the increases and decreases in the assets of the Fund and of all Eaton Vance Funds as a group over various time periods, and evaluated the extent to which the total expense ratio of the Fund and the profitability of the Adviser and its affiliates may have been affected by such increases or decreases. The Board noted that, at its request, the Adviser had agreed to add a breakpoint with respect to assets that exceed $10 billion. Based upon the foregoing, the Board concluded that the benefits from economies of scale are currently being shared equitably by the Adviser and its affiliates and the Fund. The Board also concluded that, assuming reasonably foreseeable increases in the assets of the Portfolio, the structure of the advisory fee, which includes breakpoints at several asset levels, can be expected to cause the Adviser and its affiliates and the Fund to continue to share such benefits equitably.
48
Eaton Vance Floating-Rate Fund
MANAGEMENT AND ORGANIZATION
Fund Management. The Trustees of Eaton Vance Mutual Funds Trust (the Trust), and Floating Rate Portfolio (the Portfolio) are responsible for the overall management and supervision of the Trust's and Portfolio's affairs. The Trustees and officers of the Trust and the Portfolio are listed below. Except as indicated, each individual has held the office shown or other offices in the same company for the last five years. Trustees and officers of the Trust and the Portfolio hold indefinite terms of office. The "noninterested Trustees" consist of those Trustees who are not "interested persons" of the Trust and the Portfolio, as that term is defined under the 1940 Act. The business address of each Trustee and officer is The Eaton Vance Building, 255 State Street, Boston, Massachusetts 02109. As used below, "EVC" refers to Eaton Vance Corp., "EV" refers to Eaton Vanc e, Inc., "EVM" refers to Eaton Vance Management, "BMR" refers to Boston Management and Research, "Parametric" refers to Parametric Portfolio Associates and "EVD" refers to Eaton Vance Distributors, Inc. EVC and EV are the corporate parent and trustee, respectively, of EVM and BMR. EVD is the Fund's principal underwriter, the Portfolio's placement agent and a wholly-owned subsidiary of EVM. Each officer affiliated with Eaton Vance may hold a position with other Eaton Vance affiliates that is comparable to his or her position with EVM listed below.
Name and
Date of Birth | | Position(s)
with the
Trust and
the Portfolio | | Term of
Office and
Length of
Service | |
Principal Occupation(s)
During Past Five Years | | Number of Portfolios
in Fund Complex
Overseen By
Trustee(1) | | Other Directorships Held | |
| Interested Trustee | | | | | | | | | | | | | |
|
| James B. Hawkes 11/9/41 | | Trustee | | Trustee of the Trust since 1991and of the Portfolio since 2000 | | Chairman and Chief Executive Officer of EVC, BMR, EVM and EV; Director of EV; Vice President and Director of EVD. Trustee and/or officer of 170 registered investment companies in the Eaton Vance Fund Complex. Mr. Hawkes is an interested person because of his positions with BMR, EVM, EVC and EV, which are affiliates of the Trust and the Portfolio. | | | 170 | | | Director of EVC | |
|
| Noninterested Trustee(s) | | | | | | | | | | | | | |
|
| Benjamin C. Esty 1/2/63 | | Trustee | | Since 2005 | | Roy and Elizabeth Simmons Professor of Business Administration, Harvard University Graduate School of Business Administration (since 2003). Formerly, Associate Professor, Harvard University Graduate School of Business Administration (2000-2003). | | | 170 | | | None | |
|
| Samuel L. Hayes, III 2/23/35 | | Trustee and Chairman of the Board | | Trustee of the Trust since 1986; of the Portfolio since 2000 and Chairman of the Board since 2005 | | Jacob H. Schiff Professor of Investment Banking Emeritus, Harvard University Graduate School of Business Administration. Director of Yakima Products, Inc. (manufacturer of automotive accessories) (since 2001) and Director of Telect, Inc. (telecommunications services company) (since 2000). | | | 170 | | | Director of Tiffany & Co. (specialty retailer) | |
|
| William H. Park 9/19/47 | | Trustee | | Since 2003 | | Vice Chairman, Commercial Industrial Finance Corp. (specialty finance company) (since 2006). Formerly, President and Chief Executive Officer, Prizm Capital Management, LLC (investment management firm) (2002-2005). Formerly, Executive Vice President and Chief Financial Officer, United Asset Management Corporation (a holding company owning institutional investment management firms) (1982-2001). | | | 170 | | | None | |
|
| Ronald A. Pearlman 7/10/40 | | Trustee | | Since 2003 | | Professor of Law, Georgetown University Law Center. | | | 170 | | | None | |
|
49
Eaton Vance Floating-Rate Fund
MANAGEMENT AND ORGANIZATION CONT'D
Name and
Date of Birth | | Position(s)
with the
Trust and
Portfolio | | Term of
Office and
Length of
Service | | Principal Occupation(s)
During Past Five Years | | Number of Portfolios
in Fund Complex
Overseen By
Trustee(1) | | Other Directorships Held | |
| Noninterested Trustee(s) (continued) | | | | | | | | | | | | | |
|
| Norton H. Reamer 9/21/35 | | Trustee | | Trustee of the Trust since 1986 and of the Portfolio since 2000 | | President, Chief Executive Officer and a Director of Asset Management Finance Corp. (a specialty finance company serving the investment management industry) (since October 2003). President, Unicorn Corporation (an investment and financial advisory services company) (since September 2000). Formerly, Chairman and Chief Operating Officer, Hellman, Jordan Management Co., Inc. (an investment management company) (2000-2003). Formerly, Advisory Director of Berkshire Capital Corporation (investment banking firm) (2002-2003). | | | 170 | | | None | |
|
| Lynn A. Stout 9/14/57 | | Trustee | | Trustee of the Trust since 1998 and of the Portfolio since 2000 | | Professor of Law, University of California at Los Angeles School of Law. | | | 170 | | | None | |
|
| Ralph F. Verni 1/26/43 | | Trustee | | Since 2005 | | Consultant and private investor. | | | 170 | | | None | |
|
| Principal Officers who are not Trustees | | | | | | | | | | | | | |
|
Name and
Date of Birth | | Position(s)
with the
Trust and
the Portfolio | | Term of
Office and
Length of
Service | | Principal Occupation(s)
During Past Five Years | |
| Thomas E. Faust Jr. 5/31/58 | | President of the Trust | | Since 2002 | | President of EVC, EVM, BMR and EV and Director of EVC. Chief Investment Officer of EVC, EVM and BMR. Officer of 71 registered investment companies and 5 private investment companies managed by EVM or BMR. | |
|
| William H. Ahern, Jr. 7/28/59 | | Vice President of the Trust | | Since 1995 | | Vice President of EVM and BMR. Officer of 71 registered investment companies managed by EVM or BMR. | |
|
| Cynthia J. Clemson 3/2/63 | | Vice President of the Trust | | Since 2005 | | Vice President of EVM and BMR. Officer of 86 registered investment companies managed by EVM or BMR. | |
|
| Kevin S. Dyer 2/21/75 | | Vice President of the Trust | | Since 2005 | | Assistant Vice president of EVM and BMR. Officer of 25 registered investment companies managed by EVM or BMR. | |
|
| Aamer Khan 6/7/60 | | Vice President of the Trust | | Since 2005 | | Vice President of EVM and BMR. Officer of 29 registered investment companies managed by EVM or BMR. | |
|
| Thomas H. Luster 4/8/62 | | Vice President of the Trust | | Since 2006 | | Vice President of EVM and BMR. Officer of 45 registered investment companies managed by EVM or BMR. | |
|
| Michael R. Mach 7/15/47 | | Vice President of the Trust | | Since 1999 | | Vice President of EVM and BMR. Officer of 51 registered investment companies managed by EVM or BMR. | |
|
| Robert B. MacIntosh 1/22/57 | | Vice President of the Trust | | Since 1998 | | Vice President of EVM and BMR. Officer of 86 registered investment companies managed by EVM or BMR. | |
|
| Scott H. Page 11/30/59 | | Vice President of the Portfolio | | Since 2000 | | Vice President of EVM and BMR. Officer of 15 registered investment companies managed by EVM or BMR. | |
|
| Cliff Quisenberry, Jr. 1/1/65 | | Vice President of the Trust | | Since 2006 | | Vice President and Director of Research and Product Development of Parametric. Officer of 30 registered investment companies managed by EVM or BMR. | |
|
| Duncan W. Richardson 10/26/57 | | Vice President of the Trust | | Since 2001 | | Executive Vice President and Chief Equity Investment Officer of EVC, EVM and BMR. Officer 71 registered investment companies managed by EVM or BMR. | |
|
| Walter A. Row, III 7/20/57 | | Vice President of the Trust | | Since 2001 | | Director of Equity Research and a Vice President of EVM and BMR. Officer of 33 registered investment companies managed by EVM or BMR. | |
|
50
Eaton Vance Floating-Rate Fund
MANAGEMENT AND ORGANIZATION CONT'D
Name and
Date of Birth | | Position(s)
with the
Trust and
the Portfolio | | Term of
Office and
Length of
Service | | Principal Occupation(s)
During Past Five Years | |
| Principal Officers who are not Trustees (continued) | | | | | | | |
|
| Judith A. Saryan 8/21/54 | | Vice President of the Trust | | Since 2003 | | Vice President of EVM and BMR. Officer of 50 registered investment companies managed by EVM or BMR. | |
|
| Susan Schiff 3/31/61 | | Vice President of the Trust | | Since 2002 | | Vice President of EVM and BMR. Officer of 30 registered investment companies managed by EVM or BMR. | |
|
| Payson F. Swaffield 8/13/56 | | President of the Portfolio | | Since 2002(2) | | Vice President of EVM and BMR. Officer of 15 registered investment companies managed by EVM or BMR. | |
|
| Barbara E. Campbell 6/19/57 | | Treasurer of the Trust | | Since 2005(2) | | Vice President of EVM and BMR. Officer of 170 registered investment companies managed by EVM or BMR. | |
|
| Alan R. Dynner 10/10/40 | | Secretary | | Secretary of the Trust since 1997 and of the Portfolio since 2000 | | Vice President, Secretary and Chief Legal Officer of BMR, EVM, EVD, EV and EVC. Officer of 170 registered investment companies managed by EVM or BMR. | |
|
| Dan A. Maalouly 3/25/62 | | Treasurer of the Portfolio | | Since 2005 | | Vice President of EVM and BMR. Previously, Senior Manager at PricewaterhouseCoopers LLP (1997-2005). Officer of 71 registered investment companies managed by EVM or BMR. | |
|
| Paul M. O'Neil 7/11/53 | | Chief Compliance Officer | | Since 2004 | | Vice President of EVM and BMR. Officer of 170 registered investment companies managed by EVM or BMR. | |
|
(1) Includes both master and feeder funds in a master-feeder structure.
(2) Prior to 2002, Mr. Swaffield served as Vice President of the Portfolio since 2000. Prior to 2005, Ms. Campbell served as Assistant Treasurer of the Trust since 1995.
The SAI for the Fund includes additional information about the Trustees and officers of the Fund and the Portfolio and can be obtained without charge on Eaton Vance's website at www.eatonvance.com or by calling 1-800-225-6265.
51
This Page Intentionally Left Blank
Investment Adviser of Floating Rate Portfolio
Boston Management and Research
The Eaton Vance Building
255 State Street
Boston, MA 02109
Administrator of Eaton Vance Floating-Rate Fund
Eaton Vance Management
The Eaton Vance Building
255 State Street
Boston, MA 02109
Principal Underwriter
Eaton Vance Distributors, Inc.
The Eaton Vance Building
255 State Street
Boston, MA 02109
(617) 482-8260
Custodian
Investors Bank & Trust Company
200 Clarendon Street
Boston, MA 02116
Transfer Agent
PFPC Inc.
Attn: Eaton Vance Funds
P.O. Box 9653
Providence, RI 02940-9653
(800) 262-1122
Independent Registered Public Accounting Firm
Deloitte & Touche LLP
200 Berkeley Street
Boston, MA 02116-5022
Eaton Vance Floating-Rate Fund
The Eaton Vance Building
255 State Street
Boston, MA 02109
This report must be preceded or accompanied by a current prospectus. Before investing, investors should consider carefully the Fund's investment objective(s), risks, and charges and expenses. The Fund's current prospectus contains this and other information about the Fund and is available through your financial advisor. Please read the prospectus carefully before you invest or send money. For further information please call 1-800-225-6265.
1044-12/06 FRSRC

Annual Report October 31, 2006


EATON VANCE
DIVERSIFIED
INCOME
FUND
IMPORTANT NOTICES REGARDING PRIVACY,
DELIVERY OF SHAREHOLDER DOCUMENTS,
PORTFOLIO HOLDINGS AND PROXY VOTING
Privacy. The Eaton Vance organization is committed to ensuring your financial privacy. Each of the financial institutions identified below has in effect the following policy ("Privacy Policy") with respect to nonpublic personal information about its customers:
• Only such information received from you, through application forms or otherwise, and information about your Eaton Vance fund transactions will be collected. This may include information such as name, address, social security number, tax status, account balances and transactions.
• None of such information about you (or former customers) will be disclosed to anyone, except as permitted by law (which includes disclosure to employees necessary to service your account). In the normal course of servicing a customer's account, Eaton Vance may share information with unaffiliated third parties that perform various required services such as transfer agents, custodians and broker/dealers.
• Policies and procedures (including physical, electronic and procedural safeguards) are in place that are designed to protect the confidentiality of such information.
• We reserve the right to change our Privacy Policy at any time upon proper notification to you. Customers may want to review our Policy periodically for changes by accessing the link on our homepage: www.eatonvance.com.
Our pledge of privacy applies to the following entities within the Eaton Vance organization: the Eaton Vance Family of Funds, Eaton Vance Management, Eaton Vance Investment Counsel, Boston Management and Research, and Eaton Vance Distributors, Inc.
In addition, our Privacy Policy only applies to those Eaton Vance customers who are individuals and who have a direct relationship with us. If a customer's account (i.e., fund shares) is held in the name of a third-party financial adviser/ broker-dealer, it is likely that only such adviser's privacy policies apply to the customer. This notice supersedes all previously issued privacy disclosures.
For more information about Eaton Vance's Privacy Policy, please call 1-800-262-1122.
Delivery of Shareholder Documents. The Securities and Exchange Commission (the "SEC") permits funds to deliver only one copy of shareholder documents, including prospectuses, proxy statements and shareholder reports, to fund investors with multiple accounts at the same residential or post office box address. This practice is often called "householding" and it helps eliminate duplicate mailings to shareholders.
Eaton Vance, or your financial adviser, may household the mailing of your documents indefinitely unless you instruct Eaton Vance, or your financial adviser, otherwise.
If you would prefer that your Eaton Vance documents not be householded, please contact Eaton Vance at 1-800-262-1122, or contact your financial adviser.
Your instructions that householding not apply to delivery of your Eaton Vance documents will be effective within 30 days of receipt by Eaton Vance or your financial adviser.
Portfolio Holdings. Each Eaton Vance Fund and its underlying Portfolio (if applicable) will file a schedule of its portfolio holdings on Form N-Q with the SEC for the first and third quarters of each fiscal year. The Form N-Q will be available on the Eaton Vance website www.eatonvance.com, by calling Eaton Vance at 1-800-262-1122 or in the EDGAR database on the SEC's website at www.sec.gov. Form N-Q may also be reviewed and copied at the SEC's public reference room in Washington, D.C. (call 1-800-732-0330 for information on the operation of the public reference room).
Proxy Voting. From time to time, funds are required to vote proxies related to the securities held by the funds. The Eaton Vance Funds or their underlying Portfolios (if applicable) vote proxies according to a set of policies and procedures approved by the Funds' and Portfolios' Boards. You may obtain a description of these policies and procedures and information on how the Funds or Portfolios voted proxies relating to Portfolio securities during the most recent 12 month period ended June 30, without charge, upon request, by calling 1-800-262-1122. This description is also available on the SEC's website at www.sec.gov.
Eaton Vance Diversified Income Fund as of October 31, 2006
MANAGEMENT’S DISCUSSION OF FUND PERFORMANCE
The Fund
Performance for the Past Year
· The Fund’s Class A shares had a total return of 6.84% during the year ended October 31, 2006.(1) This return resulted from an increase in net asset value per share (NAV) to $9.77 on October 31, 2006, from $9.76 on October 31, 2005, and the reinvestment of $0.637 in dividends.
· The Fund’s Class B shares had a total return of 6.05% during the year ended October 31, 2006.(1) This return resulted from an increase in NAV per share to $9.76 on October 31, 2006, from $9.75 on October 31, 2005, and the reinvestment of $0.563 in dividends.
· The Fund’s Class C shares had a total return of 6.16% during the year ended October 31, 2006.(1) This return resulted from an increase in NAV per share to $9.77 on October 31, 2006, from $9.75 on October 31, 2005, and the reinvestment of $0.564 in dividends.
· In comparison, the Merrill Lynch U.S. High Yield Master II Index – an unmanaged index of below-investment-grade U.S. dollar-denominated corporate bonds publicly issued in the U.S. domestic market – had a total return of 10.34% during the same period.(2) The S&P/LSTA Leveraged Loan Index – an unmanaged index of U.S. dollar-denominated leveraged loans – had a total return of 6.49% during the same period.(2) The Lehman Brothers Intermediate Government Bond Index – an unmanaged index of U.S. government bonds with maturities between one and 10 years – had a total return of 4.47% during the same period.(2)
Recent Fund Developments
· The Fund’s primary investment objective is to provide a high level of current income. The Fund may, as a secondary objective, also seek capital appreciation to the extent consistent with its primary objective of high current income.
· The Fund is structured as a “fund-of-funds” and, accordingly, currently pursues its objectives by investing its assets in three registered investment companies (each a “Portfolio”) that are managed by Eaton Vance Management or its affiliates: Boston Income Portfolio, which normally invests primarily in high-yield, high-risk corporate bonds; Floating Rate Portfolio, which normally invests primarily in interests in senior floating-rate loans; and Government Obligations Portfolio, which primarily invests in mortgage-backed securities (MBS) issued by the U.S. Government or one of its agencies or instrumentalities.
· During the period, the high-yield market was characterized by modest credit spreads, record issuance and strong demand from investors searching for yield. In the Boston Income Portfolio, management positioned its bond investments defensively through an emphasis on short duration and senior high-yield paper. Auto company credit bonds were among the leading performers, responding well to the prospect of company reorganizations. Health care, telecom and energy bonds were also strong contributors.(3)
· The segment of the Fund investing in the Floating Rate Portfolio benefited from an environment of rising short-term interest rates through the first half of the period. While loan prices declined slightly during the fiscal year, the loan market enjoyed generally stable fundamentals, including a low default rate. Record new issuance from strong merger and acquisition activity met with robust investor demand. As a result, supply/demand balance was closer to equilibrium than in recent years.(3)
· In the Government Obligations Portfolio, prepayment rates for MBS continued to edge lower during the period. Spreads on seasoned MBS – the Portfolio’s current focus when investing in MBS – remained at historically tight levels. The MBS market continued to be well supported by strong demand from foreign buyers.(3)
(1)These returns do not include the 4.75% maximum sales charge for the Fund’s Class A shares or the applicable contingent deferred sales charges (CDSC) for Class B shares and Class C shares. If sales charges were deducted, returns would be lower.
(2)It is not possible to invest directly in an Index. The Indices’ total returns do not reflect the commissions or expenses that would have been incurred if an investor individually purchased or sold the securities represented in the Indices. Index returns are available as of month-end only.
(3)Portfolio investments may not be representative of the Portfolios’ current or future investments and may change due to active management.
Past performance is no guarantee of future results. Returns are historical and are calculated by determining the percentage change in net asset value or offering price (as applicable) with all distributions reinvested. Investment return and principal value will fluctuate so that shares, when redeemed, may be worth more or less than their original cost. Performance is for the stated time period only; due to market volatility, the Fund’s current performance may be lower or higher than the quoted return. For performance as of the most recent month end, please refer to www.eatonvance.com.
The views expressed throughout this report are those of the portfolio managers and are current only through the end of the period of the report as stated on the cover. These views are subject to change at any time based upon market or other conditions, and the investment adviser disclaims any responsibility to update such views. These views may not be relied on as investment advice and, because investment decisions for a fund are based on many factors, may not be relied on as an indication of trading intent on behalf of any Eaton Vance fund.
Shares of the Fund are not insured by the FDIC and are not deposits or other obligations of, or guaranteed by, any depository institution. Shares are subject to investment risks, including possible loss of principal invested. Yield will vary.
1
Eaton Vance Diversified Income Fund as of October 31, 2006
FUND PERFORMANCE
The line graph and table set forth below provide information about the Fund’s performance. The line graph compares the performance of Class A of the Fund with that of the Merrill Lynch U.S. High Yield Master II Index, an unmanaged index of below-investment-grade U.S. dollar-denominated corporate bonds publicly issued in the U.S. domestic market; the Lehman Brothers Intermediate Government Bond Index, an unmanaged index of U.S. government bonds with maturities between one and 10 years; and the S&P/LSTA Leveraged Loan Index, an unmanaged index of U.S. dollar-denominated leveraged loans. The lines on the graph represent the total returns of a hypothetical investment of $10,000 in each of Class A and the Merrill Lynch U.S. High Yield Master II Index, the Lehman Brothers Intermediate Government Bond Index and the S&P/LSTA Leveraged Loan Index. Class A total returns are presented at net asset value and maximum public offering price (POP). The table includes the total returns of each Class of the Fund at net asset value and public offering price. The performance presented below does not reflect the deduction of taxes, if any, that a shareholder would pay on distributions or redemptions of Fund shares.
Performance(1) | | Class A | | Class B | | Class C | |
Average Annual Total Returns (at net asset value) | | | | | | | |
One Year | | 6.84 | % | 6.05 | % | 6.16 | % |
Life of Fund† | | 5.32 | | 4.48 | | 4.54 | |
| | | | | | | |
SEC Average Annual Total Returns (including sales charge or applicable CDSC) | | | | | | | |
One Year | | 1.73 | % | 1.05 | % | 5.16 | % |
Life of Fund† | | 2.65 | | 1.99 | | 4.54 | |
†Inception dates: Class A: 12/7/04; Class B: 12/7/04; Class C: 12/7/04
(1) Average Annual Total Returns do not include the 4.75% maximum sales charge for Class A shares or the applicable contingent deferred sales charges (CDSC) for Class B or Class C shares. If sales charges were deducted, returns would be lower. SEC returns for Class A reflect the maximum 4.75% sales charge. SEC returns for Class B reflect applicable CDSC based on the following schedule: 5% - 1st and 2nd years; 4% - 3rd year; 3% - 4th year; 2% - 5th year; 1% - 6th year. SEC 1-year return for Class C reflects a 1% CDSC.
Past performance is no guarantee of future results. Returns are historical and are calculated by determining the percentage change in net asset value or offering price (as applicable) with all distributions reinvested. Investment return and principal value will fluctuate so that shares, when redeemed, may be worth more or less than their original cost. Performance is for the stated time period only; due to market volatility, the Fund’s current performance may be lower or higher than the quoted return. For performance as of the most recent month end, please refer to www.eatonvance.com.
Diversification by Sectors(2)
By Total Investments
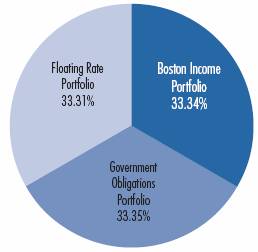
(2)As of October 31, 2006. Sectors are shown as a percentage of the Fund’s total investments. Fund statistics may not be representative of the Portfolios’ current or future investments and are subject to change due to active management.
Comparison of Change in Value of a $10,000 Investment in Eaton Vance Diversified Income Fund, Class A shares vs. the Merrill Lynch U.S. High Yield Master II Index, the Lehman Brothers Intermediate Government Bond Index and the S&P/LSTA Leveraged Loan Index*
December 31, 2004 – October 31, 2005
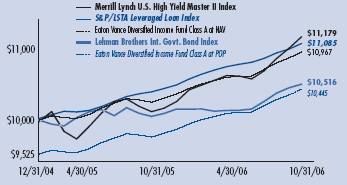
* Source: Thomson Financial. Class A of the Fund commenced investment operations on 12/7/04.
A $10,000 hypothetical investment on 12/7/04 at net asset value in Class B shares and Class C shares, respectively, would have been valued at $10,869 ($10,381 after deduction of the applicable CDSC) and $10,880, respectively, on 10/31/06. It is not possible to invest directly in an Index. The Indices’ total returns do not reflect commissions or expenses that would have been incurred if an investor individually purchased or sold the securities represented in the Indices. Index returns are available as of month-end only.
2
Eaton Vance Diversified Income Fund as of October 31, 2006
FUND EXPENSES
Example: As a shareholder of the Fund, you incur two types of costs: (1) transaction costs, including sales charges (loads) on purchases and redemption fees (if applicable); and (2) ongoing costs, including management fees; distribution or service fees; and other Fund expenses. This Example is intended to help you understand your ongoing costs (in dollars) of investing in the Fund and to compare these costs with the ongoing costs of investing in other mutual funds. The Example is based on an investment of $1,000 invested at the beginning of the period and held for the entire period (May 1, 2006 – October 31, 2006).
Actual Expenses: The first section of the table below provides information about actual account values and actual expenses. You may use the information in this section, together with the amount you invested, to estimate the expenses that you paid over the period. Simply divide your account value by $1,000 (for example, an $8,600 account value divided by $1,000 = 8.6), then multiply the result by the number in the first section under the heading entitled "Expenses Paid During Period" to estimate the expenses you paid on your account during this period.
Hypothetical Example for Comparison Purposes: The second section of the table below provides information about hypothetical account values and hypothetical expenses based on the Fund's actual expense ratios and an assumed rate of return of 5% per year (before expenses), which is not the actual return of the Fund. The hypothetical account values and expenses may not be used to estimate the actual ending account balance or expenses you paid for the period. You may use this information to compare the ongoing costs of investing in your Fund and other funds. To do so, compare this 5% hypothetical example with the 5% hypothetical examples that appear in the shareholder reports of the other funds.
Please note that the expenses shown in the table are meant to highlight your ongoing costs only and do not reflect any transactional costs, such as sales charges (loads) or redemption fees (if applicable). Therefore, the second section of the table is useful in comparing ongoing costs only, and will not help you determine the relative total costs of owning different funds. In addition, if these transactional costs were included, your costs would have been higher.
Eaton Vance Diversified Income Fund
| | | Beginning Account Value
(5/1/06) | | Ending Account Value
(10/31/06) | | Expenses Paid During Period*
(5/1/06 – 10/31/06) | |
| Actual | |
| Class A | | $ | 1,000.00 | | | $ | 1,033.40 | | | $ | 5.59 | | |
| Class B | | $ | 1,000.00 | | | $ | 1,029.50 | | | $ | 9.41 | | |
| Class C | | $ | 1,000.00 | | | $ | 1,030.60 | | | $ | 9.42 | | |
| Hypothetical | |
| (5% return per year before expenses) | |
| Class A | | $ | 1,000.00 | | | $ | 1,019.70 | | | $ | 5.55 | | |
| Class B | | $ | 1,000.00 | | | $ | 1,015.90 | | | $ | 9.35 | | |
| Class C | | $ | 1,000.00 | | | $ | 1,015.90 | | | $ | 9.35 | | |
* Expenses are equal to the Fund's annualized expense ratio of 1.09% for Class A shares, 1.84% for Class B shares and 1.84% for Class C shares, multiplied by the average account value over the period, multiplied by 184/365 (to reflect the one-half year period). The example assumes that the $1,000 was invested at the net asset value per share determined at the close of business on April 30, 2006. The example reflects the expenses of the Fund and the Portfolios.
3
Eaton Vance Diversified Income Fund as of October 31, 2006
FINANCIAL STATEMENTS
Statement of Assets and Liabilities
As of October 31, 2006
| Assets | |
Investment in Boston Income Portfolio, at value
(identified cost, $103,343,853) | | $ | 104,238,038 | | |
Investment in Floating Rate Portfolio, at value
(identified cost, $104,088,474) | | | 104,148,778 | | |
Investment in Government Obligations Portfolio, at value
(identified cost, $104,131,037) | | | 104,288,282 | | |
| Receivable for Fund shares sold | | | 1,562,081 | | |
| Prepaid expenses | | | 961 | | |
| Total assets | | $ | 314,238,140 | | |
| Liabilities | |
| Payable for Fund shares redeemed | | $ | 937,091 | | |
| Dividends payable | | | 507,045 | | |
| Payable to affiliate for distribution and service fees | | | 169,272 | | |
| Payable to affiliate for Trustees' fees | | | 282 | | |
| Accrued expenses | | | 87,872 | | |
| Total liabilities | | $ | 1,701,562 | | |
| Net Assets | | $ | 312,536,578 | | |
| Sources of Net Assets | |
| Paid-in capital | | $ | 313,920,669 | | |
Accumulated net realized loss from Portfolios
(computed on the basis of identified cost) | | | (2,567,489 | ) | |
| Accumulated undistributed net investment income | | | 71,664 | | |
Net unrealized appreciation from Portfolios
(computed on the basis of identified cost) | | | 1,111,734 | | |
| Total | | $ | 312,536,578 | | |
| Class A Shares | |
| Net Assets | | $ | 144,829,882 | | |
| Shares Outstanding | | | 14,820,009 | | |
Net Asset Value and Redemption Price Per Share
(net assets ÷ shares of beneficial interest outstanding) | | $ | 9.77 | | |
Maximum Offering Price Per Share
(100 ÷ 95.25 of $9.77) | | $ | 10.26 | | |
| Class B Shares | |
| Net Assets | | $ | 31,826,647 | | |
| Shares Outstanding | | | 3,259,737 | | |
Net Asset Value, Offering Price and Redemption Price Per Share
(net assets ÷ shares of beneficial interest outstanding) | | $ | 9.76 | | |
| Class C Shares | |
| Net Assets | | $ | 135,880,049 | | |
| Shares Outstanding | | | 13,914,835 | | |
Net Asset Value, Offering Price and Redemption Price Per Share
(net assets ÷ shares of beneficial interest outstanding) | | $ | 9.77 | | |
| On sales of $25,000 or more, the offering price of Class A shares is reduced. | |
Statement of Operations
For the Year Ended
October 31, 2006
| Investment Income | |
| Interest and other income allocated from Portfolios | | $ | 16,820,671 | | |
| Dividend income allocated from Portfolios | | | 55,352 | | |
| Security lending income allocated from Portfolios, net | | | 437,474 | | |
| Expenses allocated from Portfolios | | | (1,682,616 | ) | |
| Net investment income from Portfolios | | $ | 15,630,881 | | |
| Expenses | |
| Trustees' fees and expenses | | $ | 3,507 | | |
Distribution and service fees
Class A | | | 281,026 | | |
| Class B | | | 270,762 | | |
| Class C | | | 1,129,177 | | |
| Transfer and dividend disbursing agent fees | | | 145,647 | | |
| Custodian fee | | | 145,052 | | |
| Registration fees | | | 63,108 | | |
| Legal and accounting services | | | 54,098 | | |
| Printing and postage | | | 30,584 | | |
| Miscellaneous | | | 3,022 | | |
| Total expenses | | $ | 2,125,983 | | |
| Net investment income | | $ | 13,504,898 | | |
| Realized and Unrealized Gain (Loss) from Portfolios | |
Net realized gain (loss) —
Investment transactions (identified cost basis) | | $ | 169,285 | | |
| Financial futures contracts | | | 266,412 | | |
| Swap contracts | | | 32,633 | | |
| Foreign currency and forward foreign currency exchange contract transactions | | | (294,390 | ) | |
| Net realized gain | | $ | 173,940 | | |
Change in unrealized appreciation (depreciation) —
Investments (identified cost basis) | | $ | 2,326,682 | | |
| Financial futures contracts | | | 7,972 | | |
| Swap contracts | | | 6,959 | | |
Foreign currency and forward foreign currency exchange
contract transactions | | | (95,904 | ) | |
| Net change in unrealized appreciation (depreciation) | | $ | 2,245,709 | | |
| Net realized and unrealized gain | | $ | 2,419,649 | | |
| Net increase in net assets from operations | | $ | 15,924,547 | | |
See notes to financial statements
4
Eaton Vance Diversified Income Fund as of October 31, 2006
FINANCIAL STATEMENTS CONT'D
Statements of Changes in Net Assets
Increase (Decrease)
in Net Assets | | Year Ended
October 31, 2006 | | Period Ended
October 31, 2005(1) | |
From operations —
Net investment income | | $ | 13,504,898 | | | $ | 3,775,571 | | |
Net realized gain (loss) from investment
transactions, financial futures contracts,
swap contracts, and foreign currency and
forward foreign currency exchange contract
transactions | | | 173,940 | | | | (594,474 | ) | |
Net change in unrealized appreciation
(depreciation) from investments,
financial futures contracts, swap
contracts, and foreign currency and
forward foreign currency exchange contract
transactions | | | 2,245,709 | | | | (1,133,975 | ) | |
| Net increase in net assets from operations | | $ | 15,924,547 | | | $ | 2,047,122 | | |
Distributions to shareholders —
From net investment income
Class A | | $ | (7,323,426 | ) | | $ | (2,369,812 | ) | |
| Class B | | | (1,562,528 | ) | | | (512,591 | ) | |
| Class C | | | (6,522,201 | ) | | | (2,006,640 | ) | |
| Total distributions to shareholders | | $ | (15,408,155 | ) | | $ | (4,889,043 | ) | |
Transactions in shares of beneficial interest —
Proceeds from sale of shares
Class A | | $ | 82,726,214 | | | $ | 98,157,284 | | |
| Class B | | | 13,707,120 | | | | 23,497,760 | | |
| Class C | | | 63,879,837 | | | | 92,621,826 | | |
Net asset value of shares issued
to shareholders in payment of
distributions declared
Class A | | | 5,159,127 | | | | 1,714,177 | | |
| Class B | | | 973,870 | | | | 303,413 | | |
| Class C | | | 4,393,885 | | | | 1,295,084 | | |
Cost of shares redeemed
Class A | | | (30,170,684 | ) | | | (11,713,909 | ) | |
| Class B | | | (4,834,978 | ) | | | (1,540,982 | ) | |
| Class C | | | (22,404,604 | ) | | | (2,884,333 | ) | |
Net increase in net assets from Fund
share transactions | | $ | 113,429,787 | | | $ | 201,432,320 | | |
| Net increase in net assets | | $ | 113,946,179 | | | $ | 198,590,399 | | |
| Net Assets | | Year Ended
October 31, 2006 | | Period Ended
October 31, 2005(1) | |
| At beginning of year | | $ | 198,590,399 | | | $ | — | | |
| At end of year | | $ | 312,536,578 | | | $ | 198,590,399 | | |
Accumulated undistributed
net investment income
included in net assets | |
| At end of year | | $ | 71,664 | | | $ | 33,498 | | |
(1) For the period from the start of business, December 7, 2004, to October 31, 2005.
See notes to financial statements
5
Eaton Vance Diversified Income Fund as of October 31, 2006
FINANCIAL STATEMENTS CONT'D
Financial Highlights
| | | Class A | |
| | | Year Ended
October 31, 2006(2) | | Period Ended
October 31, 2005(1)(2) | |
| Net asset value — Beginning of year | | $ | 9.760 | | | $ | 10.000 | | |
| Income (loss) from operations | |
| Net investment income | | $ | 0.561 | | | $ | 0.430 | | |
| Net realized and unrealized gain (loss) | | | 0.086 | | | | (0.108 | ) | |
| Total income from operations | | $ | 0.647 | | | $ | 0.322 | | |
| Less distributions | |
| From net investment income | | $ | (0.637 | ) | | $ | (0.562 | ) | |
| Total distributions | | $ | (0.637 | ) | | $ | (0.562 | ) | |
| Net asset value — End of period | | $ | 9.770 | | | $ | 9.760 | | |
| Total Return(3) | | | 6.84 | % | | | 3.29 | % | |
| Ratios/Supplemental Data | |
| Net assets, end of year (000's omitted) | | $ | 144,830 | | | $ | 86,858 | | |
| Ratios (As a percentage of average daily net assets): | |
| Expenses before custodian fee reduction(4) | | | 1.09 | % | | | 1.17 | %(5)(6) | |
| Expenses after custodian fee reduction(4) | | | 1.09 | % | | | 1.17 | %(5)(6) | |
| Net investment income | | | 5.75 | % | | | 4.84 | %(5)(6) | |
| Portfolio Turnover of the Boston Income Portfolio | | | 68 | % | | | 71 | % | |
| Portfolio Turnover of the Floating Rate Portfolio | | | 50 | % | | | 57 | % | |
| Portfolio Turnover of the Government Obligations Portfolio | | | 2 | % | | | 30 | % | |
(1) For the period from the commencement of operations, December 7, 2004, to October 31, 2005.
(2) Net investment income per share was computed using average shares outstanding.
(3) Returns are historical and are calculated by determining the percentage change in net asset value with all distributions reinvested. Total return is not computed on an annualized basis.
(4) Includes the Fund's share of the Portfolios' allocated expenses.
(5) Annualized.
(6) The investment adviser waived a portion of its advisory fee and the administrator subsidized certain operating expenses (equal to 0.03%).
See notes to financial statements
6
Eaton Vance Diversified Income Fund as of October 31, 2006
FINANCIAL STATEMENTS CONT'D
Financial Highlights
| | | Class B | |
| | | Year Ended
October 31, 2006(2) | | Period Ended
October 31, 2005(1) (2) | |
| Net asset value — Beginning of year | | $ | 9.750 | | | $ | 10.000 | | |
| Income (loss) from operations | |
| Net investment income | | $ | 0.488 | | | $ | 0.365 | | |
| Net realized and unrealized gain (loss) | | | 0.085 | | | | (0.120 | ) | |
| Total income from operations | | $ | 0.573 | | | $ | 0.245 | | |
| Less distributions | |
| From net investment income | | $ | (0.563 | ) | | $ | (0.495 | ) | |
| Total distributions | | $ | (0.563 | ) | | $ | (0.495 | ) | |
| Net asset value — End of period | | $ | 9.760 | | | $ | 9.750 | | |
| Total Return(3) | | | 6.05 | % | | | 2.49 | % | |
| Ratios/Supplemental Data | |
| Net assets, end of year (000's omitted) | | $ | 31,827 | | | $ | 21,926 | | |
| Ratios (As a percentage of average daily net assets): | |
| Expenses before custodian fee reduction(4) | | | 1.84 | % | | | 1.92 | %(5)(6) | |
| Expenses after custodian fee reduction(4) | | | 1.84 | % | | | 1.92 | %(5)(6) | |
| Net investment income | | | 5.01 | % | | | 4.11 | %(5)(6) | |
| Portfolio Turnover of the Boston Income Portfolio | | | 68 | % | | | 71 | % | |
| Portfolio Turnover of the Floating Rate Portfolio | | | 50 | % | | | 57 | % | |
| Portfolio Turnover of the Government Obligations Portfolio | | | 2 | % | | | 30 | % | |
(1) For the period from the commencement of operations, December 7, 2004, to October 31, 2005.
(2) Net investment income per share was computed using average shares outstanding.
(3) Returns are historical and are calculated by determining the percentage change in net asset value with all distributions reinvested. Total return is not computed on an annualized basis.
(4) Includes the Fund's share of the Portfolios' allocated expenses.
(5) Annualized.
(6) The investment adviser waived a portion of its advisory fee and the administrator subsidized certain operating expenses (equal to 0.03%).
See notes to financial statements
7
Eaton Vance Diversified Income Fund as of October 31, 2006
FINANCIAL STATEMENTS CONT'D
Financial Highlights
| | | Class C | |
| | | Year Ended
October 31, 2006(2) | | Period Ended
October 31, 2005(1)(2) | |
| Net asset value — Beginning of year | | $ | 9.750 | | | $ | 10.000 | | |
| Income (loss) from operations | |
| Net investment income | | $ | 0.489 | | | $ | 0.362 | | |
| Net realized and unrealized gain (loss) | | | 0.095 | | | | (0.117 | ) | |
| Total income from operations | | $ | 0.584 | | | $ | 0.245 | | |
| Less distributions | |
| From net investment income | | $ | (0.564 | ) | | $ | (0.495 | ) | |
| Total distributions | | $ | (0.564 | ) | | $ | (0.495 | ) | |
| Net asset value — End of period | | $ | 9.770 | | | $ | 9.750 | | |
| Total Return(3) | | | 6.16 | % | | | 2.49 | % | |
| Ratios/Supplemental Data | |
| Net assets, end of year (000's omitted) | | $ | 135,880 | | | $ | 89,806 | | |
| Ratios (As a percentage of average daily net assets): | |
| Expenses before custodian fee reduction(4) | | | 1.84 | % | | | 1.92 | %(5)(6) | |
| Expenses after custodian fee reduction(4) | | | 1.84 | % | | | 1.92 | %(5)(6) | |
| Net investment income | | | 5.02 | % | | | 4.08 | %(5)(6) | |
| Portfolio Turnover of the Portfolio | | | 68 | % | | | 71 | % | |
| Portfolio Turnover of the Floating Rate Portfolio | | | 50 | % | | | 57 | % | |
| Portfolio Turnover of the Boston Income Portfolio | | | 2 | % | | | 30 | % | |
(1) For the period from the commencement of operations, December 7, 2004, to October 31, 2005.
(2) Net investment income per share was computed using average shares outstanding.
(3) Returns are historical and are calculated by determining the percentage change in net asset value with all distributions reinvested. Total return is not computed on an annualized basis.
(4) Includes the Fund's share of the Portfolios' allocated expenses.
(5) Annualized.
(6) The investment adviser waived a portion of its advisory fee and the administrator subsidized certain operating expenses (equal to 0.03%).
See notes to financial statements
8
Eaton Vance Diversified Income Fund as of October 31, 2006
NOTES TO FINANCIAL STATEMENTS
1 Significant Accounting Policies
Eaton Vance Diversified Income Fund (the Fund) is a diversified series of Eaton Vance Mutual Funds Trust (the Trust). The Trust is an entity of the type commonly known as a Massachusetts business trust and is registered under the Investment Company Act of 1940, as amended, as an open-end management investment company. The Fund was organized under the laws of the Commonwealth of Massachusetts by an Agreement and Declaration of Trust dated December 7, 2004. The Fund offers three classes of shares. Class A shares are generally sold subject to a sales charge imposed at time of purchase. Class B and Class C shares are sold at net asset value and are generally subject to a contingent deferred sales charge (see Note 6). Class B shares held for eight years will automatically convert to Class A shares. Each class represents a pro rata interest in the Fund, but votes separately on class-specific matters and (as noted below) is subject to different expenses. Realized and unrealized gains and losses and net investment income and losses, other than class-specific expenses, are allocated daily to each class of shares based on the relative net assets of each class to the total net assets of the Fund. Each class of shares differs in its distribution plan and certain other class-specific expenses. The Fund currently invests all of its investable assets in the following three registered investment companies (each, a Portfolio) managed by Eaton Vance or its affiliates: Boston Income Portfolio, Floating Rate Portfolio, and Government Obligations Portfolio (the Portfolios). Each Portfolio is organized as a New York Trust. The investment objectives and policies of the Portfolios together are similar to those of the Fund. The value of the Fund's investment in each Portfolio reflects the Fund's proportionate interest in the net assets of the Boston Income Portfolio, Floating Rate Portfolio, and Government Obligations Portfolio (5.6%, 1.4%, and 14.3%, resp ectively, at October 31, 2006). The performance of the Fund is directly affected by the performance of the Portfolios. A copy of each Portfolio's financial statements is available on the EDGAR Database on the Securities and Exchange Commission's website (www.sec.gov), at the Commission's public reference room in Washington, DC or upon request from the Fund's principal underwriter, Eaton Vance Distributors Inc. (EVD), by calling 1-800-225-6265.
The following is a summary of significant accounting policies consistently followed by the Fund in the preparation of its financial statements. The policies are in conformity with accounting principles generally accepted in the United States of America.
A Investment Valuation — Boston Income Portfolio's valuation policies are as follows: Investments listed on securities exchanges or NASDAQ are valued at closing sale prices. Listed or unlisted investments for which closing sale prices are not available are valued at the mean between the latest bid and asked prices. Fixed income investments and senior floating-rate loan interests (other than short-term obligations), including listed investments and investments for which quotations are available, will normally be valued on the basis of market valuations furnished by a pricing service. Short-term obligations, maturing in sixty days or less, are valued at amortized cost, which approximates value. If short - -term debt securities are acquired with a remaining maturity of more than 60 days, they will be valued by a pricing service. Investments for which there is no quotation or valuation are valued at fair value using methods determined in good faith by or at the direction of the Trustees.
Floating Rate Portfolio's valuation policies are as follows: The Portfolio's investments are primarily in interests in senior floating rate loans (Senior Loans). Certain Senior Loans are deemed to be liquid because reliable market quotations are readily available for them. Liquid Senior Loans are valued on the basis of prices furnished by a pricing service. Other Senior Loans are valued at fair value by the Fund's investment adviser under procedures approved by the Trustees. In connection with determining the fair value of a Senior Loan, the investment adviser makes an assessment of the likelihood that the borrower will make a full repayment of the Senior Loan. The primary factors considered by the investment adviser when making this assessment are (i) the creditworthiness of the borrower, (ii) the value of the collateral backing the Senior Loan, and (iii) the priority of the Senior Loan versus other creditors of the borrower. I f, based on its assessment, the investment adviser believes there is a reasonable likelihood that the borrower will make a full repayment of the Senior Loan, the investment adviser will determine the fair value of the Senior Loan using a Matrix pricing approach that considers the yield on the Senior Loan relative to yields on other loan interests issued by companies of comparable credit quality. If, based on its assessment, the investment adviser believes there is not a reasonable likelihood that the borrower will make a full repayment of the Senior Loan, the investment adviser will determine the fair value of the Senior Loan using analyses that include but are not limited to (i) a comparison of the value of the borrower's outstanding equity and debt to that of comparable public companies; (ii) a discounted cash flow analysis; or (iii) when the investment adviser believes it is likely that a borrower will be liquidated or sold, an analysis of the terms of such liquidation or sale. In certain cases, the inves tment adviser will use a combination of analytical methods to determine fair value, such as when only a portion of a borrower's assets are likely to be sold. In conducting its assessment and analyses for purposes of determining fair value of a Senior Loan, the investment adviser will use its
9
Eaton Vance Diversified Income Fund as of October 31, 2006
NOTES TO FINANCIAL STATEMENTS CONT'D
discretion and judgment in considering and appraising such factors, data and information and the relative weight to be given thereto as it deems relevant, including without limitation, some or all of the following: (i) the fundamental characteristics of and fundamental analytical data relating to the Senior Loan, including the cost, size, current interest rate, maturity and base lending rate of the Senior Loan, the terms and conditions of the Senior Loan and any related agreements, and the position of the Senior Loan in the borrower's debt structure; (ii) the nature, adequacy and value of the collateral securing the Senior Loan, including the Portfolio's rights, remedies and interests with respect to the collateral; (iii) the creditworthiness of the borrower, based on an evaluation of its financial condition, financial statements and information about the borrower's business, cash flows, capital structure and future prospects; ( iv) information relating to the market for the Senior Loan including price quotations for and trading in the Senior Loan and interests in similar Senior Loans and the market environment and investor attitudes towards the Senior Loan and interests in similar Senior Loans; (v) the experience, reputation, stability and financial condition of the Agent and any intermediate participants in the Senior Loan; and (vi) general economic and market conditions affecting the fair value of the Senior Loan. Other portfolio securities (other than short-term obligations, but including listed issues) may be valued on the basis of prices furnished by one or more pricing services which determine prices for normal, institutional-size trading units of such securities which may use market information, transactions for comparable securities and various relationships between securities which are generally recognized by institutional traders. The value of interest rate swaps will be based on dealer quotations. Short-term obligations, maturing in sixty days or less, are valued at amortized cost, which approximates value. If short-term debt securities are acquired with a remaining maturity of more than 60 days, they will be valued by a pricing service. Over-the-counter options are valued at the mean between the bid and the asked price provided by dealers. Financial futures contracts listed on the commodity exchanges and exchange traded options are valued at closing settlement prices. Repurchase agreements are valued at cost plus accrued interest. Other portfolio securities for which there are no quotations or valuations are valued at fair value as determined in good faith by or at the direction of the Trustees.
Government Obligations Portfolio's valuation policies are as follows: Debt securities (including collateralized mortgage obligations and certain mortgage backed securities ("MBS") normally are valued by independent pricing services. The pricing services consider various factors relating to bonds or loans and/or market transactions to determine market value. Most seasoned MBS are valued by the investment adviser's matrix pricing system. The matrix pricing system also considers various factors relating to bonds and market transactions to determine market value. Options are valued at last sale price on a U.S. exchange or board of trade or, in the absence of a sale, at the mean between the last bid and asked price. Financial futures contracts listed on commodity exchanges are valued at closing settlement prices. Securities for which there is no such quotation or valuation are valued at fair value using methods determined in good faith by or at the direction of the Trustees. Short-term obligations, maturing in sixty days or less, are valued at amortized cost, which approximates value. If short-term debt securities are acquired with a remaining maturity of more than 60 days, they will be valued by a pricing service.
B Income — The Fund's net investment income or loss consists of the Fund's pro rata share of the net investment income or loss of the Portfolios, less all actual and accrued expenses of the Fund.
C Expenses — The majority of expenses of the Trust are directly identifiable to an individual fund. Expenses which are not readily identifiable to a specific fund are allocated taking into consideration, among other things, the nature and type of expense and the relative size of the funds.
D Federal Taxes — The Fund's policy is to comply with the provisions of the Internal Revenue Code applicable to regulated investment companies and to distribute to shareholders, each year, substantially all of its net investment income and all or substantially all of its net realized capital gains. Accordingly, no provision for federal income or excise tax is necessary. At October 31, 2006, the Fund, for federal income tax purposes, had a capital loss carryover of $2,203,859 which will reduce the Fund's taxable income arising from future net realized gain on investment transactions, if any, to the extent permitted by the Internal Revenue Code, and thus will reduce the amount of distributions to shareholders which would otherwise be necessary to relieve the Fund of any lia bility for federal income or excise tax. Such capital loss carryover will expire on October 31, 2013 ($1,151,435) and October 31, 2014 ($1,052,424).
E Expense Reduction — Investors Bank & Trust Company (IBT) serves as custodian of the Fund. Pursuant to the custodian agreement, IBT receives a fee reduced by credits which are determined based on the average daily cash balance the Fund maintains with IBT. All credit balances used to reduce the Fund's custodian fees are
10
Eaton Vance Diversified Income Fund as of October 31, 2006
NOTES TO FINANCIAL STATEMENTS CONT'D
reported as a reduction of expenses in the Statement of Operations.
F Indemnifications — Under the Trust's organizational documents, its officers and Trustees may be indemnified against certain liabilities and expenses arising out of the performance of their duties to the Fund, and shareholders are indemnified against personal liability for the obligations of the Trust. Additionally, in the normal course of business, the Fund enters into agreements with service providers that may contain indemnification clauses. The Fund's maximum exposure under these arrangements is unknown as this would involve future claims that may be made against the Fund that have not yet occurred.
G Use of Estimates — The preparation of the financial statements in conformity with accounting principles generally accepted in the United States of America requires management to make estimates and assumptions that affect the reported amounts of assets and liabilities at the date of the financial statements and the reported amounts of income and expense during the reporting period. Actual results could differ from those estimates.
H Other — Investment transactions are accounted for on the date the securities are purchased or sold. Dividends to shareholders are recorded on the ex-dividend date.
2 Distributions to Shareholders
The Fund declares dividends daily to shareholders of record at the time of declaration. Distributions are paid monthly. Distributions of allocated realized capital gains, if any, are made at least annually. Shareholders may reinvest all distributions in shares of the same class of the Fund at the net asset value as of the close of business on the ex-dividend date. Distributions are paid in the form of additional shares of the same class of the Fund or, at the election of the shareholder, in cash. The Fund distinguishes between distributions on a tax basis and a financial reporting basis. Accounting principles generally accepted in the United States of America require that only distributions in excess of tax basis earnings and profits be reported in the financial statements as a return of capital. Permanent differences between book and tax accounting relating to distributions are reclassified to paid-in capital.
The tax character of distributions declared for the period from the start of business, December 7, 2004 to October 31, 2005, and for the year ended October 31, 2006, were as follows:
| | | Year Ended
October 31, 2006 | | Period Ended
October 31, 2005 | |
| Distributions declared from: | |
|
| Ordinary income | | $ | 15,408,155 | | | $ | 4,889,043 | | |
|
During the year ended October 31, 2006, accumulated paid-in capital was decreased by $415,447, accumulated undistributed net investment income was increased by $1,941,423, and accumulated net realized loss was increased by $1,525,976 primarily due to differences between book and tax accounting for amortization/accretion, paydown losses and foreign currency transactions. This change had no effect on the net assets or the net asset value per share.
As of October 31, 2006 the components of distributable earnings (accumulated losses) on a tax basis were as follows:
| Undistributed ordinary income | | $ | 669,052 | | |
| Capital loss carryforwards | | $ | (2,203,859 | ) | |
The differences between components of distributable earnings (accumulated losses) on a tax basis and the amounts reflected in the statement of assets and liabilities are primarily due to differences in book and tax policies for financial futures and swaps contracts, the timing of recognizing distributions and wash sales.
3 Shares of Beneficial Interest
The Fund's Declaration of Trust permits the Trustees to issue an unlimited number of full and fractional shares of beneficial interest (without par value). Such shares may be issued in a number of different series (such as the Fund) and classes. Transactions in Fund shares were as follows:
| Class A | | Year Ended
October 31, 2006 | | Period Ended
October 31, 2005(1) | |
| Sales | | | 8,485,953 | | | | 9,912,542 | | |
Issued to shareholders electing to receive
payments of distributions in Fund shares | | | 529,161 | | | | 173,874 | | |
| Redemptions | | | (3,094,584 | ) | | | (1,186,937 | ) | |
| Net increase | | | 5,920,530 | | | | 8,899,479 | | |
11
Eaton Vance Diversified Income Fund as of October 31, 2006
NOTES TO FINANCIAL STATEMENTS CONT'D
| Class B | | Year Ended
October 31, 2006 | | Period Ended
October 31, 2005(1) | |
| Sales | | | 1,407,384 | | | | 2,374,101 | | |
Issued to shareholders electing to receive
payments of distributions in Fund shares | | | 99,979 | | | | 30,814 | | |
| Redemptions | | | (496,300 | ) | | | (156,241 | ) | |
| Net increase | | | 1,011,063 | | | | 2,248,674 | | |
| Class C | | Year Ended
October 31, 2006 | | Period Ended
October 31, 2005(1) | |
| Sales | | | 6,557,592 | | | | 9,369,671 | | |
Issued to shareholders electing to receive
payments of distributions in Fund shares | | | 450,961 | | | | 131,513 | | |
| Redemptions | | | (2,302,235 | ) | | | (292,667 | ) | |
| Net increase | | | 4,706,318 | | | | 9,208,517 | | |
(1) For the period from the start of business, December 7, 2004 to October 31, 2005.
4 Investment Advisor Fee and other Transactions with Affiliates
Eaton Vance Management (EVM) serves as the investment adviser and administrator of the Fund, providing the Fund with investment advisory services (relating to the investment of the Fund's assets in the Portfolios). EVM does not receive a fee for serving as the Fund's investment adviser and administrator. The Portfolios have engaged Boston Management & Research (BMR), a subsidiary of EVM, to render investment advisory services and the Fund is allocated its share of the investment advisory fee paid by each Portfolio in which it invests.
Except for Trustees of the Fund and the Portfolios who are not members of EVM's organization, officers and Trustees receive remuneration for their services to the Fund out of the investment adviser fee. Trustees of the Fund who are not affiliated with EVM may elect to defer receipt of all or a percentage of their annual fees in accordance with the terms of the Trustees Deferred Compensation Plan. For the year ended October 31, 2006, no significant amounts have been deferred. Certain officers and Trustees of the Fund and Portfolios are officers of the above organization.
EVM serves as the sub-transfer agent of the Fund and receives from the transfer agent an aggregate fee based upon the actual expenses incurred by EVM in the performance of those activities. For the year ended October 31, 2006, EVM received $10,209 in sub-transfer agent fees.
The Fund was informed that Eaton Vance Distributors, Inc. (EVD), a subsidiary of EVM and the Funds principal underwriter, received $91,558 as its portion of the sales charge on sales of Class A for the year ended October 31, 2006.
5 Distribution Plans
Class A has in effect a distribution plan pursuant to Rule 12b-1 under the Investment Company Act of 1940 (Class A Plan). The Class A Plan provides that the Fund will pay EVD a distribution and service fee of 0.25% of the Fund's average daily net assets attributable to Class A shares for each fiscal year for distribution services and facilities provided to the Fund by EVD, as well as for personal services and/or the maintenance of shareholder accounts. Distribution and service fees paid or accrued for the year ended October 31, 2006 amounted to $281,026 for Class A shares. The Fund also has in effect distribution plans for Class B shares (Class B Plan) and Class C shares (Class C Plan) pursuant to Rule 12b-1. The Class B and Class C Plans require the Fund to pay EVD amounts equal to 1/365 of 0.75% of the Fund's average daily net assets attributable to Class B and Class C shares for providing ongoing distribution services and fac ilities to the Fund. The Fund will automatically discontinue payments to EVD during any period in which there are no outstanding Uncovered Distribution Charges, which are equivalent to the sum of (i) 6.25% of the aggregate amount received by the Fund for the Class B and Class C shares sold, respectively, plus (ii) interest calculated by applying the rate of 1% over the prevailing prime rate to the outstanding balance of Uncovered Distribution Charges of EVD of each respective class, reduced by the aggregate amount of contingent deferred sales charges (see Note 6) and daily amounts theretofore paid to EVD by each respective class. The Fund paid or accrued $203,071 and $846,883 for Class B and Class C shares, respectively, to or payable to EVD for the year ended October 31, 2006, representing 0.75% of the average daily net assets for Class B and Class C shares. At October 31, 2006, the amount of Uncovered Distribution Charges of EVD calculated under the Plans was approximately $1,401,000 and $7,973,000 for Cla ss B and Class C shares, respectively. The Class B and Class C Plans also authorize the Fund to make payments of service fees to EVD, investment dealers and other persons in amounts not exceeding 0.25% annually of the average daily net assets attributable to that Class. Service fees are paid for personal services and/or the maintenance of shareholder accounts. They are separate and distinct from the Class B and Class C sales commissions and distribution fees and, as such, are not subject to automatic discontinuance when there are no outstanding
12
Eaton Vance Diversified Income Fund as of October 31, 2006
NOTES TO FINANCIAL STATEMENTS CONT'D
Uncovered Distribution Charges to EVD. Service fees paid or accrued for the year ended October 31, 2006 amounted to $67,691 and $282,294 for Class B and Class C shares, respectively.
6 Contingent Deferred Sales Charge
Effective September 15, 2006, all purchases of Class A shares of $1 million or more will be subject to a 1% contingent deferred sales charge (CDSC) in the event of redemption within 18 months of purchase. Prior to September 15, 2006, Class A shares purchased at net asset value in amounts of $1 million or more (other than shares purchased in a single transaction of $5 million or more) were sublect to a 1% CDSC if redeemed within 12 months or purchase. A CDSC generally is imposed on redemptions of Class B shares made within six years of purchase and on redemptions of Class C shares made within one year of purchase. Generally, the CDSC is based upon the lower of the net asset value at date of redemption or date of purchase. No charge is levied on shares acquired by reinvestment of dividends or capital gain distributions. The Class B CDSC is imposed at declining rates that begin at 5% in the case of redemptions in the first and seco nd year after purchase, declining one percentage point each subsequent year. Class C shares will be subject to a 1% CDSC if redeemed within one year of purchase.
No CDSC is levied on shares which have been sold to EVM or its affiliates or to their respective employees or clients and may be waived under certain other limited conditions. CDSC on Class B and Class C redemptions are paid to EVD to reduce the amount of Uncovered Distribution Charges calculated under the Class B and Class C Plans, respectively (see Note 5). CDSC assessed on Class B and Class C shares when no Uncovered Distribution Charges exist for the respective classes will be credited to the Fund. EVD received approximately $4,707, $71,386 and $47,255 of CDSC paid by shareholders for Class A, Class B, and Class C shares, respectively, for the year ended October 31, 2006.
7 Investment Transactions
For the year ended October 31, 2006, increases and decreases in the Fund's investment in the Portfolios were as follows:
| Portfolio | | Contributions | | Withdrawals | |
| Boston Income Portfolio | | $ | 36,255,135 | | | $ | 6,413,427 | | |
| Floating Rate Portfolio | | | 37,309,945 | | | | 4,116,037 | | |
| Government Obligations Portfolio | | | 38,302,845 | | | | 3,717,108 | | |
8 Investment in Portfolios
For the year ended October 31, 2006, the Fund was allocated net investment income and realized and unrealized gain (loss) from the Portfolios as follows:
| | | Boston
Income
Portfolio | | Floating
Rate
Portfolio | | Government
Obligations
Portfolio | | Total | |
| Interest income | | $ | 7,111,707 | | | $ | 5,924,125 | | | $ | 3,784,839 | | | $ | 16,820,671 | | |
| Dividend income | | | 55,274 | | | | 78 | | | | — | | | | 55,352 | | |
| Security lending income | | | — | | | | — | | | | 437,474 | | | | 437,474 | | |
| Expenses | | | (555,510 | ) | | | (457,711 | ) | | | (669,395 | ) | | | (1,682,616 | ) | |
| Net investment income | | $ | 6,611,471 | | | $ | 5,466,492 | | | $ | 3,552,918 | | | $ | 15,630,881 | | |
Net realized gain (loss) —
Investment transactions
(identified cost basis) | | $ | 503,014 | | | $ | (67,245 | ) | | $ | (266,484 | ) | | $ | 169,285 | | |
| Financial futures contracts | | | — | | | | — | | | | 266,412 | | | | 266,412 | | |
| Swap contracts | | | 15,985 | | | | 16,648 | | | | — | | | | 32,633 | | |
Foreign currency and forward
foreign currency exchange
contract transactions | | | 945 | | | | (295,335 | ) | | | — | | | | (294,390 | ) | |
| Net realized gain (loss) | | $ | 519,944 | | | $ | (345,932 | ) | | $ | (72 | ) | | $ | 173,940 | | |
Change in unrealized
appreciation (depreciation)
Investments | | $ | 1,713,082 | | | $ | 132,613 | | | $ | 480,987 | | | $ | 2,326,682 | | |
| Financial futures contracts | | | — | | | | — | | | | 7,972 | | | | 7,972 | | |
| Swap contracts | | | (8,701 | ) | | | 15,660 | | | | — | | | | 6,959 | | |
Foreign currency and forward
foreign currency exchange
contracts | | | 755 | | | | (96,659 | ) | | | — | | | | (95,904 | ) | |
Net change in unrealized
appreciation (depreciation) | | $ | 1,705,136 | | | $ | 51,614 | | | $ | 488,959 | | | $ | 2,245,709 | | |
9 Recently Issued Accounting Pronouncements
In June 2006, the Financial Accounting Standards Board ("FASB") issued FASB Interpretation No. 48, ("FIN 48") "Accounting for Uncertainty in Income Taxes – an interpretation of FASB Statement No. 109". FIN 48 clarifies the accounting for uncertainty in income taxes recognized in accordance with FASB Statement No. 109, "Accounting for Income Taxes." This interpretation prescribes a recognition threshold and measurement attribute for the financial statement recognition and measurement of a tax position taken or expected to be taken in a tax return. It also provides guidance on de-recognition, classification, interest and penalties, accounting in interim periods, disclosure and transition. FIN 48 is effective for fiscal years
13
Eaton Vance Diversified Income Fund as of October 31, 2006
NOTES TO FINANCIAL STATEMENTS CONT'D
beginning after December 15, 2006. Management is currently evaluating the impact of applying the various provisions of FIN 48.
In September 2006, the Financial Accounting Standards Board ("FASB") issued Statement of Financial Accounting Standards No. 157, ("FAS 157") "Fair Value Measurements". FAS 157 defines fair value, establishes a framework for measuring fair value in accordance with generally accepted accounting principles and expands disclosure about fair value measurements. FAS 157 is effective for fiscal years beginning after November 15, 2007. Management is currently evaluating the impact the adoption of FAS 157 will have on the Fund's financial statement disclosures.
14
Diversified Income Fund as of October 31, 2006
REPORT OF INDEPENDENT REGISTERED PUBLIC ACCOUNTING FIRM
To the Trustees and Shareholders
of Diversified Income Fund:
In our opinion, the accompanying statement of assets and liabilities, and the related statements of operations and of changes in net assets and the financial highlights present fairly, in all material respects, the financial position of Diversified Income Fund, a series of Eaton Vance Mutual Funds Trust (the "Fund") at October 31, 2006, and the results of its operations, the changes in its net assets and the financial highlights for each of the periods indicated, in conformity with accounting principles generally accepted in the United States of America. These financial statements and financial highlights (hereafter referred to as "financial statements") are the responsibility of the Fund's management; our responsibility is to express an opinion on these financial statements based on our audits. We conducted our audits of these financial statements in accordance with standards of the Public Company Accounting Oversight Board (Un ited States). Those standards require that we plan and perform the audit to obtain reasonable assurance about whether the financial statements are free of material misstatement. An audit includes examining, on a test basis, evidence supporting the amounts and disclosures in the financial statements, assessing the accounting principles used and significant estimates made by management, and evaluating the overall financial statement presentation. We believe that our audits provide a reasonable basis for our opinion.
PricewaterhouseCoopers LLP
Boston, Massachusetts
December 27, 2006
15
Eaton Vance Diversified Fund as of October 31, 2006
FEDERAL TAX INFORMATION (Unaudited)
The Form 1099-DIV you receive in January 2007 will show the tax status of all distributions paid to your account in calendar 2006. Shareholders are advised to consult their own tax adviser with respect to the tax consequences of their investment in the Fund.
16
Eaton Vance Diversified Income Fund
BOARD OF TRUSTEES' ANNUAL APPROVAL OF THE INVESTMENT ADVISORY AGREEMENT
Overview of the Contract Review Process
The Investment Company Act of 1940, as amended (the "1940 Act"), provides, in substance, that each investment advisory agreement between a fund and its investment adviser will continue in effect from year to year only if its continuance is approved at least annually by the fund's board of trustees, including by a vote of a majority of the trustees who are not "interested persons" of the fund ("Independent Trustees") cast in person at a meeting called for the purpose of considering such approval.
At a meeting of the Boards of Trustees (each a "Board") of the Eaton Vance group of mutual funds (the "Eaton Vance Funds") held on March 27, 2006, the Board, including a majority of the Independent Trustees, voted to approve continuation of existing advisory and sub-advisory agreements for the Eaton Vance Funds for an additional one-year period. In voting its approval, the Board relied upon the affirmative recommendation of the Special Committee of the Board, which is a committee comprised exclusively of Independent Trustees. Prior to making its recommendation, the Special Committee reviewed information furnished for a series of meetings of the Special Committee held in February and March 2006. Such information included, among other things, the following:
Information about Fees, Performance and Expenses
• An independent report comparing the advisory and related fees paid by each fund with fees paid by comparable funds;
• An independent report comparing each fund's total expense ratio and its components to comparable funds;
• An independent report comparing the investment performance of each fund to the investment performance of comparable funds over various time periods;
• Data regarding investment performance in comparison to relevant peer groups of funds and appropriate indices;
• Comparative information concerning fees charged by each adviser for managing other mutual funds and institutional accounts using investment strategies and techniques similar to those used in managing the fund;
• Profitability analyses for each adviser with respect to each fund managed by it;
Information about Portfolio Management
• Descriptions of the investment management services provided to each fund, including the investment strategies and processes employed;
• Information concerning the allocation of brokerage and the benefits received by each adviser as a result of brokerage allocation, including information concerning the acquisition of research through "soft dollar" benefits received in connection with the funds' brokerage, and the implementation of a soft dollar reimbursement program established with respect to the funds;
• Data relating to portfolio turnover rates of each fund;
• The procedures and processes used to determine the fair value of fund assets and actions taken to monitor and test the effectiveness of such procedures and processes;
Information about each Adviser
• Reports detailing the financial results and condition of each adviser;
• Descriptions of the qualifications, education and experience of the individual investment professionals whose responsibilities include portfolio management and investment research for the funds, and information relating to their compensation and responsibilities with respect to managing other mutual funds and investment accounts;
• Copies of the Codes of Ethics of each adviser and its affiliates, together with information relating to compliance with and the administration of such codes;
• Information concerning the resources devoted to compliance efforts undertaken by each adviser and its affiliates on behalf of the funds (including descriptions of various compliance programs) and their record of compliance with investment policies and restrictions, including policies with respect to market-timing, late trading and selective portfolio disclosure, and with policies on personal securities transactions;
• Descriptions of the business continuity and disaster recovery plans of each adviser and its affiliates;
Other Relevant Information
• Information concerning the nature, cost and character of the administrative and other non-investment management services provided by Eaton Vance Management and its affiliates;
• Information concerning management of the relationship with the custodian, subcustodians and fund accountants by each adviser or the funds' administrator; and
• The terms of each advisory agreement.
In addition to the information identified above, the Special Committee considered information provided from time to time by each adviser throughout the year at meetings of the Board and its committees. Over the course of the twelve month period ended March 31,
17
Eaton Vance Diversified Income Fund
BOARD OF TRUSTEES' ANNUAL APPROVAL OF THE INVESTMENT ADVISORY AGREEMENT CONT'D
2006, the Board met nine times and the Special Committee, the Audit Committee and the Governance Committee, each of which is a Committee comprised solely of Independent Trustees, met eight, twelve and five times, respectively. At such meetings, the Trustees received, among other things, presentations by the portfolio managers and other investment professionals of each adviser relating to the investment performance of each fund and the investment strategies used in pursuing the fund's investment objective.
For funds that invest through one or more underlying portfolios, the Board considered similar information about the portfolio(s) when considering the approval of advisory agreements. In addition, in cases where the fund's investment adviser has engaged a sub-adviser, the Board considered similar information about the sub-adviser when considering the approval of any sub-advisory agreement.
The Special Committee was assisted throughout the contract review process by Goodwin Procter LLP, legal counsel for the Independent Trustees. The members of the Special Committee relied upon the advice of such counsel and their own business judgment in determining the material factors to be considered in evaluating each advisory and sub-advisory agreement and the weight to be given to each such factor. The conclusions reached with respect to each advisory and sub-advisory agreement were based on a comprehensive evaluation of all the information provided and not any single factor. Moreover, each member of the Special Committee may have placed varying emphasis on particular factors in reaching conclusions with respect to each advisory and sub-advisory agreement.
Results of the Process
Based on its consideration of the foregoing, and such other information as it deemed relevant, including the factors and conclusions described below, the Special Committee concluded that the continuance of the investment advisory agreement of the Diversified Income Fund (the "Fund") with Eaton Vance Management ("EVM"), as well as the investment advisory agreements of the Boston Income Portfolio, the Floating Rate Portfolio and the Government Obligations Portfolio, the portfolios in which the Fund invests (the "Portfolios"), each with Boston Management and Research ("BMR"), including their fee structures, is in the interests of shareholders and, therefore, the Special Committee recommended to the Board approval of each agreement. The Board accepted the recommendation of the Special Committee as well as the factors considered and conclusions reached by the Special Committee with respect to each agreement. Accordingly, the Board, i ncluding a majority of the Independent Trustees, voted to approve continuation of the investment advisory agreements for the Fund and the Portfolios. EVM and BMR are each referred to as an "Adviser" herein; EVM with respect to the Fund and BMR with respect to the Portfolios. EVM and BMR are affiliates.
Nature, Extent and Quality of Services
In considering whether to approve the investment advisory agreement of the Fund and the Portfolios, the Board evaluated the nature, extent and quality of services provided to the Portfolios by BMR and to the Fund by EVM. BMR manages the Portfolios, while EVM allocates the assets of the Fund among the Portfolios and rebalances if the Fund's allocation varies more than 3% from the pre-determined fixed allocation percentages.
The Board considered BMR's management capabilities and investment process with respect to the types of investments held by the Portfolios, including the education, experience and number of its investment professionals and other personnel who provide portfolio management, investment research, and similar services to the Portfolios. In particular, the Board evaluated the abilities and experience of such investment personnel in analyzing special considerations relevant to investing in senior secured floating-rate loans, high-yield debt, and other investments. With respect to the Floating Rate Portfolio, the Board noted the experience of BMR's 29 bank loan investment professionals and other personnel who provide services to the Portfolios, including four portfolio managers and 15 analysts. With respect to the Boston Income Portfolio, the Board evaluated the abilities and experience of such investment personnel in analyzing special c onsiderations relevant to investing in high-yield debt. With respect to the Government Obligations Portfolio, the Board noted the Adviser's experience in investing in mortgage-backed securities, including seasoned mortgage-backed securities. For all the Portfolios, the Board also took into account the resources dedicated to portfolio management and other services, including the compensation paid to recruit and retain investment personnel, and the time and attention devoted to each Fund in the complex by senior management.
The Board reviewed the compliance programs of the Adviser and relevant affiliates thereof. Among other matters, the Board considered compliance and reporting matters relating to personal trading by investment personnel, selective disclosure of portfolio holdings, late trading, frequent trading, portfolio valuation, business continuity and the allocation of investment opportunities. The Board also evaluated the responses of the Adviser and its affiliates to requests from regulatory authorities such as the Securities and Exchange Commission and the National Association of Securities Dealers.
The Board considered shareholder and other administrative services provided or managed by EVM and its affiliates, including transfer agency and accounting services. The Board evaluated the benefits to shareholders of investing in a fund that is a part of a large family of funds, including the ability, in many cases, to exchange an investment among different funds without incurring additional sales charges.
18
Eaton Vance Diversified Income Fund
BOARD OF TRUSTEES' ANNUAL APPROVAL OF THE INVESTMENT ADVISORY AGREEMENT CONT'D
After consideration of the foregoing factors, among others, the Board concluded that the nature, extent and quality of services provided by the Adviser, taken as a whole, are appropriate and consistent with the terms of the investment advisory agreement.
Fund Performance
The Board compared the Fund's investment performance to a relevant universe of similarly managed funds identified by an independent data provider and appropriate benchmark indices. The Board reviewed comparative performance data for the period since inception (December 2004) ended September 30, 2005 for the Fund. The Board also considered the performance of the underlying Portfolios. The Board concluded that the Fund's performance was satisfactory.
Management Fees and Expenses
The Board reviewed contractual investment advisory fee rates, including administrative fee rates, payable by the Fund directly or indirectly through its pro rata share of the expenses of each Portfolio (referred to collectively as "management fees"). As part of its review, the Board considered the Fund's management fees, including administrative fees, and total expense ratio for the period from inception ended September 30, 2005, as compared to a group of similarly managed funds selected by an independent data provider.
After reviewing the foregoing information, and in light of the nature, extent and quality of the services provided by the Adviser, the Board concluded that the management fees charged for advisory and related services and the Fund's total expense ratio are reasonable.
Profitability
The Board reviewed the level of profits realized by the Adviser and relevant affiliates thereof in providing investment advisory and administrative services to the Fund, the Portfolios and all Eaton Vance Funds as a group. The Board considered the level of profits realized without regard to revenue sharing or other payments by the Adviser and its affiliates to third parties in respect of distribution services. The Board also considered other direct or indirect benefits received by the Adviser and its affiliates in connection with its relationship with the Fund and the Portfolios.
The Board concluded that, in light of the foregoing factors and the nature, extent and quality of the services rendered, the profits realized by the Adviser and its affiliates are reasonable.
Economies of Scale
In reviewing management fees and profitability, the Board also considered the extent to which the Adviser and its affiliates, on the one hand, and the Fund, on the other hand, can expect to realize benefits from economies of scale as the assets of the Fund and the Portfolios increase. The Board acknowledged the difficulty in accurately measuring the benefits resulting from the economies of scale with respect to the management of any specific fund or group of funds. The Board reviewed data summarizing the increases and decreases in the assets of the Portfolios and of all Eaton Vance Funds as a group over various time periods, and evaluated the extent to which the total expense ratio of the Fund and the profitability of the Adviser and its affiliates may have been affected by such increases or decreases. The Board noted that, at its request, the Adviser had agreed to add a breakpoint for the Floating Rate Portfolio with respect to assets that exceed $10 billion and for the Boston Income Portfolio with respect to assets that exceed $5 billion. Based upon the foregoing, the Board concluded that the benefits from economies of scale are currently being shared equitably by the Adviser and its affiliates and the Fund. The Board also concluded that, assuming reasonably foreseeable increases in the assets of the Fund, the structure of the advisory fee, which includes breakpoints at several asset levels, can be expected to cause the Adviser and its affiliates and the Fund and the Portfolios to continue to share such benefits equitably.
19
Eaton Vance Diversified Income Fund
MANAGEMENT AND ORGANIZATION
Fund Management. The Trustees of Eaton Vance Mutual Funds Trust (the Trust), Boston Income Portfolio (BIP), Floating Rate Portfolio (FRP) and Government Obligations Portfolio (GOP) (the Portfolios) are responsible for the overall management and supervision of the Trust's and Portfolios' affairs. The Trustees and officers of the Trust and the Portfolios are listed below. Except as indicated, each individual has held the office shown or other offices in the same company for the last five years. Trustees and officers of the Trust and the Portfolios hold indefinite terms of office. The "noninterested Trustees" consist of those Trustees who are not "interested persons" of the Trust and the Portfolios, as that term is defined under the 1940 Act. The business address of each Trustee and officer is The Eaton Vance Building, 255 State Street, Boston, Massachusetts 02 109. As used below, "EVC" refers to Eaton Vance Corp., "EV" refers to Eaton Vance, Inc., "EVM" refers to Eaton Vance Management, "BMR" refers to Boston Management and Research, "Parametric" refers to Parametric Portfolio Associates and "EVD" refers to Eaton Vance Distributors, Inc. EVC and EV are the corporate parent and trustee, respectively, of EVM and BMR. EVD is the Fund's principal underwriter, the Portfolio's placement agent and a wholly-owned subsidiary of EVM. Each officer affiliated with Eaton Vance may hold a position with other Eaton Vance affiliates that is comparable to his or her position with EVM listed below.
Name and
Date of Birth | | Position(s)
with the
Fund and
Portfolios | | Term of
Office and
Length of
Service | | Principal Occupation(s)
During Past Five Years | | Number of Portfolios
in Fund Complex
Overseen By
Trustee(1) | | Other Directorships Held | |
| Interested Trustee | | | | | | | | | | | | | |
|
| James B. Hawkes 11/9/41 | | Trustee | | Trustee of the Trust since 1991; of GOP since 1992; of FRP since 2000 and of BIP since 2001 | | Chairman and Chief Executive Officer of EVC, BMR, EVM and EV; Director of EV; Vice President and Director of EVD. Trustee and/or officer of 170 registered investment companies in the Eaton Vance Fund Complex. Mr. Hawkes is an interested person because of his positions with BMR, EVM, EVC and EV, which are affiliates of the Trust and the Portfolios. | | | 170 | | | Director of EVC | |
|
| Noninterested Trustee(s) | | | | | | | | | | | | | |
|
| Benjamin C. Esty 1/2/63 | | Trustee | | Since 2005 | | Roy and Elizabeth Simmons Professor of Business Administration, Harvard University Graduate School of Business Administration (since 2003). Formerly, Associate Professor, Harvard University Graduate School of Business Administration (2000-2003). | | | 170 | | | None | |
|
| Samuel L. Hayes, III 2/23/35 | | Trustee and Chairman of the Board | | Trustee of the Trust since 1986; of GOP since 1993; of FRP since 2000; of BIP since 2001 and Chairman of the Board since 2005 | | Jacob H. Schiff Professor of Investment Banking Emeritus, Harvard University Graduate School of Business Administration. Director of Yakima Products, Inc. (manufacturer of automotive accessories) (since 2001)
and Director of Telect, Inc. (telecommunications services company). | | | 170 | | | Director of Tiffany & Co. (specialty retailer) | |
|
| William H. Park 9/19/47 | | Trustee | | Since 2003 | | Vice Chairman, Commercial Industrial Finance Corp. (specialty finance company) (since 2006). Formerly, President and Chief Executive Officer, Prizm Capital Management, LLC (investment management firm) (2002-2005). Formerly, Executive Vice President and Chief Financial Officer, United Asset Management Corporation (a holding company owning institutional investment management firms) (1982-2001). | | | 170 | | | None | |
|
| Ronald A. Pearlman 7/10/40 | | Trustee | | Since 2003 | | Professor of Law, Georgetown University Law Center. | | | 170 | | | None | |
|
20
Eaton Vance Diversified Income Fund
MANAGEMENT AND ORGANIZATION CONT'D
Name and
Date of Birth | | Position(s)
with the
Fund and
Portfolios | | Term of
Office and
Length of
Service | | Principal Occupation(s)
During Past Five Years | | Number of Portfolios
in Fund Complex
Overseen By
Trustee(1) | | Other Directorships Held | |
| Noninterested Trustee(s) (continued) | | | | | | | | | | | | | |
|
| Norton H. Reamer 9/21/35 | | Trustee | | Trustee of the Trust since 1986; of GOP since 1993; of FRP since 2000 and of BIP since 2001 | | President, Chief Executive Officer and a Director of Asset Management Finance Corp. (a specialty finance company serving the investment management industry) (since October 2003). President, Unicorn Corporation (an investment and financial advisory services company) (since September 2000). Formerly, Chairman and Chief Operating Officer, Hellman, Jordan Management Co., Inc. (an investment management company) (2000-2003). Formerly, Advisory Director of Berkshire Capital Corporation (investment banking firm) (2002-2003). | | | 170 | | | None | |
|
| Lynn A. Stout 9/14/57 | | Trustee | | Trustee of the Trust and GOP since 1998; of FRP since 2000 and of BIP since 2001 | | Professor of Law, University of California at Los Angeles School of Law. | | | 170 | | | None | |
|
| Ralph F. Verni 1/26/43 | | Trustee | | Since 2005 | | Consultant and private investor. | | | 170 | | | None | |
|
| Principal Officers who are not Trustees | | | | | | | |
Name and
Date of Birth | | Position(s)
with the
Fund and
Portfolios | | Term of
Office and
Length of
Service | | Principal Occupation(s)
During Past Five Years | |
| Thomas E. Faust Jr. 5/31/58 | | President of the Trust | | Since 2002 | | President of EVC, EVM, BMR and EV and Director of EVC. Chief Investment Officer of EVC, EVM and BMR. Officer of 71 registered investment companies and 5 private investment companies managed by EVM or BMR. | |
|
| William H. Ahern, Jr. 7/28/59 | | Vice President of the Trust | | Since 1995 | | Vice President of EVM and BMR. Officer of 71 registered investment companies managed by EVM or BMR. | |
|
| Cynthia J. Clemson 3/2/63 | | Vice President of the Trust | | Since 2005 | | Vice President of EVM and BMR. Officer of 86 registered investment companies managed by EVM or BMR. | |
|
| Kevin S. Dyer 2/21/75 | | Vice President of the Trust | | Since 2005 | | Assistant Vice President of EVM and BMR. Officer of 25 registered investment companies managed by EVM or BMR. | |
|
| Thomas P. Huggins 3/7/66 | | Vice President of BIP | | Since 2001 | | Vice President of EVM and BMR. Officer of 4 registered investment companies managed by EVM or BMR. | |
|
| Christine Johnston 11/9/72 | | Vice President of GOP | | Since 2006 | | Vice President of EVM and BMR. Officer of 3 registered investment companies managed by EVM or BMR. | |
|
| Aamer Khan 6/7/60 | | Vice President of the Trust | | Since 2005 | | Vice President of EVM and BMR. Officer of 29 registered investment companies managed by EVM or BMR. | |
|
| Thomas H. Luster 4/8/62 | | Vice President of the Trust | | Since 2006 | | Vice President of EVM and BMR. Officer of 45 registered investment companies managed by EVM or BMR. | |
|
| Michael R. Mach 7/15/47 | | Vice President of the Trust | | Since 1999 | | Vice President of EVM and BMR. Officer of 51 registered investment companies managed by EVM or BMR. | |
|
| Robert B. MacIntosh 1/22/57 | | Vice President of the Trust | | Since 1998 | | Vice President of EVM and BMR. Officer of 86 registered investment companies managed by EVM or BMR. | |
|
21
Eaton Vance Diversified Income Fund
MANAGEMENT AND ORGANIZATION CONT'D
Name and
Date of Birth | | Position(s)
with the
Fund and
Portfolios | | Term of
Office and
Length of
Service | | Principal Occupation(s)
During Past Five Years | |
| Principal Officers who are not Trustees (continued) | | | | | | | |
| Scott H. Page 11/30/59 | | Vice President of FRP | | Since 2000 | | Vice President of EVM and BMR. Officer of 15 registered investment companies managed by EVM or BMR. | |
|
| Cliff Quisenberry, Jr. 1/1/65 | | Vice President of the Trust | | Since 2006 | | Vice President and Director of Research and Product Development of Parametric. Officer of 30 registered investment companies managed by EVM or BMR. | |
|
| Duncan W. Richardson 10/26/57 | | Vice President of the Trust | | Since 2001 | | Executive Vice President and Chief Equity Investment Officer of EVC, EVM and BMR. Officer 76 registered investment companies managed by EVM or BMR. | |
|
| Walter A. Row, III 7/20/57 | | Vice President of the Trust | | Since 2001 | | Director of Equity Research and a Vice President of EVM and BMR. Officer of 33 registered investment companies managed by EVM or BMR. | |
|
| Judith A. Saryan 8/21/54 | | Vice President of the Trust | | Since 2003 | | Vice President of EVM and BMR. Officer of 50 registered investment companies managed by EVM or BMR. | |
|
| Susan Schiff 3/31/61 | | Vice President of the Trust and GOP | | Vice President of the Trust since 2002 and of GOP since 1993 | | Vice President of EVM and BMR. Officer of 30 registered investment companies managed by EVM or BMR. | |
|
| Payson F. Swaffield 8/13/56 | | President of the Portfolio | | Since 2002(2) | | Vice President of EVM and BMR. Officer of 15 registered investment companies managed by EVM or BMR. | |
|
| Mark S. Venezia 5/23/49 | | President of GOP | | Since 2002(2) | | Vice President of EVM and BMR. Officer of 5 registered investment companies managed by EVM or BMR. | |
|
| Michael W. Weilheimer 2/11/61 | | President of BIP | | Since 2002(2) | | Vice President of EVM and BMR. Officer of 24 registered investment companies managed by EVM or BMR. | |
|
| Barbara E. Campbell 6/19/57 | | Treasurer of the Trust | | 2005(2) | | Vice President of EVM and BMR. Officer of 170 registered investment companies managed by EVM or BMR. | |
|
| Alan R. Dynner 10/10/40 | | Secretary | | Secretary of the Trust and GOP since 1997; of FRP since 2000 and of BIP since 2001 | | Vice President, Secretary and Chief Legal Officer of BMR, EVM, EVD, EV and EVC. Officer of 170 registered investment companies managed by EVM or BMR. | |
|
| Dan A. Maalouly 3/25/62 | | Treasurer of the Portfolios | | Since 2005 | | Vice President of EVM and BMR. Previously, Senior Manager of PricewaterhouseCoopers LLP (1997-2005). Officer of 71 registered investment companies managed by EVM or BMR. | |
|
| Paul M. O'Neil 7/11/53 | | Chief Compliance Officer | | Since 2004 | | Vice President of EVM and BMR. Officer of 170 registered investment companies managed by EVM or BMR. | |
|
(1) Includes both master and feeder funds in a master-feeder structure.
(2) Prior to 2002, Mr. Swaffield served as Vice President of FRP since 2000, Mr. Venezia served as Vice President of GOP since 1993 and Mr. Weilheimer served as Vice President of BIP since 2001. Prior to 2005, Ms. Campbell served as Assistant Treasurer of the Trust since 1995.
The SAI for the Fund includes additional information about the Trustees and officers of the Fund and the Portfolio and can be obtained without charge on Eaton Vance's website at www.eatonvance.com or by calling 1-800-225-6265.
22
This Page Intentionally Left Blank
This Page Intentionally Left Blank
Investment Adviser of Eaton Vance Diversified Income Fund
Eaton Vance Management
The Eaton Vance Building
255 State Street
Boston, MA 02109
Administrator of Eaton Vance Diversified Income Fund
Eaton Vance Management
The Eaton Vance Building
255 State Street
Boston, MA 02109
Principal Underwriter
Eaton Vance Distributors, Inc.
The Eaton Vance Building
255 State Street
Boston, MA 02109
(617) 482-8260
Custodian
Investors Bank & Trust Company
200 Clarendon Street
Boston, MA 02116
Transfer Agent
PFPC Inc.
Attn: Eaton Vance Funds
P.O. Box 9653
Providence, RI 02940-9653
(800) 262-1122
PricewaterhouseCoopers LLP
125 High Street
Boston, MA 02110-1707
Eaton Vance Diversified Income Fund
The Eaton Vance Building
255 State Street
Boston, MA 02109
This report must be preceded or accompanied by a current prospectus. Before investing, investors should consider carefully the Fund's investment objective(s), risks, and charges and expenses. The Fund's current prospectus contains this and other information about the Fund and is available through your financial advisor. Please read the prospectus carefully before you invest or send money. For further information please call 1-800-225-6265.
2320-12/06 DISRC
Item 2. Code of Ethics
The registrant has adopted a code of ethics applicable to its Principal Executive Officer, Principal Financial Officer and Principal Accounting Officer. The registrant undertakes to provide a copy of such code of ethics to any person upon request, without charge, by calling 1-800-262-1122.
Item 3. Audit Committee Financial Expert
The registrant’s Board has designated William H. Park, Samuel L. Hayes, III and Norton H. Reamer, each an independent trustee, as its audit committee financial experts. Mr. Park is a certified public accountant who is the Vice Chairman of Commercial Industrial Finance Corp (specialty finance company). Previously, he served as President and Chief Executive Officer of Prizm Capital Management, LLC (investment management firm) and as Executive Vice President and Chief Financial Officer of United Asset Management Corporation (“UAM”) (a holding company owning institutional investment management firms). Mr. Hayes is the Jacob H. Schiff Professor of Investment Banking Emeritus of the Harvard University Graduate School of Business Administration. Mr. Reamer is the President, Chief Executive Officer and a Director of Asset Management Finance Corp. (a specialty finance company serving the investment management industry) and is President of Unicorn Corporation (an investment and financial advisory services company). Formerly, Mr. Reamer was Chairman and Chief Operating Officer of Hellman, Jordan Management Co., Inc. (an investment management company) and Advisory Director of Berkshire Capital Corporation (an investment banking firm), Chairman of the Board of UAM and Chairman, President and Director of the UAM Funds (mutual funds).
Item 4. Principal Accountant Fees and Services
(a)-(d)
Eaton Vance Tax-Managed Small Cap Value Fund, Eaton Vance Tax-Managed Mid-Cap Core Fund, Eaton Vance Multi-Cap Opportunity Fund, Eaton Vance Tax-Managed Value Fund, Eaton Vance Tax-Managed International Equity Fund, Eaton Vance Tax-Managed Small-Cap Growth Fund, Eaton Vance Tax-Managed Equity Asset Allocation Fund, Eaton Vance High Income Fund, Eaton Vance Floating-Rate Fund, Eaton Vance Floating-Rate High Income Fund, Eaton Vance Strategic Income Fund, Eaton Vance Low Duration Fund, Eaton Vance Government Obligations Fund, Eaton Vance Diversified Income Fund, Eaton Vance Equity Research Fund ,Eaton Vance Tax-Managed Dividend Income Fund , Eaton Vance Dividend Income Fund, Eaton Vance International Equity Fund and Eaton Vance Structured Emerging Markets Fund (the “Fund(s)”) are series of Eaton Vance Mutual Funds Trust (the “Trust”), a Massachusetts business trust, which, including the Funds, contains a total of 25 series (the “Series”). The Trust is registered under the Investment Company Act of 1940 as an open-end management investment company. This Form N-CSR relates to the Funds’ annual reports.
With the exception of Tax-Managed Dividend Income Fund, the following tables present the aggregate fees billed to each Fund for the Fund’s respective fiscal years ended October 31, 2004 and October 31, 2005 or for those Funds which have not completed two years of operations, for such fiscal periods as indicated on the following tables, by the Fund’s principal accountant for professional services rendered for the audit of the Fund’s annual financial statements and fees billed for other services rendered by the principal accountant during those periods. Eaton Vance Tax-Managed Dividend Income Fund recently changed its fiscal year end from April 30 to October 31. Accordingly the tables for this Fund show fee information for the past two fiscal years ended April 30, 2006 and period from May 1, 2006 to October 31, 2006.
Eaton Vance Tax-Managed Small-Cap Value Fund
Fiscal Years Ended | | 10/31/05 | | 10/31/06 | |
| | | | | |
Audit Fees | | $ | 8,720 | | $ | 9,020 | |
| | | | | |
Audit-Related Fees(1) | | 0 | | 0 | |
| | | | | |
Tax Fees(2) | | $ | 6,090 | | 6,320 | |
| | | | | |
All Other Fees(3) | | 0 | | 0 | |
| | | | | |
Total | | $ | 14,810 | | $ | 15,340 | |
Eaton Vance Tax-Managed Mid-Cap Core Fund
Fiscal Years Ended | | 10/31/05 | | 10/31/06 | |
| | | | | |
Audit Fees | | $ | 8,720 | | $ | 9,020 | |
| | | | | |
Audit-Related Fees(1) | | 0 | | 0 | |
| | | | | |
Tax Fees(2) | | 6,300 | | 6,540 | |
| | | | | |
All Other Fees(3) | | 0 | | 0 | |
| | | | | |
Total | | $ | 15,020 | | $ | 15,560 | |
Eaton Vance Tax-Managed Multi-Cap Opportunity Fund
Fiscal Years Ended | | 10/31/05 | | 10/31/06 | |
| | | | | |
Audit Fees | | $ | 10,840 | | $ | 11,230 | |
| | | | | |
Audit-Related Fees(1) | | 0 | | 0 | |
| | | | | |
Tax Fees(2) | | 6,090 | | 6,320 | |
| | | | | |
All Other Fees(3) | | 0 | | 0 | |
| | | | | |
Total | | $ | 16,930 | | $ | 17,550 | |
Eaton Vance Tax-Managed Value Fund
Fiscal Years Ended | | 10/31/05 | | 10/31/06 | |
| | | | | |
Audit Fees | | $ | 12,055 | | $ | 12,490 | |
| | | | | |
Audit-Related Fees(1) | | 0 | | 0 | |
| | | | | |
Tax Fees(2) | | 6,300 | | 6,540 | |
| | | | | |
All Other Fees(3) | | 0 | | 0 | |
| | | | | |
Total | | $ | 18,355 | | $ | 19,030 | |
Eaton Vance Tax-Managed International Equity Fund
Fiscal Years Ended | | 10/31/05 | | 10/31/06 | |
| | | | | |
Audit Fees | | $ | 10,840 | | $ | 11,230 | |
| | | | | |
Audit-Related Fees(1) | | 0 | | 0 | |
| | | | | |
Tax Fees(2) | | 6,195 | | 6,430 | |
| | | | | |
All Other Fees(3) | | 0 | | 0 | |
| | | | | |
Total | | $ | 17,035 | | $ | 17,660 | |
Eaton Vance Tax-Managed Small-Cap Growth Fund
Fiscal Years Ended | | 10/31/05* | | 10/31/06 | |
| | | | | |
Audit Fees | | $ | 21,855 | | $ | 15,490 | |
| | | | | |
Audit-Related Fees(1) | | 0 | | 0 | |
| | | | | |
Tax Fees(2) | | 12,600 | | 6,540 | |
| | | | | |
All Other Fees(3) | | 0 | | 0 | |
| | | | | |
Total | | $ | 34,455 | | $ | 22,030 | |
* These totals represent the 2005 numbers for Tax-Managed Small-Cap Growth 1.1 and 1.2, the two have become one Tax-Managed Small-Cap Growth.
Eaton Vance Tax Managed Equity Asset Allocation Fund
Fiscal Years Ended | | 10/31/05 | | 10/31/06 | |
| | | | | |
Audit Fees | | $ | 46,775 | | $ | 48,590 | |
| | | | | |
Audit-Related Fees(1) | | 0 | | 0 | |
| | | | | |
Tax Fees(2) | | 16,800 | | 17,440 | |
| | | | | |
All Other Fees(3) | | 0 | | 0 | |
| | | | | |
Total | | $ | 63,575 | | $ | 66,030 | |
Eaton Vance High Income Fund
Fiscal Years Ended | | 10/31/05 | | 10/31/06 | |
| | | | | |
Audit Fees | | $ | 12,055 | | $ | 12,490 | |
| | | | | |
Audit-Related Fees(1) | | 0 | | 0 | |
| | | | | |
Tax Fees(2) | | 6,090 | | 6,320 | |
| | | | | |
All Other Fees(3) | | 0 | | 0 | |
| | | | | |
Total | | $ | 18,145 | | $ | 18,810 | |
Eaton Vance Floating-Rate Fund
Fiscal Years Ended | | 10/31/05 | | 10/31/06 | |
| | | | | |
Audit Fees | | $ | 12,055 | | $ | 12,490 | |
| | | | | |
Audit-Related Fees(1) | | 0 | | 0 | |
| | | | | |
Tax Fees(2) | | 6,300 | | 6,540 | |
| | | | | |
All Other Fees(3) | | 0 | | 0 | |
| | | | | |
Total | | $ | 18,355 | | $ | 19,030 | |
Eaton Vance Floating-Rate High Income Fund
Fiscal Years Ended | | 10/31/05 | | 10/31/06 | |
| | | | | |
Audit Fees | | $ | 12,055 | | $ | 12,490 | |
| | | | | |
Audit-Related Fees(1) | | 0 | | 0 | |
| | | | | |
Tax Fees(2) | | 6,300 | | 6,540 | |
| | | | | |
All Other Fees(3) | | 0 | | 0 | |
| | | | | |
Total | | $ | 18,355 | | $ | 19,030 | |
Eaton Vance Strategic Income Fund
Fiscal Years Ended | | 10/31/05 | | 10/31/06 | |
| | | | | |
Audit Fees | | $ | 31,300 | | $ | 34,300 | |
| | | | | |
Audit-Related Fees(1) | | 0 | | 0 | |
| | | | | |
Tax Fees(2) | | 19,175 | | 20,325 | |
| | | | | |
All Other Fees(3) | | 0 | | 0 | |
| | | | | |
Total | | $ | 50,475 | | $ | 54,625 | |
Eaton Vance Low Duration Fund
Fiscal Years Ended | | 10/31/05 | | 10/31/06 | |
| | | | | |
Audit Fees | | $ | 22,300 | | $ | 24,400 | |
| | | | | |
Audit-Related Fees(1) | | 0 | | 0 | |
| | | | | |
Tax Fees(2) | | 11,450 | | 12,125 | |
| | | | | |
All Other Fees(3) | | 0 | | 0 | |
| | | | | |
Total | | $ | 33,750 | | $ | 36,525 | |
Eaton Vance Government Obligations Fund
Fiscal Years Ended | | 10/31/05 | | 10/31/06 | |
| | | | | |
Audit Fees | | $ | 22,600 | | $ | 24,700 | |
| | | | | |
Audit-Related Fees(1) | | 0 | | 0 | |
| | | | | |
Tax Fees(2) | | 13,450 | | 14,275 | |
| | | | | |
All Other Fees(3) | | 0 | | 0 | |
| | | | | |
Total | | $ | 36,050 | | $ | 38,975 | |
Eaton Vance Diversified Income Fund
Fiscal Years Ended | | 10/31/05* | | 10/31/06 | |
| | | | | |
Audit Fees | | $ | 25,100 | | $ | 27,500 | |
| | | | | |
Audit-Related Fees(1) | | 0 | | 0 | |
| | | | | |
Tax Fees(2) | | 13,050 | | 15,150 | |
| | | | | |
All Other Fees(3) | | 0 | | 0 | |
| | | | | |
Total | | $ | 38,150 | | $ | 42,650 | |
* For the period from commencement of operations on November 7, 2004 to October 31, 2005
Eaton Vance Equity Research Fund
Fiscal Years Ended | | 10/31/05 | | 10/31/06 | |
| | | | | |
Audit Fees | | $ | 23,100 | | $ | 25,300 | |
| | | | | |
Audit-Related Fees(1) | | 0 | | 0 | |
| | | | | |
Tax Fees(2) | | $ | 9,125 | | 9,675 | |
| | | | | |
All Other Fees(3) | | 0 | | 0 | |
| | | | | |
Total | | $ | 32,225 | | $ | 34,975 | |
Eaton Vance Tax-Managed Dividend Income Fund
Fiscal Years Ended | | 04/30/06 | | 10/31/06 | |
| | | | | |
Audit Fees | | $ | 46,775 | | $ | 48,590 | |
| | | | | |
Audit-Related Fees(1) | | 0 | | 0 | |
| | | | | |
Tax Fees(2) | | 8,400 | | 9,620 | |
| | | | | |
All Other Fees(3) | | 0 | | 0 | |
| | | | | |
Total | | $ | 55,175 | | $ | 58,210 | |
Eaton Vance Dividend Income Fund
Fiscal Years Ended | | 10/31/06* | |
| | | |
Audit Fees | | $ | 11,360 | |
| | | |
Audit-Related Fees(1) | | 0 | |
| | | |
Tax Fees(2) | | 8,000 | |
| | | |
All Other Fees(3) | | 0 | |
| | | |
Total | | $ | 19,360 | |
* For the period from commencement of operations on November 30, 2005 to October 31, 2006
Eaton Vance International Equity Fund
Fiscal Years Ended | | 10/31/06* | |
| | | |
Audit Fees | | $ | 11,360 | |
| | | |
Audit-Related Fees(1) | | 0 | |
| | | |
Tax Fees(2) | | 8,000 | |
| | | |
All Other Fees(3) | | 0 | |
| | | |
Total | | $ | 19,360 | |
* For the period from commencement of operations on May 31, 2006 to October 31, 2006
Eaton Vance Structured Emerging Markets Fund
Fiscal Years Ended | | 10/31/06* | |
| | | |
Audit Fees | | $ | 73,400 | |
| | | |
Audit-Related Fees(1) | | 0 | |
| | | |
Tax Fees(2) | | 14,050 | |
| | | |
All Other Fees(3) | | 0 | |
| | | |
Total | | $ | 87,450 | |
* For the period from commencement of operations on June 30, 2006 to October 31, 2006
(1) Audit-related fees consist of the aggregate fees billed for assurance and related services that are reasonably related to the performance of the audit of financial statements and are not reported under the category of audit fees.
(2) Tax fees consist of the aggregate fees billed for professional services rendered by the principal accountant relating to tax compliance, tax advice, and tax planning and specifically include fees for tax return preparation.
(3) All other fees consist of the aggregate fees billed for products and services provided by the principal accountant other than audit, audit-related, and tax services.
The various Series comprising the Trust have differing fiscal year ends (October 31 or December 31). In addition, the Series differ as to principal accountant; i.e., certain Series have PricewaterhouseCoopers LLP (“PWC) as a principal accountant and other Series have Deloitte & Touche LLP (“D&T”) as a principal accountant. The following table presents the aggregate audit, audit-related, tax, and other fees billed to all of the Series in the Trust by each Series’ respective principal accountant for the last two fiscal years of each Series.
Fiscal Years | | 12/31/04 | | 10/31/05 | | 12/31/05 | | 10/31/06 | |
Ended | | PWC | | D&T | | PWC | | D&T | | PWC | | D&T | | PWC | | D&T | |
| | | | | | | | | | | | | | | | | |
Audit Fees | | $ | 67,800 | | $ | 21,885 | | $ | 0 | | $ | 37,220 | | $ | 74,200 | | $ | 22,670 | | $ | 0 | | $ | 43,070 | |
| | | | | | | | | | | | | | | | | |
Audit-Related Fees(1) | | 0 | | 0 | | 0 | | 0 | | 0 | | 0 | | 0 | | 0 | |
| | | | | | | | | | | | | | | | | |
Tax Fees(2) | | $ | 29,725 | | $ | 11,130 | | 0 | | $ | 18,585 | | $ | 31,500 | | $ | 11,550 | | 0 | | $ | 19,290 | |
| | | | | | | | | | | | | | | | | |
All Other Fees(3) | | 0 | | 0 | | 0 | | 0 | | 0 | | 0 | | 0 | | 0 | |
| | | | | | | | | | | | | | | | | |
Total | | $ | 97,525 | | $ | 33,015 | | $ | 0 | | $ | 55,805 | | $ | 105,700 | | $ | 34,220 | | $ | 0 | | $ | 62,360 | |
(1) Audit-related fees consist of the aggregate fees billed for assurance and related services that are reasonably related to the performance of the audit of financial statements and are not reported under the category of audit fees.
(2) Tax fees consist of the aggregate fees billed for professional services rendered by the principal accountant relating to tax compliance, tax advice, and tax planning and specifically include fees for tax return preparation.
(3) All other fees consist of the aggregate fees billed for products and services provided by the principal accountant other than audit, audit-related, and tax services.
During the Funds’ fiscal years ended October 31, 2005 and October 31, 2006, $35,000 was billed for each such fiscal year by D&T, the principal accountant for the Funds, for work done in connection with its Rule 17Ad-13 examination of Eaton Vance Management’s assertion that it has maintained an effective internal control structure over the sub-transfer agent and registrar functions, such services being pre-approved in accordance with Rule 2-01(c) (7) (ii) of Regulation S-X.
(e)(1) The registrant’s audit committee has adopted policies and procedures relating to the pre-approval of services provided by the registrant’s principal accountant (the “Pre-Approval Policies”). The Pre-Approval Policies establish a framework intended to assist the audit committee in the proper discharge of its pre-approval responsibilities. As a general matter, the Pre-Approval Policies (i) specify certain types of audit, audit-related, tax, and other services determined to be pre-approved by the audit committee; and (ii) delineate specific procedures governing the mechanics of the pre-approval process, including the approval and monitoring of audit and non-audit service fees. Unless a service is specifically pre-approved under the Pre-Approval Policies, it must be separately pre-approved by the audit committee.
The Pre-Approval Policies and the types of audit and non-audit services pre-approved therein must be reviewed and ratified by the registrant’s audit committee at least annually. The registrant’s audit committee maintains full responsibility for the appointment, compensation, and oversight of the work of the registrant’s principal accountant.
(e)(2) No services described in paragraphs (b)-(d) above were approved by the registrant’s audit committee pursuant to the “de minimis exception” set forth in Rule 2-01(c)(7)(i)(C) of Regulation S-X.
(f) Not applicable.
(g) The following table presents (i) the aggregate non-audit fees (i.e., fees for audit-related, tax, and other services) billed for services rendered to all of the Series in the Trust by each Series’s respective principal accountant for the last two fiscal years of each Series; and (ii) the aggregate non-audit fees (i.e., fees for audit-related, tax, and other services) billed to the Eaton Vance organization by each Series’ respective principal accountant for the last 2 fiscal years of each Series.
Fiscal
Years | | 12/31/04 | | 10/31/05 | | 12/31/05 | | 10/31/06 | |
Ended | | PWC | | D&T | | PWC | | D&T | | PWC | | D&T | | PWC | | D&T | |
| | | | | | | | | | | | | | | | | |
Registrant(1) | | $ | 29,725 | | $ | 11,130 | | $ | 0 | | $ | 18,585 | | $ | 31,500 | | $ | 11,550 | | $ | 0 | | $ | 19,290 | |
| | | | | | | | | | | | | | | | | |
Eaton Vance(2) | | $ | 98,305 | | $ | 223,443 | | $ | 33,235 | | $ | 223,443 | | $ | 83,416 | | $ | 42,100 | | $ | 68,486 | | $ | 72,100 | |
(1) Includes all of the Series of the Trust.
(2) During the fiscal years reported above, certain of the Funds were “feeder” funds in a “master-feeder” fund structure or funds of funds.
Various subsidiaries of Eaton Vance Corp. act in either an investment advisory and/or service provider capacity with respect to the Series and/or their respective “master” funds (if applicable).
(h) The registrant’s audit committee has considered whether the provision by the registrant’s principal accountant of non-audit services to the registrant’s investment adviser and any entity controlling, controlled by, or under common control with the adviser that provides ongoing services to the registrant that were not pre-approved pursuant to Rule 2-01(c)(7)(ii) of Regulation S-X is compatible with maintaining the principal accountant’s independence.
Item 5. Audit Committee of Listed registrants
Not required in this filing.
Item 6. Schedule of Investments
Please see schedule of investments contained in the Report to Stockholders included under Item 1 of this Form N-CSR.
Item 7. Disclosure of Proxy Voting Policies and Procedures for Closed-End Management Investment Companies
Not required in this filing.
Item 8. Portfolio Managers of Closed-End Management Investment Companies
Not required in this filing.
Item 9. Purchases of Equity Securities by Closed-End Management Investment Company and Affiliated Purchasers.
Not required in this filing.
Item 10. Submission of Matters to a Vote of Security Holders.
No Material Changes.
Item 11. Controls and Procedures
(a) It is the conclusion of the registrant’s principal executive officer and principal financial officer that the effectiveness of the registrant’s current disclosure controls and procedures (such disclosure controls and procedures having been evaluated within 90 days of the date of this filing) provide reasonable assurance that the information required to be disclosed by the registrant has been recorded, processed, summarized and reported within the time period specified in the Commission’s rules and forms and that the information required to be disclosed by the registrant has been accumulated and communicated to the registrant’s principal executive officer and principal financial officer in order to allow timely decisions regarding required disclosure.
(b) There have been no changes in the registrant’s internal controls over financial reporting during the second fiscal quarter of the period covered by this report that has materially affected, or is reasonably likely to materially affect, the registrant’s internal control over financial reporting.
Item 12. Exhibits
(a)(1) | | Registrant’s Code of Ethics – Not applicable (please see Item 2). |
(a)(2)(i) | | Treasurer’s Section 302 certification. |
(a)(2)(ii) | | President’s Section 302 certification. |
(b) | | Combined Section 906 certification. |
Signatures
Pursuant to the requirements of the Securities Exchange Act of 1934 and the Investment Company Act of 1940, the registrant has duly caused this report to be signed on its behalf by the undersigned, thereunto duly authorized.
Eaton Vance Mutual Funds Trust
By: | /s/ Thomas E. Faust, Jr. | | |
| Thomas E. Faust, Jr. | |
| President | |
| | |
| | |
Date: | December 19, 2006 | | |
| | | | |
Pursuant to the requirements of the Securities Exchange Act of 1934 and the Investment Company Act of 1940, this report has been signed below by the following persons on behalf of the registrant and in the capacities and on the dates indicated.
By: | /s/ Barbara E. Campbell | | |
| Barbara E. Campbell | | |
| Treasurer | | |
| | | |
| | | |
Date: | December 19, 2006 | | |
| | | |
| | | |
By: | /s/ Thomas E. Faust, Jr. | | |
| Thomas E. Faust, Jr. | | |
| President | | |
| | | |
| | | |
Date: | December 19, 2006 | | |
| | | | | | | |