UNITED STATES
SECURITIES AND EXCHANGE COMMISSION
Washington, D.C. 20549
FORM N-CSR
CERTIFIED SHAREHOLDER REPORT OF REGISTERED
MANAGEMENT INVESTMENT COMPANIES
Investment Company Act file number | 811-04015 |
|
Eaton Vance Mutual Funds Trust |
(Exact name of registrant as specified in charter) |
|
The Eaton Vance Building, 255 State Street, Boston, Massachusetts | | 02109 |
(Address of principal executive offices) | | (Zip code) |
|
Maureen A. Gemma The Eaton Vance Building, 255 State Street, Boston, Massachusetts 02109 |
(Name and address of agent for service) |
|
Registrant’s telephone number, including area code: | (617) 482-8260 | |
|
Date of fiscal year end: | October 31 | |
|
Date of reporting period: | October 31, 2007 | |
| | | | | | | | |
Item 1. Reports to Stockholders

Annual Report October 31, 2007


EATON VANCE
COMBINED
MONEY
MARKET
FUNDS
Cash Management Fund
Money Market Fund
IMPORTANT NOTICES REGARDING PRIVACY,
DELIVERY OF SHAREHOLDER DOCUMENTS,
PORTFOLIO HOLDINGS, AND PROXY VOTING
Privacy. The Eaton Vance organization is committed to ensuring your financial privacy. Each of the financial institutions identified below has in effect the following policy ("Privacy Policy") with respect to nonpublic personal information about its customers:
• Only such information received from you, through application forms or otherwise, and information about your Eaton Vance fund transactions will be collected. This may include information such as name, address, social security number, tax status, account balances and transactions.
• None of such information about you (or former customers) will be disclosed to anyone, except as permitted by law (which includes disclosure to employees necessary to service your account). In the normal course of servicing a customer's account, Eaton Vance may share information with unaffiliated third parties that perform various required services such as transfer agents, custodians and broker/dealers.
• Policies and procedures (including physical, electronic and procedural safeguards) are in place that are designed to protect the confidentiality of such information.
• We reserve the right to change our Privacy Policy at any time upon proper notification to you. Customers may want to review our Policy periodically for changes by accessing the link on our homepage: www.eatonvance.com.
Our pledge of privacy applies to the following entities within the Eaton Vance organization: the Eaton Vance Family of Funds, Eaton Vance Management, Eaton Vance Investment Counsel, Boston Management and Research, and Eaton Vance Distributors, Inc.
In addition, our Privacy Policy only applies to those Eaton Vance customers who are individuals and who have a direct relationship with us. If a customer's account (i.e., fund shares) is held in the name of a third-party financial adviser/broker-dealer, it is likely that only such adviser's privacy policies apply to the customer. This notice supersedes all previously issued privacy disclosures.
For more information about Eaton Vance's Privacy Policy, please call 1-800-262-1122.
Delivery of Shareholder Documents. The Securities and Exchange Commission (the "SEC") permits funds to deliver only one copy of shareholder documents, including prospectuses, proxy statements and shareholder reports, to fund investors with multiple accounts at the same residential or post office box address. This practice is often called "householding" and it helps eliminate duplicate mailings to shareholders.
Eaton Vance, or your financial adviser, may household the mailing of your documents indefinitely unless you instruct Eaton Vance, or your financial adviser, otherwise.
If you would prefer that your Eaton Vance documents not be householded, please contact Eaton Vance at 1-800-262-1122, or contact your financial adviser.
Your instructions that householding not apply to delivery of your Eaton Vance documents will be effective within 30 days of receipt by Eaton Vance or your financial adviser.
Portfolio Holdings. Each Eaton Vance Fund and its underlying Portfolio (if applicable) will file a schedule of its portfolio holdings on Form N-Q with the SEC for the first and third quarters of each fiscal year. The Form N-Q will be available on the Eaton Vance website www.eatonvance.com, by calling Eaton Vance at 1-800-262-1122 or in the EDGAR database on the SEC's website at www.sec.gov. Form N-Q may also be reviewed and copied at the SEC's public reference room in Washington, D.C. (call 1-800-732-0330 for information on the operation of the public reference room).
Proxy Voting. From time to time, funds are required to vote proxies related to the securities held by the funds. The Eaton Vance Funds or their underlying Portfolios (if applicable) vote proxies according to a set of policies and procedures approved by the Funds' and Portfolios' Boards. You may obtain a description of these policies and procedures and information on how the Funds or Portfolios voted proxies relating to portfolio securities during the most recent 12 month period ended June 30, without charge, upon request, by calling 1-800-262-1122. This description is also available on the SEC's website at www.sec.gov.
Eaton Vance Money Market Funds as of October 31, 2007
MANAGEMENT’S DISCUSSION OF FUND PERFORMANCE

Elizabeth S. Kenyon, CFA
Portfolio Manager
Investment Environment
· The fiscal year end for Cash Management Portfolio, Eaton Vance Cash Management Fund and Eaton Vance Money Market Fund has changed from December 31 to October 31. As a result, this is the first annual report for the Funds’ new fiscal year.
· During the year ended October 31, 2007, the U.S. economy began to show signs of slowing but generally remained on solid footing. Third quarter economic growth rose 3.9%, according to preliminary Commerce Department data. The economy grew at annualized rates of 3.8% and 1.3% in the second and first quarters of 2007, respectively, following a 2.5% growth rate achieved in the fourth quarter of 2006. Despite this solid performance, the economy’s resilience was increasingly tested during 2007 by the sluggish housing and financial sectors and a sharp rise in the price of oil.
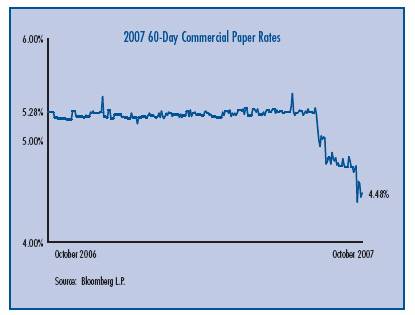
· In an unscheduled August 17, 2007 meeting, the U.S. Federal Reserve Board (the “Fed”) lowered its Discount Rate – the rate charged to banks borrowing directly from the Fed – to 5.75% from 6.25%. The move was aimed at providing liquidity during a period of increased uncertainty and tighter credit conditions that surfaced rapidly in mid-August 2007. On September 18, 2007, the Fed lowered its Federal Funds Rate to 4.75% from 5.25% – its first rate cut since the Fed stopped raising rates in June 2006 – and lowered the Discount Rate again to 5.25% from 5.75%. The Federal Funds Rate was again lowered on October 31, 2007, to 4.50%.
Asset Allocation*
By net assets
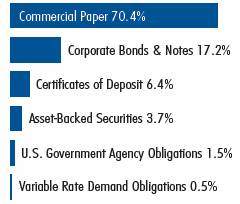
* Asset Allocation information may not be representative of the Portfolio’s current or future investments and may change due to active management.
· At October 31, 2007, Cash Management Portfolio — in which the Funds invest their assets — had 70.4% of its net assets invested in high-quality commercial paper, a highly liquid type of security in which money market funds commonly invest. The Portfolio also invests in high-quality U.S. Government agency securities and other short-term investments.
· During the ten months ended October 31, 2007, shareholders of Eaton Vance Cash Management Fund and Eaton Vance Money Market Fund received $0.040 and $0.031 per share, respectively, in income dividends. Eaton Vance Cash Management Fund and Eaton Vance Money Market Fund had total returns of 4.04% and 3.16%, respectively, during the same period.(1) An investment in one of the money market funds is neither insured nor guaranteed by the Federal Deposit Insurance Corporation or any other government agency. Although the Funds seek to maintain a stable net asset value of $1.00 per share, it is possible to lose money by investing in a Fund.
· During the period, management maintained a relatively short weighted average maturity in the Portfolio to allow for more frequent reinvestments and help maintain each Fund’s income stream. Toward the end of the period, management extended the average maturity in the Funds, seeking to lock in more attractive rates in anticipation of Fed rate cuts The Funds have never owned asset-backed commercial paper issued by structured investment vehicles or collateralized debt obligations and do not intend to in the future.
(1) Past performance is no guarantee of future results. Returns are historical and are calculated by determining the percentage change in net asset value with all distributions reinvested. There is no sales charge.
Fund shares are not insured by the FDIC and are not deposits or other obligations of, or guaranteed by, any depository institution. Shares are subject to investment risks, including possible loss of principal invested.
The views expressed in this report are those of the portfolio manager and are current only through the end of the period of the report as stated on the cover. These views are subject to change at any time based upon market or other conditions, and the investment adviser disclaims any responsibility to update such views. These views may not be relied on as investment advice and, because investment decisions for a fund are based on many factors, may not be relied on as an indication of trading intent on behalf of any Eaton Vance fund.
1
Eaton Vance Money Market Funds as of October 31, 2007
FUND EXPENSES
Example: As a shareholder of a Fund, you incur two types of costs: (1) transaction costs, including sales charges (loads) on purchases and redemption fees (if applicable); and (2) ongoing costs, including management fees; distribution or service fees; and other Fund expenses. This Example is intended to help you understand your ongoing costs (in dollars) of investing in a Fund and to compare these costs with the ongoing costs of investing in other mutual funds. The Example is based on an investment of $1,000 invested at the beginning of the period and held for the entire period (May 1, 2007 – October 31, 2007).
Actual Expenses: The first section of each table below provides information about actual account values and actual expenses. You may use the information in this section, together with the amount you invested, to estimate the expenses that you paid over the period. Simply divide your account value by $1,000 (for example, an $8,600 account value divided by $1,000 = 8.6), then multiply the result by the number in the first section under the heading entitled "Expenses Paid During Period" to estimate the expenses you paid on your account during this period.
Hypothetical Example for Comparison Purposes: The second section of each table below provides information about hypothetical account values and hypothetical expenses based on the actual Fund expense ratio and an assumed rate of return of 5% per year (before expenses), which is not the actual return of a Fund. The hypothetical account values and expenses may not be used to estimate the actual ending account balance or expenses you paid for the period. You may use this information to compare the ongoing costs of investing in your Fund and other funds. To do so, compare this 5% hypothetical example with the 5% hypothetical examples that appear in the shareholder reports of the other funds.
Please note that the expenses shown in the tables are meant to highlight your ongoing costs only and do not reflect any transactional costs, such as sales charges (loads) or redemption fees (if applicable). Therefore, the second section of each table is useful in comparing ongoing costs only, and will not help you determine the relative total costs of owning different funds. In addition, if these transactional costs were included, your costs would have been higher.
Eaton Vance Cash Management Fund
| | | Beginning Account Value
(5/1/07) | | Ending Account Value
(10/31/07) | | Expenses Paid During Period*
(5/1/07 – 10/31/07) | |
| Actual | | $ | 1,000.00 | | | $ | 1,024.40 | | | $ | 3.11 | | |
| Hypothetical | |
| (5% return per year before expenses) | | $ | 1,000.00 | | | $ | 1,022.10 | | | $ | 3.11 | | |
* Expenses are equal to the Fund's annualized expense ratio of 0.61% multiplied by the average account value over the period, multiplied by 184/365 (to reflect the one-half year period). The Example assumes that the $1,000 was invested at the net asset value per share determined at the close of business on April 30, 2007. The Example reflects the expenses of both the Fund and the Portfolio.
Eaton Vance Money Market Fund
| | | Beginning Account Value
(5/1/07) | | Ending Account Value
(10/31/07) | | Expenses Paid During Period*
(5/1/07 – 10/31/07) | |
| Actual | | $ | 1,000.00 | | | $ | 1,019.20 | | | $ | 8.40 | | |
| Hypothetical | |
| (5% return per year before expenses) | | $ | 1,000.00 | | | $ | 1,016.90 | | | $ | 8.39 | | |
* Expenses are equal to the Fund's annualized expense ratio of 1.65% multiplied by the average account value over the period, multiplied by 184/365 (to reflect the one-half year period). The Example assumes that the $1,000 was invested at the net asset value per share determined at the close of business on April 30, 2007. The Example reflects the expenses of both the Fund and the Portfolio.
2
Eaton Vance Money Market Funds as of October 31, 2007
FINANCIAL STATEMENTS
Statements of Assets and Liabilities
As of October 31, 2007
| | | Cash
Management Fund | | Money
Market Fund | |
| Assets | |
| Investment in Cash Management Portfolio, at value | | $ | 178,745,667 | | | $ | 67,514,687 | | |
| Receivable for Fund shares sold | | | 1,646,601 | | | | 176,875 | | |
| Total assets | | $ | 180,392,268 | | | $ | 67,691,562 | | |
| Liabilities | |
| Payable for Fund shares redeemed | | $ | 5,241,960 | | | $ | 1,039,091 | | |
| Dividends payable | | | 990,863 | | | | 33,397 | | |
| Payable to affiliate for Trustees' fees | | | 156 | | | | 7 | | |
| Payable to affiliate for distribution and service fees | | | — | | | | 74,344 | | |
| Accrued expenses | | | 36,909 | | | | 37,771 | | |
| Total liabilities | | $ | 6,269,888 | | | $ | 1,184,610 | | |
| Net Assets | | $ | 174,122,380 | | | $ | 66,506,952 | | |
| Sources of Net Assets | |
| Paid-in capital | | $ | 174,117,923 | | | $ | 66,507,059 | | |
| Accumulated net realized loss (computed on the basis of identified cost) | | | (362 | ) | | | (190 | ) | |
| Accumulated undistributed net investment income | | | 4,819 | | | | 83 | | |
| Total | | $ | 174,122,380 | | | $ | 66,506,952 | | |
| Shares of Beneficial Interest Outstanding | |
| | | | 174,122,579 | | | | 66,507,045 | | |
Net Asset Value, Offering Price and
Redemption Price Per Share | |
| (Net assets ÷ shares of beneficial interest outstanding) | | $ | 1.00 | | | $ | 1.00 | | |
See notes to financial statements
3
Eaton Vance Money Market Funds as of October 31, 2007
FINANCIAL STATEMENTS CONT'D
Statements of Operations
For the Period Ended October 31, 2007(1)
| | | Cash
Management Fund | | Money
Market Fund | |
| Investment Income | |
| Interest allocated from Portfolio | | $ | 6,381,185 | | | $ | 2,313,978 | | |
| Expenses allocated from Portfolio | | | (596,738 | ) | | | (217,293 | ) | |
| Total investment income from Portfolio | | $ | 5,784,447 | | | $ | 2,096,685 | | |
| Expenses | |
| Trustees' fees and expenses | | $ | 1,563 | | | $ | 149 | | |
| Distribution and service fees | | | — | | | | 374,558 | | |
| Legal and accounting services | | | 22,571 | | | | 21,622 | | |
| Printing and postage | | | 10,650 | | | | 8,673 | | |
| Custodian fee | | | 12,036 | | | | 8,581 | | |
| Transfer and dividend disbursing agent fees | | | 57,355 | | | | 52,947 | | |
| Registration fees | | | 20,650 | | | | 18,359 | | |
| Miscellaneous | | | 4,822 | | | | 4,514 | | |
| Total expenses | | $ | 129,647 | | | $ | 489,403 | | |
| Net investment income | | $ | 5,654,800 | | | $ | 1,607,282 | | |
| Realized and Unrealized Loss from Portfolio | |
| Net realized loss — | |
| Investment transactions (identified cost basis) | | $ | (55 | ) | | $ | (9 | ) | |
| Net realized loss | | $ | (55 | ) | | $ | (9 | ) | |
| Net increase in net assets from operations | | $ | 5,654,745 | | | $ | 1,607,273 | | |
(1) For the ten months ended October 31, 2007.
See notes to financial statements
4
Eaton Vance Money Market Funds as of October 31, 2007
FINANCIAL STATEMENTS CONT'D
Statements of Operations
For the Year Ended December 31, 2006
| | | Cash
Management Fund | | Money
Market Fund | |
| Investment Income | |
| Interest allocated from Portfolio | | $ | 4,370,009 | | | $ | 2,342,947 | | |
| Expenses allocated from Portfolio | | | (508,896 | ) | | | (272,196 | ) | |
| Total investment income from Portfolio | | $ | 3,861,113 | | | $ | 2,070,751 | | |
| Expenses | |
| Trustees' fees and expenses | | $ | 1,698 | | | $ | 539 | | |
| Distribution and service fees | | | — | | | | 404,131 | | |
| Legal and accounting services | | | 20,402 | | | | 20,076 | | |
| Printing and postage | | | 9,448 | | | | 9,854 | | |
| Custodian fee | | | 16,397 | | | | 11,154 | | |
| Transfer and dividend disbursing agent fees | | | 55,829 | | | | 66,893 | | |
| Registration fees | | | 30,736 | | | | 37,632 | | |
| Miscellaneous | | | 1,846 | | | | 3,135 | | |
| Total expenses | | $ | 136,356 | | | $ | 553,414 | | |
| Net investment income | | $ | 3,724,757 | | | $ | 1,517,337 | | |
| Realized and Unrealized Gain (Loss) from Portfolio | |
| Net realized gain (loss) — | |
| Investment transactions (identified cost basis) | | $ | (197 | ) | | $ | (113 | ) | |
| Increase from payments by affiliate | | | 35 | | | | 18 | | |
| Net loss realized on the disposal of investments which did not meet the Portfolio's investment guidelines | | | (35 | ) | | | (18 | ) | |
| Net realized loss | | $ | (197 | ) | | $ | (113 | ) | |
| Net increase in net assets from operations | | $ | 3,724,560 | | | $ | 1,517,224 | | |
See notes to financial statements
5
Eaton Vance Money Market Funds as of October 31, 2007
FINANCIAL STATEMENTS CONT'D
Statements of Changes in Net Assets
For the Period Ended October 31, 2007(1)
| Increase (Decrease) in Net Assets | | Cash
Management Fund | | Money
Market Fund | |
| From operations — | |
| Net investment income | | $ | 5,654,800 | | | $ | 1,607,282 | | |
| Net realized loss from investment transactions | | | (55 | ) | | | (9 | ) | |
| Net increase in net assets from operations | | $ | 5,654,745 | | | $ | 1,607,273 | | |
| Distributions to shareholders — | |
| From net investment income | | $ | (5,654,800 | ) | | $ | (1,607,282 | ) | |
| Total distributions to shareholders | | $ | (5,654,800 | ) | | $ | (1,607,282 | ) | |
| Transactions in shares of beneficial interest at Net Asset Value of $1.00 per share — | |
| Proceeds from sale of shares | | $ | 626,885,761 | | | $ | 82,204,969 | | |
| Net asset value of shares issued to shareholders in payment of distributions declared | | | 3,184,751 | | | | 1,269,302 | | |
| Cost of shares redeemed | | | (575,931,031 | ) | | | (59,064,924 | ) | |
| Net increase in net assets from Fund share transactions | | $ | 54,139,481 | | | $ | 24,409,347 | | |
| Net increase in net assets | | $ | 54,139,426 | | | $ | 24,409,338 | | |
| Net Assets | |
| At beginning of period | | $ | 119,982,954 | | | $ | 42,097,614 | | |
| At end of period | | $ | 174,122,380 | | | $ | 66,506,952 | | |
Accumulated undistributed
net investment income
included in net assets | |
| At end of year | | $ | 4,819 | | | $ | 83 | | |
(1) For the ten months ended October 31, 2007.
See notes to financial statements
6
Eaton Vance Money Market Funds as of October 31, 2007
FINANCIAL STATEMENTS CONT'D
Statements of Changes in Net Assets
For the Year Ended December 31, 2006
| Increase (Decrease) in Net Assets | | Cash
Management Fund | | Money
Market Fund | |
| From operations — | |
| Net investment income | | $ | 3,724,757 | | | $ | 1,517,337 | | |
Net realized loss from investment transactions, payments by affiliate and
the disposal of investments which did not meet the Portfolio's investment guidelines | | | (197 | ) | | | (113 | ) | |
| Net increase in net assets from operations | | $ | 3,724,560 | | | $ | 1,517,224 | | |
| Distributions to shareholders — | |
| From net investment income | | $ | (3,724,704 | ) | | $ | (1,517,308 | ) | |
| Total distributions to shareholders | | $ | (3,724,704 | ) | | $ | (1,517,308 | ) | |
| Transactions in shares of beneficial interest at Net Asset Value of $1.00 per share — | |
| Proceeds from sale of shares | | $ | 164,749,685 | | | $ | 41,881,817 | | |
| Net asset value of shares issued to shareholders in payment of distributions declared | | | 2,345,894 | | | | 1,198,865 | | |
| Cost of shares redeemed | | | (142,081,892 | ) | | | (49,322,436 | ) | |
| Net increase (decrease) in net assets from Fund share transactions | | $ | 25,013,687 | | | $ | (6,241,754 | ) | |
| Net increase (decrease) in net assets | | $ | 25,013,543 | | | $ | (6,241,838 | ) | |
| Net Assets | |
| At beginning of year | | $ | 94,969,411 | | | $ | 48,339,452 | | |
| At end of year | | $ | 119,982,954 | | | $ | 42,097,614 | | |
Accumulated undistributed
net investment income
included in net assets | |
| At end of year | | $ | 4,819 | | | $ | 83 | | |
See notes to financial statements
7
Eaton Vance Money Market Funds as of October 31, 2007
FINANCIAL STATEMENTS CONT'D
Statements of Changes in Net Assets
For the Year Ended December 31, 2005
| Increase (Decrease) in Net Assets | | Cash
Management Fund | | Money
Market Fund | |
| From operations — | |
| Net investment income | | $ | 2,239,721 | | | $ | 788,564 | | |
Net realized loss from investment transactions, payments by affiliate and
the disposal of investments which did not meet the Portfolio's investment guidelines | | | (86 | ) | | | (54 | ) | |
| Net increase in net assets from operations | | $ | 2,239,635 | | | $ | 788,510 | | |
| Distributions to shareholders — | |
| From net investment income | | $ | (2,239,635 | ) | | $ | (788,510 | ) | |
| Total distributions to shareholders | | $ | (2,239,635 | ) | | $ | (788,510 | ) | |
| Transactions in shares of beneficial interest at Net Asset Value of $1.00 per share — | |
| Proceeds from sale of shares | | $ | 138,809,354 | | | $ | 43,940,101 | | |
| Net asset value of shares issued to shareholders in payment of distributions declared | | | 1,366,207 | | | | 637,780 | | |
| Cost of shares redeemed | | | (143,371,207 | ) | | | (64,123,257 | ) | |
| Net decrease in net assets from Fund share transactions | | $ | (3,195,646 | ) | | $ | (19,545,376 | ) | |
| Net decrease in net assets | | $ | (3,195,646 | ) | | $ | (19,545,376 | ) | |
| Net Assets | |
| At beginning of year | | $ | 98,165,057 | | | $ | 67,884,828 | | |
| At end of year | | $ | 94,969,411 | | | $ | 48,339,452 | | |
See notes to financial statements
8
Eaton Vance Money Market Funds as of October 31, 2007
FINANCIAL STATEMENTS CONT'D
Financial Highlights
| | | Cash Management Fund | |
| | | Period Ended | | Year Ended December 31, | |
| | | October 31, 2007(1) | | 2006 | | 2005 | | 2004 | | 2003 | | 2002 | |
| Net asset value — Beginning of period | | $ | 1.000 | | | $ | 1.000 | | | $ | 1.000 | | | $ | 1.000 | | | $ | 1.000 | | | $ | 1.000 | | |
| Income (loss) from operations | |
| Net investment income | | $ | 0.040 | | | $ | 0.043 | | | $ | 0.024 | | | $ | 0.006 | | | $ | 0.005 | | | $ | 0.010 | | |
| Less distributions | |
| From net investment income | | $ | (0.040 | ) | | $ | (0.043 | ) | | $ | (0.024 | ) | | $ | (0.006 | ) | | $ | (0.005 | ) | | $ | (0.010 | ) | |
| Total distributions | | $ | (0.040 | ) | | $ | (0.043 | ) | | $ | (0.024 | ) | | $ | (0.006 | ) | | $ | (0.005 | ) | | $ | (0.010 | ) | |
| Net asset value — End of period | | $ | 1.000 | | | $ | 1.000 | | | $ | 1.000 | | | $ | 1.000 | | | $ | 1.000 | | | $ | 1.000 | | |
| Total Return(2) | | | 4.04 | %(6) | | | 4.40 | %(3) | | | 2.48 | %(3) | | | 0.60 | % | | | 0.48 | % | | | 1.02 | % | |
| Ratios/Supplemental Data | |
| Net assets, end of period (000's omitted) | | $ | 174,122 | | | $ | 119,983 | | | $ | 94,969 | | | $ | 98,165 | | | $ | 101,364 | | | $ | 111,741 | | |
| Ratios (As a percentage of average daily net assets): | |
| Expenses before custodian fee reduction(4) | | | 0.62 | %(5) | | | 0.75 | % | | | 0.80 | % | | | 0.79 | % | | | 0.68 | % | | | 0.79 | % | |
| Expenses after custodian fee reduction(4) | | | 0.62 | %(5) | | | 0.75 | % | | | 0.80 | % | | | 0.79 | % | | | 0.68 | % | | | 0.79 | % | |
| Net investment income | | | 4.82 | %(5) | | | 4.32 | % | | | 2.46 | % | | | 0.60 | % | | | 0.47 | % | | | 1.02 | % | |
(1) For the ten months ended October 31, 2007. The Fund changed its fiscal year-end from December 31 to October 31.
(2) Returns are historical and are calculated by determining the percentage change in net asset value with all distributions reinvested.
(3) During the years ended December 31, 2006 and December 31, 2005, the investment adviser reimbursed the Fund, through its investment in the Portfolio, for net losses realized on the disposal of investments which did not meet the Portfolio's investment guidelines. The reimbursement was less than $0.01 per share and had no effect on total return for the years ended December 31, 2006 and December 31, 2005.
(4) Includes the Fund's share of the Portfolio's allocated expenses.
(5) Annualized.
(6) Not annualized.
See notes to financial statements
9
Eaton Vance Money Market Funds as of October 31, 2007
FINANCIAL STATEMENTS CONT'D
Financial Highlights
| | | Money Market Fund | |
| | | Period Ended | | Year Ended December 31, | |
| | | October 31, 2007(1) | | 2006 | | 2005 | | 2004 | | 2003 | | 2002 | |
| Net asset value — Beginning of period | | $ | 1.000 | | | $ | 1.000 | | | $ | 1.000 | | | $ | 1.000 | | | $ | 1.000 | | | $ | 1.000 | | |
| Income (loss) from operations | |
| Net investment income | | $ | 0.031 | | | $ | 0.033 | | | $ | 0.014 | | | $ | 0.001 | | | $ | — | | | $ | 0.002 | | |
| Less distributions | |
| From net investment income | | $ | (0.031 | ) | | $ | (0.033 | ) | | $ | (0.014 | ) | | $ | (0.001 | ) | | $ | — | | | $ | (0.002 | ) | |
| Total distributions | | $ | (0.031 | ) | | $ | (0.033 | ) | | $ | (0.014 | ) | | $ | (0.001 | ) | | $ | — | | | $ | (0.002 | ) | |
| Net asset value — End of period | | $ | 1.000 | | | $ | 1.000 | | | $ | 1.000 | | | $ | 1.000 | | | $ | 1.000 | | | $ | 1.000 | | |
| Total Return(2) | | | 3.16 | %(7) | | | 3.32 | %(3) | | | 1.45 | %(3) | | | 0.05 | % | | | 0.00 | % | | | 0.19 | % | |
| Ratios/Supplemental Data | |
| Net assets, end of period (000's omitted) | | $ | 66,507 | | | $ | 42,098 | | | $ | 48,339 | | | $ | 67,885 | | | $ | 100,241 | | | $ | 158,719 | | |
| Ratios (As a percentage of average daily net assets): | |
| Expenses before custodian fee reduction(4) | | | 1.66 | %(5) | | | 1.80 | % | | | 1.82 | % | | | 1.31 | %(6) | | | 1.17 | %(6) | | | 1.61 | %(6) | |
| Expenses after custodian fee reduction(4) | | | 1.66 | %(5) | | | 1.80 | % | | | 1.82 | % | | | 1.31 | %(6) | | | 1.17 | %(6) | | | 1.61 | %(6) | |
| Net investment income | | | 3.78 | %(5) | | | 3.30 | % | | | 1.40 | % | | | 0.04 | % | | | 0.00 | % | | | 0.20 | % | |
(1) For the ten months ended October 31, 2007. The Fund changed its fiscal year-end from December 31 to October 31.
(2) Returns are historical and are calculated by determining the percentage change in net asset value with all distributions reinvested.
(3) During the years ended December 31, 2006 and December 31, 2005, the investment adviser reimbursed the Fund, through its investment in the Portfolio, for net losses realized on the disposal of investments which did not meet the Portfolio's investment guidelines. The reimbursement was less than $0.01 per share and had no effect on total return for the years ended December 31, 2006 and December 31, 2005.
(4) Includes the Fund's share of the Portfolio's allocated expenses.
(5) Annualized.
(6) The principal underwriter voluntarily waived a portion of its distribution fee and the administrator subsidized certain operating expenses (equal to 0.40%, 0.49% and less than 0.01% of average daily net assets for the years ended December 31, 2004, 2003 and 2002, respectively). Absent this waiver and allocation, total return would have been lower.
(7) Not annualized.
See notes to financial statements
10
Eaton Vance Money Market Funds as of October 31, 2007
NOTES TO FINANCIAL STATEMENTS
1 Significant Accounting Policies
Eaton Vance Cash Management Fund (Cash Management Fund) and Eaton Vance Money Market Fund (Money Market Fund) (individually, the Fund and collectively, the Funds) are each a diversified series of Eaton Vance Mutual Funds Trust (the Trust). The Trust is a Massachusetts business trust registered under the Investment Company Act of 1940, as amended (the 1940 Act), as an open-end management investment company. The Funds invest all of their investable assets in interests in the Cash Management Portfolio (the Portfolio), a New York trust, having the same investment objective and policies as the Funds. The value of each Fund's investment in the Portfolio reflects each Fund's proportionate interest in the net assets of the Portfolio (10.5% for Cash Management Fund and 4.0% for Money Market Fund at October 31, 2007). The performance of each Fund is directly affected by the performance of the Portfolio. The financial statements of the Por tfolio, including the portfolio of investments, are included elsewhere in this report and should be read in conjunction with each Fund's financial statements.
The following is a summary of significant accounting policies of the Funds. The policies are in conformity with accounting principles generally accepted in the United States of America.
A Investment Valuation — Valuation of securities by the Portfolio is discussed in Note 1A of the Portfolio's Notes to Financial Statements, which are included elsewhere in this report.
B Income — The Fund's net investment income or loss consists of the Fund's pro-rata share of the net investment income or loss of the Portfolio, less all actual and accrued expenses of the Fund.
C Federal Taxes — Each Fund's policy is to comply with the provisions of the Internal Revenue Code applicable to regulated investment companies and to distribute to shareholders each year substantially all of its net investment income, and all or substantially all of its net realized capital gains. Accordingly, no provision for federal income or excise tax is necessary. At October 31, 2007, the Funds, for federal income tax purposes, had capital loss carryforwards which will reduce each Fund's taxable income arising from future net realized gains on investment transactions, if any, to the extent permitted by the Internal Revenue Code, and thus will reduce the amount of distributions to shareholders which would otherwise be necessary to relieve the Funds of any liability f or federal income or excise tax. The amounts and expiration dates of the capital loss carryforwards are as follows:
| Fund | | Amount | | Expiration Date | |
| Cash Management | | $ | 5 | | | October 31, 2010 | |
|
| | | 20 | | | October 31, 2011 | |
|
| | | 85 | | | October 31, 2013 | |
|
| | | | 197 | | | October 31, 2014 | |
|
| | | 55 | | | October 31, 2015 | |
|
| Money Market | | | 10 | | | October 31, 2010 | |
|
| | | 5 | | | October 31, 2011 | |
|
| | | 53 | | | October 31, 2013 | |
|
| | | | 113 | | | October 31, 2014 | |
|
| | | 9 | | | October 31, 2015 | |
|
D Expenses — The majority of expenses of the Trust are directly identifiable to an individual fund. Expenses which are not readily identifiable to a specific fund are allocated taking into consideration, among other things, the nature and type of expense and the relative size of the funds.
E Expense Reduction — State Street Bank and Trust Company (SSBT) serves as custodian of the Funds. Pursuant to the respective custodian agreements, SSBT receives a fee reduced by credits, which are determined based on the average daily cash balance each Fund maintains with SSBT. All credit balances, if any, used to reduce each Fund's custodian fees are reported as a reduction of expenses in the Statements of Operations.
F Use of Estimates — The preparation of the financial statements in conformity with accounting principles generally accepted in the United States of America requires management to make estimates and assumptions that affect the reported amounts of assets and liabilities at the date of the financial statements and the reported amounts of income and expense during the reporting period. Actual results could differ from those estimates.
G Indemnifications — Under the Trust's organizational documents, its officers and Trustees may be indemnified against certain liabilities and expenses arising out of the performance of their duties to the Funds, and shareholders are indemnified against personal liability for obligations of the Trust. Additionally, in the normal course of business, each Fund enters into agreements with service providers that may contain indemnification clauses. Each Fund's maximum exposure under these arrangements is unknown as this would involve future claims that may be made against each Fund that have not yet occurred.
11
Eaton Vance Money Market Funds as of October 31, 2007
NOTES TO FINANCIAL STATEMENTS CONT'D
H Other — Investment transactions are accounted for on a trade date basis.
2 Distributions to Shareholders
The net investment income of each Fund is determined daily, and substantially all of the net investment income so determined is declared daily as a dividend to shareholders of record at the time of declaration. Distributions are paid monthly. Distributions are paid in the form of additional shares or, at the election of the shareholder, in cash.
The Funds distinguish between distributions on a tax basis and a financial reporting basis. Accounting principles generally accepted in the United States of America require that only distributions in excess of tax basis earnings and profits be reported in the financial statements as a return of capital. Permanent differences between book and tax accounting relating to distributions are reclassified to paid-in capital.
The tax character of the distributions declared for the period ended October 31, 2007 and years ended December 31, 2006 and December 31, 2005 was as follows:
| Period Ended October 31, 2007 | | Cash
Management Fund | | Money
Market Fund | |
| Distributions declared from: | |
| Ordinary income | | $ | 5,654,800 | | | $ | 1,607,282 | | |
| Year Ended December 31, 2006 | | Cash
Management Fund | | Money
Market Fund | |
| Distributions declared from: | |
| Ordinary income | | $ | 3,724,704 | | | $ | 1,517,308 | | |
| Year Ended December 31, 2005 | | Cash
Management Fund | | Money
Market Fund | |
| Distributions declared from: | |
| Ordinary income | | $ | 2,239,635 | | | $ | 788,510 | | |
At October 31, 2007, the components of distributable earnings (accumulated losses) on a tax basis were as follows:
| | | Cash
Management Fund | | Money
Market Fund | |
| Undistributed ordinary income | | $ | 995,682 | | | $ | 33,480 | | |
| Capital loss carryforward | | $ | (362 | ) | | $ | (190 | ) | |
| Other temporary differences | | $ | (990,863 | ) | | $ | (33,397 | ) | |
The differences between components of distributable earnings (accumulated loss) on a tax basis and the amounts reflected in the Statement of Assets and Liabilities are primarily due to the timing of recognizing distributions to shareholders.
3 Shares of Beneficial Interest
The Funds' Declaration of Trust permits the Trustees to issue an unlimited number of full and fractional shares of beneficial interest (without par value).
4 Transactions with Affiliates
Eaton Vance Management (EVM) serves as the administrator of the Funds, but receives no compensation. The Portfolio has engaged Boston Management and Research (BMR), a subsidiary of EVM, to render investment advisory services. See Note 2 of the Portfolio's Notes to Financial Statements which are included elsewhere in this report. EVM serves as the sub-transfer agent of the Funds and receives from the transfer agent an aggregate fee based upon the actual expenses incurred by EVM in the performance of these services. For the period ended October 31, 2007, EVM earned $4,720 and $4,252 from Cash Management Fund and Money Market Fund, respectively, in sub-transfer agent fees. For the year ended December 31, 2006, EVM earned $4,896 and $4,763 from Cash Management Fund and Money Market Fund, respectively, in sub-transfer agent fees. Eaton Vance Distributors, Inc. (EVD), a subsidiary of EVM and the Fund's principal underwriter, also rece ived distribution and service fees from the Money Market Fund (see Note 5) and contingent deferred sales charges (see Note 6) from the Funds.
Except for Trustees of the Funds and the Portfolio who are not members of EVM's or BMR's organizations, officers and Trustees receive remuneration for their services to each Fund out of the investment advisory fee. Certain officers and Trustees of the Funds and the Portfolio are officers of the above organizations.
5 Distribution Plans
The Money Market Fund (the Fund) has in effect a distribution plan (the Plan) pursuant to Rule 12b-1 under the 1940 Act. The Plan requires the Fund to pay EVD 0.75% per annum of its average daily net assets for providing ongoing distribution services and facilities to the Fund. The Fund will automatically discontinue payments to EVD during any period in which there are no outstanding Uncovered Distribution Charges, which are equivalent to the sum of (i) 6.25% of the aggregate amount received by the Fund for shares sold plus (ii) interest calculated by applying the rate of 1% over the prevailing prime rate to the outstanding balance of
12
Eaton Vance Money Market Funds as of October 31, 2007
NOTES TO FINANCIAL STATEMENTS CONT'D
Uncovered Distribution Charges of EVD, reduced by the aggregate amount of contingent deferred sales charges (Note 6) and amounts theretofore paid or payable to EVD. For the period ended October 31, 2007 and for the year ended December 31, 2006, the Fund paid or accrued to EVD $318,785 and $344,564, respectively, representing 0.75% of its average daily net assets. At October 31, 2007, the amount of Uncovered Distribution Charges of EVD calculated under the Plan was approximately $13,055,000. The Plan also authorizes the Fund to make payments of service fees to EVD, investment dealers and other persons in amounts not exceeding 0.25% per annum of its average daily net assets. The Trustees approved service fee payments equal to 0.15% per annum of its average daily net assets of shares outstanding for one year or more. Service fees paid or accrued are for personal services and/or the maintenance of shareholder accounts. They are sepa rate and distinct from the sales commissions and distribution fees payable to EVD and, as such, are not subject to automatic discontinuance when there are no outstanding Uncovered Distribution Charges of EVD. Service fees paid or accrued for the period ended October 31, 2007 and for the year ended December 31, 2006 amounted to $55,773 and $59,567, respectively.
6 Contingent Deferred Sales Charges
A contingent deferred sales charge (CDSC) generally is imposed on shares of the Money Market Fund (other than those acquired as the result of an exchange from another Eaton Vance fund) on redemptions of shares made within six years of purchase. The CDSC is imposed at declining rates that begin at 5% in the case of redemptions in the first and second year after purchase, declining one percentage point each subsequent year. Shares of Money Market Fund and Cash Management Fund acquired as a result of an exchange from shares of another Eaton Vance Fund are subject to the original CDSC rate, if any, from the date of original purchase. Generally, the CDSC is based upon the lower of the net asset value at date of redemption or date of purchase. No charge is levied on shares acquired by reinvestment of dividends or capital gains distributions. No CDSC is levied on shares which have been sold to EVM or its affiliates or to their respecti ve employees or clients and may be waived under certain other limited conditions. CDSCs received on redemptions of Money Market Fund shares are paid to EVD to reduce the amount of Uncovered Distribution Charges calculated under the Fund's Distribution Plan. CDSCs received on redemptions of Money Market Fund shares when no Uncovered Distribution Charges exist are credited to the Fund. For the period ended October 31, 2007, the Fund was informed that EVD received approximately $27,000 and $114,000 of CDSCs paid by shareholders of the Cash Management Fund and Money Market Fund, respectively.
7 Investment Transactions
Increases and decreases in each Fund's investment in the Portfolio for the period ended October 31, 2007 were as follows:
| Cash Management Fund | | | |
| Increases | | $ | 625,532,672 | | |
| Decreases | | | 572,988,483 | | |
| Money Market Fund | | | |
| Increases | | $ | 82,076,645 | | |
| Decreases | | | 59,098,620 | | |
8 Recently Issued Accounting Pronouncements
In June 2006, the Financial Accounting Standards Board (FASB) issued FASB Interpretation No. 48 (FIN 48), "Accounting for Uncertainty in Income Taxes – an interpretation of FASB Statement No. 109". FIN 48 clarifies the accounting for uncertainty in income taxes recognized in accordance with FASB Statement No. 109, "Accounting for Income Taxes". This interpretation prescribes a recognition threshold and measurement attribute for the financial statement recognition and measurement of a tax position taken or expected to be taken in a tax return. It also provides guidance on de-recognition, classification, interest and penalties, accounting in interim periods, disclosure and transition. FIN 48 is effective on the last business day of the first required financial reporting period for fiscal years beginning after December 15, 2006. Management has concluded that as of October 31, 2007, there are no uncertain tax positions that wou ld require financial statement recognition, derecognition, or disclosure.
In September 2006, the FASB issued Statement of Financial Accounting Standards No. 157 (FAS 157), "Fair Value Measurements". FAS 157 defines fair value, establishes a framework for measuring fair value in accordance with generally accepted accounting principles and expands disclosure about fair value measurements. FAS 157 is effective for fiscal years beginning after November 15, 2007. Management is currently evaluating the impact the adoption of FAS 157 will have on the Funds' financial statement disclosures.
9 Fiscal Year-End Change
Effective March 12, 2007, Cash Management Fund and Money Market Fund each changed its fiscal year-end from December 31 to October 31.
13
Eaton Vance Money Market Funds as of October 31, 2007
REPORT OF INDEPENDENT REGISTERED PUBLIC ACCOUNTING FIRM
To the Trustees of Eaton Vance Mutual
Funds Trust and Shareholders of the
Eaton Vance Cash Management Fund
and Eaton Vance Money Market Fund:
We have audited the accompanying statements of assets and liabilities of Eaton Vance Cash Management Fund and Eaton Vance Money Market Fund (the "Funds") (each a series of Eaton Vance Mutual Funds Trust) as of October 31, 2007, and the related statements of operations, the statements of changes in net assets, and the financial highlights for the ten month period then ended. These financial statements and financial highlights are the responsibility of the Fund's management. Our responsibility is to express an opinion on these financial statements and financial highlights based on our audits. The statements of operations and the statements of changes in net assets for the years ended December 31, 2006 and 2005, and the financial highlights for the five years in the period ended December 31, 2006 were audited by other auditors. Those auditors expressed an unqualified opinion on those financial statements and financial highlights in their report dated February 21, 2007.
We conducted our audits in accordance with the standards of the Public Company Accounting Oversight Board (United States). Those standards require that we plan and perform the audit to obtain reasonable assurance about whether the financial statements and financial highlights are free of material misstatement. The Funds are not required to have, nor were we engaged to perform, an audit of its internal control over financial reporting. Our audits included consideration of internal control over financial reporting as a basis for designing audit procedures that are appropriate in the circumstances, but not for the purpose of expressing an opinion on the effectiveness of the Funds' internal control over financial reporting. Accordingly, we express no such opinion. An audit also includes examining, on a test basis, evidence supporting the amounts and disclosures in the financial statements, assessing the accounting principles used an d significant estimates made by management, as well as evaluating the overall financial statement presentation. We believe that our audits provide a reasonable basis for our opinion.
In our opinion, the financial statements and financial highlights referred to above present fairly, in all material respects, the financial positions of Eaton Vance Cash Management Fund and Eaton Vance Money Market Fund as of October 31, 2007, the results of their operations, the changes in their net assets, and the financial highlights for the ten month period then ended, in conformity with accounting principles generally accepted in the United States of America.
DELOITTE & TOUCHE LLP
Boston, Massachusetts
December 17, 2007
14
Eaton Vance Money Market Funds as of October 31, 2007
FEDERAL TAX INFORMATION (Unaudited)
The Form 1099-DIV you receive in January 2008 will show the tax status of all distributions paid to your account in calendar 2007. Shareholders are advised to consult their own tax adviser with respect to the tax consequences of their investment in the Funds.
15
Cash Management Portfolio as of October 31, 2007
PORTFOLIO OF INVESTMENTS
Asset Backed Securities — 3.7% | | | |
Principal Amount
(000's omitted) | |
Security | |
Value | |
| $ | 1,044 | | | AMCAR, Series 2007-BF, Class A1, 5.319%, 5/6/08 | | $ | 1,043,620 | | |
| | 6,792 | | | CARAT, Series 2007-1, Class A1, 5.325%, 5/15/08(1) | | | 6,791,576 | | |
| | 15,787 | | | CARAT, Series 2007-2, Class A1A, 5.605%, 8/15/08(1) | | | 15,787,405 | | |
| | 9,868 | | | CARAT, Series 2007-3, Class A1, 5.264%, 9/15/08(1) | | | 9,868,167 | | |
| | 3,196 | | | CARMX, Series 2007-2, Class A1, 5.328%, 6/16/08 | | | 3,196,000 | | |
| | 4,928 | | | DTAOT, Series 2007-A, Class A1, 5.343%, 5/15/08(1) | | | 4,928,171 | | |
| | 10,702 | | | FORDO, Series 2007-A, Class A1, 5.349%, 7/15/08(1) | | | 10,701,858 | | |
| | 10,000 | | | FORDO, Series 2007-B, Class A1, 5.292%, 10/15/08(1) | | | 10,000,000 | | |
| | 1,705 | | | TAROT, Series 2007-A, Class A1, 5.303%, 6/12/08 | | | 1,705,010 | | |
Total Asset Backed Securities
(amortized cost $64,021,807) | | $ | 64,021,807 | | |
| Certificates of Deposit — 6.4% | | | |
Principal Amount
(000's omitted) | | Security | | Value | |
| $ | 21,000 | | | Deutsche Bank, NY, 4.65%, 4/24/08(2) | | $ | 21,000,000 | | |
| | 38,000 | | | Royal Bank of Scotland, NY, 5.294%, 7/11/08(2) | | | 38,000,000 | | |
| | 50,000 | | | Societe Generale, NY, 5.76%, 7/7/08(2) | | | 50,000,000 | | |
Total Certificates of Deposit
(amortized cost $109,000,000) | | $ | 109,000,000 | | |
| Commercial Paper — 70.4% | | | |
Principal Amount
(000's omitted) | | Security | | Value | |
| Banks and Money Services — 62.6% | | | |
| $ | 8,050 | | | Abbey National, LLC, 4.75%, 11/1/07 | | $ | 8,050,000 | | |
| | 25,000 | | | American Express Credit Corp., 5.50%, 12/7/07 | | | 24,862,500 | | |
| | 35,000 | | | American General Corp., 5.39%, 11/9/07(3) | | | 34,958,078 | | |
| | 10,000 | | | BankAmerica Corp., 5.50%, 11/20/07 | | | 9,970,972 | | |
| | 9,500 | | | Barclays U.S. Funding, LLC, 4.95%, 1/9/08 | | | 9,409,869 | | |
| | 38,000 | | | Barclays U.S. Funding, LLC, 5.135%, 12/10/07 | | | 37,788,609 | | |
| | 8,381 | | | Barton Capital Corp., LLC, 4.83%, 11/1/07(3) | | | 8,381,000 | | |
| | 11,000 | | | Barton Capital Corp., LLC, 4.84%, 12/7/07(3) | | | 10,946,760 | | |
| | 24,900 | | | Barton Capital Corp., LLC, 5.00%, 1/11/08(3) | | | 24,654,458 | | |
| | 11,000 | | | Barton Capital Corp., LLC, 5.15%, 11/9/07(3) | | | 10,987,411 | | |
| | 15,000 | | | Barton Capital Corp., LLC, 5.95%, 11/19/07 | | | 14,955,375 | | |
| | 20,000 | | | CAFCO, LLC, 5.13%, 1/10/08(3) | | | 19,800,500 | | |
| | 10,000 | | | CAFCO, LLC, 5.95%, 1/15/08(3) | | | 9,876,042 | | |
| | 11,425 | | | CAFCO, LLC, 6.20%, 11/15/07(3) | | | 11,397,453 | | |
Principal Amount
(000's omitted) | |
Security | |
Value | |
| Banks and Money Services (continued) | | | |
| $ | 11,500 | | | CIESCO, LLC, 5.10%, 11/5/07(3) | | $ | 11,493,483 | | |
| | 16,500 | | | CIESCO, LLC, 5.50%, 11/2/07(3) | | | 16,497,479 | | |
| | 11,000 | | | CIESCO, LLC, 5.50%, 2/15/08(3) | | | 10,821,861 | | |
| | 12,500 | | | CIT Group, Inc., 5.16%, 2/15/08(3) | | | 12,310,083 | | |
| | 10,000 | | | CIT Group, Inc., 5.25%, 12/19/07(3) | | | 9,930,000 | | |
| | 10,500 | | | CIT Group, Inc., 5.32%, 2/1/08(3) | | | 10,357,247 | | |
| | 10,000 | | | CIT Group, Inc., 5.37%, 2/7/08(3) | | | 9,853,817 | | |
| | 11,000 | | | CIT Group, Inc., 5.48%, 2/8/08(3) | | | 10,834,230 | | |
| | 18,500 | | | CIT Group, Inc., 5.53%, 11/13/07(3) | | | 18,465,898 | | |
| | 15,500 | | | CIT Group, Inc., 5.63%, 11/20/07(3) | | | 15,453,944 | | |
| | 10,000 | | | CRC Funding, LLC, 5.05%, 12/14/07(3) | | | 9,939,681 | | |
| | 11,500 | | | CRC Funding, LLC, 5.85%, 3/5/08(3) | | | 11,266,406 | | |
| | 7,500 | | | CRC Funding, LLC, 5.88%, 2/8/08(3) | | | 7,378,725 | | |
| | 25,000 | | | CRC Funding, LLC, 6.05%, 11/14/07(3) | | | 24,945,382 | | |
| | 12,000 | | | Fortis Funding, LLC, 5.64%, 11/5/07(3) | | | 11,992,474 | | |
| | 35,000 | | | HSBC Finance Corp., 5.42%, 12/6/07 | | | 34,815,569 | | |
| | 25,000 | | | ING (US) Funding, LLC, 4.89%, 1/22/08 | | | 24,721,542 | | |
| | 8,075 | | | Kitty Hawk Funding Corp., 4.80%, 1/17/08(3) | | | 7,992,097 | | |
| | 13,356 | | | Kitty Hawk Funding Corp., 4.80%, 1/29/08(3) | | | 13,197,509 | | |
| | 8,500 | | | Kitty Hawk Funding Corp., 4.90%, 12/14/07(3) | | | 8,450,251 | | |
| | 15,000 | | | Kitty Hawk Funding Corp., 4.95%, 11/19/07(3) | | | 14,962,875 | | |
| | 11,000 | | | Kitty Hawk Funding Corp., 5.11%, 1/11/08(3) | | | 10,889,141 | | |
| | 7,500 | | | Kitty Hawk Funding Corp., 5.50%, 12/18/07(3) | | | 7,446,146 | | |
| | 25,000 | | | Merrill Lynch & Co., 4.77%, 12/12/07 | | | 24,864,187 | | |
| | 8,000 | | | Morgan Stanley, 5.39%, 2/8/08 | | | 7,881,420 | | |
| | 26,400 | | | Morgan Stanley, 5.48%, 11/20/07 | | | 26,323,646 | | |
| | 25,000 | | | Morgan Stanley, 5.50%, 11/28/07 | | | 24,896,875 | | |
| | 20,000 | | | Nestle Capital Corp., 5.30%, 11/15/07(3) | | | 19,958,777 | | |
| | 9,500 | | | Old Line Funding Corp., LLC, 4.93%, 11/19/07(3) | | | 9,476,582 | | |
| | 6,150 | | | Old Line Funding Corp., LLC, 4.95%, 1/22/08(3) | | | 6,080,659 | | |
| | 16,378 | | | Old Line Funding Corp., LLC, 5.12%, 1/17/08(3) | | | 16,197,592 | | |
| | 10,000 | | | Old Line Funding Corp., LLC, 5.20%, 11/9/07(3) | | | 9,988,444 | | |
| | 26,178 | | | Old Line Funding Corp., LLC, 5.70%, 12/13/07(3) | | | 26,003,916 | | |
| | 8,500 | | | Old Line Funding Corp., LLC, 5.95%, 11/14/07(3) | | | 8,481,737 | | |
| | 6,000 | | | Old Line Funding Corp., LLC, 6.15%, 12/7/07(3) | | | 5,963,100 | | |
| | 6,500 | | | Ranger Funding Co., LLC, 4.90%, 11/21/07(3) | | | 6,482,306 | | |
| | 10,000 | | | Ranger Funding Co., LLC, 4.91%, 1/14/08(3) | | | 9,899,072 | | |
| | 11,000 | | | Ranger Funding Co., LLC, 5.10%, 11/26/07(3) | | | 10,961,042 | | |
| | 11,000 | | | Ranger Funding Co., LLC, 5.13%, 1/10/08(3) | | | 10,890,275 | | |
| | 25,000 | | | Royal Bank of Canada, 5.44%, 11/8/07 | | | 24,973,556 | | |
| | 10,000 | | | Royal Bank of Scotland, 5.06%, 12/11/07 | | | 9,943,778 | | |
| | 7,000 | | | Sheffield Receivables Corp., 4.90%, 11/15/07(3) | | | 6,986,661 | | |
| | 8,750 | | | Sheffield Receivables Corp., 4.95%, 11/7/07(3) | | | 8,742,781 | | |
| | 15,000 | | | Sheffield Receivables Corp., 4.96%, 11/13/07(3) | | | 14,975,200 | | |
See notes to financial statements
16
Cash Management Portfolio as of October 31, 2007
PORTFOLIO OF INVESTMENTS CONT'D
Principal Amount
(000's omitted) | |
Security | |
Value | |
| Banks and Money Services (continued) | | | |
| $ | 24,750 | | | Sheffield Receivables Corp., 5.08%, 1/18/08(3) | | $ | 24,477,585 | | |
| | 10,000 | | | Sheffield Receivables Corp., 5.17%, 11/9/07(3) | | | 9,988,511 | | |
| | 10,053 | | | Societe Generale North America, Inc., 4.89%, 1/24/08 | | | 9,938,295 | | |
| | 18,500 | | | Societe Generale North America, Inc., 5.15%, 1/7/08 | | | 18,322,683 | | |
| | 15,150 | | | Societe Generale North America, Inc., 5.46%, 11/6/07 | | | 15,138,511 | | |
| | 20,000 | | | UBS Finance Delaware, LLC, 4.785%, 12/27/07 | | | 19,851,133 | | |
| | 23,000 | | | UBS Finance Delaware, LLC, 4.79%, 12/21/07 | | | 22,846,986 | | |
| | 39,719 | | | UBS Finance Delaware, LLC, 5.40%, 11/7/07 | | | 39,683,253 | | |
| | 18,000 | | | Yorktown Capital, LLC, 4.85%, 11/1/07(3) | | | 18,000,000 | | |
| | 10,000 | | | Yorktown Capital, LLC, 4.88%, 1/25/08(3) | | | 9,884,778 | | |
| | 5,741 | | | Yorktown Capital, LLC, 5.00%, 1/14/08(3) | | | 5,681,995 | | |
| | 6,250 | | | Yorktown Capital, LLC, 5.15%, 12/20/07(3) | | | 6,206,189 | | |
| | 14,800 | | | Yorktown Capital, LLC, 5.18%, 11/13/07(3) | | | 14,774,445 | | |
| | 10,000 | | | Yorktown Capital, LLC, 5.75%, 11/27/07(3) | | | 9,958,472 | | |
| | | | | | | $ | 1,064,779,309 | | |
| Foods — 1.1% | | | |
| $ | 8,000 | | | General Mills, Inc., 5.04%, 1/29/08(3) | | $ | 7,900,320 | | |
| | 11,000 | | | General Mills, Inc., 5.13%, 11/8/07(3) | | | 10,989,028 | | |
| | | | | | | $ | 18,889,348 | | |
| Household Products — 0.3% | | | |
| $ | 5,253 | | | Fortune Brands, Inc., 5.25%, 11/14/07(3) | | $ | 5,243,041 | | |
| | | | | | | $ | 5,243,041 | | |
| Insurance — 4.3% | | | |
| $ | 25,000 | | | Prudential Financial, Inc., 5.05%, 1/25/08(3) | | $ | 24,701,910 | | |
| | 16,500 | | | Prudential Financial, Inc., 5.67%, 11/15/07(3) | | | 16,463,618 | | |
| | 16,500 | | | Prudential Financial, Inc., 5.67%, 12/17/07(3) | | | 16,380,458 | | |
| | 15,000 | | | Prudential Financial, Inc., 5.75%, 11/21/07(3) | | | 14,952,083 | | |
| | | | | | | $ | 72,498,069 | | |
| Machinery — 0.6% | | | |
| $ | 10,000 | | | Ingersoll-Rand Co., Ltd., 5.07%, 12/7/07(3) | | $ | 9,949,300 | | |
| | | | | | | $ | 9,949,300 | | |
| Oil and Gas-Equipment and Services — 0.9% | | | |
| $ | 8,600 | | | XTO Energy, Inc., 5.38%, 1/22/08(3) | | $ | 8,494,612 | | |
| | 6,765 | | | XTO Energy, Inc., 5.38%, 1/29/08(3) | | | 6,675,022 | | |
| | | | | | | $ | 15,169,634 | | |
Principal Amount
(000's omitted) | |
Security | |
Value | |
| Retail-Food and Drug — 0.6% | | | |
| $ | 11,000 | | | CVS Corp., 5.42%, 1/9/08(3) | | $ | 10,885,728 | | |
| | | | | | | $ | 10,885,728 | | |
Total Commercial Paper
(amortized cost $1,197,414,429) | | $ | 1,197,414,429 | | |
| Corporate Bonds & Notes — 17.2% | | | |
Principal Amount
(000's omitted) | |
Security | |
Value | |
| Banks and Money Services — 15.1% | | | |
| $ | 14,000 | | | Countrywide Financial Corp., MTN,
5.768%, 12/19/07(2) | | $ | 14,000,321 | | |
| | 10,000 | | | Countrywide Home Loan, MTN, 3.25%, 5/21/08 | | | 9,876,516 | | |
| | 20,000 | | | Credit Agricole SA/London, 5.18%, 10/21/08(1)(2) | | | 20,000,000 | | |
| | 16,000 | | | Diageo Capital PLC, 3.50%, 11/19/07 | | | 15,985,205 | | |
| | 23,000 | | | Fortis Bank, NY, 5.169%, 11/19/08(1)(2) | | | 23,000,000 | | |
| | 21,500 | | | General Electric Capital Corp., 5.696%, 1/15/08(2) | | | 21,495,069 | | |
| | 13,500 | | | John Deere Capital Corp., 5.383%, 9/25/08(2) | | | 13,500,000 | | |
| | 11,000 | | | Merrill Lynch & Co., 3.70%, 4/21/08 | | | 10,891,125 | | |
| | 25,000 | | | Merrill Lynch & Co., 5.175%, 11/17/08(2) | | | 25,000,000 | | |
| | 9,500 | | | Merrill Lynch & Co., MTN, 3.125%, 7/15/08 | | | 9,345,233 | | |
| | 20,000 | | | Morgan Stanley, MTN, 5.118%, 1/11/08(2) | | | 20,004,348 | | |
| | 25,000 | | | Rabobank Nederland, MTN, 4.53%, 3/12/08(2) | | | 25,000,000 | | |
| | 20,000 | | | Totta Ireland PLC, 5.122%, 11/6/08(1)(2) | | | 20,000,000 | | |
| | 14,800 | | | Unilever Capital Corp., 5.10%, 11/11/08(1)(2) | | | 14,800,000 | | |
| | 14,730 | | | Washington Mutual, 4.375%, 1/15/08 | | | 14,694,490 | | |
| | | | | | | $ | 257,592,307 | | |
| Insurance — 1.2% | | | |
| $ | 20,000 | | | Prudential Financial, Inc., 5.791%, 9/4/08(2) | | $ | 20,000,000 | | |
| | | | | | | $ | 20,000,000 | | |
| Telecommunications — 0.9% | | | |
| $ | 16,000 | | | Vodafone Group PLC, 3.95%, 1/30/08 | | $ | 15,944,447 | | |
| | | | | | | $ | 15,944,447 | | |
Total Corporate Bonds & Notes
(amortized cost $293,536,754) | | $ | 293,536,754 | | |
See notes to financial statements
17
Cash Management Portfolio as of October 31, 2007
PORTFOLIO OF INVESTMENTS CONT'D
U.S. Government Agency Obligations — 1.5% | |
Principal Amount
(000's omitted) | |
Security | |
Value | |
| $ | 25,000 | | | FHLB, 5.375%, 2/28/08 | | $ | 25,000,000 | | |
Total U.S. Government Agency Obligations
(amortized cost $25,000,000) | | $ | 25,000,000 | | |
| Variable Rate Demand Obligations — 0.5% | |
Principal Amount
(000's omitted) | |
Security | |
Value | |
| $ | 8,000 | | | Miami, FL, (MBIA), (SPA - Wachovia Bank N.A.),
4.75%, 12/1/25(2) | | $ | 8,000,000 | | |
Total Variable Rate Demand Obligations
(amortized cost $8,000,000) | | $ | 8,000,000 | | |
Total Investments — 99.7%
(amortized cost $1,696,972,990)(4) | | $ | 1,696,972,990 | | |
| Other Assets, Less Liabilities — 0.3% | | $ | 4,621,269 | | |
| Net Assets — 100.0% | | $ | 1,701,594,259 | | |
AMCAR - AmeriCredit Automobile Receivables Trust
CARAT - Capital Auto Receivables Asset Trust
CARMX - Carmax Auto Owner Trust
DTAOT - DT Auto Owner Trust
FHLB - Federal Home Loan Bank
FORDO - Ford Credit Auto Owner Trust
MTN - Medium-Term Note
TAROT - Triad Auto Receivables Owner Trust
(1) Security exempt from registration under Rule 144A of the Securities Act of 1933. These securities may be sold in transactions exempt from registration, normally to qualified institutional buyers. At October 31, 2007, the aggregate value of the securities is $135,877,177 or 8.0% of the Portfolio's net assets.
(2) Variable rate obligation. The stated interest rate represents the rate in effect at October 31, 2007.
(3) A security which has been issued under section 4(2) of the Securities Act of 1933 and is generally regarded as restricted and illiquid. This security may be resold in transactions exempt from registration or to the public if the security is registered. All such securities held are deemed liquid based on criteria and procedures authorized by the Trustees.
(4) Cost for federal income taxes is the same.
See notes to financial statements
18
Cash Management Portfolio as of October 31, 2007
FINANCIAL STATEMENTS
Statement of Assets and Liabilities
As of October 31, 2007
| Assets | |
| Investments, at amortized cost | | $ | 1,696,972,990 | | |
| Cash | | | 426 | | |
| Interest receivable | | | 5,553,299 | | |
| Total assets | | $ | 1,702,526,715 | | |
| Liabilities | |
| Payable to affiliate for investment advisory fee | | $ | 833,520 | | |
| Payable to affiliate for Trustees' fee | | | 2,773 | | |
| Accrued expenses | | | 96,163 | | |
| Total liabilities | | $ | 932,456 | | |
| Net Assets applicable to investors' interest in Portfolio | | $ | 1,701,594,259 | | |
| Sources of Net Assets | |
| Net proceeds from capital contributions and withdrawals | | $ | 1,701,594,259 | | |
| Total | | $ | 1,701,594,259 | | |
Statements of Operations
For the Period Ended
October 31, 2007(1)
| Investment Income | | Period Ended(1)
October 31, 2007 | | Year Ended
December 31, 2006 | |
| Interest | | $ | 96,036,530 | | | $ | 14,388,824 | | |
| Total investment income | | $ | 96,036,530 | | | $ | 14,388,824 | | |
| Expenses | |
| Investment adviser fee | | $ | 8,714,325 | | | $ | 1,360,454 | | |
| Trustees' fees and expenses | | | 22,782 | | | | 8,016 | | |
| Custodian fee | | | 182,662 | | | | 85,116 | | |
| Legal and accounting services | | | 113,357 | | | | 44,598 | | |
| Miscellaneous | | | 12,978 | | | | 368 | | |
| Total expenses | | $ | 9,046,104 | | | $ | 1,498,552 | | |
Deduct —
Reduction of custodian fee | | $ | 293 | | | $ | 18 | | |
| Total expense reductions | | $ | 293 | | | $ | 18 | | |
| Net expenses | | $ | 9,045,811 | | | $ | 1,498,534 | | |
| Net investment income | | $ | 86,990,719 | | | $ | 12,890,290 | | |
| Realized Gain (Loss) | |
Net realized gain (loss) —
Investment transactions (identified
cost basis) | | $ | (196 | ) | | $ | (2,730 | ) | |
| Increase from payments by affiliate | | | — | | | | 53 | | |
Net loss realized on the disposal of
investments which did not meet
the Portfolio's investment guidelines | | | — | | | | (53 | ) | |
| Net realized loss | | $ | (196 | ) | | $ | (2,730 | ) | |
| Net increase in net assets from operations | | $ | 86,990,523 | | | $ | 12,887,560 | | |
(1) For the ten months ended October 31, 2007.
See notes to financial statements
19
Cash Management Portfolio as of October 31, 2007
FINANCIAL STATEMENTS CONT'D
Statements of Changes in Net Assets
| Increase (Decrease) in Net Assets | | Period Ended
October 31, 2007(1) | | Year Ended
December 31, 2006 | | Year Ended
December 31, 2005 | |
From operations —
Net investment income | | $ | 86,990,719 | | | $ | 12,890,290 | | | $ | 3,954,413 | | |
Net realized loss from investment transactions, payments by affiliate and the disposal of investments
which did not meet the Portfolio's investment guidelines | | | (196 | ) | | | (2,730 | ) | | | (141 | ) | |
| Net increase in net assets from operations | | $ | 86,990,523 | | | $ | 12,887,560 | | | $ | 3,954,272 | | |
Capital transactions —
Contributions | | $ | 24,122,874,395 | | | $ | 3,903,906,779 | | | $ | 184,089,048 | | |
| Withdrawals | | | (23,798,494,086 | ) | | | (2,773,384,656 | ) | | | (210,117,271 | ) | |
| Net increase (decrease) in net assets from capital transactions | | $ | 324,380,309 | | | $ | 1,130,522,123 | | | $ | (26,028,223 | ) | |
| Net increase (decrease) in net assets | | $ | 411,370,832 | | | $ | 1,143,409,683 | | | $ | (22,073,951 | ) | |
| Net Assets | |
| At beginning of period | | $ | 1,290,223,427 | | | $ | 146,813,744 | | | $ | 168,887,695 | | |
| At end of period | | $ | 1,701,594,259 | | | $ | 1,290,223,427 | | | $ | 146,813,744 | | |
(1) For the ten months ended October 31, 2007.
See notes to financial statements
20
Cash Management Portfolio as of October 31, 2007
FINANCIAL STATEMENTS CONT'D
Supplementary Data
| | | Period Ended | | Year Ended December 31, | |
| | | October 31, 2007(1) | | 2006 | | 2005 | | 2004 | | 2003 | | 2002 | |
| Ratios/Supplemental Data | |
| Ratios (As a percentage of average daily net assets): | |
| Expenses before custodian fee reduction | | | 0.51 | %(2) | | | 0.54 | % | | | 0.60 | % | | | 0.59 | % | | | 0.57 | % | | | 0.58 | % | |
| Expenses after custodian fee reduction | | | 0.51 | %(2) | | | 0.54 | % | | | 0.60 | % | | | 0.59 | % | | | 0.57 | % | | | 0.58 | % | |
| Net investment income | | | 4.88 | %(2) | | | 4.67 | % | | | 2.63 | % | | | 0.78 | % | | | 0.59 | % | | | 1.22 | % | |
| Total Return | | | 4.14 | %(4) | | | 4.60 | %(3) | | | 2.67 | %(3) | | | 0.78 | % | | | 0.60 | % | | | 1.22 | % | |
(1) For the ten months ended October 31, 2007. The Portfolio changed its fiscal year end from December 31 to October 31.
(2) Annualized.
(3) During the years ended December 31, 2006 and December 31, 2005, the investment adviser reimbursed the Portfolio for net losses realized on the disposal of investments which did not meet the Portfolio's investment guidelines. The reimbursement had no effect on total return for the years ended December 31, 2006 and December 31, 2005.
(4) Not annualized.
See notes to financial statements
21
Cash Management Portfolio as of October 31, 2007
NOTES TO FINANCIAL STATEMENTS
1 Significant Accounting Policies
Cash Management Portfolio (the Portfolio) is registered under the Investment Company Act of 1940, as amended (the 1940 Act), as a diversified, open-end management investment company. The Portfolio's objective is to provide as high a rate of income as may be consistent with preservation of capital and maintenance of liquidity. The Declaration of Trust permits the Trustees to issue interests in the Portfolio. At October 31, 2007, Eaton Vance Cash Management Fund and Eaton Vance Money Market Fund held an approximate 10.5% and 4.0% interest, respectively, in the Portfolio. The Portfolio is also available to other portfolios and funds managed by Boston Management and Research (BMR) and Eaton Vance Management (EVM) and its affiliates for short-term investment purposes. At October 31, 2007, other portfolios and funds managed by BMR and EVM and its affiliates held interests totaling 85.3% of the Portfolio's net assets. At October 31, 20 07, Eaton Vance Tax-Managed Global Diversified Equity Income Fund and Large-Cap Value Portfolio each held a greater than 10% interest in the Portfolio (16.9% and 12.6%, respectively).
The following is a summary of significant accounting policies of the Portfolio. The policies are in conformity with accounting principles generally accepted in the United States of America.
A Investment Valuation — The Portfolio values its investment securities utilizing the amortized cost valuation technique permitted by Rule 2a-7 of the 1940 Act, pursuant to which the Portfolio must comply with certain conditions. This technique involves initially valuing a portfolio security at its cost and thereafter assuming a constant amortization to maturity of any discount or premium.
B Investment Transactions — Investment transactions for financial statement purposes are accounted for on a trade date basis. Realized gains and losses on investments sold are determined on the basis of identified cost.
C Income — Interest income is recorded on the basis of interest accrued, adjusted for amortization of premium or accretion of discount.
D Federal Taxes — The Portfolio has elected to be treated as a partnership for federal tax purposes. No provision is made by the Portfolio for federal or state taxes on any taxable income of the Portfolio because each investor in the Portfolio is ultimately responsible for the payment of any taxes on its share of taxable income. Since at least one of the Portfolio's investors is a regulated investment company that invests all or substantially all of its assets in the Portfolio, the Portfolio normally must satisfy the applicable source of income and diversification requirements (under the Internal Revenue Code) in order for its investors to satisfy them. The Portfolio will allocate, at least annually a mong its investors, each investor's distributive share of the Portfolio's net investment income, net realized capital gains and any other items of income, gain, loss, deduction or credit.
E Expense Reduction — State Street Bank and Trust Company (SSBT) serves as custodian of the Portfolio. Pursuant to the custodian agreement, SSBT receives a fee reduced by credits, which are determined based on the average daily cash balance the Portfolio maintains with SSBT. All credit balances, if any, used to reduce the Portfolio's custodian fees are reported as a reduction of expenses in the Statement of Operations.
F Use of Estimates — The preparation of the financial statements in conformity with accounting principles generally accepted in the United States of America requires management to make estimates and assumptions that affect the reported amounts of assets and liabilities at the date of the financial statements and the reported amounts of income and expense during the reporting period. Actual results could differ from those estimates.
G Indemnifications — Under the Portfolio's organizational documents, its officers and Trustees may be indemnified against certain liabilities and expenses arising out of the performance of their duties to the Portfolio. Interestholders in the Portfolio are jointly and severally liable for the liabilities and obligations of the Portfolio in the event that the Portfolio fails to satisfy such liabilities and obligations; provided, however, that, to the extent assets are available in the Portfolio, the Portfolio may, under certain circumstances, indemnify interestholders from and against any claim or liability to which such holder may become subject by reason of being or having been an interestholder in the Portfolio. Additionally, in the normal course of business, the Portfo lio enters into agreements with service providers that may contain indemnification clauses. The Portfolio's maximum exposure under these arrangements is unknown as this would involve future claims that may be made against the Portfolio that have not yet occurred.
22
Cash Management Portfolio as of October 31, 2007
NOTES TO FINANCIAL STATEMENTS CONT'D
2 Investment Adviser Fee and Other Transactions with Affiliates
The investment adviser fee is earned by BMR, a subsidiary of EVM, as compensation for management and investment advisory services rendered to the Portfolio. Pursuant to the advisory agreement, BMR receives a monthly advisory fee at the annual rate of 1/2 of 1% of the Portfolio's average daily net assets. However, BMR has contractually agreed to reduce its advisory fee to 0.50% annually of the Portfolio's average daily net assets up to $1 billion, 0.475% annually of average daily net assets of $1 billion but less than $2 billion, 0.450% annually of average daily net assets of $2 billion but less than $5 billion and at reduced rates as daily net as sets exceed that level. This contractual reduction, which cannot be terminated or amended without Trustee consent and decreased without shareholder consent, was accepted by a vote of the Trustees on April 23, 2007. For the period ended October 31, 2007, the fee was equivalent to 0.49% (annualized) of the Portfolio's average daily net assets and amounted to $8,714,325. For the year ended December 31, 2006, the fee was equivalent to 0.50% and amounted to $1,360,454.
Except for Trustees of the Portfolio who are not members of EVM's or BMR's organizations, officers and Trustees receive remuneration for their services to the Portfolio out of such investment adviser fee. Certain officers and Trustees of the Portfolio are officers of the above organizations.
3 Purchases and Sales of Investments
Purchases and sales (including maturities and paydowns) of investments during the period ended October 31, 2007, exclusive of U.S. Government and agency securities, aggregated $46,643,261,683 and $46,321,821,035 respectively. Purchases and sales (including maturities) of U.S. Government and agency securities aggregated $25,000,000 and $18,000,000, respectively.
4 Line of Credit
The Portfolio participates with other portfolios and funds managed by EVM and its affiliates in a $200 million unsecured line of credit agreement with a group of banks. Borrowings are made by the Portfolio solely to facilitate the handling of unusual and/or unanticipated short-term cash requirements. Interest is charged to the Portfolio based on its borrowings at an amount above either the Eurodollar rate or Federal Funds rate. In addition, a fee computed at an annual rate of 0.07% on the daily unused portion of the line of credit is allocated among the participating portfolios and funds at the end of each quarter. The Portfolio did not have any significant borrowings or allocated fees during the period ended October 31, 2007.
5 Recently Issued Accounting Pronouncements
In June 2006, the Financial Accounting Standards Board (FASB) issued FASB Interpretation No. 48 (FIN 48), "Accounting for Uncertainty in Income Taxes – an interpretation of FASB Statement No. 109". FIN 48 clarifies the accounting for uncertainty in income taxes recognized in accordance with FASB Statement No. 109, "Accounting for Income Taxes". This interpretation prescribes a recognition threshold and measurement attribute for the financial statement recognition and measurement of a tax position taken or expected to be taken in a tax return. It also provides guidance on de-recognition, classification, interest and penalties, accounting in interim periods, disclosure and transition. FIN 48 is effective on the last business day of the first required financial reporting period for fiscal years beginning after December 15, 2006. Management has concluded that as of October 31, 2007, there are no uncertain tax positions that wou ld require financial statement recognition, derecognition, or disclosure.
In September 2006, the FASB issued Statement of Financial Accounting Standards No. 157 (FAS 157), "Fair Value Measurements". FAS 157 defines fair value, establishes a framework for measuring fair value in accordance with generally accepted accounting principles and expands disclosure about fair value measurements. FAS 157 is effective for fiscal years beginning after November 15, 2007. Management is currently evaluating the impact the adoption of FAS 157 will have on the Portfolio's financial statement disclosures.
6 Fiscal Year-End Change
Effective January 1, 2007, the Portfolio changed its fiscal year-end from December 31 to October 31.
23
Cash Management Portfolio as of October 31, 2007
REPORT OF INDEPENDENT REGISTERED PUBLIC ACCOUNTING FIRM
To the Trustees and Investors of
Cash Management Portfolio:
We have audited the accompanying statement of assets and liabilities of Cash Management Portfolio (the "Portfolio"), including the portfolio of investments, as of October 31, 2007, and the related statement of operations, the statement of changes in net assets, and the supplementary data for the ten month period then ended. These financial statements and supplementary data are the responsibility of the Portfolio's management. Our responsibility is to express an opinion on these financial statements and supplementary data based on our audit. The statement of operations for the year ended December 31, 2006, the statements of changes in net assets for the years ended December 31, 2006 and 2005, and the supplementary data for the five years in the period ended December 31, 2006 were audited by other auditors. Those auditors expressed an unqualified opinion on those financial statements and supplementary data in their report dated Fe bruary 21, 2007.
We conducted our audit in accordance with the standards of the Public Company Accounting Oversight Board (United States). Those standards require that we plan and perform the audit to obtain reasonable assurance about whether the financial statements and supplementary data are free of material misstatement. The Portfolio is not required to have, nor were we engaged to perform, an audit of its internal control over financial reporting. Our audit included consideration of internal control over financial reporting as a basis for designing audit procedures that are appropriate in the circumstances, but not for the purpose of expressing an opinion on the effectiveness of the Portfolio's internal control over financial reporting. Accordingly, we express no such opinion. An audit also includes examining, on a test basis, evidence supporting the amounts and disclosures in the financial statements, assessing the accounting principles use d and significant estimates made by management, as well as evaluating the overall financial statement presentation. Our procedures included confirmation of securities owned as of October 31, 2007, by correspondence with the custodian and brokers; where replies were not received from brokers, we performed other auditing procedures. We believe that our audit provides a reasonable basis for our opinion.
In our opinion, the financial statements and supplementary data referred to above present fairly, in all material respects, the financial position of Cash Management Portfolio as of October 31, 2007, the results of its operations, the changes in its net assets, and the supplementary data for the ten month period then ended, in conformity with accounting principles generally accepted in the United States of America.
DELOITTE & TOUCHE LLP
Boston, Massachusetts
December 17, 2007
24
Eaton Vance Money Market Funds and Cash Management Portfolio
OTHER MATTERS
Change in Independent Registered Public Accounting Firm
On August 6, 2007, PricewaterhouseCoopers LLP resigned in the ordinary course as the independent registered public accounting firm for the Funds and Portfolio.
The reports of PricewaterhouseCoopers LLP on the Funds' and Portfolio's financial statements for each of the last two fiscal years contained no adverse opinion or disclaimer of opinion and were not qualified or modified as to uncertainty, audit scope or accounting principle. There have been no disagreements with PricewaterhouseCoopers LLP during the Funds' and Portfolio's two most recent fiscal years and any subsequent interim period on any matter of accounting principles or practices, financial statement disclosure or auditing scope or procedure, which disagreements if not resolved to the satisfaction of PricewaterhouseCoopers LLP, would have caused them to make reference thereto in their reports on the Funds' and Portfolio's financial statements for such years, and there were no reportable events of the kind described in Item 304 (a)(1)(v) of Regulation S-K under the Securities Exchange Act of 1934, as amended.
At a meeting held on August 6, 2007, based on Audit Committee recommendations and approvals, the full Board of Trustees of the Funds and Portfolio approved Deloitte & Touche LLP as the Funds' and Portfolio's independent registered public accounting firm for the period ending October 31, 2007. To the best of the Funds' and Portfolio's knowledge, for the fiscal years ended December 31, 2006 and December 31, 2005, and through August 6, 2007, the Funds and Portfolio did not consult with Deloitte & Touche LLP on items which concerned the application of accounting principles to a specified transaction, either completed or proposed, or the type of audit opinion that might be rendered on the Funds' and Portfolio's financial statements or concerned the subject of a disagreement (as defined in paragraph (a)(1)(iv) of Item 304 of Regulation S-K) or reportable events (as described in paragraph (a)(1)(v) of Item 304 of Regulation S-K).
25
Eaton Vance Money Market Funds
BOARD OF TRUSTEES' ANNUAL APPROVAL OF THE INVESTMENT ADVISORY AGREEMENTS
Overview of the Contract Review Process
The Investment Company Act of 1940, as amended (the "1940 Act"), provides, in substance, that each investment advisory agreement between a fund and its investment adviser will continue in effect from year to year only if its continuance is approved at least annually by the fund's board of trustees, including by a vote of a majority of the trustees who are not "interested persons" of the fund ("Independent Trustees"), cast in person at a meeting called for the purpose of considering such approval.
At a meeting of the Boards of Trustees (each a "Board") of the Eaton Vance group of mutual funds (the "Eaton Vance Funds") held on April 23, 2007, the Board, including a majority of the Independent Trustees, voted to approve continuation of existing advisory and sub-advisory agreements for the Eaton Vance Funds for an additional one-year period. In voting its approval, the Board relied upon the affirmative recommendation of the Special Committee of the Board, which is a committee comprised exclusively of Independent Trustees. Prior to making its recommendation, the Special Committee reviewed information furnished for a series of meetings of the Special Committee held in February, March and April 2007. Such information included, among other things, the following:
Information about Fees, Performance and Expenses
• An independent report comparing the advisory and related fees paid by each fund with fees paid by comparable funds;
• An independent report comparing each fund's total expense ratio and its components to comparable funds;
• An independent report comparing the investment performance of each fund to the investment performance of comparable funds over various time periods;
• Data regarding investment performance in comparison to relevant peer groups of funds and appropriate indices;
• Comparative information concerning fees charged by each adviser for managing other mutual funds and institutional accounts using investment strategies and techniques similar to those used in managing the fund;
• Profitability analyses for each adviser with respect to each fund;
Information about Portfolio Management
• Descriptions of the investment management services provided to each fund, including the investment strategies and processes employed;
• Information concerning the allocation of brokerage and the benefits received by each adviser as a result of brokerage allocation, including information concerning the acquisition of research through "soft dollar" benefits received in connection with the funds' brokerage, and the implementation of a soft dollar reimbursement program established with respect to the funds;
• Data relating to portfolio turnover rates of each fund;
• The procedures and processes used to determine the fair value of fund assets and actions taken to monitor and test the effectiveness of such procedures and processes;
Information about each Adviser
• Reports detailing the financial results and condition of each adviser;
• Descriptions of the qualifications, education and experience of the individual investment professionals whose responsibilities include portfolio management and investment research for the funds, and information relating to their compensation and responsibilities with respect to managing other mutual funds and investment accounts;
• Copies of the Codes of Ethics of each adviser and its affiliates, together with information relating to compliance with and the administration of such codes;
• Copies of or descriptions of each adviser's proxy voting policies and procedures;
• Information concerning the resources devoted to compliance efforts undertaken by each adviser and its affiliates on behalf of the funds (including descriptions of various compliance programs) and their record of compliance with investment policies and restrictions, including policies with respect to market-timing, late trading and selective portfolio disclosure, and with policies on personal securities transactions;
• Descriptions of the business continuity and disaster recovery plans of each adviser and its affiliates;
Other Relevant Information
• Information concerning the nature, cost and character of the administrative and other non-investment management services provided by Eaton Vance Management and its affiliates;
• Information concerning management of the relationship with the custodian, subcustodians and fund accountants by each adviser or the funds' administrator; and
• The terms of each advisory agreement.
26
Eaton Vance Money Market Funds
BOARD OF TRUSTEES' ANNUAL APPROVAL OF THE INVESTMENT ADVISORY AGREEMENTS CONT'D
In addition to the information identified above, the Special Committee considered information provided from time to time by each adviser throughout the year at meetings of the Board and its committees. Over the course of the twelve-month period ended April 30, 2007, the Board met ten times and the Special Committee, the Audit Committee and the Governance Committee, each of which is a Committee comprised solely of Independent Trustees, met twelve, fourteen and eight times, respectively. At such meetings, the Trustees received, among other things, presentations by the portfolio managers and other investment professionals of each adviser relating to the investment performance of each fund and the investment strategies used in pursuing the fund's investment objective.
For funds that invest through one or more underlying portfolios, the Board considered similar information about the portfolio(s) when considering the approval of advisory agreements. In addition, in cases where the fund's investment adviser has engaged a sub-adviser, the Board considered similar information about the sub-adviser when considering the approval of any sub-advisory agreement.
The Special Committee was assisted throughout the contract review process by Goodwin Procter LLP, legal counsel for the Independent Trustees. The members of the Special Committee relied upon the advice of such counsel and their own business judgment in determining the material factors to be considered in evaluating each advisory and sub-advisory agreement and the weight to be given to each such factor. The conclusions reached with respect to each advisory and sub-advisory agreement were based on a comprehensive evaluation of all the information provided and not any single factor. Moreover, each member of the Special Committee may have placed varying emphasis on particular factors in reaching conclusions with respect to each advisory and sub-advisory agreement.
Results of the Process
Based on its consideration of the foregoing, and such other information as it deemed relevant, including the factors and conclusions described below, the Special Committee concluded that the continuance of the investment advisory agreement of the Cash Management Portfolio (the "Portfolio"), the portfolio in which the Eaton Vance Cash Management Fund and the Eaton Vance Money Market Fund (the "Funds") invest, with Boston Management and Research (the "Adviser"), including its fee structure, is in the interests of shareholders and, therefore, the Special Committee recommended to the Board approval of the agreement. The Board accepted the recommendation of the Special Committee as well as the factors considered and conclusions reached by the Special Committee with respect to the agreement. Accordingly, the Board, including a majority of the Independent Trustees, voted to approve continuation of the investment advisory agreement for the Portfolio.
Nature, Extent and Quality of Services
In considering whether to approve the investment advisory agreement of the Portfolio, the Board evaluated the nature, extent and quality of services provided to the Portfolio by the Adviser.
The Board considered the Adviser's management capabilities and investment process with respect to the types of investments held by the Portfolio, including the education, experience and number of its investment professionals and other personnel who provide portfolio management, investment research, and similar services to the Portfolio. The Board specifically noted the Adviser's experience in managing portfolios consisting of high quality money market instruments and short-term obligations. The Board also took into account the resources dedicated to portfolio management and other services, including the compensation paid to recruit and retain investment personnel, and the time and attention devoted to the Portfolio by senior management.
The Board reviewed the compliance programs of the Adviser and relevant affiliates thereof. Among other matters, the Board considered compliance and reporting matters relating to personal trading by investment personnel, selective disclosure of portfolio holdings, late trading, frequent trading, portfolio valuation, business continuity and the allocation of investment opportunities. The Board also evaluated the responses of the Adviser and its affiliates to requests from regulatory authorities such as the Securities and Exchange Commission and the National Association of Securities Dealers.
The Board considered shareholder and other administrative services provided or managed by Eaton Vance Management and its affiliates, including transfer agency and accounting services. The Board evaluated the benefits to shareholders of investing in a fund that is a part of a large family of funds, including the ability, in many cases, to exchange an investment among different funds without incurring additional sales charges. Each Fund is maintained by the Adviser primarily as an administrative convenience for shareholders of other Eaton Vance Funds and is not actively marketed to the public as a stand-alone investment product.
After consideration of the foregoing factors, among others, the Board concluded that the nature, extent and quality of services provided by the Adviser, taken as a whole, are appropriate and consistent with the terms of the investment advisory agreement.
27
Eaton Vance Money Market Funds
BOARD OF TRUSTEES' ANNUAL APPROVAL OF THE INVESTMENT ADVISORY AGREEMENTS CONT'D
Fund Performance
The Board compared each Fund's investment performance to a relevant universe of similarly managed funds identified by an independent data provider and appropriate benchmark indices. The Board reviewed comparative performance data for the one-, three-, five- and ten-year periods ended September 30, 2006 for each Fund. The Board concluded that the performance of each Fund was satisfactory.
Management Fees and Expenses
The Board reviewed contractual investment advisory fee rates, including any administrative fee rates, payable by the Portfolio and each Fund (referred to collectively as "management fees"). As part of its review, the Board considered the management fees and each Fund's total expense ratio for the year ended September 30, 2006, as compared to a group of similarly managed funds selected by an independent data provider.
After reviewing the foregoing information, and in light of the nature, extent and quality of the services provided by the Adviser, the Board concluded that the management fees charged for advisory and related services and each Fund's total expense ratio are reasonable.
Profitability
The Board reviewed the level of profits realized by the Adviser and relevant affiliates thereof in providing investment advisory and administrative services to the Portfolio, each Fund and to all Eaton Vance Funds as a group. The Board considered the level of profits realized without regard to revenue sharing or other payments by the Adviser and its affiliates to third parties in respect of distribution services. The Board also considered other direct or indirect benefits received by the Adviser and its affiliates in connection with its relationship with the Portfolio and the Fund, including the benefits of research services that may be available to the Adviser as a result of securities transactions effected for the Portfolio and other advisory clients.
The Board concluded that, in light of the foregoing factors and the nature, extent and quality of the services rendered, the profits realized by the Adviser and its affiliates are reasonable.
Economies of Scale
In reviewing management fees and profitability, the Board also considered the extent to which the Adviser and its affiliates, on the one hand, and the Funds, on the other hand, can expect to realize benefits from economies of scale as the assets of the Funds and the Portfolio increase. The Board acknowledged the difficulty in accurately measuring the benefits resulting from the economies of scale with respect to the management of any specific fund or group of funds. The Board reviewed data summarizing the increases and decreases in the assets of the Funds and of all Eaton Vance Funds as a group over various time periods, and evaluated the extent to which the total expense ratio of each Fund and the profitability of the Adviser and its affiliates may have been affected by such increases or decreases. The Board noted that, at its request, the Adviser had agreed to add new breakpoints to the advisory fee. Based upon the foregoing, the Board concluded that the benefits from economies of scale are currently being shared equitably by the Adviser and its affiliates and each Fund and that, assuming reasonably foreseeable increases in the assets of the Portfolio, the structure of the advisory fee, which now includes breakpoints at several levels, can be expected to cause the Adviser and its affiliates and the Funds to continue to share such benefits equitably.
28
Eaton Vance Money Market Funds
MANAGEMENT AND ORGANIZATION
Fund Management. The Trustees of Eaton Vance Mutual Funds Trust (the Trust) and Cash Management Portfolio (the Portfolio) are responsible for the overall management and supervision of the Trust's and Portfolio's affairs. The Trustees and officers of the Trust and the Portfolio are listed below. Except as indicated, each individual has held the office shown or other offices in the same company for the last five years. Trustees and officers of the Trust and the Portfolio hold indefinite terms of office. The "noninterested Trustees" consist of those Trustees who are not "interested persons" of the Trust and the Portfolio, as that term is defined under the 1940 Act. The business address of each Trustee and officer is The Eaton Vance Building, 255 State Street, Boston, Massachusetts 02109. As used below, "EVC" refers to Eaton Vance Corp., "EV" refers to Eaton Van ce, Inc., "EVM" refers to Eaton Vance Management, "BMR" refers to Boston Management and Research, "EVD" refers to Eaton Vance Distributors, Inc. and "Parametric" refers to Parametric Portfolio Associates. EVC and EV are the corporate parent and trustee, respectively, of EVM and BMR. EVD is the Fund's principal underwriter, the Portfolio's placement agent and a wholly-owned subsidiary of EVM. Each officer affiliated with Eaton Vance may hold a position with other Eaton Vance affiliates that is comparable to his or her position with EVM listed below.
Name and
Date of Birth | | Position(s)
with the
Trust and
the Portfolio | | Term of
Office and
Length of
Service | | Principal Occupation(s)
During Past Five Years | | Number of Portfolios
in Fund Complex
Overseen By
Trustee(1) | | Other Directorships Held | |
| Interested Trustee | | | | | | | | | | | | | |
|
| Thomas E. Faust Jr. 5/31/58 | | Trustee and President of the Trust | | Trustee since 2007 and President of the Trust since 2002 | | Chairman, Chief Executive Officer and President of EVC, President of EV, Chief Executive Officer and President of EVM and BMR, and Director of EVD. Trustee and/or Officer of 176 registered investment companies and 5 private investment companies in the Eaton Vance Fund Complex. Mr. Faust is an interested person because of his positions with EVM, BMR, EVC and EV which are affiliates of the Trust and the Portfolio. | | | 176 | | | Director of EVC | |
|
| Noninterested Trustee(s) | | | | | | | | | | | | | |
|
| Benjamin C. Esty 1/2/63 | | Trustee | | Since 2005 | | Roy and Elizabeth Simmons Professor of Business Administration, Harvard University Graduate School of Business Administration (since 2003). Formerly, Associate Professor, Harvard University Graduate School of Business Administration (2000-2003). | | | 176 | | | None | |
|
| Allen R. Freedman 4/3/40 | | Trustee | | Since 2007 | | Former Chairman and Chief Executive Officer of Assurant, Inc. (insurance provider) (1978-2000). Formerly, a Director of Loring Ward International (fund distributor) (2005-2007). | | | 175 | | | Director of Assurant, Inc. and Stonemor Partners L.P. (owner and operator of cemeteries) | |
|
| William H. Park 9/19/47 | | Trustee | | Since 2003 | | Vice Chairman, Commercial Industrial Finance Corp. (specialty finance company) (since 2006). Formerly, President and Chief Executive Officer, Prizm Capital Management, LLC (investment management firm) (2002-2005). | | | 176 | | | None | |
|
| Ronald A. Pearlman 7/10/40 | | Trustee | | Since 2003 | | Professor of Law, Georgetown University Law Center. | | | 176 | | | None | |
|
| Norton H. Reamer 9/21/35 | | Trustee | | Trustee of the Trust since 1986 and of the Portfolio since 1993 | | President, Chief Executive Officer and a Director of Asset Management Finance Corp. (a specialty finance company serving the investment management industry) (since October 2003). President, Unicorn Corporation (an investment and financial advisory services company) (since September 2000). Formerly, Chairman and Chief Operating Officer, Hellman, Jordan Management Co., Inc. (an investment management company) (2000-2003). Formerly, Advisory Director of Berkshire Capital Corporation (investment banking firm) (2002-2003). | | | 176 | | | None | |
|
29
Eaton Vance Money Market Funds
MANAGEMENT AND ORGANIZATION CONT'D
Name and
Date of Birth | | Position(s)
with the
Trust and
the Portfolio | | Term of
Office and
Length of
Service | | Principal Occupation(s)
During Past Five Years | | Number of Portfolios
in Fund Complex
Overseen By
Trustee(1) | | Other Directorships Held | |
| Noninterested Trustee(s) (continued) | | | | | | | | | | | | | |
|
| Heidi L. Steiger 7/8/53 | | Trustee | | Since 2007 | | President, Lowenhaupt Global Advisors, LLC (global wealth management firm) (since 2005); Formerly, President and Contributing Editor, Worth Magazine (2004); Formerly, Executive Vice President and Global Head of Private Asset Management (and various other positions), Neuberger Berman (investment firm) (1986-2004). | | | 173 | | | Director of Nuclear Electric Insurance Ltd. (nuclear insurance provider) and Aviva USA (insurance provider) | |
|
| Lynn A. Stout 9/14/57 | | Trustee | | Since 1998 | | Paul Hastings Professor of Corporate and Securities Law, University of California at Los Angeles School of Law. | | | 176 | | | None | |
|
| Ralph F. Verni 1/26/43 | | Chairman of the Board and Trustee | | Chairman of the Board since 2007 and Trustee since 2005 | | Consultant and private investor. | | | 176 | | | None | |
|
| Principal Officers who are not Trustees | | | | | | | | | | | | | |
|
Name and
Date of Birth | | Position(s)
with the
Trust and
the Portfolio | | Term of
Office and
Length of
Service | | Principal Occupation(s)
During Past Five Years | |
| William H. Ahern, Jr. 7/28/59 | | Vice President of the Trust | | Since 1995 | | Vice President of EVM and BMR. Officer of 74 registered investment companies managed by EVM or BMR. | |
|
| Cynthia J. Clemson 3/2/63 | | Vice President of the Trust | | Since 2005 | | Vice President of EVM and BMR. Officer of 89 registered investment companies managed by EVM or BMR. | |
|
| Charles B. Gaffney 12/4/72 | | Vice President of the Trust | | Since 2007 | | Vice President of EVM and BMR. Previously, Sector Portfolio Manager and Senior Equity Analyst of Brown Brothers Harriman (1997-2003). Officer of 29 registered investment companies managed by EVM or BMR. | |
|
| Christine M. Johnston 11/9/72 | | Vice President of the Trust | | Since 2007 | | Vice President of EVM and BMR. Officer of 34 registered investment companies managed by EVM or BMR. | |
|
| Elizabeth S. Kenyon 9/8/59 | | President of the Portfolio | | Since 2002 | | Vice President of EVM and BMR. Officer of 17 registered investment companies managed by EVM or BMR. | |
|
| Aamer Khan 6/7/60 | | Vice President of the Trust | | Since 2005 | | Vice President of EVM and BMR. Officer of 32 registered investment companies managed by EVM or BMR. | |
|
| Thomas H. Luster 4/8/62 | | Vice President | | Vice President of the Trust since 2006 and of the Portfolio since 2002 | | Vice President of EVM and BMR. Officer of 48 registered investment companies managed by EVM or BMR. | |
|
| Michael R. Mach 7/15/47 | | Vice President of the Trust | | Since 1999 | | Vice President of EVM and BMR. Officer of 54 registered investment companies managed by EVM or BMR. | |
|
| Robert B. MacIntosh 1/22/57 | | Vice President of the Trust | | Since 1998 | | Vice President of EVM and BMR. Officer of 89 registered investment companies managed by EVM or BMR. | |
|
| Duncan W. Richardson 10/26/57 | | Vice President of the Trust | | Since 2001 | | Executive Vice President and Chief Equity Investment Officer of EVC, EVM and BMR. Officer of 80 registered investment companies managed by EVM or BMR. | |
|
| Walter A. Row, III 7/20/57 | | Vice President of the Trust | | Since 2001 | | Director of Equity Research and a Vice President of EVM and BMR. Officer of 38 registered investment companies managed by EVM or BMR. | |
|
| Judith A. Saryan 8/21/54 | | Vice President of the Trust | | Since 2003 | | Vice President of EVM and BMR. Officer of 53 registered investment companies managed by EVM or BMR. | |
|
30
Eaton Vance Money Market Funds
MANAGEMENT AND ORGANIZATION CONT'D
Name and
Date of Birth | | Position(s)
with the
Trust and
the Portfolio | | Term of
Office and
Length of
Service | | Principal Occupation(s)
During Past Five Years | |
| Principal Officers who are not Trustees (continued) | | | |
|
| Susan Schiff 3/13/61 | | Vice President of the Trust | | Since 2002 | | Vice President of EVM and BMR. Officer of 35 registered investment companies managed by EVM or BMR. | |
|
| Thomas Seto 9/27/62 | | Vice President of the Trust | | Since 2007 | | Vice President and Director of Portfolio Management of Parametric. Officer of 30 registered investment companies managed by EVM or BMR. | |
|
| David M. Stein 5/4/51 | | Vice President of the Trust | | Since 2007 | | Managing Director and Chief Investment Officer of Parametric. Officer of 30 registered investment companies managed by EVM or BMR. | |
|
| Mark S. Venezia 5/23/49 | | Vice President of the Trust | | Since 2007 | | Vice President of EVM and BMR. Officer of 35 registered investment companies managed by EVM or BMR. | |
|
| Adam A. Weigold 3/22/75 | | Vice President of the Trust | | Since 2007 | | Vice President of EVM and BMR. Officer of 70 registered investment companies managed by EVM or BMR. | |
|
| Kristin S. Anagnost 6/12/65 | | Treasurer of the Portfolio | | Since 2002 | | Vice President of EVM and BMR. Officer of 97 registered investment companies managed by EVM or BMR. | |
|
| Barbara E. Campbell 6/19/57 | | Treasurer of
the Trust | | Since 2005 | | Vice President of EVM and BMR. Officer of 176 registered investment companies managed by EVM or BMR. | |
|
| Maureen A. Gemma 5/24/60 | | Secretary | | Since 2007 | | Deputy Chief Legal Officer and Vice President of EVM and BMR. Officer of 176 registered investment companies managed by EVM or BMR. | |
|
| Paul M. O'Neil 7/11/53 | | Chief Compliance Officer | | Since 2004 | | Vice President of EVM and BMR. Officer of 176 registered investment companies managed by EVM or BMR. | |
|
(1) Includes both master and feeder funds in a master-feeder structure.
The SAI for the Funds includes additional information about the Trustees and officers of the Funds and the Portfolio and can be obtained without charge on Eaton Vance's website at www.eatonvance.com or by calling 1-800-225-6265.
31
This Page Intentionally Left Blank
Portfolio Investment Adviser
Boston Management and Research
The Eaton Vance Building
255 State Street
Boston, MA 02109
Fund Administrator
Eaton Vance Management
The Eaton Vance Building
255 State Street
Boston, MA 02109
Principal Underwriter
Eaton Vance Distributors, Inc.
The Eaton Vance Building
255 State Street
Boston, MA 02109
(617) 482-8260
Custodian
State Street Bank & Trust Company
200 Clarendon Street
Boston, MA 02116
Transfer Agent
PFPC Inc.
Attn: Eaton Vance Funds
P.O. Box 9653
Providence, RI 02940-9653
(800) 262-1122
Independent Registered Public Accounting Firm
Deloitte & Touche LLP
200 Berkeley Street
Boston, MA 02116-5022
Eaton Vance Mutual Funds Trust
The Eaton Vance Building
255 State Street
Boston, MA 02109
This report must be preceded or accompanied by a current prospectus. Before investing, investors should consider carefully a Fund's investment objective(s), risks, and charges and expenses. The Funds' current prospectus contains this and other information about the Funds and is available through your financial advisor. Please read the prospectus carefully before you invest or send money. For further information please call 1-800-225-6265.
131-12/07 MMSRC

Annual Report October 31, 2007


EATON VANCE
TAX-MANAGED
EQUITY ASSET
ALLOCATION
FUND
IMPORTANT NOTICES REGARDING PRIVACY,
DELIVERY OF SHAREHOLDER DOCUMENTS,
PORTFOLIO HOLDINGS AND PROXY VOTING
Privacy. The Eaton Vance organization is committed to ensuring your financial privacy. Each of the financial institutions identified below has in effect the following policy ("Privacy Policy") with respect to nonpublic personal information about its customers:
• Only such information received from you, through application forms or otherwise, and information about your Eaton Vance fund transactions will be collected. This may include information such as name, address, social security number, tax status, account balances and transactions.
• None of such information about you (or former customers) will be disclosed to anyone, except as permitted by law (which includes disclosure to employees necessary to service your account). In the normal course of servicing a customer's account, Eaton Vance may share information with unaffiliated third parties that perform various required services such as transfer agents, custodians and broker/dealers.
• Policies and procedures (including physical, electronic and procedural safeguards) are in place that are designed to protect the confidentiality of such information.
• We reserve the right to change our Privacy Policy at any time upon proper notification to you. Customers may want to review our Policy periodically for changes by accessing the link on our homepage: www.eatonvance.com.
Our pledge of privacy applies to the following entities within the Eaton Vance organization: the Eaton Vance Family of Funds, Eaton Vance Management, Eaton Vance Investment Counsel, Boston Management and Research, and Eaton Vance Distributors, Inc.
In addition, our Privacy Policy only applies to those Eaton Vance customers who are individuals and who have a direct relationship with us. If a customer's account (i.e., fund shares) is held in the name of a third-party financial adviser/ broker-dealer, it is likely that only such adviser's privacy policies apply to the customer. This notice supersedes all previously issued privacy disclosures.
For more information about Eaton Vance's Privacy Policy, please call 1-800-262-1122.
Delivery of Shareholder Documents. The Securities and Exchange Commission (the "SEC") permits funds to deliver only one copy of shareholder documents, including prospectuses, proxy statements and shareholder reports, to fund investors with multiple accounts at the same residential or post office box address. This practice is often called "householding" and it helps eliminate duplicate mailings to shareholders.
Eaton Vance, or your financial adviser, may household the mailing of your documents indefinitely unless you instruct Eaton Vance, or your financial adviser, otherwise.
If you would prefer that your Eaton Vance documents not be householded, please contact Eaton Vance at 1-800-262-1122, or contact your financial adviser.
Your instructions that householding not apply to delivery of your Eaton Vance documents will be effective within 30 days of receipt by Eaton Vance or your financial adviser.
Portfolio Holdings. Each Eaton Vance Fund and its underlying Portfolio (if applicable) will file a schedule of its portfolio holdings on Form N-Q with the SEC for the first and third quarters of each fiscal year. The Form N-Q will be available on the Eaton Vance website www.eatonvance.com, by calling Eaton Vance at 1-800-262-1122 or in the EDGAR database on the SEC's website at www.sec.gov. Form N-Q may also be reviewed and copied at the SEC's public reference room in Washington, D.C. (call 1-800-732-0330 for information on the operation of the public reference room).
Proxy Voting. From time to time, funds are required to vote proxies related to the securities held by the funds. The Eaton Vance Funds or their underlying Portfolios (if applicable) vote proxies according to a set of policies and procedures approved by the Funds' and Portfolios' Boards. You may obtain a description of these policies and procedures and information on how the Funds or Portfolios voted proxies relating to portfolio securities during the most recent 12 month period ended June 30, without charge, upon request, by calling 1-800-262-1122. This description is also available on the SEC's website at www.sec.gov.
Eaton Vance Tax-Managed Equity Asset Allocation Fund as of October 31, 2007
MANAGEMENT’S DISCUSSION OF FUND PERFORMANCE

Duncan W. Richardson, CFA
Portfolio Manager
The Fund
Performance for the Past Year
· | | For the year ended October 31, 2007, the Fund’s Class A shares had a total return of 23.71%. This return was the result of an increase in net asset value (NAV) per share to $16.90 on October 31, 2007, from $14.04 on October 31, 2006, and the distribution of $0.396 per share in capital gains.(1) |
| | |
· | | The Fund’s Class B shares had a total return of 22.89% for the same period, the result of an increase in NAV per share to $16.21 from $13.57, and the distribution of $0.396 per share in capital gains.(1) |
| | |
· | | The Fund’s Class C shares had a total return of 22.85% for the same period, the result of an increase in NAV per share to $16.18 from $13.55, and the distribution of $0.396 per share in capital gains.(1) |
| | |
· | | For comparison, the Russell 3000 Index, a broadbased, unmanaged index of the 3,000 largest U.S. companies, which represents approximately 98% of the investable U.S. equity market, had a total return of 14.53% during the same period. The average return of funds in the Fund’s peer group, the Lipper Multi-Cap Core Funds Classification, was 16.05%.(2) |
| | |
| | See pages 3 and 4 for more performance information, including after-tax returns. |
Management Discussion
· | | Major equity market indices posted strong returns for the year ended October 31, 2007, despite an increase in volatility to its highest level in nearly four years. Corporate earnings growth proved better than expected, and merger and buyout activity continued at a robust clip, fueling the equity markets. Later in the summer, however, a sub-prime mortgage crisis, coupled with rising food and commodity prices, led to investor fears of both a slowing economy and rising inflation. The Federal Reserve addressed the issues by lowering interest rates, which provided a boost to the equity markets. On average during the course of the year ended October 31, 2007, largecapitalization stocks generally outperformed smalland mid-cap stocks, and growth style investments remained ahead of their value counterparts. |
| | |
· | | In this environment, the Fund outperformed its benchmark, the Russell 3000 Index and its Lipper Multi-Cap Core Funds peer group for the year ended October 31, 2007.(2) The Fund’s performance is a function of the performance of the underlying Portfolios in which it invests, as well as its allocation among these Portfolios. During the year ended October 31, 2007, no changes to the target allocations were made by management.(3) |
| | |
· | | The Fund benefited from its continued emphasis of small- and mid-cap securities through the Tax-Managed Small- and Mid-Cap Portfolios, as well as a sizeable exposure to international securities, which on average outpaced domestic investments, through Tax-Managed International Equity Portfolio. The Fund also retained its emphasis of growth stocks over their value counterparts by emphasizing growth Portfolios. At the end of the period, management continued to be constructive on equities and believed that the market had valuation support of high-quality earnings. A low interest rate environment and slowing economic growth expectations provided a favorable backdrop for U.S. equities, particularly large-capitalization growth stocks, during the year.(3) |
Past performance is no guarantee of future results. Returns are historical and are calculated by determining the percentage change in net asset value or offering price (as applicable) with all distributions reinvested. Investment return and principal value will fluctuate so that shares, when redeemed, may be worth more or less than their original cost. Performance is for stated time period only; due to market volatility, the Fund’s current performance may be lower or higher than the quoted return. Fund performance during certain periods reflects the strong stock market performance and/or the strong performance of stocks held during those periods. This performance is not typical and may not be repeated. For performance as of the most recent month end, please refer to www.eatonvance.com.
(1) | | These returns do not include the 5.75% maximum sales charge for Class A shares or the applicable contingent deferred sales charge (CDSC) for Class B and Class C shares. If sales charges were deducted, the returns would be lower. |
| | |
(2) | | It is not possible to invest directly in an Index or a Lipper Classification. The Index’s total return does not reflect commissions or expenses that would have been incurred if an investor individually purchased or sold the securities represented in the Index. The Lipper Average is the average total return, at net asset value, of the funds that are in the same Lipper Classification as the Fund. |
| | |
(3) | | Asset allocation may not be representative of the Fund’s current or future investments and may change due to active management. |
Fund shares are not insured by the FDIC and are not deposits or other obligations of, or guaranteed by, any depository institution. Shares are subject to investment risks, including possible loss of principal invested.
1
· | | Continued market volatility is likely, which could potentially work to the Fund’s advantage. Because of the Fund’s multi-asset exposure, its volatility over the past five years has been lower than that of the benchmark Russell 3000 Index.(1) In allocating the Fund’s assets among Eaton Vance Tax-Managed Portfolios, managment continues to seek to maintain broad diversification and emphasize market sectors that Eaton Vance believes offer relatively attractive riskadjusted return prospects based on its assessment of current and future market trends and conditions.(2) |
| | |
· | | In closing, I would like to thank my fellow shareholders for their continued confidence and participation in the Eaton Vance Tax-Managed Equity Asset Allocation Fund. |
(1) | | It is not possible to invest directly in an Index. The Index’s total return does not reflect commissions or expenses that would have been incurred if an investor individually purchased or sold the securities represented in the Index. |
| | |
(2) | | Asset allocation may not be representative of the Fund’s current or future investments and may change due to active management. |
Current Allocations* By total net assets
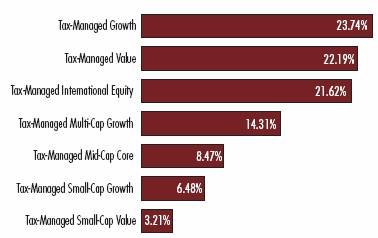
* | | As a percentage of the Fund’s net assets as of October 31, 2007. Fund information may not be representative of the Fund’s current or future investments and may change due to active management. You may obtain free copies of each of the Portfolios’ most recent financial statements by contacting Eaton Vance Distributors, Inc. at 1-800-836- 2414 or from the EDGAR database on the Securities and Exchange Commission’s website (www.sec.gov). |
The views expressed throughout this report are those of the portfolio manager and are current only through the end of the period of the report as stated on the cover. These views are subject to change at any time based upon market or other conditions, and the investment adviser disclaims any responsibility to update such views. These views may not be relied on as investment advice and, because investment decisions for a fund are based on many factors, may not be relied on as an indication of trading intent on behalf of any Eaton Vance fund.
2
Eaton Vance Tax-Managed Equity Asset Allocation Fund as of October 31, 2007
FUND PERFORMANCE
The line graphs and table set forth below provide information about the Fund’s performance. The line graphs compare the performance of Class A, Class B, and Class C of the Fund with that of the Russell 3000 Index, a broad-based, unmanaged index of the 3,000 largest U.S. companies, which represents approximately 98% of the investable U.S. equity market. The lines on the graphs represent the total returns of a hypothetical investment of $10,000 in each of Class A, Class B, and Class C and the Russell 3000 Index. Class A total returns are presented at net asset value and maximum public offering price. The table includes the total returns of each Class of the Fund at net asset value and public offering price. The performance presented below does not reflect the deduction of taxes, if any, that a shareholder would pay on distributions or redemptions of Fund shares.
Performance(1) | | Class A | | Class B | | Class C | |
Symbol | | EAEAX | | EBEAX | | ECEAX | |
| | | | | | | |
Average Annual Total Returns (at net asset value) | | | | | | | |
One Year | | 23.71 | % | 22.89 | % | 22.85 | % |
Five Years | | 16.79 | | 15.92 | | 15.94 | |
Life of Fund† | | 10.73 | | 9.95 | | 9.91 | |
| | | | | | | |
SEC Average Annual Total Returns (including sales charge or applicable CDSC) | | | | | | |
One Year | | 16.57 | | 17.89 | | 21.85 | |
Five Years | | 15.42 | | 15.70 | | 15.94 | |
Life of Fund† | | 9.57 | | 9.83 | | 9.91 | |
† | | Inception Dates – Class A: 3/4/02; Class B: 3/4/02; Class C: 3/4/02 |
| | |
(1) | | Average annual total returns do not include the 5.75% maximum sales charge for Class A shares or the applicable contingent deferred sales charge (CDSC) for Class B and Class C shares. If sales charges were deducted, the returns would be lower. SEC average annual total returns for Class A reflect the maximum 5.75% sales charge. SEC returns for Class B shares reflect the applicable CDSC based on the following schedule: 5% - 1st and 2nd years; 4% - 3rd year; 3% - 4th year; 2% - 5th year; 1% - 6th year. SEC returns for Class C reflect a 1% CDSC for the first year. Absent an allocation of certain expenses to the administrator, the returns for certain periods would be lower |
Total Annual | | | | | | | |
Operating Expenses(2) | | Class A | | Class B | | Class C | |
Expense Ratio | | 1.40 | % | 2.15 | % | 2.15 | % |
(2) From the Fund’s prospectus dated 3/1/07.
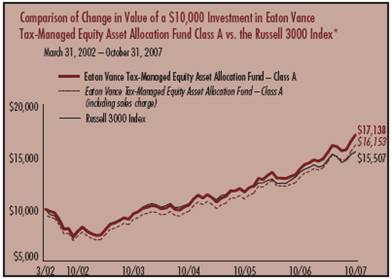
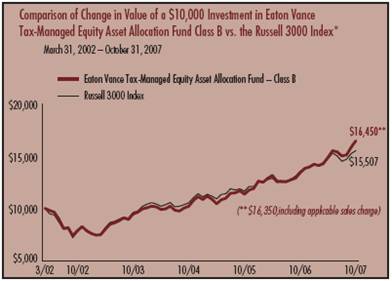
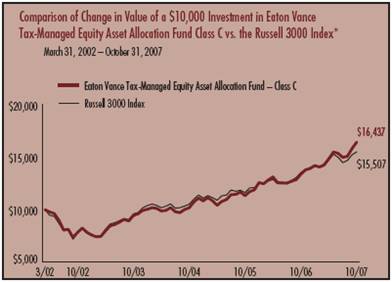
* | | Source: Thomson Financial. Investment operations commenced on 3/4/02. It is not possible to invest directly in an Index. The Index’s total returns do not reflect commissions or expenses that would have been incurred if an investor individually purchased or sold the securities represented in the Index. |
Past performance is no guarantee of future results. Returns are historical and are calculated by determining the percentage change in net asset value or offering price (as applicable) with all distributions reinvested. Investment return and principal value will fluctuate so that shares, when redeemed, may be worth more or less than their original cost. Performance is for stated time period only; due to market volatility, the Fund’s current performance may be lower or higher than the quoted return. Fund performance during certain periods reflects the strong stock market performance and/or the strong performance of stocks held during those periods. This performance is not typical and may not be repeated. For performance as of the most recent month end, please refer to www.eatonvance.com.
3
“Return Before Taxes” does not take into consideration shareholder taxes. It is most relevant to tax-free or tax-deferred shareholder accounts. “Return After Taxes on Distributions” reflects the impact of federal income taxes due on Fund distributions of dividends and capital gains. It is most relevant to taxpaying shareholders who continue to hold their shares. “Return After Taxes on Distributions and Sale of Fund Shares” also reflects the impact of taxes on capital gain or loss realized upon a sale of shares. It is most relevant to taxpaying shareholders who sell their shares.
Average Annual Total Returns
(For the periods ended October 31, 2007)
Returns at Net Asset Value (NAV) (Class A)
| | One Year | | Five Years | | Life of Fund | |
Return Before Taxes | | 23.71 | % | 16.79 | % | 10.73 | % |
Return After Taxes on Distributions | | 23.21 | | 16.61 | | 10.57 | |
Return After Taxes on Distributions and Sale of Fund Shares | | 15.92 | | 14.79 | | 9.36 | |
Returns at Public Offering Price (POP) (Class A)
| | One Year | | Five Years | | Life of Fund | |
Return Before Taxes | | 16.57 | % | 15.42 | % | 9.57 | % |
Return After Taxes on Distributions | | 16.10 | | 15.24 | | 9.42 | |
Return After Taxes on Distributions and Sale of Fund Shares | | 11.25 | | 13.54 | | 8.33 | |
Average Annual Total Returns
(For the periods ended October 31, 2007)
Returns at Net Asset Value (NAV) (Class B)
| | One Year | | Five Years | | Life of Fund | |
Return Before Taxes | | 22.89 | % | 15.92 | % | 9.95 | % |
Return After Taxes on Distributions | | 22.37 | | 15.74 | | 9.79 | |
Return After Taxes on Distributions and Sale of Fund Shares | | 15.41 | | 13.99 | | 8.66 | |
Returns at Public Offering Price (POP) (Class B)
| | One Year | | Five Years | | Life of Fund | |
Return Before Taxes | | 17.89 | % | 15.70 | % | 9.83 | % |
Return After Taxes on Distributions | | 17.37 | | 15.51 | | 9.68 | |
Return After Taxes on Distributions and Sale of Fund Shares | | 12.16 | | 13.79 | | 8.56 | |
Average Annual Total Returns
(For the periods ended October 31, 2007)
Returns at Net Asset Value (NAV) (Class C)
| | One Year | | Five Years | | Life of Fund | |
Return Before Taxes | | 22.85 | % | 15.94 | % | 9.91 | % |
Return After Taxes on Distributions | | 22.33 | | 15.75 | | 9.76 | |
Return After Taxes on Distributions and Sale of Fund Shares | | 15.38 | | 14.01 | | 8.63 | |
Returns at Public Offering Price (POP) (Class C)
| | One Year | | Five Years | | Life of Fund | |
Return Before Taxes | | 21.85 | % | 15.94 | % | 9.91 | % |
Return After Taxes on Distributions | | 21.33 | | 15.75 | | 9.76 | |
Return After Taxes on Distributions and Sale of Fund Shares | | 14.73 | | 14.01 | | 8.63 | |
Class A, Class B, and Class C of the Fund commenced investment operations on 3/4/02. Returns at Public Offering Price (POP) reflect the deduction of the maximum initial sales charge or applicable CDSC, while Returns at Net Asset Value (NAV) do not. Absent an allocation of certain expenses to the administrator, the returns for certain periods would be lower.
After-tax returns are calculated using certain assumptions. After-tax returns are calculated using the highest historical individual federal income tax rates and do not reflect the impact of state and local taxes. Actual after-tax returns depend on a shareholder’s tax situation and the actual characterization of distributions and may differ from those shown. After-tax returns are not relevant to shareholders who hold shares in tax-deferred accounts or to shares held by non-taxable entities. Return After Taxes on Distributions for a period may be the same as Return Before Taxes for the same period because no taxable distributions were made during that period. Return After Taxes on Distributions and Sale of Fund Shares for a period may be greater than or equal to Return After Taxes on Distributions for the same period because of losses realized on the sale of Fund shares.
Past performance is no guarantee of future results. Returns are historical and are calculated by determining the percentage change in net asset value or offering price (as applicable) with all distributions reinvested. Investment return and principal value will fluctuate so that shares, when redeemed, may be worth more or less than their original cost. Performance is for the stated time period only; due to market volatility, the Fund’s current performance may be lower or higher than the quoted return. Fund performance during certain periods reflects the strong stock market performance and/or the strong performance of stocks held during those periods. This performance is not typical and may not be repeated. For performance as of the most recent month end, please refer to www.eatonvance.com.
4
Eaton Vance Tax-Managed Equity Asset Allocation Fund as of October 31, 2007
FUND EXPENSES
Example: As a shareholder of the Fund, you incur two types of costs: (1) transaction costs, including sales charges (loads) on purchases and redemption fees (if applicable); and (2) ongoing costs, including management fees; distribution or service fees; and other Fund expenses. This Example is intended to help you understand your ongoing costs (in dollars) of investing in the Fund and to compare these costs with the ongoing costs of investing in other mutual funds. The Example is based on an investment of $1,000 invested at the beginning of the period and held for the entire period (May 1, 2007 – October 31, 2007).
Actual Expenses: The first section of the table below provides information about actual account values and actual expenses. You may use the information in this section, together with the amount you invested, to estimate the expenses that you paid over the period. Simply divide your account value by $1,000 (for example, an $8,600 account value divided by $1,000 = 8.6), then multiply the result by the number in the first section under the heading entitled "Expenses Paid During Period" to estimate the expenses you paid on your account during this period.
Hypothetical Example for Comparison Purposes: The second section of the table below provides information about hypothetical account values and hypothetical expenses based on the actual Fund expense ratio and an assumed rate of return of 5% per year (before expenses), which is not the actual return of the Fund. The hypothetical account values and expenses may not be used to estimate the actual ending account balance or expenses you paid for the period. You may use this information to compare the ongoing costs of investing in your Fund and other funds. To do so, compare this 5% hypothetical example with the 5% hypothetical examples that appear in the shareholder reports of the other funds.
Please note that the expenses shown in the table are meant to highlight your ongoing costs only and do not reflect any transactional costs, such as sales charges (loads) or redemption fees (if applicable). Therefore, the second section of the table is useful in comparing ongoing costs only, and will not help you determine the relative total costs of owning different funds. In addition, if these transactional costs were included, your costs would have been higher.
Eaton Vance Tax-Managed Equity Asset Allocation Fund
| | | Beginning Account Value
(5/1/07) | | Ending Account Value
(10/31/07) | | Expenses Paid During Period*
(5/1/07 – 10/31/07) | |
| Actual | |
| Class A | | $ | 1,000.00 | | | $ | 1,110.40 | | | $ | 7.13 | | |
| Class B | | $ | 1,000.00 | | | $ | 1,106.50 | | | $ | 11.10 | | |
| Class C | | $ | 1,000.00 | | | $ | 1,106.70 | | | $ | 11.10 | | |
| Hypothetical | |
| (5% return per year before expenses) | |
| Class A | | $ | 1,000.00 | | | $ | 1,018.50 | | | $ | 6.82 | | |
| Class B | | $ | 1,000.00 | | | $ | 1,014.70 | | | $ | 10.61 | | |
| Class C | | $ | 1,000.00 | | | $ | 1,014.70 | | | $ | 10.61 | | |
* Expenses are equal to the Fund's annualized expense ratio of 1.34% for Class A shares, 2.09% for Class B shares, and 2.09% for Class C shares multiplied by the average account value over the period multiplied by 184/365 (to reflect the one-half year period). The Example assumes that the $1,000 was invested at the net asset value per share determined at the close of business on April 30, 2007. The Example reflects the expenses of both the Fund and the Portfolios.
5
Eaton Vance Tax-Managed Equity Asset Allocation Fund as of October 31, 2007
FINANCIAL STATEMENTS
Statement of Assets and Liabilities
As of October 31, 2007
| Assets | |
Investment in Tax-Managed Growth Portfolio, at value
(identified cost, $178,408,031) | | $ | 199,151,543 | | |
Investment in Tax-Managed Value Portfolio, at value
(identified cost, $125,560,769) | | | 186,162,813 | | |
Investment in Tax-Managed International Equity Portfolio, at value
(identified cost, $105,177,207) | | | 181,385,119 | | |
Investment in Tax-Managed Multi-Cap Growth Portfolio, at value
(identified cost, $81,781,387) | | | 120,058,060 | | |
Investment in Tax-Managed Mid-Cap Core Portfolio, at value
(identified cost, $51,123,762) | | | 71,055,636 | | |
Investment in Tax-Managed Small-Cap Growth Portfolio, at value
(identified cost, $42,047,151) | | | 54,364,355 | | |
Investment in Tax-Managed Small-Cap Value Portfolio, at value
(identified cost, $18,841,458) | | | 26,911,164 | | |
| Receivable for Fund shares sold | | | 1,255,384 | | |
| Total assets | | $ | 840,344,074 | | |
| Liabilities | |
| Payable for Fund shares redeemed | | $ | 559,320 | | |
| Payable to affiliate for distribution and service fees | | | 462,138 | | |
| Payable to affiliate for administration fee | | | 104,157 | | |
| Payable to affiliate for investment adviser fee | | | 70,300 | | |
| Payable to affiliate for Trustees' fees | | | 199 | | |
| Other accrued expenses | | | 205,545 | | |
| Total liabilities | | $ | 1,401,659 | | |
| Net Assets | | $ | 838,942,415 | | |
| Sources of Net Assets | |
| Paid-in capital | | $ | 543,665,296 | | |
Accumulated undistributed net realized gain from Portfolios (computed on
the basis of identified cost) | | | 56,355,655 | | |
| Accumulated undistributed net investment income | | | 2,772,539 | | |
Net unrealized appreciation from Portfolios (computed on the basis of
identified cost) | | | 236,148,925 | | |
| Total | | $ | 838,942,415 | | |
| Class A Shares | |
| Net Assets | | $ | 374,979,495 | | |
| Shares Outstanding | | | 22,186,397 | | |
Net Asset Value and Redemption Price Per Share
(net assets ÷ shares of beneficial interest outstanding) | | $ | 16.90 | | |
Maximum Offering Price Per Share
(100 ÷ 94.25 of $16.90) | | $ | 17.93 | | |
| Class B Shares | |
| Net Assets | | $ | 154,094,321 | | |
| Shares Outstanding | | | 9,507,389 | | |
Net Asset Value and Offering Price Per Share*
(net assets ÷ shares of beneficial interest outstanding) | | $ | 16.21 | | |
| Class C Shares | |
| Net Assets | | $ | 309,868,599 | | |
| Shares Outstanding | | | 19,153,993 | | |
Net Asset Value and Offering Price Per Share*
(net assets ÷ shares of beneficial interest outstanding) | | $ | 16.18 | | |
| On sales of $50,000 or more, the offering price of Class A shares is reduced. | |
* Redemption price per share is equal to the net asset value less any applicable contingent deferred sales charge.
Statement of Operations
For the Year Ended
October 31, 2007
| Investment Income | |
| Dividends allocated from Portfolios (net of foreign taxes, $478,063) | | $ | 15,351,302 | | |
| Interest allocated from Portfolios | | | 838,441 | | |
| Security lending income allocated from Portfolios, net | | | 152,916 | | |
| Expenses allocated from Portfolios | | | (5,352,086 | ) | |
| Net investment income from Portfolios | | $ | 10,990,573 | | |
| Expenses | |
| Investment adviser fee | | $ | 663,023 | | |
| Administration fee | | | 1,059,648 | | |
| Trustees' fees and expenses | | | 3,532 | | |
Distribution and service fees
Class A | | | 758,925 | | |
| Class B | | | 1,461,521 | | |
| Class C | | | 2,567,101 | | |
| Transfer and dividend disbursing agent fees | | | 457,792 | | |
| Legal and accounting services | | | 92,361 | | |
| Registration fees | | | 63,650 | | |
| Custodian fee | | | 63,300 | | |
| Printing and postage | | | 54,386 | | |
| Miscellaneous | | | 7,201 | | |
| Total expenses | | $ | 7,252,440 | | |
| Net investment income | | $ | 3,738,133 | | |
Realized and Unrealized
Gain (Loss) from Portfolios | |
Net realized gain (loss) —
Investment transactions (identified cost basis) | | $ | 57,917,051 | | |
| Foreign currency transactions | | | (103,943 | ) | |
| Net realized gain | | $ | 57,813,108 | | |
Change in unrealized appreciation (depreciation) —
Investments (identified cost basis) | | $ | 87,699,385 | | |
| Securities sold short | | | (187,459 | ) | |
| Foreign currency | | | 36,788 | | |
| Net change in unrealized appreciation (depreciation) | | $ | 87,548,714 | | |
| Net realized and unrealized gain | | $ | 145,361,822 | | |
| Net increase in net assets from operations | | $ | 149,099,955 | | |
See notes to financial statements
6
Eaton Vance Tax-Managed Equity Asset Allocation Fund as of October 31, 2007
FINANCIAL STATEMENTS CONT'D
Statements of Changes in Net Assets
Increase (Decrease)
in Net Assets | | Year Ended
October 31, 2007 | | Year Ended
October 31, 2006 | |
From operations —
Net investment income (loss) | | $ | 3,738,133 | | | $ | (227,178 | ) | |
Net realized gain from investment
transactions, securities sold short
and foreign currency transactions | | | 57,813,108 | | | | 21,153,200 | | |
Net change in unrealized
appreciation (depreciation) of
investments, securities sold short and
foreign currency | | | 87,548,714 | | | | 66,085,645 | | |
| Net increase in net assets from operations | | $ | 149,099,955 | | | $ | 87,011,667 | | |
Distributions to shareholders —
From net realized gain | |
| Class A | | $ | (7,086,640 | ) | | $ | (4,516,935 | ) | |
| Class B | | | (4,036,376 | ) | | | (3,269,325 | ) | |
| Class C | | | (6,336,074 | ) | | | (4,277,799 | ) | |
| Total distributions to shareholders | | $ | (17,459,090 | ) | | $ | (12,064,059 | ) | |
Transactions in shares of beneficial interest —
Proceeds from sale of shares
Class A | | $ | 95,276,815 | | | $ | 65,245,218 | | |
| Class B | | | 12,224,925 | | | | 17,625,159 | | |
| Class C | | | 70,320,557 | | | | 49,334,856 | | |
Net asset value of shares issued to
shareholders in payment of
distributions declared
Class A | | | 6,172,624 | | | | 3,962,987 | | |
| Class B | | | 3,493,464 | | | | 2,809,766 | | |
| Class C | | | 4,981,960 | | | | 3,313,882 | | |
Cost of shares redeemed
Class A | | | (42,028,282 | ) | | | (28,203,263 | ) | |
| Class B | | | (17,824,069 | ) | | | (16,417,077 | ) | |
| Class C | | | (26,620,838 | ) | | | (22,588,349 | ) | |
Net asset value of shares exchanged
Class A | | | 9,473,074 | | | | 6,419,182 | | |
| Class B | | | (9,473,074 | ) | | | (6,419,182 | ) | |
Net increase in net assets from
Fund share transactions | | $ | 105,997,156 | | | $ | 75,083,179 | | |
| Net increase in net assets | | $ | 237,638,021 | | | $ | 150,030,787 | | |
| Net Assets | |
| At beginning of year | | $ | 601,304,394 | | | $ | 451,273,607 | | |
| At end of year | | $ | 838,942,415 | | | $ | 601,304,394 | | |
Accumulated undistributed
net investment income
included in net assets | |
| At end of year | | $ | 2,772,539 | | | $ | 1,867,897 | | |
See notes to financial statements
7
Eaton Vance Tax-Managed Equity Asset Allocation Fund as of October 31, 2007
FINANCIAL STATEMENTS CONT'D
Financial Highlights
| | | Class A | |
| | | Year Ended October 31, | |
| | | 2007 | | 2006 | | 2005 | | 2004 | | 2003 | |
| Net asset value — Beginning of year | | $ | 14.040 | | | $ | 12.100 | | | $ | 10.790 | | | $ | 9.930 | | | $ | 8.190 | | |
| Income (loss) from operations | |
| Net investment income (loss)(1) | | $ | 0.146 | (2) | | $ | 0.053 | | | $ | 0.018 | | | $ | 0.002 | | | $ | (0.012 | ) | |
| Net realized and unrealized gain | | | 3.110 | | | | 2.201 | | | | 1.292 | | | | 0.858 | | | | 1.752 | | |
| Total income from operations | | $ | 3.256 | | | $ | 2.254 | | | $ | 1.310 | | | $ | 0.860 | | | $ | 1.740 | | |
| Less Distributions | |
| From net realized gain | | $ | (0.396 | ) | | $ | (0.314 | ) | | $ | — | | | $ | — | | | $ | — | | |
| Total distributions | | $ | (0.396 | ) | | $ | (0.314 | ) | | $ | — | | | $ | — | | | $ | — | | |
| Net asset value — End of year | | $ | 16.900 | | | $ | 14.040 | | | $ | 12.100 | | | $ | 10.790 | | | $ | 9.930 | | |
| Total Return(3) | | | 23.71 | % | | | 18.96 | % | | | 12.14 | % | | | 8.66 | %(4) | | | 21.25 | % | |
| Ratios/Supplemental Data | |
| Net assets, end of year (000's omitted) | | $ | 374,979 | | | $ | 247,710 | | | $ | 169,704 | | | $ | 134,070 | | | $ | 82,868 | | |
| Ratios (As a percentage of average daily net assets): | | | | | | | | | | | | | | | | | | | | | |
| Expenses(5)(6) | | | 1.35 | % | | | 1.40 | % | | | 1.43 | % | | | 1.46 | % | | | 1.52 | % | |
| Net investment income (loss) | | | 0.96 | % | | | 0.41 | % | | | 0.15 | % | | | 0.02 | % | | | (0.14 | )% | |
| Portfolio Turnover of the Tax-Managed Growth Portfolio | | | 2 | % | | | 1 | % | | | 1 | % | | | 4 | % | | | 19 | % | |
| Portfolio Turnover of the Tax-Managed Value Portfolio | | | 14 | % | | | 26 | % | | | 40 | % | | | 44 | % | | | 76 | % | |
| Portfolio Turnover of the Tax-Managed International Equity Portfolio | | | 23 | % | | | 25 | % | | | 39 | % | | | 62 | % | | | 100 | % | |
| Portfolio Turnover of the Tax-Managed Multi-Cap Growth Portfolio | | | 157 | % | | | 181 | % | | | 217 | % | | | 239 | % | | | 224 | % | |
| Portfolio Turnover of the Tax-Managed Mid-Cap Core Portfolio | | | 38 | % | | | 55 | % | | | 53 | % | | | 42 | % | | | 50 | % | |
| Portfolio Turnover of the Tax-Managed Small-Cap Growth Portfolio | | | 78 | % | | | 99 | % | | | 223 | % | | | 282 | % | | | 248 | % | |
| Portfolio Turnover of the Tax-Managed Small-Cap Value Portfolio | | | 80 | % | | | 49 | % | | | 24 | % | | | 12 | % | | | 21 | % | |
(1) Net investment income (loss) per share was computed using average shares outstanding.
(2) Net investment income per share reflects a dividend resulting from a corporate action allocated from the Tax-Managed International Equity Portfolio which amounted $0.029 per share. Excluding this dividend, the ratio of net investment income to average daily net assets would have been 0.77%.
(3) Returns are historical and are calculated by determining the percentage change in net asset value with all distributions reinvested.
(4) The effect of the net increase from payments by affiliate and net gains (losses) realized through the Fund's investment in Tax-Managed Small-Cap Growth Portfolio (the Portfolio) on the disposal of investments purchased which did not meet the Portfolio's investment guidelines amounted to less than $0.01 per share and had no effect on total return for the year ended October 31, 2004.
(5) Includes the Fund's share of the Portfolios' allocated expenses.
(6) The investment adviser waived a portion of its investment adviser fee and/or the administrator subsidized certain operating expenses (equal to 0.01% and 0.01% for 2005 and 2004, respectively).
See notes to financial statements
8
Eaton Vance Tax-Managed Equity Asset Allocation Fund as of October 31, 2007
FINANCIAL STATEMENTS CONT'D
Financial Highlights
| | | Class B | |
| | | Year Ended October 31, | |
| | | 2007 | | 2006 | | 2005 | | 2004 | | 2003 | |
| Net asset value — Beginning of year | | $ | 13.570 | | | $ | 11.800 | | | $ | 10.600 | | | $ | 9.830 | | | $ | 8.170 | | |
| Income (loss) from operations | |
| Net investment income (loss)(1) | | $ | 0.029 | (2) | | $ | (0.042 | ) | | $ | (0.068 | ) | | $ | (0.076 | ) | | $ | (0.077 | ) | |
| Net realized and unrealized gain | | | 3.007 | | | | 2.126 | | | | 1.268 | | | | 0.846 | | | | 1.737 | | |
| Total income from operations | | $ | 3.036 | | | $ | 2.084 | | | $ | 1.200 | | | $ | 0.770 | | | $ | 1.660 | | |
| Less Distributions | |
| From net realized gain | | $ | (0.396 | ) | | $ | (0.314 | ) | | $ | — | | | $ | — | | | $ | — | | |
| Total distributions | | $ | (0.396 | ) | | $ | (0.314 | ) | | $ | — | | | $ | — | | | $ | — | | |
| Net asset value — End of year | | $ | 16.210 | | | $ | 13.570 | | | $ | 11.800 | | | $ | 10.600 | | | $ | 9.830 | | |
| Total Return(3) | | | 22.89 | % | | | 17.98 | % | | | 11.32 | % | | | 7.83 | %(4) | | | 20.32 | % | |
| Ratios/Supplemental Data | |
| Net assets, end of year (000's omitted) | | $ | 154,094 | | | $ | 139,586 | | | $ | 123,431 | | | $ | 109,471 | | | $ | 79,854 | | |
| Ratios (As a percentage of average daily net assets): | | | | | | | | | | | | | | | | | | | | | |
| Expenses(5)(6) | | | 2.10 | % | | | 2.15 | % | | | 2.18 | % | | | 2.21 | % | | | 2.27 | % | |
| Net investment income (loss) | | | 0.20 | % | | | (0.33 | )% | | | (0.59 | )% | | | (0.73 | )% | | | (0.88 | )% | |
| Portfolio Turnover of the Tax-Managed Growth Portfolio | | | 2 | % | | | 1 | % | | | 1 | % | | | 4 | % | | | 19 | % | |
| Portfolio Turnover of the Tax-Managed Value Portfolio | | | 14 | % | | | 26 | % | | | 40 | % | | | 44 | % | | | 76 | % | |
| Portfolio Turnover of the Tax-Managed International Equity Portfolio | | | 23 | % | | | 25 | % | | | 39 | % | | | 62 | % | | | 100 | % | |
| Portfolio Turnover of the Tax-Managed Multi-Cap Growth Portfolio | | | 157 | % | | | 181 | % | | | 217 | % | | | 239 | % | | | 224 | % | |
| Portfolio Turnover of the Tax-Managed Mid-Cap Core Portfolio | | | 38 | % | | | 55 | % | | | 53 | % | | | 42 | % | | | 50 | % | |
| Portfolio Turnover of the Tax-Managed Small-Cap Growth Portfolio | | | 78 | % | | | 99 | % | | | 223 | % | | | 282 | % | | | 248 | % | |
| Portfolio Turnover of the Tax-Managed Small-Cap Value Portfolio | | | 80 | % | | | 49 | % | | | 24 | % | | | 12 | % | | | 21 | % | |
(1) Net investment income (loss) per share was computed using average shares outstanding.
(2) Net investment income per share reflects a dividend resulting from a corporate action allocated from the Tax-Managed International Equity Portfolio which amounted $0.028 per share. Excluding this dividend, the ratio of net investment income to average daily net assets would have been 0.01%.
(3) Returns are historical and are calculated by determining the percentage change in net asset value with all distributions reinvested.
(4) The effect of the net increase from payments by affiliate and net gains (losses) realized through the Fund's investment in Tax-Managed Small-Cap Growth Portfolio (the Portfolio) on the disposal of investments purchased which did not meet the Portfolio's investment guidelines amounted to less than $0.01 per share and had no effect on total return for the year ended October 31, 2004.
(5) Includes the Fund's share of the Portfolios' allocated expenses.
(6) The investment adviser waived a portion of its investment adviser fee and/or the administrator subsidized certain operating expenses (equal to 0.01% and 0.01% for 2005 and 2004, respectively).
See notes to financial statements
9
Eaton Vance Tax-Managed Equity Asset Allocation Fund as of October 31, 2007
FINANCIAL STATEMENTS CONT'D
Financial Highlights
| | | Class C | |
| | | Year Ended October 31, | |
| | | 2007 | | 2006 | | 2005 | | 2004 | | 2003 | |
| Net asset value — Beginning of year | | $ | 13.550 | | | $ | 11.780 | | | $ | 10.580 | | | $ | 9.810 | | | $ | 8.150 | | |
| Income (loss) from operations | |
| Net investment income (loss)(1) | | $ | 0.031 | (2) | | $ | (0.043 | ) | | $ | (0.068 | ) | | $ | (0.076 | ) | | $ | (0.076 | ) | |
| Net realized and unrealized gain | | | 2.995 | | | | 2.127 | | | | 1.268 | | | | 0.846 | | | | 1.736 | | |
| Total income from operations | | $ | 3.026 | | | $ | 2.084 | | | $ | 1.200 | | | $ | 0.770 | | | $ | 1.660 | | |
| Less Distributions | |
| From net realized gain | | $ | (0.396 | ) | | $ | (0.314 | ) | | $ | — | | | $ | — | | | $ | — | | |
| Total distributions | | $ | (0.396 | ) | | $ | (0.314 | ) | | $ | — | | | $ | — | | | $ | — | | |
| Net asset value — End of year | | $ | 16.180 | | | $ | 13.550 | | | $ | 11.780 | | | $ | 10.580 | | | $ | 9.810 | | |
| Total Return(3) | | | 22.85 | % | | | 18.01 | % | | | 11.34 | % | | | 7.85 | %(4) | | | 20.37 | % | |
| Ratios/Supplemental Data | |
| Net assets, end of year (000's omitted) | | $ | 309,869 | | | $ | 214,009 | | | $ | 158,138 | | | $ | 124,779 | | | $ | 85,040 | | |
| Ratios (As a percentage of average daily net assets): | | | | | | | | | | | | | | | | | | | | | |
| Expenses(5)(6) | | | 2.10 | % | | | 2.15 | % | | | 2.18 | % | | | 2.21 | % | | | 2.27 | % | |
| Net investment income (loss) | | | 0.21 | % | | | (0.34 | )% | | | (0.59 | )% | | | (0.73 | )% | | | (0.88 | )% | |
| Portfolio Turnover of the Tax-Managed Growth Portfolio | | | 2 | % | | | 1 | % | | | 1 | % | | | 4 | % | | | 19 | % | |
| Portfolio Turnover of the Tax-Managed Value Portfolio | | | 14 | % | | | 26 | % | | | 40 | % | | | 44 | % | | | 76 | % | |
| Portfolio Turnover of the Tax-Managed International Equity Portfolio | | | 23 | % | | | 25 | % | | | 39 | % | | | 62 | % | | | 100 | % | |
| Portfolio Turnover of the Tax-Managed Multi-Cap Growth Portfolio | | | 157 | % | | | 181 | % | | | 217 | % | | | 239 | % | | | 224 | % | |
| Portfolio Turnover of the Tax-Managed Mid-Cap Core Portfolio | | | 38 | % | | | 55 | % | | | 53 | % | | | 42 | % | | | 50 | % | |
| Portfolio Turnover of the Tax-Managed Small-Cap Growth Portfolio | | | 78 | % | | | 99 | % | | | 223 | % | | | 282 | % | | | 248 | % | |
| Portfolio Turnover of the Tax-Managed Small-Cap Value Portfolio | | | 80 | % | | | 49 | % | | | 24 | % | | | 12 | % | | | 21 | % | |
(1) Net investment income (loss) per share was computed using average shares outstanding.
(2) Net investment income per share reflects a dividend resulting from a corporate action allocated from the Tax-Managed International Equity Portfolio which amounted $0.028 per share. Excluding this dividend, the ratio of net investment income to average daily net assets would have been 0.02%.
(3) Returns are historical and are calculated by determining the percentage change in net asset value with all distributions reinvested.
(4) The effect of the net increase from payments by affiliate and net gains (losses) realized through the Fund's investment in Tax-Managed Small-Cap Growth Portfolio (the Portfolio) on the disposal of investments purchased which did not meet the Portfolio's investment guidelines amounted to less than $0.01 per share and had no effect on total return for the year ended October 31, 2004.
(5) Includes the Fund's share of the Portfolios' allocated expenses.
(6) The investment adviser waived a portion of its investment adviser fee and/or the administrator subsidized certain operating expenses (equal to 0.01% and 0.01% for 2005 and 2004, respectively).
See notes to financial statements
10
Eaton Vance Tax-Managed Equity Asset Allocation Fund as of October 31, 2007
NOTES TO FINANCIAL STATEMENTS
1 Significant Accounting Policies
Eaton Vance Tax-Managed Equity Asset Allocation Fund (the Fund) is a diversified series of Eaton Vance Mutual Funds Trust (the Trust). The Trust is a Massachusetts business trust registered under the Investment Company Act of 1940, as amended (the 1940 Act), as an open-end management investment company. The Fund offers three classes of shares. Class A shares are generally sold subject to a sales charge imposed at time of purchase. Class B and Class C shares are sold at net asset value and are generally subject to a contingent deferred sales charge (see Note 5). Class B shares held for eight years will automatically convert to Class A shares. Each class represents a pro-rata interest in the Fund, but votes separately on class-specific matters and (as noted below) is subject to different expenses. Realized and unrealized gains and losses and net investment income and losses, other than class-specific expenses, are allocated daily to each class of shares based on the relative net assets of each class to the total net assets of the Fund. Each class of shares differs in its distribution plan and certain other class-specific expenses. The Fund currently invests all of its investable assets in the following seven tax-managed equity portfolios managed by Eaton Vance or its affiliates: Tax-Managed Growth Portfolio, Tax-Managed Value Portfolio, Tax-Managed International Equity Portfolio, Tax-Managed Multi-Cap Growth Portfolio (formerly Tax-Managed Multi-Cap Opportunity Portfolio), Tax-Managed Mid-Cap Core Portfolio, Tax-Managed Small-Cap Growth Portfolio and Tax-Managed Small-Cap Value Portfolio (the Portfolios). Each Portfolio is organized as a New York Trust. The investment objectives and policies of the Portfolios together are similar as those of the Fund. The value of the Fund's investment in each Portfolio reflects the Fund's proportionate interest in the net assets of the Tax-Managed Growth Portfolio, Tax-Managed Value Portfolio, Tax-M anaged International Equity Portfolio, Tax-Managed Multi-Cap Growth Portfolio, Tax-Managed Mid-Cap Core Portfolio, Tax-Managed Small-Cap Growth Portfolio and Tax-Managed Small-Cap Value Portfolio (0.9%, 12.2%, 46.3%, 54.8%, 64.5%, 28.9%, and 45.2%, respectively, at October 31, 2007). The performance of the Fund is directly affected by the performance of the Portfolios. A copy of each Portfolio's financial statements is available on the EDGAR Database on the Securities and Exchange Commission's website (www.sec.gov), at the Commission's public reference room in Washington, DC or upon request from the Fund's principal underwriter, Eaton Vance Distributors Inc. (EVD), by calling 1-800-225-6265.
The following is a summary of significant accounting policies of the Fund. The policies are in conformity with accounting principles generally accepted in the United States of America.
A Investment Valuation — The valuation policy of each Portfolio is as follows: Securities listed on a U.S. securities exchange generally are valued at the last sale price on the day of valuation or, if no sales took place on such date, at the mean between the closing bid and asked prices therefore on the exchange where such securities are principally traded. Equity securities listed on the NASDAQ Global or Global Select Market generally are valued at the official NASDAQ closing price. Unlisted or listed securities for which closing sales prices or closing quotations are not available are valued at the mean between the latest available bid and asked prices or, in the case of preferred equity securities that are not listed or traded in the over-the-counter market, by an ind ependent pricing service. Exchange-traded options are valued at the last sale price for the day of valuation as quoted on the principal exchange or board of trade on which the options are traded or, in the absence of sales on such date, at the mean between the latest bid and asked prices therefore. Futures positions on securities and currencies generally are valued at closing settlement prices. Short-term debt securities with a remaining maturity of 60 days or less are valued at amortized cost. If short-term debt securities are acquired with a remaining maturity of more than 60 days, they will be valued by a pricing service. Other fixed income and debt securities, including listed securities and securities for which price quotations are available, will normally be valued on the basis of valuations furnished by a pricing service. Foreign securities and currencies are valued in U.S. dollars, based on foreign currency exchange rate quotations and supplied by an independent quotation service. The daily valuation of exchange-traded foreign securities generally is determined as of the close of trading on the principal exchange on which such securities trade. Events occurring after the close of trading on foreign exchanges may result in adjustments to the valuation of foreign securities to more accurately reflect their fair value as of the close of regular trading on the New York Stock Exchange. When valuing foreign equity securities that meet certain criteria, the Trustees have approved the use of a fair value service that values such securities to reflect market trading that occurs after the close of the applicable foreign markets of comparable securities or other instruments that have a strong correlation to the fair-valued securities. Investments held by the Portfolios for which valuations or market quotations are unavailable are valued at fair value using methods determined in good faith by or at the direction of the Trustees of the Portfolios considering relevant factors, data and information including the marke t value of freely tradable securities of
11
Eaton Vance Tax-Managed Equity Asset Allocation Fund as of October 31, 2007
NOTES TO FINANCIAL STATEMENTS CONT'D
the same class in the principal market on which such securities are normally traded.
The Portfolios may invest in Cash Management Portfolio (Cash Management) and Eaton Vance Cash Collateral Fund, LLC (Cash Collateral), both are affiliated investment companies managed by Boston Management and Research (BMR) and Eaton Vance Management (EVM), respectively. Cash Management values its investment securities utilizing the amortized cost valuation technique permitted by Rule 2a-7 of the 1940 Act. This technique involves initially valuing a portfolio security at its cost and thereafter assuming a constant amortization to maturity of any discount or premium. Investments in Cash Collateral are valued at net asset value per share on the valuation date.
B Income — The Fund's net investment income or loss consists of the Fund's pro-rata share of the net investment income or loss of the Portfolios, less all actual and accrued expenses of the Fund.
C Federal Taxes — The Fund's policy is to comply with the provisions of the Internal Revenue Code applicable to regulated investment companies and to distribute to shareholders each year substantially all of its net investment income, and all or substantially all of its net realized capital gains. Accordingly, no provision for federal income or excise tax is necessary.
D Expenses — The majority of expenses of the Trust are directly identifiable to an individual fund. Expenses which are not readily identifiable to a specific fund are allocated taking into consideration, among other things, the nature and type of expense and the relative size of the funds.
E Expense Reduction — State Street Bank and Trust Company (SSBT) serves as custodian of the Fund. Pursuant to the custodian agreement, SSBT receives a fee reduced by credits, which are determined based on the average daily cash balance the Fund maintains with SSBT. All credit balances, if any, used to reduce the Fund's custodian fees are reported as a reduction of expenses in the Statement of Operations.
F Use of Estimates — The preparation of the financial statements in conformity with accounting principles generally accepted in the United States of America requires management to make estimates and assumptions that affect the reported amounts of assets and liabilities at the date of the financial statements and the reported amounts of income and expense during the reporting period. Actual results could differ from those estimates.
G Indemnifications — Under the Trust's organizational documents, its officers and Trustees may be indemnified against certain liabilities and expenses arising out of the performance of their duties to the Fund, and shareholders are indemnified against personal liability for obligations of the Trust. Additionally, in the normal course of business, the Fund enters into agreements with service providers that may contain indemnification clauses. The Fund's maximum exposure under these arrangements is unknown as this would involve future claims that may be made against the Fund that have not yet occurred.
H Other — Investment transactions are accounted for on trade date basis. Dividends to shareholders are recorded on the ex-dividend date.
2 Distributions to Shareholders
It is the present policy of the Fund to make at least one distribution annually (normally in December) of all or substantially all of its net investment income and at least one distribution annually of all or substantially all of its net realized capital gains (reduced by available capital loss carryforwards from prior years, if any). Distributions are declared separately for each class of shares. Shareholders may reinvest distributions in shares of the same class of the Fund at the net asset value as of the reinvestment date or, at the election of the shareholder, receive distributions in cash. The Fund distinguishes between distributions on a tax basis and a financial reporting basis. Accounting principles generally accepted in the United States of America require that only distributions in excess of tax basis earnings and profits be reported in the financial statements as a return of capital. Permanent differences between boo k and tax accounting relating to distributions are reclassified to paid-in capital.
The tax character of the distributions declared for the years ended October 31, 2007 and October 31, 2006 were as follows:
| | | Year Ended October 31, | |
| | | 2007 | | 2006 | |
| Distributions declared from: | |
| Long-Term Capital Gains | | $ | 17,459,090 | | | $ | 12,064,059 | | |
During the year ended October 31, 2007, undistributed net investment income was decreased by $2,833,491,
12
Eaton Vance Tax-Managed Equity Asset Allocation Fund as of October 31, 2007
NOTES TO FINANCIAL STATEMENTS CONT'D
accumulated net realized gain was decreased by $2,848,684 and paid-in-capital was increased by $5,682,175 due to differences in book and tax policies for foreign currency gains and losses, partnership allocations and certain dividends received from Real Estate Investment Trusts (REITs). These reclassifications had no effect on net asset or net asset value per share of the Fund.
At October 31, 2007, the components of distributable earnings (accumulated losses) and unrealized appreciation (depreciation) on a tax basis were as follows:
| Undistributed capital gain | | $ | 35,417,597 | | |
| Undistributed ordinary income | | $ | 7,245,570 | | |
| Unrealized appreciation | | $ | 234,385,352 | | |
| Other temporary differences | | $ | 18,228,600 | | |
The differences between components of distributable earnings (accumulated losses) on a tax basis and the amounts reflected in the Statements of Assets and Liabilities are primarily due to wash sales, passive foreign investment companies, partnership allocations, the treatment of short-term capital gains as ordinary for tax purposes and certain dividends received from REITs.
3 Transactions with Affiliates
The investment adviser fee is earned by EVM, as compensation for management and investment advisory services rendered to the Fund. Under the investment advisory agreement, EVM receives a monthly advisory fee in the amount of 0.80% annually of average daily net assets of the Fund up to $500 million and at reduced rates as daily net assets exceed that level. The investment advisory fee payable by the Fund is reduced by the Fund's allocable portion of the investment advisory fees paid by the Portfolios in which it invests. For the year ended October 31, 2007, the Fund's investment advisory fee totaled $5,548,941, of which $4,885,918 was allocated from the Portfolios and $663,023 was paid or accrued directly by the Fund. For the year ended October 31, 2007, the Fund's investment advisory fee, including the fees allocated from the Portfolios, was 0.785% of the Fund's average daily net assets.
An administrative fee is earned by EVM for managing and administering the business affairs of the Fund. Under the administration agreement, EVM earns a fee in the amount of 0.15% per annum of the average daily net assets of the Fund. For the year ended October 31, 2007, the administration fee amounted to $1,059,648.
EVM serves as the sub-transfer agent of the Fund and receives from the transfer agent an aggregate fee based upon the actual expenses incurred by EVM in the performance of those services. For the year ended October 31, 2007, EVM earned $33,476 in sub-transfer agent fees. The Fund was informed that Eaton Vance Distributors, Inc. (EVD), a subsidiary of EVM and the Fund's principal underwriter, received $335,393, as its portion of the sales charge on sales of Class A for the year ended October 31, 2007. EVD also received distribution and service fees from Class A, Class B, and Class C shares (see note 4) and contingent deferred sales charges (see note 5).
Except for Trustees of the Fund and the Portfolios who are not members of EVM's organization, officers and Trustees receive remuneration for their services to the Fund out of the investment advisory fee. Trustees of the Fund who are not affiliated with EVM may elect to defer receipt of all or a percentage of their annual fees in accordance with the terms of the Trustees Deferred Compensation Plan. For the year ended October 31, 2007, no significant amounts have been deferred. Certain officers and Trustees of the Fund and of the Portfolios are officers of the above organizations.
4 Distribution Plans
The Fund has in effect a distribution plan for Class A shares (Class A Plan) pursuant to Rule 12b-1 under the 1940 Act. The Class A Plan provides that the Fund will pay EVD a distribution and service fee of 0.25% per annum of its average daily net assets attributable to Class A shares for distribution services and facilities provided to the Fund by EVD, as well as for personal services and/or the maintenance of shareholder accounts. Distribution and service fees paid or accrued to EVD for the year ended October 31, 2007 amounted to $758,925 for Class A shares.
The Fund also has in effect distribution plans for Class B shares (Class B Plan) and Class C shares (Class C Plan) pursuant to Rule 12b-1 under the 1940 Act (collectively, The Plans). The Class B and Class C Plans require the Fund to pay EVD amounts equal to 0.75% per annum of the Fund's average daily net assets attributable to Class B and Class C shares for providing ongoing distribution services and facilities to the Fund. The Fund will automatically discontinue payments to EVD during any period in which there are no outstanding Uncovered Distribution Charges, which are equivalent to the sum of (i) 6.25% of the aggregate amount received by the Fund for the Class B and Class C shares sold, plus (ii) interest calculated by applying the rate of 1% over the prevailing prime rate to the outstanding balance of Uncovered Distribution Charges of EVD of each respective class, reduced by the aggregate
13
Eaton Vance Tax-Managed Equity Asset Allocation Fund as of October 31, 2007
NOTES TO FINANCIAL STATEMENTS CONT'D
amount of contingent deferred sales charges (see Note 5) and amounts theretofore paid or payable to EVD by each respective class. For the year ended October 31, 2007, the fund paid or accrued to EVD $1,096,141 and $1,925,326 for Class B and Class C shares, respectively representing 0.75% of the average daily net assets of Class B and C shares. At October 31, 2007, the amount of Uncovered Distribution Charges of EVD calculated under the Plans was approximately $2,925,000 and $10,274,000 for Class B and Class C shares, respectively. The Class B and Class C Plans also authorize the Fund to make payments of service fees to EVD, investment dealers, and other persons in amounts not exceeding 0.25% per annum of the Fund's average daily net assets attributable to the Class B and Class C shares. Service fees paid or accrued are for personal services and/or the maintenance of shareholder accounts. They are separate and distinct from the s ales commissions and distribution fees payable to EVD and, as such, are not subject to automatic discontinuance when there are no outstanding Uncovered Distribution Charges of EVD. Service fees paid or accrued for the year ended October 31, 2007 amounted to $365,380, and $641,775, for Class B and Class C shares, respectively.
5 Contingent Deferred Sales Charge
A contingent deferred sales charge (CDSC) generally is imposed on redemptions of Class B shares made within six years of purchase and on redemptions of Class C shares made within one year of purchase. Class A shares may be subject to a CDSC of up to 1% if redeemed within two years of purchase (depending upon the circumstances of purchase). Generally, the CDSC is based upon the lower of the net asset value at date of redemption or date of purchase. No charge is levied on shares acquired by reinvestment of dividends or capital gain distributions. The Class B CDSC is imposed at declining rates that begin at 5% in the case of redemptions in the first and second year after purchase, declining one percentage point each subsequent year. Class C shares will be subject to a 1% CDSC if redeemed within one year of purchase.
No CDSC is levied on shares which have been sold to EVM or its affiliates or to their respective employees or clients and may be waived under certain other limited conditions. CDSC on Class B and Class C redemptions are paid to EVD to reduce the amount of Uncovered Distribution Charges calculated under the Class B and Class C Plans, respectively (see Note 4). CDSC assessed on Class B and Class C shares when no Uncovered Distribution Charges exist for the respective classes will be credited to the Fund. EVD received approximately $4,000, $153,000 and $26,000 of CDSC paid by shareholders for Class A, Class B and Class C shares, respectively, for the year ended October 31, 2007.
6 Investment Transactions
For the year ended October 31, 2007, increases and decreases in the Fund's investment in the Portfolios were as follows:
| Portfolio | | Contributions | | Withdrawals | |
| Tax-Managed Growth Portfolio | | $ | 43,937,506 | | | $ | – | | |
| Tax-Managed Value Portfolio | | | 28,354,979 | | | | – | | |
| Tax-Managed International Equity Portfolio | | | 22,477,668 | | | | – | | |
| Tax-Managed Multi-Cap Growth Portfolio | | | – | | | | 6,662,676 | | |
| Tax-Managed Mid-Cap Core Portfolio | | | – | | | | 6,662,676 | | |
| Tax-Managed Small-Cap Growth Portfolio | | | – | | | | – | | |
| Tax-Managed Small-Cap Value Portfolio | | | – | | | | – | | |
7 Shares of Beneficial Interest
The Fund's Declaration of Trust permits the Trustees to issue an unlimited number of full and fractional shares of beneficial interest (without par value). Such shares may be issued in a number of different series (such as the Fund) and classes. Transactions in Fund shares were as follows:
| | | Year Ended October 31, | |
| Class A | | 2007 | | 2006 | |
| Sales | | | 6,263,745 | | | | 4,978,140 | | |
Issued to shareholders electing to
receive payments of distributions
in Fund shares | | | 432,864 | | | | 317,801 | | |
| Redemptions | | | (2,780,265 | ) | | | (2,162,067 | ) | |
| Exchanges from Class B shares | | | 621,246 | | | | 490,894 | | |
| Net increase | | | 4,537,590 | | | | 3,624,768 | | |
| | | Year Ended October 31, | |
| Class B | | 2007 | | 2006 | |
| Sales | | | 835,141 | | | | 1,386,326 | | |
Issued to shareholders electing to
receive payments of distributions
in Fund shares | | | 253,884 | | | | 231,447 | | |
| Redemptions | | | (1,218,791 | ) | | | (1,289,718 | ) | |
| Exchanges to Class A shares | | | (645,484 | ) | | | (506,003 | ) | |
| Net decrease | | | (775,250 | ) | | | (177,948 | ) | |
14
Eaton Vance Tax-Managed Equity Asset Allocation Fund as of October 31, 2007
NOTES TO FINANCIAL STATEMENTS CONT'D
| | | Year Ended October 31, | |
| Class C | | 2007 | | 2006 | |
| Sales | | | 4,816,611 | | | | 3,879,369 | | |
Issued to shareholders
electing to receive
payments of distributions
in Fund shares | | | 362,588 | | | | 273,672 | | |
| Redemptions | | | (1,819,644 | ) | | | (1,784,560 | ) | |
| Net increase | | | 3,359,555 | | | | 2,368,481 | | |
8 Recently Issued Accounting Pronouncements
In June 2006, the Financial Accounting Standards Board (FASB) issued FASB Interpretation No. 48 (FIN 48), "Accounting for Uncertainty in Income Taxes – an interpretation of FASB Statement No. 109". FIN 48 clarifies the accounting for uncertainty in income taxes recognized in accordance with FASB Statement No. 109, "Accounting for Income Taxes". This interpretation prescribes a recognition threshold and measurement attribute for the financial statement recognition and measurement of a tax position taken or expected to be taken in a tax return. It also provides guidance on de-recognition, classification, interest and penalties, accounting in interim periods, disclosure and transition. FIN 48 is effective on the last business day of the first required financial reporting period for fiscal years beginning after December 15, 2006. Management is currently evaluating the impact of applying the various provisions of FIN 48.
In September 2006, the FASB issued Statement of Financial Accounting Standards No. 157 (FAS 157), "Fair Value Measurements". FAS 157 defines fair value, establishes a framework for measuring fair value in accordance with generally accepted accounting principles and expands disclosure about fair value measurements. FAS 157 is effective for fiscal years beginning after November 15, 2007. Management is currently evaluating the impact the adoption of FAS 157 will have on the Fund's financial statement disclosures.
15
Eaton Vance Tax-Managed Equity Asset Allocation Fund as of October 31, 2007
REPORT OF INDEPENDENT REGISTERED PUBLIC ACCOUNTING FIRM
To the Trustees of Eaton Vance Mutual Funds
Trust and Shareholders of Eaton Vance
Tax-Managed Equity Asset Allocation Fund:
We have audited the accompanying statement of assets and liabilities of Eaton Vance Tax-Managed Equity Asset Allocation Fund (the "Fund") (one of the series of Eaton Vance Mutual Funds Trust) as of October 31, 2007 and the related statement of operations for the year then ended, the statements of changes in net assets for each of the two years in the period then ended, and the financial highlights for each of the five years in the period then ended. These financial statements and financial highlights are the responsibility of the Fund's management. Our responsibility is to express an opinion on these financial statements and financial highlights based on our audits.
We conducted our audits in accordance with standards of the Public Company Accounting Oversight Board (United States). Those standards require that we plan and perform the audit to obtain reasonable assurance about whether the financial statements and financial highlights are free of material misstatement. The Fund is not required to have, nor were we engaged to perform, an audit of its internal control over financial reporting. Our audits included consideration of internal control over financial reporting as a basis for designing audit procedures that are appropriate in the circumstances, but not for the purpose of expressing an opinion of the Fund's internal control over financial reporting. Accordingly, we express no such opinion. An audit also includes examining, on a test basis, evidence supporting the amounts and disclosures in the financial statements, assessing the accounting principles used and significant estimates mad e by management, as well as evaluating the overall financial statement presentation. We believe that our audits provide a reasonable basis for our opinion.
In our opinion, the financial statements and financial highlights referred to above present fairly, in all material respects, the financial position of Eaton Vance Tax-Managed Equity Asset Allocation Fund as of October 31, 2007, the results of its operations for the year then ended, the changes in its net assets for each of the two years in the period then ended, and the financial highlights for each of the five years in the period then ended, in conformity with accounting principles generally accepted in the United States of America.
DELOITTE & TOUCHE LLP
Boston, Massachusetts
December 14, 2007
16
Eaton Vance Tax-Managed Equity Asset Allocation Fund as of October 31, 2007
FEDERAL TAX INFORMATION (Unaudited)
The Form 1099-DIV you receive in January 2008 will show the tax status of all distributions paid to your account in calendar year 2007. Shareholders are advised to consult their own tax adviser with respect to the tax consequences of their investment in the Fund. As required by the Internal Revenue Code regulations, shareholders must be notified within 60 days of the Fund's fiscal year end regarding the status of the long-term capital gains distribution.
Long-Term Capital Gains Distribution: The Fund designates $17,459,090 as long-term capital gains distribution.
17
Eaton Vance Tax-Managed Equity Asset Allocation Fund
BOARD OF TRUSTEES' ANNUAL APPROVAL OF THE INVESTMENT ADVISORY AGREEMENTS
Overview of the Contract Review Process
The Investment Company Act of 1940, as amended (the "1940 Act"), provides, in substance, that each investment advisory agreement between a fund and its investment adviser will continue in effect from year to year only if its continuance is approved at least annually by the fund's board of trustees, including by a vote of a majority of the trustees who are not "interested persons" of the fund ("Independent Trustees"), cast in person at a meeting called for the purpose of considering such approval.
At a meeting of the Boards of Trustees (each a "Board") of the Eaton Vance group of mutual funds (the "Eaton Vance Funds") held on April 23, 2007, the Board, including a majority of the Independent Trustees, voted to approve continuation of existing advisory and sub-advisory agreements for the Eaton Vance Funds for an additional one-year period. In voting its approval, the Board relied upon the affirmative recommendation of the Special Committee of the Board, which is a committee comprised exclusively of Independent Trustees. Prior to making its recommendation, the Special Committee reviewed information furnished for a series of meetings of the Special Committee held in February, March and April 2007. Such information included, among other things, the following:
Information about Fees, Performance and Expenses
• An independent report comparing the advisory and related fees paid by each fund with fees paid by comparable funds;
• An independent report comparing each fund's total expense ratio and its components to comparable funds;
• An independent report comparing the investment performance of each fund to the investment performance of comparable funds over various time periods;
• Data regarding investment performance in comparison to relevant peer groups of funds and appropriate indices;
• Comparative information concerning fees charged by each adviser for managing other mutual funds and institutional accounts using investment strategies and techniques similar to those used in managing the fund;
• Profitability analyses for each adviser with respect to each fund;
Information about Portfolio Management
• Descriptions of the investment management services provided to each fund, including the investment strategies and processes employed;
• Information concerning the allocation of brokerage and the benefits received by each adviser as a result of brokerage allocation, including information concerning the acquisition of research through "soft dollar" benefits received in connection with the funds' brokerage, and the implementation of a soft dollar reimbursement program established with respect to the funds;
• Data relating to portfolio turnover rates of each fund;
• The procedures and processes used to determine the fair value of fund assets and actions taken to monitor and test the effectiveness of such procedures and processes;
Information about each Adviser
• Reports detailing the financial results and condition of each adviser;
• Descriptions of the qualifications, education and experience of the individual investment professionals whose responsibilities include portfolio management and investment research for the funds, and information relating to their compensation and responsibilities with respect to managing other mutual funds and investment accounts;
• Copies of the Codes of Ethics of each adviser and its affiliates, together with information relating to compliance with and the administration of such codes;
• Copies of or descriptions of each adviser's proxy voting policies and procedures;
• Information concerning the resources devoted to compliance efforts undertaken by each adviser and its affiliates on behalf of the funds (including descriptions of various compliance programs) and their record of compliance with investment policies and restrictions, including policies with respect to market-timing, late trading and selective portfolio disclosure, and with policies on personal securities transactions;
• Descriptions of the business continuity and disaster recovery plans of each adviser and its affiliates;
Other Relevant Information
• Information concerning the nature, cost and character of the administrative and other non-investment management services provided by Eaton Vance Management and its affiliates;
• Information concerning management of the relationship with the custodian, subcustodians and fund accountants by each adviser or the funds' administrator; and
• The terms of each advisory agreement.
18
Eaton Vance Tax-Managed Equity Asset Allocation Fund
BOARD OF TRUSTEES' ANNUAL APPROVAL OF THE INVESTMENT ADVISORY AGREEMENTS CONT'D
In addition to the information identified above, the Special Committee considered information provided from time to time by each adviser throughout the year at meetings of the Board and its committees. Over the course of the twelve-month period ended April 30, 2007, the Board met ten times and the Special Committee, the Audit Committee and the Governance Committee, each of which is a Committee comprised solely of Independent Trustees, met twelve, fourteen and eight times, respectively. At such meetings, the Trustees received, among other things, presentations by the portfolio managers and other investment professionals of each adviser relating to the investment performance of each fund and the investment strategies used in pursuing the fund's investment objective.
For funds that invest through one or more underlying portfolios, the Board considered similar information about the portfolio(s) when considering the approval of advisory agreements. In addition, in cases where the fund's investment adviser has engaged a sub-adviser, the Board considered similar information about the sub-adviser when considering the approval of any sub-advisory agreement.
The Special Committee was assisted throughout the contract review process by Goodwin Procter LLP, legal counsel for the Independent Trustees. The members of the Special Committee relied upon the advice of such counsel and their own business judgment in determining the material factors to be considered in evaluating each advisory and sub-advisory agreement and the weight to be given to each such factor. The conclusions reached with respect to each advisory and sub-advisory agreement were based on a comprehensive evaluation of all the information provided and not any single factor. Moreover, each member of the Special Committee may have placed varying emphasis on particular factors in reaching conclusions with respect to each advisory and sub-advisory agreement.
Results of the Process
Based on its consideration of the foregoing, and such other information as it deemed relevant, including the factors and conclusions described below, the Special Committee concluded that the continuance of the investment advisory agreement of the Eaton Vance Tax-Managed Equity Asset Allocation Fund (the "Fund") with Eaton Vance Management ("EVM"), as well as the investment advisory agreements of the Tax-Managed Growth Portfolio, the Tax-Managed Mid-Cap Core Portfolio, the Tax-Managed International Equity Portfolio, Tax-Managed Multi-Cap Opportunity Portfolio, Tax-Managed Small-Cap Growth Portfolio, Tax-Managed Small-Cap Value Portfolio and the Tax-Managed Value Portfolio (the "Portfolios"), the portfolios in which the Fund invests, each with Boston Management and Research ("BMR"), including their fee structures, is in the interests of shareholders and, therefore, the Special Committee recommended to the Board approval of each ag reement. In addition, the Special Committee concluded that each of the investment sub-advisory agreements between BMR and Atlanta Capital Asset Management ("Atlanta Capital"), with respect to the Tax-Managed Mid-Cap Core Portfolio, between BMR and Eagle Global Advisors, L.L.C. ("Eagle"), with respect to the Tax-Managed International Equity Portfolio, and between BMR and Fox Asset Management ("Fox"), with respect to the Tax-Managed Small-Cap Value Portfolio, including their fee structures, is in the interests of shareholders and, therefore, the Special Committee recommended to the Board approval of each agreement. The Board accepted the recommendation of the Special Committee as well as the factors considered and conclusions reached by the Special Committee with respect to each agreement. Accordingly, the Board, including a majority of the Independent Trustees, voted to approve continuation of the investment advisory agreements for the Fund and the Portfolios. EVM and BMR are each referred to as an "Adviser" herein; EVM with respect to the Fund and BMR with respect to the Portfolios. EVM and BMR are affiliates. Eagle, Fox and Atlanta Capital are referred to herein as the "Sub-advisers." Fox and Atlanta Capital are affiliates of EVM and BMR.
Nature, Extent and Quality of Services
In considering whether to approve the investment advisory agreement of the Fund and each Portfolio and the sub-advisory agreements of the relevant Portfolio, the Board evaluated the nature, extent and quality of services provided to each Portfolio by BMR and to the relevant Portfolio by the Sub-adviser and to the Fund by EVM. BMR manages the Portfolios, while EVM allocates the assets of the Fund among the Portfolios.
The Board considered BMR's and the Sub-advisers' management capabilities and investment process with respect to the types of investments held by the Portfolios, including the education, experience and number of its investment professionals and other personnel who provide portfolio management, investment research, and similar services to the Portfolios. The Board specifically noted BMR's in-house equity research capabilities and experience in managing funds that seek to maximize after-tax returns. For all the Portfolios, the Board also took into account the resources dedicated to portfolio management and other services, including the compensation paid to recruit and retain investment personnel, and the time and attention devoted to the Fund and each Portfolio by senior management. The Board also considered the capabilities of each Sub-adviser.
The Board reviewed the compliance programs of the Adviser and relevant affiliates thereof. Among other matters, the Board considered compliance and reporting matters relating to personal trading by investment personnel, selective disclosure of portfolio holdings, late trading, frequent trading, portfolio valuation, business continuity and the allocation of investment opportunities. The Board also
19
Eaton Vance Tax-Managed Equity Asset Allocation Fund
BOARD OF TRUSTEES' ANNUAL APPROVAL OF THE INVESTMENT ADVISORY AGREEMENTS CONT'D
evaluated the responses of the Adviser and its affiliates to requests from regulatory authorities such as the Securities and Exchange Commission and the National Association of Securities Dealers.
The Board considered shareholder and other administrative services provided or managed by Eaton Vance Management and its affiliates, including transfer agency and accounting services. The Board evaluated the benefits to shareholders of investing in a fund that is a part of a large family of funds, including the ability, in many cases, to exchange an investment among different funds without incurring additional sales charges.
After consideration of the foregoing factors, among others, the Board concluded that the nature, extent and quality of services provided by the Adviser and Sub-advisers, taken as a whole, are appropriate and consistent with the terms of the investment advisory and sub-advisory agreements.
Fund Performance
The Board compared the Fund's investment performance to a relevant universe of similarly managed funds identified by an independent data provider and appropriate benchmark indices for the one- and three-year periods ended September 30, 2006 for the Fund. The Board also considered the performance of the underlying Portfolios. The Board concluded that the Fund's performance was satisfactory.
Management Fees and Expenses
The Board reviewed contractual investment advisory fee rates, including any administrative fee rates, payable by the Portfolios and the Fund (referred to collectively as "management fees"). As part of its review, the Board considered the management fees, including administrative fees, and the Fund's total expense ratio for the year ended September 30, 2006, as compared to a group of similarly managed funds selected by an independent data provider. The Board considered the fact that with respect to two of the underlying Portfolios, the Adviser had agreed to waive fees and/or pay expenses of the Portfolios in an additional amount.
After reviewing the foregoing information, and in light of the nature, extent and quality of the services provided by the Adviser, the Board concluded that the management fees charged for advisory and related services and the Fund's total expense ratio are reasonable.
Profitability
The Board reviewed the level of profits realized by the Adviser and relevant affiliates thereof in providing investment advisory and administrative services to the Fund, the Portfolios and all Eaton Vance Funds as a group. The Board considered the level of profits realized without regard to revenue sharing or other payments by the Adviser and its affiliates to third parties in respect of distribution services. The Board also considered other direct or indirect benefits received by the Adviser and its affiliates in connection with its relationship with the Fund and the Portfolios, including the benefits of research services that may be available to BMR or the Sub-advisers as a result of securities transactions effected for the Portfolios and other investment advisory clients. The Board also concluded that, in light of its role as a sub-adviser not affiliated with the Adviser, Eagle's profitability in managing the Tax-Managed Inte rnational Equity Portfolio was not a material factor.
The Board concluded that, in light of the foregoing factors and the nature, extent and quality of the services rendered, the profits realized by the Adviser and its affiliates are reasonable.
Economies of Scale
In reviewing management fees and profitability, the Board also considered the extent to which the Adviser and its affiliates, on the one hand, and the Fund, on the other hand, can expect to realize benefits from economies of scale as the assets of the Fund and the Portfolios increase. The Board acknowledged the difficulty in accurately measuring the benefits resulting from the economies of scale with respect to the management of any specific fund or group of funds. The Board reviewed data summarizing the increases and decreases in the assets of the Portfolios and of all Eaton Vance Funds as a group over various time periods, and evaluated the extent to which the total expense ratio of the Fund and the profitability of the Adviser and its affiliates may have been affected by such increases or decreases. Based upon the foregoing, the Board concluded that the benefits from economies of scale are currently being shared equitably by the Adviser and its affiliates and the Fund. The Board also concluded that, assuming reasonably foreseeable increases in the assets of the Portfolios, the structure of the advisory fees, which include breakpoints at several asset levels, can be expected to cause the Adviser and its affiliates and the Fund to continue to share such benefits equitably.
20
Eaton Vance Tax-Managed Equity Asset Allocation Fund
MANAGEMENT AND ORGANIZATION
Fund Management. The Trustees of Eaton Vance Mutual Funds Trust (the Trust) are responsible for the overall management and supervision of the Trust's affairs. The Trustees and officers of the Trust are listed below. Except as indicated, each individual has held the office shown or other offices in the same company for the last five years. Trustees and officers of the Trust hold indefinite terms of office. The "noninterested Trustees" consist of those Trustees who are not "interested persons" of the Trust, as that term is defined under the 1940 Act. The business address of each Trustee and officer is The Eaton Vance Building, 255 State Street, Boston, Massachusetts 02109. As used below, "EVC" refers to Eaton Vance Corp., "EV" refers to Eaton Vance, Inc., "EVM" refers to Eaton Vance Management, "BMR" refers to Boston Management and Research, "Parametric" refer s to Parametric Portfolio Associates and "EVD" refers to Eaton Vance Distributors, Inc. EVC and EV are the corporate parent and trustee, respectively, of EVM and BMR. EVD is the Fund's principal underwriter and a wholly-owned subsidiary of EVM. Each officer affiliated with Eaton Vance may hold a position with other Eaton Vance affiliates that is comparable to his or her position with EVM listed below.
Name and
Date of Birth | | Position
with the
Trust | | Term of
Office and
Length of
Service | | Principal Occupation(s)
During Past Five Years | | Number of Portfolios
in Fund Complex
Overseen By
Trustee(1) | | Other Directorships Held | |
| Interested Trustee | | | | | | | | | | | | | |
|
| Thomas E. Faust Jr. 5/31/58 | | Trustee and President of the Trust | | Trustee since 2007 and President of the Trust since 2002 | | Chairman, Chief Executive Officer and President of EVC, President of EV, Chief Executive Officer and President of EVM and BMR, and Director of EVD. Trustee and/or Officer of 176 registered investment companies and 5 private investment companies in the Eaton Vance Fund Complex. Mr. Faust is an interested person because of his positions with EVM, BMR, EVC and EV which are affiliates of the Trust. | | | 176 | | | Director of EVC | |
|
| Noninterested Trustee(s) | | | | | | | | | | | | | |
|
| Benjamin C. Esty 1/2/63 | | Trustee | | Since 2005 | | Roy and Elizabeth Simmons Professor of Business Administration, Harvard University Graduate School of Business Administration (since 2003). Formerly, Associate Professor, Harvard University Graduate School of Business Administration (2000-2003). | | | 176 | | | None | |
|
| Allen R. Freedman 4/3/40 | | Trustee | | Since 2007 | | Former Chairman and Chief Executive Officer of Assurant, Inc. (insurance provider) (1978-2000). Formerly, a Director of Loring Ward International (fund distributor) (2005-2007). | | | 175 | | | Director of Assurant, Inc. and Stonemor Partners L.P. (owner and operator of cemeteries) | |
|
| William H. Park 9/19/47 | | Trustee | | Since 2003 | | Vice Chairman, Commercial Industrial Finance Corp. (specialty finance company) (since 2006). Formerly, President and Chief Executive Officer, Prizm Capital Management, LLC (investment management firm) (since 2002-2005). | | | 176 | | | None | |
|
| Ronald A. Pearlman 7/10/40 | | Trustee | | Since 2003 | | Professor of Law, Georgetown University Law Center. | | | 176 | | | None | |
|
| Norton H. Reamer 9/21/35 | | Trustee | | Since 1986 | | President, Chief Executive Officer and a Director of Asset Management Finance Corp. (a specialty finance company serving the investment management industry) (since October 2003). President, Unicorn Corporation (an investment and financial advisory services company) (since September 2000). Formerly, Chairman and Chief Operating Officer, Hellman, Jordan Management Co., Inc. (an investment management company) (2000-2003). Formerly, Advisory Director of Berkshire Capital Corporation (investment banking firm) (2002-2003). | | | 176 | | | None | |
|
21
Eaton Vance Tax-Managed Equity Asset Allocation Fund
MANAGEMENT AND ORGANIZATION CONT'D
Name and
Date of Birth | | Position
with the
Trust | | Term of
Office and
Length of
Service | | Principal Occupation(s)
During Past Five Years | | Number of Portfolios
in Fund Complex
Overseen By
Trustee(1) | | Other Directorships Held | |
| Noninterested Trustee(s) (continued) | | | | | | | | | | | | | |
|
| Heidi L. Steiger 7/8/53 | | Trustee | | Since 2007 | | President, Lowenhaupt Global Advisors, LLC (global wealth management firm) (since 2005); Formerly, President and Contributing Editor, Worth Magazine (2004); Formerly, Executive Vice President and Global Head of Private Asset Management (and various other positions), Neuberger Berman (investment firm) (1986-2004). | | | 173 | | | Director of Nuclear Electric Insurance Ltd. (nuclear insurance provider) and Aviva USA (insurance provider) | |
|
| Lynn A. Stout 9/14/57 | | Trustee | | Since 1998 | | Paul Hastings Professor of Corporate and Securities Law, University of California at Los Angeles School of Law. | | | 176 | | | None | |
|
| Ralph F. Verni 1/26/43 | | Chairman of
the Board
and Trustee | | Chairman of the Board since 2007 and Trustee since 2005 | | Consultant and private investor. | | | 176 | | | None | |
|
| Principal Officers who are not Trustees | | | | | | | | | | | | | |
|
Name and
Date of Birth | | Position
with the
Trust | | Term of
Office and
Length of
Service | | Principal Occupation(s)
During Past Five Years | |
| William H. Ahern, Jr. 7/28/59 | | Vice President | | Since 1995 | | Vice President of EVM and BMR. Officer of 74 registered investment companies managed by EVM or BMR. | |
|
| Cynthia J. Clemson 3/2/63 | | Vice President | | Since 2005 | | Vice President of EVM and BMR. Officer of 89 registered investment companies managed by EVM or BMR. | |
|
| Charles B. Gaffney 12/4/72 | | Vice President | | Since 2007 | | Vice President of EVM and BMR. Previously, Sector Portfolio Manager and Senior Equity Analyst of Brown Brothers Harriman (1997-2003). Officer of 29 registered investment companies managed by EVM or BMR. | |
|
| Christine M. Johnston 11/9/72 | | Vice President | | Since 2007 | | Vice President of EVM and BMR. Officer of 34 registered investment companies managed by EVM or BMR. | |
|
| Aamer Khan 6/7/60 | | Vice President | | Since 2005 | | Vice President of EVM and BMR. Officer of 32 registered investment companies managed by EVM or BMR. | |
|
| Thomas H. Luster 4/8/62 | | Vice President | | Since 2006 | | Vice President of EVM and BMR. Officer of 48 registered investment companies managed by EVM or BMR. | |
|
| Michael R. Mach 7/15/47 | | Vice President | | Since 1999 | | Vice President of EVM and BMR. Officer of 54 registered investment companies managed by EVM or BMR. | |
|
| Robert B. MacIntosh 1/22/57 | | Vice President | | Since 1998 | | Vice President of EVM and BMR. Officer of 89 registered investment companies managed by EVM or BMR. | |
|
| Duncan W. Richardson 10/26/57 | | Vice President | | Since 2001 | | Executive Vice President and Chief Equity Investment Officer of EVC, EVM and BMR. Officer 80 registered investment companies managed by EVM or BMR. | |
|
| Walter A. Row, III 7/20/57 | | Vice President | | Since 2001 | | Director of Equity Research and a Vice President of EVM and BMR. Officer of 38 registered investment companies managed by EVM or BMR. | |
|
| Judith A. Saryan 8/21/54 | | Vice President | | Since 2003 | | Vice President of EVM and BMR. Officer of 53 registered investment companies managed by EVM or BMR. | |
|
| Susan Schiff 3/13/61 | | Vice President | | Since 2002 | | Vice President of EVM and BMR. Officer of 35 registered investment companies managed by EVM or BMR. | |
|
| Thomas Seto 9/27/62 | | Vice President | | Since 2007 | | Vice President and Director of Portfolio Management of Parametric. Officer of 30 registered investment companies managed by EVM or BMR. | |
|
22
Eaton Vance Tax-Managed Equity Asset Allocation Fund
MANAGEMENT AND ORGANIZATION CONT'D
Name and
Date of Birth | | Position
with the
Trust | | Term of
Office and
Length of
Service | | Principal Occupation(s)
During Past Five Years | |
| Principal Officers who are not Trustees (continued) | | | | | | | |
|
| David M. Stein 5/4/51 | | Vice President | | Since 2007 | | Managing Director and Chief Investment Officer of Parametric. Officer of 30 registered investment companies managed by EVM or BMR. | |
|
| Mark S. Venezia 5/23/49 | | Vice President | | Since 2007 | | Vice President of EVM and BMR. Officer of 35 registered investment companies managed by EVM or BMR. | |
|
| Adam A. Weigold 3/22/75 | | Vice President | | Since 2007 | | Vice President of EVM and BMR. Officer of 70 registered investment companies managed by EVM or BMR. | |
|
| Barbara E. Campbell 6/19/57 | | Treasurer | | Since 2005 | | Vice President of EVM and BMR. Officer of 176 registered investment companies managed by EVM or BMR. | |
|
| Maureen A. Gemma 5/24/60 | | Secretary | | Since 2007 | | Deputy Chief Legal Officer and Vice President of EVM and BMR. Officer of 176 registered investment companies managed by EVM or BMR. | |
|
| Paul M. O'Neil 7/11/53 | | Chief
Compliance Officer | | Since 2004 | | Vice President of EVM and BMR. Officer of 176 registered investment companies managed by EVM or BMR. | |
|
(1) Includes both master and feeder funds in a master-feeder structure.
The SAI for the Fund includes additional information about the Trustees and officers of the Fund and can be obtained without charge by calling 1-800-225-6265.
23
This Page Intentionally Left Blank
Investment Adviser of Eaton Vance Tax-Managed Equity Asset Allocation Fund
Eaton Vance Management
The Eaton Vance Building
255 State Street
Boston, MA 02109
Administrator of Eaton Vance Tax-Managed Equity Asset Allocation Fund
Eaton Vance Management
The Eaton Vance Building
255 State Street
Boston, MA 02109
Principal Underwriter
Eaton Vance Distributors, Inc.
The Eaton Vance Building
255 State Street
Boston, MA 02109
(617) 482-8260
Custodian
State Street Bank and Trust Company
200 Clarendon Street
Boston, MA 02116
Transfer Agent
PFPC Inc.
Attn: Eaton Vance Funds
P.O. Box 9653
Providence, RI 02940-9653
(800) 262-1122
Independent Registered Public Accounting Firm
Deloitte & Touche LLP
200 Berkeley Street
Boston, MA 02116-5022
Eaton Vance Tax-Managed Equity Asset Allocation Fund
The Eaton Vance Building
255 State Street
Boston, MA 02109
This report must be preceded or accompanied by a current prospectus. Before investing, investors should consider carefully the Fund's investment objective, risks, and charges and expenses. The Fund's current prospectus contains this and other information about the Fund and is available through your financial advisor. Please read the prospectus carefully before you invest or send money. For further information please call 1-800-225-6265.
1299-12/07 TMEAASRC

Annual Report October 31, 2007


EATON VANCE
DIVERSIFIED
INCOME
FUND
IMPORTANT NOTICES REGARDING PRIVACY,
DELIVERY OF SHAREHOLDER DOCUMENTS,
PORTFOLIO HOLDINGS AND PROXY VOTING
Privacy. The Eaton Vance organization is committed to ensuring your financial privacy. Each of the financial institutions identified below has in effect the following policy ("Privacy Policy") with respect to nonpublic personal information about its customers:
• Only such information received from you, through application forms or otherwise, and information about your Eaton Vance fund transactions will be collected. This may include information such as name, address, social security number, tax status, account balances and transactions.
• None of such information about you (or former customers) will be disclosed to anyone, except as permitted by law (which includes disclosure to employees necessary to service your account). In the normal course of servicing a customer's account, Eaton Vance may share information with unaffiliated third parties that perform various required services such as transfer agents, custodians and broker/dealers.
• Policies and procedures (including physical, electronic and procedural safeguards) are in place that are designed to protect the confidentiality of such information.
• We reserve the right to change our Privacy Policy at any time upon proper notification to you. Customers may want to review our Policy periodically for changes by accessing the link on our homepage: www.eatonvance.com.
Our pledge of privacy applies to the following entities within the Eaton Vance organization: the Eaton Vance Family of Funds, Eaton Vance Management, Eaton Vance Investment Counsel, Boston Management and Research, and Eaton Vance Distributors, Inc.
In addition, our Privacy Policy only applies to those Eaton Vance customers who are individuals and who have a direct relationship with us. If a customer's account (i.e., fund shares) is held in the name of a third-party financial adviser/ broker-dealer, it is likely that only such adviser's privacy policies apply to the customer. This notice supersedes all previously issued privacy disclosures.
For more information about Eaton Vance's Privacy Policy, please call 1-800-262-1122.
Delivery of Shareholder Documents. The Securities and Exchange Commission (the "SEC") permits funds to deliver only one copy of shareholder documents, including prospectuses, proxy statements and shareholder reports, to fund investors with multiple accounts at the same residential or post office box address. This practice is often called "householding" and it helps eliminate duplicate mailings to shareholders.
Eaton Vance, or your financial adviser, may household the mailing of your documents indefinitely unless you instruct Eaton Vance, or your financial adviser, otherwise.
If you would prefer that your Eaton Vance documents not be householded, please contact Eaton Vance at 1-800-262-1122, or contact your financial adviser.
Your instructions that householding not apply to delivery of your Eaton Vance documents will be effective within 30 days of receipt by Eaton Vance or your financial adviser.
Portfolio Holdings. Each Eaton Vance Fund and its underlying Portfolio (if applicable) will file a schedule of its portfolio holdings on Form N-Q with the SEC for the first and third quarters of each fiscal year. The Form N-Q will be available on the Eaton Vance website www.eatonvance.com, by calling Eaton Vance at 1-800-262-1122 or in the EDGAR database on the SEC's website at www.sec.gov. Form N-Q may also be reviewed and copied at the SEC's public reference room in Washington, D.C. (call 1-800-732-0330 for information on the operation of the public reference room).
Proxy Voting. From time to time, funds are required to vote proxies related to the securities held by the funds. The Eaton Vance Funds or their underlying Portfolios (if applicable) vote proxies according to a set of policies and procedures approved by the Funds' and Portfolios' Boards. You may obtain a description of these policies and procedures and information on how the Funds or Portfolios voted proxies relating to Portfolio securities during the most recent 12 month period ended June 30, without charge, upon request, by calling 1-800-262-1122. This description is also available on the SEC's website at www.sec.gov.
Eaton Vance Diversified Income Fund as of October 31, 2007
MANAGEMENT’S DISCUSSION OF FUND PERFORMANCE
The Fund
Performance for the Past Year
· The Fund’s Class A shares had a total return of 5.22% during the year ended October 31, 2007.(1) This return resulted from a decrease in net asset value per share (NAV) to $9.63 on October 31, 2007, from $9.77 on October 31, 2006, and the reinvestment of $0.638 in dividend income.
· The Fund’s Class B shares had a total return of 4.44% for the same period.(1) This return resulted from a decrease in NAV per share to $9.62 on October 31, 2007, from $9.76 on October 31, 2006, and the reinvestment of $0.565 in dividend income.
· The Fund’s Class C shares had a total return of 4.33% for the same period.(1) This return resulted from a decrease in NAV per share to $9.62 on October 31, 2007, from $9.77 on October 31, 2006, and the reinvestment of $0.565 in dividend income.
· For comparison, the Fund’s benchmarks had the following returns: the Merrill Lynch U.S. High Yield Master II Index – an unmanaged index of below investment grade U.S. dollar-denominated corporate bonds publicly issued in the U.S. domestic market – had a total return of 6.85% during the same period.(2) The S&P/LSTA Leveraged Loan Index – an unmanaged index of U.S. dollar-denominated leveraged loans – had a total return of 4.42% during the same period.(2) The Lehman Brothers Intermediate Government Bond Index – an unmanaged index of U.S. government bonds with maturities between one and 10 years – had a total return of 6.01% during the same period.(2)
Management Discussion
· The Fund’s primary investment objective is to provide a high level of current income. The Fund may, as a secondary objective, also seek capital appreciation to the extent consistent with its primary objective of high current income.
· The Fund is structured as a “fund-of-funds” and, accordingly, currently pursues its objectives by investing its assets in three registered investment companies (each a “Portfolio”) that are managed by Eaton Vance Management or its affiliates: Boston Income Portfolio, which normally invests primarily in high-yield, high-risk corporate bonds; Floating Rate Portfolio, which normally invests primarily in interests in senior floating-rate loans; and Government Obligations Portfolio, which primarily invests in mortgage-backed securities (MBS) issued by the U.S. Government or one of its agencies or instrumentalities.
· In the Boston Income Portfolio, the bond market’s correction in the third quarter of 2007 hurt performance, but some of the losses were recovered after the Federal Reserve cut interest rates in September. Among the Portfolio’s stronger performing sectors were metals, specialty retailers, energy and health care. For-profit education companies also held up well. Cyclical sectors — notably home builders and financials — were among the Portfolio’s lagging performers, but the Portfolio remained significantly underweighted in both of these sectors, relative to the Merrill Lynch U.S. High Yield Master II Index, during the period.(3)
· In Floating Rate Portfolio, the loan market underwent a correction in the third quarter of 2007 that was distinguished from previous corrections by the fact that corporate loan default rates remained at historic lows, just 0.5%, according to Standard & Poor’s. Thus, while there were increasing signs of a weakening economy, the exaggerated market decline was
Continued on page 2.
(1) | These returns do not include the 4.75% maximum sales charge for the Fund’s Class A shares or the applicable contingent deferred sales charges (CDSC) for Class B shares and Class C shares. If sales charges were deducted, the returns would be lower. |
| |
(2) | It is not possible to invest directly in an Index. The Indices’ total returns do not reflect the expenses that would have been incurred if an investor individually purchased or sold the securities represented in the Indices. Index returns are available as of month end only. |
| |
(3) | Portfolio investments may not be representative of the Portfolios’ current or future investments and may change due to active management. |
The views expressed throughout this report are those of the portfolio managers and are current only through the end of the period of the report as stated on the cover. These views are subject to change at any time based upon market or other conditions, and the investment adviser disclaims any responsibility to update such views. These views may not be relied on as investment advice and, because investment decisions for a fund are based on many factors, may not be relied on as an indication of trading intent on behalf of any Eaton Vance fund.
Fund shares are not insured by the FDIC and are not deposits or other obligations of, or guaranteed by, any depository institution. Shares are subject to investment risks, including possible loss of principal invested. Yield will vary.
Past performance is no guarantee of future results. Returns are historical and are calculated by determining the percentage change in net asset value or offering price (as applicable) with all distributions reinvested. Investment return and principal value will fluctuate so that shares, when redeemed, may be worth more or less than their original cost. Performance is for the stated time period only; due to market volatility, the Fund’s current performance may be lower or higher than the quoted return. For performance as of the most recent month end, please refer to www.eatonvance.com.
1
Eaton Vance Diversified Income Fund as of October 31, 2007
PORTFOLIO INFORMATION
primarily based on technical factors. The Fund’s senior loan holdings remained diversified in terms of industry, market and geography — a strategy management believes should help weather an economic downturn. Publishing, cable and satellite television, health care, chemicals and plastics, and business equipment and services were the largest industry weightings. The Fund had a modest exposure to home builders but had no exposure to subprime or mortgage lenders.(1)
· In Government Obligations Portfolio, management maintained a large position in seasoned fixed-rate MBS and a smaller position in adjustable-rate MBS. While the Portfolio’s seasoned MBS had no direct exposure to subprime investments or non-agency MBS, they were nonetheless affected by the overall spread widening in the fixed-income markets.
Diversification by Sectors(2)
By total investments
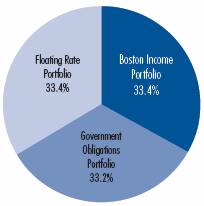
However, that widening was partially offset by a decline in overall bond yields. With MBS spreads in the 125 basis point range (1.25%) at October 31, 2007, MBS represented, in the view of management, better value than in recent years. Prepayment rates for the Portfolio’s seasoned MBS were slightly lower during the fiscal year, as homeowners were less motivated to refinance their mortgages. With signs of a weaker economy, management extended duration slightly. Duration is an indicator — stated in years — that measures cash flows and expected maturity of a fixed-income security or portfolio, and is used to determine price sensitivity to changes in interest rates. A longer duration increases the Portfolio’s interestrate exposure.(1)
(1) | Portfolio investments may not be representative of the Portfolios’ current or future investments and may change due to active management. |
| |
(2) | As of 10/31/07. Sectors are shown as a percentage of the Fund’s total investments. Fund statistics may not be representative of the Fund’s current or future investments and are subject to change due to active management. The Fund expects to allocate its assets approximately equally among Boston Income Portfolio, Government Obligations Portfolio and Floating Rate Portfolio. The Fund’s investment adviser will monitor the Fund’s allocations to the underlying Portfolios and will rebalance whenever actual allocations exceed plus or minus 3% of the Fund’s pre-determined fixed allocation percentages. |
2
Eaton Vance Diversified Income Fund as of October 31, 2007
FUND PERFORMANCE
The line graph and table set forth below provide information about the Fund’s performance. The line graph compares the performance of Class A of the Fund with that of the Merrill Lynch U.S. High Yield Master II Index, an unmanaged index of below investment grade U.S. dollar-denominated corporate bonds publicly issued in the U.S. domestic market; the S&P/LSTA Leveraged Loan Index, an unmanaged index of U.S. dollar-denominated leveraged loans; and the Lehman Brothers Intermediate Government Bond Index, an unmanaged index of U.S. government bonds with maturities between one and 10 years. The lines on the graph represent the total returns of a hypothetical investment of $10,000 in each of Class A and the Merrill Lynch U.S. High Yield Master II Index, the S&P/LSTA Leveraged Loan Index and the Lehman Brothers Intermediate Government Bond Index. Class A total returns are presented at net asset value and maximum public offering price (POP). The table includes the total returns of each Class of the Fund at net asset value and public offering price. The performance presented below does not reflect the deduction of taxes, if any, that a shareholder would pay on distributions or redemptions of Fund shares.
Performance(1) | | Class A | | Class B | | Class C | |
Share Class Symbol | | EADDX | | EBDDX | | ECDDX | |
| | | | | | | |
Average Annual Total Returns (at net asset value) | | | | | | | |
One Year | | 5.22 | % | 4.44 | % | 4.33 | % |
Life of Fund† | | 5.29 | | 4.47 | | 4.47 | |
| | | | | | | |
SEC Average Annual Total Returns (including sales charge or applicable CDSC) | | | | | | | |
One Year | | 0.19 | % | -0.49 | % | 3.35 | % |
Life of Fund† | | 3.53 | | 3.24 | | 4.47 | |
† | Inception dates: Class A: 12/7/04; Class B: 12/7/04; Class C: 12/7/04 |
| |
(1) | Average Annual Total Returns do not include the 4.75% maximum sales charge for Class A shares or the applicable contingent deferred sales charges (CDSC) for Class B or Class C shares. If sales charges were deducted, the returns would be lower. SEC returns for Class A reflect the maximum 4.75% sales charge. SEC returns for Class B reflect applicable CDSC based on the following schedule: 5% - 1st and 2nd years; 4% - 3rd year; 3% - 4th year; 2% - 5th year; 1% - 6th year. SEC 1-year return for Class C reflects a 1% CDSC. |
Total Annual | | | | | | | |
Operating Expenses(2) | | Class A | | Class B | | Class C | |
| | | | | | | |
Expense Ratio | | 1.09 | % | 1.84 | % | 1.84 | % |
(2) | Source: Prospectus dated 3/1/07. |
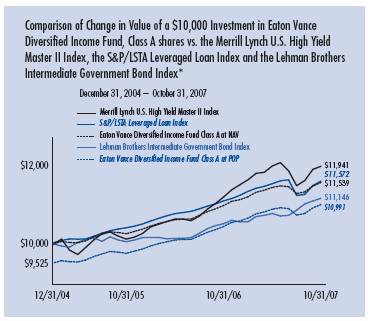
* | Source: Thomson Financial. Class A of the Fund commenced operations on 12/7/04. A $10,000 hypothetical investment on 12/7/04 at NAV in Class B shares and Class C shares, respectively, would have been valued at $11,351 ($10,967 after deduction of the applicable CDSC) and $11,352, respectively, on 10/31/07. It is not possible to invest directly in an Index. The Indices’ total returns do not reflect expenses that would have been incurred if an investor individually purchased or sold the securities represented in the Indices. Index returns are available as of month-end only. |
Past performance is no guarantee of future results. Returns are historical and are calculated by determining the percentage change in net asset value or offering price (as applicable) with all distributions reinvested. Investment return and principal value will fluctuate so that shares, when redeemed, may be worth more or less than their original cost. Performance is for the stated time period only; due to market volatility, the Fund’s current performance may be lower or higher than the quoted return. For performance as of the most recent month end, please refer to www.eatonvance.com.
3
Eaton Vance Diversified Income Fund as of October 31, 2007
FUND EXPENSES
Example: As a shareholder of the Fund, you incur two types of costs: (1) transaction costs, including sales charges (loads) on purchases and redemption fees (if applicable); and (2) ongoing costs, including management fees; distribution or service fees; and other Fund expenses. This Example is intended to help you understand your ongoing costs (in dollars) of investing in the Fund and to compare these costs with the ongoing costs of investing in other mutual funds. The Example is based on an investment of $1,000 invested at the beginning of the period and held for the entire period (May 1, 2007 – October 31, 2007).
Actual Expenses: The first section of the table below provides information about actual account values and actual expenses. You may use the information in this section, together with the amount you invested, to estimate the expenses that you paid over the period. Simply divide your account value by $1,000 (for example, an $8,600 account value divided by $1,000 = 8.6), then multiply the result by the number in the first section under the heading entitled "Expenses Paid During Period" to estimate the expenses you paid on your account during this period.
Hypothetical Example for Comparison Purposes: The second section of the table below provides information about hypothetical account values and hypothetical expenses based on the Fund's actual expense ratios and an assumed rate of return of 5% per year (before expenses), which is not the actual return of the Fund. The hypothetical account values and expenses may not be used to estimate the actual ending account balance or expenses you paid for the period. You may use this information to compare the ongoing costs of investing in your Fund and other funds. To do so, compare this 5% hypothetical example with the 5% hypothetical examples that appear in the shareholder reports of the other funds.
Please note that the expenses shown in the table are meant to highlight your ongoing costs only and do not reflect any transactional costs, such as sales charges (loads) or redemption fees (if applicable). Therefore, the second section of the table is useful in comparing ongoing costs only, and will not help you determine the relative total costs of owning different funds. In addition, if these transactional costs were included, your costs would have been higher.
Eaton Vance Diversified Income Fund
| | | Beginning Account Value
(5/1/07) | | Ending Account Value
(10/31/07) | | Expenses Paid During Period*
(5/1/07 – 10/31/07) | |
| Actual | |
| Class A | | $ | 1,000.00 | | | $ | 1,010.80 | | | $ | 5.63 | | |
| Class B | | $ | 1,000.00 | | | $ | 1,006.90 | | | $ | 9.41 | | |
| Class C | | $ | 1,000.00 | | | $ | 1,006.90 | | | $ | 9.41 | | |
| Hypothetical | |
| (5% return per year before expenses) | |
| Class A | | $ | 1,000.00 | | | $ | 1,019.60 | | | $ | 5.65 | | |
| Class B | | $ | 1,000.00 | | | $ | 1,015.80 | | | $ | 9.45 | | |
| Class C | | $ | 1,000.00 | | | $ | 1,015.80 | | | $ | 9.45 | | |
* Expenses are equal to the Fund's annualized expense ratio of 1.11% for Class A shares, 1.86% for Class B shares and 1.86% for Class C shares, multiplied by the average account value over the period, multiplied by 184/365 (to reflect the one-half year period). The example assumes that the $1,000 was invested at the net asset value per share determined at the close of business on April 30, 2007. The example reflects the expenses of the Fund and the Portfolios.
4
Eaton Vance Diversified Income Fund as of October 31, 2007
FINANCIAL STATEMENTS
Statement of Assets and Liabilities
As of October 31, 2007
| Assets | |
Investment in Boston Income Portfolio, at value
(identified cost, $142,250,281) | | $ | 139,282,506 | | |
Investment in Floating Rate Portfolio, at value
(identified cost, $141,198,029) | | | 139,289,982 | | |
Investment in Government Obligations Portfolio, at value
(identified cost, $137,677,422) | | | 138,737,081 | | |
| Receivable for Fund shares sold | | | 5,731,508 | | |
| Prepaid expenses | | | 11,279 | | |
| Total assets | | $ | 423,052,356 | | |
| Liabilities | |
| Payable for Fund shares redeemed | | $ | 670,006 | | |
| Dividends payable | | | 646,670 | | |
| Payable to affiliate for distribution and service fees | | | 228,807 | | |
| Payable to affiliate for Trustees' fees | | | 333 | | |
| Accrued expenses | | | 160,549 | | |
| Total liabilities | | $ | 1,706,365 | | |
| Net Assets | | $ | 421,345,991 | | |
| Sources of Net Assets | |
| Paid-in capital | | $ | 428,980,781 | | |
Accumulated net realized loss from Portfolios (computed on
the basis of identified cost) | | | (3,988,420 | ) | |
| Accumulated net investment income | | | 169,793 | | |
Net unrealized depreciation from Portfolios (computed on the basis of
identified cost) | | | (3,816,163 | ) | |
| Total | | $ | 421,345,991 | | |
| Class A Shares | |
| Net Assets | | $ | 200,163,118 | | |
| Shares Outstanding | | | 20,782,949 | | |
Net Asset Value and Redemption Price Per Share
(net assets ÷ shares of beneficial interest outstanding) | | $ | 9.63 | | |
Maximum Offering Price Per Share
(100 ÷ 95.25 of $9.63) | | $ | 10.11 | | |
| Class B Shares | |
| Net Assets | | $ | 38,985,668 | | |
| Shares Outstanding | | | 4,051,278 | | |
Net Asset Value and Offering Price Per Share*
(net assets ÷ shares of beneficial interest outstanding) | | $ | 9.62 | | |
| Class C Shares | |
| Net Assets | | $ | 182,197,205 | | |
| Shares Outstanding | | | 18,932,230 | | |
Net Asset Value and Offering Price Per Share*
(net assets ÷ shares of beneficial interest outstanding) | | $ | 9.62 | | |
| On sales of $25,000 or more, the offering price of Class A shares is reduced. | |
* Redemption price per share is equal to the net asset value less any applicable contingent deferred sales charge.
Statement of Operations
For the Year Ended
October 31, 2007
| Investment Income | |
| Interest and other income allocated from Portfolios | | $ | 27,136,000 | | |
| Dividend income allocated from Portfolios | | | 100,940 | | |
| Expenses allocated from Portfolios | | | (2,578,864 | ) | |
| Net investment income from Portfolios | | $ | 24,658,076 | | |
| Expenses | |
| Trustees' fees and expenses | | $ | 3,743 | | |
Distribution and service fees
Class A | | | 444,967 | | |
| Class B | | | 362,811 | | |
| Class C | | | 1,645,311 | | |
| Transfer and dividend disbursing agent fees | | | 267,044 | | |
| Custodian fee | | | 182,355 | | |
| Registration fees | | | 86,831 | | |
| Legal and accounting services | | | 49,040 | | |
| Printing and postage | | | 41,019 | | |
| Miscellaneous | | | 7,153 | | |
| Total expenses | | $ | 3,090,274 | | |
| Net investment income | | $ | 21,567,802 | | |
Realized and Unrealized
Gain (Loss) from Portfolios | |
Net realized gain (loss) —
Investment transactions (identified cost basis) | | $ | 1,780,760 | | |
| Financial futures contracts | | | 157,066 | | |
| Swap contracts | | | (80,269 | ) | |
Foreign currency and forward foreign currency exchange
contract transactions | | | (1,658,930 | ) | |
| Net realized gain | | $ | 198,627 | | |
Change in unrealized appreciation (depreciation) —
Investments (identified cost basis) | | $ | (5,169,237 | ) | |
| Financial futures contracts | | | 118,612 | | |
| Swap contracts | | | 89,402 | | |
| Foreign currency and forward foreign currency exchange contracts | | | 33,326 | | |
| Net change in unrealized appreciation (depreciation) | | $ | (4,927,897 | ) | |
| Net realized and unrealized loss | | $ | (4,729,270 | ) | |
| Net increase in net assets from operations | | $ | 16,838,532 | | |
See notes to financial statements
5
Eaton Vance Diversified Income Fund as of October 31, 2007
FINANCIAL STATEMENTS CONT'D
Statements of Changes in Net Assets
Increase (Decrease)
in Net Assets | | Year Ended
October 31, 2007 | | Year Ended
October 31, 2006 | |
From operations —
Net investment income | | $ | 21,567,802 | | | $ | 13,504,898 | | |
Net realized gain from investment
transactions, financial futures
contracts, swaps contracts and
foreign currency and forward foreign
currency exchange contract transactions | | | 198,627 | | | | 173,940 | | |
Net change in unrealized
appreciation (depreciation) from
investments, financial futures contracts,
swaps contracts and foreign currency
and forward foreign currency
exchange contracts | | | (4,927,897 | ) | | | 2,245,709 | | |
| Net increase in net assets from operations | | $ | 16,838,532 | | | $ | 15,924,547 | | |
Distributions to shareholders —
From net investment income
Class A | | $ | (11,639,357 | ) | | $ | (7,323,426 | ) | |
| Class B | | | (2,100,586 | ) | | | (1,562,528 | ) | |
| Class C | | | (9,527,571 | ) | | | (6,522,201 | ) | |
| Total distributions to shareholders | | $ | (23,267,514 | ) | | $ | (15,408,155 | ) | |
Transactions in shares of beneficial interest —
Proceeds from sale of shares
Class A | | $ | 103,643,666 | | | $ | 82,726,214 | | |
| Class B | | | 11,774,288 | | | | 13,707,120 | | |
| Class C | | | 72,555,582 | | | | 63,879,837 | | |
Net asset value of shares issued to
shareholders in payment of
distributions declared
Class A | | | 8,124,353 | | | | 5,159,127 | | |
| Class B | | | 1,367,260 | | | | 973,870 | | |
| Class C | | | 6,588,347 | | | | 4,393,885 | | |
Cost of shares redeemed
Class A | | | (53,332,480 | ) | | | (30,170,684 | ) | |
| Class B | | | (5,406,383 | ) | | | (4,834,978 | ) | |
| Class C | | | (30,076,238 | ) | | | (22,404,604 | ) | |
Net increase in net assets from Fund
share transactions | | $ | 115,238,395 | | | $ | 113,429,787 | | |
| Net increase in net assets | | $ | 108,809,413 | | | $ | 113,946,179 | | |
| Net Assets | | Year Ended
October 31, 2007 | | Year Ended
October 31, 2006 | |
| At beginning of year | | $ | 312,536,578 | | | $ | 198,590,399 | | |
| At end of year | | $ | 421,345,991 | | | $ | 312,536,578 | | |
Accumulated undistributed
net investment income
included in net assets | |
| At end of year | | $ | 169,793 | | | $ | 71,664 | | |
See notes to financial statements
6
Eaton Vance Diversified Income Fund as of October 31, 2007
FINANCIAL STATEMENTS CONT'D
Financial Highlights
| | | Class A | |
| | | Year Ended October 31, | | Period Ended | |
| | | 2007(1) | | 2006(1) | | October 31, 2005(1)(2) | |
| Net asset value — Beginning of period | | $ | 9.770 | | | $ | 9.760 | | | $ | 10.000 | | |
| Income (loss) from operations | |
| Net investment income | | $ | 0.593 | | | $ | 0.561 | | | $ | 0.430 | | |
| Net realized and unrealized gain (loss) | | | (0.095 | ) | | | 0.086 | | | | (0.108 | ) | |
| Total income from operations | | $ | 0.498 | | | $ | 0.647 | | | $ | 0.322 | | |
| Less distributions | |
| From net investment income | | $ | (0.638 | ) | | $ | (0.637 | ) | | $ | (0.562 | ) | |
| Total distributions | | $ | (0.638 | ) | | $ | (0.637 | ) | | $ | (0.562 | ) | |
| Net asset value — End of period | | $ | 9.630 | | | $ | 9.770 | | | $ | 9.760 | | |
| Total Return(3) | | | 5.22 | % | | | 6.84 | % | | | 3.29 | %(7) | |
| Ratios/Supplemental Data | |
| Net assets, end of year (000's omitted) | | $ | 200,163 | | | $ | 144,830 | | | $ | 86,858 | | |
| Ratios (As a percentage of average daily net assets): | |
| Expenses before custodian fee reduction(4) | | | 1.10 | % | | | 1.09 | % | | | 1.17 | %(5)(6) | |
| Expenses after custodian fee reduction(4) | | | 1.10 | % | | | 1.09 | % | | | 1.17 | %(5)(6) | |
| Net investment income | | | 6.08 | % | | | 5.75 | % | | | 4.84 | %(5)(6) | |
| Portfolio Turnover of the Boston Income Portfolio | | | 84 | % | | | 68 | % | | | 71 | % | |
| Portfolio Turnover of the Floating Rate Portfolio | | | 61 | % | | | 50 | % | | | 57 | % | |
| Portfolio Turnover of the Government Obligations Portfolio | | | 23 | % | | | 2 | % | | | 30 | % | |
(1) Net investment income per share was computed using average shares outstanding.
(2) For the period from the start of business, December 7, 2004, to October 31, 2005.
(3) Returns are historical and are calculated by determining the percentage change in net asset value with all distributions reinvested.
(4) Includes the Fund's share of the Portfolios' allocated expenses.
(5) Annualized.
(6) The investment adviser waived a portion of its advisory fee and the administrator subsidized certain operating expenses (equal to 0.03%).
(7) Not annualized.
See notes to financial statements
7
Eaton Vance Diversified Income Fund as of October 31, 2007
FINANCIAL STATEMENTS CONT'D
Financial Highlights
| | | Class B | |
| | | Year Ended October 31, | | Period Ended | |
| | | 2007(1) | | 2006(1) | | October 31, 2005(1)(2) | |
| Net asset value — Beginning of period | | $ | 9.760 | | | $ | 9.750 | | | $ | 10.000 | | |
| Income (loss) from operations | |
| Net investment income | | $ | 0.520 | | | $ | 0.488 | | | $ | 0.365 | | |
| Net realized and unrealized gain (loss) | | | (0.095 | ) | | | 0.085 | | | | (0.120 | ) | |
| Total income from operations | | $ | 0.425 | | | $ | 0.573 | | | $ | 0.245 | | |
| Less distributions | |
| From net investment income | | $ | (0.565 | ) | | $ | (0.563 | ) | | $ | (0.495 | ) | |
| Total distributions | | $ | (0.565 | ) | | $ | (0.563 | ) | | $ | (0.495 | ) | |
| Net asset value — End of period | | $ | 9.620 | | | $ | 9.760 | | | $ | 9.750 | | |
| Total Return(3) | | | 4.44 | % | | | 6.05 | % | | | 2.49 | %(7) | |
| Ratios/Supplemental Data | |
| Net assets, end of year (000's omitted) | | $ | 38,986 | | | $ | 31,827 | | | $ | 21,926 | | |
| Ratios (As a percentage of average daily net assets): | |
| Expenses before custodian fee reduction(4) | | | 1.85 | % | | | 1.84 | % | | | 1.92 | %(5)(6) | |
| Expenses after custodian fee reduction(4) | | | 1.85 | % | | | 1.84 | % | | | 1.92 | %(5)(6) | |
| Net investment income | | | 5.35 | % | | | 5.01 | % | | | 4.11 | %(5)(6) | |
| Portfolio Turnover of the Boston Income Portfolio | | | 84 | % | | | 68 | % | | | 71 | % | |
| Portfolio Turnover of the Floating Rate Portfolio | | | 61 | % | | | 50 | % | | | 57 | % | |
| Portfolio Turnover of the Government Obligations Portfolio | | | 23 | % | | | 2 | % | | | 30 | % | |
(1) Net investment income per share was computed using average shares outstanding.
(2) For the period from the start of business, December 7, 2004, to October 31, 2005.
(3) Returns are historical and are calculated by determining the percentage change in net asset value with all distributions reinvested.
(4) Includes the Fund's share of the Portfolios' allocated expenses.
(5) Annualized.
(6) The investment adviser waived a portion of its advisory fee and the administrator subsidized certain operating expenses (equal to 0.03%).
(7) Not annualized.
See notes to financial statements
8
Eaton Vance Diversified Income Fund as of October 31, 2007
FINANCIAL STATEMENTS CONT'D
Financial Highlights
| | | Class C | |
| | | Year Ended October 31, | | Period Ended | |
| | | 2007(1) | | 2006(1) | | October 31, 2005(1)(2) | |
| Net asset value — Beginning of period | | $ | 9.770 | | | $ | 9.750 | | | $ | 10.000 | | |
| Income (loss) from operations | |
| Net investment income | | $ | 0.520 | | | $ | 0.489 | | | $ | 0.362 | | |
| Net realized and unrealized gain (loss) | | | (0.105 | ) | | | 0.095 | | | | (0.117 | ) | |
| Total income from operations | | $ | 0.415 | | | $ | 0.584 | | | $ | 0.245 | | |
| Less distributions | |
| From net investment income | | $ | (0.565 | ) | | $ | (0.564 | ) | | $ | (0.495 | ) | |
| Total distributions | | $ | (0.565 | ) | | $ | (0.564 | ) | | $ | (0.495 | ) | |
| Net asset value — End of period | | $ | 9.620 | | | $ | 9.770 | | | $ | 9.750 | | |
| Total Return(3) | | | 4.33 | % | | | 6.16 | % | | | 2.49 | %(7) | |
| Ratios/Supplemental Data | |
| Net assets, end of year (000's omitted) | | $ | 182,197 | | | $ | 135,880 | | | $ | 89,806 | | |
| Ratios (As a percentage of average daily net assets): | |
| Expenses before custodian fee reduction(4) | | | 1.85 | % | | | 1.84 | % | | | 1.92 | %(5)(6) | |
| Expenses after custodian fee reduction(4) | | | 1.85 | % | | | 1.84 | % | | | 1.92 | %(5)(6) | |
| Net investment income | | | 5.34 | % | | | 5.02 | % | | | 4.08 | %(5)(6) | |
| Portfolio Turnover of the Boston Income Portfolio | | | 84 | % | | | 68 | % | | | 71 | % | |
| Portfolio Turnover of the Floating Rate Portfolio | | | 61 | % | | | 50 | % | | | 57 | % | |
| Portfolio Turnover of the Government Obligations Portfolio | | | 23 | % | | | 2 | % | | | 30 | % | |
(1) Net investment income per share was computed using average shares outstanding.
(2) For the period from the start of business, December 7, 2004, to October 31, 2005.
(3) Returns are historical and are calculated by determining the percentage change in net asset value with all distributions reinvested.
(4) Includes the Fund's share of the Portfolios' allocated expenses.
(5) Annualized.
(6) The investment adviser waived a portion of its advisory fee and the administrator subsidized certain operating expenses (equal to 0.03%).
(7) Not annualized.
See notes to financial statements
9
Eaton Vance Diversified Income Fund as of October 31, 2007
NOTES TO FINANCIAL STATEMENTS
1 Significant Accounting Policies
Eaton Vance Diversified Income Fund (the Fund) is a diversified series of Eaton Vance Mutual Funds Trust (the Trust). The Trust is a Massachusetts business trust registered under the Investment Company Act of 1940, as amended (the 1940 Act), as an open-end management investment company. The Fund was organized under the laws of the Commonwealth of Massachusetts by an Agreement and Declaration of Trust dated December 7, 2004. The Fund offers three classes of shares. Class A shares are generally sold subject to a sales charge imposed at time of purchase. Class B and Class C shares are sold at net asset value and are generally subject to a contingent deferred sales charge (see Note 6). Class B shares held for eight years will automatically convert to Class A shares. Each class represents a pro-rata interest in the Fund, but votes separately on class-specific matters and (as noted below) is subject to different expenses. Realized and unrealized gains and losses are allocated daily to each class of shares based on the relative net assets of each class to the total net assets of the Fund. Net investment income, other than class-specific expenses, is allocated daily to each class of shares based upon the ratio of the value of each class's paid shares to the total value of all paid shares. Each class of shares differs in its distribution plan and certain other class-specific expenses. The Fund currently invests all of its investable assets in the following three registered investment companies (each, a Portfolio) managed by Eaton Vance or its affiliates: Boston Income Portfolio, Floating Rate Portfolio, and Government Obligations Portfolio (the Portfolios). Each Portfolio is organized as a New York Trust. The investment objectives and policies of the Portfolios together are similar as those of the Fund. The value of the Fund's investment in each Portfolio reflects the Fund's proportionate interest in the net assets of the Boston Income Port folio, Floating Rate Portfolio, and Government Obligations Portfolio (6.8%, 2.0%, and 20.2%, respectively, at October 31, 2007). The performance of the Fund is directly affected by the performance of the Portfolios. A copy of each Portfolio's financial statements is available on the EDGAR Database on the Securities and Exchange Commission's website (www.sec.gov), at the Commission's public reference room in Washington, DC or upon request from the Fund's principal underwriter, Eaton Vance Distributors Inc. (EVD), by calling 1-800-225-6265.
The following is a summary of significant accounting policies of the Fund. The policies are in conformity with accounting principles generally accepted in the United States of America.
A Investment Valuation — Boston Income Portfolio's valuation policies are as follows: Securities listed on a U.S. securities exchange are generally valued at the last sale price on the day of valuation, if no sales took place on such date, at the mean between the closing bid and asked prices therefore on the exchange where such securities are principally traded. Equity securities listed on the NASDAQ Global or Global Select Market generally are valued at the NASDAQ official closing price. Listed or unlisted investments for which closing sale prices are not available are valued at the mean between the latest bid and asked prices. Fixed income investments and senior floating-rate loan interests (other than short-term obligations), including listed investments and investment s for which quotations are available, will normally be valued on the basis of market valuations furnished by a pricing service. Short-term obligations, maturing in sixty days or less, are valued at amortized cost, which approximates value. If short-term debt securities are acquired with a remaining maturity of more than 60 days, they will be valued by a pricing service. Investments for which there is no quotation or valuation are valued at fair value using methods determined in good faith by or at the direction of the Trustees.
The Portfolio's investments are primarily in interests in senior floating rate loans (Senior Loans). Interests in Senior Loans for which reliable market quotations are readily available are valued on the basis of prices furnished by an independent pricing service. Other Senior Loans are valued at fair value by the investment adviser under procedures approved by the Trustees. In fair valuing a Senior Loan, the investment adviser utilizes one or more of the following valuation techniques: (i) a matrix pricing approach that considers the yield on the Senior Loan relative to yields on other loan interests issued by companies of comparable credit quality; (ii) a comparison of the value of the borrower's outstanding equity and debt to that of comparable public companies; (iii) a discounted cash flow analysis; or (iv) when the investment adviser believes it is likely that a borrower will be liquidated or sold, an analysis of the terms of such liquidation or sale. In certain cases, the investment adviser will use a combination of analytical methods to determine fair value, such as when only a portion of a borrower's assets are likely to be sold. In conducting its assessment and analyses for purposes of determining fair value of a Senior Loan, the investment adviser will use its discretion and judgment in considering and appraising relevant factors. Junior loans are valued in the same manner as Senior Loans. Other portfolio securities (other than short-term obligations, but including listed issues) may be valued on the basis of prices furnished by one or more pricing services which
10
Eaton Vance Diversified Income Fund as of October 31, 2007
NOTES TO FINANCIAL STATEMENTS CONT'D
determine prices for normal, institutional-size trading units of such securities which may use market information, transactions for comparable securities and various relationships between securities which are generally recognized by institutional traders. The value of interest rate swaps will be based on dealer quotations. Short-term obligations, maturing in sixty days or less, are valued at amortized cost, which approximates value. If short-term debt securities are acquired with a remaining maturity of more than 60 days, they will be valued by a pricing service. Over-the-counter options are valued at the mean between the bid and the asked price provided by dealers. Financial futures contracts listed on the commodity exchanges and exchange traded options are valued at closing settlement prices. Repurchase agreements are valued at cost plus accrued interest. Other portfolio securities for which there are no quotations or valuatio ns are valued at fair value as determined in good faith by or at the direction of the Trustees.
Government Obligations Portfolio's valuation policies are as follows: Debt securities (including collateralized mortgage obligations and certain mortgage backed securities ("MBS") normally are valued by independent pricing services. The pricing services consider various factors relating to bonds or loans and/or market transactions to determine market value. Most seasoned 30-year fixed rate MBS are valued by the investment adviser's matrix pricing system. The matrix pricing system also considers various factors relating to bonds and market transactions to determine market value. Options are valued at last sale price on a U.S. exchange or board of trade or, in the absence of a sale, at the mean between the last bid and asked price. Financial futures contracts listed on commodity exchanges are valued at closing settlement prices. Securities for which there is no such quotation or valuation are valued at fair value using methods det ermined in good faith by or at the direction of the Trustees. Short-term obligations, maturing in sixty days or less, are valued at amortized cost, which approximates value. If short-term debt securities are acquired with a remaining maturity of more than 60 days, they will be valued by a pricing service.
The Portfolios may invest in Cash Management Portfolio (Cash Management), an affiliated investment company managed by Boston Management and Research (BMR), a subsidiary of Eaton Vance Management (EVM). Cash Management values its investment securities utilizing the amortized cost calculation technique permitted by Rule 2a-7 of the 1940 Act. This technique involves initially valuing a portfolio security at its cost and thereafter assuming a constant amortization to maturity of any discount or premium.
B Income — The Fund's net investment income or loss consists of the Fund's pro-rata share of the net investment income or loss of the Portfolios, less all actual and accrued expenses of the Fund.
C Expenses — The majority of expenses of the Trust are directly identifiable to an individual fund. Expenses which are not readily identifiable to a specific fund are allocated taking into consideration, among other things, the nature and type of expense and the relative size of the funds.
D Federal Taxes — The Fund's policy is to comply with the provisions of the Internal Revenue Code applicable to regulated investment companies and to distribute to shareholders each year substantially all of its net investment income, and all or substantially all of its net realized capital gains. Accordingly, no provision for federal income or excise tax is necessary. At October 31, 2007, the Fund, for federal income tax purposes, had a capital loss carryforward of $3,583,517 which will reduce the Fund's taxable income arising from future net realized gain on investment transactions, if any, to the extent permitted by the Internal Revenue Code, and thus will reduce the amount of distributions to shar eholders which would otherwise be necessary to relieve the Fund of any liability for federal income or excise tax. Such capital loss carryforward will expire on October 31, 2013 ($1,151,435), October 31, 2014 ($1,054,697) and October 31, 2015 ($1,377,385).
E Expense Reduction — State Street Bank and Trust Company (SSBT) serves as custodian of the Fund. Pursuant to the custodian agreement, SSBT receives a fee reduced by credits, which are determined based on the average daily cash balance the Fund maintains with SSBT. All credit balances, if any, used to reduce the Fund's custodian fees are reported as a reduction of expenses in the Statement of Operations.
F Indemnifications — Under the Trust's organizational documents, its officers and Trustees may be indemnified against certain liabilities and expenses arising out of the performance of their duties to the Fund, and shareholders are indemnified against personal liability for obligations of the Trust. Additionally, in the normal course of business, the Fund enters into agreements with service providers that may contain indemnification clauses. The Fund's maximum exposure under these arrangements is unknown as this would involve future claims that may be made against the Fund that have not yet occurred.
G Use of Estimates — The preparation of the financial statements in conformity with accounting principles generally accepted in the United States of America requires
11
Eaton Vance Diversified Income Fund as of October 31, 2007
NOTES TO FINANCIAL STATEMENTS CONT'D
management to make estimates and assumptions that affect the reported amounts of assets and liabilities at the date of the financial statements and the reported amounts of income and expense during the reporting period. Actual results could differ from those estimates.
H Other — Investment transactions are accounted for on a trade date basis. Dividends to shareholders are recorded on the ex-dividend date.
2 Distributions to Shareholders
The Fund declares dividends daily to shareholders of record at the time of declaration. Distributions are ordinarily paid monthly. Distributions of allocated realized capital gains, if any, are made at least annually. Shareholders may reinvest income and capital gain distributions in additional shares of the same class of the Fund at the net asset value as of the ex-dividend date. Distributions are paid in the form of additional shares of the Fund or, at the election of the shareholder, in cash. The Fund distinguishes between distributions on a tax basis and a financial reporting basis. Accounting principles generally accepted in the United States of America require that only distributions in excess of tax basis earnings and profits be reported in the financial statements as a return of capital. Permanent differences between book and tax accounting relating to distributions are reclassified to paid-in capital.
The tax character of the distributions declared for the year ended October 31, 2007 and year ended October 31, 2006 were as follows:
| | | Year Ended October 31, | |
| | | 2007 | | 2006 | |
| Distributions declared from: | |
| Ordinary income | | $ | 23,267,514 | | | $ | 15,408,155 | | |
During the year ended October 31, 2007, accumulated paid-in capital was decreased by $178,283, distributions in excess of net investment income were decreased by $1,797,841, and accumulated net realized loss was increased by $1,619,558 due to differences between book and tax accounting primarily for currency gain (loss) premium amortization swaps, paydown gain/loss and mixed straddles. These reclassifications had no effect on net asset or net asset value per share of the Fund.
At October 31, 2007, the components of distributable earnings (accumulated losses) and unrealized appreciation (depreciation) on a tax basis were as follows:
| Undistributed ordinary income | | $ | 925,344 | | |
| Capital loss carryforward | | $ | (3,583,517 | ) | |
| Unrealized depreciation | | $ | (4,329,947 | ) | |
| Other temporary differences | | $ | (646,670 | ) | |
The differences between components of distributable earnings (accumulated loss) on a tax basis and the amounts reflected in the statement of assets and liabilities are primarily due to differences in book and tax policies for wash sales, the timing of recognizing distributions to shareholders, accounting for swaps, partnership allocation, premium amortization and futures contracts.
3 Shares of Beneficial Interest
The Fund's Declaration of Trust permits the Trustees to issue an unlimited number of full and fractional shares of beneficial interest (without par value). Such shares may be issued in a number of different series (such as the Fund) and classes. Transactions in Fund shares were as follows:
| | | Year Ended October 31, | |
| Class A | | 2007 | | 2006 | |
| Sales | | | 10,613,050 | | | | 8,485,953 | | |
Issued to shareholders electing to
receive payments of distributions
in Fund shares | | | 835,241 | | | | 529,161 | | |
| Redemptions | | | (5,485,351 | ) | | | (3,094,584 | ) | |
| Net increase | | | 5,962,940 | | | | 5,920,530 | | |
| | | Year Ended October 31, | |
| Class B | | 2007 | | 2006 | |
| Sales | | | 1,206,837 | | | | 1,407,384 | | |
Issued to shareholders electing to
receive payments of distributions
in Fund shares | | | 140,653 | | | | 99,979 | | |
| Redemptions | | | (555,949 | ) | | | (496,300 | ) | |
| Net increase | | | 791,541 | | | | 1,011,063 | | |
| | | Year Ended October 31, | |
| Class C | | 2007 | | 2006 | |
| Sales | | | 7,435,545 | | | | 6,557,592 | | |
Issued to shareholders electing to
receive payments of distributions
in Fund shares | | | 677,831 | | | | 450,961 | | |
| Redemptions | | | (3,095,981 | ) | | | (2,302,235 | ) | |
| Net increase | | | 5,017,395 | | | | 4,706,318 | | |
12
Eaton Vance Diversified Income Fund as of October 31, 2007
NOTES TO FINANCIAL STATEMENTS CONT'D
4 Investment Advisor Fee and other Transactions with Affiliates
EVM serves as the investment adviser and administrator of the Fund, providing the Fund with investment advisory services (relating to the investment of the Fund's assets in the Portfolios). EVM does not receive a fee for serving as the Fund's investment adviser and administrator. The Portfolios have engaged BMR to render investment advisory services and the Fund is allocated its share of the investment advisory fee paid by each Portfolio in which it invests.
Except for Trustees of the Fund and the Portfolios who are not members of EVM's organization, officers and Trustees receive remuneration for their services to the Fund out of the investment adviser fee. Trustees of the Fund who are not affiliated with EVM may elect to defer receipt of all or a percentage of their annual fees in accordance with the terms of the Trustees Deferred Compensation Plan. For the year ended October 31, 2007, no significant amounts have been deferred. Certain officers and Trustees of the Fund and of the Portfolio are officers of the above organizations.
EVM serves as the sub-transfer agent of the Fund and receives from the transfer agent an aggregate fee based upon the actual expenses incurred by EVM in the performance of those activities. For the year ended October 31, 2007, EVM received $15,322 in sub-transfer agent fees.
The Fund was informed that EVD, and the Fund's principal underwriter, received $68,710 as its portion of the sales charge on sales of Class A for the year ended October 31, 2007. EVD also received distribution and service fees from Class A, Class B and Class C shares (see note 5) and contingent deferred sales charges (see note 6).
5 Distribution Plans
The Fund has in effect a distribution plan for Class A shares (Class A Plan) pursuant to Rule 12b-1 under the 1940 Act. The Class A Plan provides that the Fund will pay EVD a distribution and service fee of 0.25% per annum of its average daily net assets attributable to Class A shares for distribution services and facilities provided to the Fund by EVD, as well as for personal services and/or the maintenance of shareholder accounts. Distribution and service fees paid or accrued to EVD for the year ended October 31, 2007 amounted to $444,967 for Class A shares. The Class B and Class C Plans require the Fund to pay EVD amounts equal to 0.75% per annum of the Fund's average daily net assets attributable to Class B and Class C shares for providing ongoing distribution services and facilities to the Fund. The Fund will automatically discontinue payments to EVD du ring any period in which there are no outstanding Uncovered Distribution Charges, which are equivalent to the sum of (i) 6.25% of the aggregate amount received by the Fund for the Class B and Class C shares sold, plus (ii) interest calculated by applying the rate of 1% over the prevailing prime rate to the outstanding balance of Uncovered Distribution Charges of EVD of each respective class, reduced by the aggregate amount of contingent deferred sales charges (see Note 6) and amounts theretofore paid or payable to EVD by each respective class. The Fund paid or accrued $272,108 and $1,233,983 for Class B and Class C shares, respectively, to or payable to EVD for the year ended October 31, 2007, representing 0.75% per annum of the average daily net assets for Class B and Class C shares. At October 31, 2007, the amount of Uncovered Distribution Charges of EVD calculated under the Plans was approximately $1,694,000 and $11,414,000 for Class B and Class C shares, respectively. The Class B and Class C Plans also a uthorize the Fund to make payments of service fees to EVD, investment dealers, and other persons in amounts not exceeding 0.25% per annum of the Fund's average daily net assets attributable to the Class B and Class C shares. Service fees paid or accrued are for personal services and/or the maintenance of shareholder accounts. They are separate and distinct from the sales commissions and distribution fees payable to EVD and, as such, are not subject to automatic discontinuance when there are no outstanding Uncovered Distribution Charges of EVD. Service fees paid or accrued for the year ended October 31, 2007 amounted to $90,703 and $411,328 for Class B and Class C shares, respectively.
6 Contingent Deferred Sales Charge
A contingent deferred sales charge (CDSC) generally is imposed on redemptions of Class B shares made within six years of purchase and on redemptions of Class C shares within one year of purchase. Class A shares may be subject to a 1% CDSC if redeemed within 18 months of purchase (depending upon the circumstances of purchase). Generally, the CDSC is based upon the lower of the net asset value at date of redemption or date of purchase. No charge is levied on shares acquired by reinvestment of dividends or capital gains distributions. The Class B CDSC is imposed at declining rates that begin at 5% in the case of redemptions in the first and second year after purchase, declining one percentage point each subsequent year. Class C shares will be subject to a 1% CDSC if redeemed within 12 month s of purchase. No CDSC is levied on shares which have been sold to EVM or its affiliates or to their respective employees or clients and may be waived under
13
Eaton Vance Diversified Income Fund as of October 31, 2007
NOTES TO FINANCIAL STATEMENTS CONT'D
certain other limited conditions. CDSC received on Class B and Class C redemptions are paid to EVD to reduce the amount of Uncovered Distribution Charges calculated under the Fund's Class B and Class C Plans. CDSC received on Class B and Class C redemptions when no Uncovered Distribution Charges exist are credited to the Fund. EVD received approximately $3,000, $93,000 and $42,000 of CDSC paid by shareholders for Class A, Class B, and Class C shares, respectively, for the year ended October 31, 2007.
7 Investment Transactions
For the year ended October 31, 2007, increases and decreases in the Fund's investment in the Portfolios were as follows:
| Portfolio | | Contributions | | Withdrawals | |
| Boston Income Portfolio | | $ | 43,833,696 | | | $ | 16,425,143 | | |
| Floating Rate Portfolio | | | 39,909,304 | | | | 10,165,199 | | |
| Government Obligations Portfolio | | | 44,666,186 | | | | 17,113,179 | | |
8 Recently Issued Accounting Pronouncements
In June 2006, the Financial Accounting Standards Board (FASB) issued FASB Interpretation No. 48 (FIN 48), "Accounting for Uncertainty in Income Taxes – an interpretation of FASB Statement No. 109". FIN 48 clarifies the accounting for uncertainty in income taxes recognized in accordance with FASB Statement No. 109, "Accounting for Income Taxes". This interpretation prescribes a recognition threshold and measurement attribute for the financial statement recognition and measurement of a tax position taken or expected to be taken in a tax return. It also provides guidance on de-recognition, classification, interest and penalties, accounting in interim periods, disclosure and transition. FIN 48 is effective on the last business day of the first required financial reporting period for fiscal years beginning after December 15, 2006. Management is currently evaluating the impact of applying the various provisions of FIN 48.
In September 2006, the FASB issued Statement of Financial Accounting Standards No. 157 (FAS 157), "Fair Value Measurements". FAS 157 defines fair value, establishes a framework for measuring fair value in accordance with generally accepted accounting principles and expands disclosure about fair value measurements. FAS 157 is effective for fiscal years beginning after November 15, 2007. Management is currently evaluating the impact the adoption of FAS 157 will have on the Fund's financial statement disclosures.
14
Eaton Vance Diversified Income Fund as of October 31, 2007
REPORT OF INDEPENDENT REGISTERED PUBLIC ACCOUNTING FIRM
To the Trustees of Eaton Vance Mutual Funds Trust and Shareholders of Eaton Vance Diversified Income Fund:
We have audited the accompanying statement of assets and liabilities of Diversified Income Fund (one of the series of Eaton Vance Mutual Funds Trust) (the "Fund") as of October 31, 2007, and the related statement of operations, the statement of changes in net assets, and the financial highlights for year then ended. These financial statements and financial highlights are the responsibility of the Fund's management. Our responsibility is to express an opinion on these financial statements and financial highlights based on our audit. The statement of changes in net assets of the Fund for the year ended October 31, 2006 and the financial highlights for the year ended October 31, 2006 and for the period from the start of business, December 7, 2004, to October 31, 2005 were audited by other auditors. Those auditors expressed an unqualified opinion on those financial statements and financial highlights in their report dated December 2 7, 2006.
We conducted our audit in accordance with the standards of the Public Company Accounting Oversight Board (United States). Those standards require that we plan and perform the audit to obtain reasonable assurance about whether the financial statements and financial highlights are free of material misstatement. The Fund is not required to have, nor were we engaged to perform, an audit of its internal control over financial reporting. Our audit included consideration of internal control over financial reporting as a basis for designing audit procedures that are appropriate in the circumstances, but not for the purpose of expressing an opinion on the effectiveness of the Fund's internal control over financial reporting. Accordingly, we express no such opinion. An audit also includes examining, on a test basis, evidence supporting the amounts and disclosures in the financial statements, assessing the accounting principles used and si gnificant estimates made by management, as well as evaluating the overall financial statement presentation. Our procedures included confirmation of securities owned as of October 31, 2007, by correspondence with the custodian and brokers; where replies were not received from brokers, we performed other auditing procedures. We believe that our audit provides a reasonable basis for our opinion.
In our opinion, the financial statements and financial highlights referred to above present fairly, in all material respects, the financial position of Diversified Income Fund as of October 31, 2007, the results of its operations, the changes in its net assets, and the financial highlights for the year then ended, in conformity with accounting principles generally accepted in the United States of America.
DELOITTE & TOUCHE LLP
Boston, Massachusetts
December 20, 2007
15
Eaton Vance Diversified Income Fund as of October 31, 2007
FEDERAL TAX INFORMATION (Unaudited)
The Form 1099-DIV you receive in January 2008 will show the tax status of all distributions paid to your account in calendar 2007. Shareholders are advised to consult their own tax adviser with respect to the tax consequences of their investment in the Fund.
16
Eaton Vance Diversified Income Fund as of October 31, 2007
OTHER MATTERS
Change in Independent Registered Public Accounting Firm
On August 6, 2007, PricewaterhouseCoopers LLP resigned in the ordinary course as the independent registered public accounting firm for the Fund.
The reports of PricewaterhouseCoopers LLP on the Fund's financial statements for the last fiscal year and its initial fiscal year contained no adverse opinion or disclaimer of opinion and were not qualified or modified as to uncertainty, audit scope or accounting principle. There have been no disagreements with PricewaterhouseCoopers LLP during the Fund's most recent fiscal year and its initial fiscal year and any subsequent interim period on any matter of accounting principles or practices, financial statement disclosure or auditing scope or procedure, which disagreements if not resolved to the satisfaction of PricewaterhouseCoopers LLP, would have caused them to make reference thereto in their reports on the Fund's financial statements for such years, and there were no reportable events of the kind described in Item 304 (a)(1)(v) of Regulation S-K under the Securities Exchange Act of 1934, as amended.
At a meeting held on August 6, 2007, based on Audit Committee recommendations and approvals, the full Board of Trustees of the Fund approved Deloitte & Touche LLP as the Fund's independent registered public accounting firm for the fiscal year ending October 31, 2007. To the best of the Fund's knowledge, for the fiscal year ended October 31, 2006 and for the period from the start of business, December 7, 2004, to October 31, 2005, and through August 6, 2007, the Fund did not consult with Deloitte & Touche LLP on items which concerned the application of accounting principles to a specified transaction, either completed or proposed, or the type of audit opinion that might be rendered on the Fund's financial statements or concerned the subject of a disagreement (as defined in paragraph (a)(1)(iv) of Item 304 of Regulation S-K) or reportable events (as described in paragraph (a)(1)(v) of Item 304 of Regulation S-K).
17
Eaton Vance Diversified Income Fund
BOARD OF TRUSTEES' ANNUAL APPROVAL OF THE INVESTMENT ADVISORY AGREEMENTS
Overview of the Contract Review Process
The Investment Company Act of 1940, as amended (the "1940 Act"), provides, in substance, that each investment advisory agreement between a fund and its investment adviser will continue in effect from year to year only if its continuance is approved at least annually by the fund's board of trustees, including by a vote of a majority of the trustees who are not "interested persons" of the fund ("Independent Trustees"), cast in person at a meeting called for the purpose of considering such approval.
At a meeting of the Boards of Trustees (each a "Board") of the Eaton Vance group of mutual funds (the "Eaton Vance Funds") held on April 23, 2007, the Board, including a majority of the Independent Trustees, voted to approve continuation of existing advisory and sub-advisory agreements for the Eaton Vance Funds for an additional one-year period. In voting its approval, the Board relied upon the affirmative recommendation of the Special Committee of the Board, which is a committee comprised exclusively of Independent Trustees. Prior to making its recommendation, the Special Committee reviewed information furnished for a series of meetings of the Special Committee held in February, March and April 2007. Such information included, among other things, the following:
Information about Fees, Performance and Expenses
• An independent report comparing the advisory and related fees paid by each fund with fees paid by comparable funds;
• An independent report comparing each fund's total expense ratio and its components to comparable funds;
• An independent report comparing the investment performance of each fund to the investment performance of comparable funds over various time periods;
• Data regarding investment performance in comparison to relevant peer groups of funds and appropriate indices;
• Comparative information concerning fees charged by each adviser for managing other mutual funds and institutional accounts using investment strategies and techniques similar to those used in managing the fund;
• Profitability analyses for each adviser with respect to each fund;
Information about Portfolio Management
• Descriptions of the investment management services provided to each fund, including the investment strategies and processes employed;
• Information concerning the allocation of brokerage and the benefits received by each adviser as a result of brokerage allocation, including information concerning the acquisition of research through "soft dollar" benefits received in connection with the funds' brokerage, and the implementation of a soft dollar reimbursement program established with respect to the funds;
• Data relating to portfolio turnover rates of each fund;
• The procedures and processes used to determine the fair value of fund assets and actions taken to monitor and test the effectiveness of such procedures and processes;
Information about each Adviser
• Reports detailing the financial results and condition of each adviser;
• Descriptions of the qualifications, education and experience of the individual investment professionals whose responsibilities include portfolio management and investment research for the funds, and information relating to their compensation and responsibilities with respect to managing other mutual funds and investment accounts;
• Copies of the Codes of Ethics of each adviser and its affiliates, together with information relating to compliance with and the administration of such codes;
• Copies of or descriptions of each adviser's proxy voting policies and procedures;
• Information concerning the resources devoted to compliance efforts undertaken by each adviser and its affiliates on behalf of the funds (including descriptions of various compliance programs) and their record of compliance with investment policies and restrictions, including policies with respect to market-timing, late trading and selective portfolio disclosure, and with policies on personal securities transactions;
• Descriptions of the business continuity and disaster recovery plans of each adviser and its affiliates;
Other Relevant Information
• Information concerning the nature, cost and character of the administrative and other non-investment management services provided by Eaton Vance Management and its affiliates;
• Information concerning management of the relationship with the custodian, subcustodians and fund accountants by each adviser or the funds' administrator; and
• The terms of each advisory agreement.
18
Eaton Vance Diversified Income Fund
BOARD OF TRUSTEES' ANNUAL APPROVAL OF THE INVESTMENT ADVISORY AGREEMENTS CONT'D
In addition to the information identified above, the Special Committee considered information provided from time to time by each adviser throughout the year at meetings of the Board and its committees. Over the course of the twelve-month period ended April 30, 2007, the Board met ten times and the Special Committee, the Audit Committee and the Governance Committee, each of which is a Committee comprised solely of Independent Trustees, met twelve, fourteen and eight times, respectively. At such meetings, the Trustees received, among other things, presentations by the portfolio managers and other investment professionals of each adviser relating to the investment performance of each fund and the investment strategies used in pursuing the fund's investment objective.
For funds that invest through one or more underlying portfolios, the Board considered similar information about the portfolio(s) when considering the approval of advisory agreements. In addition, in cases where the fund's investment adviser has engaged a sub-adviser, the Board considered similar information about the sub-adviser when considering the approval of any sub-advisory agreement.
The Special Committee was assisted throughout the contract review process by Goodwin Procter LLP, legal counsel for the Independent Trustees. The members of the Special Committee relied upon the advice of such counsel and their own business judgment in determining the material factors to be considered in evaluating each advisory and sub-advisory agreement and the weight to be given to each such factor. The conclusions reached with respect to each advisory and sub-advisory agreement were based on a comprehensive evaluation of all the information provided and not any single factor. Moreover, each member of the Special Committee may have placed varying emphasis on particular factors in reaching conclusions with respect to each advisory and sub-advisory agreement.
Results of the Process
Based on its consideration of the foregoing, and such other information as it deemed relevant, including the factors and conclusions described below, the Special Committee concluded that the continuance of the investment advisory agreement of the Eaton Vance Diversified Income Fund (the "Fund") with Eaton Vance Management ("EVM"), as well as the investment advisory agreements of the Boston Income Portfolio, the Floating Rate Portfolio and the Government Obligations Portfolio, the portfolios in which the Fund invests (the "Portfolios"), each with Boston Management and Research ("BMR"), including their fee structures, is in the interests of shareholders and, therefore, the Special Committee recommended to the Board approval of each agreement. The Board accepted the recommendation of the Special Committee as well as the factors considered and conclusions reached by the Special Committee with respect to each agreement. Accordingly, the Board, including a majority of the Independent Trustees, voted to approve continuation of the investment advisory agreements for the Fund and the Portfolios. EVM and BMR are each referred to as an "Adviser" herein; EVM with respect to the Fund and BMR with respect to the Portfolios. EVM and BMR are affiliates.
Nature, Extent and Quality of Services
In considering whether to approve the investment advisory agreement of the Fund and the Portfolios, the Board evaluated the nature, extent and quality of services provided to the Portfolios by BMR and to the Fund by EVM. BMR manages the Portfolios, while EVM allocates the assets of the Fund among the Portfolios and rebalances if the Fund's allocation varies more than 3% from the pre-determined fixed allocation percentages.
The Board considered BMR's management capabilities and investment process with respect to the types of investments held by the Portfolios, including the education, experience and number of its investment professionals and other personnel who provide portfolio management, investment research, and similar services to the Portfolios. In particular, the Board evaluated the abilities and experience of such investment personnel in analyzing special considerations relevant to investing in senior secured floating-rate loans, high-yield debt, and other investments. With respect to the Floating Rate Portfolio, the Board noted the experience of BMR's 30 bank loan investment professionals and other personnel who provide services to the Portfolios, including five portfolio managers and 17 analysts. With respect to the Boston Income Portfolio, the Board evaluated the abilities and experience of such investment personnel in analyzing special c onsiderations relevant to investing in high-yield debt. With respect to the Government Obligations Portfolio, the Board noted the Adviser's experience in investing in mortgage-backed securities, including seasoned mortgage-backed securities. For all the Portfolios, the Board also took into account the resources dedicated to portfolio management and other services, including the compensation paid to recruit and retain investment personnel, and the time and attention devoted to the Fund and each Portfolio in the complex by senior management.
The Board reviewed the compliance programs of the Adviser and relevant affiliates thereof. Among other matters, the Board considered compliance and reporting matters relating to personal trading by investment personnel, selective disclosure of portfolio holdings, late trading, frequent trading, portfolio valuation, business continuity and the allocation of investment opportunities. The Board also evaluated the responses of the Adviser and its affiliates to requests from regulatory authorities such as the Securities and Exchange Commission and the National Association of Securities Dealers.
19
Eaton Vance Diversified Income Fund
BOARD OF TRUSTEES' ANNUAL APPROVAL OF THE INVESTMENT ADVISORY AGREEMENTS CONT'D
The Board considered shareholder and other administrative services provided or managed by EVM and its affiliates, including transfer agency and accounting services. The Board evaluated the benefits to shareholders of investing in a fund that is a part of a large family of funds, including the ability, in many cases, to exchange an investment among different funds without incurring additional sales charges.
After consideration of the foregoing factors, among others, the Board concluded that the nature, extent and quality of services provided by the Adviser, taken as a whole, are appropriate and consistent with the terms of the investment advisory agreement.
Fund Performance
The Board compared the Fund's investment performance to a relevant universe of similarly managed funds identified by an independent data provider and appropriate benchmark indices. The Board reviewed comparative performance data for the one-year period ended September 30, 2006 for the Fund. The Board also considered the performance of the underlying Portfolios. The Board concluded that the Fund's performance was satisfactory.
Management Fees and Expenses
The Board reviewed contractual investment advisory fee rates, including any administrative fee rates, payable by the Fund directly or indirectly through its pro rata share of the expenses of each Portfolio (referred to collectively as "management fees"). As part of its review, the Board considered the Fund's management fees, including administrative fees, and total expense ratio for the year ended September 30, 2006, as compared to a group of similarly managed funds selected by an independent data provider.
After reviewing the foregoing information, and in light of the nature, extent and quality of the services provided by the Adviser, the Board concluded that the management fees charged for advisory and related services and the Fund's total expense ratio are reasonable.
Profitability
The Board reviewed the level of profits realized by the Adviser and relevant affiliates thereof in providing investment advisory and administrative services to the Fund, the Portfolios and all Eaton Vance Funds as a group. The Board considered the level of profits realized without regard to revenue sharing or other payments by the Adviser and its affiliates to third parties in respect of distribution services. The Board also considered other direct or indirect benefits received by the Adviser and its affiliates in connection with its relationship with the Fund and the Portfolios.
The Board concluded that, in light of the foregoing factors and the nature, extent and quality of the services rendered, the profits realized by the Adviser and its affiliates are reasonable.
Economies of Scale
In reviewing management fees and profitability, the Board also considered the extent to which the Adviser and its affiliates, on the one hand, and the Fund, on the other hand, can expect to realize benefits from economies of scale as the assets of the Fund and the Portfolios increase. The Board acknowledged the difficulty in accurately measuring the benefits resulting from the economies of scale with respect to the management of any specific fund or group of funds. The Board reviewed data summarizing the increases and decreases in the assets of the Portfolios and of all Eaton Vance Funds as a group over various time periods, and evaluated the extent to which the total expense ratio of the Fund and the profitability of the Adviser and its affiliates may have been affected by such increases or decreases. Based upon the foregoing, the Board concluded that the benefits from economies of scale are currently being shared equitably by the Adviser and its affiliates and the Fund and the Portfolios. The Board also concluded that, assuming reasonably foreseeable increases in the assets of the Fund and the Portfolios, the structure of the Portfolio advisory fees, which include breakpoints at several asset levels, can be expected to cause the Adviser and its affiliates and the Fund and the Portfolios to continue to share such benefits equitably.
20
Eaton Vance Diversified Income Fund
MANAGEMENT AND ORGANIZATION
Fund Management. The Trustees of Eaton Vance Mutual Funds Trust (the Trust), Boston Income Portfolio (BIP), Floating Rate Portfolio (FRP) and Government Obligations Portfolio (GOP) (the Portfolios) are responsible for the overall management and supervision of the Trust's and Portfolios' affairs. The Trustees and officers of the Trust and the Portfolios are listed below. Except as indicated, each individual has held the office shown or other offices in the same company for the last five years. Trustees and officers of the Trust and the Portfolios hold indefinite terms of office. The "noninterested Trustees" consist of those Trustees who are not "interested persons" of the Trust and the Portfolios, as that term is defined under the 1940 Act. The business address of each Trustee and officer is The Eaton Vance Building, 255 State Street, Boston, Massachusetts 02 109. As used below, "EVC" refers to Eaton Vance Corp., "EV" refers to Eaton Vance, Inc., "EVM" refers to Eaton Vance Management, "BMR" refers to Boston Management and Research, "Parametric" refers to Parametric Portfolio Associates and "EVD" refers to Eaton Vance Distributors, Inc. EVC and EV are the corporate parent and trustee, respectively, of EVM and BMR. EVD is the Fund's principal underwriter, the Portfolio's placement agent and a wholly-owned subsidiary of EVM. Each officer affiliated with Eaton Vance may hold a position with other Eaton Vance affiliates that is comparable to his or her position with EVM listed below.
Name and
Date of Birth | | Position(s)
with the
Fund and
Portfolios | | Term of
Office and
Length of
Service | | Principal Occupation(s)
During Past Five Years | | Number of Portfolios
in Fund Complex
Overseen By
Trustee(1) | | Other Directorships Held | |
| Interested Trustee | | | | | | | | | | | | | |
|
Thomas E. Faust Jr.
5/31/58 | | Trustee and President of the Trust | | Trustee since 2007 and President of the Trust since 2002 | | Chairman, Chief Executive Officer and President of EVC, President of EV, Chief Executive Officer and President of EVM and BMR, and Director of EVD. Trustee and/or Officer of 176 registered investment companies and 5 private investment companies in the Eaton Vance Fund Complex. Mr. Faust is an interested person because of his positions with EVM, BMR, EVC and EV which are affiliates of the Trust and the Portfolios. | | | 176 | | | Director of EVC | |
|
| Noninterested Trustee(s) | | | | | | | | | | | | | |
|
| Benjamin C. Esty 1/2/63 | | Trustee | | Since 2005 | | Roy and Elizabeth Simmons Professor of Business Administration, Harvard University Graduate School of Business Administration (since 2003). Formerly, Associate Professor, Harvard University Graduate School of Business Administration (2000-2003). | | | 176 | | | None | |
|
| Allen R. Freedman 4/3/40 | | Trustee | | Since 2007 | | Former Chairman and Chief Executive Officer of Assurant, Inc. (insurance provider) (1978-2000). Formerly, a Director of Loring Ward International (fund distributor) (2005-2007). | | | 175 | | | Director of Assurant, Inc. and Stonemor Partners L.P. (owner and operator of cemeteries) | |
|
| William H. Park 9/19/47 | | Trustee | | Since 2003 | | Vice Chairman, Commercial Industrial Finance Corp. (specialty finance company) (since 2006). Formerly, President and Chief Executive Officer, Prizm Capital Management, LLC (investment management firm) (since 2002-2005). | | | 176 | | | None | |
|
| Ronald A. Pearlman 7/10/40 | | Trustee | | Since 2003 | | Professor of Law, Georgetown University Law Center. | | | 176 | | | None | |
|
21
Eaton Vance Diversified Income Fund
MANAGEMENT AND ORGANIZATION CONT'D
Name and
Date of Birth | | Position(s)
with the
Fund and
Portfolios | | Term of
Office and
Length of
Service | | Principal Occupation(s)
During Past Five Years | | Number of Portfolios
in Fund Complex
Overseen By
Trustee(1) | | Other Directorships Held | |
| Noninterested Trustee(s) (continued) | | | | | | | | | | | | | |
|
| Norton H. Reamer 9/21/35 | | Trustee | | Trustee of the Trust since 1986; of GOP
since 1993; of FRP since 2000 and of BIP since 2001 | | President, Chief Executive Officer and a Director of Asset Management Finance Corp. (a specialty finance company serving the investment management industry) (since October 2003). President, Unicorn Corporation (an investment and financial advisory services company) (since September 2000). Formerly, Chairman and Chief Operating Officer, Hellman, Jordan Management Co., Inc. (an investment management company) (2000-2003). Formerly, Advisory Director of Berkshire Capital Corporation (investment banking firm) (2002-2003). | | | 176 | | | None | |
|
| Heidi L. Steiger 7/8/53 | | Trustee | | Since 2007 | | President, Lowenhaupt Global Advisors, LLC (global wealth management firm) (since 2005); Formerly, President and Contributing Editor, Worth Magazine (2004); Formerly, Executive Vice President and Global Head of Private Asset Management (and various other positions), Neuberger Berman (investment firm) (1986-2004). | | | 173 | | | Director of Nuclear Electric Insurance Ltd. (nuclear insurance provider) and Aviva USA (insurance provider) | |
|
| Lynn A. Stout 9/14/57 | | Trustee | | Trustee of the Trust and GOP since 1998; of FRP since 2000 and of BIP since 2001 | | Paul Hastings Professor of Corporate and Securities Law, University of California at Los Angeles School of Law. | | | 176 | | | None | |
|
| Ralph F. Verni 1/26/43 | | Chairman of the Board and Trustee | | Chairman of the Board since 2007 and Trustee since 2005 | | Consultant and private investor. | | | 176 | | | None | |
|
| Principal Officers who are not Trustees | | | | | | | | | | | | | |
|
Name and
Date of Birth | | Position(s)
with the
Fund and
Portfolios | | Term of
Office and
Length of
Service | | Principal Occupation(s)
During Past Five Years | |
| William H. Ahern, Jr. 7/28/59 | | Vice President of the Trust | | Since 1995 | | Vice President of EVM and BMR. Officer of 74 registered investment companies managed by EVM or BMR. | |
|
| Cynthia J. Clemson 3/2/63 | | Vice President of the Trust | | Since 2005 | | Vice President of EVM and BMR. Officer of 89 registered investment companies managed by EVM or BMR. | |
|
| Charles B. Gaffney 12/4/72 | | Vice President of the Trust | | Since 2007 | | Vice President of EVM and BMR. Previously, Sector Portfolio Manager and Senior Equity Analyst of Brown Brothers Harriman (1997-2003). Officer of 29 registered investment companies managed by EVM or BMR. | |
|
| Thomas P. Huggins 3/7/66 | | Vice President of BIP | | Since 2001 | | Vice President of EVM and BMR. Officer of 4 registered investment companies managed by EVM or BMR. | |
|
| Christine M. Johnston 11/9/72 | | Vice President of the Trust | | Since 2007 | | Vice President of EVM and BMR. Officer of 34 registered investment companies managed by EVM or BMR. | |
|
| Aamer Khan 6/7/60 | | Vice President of the Trust | | Since 2005 | | Vice President of EVM and BMR. Officer of 32 registered investment companies managed by EVM or BMR. | |
|
| Thomas H. Luster 4/8/62 | | Vice President of the Trust | | Since 2006 | | Vice President of EVM and BMR. Officer of 48 registered investment companies managed by EVM or BMR. | |
|
| Michael R. Mach 7/15/47 | | Vice President of the Trust | | Since 1999 | | Vice President of EVM and BMR. Officer of 54 registered investment companies managed by EVM or BMR. | |
|
22
Eaton Vance Diversified Income Fund
MANAGEMENT AND ORGANIZATION CONT'D
Name and
Date of Birth | | Position(s)
with the
Fund and
Portfolios | | Term of
Office and
Length of
Service | | Principal Occupation(s)
During Past Five Years | |
| Principal Officers who are not Trustees (continued) | | | | | | | |
|
| Robert B. MacIntosh 1/22/57 | | Vice President of the Trust | | Since 1998 | | Vice President of EVM and BMR. Officer of 89 registered investment companies managed by EVM or BMR. | |
|
| Scott H. Page 11/30/59 | | President of FRP | | Since 2007(2) | | Vice President of EVM and BMR. Officer of 15 registered investment companies managed by EVM or BMR. | |
|
| Duncan W. Richardson 10/26/57 | | Vice President of the Trust | | Since 2001 | | Executive Vice President and Chief Equity Investment Officer of EVC, EVM and BMR. Officer 80 registered investment companies managed by EVM or BMR. | |
|
| Walter A. Row, III 7/20/57 | | Vice President of the Trust | | Since 2001 | | Director of Equity Research and a Vice President of EVM and BMR. Officer of 38 registered investment companies managed by EVM or BMR. | |
|
| Craig Russ 10/30/63 | | Vice President of FRP | | Since 2007 | | Vice President of EVM and BMR. Officer of 9 registered investment companies managed by EVM or BMR. | |
|
| Judith A. Saryan 8/21/54 | | Vice President of the Trust | | Since 2003 | | Vice President of EVM and BMR. Officer of 53 registered investment companies managed by EVM or BMR. | |
|
| Susan Schiff 3/31/61 | | Vice President of the Trust and GOP | | Vice President of the Trust since 2002 and of GOP since 1993 | | Vice President of EVM and BMR. Officer of 35 registered investment companies managed by EVM or BMR. | |
|
| Thomas Seto 9/27/62 | | Vice President of the Trust | | Since 2007 | | Vice President and Director of Portfolio Management of Parametric. Officer of 30 registered investment companies managed by EVM or BMR. | |
|
| David M. Stein 5/4/51 | | Vice President of the Trust | | Since 2007 | | Managing Director and Chief Investment Officer of Parametric. Officer of 30 registered investment companies managed by EVM or BMR. | |
|
| Mark S. Venezia 5/23/49 | | Vice President of the Trust and President of GOP | | Vice President of the Trust since 2007 and President of GOP since 2002 | | Vice President of EVM and BMR. Officer of 35 registered investment companies managed by EVM or BMR. | |
|
| Adam A. Weigold 3/22/75 | | Vice President of the Trust | | Since 2007 | | Vice President of EVM and BMR. Officer of 70 registered investment companies managed by EVM or BMR. | |
|
| Michael W. Weilheimer 2/11/61 | | President of BIP | | Since 2002 | | Vice President of EVM and BMR. Officer of 25 registered investment companies managed by EVM or BMR. | |
|
| Barbara E. Campbell 6/19/57 | | Treasurer of the Trust | | Since 2005 | | Vice President of EVM and BMR. Officer of 176 registered investment companies managed by EVM or BMR. | |
|
| Maureen A. Gemma 5/24/60 | | Secretary | | Since 2007 | | Vice President and Deputy Chief Legal Officer of EVM, and BMR. Officer of 176 registered investment companies managed by EVM or BMR. | |
|
| Dan A. Maalouly 3/25/62 | | Treasurer of the Portfolios | | Since 2005 | | Vice President of EVM and BMR. Previously, Senior Manager of PricewaterhouseCoopers LLP (1997-2005). Officer of 76 registered investment companies managed by EVM or BMR. | |
|
| Paul M. O'Neil 7/11/53 | | Chief Compliance Officer | | Since 2004 | | Vice President of EVM and BMR. Officer of 176 registered investment companies managed by EVM or BMR. | |
|
(1) Includes both master and feeder funds in a master-feeder structure.
(2) Prior to 2007, Mr. Page served as Vice President of FRP since 2000.
The SAI for the Fund includes additional information about the Trustees and officers of the Fund and the Portfolio and can be obtained without charge by calling 1-800-225-6265.
23
This Page Intentionally Left Blank
Investment Adviser of Eaton Vance Diversified Income Fund
Eaton Vance Management
The Eaton Vance Building
255 State Street
Boston, MA 02109
Administrator of Eaton Vance Diversified Income Fund
Eaton Vance Management
The Eaton Vance Building
255 State Street
Boston, MA 02109
Principal Underwriter
Eaton Vance Distributors, Inc.
The Eaton Vance Building
255 State Street
Boston, MA 02109
(617) 482-8260
Custodian
State Street Bank & Trust Company
200 Clarendon Street
Boston, MA 02116
Transfer Agent
PFPC Inc.
Attn: Eaton Vance Funds
P.O. Box 9653
Providence, RI 02940-9653
(800) 262-1122
Independent Registered Public Accounting Firm
Deloitte & Touche LLP
200 Berkeley Street
Boston, MA 02116-5022
Eaton Vance Diversified Income Fund
The Eaton Vance Building
255 State Street
Boston, MA 02109
This report must be preceded or accompanied by a current prospectus. Before investing, investors should consider carefully the Fund's investment objective(s), risks, and charges and expenses. The Fund's current prospectus contains this and other information about the Fund and is available through your financial advisor. Please read the prospectus carefully before you invest or send money. For further information please call 1-800-225-6265.
2320-12/07 DISRC

Annual Report October 31, 2007


EATON VANCE
DIVIDEND
INCOME
FUND
IMPORTANT NOTICES REGARDING PRIVACY,
DELIVERY OF SHAREHOLDER DOCUMENTS,
PORTFOLIO HOLDINGS, AND PROXY VOTING
Privacy. The Eaton Vance organization is committed to ensuring your financial privacy. Each of the financial institutions identified below has in effect the following policy ("Privacy Policy") with respect to nonpublic personal information about its customers:
• Only such information received from you, through application forms or otherwise, and information about your Eaton Vance fund transactions will be collected. This may include information such as name, address, social security number, tax status, account balances and transactions.
• None of such information about you (or former customers) will be disclosed to anyone, except as permitted by law (which includes disclosure to employees necessary to service your account). In the normal course of servicing a customer's account, Eaton Vance may share information with unaffiliated third parties that perform various required services such as transfer agents, custodians and broker/dealers.
• Policies and procedures (including physical, electronic and procedural safeguards) are in place that are designed to protect the confidentiality of such information.
• We reserve the right to change our Privacy Policy at any time upon proper notification to you. Customers may want to review our Policy periodically for changes by accessing the link on our homepage: www.eatonvance.com.
Our pledge of privacy applies to the following entities within the Eaton Vance organization: the Eaton Vance Family of Funds, Eaton Vance Management, Eaton Vance Investment Counsel, Boston Management and Research, and Eaton Vance Distributors, Inc.
In addition, our Privacy Policy only applies to those Eaton Vance customers who are individuals and who have a direct relationship with us. If a customer's account (i.e., fund shares) is held in the name of a third-party financial adviser/broker-dealer, it is likely that only such adviser's privacy policies apply to the customer. This notice supersedes all previously issued privacy disclosures.
For more information about Eaton Vance's Privacy Policy, please call 1-800-262-1122.
Delivery of Shareholder Documents. The Securities and Exchange Commission (the "SEC") permits funds to deliver only one copy of shareholder documents, including prospectuses, proxy statements and shareholder reports, to fund investors with multiple accounts at the same residential or post office box address. This practice is often called "householding" and it helps eliminate duplicate mailings to shareholders.
Eaton Vance, or your financial adviser, may household the mailing of your documents indefinitely unless you instruct Eaton Vance, or your financial adviser, otherwise.
If you would prefer that your Eaton Vance documents not be householded, please contact Eaton Vance at 1-800-262-1122, or contact your financial adviser.
Your instructions that householding not apply to delivery of your Eaton Vance documents will be effective within 30 days of receipt by Eaton Vance or your financial adviser.
Portfolio Holdings. Each Eaton Vance Fund and its underlying Portfolio (if applicable) will file a schedule of its portfolio holdings on Form N-Q with the SEC for the first and third quarters of each fiscal year. The Form N-Q will be available on the Eaton Vance website www.eatonvance.com, by calling Eaton Vance at 1-800-262-1122 or in the EDGAR database on the SEC's website at www.sec.gov. Form N-Q may also be reviewed and copied at the SEC's public reference room in Washington, D.C. (call 1-800-732-0330 for information on the operation of the public reference room).
Proxy Voting. From time to time, funds are required to vote proxies related to the securities held by the funds. The Eaton Vance Funds or their underlying Portfolios (if applicable) vote proxies according to a set of policies and procedures approved by the Funds' and Portfolios' Boards. You may obtain a description of these policies and procedures and information on how the Funds or Portfolios voted proxies relating to portfolio securities during the most recent 12 month period ended June 30, without charge, upon request, by calling 1-800-262-1122. This description is also available on the SEC's website at www.sec.gov.
Eaton Vance Dividend Income Fund as of October 31, 2007
MANAGEMENT’S DISCUSSION OF FUND PERFORMANCE

Aamer Khan, CFA
Co-Portfolio Manager

Judith A. Saryan, CFA
Co-Portfolio Manager
The Fund
Performance for the Past Year
· For the year ended October 31, 2007, Class A shares of Eaton Vance Dividend Income Fund (the “Fund”) had a total return of 18.18%. This return was the result of an increase in net asset value (NAV) per share to $12.64 on October 31, 2007, from $11.41 on October 31, 2006, and the reinvestment of $0.781 per share in dividend income.(1)
· During the same period, the Fund’s Class C shares had a total return of 17.31%. This return was the result of an increase in NAV per share to $12.58 on October 31, 2007, from $11.36 on October 31, 2006, and the reinvestment of $0.694 per share in dividend income.(1)
· During the same period, the Fund’s Class I shares had a total return of 18.45%. This return was the result of an increase in NAV per share to $12.64 on October 31, 2007, from $11.41 on October 31, 2006, and the reinvestment of $0.810 per share in dividend income.(1)
· During the same period, the Fund’s Class R shares had a total return of 18.15%. This return was the result of an increase in NAV per share to $12.66 on October 31, 2007, from $11.40 on October 31, 2006, and the reinvestment of $0.750 per share in dividend income.(1)
· For comparison, the Fund’s benchmark, the Russell 1000 Value Index (the “Index”) — a broad-based, unmanaged index of value stocks — had a total return of 10.83% during the same period. The Fund’s Lipper Classification, Equity Income Funds, had a total return of 13.44% during the same period.(2)
Management Discussion
· During the year ended October 31, 2007, U.S. stock markets moved higher amid a significant increase in volatility. In the first half of the period, investors were cautiously optimistic about the economy, inflation, interest rates, and corporate profits, although markets both in the U.S. and abroad saw sharp declines from late February through mid-March 2007. Markets recovered strongly through mid-July, only to decline again more dramatically in late July and August due to fallout from the subprime mortgage crisis. The Federal Reserve Board (the “Fed”) responded to the subprime situation by lowering the Fed Funds Rate — a key short-term interest rate benchmark — to 4.50% by period’s end. This eased some concerns about the economy and helped move markets higher through early October, though another decline, caused in part by a spike in oil prices, occurred in the final weeks of the period.
· The Fund invests in Dividend Income Portfolio (the “Portfolio”), a registered investment company that invests primarily in a diversified portfolio of equity securities that pay dividends. Reflecting its value-oriented style and a focus on higher-yielding stocks, as well as stock selection and allocation decisions, the Fund outperformed both its benchmark Index and Lipper peer group average return during the year ended October 31, 2007.(2)
· Stock selection was a key driver of the Fund’s performance, although sector allocation decisions were also beneficial. The largest contribution to performance came from the financials sector, both because the Portfolio was underweight this sector, relative to the Index, and also because management’s selections outperformed those in the Index. The second largest contribution came from the materials sector, in which an overweight allocation relative to the Index, along with investment selections in the metals and mining industry, benefited returns. The information technology sector made a solid contribution, primarily due
(1) These returns do not include the 5.75% maximum sales charge for Class A shares or the applicable contingent deferred sales charge (CDSC) for Class C shares. If sales charges were deducted, the returns would be lower. Class I and Class R shares are offered to certain investors at net asset value.
(2) It is not possible to invest directly in an Index or Lipper Classification. The Index’s total return does not reflect commissions or expenses that would have been incurred if an investor individually purchased or sold the securities represented in the Index. The Lipper return is the average total return, at net asset value, of the funds that are in the same Lipper Classification as the Fund.
Past performance is no guarantee of future results. Returns are historical and are calculated by determining the percentage change in net asset value or offering price (as applicable) with all distributions reinvested. Investment return and principal value will fluctuate so that shares, when redeemed, may be worth more or less than their original cost. Performance is for stated time period only; due to market volatility, the Fund’s current performance may be lower or higher than the quoted return. For performance as of the most recent month end, please refer to www.eatonvance.com.
The views expressed throughout this report are those of the portfolio managers and are current only through the end of the period of the report as stated on the cover. These views are subject to change at any time based upon market or other conditions, and the investment adviser disclaims any responsibility to update such views. These views may not be relied on as investment advice and, because investment decisions for a fund are based on many factors, may not be relied on as an indication of trading intent on behalf of any Eaton Vance fund.
Fund shares are not insured by the FDIC and are not deposits or other obligations of, or guaranteed by, any depository institution. Shares are subject to investment risks, including possible loss of principal invested.
1
Eaton Vance Dividend Income Fund as of October 31, 2007
PORTFOLIO INFORMATION
to stock selection, and the utilities, consumer staples, consumer discretionary and energy sectors also contributed positively.(1),(2)
· Limiting the Fund’s returns relative to the Index were holdings in the health care sector, where selections in the pharmaceutical industry underperformed similar stocks in the Index.(1),(2)
(1) It is not possible to invest directly in an Index. The Index’s total return does not reflect commissions or expenses that would have been incurred if an investor individually purchased or sold the securities represented in the Index.
(2) Sector weightings are subject to change due to active management.
Common Stock Investments by Sector(3)
By net assets
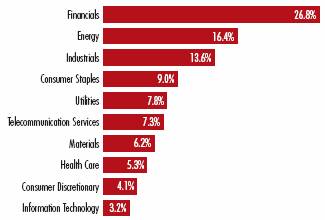
(3) As of 10/31/07. Portfolio information may not be representative of the Portfolio’s current or future investments and are subject to change due to active management.
Top Ten Holdings(4)
By net assets
Diamond Offshore Drilling, Inc. | | 3.0 | % |
Total SA, ADR | | 2.4 | |
Occidental Petroleum Corp. | | 2.3 | |
IBM Corp. | | 2.2 | |
Nestle SA | | 2.2 | |
AFLAC, Inc. | | 2.2 | |
Southern Copper Corp. | | 2.2 | |
Altria Group, Inc. | | 2.1 | |
ConocoPhillips | | 2.1 | |
Loews Corp.-Carolina Group | | 2.1 | |
(4) Top Ten Holdings represented 22.8% of Portfolio net assets as of 10/31/07. Holdings are subject to change due to active management.
2
Eaton Vance Dividend Income Fund as of October 31, 2007
FUND PERFORMANCE
The line graph and table set forth below provide information about the Fund’s performance. The line graph compares the performance of Class A of the Fund with that of the Russell 1000 Value Index, a broad-based, unmanaged index of value stocks. The lines on the graph represent the total returns of a hypothetical investment of $10,000 in each of Class A and the Russell 1000 Value Index. Class A total returns are presented at net asset value and maximum public offering price. The table includes the total returns of each Class of the Fund at net asset value and public offering price. The performance presented below does not reflect the deduction of taxes, if any, that a shareholder would pay on distributions or redemptions of Fund shares.
Performance(1) | | Class A | | Class C | | Class I | | Class R | |
| | | | | | | | | |
Average Annual Total Returns (at net asset value) | | | | | | | | | |
One Year | | 18.18 | % | 17.31 | % | 18.45 | % | 18.15 | % |
Life of Fund† | | 19.59 | | 18.61 | | 17.92 | | 17.47 | |
| | | | | | | | | |
SEC Average Annual Total Returns (including sales charge or applicable CDSC) | | | | | | | | | |
One Year | | 11.34 | % | 16.31 | % | 18.45 | % | 18.15 | % |
Life of Fund† | | 15.96 | | 18.61 | | 17.92 | | 17.47 | |
† | Inception Dates – C lass A: 11/30/05; Class C: 11/30/05; Class I: 1/31/06; Class R: 1/31/06 |
| |
(1) | Average annual total returns do not include the 5.75% maximum sales charge for Class A or the applicable contingent deferred sales charge (CDSC) for Class C shares. If sales charges were deducted, returns would be lower. SEC average annual total returns for Class A reflect the maximum 5.75% sales charge. SEC returns for Class C reflect a 1% CDSC for the first year. Class I and Class R shares are offered to certain investors at net asset value. Absent an allocation of certain expenses to the administrator, the returns would be lower. |
Total Annual | | | | | | | | | |
Operating Expenses(2) | | Class A | | Class C | | Class I | | Class R | |
| | | | | | | | | |
Gross Expense Ratio | | 2.62 | % | 3.37 | % | 2.37 | % | 2.87 | % |
Net Expense Ratio | | 1.40 | | 2.15 | | 1.15 | | 1.65 | |
(2) Source: Prospectus dated 3/1/07. Reflects a contractual expense reimbursement that continues through February 28, 2008. Thereafter, the reimbursement may be changed or terminated at any time. Without this reimbursement performance would have been lower.
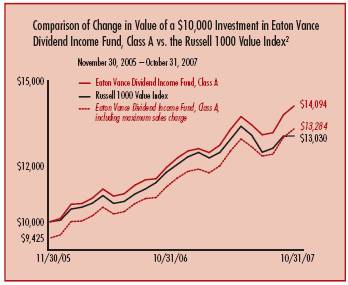
(2) Source: Thomson Financial. Class A of the Fund commenced investment operations on 11/30/05. A $10,000 hypothetical investment at net asset value in Class C shares on 11/30/05 (inception date), Class I shares on 1/31/06 (inception date) and Class R shares on 1/31/06 (inception date) would have been valued at $13,873, $13,340 and $13,250, respectively, on 10/31/07. It is not possible to invest directly in an Index. The Index’s been incurred if an investor individually purchased or sold the securities represented in the Index. Absent an allocation of certain expenses to the administrator, the returns would be lower.
Past performance is no guarantee of future results. Returns are historical and are calculated by determining the percentage change in net asset value or offering price (as applicable) with all distributions reinvested. Investment return and principal value will fluctuate so that shares, when redeemed, may be worth more or less than their original cost. Performance is for the stated time period only; due to market volatility, the Fund’s current performance may be lower or higher than the quoted return. For performance as of the most recent month end, please refer to www.eatonvance.com.
3
Eaton Vance Dividend Income Fund as of October 31, 2007
FUND EXPENSES
Example: As a shareholder of the Fund, you incur two types of costs: (1) transaction costs, including sales charges (loads) on purchases and redemption fees (if applicable); and (2) ongoing costs, including management fees; distribution or service fees; and other Fund expenses. This Example is intended to help you understand your ongoing costs (in dollars) of investing in the Fund and to compare these costs with the ongoing costs of investing in other mutual funds. The Example is based on an investment of $1,000 invested at the beginning of the period and held for the entire period (May 1, 2007 – October 31, 2007).
Actual Expenses: The first section of the table below provides information about actual account values and actual expenses. You may use the information in this section, together with the amount you invested, to estimate the expenses that you paid over the period. Simply divide your account value by $1,000 (for example, an $8,600 account value divided by $1,000 = 8.6), then multiply the result by the number in the first section under the heading entitled "Expenses Paid During Period" to estimate the expenses you paid on your account during this period.
Hypothetical Example for Comparison Purposes: The second section of the table below provides information about hypothetical account values and hypothetical expenses based on the Fund's actual expense ratio and an assumed rate of return of 5% per year (before expenses), which is not the actual return of the Fund. The hypothetical account values and expenses may not be used to estimate the actual ending account balance or expenses you paid for the period. You may use this information to compare the ongoing costs of investing in your Fund and other funds. To do so, compare this 5% hypothetical example with the 5% hypothetical examples that appear in the shareholder reports of the other funds.
Please note that the expenses shown in the table are meant to highlight your ongoing costs only and do not reflect any transactional costs, such as sales charges (loads) or redemption fees (if applicable). Therefore, the second section of the table is useful in comparing ongoing costs only, and will not help you determine the relative total costs of owning different funds. In addition, if these transactional costs were included, your costs would have been higher.
Eaton Vance Dividend Income Fund
| | | Beginning Account Value
(5/1/07) | | Ending Account Value
(10/31/07) | | Expenses Paid During Period*
(5/1/07 – 10/31/07) | |
| Actual | |
| Class A | | $ | 1,000.00 | | | $ | 1,063.10 | | | $ | 6.97 | | |
| Class C | | $ | 1,000.00 | | | $ | 1,058.70 | | | $ | 10.85 | | |
| Class I | | $ | 1,000.00 | | | $ | 1,064.30 | | | $ | 5.67 | | |
| Class R | | $ | 1,000.00 | | | $ | 1,061.60 | | | $ | 8.26 | | |
| Hypothetical | |
| (5% return per year before expenses) | |
| Class A | | $ | 1,000.00 | | | $ | 1,018.50 | | | $ | 6.82 | | |
| Class C | | $ | 1,000.00 | | | $ | 1,014.70 | | | $ | 10.61 | | |
| Class I | | $ | 1,000.00 | | | $ | 1,019.70 | | | $ | 5.55 | | |
| Class R | | $ | 1,000.00 | | | $ | 1,017.20 | | | $ | 8.08 | | |
* Expenses are equal to the Fund's annualized expense ratio of 1.34% for Class A shares, 2.09% for Class C shares, 1.09% for Class I shares, and 1.59% for Class R shares, multiplied by the average account value over the period, multiplied by 184/365 (to reflect the one-half year period). The Example assumes that the $1,000 was invested at the net asset value per share determined at the close of business on April 30, 2007. The Example reflects the expenses of both the Fund and the Portfolio.
4
Eaton Vance Dividend Income Fund as of October 31, 2007
FINANCIAL STATEMENTS
Statement of Assets and Liabilities
As of October 31, 2007
| Assets | |
Investment in Dividend Income Portfolio, at value
(identified cost, $260,006,734) | | $ | 287,068,343 | | |
| Receivable for Fund shares sold | | | 1,734,035 | | |
| Total assets | | $ | 288,802,378 | | |
| Liabilities | |
| Payable for Fund shares redeemed | | $ | 705,947 | | |
| Payable to affiliate for distribution and service fees | | | 130,518 | | |
| Payable to affiliate for administration fees | | | 35,085 | | |
| Payable to affiliate for Trustees' fees | | | 333 | | |
| Other accrued expenses | | | 82,361 | | |
| Total liabilities | | $ | 954,244 | | |
| Net Assets | | $ | 287,848,134 | | |
| Sources of Net Assets | |
| Paid-in capital | | $ | 270,405,301 | | |
Accumulated net realized loss from Portfolio
(computed on the basis of identified cost) | | | (10,047,393 | ) | |
| Accumulated undistributed net investment income | | | 428,617 | | |
Net unrealized appreciation from Portfolio
(computed on the basis of identified cost) | | | 27,061,609 | | |
| Total | | $ | 287,848,134 | | |
| Class A Shares | |
| Net Assets | | $ | 166,608,840 | | |
| Shares Outstanding | | | 13,179,373 | | |
Net Asset Value and Redemption Price Per Share
(net assets ÷ shares of beneficial interest outstanding) | | $ | 12.64 | | |
Maximum Offering Price Per Share
(100 ÷ 94.25 of $12.64) | | $ | 13.41 | | |
| Class C Shares | |
| Net Assets | | $ | 118,841,318 | | |
| Shares Outstanding | | | 9,445,990 | | |
Net Asset Value and Offering Price Per Share*
(net assets ÷ shares of beneficial interest outstanding) | | $ | 12.58 | | |
| Class I Shares | |
| Net Assets | | $ | 2,317,224 | | |
| Shares Outstanding | | | 183,350 | | |
Net Asset Value, Offering Price and Redemption Price Per Share
(net assets ÷ shares of beneficial interest outstanding) | | $ | 12.64 | | |
| Class R Shares | |
| Net Assets | | $ | 80,752 | | |
| Shares Outstanding | | | 6,380 | | |
Net Asset Value, Offering Price and Redemption Price Per Share
(net assets ÷ shares of beneficial interest outstanding) | | $ | 12.66 | | |
On sales of $50,000 or more, the offering price of Class A shares is reduced.
* Redemption price per share is equal to net asset value less any applicable contingent deferred sales charge.
Statement of Operations
For the Year Ended
October 31, 2007
| Investment Income | |
| Dividends allocated from Portfolio (net of foreign taxes, $485,173) | | $ | 11,693,857 | | |
| Interest allocated from Portfolio | | | 205,052 | | |
| Expenses allocated from Portfolio | | | (1,211,066 | ) | |
| Net investment income from Portfolio | | $ | 10,687,843 | | |
| Expenses | |
| Administration fee | | $ | 241,191 | | |
| Trustees' fees and expenses | | | 1,679 | | |
Distribution and service fees
Class A | | | 229,350 | | |
| Class C | | | 673,396 | | |
| Class R | | | 342 | | |
| Transfer and dividend disbursing agent fees | | | 151,794 | | |
| Registration fees | | | 85,188 | | |
| Printing and postage | | | 29,129 | | |
| Legal and accounting services | | | 26,732 | | |
| Custodian fee | | | 24,325 | | |
| Miscellaneous | | | 9,545 | | |
| Total expenses | | $ | 1,472,671 | | |
| Net investment income | | $ | 9,215,172 | | |
Realized and Unrealized
Gain (Loss) from Portfolio | |
Net realized gain (loss) —
Investment transactions (identified cost basis) | | $ | (8,698,862 | ) | |
| Foreign currency transactions | | | (15,054 | ) | |
| Net realized loss | | $ | (8,713,916 | ) | |
Change in unrealized appreciation (depreciation) from Portfolio —
Investments (identified cost basis) | | $ | 24,625,574 | | |
| Foreign currency | | | 379 | | |
Change in unrealized appreciation (depreciation) —
Investments (identified cost basis) | | | (147,249 | ) | |
| Foreign currency | | | 200 | | |
| Net change in unrealized appreciation (depreciation) | | $ | 24,478,904 | | |
| Net realized and unrealized gain | | $ | 15,764,988 | | |
| Net increase in net assets from operations | | $ | 24,980,160 | | |
See notes to financial statements
5
Eaton Vance Dividend Income Fund as of October 31, 2007
FINANCIAL STATEMENTS CONT'D
Statements of Changes in Net Assets
Increase (Decrease)
in Net Assets | | Year Ended
October 31, 2007 | | Period Ended
October 31, 2006(1) | |
From operations —
Net investment income | | $ | 9,215,172 | | | $ | 1,871,279 | | |
Net realized loss from investment transactions
and foreign currency transactions | | | (8,713,916 | ) | | | (1,408,936 | ) | |
Net change in unrealized appreciation
(depreciation) of investments and
foreign currency | | | 24,478,904 | | | | 2,582,705 | | |
| Net increase in net assets from operations | | $ | 24,980,160 | | | $ | 3,045,048 | | |
Distributions to shareholders —
From net investment income
Class A | | $ | (5,859,850 | ) | | $ | (500,351 | ) | |
| Class C | | | (3,828,527 | ) | | | (298,470 | ) | |
| Class I | | | (111,236 | ) | | | (479 | ) | |
| Class R | | | (4,211 | ) | | | (641 | ) | |
| Total distributions to shareholders | | $ | (9,803,824 | ) | | $ | (799,941 | ) | |
Transactions in shares of beneficial interest —
Proceeds from sale of shares
Class A | | $ | 140,876,450 | | | $ | 28,606,860 | | |
| Class C | | | 93,500,708 | | | | 22,333,000 | | |
| Class I | | | 2,069,784 | | | | 1,095,000 | | |
| Class R | | | 59,316 | | | | 26,066 | | |
Net asset value of shares issued to
shareholders in payment of
distributions declared
Class A | | | 4,069,253 | | | | 352,963 | | |
| Class C | | | 2,022,070 | | | | 151,748 | | |
| Class I | | | 84,895 | | | | 479 | | |
| Class R | | | 3,331 | | | | 641 | | |
Cost of shares redeemed
Class A | | | (16,583,175 | ) | | | (688,263 | ) | |
| Class C | | | (6,119,474 | ) | | | (306,784 | ) | |
| Class I | | | (1,111,732 | ) | | | — | | |
| Class R | | | (16,445 | ) | | | — | | |
Net increase in net assets from Fund
share transactions | | $ | 218,854,981 | | | $ | 51,571,710 | | |
| Net increase in net assets | | $ | 234,031,317 | | | $ | 53,816,817 | | |
| Net Assets | |
| At beginning of year | | $ | 53,816,817 | | | $ | — | | |
| At end of year | | $ | 287,848,134 | | | $ | 53,816,817 | | |
Accumulated undistributed
net investment income
included in net assets | |
| At end of year | | $ | 428,617 | | | $ | 1,032,503 | | |
(1) For the period from start of business, November 30, 2005, to October 31, 2006.
See notes to financial statements
6
Eaton Vance Dividend Income Fund as of October 31, 2007
FINANCIAL STATEMENTS CONT'D
Financial Highlights
| | | Class A | |
| | | Year Ended
October 31, 2007 | | Period Ended
October 31, 2006(1) | |
| Net asset value — Beginning of year | | $ | 11.410 | | | $ | 10.000 | | |
| Income from operations | |
| Net investment income(2) | | $ | 0.729 | | | $ | 1.401 | | |
| Net realized and unrealized gain | | | 1.282 | | | | 0.487 | | |
| Total income from operations | | $ | 2.011 | | | $ | 1.888 | | |
| Less distributions | |
| From net investment income | | $ | (0.781 | ) | | $ | (0.478 | ) | |
| Total distributions | | $ | (0.781 | ) | | $ | (0.478 | ) | |
| Net asset value — End of year | | $ | 12.640 | | | $ | 11.410 | | |
| Total Return(3) | | | 18.18 | % | | | 19.26 | %(9) | |
| Ratios/Supplemental Data | |
| Net assets, end of year (000's omitted) | | $ | 166,609 | | | $ | 29,586 | | |
| Ratios (As a percentage of average daily net assets): | | | | | | | | | |
| Expenses before custodian fee reduction(4) | | | 1.36 | % | | | 1.41 | %(5)(6) | |
| Expenses after custodian fee reduction(4) | | | 1.36 | % | | | 1.40 | %(5)(6) | |
| Net investment income(4) | | | 6.00 | % | | | 14.04 | %(5)(6) | |
| Portfolio Turnover of the Fund(7) | | | — | | | | 35 | % | |
| Portfolio Turnover of the Portfolio | | | 87 | % | | | 170 | %(8) | |
(1) For the period from the start of business, November 30, 2005, to October 31, 2006.
(2) Net investment income per share was computed using average shares outstanding.
(3) Returns are historical and are calculated by determining the percentage change in net asset value with all distributions reinvested.
(4) Includes the Fund's share of the Portfolio's allocated expenses.
(5) The administrator subsidized certain operating expenses (equal to 1.21% of average net assets for the period from the start of business, November 30, 2005, to October 31, 2006).
(6) Annualized.
(7) Represents the rate of portfolio activity for the period during which the Fund was making investments directly in securities.
(8) For the period from the Portfolio's start of business, March 24, 2006, to October 31, 2006.
(9) Not annualized.
See notes to financial statements
7
Eaton Vance Dividend Income Fund as of October 31, 2007
FINANCIAL STATEMENTS CONT'D
Financial Highlights
| | | Class C | |
| | | Year Ended
October 31, 2007 | | Period Ended
October 31, 2006(1) | |
| Net asset value — Beginning of year | | $ | 11.360 | | | $ | 10.000 | | |
| Income from operations | |
| Net investment income(2) | | $ | 0.644 | | | $ | 1.322 | | |
| Net realized and unrealized gain | | | 1.270 | | | | 0.470 | | |
| Total income from operations | | $ | 1.914 | | | $ | 1.792 | | |
| Less distributions | |
| From net investment income | | $ | (0.694 | ) | | $ | (0.432 | ) | |
| Total distributions | | $ | (0.694 | ) | | $ | (0.432 | ) | |
| Net asset value — End of year | | $ | 12.580 | | | $ | 11.360 | | |
| Total Return(3) | | | 17.31 | % | | | 18.25 | %(9) | |
| Ratios/Supplemental Data | |
| Net assets, end of year (000's omitted) | | $ | 118,841 | | | $ | 23,105 | | |
| Ratios (As a percentage of average daily net assets): | | | | | | | | | |
| Expenses before custodian fee reduction(4) | | | 2.11 | % | | | 2.16 | %(5)(6) | |
| Expenses after custodian fee reduction(4) | | | 2.11 | % | | | 2.15 | %(5)(6) | |
| Net investment income(4) | | | 5.33 | % | | | 13.27 | %(5)(6) | |
| Portfolio Turnover of the Fund(7) | | | — | | | | 35 | % | |
| Portfolio Turnover of the Portfolio | | | 87 | % | | | 170 | %(8) | |
(1) For the period from the start of business, November 30, 2005, to October 31, 2006.
(2) Net investment income per share was computed using average shares outstanding.
(3) Returns are historical and are calculated by determining the percentage change in net asset value with all distributions reinvested.
(4) Includes the Fund's share of the Portfolio's allocated expenses.
(5) The administrator subsidized certain operating expenses (equal to 1.21% of average net assets for the period from the start of business, November 30, 2005, to October 31, 2006).
(6) Annualized.
(7) Represents the rate of portfolio activity for the period during which the Fund was making investments directly in securities.
(8) For the period from the Portfolio's start of business, March 24, 2006, to October 31, 2006.
(9) Not annualized.
See notes to financial statements
8
Eaton Vance Dividend Income Fund as of October 31, 2007
FINANCIAL STATEMENTS CONT'D
Financial Highlights
| | | Class I | |
| | | Year Ended
October 31, 2007 | | Period Ended
October 31, 2006(1) | |
| Net asset value — Beginning of year | | $ | 11.410 | | | $ | 10.610 | | |
| Income (loss) from operations | |
| Net investment income(2) | | $ | 0.831 | | | $ | 1.912 | | |
| Net realized and unrealized gain (loss) | | | 1.209 | | | | (0.614 | )(3) | |
| Total income from operations | | $ | 2.040 | | | $ | 1.298 | | |
| Less distributions | |
| From net investment income | | $ | (0.810 | ) | | $ | (0.498 | ) | |
| Total distributions | | $ | (0.810 | ) | | $ | (0.498 | ) | |
| Net asset value — End of year | | $ | 12.640 | | | $ | 11.410 | | |
| Total Return(4) | | | 18.45 | % | | | 12.62 | %(10) | |
| Ratios/Supplemental Data | |
| Net assets, end of year (000's omitted) | | $ | 2,317 | | | $ | 1,098 | | |
| Ratios (As a percentage of average daily net assets): | | | | | | | | | |
| Expenses before custodian fee reduction(5) | | | 1.11 | % | | | 1.16 | %(6)(7) | |
| Expenses after custodian fee reduction(5) | | | 1.11 | % | | | 1.15 | %(6)(7) | |
| Net investment income(5) | | | 6.87 | % | | | 25.28 | %(6)(7) | |
| Portfolio Turnover of the Fund(8) | | | — | | | | 35 | % | |
| Portfolio Turnover of the Portfolio | | | 87 | % | | | 170 | %(9) | |
(1) For the period from the initial issuance of Class I shares, January 31, 2006, to October 31, 2006.
(2) Net investment income per share was computed using average shares outstanding.
(3) The per share amount is not in accord with the net realized and unrealized gain (loss) for the period because of the timing of sales of the Fund shares and the amount of the per share realized and unrealized gains and losses at such time.
(4) Returns are historical and are calculated by determining the percentage change in net asset value with all distributions reinvested.
(5) Includes the Fund's share of the Portfolio's allocated expenses.
(6) The administrator subsidized certain operating expenses (equal to 1.21% of average net assets for the period from the initial issuance of shares, January 31, 2006, to October 31, 2006).
(7) Annualized.
(8) Represents the rate of portfolio activity for the period during which the Fund was making investments directly in securities.
(9) For the period from the Portfolio's start of business, March 24, 2006, to October 31, 2006.
(10) Not annualized.
See notes to financial statements
9
Eaton Vance Dividend Income Fund as of October 31, 2007
FINANCIAL STATEMENTS CONT'D
Financial Highlights
| | | Class R | |
| | | Year Ended
October 31, 2007 | | Period Ended
October 31, 2006(1) | |
| Net asset value — Beginning of year | | $ | 11.400 | | | $ | 10.610 | | |
| Income from operations | |
| Net investment income(2) | | $ | 0.788 | | | $ | 1.162 | | |
| Net realized and unrealized gain | | | 1.222 | | | | 0.090 | | |
| Total income from operations | | $ | 2.010 | | | $ | 1.252 | | |
| Less distributions | |
| From net investment income | | $ | (0.750 | ) | | $ | (0.462 | ) | |
| Total distributions | | $ | (0.750 | ) | | $ | (0.462 | ) | |
| Net asset value — End of year | | $ | 12.660 | | | $ | 11.400 | | |
| Total Return(3) | | | 18.15 | % | | | 12.15 | %(9) | |
| Ratios/Supplemental Data | |
| Net assets, end of year (000's omitted) | | $ | 81 | | | $ | 28 | | |
| Ratios (As a percentage of average daily net assets): | | | | | | | | | |
| Expenses before custodian fee reduction(4) | | | 1.61 | % | | | 1.66 | %(5)(6) | |
| Expenses after custodian fee reduction(4) | | | 1.61 | % | | | 1.65 | %(5)(6) | |
| Net investment income(4) | | | 6.51 | % | | | 14.30 | %(5)(6) | |
| Portfolio Turnover of the Fund(7) | | | — | | | | 35 | % | |
| Portfolio Turnover of the Portfolio | | | 87 | % | | | 170 | %(8) | |
(1) For the period from the initial issuance of Class R shares, January 31, 2006, to October 31, 2006.
(2) Net investment income per share was computed using average shares outstanding.
(3) Returns are historical and are calculated by determining the percentage change in net asset value with all distributions reinvested.
(4) Includes the Fund's share of the Portfolio's allocated expenses.
(5) The administrator subsidized certain operating expenses (equal to 1.21% of average net assets for the period from the initial issuance of shares, January 31, 2006, to October 31, 2006).
(6) Annualized.
(7) Represents the rate of portfolio activity for the period during which the Fund was making investments directly in securities.
(8) For the period from the Portfolio's start of business, March 24, 2006, to October 31, 2006.
(9) Not annualized.
See notes to financial statements
10
Eaton Vance Dividend Income Fund as of October 31, 2007
NOTES TO FINANCIAL STATEMENTS
1 Significant Accounting Policies
Eaton Vance Dividend Income Fund (the Fund) is a diversified series of Eaton Vance Mutual Funds Trust (the Trust). The Trust is a Massachusetts business trust registered under the Investment Company Act of 1940, as amended (the 1940 Act), as an open-end management investment company. The Fund offers four classes of shares. Class A shares are generally sold subject to a sales charge imposed at time of purchase. Class C shares are sold at net asset value and are subject to a contingent deferred sales charge (see Note 6). Class I and Class R shares are offered at net asset value and are not subject to a sales charge. Each class represents a pro-rata interest in the Fund, but votes separately on class-specific matters and (as noted below) is subject to different expenses. Realized and unrealized gains and losses and net investment income and losses, other than class-specific expenses, are allocated daily to each class of shares base d on the relative net assets of each class to the total net assets of the Fund. Each class of shares differs in its distribution plan and certain other class-specific expenses. The Fund invests all of its investable assets in interests of the Dividend Income Portfolio (the Portfolio), a New York trust, having the same investment objective and policies as the Fund. The value of the Fund's investment in the Portfolio reflects the Fund's proportionate interest in the net assets of the Portfolio (90.8% at October 31, 2007). The performance of the Fund is directly affected by the performance of the Portfolio. The financial statements of the Portfolio, including the portfolio of investments, are included elsewhere in this report and should be read in conjunction with the Fund's financial statements.
The following is a summary of significant accounting policies of the Fund. The policies are in conformity with accounting principles generally accepted in the United States of America.
A Investment Valuation — Valuation of securities by the Portfolio is discussed in Note 1A of the Portfolio's Notes to Financial Statements, which are included elsewhere in this report.
B Income — The Fund's net investment income or loss consists of the Fund's pro-rata share of the net investment income or loss of the Portfolio, less all actual and accrued expenses of the Fund.
C Federal Taxes — The Fund's policy is to comply with the provisions of the Internal Revenue Code applicable to regulated investment companies and to distribute to shareholders each year substantially all of its net investment income, and all or substantially all of its net realized capital gains. Accordingly, no provision for federal income or excise tax is necessary. At October 31, 2007, the Fund, for federal income tax purposes, had a capital loss carryforward of $9,866,279, which will reduce the Fund's taxable income arising from future net realized gain on investments, if any, to the extent permitted by the Internal Revenue Code, and thus will reduce the amount of distributions to shareholders wh ich would otherwise be necessary to relieve the Fund of any liability for federal income or excise tax. Such capital loss carryforward will expire on October 31, 2014 ($1,311,256) and October 31, 2015 ($8,555,023).
D Expenses — The majority of expenses of the Trust are directly identifiable to an individual fund. Expenses which are not readily identifiable to a specific fund are allocated taking into consideration, among other things, the nature and type of expense and the relative size of the funds.
E Expense Reduction — State Street Bank and Trust Company (SSBT) serves as custodian of the Fund. Pursuant to the custodian agreement, SSBT receives a fee reduced by credits, which are determined based on the average daily cash balance the Fund maintains with SSBT. All credit balances, if any, used to reduce the Fund's custodian fees are reported as a reduction of expenses in the Statement of Operations.
F Use of Estimates — The preparation of the financial statements in conformity with accounting principles generally accepted in the United States of America requires management to make estimates and assumptions that affect the reported amounts of assets and liabilities at the date of the financial statements and the reported amounts of income and expense during the reporting period. Actual results could differ from those estimates.
G Indemnifications — Under the Trust's organizational documents, its officers and Trustees may be indemnified against certain liabilities and expenses arising out of the performance of their duties to the Fund, and shareholders are indemnified against personal liability for obligations of the Trust. Additionally, in the normal course of business, the Fund enters into agreements with service providers that may contain indemnification clauses. The Fund's maximum exposure under these arrangements is unknown as this would involve future claims that may be made against the Fund that have not yet occurred.
11
Eaton Vance Dividend Income Fund as of October 31, 2007
NOTES TO FINANCIAL STATEMENTS CONT'D
H Other — Investment transactions are accounted for on a trade date basis. Dividends to shareholders are recorded on the ex-dividend date.
2 Distribution to Shareholders
It is the present policy of the Fund to make monthly distributions to shareholders of all or substantially all of the net investment income allocated to the Fund by the Portfolio, less the Fund's direct and allocated expenses, and to distribute at least annually (normally in December) all or substantially all of the net realized capital gains allocated to the Fund by the Portfolio (reduced by available capital loss carryforwards from prior years, if any). Distributions are declared separately for each class of shares. Distributions are paid in the form of additional shares of the same class of the Fund or, at the election of the shareholder, in cash. Shareholders may reinvest distributions in additional shares of the same class of the Fund at the net asset value as of the reinvestment date. The Fund distinguishes between distributions on a tax basis and a financial reporting basis. Accounting principles generally accepted in the United States of America require that only distributions in excess of tax basis earnings and profits be reported in the financial statements as a return of capital. Permanent differences between book and tax accounting relating to distributions are reclassified to paid-in capital.
The tax character of distributions paid was as follows:
| | | For the Year Ended
October 31, 2007 | | Period Ended
October 31, 2006(1) | |
| Distributions declared from: | |
| Ordinary income | | $ | 9,803,824 | | | $ | 799,941 | | |
(1) For the period from the start of business, November 30, 2005, to October 31, 2006.
During the year ended October 31, 2007, the following amounts were reclassified due to differences between book and tax accounting, primarily for foreign currency gain(loss):
| Increase (decrease): | |
| Accumulated net realized loss | | $ | 15,234 | | |
| Accumulated undistributed net investment income | | $ | (15,234 | ) | |
These reclassifications had no effect on the net assets or net asset value per share of the Fund.
As of October 31, 2007, the components of distributable earnings (accumulated losses) and unrealized appreciation (depreciation) on a tax basis were as follows:
| Undistributed ordinary income | | $ | 428,617 | | |
| Capital loss carryforwards | | $ | (9,866,279 | ) | |
| Unrealized appreciation (depreciation) | | $ | 26,880,495 | | |
The differences between components of distributable earnings (accumulated losses) on a tax basis and the amounts reflected in the Statement of Assets and Liabilities are primarily due to wash sales and partnership allocations.
3 Shares of Beneficial Interest
The Fund's Declaration of Trust permits the Trustees to issue an unlimited number of full and fractional shares of beneficial interest (without par value). Such shares may be issued in a number of different series (such as the Fund) and classes. Transactions in Fund shares were as follows:
| Class A | | Year Ended
October 31, 2007 | | Period Ended
October 31, 2006(1) | |
| Sales | | | 11,623,281 | | | | 2,624,720 | | |
Issued to shareholders electing to
receive payments of distributions
in Fund shares | | | 334,945 | | | | 32,394 | | |
| Redemptions | | | (1,372,583 | ) | | | (63,384 | ) | |
| Net increase | | | 10,585,643 | | | | 2,593,730 | | |
| Class C | | Year Ended
October 31, 2007 | | Period Ended
October 31, 2006(1) | |
| Sales | | | 7,754,795 | | | | 2,048,157 | | |
Issued to shareholders electing to
receive payments of distributions
in Fund shares | | | 167,204 | | | | 13,936 | | |
| Redemptions | | | (510,023 | ) | | | (28,079 | ) | |
| Net increase | | | 7,411,976 | | | | 2,034,014 | | |
12
Eaton Vance Dividend Income Fund as of October 31, 2007
NOTES TO FINANCIAL STATEMENTS CONT'D
| Class I | | Year Ended
October 31, 2007 | | Period Ended
October 31, 2006(2) | |
| Sales | | | 170,313 | | | | 96,202 | | |
Issued to shareholders electing to
receive payments of distributions
in Fund shares | | | 7,024 | | | | 44 | | |
| Redemptions | | | (90,233 | ) | | | — | | |
| Net increase | | | 87,104 | | | | 96,246 | | |
| Class R | | Year Ended
October 31, 2007 | | Period Ended
October 31, 2006(2) | |
| Sales | | | 4,961 | | | | 2,413 | | |
Issued to shareholders electing to
receive payments of distributions
in Fund shares | | | 275 | | | | 59 | | |
| Redemptions | | | (1,328 | ) | | | — | | |
| Net increase | | | 3,908 | | | | 2,472 | | |
(1) For the period from the start of business, November 30, 2005, to October 31, 2006.
(2) For the period from the initial issuance of shares, January 31, 2006, to October 31, 2006.
4 Transactions with Affiliates
The administration fee is earned by Eaton Vance Management (EVM) as compensation for managing and administering the business affairs of the Fund. Under the administration agreement, EVM earns a fee in the amount of 0.15% per annum of the average daily net assets of the Fund. For the year ended October 31, 2007, the administration fee amounted to $241,191. The Portfolio has engaged Boston Management and Research (BMR), a subsidiary of EVM, to render investment advisory services. See Note 2 of the Portfolio's Notes to Financial Statements which are included elsewhere in this report. EVM serves as the sub-transfer agent of the Fund and receives from the transfer agent an aggregate fee based upon the actual expenses incurred by EVM in the performance of those services. For the year ended October 31, 2007, EVM received approximately $8,000 in sub-transfer agent fees.
Eaton Vance Distributors, Inc, (EVD), a subsidiary of EVM and the Fund's principal underwriter, received $320,420 as its portion of the sales charge on sales of Class A shares for the year ended October 31, 2007. EVD also received distribution and service fees from Class A, Class C and Class R shares (see Note 5) and contingent deferred sales charges (see Note 6).
Except for Trustees of the Fund and the Portfolio who are not members of EVM's or BMR's organizations, officers and Trustees receive remuneration for their services to the Fund out of the investment adviser fee earned by BMR. Certain officers and Trustees of the Fund and Portfolio are officers of the above organizations.
5 Distribution Plans
The Fund has in effect a distribution plan for Class A shares (Class A Plan) pursuant to Rule 12b-1 under the 1940 Act. The Class A Plan provides that the Fund will pay EVD a distribution and service fee of 0.25% per annum of the Fund's average daily net assets attributable to Class A shares for distribution services and facilities provided to the Fund by EVD, as well as for personal services and/or the maintenance of shareholder accounts. Distribution and service fees paid or accrued for the year ended October 31, 2007, amounted to $229,350 for Class A shares. The Fund also has in effect distribution plans for Class C shares (Class C Plan) and Class R shares (Class R Plan) pursuant to Rule 12b-1 of the 1940 Act. The Class C Plan requires the Fund to pay EVD amounts equal to 0.75% per annum of the Fund's average daily net assets attributable to Class C shares for providing ongoing distribution services and facilities to the Fund . The Fund will automatically discontinue payments to EVD during any period in which there are no outstanding Uncovered Distribution Charges, which are equivalent to the sum of (i) 6.25% of the aggregate amount received by the Fund for the Class C shares sold, plus (ii) interest calculated by applying the rate of 1% over the prevailing prime rate to the outstanding balance of Uncovered Distribution Charges of EVD of Class C, reduced by the aggregate amount of contingent deferred sales charges (see Note 6) and amounts theretofore paid to EVD by Class C. The Fund paid or accrued $505,047 for Class C shares to or payable to EVD for the year ended October 31, 2007. At October 31, 2007, the amount of Uncovered Distribution Charges of EVD calculated under the Class C Plan was approximately $6,085,000 for Class C shares. The Class R Plan requires the Fund to pay EVD amounts up to 0.50% per annum of the Fund's average daily net assets attributable to Class R shares for providing ongoing distribution services and fac ilities to the Fund. The Trustees of the Fund have currently limited the Class R distribution payments to 0.25% per annum of the Fund's average daily net assets attributable to the Class R shares. The Fund paid or accrued $171 for Class R shares, to or payable to EVD for the year ended October 31, 2007. The Class C and Class R Plans also authorize the Fund to make payments of service fees to EVD, investment dealers and other persons in amounts not exceeding 0.25% per annum of the Fund's average daily
13
Eaton Vance Dividend Income Fund as of October 31, 2007
NOTES TO FINANCIAL STATEMENTS CONT'D
net assets attributable to Class C and Class R shares. Service fees are paid for personal services and/or the maintenance of shareholder accounts. They are separate and distinct from sales commissions and distribution fees payable and as such, are not subject to automatic discontinuance when there are no outstanding Uncovered Distribution Charges to EVD. Service fees paid or accrued for the year ended October 31, 2007 amounted to $168,349, and $171, for Class C and Class R shares, respectively.
6 Contingent Deferred Sales Charge
A contingent deferred sales charge (CDSC) of 1% generally is imposed on redemptions of Class C shares made within one year of purchase. Class A shares may be subject to a 1% CDSC if redeemed within eighteen months of purchase (depending upon the circumstances of purchase). Generally, the CDSC is based upon the lower of the net asset value at date of redemption or date of purchase. No charge is levied on shares acquired by reinvestment of dividends or capital gain distributions. No CDSC is levied on shares which have been sold to EVM or its affiliates or to their respective employees or clients and may be waived under certain other limited conditions. CDSC are paid to EVD to reduce the amount of Uncovered Distribution Charges calculated under the Plans (see Note 5). CDSC received when no Uncovered Distribution Charges exist will be credited to the Fund. The Fund was informed that EVD received approximately $11,000 and $16,000 of CDSC paid by shareholders for Class A shares and Class C shares, respectively, for the year ended October 31, 2007.
7 Investments Transactions
Increases and decreases in the Fund's investment in the Portfolio aggregated $237,005,517 and $27,916,674 respectively for the year ended October 31, 2007.
8 Recently Issued Accounting Pronouncements
In June 2006, the Financial Accounting Standards Board (FASB) issued FASB Interpretation No. 48 (FIN 48), "Accounting for Uncertainty in Income Taxes – an interpretation of FASB Statement No. 109". FIN 48 clarifies the accounting for uncertainty in income taxes recognized in accordance with FASB Statement No. 109, "Accounting for Income Taxes". This interpretation prescribes a recognition threshold and measurement attribute for the financial statement recognition and measurement of a tax position taken or expected to be taken in a tax return. It also provides guidance on de-recognition, classification, interest and penalties, accounting in interim periods, disclosure and transition. FIN 48 is effective on the last business day of the first required financial reporting period for fiscal years beginning after December 15, 2006. Management is currently eva luating the impact of applying the various provisions of FIN 48.
In September 2006, the FASB issued Statement of Financial Accounting Standards No. 157 (FAS 157), "Fair Value Measurements". FAS 157 defines fair value, establishes a framework for measuring fair value in accordance with generally accepted accounting principles and expands disclosure about fair value measurements. FAS 157 is effective for fiscal years beginning after November 15, 2007. Management is currently evaluating the impact the adoption of FAS 157 will have on the Fund's financial statement disclosures.
14
Eaton Vance Dividend Income Fund as of October 31, 2007
REPORT OF INDEPENDENT REGISTERED PUBLIC ACCOUNTING FIRM
To the Trustees of Eaton Vance Mutual Funds Trust and Shareholders of Eaton Vance
Dividend Income Fund:
We have audited the accompanying statement of assets and liabilities of Dividend Income Fund (the "Fund") (one of the series of Eaton Vance Mutual Funds Trust) as of October 31, 2007, and the related statements of operations for the year then ended and the statements of changes in net assets and the financial highlights for the year then ended and the period from the start of business, November 30, 2005, to October 31, 2006. These financial statements and financial highlights are the responsibility of the Fund's management. Our responsibility is to express an opinion on these financial statements and financial highlights based on our audits.
We conducted our audits in accordance with the standards of the Public Company Accounting Oversight Board (United States). Those standards require that we plan and perform the audit to obtain reasonable assurance about whether the financial statements and financial highlights are free of material misstatement. The Fund is not required to have, nor were we engaged to perform, an audit of its internal control over financial reporting. Our audits included consideration of internal control over financial reporting as a basis for designing audit procedures that are appropriate in the circumstances, but not for the purpose of expressing an opinion on the effectiveness of the Fund's internal control over financial reporting. Accordingly, we express no such opinion. An audit also includes examining, on a test basis, evidence supporting the amounts and disclosures in the financial statements, assessing the accounting principles used and significant estimates made by management, as well as evaluating the overall financial statement presentation. We believe that our audits provide a reasonable basis for our opinion.
In our opinion, the financial statements and financial highlights referred to above present fairly, in all material respects, the financial position of Dividend Income Fund as of October 31, 2007 and the results of its operations for the year then ended and the changes in its net assets and the financial highlights for the year then ended and the period from the start of business, November 30, 2005, to October 31, 2006, in conformity with accounting principles generally accepted in the United States of America.
DELOITTE & TOUCHE LLP
Boston, Massachusetts
December 17, 2007
15
Eaton Vance Dividend Income Fund as of October 31, 2007
FEDERAL TAX INFORMATION (Unaudited)
The Form 1099-DIV you receive in January 2008 will show the tax status of all distributions paid to your account in calendar 2007. Shareholders are advised to consult their own tax adviser with respect to the tax consequences of their investment in the Fund. As required by the Internal Revenue Code regulations, shareholders must be notified within 60 days of the Fund's fiscal year end regarding the status of qualified dividend income for individuals and the dividends received deduction for corporations.
Qualified Dividend Income. The Fund designates $9,346,069, or up to the maximum amount of such dividends allowable pursuant to the Internal Revenue Code, as qualified dividend income eligible for the reduced tax rate of 15%.
Dividends Received Deduction. Corporate shareholders are generally entitled to take the dividends received deduction on the portion of the Fund's dividend distribution that qualifies under tax law. For the Fund's fiscal 2007 ordinary income dividends, 48.3% qualifies for the corporate dividends received deduction.
16
Dividend Income Portfolio as of October 31, 2007
PORTFOLIO OF INVESTMENTS
| Common Stocks — 99.7% | |
| Security | | Shares | | Value | |
| Aerospace & Defense — 5.9% | |
| General Dynamics Corp. | | | 70,500 | | | $ | 6,412,680 | | |
| Lockheed Martin Corp. | | | 54,800 | | | | 6,030,192 | | |
| United Technologies Corp. | | | 82,928 | | | | 6,351,456 | | |
| | | $ | 18,794,328 | | |
| Auto Components — 0.7% | |
| Johnson Controls, Inc. | | | 51,000 | | | $ | 2,229,720 | | |
| | | $ | 2,229,720 | | |
| Beverages — 0.8% | |
| Diageo PLC ADR | | | 26,300 | | | $ | 2,413,025 | | |
| | | $ | 2,413,025 | | |
| Capital Markets — 1.6% | |
| Bank of New York Mellon Corp. | | | 35,200 | | | $ | 1,719,520 | | |
| Credit Suisse Group ADR | | | 48,500 | | | | 3,283,450 | | |
| | | $ | 5,002,970 | | |
| Commercial Banks — 11.0% | |
| Bank of Nova Scotia(1) | | | 41,395 | | | $ | 2,327,227 | | |
| Intesa Sanpaolo(1) | | | 529,000 | | | | 4,191,371 | | |
| KBC Groep NV(1) | | | 43,090 | | | | 6,048,857 | | |
| National Bank of Greece SA(1) | | | 88,200 | | | | 6,155,491 | | |
| Standard Chartered PLC(1) | | | 161,000 | | | | 6,256,134 | | |
| Wachovia Corp. | | | 91,950 | | | | 4,204,874 | | |
| Wells Fargo & Co. | | | 164,500 | | | | 5,594,645 | | |
| | | $ | 34,778,599 | | |
| Communications Equipment — 1.0% | |
| Nokia Oyj Sponsored ADR | | | 80,200 | | | $ | 3,185,544 | | |
| | | $ | 3,185,544 | | |
| Computer Peripherals — 2.2% | |
| IBM Corp. | | | 61,081 | | | $ | 7,092,726 | | |
| | | $ | 7,092,726 | | |
| Containers & Packaging — 1.1% | |
| Temple-Inland, Inc. | | | 66,600 | | | $ | 3,574,422 | | |
| | | $ | 3,574,422 | | |
| Security | | Shares | | Value | |
| Diversified Financial Services — 5.6% | |
| Bank of America Corp. | | | 109,590 | | | $ | 5,291,005 | | |
| Citigroup, Inc. | | | 148,133 | | | | 6,206,773 | | |
| JPMorgan Chase & Co. | | | 130,000 | | | | 6,110,000 | | |
| | | $ | 17,607,778 | | |
| Diversified Telecommunication Services — 6.0% | |
| AT&T, Inc. | | | 143,967 | | | $ | 6,016,381 | | |
| Elisa Oyj(1) | | | 45,500 | | | | 1,351,992 | | |
| Embarq Corp. | | | 26,800 | | | | 1,418,256 | | |
| Telefonos de Mexico SA de CV ADR | | | 62,130 | | | | 2,272,094 | | |
| Verizon Communications, Inc. | | | 142,060 | | | | 6,544,704 | | |
| Windstream Corp. | | | 101,500 | | | | 1,365,175 | | |
| | | $ | 18,968,602 | | |
| Electric Utilities — 4.2% | |
| CPFL Energia SA ADR | | | 35,800 | | | $ | 2,381,416 | | |
| E. ON AG(1) | | | 22,466 | | | | 4,386,670 | | |
| E. ON AG ADR | | | 2 | | | | 130 | | |
| Enel SPA(1) | | | 168,000 | | | | 2,011,887 | | |
| Fortum Oyj(1) | | | 76,092 | | | | 3,304,647 | | |
| Scottish and Southern Energy PLC(1) | | | 39,900 | | | | 1,292,654 | | |
| | | $ | 13,377,404 | | |
| Energy Equipment & Services — 3.5% | |
| Diamond Offshore Drilling, Inc. | | | 83,388 | | | $ | 9,442,023 | | |
| Halliburton Co. | | | 39,000 | | | | 1,537,380 | | |
| | | $ | 10,979,403 | | |
| Food & Staples Retailing — 0.4% | |
| Wal-Mart Stores, Inc. | | | 25,300 | | | $ | 1,143,813 | | |
| | | $ | 1,143,813 | | |
| Food Products — 2.8% | |
| Cadbury Schweppes PLC ADR | | | 36,081 | | | $ | 1,920,952 | | |
| Nestle SA(1) | | | 15,198 | | | | 7,015,745 | | |
| Nestle SA ADR | | | 3 | | | | 342 | | |
| | | $ | 8,937,039 | | |
See notes to financial statements
17
Dividend Income Portfolio as of October 31, 2007
PORTFOLIO OF INVESTMENTS CONT'D
| Security | | Shares | | Value | |
| Hotels, Restaurants & Leisure — 2.0% | |
| McDonald's Corp. | | | 74,400 | | | $ | 4,441,680 | | |
| Starwood Hotels & Resorts Worldwide, Inc. | | | 34,400 | | | | 1,955,984 | | |
| | | $ | 6,397,664 | | |
| Household Products — 0.9% | |
| Kimberly-Clark Corp. | | | 16,670 | | | $ | 1,181,736 | | |
| Kimberly-Clark de Mexico S.A. de C.V.(1) | | | 362,500 | | | | 1,571,493 | | |
| | | $ | 2,753,229 | | |
| Industrial Conglomerates — 1.9% | |
| General Electric Co. | | | 145,450 | | | $ | 5,986,722 | | |
| | | $ | 5,986,722 | | |
| Insurance — 6.9% | |
| AFLAC, Inc. | | | 111,600 | | | $ | 7,006,248 | | |
| Brit Insurance Holdings PLC(1) | | | 197,500 | | | | 1,335,751 | | |
| Chubb Corp. | | | 38,000 | | | | 2,027,300 | | |
| Fidelity National Financial, Inc. | | | 149,025 | | | | 2,293,495 | | |
| Hartford Financial Services Group, Inc. | | | 30,000 | | | | 2,910,900 | | |
| Lincoln National Corp. | | | 98,300 | | | | 6,130,971 | | |
| | | $ | 21,704,665 | | |
| Machinery — 5.8% | |
| Atlas Copco AB, Class A(1) | | | 129,200 | | | $ | 2,168,590 | | |
| Eaton Corp. | | | 52,000 | | | | 4,814,160 | | |
| Illinois Tool Works, Inc. | | | 114,300 | | | | 6,544,818 | | |
| Vallourec SA(1) | | | 16,300 | | | | 4,740,700 | | |
| | | $ | 18,268,268 | | |
| Media — 1.3% | |
| Time Warner Inc. | | | 234,400 | | | $ | 4,280,144 | | |
| | | $ | 4,280,144 | | |
| Metals & Mining — 5.1% | |
| BHP Billiton, Ltd. ADR | | | 50,600 | | | $ | 4,415,356 | | |
| Freeport-McMoRan Copper & Gold, Inc., Class B | | | 40,631 | | | | 4,781,456 | | |
| Southern Copper Corp. | | | 50,000 | | | | 6,985,000 | | |
| | | $ | 16,181,812 | | |
| Security | | Shares | | Value | |
| Multi-Utilities — 1.9% | |
| CMS Energy Corp. | | | 32,000 | | | $ | 543,040 | | |
| Consolidated Edison, Inc. | | | 67,000 | | | | 3,155,030 | | |
| Energy East Corp. | | | 27,000 | | | | 752,760 | | |
| RWE AG(1) | | | 10,595 | | | | 1,445,582 | | |
| | | $ | 5,896,412 | | |
| Oil, Gas & Consumable Fuels — 12.9% | |
| Chevron Corp. | | | 70,100 | | | $ | 6,414,851 | | |
| ConocoPhillips | | | 78,103 | | | | 6,635,631 | | |
| Exxon Mobil Corp. | | | 68,529 | | | | 6,303,983 | | |
| Occidental Petroleum Corp. | | | 106,160 | | | | 7,330,348 | | |
| Total SA ADR | | | 93,770 | | | | 7,558,800 | | |
| Williams Cos., Inc. (The) | | | 178,165 | | | | 6,501,241 | | |
| | | $ | 40,744,854 | | |
| Pharmaceuticals — 5.3% | |
| GlaxoSmithKline PLC ADR | | | 60,454 | | | $ | 3,098,268 | | |
| Johnson & Johnson | | | 93,685 | | | | 6,105,451 | | |
| Pfizer, Inc. | | | 229,564 | | | | 5,649,570 | | |
| Wyeth | | | 37,981 | | | | 1,847,016 | | |
| | | $ | 16,700,305 | | |
| Real Estate Investment Trusts (REITs) — 1.7% | |
| AvalonBay Communities, Inc. | | | 4,800 | | | $ | 588,720 | | |
| Simon Property Group, Inc. | | | 47,490 | | | | 4,944,184 | | |
| | | $ | 5,532,904 | | |
| Tobacco — 4.2% | |
| Altria Group, Inc. | | | 92,445 | | | $ | 6,742,014 | | |
| Loews Corp. - Carolina Group | | | 76,500 | | | | 6,562,170 | | |
| | | $ | 13,304,184 | | |
| Water Utilities — 1.7% | |
| Severn Trent PLC(1) | | | 177,000 | | | $ | 5,343,197 | | |
| | | $ | 5,343,197 | | |
See notes to financial statements
18
Dividend Income Portfolio as of October 31, 2007
PORTFOLIO OF INVESTMENTS CONT'D
| Security | | Shares | | Value | |
| Wireless Telecommunication Services — 1.3% | |
| Vodafone Group PLC ADR | | | 106,500 | | | $ | 4,182,255 | | |
| | | $ | 4,182,255 | | |
Total Common Stocks
(identified cost $283,422,449) | | | | | | $ | 315,361,988 | | |
| Other Investments — 0.0% | |
| Description | | Shares | | Value | |
| Cairn Energy PLC, Class B, Deferred Shares(1)(2)(3) | | | 59,500 | | | $ | 0 | | |
| Kelda Group PLC, Deferred Shares(1)(2)(3) | | | 269,800 | | | | 0 | | |
Total Other Investments
(identified cost $0) | | | | | | $ | 0 | | |
| Short-Term Investments — 2.8% | |
| Description | | Interest
(000's omitted) | | Value | |
| Investment in Cash Management Portfolio, 4.83%(4) | | | 8,679 | | | $ | 8,679,217 | | |
Total Short-Term Investments
(identified cost $8,679,217) | | | | | | $ | 8,679,217 | | |
Total Investments — 102.5%
(identified cost $292,101,666) | | | | | | $ | 324,041,205 | | |
| Other Assets, Less Liabilities — (2.5)% | | | | | | $ | (7,802,415 | ) | |
| Net Assets — 100.0% | | | | | | $ | 316,238,790 | | |
ADR - American Depository Receipt
(1) Foreign security.
(2) Security valued at fair value using methods determined in good faith by or at the direction of the Trustees.
(3) Non-income producing security.
(4) Affiliated investment company available to Eaton Vance portfolios and funds which invests in high quality U.S. dollar denominated money market instruments. The rate shown is the annualized seven-day yield as of October 31, 2007.
| Country Concentration of Portfolio | |
| Country | | Percentage
of Net Assets | | Value | |
| United States | | | 83.2 | % | | $ | 263,093,216 | | |
| United Kingdom | | | 4.5 | | | | 14,227,737 | | |
| Switzerland | | | 2.2 | | | | 7,015,745 | | |
| Italy | | | 2.0 | | | | 6,203,258 | | |
| Greece | | | 2.0 | | | | 6,155,491 | | |
| Belgium | | | 1.9 | | | | 6,048,857 | | |
| Germany | | | 1.8 | | | | 5,832,252 | | |
| France | | | 1.5 | | | | 4,740,700 | | |
| Finland | | | 1.5 | | | | 4,656,639 | | |
| Canada | | | 0.7 | | | | 2,327,227 | | |
| Sweden | | | 0.7 | | | | 2,168,590 | | |
| Mexico | | | 0.5 | | | | 1,571,493 | | |
| | | | 102.5 | % | | $ | 324,041,205 | | |
See notes to financial statements
19
Dividend Income Portfolio as of October 31, 2007
FINANCIAL STATEMENTS
Statement of Assets and Liabilities
As of October 31, 2007
| Assets | |
| Unaffiliated investments, at value (identified cost, $283,422,449) | | $ | 315,361,988 | | |
| Affiliated investment, at value (identified cost, $8,679,217) | | | 8,679,217 | | |
| Cash | | | 1,960 | | |
| Receivable for investments sold | | | 10,269,302 | | |
| Dividends and interest receivable | | | 952,070 | | |
| Interest receivable from affiliated investment | | | 25,415 | | |
| Tax reclaim receivable | | | 172,393 | | |
| Total assets | | $ | 335,462,345 | | |
| Liabilities | |
| Payable for investments purchased | | $ | 18,956,115 | | |
| Payable to affiliate for investment advisory fees | | | 164,899 | | |
| Payable to affiliate for Trustees' fees | | | 1,102 | | |
| Other accrued expenses | | | 101,439 | | |
| Total liabilities | | $ | 19,223,555 | | |
| Net Assets applicable to investors' interest in Portfolio | | $ | 316,238,790 | | |
| Sources of Net Assets | |
| Net proceeds from capital contributions and withdrawals | | $ | 284,290,125 | | |
| Net unrealized appreciation (computed on the basis of identified cost) | | | 31,948,665 | | |
| Total | | $ | 316,238,790 | | |
Statement of Operations
For the Year Ended
October 31, 2007
| Investment Income | |
| Dividends (net of foreign taxes, $568,778) | | $ | 13,822,372 | | |
| Interest | | | 6,220 | | |
| Interest income allocated from affiliated investment | | | 235,289 | | |
| Expenses allocated from affiliated investment | | | (22,129 | ) | |
| Total investment income | | $ | 14,041,752 | | |
| Expenses | |
| Investment adviser fee | | $ | 1,188,555 | | |
| Trustees' fees and expenses | | | 10,070 | | |
| Custodian fee | | | 139,385 | | |
| Legal and accounting services | | | 38,594 | | |
| Miscellaneous | | | 14,873 | | |
| Total expenses | | $ | 1,391,477 | | |
| Net investment income | | $ | 12,650,275 | | |
| Realized and Unrealized Gain (Loss) | |
Net realized gain (loss) —
Investment transactions (identified cost basis) | | $ | (9,078,563 | ) | |
| Foreign currency transactions | | | (17,137 | ) | |
| Net realized loss | | $ | (9,095,700 | ) | |
Change in unrealized appreciation (depreciation) —
Investments (identified cost basis) | | $ | 27,518,836 | | |
| Foreign currency | | | (490 | ) | |
| Net change in unrealized appreciation (depreciation) | | $ | 27,518,346 | | |
| Net realized and unrealized gain | | $ | 18,422,646 | | |
| Net increase in net assets from operations | | $ | 31,072,921 | | |
See notes to financial statements
20
Dividend Income Portfolio as of October 31, 2007
FINANCIAL STATEMENTS CONT'D
Statements of Changes in Net Assets
Increase (Decrease)
in Net Assets | | Year Ended
October 31, 2007 | | Period Ended
October 31, 2006(1) | |
From operations —
Net investment income | | $ | 12,650,275 | | | $ | 3,753,280 | | |
Net realized loss from investment
transactions and foreign
currency transactions | | | (9,095,700 | ) | | | (2,728,786 | ) | |
Net change in unrealized appreciation
(depreciation) of investments
and foreign currency | | | 27,518,346 | | | | 4,283,270 | | |
| Net increase in net assets from operations | | $ | 31,072,921 | | | $ | 5,307,764 | | |
Capital transactions —
Assets contributed by Eaton Vance
Dividend Income Fund | | $ | — | | | $ | 5,112,681 | | |
| Contributions | | | 242,628,525 | | | | 67,092,789 | | |
| Withdrawals | | | (32,100,952 | ) | | | (2,974,948 | ) | |
Net increase in net assets from
capital transactions | | $ | 210,527,573 | | | $ | 69,230,522 | | |
| Net increase in net assets | | $ | 241,600,494 | | | $ | 74,538,286 | | |
| Net Assets | |
| At beginning of year | | $ | 74,638,296 | | | $ | 100,010 | | |
| At end of year | | $ | 316,238,790 | | | $ | 74,638,296 | | |
(1) For the period from the start of business, March 24, 2006, to October 31, 2006.
See notes to financial statements
21
Dividend Income Portfolio as of October 31, 2007
FINANCIAL STATEMENTS CONT'D
Supplementary Data
| | | Year Ended
October 31, 2007 | | Period Ended
October 31, 2006(1) | |
| Ratios/Supplemental Data | |
| Ratios (As a percentage of average daily net assets): | |
| Expenses before custodian fee reduction | | | 0.76 | % | | | 0.88 | %(2) | |
| Expenses after custodian fee reduction | | | 0.76 | % | | | 0.88 | %(2) | |
| Net investment income | | | 6.77 | % | | | 15.44 | %(2) | |
| Portfolio Turnover | | | 87 | % | | | 170 | % | |
| Total Return | | | 18.88 | % | | | 10.33 | %(3) | |
| Net assets, end of year (000's omitted) | | $ | 316,239 | | | $ | 74,638 | | |
(1) For the period from the start of business, March 24, 2006, to October 31, 2006.
(2) Annualized.
(3) Not annualized.
See notes to financial statements
22
Dividend Income Portfolio as of October 31, 2007
NOTES TO FINANCIAL STATEMENTS
1 Significant Accounting Policies
Dividend Income Portfolio (the Portfolio) is registered under the Investment Company Act of 1940, as amended (the 1940 Act), as a diversified, open-end management investment company. The Portfolio, which was organized as a trust under the laws of the State of New York on February 13, 2006 seeks to achieve total return by investing primarily in a diversified portfolio of equity securities that pay dividends. The Declaration of Trust permits the Trustees to issue interests in the Portfolio. At October 31, 2007, the Eaton Vance Dividend Income Fund held a 90.8% interest in the Portfolio. The following is a summary of significant accounting policies followed by the Portfolio in the preparation of its financial statements. The policies are in conformity with accounting principles generally accepted in the United States of America.
A Investment Valuation — Securities listed on a U.S. securities exchange generally are valued at the last sale price on the day of valuation or, if no sales took place on such date, at the mean between the closing bid and asked prices therefore on the exchange where such securities are principally traded. Equity securities listed on the NASDAQ Global or Global Select Market generally are valued at the NASDAQ official closing price. Unlisted or listed securities for which closing sales prices or closing quotations are not available are valued at the mean between the latest available bid and asked prices or, in the case of preferred equity securities that are not listed or traded in the over-the-counter market, by an independent pricing service. Exchange-traded options are valued at the last sale price for the day of valuation as quoted on the principal exchange or board of trade on which the options are traded or, in the absence of sales on such date, at the mean between the latest bid and asked prices therefore. Futures positions on securities and currencies generally are valued at closing settlement prices. Short-term debt securities with a remaining maturity of 60 days or less are valued at amortized cost. If short-term debt securities are acquired with a remaining maturity of more than 60 days, they will be valued by a pricing service. Other fixed income and debt securities, including listed securities and securities for which price quotations are available, will normally be valued on the basis of valuations furnished by a pricing service. Foreign securities and currencies are valued in U.S. dollars, based on foreign currency exchange rate quotations supplied by an independent quotation service. The daily valuation of exchange-traded foreign securities generally is determ ined as of the close of trading on the principal exchange on which such securities trade. Events occurring after the close of trading on foreign exchanges may result in adjustments to the valuation of foreign securities to more accurately reflect their fair value as of the close of regular trading on the New York Stock Exchange. When valuing foreign equity securities that meet certain criteria, the Trustees have approved the use of a fair value service that values such securities to reflect market trading that occurs after the close of the applicable foreign markets of comparable securities or other instruments that have a strong correlation to the fair-valued securities. Investments held by the Portfolio for which valuations or market quotations are unavailable are valued at fair value using methods determined in good faith by or at the direction of the Trustees of the Portfolio considering relevant factors, data and information includi ng the market value of freely tradable securities of the same class in the principal market on which such securities are normally traded.
The Portfolio may invest in Cash Management Portfolio (Cash Management), an affiliated investment company managed by Boston Management and Research (BMR), a subsidiary of Eaton Vance Management (EVM). Cash Management values its investment securities utilizing the amortized cost valuation technique permitted by Rule 2a-7 of the 1940 Act. This technique involves initially valuing a portfolio security at its cost and thereafter assuming a constant amortization to maturity of any discount or premium.
B Investment Transactions — Investment transactions are accounted for on a trade date basis. Realized gains and losses on securities sold are determined on the basis of identified cost.
C Income — Dividend income is recorded on the ex-dividend date for dividends received in cash and/or securities. However, if the ex-dividend date has passed, certain dividends from foreign securities are recorded as the Portfolio is informed of the ex-dividend date. Withholding taxes on foreign dividends and capital gains have been provided for in accordance with the Portfolio's understanding of the applicable countries' tax rules and rates. Interest income is recorded on the basis of interest accrued, adjusted for amortization of premium or accretion of discount.
D Federal Taxes — The Portfolio has elected to be treated as a partnership for federal tax purposes. No provision is made by the Portfolio for federal or state taxes on any taxable income of the Portfolio because each investor in the Portfolio is ultimately responsible for the payment of any taxes on its share of taxable income. Since at least one of the Portfolio's investors is a regulated investment company that invests all or substantially all of
23
Dividend Income Portfolio as of October 31, 2007
NOTES TO FINANCIAL STATEMENTS CONT'D
its assets in the Portfolio, the Portfolio normally must satisfy the applicable source of income and diversification requirements (under the Internal Revenue Code) in order for its investors to satisfy them. The Portfolio will allocate, at least annually among its investors, each investor's distributive share of the Portfolio's net investment income, net realized capital gains, and any other items of income, gain, loss, deduction or credit.
E Expense Reduction — State Street Bank and Trust Company (SSBT) serves as custodian of the Portfolio. Pursuant to the custodian agreement, SSBT receives a fee reduced by credits, which are determined based on the average daily cash balance the Portfolio maintains with SSBT. All credit balances, if any, used to reduce the Portfolio's custodian fees are reported as a reduction of expenses in the Statement of Operations.
F Foreign Currency Translation — Investment valuations, other assets, and liabilities initially expressed in foreign currencies are converted each business day into U.S. dollars based upon current exchange rates. Purchases and sales of foreign investment securities and income and expenses are converted into U.S. dollars based upon currency exchange rates prevailing on the respective dates of such transactions. Recognized gains or losses on investment transactions attributable to changes in foreign currency exchange rates are recorded for financial statement purposes as net realized gains and losses on investments. That portion of unrealized gains and losses on investments that results from fluctuations in foreign currency exchange rates is not separately disclosed.
G Use of Estimates — The preparation of the financial statements in conformity with accounting principles generally accepted in the United States of America requires management to make estimates and assumptions that affect the reported amounts of assets and liabilities at the date of the financial statements and the reported amounts of income and expense during the reporting period. Actual results could differ from those estimates.
H Indemnifications — Under the Portfolio's organizational documents, its officers and Trustees may be indemnified against certain liabilities and expenses arising out of the performance of their duties to the Portfolio. Interestholders in the Portfolio are jointly and severally liable for the liabilities and obligations of the Portfolio in the event that the Portfolio fails to satisfy such liabilities and obligations; provided, however, that, to the extent assets are available in the Portfolio, the Portfolio may, under certain circumstances, indemnify interestholders from and against any claim or liability to which such holder may become subject by reason of being or having been an interestholder in t he Portfolio. Additionally, in the normal course of business, the Portfolio enters into agreements with service providers that may contain indemnification clauses. The Portfolio's maximum exposure under these arrangements is unknown as this would involve future claims that may be made against the Portfolio that have not yet occurred.
2 Investment Adviser Fee and Other Transactions with Affiliates
The investment adviser fee is earned by BMR, a subsidiary of EVM, as compensation for management and investment advisory services rendered to the Portfolio. Pursuant to the advisory agreement, BMR receives a monthly fee at the annual rate of 0.65% of the average daily net assets of the Portfolio up to $500 million and at reduced rates as daily net assets exceed that level. The portion of the advisory fee payable by Cash Management on the Portfolio's investment of cash therein is credited against the Portfolio's advisory fees. For the year ended October 31, 2007, the Portfolio's advisory fee totaled $1,209,881 of which $21,326 was allocated from Cash Management and $1,188,555 was paid or accrued directly by the Portfolio.
Except for Trustees of the Portfolio who are not members of EVM's or BMR's organizations, officers and Trustees receive remuneration for their services to the Portfolio out of such investment adviser fee. Trustees of the Portfolio who are not affiliated with the investment adviser may elect to defer receipt of all or a percentage of their annual fees in accordance with the terms of the Trustees Deferred Compensation Plan. For the year ended October 31, 2007, no significant amounts have been deferred. Certain officers and Trustees of the Portfolio are officers of the above organizations.
3 Investments Transactions
Purchases and sales of investments, other than short-term obligations, aggregated $381,733,390 and $159,148,428 respectively, for the year ended October 31, 2007.
4 Transfer of Assets
Investment operations began on March 24, 2006 with a transfer of investment assets, and related accounts by Eaton Vance Dividend Income Fund of $5,112,681, in exchange for an interest in the Portfolio, including net unrealized appreciation of $147,049. The transaction was structured for tax purposes to qualify as a tax-free exchange under the Internal Revenue Code.
24
Dividend Income Portfolio as of October 31, 2007
NOTES TO FINANCIAL STATEMENTS CONT'D
5 Federal Income Tax Basis of Unrealized Appreciation (Depreciation)
The cost and unrealized appreciation (depreciation) in value of the investments owned at October 31, 2007, as determined on a federal income tax basis, were as follows:
| Aggregate cost | | $ | 292,140,140 | | |
| Gross unrealized appreciation | | $ | 36,025,064 | | |
| Gross unrealized depreciation | | | (4,123,999 | ) | |
| Net unrealized appreciation | | $ | 31,901,065 | | |
6 Risks Associated with Foreign Investments
Investing in securities issued by companies whose principal business activities are outside the United States may involve significant risks not present in domestic investments. For example, there is generally less publicly available information about foreign companies, particularly those not subject to the disclosure and reporting requirements of the U.S. securities laws. Foreign issuers are generally not bound by uniform accounting, auditing, and financial reporting requirements and standards of practice comparable to those applicable to domestic issuers. Investments in foreign securities also involve the risk of possible adverse changes in investment or exchange control regulations, expropriation or confiscatory taxation, limitation on the removal of funds or other assets of the Portfolio, political or financial instability or diplomatic and other developments which could affect such investments. Foreign stock markets, while g rowing in volume and sophistication, are generally not as developed as those in the United States, and securities of some foreign issuers (particularly those located in developing countries) may be less liquid and more volatile than securities of comparable U.S. companies. In general, there is less overall governmental supervision and regulation of foreign securities markets, broker-dealers and issuers than in the United States.
7 Financial Instruments
The Portfolio may trade in financial instruments with off-balance sheet risk in the normal course of its investing activities to assist in managing exposure to various market risks. These financial instruments may include written options, forward foreign currency contracts and financial futures contracts and may involve, to a varying degree, elements of risk in excess of the amounts recognized for financial statement purposes. The notional or contractual amounts of these instruments represent the investment the Portfolio has in particular classes of financial instruments and does not necessarily represent the amounts potentially subject to risk. The measurement of the risks associated with these instruments is meaningful only when all related and offsetting transactions are considered. The Portfolio did not have any open obligations under these financial ins truments at October 31, 2007.
8 Line of Credit
The Portfolio participates with other portfolios and funds managed by EVM and its affiliates in a $200 million unsecured line of credit agreement with a group of banks. Borrowings will be made by the Portfolio solely to facilitate the handling of unusual and/or unanticipated short-term cash requirements. Interest is charged to the Portfolio based on its borrowings at an amount above either the Eurodollar rate or Federal Funds rate. In addition, a fee computed at an annual rate of 0.07% on the daily unused portion of the line of credit is allocated among the participating portfolios and funds at the end of each quarter. The Portfolio did not have any significant borrowings or allocated fees during the year ended October 31, 2007.
9 Recently Issued Accounting Pronouncements
In June 2006, the Financial Accounting Standards Board (FASB) issued FASB Interpretation No. 48 (FIN 48), "Accounting for Uncertainty in Income Taxes – an interpretation of FASB Statement No. 109". FIN 48 clarifies the accounting for uncertainty in income taxes recognized in accordance with FASB Statement No. 109, "Accounting for Income Taxes". This interpretation prescribes a recognition threshold and measurement attribute for the financial statement recognition and measurement of a tax position taken or expected to be taken in a tax return. It also provides guidance on de-recognition, classification, interest and penalties, accounting in interim periods, disclosure and transition. FIN 48 is effective on the last business day of the first required financial reporting period for fiscal years beginning after December 15, 2006. Management is currently evaluating the impact of applying the various provisions of FIN 48.
In September 2006, the FASB issued Statement of Financial Accounting Standards No. 157 (FAS 157), "Fair Value Measurements". FAS 157 defines fair value, establishes a framework for measuring fair value in accordance with generally accepted accounting principles and expands disclosure about fair value measurements. FAS 157 is effective for fiscal years beginning after November 15, 2007. Management is currently evaluating the impact the adoption of FAS 157 will have on the Portfolio's financial statement disclosures.
25
Dividend Income Portfolio as of October 31, 2007
REPORT OF INDEPENDENT REGISTERED PUBLIC ACCOUNTING FIRM
To the Trustees and the Investors
of Dividend Income Portfolio:
We have audited the accompanying statement of assets and liabilities of Dividend Income Portfolio (the "Portfolio"), including the portfolio of investments, as of October 31, 2007, and the related statements of operations for the year then ended, the statements of changes in net assets and the supplementary data for the year then ended and the period from the start of business, March 24, 2006, to October 31, 2006. These financial statements and supplementary data are the responsibility of the Portfolio's management. Our responsibility is to express an opinion on these financial statements and supplementary data based on our audits.
We conducted our audits in accordance with the standards of the Public Company Accounting Oversight Board (United States). Those standards require that we plan and perform the audit to obtain reasonable assurance about whether the financial statements and supplementary data are free of material misstatement. The Portfolio is not required to have, nor were we engaged to perform, an audit of its internal control over financial reporting. Our audits included consideration of internal control over financial reporting as a basis for designing audit procedures that are appropriate in the circumstances, but not for the purpose of expressing an opinion on the effectiveness of the Portfolio's internal control over financial reporting. Accordingly, we express no such opinion. An audit also includes examining, on a test basis, evidence supporting the amounts and disclosures in the financial statements, assessing the accounting principles u sed and significant estimates made by management, as well as evaluating the overall financial statement presentation. Our procedures included confirmation of securities owned as of October 31, 2007, by correspondence with the custodian, brokers and agent banks; where replies were not received from brokers and agent banks, we performed other auditing procedures. We believe that our audits provide a reasonable basis for our opinion.
In our opinion, the financial statements and supplementary data referred to above present fairly, in all material respects, the financial position of Dividend Income Portfolio as of October 31, 2007, the results of its operations for the year then ended, the changes in its net assets and the supplementary data for the year ended and the period from the start of business, March 24, 2006, to October 31, 2006, in conformity with accounting principles generally accepted in the United States of America.
DELOITTE & TOUCHE LLP
Boston, Massachusetts
December 17, 2007
26
Eaton Vance Dividend Income Fund
BOARD OF TRUSTEES' ANNUAL APPROVAL OF THE INVESTMENT ADVISORY AGREEMENT
Overview of the Contract Review Process
The Investment Company Act of 1940, as amended (the "1940 Act"), provides, in substance, that each investment advisory agreement between a fund and its investment adviser will continue in effect from year to year only if its continuance is approved at least annually by the fund's board of trustees, including by a vote of a majority of the trustees who are not "interested persons" of the fund ("Independent Trustees"), cast in person at a meeting called for the purpose of considering such approval.
At a meeting of the Boards of Trustees (each a "Board") of the Eaton Vance group of mutual funds (the "Eaton Vance Funds") held on April 23, 2007, the Board, including a majority of the Independent Trustees, voted to approve continuation of existing advisory and sub-advisory agreements for the Eaton Vance Funds for an additional one-year period. In voting its approval, the Board relied upon the affirmative recommendation of the Special Committee of the Board, which is a committee comprised exclusively of Independent Trustees. Prior to making its recommendation, the Special Committee reviewed information furnished for a series of meetings of the Special Committee held in February, March and April 2007. Such information included, among other things, the following:
Information about Fees, Performance and Expenses
• An independent report comparing the advisory and related fees paid by each fund with fees paid by comparable funds;
• An independent report comparing each fund's total expense ratio and its components to comparable funds;
• An independent report comparing the investment performance of each fund to the investment performance of comparable funds over various time periods;
• Data regarding investment performance in comparison to relevant peer groups of funds and appropriate indices;
• Comparative information concerning fees charged by each adviser for managing other mutual funds and institutional accounts using investment strategies and techniques similar to those used in managing the fund;
• Profitability analyses for each adviser with respect to each fund;
Information about Portfolio Management
• Descriptions of the investment management services provided to each fund, including the investment strategies and processes employed;
• Information concerning the allocation of brokerage and the benefits received by each adviser as a result of brokerage allocation, including information concerning the acquisition of research through "soft dollar" benefits received in connection with the funds' brokerage, and the implementation of a soft dollar reimbursement program established with respect to the funds;
• Data relating to portfolio turnover rates of each fund;
• The procedures and processes used to determine the fair value of fund assets and actions taken to monitor and test the effectiveness of such procedures and processes;
Information about each Adviser
• Reports detailing the financial results and condition of each adviser;
• Descriptions of the qualifications, education and experience of the individual investment professionals whose responsibilities include portfolio management and investment research for the funds, and information relating to their compensation and responsibilities with respect to managing other mutual funds and investment accounts;
• Copies of the Codes of Ethics of each adviser and its affiliates, together with information relating to compliance with and the administration of such codes;
• Copies of or descriptions of each adviser's proxy voting policies and procedures;
• Information concerning the resources devoted to compliance efforts undertaken by each adviser and its affiliates on behalf of the funds (including descriptions of various compliance programs) and their record of compliance with investment policies and restrictions, including policies with respect to market-timing, late trading and selective portfolio disclosure, and with policies on personal securities transactions;
• Descriptions of the business continuity and disaster recovery plans of each adviser and its affiliates;
Other Relevant Information
• Information concerning the nature, cost and character of the administrative and other non-investment management services provided by Eaton Vance Management and its affiliates;
• Information concerning management of the relationship with the custodian, subcustodians and fund accountants by each adviser or the funds' administrator; and
• The terms of each advisory agreement.
27
Eaton Vance Dividend Income Fund
BOARD OF TRUSTEES' ANNUAL APPROVAL OF THE INVESTMENT ADVISORY AGREEMENT CONT'D
In addition to the information identified above, the Special Committee considered information provided from time to time by each adviser throughout the year at meetings of the Board and its committees. Over the course of the twelve-month period ended April 30, 2007, the Board met ten times and the Special Committee, the Audit Committee and the Governance Committee, each of which is a Committee comprised solely of Independent Trustees, met twelve, fourteen and eight times, respectively. At such meetings, the Trustees received, among other things, presentations by the portfolio managers and other investment professionals of each adviser relating to the investment performance of each fund and the investment strategies used in pursuing the fund's investment objective.
For funds that invest through one or more underlying portfolios, the Board considered similar information about the portfolio(s) when considering the approval of advisory agreements. In addition, in cases where the fund's investment adviser has engaged a sub-adviser, the Board considered similar information about the sub-adviser when considering the approval of any sub-advisory agreement.
The Special Committee was assisted throughout the contract review process by Goodwin Procter LLP, legal counsel for the Independent Trustees. The members of the Special Committee relied upon the advice of such counsel and their own business judgment in determining the material factors to be considered in evaluating each advisory and sub-advisory agreement and the weight to be given to each such factor. The conclusions reached with respect to each advisory and sub-advisory agreement were based on a comprehensive evaluation of all the information provided and not any single factor. Moreover, each member of the Special Committee may have placed varying emphasis on particular factors in reaching conclusions with respect to each advisory and sub-advisory agreement.
Results of the Process
Based on its consideration of the foregoing, and such other information as it deemed relevant, including the factors and conclusions described below, the Special Committee concluded that the continuance of the investment advisory agreement of Dividend Income Portfolio (the "Portfolio"), the underlying Portfolio in which Eaton Vance Dividend Income Fund (the "Fund") invests, with Boston Management and Research (the "Adviser"), including the fee structure, is in the interests of shareholders and, therefore, the Special Committee recommended to the Board approval of the agreement. The Board accepted the recommendation of the Special Committee as well as the factors considered and conclusions reached by the Special Committee with respect to the agreement. Accordingly, the Board, including a majority of the Independent Trustees, voted to approve continuation of the investment advisory agreement for the Portfolio.
Nature, Extent and Quality of Services
In considering whether to approve the investment advisory agreement of the Portfolio, the Board evaluated the nature, extent and quality of services provided to the Portfolio by the Adviser.
The Board considered the Adviser's management capabilities and investment process with respect to the types of investments held by the Portfolio, including the education, experience and number of its investment professionals and other personnel who provide portfolio management, investment research, and similar services to the Portfolio. The Board also took into account the resources dedicated to portfolio management and other services, including the compensation paid to recruit and retain investment personnel, and the time and attention devoted to the Portfolio by senior management.
The Board reviewed the compliance programs of the Adviser and its affiliates. Among other matters, the Board considered compliance and reporting matters relating to personal trading by investment personnel, selective disclosure of portfolio holdings, late trading, frequent trading, portfolio valuation, business continuity and the allocation of investment opportunities. The Board also evaluated the responses of the Adviser and its affiliates to requests from regulatory authorities such as the Securities and Exchange Commission and the National Association of Securities Dealers.
The Board considered shareholder and other administrative services provided or managed by Eaton Vance Management and its affiliates, including transfer agency and accounting services. The Board evaluated the benefits to shareholders of investing in a fund that is a part of a large family of funds, including the ability, in many cases, to exchange an investment among different funds without incurring additional sales charges.
After consideration of the foregoing factors, among others, the Board concluded that the nature, extent and quality of services provided by the Adviser, taken as a whole, are appropriate and consistent with the terms of the investment advisory agreement.
Fund Performance
The Board compared the Fund's investment performance to a relevant universe of similarly managed funds identified by an independent data provider and appropriate benchmark indices. The Board reviewed comparative performance data for the period from inception (November 2005) through September 30, 2006 for the Fund. The Board concluded that the performance of the Fund is satisfactory.
28
Eaton Vance Dividend Income Fund
BOARD OF TRUSTEES' ANNUAL APPROVAL OF THE INVESTMENT ADVISORY AGREEMENT CONT'D
Management Fees and Expenses
The Board reviewed contractual investment advisory fee rates, including any administrative fee rates, payable by the Portfolio and by the Fund (referred to collectively as "management fees"). As part of its review, the Board considered the Portfolio's management fees and the Fund's total expense ratio for the period from inception through September 30, 2006, as compared to a group of similarly managed funds selected by an independent data provider. The Board considered the fact that the Adviser had waived fees and/or paid expenses of the Fund.
After reviewing the foregoing information, and in light of the nature, extent and quality of the services provided by the Adviser, the Board concluded with respect to the Portfolio and the Fund that the management fee charged to the Portfolio and the Fund for advisory and related services and the total expense ratio of the Fund are reasonable.
Profitability
The Board reviewed the level of profits realized by the Adviser and its affiliates in providing investment advisory and administrative services to the Fund and the Portfolio and to all Eaton Vance Funds as a group. The Board considered the level of profits realized without regard to revenue sharing or other payments by the Adviser and its affiliates to third parties in respect of distribution services. The Board also considered other direct or indirect benefits received by the Adviser and its affiliates in connection with its relationship with the Portfolio, including the benefits of research services that may be available to the Adviser as a result of securities transactions effected for the Portfolio and other investment advisory clients.
The Board concluded that, in light of the foregoing factors and the nature, extent and quality of the services rendered, the profits realized by the Adviser and its affiliates are reasonable.
Economies of Scale
In reviewing management fees and profitability, the Board also considered the extent to which the Adviser and its affiliates, on the one hand, and the Fund, on the other hand, can expect to realize benefits from economies of scale as the assets of the Fund increase. The Board acknowledged the difficulty in accurately measuring the benefits resulting from the economies of scale with respect to the management of any specific fund or group of funds. The Board reviewed data summarizing the increases and decreases in the assets of the Fund and of all Eaton Vance Funds as a group over various time periods, and evaluated the extent to which the total expense ratio of the Fund and the profitability of the Adviser and its affiliates may have been affected by such increases or decreases. Based upon the foregoing, the Board concluded that the benefits from economies of scale are currently being shared equitably by the Adviser and its affil iates and the Fund. The Board also concluded that, assuming reasonably foreseeable increases in the assets of the Fund, the structure of the Portfolio advisory fee, which includes breakpoints at several asset levels, can be expected to cause the Adviser and its affiliates and the Fund and the Portfolio to continue to share such benefits equitably.
29
Eaton Vance Dividend Income Fund
MANAGEMENT AND ORGANIZATION
Fund Management. The Trustees of Eaton Vance Mutual Funds Trust (the Trust) and Dividend Income Portfolio (the Portfolio) are responsible for the overall management and supervision of the Trust's and Portfolio's affairs. The Trustees and officers of the Trust and the Portfolio are listed below. Except as indicated, each individual has held the office shown or other offices in the same company for the last five years. Trustees and officers of the Trust and the Portfolio hold indefinite terms of office. The "noninterested Trustees" consist of those Trustees who are not "interested persons" of the Trust and the Portfolio, as that term is defined under the 1940 Act. The business address of each Trustee and officer is The Eaton Vance Building, 255 State Street, Boston, Massachusetts 02109. As used below, "EVC" refers to Eaton Vance Corp., "EV" refers to Eaton Van ce, Inc., "EVM" refers to Eaton Vance Management, "BMR" refers to Boston Management and Research, "Parametric" refers to Parametric Portfolio Associates and "EVD" refers to Eaton Vance Distributors, Inc. EVC and EV are the corporate parent and trustee, respectively, of EVM and BMR. EVD is the Fund's principal underwriter, the Portfolio's placement agent and a wholly-owned subsidiary of EVM. Each officer affiliated with Eaton Vance may hold a position with other Eaton Vance affiliates that is comparable to his or her position with EVM listed below.
Name and
Date of Birth | | Position(s)
with the
Trust and
the Portfolio | | Term of
Office and
Length of
Service | | Principal Occupation(s)
During Past Five Years | | Number of Portfolios
in Fund Complex
Overseen By
Trustee(1) | | Other Directorships Held | |
| Interested Trustee | | | | | | | | | | | | | |
|
Thomas E. Faust Jr.
5/31/58 | | Trustee and President of the Trust | | Trustee since 2007 and President of the Trust since 2002 | | Chairman, Chief Executive Officer and President of EVC, President of EV, Chief Executive Officer and President of EVM and BMR, and Director of EVD. Trustee and/or Officer of 176 registered investment companies and 5 private investment companies in the Eaton Vance Fund Complex. Mr. Faust is an interested person because of his positions with EVM, BMR, EVC and EV which are affiliates of the Trust and the Portfolio. | | | 176 | | | Director of EVC | |
|
| Noninterested Trustee(s) | | | | | | | | | | | | | |
|
Benjamin C. Esty
1/2/63 | | Trustee | | Trustee of the Trust since 2005 and of the Portfolio since 2006. | | Roy and Elizabeth Simmons Professor of Business Administration, Harvard University Graduate School of Business Administration (since 2003). Formerly, Associate Professor, Harvard University Graduate School of Business Administration (2000-2003). | | | 176 | | | None | |
|
Allen R. Freedman
4/3/40 | | Trustee | | Since 2007 | | Former Chairman and Chief Executive Officer of Assurant, Inc. (insurance provider) (1978-2000). Formerly, a Director of Loring Ward International (fund distributor) (2005-2007). | | | 175 | | | Director of Assurant, Inc. and Stonemor Partners L.P. (owner and operator of cemeteries) | |
|
William H. Park
9/19/47 | | Trustee | | Trustee of the Trust since 2003 and of the Portfolio since 2006. | | Vice Chairman, Commercial Industrial Finance Corp. (specialty finance company) (since 2006). Formerly, President and Chief Executive Officer, Prizm Capital Management, LLC (investment management firm) (since 2002-2005). | | | 176 | | | None | |
|
Ronald A. Pearlman
7/10/40 | | Trustee | | Trustee of the Trust since 2003 and of the Portfolio since 2006. | | Professor of Law, Georgetown University Law Center. | | | 176 | | | None | |
|
Norton H. Reamer
9/21/35 | | Trustee | | Trustee of the Trust since 1986 and of the Portfolio since 2006. | | President, Chief Executive Officer and a Director of Asset Management Finance Corp. (a specialty finance company serving the investment management industry) (since October 2003). President, Unicorn Corporation (an investment and financial advisory services company) (since September 2000). Formerly, Chairman and Chief Operating Officer, Hellman, Jordan Management Co., Inc. (an investment management company) (2000-2003). Formerly, Advisory Director of Berkshire Capital Corporation (investment banking firm) (2002-2003). | | | 176 | | | None | |
|
30
Eaton Vance Dividend Income Fund
MANAGEMENT AND ORGANIZATION CONT'D
Name and
Date of Birth | | Position(s)
with the
Trust and
the Portfolio | | Term of
Office and
Length of
Service | | Principal Occupation(s)
During Past Five Years | | Number of Portfolios
in Fund Complex
Overseen By
Trustee(1) | | Other Directorships Held | |
| Noninterested Trustee(s) (continued) | | | | | | | | | | | | | |
|
Heidi L. Steiger
7/8/53 | | Trustee | | Since 2007 | | President, Lowenhaupt Global Advisors, LLC (global wealth management firm) (since 2005); Formerly, President and Contributing Editor, Worth Magazine (2004); Formerly, Executive Vice President and Global Head of Private Asset Management (and various other positions), Neuberger Berman (investment firm) (1986-2004). | | | 173 | | | Director of Nuclear Electric Insurance Ltd. (nuclear insurance provider) and Aviva USA (insurance provider) | |
|
Lynn A. Stout
9/14/57 | | Trustee | | Trustee of the Trust since 1998 and of the Portfolio since 2006. | | Paul Hastings Professor of Corporate and Securities Law, University of California at Los Angeles School of Law. | | | 176 | | | None | |
|
Ralph F. Verni
1/26/43 | | Chairman of the Board and Trustee | | Chaiman of the Board since 2007; Trustee of the Trust since 2005 and of the Portfolio since 2006. | | Consultant and private investor. | | | 176 | | | None | |
|
| Principal Officers who are not Trustees | | | | | | | | | | | | | |
|
Name and
Date of Birth | | Position(s)
with the
Trust and
the Portfolio | | Term of
Office and
Length of
Service | | Principal Occupation(s)
During Past Five Years | |
William H. Ahern, Jr.
7/28/59 | | Vice President of the Trust | | Since 1995 | | Vice President of EVM and BMR. Officer of 74 registered investment companies managed by EVM or BMR. | |
|
Cynthia J. Clemson
3/2/63 | | Vice President of the Trust | | Since 2005 | | Vice President of EVM and BMR. Officer of 89 registered investment companies managed by EVM or BMR. | |
|
Charles B. Gaffney
12/4/72 | | Vice President of the Trust | | Since 2007 | | Vice President of EVM and BMR. Previously, Sector Portfolio Manager and Senior Equity Analyst of Brown Brothers Harriman (1997-2003). Officer of 29 registered investment companies managed by EVM or BMR. | |
|
Christine M. Johnston
11/9/72 | | Vice President of the Trust | | Since 2007 | | Vice President of EVM and BMR. Officer of 34 registered investment companies managed by EVM or BMR. | |
|
Aamer Khan
6/7/60 | | Vice President | | Vice President of the Trust since 2005 and of the Portfolio since 2006 | | Vice President of EVM and BMR. Officer of 32 registered investment companies managed by EVM or BMR. | |
|
Thomas H. Luster
4/8/62 | | Vice President of the Trust | | Since 2006 | | Vice President of EVM and BMR. Officer of 48 registered investment companies managed by EVM or BMR. | |
|
Michael R. Mach
7/15/47 | | Vice President of the Trust | | Since 1999 | | Vice President of EVM and BMR. Officer of 54 registered investment companies managed by EVM or BMR. | |
|
Robert B. MacIntosh
1/22/57 | | Vice President of the Trust | | Since 1998 | | Vice President of EVM and BMR. Officer of 89 registered investment companies managed by EVM or BMR. | |
|
Duncan W. Richardson
10/26/57 | | Vice President of the Trust and President of the Portfolio | | Vice President of the Trust since 2001 and President of the Portfolio since 2006 | | Executive Vice President and Chief Equity Investment Officer of EVC, EVM and BMR. Officer 80 registered investment companies managed by EVM or BMR. | |
|
Walter A. Row, III
7/20/57 | | Vice President of the Trust | | Since 2001 | | Director of Equity Research and a Vice President of EVM and BMR. Officer of 38 registered investment companies managed by EVM or BMR. | |
|
Judith A. Saryan
8/21/54 | | Vice President | | Vice President of the Trust since 2003 and of the Portfolio since 2006 | | Vice President of EVM and BMR. Officer of 53 registered investment companies managed by EVM or BMR. | |
|
31
Eaton Vance Dividend Income Fund
MANAGEMENT AND ORGANIZATION CONT'D
Name and
Date of Birth | | Position(s)
with the
Trust and
the Portfolio | | Term of
Office and
Length of
Service | | Principal Occupation(s)
During Past Five Years | |
| Principal Officers who are not Trustees (continued) | |
|
Susan Schiff
3/31/61 | | Vice President of the Trust | | Since 2002 | | Vice President of EVM and BMR. Officer of 35 registered investment companies managed by EVM or BMR. | |
|
Thomas Seto
9/27/62 | | Vice President of the Trust | | Since 2007 | | Vice President and Director of Portfolio Management of Parametric. Officer of 30 registered investment companies managed by EVM or BMR. | |
|
David M. Stein
5/4/51 | | Vice President of the Trust | | Since 2007 | | Managing Director and Chief Investment Officer of Parametric. Officer of 30 registered investment companies managed by EVM or BMR. | |
|
Mark S. Venezia
5/23/49 | | Vice President of the Trust | | Since 2007 | | Vice President of EVM and BMR. Officer of 35 registered investment companies managed by EVM or BMR. | |
|
Adam A. Weigold
3/22/75 | | Vice President of the Trust | | Since 2007 | | Vice President of EVM and BMR. Officer of 70 registered investment companies managed by EVM or BMR. | |
|
Barbara E. Campbell
6/19/57 | | Treasurer of the Trust | | Since 2005 | | Vice President of EVM and BMR. Officer of 176 registered investment companies managed by EVM or BMR. | |
|
Maureen A. Gemma
5/24/60 | | Secretary | | Since 2007 | | Deputy Chief Legal Officer and Vice President of EVM and BMR. Officer of 176 registered investment companies managed by EVM or BMR. | |
|
Michelle A. Green
8/25/69 | | Treasurer of the Portfolio | | Since 2006 | | Vice President of EVM and BMR. Officer of 68 registered investment companies managed by EVM or BMR. | |
|
Paul M. O'Neil
7/11/53 | | Chief Compliance Officer | | Chief Compliance Officer of the Trust since 2004 and of the Portfolio since 2006 | | Vice President of EVM and BMR. Officer of 176 registered investment companies managed by EVM or BMR. | |
|
(1) Includes both master and feeder funds in a master-feeder structure.
The SAI for the Fund includes additional information about the Trustees and officers of the Fund and the Portfolio and can be obtained without charge by calling 1-800-225-6265.
32
Investment Adviser of Dividend Income Portfolio
Boston Management and Research
The Eaton Vance Building
255 State Street
Boston, MA 02109
Administrator of Eaton Vance Dividend Income Fund
Eaton Vance Management
The Eaton Vance Building
255 State Street
Boston, MA 02109
Principal Underwriter
Eaton Vance Distributors, Inc.
The Eaton Vance Building
255 State Street
Boston, MA 02109
(617) 482-8260
Custodian
State Street Bank and Trust Company
200 Clarendon Street
Boston, MA 02116
Transfer Agent
PFPC Inc.
Attn: Eaton Vance Funds
P.O. Box 9653
Providence, RI 02940-9653
(800) 262-1122
Independent Registered Public Accounting Firm
Deloitte & Touche LLP
200 Berkeley Street
Boston, MA 02116-5022
Eaton Vance Dividend Income Fund
The Eaton Vance Building
255 State Street
Boston, MA 02109
This report must be preceded or accompanied by a current prospectus. Before investing, investors should consider carefully the Fund's investment objective(s), risks, and charges and expenses. The Fund's current prospectus contains this and other information about the Fund and is available through your financial advisor. Please read the prospectus carefully before you invest or send money. For further information please call 1-800-225-6265.
2634-12/07 DIVISRC

Annual Report October 31, 2007


EATON VANCE EMERGING
MARKETS
INCOME
FUND
IMPORTANT NOTICES REGARDING PRIVACY,
DELIVERY OF SHAREHOLDER DOCUMENTS,
PORTFOLIO HOLDINGS, AND PROXY VOTING
Privacy. The Eaton Vance organization is committed to ensuring your financial privacy. Each of the financial institutions identified below has in effect the following policy ("Privacy Policy") with respect to nonpublic personal information about its customers:
• Only such information received from you, through application forms or otherwise, and information about your Eaton Vance fund transactions will be collected. This may include information such as name, address, social security number, tax status, account balances and transactions.
• None of such information about you (or former customers) will be disclosed to anyone, except as permitted by law (which includes disclosure to employees necessary to service your account). In the normal course of servicing a customer's account, Eaton Vance may share information with unaffiliated third parties that perform various required services such as transfer agents, custodians and broker/dealers.
• Policies and procedures (including physical, electronic and procedural safeguards) are in place that are designed to protect the confidentiality of such information.
• We reserve the right to change our Privacy Policy at any time upon proper notification to you. Customers may want to review our Policy periodically for changes by accessing the link on our homepage: www.eatonvance.com.
Our pledge of privacy applies to the following entities within the Eaton Vance organization: the Eaton Vance Family of Funds, Eaton Vance Management, Eaton Vance Investment Counsel, Boston Management and Research, and Eaton Vance Distributors, Inc.
In addition, our Privacy Policy only applies to those Eaton Vance customers who are individuals and who have a direct relationship with us. If a customer's account (i.e., fund shares) is held in the name of a third-party financial adviser/broker-dealer, it is likely that only such adviser's privacy policies apply to the customer. This notice supersedes all previously issued privacy disclosures.
For more information about Eaton Vance's Privacy Policy, please call 1-800-262-1122.
Delivery of Shareholder Documents. The Securities and Exchange Commission (the "SEC") permits funds to deliver only one copy of shareholder documents, including prospectuses, proxy statements and shareholder reports, to fund investors with multiple accounts at the same residential or post office box address. This practice is often called "householding" and it helps eliminate duplicate mailings to shareholders.
Eaton Vance, or your financial adviser, may household the mailing of your documents indefinitely unless you instruct Eaton Vance, or your financial adviser, otherwise.
If you would prefer that your Eaton Vance documents not be householded, please contact Eaton Vance at 1-800-262-1122, or contact your financial adviser.
Your instructions that householding not apply to delivery of your Eaton Vance documents will be effective within 30 days of receipt by Eaton Vance or your financial adviser.
Portfolio Holdings. Each Eaton Vance Fund and its underlying Portfolio (if applicable) will file a schedule of its portfolio holdings on Form N-Q with the SEC for the first and third quarters of each fiscal year. The Form N-Q will be available on the Eaton Vance website www.eatonvance.com, by calling Eaton Vance at 1-800-262-1122 or in the EDGAR database on the SEC's website at www.sec.gov. Form N-Q may also be reviewed and copied at the SEC's public reference room in Washington, D.C. (call 1-800-732-0330 for information on the operation of the public reference room).
Proxy Voting. From time to time, funds are required to vote proxies related to the securities held by the funds. The Eaton Vance Funds or their underlying Portfolios (if applicable) vote proxies according to a set of policies and procedures approved by the Funds' and Portfolios' Boards. You may obtain a description of these policies and procedures and information on how the Funds or Portfolios voted proxies relating to portfolio securities during the most recent 12 month period ended June 30, without charge, upon request, by calling 1-800-262-1122. This description is also available on the SEC's website at www.sec.gov.
Eaton Vance Emerging Markets Income Fund as of October 31, 2007
MANAGEMENT’S DISCUSSION OF FUND PERFORMANCE

Mark S. Venezia, CFA
Portfolio Manager
Performance Since Inception
· The Fund’s Class A shares had a total return of 10.44% during the period from inception on June 27, 2007 through October 31, 2007.(1)
· In comparison, the JP Morgan Government Bond Index – Emerging Market Global Diversified (Unhedged), an unmanaged broad-based index that currently comprises the local currency, fixed rate coupon issues of 13 markets greater than 1-year in maturity, had a return of 9.80% for the period from June 30, 2007 through October 31, 2007.(2)
Management Discussion
· The Fund seeks to provide total return. The Fund invests at least 80% of its total net assets in securities denominated in currencies of emerging market countries, fixed-income instruments issued by emerging market entities or sovereigns and/or derivative instruments denominated in or based on the currencies, interest rates or issues of, emerging market countries. The Fund invests its assets in Emerging Markets Income Portfolio (the “Portfolio”), a separate registered investment company with the same objective and investment policies as the Fund.
· As the Fund commenced operations in June, the global bond markets were encountering increasing volatility. The U.S. credit squeeze resulted in broad deleveraging and a flight to quality in the global bond markets. Some high-yield – including senior secured loans – and emerging markets reacted negatively, while the flight to quality benefited the G7 sovereigns, the Euro and the Yen. Amid the turmoil, central banks – including the Federal Reserve – injected liquidity to preserve economic stability. While the credit squeeze and a weakening U.S. economy concerned investors, stronger domestic economies insulated some Asian and Latin American countries from slowing U.S. demand.
· The Portfolio had a generally unhedged exposure to the emerging markets, even when those currencies were tied to the Euro. Not surprisingly, the Fund’s NAV reflected the volatility of the markets during this turbulent period, rallying sharply in September after an initial decline in July and August. Amid the prolonged depreciation of the dollar, the Portfolio’s Euro-related positions added to the gains from individual emerging markets.
· The Portfolio was widely diversified during the period. In Asia, the Portfolio’s largest exposure was in Malaysia, whose export-oriented economy has benefited from the Asian region’s broad economic uptrend. Following the de-pegging of its currency, the Ringgit, from the U.S. dollar and the easing of capital controls, Malaysia has seen an inflow of investment, a stronger economy and an appreciating currency.(3)
· In Eastern Europe, Poland was the Portfolio’s largest currency position during the period. Improving economic fundamentals, large remittances from abroad and the recent election of a reform-minded government committed to selling state-owned industries and convergence with the Euro have pushed Poland’s currency higher. The Portfolio cross-hedged some of its Eastern Europe investments – which have attractive yields spreads over the Euro – with short-Euro positions.(3)
· The Portfolio also had positions in northern and sub- Saharan Africa. Unlike some other developing economies, these countries tend to be de-linked from broad short-term global financial tides. Egyptian T-bills remained attractive, as high energy prices produced a continuing influx of Middle Eastern petro-dollars into the Egyptian financial markets.(3)
· In Latin America, Brazil was the Portfolio’s largest position during the period. Brazil’s government has stabilized its economy in recent years, resulting in lower inflation, an accumulation of reserves and an inflow of capital – trends that have resulted in a further appreciation of Brazil’s currency.(3)
· The Fund’s duration was 3.2 years at October 31, 2007. Duration is a measure of the sensitivity of a fund or a fixed-income security to changes in interest rates. A shorter duration instrument normally has less exposure to interest rate risk than longer duration instruments.
Fund shares are not insured by the FDIC and are not deposits or other obligations of, or guaranteed by, any depository institution. Shares are subject to investment risks, including possible loss of principal invested.
The views expressed throughout this report are those of the portfolio manager and are current only through the end of the period of the report as stated on the cover. These views are subject to change at any time based upon market or other conditions, and the investment adviser disclaims any responsibility to update such views. These views may not be relied on as investment advice and, because investment decisions for a fund are based on many factors, may not be relied on as an indication of trading intent on behalf of any Eaton Vance fund.
(1) | These returns do not include the 4.75% maximum sales charge for the Fund’s Class A shares. If sales charges were deducted, the returns would be lower. Absent a voluntary allocation of expenses to the adminsitrator, the returns would be lower. |
| |
(2) | It is not possible to invest directly in an Index. The Index’s total return does not reflect the commissions or expenses that would have been incurred if an investor individually purchased or sold the securities represented in the Index. |
| |
(3) | Fund allocations are subject to change due to active management. |
Past performance is no guarantee of future results. Returns are historical and are calculated by determining the percentage change in net asset value or offering price (as applicable) with all distributions reinvested. Investment return and principal value will fluctuate so that shares, when redeemed, may be worth more or less than their original cost. Performance is for the stated time period only; due to market volatility, the Fund’s current performance may be lower or higher than the quoted return. For performance as of the most recent month end, please refer to www.eatonvance.com.
1
Eaton Vance Emerging Markets Income Fund as of October 31, 2007
PORTFOLIO PROFILE
Securities Holdings (excludes derivatives)(1)
By total net assets
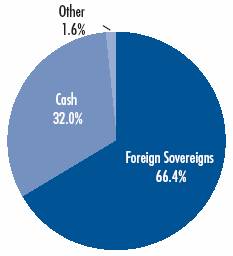
(1) Securities Holdings reflect the Portfolio’s investments as of 10/31/07. SecuritiesHoldings do not reflect derivatives positions. For International and Emerging Market exposures please refer to the Regional Currency Exposure table. Portfolio Statistics may not be representative of the Portfolio’s current or future investments and are subject to change due to active management.
Regional Currency Exposures (including derivatives)(2)
By total net assets
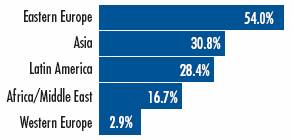
(2) | The Regional Currency Exposures reflects the Portfolio’s investments as of 10/31/07. Total exposures may exceed 100% due to implicit leverage created by derivatives. Portfolio Statistics may not be representative of the Portfolio’s current or future investments and are subject to change due to active management. |
Currency Positions (including derivatives)(3)
By total net assets
Poland | | 15.0 | % |
Turkey | | 14.1 | |
Malaysia | | 13.3 | |
Brazil | | 12.3 | |
Indonesia | | 11.7 | |
Mexico | | 10.1 | |
Czech Republic | | 9.8 | |
Hungary | | 9.3 | |
South Africa | | 7.3 | |
Egypt | | 6.1 | |
Slovakia | | 3.1 | |
Iceland | | 2.9 | |
Philippines | | 2.4 | |
Peru | | 2.2 | |
India | | 2.1 | |
Russia | | 2.0 | |
Nigeria | | 1.5 | |
Chile | | 1.4 | |
Colombia | | 1.0 | |
Uruguay | | 0.9 | |
Ghana | | 0.9 | |
Kazakhstan | | 0.8 | |
Romania | | 0.7 | |
South Korea | | 0.5 | |
Guatemala | | 0.5 | |
Uganda | | 0.5 | |
Zambia | | 0.2 | |
Botswana | | 0.1 | |
Mauritius | | 0.1 | |
Kenya | | 0.1 | |
(3) | Currency Positions reflect the Portfolio’s investments as of 10/31/07. Currency exposures include all long foreign exchange denominated assets and all long currency derivatives. Net short positions and other foreign derivatives are excluded. Short Currency Exposures are 11.0%. Other Foreign Long derivatives are 11.5%. Other Foreign Short Derivatives are 5.5%. All numbers are a percentage of net assets. Total exposures may exceed 100% due to implicit leverage created by derivatives. Portfolio Statistics may not be representative of the Portfolio’s current or future investments and are subject to change due to active management. |
2
Eaton Vance Emerging Markets Income Fund as of October 31, 2007
FUND PERFORMANCE
The line graph and table set forth below provide information about the Fund’s performance. The line graph compares the performance of Class A of the Fund with that of the JP Morgan Government Bond Index - Emerging Market Global Diversified (Unhedged), an unmanaged broad-based index that currently comprises the local currency, fixed rate coupon issues of 13 markets greater than 1-year in maturity. The lines on the graph represent the total returns of a hypothetical investment of $10,000 in Class A of the Fund and in the JP Morgan Government Bond Index - Emerging Market Global Diversified (Unhedged). The table includes the total returns of Class A of the Fund at net asset value and public offering price. The performance presented below does not reflect the deduction of taxes, if any, that a shareholder would pay on Fund distributions or the redemption of Fund shares.
Fund Performance(1) As of 10/31/07 | | Class A | |
Share Class Symbol | | EAEIX | |
| | | |
Cumulative Total Return (at net asset value) | | | |
Life of Fund† | | 10.44 | % |
| | | |
SEC Cumulative Total Return (including sales charge or applicable CDSC) | | | |
Life of Fund† | | 5.18 | % |
† Inception Date – Class A: 6/27/07. |
|
(1) | Cumulative Total Return does not include the 4.75% maximum sales charge for Class A shares. If sales charges were deducted, the returns would be lower. SEC Cumulative Total Return for Class A reflects the maximum 4.75% sales charge. Absent a voluntary allocation of expenses to the administrator, the returns would be lower. |
Total Annual | | | |
Operating Expenses(2) | | Class A | |
| | | |
Expense Ratio | | 1.25 | % |
(2) | Source: Prospectus dated 6/27/07. |
Comparison of Change in Value of a $10,000 Investment in Eaton Vance Emerging Markets Income Fund, Class A vs. the JP Morgan Government Bond Index – Emerging Market Global Diversified (Unhedged) (JP Morgan Index)*
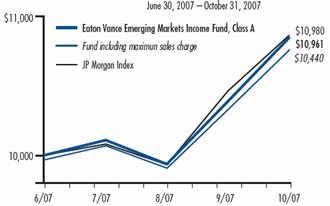
* Sources: Thomson Financial; Lipper. Class A of the Fund commenced operations on 6/27/07. Index data is available as of month end only. It is not possible to invest directly in an Index. The Index’s total return does not reflect the expenses that would have been incurred if an investor individually purchased or sold the securities represented in the Index.
Past performance is no guarantee of future results. Returns are historical and are calculated by determining the percentage change in net asset value or offering price (as applicable) with all distributions reinvested. Investment return and principal value will fluctuate so that shares, when redeemed, may be worth more or less than their original cost. Performance is for the stated time period only; due to market volatility, the Fund’s current performance may be lower or higher than the quoted return. For performance as of the most recent month end, please refer to www.eatonvance.com.
3
Eaton Vance Emerging Markets Income Fund as of October 31, 2007
FUND EXPENSES
Example: As a shareholder of the Fund, you incur two types of costs: (1) transaction costs, including sales charges (loads) on purchases and redemption fees (if applicable); and (2) ongoing costs, including management fees; distribution or service fees; and other Fund expenses. This Example is intended to help you understand your ongoing costs (in dollars) of investing in the Fund and to compare these costs with the ongoing costs of investing in other mutual funds. The actual expense Example is based on an investment of $1,000 invested at the beginning of the period and held for the entire period (June 27, 2007 – October 31, 2007). The hypothetical expense Example is based on an investment of $1,000 invested for the one-half year period (May 1, 2007 – October 31, 2007).
Actual Expenses: The first section of the table below provides information about actual account values and actual expenses. You may use the information in this section, together with the amount you invested, to estimate the expenses that you paid over the period. Simply divide your account value by $1,000 (for example, an $8,600 account value divided by $1,000 = 8.6), then multiply the result by the number in the first section under the heading entitled "Expenses Paid During Period" to estimate the expenses you paid on your account during this period.
Hypothetical Example for Comparison Purposes: The second section of the table below provides information about hypothetical account values and hypothetical expenses based on the actual Fund expense ratio and an assumed rate of return of 5% per year (before expenses), which is not the actual return of the Fund. The hypothetical account values and expenses may not be used to estimate the actual ending account balance or expenses you paid for the period. You may use this information to compare the ongoing costs of investing in your Fund and other funds. To do so, compare this 5% hypothetical example with the 5% hypothetical examples that appear in the shareholder reports of the other funds.
Please note that the expenses shown in the table are meant to highlight your ongoing costs only and do not reflect any transactional costs, such as sales charges (loads) or redemption fees (if applicable). Therefore, the second section of the table is useful in comparing ongoing costs only, and will not help you determine the relative total costs of owning different funds. In addition, if these transactional costs were included, your costs would have been higher.
Eaton Vance Emerging Markets Income Fund
| | | Beginning Account Value
(6/27/07) | | Ending Account Value
(10/31/07) | | Expenses Paid During Period
(6/27/07 – 10/31/07) | |
| Actual* | |
| Class A | | $ | 1,000.00 | | | $ | 1,104.40 | | | $ | 4.58 | *** | |
| Hypothetical** | |
| (5% return per year before expenses) | |
| Class A | | $ | 1,000.00 | | | $ | 1,018.90 | | | $ | 6.36 | *** | |
* Actual expenses are equal to the Fund's annualized expense ratio of 1.25% for Class A shares, multiplied by average account value over the period, multiplied by 127/365 (to reflect the period from the start of business, June 27, 2007 to October 31, 2007). The Example assumes that the $1,000 was invested at the net asset per share determined at the start of business on June 27, 2007. This Example reflects the expenses of both the Fund and the Portfolio.
** Hypothetical expenses are equal to the Fund's annualized expense ratio of 1.25% for Class A shares, multiplied by the average account value over the period, multiplied by 184/365 (to reflect the one-half year period). The Example assumes that $1,000 was invested at the net asset value per share determined at the start of business, June 27, 2007. The Example reflects the expenses of both the Fund and the Portfolio.
*** Absent a voluntary allocation of expenses to the administrator, the expenses would have been higher.
4
Eaton Vance Emerging Markets Income Fund as of October 31, 2007
FINANCIAL STATEMENTS
Statement of Assets and Liabilities
As of October 31, 2007
| Assets | |
Investment in Emerging Markets Income Portfolio,
at value (identified cost, $7,632) | | $ | 8,031 | | |
| Receivable from the administrator | | | 29,343 | | |
| Total assets | | $ | 37,374 | | |
| Liabilities | |
| Dividends payable | | $ | 64 | | |
| Payable to affiliate for distribution and service fees | | | 11 | | |
| Accrued expenses | | | 26,429 | | |
| Total liabilities | | $ | 26,504 | | |
| Net Assets | | $ | 10,870 | | |
| Sources of Net Assets | |
| Paid-in capital | | $ | 10,231 | | |
| Accumulated undistributed net realized gain from Portfolio | | | 302 | | |
| Accumulated distributions in excess of net investment income | | | (62 | ) | |
| Net unrealized appreciation from Portfolio | | | 399 | | |
| Total | | $ | 10,870 | | |
| Class A Shares | |
| Net Assets | | $ | 10,870 | | |
| Shares Outstanding | | | 1,010 | | |
Net Asset Value and Redemption Price Per Share
(net assets ÷ shares of beneficial interest outstanding) | | $ | 10.77 | | |
Maximum Offering Price Per Share
(100 ÷ 95.25 of $10.77) | | $ | 11.31 | | |
| On sales of $25,000 or more, the offering price of Class A shares is reduced. | |
Statement of Operations
For the Period Ended
October 31, 2007(1)
| Investment Income | |
| Interest allocated from Portfolio (net of foreign taxes, $7) | | $ | 209 | | |
| Expenses allocated from Portfolio | | | (36 | ) | |
| Net investment income from Portfolio | | $ | 173 | | |
| Expenses | |
Distribution and service fees
Class A | | $ | 11 | | |
| Legal and accounting services | | | 20,753 | | |
| Printing and postage | | | 3,549 | | |
| Custodian fee | | | 2,728 | | |
| Registration fees | | | 1,500 | | |
| Miscellaneous | | | 678 | | |
| Total expenses | | $ | 29,219 | | |
Deduct —
Allocation of expenses to the administrator | | $ | 29,211 | | |
| Total expense reductions | | $ | 29,211 | | |
| Net expenses | | $ | 8 | | |
| Net investment income | | $ | 165 | | |
Realized and Unrealized
Gain (Loss) from Portfolio | |
Net realized gain (loss) —
Investment transactions | | $ | 17 | | |
| Swap contracts | | | 1 | | |
| Foreign currency and forward foreign currency exchange contract transactions | | | 308 | | |
| Net realized gain | | $ | 326 | | |
Change in unrealized appreciation (depreciation) —
Investments | | $ | 244 | | |
| Swap contracts | | | 10 | | |
| Foreign currency and forward foreign currency exchange contracts | | | 145 | | |
| Net change in unrealized appreciation (depreciation) | | $ | 399 | | |
| Net realized and unrealized gain | | $ | 725 | | |
| Net increase in net assets from operations | | $ | 890 | | |
(1) For the period from the start of business, June 27, 2007 to October 31, 2007.
See notes to financial statements
5
Eaton Vance Emerging Markets Income Fund as of October 31, 2007
FINANCIAL STATEMENTS CONT'D
Statement of Changes in Net Assets
Increase (Decrease)
in Net Assets | | Period Ended
October 31, 2007(1) | |
From operations —
Net investment income | | $ | 165 | | |
Net realized gain from investment transactions,
swap contracts and foreign currency and forward foreign
currency exchange contract transactions | | | 326 | | |
Net change in unrealized appreciation (depreciation)
from investments, swap contracts and foreign currency and
forward foreign currency exchange contracts | | | 399 | | |
| Net increase in net assets from operations | | $ | 890 | | |
Distributions to shareholders —
From net investment income
Class A | | $ | (252 | ) | |
| Total distributions to shareholders | | $ | (252 | ) | |
Transactions in shares of beneficial interest —
Proceeds from sale of shares
Class A | | $ | 10,100 | | |
| Capital contribution from administrator | | | 132 | | |
| Net increase in net assets from Fund share transactions | | $ | 10,232 | | |
| Net increase in net assets | | $ | 10,870 | | |
| Net Assets | |
| At beginning of period | | $ | — | | |
| At end of period | | $ | 10,870 | | |
| Accumulated distributions in excess of net investment income included in net assets | |
| At end of period | | $ | (87 | ) | |
(1) For the period from the start of business, June 27, 2007 to October 31, 2007.
See notes to financial statements
6
Eaton Vance Emerging Markets Income Fund as of October 31, 2007
FINANCIAL STATEMENTS CONT'D
Financial Highlights
| | | Class A | |
| | | Period Ended
October 31, 2007(1)(2) | |
| Net asset value — Beginning of period | | $ | 10.000 | | |
| Income (loss) from operations | |
| Net investment income | | $ | 0.165 | | |
| Net realized and unrealized gain | | | 0.732 | | |
| Total income from operations | | $ | 0.897 | | |
| Less distributions | |
| From net investment income | | $ | (0.259 | ) | |
| Total distributions | | $ | (0.259 | ) | |
| Capital contribution from administrator | | $ | 0.132 | | |
| Net asset value — End of period | | $ | 10.77 | | |
| Total Return(3) | | | 10.44 | %(4)(8) | |
| Ratios/Supplemental Data | |
| Net assets, end of period (000's omitted) | | $ | 11 | | |
| Ratios (As a percentage of average daily net assets): | |
| Expenses(5) | | | 1.25 | %(6)(7) | |
| Net investment income | | | 4.67 | %(6)(7) | |
| Portfolio Turnover of the Portfolio | | | 2 | % | |
(1) Net investment income per share was computed using average shares outstanding.
(2) For the period from the start of business, June 27, 2007 to October 31, 2007.
(3) Returns are historical and are calculated by determining the percentage change in net asset value with all distributions reinvested.
(4) Not annualized.
(5) Includes the Fund's share of the Portfolio's allocated expenses.
(6) Annualized.
(7) The administrator subsidized certain operating expenses (equal to 287.76% of average daily net assets for the period from the start of business, June 27, 2007 to October 31, 2007).
(8) Absent a capital contribution by the administrator in the period, total return would have been 9.12%.
See notes to financial statements
7
Eaton Vance Emerging Markets Income Fund as of October 31, 2007
NOTES TO FINANCIAL STATEMENTS
1 Significant Accounting Policies
Eaton Vance Emerging Markets Income Fund (the Fund), is a non-diversified series of Eaton Vance Mutual Funds Trust (the Trust). The Trust is a Massachusetts business trust registered under the Investment Company Act of 1940, as amended (the 1940 Act), as an open-end management investment company. The Fund offers one class of shares. Class A shares are generally sold subject to a sales charge imposed at the time of purchase. The Fund invests all of its investable assets in interests in the Emerging Markets Income Portfolio (the Portfolio), a New York trust, having the same investment objective and policies as the Fund. The value of the Fund's investment in the Portfolio reflects the Fund's proportionate interest in the net assets of the Portfolio (0.01% at October 31, 2007). The performance of the Fund is directly affected by the performance of the Portfolio. The financial statements of the Portfolio, including the portfolio of i nvestments, are included elsewhere in this report and should be read in conjunction with the Fund's financial statements.
The following is a summary of significant accounting policies of the Fund. The policies are in conformity with accounting principles generally accepted in the United States of America.
A Investment Valuation — Valuation of securities by the Portfolio is discussed in Note 1A of the Portfolio's Notes to Financial Statements, which are included elsewhere in this report.
B Income — The Fund's net investment income or loss consists of the Fund's pro-rata share of the net investment income or loss of the Portfolio, less all actual and accrued expenses of the Fund.
C Federal Taxes — The Fund's policy is to comply with the provisions of the Internal Revenue Code applicable to regulated investment companies and to distribute to shareholders each year substantially all of its net investment income, and all or substantially all of its net realized capital gains. Accordingly, no provision for federal income or excise tax is necessary.
In June 2006, the Financial Accounting Standards Board (FASB) issued FASB Interpretation No. 48 (FIN 48), "Accounting for Uncertainty in Income Taxes – an interpretation of FASB Statement No. 109". FIN 48 clarifies the accounting for uncertainty in income taxes recognized in accordance with FASB Statement No. 109, "Accounting for Income Taxes". This interpretation prescribes a recognition threshold and measurement attribute for the financial statement recognition and measurement of a tax position taken or expected to be taken in a tax return. It also provides guidance on de-recognition, classification, interest and penalties, accounting in interim periods, disclosure and transition. FIN 48 is effective on the last business day of the first required financial reporting period for fiscal years beginning after December 15, 2006. Management has concluded th at as of October 31, 2007, there are no uncertain tax positions that would require financial statement recognition, derecognition, or disclosure.
D Expenses — The majority of expenses of the Trust are directly identifiable to an individual fund. Expenses which are not readily identifiable to a specific fund are allocated taking into consideration, among other things, the nature and type of expense and the relative size of the funds.
E Expense Reduction — State Street Bank and Trust Company (SSBT) serves as custodian of the Fund. Pursuant to the custodian agreement, SSBT receives a fee reduced by credits, which are determined based on the average daily cash balance the Fund maintains with SSBT. All credit balances, if any, used to reduce the Fund's custodian fees are reported as a reduction of expenses in the Statement of Operations.
F Use of Estimates — The preparation of the financial statements in conformity with accounting principles generally accepted in the United States of America requires management to make estimates and assumptions that affect the reported amounts of assets and liabilities at the date of the financial statements and the reported amounts of income and expense during the reporting period. Actual results could differ from those estimates.
G Indemnifications — Under the Trust's organizational documents, its officers and Trustees may be indemnified against certain liabilities and expenses arising out of the performance of their duties to the Fund, and shareholders are indemnified against personal liability for obligations of the Trust. Additionally, in the normal course of business, the Fund enters into agreements with service providers that may contain indemnification clauses. The Fund's maximum exposure under these arrangements is unknown as this would involve future claims that may be made against the Fund that have not yet occurred.
H Other — Investment transactions are accounted for on a trade date basis. Dividends to shareholders are recorded on the ex-dividend date.
8
Eaton Vance Emerging Markets Income Fund as of October 31, 2007
NOTES TO FINANCIAL STATEMENTS CONT'D
2 Distributions to Shareholders
The Fund declares dividends daily to shareholders of record at the time of declaration. Distributions are generally paid monthly. Distributions of realized capital gains, if any, are made at least annually. Shareholders may reinvest income and capital gain distributions in additional shares of the same class of the Fund at the net asset value as of the ex-dividend date or, at the election of the shareholder, receive distributions in cash. The Fund distinguishes between distributions on a tax basis and a financial reporting basis. Accounting principles generally accepted in the United States of America require that only distributions in excess of tax basis earnings and profits be reported in the financial statements as a return of capital. Permanent differences between book and tax accounting relating to distributions are reclassified to paid-in capital.
The tax character of distributions declared for the period from start of business, June 27, 2007 to October 31, 2007 was as follows:
| | | Period Ended
October 31, 2007 | |
| Distributions declared from: | |
| Ordinary income | | $ | 252 | | |
During the period from the start of business, June 27, 2007 to October 31, 2007, accumulated distributions in excess of net investment income was decreased by $25, accumulated undistributed net realized gain was decreased by $24, and paid-in capital was decreased by $1, due to differences between book and tax accounting primarily for foreign currency gain (loss) and accounting for swaps. These reclassifications had no effect on the net assets or net asset value per share of the Fund.
As of October 31, 2007, the components of distributable earnings (accumulated losses) and unrealized appreciation (depreciation) on a tax basis were as follows:
| Undistributed ordinary income | | $ | 230 | | |
| Undistributed long-term capital gains | | $ | 154 | | |
| Unrealized appreciation | | $ | 319 | | |
| Other temporary differences | | $ | (64 | ) | |
The differences between components of distributable earnings (accumulated losses) on a tax basis and the amount reflected in the Statements of Assets and Liabilities are primarily due to differences in book and tax policies for the timing of recognizing distributions to shareholders, accounting for swaps and foreign currency transactions.
3 Transactions with Affiliates
Eaton Vance Management (EVM) serves as the administrator of the Fund, but receives no compensation. The Fund has engaged EVM to render investment advisory services. Under the investment advisory agreement, EVM receives a monthly advisory fee equal to 0.65% annually of the average daily net assets of the Fund up to $1 billion that are invested directly in securities. On net assets of $1 billion and over that are invested directly in securities, the annual fee is reduced. For the period from the start of business, June 27, 2007, to October 31, 2007 the Fund held no direct investments and incurred no direct advisory fees. To the extent the Fund's assets are invested in the Portfolio, the Fund is allocated its share of the Portfolio's advisory fee. The Portfolio has engaged Boston Management and Research (BMR), a subsidiary of EVM, to render investment advisory services at the Portfolio level, (See Note 2 of the Portfolio's notes to financial statements which are included elsewhere in this report). Pursuant to a voluntary expense reimbursement, the administrator was allocated $29,211 of the Fund's operating expenses for the period ended October 31, 2007. During the period ended October 31, 2007, the administrator reimbursed the Fund $132 for forgone investment return resulting from the payment by the Fund of expenses that the administrator had intended to pay on behalf of the Fund. EVM serves as the sub-transfer agent of the Fund and receives an aggregate fee based upon the actual expenses incurred by EVM in the performance of those services. For the period from the start of business June 27, 2007 to October 31, 2007, EVM received no sub-transfer agent fees. The Fund was informed that Eaton Vance Distributors Inc. (EVD), the Fund's principal underwriter and a subsidiary of EVM, received no sales charge on sales of Class A shares for the period from the start of business, June 27, 2007, to October 31, 2007. EVD received distribution and service fees from Class A shares (see Note 4).
Except for Trustees of the Fund and the Portfolio who are not members of EVM's and BMR's organizations, officers and Trustees receive remuneration for their services to the Fund out of the investment advisory fee. Certain officers and Trustees of the Fund and of the Portfolio are officers of the above organizations.
4 Distribution Plans
The Fund has in effect a distribution plan for Class A shares (Class A Plan) pursuant to Rule 12b-1 under the 1940 Act. The Class A Plan provides that the Fund will pay EVD a distribution and service fee of 0.30% per annum of its
9
Eaton Vance Emerging Markets Income Fund as of October 31, 2007
NOTES TO FINANCIAL STATEMENTS CONT'D
average daily net assets attributable to Class A shares for distribution services and facilities provided to the Fund by EVD, as well as for personal services and/or the maintenance of shareholder accounts. Distribution and service fees paid or accrued to EVD for the period from start of business, June 27, 2007 to October 31, 2007 for Class A shares amounted to $11.
5 Contingent Deferred Sales Charges
Class A shares may be subject to a 1% contingent deferred sales charge (CDSC) if redeemed within eighteen months of purchase (depending on the circumstances of purchase). Generally, the CDSC is based upon the lower of the net asset value at date of redemption or date of purchase. No charge is levied on shares acquired by reinvestment of dividends or capital gains distributions. No CDSC is levied on shares which have been sold to EVM or its affiliates or to their respective employees or clients and may be waived under certain other limited conditions. From the start of business, June 27, 2007 to October 31, 2007, there were no CDSC fees paid by shareholders of Class A shares.
6 Investment Transactions
Increases and decreases in the Fund's investment in the Portfolio aggregated $10,100 and $2,966, respectively for the period from the start of business, June 27, 2007 to October 31, 2007.
7 Shares of Beneficial Interest
The Fund's Declaration of Trust permits the Trustees to issue an unlimited number of full and fractional shares of beneficial interest (without par value). Transactions in Fund shares were as follows:
| Class A | | Period Ended
October 31, 2007(1) | |
| Sales | | | 1,010 | | |
| Net increase | | | 1,010 | | |
(1) For the period from the start of business, June 27, 2007 to October 31, 2007.
At October 31, 2007 EVM owned 100% of the outstanding shares of the Fund.
8 Recently Issued Accounting Pronouncements
In September 2006, the FASB issued Statement of Financial Accounting Standards No. 157 (FAS 157), "Fair Value Measurements". FAS 157 defines fair value, establishes a framework for measuring fair value in accordance with generally accepted accounting principles and expands disclosure about fair value measurements. FAS 157 is effective for fiscal years beginning after November 15, 2007. Management is currently evaluating the impact the adoption of FAS 157 will have on the Fund's financial statement disclosures.
10
Eaton Vance Emerging Markets Income Fund as of October 31, 2007
REPORT OF INDEPENDENT REGISTERED PUBLIC ACCOUNTING FIRM
To the Trustees of Eaton Vance Mutual Funds Trust and Shareholders of Eaton Vance Emerging Markets Income Fund:
We have audited the accompanying statement of assets and liabilities of Eaton Vance Emerging Markets Income Fund (the Fund) (one of the series of Eaton Vance Mutual Funds Trust) as of October 31, 2007, the related statement of operations, the statement of changes in net assets and the financial highlights from the start of business, June 27, 2007 to October 31, 2007. These financial statements and financial highlights are the responsibility of the Fund's management. Our responsibility is to express an opinion on these financial statements and financial highlights based on our audit.
We conducted our audit in accordance with the standards of the Public Company Accounting Oversight Board (United States). Those standards require that we plan and perform the audit to obtain reasonable assurance about whether the financial statements and financial highlights are free of material misstatement. The Fund is not required to have, nor were we engaged to perform, an audit of its internal control over financial reporting. Our audit included consideration of internal control over financial reporting as a basis for designing audit procedures that are appropriate in the circumstances, but not for the purpose of expressing an opinion on the effectiveness of the Fund's internal control over financial reporting. Accordingly, we express no such opinion. An audit also includes examining, on a test basis, evidence supporting the amounts and disclosures in the financial statements, assessing the accounting principles used and si gnificant estimates made by management, as well as evaluating the overall financial statement presentation. We believe that our audit provides a reasonable basis for our opinion.
In our opinion, the financial statements and financial highlights referred to above present fairly, in all material respects, the financial position of Eaton Vance Emerging Markets Income Fund as of October 31, 2007, the results of its operations, the changes in its net assets and the financial highlights from the start of business, June 27, 2007 to October 31, 2007, in conformity with accounting principles generally accepted in the United States of America.
DELOITTE & TOUCHE LLP
Boston, Massachusetts
December 17, 2007
11
Eaton Vance Emerging Markets Income Fund as of October 31, 2007
FEDERAL TAX INFORMATION (Unaudited)
The Form 1099-DIV you receive in January 2008 will show the tax status of all distributions paid to your account in calendar 2007. Shareholders are advised to consult their own tax adviser with respect to the tax consequences of their investment in the Fund.
12
Emerging Markets Income Portfolio as of October 31, 2007
PORTFOLIO OF INVESTMENTS
| Bonds & Notes — 64.6% | |
| Security | | Principal | | U.S. $ Value | |
| Brazil — 9.4% | |
| Letra Tesouro Nacional, 0.00%, 1/1/09 | | BRL | 2,200,000 | | | $ | 1,114,990 | | |
| Nota Do Tesouro Nacional, 10.00%, 1/1/14 | | BRL | 3,810,000 | | | | 2,027,921 | | |
| Nota Do Tesouro Nacional, 10.00%, 1/1/10 | | BRL | 3,775,000 | | | | 2,108,474 | | |
| Total Brazil (identified cost $4,980,589) | | $ | 5,251,385 | | |
| Czech Republic — 4.6% | |
| Czech Republic, 3.55%, 10/18/12 | | CZK | 12,300,000 | | | $ | 642,696 | | |
| Czech Republic, 3.80%, 3/22/09 | | CZK | 11,820,000 | | | | 635,202 | | |
| Czech Republic, 3.80%, 4/11/15 | | CZK | 12,370,000 | | | | 643,893 | | |
| Czech Republic, 4.00%, 4/11/17 | | CZK | 12,420,000 | | | | 645,793 | | |
| Total Czech Republic (identified cost $2,233,344) | | $ | 2,567,584 | | |
| Egypt — 6.0% | |
| Arab Republic of Egypt, 8.75%, 7/18/12(1) | | EGP | 4,500,000 | | | $ | 850,494 | | |
| Egyptian Treasury Bill, 0.00%, 11/6/07 | | EGP | 3,400,000 | | | | 615,593 | | |
| Egyptian Treasury Bill, 0.00%, 1/8/08 | | EGP | 10,650,000 | | | | 1,907,079 | | |
| Total Egypt (identified cost $3,285,983) | | $ | 3,373,166 | | |
| Ghana — 0.9% | |
| Republic of Ghana, 13.00%, 8/2/10(2) GHS | | | 470,000 | | | $ | 488,067 | | |
| Total Ghana (identified cost $503,347) | | $ | 488,067 | | |
| Hungary — 9.1% | |
| Hungary Government Bond, 6.50%, 8/12/09 | | HUF | 380,000,000 | | | $ | 2,166,133 | | |
| Hungary Government Bond, 6.75%, 2/24/17 | | HUF | 221,000,000 | | | | 1,284,958 | | |
| Hungary Government Bond, 7.25%, 6/12/12 | | HUF | 277,000,000 | | | | 1,624,037 | | |
| Total Hungary (identified cost $4,832,577) | | $ | 5,075,128 | | |
| Indonesia — 8.8% | |
| Indonesia Government, 9.75%, 5/15/37 | | IDR | 11,804,000,000 | | | $ | 1,243,721 | | |
| Indonesia Government, 12.50%, 3/15/13 | | IDR | 28,503,000,000 | | | | 3,647,081 | | |
| Total Indonesia (identified cost $4,923,059) | | $ | 4,890,802 | | |
| Security | | Principal | | U.S. $ Value | |
| Mexico — 9.0% | |
| Mexican Fixed Rate Bonds, 9.00%, 12/24/09 | | MXN | 22,100,000 | | | $ | 2,118,075 | | |
| Mexican Fixed Rate Bonds, 9.00%, 12/22/11 | | MXN | 15,500,000 | | | | 1,515,577 | | |
| Mexican Fixed Rate Bonds, 10.00%, 12/5/24 | | MXN | 12,450,000 | | | | 1,391,889 | | |
| Total Mexico (identified cost $4,980,186) | | $ | 5,025,541 | | |
| Nigeria — 1.4% | |
| Nigeria Treasury Bill, 0.00%, 9/4/08(2) | | NGN | 11,660,000 | | | $ | 90,570 | | |
| Republic of Nigeria, 9.35%, 8/31/17 | | NGN | 16,595,000 | | | | 132,870 | | |
| Republic of Nigeria, 12.00%, 4/28/09 | | NGN | 27,583,000 | | | | 241,553 | | |
| Republic of Nigeria, 17.00%, 12/16/08 | | NGN | 36,700,000 | | | | 335,450 | | |
| Total Nigeria (identified cost $783,325) | | $ | 800,443 | | |
| Peru — 2.2% | |
| Republic of Peru, 6.90%, 8/12/37(1) | | PEN | 1,460,000 | | | $ | 514,058 | | |
| Republic of Peru, 8.60%, 8/12/17 | | PEN | 1,000,000 | | | | 392,350 | | |
| Republic of Peru, 12.25%, 8/10/11 | | PEN | 730,000 | | | | 294,428 | | |
| Total Peru (identified cost $1,117,445) | | $ | 1,200,836 | | |
| Poland — 4.4% | |
| Poland Government Bond, 4.75%, 4/25/12 | | PLN | 2,010,000 | | | $ | 773,654 | | |
| Poland Government Bond, 6.00%, 5/24/09 | | PLN | 2,350,000 | | | | 944,683 | | |
| Poland Government Bond, 6.25%, 10/24/15 | | PLN | 1,800,000 | | | | 748,589 | | |
| Total Poland (identified cost $2,203,366) | | $ | 2,466,926 | | |
| Slovakia — 3.0% | |
| Slovak Republic, 4.90%, 2/5/10 | | SKK | 20,800,000 | | | $ | 914,266 | | |
| Slovak Republic, 5.30%, 5/12/19 | | SKK | 16,900,000 | | | | 774,566 | | |
| Total Slovakia (identified cost $1,621,888) | | $ | 1,688,832 | | |
| Turkey — 4.8% | |
| Turkey Government Bond, 0.00%, 2/4/09 TRL | | | 3,800,000 | | | $ | 2,676,952 | | |
| Total Turkey (identified cost $2,438,055) | | $ | 2,676,952 | | |
See notes to financial statements
13
Emerging Markets Income Portfolio as of October 31, 2007
PORTFOLIO OF INVESTMENTS CONT'D
| Security | | Principal | | U.S. $ Value | |
| Uruguay — 1.0% | |
| Republic of Uruguay, 5.00%, 9/14/18(3) | | UYU | 11,474,957 | | | $ | 567,846 | | |
| Total Uruguay (identified cost $528,258) | | $ | 567,846 | | |
Total Bonds & Notes
(identified cost $34,431,422) | | $ | 36,073,508 | | |
| Call Options Purchased — 0.1% | |
| Security | | Contracts
(000's omitted) | | Value | |
South Korean Won Call Option, Expires 7/28/2009,
Strike Price 905.2 | | | 905,200 | | | $ | 29,084 | | |
Total Call Options Purchased
(identified cost $20,625) | | $ | 29,084 | | |
| Put Options Purchased — 0.0% | |
| Security | | Contracts
(000's omitted) | | Value | |
South Korean Won Put Option, Expires 7/28/2009,
Strike Price 905.2 | | | 905,200 | | | $ | 18,711 | | |
Total Put Options Purchased
(identified cost $21,650) | | $ | 18,711 | | |
| Short-Term Investments — 32.1% | |
| Description | | Interest
(000's omitted) | | Value | |
| Investment in Cash Management Portfolio, 4.83%(4) | | | 17,883 | | | $ | 17,883,275 | | |
Total Short-Term Investments
(identified cost $17,883,275) | | $ | 17,883,275 | | |
Total Investments — 96.8%
(identified cost $52,356,972) | | $ | 54,004,578 | | |
| Other Assets, Less Liabilities — 3.2% | | | | | | $ | 1,808,195 | | |
| Net Assets — 100.0% | | $ | 55,812,773 | | |
BRL - Brazilian Real
CZK - Crech Koruna
EGP - Egyptian Pound
GHS - Ghanaian Cedi
HUF - Hungarian Forint
IDR - Indonesian Rupiah
MXN - Mexican Peso
NGN - Nigerian Naira
PEN - Peruvian Sol
PLN - Polish Zloty
SKK - Slovak Koruna
TRL - Turkish Lira
UYU - Uruguayo Peso
(1) Security exempt from registration under Rule 144A of the Securities Act of 1933. These securities may be sold in transactions exempt from registration, normally to qualified institutional buyers. At October 31, 2007, the aggregate value of the securities is $1,364,552 or 2.4% of the Portfolio's net assets.
(2) Security valued at fair value using methods determined in good faith by or at the direction of the Trustees.
(3) Bond pays a coupon of 5% on the face at the end of the payment period. Principal grows with the Uruguayan inflation rate. Original face of the bond is UYU 4,900,000.
(4) Affiliated investment company available to Eaton Vance portfolios and funds which invests in high quality U.S. dollar denominated money market instruments. The rate shown is the annualized seven-day yield as of October 31, 2007.
See notes to financial statements
14
Emerging Markets Income Portfolio as of October 31, 2007
FINANCIAL STATEMENTS
Statement of Assets and Liabilities
As of October 31, 2007
| Assets | |
| Unaffiliated investments, at value (identified cost, $34,473,697) | | $ | 36,121,303 | | |
| Affiliated investment, at value (identified cost, $17,883,275) | | | 17,883,275 | | |
| Foreign currency, at value (identified cost, $34,993) | | | 35,898 | | |
| Interest receivable | | | 789,417 | | |
| Interest receivable from affiliated investment | | | 82,879 | | |
| Receivable for open swap contracts | | | 74,335 | | |
| Receivable for open forward foreign currency contracts | | | 917,500 | | |
| Receivable for closed forward foreign currency contracts | | | 161,405 | | |
| Total assets | | $ | 56,066,012 | | |
| Liabilities | |
| Payable to affiliate for investment advisory fee | | $ | 21,968 | | |
| Payable for open swap contracts | | | 3,819 | | |
| Payable for open forward foreign currency contracts | | | 106,544 | | |
| Payable for closed forward foreign currency contracts | | | 7,187 | | |
| Accrued expenses and other liabilities | | | 113,721 | | |
| Total liabilities | | $ | 253,239 | | |
| Net Assets applicable to investors' interest in Portfolio | | $ | 55,812,773 | | |
| Sources of Net Assets | |
| Net proceeds from capital contributions and withdrawals | | $ | 53,247,346 | | |
| Net unrealized appreciation (computed on the basis of identified cost) | | | 2,565,427 | | |
| Total | | $ | 55,812,773 | | |
Statement of Operations
For the Period Ended
October 31, 2007(1)
| Investment Income | |
| Interest (net of foreign taxes, $39,918) | | $ | 705,283 | | |
| Interest income allocated from affiliated investment | | | 432,616 | | |
| Expenses allocated from affliated investment | | | (42,577 | ) | |
| Total investment income | | $ | 1,095,322 | | |
| Expenses | |
| Investment adviser fee | | $ | 74,040 | | |
| Legal and accounting services | | | 51,886 | | |
| Custodian fee | | | 32,162 | | |
| Miscellaneous | | | 997 | | |
| Total expenses | | $ | 159,085 | | |
| Net investment income | | $ | 936,237 | | |
| Realized and Unrealized Gain | |
Net realized gain —
Investment transactions (identified cost basis) | | $ | 2,953 | | |
| Swap contracts | | | 3,387 | | |
Foreign currency and forward foreign currency exchange
contract transactions | | | 1,807,876 | | |
| Net realized gain | | $ | 1,814,216 | | |
Change in unrealized appreciation (depreciation) —
Investments (identified cost basis) | | $ | 1,647,606 | | |
| Swap contracts | | | 70,516 | | |
| Foreign currency and forward foreign currency exchange contracts | | | 847,305 | | |
| Net change in unrealized appreciation (depreciation) | | $ | 2,565,427 | | |
| Net realized and unrealized gain | | $ | 4,379,643 | | |
| Net increase in net assets from operations | | $ | 5,315,880 | | |
(1) For the period from the start of business, June 27, 2007 to October 31, 2007.
See notes to financial statements
15
Emerging Markets Income Portfolio as of October 31, 2007
FINANCIAL STATEMENTS CONT'D
Statement of Changes in Net Assets
Increase (Decrease)
in Net Assets | | Period Ended
October 31, 2007(1) | |
From operations —
Net investment income | | $ | 936,237 | | |
Net realized gain from investment transactions,
swap contracts, and foreign currency and forward foreign
currency exchange contract transactions | | | 1,814,216 | | |
Net change in unrealized appreciation (depreciation)
from investments, swap contracts, and foreign currency
and forward foreign currency exchange contracts | | | 2,565,427 | | |
| Net increase in net assets from operations | | $ | 5,315,880 | | |
Capital transactions —
Contributions | | $ | 58,250,069 | | |
| Withdrawals | | | (7,868,186 | ) | |
| Net increase in net assets from capital transactions | | $ | 50,381,883 | | |
| Net increase in net assets | | $ | 55,697,763 | | |
| Net Assets | |
| At beginning of period | | $ | 115,010 | | |
| At end of period | | $ | 55,812,773 | | |
(1) For the period from the start of business, June 27, 2007 to October 31, 2007.
See notes to financial statements
16
Emerging Markets Income Portfolio as of October 31, 2007
FINANCIAL STATEMENTS CONT'D
Supplementary Data
| | | Period Ended
October 31, 2007(1) | |
| Ratios/Supplemental Data | |
| Ratios (As a percentage of average daily net assets): | |
| Expenses | | | 1.13 | %(2) | |
| Net investment income | | | 5.25 | %(2) | |
| Portfolio Turnover | | | 2 | % | |
| Total Return | | | 10.48 | %(3) | |
| Net assets, end of period (000's omitted) | | $ | 55,813 | | |
(1) For the period from the start of business on June 27, 2007 to October 31, 2007.
(2) Annualized.
(3) Not annualized.
See notes to financial statements
17
Emerging Markets Income Portfolio as of October 31, 2007
NOTES TO FINANCIAL STATEMENTS
1 Significant Accounting Policies
Emerging Markets Income Portfolio (the Portfolio) is a New York trust, registered under the Investment Company Act of 1940, as amended (the 1940 Act), as a non-diversified open-end management investment company. The Portfolio's investment objective is to seek total return. The Declaration of Trust permits the Trustees to issue interests in the Portfolio. At October 31, 2007, Eaton Vance Emerging Markets Income Fund and Eaton Vance Strategic Income Fund held an approximate 0.01% and 85.2% interest, respectively, in the Portfolio.
The following is a summary of significant accounting policies of the Portfolio. The policies are in conformity with accounting principles generally accepted in the United States of America.
A Investment Valuation — Debt securities, including those issued by foreign entities, will normally be valued on the basis of market valuations furnished by pricing services. The pricing services consider various factors relating to bonds or loans and/or market transactions to determine market value. Marketable securities that are listed on foreign or U.S. securities exchanges are valued at closing sale prices on the exchange where such securities are principally traded. Equity securities listed in the NASDAQ Global or Global Select Market are valued at the NASDAQ official closing price. Unlisted or listed securities for which closing sale prices are not available are valued at the mean between the latest available bid and ask prices. When valuing foreign investments that meet certain criteria, the Trustees have approved the use of a fair-value service that values such securities to reflect market trading that occurs after the close of the applicable foreign markets of comparable or other instruments that have strong correlation to the fair-valued securities. Financial futures contracts and options thereon listed on commodity exchanges and exchange-traded options are valued at closing settlement prices. The value of interest rate swaps are generally based upon a dealer quotation. Credit default swaps are valued by broker dealers (usually the counterparty to the agreement). Short-term debt securities and money-market securities (of U.S. issuers) maturing in sixty days or less are valued at amortized cost, which approximates market value. If short-term debt securities are acquired with a remaining maturity of more than sixty days, they will be valued by a pricing service. Other short-term instruments, including those issued by foreign entities, are valued by a pricing service, if available, or other market quotations.
Foreign exchange rates for foreign exchange forward contracts and for the translation of non-U.S. dollar-denominated investments into U.S. dollars are obtained from a pricing service. Sovereign credit default swaps are valued by a pricing service. Foreign interest rate swaps and over-the-counter currency options are valued using inputs from a third party into a valuation model. Investments for which market quotations are not readily available and investments for which the price of the security is not believed to represent its fair market value, are valued at fair value using methods determined in good faith by or at the direction of the Trustees.
The Portfolio may invest in Cash Management Portfolio (Cash Management), an affiliated investment company managed by Boston Management and Research (BMR), a subsidiary of Eaton Vance Management (EVM). Cash Management values its investment securities utilizing the amortized cost valuation technique permitted by Rule 2a-7 of the 1940 Act. This technique involves initially valuing a portfolio security at its cost and thereafter assuming a constant amortization to maturity of any discount or premium.
B Investment Transactions — Investment transactions for financial statement purposes are accounted for on a trade date basis. Realized gains and losses on investments sold are determined on the basis of identified cost.
C Income — Interest income is determined on the basis of interest accrued, adjusted for amortization of premium or accretion of discount. Dividend income is recorded on the ex-dividend date for dividends received in cash and/or securities. However, if the ex-dividend date has passed, certain dividends from foreign securities are recorded as the Portfolio is informed of the ex-dividend date.
D Federal Taxes — The Portfolio has elected to be treated as a partnership for federal tax purposes. No provision is made by the Portfolio for federal or state taxes on any taxable income of the Portfolio because each investor in the Portfolio is ultimately responsible for the payment of any taxes on its share of taxable income. Since at least one of the Portfolio's investors is a regulated investment company that invests all or substantially all of its assets in the Portfolio, the Portfolio normally must satisfy the applicable source of income and diversification requirements (under the Internal Revenue Code) in order for its investors to satisfy them. The Portfolio will allocate, at least annually among its investors, each investor's distributive share of the Portfolio' s net investment income, net realized capital gains and any other items of income, gain, loss, deduction or credit.
In June 2006, the Financial Accounting Standards Board (FASB) issued FASB Interpretation No. 48 (FIN 48), "Accounting for Uncertainty in Income Taxes – an interpretation of FASB Statement No. 109". FIN 48 clarifies the accounting for uncertainty in income taxes recognized in accordance with FASB Statement No. 109, "Accounting
18
Emerging Markets Income Portfolio as of October 31, 2007
NOTES TO FINANCIAL STATEMENTS CONT'D
for Income Taxes". This interpretation prescribes a recognition threshold and measurement attribute for the financial statement recognition and measurement of a tax position taken or expected to be taken in a tax return. It also provides guidance on de-recognition, classification, interest and penalties, accounting in interim periods, disclosure and transition. FIN 48 is effective on the last business day of the first required financial reporting period for fiscal years beginning after December 15, 2006. Management has concluded that as of October 31, 2007, there are no uncertain tax positions that would require financial statement recognition, derecognition, or disclosure.
E Financial Futures Contracts — The Portfolio may enter into financial futures contracts. The Portfolio's investment in financial futures contracts is designed for hedging against changes in interest rates or as a substitute for the purchase of securities. Upon entering into a financial futures contract, the Portfolio is required to deposit with the broker, either in cash or securities an amount equal to a certain percentage of the purchase price (initial margin). Subsequent payments, known as variation margin, are made or received by the Portfolio each business day, depending on the daily fluctuations in the value of the underlying security, and are recorded as unrealized gains or losses by the Portfolio. Gains (losses) are realized upon the expiration or closing of the financial futures contracts. Should market conditions change unexpectedly, the Portfolio may not achieve the anticipated benefits of the financial futures contracts and may realize a loss. In entering such contracts, the Portfolio bears the risk if the counterparties do not perform under the contracts' terms.
F Expense Reduction — State Street Bank and Trust Company (SSBT) serves as custodian of the Portfolio. Pursuant to the custodian agreement, SSBT receives a fee reduced by credits, which are determined based on the average daily cash balance the Portfolio maintains with SSBT. All credit balances, if any, used to reduce the Portfolio's custodian fees are reported as a reduction of expenses in the Statement of Operations.
G Foreign Currency Translation — Investment valuations, other assets, and liabilities initially expressed in foreign currencies are translated each business day into U.S. dollars based upon current exchange rates. Purchases and sales of foreign investment securities and income and expenses denominated in foreign currencies are translated into U.S. dollars based upon currency exchange rates in effect on the respective dates of such transactions. Recognized gains or losses on investment transactions attributable to changes in foreign currency exchange rates are recorded for financial statement purposes as net realized gains and losses on investments. That portion of unrealized gains and losses on invest ments that results from fluctuations in foreign currency exchange rates is not separately disclosed.
H Use of Estimates — The preparation of the financial statements in conformity with accounting principles generally accepted in the United States of America requires management to make estimates and assumptions that affect the reported amounts of assets and liabilities at the date of the financial statements and the reported amounts of income and expense during the reporting period. Actual results could differ from those estimates.
I Indemnifications — Under the Portfolio's organizational documents, its officers and Trustees may be indemnified against certain liabilities and expenses arising out of the performance of their duties to the Portfolio. Interestholders in the Portfolio are jointly and severally liable for the liabilities and obligations of the Portfolio in the event that the Portfolio fails to satisfy such liabilities and obligations; provided, however, that, to the extent assets are available in the Portfolio, the Portfolio may, under certain circumstances, indemnify interestholders from and against any claim or liability to which such holder may become subject by reason of being or having been an interestholder in the Portfolio. Additionally, in the normal course of business, the Portfo lio enters into agreements with service providers that may contain indemnification clauses. The Portfolio's maximum exposure under these arrangements is unknown as this would involve future claims that may be made against the Portfolio that have not yet occurred.
J Purchased Options — Upon the purchase of a call or put option, the premium paid by the Portfolio is included in the Statement of Assets and Liabilities as an investment. The amount of the investment is subsequently marked-to-market to reflect the current market value of the option purchased, in accordance with the Portfolio's policies on investment valuations discussed above. If an option which the Portfolio has purchased expires on the stipulated expiration date, the Portfolio will realize a loss in the amount of the cost of the option. If the Portfolio enters into a closing sale transaction, the Portfolio will realize a gain or loss, depending on whether the sales proceeds from the closing sale transaction are greater or less than the cost of the option. If a Portfoli o exercises a put option, it will realize a gain or loss from the sale of the underlying security, and the proceeds from such sale will be decreased by the premium originally paid. If the Portfolio exercises a call option, the cost of the security which the Portfolio purchases upon exercise will be increased by the premium originally paid.
K Written Options — Upon the writing of a call or a put option, an amount equal to the premium received by the Portfolio is included in the Statement of Assets and Liabilities
19
Emerging Markets Income Portfolio as of October 31, 2007
NOTES TO FINANCIAL STATEMENTS CONT'D
as a liability. The amount of the liability is subsequently marked-to-market to reflect the current value of the option written in accordance with the Portfolio's policies on investment valuations discussed above. Premiums received from writing options which expire are treated as realized gains. Premiums received from writing options which are exercised or are closed are added to or offset against the proceeds or amount paid on the transaction to determine the realized gain or loss. If a put option is exercised, the premium reduces the cost basis of the securities purchased by the Portfolio. The Portfolio, as writer of an option, may have no control over whether the underlying securities may be sold (call) or purchased (put) and, as a result, bears the market risk of an unfavorable change in the price of the securities underlying the written option.
L Forward Foreign Currency Exchange Contracts — The Portfolio may enter into forward foreign currency exchange contracts for the purchase or sale of a specific foreign currency at a fixed price on a future date. The Portfolio enters into forward contracts for hedging purposes as well as non-hedging purposes. The forward foreign currency exchange contract is adjusted by the daily exchange rate of the underlying currency and any gains or losses are recorded for financial statement purposes as unrealized until such time as the contract has been closed or offset by another contract with the same broker for the same settlement date and currency. Risks may arise upon entering these contracts from the potential inability of counterparties to meet the terms of their contracts and from movements in the value of a foreign currency relative to the U.S. dollar.
M Interest Rate Swaps — The Portfolio may enter into interest rate swap agreements to enhance return, to hedge against fluctuations in securities prices or interest rates, or as substitution for the purchase or sale of securities. Pursuant to these agreements, the Portfolio makes periodic payments at a fixed interest rate and, in exchange, receives payments based on the interest rate of a benchmark industry index. Payments received or made are recorded as realized gains or losses. During the term of the outstanding swap agreement, changes in the underlying value of the swap are recorded as unrealized gains or losses. The value of the swap is determined by changes in the relationship between two rates of interest. The Portfolio is exposed to credit loss in the event of non - -performance by the swap counterparty. Risk may also arise from movements in interest rates.
N Total Return Swaps — The Portfolio may enter into swap agreements to enhance return, to hedge against fluctuations in securities prices or interest rates or as substitution for the purchase or sale of securities. In a total return swap, the Portfolio makes payments at a rate equal to a predetermined spread to the one or three-month LIBOR. In exchange, the Portfolio receives payments based on the rate of return of a benchmark industry index or basket of securities. During the term of the outstanding swap agreement, changes in the underlying value of the swap are recorded as unrealized gains and losses. Periodic payments received or made are recorded as realized gains or losses. The value of the swap is determined by changes in the relationship between the rate of interest and the benchmark industry index or basket of securities. The Portfolio is exposed to credit loss in the event of nonperformance by the swap counterparty. However, the Portfolio does not anticipate nonperformance by the counterparty. Risk may also arise from the unanticipated movements in value of interest rates, securities, or the index.
O Credit Default Swaps — The Portfolio may enter into credit default swap contracts to buy or sell protection against default on an individual issuer or a basket of issuers of bonds. When the Portfolio is the buyer of a credit default swap contract, the Portfolio is entitled to receive the par (or other agreed-upon) value of a referenced debt obligation (or basket of debt obligations) from the counterparty to the contract in the event of a default by a third party, such as a U.S. or foreign corporate issuer, on the debt obligation. In return, the Portfolio pays the counterparty a periodic stream of payments over the term of the contract provided that no event of default has occurred. If no default occurs, the Portfolio would have spent the stream of payments and received no benefit from the contract. When the Portfolio is the seller of a credit default swap contract, it receives the stream of payments, but is obligated to pay upon default of the referenced debt obligation. As the seller, the Portfolio effectively adds leverage to its portfolio because, in addition to its total net assets, the Portfolio is subject to investment exposure on the notional amount of the swap. The interest fee paid or received on the swap contract, which is based on a specified interest rate on a fixed notional amount, is accrued daily as a component of unrealized appreciation (depreciation) and is recorded as realized gain upon receipt or realized loss upon payment. The Portfolio also records an increase or decrease to unrealized appreciation (depreciation) in an amount equal to the daily valuation. Up-front payments or receipts, if any, are recorded as other assets or other liabilities, respectively, and amortized over the life of the swap contract as realized gains or losses. The Portfolio segr egates assets in the form of cash and cash equivalents in an amount equal to the aggregate market value of the credit default swap of which it is the seller, marked to market on a daily basis. These transactions involve certain risks, including the risk that the seller may be unable to fulfill the transaction.
20
Emerging Markets Income Portfolio as of October 31, 2007
NOTES TO FINANCIAL STATEMENTS CONT'D
2 Investment Adviser Fee and Other Transactions with Affiliates
The investment adviser fee is earned by BMR as compensation for management and investment advisory services rendered to the Portfolio. Pursuant to the investment advisory agreement, BMR receives a monthly advisory fee at the annual rate of 0.65% annually of the average daily net assets of the Portfolio up to $1 billion, and at reduced rates as daily net assets exceed that level. The portion of the advisory fee payable by Cash Management on the Portfolio's investment of cash therein is credited against the Portfolio's advisory fee. For the period from the start of business, June 27, 2007, to October 31, 2007, the Portfolio's advisory fee totaled $114,815 of which $40,775 was allocated from Cash Management and $74,040 was paid or accrued directly by the Portfolio. BMR serves as administrator of the Portfolio but currently does not receive any fees.
Except for Trustees of the Portfolio who are not members of EVM's or BMR's organization, officers and Trustees receive remuneration for their services to the Portfolio out of the investment advisory fee. Trustees of the Portfolio who are not affiliated with the investment adviser may elect to defer receipt of all or a portion of their annual fees in accordance with the terms of the Trustees Deferred Compensation Plan. For the period from the start of business, June 27, 2007 to October 31, 2007, no significant amounts have been deferred. Certain officers and Trustees of the Portfolio are officers of the above organizations.
3 Line of Credit
The Portfolio participates with other portfolios and funds managed by EVM and its affiliates in a $200 million unsecured line of credit agreement with a group of banks. Borrowings are made by the Portfolio solely to facilitate the handling of unusual and/or unanticipated short-term cash requirements. Interest is charged to the Portfolio based on its borrowings at an amount above either the Eurodollar rate or Federal Funds rate. In addition, a fee computed at an annual rate of 0.07% on the daily unused portion of the line of credit is allocated among the participating portfolios and funds at the end of each quarter. The Portfolio did not have any significant borrowings or allocated fees during the period from the start of business, June 27, 2007, to October 31, 2007.
4 Purchases and Sales of Investments
The Portfolio invests primarily in foreign government and U.S. Government debt securities. The ability of the issuers of the debt securities to meet their obligations may be affected by economic developments in a specific industry or country. The Portfolio regularly invests in lower rated and comparable quality unrated high yield securities. These investments have different risks than investments in debt securities rated investment grade and held by the Portfolio. Risk of loss upon default by the borrower is significantly greater with respect to such debt securities than with other debt securities because these securities are generally unsecured and are more sensitive to adverse economic conditions, such as recession or increasing interest rates, than are investment grade issuers. At October 31, 2007, the Portfolio had invested approximately 17.28% of its net assets or approximately $9,650,000 in high yield securities. Purchases and sales of investments, other than short-term obligations, for the period from the start of business, June 27, 2007, to October 31, 2007 were as follows:
| Purchases | |
| Investments (non-U.S. Government) | | $ | 34,803,104 | | |
| | | $ | 34,803,104 | | |
| Sales | |
| Investments (non-U.S. Government) | | $ | 425,538 | | |
| | | $ | 425,538 | | |
5 Financial Instruments
The Portfolio may trade in financial instruments with off-balance sheet risk in the normal course of its investing activities to assist in managing exposure to various market risks. These financial instruments may include forward foreign currency exchange contracts, interest rate swaps, credit default swaps and financial futures contracts and may involve, to a varying degree, elements of risk in excess of the amounts recognized for financial statement purposes. The notional or contractual amounts of these instruments represent the investment the Portfolio has in particular classes of financial instruments and does not necessarily represent the amounts potentially subject to risk. The measurement of the risks associated with these instruments is meaningful only when all related and offsetting transactions are considered.
21
Emerging Markets Income Portfolio as of October 31, 2007
NOTES TO FINANCIAL STATEMENTS CONT'D
A summary of obligations under these financial instruments at October 31, 2007 is as follows:
| Forward Foreign Currency Exchange Contracts | |
| Sales | |
Settlement
Date(s) | | Deliver | | In Exchange For | | Net Unrealized
Depreciation | |
| 11/6/07 | | Canadian Dollar | | United States Dollar | | |
| | |
| | 487,500 | | 497,726 | | $ | (15,547 | ) | |
11/14/07
| | Canadian Dollar
426,000 | | United States Dollar
446,323 | | | (2,207 | ) | |
11/5/07
| | Chilean Peso
377,000,000 | | United States Dollar
762,695 | | | (1,236 | ) | |
11/1/07
| | Icelandic Krona
27,300,000 | | Euro
314,335 | | | (1,949 | ) | |
11/8/07
| | New Zealand Dollar
530,000 | | United States Dollar
398,549 | | | (8,850 | ) | |
11/5/07
| | Polish Zloty
3,844,000 | | Euro
1,056,044 | | | (5,156 | ) | |
11/1/07
| | Serbia
26,000,000 | | Euro
336,134 | | | 184 | | |
11/5/07
| | Slovakia Koruna
34,000,000 | | United States Dollar
1,427,731 | | | (50,164 | ) | |
11/1/07
| | United States Dollar
3,736 | | Euro
2,588 | | | 8 | | |
| | | | | | | $ | (84,917 | ) | |
| Purchases | |
Settlement
Date(s) | | In Exchange For | | Deliver | | Net Unrealized
Appreciation
(Depreciation) | |
11/30/07
| | Botswana Pula
315,000 | | United States Dollar
49,493 | | | $3,638 | | |
12/4/07
| | Brazilian Real
2,504,000 | | United States Dollar
1,430,530 | | | 3,539 | | |
11/5/07
| | Chilean Peso
377,000,000 | | United States Dollar
740,741 | | | 23,190 | | |
11/13/07
| | Chilean Peso
377,000,000 | | United States Dollar
762,726 | | | 1,184 | | |
11/16/07
| | Colombian Peso
1,159,000,000 | | United States Dollar
588,923 | | | (7,505 | ) | |
11/19/07
| | Czech Republic Koruna
52,660,000 | | United States Dollar
2,711,638 | | | 122,546 | | |
7/21/08
| | Guatemalan Quetzal
2,059,994 | | United States Dollar
263,866 | | | (616 | ) | |
11/1/07
| | Icelandic Krona
27,300,000 | | Euro Dollar
316,705 | | | (1,481 | ) | |
Settlement
Date(s) | | In Exchange For | | Deliver | | Net Unrealized
Appreciation
(Depreciation) | |
| 11/5/07 | | Icelandic Krona | | Euro Dollar | | |
| | |
| | 42,500,000 | | 481,423 | | $ | 13,945 | | |
11/16/07
| | Icelandic Krona
27,300,000 | | Euro Dollar
317,793 | | | (4,722 | ) | |
12/3/07
| | Icelandic Krona
27,300,000 | | Euro Dollar
311,786 | | | 1,962 | | |
11/5/07
| | Indian Rupee
10,588,000 | | United States Dollar
265,630 | | | 3,584 | | |
11/13/07
| | Indian Rupee
10,518,000 | | United States Dollar
265,405 | | | 1,924 | | |
11/26/07
| | Indian Rupee
10,528,000 | | United States Dollar
266,329 | | | 1,083 | | |
12/3/07
| | Indian Rupee
14,272,000 | | United States Dollar
360,677 | | | 1,708 | | |
11/13/07
| | Indonesian Rupiah
2,451,000,000 | | United States Dollar
268,956 | | | 248 | | |
11/26/07
| | Indonesian Rupiah
8,844,015,000 | | United States Dollar
962,666 | | | 7,749 | | |
10/14/08
| | Kazakh Tenge
51,456,000 | | United States Dollar
411,648 | | | (3,166 | ) | |
11/5/07
| | Kenyan Shilling
3,300,000 | | United States Dollar
49,361 | | | (34 | ) | |
11/9/07
| | Malaysian Ringgit
24,000,000 | | United States Dollar
7,058,824 | | | 139,015 | | |
11/13/07
| | Malaysian Ringgit
728,000 | | United States Dollar
215,417 | | | 2,942 | | |
1/18/08
| | Maritian Rand
1,595,500 | | United States Dollar
52,408 | | | 152 | | |
11/20/07
| | Mexican Peso
5,000,000 | | United States Dollar
461,476 | | | 5,042 | | |
11/9/07
| | New Turkish Lira
2,192,704 | | United States Dollar
1,835,052 | | | 32,176 | | |
11/19/07
| | New Turkish Lira
3,897,704 | | United States Dollar
3,196,936 | | | 111,432 | | |
11/30/07
| | Philippine Peso
59,000,000 | | United States Dollar
1,352,529 | | | (3,411 | ) | |
11/5/07
| | Polish Zloty
3,844,000 | | Euro
1,027,102 | | | 47,030 | | |
11/8/07
| | Polish Zloty
3,150,000 | | Euro
860,914 | | | 10,616 | | |
11/19/07
| | Polish Zloty
7,700,000 | | United States Dollar
2,938,483 | | | 132,256 | | |
11/26/07
| | Polish Zloty
3,844,000 | | Euro
1,055,644 | | | 5,085 | | |
11/13/07
| | Romanian Leu
951,500 | | Euro
283,016 | | | 3,720 | | |
22
Emerging Markets Income Portfolio as of October 31, 2007
NOTES TO FINANCIAL STATEMENTS CONT'D
Settlement
Date(s) | | In Exchange For | | Deliver | | Net Unrealized
Appreciation
(Depreciation) | |
| 11/6/07 | | Russian Ruble | | United States Dollar | | |
| | |
| | 27,050,000 | | 1,082,618 | | $ | 13,371 | | |
11/1/07
| | Serbia
26,000,000 | | Euro
336,352 | | | (500 | ) | |
11/5/07
| | Slovakia Koruna
34,000,000 | | United States Dollar
1,419,861 | | | 58,034 | | |
11/19/07
| | South African Rand
26,662,790 | | United States Dollar
3,904,634 | | | 161,829 | | |
4/4/08
| | Uganda Shilling
439,470,000 | | United States Dollar
246,917 | | | 1,510 | | |
2/7/08
| | Zambian Kwacha
403,690,000 | | United States Dollar
98,094 | | | 6,798 | | |
| | | | | | | $ | 895,873 | | |
At October 31, 2007, closed forward foreign currency purchases and sales excluded above amounted to a receivable of $161,405 and a payable of $7,187.
Credit Default Swaps
The Portfolio has entered into credit default swaps whereby the Portfolio is buying or selling protection against default exposing the Portfolio to risks associated with changes in credit spreads of the underlying instruments.
| Counterparty | | Reference
Entity | | Buy/
Sell | | Notional
Amount
(000s
omitted) | | Pay/
Receive
Annual
Fixed
Rate | | Termination
Date | | Net
Unrealized
Appreciation
(Depreciation) | |
| Lehman | | | | | | | | | | | | |
| | |
| Brothers, Inc. | | Turkey | | | | | | | | | | |
| | |
| | (Republic of) | | Buy | | $ | 1,057 | | | | 1.45 | % | | 7/20/12 | | $ | 4,062 | | |
Lehman
Brothers, Inc. | | CDX.EM.
8 Index* | | Buy | | | 2,000 | | | | 1.75 | | | 12/20/12 | | | (3,610 | ) | |
| | | | | | | | | | | | | $ | 452 | | |
* CDX. EM. 8 Index is composed of issues from (i) Latin America; (ii) Eastern Europe, the Middle East and Africa; and (iii) Asia as determined by Markit Partners.
Interest Rate Swaps
| Counterparty | | Notional
Amount
(000's
omitted) | | Fund Pay/
Receive
Floating
Rate | | Floating
Rate Index | | Annual
Fixed Rate | | Termination
Date | | Net
Unrealized
Appreciation
(Depreciation) | |
J.P. Morgan
Chase, N.A | | ZAR | 36,500 | | |
Pay | | 3 month
Jibar | |
9.05% | |
October 12, 2015 | |
$70,273 | |
J.P. Morgan
Chase, N.A | | BRL | 1,466 | | |
Pay | | Brazilian
Interbank
Deposit Rate | |
11.34 | |
January 2, 2009 | |
(209) | |
| | | $70,064 | |
At October 31, 2007, the Portfolio had sufficient cash and/or securities segregated to cover commitments under these contracts.
6 Federal Income Tax Basis of Unrealized Appreciation (Depreciation)
The cost and unrealized appreciation (depreciation) of investments of the Portfolio at October 31, 2007, as determined on a federal income tax basis, were as follows:
| Aggregate cost | | $ | 52,438,770 | | |
| Gross unrealized appreciation | | $ | 1,641,917 | | |
| Gross unrealized depreciation | | | (76,109 | ) | |
| Net unrealized appreciation | | $ | 1,565,808 | | |
The net unrealized appreciation at October 31, 2007 on foreign currency, forward foreign currency exchange contracts and swap contracts on a federal income tax basis was $917,821.
7 Risks Associated with Foreign Investments
Investing in securities issued by companies whose principal business activities are outside the United States may involve significant risks not present in domestic investments. For example, there is generally less publicly available information about foreign companies, particularly those not subject to the disclosure and reporting requirements of the U.S. securities laws. Certain foreign issuers are generally not bound by uniform accounting, auditing, and financial reporting requirements and standards of practice comparable to those applicable to domestic issuers. Investments in foreign securities also involve the risk of possible adverse changes in investment or exchange control regulations, expropriation or confiscatory taxation, limitation on the removal of funds or other assets of the Portfolio, political or financial instability or diplomatic and other developments which could affect such investments. Foreign stock markets, while growing in volume and sophistication, are generally not as developed as those in the United States, and securities of some foreign issuers (particularly those located in developing countries) may be less liquid and more volatile than securities of comparable U.S. companies. In general, there is less overall governmental supervision and regulation of foreign securities markets, broker-dealers and issuers than in the United States.
23
Emerging Markets Income Portfolio as of October 31, 2007
NOTES TO FINANCIAL STATEMENTS CONT'D
8 Recently Issued Accounting Pronouncements
In September 2006, the FASB issued Statement of Financial Accounting Standards No. 157 (FAS 157), "Fair Value Measurements". FAS 157 defines fair value, establishes a framework for measuring fair value in accordance with generally accepted accounting principles and expands disclosure about fair value measurements. FAS 157 is effective for fiscal years beginning after November 15, 2007. Management is currently evaluating the impact the adoption of FAS 157 will have on the Portfolio's financial statement disclosures.
24
Emerging Markets Income Portfolio as of October 31, 2007
REPORT OF INDEPENDENT REGISTERED PUBLIC ACCOUNTING FIRM
To the Trustees and Investors
of Emerging Markets Income Portfolio:
We have audited the accompanying statement of assets and liabilities of Emerging Markets Income Portfolio (the "Portfolio"), including the portfolio of investments, as of October 31, 2007, and the related statement of operations, the statements of changes in net assets, and the supplementary data from the start of business, June 27, 2007 to October 31, 2007. These financial statements and supplementary data are the responsibility of the Portfolio's management. Our responsibility is to express an opinion on these financial statements and supplementary data based on our audit.
We conducted our audit in accordance with standards of the Public Company Accounting Oversight Board (United States). Those standards require that we plan and perform the audit to obtain reasonable assurance about whether the financial statements and supplementary data are free of material misstatement. The Portfolio is not required to have, nor were we engaged to perform, an audit of its internal control over financial reporting. Our audit included consideration of internal control over financial reporting as a basis for designing audit procedures that are appropriate in the circumstances, but not for the purpose of expressing an opinion on the effectiveness of the Portfolio's internal control over financial reporting. Accordingly, we express no such opinion. An audit includes examining, on a test basis, evidence supporting the amounts and disclosures in the financial statements, assessing the accounting principles used and sig nifying estimates made by management, as well as evaluating the overall financial statement presentation. Our procedures included confirmation of securities owned as of October 31, 2007 by correspondence with the custodian and brokers. We believe that our audit provides a reasonable basis for our opinion.
In our opinion, the financial statements and supplementary data referred to above present fairly, in all material respects, the financial position of Emerging Markets Income Portfolio as of October 31, 2007, the results of its operations, the changes in its net assets, and the supplementary data from the the start of business, June 27, 2007 to October 31, 2007, in conformity with accounting principles generally accepted in the United States of America.
DELOITTE & TOUCHE LLP
Boston, Massachusetts
December 17, 2007
25
Eaton Vance Emerging Markets Income Fund
BOARD OF TRUSTEES' APPROVAL OF THE INVESTMENT ADVISORY AGREEMENTS
Overview of the Contract Review Process
The Investment Company Act of 1940, as amended (the "1940 Act"), provides, in substance, that for a fund to enter into an investment advisory agreement with an investment adviser, the fund's board of trustees, including a majority of the trustees who are not "interested persons" of the fund ("Independent Trustees"), must approve the agreement and its terms at an in-person meeting called for the purpose of considering such approval.
At a meeting of the Boards of Trustees (each a "Board") of the Eaton Vance group of mutual funds (the "Eaton Vance Funds") held on March 12, 2007, the Board, including a majority of the Independent Trustees, voted to approve the investment advisory agreement of the Emerging Markets Income Fund (the "Fund") with Eaton Vance Management ("EVM"), as well as the investment advisory agreement of the Emerging Markets Income Portfolio (the "Portfolio"), the portfolio in which the Fund will invest substantially all of its assets, with Boston Management and Research ("BMR"), an affiliate of EVM (EVM, with respect to the Fund, and BMR, with respect to the Portfolio, are each referred to herein as the "Adviser"). The Board reviewed information furnished for the March 2007 meeting as well as information previously furnished with respect to the approval of other investment advisory agreements for other Eaton Vance Funds. Such information incl uded, among other things, the following:
Information about Fees and Expenses
• The advisory and related fees to be paid by the Fund directly or indirectly through the Portfolio and the estimated expense ratio of the Fund;
• Comparative information concerning fees charged by the Adviser for managing other mutual funds and institutional accounts using investment strategies and techniques similar to those to be used in managing the Fund and the Portfolio, and concerning fees charged by other advisers for managing funds similar to the Fund and Portfolio;
Information about Portfolio Management
• Descriptions of the investment management services to be provided to the Fund and the Portfolio, including the investment strategies and processes to be employed;
• Information concerning the allocation of brokerage and the benefits expected to be received by the Adviser as a result of brokerage allocation, including information concerning the acquisition of research through "soft dollar" benefits received in connection with the Eaton Vance Funds' brokerage, and the implementation of the soft dollar reimbursement program established with respect to the Eaton Vance Funds;
• The procedures and processes to be used to determine the fair value of Fund and Portfolio assets and actions to be taken to monitor and test the effectiveness of such procedures and processes;
Information about the Adviser
• Reports detailing the financial results and condition of the Adviser;
• Descriptions of the qualifications, education and experience of the individual investment professionals whose responsibilities include portfolio management and investment research for the Fund and the Portfolio, and information relating to their compensation and responsibilities with respect to managing other mutual funds and investment accounts;
• Copies of the Codes of Ethics of the Adviser and its affiliates, together with information relating to compliance with and the administration of such codes;
• Information concerning the resources devoted to compliance efforts undertaken by the Adviser and its affiliates on behalf of the Eaton Vance Funds (including descriptions of various compliance programs) and their record of compliance with investment policies and restrictions, including policies with respect to market-timing, late trading and selective portfolio disclosure, and with policies on personal securities transactions;
• Descriptions of the business continuity and disaster recovery plans of the Adviser and its affiliates;
Other Relevant Information
• Information concerning the nature, cost and character of the administrative and other non-investment management services to be provided by Eaton Vance Management and its affiliates;
• Information concerning management of the relationship with the custodian, subcustodians and fund accountants by the Adviser or the administrator; and
• The terms of the advisory agreement for the Fund and for the Portfolio.
26
Eaton Vance Emerging Markets Income Fund
BOARD OF TRUSTEES' APPROVAL OF THE INVESTMENT ADVISORY AGREEMENTS CONT'D
Results of the Process
Based on its consideration of the foregoing, and such other information as it deemed relevant, including the factors and conclusions described below, the Board concluded that the investment advisory agreement of the Fund with EVM, as well as the terms of the investment advisory agreement of the Portfolio with BMR, including the fee structure of each agreement, is in the interests of shareholders and, therefore, the Board, including a majority of the Independent Trustees, voted to approve the investment advisory agreements for the Fund and the Portfolio.
Nature, Extent and Quality of Services
In considering whether to approve the investment advisory agreements of the Fund and the Portfolio, the Board evaluated the nature, extent and quality of services provided to the Fund by EVM and the Portfolio by BMR. The Board considered EVM's and BMR's management capabilities and investment process with respect to the types of investments to be held by the Fund and the Portfolio, including the education, experience and number of its investment professionals and other personnel who provide portfolio management, investment research, and similar services to the Portfolio and the Fund. The Board specifically noted EVM's and BMR's expertise with respect to emerging markets and in-house research capabilities. The Board also took into account the resources dedicated to portfolio management and other services, including the compensation paid to recruit and retain investment personnel, and the time and attention devoted to each fund in the complex by senior management.
The Board noted that under the terms of the investment advisory agreement of the Fund, EVM may invest assets of the Fund directly in securities, for which it may receive a fee, or in the Portfolio, for which it receives no separate fee but for which BMR receives an advisory fee from the Portfolio. The Trustees considered the potential benefits to the Fund of the ability to make direct investments, such as an improved ability to: manage the Fund's duration, or other general market exposures, using certain derivatives; add exposure to specific market sectors or asset classes without changing the Portfolio's investments, which would affect any other fund investing in the Portfolio; hedge some of the general market risks of the Portfolio while retaining the value added by the individual manager; and hedge a portion of the exposures of the Portfolio while retaining others (e.g., hedging the U.S. government exposure of the Portfolio w hile retaining its exposure to high-grade corporate bonds).
The Board reviewed the compliance programs of the Adviser and relevant affiliates thereof. Among other matters, the Board considered compliance and reporting matters relating to personal trading by investment personnel, selective disclosure of portfolio holdings, late trading, frequent trading, portfolio valuation, business continuity and the allocation of investment opportunities. The Board also evaluated the responses of the Adviser and its affiliates to requests from regulatory authorities such as the Securities and Exchange Commission and the National Association of Securities Dealers.
The Board considered shareholder and other administrative services provided or managed by EVM and its affiliates, including transfer agency and accounting services. The Board evaluated the benefits to shareholders of investing in a fund that is a part of a large family of funds, including the ability, in many cases, to exchange an investment among different funds without incurring additional sales charges.
After consideration of the foregoing factors, among others, the Board concluded that the nature, extent and quality of services provided by the Adviser, taken as a whole, are appropriate and consistent with the terms of the investment advisory agreements.
Management Fees and Expenses
The Board reviewed contractual investment advisory fee rates to be paid by the Fund directly or indirectly through its pro rata share of the expenses of the Portfolio (referred to as "management fees"). As part of its review, the Board considered the Fund's management fees and estimated expense ratio for a one-year period.
After reviewing the foregoing information, and in light of the nature, extent and quality of the services provided by the Adviser, the Board concluded that the management fees proposed to be charged for advisory and related services and the Fund's total expense ratio are reasonable.
Economies of Scale
In reviewing management fees and profitability, the Board also considered the extent to which the Adviser and its affiliates, on the one hand, and the Fund and the Portfolio, on the other hand, can expect to realize benefits from economies of scale as the assets of the Fund and the Portfolios increase. The Board noted the structure of the advisory fee, which includes breakpoints at several asset levels both at the Fund and at the Portfolio level. Based upon the foregoing, the Board concluded that the Adviser and its affiliates and the Fund and the Portfolio can be expected to share such benefits equitably.
27
Eaton Vance Emerging Markets Income Fund
MANAGEMENT AND ORGANIZATION
Fund Management. The Trustees of Eaton Vance Mutual Funds Trust (the Trust) and Emerging Markets Income Portfolio (the Portfolio) are responsible for the overall management and supervision of the Trust's and Portfolio's affairs. The Trustees and officers of the Trust and the Portfolio are listed below. Except as indicated, each individual has held the office shown or other offices in the same company for the last five years. Trustees and officers of the Trust and the Portfolio hold indefinite terms of office. The "noninterested Trustees" consist of those Trustees who are not "interested persons" of the Trust and the Portfolio, as that term is defined under the 1940 Act. The business address of each Trustee and officer is The Eaton Vance Building, 255 State Street, Boston, Massachusetts 02109. As used below, "EVC" refers to Eaton Vance Corp., "EV" refers to E aton Vance, Inc., "EVM" refers to Eaton Vance Management, "BMR" refers to Boston Management and Research, "Parametric" refers to Parametric Portfolio Associates and "EVD" refers to Eaton Vance Distributors, Inc. EVC and EV are the corporate parent and trustee, respectively, of EVM and BMR. EVD is the Fund's principal underwriter, the Portfolio's placement agent and a wholly-owned subsidiary of EVM. Each officer affiliated with Eaton Vance may hold a position with other Eaton Vance affiliates that is comparable to his or her position with EVM listed below.
Name and
Date of Birth | | Position(s)
with the
Trust and
the Portfolio | | Term of
Office and
Length of
Service | | Principal Occupation(s)
During Past Five Years | | Number of Portfolios
in Fund Complex
Overseen By
Trustee(1) | | Other Directorships Held | |
| Interested Trustee | | | | | | | | | | | | | |
|
Thomas E. Faust Jr.
5/31/58 | | Trustee and President of the Trust | | Trustee since 2007 and President of the Trust since 2002 | | Chairman, Chief Executive Officer and President of EVC, President of EV, Cheif Executive Officer and President of EVM and BMR, and Director of EVD. Trustee and/or Officer of 176 registered investment companies and 5 private investment companies in the Eaton Vance Fund Complex. Mr. Faust is an interested person because of his positions with EVM, BMR, EVC and EV which are affiliates of the Trust and Portfolio. | | | 176 | | | Director of EVC | |
|
| Noninterested Trustee(s) | | | | | | | | | | | | | |
|
Benjamin C. Esty
1/2/63 | | Trustee | | Trustee of the Trust since 2005 and of the Portfolio since 2007 | | Roy and Elizabeth Simmons Professor of Business Administration, Harvard University Graduate School of Business Administration (since 2003). Formerly, Associate Professor, Harvard University Graduate School of Business Administration (2000-2003). Harvard University Graduate School of Business Administration (2000-2003). | | | 176 | | | None | |
|
Allen R. Freedman
4/3/40 | | Trustee | | Since 2007 | | Former Chairman and Chief Executive Officer of Assurant, Inc. (insurance provider) (1978-2000). Formerly, a Director of Loring Ward International (fund distributor) (2005-2007). | | | 175 | | | Director of Assurant, Inc. and Stonemor Partners L.P. (owner and operator of cemeteries) | |
|
William H. Park
9/19/47 | | Trustee | | Trustee of the Trust since 2003 and of the Portfolio since 2007 | | Vice Chairman, Commercial Industrial Finance Corp. (specialty finance company) (since 2006). Formerly, President and Chief Executive Officer, Prizm Capital Management, LLC (investment management firm) (since 2002-2005). | | | 176 | | | None | |
|
Ronald A. Pearlman
7/10/40 | | Trustee | | Trustee of the Trust since 2003 and of the Portfolio since 2007 | | Professor of Law, Georgetown University Law Center. | | | 176 | | | None | |
|
Norton H. Reamer
9/21/35 | | Trustee | | Trustee of the Trust since 1986 and of the Portfolio since 2007 | | President, Chief Executive Officer and a Director of Asset Management Finance Corp. (a specialty finance company serving the investment management industry) (since October 2003). President, Unicorn Corporation (an investment and financial advisory services company) (since September 2000). Formerly, Chairman and Chief Operating Officer, Hellman, Jordan Management Co., Inc. (an investment management company) (2000-2003). Formerly, Advisory Director of Berkshire Capital Corporation (investment banking firm) (2002-2003). | | | 176 | | | None | |
|
28
Eaton Vance Emerging Markets Income Fund
MANAGEMENT AND ORGANIZATION CONT'D
Name and
Date of Birth | | Position(s)
with the
Trust and
the Portfolio | | Term of
Office and
Length of
Service | | Principal Occupation(s)
During Past Five Years | | Number of Portfolios
in Fund Complex
Overseen By
Trustee(1) | | Other Directorships Held | |
| Noninterested Trustee(s) (continued) | | | | | | | | | | | | | |
|
Heidi L. Steiger
7/8/53 | | Trustee | | Since 2007 | | President, Lowenhaupt Global Advisors, LLC (global wealth management firm) (since 2005); Formerly, President and Contributing Editor, Worth Magazine (2004); Formerly, Executive Vice President and Global Head of Private Asset Management (and various other positions), Neuberger Berman (investment firm) (1986-2004). | | | 173 | | | Director of Nuclear Electric Insurance Ltd. (nuclear insurance provider) and Aviva USA (insurance provider). | |
|
Lynn A. Stout
9/14/57 | | Trustee | | Trustee of the Trust since 1998 and of the Portfolio since 2007 | | Paul Hastings Professor of Corporate and Securities Law, University of California at Los Angeles School of Law. | | | 176 | | | None | |
|
Ralph F. Verni
1/26/43 | | Chairman of the Board and Trustee | | Chairman of the Board and Trustee of the Portfolio since 2007; Trustee of the Trust since 2005 | | Consultant and private investor. | | | 176 | | | None | |
|
| Principal Officers who are not Trustees | | | | | | | | | | | | | |
|
Name and
Date of Birth | | Position(s)
with the
Trust and
the Portfolio | | Term of
Office and
Length of
Service | | Principal Occupation(s)
During Past Five Years | |
William H. Ahern, Jr.
7/28/59 | | Vice President of the Trust | | Since 1995 | | Vice President of EVM and BMR. Officer of 74 registered investment companies managed by EVM or BMR. | |
|
John R. Baur
2/10/70 | | Vice President of the Portfolio | | Since 2007 | | Vice President of EVM and BMR. Previously, attended business school at Johnson Graduate School of Business (2002-2005). Officer of 4 registered investment companies managed by EVM or BMR. | |
|
Michael A. Cirami
12/24/75 | | Vice President of the Portfolio | | Since 2007 | | Vice President of EVM and BMR. Previously, attended business school at the University of Rochester Simon School of Business (2001-2003). Officer of 4 registered investment companies managed by EVM or BMR. | |
|
Cynthia J. Clemson
3/2/63 | | Vice President of the Trust | | Since 2005 | | Vice President of EVM and BMR. Officer of 89 registered investment companies managed by EVM or BMR. | |
|
Charles B. Gaffney
12/4/72 | | Vice President of the Trust | | Since 2007 | | Vice President of EVM and BMR. Previously, Sector Portfolio Manager and Senior Equity Analyst of Brown Brothers Harriman (1997-2003). Officer of 29 registered investment companies managed by EVM or BMR. | |
|
Christine M. Johnston
11/9/72 | | Vice President | | Since 2007 | | Vice President of EVM and BMR. Officer of 34 registered investment companies managed by EVM or BMR. | |
|
Aamer Khan
6/7/60 | | Vice President of the Trust | | Since 2005 | | Vice President of EVM and BMR. Officer of 32 registered investment companies managed by EVM or BMR. | |
|
Thomas H. Luster
4/8/62 | | Vice President of the Trust | | Since 2006 | | Vice President of EVM and BMR. Officer of 48 registered investment companies managed by EVM or BMR. | |
|
Michael R. Mach
7/15/47 | | Vice President of the Trust | | Since 1999 | | Vice President of EVM and BMR. Officer of 54 registered investment companies managed by EVM or BMR. | |
|
Robert B. MacIntosh
1/22/57 | | Vice President of the Trust | | Since 1998 | | Vice President of EVM and BMR. Officer of 89 registered investment companies managed by EVM or BMR. | |
|
Duncan W. Richardson
10/26/57 | | Vice President of the Trust | | Since 2001 | | Executive Vice President and Chief Equity Investment Officer of EVC, EVM and BMR. Officer 80 registered investment companies managed by EVM or BMR. | |
|
29
Eaton Vance Emerging Markets Income Fund
MANAGEMENT AND ORGANIZATION CONT'D
Name and
Date of Birth | | Position(s)
with the
Trust and
the Portfolio | | Term of
Office and
Length of
Service | | Principal Occupation(s)
During Past Five Years | |
| Principal Officers who are not Trustees (continued) | |
|
Walter A. Row, III
7/20/57 | | Vice President of the Trust | | Since 2001 | | Director of Equity Research and a Vice President of EVM and BMR. Officer of 38 registered investment companies managed by EVM or BMR. | |
|
Judith A. Saryan
8/21/54 | | Vice President of the Trust | | Since 2003 | | Vice President of EVM and BMR. Officer of 53 registered investment companies managed by EVM or BMR. | |
|
Susan Schiff
3/13/61 | | Vice President | | Vice President of the Trust since 2002 and of the Portfolio since 2007 | | Vice President of EVM and BMR. Officer of 35 registered investment companies managed by EVM or BMR. | |
|
Thomas Seto
9/27/62 | | Vice President of the Trust | | Since 2007 | | Vice President and Director of Portfolio Management of Parametric. Officer of 30 registered investment companies managed by EVM or BMR. | |
|
David M. Stein
5/4/51 | | Vice President of the Trust | | Since 2007 | | Managing Director and Chief Investment Officer of Parametric. Officer of 30 registered investment companies managed by EVM or BMR. | |
|
Mark S. Venezia
5/23/49 | | Vice President of the Trust and President of the Portfolio | | Since 2007 | | Vice President of EVM and BMR. Officer of 35 registered investment companies managed by EVM or BMR. | |
|
Adam A. Weigold
3/22/75 | | Vice President of the Trust | | Since 2007 | | Vice President of EVM and BMR. Officer of 70 registered investment companies managed by EVM or BMR. | |
|
Barbara E. Campbell
6/19/57 | | Treasurer of the Trust | | Since 2005 | | Vice President of EVM and BMR. Officer of 176 registered investment companies managed by EVM or BMR. | |
|
Maureen A. Gemma
5/24/60 | | Secretary | | Since 2007 | | Vice President and Deputy Chief Legal Officer of EVM and BMR. Officer of 176 registered investment companies managed by EVM or BMR. | |
|
Dan A. Maalouly
3/35/62 | | Treasurer of the Portfolio | | Since 2007 | | Vice President of EVM and BMR. Previously, Senior Manager at Pricewaterhouse Coopers LLP (1997-2005). Officer of 76 registered investment companies managed by EVM or BMR. | |
|
Paul M. O'Neil
7/11/53 | | Chief Compliance Officer | | Chief Compliance Officer of the Trust since 2004 and of the Portfolio since 2007 | | Vice President of EVM and BMR. Officer of 178 registered investment companies managed by EVM or BMR. | |
|
(1) Includes both master and feeder funds in a master-feeder structure.
The SAI for the Fund includes additional information about the Trustees and officers of the Fund and the Portfolio and can be obtained without charge on Eaton Vance's website at eatonvance.com or by calling 1-800-225-6265.
30
This Page Intentionally Left Blank
This Page Intentionally Left Blank
Investment Adviser of Emerging Markets Income Portfolio
Boston Management and Research
The Eaton Vance Building
255 State Street
Boston, MA 02109
Investment Adviser and Administrator of Emerging Markets Income Fund
Eaton Vance Management
The Eaton Vance Building
255 State Street
Boston, MA 02109
Principal Underwriter
Eaton Vance Distributors, Inc.
The Eaton Vance Building
255 State Street
Boston, MA 02109
(617) 482-8260
Custodian
State Street Bank and Trust Company
200 Clarendon Street
Boston, MA 02116
Transfer Agent
PFPC Inc.
Attn: Eaton Vance Funds
P.O. Box 9653
Providence, RI 02940-9653
(800) 262-1122
Independent Registered Public Accounting Firm
Deloitte & Touche LLP
200 Berkeley Street
Boston, MA 02116-5022
Eaton Vance Emerging Markets Income Fund
The Eaton Vance Building
255 State Street
Boston, MA 02109
This report must be preceded or accompanied by a current prospectus. Before investing, investors should consider carefully the Fund's investment objective(s), risks, and charges and expenses. The Fund's current prospectus contains this and other information about the Fund and is available through your financial advisor. Please read the prospectus carefully before you invest or send money. For further information please call 1-800-225-6265.
3040-12/07 EMISRC

Annual Report October 31, 2007


EATON VANCE EQUITY
RESEARCH
FUND
IMPORTANT NOTICES REGARDING PRIVACY,
DELIVERY OF SHAREHOLDER DOCUMENTS,
PORTFOLIO HOLDINGS AND PROXY VOTING
Privacy. The Eaton Vance organization is committed to ensuring your financial privacy. Each of the financial institutions identified below has in effect the following policy ("Privacy Policy") with respect to nonpublic personal information about its customers:
• Only such information received from you, through application forms or otherwise, and information about your Eaton Vance fund transactions will be collected. This may include information such as name, address, social security number, tax status, account balances and transactions.
• None of such information about you (or former customers) will be disclosed to anyone, except as permitted by law (which includes disclosure to employees necessary to service your account). In the normal course of servicing a customer's account, Eaton Vance may share information with unaffiliated third parties that perform various required services such as transfer agents, custodians and broker/dealers.
• Policies and procedures (including physical, electronic and procedural safeguards) are in place that are designed to protect the confidentiality of such information.
• We reserve the right to change our Privacy Policy at any time upon proper notification to you. Customers may want to review our Policy periodically for changes by accessing the link on our homepage: www.eatonvance.com.
Our pledge of privacy applies to the following entities within the Eaton Vance organization: the Eaton Vance Family of Funds, Eaton Vance Management, Eaton Vance Investment Counsel, Boston Management and Research, and Eaton Vance Distributors, Inc.
In addition, our Privacy Policy only applies to those Eaton Vance customers who are individuals and who have a direct relationship with us. If a customer's account (i.e., fund shares) is held in the name of a third-party financial adviser/ broker-dealer, it is likely that only such adviser's privacy policies apply to the customer. This notice supersedes all previously issued privacy disclosures.
For more information about Eaton Vance's Privacy Policy, please call 1-800-262-1122.
Delivery of Shareholder Documents. The Securities and Exchange Commission (the "SEC") permits funds to deliver only one copy of shareholder documents, including prospectuses, proxy statements and shareholder reports, to fund investors with multiple accounts at the same residential or post office box address. This practice is often called "householding" and it helps eliminate duplicate mailings to shareholders.
Eaton Vance, or your financial adviser, may household the mailing of your documents indefinitely unless you instruct Eaton Vance, or your financial adviser, otherwise.
If you would prefer that your Eaton Vance documents not be householded, please contact Eaton Vance at 1-800-262-1122, or contact your financial adviser.
Your instructions that householding not apply to delivery of your Eaton Vance documents will be effective within 30 days of receipt by Eaton Vance or your financial adviser.
Portfolio Holdings. Each Eaton Vance Fund and its underlying Portfolio (if applicable) will file a schedule of its portfolio holdings on Form N-Q with the SEC for the first and third quarters of each fiscal year. The Form N-Q will be available on the Eaton Vance website www.eatonvance.com, by calling Eaton Vance at 1-800-262-1122 or in the EDGAR database on the SEC's website at www.sec.gov. Form N-Q may also be reviewed and copied at the SEC's public reference room in Washington, D.C. (call 1-800-732-0330 for information on the operation of the public reference room).
Proxy Voting. From time to time, funds are required to vote proxies related to the securities held by the funds. The Eaton Vance Funds or their underlying Portfolios (if applicable) vote proxies according to a set of policies and procedures approved by the Funds' and Portfolios' Boards. You may obtain a description of these policies and procedures and information on how the Funds or Portfolios voted proxies relating to Portfolio securities during the most recent 12 month period ended June 30, without charge, upon request, by calling 1-800-262-1122. This description is also available on the SEC's website at www.sec.gov.
Eaton Vance Equity Research Fund as of October 31, 2007
MANAGEMENT’S DISCUSSION OF FUND PERFORMANCE

Walter A. Row III, CFA
Investment Team Leader
The Fund
Performance for the Past Year
· During the year ended October 31, 2007, the Fund’s Class A shares had a total return of 20.12%. This return was the result of an increase in net asset value (NAV) per share to $15.44 on October 31, 2007, from $13.37 on October 31, 2006, and the reinvestment of $0.052 per share in dividend income and $0.481 in capital gains.(1)
· For comparison, the Fund’s benchmark, the Standard & Poor’s 500 Index (the “S&P 500 Index”) — a broad-based, unmanaged market index of common stocks commonly used as a measure of U.S. stock market performance — had a total return of 14.55% during the same period. The Fund’s peer group, the Lipper Large-Cap Core Funds Classification, had an average total return of 14.56% during the same period.(2)
Management Discussion
· During the year ended October 31, 2007, U.S. stock markets moved higher amid a significant increase in volatility. In the first half of the period, investors were somewhat cautious about the economy, inflation, interest rates, and corporate profits. However, markets both in the U.S. and abroad saw sharp declines from late February through mid-March 2007. Stocks recovered strongly through mid-July, only to decline again more dramatically in late July and August due to fallout from the subprime mortgage crisis. The Federal Reserve Board (the “Fed”) responded to the subprime situation by lowering the Fed Funds Rate — a key short-term interest rate benchmark — by 50 basis points (0.50%) to 4.50% by period’s end. This eased some concerns about the economy and helped move markets higher through early October, though another decline, caused in part by a spike in oil prices, occurred in the final weeks of the period.
· During the period, the Fund outperformed both the S&P 500 Index and the average return of its Lipper peer group, Large-Cap Core Funds Classification. While no one sector contributed on the positive side to relative returns, not a single sector detracted during the period. The Fund’s outperformance came from positive contributions in every major industry sector, benefiting from the broad range of sectors in which the Fund was invested, as well as stock selections, derived from significant analytical research, by the Fund’s management team.(2),(3)
· The top-performing sector during the period was financials, where Fund holdings in the commercial banking, capital markets, and insurance industries all outperformed similar holdings in the S&P 500 Index. Information technology was the second-strongest contributing sector, with software, communications equipment, computers, and semiconductor stocks leading that sector’s returns. Stocks in the metals and mining industry in the materials sector made a solid contribution, as did oil and gas stocks in the energy sector. In health care, Fund holdings in the biotechnology industry made the strongest contribution. Finally, holdings in the consumer staples, consumer discretionary and telecommunications services sectors all made positive contributions to the Fund’s performance during the period.(2),(3)
· On November 1, 2007, Charles Gaffney, Director of Equity Research at Eaton Vance, became the Investment Team Leader for the Fund.
(1) This return does not include the 5.75% maximum sales charge for Class A shares. If the sales charge was deducted, the return would be lower. Absent contractual and voluntary expense limitations by the adviser and the administrator, the return would be lower.
(2) It is not possible to invest directly in an Index or a Lipper Classification. The Index’s total return does not reflect commissions or expenses that would have been incurred if an investor individually purchased or sold the securities represented in the Index. The Lipper total return is the average total return, at net asset value, of the funds that are in the same Lipper Classification as the Fund.
(3) Sector weightings are subject to change due to active management.
The views expressed throughout this report are those of the investment team leader and are current only through the end of the period of the report as stated on the cover. These views are subject to change at any time based upon market or other conditions, and the investment adviser disclaims any responsibility to update such views. These views may not be relied on as investment advice and, because investment decisions for a fund are based on many factors, may not be relied on as an indication of trading intent on behalf of any Eaton Vance fund.
Past performance is no guarantee of future results. Returns are historical and are calculated by determining the percentage change in net asset value or offering price (as applicable) with all distributions reinvested. Investment return and principal value will fluctuate so that shares, when redeemed, may be worth more or less than their original cost. Performance is for the stated time period only; due to market volatility, the Fund’s current performance may be lower or higher than the quoted return. Fund performance during certain periods reflects the strong stock market performance and/or the strong performance of stocks held during those periods. This performance is not typical and may not be repeated. For performance as of the most recent month end, please refer to www.eatonvance.com.
Fund shares are not insured by the FDIC and are not deposits or other obligations of, or guaranteed by, any depository institution. Shares are subject to investment risks, including possible loss of principal invested.
1
Eaton Vance Equity Research Fund as of October 31, 2007
PORTFOLIO INFORMATION
Common Stock Investments by Sector(1)
By net assets
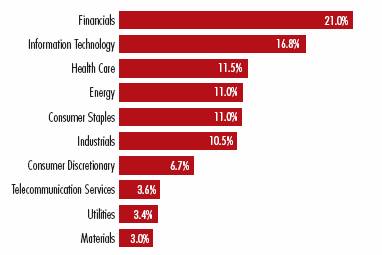
(1) As of 10/31/07. Fund information may not be representative of the Fund’s current or future investments and are subject to change due to active management.
Top Ten Equity Holdings(2)
By net assets
Exxon Mobil Corp. | | 2.8 | % |
General Electric Co. | | 2.6 | |
Microsoft Corp. | | 2.4 | |
Google, Inc., Class A | | 2.1 | |
AT&T, Inc. | | 1.9 | |
Schlumberger, Ltd. | | 1.7 | |
Cisco Systems, Inc. | | 1.6 | |
Apple, Inc. | | 1.6 | |
Johnson & Johnson | | 1.4 | |
PepsiCo., Inc. | | 1.4 | |
(2) Top Ten Equity Holdings represented 19.5% of Fund net assets as of 10/31/07. Holdings are subject to change due to active management.
2
Eaton Vance Equity Research Fund as of October 31, 2007
FUND PERFORMANCE
The line graph and table set forth below provide information about the Fund’s performance. The line graph compares the performance of Class A of the Fund with that of the S&P 500 Index, a broad-based, unmanaged market index of common stocks commonly used as a measure of U.S. stock market performance. Effective June 13, 2005, the Fund’s outstanding shares were classified as Class A shares. Prior to August 26, 2005, the Fund was not actively marketed and had few shareholders. From inception to the present, the Fund’s expenses were subsidized. Absent the subsidy, Fund performance would have been lower. The lines on the graph represent the total returns of a hypothetical investment of $10,000 in each of Class A and the S&P 500 Index. The table includes the total returns of Class A shares of the Fund at net asset value and maximum public offering price. The performance presented below does not reflect the deduction of taxes, if any, that a shareholder would pay on distributions or redemptions of Fund shares.
Performance(1)
| | Class A | |
Symbol | | EAERX | |
| | | |
Average Annual Total Returns (at net asset value) | | | |
One Year | | 20.12 | % |
Five Years | | 15.05 | |
Life of Fund† | | 9.18 | |
| | | |
SEC Average Annual Total Returns (including sales charge) | | | |
One Year | | 13.18 | % |
Five Years | | 13.70 | |
Life of Fund† | | 8.11 | |
†Inception Date — 11/01/01
(1) Average Annual Total Returns do not include the 5.75% maximum sales charge for Class A shares. If the sales charge was deducted, the returns would be lower. Absent contractual and voluntary expense limitations by the adviser and the administrator, the returns would be lower. SEC Average Annual Total Returns for Class A shares reflect the maximum 5.75% sales charge.
Total Annual Operating Expenses(2)
| | Class A | |
Gross Expense Ratio | | 4.99 | % |
Net Expense Ratio | | 1.40 | |
(2) Source: Prospectus dated 3/1/07. The net expense ratio reflects a contractual expense limitation that continues through February 28, 2008. Thereafter, the expense limitation may be changed or terminated at any time. Without this expense limitation, performance would have been lower.

** Source: Thomson Financial. Class A of the Fund commenced investment operations on 11/1/01.
It is not possible to invest directly in an Index. The Index’s total returns do not reflect commissions or expenses that would have been incurred if an investor individually purchased or sold the securities represented in the Index. Absent contractual and voluntary expense limitations by the adviser and the administrator, the returns would be lower.
Past performance is no guarantee of future results. Returns are historical and are calculated by determining the percentage change in net asset value or offering price (as applicable) with all distributions reinvested. Investment return and principal value will fluctuate so that shares, when redeemed, may be worth more or less than their original cost. Performance is for the stated time period only; due to market volatility, the Fund’s current performance may be lower or higher than the quoted return. Fund performance during certain periods reflects the strong stock market performance and/or the strong performance of stocks held during those periods. This performance is not typical and may not be repeated. For performance as of the most recent month end, please refer to www.eatonvance.com.
3
Eaton Vance Equity Research Fund as of October 31, 2007
FUND EXPENSES
Example: As a shareholder of the Fund, you incur two types of costs: (1) transaction costs, including sales charges (loads) on purchases and redemption fees (if applicable); and (2) ongoing costs, including management fees; distribution or service fees; and other Fund expenses. This Example is intended to help you understand your ongoing costs (in dollars) of investing in the Fund and to compare these costs with the ongoing costs of investing in other mutual funds. The Example is based on an investment of $1,000 invested at the beginning of the period and held for the entire period (May 1, 2007 – October 31, 2007).
Actual Expenses: The first section of the table below provides information about actual account values and actual expenses. You may use the information in this section, together with the amount you invested, to estimate the expenses that you paid over the period. Simply divide your account value by $1,000 (for example, an $8,600 account value divided by $1,000 = 8.6), then multiply the result by the number in the first section under the heading entitled "Expenses Paid During Period" to estimate the expenses you paid on your account during this period.
Hypothetical Example for Comparison Purposes: The second section of the table below provides information about hypothetical account values and hypothetical expenses based on the actual Fund expense ratio and an assumed rate of return of 5% per year (before expenses), which is not the actual return of the Fund. The hypothetical account values and expenses may not be used to estimate the actual ending account balance or expenses you paid for the period. You may use this information to compare the ongoing costs of investing in your Fund and other funds. To do so, compare this 5% hypothetical example with the 5% hypothetical examples that appear in the shareholder reports of the other funds.
Please note that the expenses shown in the table are meant to highlight your ongoing costs only and do not reflect any transactional costs, such as sales charges (loads) or redemption fees (if applicable). Therefore, the second section of the table is useful in comparing ongoing costs only, and will not help you determine the relative total costs of owning different funds. In addition, if these transactional costs were included, your costs would have been higher.
Eaton Vance Equity Research Fund
| | | Beginning Account Value
(5/1/07) | | Ending Account Value
(10/31/07) | | Expenses Paid During Period*
(5/1/07 – 10/31/07) | |
| Actual | |
| Class A | | $ | 1,000.00 | | | $ | 1,102.10 | | | $ | 6.62 | ** | |
| Hypothetical | |
| (5% return per year before expenses) | |
| Class A | | $ | 1,000.00 | | | $ | 1,018.90 | | | $ | 6.36 | ** | |
* Expenses are equal to the Fund's annualized expense ratio of 1.25% for Class A shares, multiplied by the average account value over the period, multiplied by 184/365 (to reflect the one-half year period). The Example assumes that the $1,000 was invested at the net asset value per share determined at the close of business on April 30, 2007.
** Absent contractual and voluntary expense limitations by the adviser and administrator, expenses would have been higher.
4
Eaton Vance Equity Research Fund as of October 31, 2007
PORTFOLIO OF INVESTMENTS
| Common Stocks — 98.5% | |
| Security | | Shares | | Value | |
| Aerospace & Defense — 3.7% | |
| Boeing Co. (The) | | | 364 | | | $ | 35,887 | | |
| General Dynamics Corp. | | | 761 | | | | 69,221 | | |
| Lockheed Martin Corp. | | | 411 | | | | 45,226 | | |
| United Technologies Corp. | | | 1,048 | | | | 80,266 | | |
| | | $ | 230,600 | | |
| Air Freight & Logistics — 0.7% | |
| FedEx Corp. | | | 430 | | | $ | 44,436 | | |
| | | $ | 44,436 | | |
| Auto Components — 0.7% | |
| Johnson Controls, Inc. | | | 1,014 | | | $ | 44,332 | | |
| | | $ | 44,332 | | |
| Beverages — 2.2% | |
| Coca-Cola Co. (The) | | | 873 | | | $ | 53,917 | | |
| PepsiCo, Inc. | | | 1,156 | | | | 85,220 | | |
| | | $ | 139,137 | | |
| Biotechnology — 2.7% | |
| Biogen Idec, Inc.(1) | | | 384 | | | $ | 28,585 | | |
| BioMarin Pharmaceutical, Inc.(1) | | | 1,404 | | | | 38,933 | | |
| Cephalon, Inc.(1) | | | 410 | | | | 30,233 | | |
| Gilead Sciences, Inc.(1) | | | 1,598 | | | | 73,812 | | |
| | | $ | 171,563 | | |
| Capital Markets — 5.4% | |
| Affiliated Managers Group, Inc.(1) | | | 284 | | | $ | 37,360 | | |
| Ameriprise Financial, Inc. | | | 265 | | | | 16,690 | | |
| Bank of New York Mellon Corp. (The) | | | 585 | | | | 28,577 | | |
| Credit Suisse Group, ADS | | | 358 | | | | 24,237 | | |
| Goldman Sachs Group, Inc. | | | 328 | | | | 81,318 | | |
| Invesco PLC, ADR | | | 1,032 | | | | 31,641 | | |
| Julius Baer Holding AG | | | 400 | | | | 34,721 | | |
| Merrill Lynch & Co., Inc. | | | 342 | | | | 22,579 | | |
| T. Rowe Price Group, Inc. | | | 605 | | | | 38,865 | | |
| UBS AG | | | 341 | | | | 18,308 | | |
| | | $ | 334,296 | | |
| Security | | Shares | | Value | |
| Chemicals — 1.1% | |
| E.I. Dupont de Nemours & Co. | | | 313 | | | $ | 15,497 | | |
| Ecolab, Inc. | | | 574 | | | | 27,076 | | |
| Monsanto Co. | | | 241 | | | | 23,529 | | |
| | | $ | 66,102 | | |
| Commercial Banks — 5.7% | |
| Anglo Irish Bank Corp., PLC | | | 20 | | | $ | 337 | | |
| Bank of Cyprus Ltd. | | | 880 | | | | 17,157 | | |
| BNP Paribas SA | | | 120 | | | | 13,283 | | |
| Canadian Imperial Bank of Commerce | | | 175 | | | | 18,886 | | |
| HDFC Bank Ltd., ADR | | | 110 | | | | 15,290 | | |
| HSBC Holdings, PLC, ADR | | | 160 | | | | 15,923 | | |
| Intesa Sanpaolo SPA | | | 3,300 | | | | 26,147 | | |
| National Bank of Greece SA, ADR | | | 5,333 | | | | 74,715 | | |
| PNC Financial Services Group, Inc. | | | 425 | | | | 30,668 | | |
| Royal Bank of Canada | | | 704 | | | | 41,649 | | |
| Standard Chartered, PLC | | | 2,145 | | | | 83,350 | | |
| Wells Fargo & Co. | | | 576 | | | | 19,590 | | |
| | | $ | 356,995 | | |
| Commercial Services & Supplies — 0.3% | |
| Manpower, Inc. | | | 270 | | | $ | 20,180 | | |
| | | $ | 20,180 | | |
| Communications Equipment — 3.4% | |
| Cisco Systems, Inc.(1) | | | 3,105 | | | $ | 102,651 | | |
| Corning, Inc. | | | 1,172 | | | | 28,444 | | |
| QUALCOMM, Inc. | | | 937 | | | | 40,038 | | |
| Research In Motion Ltd.(1) | | | 328 | | | | 40,839 | | |
| | | $ | 211,972 | | |
| Computer Peripherals — 4.6% | |
| Apple, Inc.(1) | | | 522 | | | $ | 99,154 | | |
| EMC Corp.(1) | | | 1,955 | | | | 49,637 | | |
| Hewlett-Packard Co. | | | 1,204 | | | | 62,223 | | |
| International Business Machines Corp. | | | 629 | | | | 73,040 | | |
| | | $ | 284,054 | | |
| Consumer Finance — 0.3% | |
| American Express Co. | | | 322 | | | $ | 19,626 | | |
| | | $ | 19,626 | | |
See notes to financial statements
5
Eaton Vance Equity Research Fund as of October 31, 2007
PORTFOLIO OF INVESTMENTS CONT'D
| Security | | Shares | | Value | |
| Diversified Telecommunications Services — 3.1% | |
| AT&T, Inc. | | | 2,855 | | | $ | 119,310 | | |
| Verizon Communications, Inc. | | | 1,591 | | | | 73,297 | | |
| | | $ | 192,607 | | |
| Electric Utilities — 1.3% | |
| E.ON AG | | | 263 | | | $ | 51,353 | | |
| Edison International | | | 542 | | | | 31,485 | | |
| | | $ | 82,838 | | |
| Electrical Equipment — 1.1% | |
| Emerson Electric Co. | | | 1,281 | | | $ | 66,958 | | |
| | | $ | 66,958 | | |
| Electronics-Semiconductors — 1.8% | |
| Intel Corp. | | | 1,502 | | | $ | 40,404 | | |
| KLA-Tencor Corp. | | | 185 | | | | 9,740 | | |
| Maxim Integrated Products, Inc. | | | 488 | | | | 13,225 | | |
| NVIDIA Corp.(1) | | | 518 | | | | 18,327 | | |
| Texas Instruments, Inc. | | | 852 | | | | 27,775 | | |
| | | $ | 109,471 | | |
| Energy Equipment & Services — 3.3% | |
| Diamond Offshore Drilling, Inc. | | | 400 | | | $ | 45,292 | | |
| Schlumberger, Ltd. | | | 1,074 | | | | 103,716 | | |
| Transocean, Inc.(1) | | | 499 | | | | 59,566 | | |
| | | $ | 208,574 | | |
| Financial Services-Diversified — 2.4% | |
| Bank of America Corp. | | | 1,100 | | | $ | 53,108 | | |
| Citigroup, Inc. | | | 1,265 | | | | 53,004 | | |
| ING Groep NV, ADR | | | 357 | | | | 16,061 | | |
| JP Morgan Chase & Co. | | | 618 | | | | 29,046 | | |
| | | $ | 151,219 | | |
| Food Products — 1.1% | |
| Nestle SA, ADR | | | 578 | | | $ | 65,979 | | |
| | | $ | 65,979 | | |
| Health Care Equipment & Supplies — 1.6% | |
| Baxter International, Inc. | | | 363 | | | $ | 21,784 | | |
| Hospira, Inc.(1) | | | 455 | | | | 18,805 | | |
| Medtronic, Inc. | | | 688 | | | | 32,639 | | |
| Zimmer Holdings, Inc.(1) | | | 339 | | | | 23,557 | | |
| | | $ | 96,785 | | |
| Security | | Shares | | Value | |
| Health Care Services — 0.9% | |
| Aetna, Inc. | | | 450 | | | $ | 25,277 | | |
| UnitedHealth Group, Inc. | | | 574 | | | | 28,212 | | |
| | | $ | 53,489 | | |
| Hotels, Restaurants & Leisure — 1.8% | |
| International Game Technology | | | 423 | | | $ | 18,447 | | |
| Marriott International, Inc., Class A | | | 400 | | | | 16,444 | | |
| McDonald's Corp. | | | 750 | | | | 44,775 | | |
| Yum! Brands, Inc. | | | 875 | | | | 35,236 | | |
| | | $ | 114,902 | | |
| Household Products — 2.1% | |
| Colgate-Palmolive Co. | | | 543 | | | $ | 41,415 | | |
| Energizer Holdings, Inc.(1) | | | 171 | | | | 17,835 | | |
| Procter & Gamble Co. | | | 1,077 | | | | 74,873 | | |
| | | $ | 134,123 | | |
Independent Power Producers &
Energy Traders — 0.8% | |
| Mirant Corp.(1) | | | 536 | | | $ | 22,705 | | |
| NRG Energy, Inc.(1) | | | 640 | | | | 29,222 | | |
| | | $ | 51,927 | | |
| Industrial Conglomerates — 2.6% | |
| General Electric Co. | | | 3,913 | | | $ | 161,059 | | |
| | | $ | 161,059 | | |
| Information Technology Services — 1.4% | |
| Accenture Ltd., Class A | | | 448 | | | $ | 17,494 | | |
| MasterCard, Inc., Class A | | | 275 | | | | 52,126 | | |
| Paychex, Inc. | | | 415 | | | | 17,339 | | |
| | | $ | 86,959 | | |
| Insurance — 4.4% | |
| ACE Ltd. | | | 241 | | | $ | 14,607 | | |
| AFLAC, Inc. | | | 380 | | | | 23,856 | | |
| Allianz SE, ADR | | | 683 | | | | 15,436 | | |
| American International Group, Inc. | | | 753 | | | | 47,529 | | |
| Assurant, Inc. | | | 273 | | | | 15,954 | | |
| AXA, ADR | | | 395 | | | | 17,668 | | |
| Chubb Corp. | | | 382 | | | | 20,380 | | |
| Hartford Financial Services Group, Inc. (The) | | | 223 | | | | 21,638 | | |
See notes to financial statements
6
Eaton Vance Equity Research Fund as of October 31, 2007
PORTFOLIO OF INVESTMENTS CONT'D
| Security | | Shares | | Value | |
| Insurance (continued) | |
| Lincoln National Corp. | | | 320 | | | $ | 19,958 | | |
| MBIA, Inc. | | | 251 | | | | 10,803 | | |
| Prudential Financial, Inc. | | | 253 | | | | 24,470 | | |
| St. Paul Travelers Companies, Inc. (The) | | | 516 | | | | 26,940 | | |
| Zurich Financial Services | | | 55 | | | | 16,597 | | |
| | | $ | 275,836 | | |
| Internet Software & Services — 2.7% | |
| Akamai Technologies, Inc.(1) | | | 335 | | | $ | 13,129 | | |
| eBay, Inc.(1) | | | 675 | | | | 24,368 | | |
| Google, Inc., Class A(1) | | | 183 | | | | 129,381 | | |
| | | $ | 166,878 | | |
| Life Sciences Tools & Services — 0.6% | |
| Thermo Fisher Scientific, Inc.(1) | | | 614 | | | $ | 36,109 | | |
| | | $ | 36,109 | | |
| Machinery — 2.1% | |
| Danaher Corp. | | | 680 | | | $ | 58,256 | | |
| Deere & Co. | | | 135 | | | | 20,912 | | |
| Eaton Corp. | | | 270 | | | | 24,997 | | |
| Illinois Tool Works, Inc. | | | 485 | | | | 27,771 | | |
| | | $ | 131,936 | | |
| Media — 1.9% | |
| Comcast Corp., Class A(1) | | | 1,423 | | | $ | 29,954 | | |
| McGraw-Hill Companies, Inc. (The) | | | 378 | | | | 18,915 | | |
| Omnicom Group, Inc. | | | 274 | | | | 13,969 | | |
| Time Warner, Inc. | | | 774 | | | | 14,133 | | |
| Walt Disney Co. (The) | | | 1,181 | | | | 40,898 | | |
| | | $ | 117,869 | | |
| Metals & Mining — 1.7% | |
| Companhia Vale do Rio Doce, ADR | | | 1,102 | | | $ | 41,523 | | |
| Goldcorp, Inc. | | | 1,354 | | | | 47,566 | | |
| Teck Cominco Ltd., Class B | | | 392 | | | | 19,526 | | |
| | | $ | 108,615 | | |
| Oil & Gas — 7.7% | |
| Anadarko Petroleum Corp. | | | 1,320 | | | $ | 77,906 | | |
| ConocoPhillips | | | 855 | | | | 72,641 | | |
| Security | | Shares | | Value | |
| Oil & Gas (continued) | |
| Exxon Mobil Corp. | | | 1,917 | | | $ | 176,345 | | |
| Hess Corp. | | | 885 | | | | 63,375 | | |
| Occidental Petroleum Corp. | | | 805 | | | | 55,585 | | |
| Williams Cos., Inc. (The) | | | 1,035 | | | | 37,767 | | |
| | | $ | 483,619 | | |
| Paper & Forest Products — 0.2% | |
| AbitibiBowater, Inc. | | | 0 | (3) | | $ | 7 | | |
| Weyerhaeuser Co. | | | 165 | | | | 12,525 | | |
| | | $ | 12,532 | | |
| Pharmaceuticals — 5.7% | |
| Abbott Laboratories | | | 913 | | | $ | 49,868 | | |
| Allergan, Inc. | | | 404 | | | | 27,302 | | |
| Ipsen | | | 400 | | | | 22,792 | | |
| Johnson & Johnson | | | 1,346 | | | | 87,719 | | |
| Novartis AG, ADS | | | 814 | | | | 43,280 | | |
| Novo Nordisk A/S, ADS | | | 192 | | | | 23,941 | | |
| Roche Holdings Ltd., ADR | | | 391 | | | | 33,098 | | |
| Shire PLC, ADS | | | 512 | | | | 38,477 | | |
| Wyeth | | | 655 | | | | 31,853 | | |
| | | $ | 358,330 | | |
| Real Estate Investment Trusts (REITs) — 1.2% | |
| AvalonBay Communities, Inc. | | | 206 | | | $ | 25,266 | | |
| Simon Property Group, Inc. | | | 230 | | | | 23,945 | | |
| Vornado Realty Trust | | | 225 | | | | 25,137 | | |
| | | $ | 74,348 | | |
| Retail-Food & Drug — 1.0% | |
| CVS Caremark Corp. | | | 1,450 | | | $ | 60,567 | | |
| | | $ | 60,567 | | |
| Retail-Food & Staples — 2.8% | |
| Kroger Co. | | | 1,360 | | | $ | 39,970 | | |
| Safeway, Inc. | | | 1,661 | | | | 56,474 | | |
| Sysco Corp. | | | 1,087 | | | | 37,273 | | |
| Wal-Mart Stores, Inc. | | | 890 | | | | 40,237 | | |
| | | $ | 173,954 | | |
See notes to financial statements
7
Eaton Vance Equity Research Fund as of October 31, 2007
PORTFOLIO OF INVESTMENTS CONT'D
| Security | | Shares | | Value | |
| Retail-Multiline — 1.3% | |
| J.C. Penney Co., Inc. | | | 401 | | | $ | 22,552 | | |
| Macy's, Inc. | | | 539 | | | | 17,264 | | |
| Target Corp. | | | 658 | | | | 40,375 | | |
| | | $ | 80,191 | | |
| Retail-Specialty — 1.0% | |
| Best Buy Co., Inc. | | | 491 | | | $ | 23,823 | | |
| Staples, Inc. | | | 1,633 | | | | 38,114 | | |
| | | $ | 61,937 | | |
| Software — 3.8% | |
| Microsoft Corp. | | | 4,098 | | | $ | 150,847 | | |
| Oracle Corp.(1) | | | 2,516 | | | | 55,780 | | |
| VMware, Inc., Class A(1) | | | 237 | | | | 29,585 | | |
| | | $ | 236,212 | | |
| Thrifts & Mortgage Finance — 0.7% | |
| Fannie Mae | | | 500 | | | $ | 28,520 | | |
| Freddie Mac | | | 325 | | | | 16,975 | | |
| | | $ | 45,495 | | |
| Tobacco — 1.8% | |
| Altria Group, Inc. | | | 1,061 | | | $ | 77,379 | | |
| Carolina Group | | | 418 | | | | 35,856 | | |
| | | $ | 113,235 | | |
| Utilities-Multi-Utilities — 1.3% | |
| CMS Energy Corp. | | | 1,266 | | | $ | 21,484 | | |
| Dominion Resources, Inc. | | | 251 | | | | 22,999 | | |
| Public Service Enterprise Group, Inc. | | | 353 | | | | 33,747 | | |
| | | $ | 78,230 | | |
| Wireless Telecommunication Services — 0.5% | |
| Rogers Communications, Inc., Class B | | | 640 | | | $ | 32,614 | | |
| | | $ | 32,614 | | |
Total Common Stocks
(identified cost $5,058,434) | | | | | | $ | 6,148,690 | | |
| Short-Term Investments — 0.9% | |
| Description | | Interest
(000's omitted) | | Value | |
Investment in Cash Management
Portfolio, 4.83%(2) | | | 55 | | | $ | 54,811 | | |
Total Short-Term Investments
(identified cost $54,811) | | | | $ | 54,811 | | |
Total Investments — 99.4%
(identified cost $5,113,245) | | | | $ | 6,203,501 | | |
| Other Assets, Less Liabilities — 0.6% | | | | $ | 37,871 | | |
| Net Assets — 100.0% | | | | $ | 6,241,372 | | |
ADR - American Depository Receipt
ADS - American Depository Share
(1) Non-income producing security.
(2) Affiliated investment company available to Eaton Vance portfolios and funds which invests in high quality, U.S. dollar denominated money market instruments. The rate shown is the annualized seven-day yield as of October 31, 2007.
(3) Represents fractional shares.
See notes to financial statements
8
Eaton Vance Equity Research Fund as of October 31, 2007
FINANCIAL STATEMENTS
Statement of Assets and Liabilities
As of October 31, 2007
| Assets | |
| Unaffiliated investments, at value (identified cost, $5,058,434) | | $ | 6,148,690 | | |
| Affiliated investment, at value (identified cost, $54,811) | | | 54,811 | | |
| Receivable for investments sold | | | 56,508 | | |
| Receivable for Fund shares sold | | | 2,880 | | |
| Receivable from the investment adviser | | | 60,759 | | |
| Dividends receivable | | | 6,058 | | |
| Interest receivable from affiliated investment | | | 197 | | |
| Tax reclaims receivable | | | 112 | | |
| Total assets | | $ | 6,330,015 | | |
| Liabilities | |
| Payable for investments purchased | | $ | 22,958 | | |
| Payable for Fund shares redeemed | | | 14,337 | | |
| Payable to affiliate for distribution and service fees | | | 1,368 | | |
| Accrued expenses | | | 49,980 | | |
| Total liabilities | | $ | 88,643 | | |
| Net Assets | | $ | 6,241,372 | | |
| Sources of Net Assets | |
| Paid-in capital | | $ | 4,971,493 | | |
Accumulated undistributed net realized gain (computed on the basis
of identified cost) | | | 161,326 | | |
| Accumulated undistributed net investment income | | | 18,292 | | |
| Net unrealized appreciation (computed on the basis of identified cost) | | | 1,090,261 | | |
| Total | | $ | 6,241,372 | | |
| Class A Shares | |
| Net Assets | | $ | 6,241,372 | | |
| Shares Outstanding | | | 404,165 | | |
Net Asset Value and Redemption Price Per Share
(net assets ÷ shares of beneficial interest outstanding) | | $ | 15.44 | | |
Maximum Offering Price Price Per Share
(100 ÷ 94.25 of $15.44) | | $ | 16.38 | | |
| On sales of $50,000 or more, the offering price of Class A shares is reduced. | |
Statement of Operations
For the Year Ended
October 31, 2007
| Investment Income | |
| Dividends (net of foreign taxes, $1,153) | | $ | 73,564 | | |
| Interest | | | 242 | | |
| Interest income allocated from affiliated investment | | | 6,843 | | |
| Expenses allocated from affliated investment | | | (641 | ) | |
| Total investment income | | $ | 80,008 | | |
| Expenses | |
| Investment adviser fee | | $ | 29,738 | | |
| Administration fee | | | 7,010 | | |
| Distribution and service fees | |
| Class A | | | 11,684 | | |
| Custodian fee | | | 32,586 | | |
| Legal and accounting services | | | 32,366 | | |
| Registration fees | | | 26,567 | | |
| Printing and postage | | | 7,404 | | |
| Transfer and dividend disbursing agent fees | | | 2,800 | | |
| Miscellaneous | | | 5,394 | | |
| Total expenses | | $ | 155,549 | | |
Deduct —
Waiver and reimbursement of expenses by the investment adviser
and/or the administrator | | $ | 97,507 | | |
| Total expense reductions | | $ | 97,507 | | |
| Net expenses | | $ | 58,042 | | |
| Net investment income | | $ | 21,966 | | |
| Realized and Unrealized Gain (Loss) | |
Net realized gain (loss) —
Investment transactions (identified cost basis) | | $ | 168,102 | | |
| Foreign currency transactions | | | 108 | | |
| Net realized gain | | $ | 168,210 | | |
Change in unrealized appreciation (depreciation) —
Investments (identified cost basis) | | $ | 703,498 | | |
| Foreign currency | | | 56 | | |
| Net change in unrealized appreciation (depreciation) | | $ | 703,554 | | |
| Net realized and unrealized gain | | $ | 871,764 | | |
| Net increase in net assets from operations | | $ | 893,730 | | |
See notes to financial statements
9
Eaton Vance Equity Research Fund as of October 31, 2007
FINANCIAL STATEMENTS CONT'D
Statements of Changes in Net Assets
Increase (Decrease)
in Net Assets | | Year Ended
October 31, 2007 | | Year Ended
October 31, 2006 | |
From operations —
Net investment income | | $ | 21,966 | | | $ | 11,781 | | |
Net realized gain on investment and
foreign currency transactions | | | 168,210 | | | | 133,069 | | |
Net change in unrealized appreciation
(depreciation) from investments and
foreign currency | | | 703,554 | | | | 183,634 | | |
| Net increase in net assets from operations | | $ | 893,730 | | | $ | 328,484 | | |
Distributions to shareholders —
From net investment income | | $ | (13,971 | ) | | $ | (3,119 | ) | |
| From net realized gains | | | (129,316 | ) | | | (88,696 | ) | |
| Total distributions to shareholders | | $ | (143,287 | ) | | $ | (91,815 | ) | |
Transactions in shares of beneficial interest —
Proceeds from sale of shares | | $ | 3,016,739 | | | $ | 1,159,759 | | |
Net asset value of shares issued to
shareholders in payment of
distributions declared | | | 139,304 | | | | 91,642 | | |
| Cost of shares redeemed | | | (740,499 | ) | | | (143,030 | ) | |
Net increase in net assets from
Fund share transactions | | $ | 2,415,544 | | | $ | 1,108,371 | | |
| Net increase in net assets | | $ | 3,165,987 | | | $ | 1,345,040 | | |
| Net Assets | |
| At beginning of year | | $ | 3,075,385 | | | $ | 1,730,345 | | |
| At end of year | | $ | 6,241,372 | | | $ | 3,075,385 | | |
Accumulated undistributed
net investment income
included in net assets | |
| At end of year | | $ | 18,292 | | | $ | 10,404 | | |
See notes to financial statements
10
Eaton Vance Equity Research Fund as of October 31, 2007
FINANCIAL STATEMENTS CONT'D
Financial Highlights
| | | Class A | |
| | | Year Ended October 31, | |
| | | 2007(1) | | 2006(1) | | 2005(1) | | 2004(1) | | 2003(1) | |
| Net asset value — Beginning of year | | $ | 13.370 | | | $ | 12.150 | | | $ | 10.810 | | | $ | 9.860 | | | $ | 8.400 | | |
| Income (loss) from operations | |
| Net investment income | | $ | 0.066 | | | $ | 0.064 | | | $ | 0.041 | | | $ | 0.007 | | | $ | 0.007 | | |
| Net realized and unrealized gain | | | 2.537 | | | | 1.771 | | | | 1.334 | | | | 0.952 | | | | 1.453 | | |
| Total income from operations | | $ | 2.603 | | | $ | 1.835 | | | $ | 1.375 | | | $ | 0.959 | | | $ | 1.460 | | |
| Less distributions | |
| From net investment income | | $ | (0.052 | ) | | $ | (0.021 | ) | | $ | (0.035 | ) | | $ | (0.009 | ) | | $ | — | | |
| From net realized gain | | | (0.481 | ) | | | (0.594 | ) | | | — | | | | — | | | | — | | |
| Total distributions | | $ | (0.533 | ) | | $ | (0.615 | ) | | $ | (0.035 | ) | | $ | (0.009 | ) | | $ | — | | |
| Net asset value — End of year | | $ | 15.440 | | | $ | 13.370 | | | $ | 12.150 | | | $ | 10.810 | | | $ | 9.860 | | |
| Total Return(2) | | | 20.12 | % | | | 15.59 | % | | | 12.74 | % | | | 9.73 | % | | | 17.38 | % | |
| Ratios/Supplemental Data | |
| Net assets, end of year (000's omitted) | | $ | 6,241 | | | $ | 3,075 | | | $ | 1,730 | | | $ | 1,296 | | | $ | 949 | | |
| Ratios (As a percentage of average daily net assets): | |
| Expenses before custodian fee reduction(3) | | | 1.25 | % | | | 1.25 | % | | | 1.25 | % | | | 1.40 | % | | | 1.40 | % | |
| Expenses after custodian fee reduction(3) | | | 1.25 | % | | | 1.25 | % | | | 1.25 | % | | | 1.40 | % | | | 1.40 | % | |
| Net investment income | | | 0.47 | % | | | 0.51 | % | | | 0.35 | % | | | 0.07 | % | | | 0.08 | % | |
| Portfolio Turnover | | | 63 | % | | | 74 | % | | | 93 | % | | | 70 | % | | | 64 | % | |
(1) Net investment income per share was computed using average shares outstanding.
(2) Returns are historical and are calculated by determining the percentage change in net asset value with all distributions reinvested.
(3) The adviser waived its advisory fee, the administrator waived its administration fee and the adviser subsidized certain operating expenses (equal to 2.10%, 3.74%, 5.70%, 4.27% and 5.27% of average daily net assets for the years ended October 31, 2007, 2006, 2005, 2004 and 2003, respectively). Absent the waivers and allocation, total return would be lower.
See notes to financial statements
11
Eaton Vance Equity Research Fund as of October 31, 2007
NOTES TO FINANCIAL STATEMENTS
1 Significant Accounting Policies
Eaton Vance Equity Research Fund (the Fund) is a diversified series of Eaton Vance Mutual Funds Trust (the Trust). The Trust is a Massachusetts business trust registered under the Investment Company Act of 1940, as amended (the 1940 Act), as an open-end management investment company. The Fund's investment objective is to achieve long-term capital appreciation by investing in a diversified portfolio of equity securities. The Fund offers Class A shares, which are generally sold subject to a sales charge imposed at time of purchase.
The following is a summary of significant accounting policies of the Fund. The policies are in conformity with accounting principles generally accepted in the United States of America.
A Investment Valuation — Securities listed on a U.S. securities exchange generally are valued at the last sale price on the day of valuation or, if no sales took place on such date, at the mean between the closing bid and asked prices therefore on the exchange where such securities are principally traded. Equity securities listed on the NASDAQ Global or Global Select Market generally are valued at the official NASDAQ closing price. Unlisted or listed securities for which closing sales prices or closing quotations are not available are valued at the mean between the latest available bid and asked prices or, in the case of preferred equity securities that are not listed or traded in the over-the-counter market, by an independent pricing service. Exchange-traded options are valued at the last sale price for the day of valuation as quoted on the principal exchange or board of trade on which the options are traded or, in the absence of sales on such date, at the mean between the latest bid and asked prices therefore. Financial futures contracts listed on commodity exchanges are valued at closing settlement prices. Short-term debt securities with a remaining maturity of 60 days or less are valued at amortized cost, which approximates market value. If short-term debt securities are acquired with a remaining maturity of more than 60 days, they will be valued by a pricing service. Other fixed income and debt securities, including listed securities and securities for which price quotations are available, will normally be valued on the basis of valuations furnished by a pricing service. Foreign securities and currencies are valued in U.S. dollars, based on foreign currency exchange rate quotations supplied by an independent quotation service. The daily valuation of exchange-traded fore ign securities generally is determined as of the close of trading on the principal exchange on which such securities trade. Events occurring after the close of trading on foreign exchanges may result in adjustments to the valuation of foreign securities to more accurately reflect their fair value as of the close of regular trading on the New York Stock Exchange. When valuing foreign equity securities that meet certain criteria, the Trustees have approved the use of a fair value service that values such securities to reflect market trading that occurs after the close of the applicable foreign markets of comparable securities or other instruments that have a strong correlation to the fair-valued securities. Investments for which valuations or market quotations are not ready available are valued at fair value using methods determined in good faith by or at the direction of the Trustees of the Fund considering relevant factors, data and info rmation including the market value of freely tradable securities of the same class in the principal market on which such securities are normally traded.
The Fund may invest in Cash Management Portfolio (Cash Management), an affiliated investment company managed by Boston Management and Research (BMR), a subsidiary of Eaton Vance Management (EVM). Cash Management values its investment securities utilizing the amortized cost valuation technique permitted by Rule 2a-7 of the 1940 Act. This technique involves initially valuing a portfolio security at its cost and thereafter assuming a constant amortization to maturity of any discount or premium.
B Investment Transactions and Other — Investment transactions for financial statement purposes are accounted for on a trade date basis. Realized gains and losses on investments sold are determined on the basis of identified cost. Dividends to shareholders are recorded on the ex-dividend date.
C Income — Dividend income is recorded on the ex-dividend date for dividends received in cash and/or securities. However, if the ex-dividend date has passed, certain dividends from foreign securities are recorded as the Fund is informed of the ex-dividend date. Withholding taxes on foreign dividends and capital gains have been provided for in accordance with the Fund's understanding of the applicable countries' tax rules and rates. Interest income is recorded on the basis of interest accrued, adjusted for amortization of premium or accretion of discount.
D Federal Taxes — The Fund's policy is to comply with the provisions of the Internal Revenue Code
12
Eaton Vance Equity Research Fund as of October 31, 2007
NOTES TO FINANCIAL STATEMENTS CONT'D
applicable to regulated investment companies and to distribute to shareholders each year substantially all of its net investment income, and all or substantially all of its net realized capital gains. Accordingly, no provision for federal income or excise tax is necessary.
E Expenses — The majority of expenses of the Trust are directly identifiable to an individual fund. Expenses which are not readily identifiable to a specific fund are allocated taking into consideration, among other things, the nature and type of expense and the relative size of the funds.
F Expense Reduction — State Street Bank and Trust Company (SSBT) serves as custodian of the Fund. Pursuant to the custodian agreement, SSBT receives a fee reduced by credits, which are determined based on the average daily cash balance the Fund maintains with SSBT. All credit balances, if any, used to reduce the Fund's custodian fees are reported as a reduction of expenses in the Statement of Operations.
G Foreign Currency Translation — Investment valuations, other assets, and liabilities initially expressed in foreign currencies are translated each business day into U.S. dollars based upon current exchange rates. Purchases and sales of foreign investment securities and income and expenses are translated into U.S. dollars based upon currency exchange rates in effect on the respective dates of such transactions. Recognized gains or losses on investment transactions attributable to changes in foreign currency exchange rates are recorded for financial statement purposes as net realized gains and losses on investments. That portion of unrealized gains and losses on investments that results from fluctuations in foreign currency exchange rates is not separately disclosed.
H Use of Estimates — The preparation of the financial statements in conformity with accounting principles generally accepted in the United States of America requires management to make estimates and assumptions that affect the reported amounts of assets and liabilities at the date of the financial statements and the reported amounts of income and expense during the reporting period. Actual results could differ from those estimates.
I Indemnifications — Under the Trust's organizational documents, its officers and Trustees may be indemnified against certain liabilities and expenses arising out of the performance of their duties to the Fund, and shareholders are indemnified against personal liability for obligations of the Trust. Additionally, in the normal course of business, the Fund enters into agreements with service providers that may contain indemnification clauses. The Fund's maximum exposure under these arrangements is unknown as this would involve future claims that may be made against the Fund that have not yet occurred.
2 Distributions to Shareholders
It is the present policy of the Fund to make at least one distribution annually (normally in December) of all or substantially all of its net investment income and at least one distribution annually of all or substantially all of its net realized capital gains (reduced by available capital loss carryforwards from prior years, if any). Shareholders may reinvest distributions in shares at the net asset value as of the ex-dividend date or, at the election of the shareholder, receive distributions in cash. The Fund distinguishes between distributions on a tax basis and a financial reporting basis. Accounting principles generally accepted in the United States of America require that only distributions in excess of tax basis earnings and profits be reported in the financial statements as a return of capital. Permanent differences between book and tax accounting relating to distributions are reclassified to paid-in capital.
The tax character of distributions declared for the years ended October 31, 2007 and October 31, 2006 was as follows:
| | | Year Ended October 31, | |
| | | 2007 | | 2006 | |
| Distributions declared from: | |
| Ordinary income | | $ | 28,265 | | | $ | 8,864 | | |
| Long-term capital gains | | $ | 115,022 | | | $ | 82,951 | | |
During the year ended October 31, 2007, accumulated undistributed net investment income was decreased by $107 and accumulated undistributed net realized gain was increased by $107, primarily due to differences between book and tax accounting for foreign currency gains and investments in real estate investment trusts. These changes had no effect on the net assets or net asset value per share of the Fund.
As of October 31, 2007, the components of distributable earnings (accumulated losses) and unrealized appreciation (depreciation) on a tax basis were as follows:
| Undistributed ordinary income | | $ | 60,663 | | |
| Undistributed long-term capital gains | | $ | 126,589 | | |
| Unrealized appreciation | | $ | 1,082,627 | | |
13
Eaton Vance Equity Research Fund as of October 31, 2007
NOTES TO FINANCIAL STATEMENTS CONT'D
The differences between components of distributable earnings (accumulated losses) on a tax basis and the amounts reflected in the Statement of Assets and Liabilities are primarily due to wash sales. In addition, distributions from short-term capital gains are considered to be ordinary income for tax purposes.
3 Investment Adviser Fee and Other Transactions with Affiliates
The investment adviser fee is earned by EVM as compensation for management and investment advisory services rendered to the Fund. Pursuant to the advisory agreement, EVM receives a monthly advisory fee at the annual rate of 0.65% of the average daily net assets of the Fund up to $500 million and at reduced rates as daily net assets exceed that level. The portion of the advisory fee payable by Cash Management on the Fund's investment of cash therein is credited against the Fund's advisory fee. For the year ended October 31, 2007, the Fund's advisory fee totaled $30,358 of which $620 was allocated from Cash Management and $29,738 (all of which was waived) was paid or accrued directly by the Fund. An administrative fee is earned by EVM as compensation for administering certain business affairs of the Fund. The fee is equal to 0.15% per annum of the average daily net assets of the Fund. For the year ended October 31, 2007, the fee a mounted to $7,010, all of which was waived. EVM has contractually agreed to limit net annual Fund operating expenses to 1.40% for Class A. The expense limitation will continue through February 28, 2008. Thereafter, the expense limitation may be changed or terminated at any time. For the year ended October 31, 2007, EVM has voluntarily agreed to further limit net annual Fund operating expenses to 1.25% for Class A. This voluntary expense reduction could be terminated at any time. Pursuant to these expense reductions, EVM was allocated $60,759 of the Fund's operating expenses. EVM serves as the sub-transfer agent of the Fund and receives from the transfer agent an aggregate fee based on the actual expenses incurred by EVM in the performance of these services. For the year ended October 31, 2007, EVM earned $181 in sub-transfer agent fees. The Fund was informed that Eaton Vance Distributors, Inc. (EVD), a subsidiary of EVM and the Fund's principal underwriter, received $7,092 as its portion of sales charges on sales of Class A shares for the year ended October 31, 2007. EVD also received distribution and service fees from Class A shares (see Note 4).
Except for Trustees of the Fund and the Portfolio who are not members of EVM's organization, officers and Trustees receive remuneration for their services to the Fund out of the investment adviser fee. Trustees of the Fund who are not affiliated with the investment adviser may elect to defer receipt of all or a percentage of their annual fees in accordance with the terms of the Trustees Deferred Compensation Plan. For the year ended October 31, 2007, no significant amounts have been deferred. Certain officers and Trustees of the Fund are officers of the above organizations.
4 Distribution Plans
The Fund has in effect a distribution plan for Class A shares (Class A Plan) pursuant to Rule 12b-1 under the 1940 Act. The Class A Plan provides that the Fund will pay EVD a distribution and service fee of 0.25% per annum of its average daily net assets attributable to Class A shares for distribution services and facilities provided to the Fund by EVD, as well as for personal services and/or the maintenance of shareholder accounts. Distribution and service fees paid or accrued to EVD for Class A shares for the year ended October 31, 2007 amounted to $11,684.
5 Contingent Deferred Sales Charges
Class A shares may be subject to a 1% contingent deferred sales charge (CDSC) if redeemed within 18 months of purchase (depending on the circumstances of purchase). Generally, the CDSC is based upon the lower of the net asset value at date of redemption or date of purchase. No charge is levied on shares acquired by reinvestment of dividends or capital gains distributions. No CDSC is levied on shares which have been sold to EVM or its affiliates or to their respective employees or clients and may be waived under certain other limited conditions. For the year ended October 31, 2007, the Fund was informed that EVD did not receive any CDSCs paid by Class A shareholders.
6 Purchases and Sales of Investments
Purchases and sales of investments, other than short-term obligations, aggregated $5,206,295 and $2,873,729, respectively, for the year ended October 31, 2007.
7 Shares of Beneficial Interest
The Fund's Declaration of Trust permits the Trustees to issue an unlimited number of full and fractional shares of beneficial interest (without par value). Such shares
14
Eaton Vance Equity Research Fund as of October 31, 2007
NOTES TO FINANCIAL STATEMENTS CONT'D
may be issued in a number of different series (such as the Fund) and classes. Transactions in Fund shares were as follows:
| | | Year Ended October 31, | |
| Class A | | 2007 | | 2006 | |
| Sales | | | 215,880 | | | | 91,410 | | |
Issued to shareholders electing to
receive payments of distributions
in Fund shares | | | 10,482 | | | | 7,518 | | |
| Redemptions | | | (52,242 | ) | | | (11,267 | ) | |
| Net increase | | | 174,120 | | | | 87,661 | | |
At October 31, 2007, EVM and an EVM retirement plan owned 12% and 34%, respectively, of the outstanding shares of the Fund.
8 Federal Income Tax Basis of Investments
The cost and unrealized appreciation (depreciation) of investments of the Fund at October 31, 2007, as determined on a federal income tax basis, were as follows:
| Aggregate cost | | $ | 5,120,879 | | |
| Gross unrealized appreciation | | $ | 1,143,667 | | |
| Gross unrealized depreciation | | | (61,045 | ) | |
| Net unrealized appreciation | | $ | 1,082,622 | | |
The net unrealized appreciation on foreign currency at October 31, 2007 on a federal income tax basis was $5.
9 Line of Credit
The Fund participates with other portfolios and funds managed by EVM and its affiliates in a $200 million unsecured line of credit agreement with a group of banks. Borrowings are made by the Fund solely to facilitate the handling of unusual and/or unanticipated short-term cash requirements. Interest is charged to the Fund based on its borrowings at an amount above either the Eurodollar rate or Federal Funds rate. In addition, a fee computed at an annual rate of 0.07% on the daily unused portion of the line of credit is allocated among the participating portfolios and funds at the end of each quarter. The Fund did not have any significant borrowings or allocated fees during the year ended October 31, 2007.
10 Recently Issued Accounting Pronouncements
In June 2006, the Financial Accounting Standards Board (FASB) issued FASB Interpretation No. 48 (FIN 48), "Accounting for Uncertainty in Income Taxes – an interpretation of FASB Statement No. 109". FIN 48 clarifies the accounting for uncertainty in income taxes recognized in accordance with FASB Statement No. 109, "Accounting for Income Taxes". This interpretation prescribes a recognition threshold and measurement attribute for the financial statement recognition and measurement of a tax position taken or expected to be taken in a tax return. It also provides guidance on de-recognition, classification, interest and penalties, accounting in interim periods, disclosure and transition. FIN 48 is effective on the last business day of the first required financial reporting period for fiscal years beginning after December 15, 2006. Management is currently evaluating the impact of applying the various provisions of FIN 48.
In September 2006, the FASB issued Statement of Financial Accounting Standards No. 157 (FAS 157), "Fair Value Measurements". FAS 157 defines fair value, establishes a framework for measuring fair value in accordance with generally accepted accounting principles and expands disclosure about fair value measurements. FAS 157 is effective for fiscal years beginning after November 15, 2007. Management is currently evaluating the impact the adoption of FAS 157 will have on the Fund's financial statement disclosures.
15
Eaton Vance Equity Research Fund as of October 31, 2007
REPORT OF INDEPENDENT REGISTERED PUBLIC ACCOUNTING FIRM
To the Trustees of Eaton Vance Mutual Funds Trust and Shareholders of
Eaton Vance Equity Research Fund:
We have audited the accompanying statement of assets and liabilities of Eaton Vance Equity Research Fund (one of the series of Eaton Vance Mutual Funds Trust) (the "Fund"), including the portfolio of investments, as of October 31, 2007, and the related statement of operations, the statement of changes in net assets, and the financial highlights for the year then ended. These financial statements and financial highlights are the responsibility of the Fund's management. Our responsibility is to express an opinion on these financial statements and financial highlights based on our audit. The statement of changes in net assets for the year ended October 31, 2006 and the financial highlights for each of the four years in the period ended October 31, 2006 were audited by other auditors. Those auditors expressed an unqualified opinion on those financial statements and financial highlights in their report dated December 19, 2006.
We conducted our audit in accordance with the standards of the Public Company Accounting Oversight Board (United States). Those standards require that we plan and perform the audit to obtain reasonable assurance about whether the financial statements and financial highlights are free of material misstatement. The Fund is not required to have, nor were we engaged to perform, an audit of its internal control over financial reporting. Our audit included consideration of internal control over financial reporting as a basis for designing audit procedures that are appropriate in the circumstances, but not for the purpose of expressing an opinion on the effectiveness of the Fund's internal control over financial reporting. Accordingly, we express no such opinion. An audit also includes examining, on a test basis, evidence supporting the amounts and disclosures in the financial statements, assessing the accounting principles used and si gnificant estimates made by management, as well as evaluating the overall financial statement presentation. Our procedures included confirmation of securities owned as of October 31, 2007, by correspondence with the custodian and brokers. We believe that our audit provides a reasonable basis for our opinion.
In our opinion, the financial statements and financial highlights referred to above present fairly, in all material respects, the financial position of Eaton Vance Equity Research Fund as of October 31, 2007, the results of its operations, the changes in its net assets, and the financial highlights for the year then ended, in conformity with accounting principles generally accepted in the United States of America.
DELOITTE & TOUCHE LLP
Boston, Massachusetts
December 14, 2007
16
Eaton Vance Equity Research Fund as of October 31, 2007
FEDERAL TAX INFORMATION (Unaudited)
The Form 1099-DIV you receive in January 2008 will show the tax status of all distributions paid to your account in calendar 2007. Shareholders are advised to consult their own tax adviser with respect to the tax consequences of their investment in the Fund. As required by the Internal Revenue Code regulations, shareholders must be notified within 60 days of the Fund's fiscal-year end regarding the status of qualified dividend income for individuals, the dividends received deduction for corporations and capital gains dividends.
Qualified Dividend Income. The Fund designates approximately $73,679, or up to the maximum amount of such dividends allowable pursuant to the Internal Revenue Code, as qualified dividend income eligible for the reduced tax rate of 15%.
Dividends Received Deduction. Corporate shareholders are generally entitled to take the dividends received deduction on the portion of the Fund's dividend distribution that qualifies under tax law. For the Fund's fiscal year 2007 ordinary income dividends, 96.85% qualifies for the corporate dividends received deduction.
Capital Gains Dividends. The Fund designates $115,022 as a capital gain dividend.
17
Eaton Vance Equity Research Fund as of October 31, 2007
OTHER MATTERS
Change in Independent Registered Public Accounting Firm
On August 6, 2007, PricewaterhouseCoopers LLP resigned in the ordinary course as the independent registered public accounting firm for the Fund.
The reports of PricewaterhouseCoopers LLP on the Fund's financial statements for each of the last two fiscal years contained no adverse opinion or disclaimer of opinion and were not qualified or modified as to uncertainty, audit scope or accounting principle. There have been no disagreements with PricewaterhouseCoopers LLP during the Fund's two most recent fiscal years and any subsequent interim period on any matter of accounting principles or practices, financial statement disclosure or auditing scope or procedure, which disagreements if not resolved to the satisfaction of PricewaterhouseCoopers LLP, would have caused them to make reference thereto in their reports on the Fund's financial statements for such years, and there were no reportable events of the kind described in Item 304 (a)(1)(v) of Regulation S-K under the Securities Exchange Act of 1934, as amended.
At a meeting held on August 6, 2007, based on Audit Committee recommendations and approvals, the full Board of Trustees of the Fund approved Deloitte & Touche LLP as the Fund's independent registered public accounting firm for the fiscal year ending October 31, 2007. To the best of the Fund's knowledge, for the fiscal years ended October 31, 2006 and October 31, 2005, and through August 6, 2007, the Fund did not consult with Deloitte & Touche LLP on items which concerned the application of accounting principles to a specified transaction, either completed or proposed, or the type of audit opinion that might be rendered on the Fund's financial statements or concerned the subject of a disagreement (as defined in paragraph (a)(1)(iv) of Item 304 of Regulation S-K) or reportable events (as described in paragraph (a)(1)(v) of Item 304 of Regulation S-K).
18
Eaton Vance Equity Research Fund
BOARD OF TRUSTEES' ANNUAL APPROVAL OF THE INVESTMENT ADVISORY AGREEMENT
Overview of the Contract Review Process
The Investment Company Act of 1940, as amended (the "1940 Act"), provides, in substance, that each investment advisory agreement between a fund and its investment adviser will continue in effect from year to year only if its continuance is approved at least annually by the fund's board of trustees, including by a vote of a majority of the trustees who are not "interested persons" of the fund ("Independent Trustees"), cast in person at a meeting called for the purpose of considering such approval.
At a meeting of the Boards of Trustees (each a "Board") of the Eaton Vance group of mutual funds (the "Eaton Vance Funds") held on April 23, 2007, the Board, including a majority of the Independent Trustees, voted to approve continuation of existing advisory and sub-advisory agreements for the Eaton Vance Funds for an additional one-year period. In voting its approval, the Board relied upon the affirmative recommendation of the Special Committee of the Board, which is a committee comprised exclusively of Independent Trustees. Prior to making its recommendation, the Special Committee reviewed information furnished for a series of meetings of the Special Committee held in February, March and April 2007. Such information included, among other things, the following:
Information about Fees, Performance and Expenses
• An independent report comparing the advisory and related fees paid by each fund with fees paid by comparable funds;
• An independent report comparing each fund's total expense ratio and its components to comparable funds;
• An independent report comparing the investment performance of each fund to the investment performance of comparable funds over various time periods;
• Data regarding investment performance in comparison to relevant peer groups of funds and appropriate indices;
• Comparative information concerning fees charged by each adviser for managing other mutual funds and institutional accounts using investment strategies and techniques similar to those used in managing the fund;
• Profitability analyses for each adviser with respect to each fund;
Information about Portfolio Management
• Descriptions of the investment management services provided to each fund, including the investment strategies and processes employed;
• Information concerning the allocation of brokerage and the benefits received by each adviser as a result of brokerage allocation, including information concerning the acquisition of research through "soft dollar" benefits received in connection with the funds' brokerage, and the implementation of a soft dollar reimbursement program established with respect to the funds;
• Data relating to portfolio turnover rates of each fund;
• The procedures and processes used to determine the fair value of fund assets and actions taken to monitor and test the effectiveness of such procedures and processes;
Information about each Adviser
• Reports detailing the financial results and condition of each adviser;
• Descriptions of the qualifications, education and experience of the individual investment professionals whose responsibilities include portfolio management and investment research for the funds, and information relating to their compensation and responsibilities with respect to managing other mutual funds and investment accounts;
• Copies of the Codes of Ethics of each adviser and its affiliates, together with information relating to compliance with and the administration of such codes;
• Copies of or descriptions of each adviser's proxy voting policies and procedures;
• Information concerning the resources devoted to compliance efforts undertaken by each adviser and its affiliates on behalf of the funds (including descriptions of various compliance programs) and their record of compliance with investment policies and restrictions, including policies with respect to market-timing, late trading and selective portfolio disclosure, and with policies on personal securities transactions;
• Descriptions of the business continuity and disaster recovery plans of each adviser and its affiliates;
Other Relevant Information
• Information concerning the nature, cost and character of the administrative and other non-investment management services provided by Eaton Vance Management and its affiliates;
• Information concerning management of the relationship with the custodian, subcustodians and fund accountants by each adviser or the funds' administrator; and
• The terms of each advisory agreement.
19
Eaton Vance Equity Research Fund
BOARD OF TRUSTEES' ANNUAL APPROVAL OF THE INVESTMENT ADVISORY AGREEMENT CONT'D
In addition to the information identified above, the Special Committee considered information provided from time to time by each adviser throughout the year at meetings of the Board and its committees. Over the course of the twelve-month period ended April 30, 2007, the Board met ten times and the Special Committee, the Audit Committee and the Governance Committee, each of which is a Committee comprised solely of Independent Trustees, met twelve, fourteen and eight times, respectively. At such meetings, the Trustees received, among other things, presentations by the portfolio managers and other investment professionals of each adviser relating to the investment performance of each fund and the investment strategies used in pursuing the fund's investment objective.
For funds that invest through one or more underlying portfolios, the Board considered similar information about the portfolio(s) when considering the approval of advisory agreements. In addition, in cases where the fund's investment adviser has engaged a sub-adviser, the Board considered similar information about the sub-adviser when considering the approval of any sub-advisory agreement.
The Special Committee was assisted throughout the contract review process by Goodwin Procter LLP, legal counsel for the Independent Trustees. The members of the Special Committee relied upon the advice of such counsel and their own business judgment in determining the material factors to be considered in evaluating each advisory and sub-advisory agreement and the weight to be given to each such factor. The conclusions reached with respect to each advisory and sub-advisory agreement were based on a comprehensive evaluation of all the information provided and not any single factor. Moreover, each member of the Special Committee may have placed varying emphasis on particular factors in reaching conclusions with respect to each advisory and sub-advisory agreement.
Results of the Process
Based on its consideration of the foregoing, and such other information as it deemed relevant, including the factors and conclusions described below, the Special Committee concluded that the continuance of the investment advisory agreement of the Eaton Vance Equity Research Fund (the "Fund") with Eaton Vance Management (the "Adviser"), including its fee structure, is in the interests of shareholders and, therefore, the Special Committee recommended to the Board approval of the agreement. The Board accepted the recommendation of the Special Committee as well as the factors considered and conclusions reached by the Special Committee with respect to the agreement. Accordingly, the Board, including a majority of the Independent Trustees, voted to approve continuation of the advisory agreement for the Fund.
Nature, Extent and Quality of Services
In considering whether to approve the investment advisory agreement of the Fund, the Board evaluated the nature, extent and quality of services provided to the Fund by the Adviser.
The Board considered the Adviser's management capabilities and investment process with respect to the types of investments held by the Fund, including the education, experience and number of its investment professionals and other personnel who provide portfolio management, investment research, and similar services to the Fund. In particular, the Board evaluated, where relevant, the abilities and experience of such investment personnel in analyzing factors such as credit risk, tax efficiency, and special considerations relevant to investing in foreign markets. Specifically, the Board considered the Adviser's in-house equity research capabilities. The Board also took into account the resources dedicated to portfolio management and other services, including the compensation paid to recruit and retain investment personnel, and the time and attention devoted to the Fund by senior management.
The Board reviewed the compliance programs of the Adviser and relevant affiliates thereof. Among other matters, the Board considered compliance and reporting matters relating to personal trading by investment personnel, selective disclosure of portfolio holdings, late trading, frequent trading, portfolio valuation, business continuity and the allocation of investment opportunities. The Board also evaluated the responses of the Adviser and its affiliates to requests from regulatory authorities such as the Securities and Exchange Commission and the National Association of Securities Dealers.
The Board considered shareholder and other administrative services provided or managed by Eaton Vance Management and its affiliates, including transfer agency and accounting services. The Board evaluated the benefits to shareholders of investing in a fund that is a part of a large family of funds, including the ability, in many cases, to exchange an investment among different funds without incurring additional sales charges.
After consideration of the foregoing factors, among others, the Board concluded that the nature, extent and quality of services provided by the Adviser, taken as a whole, are appropriate and consistent with the terms of the investment advisory agreement.
Fund Performance
The Board compared the Fund's investment performance to a relevant universe of similarly managed funds identified by an independent data provider and appropriate benchmark indices. The Board reviewed comparative performance data for the one- and
20
Eaton Vance Equity Research Fund
BOARD OF TRUSTEES' ANNUAL APPROVAL OF THE INVESTMENT ADVISORY AGREEMENT CONT'D
three-year periods ended September 30, 2006 for the Fund. On the basis of the foregoing and other relevant information, the Board concluded that the performance of the Fund is satisfactory.
Management Fees and Expenses
The Board reviewed contractual investment advisory fee rates, including administrative fee rates payable by the Fund (referred to collectively as "management fees"). As part of its review, the Board considered the Fund's management fees (including administrative fees) and total expense ratio for the year ended September 30, 2006, as compared to a group of similarly managed funds selected by an independent data provider. The Board considered the fact that the Adviser had waived fees and/or paid expenses for the Fund.
After reviewing the foregoing information, and in light of the nature, extent and quality of the services provided by the Adviser, the Board concluded that the management fees charged for advisory and related services and the Fund's total expense ratio are reasonable.
Profitability
The Board reviewed the level of profits realized by the Adviser and relevant affiliates thereof in providing investment advisory and administrative services to the Fund and to all Eaton Vance Funds as a group. The Board considered the level of profits realized without regard to revenue sharing or other payments by the Adviser and its affiliates to third parties in respect of distribution services. The Board also considered other direct or indirect benefits received by the Adviser and its affiliates in connection with its relationship with the Fund, including the benefits of research services that may be available to the Adviser as a result of securities transactions effected for the Fund and other investment advisory clients.
The Board concluded that, in light of the foregoing factors and the nature, extent and quality of the services rendered, the profits realized by the Adviser and its affiliates are reasonable.
Economies of Scale
In reviewing management fees and profitability, the Board also considered the extent to which the Adviser and its affiliates, on the one hand, and the Fund, on the other hand, can expect to realize benefits from economies of scale as the assets of the Fund increase. The Board acknowledged the difficulty in accurately measuring the benefits resulting from the economies of scale with respect to the management of any specific fund or group of funds. The Board reviewed data summarizing the increases and decreases in the assets of the Fund and of all Eaton Vance Funds as a group over various time periods, and evaluated the extent to which the total expense ratio of the Fund and the Adviser's profitability may have been affected by such increases or decreases. Based upon the foregoing, the Board concluded that the benefits from economies of scale are currently being shared equitably by the Adviser and the Fund. The Board also conclude d that the structure of the advisory fee, which includes breakpoints at several asset levels, can be expected to cause the Adviser and its affiliates and the Fund to continue to share such benefits equitably.
21
Eaton Vance Equity Research Fund
MANAGEMENT AND ORGANIZATION
Fund Management. The Trustees of Eaton Vance Mutual Funds Trust (the Trust) are responsible for the overall management and supervision of the Trust's affairs. The Trustees and officers of the Trust are listed below. Except as indicated, each individual has held the office shown or other offices in the same company for the last five years. Trustees and officers of the Trust hold indefinite terms of office. The "noninterested Trustees" consist of those Trustees who are not "interested persons" of the Trust, as that term is defined under the 1940 Act. The business address of each Trustee and officer is The Eaton Vance Building, 255 State Street, Boston, Massachusetts 02109. As used below, "EVC" refers to Eaton Vance Corp., "EV" refers to Eaton Vance, Inc., "EVM" refers to Eaton Vance Management, "BMR" refers to Boston Management and Research, "Parametric" refer s to Parametric Portfolio Associates and "EVD" refers to Eaton Vance Distributors, Inc. EVC and EV are the corporate parent and trustee, respectively, of EVM and BMR. EVD is the Fund's principal underwriter and a wholly-owned subsidiary of EVM. Each officer affiliated with Eaton Vance may hold a position with other Eaton Vance affiliates that is comparable to his or her position with EVM listed below.
Name and
Date of Birth | | Position(s)
with the
Trust | | Term of
Office and
Length of
Service | | Principal Occupation(s)
During Past Five Years | | Number of Portfolios
in Fund Complex
Overseen By
Trustee(1) | | Other Directorships Held | |
| Interested Trustee | | | | | | | | | | | | | |
|
| Thomas E. Faust Jr. 5/31/58 | | Trustee and President of the Trust | | Trustee since 2007 and President of the Trust since 2002 | | Chairman, Chief Executive Officer and President of EVC, President of EV, Chief Executive Officer and President of EVM and BMR, and Director of EVD. Trustee and/or Officer of 176 registered investment companies and 5 private investment companies in the Eaton Vance Fund Complex. Mr. Faust is an interested person because of his positions with EVM, BMR, EVC and EV which are affiliates of the Trust. | | | 176 | | | Director of EVC | |
|
| Noninterested Trustee(s) | | | | | | | | | | | | | |
|
| Benjamin C. Esty 1/2/63 | | Trustee | | Since 2005 | | Roy and Elizabeth Simmons Professor of Business Administration, Harvard University Graduate School of Business Administration (since 2003). Formerly, Associate Professor, Harvard University Graduate School of Business Administration (2000-2003). | | | 176 | | | None | |
|
| Allen R. Freedman 4/3/40 | | Trustee | | Since 2007 | | Former Chairman and Chief Executive Officer of Assurant, Inc. (insurance provider) (1978-2000). Formerly, a Director of Loring Ward International (fund distributor) (2005-2007). | | | 175 | | | Director of Assurant, Inc. and Stonemor Partners L.P. (owner and operator of cemeteries) | |
|
| William H. Park 9/19/47 | | Trustee | | Since 2003 | | Vice Chairman, Commercial Industrial Finance Corp. (specialty finance company) (since 2006). Formerly, President and Chief Executive Officer, Prizm Capital Management, LLC (investment management firm) (2002-2005). | | | 176 | | | None | |
|
| Ronald A. Pearlman 7/10/40 | | Trustee | | Since 2003 | | Professor of Law, Georgetown University Law Center. | | | 176 | | | None | |
|
| Norton H. Reamer 9/21/35 | | Trustee | | Since 1986 | | President, Chief Executive Officer and a Director of Asset Management Finance Corp. (a specialty finance company serving the investment management industry) (since October 2003). President, Unicorn Corporation (an investment and financial advisory services company) (since September 2000). Formerly, Chairman and Chief Operating Officer, Hellman, Jordan Management Co., Inc. (an investment management company) (2000-2003). Formerly, Advisory Director of Berkshire Capital Corporation (investment banking firm) (2002-2003). | | | 176 | | | None | |
|
22
Eaton Vance Equity Research Fund
MANAGEMENT AND ORGANIZATION CONT'D
Name and
Date of Birth | | Position(s)
with the
Trust | | Term of
Office and
Length of
Service | | Principal Occupation(s)
During Past Five Years | | Number of Portfolios
in Fund Complex
Overseen By
Trustee(1) | | Other Directorships Held | |
| Noninterested Trustee(s) (continued) | | | | | | | | | | | | | |
|
| Heidi L. Steiger 7/8/53 | | Trustee | | Since 2007 | | President, Lowenhaupt Global Advisors, LLC (global wealth management firm) (since 2005); Formerly, President and Contributing Editor, Worth Magazine (2004); Formerly, Executive Vice President and Global Head of Private Asset Management (and various other positions), Neuberger Berman (investment firm) (1986-2004). | | | 173 | | | Director of Nuclear Electric Insurance Ltd. (nuclear insurance provider) and Aviva USA (insurance provider) | |
|
| Lynn A. Stout 9/14/57 | | Trustee | | Since 1998 | | Paul Hastings Professor of Corporate and Securities Law, University of California at Los Angeles School of Law. | | | 176 | | | None | |
|
| Ralph F. Verni 1/26/43 | | Chairman of the Board and Trustee | | Chairman of the Board since 2007 and Trustee since 2005 | | Consultant and private investor. | | | 176 | | | None | |
|
| Principal Officers who are not Trustees | | | | | | | | | | | | | |
|
Name and
Date of Birth | | Position(s)
with the
Trust | | Term of
Office and
Length of
Service | | Principal Occupation(s)
During Past Five Years | |
| William H. Ahern, Jr. 7/28/59 | | Vice President | | Since 1995 | | Vice President of EVM and BMR. Officer of 74 registered investment companies managed by EVM or BMR. | |
|
| Cynthia J. Clemson 3/2/63 | | Vice President | | Since 2005 | | Vice President of EVM and BMR. Officer of 89 registered investment companies managed by EVM or BMR. | |
|
| Charles B. Gaffney 12/4/72 | | Vice President | | Since 2007 | | Vice President of EVM and BMR. Previously, Sector Portfolio Manager and Senior Equity Analyst of Brown Brothers Harriman (1997-2003). Officer of 29 registered investment companies managed by EVM or BMR. | |
|
| Christine M. Johnston 11/9/72 | | Vice President | | Since 2007 | | Vice President of EVM and BMR. Officer of 34 registered investment companies managed by EVM or BMR. | |
|
| Aamer Khan 6/7/60 | | Vice President | | Since 2005 | | Vice President of EVM and BMR. Officer of 32 registered investment companies managed by EVM or BMR. | |
|
| Thomas H. Luster 4/8/62 | | Vice President | | Since 2006 | | Vice President of EVM and BMR. Officer of 48 registered investment companies managed by EVM or BMR. | |
|
| Michael R. Mach 7/15/47 | | Vice President | | Since 1999 | | Vice President of EVM and BMR. Officer of 54 registered investment companies managed by EVM or BMR. | |
|
| Robert B. MacIntosh 1/22/57 | | Vice President | | Since 1998 | | Vice President of EVM and BMR. Officer of 89 registered investment companies managed by EVM or BMR. | |
|
| Duncan W. Richardson 10/26/57 | | Vice President | | Since 2001 | | Executive Vice President and Chief Equity Investment Officer of EVC, EVM and BMR. Officer of 80 registered investment companies managed by EVM or BMR. | |
|
| Walter A. Row, III 7/20/57 | | Vice President | | Since 2001 | | Director of Equity Research and a Vice President of EVM and BMR. Officer of 38 registered investment companies managed by EVM or BMR. | |
|
| Judith A. Saryan 8/21/54 | | Vice President | | Since 2003 | | Vice President of EVM and BMR. Officer of 53 registered investment companies managed by EVM or BMR. | |
|
| Susan Schiff 3/31/61 | | Vice President | | Since 2002 | | Vice President of EVM and BMR. Officer of 35 registered investment companies managed by EVM or BMR. | |
|
| Thomas Seto 9/27/62 | | Vice President | | Since 2007 | | Vice President and Director of Portfolio Management of Parametric. Officer of 30 registered investment companies managed by EVM or BMR. | |
|
23
Eaton Vance Equity Research Fund
MANAGEMENT AND ORGANIZATION CONT'D
Name and
Date of Birth | | Position(s)
with the
Trust | | Term of
Office and
Length of
Service | | Principal Occupation(s)
During Past Five Years | |
| Principal Officers who are not Trustees (continued) | |
|
| David M. Stein 5/4/51 | | Vice President | | Since 2007 | | Managing Director and Chief Investment Officer of Parametric. Officer of 30 registered investment companies managed by EVM or BMR. | |
|
| Mark S. Venezia 5/23/49 | | Vice President | | Since 2007 | | Vice President of EVM and BMR. Officer of 35 registered investment companies managed by EVM or BMR. | |
|
| Adam A. Weigold 3/22/75 | | Vice President | | Since 2007 | | Vice President of EVM and BMR. Officer of 70 registered investment companies managed by EVM or BMR. | |
|
| Barbara E. Campbell 6/19/57 | | Treasurer | | Since 2005 | | Vice President of EVM and BMR. Officer of 176 registered investment companies managed by EVM or BMR. | |
|
| Maureen A. Gemma 5/24/60 | | Secretary | | Since 2007 | | Deputy Chief Legal Officer and Vice President of EVM and BMR. Officer of 176 registered investment companies managed by EVM or BMR. | |
|
| Paul M. O'Neil 7/11/53 | | Chief Compliance Officer | | Since 2004 | | Vice President of EVM and BMR. Officer of 176 registered investment companies managed by EVM or BMR. | |
|
(1) Includes both master and feeder funds in a master-feeder structure.
The SAI for the Fund includes additional information about the Trustees and officers of the Fund and the Portfolio and can be obtained without charge by calling 1-800-225-6265.
24
Investment Adviser and
Administrator of Eaton Vance Equity Research Fund
Eaton Vance Management
The Eaton Vance Building
255 State Street
Boston, MA 02109
Principal Underwriter
Eaton Vance Distributors, Inc.
The Eaton Vance Building
255 State Street
Boston, MA 02109
Custodian
State Street Bank and Trust Company
200 Clarendon Street
Boston, MA 02116
Transfer Agent
PFPC Inc.
Attn: Eaton Vance Funds
P.O. Box 9653
Providence, RI 02940-9653
(800) 262-1122
Independent Registered Public Accounting Firm
Deloitte & Touche LLP
200 Berkeley Street
Boston, MA 02116-5022
Eaton Vance Equity Research Fund
The Eaton Vance Building
255 State Street
Boston, MA 02109
This report must be preceded or accompanied by a current prospectus. Before investing, investors should consider carefully the Fund's investment objective(s), risks, and charges and expenses. The Fund's current prospectus contains this and other information about the Fund and is available through your financial advisor. Please read the prospectus carefully before you invest or send money. For further information please call 1-800-225-6265.
1325-12/07 ERSRC

Annual Report October 31, 2007


EATON VANCE
FLOATING-RATE
FUND
IMPORTANT NOTICES REGARDING PRIVACY,
DELIVERY OF SHAREHOLDER DOCUMENTS,
PORTFOLIO HOLDINGS, AND PROXY VOTING
Privacy. The Eaton Vance organization is committed to ensuring your financial privacy. Each of the financial institutions identified below has in effect the following policy ("Privacy Policy") with respect to nonpublic personal information about its customers:
• Only such information received from you, through application forms or otherwise, and information about your Eaton Vance fund transactions will be collected. This may include information such as name, address, social security number, tax status, account balances and transactions.
• None of such information about you (or former customers) will be disclosed to anyone, except as permitted by law (which includes disclosure to employees necessary to service your account). In the normal course of servicing a customer's account, Eaton Vance may share information with unaffiliated third parties that perform various required services such as transfer agents, custodians and broker/dealers.
• Policies and procedures (including physical, electronic and procedural safeguards) are in place that are designed to protect the confidentiality of such information.
• We reserve the right to change our Privacy Policy at any time upon proper notification to you. Customers may want to review our Policy periodically for changes by accessing the link on our homepage: www.eatonvance.com.
Our pledge of privacy applies to the following entities within the Eaton Vance organization: the Eaton Vance Family of Funds, Eaton Vance Management, Eaton Vance Investment Counsel, Boston Management and Research, and Eaton Vance Distributors, Inc.
In addition, our Privacy Policy only applies to those Eaton Vance customers who are individuals and who have a direct relationship with us. If a customer's account (i.e., fund shares) is held in the name of a third-party financial adviser/broker-dealer, it is likely that only such adviser's privacy policies apply to the customer. This notice supersedes all previously issued privacy disclosures.
For more information about Eaton Vance's Privacy Policy, please call 1-800-262-1122.
Delivery of Shareholder Documents. The Securities and Exchange Commission (the "SEC") permits funds to deliver only one copy of shareholder documents, including prospectuses, proxy statements and shareholder reports, to fund investors with multiple accounts at the same residential or post office box address. This practice is often called "householding" and it helps eliminate duplicate mailings to shareholders.
Eaton Vance, or your financial adviser, may household the mailing of your documents indefinitely unless you instruct Eaton Vance, or your financial adviser, otherwise.
If you would prefer that your Eaton Vance documents not be householded, please contact Eaton Vance at
1-800-262-1122, or contact your financial adviser.
Your instructions that householding not apply to delivery of your Eaton Vance documents will be effective within 30 days of receipt by Eaton Vance or your financial adviser.
Portfolio Holdings. Each Eaton Vance Fund and its underlying Portfolio (if applicable) will file a schedule of its portfolio holdings on Form N-Q with the SEC for the first and third quarters of each fiscal year. The Form N-Q will be available on the Eaton Vance website www.eatonvance.com, by calling Eaton Vance at 1-800-262-1122 or in the EDGAR database on the SEC's website at www.sec.gov. Form N-Q may also be reviewed and copied at the SEC's public reference room in Washington, D.C. (call 1-800-732-0330 for information on the operation of the public reference room).
Proxy Voting. From time to time, funds are required to vote proxies related to the securities held by the funds. The Eaton Vance Funds or their underlying Portfolios (if applicable) vote proxies according to a set of policies and procedures approved by the Funds' and Portfolios' Boards. You may obtain a description of these policies and procedures and information on how the Funds or Portfolios voted proxies relating to portfolio securities during the most recent 12 month period ended June 30, without charge, upon request, by calling 1-800-262-1122. This description is also available on the SEC's website at www.sec.gov.
Eaton Vance Floating-Rate Fund as of October 31, 2007
MANAGEMENT’S DISCUSSION OF FUND PERFORMANCE
The Fund
Performance for the Past Year
· The Fund’s Advisers Class shares had a total return of 4.13% for the year ended October 31, 2007.(1) This return resulted from a decrease in net asset value (NAV) per share to $9.59 on October 31, 2007, from $9.84 on October 31, 2006, and the reinvestment of $0.648 in dividends.
· The Fund’s Class A shares had a total return of 4.12% for the year ended October 31, 2007.(1) This return resulted from a decrease in NAV per share to $9.92 on October 31, 2007, from $10.18 on October 31, 2006, and the reinvestment of $0.670 in dividends.
· The Fund’s Class B shares had a total return of 3.35% for the year ended October 31, 2007.(1) This return resulted from a decrease in NAV per share to $9.59 on October 31, 2007, from $9.84 on October 31, 2006, and the reinvestment of $0.574 in dividends.
· The Fund’s Class C shares had a total return of 3.35% for the year ended October 31, 2007.(1) This return resulted from a decrease in NAV per share to $9.59 on October 31, 2007, from $9.84 on October 31, 2006, and the reinvestment of $0.574 in dividends.
· The Fund’s Class I shares had a total return of 4.39% for the year ended October 31, 2007.(1) This return resulted from a decrease in NAV per share to $9.59 on October 31, 2007, from $9.84 on October 31, 2006, and the reinvestment of $0.672 in dividends.
· For comparison, the S&P/LSTA Leveraged Loan Index – an unmanaged index of U.S. dollar-denominated leveraged loans – had a total return of 4.42% for the same period.2
Investment Environment
· The loan market underwent an unprecedented correction in the third quarter of 2007 that resulted from a decline in loan demand, combined with an increase in the supply of new loan issuance. Average loan market prices fell 4%-5% in July and August. The risk aversion that began in the subprime mortgage area spread to the leveraged loan market through increased credit spreads and loan price volatility, which in turn further reduced demand from key market participants, including hedge funds, collateralized loan participation funds and mutual funds. With investor demand falling and loan supply rising to record levels, prices fell to levels not seen since Class A shares had a total return of 2002.
· Interestingly, this market decline was distinguished from previous corrections by the fact that corporate loan default rates have remained at historic lows, 0.5% according to Standard & there were increasing signs of a weakening economy, Class B shares had a total return of the market decline was primarily based on technical factors. The silver lining in the correction is that effective loan credit spreads widened from roughly 200 basis points (2.00%) over LIBOR – the London-Interbank Offered Rate, used by banks as a base for loans to large commercial and industrial companies – to around 300 basis points (3.00%) by the Fund’s fiscal year-end. That was closer to average historical levels.
The Portfolio’s Investment
· The Fund’s investment objective is to seek a high level of current income. The Fund invests in Floating Rate Portfolio (the “Portfolio”), a registered investment company that has the same investment objective and policies as the Fund. In managing the Portfolio, the investment adviser seeks to invest in a portfolio of senior loans that will be less volatile over time than the general loan market.
· The Portfolio’s investments included senior loans to 547 borrowers spanning 38 industries at October 31, 2007, with an average loan size of 0.18% of total investments, and no industry constituting more than 10% of total investments. Publishing, health care, cable and satellite television, chemicals and plastics, and business equipment and services were the largest industry weightings.(1)
(1) These returns do not include the 2.25% maximum sales charge for Class A shares or the applicable contingent deferred sales charges (CDSC) for Class B and Class C shares. If sales charges were deducted, the returns would be lower. Advisers Class and Class I shares are offered to investors at net asset value.
(2) It is not possible to invest directly in an Index. The Index’s been incurred if an investor individually purchased or sold the securities represented in the Index.
The views expressed throughout this report are those of the portfolio managers and are current only through the end of the period of the report as stated on the cover. These views are subject to change at any time based upon market or other conditions, and the investment adviser disclaims any responsibility to update such views. These views may not be relied on as investment advice and, because investment decisions for a fund are based on many factors, may not be relied on as an indication of trading intent on behalf of any Eaton Vance fund.
Past performance is no guarantee of future results. Returns are historical and are calculated by determining the percentage change in net asset value or offering price (as applicable) with all distributions reinvested. Investment return and principal value will fluctuate so that shares, when redeemed, may be worth more or less than their original cost. Performance is for the stated time period only; due to market volatility, the Fund’s current performance may be lower or higher than the quoted return. For performance as of the most recent month end, please refer to www.eatonvance.com.
Fund shares are not insured by the FDIC and are not deposits or other obligations of, or guaranteed by, any depository institution. Shares are subject to investment risks, including possible loss of principal invested.
1
· The Portfolio is well diversified in terms of industry, market and geography – a strategy management believes should help the Portfolio weather an economic downturn. The Portfolio had a 16.2% exposure to European loans, which provided further diversification and the opportunity for yield enhancement. Loans denominated in foreign currencies were hedged to protect against foreign currency risk.(1)
The Portfolio had a modest 1.5% exposure to home builders. Home builders have struggled in the recent economic climate; however, management believes that these loans should benefit from the security and collateral that back these exposures. The Portfolio did not have any direct exposure to subprime or prime mortgage lenders during the year ended October 31, 2007.(1)
· The Fund’s net asset value reflected the market correction, declining in July and August, before temporarily rebounding somewhat in September and October. Despite the summer decline, the Fund registered a positive total return for the fiscal year.
(1) Portfolio holdings may change due to active management.
Top Ten Holdings(2)
By total investments
Sungard Data Systems | | 1.1 | % |
Charter Communications Operating, LLC | | 1.1 | |
Community Health Systems, Inc. | | 1.0 | |
Univision Communications, Inc. | | 1.0 | |
NRG Energy Inc. | | 1.0 | |
UPC Broadband Holding B.V. | | 0.9 | |
Georgia-Pacific Corp. | | 0.9 | |
Gala Group Ltd. | | 0.8 | |
Idearc, Inc. | | 0.8 | |
Metro-Goldwyn-Mayer Studios, Inc. | | 0.8 | |
(2) Reflects the Portfolio’s investments as of October 31, 2007. Top Ten Holdings are shown as a percentage of the Portfolio’s total investments. Portfolio information may not be representative of current or future investments and may change due to active management.
Top Five Industries(3)
By total investments
Publishing | | 9.1 | % |
Health Care | | 7.8 | |
Cable & Satellite Television | | 7.3 | |
Chemicals & Plastics | | 6.4 | |
Business Equipment & Services | | 6.2 | |
(3) Reflects the Portfolio’s investments as of October 31, 2007. Industries are shown as a percentage of the Portfolio’s total investments. Portfolio information may not be representative of current or future investments and are subject to change due to active management.
Credit Quality Ratings for Total Loan Investments(4)
By total loan investments
Baa | | 2.0 | % |
Ba | | 51.4 | |
B | | 29.2 | |
Caa | | 0.3 | |
Non-Rated(5) | | 17.1 | |
(4) Credit Quality ratings are those provided by Moody’s, a nationally recognized bond rating service. As a percentage of the Portfolio’s total loan investments as of October 31, 2007. Portfolio information may not be representative of the Portfolio’s current or future investments and may change due to active management.
(5) Certain loans in which the Portfolio invests are not rated by a rating agency. In management’s opinion, such securities are comparable to securities rated by a rating agency in the categories listed above.
2
Eaton Vance Floating-Rate Fund as of October 31, 2007
FUND PERFORMANCE
The line graph and table set forth below provide information about the Fund’s performance. The line graph compares the performance of Class B of the Fund with that of the S&P/LSTA Leveraged Loan Index, an unmanaged loan market index. The lines on the graph represent the total returns of a hypothetical investment of $10,000 in Class B of the Fund and the S&P/LSTA Leveraged Loan Index. The table includes the total returns of each Class of the Fund at net asset value and public offering price. The performance presented below does not reflect the deduction of taxes, if any, that a shareholder would pay on Fund distributions or the redemption of Fund shares.
| | Advisers | | | | | | | | | |
Performance(1) | | Class | | Class A | | Class B | | Class C | | Class I | |
Share Class Symbol | | EABLX | | EVBLX | | EBBLX | | ECBLX | | EIBLX | |
Average Annual Total Returns (at net asset value) | | | | | | | | | |
One Year | | 4.13 | % | 4.12 | % | 3.35 | % | 3.35 | % | 4.39 | % |
Five Years | | 4.81 | | N.A. | | 4.03 | | 4.03 | | 5.07 | |
Life of Fund† | | 4.19 | | 4.62 | | 3.43 | | 3.43 | | 4.47 | |
| | | | | | | | | | | |
SEC Average Annual Total Returns (including sales charge or applicable CDSC) | | | | | |
One Year | | 4.13 | % | 1.82 | % | -1.52 | % | 2.38 | % | 4.39 | % |
Five Years | | 4.81 | | N.A. | | 3.68 | | 4.03 | | 5.07 | |
Life of Fund† | | 4.19 | | 4.09 | | 3.43 | | 3.43 | | 4.47 | |
† Inception Dates – Advisers Class: 2/7/01; Class A: 5/5/03; Class B: 2/5/01; Class C: 2/1/01; Class I: 1/30/01
(1) Average Annual Total Returns at net asset value do not include the 2.25% maximum sales charge for Class A shares or the applicable contingent deferred sales charges (CDSC) for Class B and Class C shares. If sales charges were deducted, the returns would be lower. SEC Average Annual Total Returns for Class A reflect the maximum 2.25% sales charge. Advisers Class and Class I are offered to certain investors at net asset value. SEC Average Annual Total Returns for Class B reflect applicable CDSC based on the following schedule: 5% - 1st and 2nd years; 4% - 3rd year; 3% - 4th year; 2% - 5th year; 1% - 6th year. 1-year SEC returns for Class C reflect 1% CDSC. Class A, Advisers Class and Class I shares are subject to a 1% redemption fee if redeemed or exchanged within 90 days of the settlement of the purchase.
Total Annual | | Advisers | | | | | | | | | |
Operating Expenses (2) | | Class | | Class A | | Class B | | Class C | | Class I | |
| | | | | | | | | | | |
Expense Ratio | | 1.01 | % | 1.01 | % | 1.77 | % | 1.76 | % | 0.76 | % |
(2) Source: Prospectus dated 3/1/07.
Comparison of Change in Value of a $10,000 Investment in Eaton Vance Floating-Rate Fund Class B vs. the S&P/LSTA Leveraged Loan Index*
February 28, 2001 – October 31, 2007
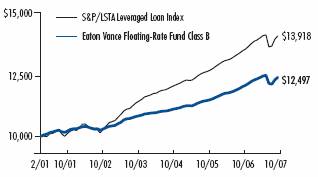
* Sources: Standard & Poor’s; Thomson Financial. Class B of the Fund commenced operations on 2/5/01. Index data is available as of month end only. A $10,000 hypothetical investment at net asset value in Class A on 5/5/03, Class C on 2/1/01, Class I on 1/30/01 and Advisers Class on 2/7/01 would have been valued at $12,250 ($11,974 at the maximum offering price), $12,558, $13,435 and $13,184, respectively, on 10/31/07. It is not possible to invest directly in an Index. The Index’s total return does not reflect the expenses that would have been incurred if an investor individually purchased or sold the securities represented in the Index.
Past performance is no guarantee of future results. Returns are historical and are calculated by determining the percentage change in net asset value or offering price (as applicable) with all distributions reinvested. Investment return and principal value will fluctuate so that shares, when redeemed, may be worth more or less than their original cost. Performance is for the stated time period only; due to market volatility, the Fund’s current performance may be lower or higher than the quoted return. For performance as of the most recent month end, please refer to www.eatonvance.com.
3
Eaton Vance Floating-Rate Fund as of October 31, 2007
FUND EXPENSES
Example: As a shareholder of the Fund, you incur two types of costs: (1) transaction costs, including sales charges (loads) on purchases and redemption fees (if applicable); and (2) ongoing costs, including management fees; distribution or service fees; and other Fund expenses. This Example is intended to help you understand your ongoing costs (in dollars) of investing in the Fund and to compare these costs with the ongoing costs of investing in other mutual funds. The Example is based on an investment of $1,000 invested at the beginning of the period and held for the entire period (May 1, 2007 – October 31, 2007).
Actual Expenses: The first section of the table below provides information about actual account values and actual expenses. You may use the information in this section, together with the amount you invested, to estimate the expenses that you paid over the period. Simply divide your account value by $1,000 (for example, an $8,600 account value divided by $1,000 = 8.6), then multiply the result by the number in the first section under the heading entitled "Expenses Paid During Period" to estimate the expenses you paid on your account during this period.
Hypothetical Example for Comparison Purposes: The second section of the table below provides information about hypothetical account values and hypothetical expenses based on the actual Fund expense ratio and an assumed rate of return of 5% per year (before expenses), which is not the actual return of the Fund. The hypothetical account values and expenses may not be used to estimate the actual ending account balance or expenses you paid for the period. You may use this information to compare the ongoing costs of investing in the Fund and other funds. To do so, compare this 5% hypothetical example with the 5% hypothetical examples that appear in the shareholder reports of the other funds.
Please note that the expenses shown in the table are meant to highlight your ongoing costs only and do not reflect any transactional costs, such as sales charges (loads) or redemption fees (if applicable). Therefore, the second section of the table is useful in comparing ongoing costs only, and will not help you determine the relative total costs of owning different funds. In addition, if these transactional costs were included, your costs would have been higher.
Eaton Vance Floating-Rate Fund
| | | Beginning Account Value
(5/1/07) | | Ending Account Value
(10/31/07) | | Expenses Paid During Period*
(5/1/07 – 10/31/07) | |
| Actual | |
| Advisers Class | | $ | 1,000.00 | | | $ | 1,003.70 | | | $ | 5.50 | | |
| Class A | | $ | 1,000.00 | | | $ | 1,004.70 | | | $ | 5.51 | | |
| Class B | | $ | 1,000.00 | | | $ | 1,000.90 | | | $ | 9.33 | | |
| Class C | | $ | 1,000.00 | | | $ | 1,000.90 | | | $ | 9.33 | | |
| Class I | | $ | 1,000.00 | | | $ | 1,005.00 | | | $ | 4.25 | | |
| Hypothetical | |
| (5% return per year before expenses) | |
| Advisers Class | | $ | 1,000.00 | | | $ | 1,019.70 | | | $ | 5.55 | | |
| Class A | | $ | 1,000.00 | | | $ | 1,019.70 | | | $ | 5.55 | | |
| Class B | | $ | 1,000.00 | | | $ | 1,015.90 | | | $ | 9.40 | | |
| Class C | | $ | 1,000.00 | | | $ | 1,015.90 | | | $ | 9.40 | | |
| Class I | | $ | 1,000.00 | | | $ | 1,021.00 | | | $ | 4.28 | | |
* Expenses are equal to the Fund's annualized expense ratio of 1.09% for Advisers Class shares, 1.09% for Class A shares, 1.85% for Class B shares, 1.85% for Class C shares and 0.84% for Class I shares, multiplied by the average account value over the period, multiplied by 184/365 (to reflect the one-half-year period). The Example assumes that the $1,000 was invested at the net asset value per share determined at the close of business on April 30, 2007. The Example reflects the expenses of both the Fund and the Portfolio.
4
Eaton Vance Floating-Rate Fund as of October 31, 2007
FINANCIAL STATEMENTS
Statement of Assets and Liabilities
As of October 31, 2007
| Assets | |
Investment in Floating Rate Portfolio, at value
(identified cost, $4,522,036,924) | | $ | 4,458,555,034 | | |
| Receivable for Fund shares sold | | | 16,287,311 | | |
| Total assets | | $ | 4,474,842,345 | | |
| Liabilities | |
| Payable for Fund shares redeemed | | $ | 20,783,497 | | |
| Dividends payable | | | 7,397,968 | | |
| Payable to affiliate for distribution and service fees | | | 1,678,615 | | |
| Payable to affiliate for administration fees | | | 568,152 | | |
| Payable to affiliate for Trustees' fees | | | 333 | | |
| Accrued expenses | | | 701,688 | | |
| Total liabilities | | $ | 31,130,253 | | |
| Net Assets | | $ | 4,443,712,092 | | |
| Sources of Net Assets | |
| Paid-in capital | | $ | 4,566,817,468 | | |
| Accumulated net realized loss from Portfolio | | | (53,492,686 | ) | |
| Accumulated distributions in excess of net investment income | | | (6,130,800 | ) | |
| Net unrealized depreciation from Portfolio | | | (63,481,890 | ) | |
| Total | | $ | 4,443,712,092 | | |
| Advisers Shares | |
| Net Assets | | $ | 972,839,940 | | |
| Shares Outstanding | | | 101,393,695 | | |
Net Asset Value, Offering Price and Redemption Price Per Share
(net assets ÷ shares of beneficial interest outstanding) | | $ | 9.59 | | |
| Class A Shares | |
| Net Assets | | $ | 1,619,235,070 | | |
| Shares Outstanding | | | 163,234,635 | | |
Net Asset Value and Redemption Price Per Share
(net assets ÷ shares of beneficial interest outstanding) | | $ | 9.92 | | |
Maximum Offering Price Per Share
(100 ÷ 97.75 of $9.92) | | $ | 10.15 | | |
| Class B Shares | |
| Net Assets | | $ | 177,431,337 | | |
| Shares Outstanding | | | 18,508,838 | | |
Net Asset Value and Offering Price Per Share*
(net assets ÷ shares of beneficial interest outstanding) | | $ | 9.59 | | |
| Class C Shares | |
| Net Assets | | $ | 1,142,139,108 | | |
| Shares Outstanding | | | 119,123,807 | | |
Net Asset Value and Offering Price Per Share*
(net assets ÷ shares of beneficial interest outstanding) | | $ | 9.59 | | |
| Class I Shares | |
| Net Assets | | $ | 532,066,637 | | |
| Shares Outstanding | | | 55,457,999 | | |
Net Asset Value, Offering Price and Redemption Price Per Share
(net assets ÷ shares of beneficial interest outstanding) | | $ | 9.59 | | |
On sales of $100,000 or more, the offering price of Class A shares is reduced.
* Redemption price per share is equal to the net asset value less any applicable contingent deferred sales charge.
Statement of Operations
For the Year Ended
October 31, 2007
| Investment Income | |
| Interest allocated from Portfolio | | $ | 380,601,873 | | |
| Dividends allocated from Portfolio | | | 5,041 | | |
| Expenses allocated from Portfolio | | | (29,244,590 | ) | |
| Net investment income from Portfolio | | $ | 351,362,324 | | |
| Expenses | |
| Administration fee | | $ | 7,565,641 | | |
| Trustees' fees and expenses | | | 3,743 | | |
Distribution and service fees
Advisers | | | 2,970,939 | | |
| Class A | | | 4,696,934 | | |
| Class B | | | 2,091,340 | | |
| Class C | | | 11,916,175 | | |
| Transfer and dividend disbursing agent fees | | | 2,744,634 | | |
| Printing and postage | | | 410,544 | | |
| Registration fees | | | 257,759 | | |
| Legal and accounting services | | | 97,676 | | |
| Custodian fee | | | 42,993 | | |
| Miscellaneous | | | 42,186 | | |
| Total expenses | | $ | 32,840,564 | | |
| Net investment income | | $ | 318,521,760 | | |
| Realized and Unrealized Gain (Loss) from Portfolio | |
Net realized gain (loss) —
Investment transactions | | $ | 10,900,716 | | |
| Swap contracts | | | 1,057,226 | | |
Foreign currency and forward foreign currency exchange
contract transactions | | | (62,184,549 | ) | |
| Net realized loss | | $ | (50,226,607 | ) | |
Change in unrealized appreciation (depreciation) —
Investments | | $ | (86,990,894 | ) | |
| Swap contracts | | | (201,567 | ) | |
| Foreign currency and forward foreign currency exchange contracts | | | 51,356 | | |
| Net change in unrealized appreciation (depreciation) | | $ | (87,141,105 | ) | |
| Net realized and unrealized loss | | $ | (137,367,712 | ) | |
| Net increase in net assets from operations | | $ | 181,154,048 | | |
See notes to financial statements
5
Eaton Vance Floating-Rate Fund as of October 31, 2007
FINANCIAL STATEMENTS CONT'D
Statements of Changes in Net Assets
Increase (Decrease)
in Net Assets | | Year Ended
October 31, 2007 | | Year Ended
October 31, 2006 | |
From operations —
Net investment income | | $ | 318,521,760 | | | $ | 274,169,927 | | |
Net realized loss from investment
transactions, swap contracts, and
foreign currency and forward foreign
currency exchange contract transactions | | | (50,226,607 | ) | | | (14,883,545 | ) | |
Net change in unrealized appreciation
(depreciation) from investments,
swap contracts, and foreign currency
and forward foreign currency
exchange contracts | | | (87,141,105 | ) | | | (158,708 | ) | |
| Net increase in net assets from operations | | $ | 181,154,048 | | | $ | 259,127,674 | | |
Distributions to shareholders —
From net investment income
Advisers | | $ | (78,819,187 | ) | | $ | (70,673,479 | ) | |
| Class A | | | (124,345,531 | ) | | | (103,047,869 | ) | |
| Class B | | | (12,298,989 | ) | | | (13,007,797 | ) | |
| Class C | | | (70,005,571 | ) | | | (62,803,641 | ) | |
| Class I | | | (39,517,999 | ) | | | (27,488,865 | ) | |
| Total distributions to shareholders | | $ | (324,987,277 | ) | | $ | (277,021,651 | ) | |
Transactions in shares of beneficial interest —
Proceeds from sale of shares
Advisers | | $ | 638,760,508 | | | $ | 801,542,199 | | |
| Class A | | | 973,665,214 | | | | 1,017,522,188 | | |
| Class B | | | 18,988,643 | | | | 24,277,462 | | |
| Class C | | | 360,669,378 | | | | 327,275,996 | | |
| Class I | | | 439,234,146 | | | | 234,079,444 | | |
Net asset value of shares issued to
shareholders in payment of
distributions declared
Advisers | | | 54,522,994 | | | | 48,260,518 | | |
| Class A | | | 87,133,081 | | | | 73,890,874 | | |
| Class B | | | 7,943,406 | | | | 8,328,153 | | |
| Class C | | | 45,357,185 | | | | 39,440,391 | | |
| Class I | | | 27,972,993 | | | | 18,682,236 | | |
Cost of shares redeemed
Advisers | | | (925,978,979 | ) | | | (628,533,183 | ) | |
| Class A | | | (1,240,095,133 | ) | | | (773,541,104 | ) | |
| Class B | | | (61,657,752 | ) | | | (58,696,661 | ) | |
| Class C | | | (400,928,465 | ) | | | (412,928,596 | ) | |
| Class I | | | (402,425,316 | ) | | | (137,589,950 | ) | |
Net asset value of shares exchanged
Class A | | | 12,993,524 | | | | 6,988,095 | | |
| Class B | | | (12,993,524 | ) | | | (6,988,095 | ) | |
| Redemption fees | | | 339,031 | | | | 129,528 | | |
Net increase (decrease) in net assets from
Fund share transactions | | $ | (376,499,066 | ) | | $ | 582,139,495 | | |
| Net increase (decrease) in net assets | | $ | (520,332,295 | ) | | $ | 564,245,518 | | |
| Net Assets | | Year Ended
October 31, 2007 | | Year Ended
October 31, 2006 | |
| At beginning of year | | $ | 4,964,044,387 | | | $ | 4,399,798,869 | | |
| At end of year | | $ | 4,443,712,092 | | | $ | 4,964,044,387 | | |
Accumulated undistributed
(distributions in excess of)
net investment income
included in net assets | |
| At end of year | | $ | (6,130,800 | ) | | $ | 4,088,896 | | |
See notes to financial statements
6
Eaton Vance Floating-Rate Fund as of October 31, 2007
FINANCIAL STATEMENTS CONT'D
Financial Highlights
| | | Advisers | |
| | | Year Ended October 31, | |
| | | 2007(1) | | 2006(1) | | 2005(1) | | 2004(1) | | 2003(1) | |
| Net asset value — Beginning of year | | $ | 9.840 | | | $ | 9.880 | | | $ | 9.880 | | | $ | 9.820 | | | $ | 9.560 | | |
| Income (loss) from operations | |
| Net investment income | | $ | 0.636 | | | $ | 0.589 | | | $ | 0.417 | | | $ | 0.274 | | | $ | 0.331 | | |
| Net realized and unrealized gain (loss) | | | (0.239 | ) | | | (0.037 | ) | | | (0.005 | ) | | | 0.058 | | | | 0.283 | | |
| Total income from operations | | $ | 0.397 | | | $ | 0.552 | | | $ | 0.412 | | | $ | 0.332 | | | $ | 0.614 | | |
| Less distributions | |
| From net investment income | | $ | (0.648 | ) | | $ | (0.592 | ) | | $ | (0.413 | ) | | $ | (0.272 | ) | | $ | (0.354 | ) | |
| Total distributions | | $ | (0.648 | ) | | $ | (0.592 | ) | | $ | (0.413 | ) | | $ | (0.272 | ) | | $ | (0.354 | ) | |
| Redemption fees | | $ | 0.001 | | | $ | 0.000 | (2) | | $ | 0.001 | | | $ | 0.000 | (2) | | $ | — | | |
| Net asset value — End of year | | $ | 9.590 | | | $ | 9.840 | | | $ | 9.880 | | | $ | 9.880 | | | $ | 9.820 | | |
| Total Return(3) | | | 4.13 | % | | | 5.74 | % | | | 4.26 | % | | | 3.43 | % | | | 6.54 | % | |
| Ratios/Supplemental Data | |
| Net assets, end of year (000's omitted) | | $ | 972,840 | | | $ | 1,238,349 | | | $ | 1,021,526 | | | $ | 782,259 | | | $ | 271,723 | | |
| Ratios (As a percentage of average daily net assets): | |
| Expenses before custodian fee reduction(4) | | | 1.05 | % | | | 1.01 | % | | | 1.03 | % | | | 1.05 | % | | | 1.09 | % | |
| Expenses after custodian fee reduction(4) | | | 1.05 | % | | | 1.01 | % | | | 1.03 | % | | | 1.05 | % | | | 1.09 | % | |
| Net investment income | | | 6.50 | % | | | 5.97 | % | | | 4.21 | % | | | 2.78 | % | | | 3.40 | % | |
| Portfolio Turnover of the Portfolio | | | 61 | % | | | 50 | % | | | 57 | % | | | 67 | % | | | 64 | % | |
(1) Net investment income per share was computed using average shares outstanding.
(2) Amount represents less than $0.0005 per share.
(3) Returns are historical and are calculated by determining the percentage change in net asset value with all distributions reinvested.
(4) Includes the Fund's share of the Portfolio's allocated expenses.
See notes to financial statements
7
Eaton Vance Floating-Rate Fund as of October 31, 2007
FINANCIAL STATEMENTS CONT'D
Financial Highlights
| | | Class A | |
| | | Year Ended October 31, | |
| | | 2007(1) | | 2006(1) | | 2005(1) | | 2004(1) | | 2003(1)(2) | |
| Net asset value — Beginning of year | | $ | 10.180 | | | $ | 10.220 | | | $ | 10.210 | | | $ | 10.150 | | | $ | 10.000 | | |
| Income (loss) from operations | |
| Net investment income | | $ | 0.657 | | | $ | 0.608 | | | $ | 0.430 | | | $ | 0.282 | | | $ | 0.138 | | |
| Net realized and unrealized gain (loss) | | | (0.248 | ) | | | (0.036 | ) | | | 0.006 | (3) | | | 0.060 | | | | 0.169 | | |
| Total income from operations | | $ | 0.409 | | | $ | 0.572 | | | $ | 0.436 | | | $ | 0.342 | | | $ | 0.307 | | |
| Less distributions | |
| From net investment income | | $ | (0.670 | ) | | $ | (0.612 | ) | | $ | (0.427 | ) | | $ | (0.282 | ) | | $ | (0.157 | ) | |
| Total distributions | | $ | (0.670 | ) | | $ | (0.612 | ) | | $ | (0.427 | ) | | $ | (0.282 | ) | | $ | (0.157 | ) | |
| Redemption fees | | $ | 0.001 | | | $ | 0.000 | (4) | | $ | 0.001 | | | $ | 0.000 | (4) | | $ | — | | |
| Net asset value — End of year | | $ | 9.920 | | | $ | 10.180 | | | $ | 10.220 | | | $ | 10.210 | | | $ | 10.150 | | |
| Total Return(5) | | | 4.12 | % | | | 5.75 | % | | | 4.36 | % | | | 3.40 | % | | | 3.09 | %(8) | |
| Ratios/Supplemental Data | |
| Net assets, end of year (000's omitted) | | $ | 1,619,235 | | | $ | 1,839,719 | | | $ | 1,521,460 | | | $ | 1,155,058 | | | $ | 273,365 | | |
| Ratios (As a percentage of average daily net assets): | |
| Expenses before custodian fee reduction(6) | | | 1.05 | % | | | 1.01 | % | | | 1.03 | % | | | 1.05 | % | | | 1.09 | %(7) | |
| Expenses after custodian fee reduction(6) | | | 1.05 | % | | | 1.01 | % | | | 1.03 | % | | | 1.05 | % | | | 1.09 | %(7) | |
| Net investment income | | | 6.50 | % | | | 5.96 | % | | | 4.21 | % | | | 2.76 | % | | | 2.81 | %(7) | |
| Portfolio Turnover of the Portfolio | | | 61 | % | | | 50 | % | | | 57 | % | | | 67 | % | | | 64 | % | |
(1) Net investment income per share was computed using average shares outstanding.
(2) For the period from the start of business, May 5, 2003 to October 31, 2003.
(3) The per share amount is not in accordance with the net realized and unrealized gain (loss) for the period because of the timing of sales of Fund shares and the amount of the per share realized and unrealized gains and losses at such time.
(4) Amount represents less than $0.0005 per share.
(5) Returns are historical and are calculated by determining the percentage change in net asset value with all distributions reinvested.
(6) Includes the Fund's share of the Portfolio's allocated expenses.
(7) Annualized.
(8) Not annualized.
See notes to financial statements
8
Eaton Vance Floating-Rate Fund as of October 31, 2007
FINANCIAL STATEMENTS CONT'D
Financial Highlights
| | | Class B | |
| | | Year Ended October 31, | |
| | | 2007(1) | | 2006(1) | | 2005(1) | | 2004(1) | | 2003(1) | |
| Net asset value — Beginning of year | | $ | 9.840 | | | $ | 9.870 | | | $ | 9.870 | | | $ | 9.810 | | | $ | 9.560 | | |
| Income (loss) from operations | |
| Net investment income | | $ | 0.563 | | | $ | 0.511 | | | $ | 0.336 | | | $ | 0.198 | | | $ | 0.278 | | |
| Net realized and unrealized gain (loss) | | | (0.240 | ) | | | (0.023 | ) | | | 0.002 | (2) | | | 0.060 | | | | 0.253 | | |
| Total income from operations | | $ | 0.323 | | | $ | 0.488 | | | $ | 0.338 | | | $ | 0.258 | | | $ | 0.531 | | |
| Less distributions | |
| From net investment income | | $ | (0.574 | ) | | $ | (0.518 | ) | | $ | (0.339 | ) | | $ | (0.198 | ) | | $ | (0.281 | ) | |
| Total distributions | | $ | (0.574 | ) | | $ | (0.518 | ) | | $ | (0.339 | ) | | $ | (0.198 | ) | | $ | (0.281 | ) | |
| Redemption fees | | $ | 0.001 | | | $ | 0.000 | (3) | | $ | 0.001 | | | $ | 0.000 | (3) | | $ | — | | |
| Net asset value — End of year | | $ | 9.590 | | | $ | 9.840 | | | $ | 9.870 | | | $ | 9.870 | | | $ | 9.810 | | |
| Total Return(4) | | | 3.35 | % | | | 5.06 | % | | | 3.48 | % | | | 2.65 | % | | | 5.63 | % | |
| Ratios/Supplemental Data | |
| Net assets, end of year (000's omitted) | | $ | 177,431 | | | $ | 230,454 | | | $ | 264,403 | | | $ | 298,187 | | | $ | 247,494 | | |
| Ratios (As a percentage of average daily net assets): | |
| Expenses before custodian fee reduction(5) | | | 1.80 | % | | | 1.77 | % | | | 1.78 | % | | | 1.80 | % | | | 1.84 | % | |
| Expenses after custodian fee reduction(5) | | | 1.80 | % | | | 1.77 | % | | | 1.78 | % | | | 1.80 | % | | | 1.84 | % | |
| Net investment income | | | 5.76 | % | | | 5.18 | % | | | 3.40 | % | | | 2.01 | % | | | 2.87 | % | |
| Portfolio Turnover of the Portfolio | | | 61 | % | | | 50 | % | | | 57 | % | | | 67 | % | | | 64 | % | |
(1) Net investment income per share was computed using average shares outstanding.
(2) The per share amount is not in accordance with the net realized and unrealized gain (loss) for the period because of the timing of sales of Fund shares and the amount of the per share realized and unrealized gains and losses at such time.
(3) Amount represents less than $0.0005 per share.
(4) Returns are historical and are calculated by determining the percentage change in net asset value with all distributions reinvested.
(5) Includes the Fund's share of the Portfolio's allocated expenses.
See notes to financial statements
9
Eaton Vance Floating-Rate Fund as of October 31, 2007
FINANCIAL STATEMENTS CONT'D
Financial Highlights
| | | Class C | |
| | | Year Ended October 31, | |
| | | 2007(1) | | 2006(1) | | 2005(1) | | 2004(1) | | 2003(1) | |
| Net asset value — Beginning of year | | $ | 9.840 | | | $ | 9.870 | | | $ | 9.870 | | | $ | 9.810 | | | $ | 9.560 | | |
| Income (loss) from operations | |
| Net investment income | | $ | 0.562 | | | $ | 0.512 | | | $ | 0.338 | | | $ | 0.198 | | | $ | 0.275 | | |
| Net realized and unrealized gain (loss) | | | (0.239 | ) | | | (0.024 | ) | | | (0.000 | )(2) | | | 0.060 | | | | 0.256 | | |
| Total income from operations | | $ | 0.323 | | | $ | 0.488 | | | $ | 0.338 | | | $ | 0.258 | | | $ | 0.531 | | |
| Less distributions | |
| From net investment income | | $ | (0.574 | ) | | $ | (0.518 | ) | | $ | (0.339 | ) | | $ | (0.198 | ) | | $ | (0.281 | ) | |
| Total distributions | | $ | (0.574 | ) | | $ | (0.518 | ) | | $ | (0.339 | ) | | $ | (0.198 | ) | | $ | (0.281 | ) | |
| Redemption fees | | $ | 0.001 | | | $ | 0.000 | (3) | | $ | 0.001 | | | $ | 0.000 | (3) | | $ | — | | |
| Net asset value — End of year | | $ | 9.590 | | | $ | 9.840 | | | $ | 9.870 | | | $ | 9.870 | | | $ | 9.810 | | |
| Total Return(4) | | | 3.35 | % | | | 5.06 | % | | | 3.48 | % | | | 2.65 | % | | | 5.63 | % | |
| Ratios/Supplemental Data | |
| Net assets, end of year (000's omitted) | | $ | 1,142,139 | | | $ | 1,170,248 | | | $ | 1,220,713 | | | $ | 1,227,737 | | | $ | 724,521 | | |
| Ratios (As a percentage of average daily net assets): | |
| Expenses before custodian fee reduction(5) | | | 1.80 | % | | | 1.76 | % | | | 1.78 | % | | | 1.80 | % | | | 1.84 | % | |
| Expenses after custodian fee reduction(5) | | | 1.80 | % | | | 1.76 | % | | | 1.78 | % | | | 1.80 | % | | | 1.84 | % | |
| Net investment income | | | 5.75 | % | | | 5.19 | % | | | 3.42 | % | | | 2.01 | % | | | 2.84 | % | |
| Portfolio Turnover of the Portfolio | | | 61 | % | | | 50 | % | | | 57 | % | | | 67 | % | | | 64 | % | |
(1) Net investment income per share was computed using average shares outstanding.
(2) Amount represents less than $(0.0005) per share.
(3) Amount represents less than $0.0005 per share.
(4) Returns are historical and are calculated by determining the percentage change in net asset value with all distributions reinvested.
(5) Includes the Fund's share of the Portfolio's allocated expenses.
See notes to financial statements
10
Eaton Vance Floating-Rate Fund as of October 31, 2007
FINANCIAL STATEMENTS CONT'D
Financial Highlights
| | | Class I | |
| | | Year Ended October 31, | |
| | | 2007(1) | | 2006(1) | | 2005(1) | | 2004(1) | | 2003(1) | |
| Net asset value — Beginning of year | | $ | 9.840 | | | $ | 9.880 | | | $ | 9.880 | | | $ | 9.820 | | | $ | 9.560 | | |
| Income (loss) from operations | |
| Net investment income | | $ | 0.658 | | | $ | 0.614 | | | $ | 0.440 | | | $ | 0.299 | | | $ | 0.359 | | |
| Net realized and unrealized gain (loss) | | | (0.237 | ) | | | (0.037 | ) | | | (0.003 | ) | | | 0.058 | | | | 0.279 | | |
| Total income from operations | | $ | 0.421 | | | $ | 0.577 | | | $ | 0.437 | | | $ | 0.357 | | | $ | 0.638 | | |
| Less distributions | |
| From net investment income | | $ | (0.672 | ) | | $ | (0.617 | ) | | $ | (0.438 | ) | | $ | (0.297 | ) | | $ | (0.378 | ) | |
| Total distributions | | $ | (0.672 | ) | | $ | (0.617 | ) | | $ | (0.438 | ) | | $ | (0.297 | ) | | $ | (0.378 | ) | |
| Redemption fees | | $ | 0.001 | | | $ | 0.000 | (2) | | $ | 0.001 | | | $ | 0.000 | (2) | | $ | — | | |
| Net asset value — End of year | | $ | 9.590 | | | $ | 9.840 | | | $ | 9.880 | | | $ | 9.880 | | | $ | 9.820 | | |
| Total Return(3) | | | 4.39 | % | | | 6.00 | % | | | 4.52 | % | | | 3.69 | % | | | 6.79 | % | |
| Ratios/Supplemental Data | |
| Net assets, end of year (000's omitted) | | $ | 532,067 | | | $ | 485,274 | | | $ | 371,698 | | | $ | 270,774 | | | $ | 98,545 | | |
| Ratios (As a percentage of average daily net assets): | |
| Expenses before custodian fee reduction(4) | | | 0.80 | % | | | 0.76 | % | | | 0.78 | % | | | 0.80 | % | | | 0.84 | % | |
| Expenses after custodian fee reduction(4) | | | 0.80 | % | | | 0.76 | % | | | 0.78 | % | | | 0.80 | % | | | 0.84 | % | |
| Net investment income | | | 6.73 | % | | | 6.22 | % | | | 4.45 | % | | | 3.03 | % | | | 3.69 | % | |
| Portfolio Turnover of the Portfolio | | | 61 | % | | | 50 | % | | | 57 | % | | | 67 | % | | | 64 | % | |
(1) Net investment income per share was computed using average shares outstanding.
(2) Amount represents less than $0.0005 per share.
(3) Returns are historical and are calculated by determining the percentage change in net asset value with all distributions reinvested.
(4) Includes the Fund's share of the Portfolio's allocated expenses.
See notes to financial statements
11
Eaton Vance Floating-Rate Fund as of October 31, 2007
NOTES TO FINANCIAL STATEMENTS
1 Significant Accounting Policies
Eaton Vance Floating-Rate Fund (the Fund) is a diversified series of Eaton Vance Mutual Funds Trust (the Trust). The Trust is a Massachusetts business trust registered under the Investment Company Act of 1940, as amended (the 1940 Act), as an open-end management investment company. The Fund offers five classes of shares. The Advisers Class and Class I shares are generally sold at net asset value per share. Class A shares are generally sold subject to a sales charge imposed at time of purchase. Class B and Class C shares are sold at net asset value and are subject to a contingent deferred sales charge (see Note 5). Class B shares automatically convert to Class A shares eight years after their purchase as described in the Fund's prospectus. Each class represents a pro-rata interest in the Fund, but votes separately on class-specific matters and (as noted below) is subject to different expenses. Realized and unrealized gains and lo sses are allocated daily to each class of shares based on the relative net assets of each class to the total net assets of the Fund. Net investment income, other than class-specific expenses, is allocated daily to each class of shares based upon the ratio of the value of each class's paid shares to the total value of all paid shares. Each class of shares differs in its distribution plan and certain other class-specific expenses. The Fund invests all of its investable assets in interests in Floating Rate Portfolio (the Portfolio), a New York trust, having the same investment objective and policies as the Fund. The value of the Fund's investment in the Portfolio reflects the Fund's proportionate interest in the net assets of the Portfolio (approximately 65.1% at October 31, 2007). The performance of the Fund is directly affected by the performance of the Portfolio. The financial statements of the Portfolio, including the portfolio of investments, are included elsewhere in this report and should be read in conj unction with the Fund's financial statements.
The following is a summary of significant accounting policies of the Fund. The policies are in conformity with accounting principles generally accepted in the United States of America.
A Investment Valuation — Valuation of securities by the Portfolio is discussed in Note 1A of the Portfolio's Notes to Financial Statements, which are included elsewhere in this report.
B Income — The Fund's net investment income or loss consists of the Fund's pro-rata share of the net investment income or loss of the Portfolio, less all actual and accrued expenses of the Fund.
C Federal Taxes — The Fund's policy is to comply with the provisions of the Internal Revenue Code applicable to regulated investment companies and to distribute to shareholders each year substantially all of its net investment income, and all or substantially all of its net realized capital gains. Accordingly, no provision for federal income or excise tax is necessary. At October 31, 2007, the Fund, for federal income tax purposes, had a capital loss carryforward of $53,858,929, which will reduce the Fund's taxable income arising from future net realized gains on investment transactions, if any, to the extent permitted by Internal Revenue Code, and thus will reduce the amount of the distributions to s hareholders which would otherwise be necessary to relieve the Fund of any liability for federal income or excise tax. Such capital loss carryforward will expire on October 31, 2010 ($8,217,006), October 31, 2011 ($8,406,344), October 31, 2012 ($4,215,434), October 31, 2013 ($7,255,003), October 31, 2014 ($1,123,368) and October 31, 2015 ($24,641,774).
D Expenses — The majority of expenses of the Trust are directly identifiable to an individual fund. Expenses which are not readily identifiable to a specific fund are allocated taking into consideration, among other things, the nature and type of expense and the relative size of the funds.
E Expense Reduction — State Street Bank and Trust Company (SSBT) serves as custodian of the Fund. Pursuant to the custodian agreement, SSBT receives a fee reduced by credits, which are determined based on the average daily cash balance the Fund maintains with SSBT. All credit balances, if any, used to reduce the Fund's custodian fees are reported as a reduction of expenses in the Statement of Operations.
F Other — Investment transactions are accounted for on a trade date basis. Dividends to shareholders are recorded on the ex-dividend date.
G Use of Estimates — The preparation of the financial statements in conformity with accounting principles generally accepted in the United States of America requires management to make estimates and assumptions that affect the reported amounts of assets and liabilities at the date of the financial statements and the reported amounts of income and expense during the reporting period. Actual results could differ from those estimates.
12
Eaton Vance Floating-Rate Fund as of October 31, 2007
NOTES TO FINANCIAL STATEMENTS CONT'D
H Indemnifications — Under the Trust's organizational documents, its officers and Trustees may be indemnified against certain liabilities and expenses arising out of the performance of their duties to the Fund, and shareholders are indemnified against personal liability for obligations of the Trust. Additionally, in the normal course of business, the Fund enters into agreements with service providers that may contain indemnification clauses. The Fund's maximum exposure under these arrangements is unknown as this would involve future claims that may be made against the Fund that have not yet occurred.
I Redemption Fee — Upon the redemption or exchange of shares by Advisers Class, Class A and Class I shareholders within 90 days of the settlement of purchase, a fee of 1% of the current net asset value of these shares will be assessed and retained by the Fund for the benefit of the remaining shareholders. The redemption fee is accounted for as an addition to paid-in capital.
2 Distributions to Shareholders
The Fund declares dividends daily to shareholders of record at the time of declaration. Distributions are generally paid monthly. Distributions of realized capital gains, if any, are made at least annually. Distributions are declared separately for each class of shares. Shareholders may reinvest income and capital gain distributions in additional shares of the same class of the Fund at the net asset value as of the ex-dividend date or, at the election of the shareholder, receive distributions in cash. The Fund distinguishes between distributions on a tax basis and a financial reporting basis. Accounting principles generally accepted in the United States of America require that only distributions in excess of tax basis earnings and profits be reported in the financial statements as a return of capital. Permanent differences between book and tax accounting relating to distributions are reclassified to paid-in capital.
The tax character of distributions declared for the years ended October 31, 2007 and October 31, 2006 was as follows:
| | | Year Ended October 31, | |
| | | 2007 | | 2006 | |
| Distributions declared from: | |
| Ordinary income | | $ | 324,987,277 | | | $ | 277,021,651 | | |
During the year ended October 31, 2007, accumulated distributions in excess of net investment income was increased by $3,754,179, paid-in capital was decreased by $21,641,683, and accumulated net realized loss was decreased by $25,395,862 due to differences between book and tax accounting primarily for foreign currency gains and losses, swap contracts and mixed straddles. These reclassifications had no effect on the net assets or net asset value per share of the Fund.
As of October 31, 2007, the components of distributable earnings (accumulated losses) and unrealized appreciation (depreciation) on a tax basis were as follows:
| Undistributed ordinary income | | $ | 1,267,168 | | |
| Capital loss carryforward | | $ | (53,858,929 | ) | |
| Unrealized appreciation (depreciation) | | $ | (63,115,647 | ) | |
| Other temporary differences | | $ | (7,397,968 | ) | |
The differences between the components of distributable earnings (accumulated loss) on a tax basis and the amounts reflected in the Statement of Assets and Liabilities are primarily due to differences in book and tax policies for wash sales, partnership allocations and the timing of recognizing distributions to shareholders.
3 Transactions with Affiliates
The Fund is authorized to pay Eaton Vance Management (EVM), a fee as compensation for administrative services necessary to conduct the Fund's business. The fee is computed at the rate of 0.15% per annum of the Fund's average daily net assets. For the year ended October 31, 2007, the fee amounted to $7,565,641. The Portfolio has engaged Boston Management and Research (BMR), a subsidiary of EVM, to render investment advisory services. (See Note 2 of the Portfolio's Notes to Financial Statements which are included elsewhere in this report). EVM serves as the sub-transfer agent of the Fund and receives from the transfer agent an aggregate fee based upon the actual expenses incurred by EVM in the performance of these services. For the year ended October 31, 2007, EVM received $154,905 in sub- transfer agent fees. The Fund was informed that Eaton Vance Distributors, Inc. (EVD), the Fund's principal underwriter and a subsidiary of EVM, received $119,294 as its portion of the sales charge on sales of Class A shares for the year ended October 31, 2007. EVD also received distributions and service fees from the Fund (see Note 4) and contingent deferred sales charges (see Note 5).
Except for Trustees of the Fund and the Portfolio who are not members of EVM's or BMR's organization, officers and Trustees receive remuneration for their services to the Fund out of the investment advisory fee. Certain officers and Trustees of the Fund and of the Portfolio are officers of the above organizations.
13
Eaton Vance Floating-Rate Fund as of October 31, 2007
NOTES TO FINANCIAL STATEMENTS CONT'D
4 Distribution Plans
The Fund has in effect distribution plans for the Advisers Class shares (Advisers Plan) and Class A shares (Class A Plan) pursuant to Rule 12b-1under the 1940 Act. The Advisers Plan and Class A Plan provide that the Fund will pay EVD a distribution and service fee of 0.25% per annum of the Fund's average daily net assets attributable to Advisers Class and Class A shares for distribution services and facilities provided to the Fund by EVD, as well as for personal services and/or the maintenance of shareholder accounts. Distribution and service fees paid or accrued to EVD for the year ended October 31, 2007 for Advisers Class and Class A shares amounted to $2,970,939 and $4,696,934, respectively. The Fund also has in effect distribution plans for Class B shares (Class B Plan) and Class C shares (Class C Plan) pursuant to Rule 12b-1 under the 1940 Act. The Class B and Class C Plans require the Fund to pay EVD amounts equal to 0.75% per annum of the Fund's average daily net assets attributable to Class B and Class C shares for providing ongoing distribution services and facilities to the Fund. The Fund will automatically discontinue payments to EVD during any period in which there are no outstanding Uncovered Distribution Charges, which are equivalent to the sum of (i) 6.25% of the aggregate amount received by the Fund for the Class B and Class C shares sold, plus (ii) interest calculated by applying the rate of 1% over the prevailing prime rate to the outstanding balance of Uncovered Distribution Charges of EVD of each respective class, reduced by the aggregate amount of contingent deferred sales charges (see Note 5) and amounts theretofore paid or payable to EVD by each respective class. For the year ended October 31, 2007, the Fund paid or accrued to EVD $1,568,505 and $8,937,131 for Class B and Class C shares, respectively, representing 0.75% of the average daily net assets for Class B and Class C shares. At October 31, 2007, the a mounts of Uncovered Distribution Charges of EVD calculated under the Plans were approximately $11,082,000 and $151,207,000 for Class B and Class C shares, respectively.
The Class B and Class C Plans also authorize the Fund to make payments of service fees to EVD, investment dealers, and other persons in amounts not exceeding 0.25% per annum of the Fund's average daily net assets attributable to that class. Service fees paid or accrued are for personal services and/or the maintenance of shareholder accounts. They are separate and distinct from the sales commissions and distribution fees payable to EVD and, as such, are not subject to automatic discontinuance when there are no outstanding Uncovered Distribution Charges of EVD. Service fees paid or accrued for the year ended October 31, 2007 amounted to $522,835, and $2,979,044, for Class B and Class C shares, respectively.
5 Contingent Deferred Sales Charges
A contingent deferred sales charge (CDSC) generally is imposed on redemptions of Class B shares made within six years of purchase and on redemptions of Class C shares within one year of purchase. Class A shares may be subject to a 1% CDSC if redeemed within eighteen months of purchase (depending on the circumstances of purchase). Generally, the CDSC is based upon the lower of the net asset value at date of redemption or date of purchase. No charge is levied on shares acquired by reinvestment of dividends or capital gains distributions. The CDSC for Class B shares is imposed at declining rates that begin at 5% in the case of redemption in the first and second year, declining one percentage point each subsequent year. Class C shares are subject to a 1% CDSC if redeemed within one year of purchase. No CDSC is levied on shares which have been sold to EVM or its affiliates or to their respective employees or clients and may be waived under certain other limited conditions. CDSCs received on Class B and Class C redemptions are paid to EVD to reduce the amount of Uncovered Distribution Charges calculated under the Fund's Class B and Class C Plans. CDSCs received on Class B and Class C redemptions when no Uncovered Distribution Charges exist are credited to the Fund. For the year ended October 31, 2007 the Fund was informed that EVD received approximately $575,000, $509,000 and $431,000 of CDSCs paid by Class A, Class B and Class C shareholders, respectively.
6 Investment Transactions
Increases and decreases in the Fund's investment in the Portfolio aggregated $2,444,704,222 and $3,174,487,044, respectively, for the year ended October 31, 2007.
7 Shares of Beneficial Interest
The Fund's Declaration of Trust permits the Trustees to issue an unlimited number of full and fractional shares of beneficial interest (without par value). Such shares may be issued in a number of different series (such as the Fund) and classes. Transactions in Fund shares were as follows:
| | | Year Ended October 31, | |
| Advisers | | 2007 | | 2006 | |
| Sales | | | 65,096,692 | | | | 81,237,285 | | |
Issued to shareholders electing to receive
payments of distributions in Fund shares | | | 5,584,266 | | | | 4,894,076 | | |
| Redemptions | | | (95,074,436 | ) | | | (63,738,296 | ) | |
| Net increase (decrease) | | | (24,393,478 | ) | | | 22,393,065 | | |
14
Eaton Vance Floating-Rate Fund as of October 31, 2007
NOTES TO FINANCIAL STATEMENTS CONT'D
| | | Year Ended October 31, | |
| Class A | | 2007 | | 2006 | |
| Sales | | | 96,135,148 | | | | 99,686,666 | | |
Issued to shareholders electing to receive
payments of distributions in Fund shares | | | 8,633,604 | | | | 7,244,918 | | |
| Redemptions | | | (123,531,866 | ) | | | (75,822,964 | ) | |
| Exchange from Class B shares | | | 1,284,530 | | | | 685,169 | | |
| Net increase (decrease) | | | (17,478,584 | ) | | | 31,793,789 | | |
| | | Year Ended October 31, | |
| Class B | | 2007 | | 2006 | |
| Sales | | | 1,939,667 | | | | 2,462,298 | | |
Issued to shareholders electing to receive
payments of distributions in Fund shares | | | 814,090 | | | | 845,007 | | |
| Redemptions | | | (6,343,329 | ) | | | (5,954,887 | ) | |
| Exchange to Class A shares | | | (1,326,892 | ) | | | (708,211 | ) | |
| Net decrease | | | (4,916,464 | ) | | | (3,355,793 | ) | |
| | | Year Ended October 31, | |
| Class C | | 2007 | | 2006 | |
| Sales | | | 36,772,421 | | | | 33,190,416 | | |
Issued to shareholders electing to receive
payments of distributions in Fund shares | | | 4,652,826 | | | | 4,001,360 | | |
| Redemptions | | | (41,242,090 | ) | | | (41,880,646 | ) | |
| Net increase (decrease) | | | 183,157 | | | | (4,688,870 | ) | |
| | | Year Ended October 31, | |
| Class I | | 2007 | | 2006 | |
| Sales | | | 44,817,688 | | | | 23,724,123 | | |
Issued to shareholders electing to receive
payments of distributions in Fund shares | | | 2,866,699 | | | | 1,894,462 | | |
| Redemptions | | | (41,518,916 | ) | | | (13,946,763 | ) | |
| Net increase | | | 6,165,471 | | | | 11,671,822 | | |
Redemptions or exchanges of Advisers Class, Class A and Class I shares made within 90 days of purchase are subject to a redemption fee equal to 1.00% of the amount redeemed. For the year ended October 31, 2007 the Fund received $339,031 in redemption fees.
8 Recently Issued Accounting Pronouncements
In June 2006, the Financial Accounting Standards Board (FASB) issued FASB Interpretation No. 48 (FIN 48), "Accounting for Uncertainty in Income Taxes – an interpretation of FASB Statement No. 109". FIN 48 clarifies the accounting for uncertainty in income taxes recognized in accordance with FASB Statement No. 109, "Accounting for Income Taxes". This interpretation prescribes a recognition threshold and measurement attribute for the financial statement recognition and measurement of a tax position taken or expected to be taken in a tax return. It also provides guidance on de-recognition, classification, interest and penalties, accounting in interim periods, disclosure and transition. FIN 48 is effective on the last business day of the first required financial reporting period for fiscal years beginning after December 15, 2006. Management is currently eva luating the impact of applying the various provisions of FIN 48.
In September 2006, the FASB issued Statement of Financial Accounting Standards No. 157 (FAS 157), "Fair Value Measurements". FAS 157 defines fair value, establishes a framework for measuring fair value in accordance with generally accepted accounting principles and expands disclosure about fair value measurements. FAS 157 is effective for fiscal years beginning after November 15, 2007. Management is currently evaluating the impact the adoption of FAS 157 will have on the Fund's financial statement disclosures.
15
Eaton Vance Floating-Rate Fund as of October 31, 2007
REPORT OF INDEPENDENT REGISTERED PUBLIC ACCOUNTING FIRM
To the Trustees and Shareholders
of Eaton Vance Floating Rate Fund:
We have audited the accompanying statement of assets and liabilities of Eaton Vance Floating-Rate Fund (the Fund) as of October 31, 2007, the related statement of operations for the year then ended, the statements of changes in net assets for each of the two years in the period then ended, and the financial highlights for each of the five years in the period then ended. These financial statements and financial highlights are the responsibility of the Fund's management. Our responsibility is to express an opinion on these financial statements and financial highlights based on our audits.
We conducted our audits in accordance with the standards of the Public Company Accounting Oversight Board (United States). Those standards require that we plan and perform the audit to obtain reasonable assurance about whether the financial statements and financial highlights are free of material misstatement. The Fund is not required to have, nor were we engaged to perform, an audit of its internal control over financial reporting. Our audits included consideration of internal control over financial reporting as a basis for designing audit procedures that are appropriate in the circumstances, but not for the purpose of expressing an opinion on the effectiveness of the Fund's internal control over financial reporting. Accordingly, we express no such opinion. An audit also includes examining, on a test basis, evidence supporting the amounts and disclosures in the financial statements, assessing the accounting principles used and significant estimates made by management, as well as evaluating the overall financial statement presentation. We believe that our audits provide a reasonable basis for our opinion.
In our opinion, such financial statements and financial highlights referred to above present fairly, in all material respects, the financial position of the Eaton Vance Floating-Rate Fund as of October 31, 2007, the results of its operations for the year then ended, the changes in its net assets for each of the two years in the period then ended, and the financial highlights for each of the five years in the period then ended, in conformity with accounting principles generally accepted in the United States of America.
DELOITTE & TOUCHE LLP
Boston, Massachusetts
December 20, 2007
16
Eaton Vance Floating-Rate Fund as of October 31, 2007
FEDERAL TAX INFORMATION (Unaudited)
The Form 1099-DIV you receive in January 2008 will show the tax status of all distributions paid to your account in calendar 2007. Shareholders are advised to consult their own tax adviser with respect to the tax consequences of their investment in the Fund.
17
Floating Rate Portfolio as of October 31, 2007
PORTFOLIO OF INVESTMENTS
| Senior Floating-Rate Interests — 100.5%(1) | | | |
Principal
Amount* | |
Borrower/Tranche Description | |
Value | |
| Aerospace and Defense — 1.9% | | | |
| AWAS Capital, Inc. | | | |
| $ | 14,886,848 | | | Term Loan, 7.00%, Maturing March 22, 2013 | | $ | 14,179,722 | | |
| CACI International, Inc. | | | |
| | 8,082,151 | | | Term Loan, 6.79%, Maturing May 3, 2011 | | | 7,991,227 | | |
| DAE Aviation Holdings, Inc. | | | |
| | 669,056 | | | Term Loan, 7.80%, Maturing July 31, 2009 | | | 668,638 | | |
| | 757,467 | | | Term Loan, 8.93%, Maturing July 31, 2014 | | | 757,941 | | |
| | 573,477 | | | Term Loan, 8.93%, Maturing July 31, 2014 | | | 573,835 | | |
| Evergreen International Aviation | | | |
| | 7,951,619 | | | Term Loan, 8.30%, Maturing October 31, 2011 | | | 7,752,828 | | |
| Forgings International Holding | | | |
| | 1,448,068 | | | Term Loan, 7.97%, Maturing August 11, 2014 | | | 1,431,777 | | |
| GBP | 643,892 | | | Term Loan, 9.14%, Maturing August 11, 2014 | | | 1,320,312 | | |
| | 1,634,051 | | | Term Loan, 8.22%, Maturing August 11, 2015 | | | 1,623,838 | | |
| GBP | 695,408 | | | Term Loan, 9.39%, Maturing August 11, 2015 | | | 1,433,169 | | |
| Hawker Beechcraft Acquisition | | | |
| | 1,448,094 | | | Term Loan, 7.20%, Maturing March 26, 2014 | | | 1,419,245 | | |
| | 17,028,263 | | | Term Loan, 7.17%, Maturing March 26, 2014 | | | 16,689,026 | | |
| Hexcel Corp. | | | |
| | 6,706,579 | | | Term Loan, 7.03%, Maturing March 1, 2012 | | | 6,572,448 | | |
| IAP Worldwide Services, Inc. | | | |
| | 7,323,864 | | | Term Loan, 11.50%, Maturing December 30, 2012 | | | 6,657,393 | | |
| Jet Aviation Holding, AG | | | |
| | 4,106,776 | | | Term Loan, 5.77%, Maturing May 15, 2013 | | | 3,901,437 | | |
| PGS Solutions, Inc. | | | |
| | 1,990,000 | | | Term Loan, 7.62%, Maturing February 14, 2013 | | | 1,937,763 | | |
| Spirit AeroSystems, Inc. | | | |
| | 7,024,219 | | | Term Loan, 6.90%, Maturing December 31, 2011 | | | 6,971,537 | | |
| TransDigm, Inc. | | | |
| | 17,650,000 | | | Term Loan, 7.20%, Maturing June 23, 2013 | | | 17,401,806 | | |
| Vought Aircraft Industries, Inc. | | | |
| | 10,000,000 | | | Revolving Loan, 0.00%, Maturing February 22, 2010(2) | | | 9,400,000 | | |
| | 8,958,453 | | | Term Loan, 7.34%, Maturing February 22, 2011 | | | 8,880,067 | | |
| | 4,000,000 | | | Term Loan, 7.62%, Maturing February 22, 2010 | | | 3,964,168 | | |
| Wyle Laboratories, Inc. | | | |
| | 3,951,569 | | | Term Loan, 8.11%, Maturing January 28, 2011 | | | 3,892,296 | | |
| | 995,000 | | | Term Loan, 8.13%, Maturing January 28, 2011 | | | 980,075 | | |
| | | | | | | $ | 126,400,548 | | |
Principal
Amount* | |
Borrower/Tranche Description | |
Value | |
| Air Transport — 0.6% | | | |
| Airport Development and Investment, Ltd. | | | |
| GBP | 8,874,630 | | | Term Loan, 10.28%, Maturing April 7, 2011 | | $ | 17,958,504 | | |
| Delta Air Lines, Inc. | | | |
| | 8,600,000 | | | Term loan, 6.87%, Maturing April 30, 2012 | | | 8,419,400 | | |
| Northwest Airlines, Inc. | | | |
| | 17,820,000 | | | DIP Loan, 7.03%, Maturing August 21, 2008 | | | 17,188,869 | | |
| | | | | | | $ | 43,566,773 | | |
| Automotive — 3.8% | | | |
| Accuride Corp. | | | |
| $ | 11,954,274 | | | Term Loan, 7.13%, Maturing January 31, 2012 | | $ | 11,730,131 | | |
| Adesa, Inc. | | | |
| | 31,421,250 | | | Term Loan, 7.45%, Maturing October 18, 2013 | | | 30,453,350 | | |
| Affina Group, Inc. | | | |
| | 5,135,471 | | | Term Loan, 7.96%, Maturing November 30, 2011 | | | 5,132,261 | | |
| Allison Transmission, Inc. | | | |
| | 10,000,000 | | | Term Loan, 8.17%, Maturing September 30, 2014 | | | 9,770,830 | | |
| CSA Acquisition Corp. | | | |
| | 2,766,402 | | | Term Loan, 7.75%, Maturing December 23, 2011 | | | 2,732,397 | | |
| | 5,032,969 | | | Term Loan, 7.75%, Maturing December 23, 2011 | | | 4,971,104 | | |
| | 3,684,375 | | | Term Loan, 7.75%, Maturing December 23, 2012 | | | 3,665,953 | | |
| Dana Corp. | | | |
| | 13,750,000 | | | Term Loan, 7.98%, Maturing March 30, 2008 | | | 13,691,067 | | |
| Dayco Products, LLC | | | |
| | 10,233,316 | | | Term Loan, 7.76%, Maturing June 21, 2011 | | | 9,916,728 | | |
| Federal-Mogul Corp. | | | |
| | 4,982,950 | | | Revolving Loan, 6.28%, Maturing December 31, 2007(2) | | | 4,916,926 | | |
| | 16,350,000 | | | DIP Loan, 6.65%, Maturing December 31, 2007 | | | 16,289,096 | | |
| | 4,108,827 | | | Term Loan, 7.00%, Maturing December 31, 2007 | | | 4,051,476 | | |
| | 3,000,000 | | | Term Loan, 7.59%, Maturing December 31, 2007 | | | 2,956,875 | | |
| Financiere Truck (Investissement) | | | |
| EUR | 4,841,388 | | | Term Loan, 6.16%, Maturing February 15, 2012 | | | 6,872,949 | | |
| Ford Motor Co. | | | |
| | 10,000,000 | | | Revolving Loan, 0.00%, Maturing December 15, 2013(2) | | | 9,155,360 | | |
| | 9,106,063 | | | Term Loan, 8.70%, Maturing December 15, 2013 | | | 8,783,207 | | |
| Fraikin, Ltd. | | | |
| GBP | 1,612,016 | | | Term Loan, 8.03%, Maturing February 15, 2012(2) | | | 3,281,746 | | |
| GBP | 1,392,962 | | | Term Loan, 8.03%, Maturing February 15, 2012(2) | | | 2,835,796 | | |
| General Motors Corp. | | | |
| | 16,537,562 | | | Term Loan, 7.62%, Maturing November 29, 2013 | | | 16,256,424 | | |
| Goodyear Tire & Rubber Co. | | | |
| | 20,275,000 | | | Term Loan, 6.43%, Maturing April 30, 2010 | | | 19,746,998 | | |
See notes to financial statements
18
Floating Rate Portfolio as of October 31, 2007
PORTFOLIO OF INVESTMENTS CONT'D
Principal
Amount* | |
Borrower/Tranche Description | |
Value | |
| Automotive (continued) | | | |
| HLI Operating Co., Inc. | | | |
| EUR | 7,374,545 | | | Term Loan, 6.87%, Maturing May 30, 2014 | | $ | 10,335,714 | | |
| EUR | 425,455 | | | Term Loan, 7.16%, Maturing May 30, 2014 | | | 603,216 | | |
| Keystone Automotive Operations, Inc. | | | |
| | 7,195,625 | | | Term Loan, 8.65%, Maturing January 12, 2012 | | | 6,733,903 | | |
| LKQ Corp. | | | |
| | 7,275,000 | | | Term Loan, 7.36%, Maturing October 12, 2013 | | | 7,256,812 | | |
| Locafroid Services S.A.S. | | | |
| EUR | 1,666,405 | | | Term Loan, 6.48%, Maturing February 15, 2012(2) | | | 2,365,668 | | |
| Speedy 1, Ltd. | | | |
| EUR | 6,457,254 | | | Term Loan, 6.98%, Maturing August 31, 2013 | | | 8,968,352 | | |
| Tenneco Automotive, Inc. | | | |
| | 6,550,000 | | | Term Loan, 6.62%, Maturing March 17, 2014 | | | 6,451,750 | | |
| TriMas Corp. | | | |
| | 1,893,750 | | | Term Loan, 6.79%, Maturing August 2, 2011 | | | 1,862,977 | | |
| | 8,124,188 | | | Term Loan, 7.23%, Maturing August 2, 2013 | | | 7,992,169 | | |
| TRW Automotive, Inc. | | | |
| | 11,745,563 | | | Term Loan, 6.78%, Maturing February 2, 2014 | | | 11,646,465 | | |
| United Components, Inc. | | | |
| | 9,954,545 | | | Term Loan, 7.38%, Maturing June 30, 2012 | | | 9,767,898 | | |
| | | | | | | $ | 261,195,598 | | |
| Beverage and Tobacco — 0.6% | | | |
| Constellation Brands, Inc. | | | |
| $ | 10,620,000 | | | Term Loan, 6.69%, Maturing June 5, 2013 | | $ | 10,485,041 | | |
| Culligan International Co. | | | |
| | 18,453,750 | | | Term Loan, 7.28%, Maturing November 24, 2014 | | | 17,300,391 | | |
| Southern Wine & Spirits of America, Inc. | | | |
| | 11,509,636 | | | Term Loan, 6.70%, Maturing May 31, 2012 | | | 11,488,055 | | |
| Van Houtte, Inc. | | | |
| | 2,633,400 | | | Term Loan, 7.70%, Maturing July 11, 2014 | | | 2,577,440 | | |
| | 359,100 | | | Term Loan, 7.70%, Maturing July 11, 2014 | | | 351,469 | | |
| | | | | | | $ | 42,202,396 | | |
| Brokers, Dealers and Investment Houses — 0.2% | | | |
| AmeriTrade Holding Corp. | | | |
| $ | 16,578,057 | | | Term Loan, 6.25%, Maturing December 31, 2012 | | $ | 16,410,552 | | |
| | | | | | | $ | 16,410,552 | | |
| Building and Development — 5.1% | | | |
| 401 North Wabash Venture, LLC | | | |
| $ | 9,498,461 | | | Term Loan, 8.53%, Maturing May 7, 2008(2) | | $ | 9,071,030 | | |
| AIMCO Properties, L.P. | | | |
| | 19,718,750 | | | Term Loan, 6.39%, Maturing March 23, 2011 | | | 19,435,293 | | |
Principal
Amount* | |
Borrower/Tranche Description | |
Value | |
| Building and Development (continued) | | | |
| Beacon Sales Acquisition, Inc. | | | |
| $ | 5,519,250 | | | Term Loan, 7.16%, Maturing September 30, 2013 | | $ | 5,298,480 | | |
| Brickman Group Holdings, Inc. | | | |
| | 4,977,494 | | | Term Loan, 7.14%, Maturing January 23, 2014 | | | 4,840,613 | | |
| Building Materials Corp. of America | | | |
| | 11,761,347 | | | Term Loan, 7.94%, Maturing February 22, 2014 | | | 10,740,627 | | |
| Capital Automotive REIT | | | |
| | 10,788,753 | | | Term Loan, 6.88%, Maturing December 15, 2010 | | | 10,675,957 | | |
| Contech Construction Products | | | |
| | 5,898,333 | | | Term Loan, 7.03%, Maturing January 13, 2013 | | | 5,780,367 | | |
| Epco/Fantome, LLC | | | |
| | 10,320,000 | | | Term Loan, 7.59%, Maturing November 23, 2010 | | | 10,345,800 | | |
| Financiere Daunou S.A. | | | |
| EUR | 1,067,260 | | | Term Loan, 6.43%, Maturing May 31, 2015 | | | 1,418,604 | | |
| EUR | 2,613,290 | | | Term Loan, 6.43%, Maturing May 31, 2015 | | | 3,473,590 | | |
| | 1,664,521 | | | Term Loan, 7.50%, Maturing May 31, 2015 | | | 1,521,650 | | |
| EUR | 1,246,799 | | | Term Loan, 6.68%, Maturing February 28, 2016 | | | 1,664,978 | | |
| EUR | 2,423,776 | | | Term Loan, 6.68%, Maturing February 28, 2016 | | | 3,236,716 | | |
| | 2,452,266 | | | Term Loan, 7.75%, Maturing February 28, 2016 | | | 2,254,042 | | |
| General Growth Properties, Inc. | | | |
| | 10,782,895 | | | Term Loan, 6.38%, Maturing February 24, 2011 | | | 10,636,700 | | |
| Hearthstone Housing Partners II, LLC | | | |
| | 21,176,471 | | | Revolving Loan, 6.79%, Maturing December 1, 2007(2) | | | 20,647,059 | | |
| Hovstone Holdings, LLC | | | |
| | 6,358,254 | | | Term Loan, 7.63%, Maturing February 28, 2009 | | | 5,786,012 | | |
| LNR Property Corp. | | | |
| | 22,175,000 | | | Term Loan, 8.11%, Maturing July 12, 2011 | | | 21,676,062 | | |
| Mueller Water Products, Inc. | | | |
| | 8,946,117 | | | Term Loan, 6.69%, Maturing May 24, 2014 | | | 8,821,712 | | |
| NCI Building Systems, Inc. | | | |
| | 6,417,430 | | | Term Loan, 6.88%, Maturing June 18, 2010 | | | 6,297,103 | | |
| Nortek, Inc. | | | |
| | 20,893,788 | | | Term Loan, 7.05%, Maturing August 27, 2011 | | | 20,475,912 | | |
| November 2005 Land Investors | | | |
| | 793,294 | | | Term Loan, 7.57%, Maturing May 9, 2011 | | | 713,965 | | |
| Panolam Industries Holdings, Inc. | | | |
| | 4,194,448 | | | Term Loan, 7.95%, Maturing September 30, 2012 | | | 4,026,670 | | |
| PLY GEM Industries, Inc. | | | |
| | 15,466,451 | | | Term Loan, 7.95%, Maturing August 15, 2011 | | | 14,561,664 | | |
| | 577,895 | | | Term Loan, 7.95%, Maturing August 15, 2011 | | | 544,088 | | |
| Re/Max International, Inc. | | | |
| | 966,667 | | | Term Loan, Maturing January 23, 2008(3) | | | 957,000 | | |
| | 1,033,333 | | | Term Loan, Maturing January 23, 2008(3) | | | 1,023,000 | | |
| Realogy Corp. | | | |
| | 6,224,502 | | | Term Loan, Maturing September 1, 2014(3) | | | 5,801,236 | | |
| | 23,061,778 | | | Term Loan, Maturing September 1, 2014(3) | | | 21,493,577 | | |
See notes to financial statements
19
Floating Rate Portfolio as of October 31, 2007
PORTFOLIO OF INVESTMENTS CONT'D
Principal
Amount* | |
Borrower/Tranche Description | |
Value | |
| Building and Development (continued) | | | |
| Shea Capital I, LLC | | | |
| $ | 1,608,750 | | | Term Loan, 7.20%, Maturing October 27, 2011 | | $ | 1,379,503 | | |
| South Edge, LLC | | | |
| | 8,794,643 | | | Term Loan, 6.81%, Maturing October 31, 2009 | | | 7,915,179 | | |
| Standard Pacific Corp. | | | |
| | 4,680,000 | | | Term Loan, 7.27%, Maturing May 5, 2013 | | | 3,954,600 | | |
| Stile Acquisition Corp. | | | |
| | 6,433,878 | | | Term Loan, 7.12%, Maturing April 6, 2013 | | | 6,060,835 | | |
| Stile U.S. Acquisition Corp. | | | |
| | 6,441,517 | | | Term Loan, 7.12%, Maturing April 6, 2013 | | | 6,068,031 | | |
| Tousa/Kolter, LLC | | | |
| | 7,908,533 | | | Term Loan, 8.46%, Maturing January 7, 2008 | | | 7,888,762 | | |
| TRU 2005 RE Holding Co. | | | |
| | 32,825,000 | | | Term Loan, 8.13%, Maturing December 9, 2008 | | | 32,524,093 | | |
| United Subcontractors, Inc. | | | |
| | 5,925,000 | | | Term Loan, 12.36%, Maturing June 27, 2013 | | | 4,917,750 | | |
| WCI Communities, Inc. | | | |
| | 23,296,875 | | | Term Loan, 8.62%, Maturing December 23, 2010 | | | 22,399,945 | | |
| Wintergames Acquisition ULC | | | |
| | 22,303,561 | | | Term Loan, 8.13%, Maturing April 24, 2008 | | | 22,136,285 | | |
| | | | | | | $ | 348,464,490 | | |
| Business Equipment and Services — 6.3% | | | |
| ACCO Brands Corp. | | | |
| $ | 6,689,748 | | | Term Loan, 7.18%, Maturing August 17, 2012 | | $ | 6,597,764 | | |
| Activant Solutions, Inc. | | | |
| | 6,375,933 | | | Term Loan, 7.38%, Maturing May 1, 2013 | | | 6,108,941 | | |
| Acxiom Corp. | | | |
| | 11,693,182 | | | Term Loan, 6.80%, Maturing September 15, 2012 | | | 11,590,867 | | |
| Affiliated Computer Services | | | |
| | 5,993,250 | | | Term Loan, 6.82%, Maturing March 20, 2013 | | | 5,929,572 | | |
| | 16,935,625 | | | Term Loan, 6.96%, Maturing March 20, 2013 | | | 16,755,684 | | |
| Affinion Group, Inc. | | | |
| | 14,642,732 | | | Term Loan, 7.98%, Maturing October 17, 2012 | | | 14,539,018 | | |
| Allied Security Holdings, LLC | | | |
| | 9,877,273 | | | Term Loan, 8.20%, Maturing June 30, 2010 | | | 9,840,233 | | |
| Buhrmann US, Inc. | | | |
| EUR | 979,747 | | | Term Loan, 5.91%, Maturing December 23, 2010 | | | 1,389,100 | | |
| | 10,668,135 | | | Term Loan, 7.30%, Maturing December 31, 2010 | | | 10,561,454 | | |
| Cellnet Group, Inc. | | | |
| | 1,999,413 | | | Term Loan, 7.20%, Maturing July 22, 2011 | | | 1,945,055 | | |
| DynCorp International, LLC | | | |
| | 7,118,824 | | | Term Loan, 7.25%, Maturing February 11, 2011 | | | 6,887,462 | | |
| Education Management, LLC | | | |
| | 14,548,092 | | | Term Loan, 7.00%, Maturing June 1, 2013 | | | 14,148,019 | | |
Principal
Amount* | |
Borrower/Tranche Description | |
Value | |
| Business Equipment and Services (continued) | | | |
| Info USA, Inc. | | | |
| $ | 1,985,000 | | | Term Loan, 7.20%, Maturing February 14, 2012 | | $ | 1,955,225 | | |
| | 4,372,459 | | | Term Loan, 7.20%, Maturing February 14, 2012 | | | 4,306,872 | | |
| Information Resources, Inc. | | | |
| | 6,483,170 | | | Term Loan, 7.16%, Maturing May 7, 2014 | | | 6,296,779 | | |
| Intergraph Corp. | | | |
| | 3,349,524 | | | Term Loan, 7.45%, Maturing May 29, 2014 | | | 3,286,720 | | |
| iPayment, Inc. | | | |
| | 12,897,014 | | | Term Loan, 7.04%, Maturing May 10, 2013 | | | 12,316,649 | | |
| Iron Mountain, Inc. | | | |
| | 14,955,000 | | | Term Loan, 7.06%, Maturing April 16, 2014 | | | 14,940,987 | | |
| ista International GmbH | | | |
| EUR | 9,635,715 | | | Term Loan, 6.34%, Maturing May 14, 2015 | | | 13,268,345 | | |
| EUR | 1,914,285 | | | Term Loan, 6.34%, Maturing May 14, 2015 | | | 2,635,963 | | |
| Kronos, Inc. | | | |
| | 9,950,063 | | | Term Loan, 7.45%, Maturing June 11, 2014 | | | 9,645,342 | | |
| Language Line, Inc. | | | |
| | 10,360,194 | | | Term Loan, 8.42%, Maturing June 10, 2011 | | | 10,122,769 | | |
| N.E.W. Holdings I, LLC | | | |
| | 10,531,466 | | | Term Loan, 7.77%, Maturing May 22, 2014 | | | 9,975,278 | | |
| Protection One, Inc. | | | |
| | 10,317,762 | | | Term Loan, 7.39%, Maturing March 31, 2012 | | | 10,124,304 | | |
| Quantum Corp. | | | |
| | 3,728,750 | | | Term Loan, 8.70%, Maturing July 12, 2014 | | | 3,700,784 | | |
| Quintiles Transnational Corp. | | | |
| | 16,252,546 | | | Term Loan, 7.20%, Maturing March 31, 2013 | | | 15,973,213 | | |
| Sabre, Inc. | | | |
| | 29,769,734 | | | Term Loan, 6.96%, Maturing September 30, 2014 | | | 28,342,662 | | |
| Safente, Inc. | | | |
| | 3,990,000 | | | Term Loan, 7.75%, Maturing April 12, 2014 | | | 3,810,450 | | |
| Serena Software, Inc. | | | |
| | 3,795,000 | | | Term Loan, 7.18%, Maturing March 10, 2013 | | | 3,674,824 | | |
| Sitel (Client Logic) | | | |
| EUR | 1,946,407 | | | Term Loan, Maturing January 29, 2014(3) | | | 2,618,846 | | |
| | 5,201,404 | | | Term Loan, 7.30%, Maturing January 29, 2014 | | | 4,954,337 | | |
| Solera Holdings, LLC | | | |
| EUR | 3,208,875 | | | Term Loan, 6.75%, Maturing May 15, 2014 | | | 4,526,379 | | |
| Solera Nederland Holdings | | | |
| | 3,980,000 | | | Term Loan, 7.69%, Maturing May 15, 2014 | | | 3,920,300 | | |
| SunGard Data Systems, Inc. | | | |
| | 75,918,770 | | | Term Loan, 7.36%, Maturing February 11, 2013 | | | 75,056,029 | | |
| TDS Investor Corp. | | | |
| EUR | 2,105,820 | | | Term Loan, 6.98%, Maturing August 23, 2013 | | | 2,989,471 | | |
| | 12,871,734 | | | Term Loan, 7.45%, Maturing August 23, 2013 | | | 12,638,434 | | |
| | 10,972,500 | | | Term Loan, 7.45%, Maturing August 23, 2013 | | | 10,771,912 | | |
| | 2,582,721 | | | Term Loan, 7.45%, Maturing August 23, 2013 | | | 2,535,909 | | |
See notes to financial statements
20
Floating Rate Portfolio as of October 31, 2007
PORTFOLIO OF INVESTMENTS CONT'D
Principal
Amount* | |
Borrower/Tranche Description | |
Value | |
| Business Equipment and Services (continued) | | | |
| Transaction Network Services, Inc. | | | |
| $ | 5,648,739 | | | Term Loan, 7.48%, Maturing May 4, 2012 | | $ | 5,564,007 | | |
| Valassis Communications, Inc. | | | |
| | 1,302,069 | | | Term Loan, 0.00%, Maturing March 2, 2014(2) | | | 1,241,034 | | |
| | 5,735,857 | | | Term Loan, 6.95%, Maturing March 2, 2014 | | | 5,466,989 | | |
| VWR International, Inc. | | | |
| | 12,850,000 | | | Term Loan, 7.70%, Maturing June 29, 2014 | | | 12,436,397 | | |
| WAM Acquisition, S.A. | | | |
| EUR | 1,414,189 | | | Term Loan, Maturing May 4, 2014(3) | | | 1,993,783 | | |
| EUR | 885,811 | | | Term Loan, Maturing May 4, 2014(3) | | | 1,248,853 | | |
| EUR | 1,414,189 | | | Term Loan, Maturing May 4, 2015(3) | | | 2,003,082 | | |
| EUR | 885,811 | | | Term Loan, Maturing May 4, 2015(3) | | | 1,254,678 | | |
| West Corp. | | | |
| | 19,493,233 | | | Term Loan, 7.27%, Maturing October 24, 2013 | | | 19,148,047 | | |
| | 2,481,250 | | | Term Loan, 5.44%, Maturing October 24, 2013 | | | 2,437,312 | | |
| | | | | | | $ | 433,476,134 | | |
| Cable and Satellite Television — 7.1% | | | |
| Atlantic Broadband Finance, LLC | | | |
| $ | 13,978,491 | | | Term Loan, 7.45%, Maturing September 1, 2011 | | $ | 13,809,589 | | |
| Bragg Communications, Inc. | | | |
| | 2,125,000 | | | Term Loan, 8.06%, Maturing August 13, 2014 | | | 2,128,984 | | |
| Bresnan Broadband Holdings, LLC | | | |
| | 3,500,000 | | | Term Loan, 7.18%, Maturing March 29, 2014 | | | 3,420,000 | | |
| | 18,551,500 | | | Term Loan, 7.42%, Maturing March 29, 2014 | | | 18,127,468 | | |
| Cequel Communications, LLC | | | |
| | 37,347,250 | | | Term Loan, 7.27%, Maturing November 5, 2013 | | | 36,245,506 | | |
| Charter Communications Operating, Inc. | | | |
| | 77,463,117 | | | Term Loan, 6.99%, Maturing April 28, 2013 | | | 74,571,186 | | |
| CSC Holdings, Inc. | | | |
| | 3,331,731 | | | Term Loan, 6.38%, Maturing March 29, 2012 | | | 3,248,437 | | |
| | 24,116,452 | | | Term Loan, 6.88%, Maturing March 29, 2013 | | | 23,595,947 | | |
| DirecTV Holdings, LLC | | | |
| | 7,421,087 | | | Term Loan, 6.25%, Maturing April 13, 2013 | | | 7,386,045 | | |
| Insight Midwest Holdings, LLC | | | |
| | 45,950,000 | | | Term Loan, 7.00%, Maturing April 6, 2014 | | | 45,066,106 | | |
| Kabel BW GmbH & Co. KG | | | |
| EUR | 1,666,667 | | | Term Loan, 6.41%, Maturing June 9, 2012 | | | 2,306,763 | | |
| Kabel Deutschland GmbH | | | |
| EUR | 15,600,000 | | | Term Loan, 6.48%, Maturing March 31, 2012 | | | 21,993,783 | | |
| MCC Iowa, LLC | | | |
| | 1,603,250 | | | Term Loan, 6.72%, Maturing March 31, 2010 | | | 1,540,723 | | |
| Mediacom Broadband Group | | | |
| | 14,356,391 | | | Term Loan, 6.61%, Maturing January 31, 2015 | | | 13,943,645 | | |
| | 7,940,000 | | | Term Loan, 6.61%, Maturing January 31, 2015 | | | 7,711,725 | | |
Principal
Amount* | |
Borrower/Tranche Description | |
Value | |
| Cable and Satellite Television (continued) | | | |
| Mediacom Illinois, LLC | | | |
| $ | 2,000,000 | | | Term Loan, 6.69%, Maturing September 30, 2012 | | $ | 1,927,858 | | |
| | 18,474,767 | | | Term Loan, 6.61%, Maturing January 31, 2015 | | | 17,969,593 | | |
| NTL Investment Holdings, Ltd. | | | |
| | 9,000,000 | | | Term Loan, 7.22%, Maturing March 30, 2012 | | | 8,755,317 | | |
| GBP | 2,000,000 | | | Term Loan, 7.96%, Maturing March 30, 2012 | | | 4,009,472 | | |
| GBP | 4,095,825 | | | Term Loan, 8.28%, Maturing March 30, 2012 | | | 8,260,568 | | |
| GBP | 3,504,175 | | | Term Loan, 8.28%, Maturing March 30, 2012 | | | 7,067,313 | | |
| GBP | 4,408,427 | | | Term Loan, 8.29%, Maturing March 30, 2012 | | | 8,891,032 | | |
| GBP | 2,241,573 | | | Term Loan, 8.29%, Maturing March 30, 2012 | | | 4,520,864 | | |
| GBP | 3,500,000 | | | Term Loan, 8.90%, Maturing March 30, 2013 | | | 7,098,045 | | |
| Orion Cable GmbH | | | |
| EUR | 5,000,000 | | | Term Loan, Maturing October 31, 2014(3) | | | 7,140,312 | | |
| EUR | 5,000,000 | | | Term Loan, Maturing October 31, 2015(3) | | | 7,176,480 | | |
| ProSiebenSat.1 Media AG | | | |
| EUR | 2,998,397 | | | Term Loan, 6.19%, Maturing March 2, 2015(2) | | | 4,080,366 | | |
| EUR | 600,197 | | | Term Loan, 6.55%, Maturing June 26, 2015 | | | 835,704 | | |
| EUR | 12,586,345 | | | Term Loan, 6.55%, Maturing June 26, 2015 | | | 17,525,025 | | |
| EUR | 2,998,397 | | | Term Loan, 6.40%, Maturing March 2, 2016(2) | | | 4,093,380 | | |
| UPC Broadband Holding B.V. | | | |
| EUR | 27,500,000 | | | Term Loan, 6.30%, Maturing December 31, 2014 | | | 38,594,324 | | |
| EUR | 6,617,448 | | | Term Loan, 6.76%, Maturing December 31, 2014 | | | 9,285,382 | | |
| | 14,925,000 | | | Term Loan, 7.13%, Maturing December 31, 2014 | | | 14,465,594 | | |
| YPSO Holding SA | | | |
| EUR | 14,884,112 | | | Term Loan, 6.68%, Maturing July 28, 2014 | | | 20,919,882 | | |
| EUR | 5,744,037 | | | Term Loan, 6.68%, Maturing July 28, 2014 | | | 8,073,345 | | |
| EUR | 9,371,851 | | | Term Loan, 6.68%, Maturing July 28, 2014 | | | 13,172,302 | | |
| | | | | | | $ | 488,958,065 | | |
| Chemicals and Plastics — 6.5% | | | |
| Arizona Chemical, Inc. | | | |
| EUR | 3,030,763 | | | Term Loan, 6.98%, Maturing February 28, 2013 | | $ | 4,242,252 | | |
| Brenntag Holding GmbH and Co. KG | | | |
| EUR | 3,511,248 | | | Term Loan, 6.37%, Maturing January 20, 2014 | | | 4,968,776 | | |
| EUR | 845,455 | | | Term Loan, 6.66%, Maturing December 23, 2013 | | | 1,196,405 | | |
| EUR | 654,545 | | | Term Loan, 6.66%, Maturing December 23, 2013 | | | 926,249 | | |
| | 1,963,636 | | | Term Loan, 7.39%, Maturing January 20, 2014 | | | 1,924,772 | | |
| | 8,036,364 | | | Term Loan, 7.39%, Maturing January 20, 2014 | | | 7,877,308 | | |
| EUR | 525,062 | | | Term Loan, 6.62%, Maturing January 19, 2015 | | | 746,530 | | |
| EUR | 963,689 | | | Term Loan, 6.62%, Maturing January 19, 2015 | | | 1,370,167 | | |
| EUR | 770,053 | | | Term Loan, 8.75%, Maturing June 23, 2015 | | | 1,077,171 | | |
| EUR | 229,947 | | | Term Loan, 8.75%, Maturing June 23, 2015 | | | 321,551 | | |
| Celanese Holdings, LLC | | | |
| EUR | 995,000 | | | Term Loan, 6.54%, Maturing April 6, 2011 | | | 1,408,927 | | |
| | 7,000,000 | | | Term Loan, 6.87%, Maturing April 2, 2013 | | | 6,889,169 | | |
| | 27,412,250 | | | Term Loan, 6.98%, Maturing April 2, 2014 | | | 26,978,232 | | |
See notes to financial statements
21
Floating Rate Portfolio as of October 31, 2007
PORTFOLIO OF INVESTMENTS CONT'D
Principal
Amount* | |
Borrower/Tranche Description | |
Value | |
| Chemicals and Plastics (continued) | | | |
| Cognis GmbH | | | |
| EUR | 6,426,230 | | | Term Loan, 6.73%, Maturing September 15, 2013 | | $ | 8,983,369 | | |
| EUR | 1,573,770 | | | Term Loan, 6.73%, Maturing September 15, 2013 | | | 2,200,009 | | |
| Columbian Chemicals Acquisition | | | |
| | 4,653,000 | | | Term Loan, 6.95%, Maturing March 16, 2013 | | | 4,501,777 | | |
| Ferro Corp. | | | |
| | 16,104,000 | | | Term Loan, 7.06%, Maturing June 6, 2012 | | | 15,842,310 | | |
| First Chemical Holding | | | |
| EUR | 1,330,000 | | | Term Loan, 6.75%, Maturing September 19, 2014(2) | | | 1,881,819 | | |
| EUR | 1,330,000 | | | Term Loan, 7.24%, Maturing September 19, 2015(2) | | | 1,890,372 | | |
| Foamex L.P. | | | |
| | 4,391,074 | | | Term Loan, 7.44%, Maturing February 12, 2013 | | | 4,233,728 | | |
| Georgia Gulf Corp. | | | |
| | 8,295,898 | | | Term Loan, 7.63%, Maturing October 3, 2013 | | | 8,206,891 | | |
| Hexion Specialty Chemicals, Inc. | | | |
| EUR | 1,127,628 | | | Term Loan, 6.70%, Maturing May 5, 2012 | | | 1,619,161 | | |
| | 9,800,000 | | | Term Loan, 5.40%, Maturing May 5, 2013 | | | 9,718,846 | | |
| | 27,031,720 | | | Term Loan, 7.50%, Maturing May 5, 2013 | | | 26,807,871 | | |
| | 5,872,059 | | | Term Loan, 7.50%, Maturing May 5, 2013 | | | 5,823,433 | | |
| | 3,473,684 | | | Term Loan, 7.63%, Maturing May 5, 2013 | | | 3,444,919 | | |
| Huish Detergents, Inc. | | | |
| | 3,985,000 | | | Term Loan, 7.20%, Maturing April 26, 2014 | | | 3,804,607 | | |
| Huntsman International, LLC | | | |
| | 8,375,000 | | | Term Loan, 6.64%, Maturing April 19, 2014 | | | 8,318,728 | | |
| INEOS Group | | | |
| EUR | 70,008 | | | Term Loan, 7.24%, Maturing December 16, 2013 | | | 100,154 | | |
| EUR | 71,087 | | | Term Loan, 7.74%, Maturing December 16, 2014 | | | 102,207 | | |
| | 5,831,475 | | | Term Loan, 7.36%, Maturing December 16, 2012 | | | 5,715,755 | | |
| EUR | 2,000,000 | | | Term Loan, 8.49%, Maturing December 16, 2015 | | | 2,854,117 | | |
| | 7,959,750 | | | Term Loan, 7.36%, Maturing December 16, 2013 | | | 7,901,477 | | |
| | 7,959,750 | | | Term Loan, 7.86%, Maturing December 16, 2014 | | | 7,901,477 | | |
| Innophos, Inc. | | | |
| | 8,394,786 | | | Term Loan, 7.01%, Maturing August 13, 2010(2) | | | 8,331,825 | | |
| Invista B.V. | | | |
| | 3,733,500 | | | Term Loan, 6.70%, Maturing April 30, 2010 | | | 3,621,495 | | |
| | 12,199,027 | | | Term Loan, 6.70%, Maturing April 29, 2011 | | | 12,016,042 | | |
| | 7,366,191 | | | Term Loan, 6.70%, Maturing April 29, 2011 | | | 7,255,698 | | |
| ISP Chemco, Inc. | | | |
| | 25,735,500 | | | Term Loan, 7.09%, Maturing June 4, 2014 | | | 25,195,054 | | |
| Kleopatra | | | |
| EUR | 5,100,000 | | | Term Loan, 7.28%, Maturing January 3, 2016 | | | 6,800,451 | | |
| | 8,876,250 | | | Term Loan, 7.74%, Maturing January 3, 2016 | | | 8,033,006 | | |
| Kranton Polymers, LLC | | | |
| | 10,193,267 | | | Term Loan, 7.25%, Maturing May 13, 2013 | | | 9,963,918 | | |
| Lucite International Group Holdings | | | |
| | 1,708,695 | | | Term Loan, 7.45%, Maturing July 7, 2013 | | | 1,678,792 | | |
| | 4,825,935 | | | Term Loan, 7.45%, Maturing July 7, 2013 | | | 4,741,481 | | |
Principal
Amount* | |
Borrower/Tranche Description | |
Value | |
| Chemicals and Plastics (continued) | | | |
| Lyondell Chemical Co. | | | |
| $ | 28,372,950 | | | Term Loan, 6.25%, Maturing August 16, 2013 | | $ | 28,270,495 | | |
| MacDermid, Inc. | | | |
| | 4,228,750 | | | Term Loan, 7.20%, Maturing April 12, 2014 | | | 4,126,554 | | |
| Millenium Inorganic Chemicals | | | |
| | 11,450,000 | | | Term Loan, 7.45%, Maturing April 30, 2014 | | | 11,130,350 | | |
| Momentive Performance Material | | | |
| | 5,000,000 | | | Term Loan, 5.17%, Maturing December 4, 2013 | | | 4,913,395 | | |
| | 4,682,075 | | | Term Loan, 7.81%, Maturing December 4, 2013 | | | 4,600,977 | | |
| Nalco Co. | | | |
| | 18,905,907 | | | Term Loan, 6.97%, Maturing November 4, 2010 | | | 18,831,474 | | |
| Professional Paint, Inc. | | | |
| | 5,554,688 | | | Term Loan, 7.64%, Maturing May 31, 2012 | | | 5,276,953 | | |
| Propex Fabrics, Inc. | | | |
| | 5,812,901 | | | Term Loan, 10.58%, Maturing July 31, 2012 | | | 5,202,547 | | |
| Rockwood Specialties Group, Inc. | | | |
| EUR | 2,521,898 | | | Term Loan, 6.35%, Maturing July 30, 2011 | | | 3,580,145 | | |
| | 27,246,572 | | | Term Loan, 6.46%, Maturing December 10, 2012 | | | 26,853,213 | | |
| Sigmakalon (BC) Holdco B.V. | | | |
| EUR | 190,335 | | | Term Loan, 6.66%, Maturing September 9, 2013 | | | 273,990 | | |
| EUR | 3,114,528 | | | Term Loan, 6.66%, Maturing September 9, 2013 | | | 4,483,414 | | |
| EUR | 5,695,137 | | | Term Loan, 6.66%, Maturing September 9, 2013 | | | 8,198,243 | | |
| EUR | 5,825,801 | | | Term Loan, 7.41%, Maturing September 9, 2014 | | | 8,386,335 | | |
| Solo Cup Co. | | | |
| | 7,209,021 | | | Term Loan, 8.66%, Maturing February 27, 2011 | | | 7,205,157 | | |
| Solutia, Inc. | | | |
| | 5,245,516 | | | DIP Loan, 8.06%, Maturing March 31, 2008 | | | 5,240,601 | | |
| TPG Spring UK, Ltd. | | | |
| EUR | 3,896,011 | | | Term Loan, 7.48%, Maturing June 27, 2013 | | | 5,515,019 | | |
| EUR | 3,896,011 | | | Term Loan, 7.98%, Maturing June 27, 2013 | | | 5,543,201 | | |
| Wellman, Inc. | | | |
| | 5,250,000 | | | Term Loan, 9.36%, Maturing February 10, 2009 | | | 5,133,187 | | |
| | | | | | | $ | 442,183,548 | | |
| Clothing / Textiles — 0.4% | | | |
| Hanesbrands, Inc. | | | |
| $ | 13,960,000 | | | Term Loan, 6.74%, Maturing September 5, 2013 | | $ | 13,805,575 | | |
| | 5,000,000 | | | Term Loan, 8.82%, Maturing March 5, 2014 | | | 5,034,375 | | |
| St. John Knits International, Inc. | | | |
| | 3,754,872 | | | Term Loan, 8.20%, Maturing March 23, 2012 | | | 3,698,549 | | |
| The William Carter Co. | | | |
| | 2,348,539 | | | Term Loan, 6.40%, Maturing July 14, 2012 | | | 2,313,800 | | |
| Warnaco, Inc. | | | |
| | 3,836,681 | | | Term Loan, 6.74%, Maturing January 31, 2013 | | | 3,798,314 | | |
| | | | | | | $ | 28,650,613 | | |
See notes to financial statements
22
Floating Rate Portfolio as of October 31, 2007
PORTFOLIO OF INVESTMENTS CONT'D
Principal
Amount* | |
Borrower/Tranche Description | |
Value | |
| Conglomerates — 2.4% | | | |
| American Greetings Corp. | | | |
| $ | 5,497,738 | | | Term Loan, 0.00%, Maturing April 4, 2013(2) | | $ | 5,446,196 | | |
| Amsted Industries, Inc. | | | |
| | 12,710,678 | | | Term Loan, 7.28%, Maturing October 15, 2010 | | | 12,512,074 | | |
| | 12,437,054 | | | Term Loan, 7.27%, Maturing April 5, 2013 | | | 12,172,766 | | |
| Blount, Inc. | | | |
| | 5,057,907 | | | Term Loan, 6.88%, Maturing August 9, 2010 | | | 4,963,071 | | |
| Doncasters (Dunde HoldCo 4 Ltd.) | | | |
| EUR | 849,214 | | | Term Loan, 6.79%, Maturing July 13, 2015 | | | 1,197,148 | | |
| EUR | 849,214 | | | Term Loan, 7.29%, Maturing July 13, 2015 | | | 1,200,220 | | |
| | 3,931,314 | | | Term Loan, 7.61%, Maturing July 13, 2015 | | | 3,823,302 | | |
| | 3,931,314 | | | Term Loan, 8.11%, Maturing July 13, 2015 | | | 3,833,130 | | |
| GBP | 1,737,276 | | | Term Loan, 8.60%, Maturing July 13, 2015 | | | 3,517,264 | | |
| GBP | 1,737,276 | | | Term Loan, 9.10%, Maturing July 13, 2015 | | | 3,523,280 | | |
| GenTek, Inc. | | | |
| | 3,796,052 | | | Term Loan, 7.34%, Maturing February 25, 2011 | | | 3,724,876 | | |
| Goodman Global Holdings, Inc. | | | |
| | 4,611,058 | | | Term Loan, 7.19%, Maturing December 23, 2011 | | | 4,495,781 | | |
| ISS Holdings A/S | | | |
| GBP | 3,068,562 | | | Term Loan, 8.56%, Maturing December 31, 2013 | | | 6,246,989 | | |
| Jarden Corp. | | | |
| | 16,179,959 | | | Term Loan, 6.95%, Maturing January 24, 2012 | | | 15,886,697 | | |
| | 6,586,750 | | | Term Loan, 6.95%, Maturing January 24, 2012 | | | 6,467,365 | | |
| Johnson Diversey, Inc. | | | |
| | 2,487,500 | | | Term Loan, 7.36%, Maturing December 16, 2010 | | | 2,461,070 | | |
| | 12,855,976 | | | Term Loan, 7.36%, Maturing December 16, 2011 | | | 12,719,381 | | |
| Polymer Group, Inc. | | | |
| | 3,000,000 | | | Revolving Loan, 0.00%, Maturing November 22, 2010(2) | | | 2,850,000 | | |
| | 20,689,513 | | | Term Loan, 7.29%, Maturing November 22, 2012 | | | 20,534,342 | | |
| RBS Global, Inc. | | | |
| | 10,185,246 | | | Term Loan, 7.60%, Maturing July 19, 2013 | | | 10,140,685 | | |
| | 2,271,250 | | | Term Loan, 7.64%, Maturing July 19, 2013 | | | 2,261,313 | | |
| RGIS Holdings, LLC | | | |
| | 909,625 | | | Term Loan, 7.25%, Maturing April 30, 2014 | | | 875,514 | | |
| | 18,192,500 | | | Term Loan, 7.25%, Maturing April 30, 2014 | | | 17,510,281 | | |
| US Investigations Services, Inc. | | | |
| | 4,000,000 | | | Term Loan, Maturing February 21, 2015(3) | | | 3,890,000 | | |
| | | | | | | $ | 162,252,745 | | |
| Containers and Glass Products — 3.1% | | | |
| Berry Plastics Corp. | | | |
| $ | 22,787,906 | | | Term Loan, 7.36%, Maturing April 3, 2015 | | $ | 22,175,481 | | |
| Bluegrass Container Co. | | | |
| | 3,075,913 | | | Term Loan, 7.29%, Maturing June 30, 2013 | | | 3,061,905 | | |
| | 10,280,025 | | | Term Loan, 7.32%, Maturing June 30, 2013 | | | 10,233,209 | | |
Principal
Amount* | |
Borrower/Tranche Description | |
Value | |
| Containers and Glass Products (continued) | | | |
| Consolidated Container Co. | | | |
| $ | 9,950,000 | | | Term Loan, 7.23%, Maturing March 28, 2014 | | $ | 9,340,562 | | |
| Crown Americas, Inc. | | | |
| EUR | 4,455,000 | | | Term Loan, 6.25%, Maturing November 15, 2012 | | | 6,251,913 | | |
| | 9,850,500 | | | Term Loan, 7.31%, Maturing November 15, 2012 | | | 9,735,574 | | |
| | 1,435,500 | | | Term Loan, 7.31%, Maturing November 15, 2012 | | | 1,418,752 | | |
| Graham Packaging Holdings Co. | | | |
| | 33,601,138 | | | Term Loan, 7.66%, Maturing October 7, 2011 | | | 33,018,359 | | |
| Graphic Packaging International, Inc. | | | |
| | 41,259,725 | | | Term Loan, 7.39%, Maturing May 16, 2014 | | | 41,064,484 | | |
| IPG (US), Inc. | | | |
| | 6,848,146 | | | Term Loan, 9.59%, Maturing July 28, 2011 | | | 6,796,784 | | |
| JSG Acquisitions | | | |
| EUR | 6,750,000 | | | Term Loan, Maturing December 31, 2014(3) | | | 9,553,162 | | |
| EUR | 6,750,000 | | | Term Loan, Maturing December 31, 2014(3) | | | 9,596,501 | | |
| OI European Group B.V. | | | |
| EUR | 12,064,500 | | | Term Loan, 5.76%, Maturing June 14, 2013 | | | 16,908,868 | | |
| Owens-Brockway Glass Container | | | |
| | 7,139,069 | | | Term Loan, 6.59%, Maturing June 14, 2013 | | | 7,025,293 | | |
| Pregis Corp. | | | |
| | 2,646,000 | | | Term Loan, 7.45%, Maturing October 12, 2011 | | | 2,579,850 | | |
| Smurfit-Stone Container Corp. | | | |
| | 3,225,483 | | | Term Loan, 7.12%, Maturing November 1, 2010 | | | 3,199,779 | | |
| | 4,076,272 | | | Term Loan, 7.19%, Maturing November 1, 2011 | | | 4,043,789 | | |
| | 5,285,887 | | | Term Loan, 7.43%, Maturing November 1, 2011 | | | 5,243,764 | | |
| | 9,340,983 | | | Term Loan, 7.52%, Maturing November 1, 2011 | | | 9,266,544 | | |
| | | | | | | $ | 210,514,573 | | |
| Cosmetics / Toiletries — 0.3% | | | |
| American Safety Razor Co. | | | |
| $ | 3,456,250 | | | Term Loan, 7.51%, Maturing July 31, 2013 | | $ | 3,421,687 | | |
| Bausch & Lomb, Inc. | | | |
| | 835,000 | | | Term Loan, Maturing April 30, 2015(3) | | | 837,349 | | |
| | 3,340,000 | | | Term Loan, Maturing April 30, 2015(3) | | | 3,349,395 | | |
| Prestige Brands, Inc. | | | |
| | 12,275,229 | | | Term Loan, 7.73%, Maturing April 7, 2011 | | | 12,213,853 | | |
| | | | | | | $ | 19,822,284 | | |
| Drugs — 0.9% | | | |
| Chattem, Inc. | | | |
| $ | 1,608,058 | | | Term Loan, 6.97%, Maturing January 2, 2013 | | $ | 1,604,037 | | |
| Graceway Pharmaceuticals, LLC | | | |
| | 14,577,917 | | | Term Loan, 7.95%, Maturing May 3, 2012 | | | 13,983,867 | | |
| Pharmaceutical Holdings Corp. | | | |
| | 5,265,000 | | | Term Loan, 8.07%, Maturing January 30, 2012 | | | 5,133,375 | | |
See notes to financial statements
23
Floating Rate Portfolio as of October 31, 2007
PORTFOLIO OF INVESTMENTS CONT'D
Principal
Amount* | |
Borrower/Tranche Description | |
Value | |
| Drugs (continued) | | | |
| Stiefel Laboratories, Inc. | | | |
| $ | 5,412,744 | | | Term Loan, 7.50%, Maturing December 28, 2013 | | $ | 5,311,255 | | |
| | 7,076,662 | | | Term Loan, 7.50%, Maturing December 28, 2013 | | | 6,943,974 | | |
| Warner Chilcott Corp. | | | |
| | 6,927,784 | | | Term Loan, 7.20%, Maturing January 18, 2012 | | | 6,834,259 | | |
| | 23,156,216 | | | Term Loan, 7.24%, Maturing January 18, 2012 | | | 22,843,607 | | |
| | | | | | | $ | 62,654,374 | | |
| Ecological Services and Equipment — 1.3% | | | |
| Allied Waste Industries, Inc. | | | |
| $ | 9,269,894 | | | Term Loan, 6.49%, Maturing January 15, 2012 | | $ | 9,116,366 | | |
| | 3,572,392 | | | Term Loan, 7.00%, Maturing January 15, 2012 | | | 3,513,226 | | |
| Big Dumpster Merger Sub, Inc. | | | |
| | 688,822 | | | Term Loan, 7.45%, Maturing February 5, 2013 | | | 654,381 | | |
| Blue Waste B.V. (AVR Acquisition) | | | |
| EUR | 3,500,000 | | | Term Loan, 7.23%, Maturing March 31, 2014 | | | 4,986,617 | | |
| EUR | 3,500,000 | | | Term Loan, 6.98%, Maturing March 31, 2015 | | | 4,961,446 | | |
| EUR | 2,000,000 | | | Term Loan, 6.98%, Maturing April 1, 2015 | | | 2,843,466 | | |
| Casella Waste Systems, Inc. | | | |
| | 4,974,286 | | | Term Loan, 7.33%, Maturing April 28, 2010 | | | 4,896,562 | | |
| Duratek, Inc. | | | |
| | 448,998 | | | Term Loan, Maturing June 7, 2013(3) | | | 442,825 | | |
| EnergySolutions, LLC | | | |
| | 55,853 | | | Term Loan, Maturing June 7, 2013(3) | | | 55,085 | | |
| | 936,192 | | | Term Loan, Maturing June 7, 2013(3) | | | 923,319 | | |
| Environmental Systems Products Holdings, Inc. | | | |
| | 466,049 | | | Term Loan, 13.75%, Maturing December 12, 2010(4) | | | 466,049 | | |
| IESI Corp. | | | |
| | 9,267,647 | | | Term Loan, 7.17%, Maturing January 20, 2012 | | | 9,018,579 | | |
| Kemble Water Structure Ltd. | | | |
| GBP | 17,750,000 | | | Term Loan, 10.05%, Maturing October 13, 2013 | | | 36,250,731 | | |
| Sensus Metering Systems, Inc. | | | |
| | 3,000,000 | | | Revolving Loan, 7.54%, Maturing December 17, 2009(2) | | | 2,865,000 | | |
| | 8,661,047 | | | Term Loan, 7.26%, Maturing December 17, 2010 | | | 8,531,131 | | |
| | 562,717 | | | Term Loan, 7.36%, Maturing December 17, 2010 | | | 554,276 | | |
| Wastequip, Inc. | | | |
| | 311,178 | | | Term Loan, 7.04%, Maturing February 5, 2013(2) | | | 295,619 | | |
| | | | | | | $ | 90,374,678 | | |
| Electronics / Electrical — 2.8% | | | |
| AMI Semiconductor, Inc. | | | |
| $ | 7,773,318 | | | Term Loan, 6.82%, Maturing April 1, 2012 | | $ | 7,520,685 | | |
| Aspect Software, Inc. | | | |
| | 10,989,000 | | | Term Loan, 8.25%, Maturing July 11, 2011 | | | 10,659,330 | | |
Principal
Amount* | |
Borrower/Tranche Description | |
Value | |
| Electronics / Electrical (continued) | | | |
| Baldor Electric Co. | | | |
| $ | 3,440,398 | | | Term Loan, 6.96%, Maturing January 31, 2014 | | $ | 3,405,994 | | |
| EnerSys Capital, Inc. | | | |
| | 10,201,263 | | | Term Loan, 7.07%, Maturing March 17, 2011 | | | 10,022,741 | | |
| Fairchild Semiconductor Corp. | | | |
| | 16,367,813 | | | Term Loan, 6.70%, Maturing June 26, 2013 | | | 16,081,376 | | |
| FCI International S.A.S. | | | |
| EUR | 750,000 | | | Term Loan, 6.70%, Maturing November 1, 2013 | | | 1,051,380 | | |
| | 1,000,000 | | | Term Loan, 7.73%, Maturing November 1, 2013 | | | 965,750 | | |
| | 764,245 | | | Term Loan, 7.76%, Maturing November 1, 2013 | | | 741,317 | | |
| | 735,755 | | | Term Loan, 7.76%, Maturing November 1, 2013 | | | 713,683 | | |
| | 735,755 | | | Term Loan, 7.76%, Maturing November 1, 2013 | | | 710,556 | | |
| | 764,245 | | | Term Loan, 7.76%, Maturing November 1, 2013 | | | 738,069 | | |
| EUR | 750,000 | | | Term Loan, 6.70%, Maturing October 31, 2014 | | | 1,051,380 | | |
| Freescale Semiconductor, Inc. | | | |
| | 46,806,593 | | | Term Loan, 7.33%, Maturing December 1, 2013 | | | 45,031,079 | | |
| Infor Enterprise Solutions Holdings | | | |
| EUR | 2,977,500 | | | Term Loan, 7.18%, Maturing July 28, 2012 | | | 4,167,698 | | |
| | 21,698,188 | | | Term Loan, 8.95%, Maturing July 28, 2012 | | | 21,155,733 | | |
| | 11,320,794 | | | Term Loan, 8.95%, Maturing July 28, 2012 | | | 11,037,774 | | |
| Invensys International Holding | | | |
| EUR | 1,001,757 | | | Term Loan, 6.43%, Maturing December 15, 2010 | | | 1,431,780 | | |
| | 2,166,667 | | | Term Loan, 7.36%, Maturing December 15, 2010 | | | 2,126,945 | | |
| | 2,333,333 | | | Term Loan, 7.24%, Maturing January 15, 2011 | | | 2,286,667 | | |
| Network Solutions, LLC | | | |
| | 6,240,619 | | | Term Loan, 7.61%, Maturing March 7, 2014 | | | 5,928,588 | | |
| Open Solutions, Inc. | | | |
| | 12,340,175 | | | Term Loan, 7.28%, Maturing January 23, 2014 | | | 11,838,856 | | |
| Sensata Technologies Finance Co. | | | |
| | 12,835,361 | | | Term Loan, 6.76%, Maturing April 26, 2013 | | | 12,520,201 | | |
| SS&C Technologies, Inc. | | | |
| | 4,761,290 | | | Term Loan, 7.20%, Maturing November 23, 2012 | | | 4,689,871 | | |
| Vertafore, Inc. | | | |
| | 14,004,713 | | | Term Loan, 8.01%, Maturing January 31, 2012 | | | 13,812,148 | | |
| | | | | | | $ | 189,689,601 | | |
| Equipment Leasing — 0.5% | | | |
| Maxim Crane Works, L.P. | | | |
| $ | 8,478,750 | | | Term Loan, 6.81%, Maturing June 29, 2014 | | $ | 8,054,812 | | |
| The Hertz Corp. | | | |
| | 2,875,000 | | | Term Loan, 6.99%, Maturing December 21, 2012 | | | 2,835,598 | | |
| | 10,992,052 | | | Term Loan, 6.87%, Maturing December 21, 2012(2) | | | 10,841,406 | | |
| United Rentals, Inc. | | | |
| | 3,352,101 | | | Term Loan, 7.57%, Maturing February 14, 2011 | | | 3,342,045 | | |
| | 7,894,455 | | | Term Loan, 7.13%, Maturing February 14, 2011 | | | 7,870,772 | | |
| | | | | | | $ | 32,944,633 | | |
See notes to financial statements
24
Floating Rate Portfolio as of October 31, 2007
PORTFOLIO OF INVESTMENTS CONT'D
Principal
Amount* | |
Borrower/Tranche Description | |
Value | |
| Farming / Agriculture — 0.3% | | | |
| BF Bolthouse HoldCo, LLC | | | |
| $ | 6,337,125 | | | Term Loan, 7.50%, Maturing December 16, 2012 | | $ | 6,265,832 | | |
| Central Garden & Pet Co. | | | |
| | 10,859,489 | | | Term Loan, 6.56%, Maturing February 28, 2014 | | | 9,990,730 | | |
| United Agri Products, Inc. | | | |
| | 2,962,500 | | | Term Loan, 7.90%, Maturing June 8, 2012 | | | 2,962,500 | | |
| | | | | | | $ | 19,219,062 | | |
| Financial Intermediaries — 1.1% | | | |
| Asset Acceptence Capital Corp. | | | |
| $ | 2,493,750 | | | Term Loan, 7.94%, Maturing June 5, 2013 | | $ | 2,418,937 | | |
| Citco III, Ltd. | | | |
| | 10,875,000 | | | Term Loan, 7.63%, Maturing June 30, 2014 | | | 10,575,937 | | |
| Coinstar, Inc. | | | |
| | 8,339,211 | | | Term Loan, 7.13%, Maturing July 7, 2011 | | | 8,328,787 | | |
| E.A. Viner International Co. | | | |
| | 1,002,450 | | | Term Loan, 7.70%, Maturing July 31, 2013 | | | 994,932 | | |
| Grosvenor Capital Management | | | |
| | 4,334,332 | | | Term Loan, 7.33%, Maturing December 5, 2013 | | | 4,269,317 | | |
| INVESTools, Inc. | | | |
| | 3,700,000 | | | Term Loan, 8.45%, Maturing August 13, 2012 | | | 3,626,000 | | |
| Jupiter Asset Management Group | | | |
| GBP | 4,023,529 | | | Term Loan, 8.74%, Maturing June 30, 2015 | | | 7,995,738 | | |
| LPL Holdings, Inc. | | | |
| | 25,533,204 | | | Term Loan, 7.20%, Maturing December 18, 2014 | | | 25,214,039 | | |
| Oxford Acquisition III, Ltd. | | | |
| | 11,436,784 | | | Term Loan, 6.90%, Maturing May 24, 2014 | | | 10,883,324 | | |
| RJO Holdings Corp. (RJ O'Brien) | | | |
| | 4,225,000 | | | Term Loan, 7.76%, Maturing July 12, 2014 | | | 3,892,281 | | |
| | | | | | | $ | 78,199,292 | | |
| Food Products — 3.1% | | | |
| Acosta, Inc. | | | |
| $ | 18,769,962 | | | Term Loan, 7.01%, Maturing July 28, 2013 | | $ | 18,394,563 | | |
| Advantage Sales & Marketing, Inc. | | | |
| | 9,690,052 | | | Term Loan, 6.94%, Maturing March 29, 2013 | | | 9,363,013 | | |
| | 3,774,179 | | | Term Loan, 6.94%, Maturing March 29, 2013 | | | 3,646,800 | | |
| American Seafoods Group, LLC | | | |
| | 3,991,434 | | | Term Loan, 6.95%, Maturing September 28, 2012 | | | 3,906,616 | | |
| Birds Eye Foods, Inc. | | | |
| | 4,037,453 | | | Term Loan, 6.95%, Maturing March 22, 2013 | | | 3,918,852 | | |
| BL Marketing, Ltd. | | | |
| GBP | 2,200,000 | | | Term Loan, 8.81%, Maturing December 20, 2013 | | | 4,490,192 | | |
| GBP | 3,500,000 | | | Term Loan, 8.21%, Maturing December 31, 2013 | | | 7,157,120 | | |
| GBP | 2,200,000 | | | Term Loan, 9.31%, Maturing December 20, 2014 | | | 4,497,047 | | |
| GBP | 2,500,000 | | | Term Loan, 10.66%, Maturing June 30, 2015 | | | 5,053,803 | | |
Principal
Amount* | |
Borrower/Tranche Description | |
Value | |
| Food Products (continued) | | | |
| Black Lion Beverages III B.V. | | | |
| EUR | 1,500,000 | | | Term Loan, 7.10%, Maturing December 31, 2013 | | $ | 2,122,146 | | |
| EUR | 1,500,000 | | | Term Loan, 7.18%, Maturing December 31, 2014 | | | 2,132,996 | | |
| EUR | 3,000,000 | | | Term Loan, 8.97%, Maturing January 24, 2016 | | | 4,219,990 | | |
| Bumble Bee Seafood, LLC | | | |
| | 3,000,000 | | | Term Loan, 7.57%, Maturing May 2, 2012 | | | 2,962,500 | | |
| Charden International B.V. | | | |
| EUR | 1,000,000 | | | Term Loan, 7.17%, Maturing March 14, 2014 | | | 1,431,679 | | |
| EUR | 1,000,000 | | | Term Loan, 7.17%, Maturing March 14, 2015 | | | 1,438,913 | | |
| EUR | 1,500,000 | | | Term Loan, 10.26%, Maturing March 14, 2016 | | | 2,144,806 | | |
| Chiquita Brands, LLC | | | |
| | 8,497,359 | | | Term Loan, 7.88%, Maturing June 28, 2012 | | | 8,378,753 | | |
| Dean Foods Co. | | | |
| | 29,029,125 | | | Term Loan, 6.70%, Maturing April 2, 2014 | | | 28,163,186 | | |
| Dole Food Company, Inc. | | | |
| | 372,097 | | | Term Loan, Maturing April 12, 2013(3) | | | 361,993 | | |
| | 813,260 | | | Term Loan, 7.29% Maturing April 12, 2013 | | | 791,178 | | |
| | 1,219,276 | | | Term Loan, Maturing April 12, 2013(3) | | | 1,186,169 | | |
| | 1,802,386 | | | Term Loan, 7.57% Maturing April 12, 2013 | | | 1,753,446 | | |
| | 365,782 | | | Term Loan, Maturing April 12, 2013(3) | | | 355,850 | | |
| | 6,007,953 | | | Term Loan, 7.41% Maturing April 12, 2013 | | | 5,844,819 | | |
| Foodvest Limited | | | |
| EUR | 632,918 | | | Term Loan, 6.59%, Maturing March 16, 2014 | | | 889,730 | | |
| GBP | 437,500 | | | Term Loan, 8.33%, Maturing March 16, 2014 | | | 883,848 | | |
| EUR | 580,555 | | | Term Loan, 7.09%, Maturing March 16, 2015 | | | 820,320 | | |
| GBP | 401,305 | | | Term Loan, 8.83%, Maturing March 16, 2015 | | | 814,893 | | |
| GBP | 500,000 | | | Term Loan, 10.33%, Maturing September 16, 2015 | | | 998,426 | | |
| MafCo Worldwide Corp. | | | |
| | 843,632 | | | Term Loan, 7.60%, Maturing December 8, 2011 | | | 820,432 | | |
| Michael Foods, Inc. | | | |
| | 9,378,354 | | | Term Loan, 7.36%, Maturing November 21, 2010 | | | 9,261,125 | | |
| Nash-Finch Co. | | | |
| | 4,273,200 | | | Term Loan, 7.69%, Maturing November 12, 2010 | | | 4,080,906 | | |
| National Dairy Holdings, L.P. | | | |
| | 8,287,539 | | | Term Loan, 6.82%, Maturing March 15, 2012 | | | 8,101,070 | | |
| Pinnacle Foods Finance, LLC | | | |
| | 7,000,000 | | | Revolving Loan, 5.75%, Maturing April 2, 2013(2) | | | 6,685,000 | | |
| | 32,518,500 | | | Term Loan, 7.95%, Maturing April 2, 2014 | | | 31,513,906 | | |
| Reddy Ice Group, Inc. | | | |
| | 14,335,000 | | | Term Loan, 7.00%, Maturing August 9, 2012 | | | 14,084,137 | | |
| Ruby Acquisitions, Ltd. | | | |
| GBP | 2,539,204 | | | Term Loan, 8.84%, Maturing January 5, 2015 | | | 4,898,985 | | |
| United Biscuit Holdco, Ltd. | | | |
| EUR | 1,209,173 | | | Term Loan, 6.88%, Maturing December 14, 2014 | | | 1,708,917 | | |
| GBP | 2,859,511 | | | Term Loan, 8.69%, Maturing December 14, 2014 | | | 5,789,378 | | |
| | | | | | | $ | 215,067,503 | | |
See notes to financial statements
25
Floating Rate Portfolio as of October 31, 2007
PORTFOLIO OF INVESTMENTS CONT'D
Principal
Amount* | |
Borrower/Tranche Description | |
Value | |
| Food Service — 1.9% | | | |
| AFC Enterprises, Inc. | | | |
| $ | 3,206,863 | | | Term Loan, 7.50%, Maturing May 23, 2009 | | $ | 3,154,751 | | |
| Aramark Corp. | | | |
| | 2,376,596 | | | Term Loan, 5.20%, Maturing January 26, 2014 | | | 2,323,420 | | |
| | 32,987,418 | | | Term Loan, 7.20%, Maturing January 26, 2014 | | | 32,249,325 | | |
| Buffets, Inc. | | | |
| | 1,826,350 | | | Term Loan, 5.10%, Maturing May 1, 2013 | | | 1,660,837 | | |
| | 13,724,366 | | | Term Loan, 8.54%, Maturing November 1, 2013 | | | 12,480,595 | | |
| CBRL Group, Inc. | | | |
| | 9,558,325 | | | Term Loan, 6.86%, Maturing April 27, 2013 | | | 9,319,367 | | |
| | 3,877,905 | | | Term Loan, 7.43%, Maturing April 27, 2013 | | | 3,785,805 | | |
| Denny's, Inc. | | | |
| | 280,724 | | | Term Loan, 7.12%, Maturing March 31, 2012 | | | 277,215 | | |
| | 1,438,810 | | | Term Loan, 7.26%, Maturing March 31, 2012 | | | 1,420,825 | | |
| JRD Holdings, Inc. | | | |
| | 5,715,625 | | | Term Loan, 7.74%, Maturing June 26, 2014 | | | 5,601,313 | | |
| Maine Beverage Co., LLC | | | |
| | 3,103,571 | | | Term Loan, 6.98%, Maturing June 30, 2010 | | | 3,088,054 | | |
| NPC International, Inc. | | | |
| | 4,193,793 | | | Term Loan, 6.98%, Maturing March 31, 2013 | | | 4,047,010 | | |
| OSI Restaurant Partners, LLC | | | |
| | 723,182 | | | Term Loan, 5.52%, Maturing May 11, 2013 | | | 698,593 | �� | |
| | 8,929,439 | | | Term Loan, 7.06%, Maturing May 9, 2014 | | | 8,625,838 | | |
| QCE Finance, LLC | | | |
| | 10,077,462 | | | Term Loan, 7.45%, Maturing May 5, 2013 | | | 9,787,040 | | |
| Sagittarius Restaurants, LLC | | | |
| | 4,806,812 | | | Term Loan, 7.45%, Maturing March 29, 2013 | | | 4,446,301 | | |
| Selecta | | | |
| CHF | 18,404,850 | | | Term Loan, 5.13%, Maturing July 2, 2015 | | | 15,005,896 | | |
| SSP Financing, Ltd. | | | |
| EUR | 184,777 | | | Term Loan, 6.62%, Maturing June 15, 2014 | | | 259,507 | | |
| EUR | 840,369 | | | Term Loan, 6.95%, Maturing June 15, 2014 | | | 1,180,242 | | |
| | 3,954,516 | | | Term Loan, 7.58%, Maturing June 15, 2014 | | | 3,771,620 | | |
| EUR | 184,777 | | | Term Loan, 7.12%, Maturing June 15, 2015 | | | 260,844 | | |
| EUR | 840,369 | | | Term Loan, 7.45%, Maturing June 15, 2015 | | | 1,186,321 | | |
| | 3,954,516 | | | Term Loan, 8.08%, Maturing June 15, 2015 | | | 3,791,392 | | |
| | | | | | | $ | 128,422,111 | | |
| Food / Drug Retailers — 1.1% | | | |
| General Nutrition Centers, Inc. | | | |
| $ | 16,716,000 | | | Term Loan, 7.48%, Maturing September 16, 2013 | | $ | 15,948,117 | | |
| Pantry, Inc. (The) | | | |
| | 2,288,889 | | | Term Loan, 0.00%, Maturing May 15, 2014(2) | | | 2,221,653 | | |
| | 7,991,083 | | | Term Loan, 6.51%, Maturing May 15, 2014 | | | 7,756,345 | | |
| Rite Aid Corp. | | | |
| | 29,000,000 | | | Term Loan, 6.79%, Maturing June 1, 2014 | | | 28,275,000 | | |
Principal
Amount* | |
Borrower/Tranche Description | |
Value | |
| Food / Drug Retailers (continued) | | | |
| Roundy's Supermarkets, Inc. | | | |
| $ | 23,004,407 | | | Term Loan, 8.46%, Maturing November 3, 2011 | | $ | 22,927,733 | | |
| | | | | | | $ | 77,128,848 | | |
| Forest Products — 2.1% | | | |
| Appleton Papers, Inc. | | | |
| $ | 11,620,875 | | | Term Loan, 7.02%, Maturing June 5, 2014 | | $ | 11,203,256 | | |
| Boise Cascade Holdings, LLC | | | |
| | 32,057,111 | | | Term Loan, 6.49%, Maturing April 30, 2014 | | | 31,872,783 | | |
| | 9,087,215 | | | Term Loan, 6.72%, Maturing April 30, 2014 | | | 9,034,964 | | |
| Domtar Corp. | | | |
| | 8,706,250 | | | Term Loan, 6.48%, Maturing March 7, 2014 | | | 8,575,656 | | |
| Georgia-Pacific Corp. | | | |
| | 6,065,278 | | | Term Loan, 7.37%, Maturing December 20, 2012 | | | 5,931,514 | | |
| | 56,997,991 | | | Term Loan, 7.41%, Maturing December 20, 2012 | | | 55,740,958 | | |
| NewPage Corp. | | | |
| | 11,803,146 | | | Term Loan, 7.47%, Maturing May 2, 2011 | | | 11,714,623 | | |
| Xerium Technologies, Inc. | | | |
| EUR | 1,955,000 | | | Term Loan, 7.48%, Maturing May 18, 2012 | | | 2,665,763 | | |
| | 9,208,460 | | | Term Loan, 7.95%, Maturing May 18, 2012 | | | 8,736,526 | | |
| | | | | | | $ | 145,476,043 | | |
| Healthcare — 7.9% | | | |
| Accellent, Inc. | | | |
| $ | 4,188,062 | | | Term Loan, 8.01%, Maturing November 22, 2012 | | $ | 3,999,599 | | |
| Advanced Medical Optics, Inc. | | | |
| | 1,990,000 | | | Term Loan, 7.03%, Maturing April 2, 2014 | | | 1,920,350 | | |
| Alliance Imaging, Inc. | | | |
| | 6,832,983 | | | Term Loan, 7.63%, Maturing December 29, 2011 | | | 6,781,736 | | |
| American Medical Systems | | | |
| | 11,700,086 | | | Term Loan, 7.57%, Maturing July 20, 2012 | | | 11,422,209 | | |
| AMN Healthcare, Inc. | | | |
| | 2,507,029 | | | Term Loan, 6.95%, Maturing November 2, 2011 | | | 2,443,571 | | |
| AMR HoldCo, Inc. | | | |
| | 6,007,069 | | | Term Loan, 7.71%, Maturing February 10, 2012 | | | 5,875,664 | | |
| Biomet, Inc. | | | |
| EUR | 10,025,000 | | | Term Loan, Maturing December 26, 2014(3) | | | 14,422,086 | | |
| | 11,222,222 | | | Term Loan, 8.20%, Maturing December 26, 2014 | | | 11,183,326 | | |
| Cardinal Health 409, Inc. | | | |
| | 16,857,750 | | | Term Loan, 7.45%, Maturing April 10, 2014 | | | 16,244,027 | | |
| Carestream Health, Inc. | | | |
| | 17,075,000 | | | Term Loan, 7.11%, Maturing April 30, 2013 | | | 16,557,423 | | |
| Carl Zeiss Vision Holding GmbH | | | |
| EUR | 6,371,053 | | | Term Loan, 7.25%, Maturing July 24, 2015 | | | 9,062,930 | | |
See notes to financial statements
26
Floating Rate Portfolio as of October 31, 2007
PORTFOLIO OF INVESTMENTS CONT'D
Principal
Amount* | |
Borrower/Tranche Description | |
Value | |
| Healthcare (continued) | | | |
| CB Diagnostics AB | | | |
| $ | 999,652 | | | Term Loan, 7.27%, Maturing January 16, 2015 | | $ | 979,659 | | |
| | 2,318,673 | | | Term Loan, 7.52%, Maturing January 16, 2016 | | | 2,272,299 | | |
| Community Health Systems, Inc. | | | |
| | 4,934,261 | | | Term Loan, 0.00%, Maturing July 25, 2014(2) | | | 4,826,324 | | |
| | 66,067,691 | | | Term Loan, 7.76%, Maturing July 25, 2014 | | | 64,622,461 | | |
| Concentra, Inc. | | | |
| | 5,985,000 | | | Term Loan, 7.45%, Maturing June 25, 2014 | | | 5,827,894 | | |
| ConMed Corp. | | | |
| | 3,581,472 | | | Term Loan, 6.32%, Maturing April 13, 2013 | | | 3,527,750 | | |
| CRC Health Corp. | | | |
| | 3,861,000 | | | Term Loan, 7.45%, Maturing February 6, 2013 | | | 3,776,541 | | |
| | 3,915,574 | | | Term Loan, 7.45%, Maturing February 6, 2013 | | | 3,829,921 | | |
| Dako Equity Project Delphi | | | |
| EUR | 3,500,282 | | | Term Loan, 7.17%, Maturing May 31, 2016 | | | 4,709,551 | | |
| | 1,568,302 | | | Term Loan, 7.36%, Maturing May 31, 2015 | | | 1,458,521 | | |
| DaVita, Inc. | | | |
| | 32,753,823 | | | Term Loan, 6.75%, Maturing October 5, 2012 | | | 32,132,876 | | |
| Encore Medical Finance, LLC | | | |
| | 8,118,021 | | | Term Loan, 7.84%, Maturing November 3, 2013 | | | 8,097,726 | | |
| FHC Health Systems, Inc. | | | |
| | 888,889 | | | Term Loan, 12.11%, Maturing June 26, 2008 | | | 902,222 | | |
| | 917,817 | | | Term Loan, 12.33%, Maturing December 18, 2009 | | | 931,584 | | |
| | 642,472 | | | Term Loan, 14.33%, Maturing December 18, 2009 | | | 652,109 | | |
| | 3,250,000 | | | Term Loan, 15.33%, Maturing February 7, 2011 | | | 3,282,500 | | |
| Fresenius Medical Care Holdings | | | |
| | 17,715,942 | | | Term Loan, Maturing March 31, 2013(3) | | | 17,523,565 | | |
| Gambro Holding AB | | | |
| EUR | 1,803,396 | | | Term Loan, 6.79%, Maturing June 5, 2014 | | | 2,578,623 | | |
| | 1,324,583 | | | Term Loan, 7.56%, Maturing June 5, 2014 | | | 1,301,403 | | |
| EUR | 1,803,396 | | | Term Loan, 7.29%, Maturing June 5, 2015 | | | 2,591,668 | | |
| | 1,324,583 | | | Term Loan, 8.06%, Maturing June 5, 2015 | | | 1,308,026 | | |
| Hanger Orthopedic Group, Inc. | | | |
| | 5,406,562 | | | Term Loan, 7.45%, Maturing May 30, 2013 | | | 5,301,810 | | |
| HCA, Inc. | | | |
| | 55,964,626 | | | Term Loan, 7.45%, Maturing November 18, 2013 | | | 54,771,236 | | |
| Health Management Association, Inc. | | | |
| | 27,586,375 | | | Term Loan, 6.94%, Maturing February 28, 2014 | | | 26,421,623 | | |
| HealthSouth Corp. | | | |
| | 8,693,250 | | | Term Loan, 7.63%, Maturing March 10, 2013 | | | 8,528,278 | | |
| Iasis Healthcare, LLC | | | |
| | 702,512 | | | Term Loan, 6.79%, Maturing March 14, 2014 | | | 671,558 | | |
| | 7,671,518 | | | Term Loan, 7.07%, Maturing March 14, 2014 | | | 7,333,496 | | |
| | 2,634,420 | | | Term Loan, 7.70%, Maturing March 14, 2014(2) | | | 2,518,342 | | |
| Ikaria Acquisition, Inc. | | | |
| | 4,657,447 | | | Term Loan, 7.70%, Maturing March 28, 2013 | | | 4,564,298 | | |
Principal
Amount* | |
Borrower/Tranche Description | |
Value | |
| Healthcare (continued) | | | |
| IM U.S. Holdings, LLC | | | |
| $ | 10,673,250 | | | Term Loan, 7.20%, Maturing June 26, 2014 | | $ | 10,473,127 | | |
| inVentiv Health, Inc. | | | |
| | 490,000 | | | Term Loan, 0.00%, Maturing July 6, 2014(2) | | | 478,975 | | |
| | 8,064,788 | | | Term Loan, 6.57%, Maturing July 7, 2014 | | | 7,883,330 | | |
| Leiner Health Products, Inc. | | | |
| | 8,078,625 | | | Term Loan, 9.65%, Maturing May 27, 2011 | | | 7,661,227 | | |
| LifeCare Holdings, Inc. | | | |
| | 9,065,000 | | | Term Loan, 8.20%, Maturing August 11, 2012 | | | 8,453,113 | | |
| LifePoint Hospitals, Inc. | | | |
| | 16,519,064 | | | Term Loan, 7.17%, Maturing April 15, 2012 | | | 16,232,938 | | |
| Magellan Health Services, Inc. | | | |
| | 3,679,054 | | | Term Loan, 6.88%, Maturing August 15, 2008 | | | 3,605,473 | | |
| | 1,379,645 | | | Term Loan, 6.87%, Maturing August 15, 2008 | | | 1,352,052 | | |
| Matria Healthcare, Inc. | | | |
| | 3,141,953 | | | Term Loan, 7.34%, Maturing January 19, 2012 | | | 3,079,114 | | |
| MultiPlan Merger Corp. | | | |
| | 4,698,750 | | | Term Loan, 7.25%, Maturing April 12, 2013 | | | 4,608,689 | | |
| | 5,132,553 | | | Term Loan, 7.25%, Maturing April 12, 2013 | | | 5,034,177 | | |
| National Mentor Holdings, Inc. | | | |
| | 484,400 | | | Term Loan, 7.32%, Maturing June 29, 2013 | | | 474,712 | | |
| | 8,063,530 | | | Term Loan, 7.20%, Maturing June 29, 2013 | | | 7,902,259 | | |
| Nyco Holdings | | | |
| EUR | 9,850,000 | | | Term Loan, 7.21%, Maturing December 29, 2014 | | | 13,347,363 | | |
| | 2,903,121 | | | Term Loan, 7.70%, Maturing December 29, 2014 | | | 2,712,603 | | |
| EUR | 9,850,000 | | | Term Loan, 7.71%, Maturing December 29, 2015 | | | 13,411,490 | | |
| | 2,903,121 | | | Term Loan, 8.20%, Maturing December 29, 2015 | | | 2,727,119 | | |
| Psychiatric Solutions Inc. | | | |
| | 997,716 | | | Term Loan, 7.00%, Maturing May 31, 2014 | | | 980,256 | | |
| RadNet Management, Inc. | | | |
| | 2,471,278 | | | Term Loan, 9.22%, Maturing November 15, 2012 | | | 2,477,456 | | |
| ReAble Therapeutics Finance, LLC | | | |
| | 13,519,591 | | | Term Loan, 7.45%, Maturing November 16, 2013 | | | 13,316,797 | | |
| Renal Advantage, Inc. | | | |
| | 2,303,743 | | | Term Loan, 8.10%, Maturing October 5, 2012 | | | 2,254,788 | | |
| Select Medical Holding Corp. | | | |
| | 2,000,000 | | | Revolving Loan, 7.17%, Maturing February 24, 2010(2) | | | 1,850,000 | | |
| | 9,701,250 | | | Term Loan, 7.48%, Maturing February 24, 2012 | | | 9,333,408 | | |
| Sunrise Medical Holdings, Inc. | | | |
| | 5,745,846 | | | Term Loan, 9.42%, Maturing May 13, 2010 | | | 5,171,261 | | |
| Vanguard Health Holding Co., LLC | | | |
| | 11,799,355 | | | Term Loan, Maturing September 23, 2011(3) | | | 11,567,061 | | |
| Viant Holdings, Inc. | | | |
| | 4,862,812 | | | Term Loan, 7.45%, Maturing June 25, 2014 | | | 4,558,887 | | |
| | | | | | | $ | 538,104,460 | | |
See notes to financial statements
27
Floating Rate Portfolio as of October 31, 2007
PORTFOLIO OF INVESTMENTS CONT'D
Principal
Amount* | |
Borrower/Tranche Description | |
Value | |
| Home Furnishings — 1.3% | | | |
| Dometic Corp. | | | |
| $ | 2,790,150 | | | Term Loan, 7.22%, Maturing December 31, 2014 | | $ | 2,707,609 | | |
| | 421,159 | | | Term Loan, 7.72%, Maturing December 31, 2014 | | | 410,805 | | |
| | 1,788,692 | | | Term Loan, 8.01%, Maturing December 31, 2014 | | | 1,744,720 | | |
| Hunter Fan Co. | | | |
| | 415,714 | | | Term Loan, 0.00%, Maturing April 16, 2014(2) | | | 378,300 | | |
| | 4,424,239 | | | Term Loan, 8.03%, Maturing April 16, 2014 | | | 4,026,058 | | |
| Interline Brands, Inc. | | | |
| | 8,330,421 | | | Term Loan, 6.57%, Maturing June 23, 2013 | | | 8,153,400 | | |
| | 5,759,103 | | | Term Loan, 6.57%, Maturing June 23, 2013 | | | 5,636,722 | | |
| National Bedding Co., LLC | | | |
| | 12,785,390 | | | Term Loan, 7.09%, Maturing February 23, 2013 | | | 12,098,176 | | |
| | 1,500,000 | | | Term Loan, 9.75%, Maturing August 31, 2012 | | | 1,391,250 | | |
| Oreck Corp. | | | |
| | 4,234,418 | | | Term Loan, 9.25%, Maturing February 2, 2012 | | | 3,196,986 | | |
| Sanitec, Ltd. Oy | | | |
| EUR | 4,478,261 | | | Term Loan, 7.05%, Maturing April 7, 2013 | | | 6,194,311 | | |
| EUR | 4,478,261 | | | Term Loan, 7.55%, Maturing April 7, 2014 | | | 6,223,816 | | |
| Sealy Mattress Co. | | | |
| | 5,000,000 | | | Revolving Loan, 0.00%, Maturing April 6, 2012(2) | | | 4,750,000 | | |
| | 6,354,620 | | | Term Loan, 6.47%, Maturing August 25, 2012 | | | 6,132,208 | | |
| Simmons Co. | | | |
| | 21,880,243 | | | Term Loan, 7.36%, Maturing December 19, 2011 | | | 21,552,039 | | |
| | 2,500,000 | | | Term Loan, 10.65%, Maturing February 15, 2012 | | | 2,337,500 | | |
| | | | | | | $ | 86,933,900 | | |
| Industrial Equipment — 2.1% | | | |
| Aearo Technologies, Inc. | | | |
| $ | 8,079,750 | | | Term Loan, 7.45%, Maturing July 2, 2014 | | $ | 7,832,308 | | |
| CEVA Group PLC U.S. | | | |
| EUR | 652,779 | | | Term Loan, 7.16%, Maturing January 4, 2014 | | | 927,456 | | |
| EUR | 1,108,493 | | | Term Loan, 7.16%, Maturing January 4, 2014 | | | 1,574,925 | | |
| EUR | 1,362,345 | | | Term Loan, 7.16%, Maturing January 4, 2014 | | | 1,935,593 | | |
| EUR | 1,135,787 | | | Term Loan, 7.73%, Maturing January 4, 2014 | | | 1,613,705 | | |
| Colfax Corp. | | | |
| | 1,993,286 | | | Term Loan, 7.50%, Maturing December 19, 2011 | | | 1,980,828 | | |
| EUR | 4,912,500 | | | Term Loan, 6.98%, Maturing December 19, 2011 | | | 7,071,624 | | |
| EPD Holdings (Goodyear Engineering Products) | | | |
| | 1,353,125 | | | Term Loan, 0.00%, Maturing July 31, 2014(2) | | | 1,331,701 | | |
| | 9,471,875 | | | Term loan, 7.46%, Maturing July 31, 2014 | | | 9,321,907 | | |
| | 2,000,000 | | | Term Loan, 10.71%, Maturing July 13, 2015 | | | 1,936,666 | | |
| Flowserve Corp. | | | |
| | 13,655,506 | | | Term Loan, 6.78%, Maturing August 10, 2012 | | | 13,459,208 | | |
| FR Brand Acquisition Corp. | | | |
| | 10,149,000 | | | Term Loan, 7.53%, Maturing February 7, 2014 | | | 9,755,726 | | |
| Generac Acquisition Corp. | | | |
| | 11,895,000 | | | Term Loan, 7.73%, Maturing November 7, 2013 | | | 10,539,815 | | |
Principal
Amount* | |
Borrower/Tranche Description | |
Value | |
| Industrial Equipment (continued) | | | |
| Gleason Corp. | | | |
| $ | 4,940,737 | | | Term Loan, 7.17%, Maturing June 30, 2013 | | $ | 4,897,505 | | |
| | 1,518,056 | | | Term Loan, 7.42%, Maturing June 30, 2013 | | | 1,504,773 | | |
| Heating Finance PLC (Baxi) | | | |
| EUR | 3,253,597 | | | Term Loan, 0.00%, Maturing December 27, 2010(2)(4) | | | 4,236,427 | | |
| GBP | 2,613,085 | | | Term Loan, 8.35%, Maturing December 27, 2010 | | | 5,048,312 | | |
| Itron, Inc. | | | |
| GBP | 895,000 | | | Term Loan, 8.32%, Maturing April 18, 2014 | | | 1,826,692 | | |
| Jason, Inc. | | | |
| | 1,965,063 | | | Term Loan, Maturing April 30, 2010(3) | | | 1,915,936 | | |
| John Maneely Co. | | | |
| | 15,740,816 | | | Term Loan, 8.52%, Maturing December 8, 2013 | | | 14,717,663 | | |
| KION Group GmbH | | | |
| | 2,250,000 | | | Term Loan, 7.49%, Maturing January 28, 2015 | | | 2,214,461 | | |
| | 2,250,000 | | | Term Loan, 7.74%, Maturing January 28, 2016 | | | 2,223,664 | | |
| Polypore, Inc. | | | |
| | 5,000,000 | | | Term Loan, 0.00%, Maturing July 3, 2013(2) | | | 4,775,000 | | |
| EUR | 1,111,710 | | | Term Loan, 6.66%, Maturing July 3, 2014 | | | 1,568,157 | | |
| | 19,950,000 | | | Term Loan, 7.07%, Maturing July 3, 2014 | | | 19,476,188 | | |
| Terex Corp. | | | |
| | 5,628,750 | | | Term Loan, 6.95%, Maturing July 13, 2013 | | | 5,600,606 | | |
| TFS Acquisition Corp. | | | |
| | 5,445,000 | | | Term Loan, 8.70%, Maturing August 11, 2013 | | | 5,363,325 | | |
| | | | | | | $ | 144,650,171 | | |
| Insurance — 0.9% | | | |
| Alliant Holdings I, Inc. | | | |
| $ | 7,375,000 | | | Term Loan, Maturing August 21, 2014(3) | | $ | 7,301,250 | | |
| CCC Information Services Group, Inc. | | | |
| | 4,557,991 | | | Term Loan, 7.71%, Maturing February 10, 2013 | | | 4,518,108 | | |
| Conseco, Inc. | | | |
| | 29,506,722 | | | Term Loan, 6.82%, Maturing September 25, 2013 | | | 28,264,990 | | |
| Crump Group, Inc. | | | |
| | 8,150,000 | | | Term Loan, Maturing August 4, 2014(3) | | | 8,027,750 | | |
| Hub International Holdings, Inc. | | | |
| | 1,650,336 | | | Term Loan, 8.01%, Maturing June 13, 2014(2) | | | 1,620,424 | | |
| | 7,354,933 | | | Term Loan, 8.20%, Maturing June 13, 2014 | | | 7,221,624 | | |
| U.S.I. Holdings Corp. | | | |
| | 7,107,187 | | | Term Loan, 7.95%, Maturing May 4, 2014 | | | 7,000,580 | | |
| | | | | | | $ | 63,954,726 | | |
| Leisure Goods / Activities / Movies — 5.2% | | | |
| 24 Hour Fitness Worldwide, Inc. | | | |
| $ | 6,982,278 | | | Term Loan, 7.81%, Maturing June 8, 2012 | | $ | 6,877,544 | | |
| AMC Entertainment, Inc. | | | |
| | 2,000,000 | | | Term Loan, Maturing January 26, 2013(3) | | | 1,968,594 | | |
| | 17,697,635 | | | Term Loan, 6.60% Maturing January 26, 2013 | | | 17,419,729 | | |
See notes to financial statements
28
Floating Rate Portfolio as of October 31, 2007
PORTFOLIO OF INVESTMENTS CONT'D
Principal
Amount* | |
Borrower/Tranche Description | |
Value | |
| Leisure Goods / Activities / Movies (continued) | | | |
| AMF Bowling Worldwide, Inc. | | | |
| $ | 6,034,875 | | | Term Loan, 8.21%, Maturing June 8, 2013 | | $ | 5,884,003 | | |
| Bombardier Recreational Product | | | |
| | 14,400,000 | | | Term Loan, 7.70%, Maturing June 28, 2013 | | | 14,022,000 | | |
| Carmike Cinemas, Inc. | | | |
| | 9,288,013 | | | Term Loan, 9.00%, Maturing May 19, 2012 | | | 9,272,530 | | |
| | 6,658,978 | | | Term Loan, 9.23%, Maturing May 19, 2012 | | | 6,647,878 | | |
| Cedar Fair, L.P. | | | |
| | 4,937,500 | | | Term Loan, 6.76%, Maturing August 31, 2011 | | | 4,848,008 | | |
| | 13,016,951 | | | Term Loan, 6.75%, Maturing August 30, 2012 | | | 12,781,019 | | |
| Cinemark, Inc. | | | |
| | 31,436,214 | | | Term Loan, 7.25%, Maturing October 5, 2013 | | | 30,787,842 | | |
| Dave & Buster's, Inc. | | | |
| | 1,252,498 | | | Term Loan, 7.48%, Maturing March 8, 2013 | | | 1,241,539 | | |
| | 2,097,464 | | | Term Loan, 7.48%, Maturing March 8, 2013 | | | 2,079,111 | | |
| Deluxe Entertainment Services | | | |
| | 312,008 | | | Term Loan, 7.45%, Maturing January 28, 2011 | | | 303,428 | | |
| | 6,750,415 | | | Term Loan, 7.45%, Maturing January 28, 2011 | | | 6,564,779 | | |
| | 612,971 | | | Term Loan, 7.45%, Maturing January 28, 2011 | | | 596,114 | | |
| DW Funding, LLC | | | |
| | 5,303,505 | | | Term Loan, 7.10%, Maturing May 4, 2011 | | | 5,237,211 | | |
| Easton-Bell Sports, Inc. | | | |
| | 10,475,823 | | | Term Loan, 6.85%, Maturing March 16, 2012 | | | 10,179,556 | | |
| Fender Musical Instruments Corp. | | | |
| | 2,983,334 | | | Term Loan, 0.00%, Maturing June 9, 2014(2) | | | 2,878,917 | | |
| | 5,951,750 | | | Term Loan, 7.65%, Maturing June 9, 2014 | | | 5,743,439 | | |
| Lions Gate Entertainment, Inc. | | | |
| | 1,022,500 | | | Revolving Loan, 0.00%, Maturing December 31, 2008(2) | | | 996,938 | | |
| Mega Blocks, Inc. | | | |
| | 1,905,638 | | | Term Loan, 7.25%, Maturing July 26, 2012 | | | 1,831,795 | | |
| Metro-Goldwyn-Mayer Holdings, Inc. | | | |
| | 59,882,876 | | | Term Loan, 8.45%, Maturing April 8, 2012 | | | 57,562,415 | | |
| National CineMedia, LLC | | | |
| | 18,250,000 | | | Term Loan, 7.46%, Maturing February 13, 2015 | | | 17,668,281 | | |
| Odeon | | | |
| EUR | 1,064,322 | | | Term Loan, 6.95%, Maturing April 4, 2015 | | | 1,520,080 | | |
| GBP | 623,547 | | | Term Loan, 8.88%, Maturing April 4, 2015 | | | 1,262,401 | | |
| EUR | 1,064,322 | | | Term Loan, 6.95%, Maturing April 4, 2016 | | | 1,527,779 | | |
| GBP | 623,547 | | | Term Loan, 9.25%, Maturing April 4, 2016 | | | 1,271,037 | | |
| Regal Cinemas Corp. | | | |
| | 33,167,481 | | | Term Loan, 6.70%, Maturing November 10, 2010 | | | 32,479,621 | | |
| Revolution Studios Distribution Co., LLC | | | |
| | 10,321,697 | | | Term Loan, 8.51%, Maturing December 21, 2014 | | | 10,270,088 | | |
| Six Flags Theme Parks, Inc. | | | |
| | 26,558,437 | | | Term Loan, 7.75%, Maturing April 30, 2015 | | | 25,371,620 | | |
Principal
Amount* | |
Borrower/Tranche Description | |
Value | |
| Leisure Goods / Activities / Movies (continued) | | | |
| Southwest Sports Group, LLC | | | |
| $ | 9,500,000 | | | Term Loan, 7.75%, Maturing December 22, 2010 | | $ | 9,333,750 | | |
| Universal City Development Partners, Ltd. | | | |
| | 19,996,088 | | | Term Loan, 7.33%, Maturing June 9, 2011 | | | 19,821,122 | | |
| WMG Acquisition Corp. | | | |
| | 4,390,000 | | | Revolving Loan, 0.00%, Maturing February 28, 2010(2) | | | 4,263,788 | | |
| | 24,580,765 | | | Term Loan, 7.42%, Maturing February 28, 2011 | | | 24,058,423 | | |
| Zuffa, LLC | | | |
| | 2,493,750 | | | Term Loan, 7.56%, Maturing June 19, 2015 | | | 2,294,250 | | |
| | | | | | | $ | 356,866,629 | | |
| Lodging and Casinos — 3.5% | | | |
| Ameristar Casinos, Inc. | | | |
| $ | 5,086,727 | | | Term Loan, 8.43%, Maturing November 10, 2012 | | $ | 5,048,576 | | |
| Bally Technologies, Inc. | | | |
| | 14,541,034 | | | Term Loan, 8.64%, Maturing September 4, 2009 | | | 14,498,617 | | |
| CCM Merger, Inc. | | | |
| | 4,998,342 | | | Term Loan, 7.30%, Maturing July 13, 2012 | | | 4,892,127 | | |
| Choctaw Resort Development Enterprise | | | |
| | 3,481,983 | | | Term Loan, 6.95%, Maturing November 4, 2011 | | | 3,429,753 | | |
| Dionysos Leisure Entertainment | | | |
| EUR | 2,500,000 | | | Term Loan, 6.66%, Maturing March 2, 2014(2) | | | 3,562,622 | | |
| EUR | 2,500,000 | | | Term Loan, 7.03%, Maturing March 2, 2015(2) | | | 3,580,706 | | |
| Full Moon Holdco 3 Ltd. | | | |
| GBP | 1,500,000 | | | Term Loan, 9.20%, Maturing November 20, 2014 | | | 3,035,205 | | |
| GBP | 1,500,000 | | | Term Loan, 9.70%, Maturing November 20, 2015 | | | 3,050,785 | | |
| Gala Electric Casinos, Ltd. | | | |
| GBP | 5,000,000 | | | Term Loan, 6.81%, Maturing December 12, 2012(2) | | | 10,023,214 | | |
| GBP | 9,847,984 | | | Term Loan, 8.81%, Maturing December 12, 2013 | | | 19,750,220 | | |
| GBP | 8,897,012 | | | Term Loan, 9.30%, Maturing December 12, 2014 | | | 17,935,448 | | |
| Green Valley Ranch Gaming, LLC | | | |
| | 7,109,826 | | | Term Loan, 7.41%, Maturing February 16, 2014 | | | 6,967,630 | | |
| Herbst Gaming, Inc. | | | |
| | 3,508,038 | | | Term Loan, 8.16%, Maturing January 2, 2014 | | | 3,492,143 | | |
| | 6,308,195 | | | Term Loan, 8.17%, Maturing January 2, 2014 | | | 6,279,613 | | |
| Isle of Capri Casinos, Inc. | | | |
| | 4,142,647 | | | Term Loan, 0.00%, Maturing November 30, 2013(2) | | | 3,998,172 | | |
| | 5,509,720 | | | Term Loan, 6.64%, Maturing November 30, 2013 | | | 5,317,569 | | |
| | 10,083,552 | | | Term Loan, 6.74%, Maturing November 30, 2013 | | | 9,731,888 | | |
| LodgeNet Entertainment Corp. | | | |
| | 6,907,688 | | | Term Loan, 7.20%, Maturing April 4, 2014 | | | 6,793,282 | | |
| New World gaming Partners, Ltd | | | |
| | 9,770,833 | | | Term Loan, Maturing June 30, 2014(3) | | | 9,380,000 | | |
| | 1,954,167 | | | Term Loan, Maturing June 30, 2014(3) | | | 1,876,000 | | |
See notes to financial statements
29
Floating Rate Portfolio as of October 31, 2007
PORTFOLIO OF INVESTMENTS CONT'D
Principal
Amount* | |
Borrower/Tranche Description | |
Value | |
| Lodging and Casinos (continued) | | | |
| Penn National Gaming, Inc. | | | |
| $ | 31,976,717 | | | Term Loan, 6.90%, Maturing October 3, 2012 | | $ | 31,814,627 | | |
| Scandic Hotels | | | |
| EUR | 1,800,000 | | | Term Loan, 6.42%, Maturing April 25, 2015 | | | 2,513,005 | | |
| EUR | 1,800,000 | | | Term Loan, 6.79%, Maturing April 25, 2016 | | | 2,526,026 | | |
| Seminole Tribe of Florida | | | |
| | 3,184,008 | | | Term Loan, 6.75%, Maturing December 31, 2014 | | | 3,162,118 | | |
| | 952,227 | | | Term Loan, 6.97%, Maturing December 31, 2014(2) | | | 945,680 | | |
| | 3,213,765 | | | Term Loan, 7.13%, Maturing December 31, 2014 | | | 3,191,671 | | |
| Trump Entertainment Resorts Holdings, L.P. | | | |
| | 5,351,813 | | | Term Loan, 7.86%, Maturing May 20, 2012 | | | 5,298,294 | | |
| | 5,351,813 | | | Term Loan, 7.90%, Maturing May 20, 2012 | | | 5,298,294 | | |
| Venetian Casino Resort/Las Vegas Sands Inc. | | | |
| | 12,006,667 | | | Term Loan, 0.00%, Maturing May 23, 2014(2) | | | 11,675,907 | | |
| | 23,275,000 | | | Term Loan, 6.95%, Maturing May 23, 2014 | | | 22,633,820 | | |
| VML US Finance, LLC | | | |
| | 3,333,333 | | | Term Loan, 7.45%, Maturing May 25, 2012 | | | 3,271,130 | | |
| | 666,667 | | | Term Loan, 7.45%, Maturing May 25, 2013 | | | 654,226 | | |
| | 2,000,000 | | | Term Loan, 7.45%, Maturing May 25, 2013 | | | 1,962,678 | | |
| Wimar OpCo, LLC | | | |
| | 3,852,060 | | | Term Loan, 7.45%, Maturing January 3, 2012 | | | 3,765,389 | | |
| | | | | | | $ | 241,356,435 | | |
| Nonferrous Metals / Minerals — 1.4% | | | |
| Alpha Natural Resources, LLC | | | |
| $ | 9,142,187 | | | Term Loan, 6.95%, Maturing October 26, 2012 | | $ | 9,100,289 | | |
| Compass Minerals Group, Inc. | | | |
| | 7,315,269 | | | Term Loan, 6.70%, Maturing December 22, 2012 | | | 7,217,734 | | |
| Euramax International, Inc. | | | |
| | 4,582,479 | | | Term Loan, 8.24%, Maturing June 28, 2012 | | | 4,269,344 | | |
| GBP | 930,184 | | | Term Loan, 9.50%, Maturing June 29, 2012 | | | 1,797,056 | | |
| Magnum Coal Co. | | | |
| | 1,375,000 | | | Term Loan, 8.01%, Maturing March 21, 2013 | | | 1,254,688 | | |
| | 13,543,750 | | | Term Loan, 8.42%, Maturing March 21, 2013 | | | 12,358,672 | | |
| Murray Energy Corp. | | | |
| | 10,686,000 | | | Term Loan, 8.54%, Maturing January 28, 2010 | | | 10,686,000 | | |
| Noranda Aluminum Acquisition | | | |
| | 5,106,188 | | | Term Loan, 7.51%, Maturing May 18, 2014 | | | 5,008,317 | | |
| Novelis, Inc. | | | |
| | 3,598,789 | | | Term Loan, 7.20%, Maturing July 7, 2014 | | | 3,507,319 | | |
| | 7,917,336 | | | Term Loan, 7.20%, Maturing July 7, 2014 | | | 7,716,101 | | |
| Oxbow Carbon and Mineral Holdings | | | |
| | 17,496,808 | | | Term Loan, 7.19%, Maturing May 8, 2014 | | | 16,873,484 | | |
| | 1,536,418 | | | Term Loan, 7.20%, Maturing May 8, 2014 | | | 1,481,683 | | |
| Stillwater Mining Co. | | | |
| | 4,360,000 | | | Revolving Loan, 4.75%, Maturing July 30, 2009(2) | | | 4,283,700 | | |
| | 3,639,333 | | | Term Loan, 7.06%, Maturing July 30, 2010 | | | 3,609,763 | | |
Principal
Amount* | |
Borrower/Tranche Description | |
Value | |
| Nonferrous Metals / Minerals (continued) | | | |
| Thompson Creek Metals Co. | | | |
| $ | 6,747,396 | | | Term Loan, 9.56%, Maturing October 26, 2012 | | $ | 6,764,264 | | |
| Tube City IMS Corp. | | | |
| | 162,162 | | | Term Loan, 7.45%, Maturing January 25, 2014 | | | 156,757 | | |
| | 1,331,149 | | | Term Loan, 7.45%, Maturing January 25, 2014 | | | 1,286,777 | | |
| | | | | | | $ | 97,371,948 | | |
| Oil and Gas — 2.3% | | | |
| Atlas Pipeline Partners, L.P. | | | |
| $ | 10,960,000 | | | Term Loan, 7.55%, Maturing July 20, 2014 | | $ | 10,953,150 | | |
| Big West Oil, LLC | | | |
| | 3,423,750 | | | Term Loan, 0.00%, Maturing May 1, 2014(2) | | | 3,321,038 | | |
| | 2,785,688 | | | Term Loan, 7.45%, Maturing May 1, 2014 | | | 2,702,117 | | |
| Citgo Petroleum Corp. | | | |
| | 7,971,133 | | | Term Loan, 6.22%, Maturing November 15, 2012 | | | 7,811,710 | | |
| Dresser, Inc. | | | |
| | 14,277,976 | | | Term Loan, 7.99%, Maturing May 4, 2014 | | | 14,014,733 | | |
| Dynegy Holdings, Inc. | | | |
| | 35,419,681 | | | Term Loan, 6.32%, Maturing April 2, 2013 | | | 34,332,190 | | |
| | 2,055,319 | | | Term Loan, 6.63%, Maturing April 2, 2013 | | | 1,992,215 | | |
| El Paso Corp. | | | |
| | 10,960,000 | | | Term Loan, 7.32%, Maturing July 31, 2011 | | | 10,829,850 | | |
| Energy Transfer Equity, L.P. | | | |
| | 1,000,000 | | | Term Loan, 7.11%, Maturing February 8, 2012 | | | 985,313 | | |
| Enterprise GP Holdings L.P | | | |
| | 8,400,000 | | | Term Loan, Maturing October 31, 2014(3) | | | 8,386,879 | | |
| Hercules Offshore, Inc. | | | |
| | 6,309,188 | | | Term Loan, 6.99%, Maturing July 11, 2013 | | | 6,238,209 | | |
| Key Energy Services, Inc. | | | |
| | 3,000,000 | | | Term Loan, 7.96%, Maturing June 30, 2012 | | | 2,991,564 | | |
| | 3,762,198 | | | Term Loan, 7.64%, Maturing June 30, 2012 | | | 3,751,618 | | |
| Kinder Morgan, Inc. | | | |
| | 23,587,516 | | | Term Loan, 6.26%, Maturing May 21, 2014 | | | 23,046,961 | | |
| Primary Natural Resources, Inc. | | | |
| | 13,248,250 | | | Term Loan, 7.50%, Maturing July 28, 2010(4) | | | 13,082,647 | | |
| Targa Resources, Inc. | | | |
| | 4,828,492 | | | Term Loan, 7.20%, Maturing October 31, 2012 | | | 4,793,486 | | |
| | 10,634,944 | | | Term Loan, 7.53%, Maturing October 31, 2012 | | | 10,557,841 | | |
| | | | | | | $ | 159,791,521 | | |
| Publishing — 9.2% | | | |
| American Media Operations, Inc. | | | |
| $ | 23,000,000 | | | Term Loan, 8.80%, Maturing January 31, 2013 | | $ | 22,741,250 | | |
| Aster Zweite Beteiligungs GmbH | | | |
| EUR | 708,499 | | | Term Loan, 7.00%, Maturing September 27, 2013 | | | 995,124 | | |
| | 6,825,000 | | | Term Loan, 7.39%, Maturing September 27, 2013 | | | 6,590,391 | | |
See notes to financial statements
30
Floating Rate Portfolio as of October 31, 2007
PORTFOLIO OF INVESTMENTS CONT'D
Principal
Amount* | |
Borrower/Tranche Description | |
Value | |
| Publishing (continued) | | | |
| Black Press US Partnership | | | |
| $ | 1,701,700 | | | Term Loan, 7.54%, Maturing August 2, 2013 | | $ | 1,671,920 | | |
| | 2,802,800 | | | Term Loan, 7.54%, Maturing August 2, 2013 | | | 2,753,751 | | |
| CanWest MediaWorks, Ltd. | | | |
| | 7,381,500 | | | Term Loan, 7.54%, Maturing July 13, 2014 | | | 7,307,685 | | |
| Dex Media West, LLC | | | |
| | 7,146,484 | | | Term Loan, 7.05%, Maturing March 9, 2010 | | | 7,078,592 | | |
| | 1,961,433 | | | Term Loan, 7.01%, Maturing September 9, 2010 | | | 1,942,738 | | |
| GateHouse Media Operating, Inc. | | | |
| | 4,825,000 | | | Term Loan, 7.27%, Maturing August 28, 2014 | | | 4,502,328 | | |
| | 13,275,000 | | | Term Loan, 7.51%, Maturing August 28, 2014 | | | 12,387,234 | | |
| | 5,750,000 | | | Term Loan, 7.72%, Maturing August 28, 2014 | | | 5,369,063 | | |
| Hanley-Wood, LLC | | | |
| | 7,500,000 | | | Term Loan, 7.49%, Maturing March 8, 2014 | | | 6,234,375 | | |
| Idearc, Inc. | | | |
| | 58,408,625 | | | Term Loan, 7.20%, Maturing November 17, 2014 | | | 57,675,480 | | |
| Josten's Corp. | | | |
| | 4,000,000 | | | Revolving Loan, 6.81%, Maturing October 4, 2009(2) | | | 3,960,000 | | |
| | 9,488,152 | | | Term Loan, Maturing October 4, 2011(3) | | | 9,422,921 | | |
| Lamar Media Corp. | | | |
| | 2,000,000 | | | Term Loan, 6.50%, Maturing March 31, 2014 | | | 1,986,250 | | |
| MediaNews Group, Inc. | | | |
| | 12,040,626 | | | Term Loan, 6.64%, Maturing December 30, 2010 | | | 11,438,595 | | |
| | 7,579,063 | | | Term Loan, 7.14%, Maturing August 2, 2013 | | | 7,256,952 | | |
| Mediannuaire Holding | | | |
| EUR | 10,000,000 | | | Term Loan, 6.50%, Maturing November 23, 2013 | | | 14,146,510 | | |
| EUR | 2,000,000 | | | Term Loan, 7.00%, Maturing October 10, 2014 | | | 2,819,097 | | |
| EUR | 2,000,000 | | | Term Loan, 7.50%, Maturing October 10, 2015 | | | 2,833,564 | | |
| Merrill Communications, LLC | | | |
| | 11,380,107 | | | Term Loan, 7.27%, Maturing February 9, 2009 | | | 11,209,405 | | |
| Nebraska Book Co., Inc. | | | |
| | 11,049,120 | | | Term Loan, 7.65%, Maturing March 4, 2011 | | | 10,883,384 | | |
| Nelson Education, Ltd. | | | |
| | 4,300,000 | | | Term Loan, 7.70%, Maturing July 5, 2014 | | | 4,036,625 | | |
| Newspaper Holdings, Inc. | | | |
| | 21,650,000 | | | Term Loan, 6.31%, Maturing July 24, 2014 | | | 20,351,000 | | |
| Nielsen Finance, LLC | | | |
| | 50,403,169 | | | Term Loan, 7.36%, Maturing August 9, 2013 | | | 49,150,096 | | |
| Philadelphia Newspapers, LLC | | | |
| | 6,040,928 | | | Term Loan, 8.75%, Maturing June 29, 2013 | | | 5,557,654 | | |
| R.H. Donnelley Corp. | | | |
| | 38,817,720 | | | Term Loan, 7.01%, Maturing June 30, 2011 | | | 38,354,081 | | |
| | 10,122,608 | | | Term Loan, 7.06%, Maturing June 30, 2011 | | | 9,993,545 | | |
| Reader's Digest Association | | | |
| | 11,000,000 | | | Revolving Loan, 6.94%, Maturing March 2, 2013(2) | | | 10,285,000 | | |
| EUR | 1,130,168 | | | Term Loan, 6.72%, Maturing March 2, 2014 | | | 1,557,405 | | |
| | 37,785,362 | | | Term Loan, 7.54%, Maturing March 2, 2014 | | | 35,933,880 | | |
Principal
Amount* | |
Borrower/Tranche Description | |
Value | |
| Publishing (continued) | | | |
| Riverdeep Interactive Learning USA, Inc. | | | |
| $ | 15,426,428 | | | Term Loan, 7.95%, Maturing December 20, 2013 | | $ | 15,362,147 | | |
| Seat Pagine Gialle SpA | | | |
| EUR | 14,526,833 | | | Term Loan, 6.16%, Maturing May 25, 2012 | | | 20,876,578 | | |
| SGS International, Inc. | | | |
| | 990,831 | | | Term Loan, 7.68%, Maturing December 30, 2011(2) | | | 980,922 | | |
| | 1,203,563 | | | Term Loan, 7.84%, Maturing December 30, 2011 | | | 1,191,527 | | |
| Source Media, Inc. | | | |
| | 12,146,182 | | | Term Loan, 7.07%, Maturing November 8, 2011 | | | 11,827,345 | | |
| SP Newsprint Co. | | | |
| | 8,463,065 | | | Term Loan, 7.00%, Maturing January 9, 2010 | | | 8,293,804 | | |
| Springer Science+Business Media | | | |
| | 1,935,088 | | | Term Loan, 7.37%, Maturing June 30, 2011 | | | 1,867,360 | | |
| EUR | 1,359,516 | | | Term Loan, 6.79%, Maturing September 16, 2011 | | | 1,941,064 | | |
| | 3,008,560 | | | Term Loan, 7.75%, Maturing September 16, 2011 | | | 2,953,091 | | |
| EUR | 971,370 | | | Term Loan, 6.79%, Maturing September 16, 2011 | | | 1,383,372 | | |
| EUR | 603,718 | | | Term Loan, 7.16%, Maturing September 16, 2012 | | | 865,968 | | |
| EUR | 587,880 | | | Term Loan, 7.16%, Maturing September 16, 2012 | | | 843,251 | | |
| | 3,259,273 | | | Term Loan, 8.12%, Maturing September 16, 2012 | | | 3,214,458 | | |
| | 3,008,560 | | | Term Loan, 8.12%, Maturing September 16, 2011 | | | 2,968,134 | | |
| The Star Tribune Co. | | | |
| | 8,258,500 | | | Term Loan, 7.45%, Maturing March 5, 2014 | | | 6,888,968 | | |
| Thomas Nelson, Inc. | | | |
| | 1,975,000 | | | Term Loan, 7.41%, Maturing June 12, 2012 | | | 1,893,531 | | |
| TL Acquisitions, Inc. | | | |
| | 9,050,000 | | | Term Loan, 7.95%, Maturing July 5, 2014 | | | 8,773,468 | | |
| Trader Media Corp. | | | |
| GBP | 17,310,500 | | | Term Loan, 8.42%, Maturing March 23, 2015 | | | 34,611,468 | | |
| Tribune Co. | | | |
| | 16,100,000 | | | Term Loan, 7.74%, Maturing May 17, 2009 | | | 15,937,744 | | |
| | 25,735,500 | | | Term Loan, 8.24%, Maturing May 17, 2014 | | | 23,959,751 | | |
| World Directories Acquisition | | | |
| EUR | 10,000,000 | | | Term Loan, 6.72%, Maturing May 31, 2014 | | | 13,968,371 | | |
| Xsys US, Inc. | | | |
| EUR | 2,750,000 | | | Term Loan, 7.00%, Maturing September 27, 2013 | | | 3,862,520 | | |
| EUR | 791,501 | | | Term Loan, 7.00%, Maturing September 27, 2013 | | | 1,111,705 | | |
| | 7,701,575 | | | Term Loan, 7.39%, Maturing September 27, 2013 | | | 7,436,833 | | |
| EUR | 2,750,000 | | | Term Loan, 7.00%, Maturing September 27, 2014 | | | 3,880,758 | | |
| | 7,866,565 | | | Term Loan, 7.39%, Maturing September 27, 2014 | | | 7,625,651 | | |
| EUR | 1,000,000 | | | Term Loan, 8.55%, Maturing September 27, 2015 | | | 1,385,866 | | |
| YBR Acquisition BV | | | |
| EUR | 1,250,000 | | | Term Loan, 7.23%, Maturing June 30, 2013 | | | 1,793,420 | | |
| EUR | 3,500,000 | | | Term Loan, 7.23%, Maturing June 30, 2013 | | | 5,021,577 | | |
| EUR | 1,250,000 | | | Term Loan, 7.73%, Maturing June 30, 2014 | | | 1,799,880 | | |
| EUR | 3,500,000 | | | Term Loan, 7.73%, Maturing June 30, 2014 | | | 5,039,664 | | |
See notes to financial statements
31
Floating Rate Portfolio as of October 31, 2007
PORTFOLIO OF INVESTMENTS CONT'D
Principal
Amount* | |
Borrower/Tranche Description | |
Value | |
| Publishing (continued) | | | |
| Yell Group, PLC | | | |
| $ | 21,025,000 | | | Term Loan, 6.75%, Maturing October 27, 2012 | | $ | 20,783,549 | | |
| | | | | | | $ | 628,769,640 | | |
| Radio and Television — 4.5% | | | |
| Block Communications, Inc. | | | |
| $ | 6,980,687 | | | Term Loan, 7.20%, Maturing December 22, 2011 | | $ | 6,736,363 | | |
| Citadel Broadcasting Corp. | | | |
| | 34,925,000 | | | Term Loan, 6.63%, Maturing June 12, 2014 | | | 33,606,581 | | |
| CMP Susquehanna Corp. | | | |
| | 2,000,000 | | | Term Loan, 0.00%, Maturing May 5, 2011(2) | | | 1,950,000 | | |
| | 13,281,204 | | | Term Loan, 7.07%, Maturing May 5, 2012 | | | 12,882,768 | | |
| Cumulus Media, Inc. | | | |
| | 16,534,560 | | | Term Loan, 7.00%, Maturing June 11, 2014 | | | 16,341,651 | | |
| Discovery Communications, Inc. | | | |
| | 10,548,563 | | | Term Loan, 7.20%, Maturing May 14, 2014 | | | 10,434,290 | | |
| Emmis Operating Co. | | | |
| | 6,201,600 | | | Term Loan, 7.20%, Maturing November 1, 2013 | | | 6,069,816 | | |
| Entravision Communications Corp. | | | |
| | 935,754 | | | Term Loan, 6.73%, Maturing March 29, 2013 | | | 921,327 | | |
| Gray Television, Inc. | | | |
| | 10,808,753 | | | Term Loan, 6.73%, Maturing January 19, 2015 | | | 10,448,465 | | |
| HIT Entertainment, Inc. | | | |
| | 3,935,678 | | | Term Loan, 7.17%, Maturing June 1, 2012 | | | 3,861,884 | | |
| Local TV Finance, LLC | | | |
| | 1,995,000 | | | Term Loan, 7.31%, Maturing May 7, 2013 | | | 1,940,138 | | |
| NEP II, Inc. | | | |
| | 6,367,980 | | | Term Loan, 7.45%, Maturing February 16, 2014 | | | 6,093,361 | | |
| Nexstar Broadcasting, Inc. | | | |
| | 12,526,588 | | | Term Loan, 6.95%, Maturing October 1, 2012 | | | 12,103,815 | | |
| | 11,863,274 | | | Term Loan, 6.95%, Maturing October 1, 2012 | | | 11,462,888 | | |
| NextMedia Operating, Inc. | | | |
| | 1,688,423 | | | Term Loan, 7.05%, Maturing November 15, 2012 | | | 1,616,665 | | |
| | 750,410 | | | Term Loan, 7.12%, Maturing November 15, 2012 | | | 718,518 | | |
| PanAmSat Corp. | | | |
| | 24,460,656 | | | Term Loan, 7.12%, Maturing January 3, 2014 | | | 24,213,872 | | |
| Paxson Communications Corp. | | | |
| | 17,925,000 | | | Term Loan, 8.49%, Maturing January 15, 2012 | | | 17,745,750 | | |
| Raycom TV Broadcasting, LLC | | | |
| | 13,333,373 | | | Term Loan, 6.31%, Maturing June 25, 2014 | | | 13,000,038 | | |
| SFX Entertainment | | | |
| | 4,878,326 | | | Term Loan, 7.95%, Maturing June 21, 2013 | | | 4,805,151 | | |
| Spanish Broadcasting System, Inc. | | | |
| | 12,907,400 | | | Term Loan, 6.95%, Maturing June 11, 2012 | | | 12,245,896 | | |
| Tyrol Acquisition 2 SAS | | | |
| EUR | 7,300,000 | | | Term Loan, 6.37%, Maturing January 19, 2015 | | | 10,252,685 | | |
| EUR | 7,300,000 | | | Term Loan, 6.62%, Maturing January 19, 2016 | | | 10,296,145 | | |
Principal
Amount* | |
Borrower/Tranche Description | |
Value | |
| Radio and Television (continued) | | | |
| Univision Communications, Inc. | | | |
| $ | 6,125,000 | | | Term Loan, 7.25%, Maturing March 29, 2009 | | $ | 6,086,719 | | |
| | 2,458,054 | | | Term Loan, 0.00%, Maturing September 29, 2014(2) | | | 2,333,615 | | |
| | 63,275,168 | | | Term Loan, 7.20%, Maturing September 29, 2014 | | | 60,071,862 | | |
| Young Broadcasting, Inc. | | | |
| | 8,391,838 | | | Term Loan, 7.87%, Maturing November 3, 2012 | | | 8,056,164 | | |
| | 985,000 | | | Term Loan, 7.87%, Maturing November 3, 2012 | | | 945,600 | | |
| | | | | | | $ | 307,242,027 | | |
| Rail Industries — 0.4% | | | |
| Kansas City Southern Railway Co. | | | |
| $ | 15,010,000 | | | Term Loan, 6.68%, Maturing April 26, 2013 | | $ | 14,751,077 | | |
| | 1,995,000 | | | Term Loan, 7.01%, Maturing April 28, 2013 | | | 1,970,063 | | |
| RailAmerica, Inc. | | | |
| | 13,000,000 | | | Term Loan, 7.81%, Maturing August 14, 2008 | | | 12,821,250 | | |
| | | | | | | $ | 29,542,390 | | |
| Retailers (Except Food and Drug) — 2.1% | | | |
| American Achievement Corp. | | | |
| $ | 5,097,642 | | | Term Loan, 7.48%, Maturing March 25, 2011 | | $ | 4,995,689 | | |
| Amscan Holdings, Inc. | | | |
| | 4,452,625 | | | Term Loan, 7.56%, Maturing May 25, 2013 | | | 4,319,046 | | |
| Claire's Stores, Inc. | | | |
| | 3,042,375 | | | Term Loan, 7.95%, Maturing May 24, 2014 | | | 2,876,471 | | |
| Coinmach Laundry Corp. | | | |
| | 24,897,935 | | | Term Loan, 7.74%, Maturing December 19, 2012 | | | 24,773,446 | | |
| Cumberland Farms, Inc. | | | |
| | 5,940,000 | | | Term Loan, 7.64%, Maturing September 29, 2013 | | | 5,880,600 | | |
| FTD, Inc. | | | |
| | 4,516,398 | | | Term Loan, 6.50%, Maturing July 28, 2013 | | | 4,482,525 | | |
| Harbor Freight Tools USA, Inc. | | | |
| | 11,361,521 | | | Term Loan, 7.29%, Maturing July 15, 2010 | | | 10,933,691 | | |
| Mapco Express, Inc. | | | |
| | 3,570,432 | | | Term Loan, 7.74%, Maturing April 28, 2011 | | | 3,512,412 | | |
| Neiman Marcus Group, Inc. | | | |
| | 9,555,758 | | | Term Loan, 7.45%, Maturing April 5, 2013 | | | 9,419,990 | | |
| Orbitz Worldwide, Inc. | | | |
| | 10,750,000 | | | Term Loan, 8.20%, Maturing July 25, 2014 | | | 10,608,906 | | |
| Oriental Trading Co., Inc. | | | |
| | 2,000,000 | | | Term Loan, 10.76%, Maturing January 31, 2013 | | | 1,935,000 | | |
| | 12,520,427 | | | Term Loan, 7.40%, Maturing July 31, 2013 | | | 12,097,862 | | |
| Pep Boys - Manny, Moe, & Jack, (The) | | | |
| | 7,132,620 | | | Term Loan, 7.54%, Maturing January 27, 2011 | | | 7,043,462 | | |
| Rent-A-Center, Inc. | | | |
| | 6,807,813 | | | Term Loan, 7.20%, Maturing November 15, 2012 | | | 6,683,006 | | |
| Rover Acquisition Corp. | | | |
| | 1,980,000 | | | Term Loan, 7.33%, Maturing October 26, 2013 | | | 1,937,925 | | |
See notes to financial statements
32
Floating Rate Portfolio as of October 31, 2007
PORTFOLIO OF INVESTMENTS CONT'D
Principal
Amount* | |
Borrower/Tranche Description | |
Value | |
| Retailers (Except Food and Drug) (continued) | | | |
| Savers, Inc. | | | |
| $ | 2,804,162 | | | Term Loan, 7.99%, Maturing August 11, 2012 | | $ | 2,734,058 | | |
| | 3,044,373 | | | Term Loan, 7.99%, Maturing August 11, 2012 | | | 2,968,264 | | |
| The Yankee Candle Company, Inc. | | | |
| | 9,651,500 | | | Term Loan, 7.20%, Maturing February 6, 2014 | | | 9,404,180 | | |
| Vivarte | | | |
| EUR | 6,688,988 | | | Term Loan, 6.77%, Maturing May 29, 2015 | | | 9,049,479 | | |
| EUR | 247,396 | | | Term Loan, 6.77%, Maturing May 29, 2015 | | | 334,700 | | |
| EUR | 63,616 | | | Term Loan, 6.77%, Maturing May 29, 2015 | | | 86,066 | | |
| EUR | 6,688,988 | | | Term Loan, 7.27%, Maturing May 29, 2016 | | | 9,093,027 | | |
| EUR | 247,396 | | | Term Loan, 7.27%, Maturing May 29, 2016 | | | 336,311 | | |
| EUR | 63,616 | | | Term Loan, 7.27%, Maturing May 29, 2016 | | | 86,480 | | |
| | | | | | | $ | 145,592,596 | | |
| Steel — 0.1% | | | |
| Algoma Acquisition Corp. | | | |
| $ | 1,000,000 | | | Term Loan, Maturing June 20, 2013(3) | | $ | 965,000 | | |
| | 4,264,313 | | | Term Loan, 8.09% Maturing June 20, 2013 | | | 4,115,062 | | |
| | | | | | | $ | 5,080,062 | | |
| Surface Transport — 0.6% | | | |
| Delphi Acquisition Holding, Inc. | | | |
| $ | 1,183,488 | | | Term Loan, 7.57%, Maturing April 10, 2015 | | $ | 1,153,901 | | |
| | 282,788 | | | Term Loan, 7.57%, Maturing April 10, 2015 | | | 275,718 | | |
| | 1,466,276 | | | Term Loan, 8.07%, Maturing April 10, 2016 | | | 1,436,951 | | |
| Oshkosh Truck Corp. | | | |
| | 4,374,089 | | | Term Loan, 7.45%, Maturing December 6, 2013 | | | 4,310,529 | | |
| Ozburn-Hessey Holding Co., LLC | | | |
| | 3,925,495 | | | Term Loan, 8.53%, Maturing August 10, 2012 | | | 3,768,475 | | |
| SIRVA Worldwide, Inc. | | | |
| | 5,866,025 | | | Term Loan, 12.50%, Maturing December 1, 2010 | | | 4,155,099 | | |
| Swift Transportation Co., Inc. | | | |
| | 6,000,000 | | | Term Loan, 8.12%, Maturing May 10, 2012 | | | 5,145,000 | | |
| | 19,927,907 | | | Term Loan, 8.38%, Maturing May 10, 2014 | | | 17,611,288 | | |
| | | | | | | $ | 37,856,961 | | |
| Telecommunications — 3.5% | | | |
| Alaska Communications Systems Holdings, Inc. | | | |
| $ | 2,625,000 | | | Term Loan, 6.95%, Maturing February 1, 2012 | | $ | 2,573,156 | | |
| | 12,150,000 | | | Term Loan, 6.95%, Maturing February 1, 2012 | | | 11,910,038 | | |
| American Cellular Corp. | | | |
| | 3,000,000 | | | Term Loan, 0.00%, Maturing March 15, 2014(2) | | | 2,988,750 | | |
| Asurion Corp. | | | |
| | 20,000,000 | | | Term Loan, 8.36%, Maturing July 13, 2012 | | | 19,593,760 | | |
| | 2,000,000 | | | Term Loan, 11.72%, Maturing January 13, 2013 | | | 1,948,126 | | |
Principal
Amount* | |
Borrower/Tranche Description | |
Value | |
| Telecommunications (continued) | | | |
| BCM Luxembourg, Ltd. | | | |
| EUR | 6,000,000 | | | Term Loan, 6.63%, Maturing September 30, 2014 | | $ | 8,526,091 | | |
| EUR | 6,000,000 | | | Term Loan, 6.88%, Maturing September 30, 2015 | | | 8,573,348 | | |
| Cellular South, Inc. | | | |
| | 2,981,250 | | | Term Loan, 0.00%, Maturing May 29, 2014(2) | | | 2,932,805 | | |
| | 8,921,391 | | | Term Loan, 6.63%, Maturing May 29, 2014 | | | 8,776,418 | | |
| Centennial Cellular Operating Co., LLC | | | |
| | 4,500,000 | | | Revolving Loan, 0.00%, Maturing February 9, 2010(2) | | | 4,297,500 | | |
| | 14,147,788 | | | Term Loan, 7.22%, Maturing February 9, 2011 | | | 14,012,620 | | |
| Cincinnati Bell, Inc. | | | |
| | 2,345,250 | | | Term Loan, 7.02%, Maturing August 31, 2012 | | | 2,311,244 | | |
| Consolidated Communications, Inc. | | | |
| | 21,847,842 | | | Term Loan, 6.95%, Maturing July 27, 2015 | | | 21,779,568 | | |
| Crown Castle Operating Co. | | | |
| | 3,047,125 | | | Term Loan, 6.64%, Maturing January 9, 2014 | | | 2,982,849 | | |
| FairPoint Communications, Inc. | | | |
| | 21,785,000 | | | Term Loan, 7.00%, Maturing February 8, 2012 | | | 21,599,828 | | |
| Hargray Acquisition Co. | | | |
| | 3,665,813 | | | Term Loan, 7.45%, Maturing June 27, 2014 | | | 3,605,099 | | |
| Intelsat Subsidiary Holding Co. | | | |
| | 7,734,217 | | | Term Loan, 7.12%, Maturing July 3, 2013 | | | 7,657,842 | | |
| Iowa Telecommunications Services | | | |
| | 6,998,000 | | | Term Loan, 6.99%, Maturing November 23, 2011 | | | 6,921,463 | | |
| IPC Systems, Inc. | | | |
| | 9,226,875 | | | Term Loan, 7.45%, Maturing May 31, 2014 | | | 8,617,901 | | |
| GBP | 3,448,518 | | | Term Loan, 8.57%, Maturing May 31, 2014 | | | 6,644,405 | | |
| Macquarie UK Broadcast Ventures, Ltd. | | | |
| GBP | 7,050,000 | | | Term Loan, 8.04%, Maturing October 3, 2014 | | | 14,297,491 | | |
| NTelos, Inc. | | | |
| | 12,895,356 | | | Term Loan, 7.01%, Maturing August 24, 2011 | | | 12,774,462 | | |
| Stratos Global Corp. | | | |
| | 7,499,250 | | | Term Loan, 7.95%, Maturing February 13, 2012 | | | 7,374,260 | | |
| Telesat Canada, Inc. | | | |
| | 399,580 | | | Term Loan, Maturing October 22, 2014(3) | | | 396,333 | | |
| | 4,675,082 | | | Term Loan, Maturing October 22, 2014(3) | | | 4,637,097 | | |
| Triton PCS, Inc. | | | |
| | 16,285,998 | | | Term Loan, 8.01%, Maturing November 18, 2009 | | | 16,272,431 | | |
| Windstream Corp. | | | |
| | 13,387,155 | | | Term Loan, Maturing July 17, 2013(3) | | | 13,317,823 | | |
| | | | | | | $ | 237,322,708 | | |
| Utilities — 2.1% | | | |
| AEI Finance Holding, LLC | | | |
| $ | 1,409,088 | | | Revolving Loan, 5.10%, Maturing March 30, 2012 | | $ | 1,380,907 | | |
| | 10,057,136 | | | Term Loan, 8.20%, Maturing March 30, 2014 | | | 9,855,994 | | |
| BRSP, LLC | | | |
| | 14,588,858 | | | Term Loan, 8.38%, Maturing July 13, 2009 | | | 14,406,497 | | |
See notes to financial statements
33
Floating Rate Portfolio as of October 31, 2007
PORTFOLIO OF INVESTMENTS CONT'D
Principal
Amount* | |
Borrower/Tranche Description | |
Value | |
| Utilities (continued) | | | |
| Cogentrix Delaware Holdings, Inc. | | | |
| $ | 4,352,647 | | | Term Loan, 6.26%, Maturing April 14, 2012 | | $ | 4,271,035 | | |
| Covanta Energy Corp. | | | |
| | 5,253,608 | | | Term Loan, 5.10%, Maturing February 9, 2014 | | | 5,117,892 | | |
| | 10,618,035 | | | Term Loan, 6.88%, Maturing February 9, 2014 | | | 10,343,740 | | |
| Elster Group GmbH (Ruhrgas) | | | |
| | 1,250,000 | | | Term Loan, 7.63%, Maturing September 30, 2013 | | | 1,242,969 | | |
| | 1,250,000 | | | Term Loan, 7.88%, Maturing September 30, 2014 | | | 1,249,219 | | |
| LS Power Acquisition Co. | | | |
| | 616,451 | | | Term Loan, 7.19%, Maturing May 1, 2014 | | | 605,663 | | |
| Mirant North America, LLC | | | |
| | 6,201,591 | | | Term Loan, 6.50%, Maturing January 3, 2013 | | | 6,105,336 | | |
| NRG Energy, Inc. | | | |
| | 19,115,997 | | | Term Loan, 0.00%, Maturing June 1, 2014(2) | | | 18,743,923 | | |
| | 14,466,620 | | | Term Loan, 6.85%, Maturing June 1, 2014 | | | 14,187,240 | | |
| | 34,766,114 | | | Term Loan, 6.95%, Maturing June 1, 2014 | | | 34,094,710 | | |
| NSG Holdings, LLC | | | |
| | 306,124 | | | Term Loan, 7.21%, Maturing June 15, 2014 | | | 293,879 | | |
| | 2,647,541 | | | Term Loan, 7.21%, Maturing June 15, 2014 | | | 2,541,640 | | |
| Pike Electric, Inc. | | | |
| | 2,872,755 | | | Term Loan, 6.69%, Maturing July 2, 2012 | | | 2,842,232 | | |
| | 2,184,306 | | | Term Loan, 6.63%, Maturing December 10, 2012 | | | 2,161,098 | | |
| TXU Texas Competitive Electric Holdings Co., LLC | | | |
| | 6,325,000 | | | Term Loan, Maturing October 10, 2014(3) | | | 6,326,967 | | |
| | 6,325,000 | | | Term Loan, Maturing October 10, 2014(3) | | | 6,325,000 | | |
| | | | | | | $ | 142,095,941 | | |
Total Senior Floating-Rate Interests
(identified cost $6,984,602,203) | | $ | 6,885,806,579 | | |
| Corporate Bonds & Notes — 0.7% | | | |
Principal
Amount*
(000's omitted) | | Security | | Value | |
| Cable and Satellite Television —w 0.3% | | | |
| Iesy Hessen & ISH NRW, Variable Rate | | | |
| EUR | 13,500 | | | 7.481%, 4/15/13(9) | | $ | 19,238,158 | | |
| | | | | | | $ | 19,238,158 | | |
| Electronics / Electrical — 0.1% | | | |
| NXP BV/NXP Funding, LLC, Variable Rate | | | |
| $ | 6,300 | | | 7.993%, 10/15/13(9) | | $ | 5,992,875 | | |
| | | | | | | $ | 5,992,875 | | |
Principal
Amount*
(000's omitted) | | Security | | Value | |
| Financial Intermediaries — 0.0% | | | |
| Alzette, Variable Rate | | | |
| $ | 1,180 | | | 11.86%, 12/15/20(4)(9) | | $ | 1,162,300 | | |
| | | | | | | $ | 1,162,300 | | |
| Radio and Television — 0.0% | | | |
| Paxson Communications Corp., Variable Rate | | | |
| $ | 3,000 | | | 8.493%, 1/15/12(5)(9) | | $ | 3,022,500 | | |
| | | | | | | $ | 3,022,500 | | |
| Real Estate — 0.2% | | | |
| Assemblies of God, Variable Rate | | | |
| $ | 5,995 | | | 7.708%, 6/15/29(5)(9) | | $ | 5,995,157 | | |
| Sonata Securities S.A., Series 2006-6 | | | |
| | 6,518 | | | 8.91%, 12/28/07(9) | | | 6,518,072 | | |
| | | | | | | $ | 12,513,229 | | |
| Telecommunications — 0.1% | | | |
| Qwest Corp., Sr. Notes, Variable Rate | | | |
| $ | 5,850 | | | 8.944%, 6/15/13(9) | | $ | 6,266,813 | | |
| | | | | | | $ | 6,266,813 | | |
Total Corporate Bonds & Notes
(identified cost $45,391,521) | | $ | 48,195,875 | | |
| Asset Backed Securities — 0.1% | | | |
Principal
Amount*
(000's omitted) | | Security | | Value | |
| Avalon Capital Ltd. 3, Series 1A, Class D, Variable Rate | | | |
| $ | 1,140 | | | 7.449%, 2/24/19(4)(5)(9) | | $ | 1,024,672 | | |
| Babson Ltd., 2005-1A, Class C1, Variable Rate | | | |
| | 1,500 | | | 7.193%, 4/15/19(4)(5)(9) | | | 1,327,585 | | |
| Bryant Park CDO Ltd., Series 2005-1A, Class C, Variable Rate | | | |
| | 1,500 | | | 7.293%, 1/15/19(4)(5)(9) | | | 1,345,428 | | |
| Carlyle High Yield Partners, Series 2004-6A, Class C, Variable Rate | | | |
| | 1,500 | | | 7.95%, 8/11/16(4)(5)(9) | | | 1,395,195 | | |
| Centurion CDO 8 Ltd., Series 2005-8A, Class D, Variable Rate | | | |
| | 1,000 | | | 11.224%, 3/8/17(4)(9) | | | 928,087 | | |
Morgan Stanley Investment Management Croton, Ltd.,
Series 2005-1A, Class D, Variable Rate | | | |
| | 2,000 | | | 7.193%, 1/15/18(4)(5)(9) | | | 1,777,424 | | |
Total Asset Backed Securities
(identified cost $8,581,229) | | $ | 7,798,391 | | |
See notes to financial statements
34
Floating Rate Portfolio as of October 31, 2007
PORTFOLIO OF INVESTMENTS CONT'D
| Common Stocks — 0.0% | | | |
| Shares | | Security | | Value | |
| | 2,484 | | | Environmental Systems Products Holdings, Inc.(4)(6)(7) | | $ | 0 | | |
| | 105,145 | | | Hayes Lemmerz International(6) | | | 488,925 | | |
Total Common Stocks
(identified cost $1,051,450) | | $ | 488,925 | | |
| Preferred Stocks — 0.0% | | | |
| Shares | | Security | | Value | |
| | 2,484 | | | Environmental Systems Products
Holdings Preferred (Series A)(4)(6)(7) | | $ | 43,470 | | |
| | 350 | | | Hayes Lemmerz International(4)(6)(7) | | | 9,423 | | |
Total Preferred Stocks
(identified cost $60,970) | | $ | 52,893 | | |
| Closed-End Investment Companies — 0.0% | | | |
| Shares | | Security | | Value | |
| | 4,000 | | | Pioneer Floating Rate Trust | | $ | 70,960 | | |
Total Closed-End Investment Companies
(identified cost $72,147) | | $ | 70,960 | | |
| Short-Term Investments — 0.0% | | | |
| Description | | Interest
(000's omitted) | | Value | |
| | Investment in Cash Management Portfolio, 4.83%(8) | | | | 428 | | | $ | 427,945 | | |
Total Short-Term Investments
(identified cost $427,945) | | $ | 427,945 | | |
Total Investments — 101.3%
(identified cost $7,040,187,465) | | $ | 6,942,841,568 | | |
Less Unfunded Loan
Commitments — (2.2)% | | $ | (154,156,962 | ) | |
Net Investments — 99.1%
(identified cost $6,886,030,503) | | $ | 6,788,684,606 | | |
| Other Assets, Less Liabilities — 0.9% | | $ | 62,914,937 | | |
| Net Assets — 100.0% | | $ | 6,851,599,543 | | |
DIP - Debtor in Possession
REIT - Real Estate Investment Trust
CHF - Swiss Franc
EUR - Euro
GBP - British Pound
* In U.S. dollars unless otherwise indicated
(1) Senior floating-rate interests often require prepayments from excess cash flows or permit the borrower to repay at its election. The degree to which borrowers repay, whether as a contractual requirement or at their election, cannot be predicted with accuracy. As a result, the actual remaining maturity may be substantially less than the stated maturities shown. However, it is anticipated that the senior floating-rate interests will have an expected average life of approximately two to three years. The stated interest rate represents the weighted average interest rate of all contracts within the senior loan facility. Senior Loans typically have rates of interest which are redetermined either daily, monthly, quarterly or semi-annually by reference to a base lending rate, plus a premium. These base lending rates are primarily the London - -Interbank Offered Rate ("LIBOR"), and secondarily the prime rate offered by one or more major United States banks (the "Prime Rate") and the certificate of deposit ("CD") rate or other base lending rates used by commercial lenders.
(2) Unfunded or partially unfunded loan commitments. See Note 1G for description.
(3) This Senior Loan will settle after October 31, 2007, at which time the interest rate will be determined.
(4) Security valued at fair value using methods determined in good faith by or at the direction of the Trustees.
(5) Security exempt from registration under Rule 144A of the Securities Act of 1933. These securities may be sold in transactions exempt from registration, normally to qualified institutional buyers. At October 31, 2007, the aggregate value of the securities is $15,887,961 or 0.2% of the Portfolio's net assets.
(6) Non-income producing security.
(7) Restricted security.
(8) Affiliated investment company available to Eaton Vance portfolios and funds which invests in high quality U.S. dollar denominated money market instruments. The rate shown is the annualized seven-day yield as of October 31, 2007.
(9) Adjustable rate securities. Rates shown are the rates at period end.
See notes to financial statements
35
Floating-Rate Portfolio as of October 31, 2007
FINANCIAL STATEMENTS
Statement of Assets and Liabilities
As of October 31, 2007
| Assets | |
| Unaffiliated investments, at value (identified cost, $6,885,602,558) | | $ | 6,788,256,661 | | |
| Affiliated investment, at value (identified cost, $427,945) | | | 427,945 | | |
| Cash | | | 29,599,839 | | |
| Foreign currency, at value (identified cost, $17,926,668) | | | 18,143,288 | | |
| Receivable for investments sold | | | 35,399,661 | | |
| Interest and dividends receivable | | | 56,516,188 | | |
| Interest receivable from affiliated investment | | | 366,347 | | |
| Receivable for open swap contracts | | | 1,169,695 | | |
| Receivable for open forward foreign currency exchange contracts | | | 9,162 | | |
| Other assets | | | 723,331 | | |
| Total assets | | $ | 6,930,612,117 | | |
| Liabilities | |
| Payable for investments purchased | | $ | 70,459,964 | | |
| Payable for open forward foreign currency exchange contracts | | | 4,980,382 | | |
| Payable to affiliate for investment advisory fee | | | 2,955,564 | | |
| Payable to affiliate for Trustees' fees | | | 2,969 | | |
| Accrued expenses | | | 613,695 | | |
| Total liabilities | | $ | 79,012,574 | | |
| Net Assets applicable to investors' interest in Portfolio | | $ | 6,851,599,543 | | |
| Sources of Net Assets | |
| Net proceeds from capital contributions and withdrawals | | $ | 6,951,975,020 | | |
| Net unrealized depreciation (computed on the basis of identified cost) | | | (100,375,477 | ) | |
| Total | | $ | 6,851,599,543 | | |
Statement of Operations
For the Year Ended
October 31, 2007
| Investment Income | |
| Interest | | $ | 556,327,909 | | |
| Interest income allocated from affiliated investment | | | 20,864,120 | | |
| Dividends | | | 7,635 | | |
| Expenses allocated from affiliated investment | | | (1,980,779 | ) | |
| Total investment income | | $ | 575,218,885 | | |
| Expenses | |
| Investment adviser fee | | $ | 36,920,634 | | |
| Trustees' fees and expenses | | | 33,450 | | |
| Custodian fee | | | 1,094,512 | | |
| Legal and accounting services | | | 957,110 | | |
| Interest expense | | | 3,318,273 | | |
| Miscellaneous | | | 219,699 | | |
| Total expenses | | $ | 42,543,678 | | |
Deduct —
Reduction of custodian fee | | $ | 115,637 | | |
| Total expense reductions | | $ | 115,637 | | |
| Net expenses | | $ | 42,428,041 | | |
| Net investment income | | $ | 532,790,844 | | |
| Realized and Unrealized Gain (Loss) | |
Net realized gain (loss) —
Investment transactions (identified cost basis) | | $ | 15,722,270 | | |
| Swap contracts | | | 1,605,084 | | |
Foreign currency and forward foreign currency exchange
contract transactions | | | (94,436,072 | ) | |
| Net realized loss | | $ | (77,108,718 | ) | |
Change in unrealized appreciation (depreciation) —
Investments (identified cost basis) | | $ | (134,111,241 | ) | |
| Swap contracts | | | (324,629 | ) | |
Foreign currency and forward foreign currency
exchange contracts | | | 275,377 | | |
| Net change in unrealized appreciation (depreciation) | | $ | (134,160,493 | ) | |
| Net realized and unrealized loss | | $ | (211,269,211 | ) | |
| Net increase in net assets from operations | | $ | 321,521,633 | | |
See notes to financial statements
36
Floating-Rate Portfolio as of October 31, 2007
FINANCIAL STATEMENTS CONT'D
Statements of Changes in Net Assets
Increase (Decrease)
in Net Assets | | Year Ended
October 31, 2007 | | Year Ended
October 31, 2006 | |
From operations —
Net investment income | | $ | 532,790,844 | | | $ | 451,810,783 | | |
Net realized loss from investment
transactions, swap contracts,
and foreign currency and
forward foreign currency
exchange contract transactions | | | (77,108,718 | ) | | | (22,183,786 | ) | |
Net change in unrealized appreciation
(depreciation) from investments,
swap contracts, and foreign
currency and forward foreign
currency exchange contracts | | | (134,160,493 | ) | | | (30,822 | ) | |
| Net increase in net assets from operations | | $ | 321,521,633 | | | $ | 429,596,175 | | |
Capital transactions —
Contributions | | $ | 3,205,618,648 | | | $ | 2,989,478,752 | | |
| Withdrawals | | | (4,106,033,877 | ) | | | (2,494,639,771 | ) | |
Net increase (decrease) in net assets from
capital transactions | | $ | (900,415,229 | ) | | $ | 494,838,981 | | |
| Net increase (decrease) in net assets | | $ | (578,893,596 | ) | | $ | 924,435,156 | | |
| Net Assets | |
| At beginning of year | | $ | 7,430,493,139 | | | $ | 6,506,057,983 | | |
| At end of year | | $ | 6,851,599,543 | | | $ | 7,430,493,139 | | |
See notes to financial statements
37
Floating-Rate Portfolio as of October 31, 2007
FINANCIAL STATEMENTS CONT'D
Supplementary Data
| | | Year Ended October 31, | |
| | | 2007 | | 2006 | | 2005 | | 2004 | | 2003 | |
| Ratios/Supplemental Data | |
| Ratios (As a percentage of average daily net assets): | |
| Expenses before custodian fee reduction | | | 0.58 | % | | | 0.54 | % | | | 0.54 | % | | | 0.56 | % | | | 0.61 | % | |
| Expenses after custodian fee reduction | | | 0.58 | % | | | 0.54 | % | | | 0.54 | % | | | 0.56 | % | | | 0.61 | % | |
| Net investment income | | | 6.94 | % | | | 6.44 | % | | | 4.68 | % | | | 3.27 | % | | | 4.05 | % | |
| Portfolio Turnover | | | 61 | % | | | 50 | % | | | 57 | % | | | 67 | % | | | 64 | % | |
| Total Return | | | 4.62 | % | | | 6.36 | % | | | 4.77 | % | | | 3.93 | % | | | 6.91 | % | |
| Net assets, end of year (000's omitted) | | $ | 6,851,600 | | | $ | 7,430,493 | | | $ | 6,506,058 | | | $ | 5,389,638 | | | $ | 2,217,874 | | |
See notes to financial statements
38
Floating Rate Portfolio as of October 31, 2007
NOTES TO FINANCIAL STATEMENTS
1 Significant Accounting Policies
Floating Rate Portfolio (the Portfolio) is a New York trust, registered under the Investment Company Act of 1940, as amended (the 1940 Act), as a diversified open-end management investment company. The Portfolio's investment objective is to provide a high level of current income. The Portfolio primarily invests in interests of senior floating rate loans. The Declaration of Trust permits the Trustees to issue interests in the Portfolio. At October 31, 2007, the Eaton Vance Floating-Rate Fund, Eaton Vance Floating-Rate & High Income Fund, Eaton Vance Strategic Income Fund, Eaton Vance Medallion Floating-Rate Income Fund, Eaton Vance Diversified Income Fund, Eaton Vance Medallion Strategic Income Fund and Eaton Vance Low Duration Fund held an approximate 65.1%, 17.8%, 5.6%, 6.8%, 2.0%, 1.0% and 0.1% interest in the Portfolio, respectively.
The following is a summary of significant accounting policies of the Portfolio. The policies are in conformity with accounting principles generally accepted in the United States of America.
A Investment Valuation — The Portfolio's investments are primarily in interests in senior floating rate loans (Senior Loans). Interests in Senior Loans for which reliable market quotations are readily available are valued on the basis of prices furnished by an independent pricing service. Other Senior Loans are valued at fair value by the investment adviser under procedures approved by the Trustees. In fair valuing a Senior Loan, the investment adviser utilizes one or more of the following valuation techniques: (i) a matrix pricing approach that considers the yield on the Senior Loan relative to yields on other loan interests issued by companies of comparable credit quality; (ii) a comparison of the value of the borrower's outstanding equity and debt to that of comparable public companies; (iii) a discounted cash flow analysis; or (iv) when the investment adviser believes it is likely that a borrower will be liquidated or sold, an analysis of the terms of such liquidation or sale. In certain cases, the investment adviser will use a combination of analytical methods to determine fair value, such as when only a portion of a borrower's assets are likely to be sold. In conducting its assessment and analyses for purposes of determining fair value of a Senior Loan, the investment adviser will use its discretion and judgment in considering and appraising relevant factors. Fair value determinations are made by the portfolio managers of a Portfolio based on information available to such managers. The portfolio managers of other funds and portfolios managed by Eaton Vance that invest in Senior Loans may not possess the same information about a Senior Loan borrower as the portfolio managers of the Portfolio. At tim es, the fair value of a Senior Loan determined by the portfolio managers of other funds and portfolios managed by Eaton Vance that invest in Senior Loans may vary from the fair value of the same Senior Loan determined by the portfolio managers of the Portfolio. The fair value of each Senior Loan is periodically reviewed and approved by the investment adviser's Valuation Committee and by the Portfolio's Trustees based upon procedures approved by the Trustees. Junior Loans are valued in the same manner as Senior Loans.
Other portfolio securities (other than short-term obligations, but including listed issues) may be valued on the basis of prices furnished by one or more pricing services which determine prices for normal, institutional-size trading units of such securities which may use market information, transactions for comparable securities and various relationships between securities which are generally recognized by institutional traders. Short-term debt securities with a remaining maturity of sixty days or less are valued at amortized cost, which approximates market value. If short-term debt securities are acquired with a remaining maturity of more than sixty days, they will be valued by a pricing service. Over-the-counter options are valued at the mean between the bid and the asked price provided by dealers. Equity securities listed on the NASDAQ Global or Global Select Market are valued at the NASDAQ official closing price. Financial f utures contracts listed on the commodity exchanges and options thereon are valued at closing settlement prices. The value of interest rate swaps are generally based upon a dealer quotation. Credit default swaps are valued by broker-dealer (usually counterparty to the agreement). Repurchase agreements are valued at cost plus accrued interest. Other portfolio securities for which there are no quotations or valuations and investments for which the price of the security is not believed to represent its fair market value, are valued at fair value using methods determined in good faith by or at the direction of the Trustees of the Portfolio. Occasionally, events affecting the value of foreign securities may occur between the time trading is completed abroad and the close of the Exchange which will not be reflected in the computation of the Portfolio's net asset value (unless the Trust deems that such event would materially affect its net asset value in which case an adjustment would be made and reflected in such c omputation). The Portfolio may rely on an independent
39
Floating Rate Portfolio as of October 31, 2007
NOTES TO FINANCIAL STATEMENTS CONT'D
fair valuation service in making any such adjustment as to the value of a foreign equity security.
The Portfolio may invest in Cash Management Portfolio (Cash Management), an affiliated investment company managed by BMR. Cash Management values its investment securities utilizing the amortized cost valuation technique permitted by Rule 2a-7 of the 1940 Act. This technique involves initially valuing a portfolio security at its cost and thereafter assuming a constant amortization to maturity of any discount or premium.
B Investment Transactions — Investment transactions for financial statement purposes are accounted for on a trade date basis. Realized gains and losses on investments sold are determined on the basis of identified cost.
C Income — Interest income is recorded on the basis of interest accrued, adjusted for amortization of premium or accretion of discount. Fees associated with loan amendments are recognized immediately. Dividend income is recorded on the ex-dividend date for dividends received in cash and/or securities.
D Federal Taxes — The Portfolio has elected to be treated as a partnership for federal tax purposes. No provision is made by the Portfolio for federal or state taxes on any taxable income of the Portfolio because each investor in the Portfolio is ultimately responsible for the payment of any taxes on its share of taxable income. Since at least one of the Portfolio's investors is a regulated investment company that invests all or substantially all of its assets in the Portfolio, the Portfolio normally must satisfy the applicable source of income and diversification requirements (under the Internal Revenue Code) in order for its investors to satisfy them. The Portfolio will allocate, at least annually among its investors, each investor's distributive share of the Portfolio' s net investment income, net realized capital gains and any other items of income, gain, loss, deduction or credit.
E Expense Reduction — State Street Bank and Trust Company (SSBT) serves as custodian of the Portfolio. Pursuant to the custodian agreement, SSBT receives a fee reduced by credits, which are determined based on the average daily cash balance the Portfolio maintains with SSBT. All credit balances, if any, used to reduce the Portfolio's custodian fees are reported as a reduction of expenses in the Statement of Operations.
F Foreign Currency Translation — Investment valuations, other assets, and liabilities initially expressed in foreign currencies are translated each business day into U.S. dollars based upon current exchange rates. Purchases and sales of foreign investment securities and income and expenses denominated in foreign currency are translated into U.S. dollars based upon currency exchange rates in effect on the respective dates of such transactions. Recognized gains or losses on investment transactions attributable to changes in foreign currency exchange rates are recorded for financial statement purposes as net realized gains and losses on investments. That portion of unrealized gains and losses on investments that results from fluctuations in foreign currency exchange rates is not separately disclosed.
G Unfunded Loan Commitments — The Portfolio may enter into certain credit agreements all or a portion of which may be unfunded. The Portfolio is obligated to fund these commitments at the borrower's discretion. These commitments are disclosed in the accompanying Portfolio of Investments.
H Use of Estimates — The preparation of the financial statements in conformity with accounting principles generally accepted in the United States of America requires management to make estimates and assumptions that affect the reported amounts of assets and liabilities at the date of the financial statements and the reported amounts of income and expense during the reporting period. Actual results could differ from those estimates.
I Indemnifications — Under the Portfolio's organizational documents, its officers and Trustees may be indemnified against certain liabilities and expenses arising out of the performance of their duties to the Portfolio. Interestholders in the Portfolio are jointly and severally liable for the liabilities and obligations of the Portfolio in the event that the Portfolio fails to satisfy such liabilities and obligations; provided, however, that, to the extent assets are available in the Portfolio, the Portfolio may, under certain circumstances, indemnify interestholders from and against any claim or liability to which such holder may become subject by reason of being or having been an interestholder in the Portfolio. Additionally, in the normal course of business, the Portfo lio enters into agreements with service providers that may contain indemnification clauses. The Portfolio's maximum exposure under these arrangements is unknown as this would involve future claims that may be made against the Portfolio that have not yet occurred.
40
Floating Rate Portfolio as of October 31, 2007
NOTES TO FINANCIAL STATEMENTS CONT'D
J Forward Foreign Currency Exchange Contracts — The Portfolio may enter into forward foreign currency exchange contracts for the purchase or sale of a specific foreign currency at a fixed price on a future date. The Portfolio enters into forward contracts for hedging purposes as well as non-hedging purposes. The forward foreign currency exchange contract is adjusted by the daily exchange rate of the underlying currency and any gains or losses are recorded for financial statement purposes as unrealized until such time as the contract has been closed or offset by another contract with the same broker for the same settlement date and currency. Risks may arise upon entering these contracts from the potential inability of counterparties to meet the terms of their contracts and from movements in the value of a foreign currency relative to the U.S. dollar.
K Interest Rate Swaps — The Portfolio may enter into interest rate swap agreements to enhance return, to hedge against fluctuations in securities prices or interest rates, or as substitution for the purchase or sale of securities. Pursuant to these agreements, the Portfolio makes periodic payments at a fixed interest rate and, in exchange, receives payments based on the interest rate of a benchmark industry index. Payments received or made are recorded as realized gains or losses. During the term of the outstanding swap agreement, changes in the underlying value of the swap are recorded as unrealized gains or losses. The value of the swap is determined by changes in the relationship between two rates of interest. The Portfolio is exposed to credit loss in the event of non - -performance by the swap counterparty. Risk may also arise from movements in interest rates.
L Credit Default Swaps — The Portfolio may enter into credit default swap contracts to buy or sell protection against default on an individual issuer or a basket of issuers of bonds. When the Portfolio is the buyer of a credit default swap contract, the Portfolio is entitled to receive the par (or other agreed-upon) value of a referenced debt obligation (or basket of debt obligations) from the counterparty to the contract in the event of a default by a third party, such as a U.S or foreign corporate issuer, on the debt obligation. In return, the Portfolio pays the counterparty a periodic stream of payments over the term of the contract provided that no event of default has occurred. If no default occurs, the Portfolio would have made a stream of payments and received no b enefit from the contract. When the Fund is the seller of a credit default swap contract, it receives the stream of payments, but is obligated to pay upon default of the referenced debt obligation. As the seller, the Fund would effectively adds leverage to its portfolio because, in addition to its total net assets, the Fund is subject to investment exposure on the notional amount of the swap. The interest fee paid or received on the swap contract, which is based on a specified interest rate on a fixed notional amount, is accrued daily as a component of unrealized appreciation (depreciation) and is recorded as realized gain upon receipt or realized loss upon payment. The Fund also records an increase or decrease to unrealized appreciation (depreciation) in an amount equal to the daily valuation. Up-front payment or receipts, if any, are recorded as other assets or other liabilities, respectively, and amortized over the life of the swap con tract as realized gains or losses. The Fund segregates assets in the form of cash and cash equivalents in an amount equal to the aggregate market value of the credit default swap of which it is the seller, marked to market on a daily basis. These transactions involve certain risks, including the risk that the seller may be unable to fulfill the transaction.
2 Investment Adviser Fee and Other Transactions with Affiliates
The investment adviser fee is earned by BMR, as compensation for management and investment advisory services rendered to the Portfolio. Pursuant to the investment advisory agreement, BMR receives a monthly advisory fee at the annual rate of 0.575% of average daily net assets of the Portfolio up to $1 billion and at reduced rates as daily net assets exceed that level. The portion of the advisory fee payable by Cash Management on the Portfolio's investment of cash therein is credited against the Portfolio's advisory fee. For the year ended October 31, 2007, the Portfolio's advisory fee totaled $38,832,438 of which $1,911,804 was allocated from Cash Management and $36,920,634 was paid or accrued directly by the Portfolio. For the year ended October 31, 2007, the Portfolio's advisory fee, including the portion allocated from Cash Management, was 0.506% of the Portfolio's average daily net assets.
Except for Trustees of the Portfolio who are not members of EVM's or BMR's organizations, officers and Trustees receive remuneration for their services to the Portfolio out of the investment advisory fee. Trustees of the Portfolio who are not affiliated with the Investment Adviser may elect to defer receipt of all or a portion of their annual fees in accordance with the terms of the Trustees Deferred Compensation Plan. For the year ended October 31, 2007, no significant amounts have been deferred. Certain officers and Trustees of the Portfolio are officers of the above organizations.
41
Floating Rate Portfolio as of October 31, 2007
NOTES TO FINANCIAL STATEMENTS CONT'D
3 Purchases and Sales of Investments
The Portfolio invests primarily in Senior Loans. The ability of the issuers of the Senior Loans to meet their obligations may be affected by economic developments in a specific industry. The cost of purchases and proceeds from principal repayments and sales of Senior Loans for the year ended October 31, 2007 aggregated $4,505,269,399, $3,279,747,553 and $1,582,796,906, respectively.
4 Line of Credit
The Portfolio participates with other portfolios and funds managed by EVM and its affiliates in a $1.5 billion unsecured line of credit agreement with a group of banks. Borrowings will be made by the Portfolio solely to facilitate the handling of unusual and/or unanticipated short-term cash requirements. Interest is charged to the Portfolio based on its borrowings at an amount above either the Eurodollar rate or Federal Funds rate. In addition, a fee computed at an annual rate of 0.07% on the daily unused portion of the line of credit is allocated among the participating portfolios and funds at the end of each quarter. As of October 31, 2007, the Portfolio had no borrowings outstanding. Average borrowings and the average interest rate for the year ended October 31, 2007 were $50,191,781 and 5.73%, respectively.
5 Federal Income Tax Unrealized Appreciation (Depreciation)
The cost and unrealized appreciation (depreciation) of investments of the Portfolio at October 31, 2007, as determined on a federal income tax basis, were as follows:
| Aggregate cost | | $ | 6,886,275,054 | | |
| Gross unrealized appreciation | | $ | 65,485,491 | | |
| Gross unrealized depreciation | | | (163,075,939 | ) | |
| Net unrealized depreciation | | $ | (97,590,448 | ) | |
The net unrealized depreciation on October 31, 2007 on swap contracts, foreign currency, and forward foreign currency exchange contracts on a federal income tax basis was $3,029,580.
6 Financial Instruments
The Portfolio may trade in financial instruments with off-balance sheet risk in the normal course of its investing activities to assist in managing exposure to various market risks. These financial instruments may include forward foreign currency contracts, credit default swaps, and interest rate swaps and may involve, to a varying degree, elements of risk in excess of the amounts recognized for financial statement purposes. The notional or contractual amounts of these instruments represent the investment the Portfolio has in particular classes of financial instruments and does not necessarily represent the amounts potentially subject to risk. The measurement of the risks associated with these instruments is meaningful only when all related and offsetting transactions are considered. A summary of obligations under these financial instruments at October 31, 2 007 was as follows:
Forward Foreign Currency Exchange Contracts
| Sales | |
| Settlement Date | | Deliver | | In exchange for | | Net Unrealized
Appreciation
(Depreciation) | |
| 11/1/07 | | British Pound Sterling | | United States Dollar | | |
| | |
| | 74,996 | | 156,067 | | $ | 274 | | |
11/30/07
| | British Pound Sterling
135,491,320 | | United States Dollar
278,915,656 | | |
(2,303,716) | | |
11/1/07
| | Euro Dollar
2,734,864 | | United States Dollar
3,965,554 | | |
8,888 | | |
11/30/07
| | Euro Dollar
463,100,283 | | United States Dollar
667,721,144 | | |
(2,574,559) | | |
11/30/07
| | Swiss Franc
17,392,583 | | United States Dollar
14,947,218 | | |
(87,618) | | |
| | | | | | | $ | (4,956,731 | ) | |
| Purchases | |
| Settlement Date | | In exchange for | | Deliver | | Net Unrealized
Depreciation | |
| 11/30/07 | | British Pound Sterling | | United States Dollar | | |
| | |
| | 1,047,960 | | 2,178,846 | | $ | (3,749 | ) | |
11/30/07
| | Euro Dollar
3,186,576 | | United States Dollar
4,623,021 | | |
(10,740) | | |
| | | | | | | $ | (14,489 | ) | |
42
Floating Rate Portfolio as of October 31, 2007
NOTES TO FINANCIAL STATEMENTS CONT'D
| Credit Default Swaps | |
| Counterparty | | Reference
Entity | | Buy/
Sell
Credit | | Notional
Amount
(000's
omitted) | | Pay/
Receive
Annual
Fixed
Rate | | Termination
Date | | Net Unrealized
Appreciation
(Depreciation) | |
| | | Avago | | | | | | | | | | | | | | |
| | |
| Lehman | | Technologies, | | | | | | | | | | | | | | |
| | |
| Brothers, Inc. | | Inc. | | Sell | | $ | 5,000 | | | | 2.10 | % | | 12/20/10 | | $ | 82,691 | | |
Lehman
Brothers, Inc. | | Crown
Americas, Inc.. | | Sell | | | 10,000 | | | | 2.35 | | | 12/20/09 | | | 309,521 | | |
Lehman
Brothers, Inc. | | CSG Systems,
Inc. | | Sell | | | 7,000 | | | | 2.15 | | | 9/21/09 | | | 119,157 | | |
Lehman
Brothers, Inc. | |
Inergy, L.P. | | Sell | | | 6,500 | | | | 2.20 | | | 3/20/10 | | | 182,747 | | |
Lehman
Brothers, Inc. | |
Inergy, L.P. | | Sell | | | 3,000 | | | | 2.40 | | | 3/20/10 | | | 97,583 | | |
Lehman
Brothers, Inc. | | Owens-Illinois,
Inc. | | Sell | | | 5,000 | | | | 1.95 | | | 9/20/11 | | | 59,629 | | |
Lehman
Brothers, Inc. | | Pinnacle
Entertainment,
Inc. | | Sell | | | 3,000 | | | | 2.00 | | | 6/20/10 | | | (7,614 | ) | |
Lehman
Brothers, Inc. Pinnacle | | Entertainment,
Inc. | | Sell | | | 2,000 | | | | 1.95 | | | 9/20/10 | | | (7,038 | ) | |
Lehman
Brothers, Inc. | | Rural Cellular
Corp. | | Sell | | | 3,000 | | | | 3.25 | | | 6/20/10 | | | 198,052 | | |
Lehman
Brothers, Inc. | | Syniverse
Technologies,
Inc. | | Sell | | | 3,000 | | | | 1.85 | | | 3/20/11 | | | (641 | ) | |
Lehman
Brothers, Inc. | | Syniverse
Technologies,
Inc. | | Sell | | | 3,000 | | | | 2.30 | | | 6/20/11 | | | 31,743 | | |
| Lehman | | The Hertz | | | | | | | | | | | | | | |
| | |
| Brothers, Inc. | | Corp. | | Sell | | | 5,000 | | | | 1.80 | | | 3/20/11 | | | 103,865 | | |
| Total | | | | | | | | | | | | | | | | $ | 1,169,695 | | |
At October 31, 2007, the Portfolio had sufficient cash and/or securities segregated to cover commitments under these contracts.
7 Restricted Securities
At October 31, 2007, the Portfolio owned the following securities (representing less than 0.1% of net assets) which were restricted as to public resale and not registered under the Securities Act of 1933 (excluding Rule 144A securities). The Portfolio has various registration rights (exercisable under a variety of circumstances) with respect to these securities. The value of these securities is determined based on valuations provided by brokers when available, or if not available, they are valued at fair value using methods determined in good faith by or at the direction of the Trustees.
Restricted Securities
| Description | | Date of
Acquisition | | Shares/Face | | Cost | | Value | |
Common Stocks and
Preferred Stocks | |
Environmental Systems
Products Holdings, Inc. | | 10/25/07 | | | 2,484 | | | $ | 0 | (1) | | $ | 0 | | |
Environmental Systems
Products Holdings
Preferred (Series A) | | 10/25/07 | | | 2,484 | | | $ | 43,470 | | | $ | 43,470 | | |
Hayes Lemmerz
International | | 6/23/03 | | | 350 | | | $ | 17,500 | | | $ | 9,423 | | |
| Total Restricted Security | | | | | | | | $ | 60,970 | | | $ | 52,893 | | |
(1) Less than $0.50.
8 Risks Associated with Foreign Investments
Investing in securities issued by companies whose principal business activities are outside the United States may involve significant risks not present in domestic investments. For example, there is generally less publicly available information about foreign companies, particularly those not subject to the disclosure and reporting requirements of the U.S. securities laws. Certain foreign issuers are generally not bound by uniform accounting, auditing, and financial reporting requirements and standards of practice comparable to those applicable to domestic issuers. Investments in foreign securities also involve the risk of possible adverse changes in investment or exchange control regulations, expropriation or confiscatory taxation, limitation on the removal of funds or other assets of the Portfolio, political or financial instability or diplomatic and other developments which could affect such investments. Foreign stock markets, while growing in volume and sophistication, are generally not as developed as those in the United States, and securities of some foreign issuers (particularly those located in developing countries) may be less liquid and more volatile than securities of comparable U.S. companies. In general, there is less overall governmental supervision and regulation of foreign securities markets, broker-dealers and issuers than in the United States.
43
Floating Rate Portfolio as of October 31, 2007
NOTES TO FINANCIAL STATEMENTS CONT'D
9 Recently Issued Accounting Pronouncements
In June 2006, the Financial Accounting Standards Board (FASB) issued FASB Interpretation No. 48 (FIN 48), "Accounting for Uncertainty in Income Taxes – an interpretation of FASB Statement No. 109". FIN 48 clarifies the accounting for uncertainty in income taxes recognized in accordance with FASB Statement No. 109, "Accounting for Income Taxes". This interpretation prescribes a recognition threshold and measurement attribute for the financial statement recognition and measurement of a tax position taken or expected to be taken in a tax return. It also provides guidance on de-recognition, classification, interest and penalties, accounting in interim periods, disclosure and transition. FIN 48 is effective on the last business day of the first required financial reporting period for fiscal years beginning after December 15, 2006. Management is currently evaluating the impact of applying the various provisions of FIN 48.
In September 2006, the FASB issued Statement of Financial Accounting Standards No. 157 (FAS 157), "Fair Value Measurements". FAS 157 defines fair value, establishes a framework for measuring fair value in accordance with generally accepted accounting principles and expands disclosure about fair value measurements. FAS 157 is effective for fiscal years beginning after November 15, 2007. Management is currently evaluating the impact the adoption of FAS 157 will have on the Portfolio's financial statement disclosures.
44
Floating Rate Portfolio as of October 31, 2007
REPORT OF INDEPENDENT REGISTERED PUBLIC ACCOUNTING FIRM
To the Trustees and Investors
of Floating Rate Portfolio:
We have audited the accompanying statement of assets and liabilities of Floating Rate Portfolio (the Portfolio), including the portfolio of investments, as of October 31, 2007, and the related statement of operations for the year then ended, the statements of changes in net assets for each of the two years in the period then ended, and the supplementary data for each of the five years in the period then ended. These financial statements and supplementary data are the responsibility of the Portfolio's management. Our responsibility is to express an opinion on these financial statements and supplementary data based on our audits.
We conducted our audits in accordance with standards of the Public Company Accounting Oversight Board (United States). Those standards require that we plan and perform the audit to obtain reasonable assurance about whether the financial statements and supplementary data are free of material misstatement. The Portfolio is not required to have, nor were we engaged to perform, an audit of its internal control over financial reporting. Our audits included consideration of internal control over financial reporting as a basis for designing audit procedures that are appropriate in the circumstances, but not for the purpose of expressing an opinion on the effectiveness of the Portfolio's internal control over financial reporting. Accordingly, we express no such opinion. An audit also includes examining, on a test basis, evidence supporting the amounts and disclosures in the financial statements, assessing the accounting principles used and significant estimates made by management, as well as evaluating the overall financial statement presentation. Our procedures included confirmation of securities and senior loans, owned as of October 31, 2007 by correspondence with the custodian, and brokers and selling agent bankers; where replies were not received from brokers and selling agent bankers, we performed other auditing procedures. We believe that our audits provide a reasonable basis for our opinion.
In our opinion, the financial statements and supplementary data referred to above present fairly, in all material respects, the financial position of Floating-Rate Portfolio as of October 31, 2007, the results of its operations for the year then ended, the changes in its net assets for each of the two years in the period then ended, and the supplementary data for each of the five years in the period then ended, in conformity with accounting principles generally accepted in the United States of America.
DELOITTE & TOUCHE LLP
Boston, Massachusetts
December 20, 2007
45
Eaton Vance Floating-Rate Fund
BOARD OF TRUSTEES' ANNUAL APPROVAL OF THE INVESTMENT ADVISORY AGREEMENT
Overview of the Contract Review Process
The Investment Company Act of 1940, as amended (the "1940 Act"), provides, in substance, that each investment advisory agreement between a fund and its investment adviser will continue in effect from year to year only if its continuance is approved at least annually by the fund's board of trustees, including by a vote of a majority of the trustees who are not "interested persons" of the fund ("Independent Trustees"), cast in person at a meeting called for the purpose of considering such approval.
At a meeting of the Boards of Trustees (each a "Board") of the Eaton Vance group of mutual funds (the "Eaton Vance Funds") held on April 23, 2007, the Board, including a majority of the Independent Trustees, voted to approve continuation of existing advisory and sub-advisory agreements for the Eaton Vance Funds for an additional one-year period. In voting its approval, the Board relied upon the affirmative recommendation of the Special Committee of the Board, which is a committee comprised exclusively of Independent Trustees. Prior to making its recommendation, the Special Committee reviewed information furnished for a series of meetings of the Special Committee held in February, March and April 2007. Such information included, among other things, the following:
Information about Fees, Performance and Expenses
• An independent report comparing the advisory and related fees paid by each fund with fees paid by comparable funds;
• An independent report comparing each fund's total expense ratio and its components to comparable funds;
• An independent report comparing the investment performance of each fund to the investment performance of comparable funds over various time periods;
• Data regarding investment performance in comparison to relevant peer groups of funds and appropriate indices;
• Comparative information concerning fees charged by each adviser for managing other mutual funds and institutional accounts using investment strategies and techniques similar to those used in managing the fund;
• Profitability analyses for each adviser with respect to each fund managed by it;
Information about Portfolio Management
• Descriptions of the investment management services provided to each fund, including the investment strategies and processes employed;
• Information concerning the allocation of brokerage and the benefits received by each adviser as a result of brokerage allocation, including information concerning the acquisition of research through "soft dollar" benefits received in connection with the funds' brokerage, and the implementation of a soft dollar reimbursement program established with respect to the funds;
• Data relating to portfolio turnover rates of each fund;
• The procedures and processes used to determine the fair value of fund assets and actions taken to monitor and test the effectiveness of such procedures and processes;
Information about each Adviser
• Reports detailing the financial results and condition of each adviser;
• Descriptions of the qualifications, education and experience of the individual investment professionals whose responsibilities include portfolio management and investment research for the funds, and information relating to their compensation and responsibilities with respect to managing other mutual funds and investment accounts;
• Copies of the Codes of Ethics of each adviser and its affiliates, together with information relating to compliance with and the administration of such codes;
• Copies of or descriptions of each adviser's proxy voting policies and procedures;
• Information concerning the resources devoted to compliance efforts undertaken by each adviser and its affiliates on behalf of the funds (including descriptions of various compliance programs) and their record of compliance with investment policies and restrictions, including policies with respect to market-timing, late trading and selective portfolio disclosure, and with policies on personal securities transactions;
• Descriptions of the business continuity and disaster recovery plans of each adviser and its affiliates;
Other Relevant Information
• Information concerning the nature, cost and character of the administrative and other non-investment management services provided by Eaton Vance Management and its affiliates;
• Information concerning management of the relationship with the custodian, subcustodians and fund accountants by each adviser or the funds' administrator; and
• The terms of each advisory agreement.
46
Eaton Vance Floating-Rate Fund
BOARD OF TRUSTEES' ANNUAL APPROVAL OF THE INVESTMENT ADVISORY AGREEMENT CONT'D
In addition to the information identified above, the Special Committee considered information provided from time to time by each adviser throughout the year at meetings of the Board and its committees. Over the course of the twelve-month period ended April 30, 2007, the Board met ten times and the Special Committee, the Audit Committee and the Governance Committee, each of which is a Committee comprised solely of Independent Trustees, met twelve, fourteen and eight times, respectively. At such meetings, the Trustees received, among other things, presentations by the portfolio managers and other investment professionals of each adviser relating to the investment performance of each fund and the investment strategies used in pursuing the fund's investment objective.
For funds that invest through one or more underlying portfolios, the Board considered similar information about the portfolio(s) when considering the approval of advisory agreements. In addition, in cases where the fund's investment adviser has engaged a sub-adviser, the Board considered similar information about the sub-adviser when considering the approval of any sub-advisory agreement.
The Special Committee was assisted throughout the contract review process by Goodwin Procter LLP, legal counsel for the Independent Trustees. The members of the Special Committee relied upon the advice of such counsel and their own business judgment in determining the material factors to be considered in evaluating each advisory and sub-advisory agreement and the weight to be given to each such factor. The conclusions reached with respect to each advisory and sub-advisory agreement were based on a comprehensive evaluation of all the information provided and not any single factor. Moreover, each member of the Special Committee may have placed varying emphasis on particular factors in reaching conclusions with respect to each advisory and sub-advisory agreement.
Results of the Process
Based on its consideration of the foregoing, and such other information as it deemed relevant, including the factors and conclusions described below, the Special Committee concluded that the continuance of the investment advisory agreement of the Floating Rate Portfolio (the "Portfolio"), the portfolio in which the Eaton Vance Floating-Rate Fund (the "Fund") invests, with Boston Management and Research (the "Adviser"), including the fee structure, is in the interests of shareholders and, therefore, the Special Committee recommended to the Board approval of the agreement. The Board accepted the recommendation of the Special Committee as well as the factors considered and conclusions reached by the Special Committee with respect to the agreement. Accordingly, the Board, including a majority of the Independent Trustees, voted to approve continuation of the investment advisory agreement for the Portfolio.
Nature, Extent and Quality of Services
In considering whether to approve the investment advisory agreement of the Portfolio, the Board evaluated the nature, extent and quality of services provided to the Portfolio by the Adviser.
The Board considered the Adviser's management capabilities and investment process with respect to the types of investments held by the Portfolio, including the education, experience and number of its investment professionals and other personnel who provide portfolio management, investment research, and similar services to the Portfolio. In particular, the Board evaluated the experience and abilities of such personnel in analyzing factors such as the special considerations relevant to investing in senior floating-rate loans. Specifically, the Board noted the experience of the Adviser's 30 bank loan investment professionals and other personnel who provide services to the Portfolio, including five portfolio managers and 17 analysts. The Board also took into account the resources dedicated to portfolio management and other services, including the compensation paid to recruit and retain investment personnel, and the time and attent ion devoted to the Portfolio by senior management.
The Board reviewed the compliance programs of the Adviser and relevant affiliates thereof. Among other matters, the Board considered compliance and reporting matters relating to personal trading by investment personnel, selective disclosure of portfolio holdings, late trading, frequent trading, portfolio valuation, business continuity and the allocation of investment opportunities. The Board also evaluated the responses of the Adviser and its affiliates to requests from regulatory authorities such as the Securities and Exchange Commission and the National Association of Securities Dealers.
The Board considered shareholder and other administrative services provided or managed by Eaton Vance Management and its affiliates, including transfer agency and accounting services. The Board evaluated the benefits to shareholders of investing in a fund that is a part of a large family of funds, including the ability, in many cases, to exchange an investment among different funds without incurring additional sales charges.
After consideration of the foregoing factors, among others, the Board concluded that the nature, extent and quality of services provided by the Adviser, taken as a whole, are appropriate and consistent with the terms of the investment advisory agreement.
47
Eaton Vance Floating-Rate Fund
BOARD OF TRUSTEES' ANNUAL APPROVAL OF THE INVESTMENT ADVISORY AGREEMENT CONT'D
Fund Performance
The Board compared the Fund's investment performance to a relevant universe of similarly managed funds identified by an independent data provider and appropriate benchmark indices. The Board reviewed comparative performance data for the one-, three- and five-year periods ended September 30, 2006 for the Fund. The Board noted that the Fund's performance relative to its peers is affected by management's focus on reducing volatility. The Board concluded that the performance of the Fund was satisfactory.
Management Fees and Expenses
The Board reviewed contractual investment advisory fee rates, including any administrative fee rates, payable by the Portfolio and the Fund (referred to collectively as "management fees"). As part of its review, the Board considered the management fees and the Fund's total expense ratio for the year ended September 30, 2006, as compared to a group of similarly managed funds selected by an independent data provider.
After reviewing the foregoing information, and in light of the nature, extent and quality of the services provided by the Adviser, the Board concluded that the management fees charged for advisory and related services and the Fund's total expense ratio are reasonable.
Profitability
The Board reviewed the level of profits realized by the Adviser and relevant affiliates thereof in providing investment advisory and administrative services to the Fund, the Portfolio and to all Eaton Vance Funds as a group. The Board considered the level of profits realized without regard to revenue sharing or other payments by the Adviser and its affiliates to third parties in respect of distribution services. The Board also considered other direct or indirect benefits received by the Adviser and its affiliates in connection with its relationship with the Fund.
The Board concluded that, in light of the foregoing factors and the nature, extent and quality of the services rendered, the profits realized by the Adviser and its affiliates are reasonable.
Economies of Scale
In reviewing management fees and profitability, the Board also considered the extent to which the Adviser and its affiliates, on the one hand, and the Fund, on the other hand, can expect to realize benefits from economies of scale as the assets of the Fund and Portfolio increase. The Board acknowledged the difficulty in accurately measuring the benefits resulting from the economies of scale with respect to the management of any specific fund or group of funds. The Board reviewed data summarizing the increases and decreases in the assets of the Fund and of all Eaton Vance Funds as a group over various time periods, and evaluated the extent to which the total expense ratio of the Fund and the profitability of the Adviser and its affiliates may have been affected by such increases or decreases. Based upon the foregoing, the Board concluded that the benefits from economies of scale are currently being shared equitably by the Ad viser and its affiliates and the Fund. The Board also concluded that, assuming reasonably foreseeable increases in the assets of the Portfolio, the structure of the advisory fee, which includes breakpoints at several asset levels, can be expected to cause the Adviser and its affiliates and the Fund to continue to share such benefits equitably.
48
Eaton Vance Floating-Rate Fund
MANAGEMENT AND ORGANIZATION
Fund Management. The Trustees of Eaton Vance Mutual Funds Trust (the Trust), and Floating Rate Portfolio (the Portfolio) are responsible for the overall management and supervision of the Trust's and Portfolio's affairs. The Trustees and officers of the Trust and the Portfolio are listed below. Except as indicated, each individual has held the office shown or other offices in the same company for the last five years. Trustees and officers of the Trust and the Portfolio hold indefinite terms of office. The "noninterested Trustees" consist of those Trustees who are not "interested persons" of the Trust and the Portfolio, as that term is defined under the 1940 Act. The business address of each Trustee and officer is The Eaton Vance Building, 255 State Street, Boston, Massachusetts 02109. As used below, "EVC" refers to Eaton Vance Corp., "EV" refers to Eaton Vanc e, Inc., "EVM" refers to Eaton Vance Management, "BMR" refers to Boston Management and Research, "Parametric" refers to Parametric Portfolio Associates and "EVD" refers to Eaton Vance Distributors, Inc. EVC and EV are the corporate parent and trustee, respectively, of EVM and BMR. EVD is the Fund's principal underwriter, the Portfolio's placement agent and a wholly-owned subsidiary of EVM. Each officer affiliated with Eaton Vance may hold a position with other Eaton Vance affiliates that is comparable to his or her position with EVM listed below.
Name and
Date of Birth | | Position(s)
with the
Trust and
the Portfolio | | Term of
Office and
Length of
Service | | Principal Occupation(s)
During Past Five Years | | Number of Portfolios
in Fund Complex
Overseen By
Trustee(1) | | Other Directorships Held | |
| Interested Trustee | | | | | | | | | | | | | |
|
| Thomas E. Faust Jr. 5/31/58 | | Trustee and President of the Trust | | Trustee since 2007 and President of the Trust since 2002 | | Chairman, Chief Executive Officer and President of EVC, President of EV, Chief Executive Officer and President of EVM and BMR, and Director of EVD. Trustee and/or Officer of 176 registered investment companies and 5 private investment companies in the Eaton Vance Fund Complex. Mr. Faust is an interested person because of his positions with EVM, BMR, EVC and EV which are affiliates of the Trust and the Portfolios. | | | 176 | | | Director of EVC | |
|
| Noninterested Trustee(s) | | | | | | | | | | | | | |
|
| Benjamin C. Esty 1/2/63 | | Trustee | | Since 2005 | | Roy and Elizabeth Simmons Professor of Business Administration, Harvard University Graduate School of Business Administration (since 2003). Formerly, Associate Professor, Harvard University Graduate School of Business Administration (2000-2003). | | | 176 | | | None | |
|
| Allen R. Freedman 4/3/40 | | Trustee | | Since 2007 | | Former Chairman and Chief Executive Officer of Assurant, Inc. (insurance provider) (1978-2000). Formerly, a Director of Loring Ward International (fund distributor) (2005-2007). | | | 175 | | | Director of Assurant, Inc. and Stonemor Partners L.P. (owner and operator of cemeteries) | |
|
| William H. Park 9/19/47 | | Trustee | | Since 2003 | | Vice Chairman, Commercial Industrial Finance Corp. (specialty finance company) (since 2006). Formerly, President and Chief Executive Officer, Prizm Capital Management, LLC (investment management firm) (since 2002-2005). | | | 176 | | | None | |
|
| Ronald A. Pearlman 7/10/40 | | Trustee | | Since 2003 | | Professor of Law, Georgetown University Law Center. | | | 176 | | | None | |
|
| Norton H. Reamer 9/21/35 | | Trustee | | Trustee of the Trust since 1986 and of the Portfolio since 2000 | | President, Chief Executive Officer and a Director of Asset Management Finance Corp. (a specialty finance company serving the investment management industry) (since October 2003). President, Unicorn Corporation (an investment and financial advisory services company) (since September 2000). Formerly, Chairman and Chief Operating Officer, Hellman, Jordan Management Co., Inc. (an investment management company) (2000-2003). Formerly, Advisory Director of Berkshire Capital Corporation (investment banking firm) (2002-2003). | | | 176 | | | None | |
|
49
Eaton Vance Floating-Rate Fund
MANAGEMENT AND ORGANIZATION CONT'D
Name and
Date of Birth | | Position(s)
with the
Trust and
the Portfolio | | Term of
Office and
Length of
Service | | Principal Occupation(s)
During Past Five Years | | Number of Portfolios
in Fund Complex
Overseen By
Trustee(1) | | Other Directorships Held | |
| Noninterested Trustee(s) (continued) | | | | | | | | | | | | | |
|
| Heidi L. Steiger 7/8/53 | | Trustee | | Since 2007 | | President, Lowenhaupt Global Advisors, LLC (global wealth management firm) (since 2005); Formerly, President and Contributing Editor, Worth Magazine (2004); Formerly, Executive Vice President and Global Head of Private Asset Management (and various other positions), Neuberger Berman (investment firm) (1986-2004). | | | 173 | | | Director of Nuclear Electric Insurance Ltd. (nuclear insurance provider) and Aviva USA (insurance provider) | |
|
| Lynn A. Stout 9/14/57 | | Trustee | | Trustee of the Trust since 1998 and of the Portfolio since 2000 | | Paul Hastings Professor of Corporate and Securities Law, University of California at Los Angeles School of Law. | | | 176 | | | None | |
|
| Ralph F. Verni 1/26/43 | | Chairman of the Board and Trustee | | Chairman of the Board since 2007 and Trustee since 2005 | | Consultant and private investor. | | | 176 | | | None | |
|
| Principal Officers who are not Trustees | | | | | | | | | | | | | |
|
Name and
Date of Birth | | Position(s)
with the
Trust and
the Portfolio | | Term of
Office and
Length of
Service | | Principal Occupation(s)
During Past Five Years | |
| William H. Ahern, Jr. 7/28/59 | | Vice President of the Trust | | Since 1995 | | Vice President of EVM and BMR. Officer of 74 registered investment companies managed by EVM or BMR. | |
|
| Cynthia J. Clemson 3/2/63 | | Vice President of the Trust | | Since 2005 | | Vice President of EVM and BMR. Officer of 89 registered investment companies managed by EVM or BMR. | |
|
| Charles B. Gaffney 12/4/72 | | Vice President of the Trust | | Since 2007 | | Vice President of EVM and BMR. Previously, Sector Portfolio Manager and Senior Equity Analyst of Brown Brothers Harriman (1997-2003). Officer of 29 registered investment companies managed by EVM or BMR. | |
|
| Christine M. Johnston 11/9/72 | | Vice President of the Trust | | Since 2007 | | Vice President of EVM and BMR. Officer of 34 registered investment companies managed by EVM or BMR. | |
|
| Aamer Khan 6/7/60 | | Vice President of the Trust | | Since 2005 | | Vice President of EVM and BMR. Officer of 32 registered investment companies managed by EVM or BMR. | |
|
| Thomas H. Luster 4/8/62 | | Vice President of the Trust | | Since 2006 | | Vice President of EVM and BMR. Officer of 48 registered investment companies managed by EVM or BMR. | |
|
| Michael R. Mach 7/15/47 | | Vice President of the Trust | | Since 1999 | | Vice President of EVM and BMR. Officer of 54 registered investment companies managed by EVM or BMR. | |
|
| Robert B. MacIntosh 1/22/57 | | Vice President of the Trust | | Since 1998 | | Vice President of EVM and BMR. Officer of 89 registered investment companies managed by EVM or BMR. | |
|
| Scott H. Page 11/30/59 | | President of the Portfolio | | Since 2007(2) | | Vice President of EVM and BMR. Officer of 15 registered investment companies managed by EVM or BMR. | |
|
| Duncan W. Richardson 10/26/57 | | Vice President of the Trust | | Since 2001 | | Executive Vice President and Chief Equity Investment Officer of EVC, EVM and BMR. Officer 80 registered investment companies managed by EVM or BMR. | |
|
| Walter A. Row, III 7/20/57 | | Vice President of the Trust | | Since 2001 | | Director of Equity Research and a Vice President of EVM and BMR. Officer of 38 registered investment companies managed by EVM or BMR. | |
|
| Craig Russ 10/30/63 | | Vice President of FRP | | Since 2007 | | Vice President of EVM and BMR. Officer of 9 registered investment companies managed by EVM or BMR. | |
|
| Judith A. Saryan 8/21/54 | | Vice President of the Trust | | Since 2003 | | Vice President of EVM and BMR. Officer of 53 registered investment companies managed by EVM or BMR. | |
|
50
Eaton Vance Floating-Rate Fund
MANAGEMENT AND ORGANIZATION CONT'D
Name and
Date of Birth | | Position(s)
with the
Trust and
the Portfolio | | Term of
Office and
Length of
Service | | Principal Occupation(s)
During Past Five Years | |
| Principal Officers who are not Trustees (continued) | |
|
| Susan Schiff 3/31/61 | | Vice President of the Trust | | Since 2002 | | Vice President of EVM and BMR. Officer of 35 registered investment companies managed by EVM or BMR. | |
|
| Thomas Seto 9/27/62 | | Vice President of the Trust | | Since 2007 | | Vice President and Director of Portfolio Management of Parametric. Officer of 30 registered investment companies managed by EVM or BMR. | |
|
| David M. Stein 5/4/51 | | Vice President of the Trust | | Since 2007 | | Managing Director and Chief Investment Officer of Parametric. Officer of 30 registered investment companies managed by EVM or BMR. | |
|
| Payson F. Swaffield 8/13/56 | | President of the Portfolio | | Since 2002 | | Vice President of EVM and BMR. Officer of 15 registered investment companies managed by EVM or BMR. | |
|
| Mark S. Venezia 5/23/49 | | Vice President of the Trust | | Since 2007 | | Vice President of EVM and BMR. Officer of 35 registered investment companies managed by EVM or BMR. | |
|
| Adam A. Weigold 3/22/75 | | Vice President of the Trust | | Since 2007 | | Vice President of EVM and BMR. Officer of 70 registered investment companies managed by EVM or BMR. | |
|
| Barbara E. Campbell 6/19/57 | | Treasurer of the Trust | | Since 2005 | | Vice President of EVM and BMR. Officer of 176 registered investment companies managed by EVM or BMR. | |
|
| Maureen A. Gemma 5/24/60 | | Secretary | | Since 2007 | | Vice President and Deputy Chief Legal Officer of EVM and BMR. Officer of 176 registered investment companies managed by EVM or BMR. | |
|
| Dan A. Maalouly 3/25/62 | | Treasurer of the Portfolio | | Since 2005 | | Vice President of EVM and BMR. Previously, Senior Manager at PricewaterhouseCoopers LLP (1997-2005). Officer of 76 registered investment companies managed by EVM or BMR. | |
|
| Paul M. O'Neil 7/11/53 | | Chief Compliance Officer | | Since 2004 | | Vice President of EVM and BMR. Officer of 176 registered investment companies managed by EVM or BMR. | |
|
(1) Includes both master and feeder funds in a master-feeder structure.
(2) Prior to 2007, Mr. Page served as Vice President of the Portfolio since 2000.
The SAI for the Fund includes additional information about the Trustees and officers of the Fund and the Portfolio and can be obtained without charge by calling 1-800-225-6265.
51
This Page Intentionally Left Blank
Investment Adviser of Floating Rate Portfolio
Boston Management and Research
The Eaton Vance Building
255 State Street
Boston, MA 02109
Administrator of Eaton Vance Floating-Rate Fund
Eaton Vance Management
The Eaton Vance Building
255 State Street
Boston, MA 02109
Principal Underwriter
Eaton Vance Distributors, Inc.
The Eaton Vance Building
255 State Street
Boston, MA 02109
(617) 482-8260
Custodian
State Street Bank & Trust Company
200 Clarendon Street
Boston, MA 02116
Transfer Agent
PFPC Inc.
Attn: Eaton Vance Funds
P.O. Box 9653
Providence, RI 02940-9653
(800) 262-1122
Independent Registered Public Accounting Firm
Deloitte & Touche LLP
200 Berkeley Street
Boston, MA 02116-5022
Eaton Vance Floating-Rate Fund
The Eaton Vance Building
255 State Street
Boston, MA 02109
This report must be preceded or accompanied by a current prospectus. Before investing, investors should consider carefully the Fund's investment objective(s), risks, and charges and expenses. The Fund's current prospectus contains this and other information about the Fund and is available through your financial advisor. Please read the prospectus carefully before you invest or send money. For further information please call 1-800-225-6265.
1044-12/07 FRSRC

Annual Report October 31, 2007


EATON VANCE
FLOATING-RATE
& HIGH INCOME
FUND
IMPORTANT NOTICES REGARDING PRIVACY,
DELIVERY OF SHAREHOLDER DOCUMENTS,
PORTFOLIO HOLDINGS, AND PROXY VOTING
Privacy. The Eaton Vance organization is committed to ensuring your financial privacy. Each of the financial institutions identified below has in effect the following policy ("Privacy Policy") with respect to nonpublic personal information about its customers:
• Only such information received from you, through application forms or otherwise, and information about your Eaton Vance fund transactions will be collected. This may include information such as name, address, social security number, tax status, account balances and transactions.
• None of such information about you (or former customers) will be disclosed to anyone, except as permitted by law (which includes disclosure to employees necessary to service your account). In the normal course of servicing a customer's account, Eaton Vance may share information with unaffiliated third parties that perform various required services such as transfer agents, custodians and broker/dealers.
• Policies and procedures (including physical, electronic and procedural safeguards) are in place that are designed to protect the confidentiality of such information.
• We reserve the right to change our Privacy Policy at any time upon proper notification to you. Customers may want to review our Policy periodically for changes by accessing the link on our homepage: www.eatonvance.com.
Our pledge of privacy applies to the following entities within the Eaton Vance organization: the Eaton Vance Family of Funds, Eaton Vance Management, Eaton Vance Investment Counsel, Boston Management and Research, and Eaton Vance Distributors, Inc.
In addition, our Privacy Policy only applies to those Eaton Vance customers who are individuals and who have a direct relationship with us. If a customer's account (i.e., fund shares) is held in the name of a third-party financial adviser/broker-dealer, it is likely that only such adviser's privacy policies apply to the customer. This notice supersedes all previously issued privacy disclosures.
For more information about Eaton Vance's Privacy Policy, please call 1-800-262-1122.
Delivery of Shareholder Documents. The Securities and Exchange Commission permits funds to deliver only one copy of shareholder documents, including prospectuses, proxy statements and shareholder reports, to fund investors with multiple accounts at the same residential or post office box address. This practice is often called "householding" and it helps eliminate duplicate mailings to shareholders.
Eaton Vance, or your financial adviser, may household the mailing of your documents indefinitely unless you instruct Eaton Vance, or your financial adviser, otherwise.
If you would prefer that your Eaton Vance documents not be householded, please contact Eaton Vance at
1-800-262-1122, or contact your financial adviser.
Your instructions that householding not apply to delivery of your Eaton Vance documents will be effective within 30 days of receipt by Eaton Vance or your financial adviser.
Portfolio Holdings. Each Eaton Vance Fund and its underlying Portfolio (if applicable) will file a schedule of its portfolio holdings on Form N-Q with the Securities and Exchange Commission for the first and third quarters of each fiscal year. The Form N-Q will be available on the Eaton Vance website www.eatonvance.com, by calling Eaton Vance at 1-800-262-1122 or in the EDGAR database on the Securities and Exchange Commision's website at www.sec.gov. Form N-Q may also be reviewed and copied at the SEC's public reference room in Washington, D.C. (call 1-800-732-0330 for information on the operation of the public reference room).
Proxy Voting. From time to time, funds are required to vote proxies related to the securities held by the funds. The Eaton Vance Funds or their underlying Portfolios (if applicable) vote proxies according to a set of policies and procedures approved by the Funds' and Portfolios' Boards. You may obtain a description of these policies and procedures and information on how the Funds or Portfolios voted proxies relating to portfolio securities during the most recent 12 month period ended June 30, without charge, upon request, by calling 1-800-262-1122. This description is also available on the Securities and Exchange Commission's website at www.sec.gov.
Eaton Vance Floating-Rate & High Income Fund as of October 31, 2007
MANAGEMENT’S DISCUSSION OF FUND PERFORMANCE
The Fund
Performance for the Past Year
• The Fund’s Advisers Class shares had a total return of 4.29% for the year ended October 31, 2007.(1) This return resulted from a decrease in net asset value per share (NAV) to $9.45 on October 31, 2007, from $9.69 on October 31, 2006, and the reinvestment of $0.647 in dividends.
• The Fund’s Class A shares had a total return of 4.35% for the year ended October 31, 2007.(1) This return resulted from a decrease in NAV per share (NAV) to $10.05 on October 31, 2007, from $10.30 on October 31, 2006, and the reinvestment of $0.688 in dividends.
• The Fund’s Class B shares had a total return of 3.63% for the year ended October 31, 2007.(1) This return resulted from a decrease in NAV per share to $9.45 on October 31, 2007, from $9.68 on October 31, 2006, and the reinvestment of $0.575 in dividends.
• The Fund’s Class C shares had a total return of 3.63% for the year ended October 31, 2007.(1) This return resulted from a decrease in NAV per share to $9.45 on October 31, 2007, from $9.68 on October 31, 2006, and the reinvestment of $0.575 in dividends.
• The Fund’s Class I shares had a total return of 4.65% for the year ended October 31, 2007.(1) This return resulted from a decrease in NAV per share to $9.46 on October 31, 2007, from $9.69 on October 31, 2006, and the reinvestment of $0.670 in dividends.
• For comparison, the S&P/LSTA Leveraged Loan Index – an unmanaged index of U.S. dollar-denominated leveraged loans – had a total return of 4.42% for the same period.(2)
Investment Environment
• The loan market underwent an unprecedented correction in the third quarter of 2007 that resulted from a decline in loan demand, combined with an increase in the supply of new loan issuance. Average loan market prices fell 4%-5% in July and August. The risk aversion that began in the subprime mortgage area spread to the leveraged loan market through increased credit spreads and loan price volatility, which in turn further reduced demand from key market participants, including hedge funds, collateralized loan participation funds and mutual funds. With investor demand falling and loan supply rising to record levels, prices fell to levels not seen since 2002.
• Interestingly, this market decline was distinguished from previous corrections by the fact that corporate loan default rates have remained at historic lows, 0.5% according to Standard & Poor’s. Thus, while there were increasing signs of a weakening economy, the market decline was primarily based on technical factors. The silver lining in the correction is that effective loan credit spreads widened from roughly 200 basis points (2.00%) over LIBOR – the London- Interbank Offered Rate, used by banks as a base for loans to large commercial and industrial companies – to around 300 basis points (3.00%) by the Fund’s fiscal year-end. That was closer to average historical levels.
The Fund’s Investments
• The Fund currently seeks its objective by investing at least 65% of its total assets in Floating Rate Portfolio and not more than 20% of its total assets in High Income Portfolio. The Portfolios are registered investment companies managed by Eaton Vance or its affiliates. Management of Floating Rate Portfolio seeks to invest in a portfolio of bank loans that it believes will be less volatile over time than the general loan market.
• The Portfolio’s investments included senior loans to 547 borrowers spanning 38 industries at October 31, 2007, with an average loan size of 0.18% of total investments, and no industry constituting more than 10% of total investments. Publishing, health care, cable and satellite television, chemicals and plastics, and business equipment and services were the largest industry weightings.(3)
(1) these returns do not include the 2.25% maximum sales charge for Class A shares or the applicable contingent deferred sales charges (CDSC) for Class B and Class C shares. If sales charges were deducted, the returns would be lower. Advisers Class and Class I shares are offered to investors at net asset value.
(2) It is not possible to invest directly in an Index. The Index’s total return does not reflect the commissions or expenses that would have been incurred if an investor individually purchased or sold the securities represented in the Index.
(3) Portfolio investments may not be representative of the Portfolio’s current or future investments and may change due to active management.
The views expressed throughout this report are those of the portfolio managers and are current only through the end of the period of the report as stated on the cover. These views are subject to change at any time based upon market or other conditions, and the investment adviser disclaims any responsibility to update such views. These views may not be relied on as investment advice and, because investment decisions for a fund are based on many factors, may not be relied on as an indication of trading intent on behalf of any Eaton Vance fund.
Past performance is no guarantee of future results. Returns are historical and are calculated by determining the percentage change in net asset value or offering price (as applicable) with all distributions reinvested. Investment return and principal value will fluctuate so that shares, when redeemed, may be worth more or less than their original cost. Performance is for the stated time period only; due to market volatility, the Fund’s current performance may be lower or higher than the quoted return. For performance as of the most recent month end, please refer to www.eatonvance.com.
Fund shares are not insured by the FDIC and are not deposits or other obligations of, or guaranteed by, any depository institution. Shares are subject to investment risks, including possible loss of principal invested.
1
Eaton Vance Floating-Rate & High Income Fund as of October 31, 2007
PORTFOLIO PROFILE
• The Portfolio is well diversified in terms of industry, market and geography – a strategy management believes should help the Portfolio weather an economic downturn. The Portfolio had a 15.5% exposure to European loans, which provided further diversification and the opportunity for yield enhancement. Loans denominated in foreign currencies were hedged to protect against foreign currency risk.(1)
The Portfolio had a modest 1.4% exposure to home builders. Home builders have struggled in the recent economic climate; however, management believes that these loans should benefit from the security and collateral that back these exposures. The Portfolio did not have any direct exposure to subprime or prime mortgage lenders during the year ended October 31, 2007.(1)
• The Fund’s net asset value reflected the market correction, declining in July and August, before temporarily rebounding somewhat in September and October. Despite the summer decline, the Fund registered a positive total return for the fiscal year.
• The Fund reduced its exposure to high-yield bonds during the fiscal year, with an approximately 10% investment in High Income Portfolio at October 31, 2007. The high-yield market corrected dramatically, with spreads widening amid weakening demand and a large overhang of merger-related supply. High Income Portfolio continued to focus on shorter-maturity securities.(1)
(1) Portfolio information may change due to active management.
Top Ten Holdings(2)
By total Floating Rate Portfolio’s investments
Sungard Data Systems | | 1.1 | % |
Charter Communications Operating, LLC | | 1.1 | |
Community Health Systems, Inc. | | 1.0 | |
Univision Communications, Inc. | | 1.0 | |
NRG Energy Inc. | | 1.0 | |
UPC Broadband Holding B.V. | | 0.9 | |
Georgia-Pacific Corp. | | 0.9 | |
Gala Group Ltd. | | 0.8 | |
Idearc, Inc. | | 0.8 | |
Metro-Goldwyn-Mayer Studios, Inc. | | 0.8 | |
(2) Reflects the Floating Rate Portfolio’s investments as of October 31, 2007. Top Ten Holdings are shown as a percentage of the Portfolio’s total investments. Portfolio information may not be representative of current or future investments and may change due to active management.
Top Five Industries(3)
By total Floating Rate Portfolio’s investments
Publishing | | 9.1 | % |
Health Care | | 7.8 | |
Cable & Satellite Television | | 7.3 | |
Chemicals & Plastics | | 6.4 | |
Business Equipment & Services | | 6.2 | |
(3) Reflects the Floating Rate Portfolio’s investments as of October 31, 2007. Industries are shown as a percentage of the Portfolio’s total investments. Portfolio information may not be representative of current or future investments and are subject to change due to active management.
Credit Quality Ratings for Total loan Investments(4)
By total loan investments
Baa | | 2.0 | % |
Ba | | 51.4 | |
B | | 29.2 | |
Caa | | 0.3 | |
Non-Rated(5) | | 17.1 | |
(4) Credit Quality ratings are those provided by Moody’s, a nationally recognized bond rating service. As a percentage of the Floating-Rate Portfolio’s total loan investments as of October 31, 2007. Fund information may not be representative of the Portfolio’s current or future investments and may change due to active management.
(5) Certain loans in which the Portfolio invests are not rated by a rating agency. In management’s opinion, such securities are comparable to securities rated by a rating agency in the categories listed above.
2
Eaton Vance Floating-Rate & High Income Fund as of October 31, 2007
FUND PERFORMANCE
The line graph and table set forth below provide information about the Fund’s performance. The line graph compares the performance of Class B of the Fund with that of the S&P/LSTA Leveraged Loan Index, an unmanaged loan market index. The lines on the graph represent the total returns of a hypothetical investment of $10,000 in Class B of the Fund and the S&P/LSTA Leveraged Loan Index. The table includes the total returns of each Class of the Fund at net asset value. The performance presented below does not reflect the deduction of taxes, if any, that a shareholder would pay on Fund distributions or the redemption of Fund shares.
| | Advisers | | | | | | | | | |
Performance(1) | | Class | | Class A | | Class B | | Class C | | Class I | |
Share Class Symbol | | EAFHX | | EVFHX | | EBFHX | | ECFHX | | EIFHX | |
Average Annual Total Returns (at net asset value) | | | | | | | | | |
One Year | | 4.29 | % | 4.35 | % | 3.63 | % | 3.63 | % | 4.65 | % |
Five Years | | 5.96 | | N.A. | | 5.18 | | 5.18 | | 6.23 | |
Life of Fund† | | 4.79 | | 5.40 | | 4.06 | | 4.06 | | 5.04 | |
| | | | | | | | | | | |
SEC Average Annual Total Returns (including sales charge or applicable CDSC) | | | | | |
One Year | | 4.29 | % | 1.97 | % | - 1.2 5 | % | 2.65 | % | 4.65 | % |
Five Years | | 5.96 | | N.A. | | 4.85 | | 5.18 | | 6.23 | |
Life of Fund† | | 4.79 | | 4.87 | | 4.06 | | 4.06 | | 5.04 | |
† Inception Dates – Advisers Class: 9/7/00; Class A: 5/7/03; Class B: 9/5/00; Class C: 9/5/00; Class I: 9/15/00
(1) Average Annual Total Returns at net asset value do not include the 2.25% maximum sales charge for Class A shares or the applicable contingent deferred sales charges (CDSC) for Class B and Class C shares. If sales charges were deducted, the returns would be lower. SEC Average Annual Total Returns for Class A reflect the maximum 2.25% sales charge. Advisers Class and Class I shares are offered to certain investors at net asset value. SEC Average Annual Total Returns for Class B reflect applicable CDSC based on the following schedule: 5% - 1st and 2nd years; 4% - 3rd year; 3% - 4th year; 2% - 5th year; 1% - 6th year. SEC returns for Class C reflect 1% CDSC for the first year. Class A, Advisers Class and Class I shares are subject to a 1% redemption fee if redeemed or exchanged within 90 days of the settlement of the purchase.
Total annual | | Advisers | | | | | | | | | |
Operating Expenses (2) | | Class | | Class A | | Class B | | Class C | | Class I | |
| | | | | | | | | | | |
Expense Ratio | | 1.05 | % | 1.05 | % | 1.80 | % | 1.80 | % | 0.80 | % |
(2) Source: Prospectus dated 3/1/07.
Comparison of Change in Value of a $10,000 Investment in Eaton Vance Floating-Rate & High Income Fund Class B vs. the S&P/LSTA Leveraged Loan Index*
September 30, 2000 – October 31, 2007
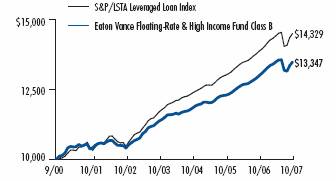
* Sources: Standard & Poor’s; Thomson Financial. Class B of the Fund commenced operations on 9/5/00. Index data is available as of month end only. A $10,000 hypothetical investment at net asset value in Class A on 5/7/03, Class C on 9/30/00, Class I on 9/15/00 and Advisers Class on 9/7/00 would have been valued at $12,662 ($12,377 at the maximum offering price), $13,350, $14,202 and $13,975, respectively, on 10/31/07. It is not possible to invest directly in an Index. The Index’s total return does not reflect the expenses that would have been incurred if an investor individually purchased or sold the securities represented in the Index.
Past performance is no guarantee of future results. Returns are historical and are calculated by determining the percentage change in net asset value or offering price (as applicable) with all distributions reinvested. Investment return and principal value will fluctuate so that shares, when redeemed, may be worth more or less than their original cost. Performance is for the stated time period only; due to market volatility, the Fund’s current performance may be lower or higher than the quoted return. For performance as of the most recent month end, please refer to www.eatonvance.com.
3
Eaton Vance Floating-Rate & High Income Fund as of October 31, 2007
FUND EXPENSES
Example: As a shareholder of the Fund, you incur two types of costs: (1) transaction costs, including sales charges (loads) on purchases and redemption fees (if applicable); and (2) ongoing costs, including management fees; distribution or service fees; and other Fund expenses. This Example is intended to help you understand your ongoing costs (in dollars) of investing in the Fund and to compare these costs with the ongoing costs of investing in other mutual funds. The Example is based on an investment of $1,000 invested at the beginning of the period and held for the entire period (May 1, 2007 – October 31, 2007).
Actual Expenses: The first section of the table below provides information about actual account values and actual expenses. You may use the information in this section, together with the amount you invested, to estimate the expenses that you paid over the period. Simply divide your account value by $1,000 (for example, an $8,600 account value divided by $1,000 = 8.6), then multiply the result by the number in the first section under the heading entitled "Expenses Paid During Period" to estimate the expenses you paid on your account during this period.
Hypothetical Example for Comparison Purposes: The second section of the table below provides information about hypothetical account values and hypothetical expenses based on the actual Fund expense ratio and an assumed rate of return of 5% per year (before expenses), which is not the actual return of the Fund. The hypothetical account values and expenses may not be used to estimate the actual ending account balance or expenses you paid for the period. You may use this information to compare the ongoing costs of investing in the Fund and other funds. To do so, compare this 5% hypothetical example with the 5% hypothetical examples that appear in the shareholder reports of the other funds.
Please note that the expenses shown in the table are meant to highlight your ongoing costs only and do not reflect any transactional costs, such as sales charges (loads) or redemption fees (if applicable). Therefore, the second section of the table is useful in comparing ongoing costs only, and will not help you determine the relative total costs of owning different funds. In addition, if these transactional costs were included, your costs would have been higher.
Eaton Vance Floating-Rate & High Income Fund
| | | Beginning Account Value
(5/1/07) | | Ending Account Value
(10/31/07) | | Expenses Paid During Period*
(5/1/07 – 10/31/07) | |
| Actual | |
| Advisers Class | | $ | 1,000.00 | | | $ | 1,003.60 | | | $ | 5.66 | | |
| Class A | | $ | 1,000.00 | | | $ | 1,003.50 | | | $ | 5.71 | | |
| Class B | | $ | 1,000.00 | | | $ | 999.80 | | | $ | 9.48 | | |
| Class C | | $ | 1,000.00 | | | $ | 999.80 | | | $ | 9.48 | | |
| Class I | | $ | 1,000.00 | | | $ | 1,004.90 | | | $ | 4.40 | | |
| Hypothetical | |
| (5% return per year before expenses) | |
| Advisers Class | | $ | 1,000.00 | | | $ | 1,019.60 | | | $ | 5.70 | �� | |
| Class A | | $ | 1,000.00 | | | $ | 1,019.50 | | | $ | 5.75 | | |
| Class B | | $ | 1,000.00 | | | $ | 1,015.70 | | | $ | 9.55 | | |
| Class C | | $ | 1,000.00 | | | $ | 1,015.70 | | | $ | 9.55 | | |
| Class I | | $ | 1,000.00 | | | $ | 1,020.80 | | | $ | 4.43 | | |
* Expenses are equal to the Fund's annualized expense ratio of 1.12% for Advisers Class shares, 1.13% for Class A shares, 1.88% for Class B shares, 1.88% for Class C shares and 0.87% for Class I shares multiplied by the average account value over the period, multiplied by 184/365 (to reflect the one-half year period). The Example assumes that the $1,000 was invested at the net asset value per share determined at the close of business on April 30, 2007. The Example reflects the expenses of both the Fund and the Portfolios.
4
Eaton Vance Floating-Rate & High Income Fund as of October 31, 2007
FINANCIAL STATEMENTS
Statement of Assets and Liabilities
As of October 31, 2007
| Assets | |
Investment in Floating-Rate Portfolio, at value
(identified cost, $1,239,023,138) | | $ | 1,219,068,974 | | |
Investment in High Income Portfolio, at value
(identified cost, $137,833,701) | | | 135,660,888 | | |
| Receivable for Fund shares sold | | | 7,350,862 | | |
| Total assets | | $ | 1,362,080,724 | | |
| Liabilities | |
| Payable for Fund shares redeemed | | $ | 7,025,787 | | |
| Dividends payable | | | 1,998,955 | | |
| Payable to affiliate for distribution and service fees | | | 603,588 | | |
| Payable to affiliate for administration fees | | | 180,607 | | |
| Payable to affiliate for Trustees' fees | | | 333 | | |
| Accrued expenses | | | 337,738 | | |
| Total liabilities | | $ | 10,147,008 | | |
| Net Assets | | $ | 1,351,933,716 | | |
| Sources of Net Assets | |
| Paid-in capital | | $ | 1,407,765,984 | | |
Accumulated net realized loss from Portfolio
(computed on the basis of identified cost) | | | (32,741,229 | ) | |
| Accumulated distributions in excess of net investment income | | | (964,062 | ) | |
Net unrealized depreciation from Portfolios
(computed on the basis of identified cost) | | | (22,126,977 | ) | |
| Total | | $ | 1,351,933,716 | | |
| Advisers Shares | |
| Net Assets | | $ | 469,776,580 | | |
| Shares Outstanding | | | 49,694,524 | | |
Net Asset Value, Offering Price and Redemption Price Per Share
(net assets ÷ shares of beneficial interest outstanding) | | $ | 9.45 | | |
| Class A Shares | |
| Net Assets | | $ | 361,137,989 | | |
| Shares Outstanding | | | 35,931,474 | | |
Net Asset Value and Redemption Price Per Share
(net assets ÷ shares of beneficial interest outstanding) | | $ | 10.05 | | |
Maximum Offering Price Per Share
(100 ÷ 97.75 of $10.05) | | $ | 10.28 | | |
| Class B Shares | |
| Net Assets | | $ | 99,812,375 | | |
| Shares Outstanding | | | 10,564,498 | | |
Net Asset Value and Offering Price Per Share*
(net assets ÷ shares of beneficial interest outstanding) | | $ | 9.45 | | |
| Class C Shares | |
| Net Assets | | $ | 383,162,630 | | |
| Shares Outstanding | | | 40,564,683 | | |
Net Asset Value and Offering Price Per Share*
(net assets ÷ shares of beneficial interest outstanding) | | $ | 9.45 | | |
| Class I Shares | |
| Net Assets | | $ | 38,044,142 | | |
| Shares Outstanding | | | 4,023,015 | | |
Net Asset Value, Offering Price and Redemption Price Per Share
(net assets ÷ shares of beneficial interest outstanding) | | $ | 9.46 | | |
| On sales of $100,000 or more, the offering price of Class A shares is reduced. | |
* Redemption price per share is equal to the net asset value less any applicable contingent deferred sales charge.
Statement of Operations
For the Year Ended
October 31, 2007
| Investment Income | |
| Interest and other income allocated from Portfolios | | $ | 137,730,619 | | |
| Dividends allocated from Portfolios | | | 175,922 | | |
| Expenses allocated from Portfolios | | | (10,444,989 | ) | |
| Net investment income from Portfolios | | $ | 127,461,552 | | |
| Expenses | |
| Administration fee | | $ | 2,681,145 | | |
| Trustees' fees and expenses | | | 3,743 | | |
Distribution and service fees
Advisers | | | 1,932,725 | | |
| Class A | | | 1,051,565 | | |
| Class B | | | 1,184,063 | | |
| Class C | | | 4,264,499 | | |
| Transfer and dividend disbursing agent fees | | | 1,286,366 | | |
| Printing and postage | | | 250,767 | | |
| Registration fees | | | 140,934 | | |
| Legal and accounting services | | | 48,788 | | |
| Custodian fee | | | 42,526 | | |
| Miscellaneous | | | 32,375 | | |
| Total expenses | | $ | 12,919,496 | | |
| Net investment income | | $ | 114,542,056 | | |
Realized and Unrealized
Gain (Loss) from Portfolio | |
Net realized gain (loss) —
Investment transactions | | $ | 7,143,812 | | |
| Swap contracts | | | 190,601 | | |
Foreign currency and forward foreign currency exchange
contract transactions | | | (18,934,391 | ) | |
| Net realized loss | | $ | (11,599,978 | ) | |
Change in unrealized appreciation (depreciation) —
Investments | | $ | (34,262,643 | ) | |
| Swap contracts | | | 98,580 | | |
| Foreign currency and forward foreign currency exchange contracts | | | 135,037 | | |
| Net change in unrealized appreciation (depreciation) | | $ | (34,029,026 | ) | |
| Net realized and unrealized loss | | $ | (45,629,004 | ) | |
| Net increase in net assets from operations | | $ | 68,913,052 | | |
See notes to financial statements
5
Eaton Vance Floating-Rate & High Income Fund as of October 31, 2007
FINANCIAL STATEMENTS CONT'D
Statements of Changes in Net Assets
Increase (Decrease)
in Net Assets | | Year Ended
October 31, 2007 | | Year Ended
October 31, 2006 | |
| From operations — | |
| Net investment income | | $ | 114,542,056 | | | $ | 113,344,047 | | |
Net realized loss from investment
transactions, swap contracts, and
foreign currency and forward
foreign currency exchange
contract transactions | | | (11,599,978 | ) | | | (1,829,186 | ) | |
Net change in unrealized
appreciation (depreciation) from
investments, swap contracts, and
foreign currency and forward
foreign currency exchange contracts | | | (34,029,026 | ) | | | 3,561,922 | | |
| Net increase in net assets from operations | | $ | 68,913,052 | | | $ | 115,076,783 | | |
Distributions to shareholders —
From net investment income
Advisers | | $ | (51,900,786 | ) | | $ | (49,695,417 | ) | |
| Class A | | | (28,305,914 | ) | | | (27,632,711 | ) | |
| Class B | | | (7,077,272 | ) | | | (8,134,859 | ) | |
| Class C | | | (25,477,484 | ) | | | (26,223,644 | ) | |
| Class I | | | (3,400,672 | ) | | | (3,003,963 | ) | |
| Total distributions to shareholders | | $ | (116,162,128 | ) | | $ | (114,690,594 | ) | |
Transactions in shares of beneficial interest —
Proceeds from sale of shares
Advisers | | $ | 242,057,197 | | | $ | 424,664,578 | | |
| Class A | | | 201,764,125 | | | | 158,084,702 | | |
| Class B | | | 6,727,378 | | | | 7,842,985 | | |
| Class C | | | 73,125,819 | | | | 87,555,753 | | |
| Class I | | | 35,055,777 | | | | 28,205,944 | | |
Net asset value of shares issued to
shareholders in payment of
distributions declared
Advisers | | | 35,936,405 | | | | 35,008,954 | | |
| Class A | | | 22,036,744 | | | | 21,321,139 | | |
| Class B | | | 4,566,007 | | | | 5,292,881 | | |
| Class C | | | 17,660,203 | | | | 18,122,229 | | |
| Class I | | | 2,649,298 | | | | 2,612,359 | | |
| Cost of shares redeemed | |
| Advisers | | | (629,689,973 | ) | | | (328,160,050 | ) | |
| Class A | | | (282,795,525 | ) | | | (235,600,058 | ) | |
| Class B | | | (34,340,242 | ) | | | (37,976,945 | ) | |
| Class C | | | (142,937,846 | ) | | | (185,720,529 | ) | |
| Class I | | | (50,780,490 | ) | | | (15,289,389 | ) | |
| Net asset value of shares exchanged | |
| Class A | | | 8,691,621 | | | | 4,793,984 | | |
| Class B | | | (8,691,621 | ) | | | (4,793,984 | ) | |
| Redemption Fees | | | 138,956 | | | | 98,648 | | |
Net decrease in net assets from
Fund share transactions | | $ | (498,826,167 | ) | | $ | (13,936,799 | ) | |
| Net decrease in net assets | | $ | (546,075,243 | ) | | $ | (13,550,610 | ) | |
| Net Assets | | Year Ended
October 31, 2007 | | Year Ended
October 31, 2006 | |
| At beginning of year | | $ | 1,898,008,959 | | | $ | 1,911,559,569 | | |
| At end of year | | $ | 1,351,933,716 | | | $ | 1,898,008,959 | | |
Accumulated undistributed
(distributions in excess of)
net investment income
included in net assets | |
| At end of year | | $ | (964,062 | ) | | $ | 1,530,823 | | |
See notes to financial statements
6
Eaton Vance Floating-Rate & High Income Fund as of October 31, 2007
FINANCIAL STATEMENTS CONT'D
Financial Highlights
| | | Advisers | |
| | | Year Ended October 31, | |
| | | 2007(1) | | 2006(1) | | 2005(1) | | 2004(1) | | 2003(1) | |
| Net asset value — Beginning of year | | $ | 9.690 | | | $ | 9.680 | | | $ | 9.710 | | | $ | 9.610 | | | $ | 9.140 | | |
| Income (loss) from operations | |
| Net investment income | | $ | 0.639 | | | $ | 0.597 | | | $ | 0.451 | | | $ | 0.347 | | | $ | 0.407 | | |
| Net realized and unrealized gain (loss) | | | (0.233 | ) | | | 0.014 | | | | (0.031 | ) | | | 0.103 | | | | 0.486 | | |
| Total income from operations | | $ | 0.406 | | | $ | 0.611 | | | $ | 0.420 | | | $ | 0.450 | | | $ | 0.893 | | |
| Less distributions | |
| From net investment income | | $ | (0.647 | ) | | $ | (0.601 | ) | | $ | (0.451 | ) | | $ | (0.350 | ) | | $ | (0.423 | ) | |
| Total distributions | | $ | (0.647 | ) | | $ | (0.601 | ) | | $ | (0.451 | ) | | $ | (0.350 | ) | | $ | (0.423 | ) | |
| Redemption fees | | $ | 0.001 | | | $ | 0.000 | (2) | | $ | 0.001 | | | $ | 0.000 | (2) | | $ | 0.000 | (2) | |
| Net asset value — End of year | | $ | 9.450 | | | $ | 9.690 | | | $ | 9.680 | | | $ | 9.710 | | | $ | 9.610 | | |
| Total Return(3) | | | 4.29 | % | | | 6.49 | % | | | 4.42 | % | | | 4.76 | % | | | 9.98 | % | |
| Ratios/Supplemental Data | |
| Net assets, end of year (000's omitted) | | $ | 469,777 | | | $ | 841,865 | | | $ | 710,286 | | | $ | 474,219 | | | $ | 68,258 | | |
| Ratios (As a percentage of average daily net assets): | |
| Expenses before custodian fee reduction(4) | | | 1.08 | % | | | 1.05 | % | | | 1.05 | % | | | 1.06 | % | | | 1.12 | % | |
| Expenses after custodian fee reduction(4) | | | 1.08 | % | | | 1.05 | % | | | 1.05 | % | | | 1.06 | % | | | 1.12 | % | |
| Net investment income | | | 6.63 | % | | | 6.16 | % | | | 4.65 | % | | | 3.59 | % | | | 4.32 | % | |
| Portfolio Turnover of the Floating-Rate Portfolio | | | 61 | % | | | 50 | % | | | 57 | % | | | 67 | % | | | 64 | % | |
| Portfolio Turnover of the High Income Portfolio | | | 81 | % | | | 62 | % | | | 62 | % | | | 80 | % | | | 118 | % | |
(1) Net investment income per share was computed using average shares outstanding.
(2) Amount represents less than $0.0005 per share.
(3) Returns are historical and are calculated by determining the percentage change in net asset value with all distributions reinvested.
(4) Includes the Fund's share of the Portfolios' allocated expenses.
See notes to financial statements
7
Eaton Vance Floating-Rate & High Income Fund as of October 31, 2007
FINANCIAL STATEMENTS CONT'D
Financial Highlights
| | | Class A | |
| | | Year Ended October 31, | |
| | | 2007(1) | | 2006(1) | | 2005(1) | | 2004(1) | | 2003(1)(2) | |
| Net asset value — Beginning of year | | $ | 10.300 | | | $ | 10.290 | | | $ | 10.320 | | | $ | 10.220 | | | $ | 10.000 | | |
| Income (loss) from operations | |
| Net investment income | | $ | 0.680 | | | $ | 0.631 | | | $ | 0.475 | | | $ | 0.363 | | | $ | 0.179 | | |
| Net realized and unrealized gain (loss) | | | (0.243 | ) | | | 0.018 | | | | (0.027 | ) | | | 0.109 | | | | 0.241 | | |
| Total income from operations | | $ | 0.437 | | | $ | 0.649 | | | $ | 0.448 | | | $ | 0.472 | | | $ | 0.420 | | |
| Less distributions | |
| From net investment income | | $ | (0.688 | ) | | $ | (0.639 | ) | | $ | (0.479 | ) | | $ | (0.372 | ) | | $ | (0.200 | ) | |
| Total distributions | | $ | (0.688 | ) | | $ | (0.639 | ) | | $ | (0.479 | ) | | $ | (0.372 | ) | | $ | (0.200 | ) | |
| Redemption fees | | $ | 0.001 | | | $ | 0.000 | (3) | | $ | 0.001 | | | $ | 0.000 | (3) | | $ | — | | |
| Net asset value — End of year | | $ | 10.050 | | | $ | 10.300 | | | $ | 10.290 | | | $ | 10.320 | | | $ | 10.220 | | |
| Total Return(4) | | | 4.35 | % | | | 6.49 | % | | | 4.43 | % | | | 4.69 | % | | | 4.23 | %(7) | |
| Ratios/Supplemental Data | |
| Net assets, end of year (000's omitted) | | $ | 361,138 | | | $ | 423,214 | | | $ | 474,435 | | | $ | 431,257 | | | $ | 39,128 | | |
| Ratios (As a percentage of average daily net assets): | |
| Expenses before custodian fee reduction(5) | | | 1.09 | % | | | 1.05 | % | | | 1.05 | % | | | 1.07 | % | | | 1.12 | %(6) | |
| Expenses after custodian fee reduction(5) | | | 1.09 | % | | | 1.05 | % | | | 1.05 | % | | | 1.07 | % | | | 1.12 | %(6) | |
| Net investment income | | | 6.63 | % | | | 6.13 | % | | | 4.60 | % | | | 3.52 | % | | | 3.68 | %(6) | |
| Portfolio Turnover of the Floating-Rate Portfolio | | | 61 | % | | | 50 | % | | | 57 | % | | | 67 | % | | | 64 | % | |
| Portfolio Turnover of the High Income Portfolio | | | 81 | % | | | 62 | % | | | 62 | % | | | 80 | % | | | 118 | % | |
(1) Net investment income per share was computed using average shares outstanding.
(2) For the period from the start of business, May 7, 2003, to October 31, 2003.
(3) Amount represents less than $0.0005 per share.
(4) Returns are historical and are calculated by determining the percentage change in net asset value with all distributions reinvested.
(5) Includes the Fund's share of the Portfolios' allocated expenses.
(6) Annualized.
(7) Not annualized.
See notes to financial statements
8
Eaton Vance Floating-Rate & High Income Fund as of October 31, 2007
FINANCIAL STATEMENTS CONT'D
Financial Highlights
| | | Class B | |
| | | Year Ended October 31, | |
| | | 2007(1) | | 2006(1) | | 2005(1) | | 2004(1) | | 2003(1) | |
| Net asset value — Beginning of year | | $ | 9.680 | | | $ | 9.680 | | | $ | 9.700 | | | $ | 9.600 | | | $ | 9.140 | | |
| Income (loss) from operations | |
| Net investment income | | $ | 0.567 | | | $ | 0.520 | | | $ | 0.373 | | | $ | 0.275 | | | $ | 0.348 | | |
| Net realized and unrealized gain (loss) | | | (0.223 | ) | | | 0.008 | | | | (0.017 | ) | | | 0.102 | | | | 0.465 | | |
| Total income from operations | | $ | 0.344 | | | $ | 0.528 | | | $ | 0.356 | | | $ | 0.377 | | | $ | 0.813 | | |
| Less distributions | |
| From net investment income | | $ | (0.575 | ) | | $ | (0.528 | ) | | $ | (0.377 | ) | | $ | (0.277 | ) | | $ | (0.353 | ) | |
| Total distributions | | $ | (0.575 | ) | | $ | (0.528 | ) | | $ | (0.377 | ) | | $ | (0.277 | ) | | $ | (0.353 | ) | |
| Redemption fees | | $ | 0.001 | | | $ | 0.000 | (2) | | $ | 0.001 | | | $ | 0.000 | (2) | | $ | — | | |
| Net asset value — End of year | | $ | 9.450 | | | $ | 9.680 | | | $ | 9.680 | | | $ | 9.700 | | | $ | 9.600 | | |
| Total Return(3) | | | 3.63 | % | | | 5.60 | % | | | 3.74 | % | | | 3.98 | % | | | 9.05 | % | |
| Ratios/Supplemental Data | |
| Net assets, end of year (000's omitted) | | $ | 99,812 | | | $ | 134,213 | | | $ | 163,795 | | | $ | 182,045 | | | $ | 161,457 | | |
| Ratios (As a percentage of average daily net assets): | |
| Expenses before custodian fee reduction(4) | | | 1.84 | % | | | 1.80 | % | | | 1.80 | % | | | 1.82 | % | | | 1.87 | % | |
| Expenses after custodian fee reduction(4) | | | 1.84 | % | | | 1.80 | % | | | 1.80 | % | | | 1.82 | % | | | 1.87 | % | |
| Net investment income | | | 5.88 | % | | | 5.37 | % | | | 3.84 | % | | | 2.84 | % | | | 3.71 | % | |
| Portfolio Turnover of the Floating-Rate Portfolio | | | 61 | % | | | 50 | % | | | 57 | % | | | 67 | % | | | 64 | % | |
| Portfolio Turnover of the High Income Portfolio | | | 81 | % | | | 62 | % | | | 62 | % | | | 80 | % | | | 118 | % | |
(1) Net investment income per share was computed using average shares outstanding.
(2) Amount represents less than $0.0005 per share.
(3) Returns are historical and are calculated by determining the percentage change in net asset value with all distributions reinvested.
(4) Includes the Fund's share of the Portfolios' allocated expenses.
See notes to financial statements
9
Eaton Vance Floating-Rate & High Income Fund as of October 31, 2007
FINANCIAL STATEMENTS CONT'D
Financial Highlights
| | | Class C | |
| | | Year Ended October 31, | |
| | | 2007(1) | | 2006(1) | | 2005(1) | | 2004(1) | | 2003(1) | |
| Net asset value — Beginning of year | | $ | 9.680 | | | $ | 9.680 | | | $ | 9.700 | | | $ | 9.600 | | | $ | 9.140 | | |
| Income (loss) from operations | |
| Net investment income | | $ | 0.566 | | | $ | 0.521 | | | $ | 0.374 | | | $ | 0.273 | | | $ | 0.346 | | |
| Net realized and unrealized gain (loss) | | | (0.222 | ) | | | 0.007 | | | | (0.018 | ) | | | 0.104 | | | | 0.467 | | |
| Total income from operations | | $ | 0.344 | | | $ | 0.528 | | | $ | 0.356 | | | $ | 0.377 | | | $ | 0.813 | | |
| Less distributions | |
| From net investment income | | $ | (0.575 | ) | | $ | (0.528 | ) | | $ | (0.377 | ) | | $ | (0.277 | ) | | $ | (0.353 | ) | |
| Total distributions | | $ | (0.575 | ) | | $ | (0.528 | ) | | $ | (0.377 | ) | | $ | (0.277 | ) | | $ | (0.353 | ) | |
| Redemption fees | | $ | 0.001 | | | $ | 0.000 | (2) | | $ | 0.001 | | | $ | 0.000 | (2) | | $ | — | | |
| Net asset value — End of year | | $ | 9.450 | | | $ | 9.680 | | | $ | 9.680 | | | $ | 9.700 | | | $ | 9.600 | | |
| Total Return(3) | | | 3.63 | % | | | 5.59 | % | | | 3.74 | % | | | 3.98 | % | | | 9.06 | % | |
| Ratios/Supplemental Data | |
| Net assets, end of year (000's omitted) | | $ | 383,163 | | | $ | 445,987 | | | $ | 525,843 | | | $ | 513,459 | | | $ | 303,297 | | |
| Ratios (As a percentage of average daily net assets): | |
| Expenses before custodian fee reduction(4) | | | 1.84 | % | | | 1.80 | % | | | 1.80 | % | | | 1.82 | % | | | 1.87 | % | |
| Expenses after custodian fee reduction(4) | | | 1.84 | % | | | 1.80 | % | | | 1.80 | % | | | 1.82 | % | | | 1.87 | % | |
| Net investment income | | | 5.88 | % | | | 5.38 | % | | | 3.85 | % | | | 2.83 | % | | | 3.69 | % | |
| Portfolio Turnover of the Floating-Rate Portfolio | | | 61 | % | | | 50 | % | | | 57 | % | | | 67 | % | | | 64 | % | |
| Portfolio Turnover of the High Income Portfolio | | | 81 | % | | | 62 | % | | | 62 | % | | | 80 | % | | | 118 | % | |
(1) Net investment income per share was computed using average shares outstanding.
(2) Amount represents less than $0.0005 per share.
(3) Returns are historical and are calculated by determining the percentage change in net asset value with all distributions reinvested.
(4) Includes the Fund's share of the Portfolios' allocated expenses.
See notes to financial statements
10
Eaton Vance Floating-Rate & High Income Fund as of October 31, 2007
FINANCIAL STATEMENTS CONT'D
Financial Highlights
| | | Class I | |
| | | Year Ended October 31, | |
| | | 2007(1) | | 2006(1) | | 2005(1) | | 2004(1) | | 2003(1) | |
| Net asset value — Beginning of year | | $ | 9.690 | | | $ | 9.690 | | | $ | 9.710 | | | $ | 9.610 | | | $ | 9.150 | | |
| Income (loss) from operations | |
| Net investment income | | $ | 0.664 | | | $ | 0.623 | | | $ | 0.474 | | | $ | 0.373 | | | $ | 0.432 | | |
| Net realized and unrealized gain (loss) | | | (0.225 | ) | | | 0.003 | | | | (0.020 | ) | | | 0.102 | | | | 0.476 | | |
| Total income from operations | | $ | 0.439 | | | $ | 0.626 | | | $ | 0.454 | | | $ | 0.475 | | | $ | 0.908 | | |
| Less distributions | |
| From net investment income | | $ | (0.670 | ) | | $ | (0.626 | ) | | $ | (0.475 | ) | | $ | (0.375 | ) | | $ | (0.448 | ) | |
| Total distributions | | $ | (0.670 | ) | | $ | (0.626 | ) | | $ | (0.475 | ) | | $ | (0.375 | ) | | $ | (0.448 | ) | |
| Redemption fees | | $ | 0.001 | | | $ | 0.000 | (2) | | $ | 0.001 | | | $ | 0.000 | (2) | | $ | — | | |
| Net asset value — End of year | | $ | 9.460 | | | $ | 9.690 | | | $ | 9.690 | | | $ | 9.710 | | | $ | 9.610 | | |
| Total Return(3) | | | 4.65 | % | | | 6.65 | % | | | 4.78 | % | | | 5.02 | % | | | 10.14 | % | |
| Ratios/Supplemental Data | |
| Net assets, end of year (000's omitted) | | $ | 38,044 | | | $ | 52,730 | | | $ | 37,200 | | | $ | 23,618 | | | $ | 3,355 | | |
| Ratios (As a percentage of average daily net assets): | |
| Expenses before custodian fee reduction(4) | | | 0.84 | % | | | 0.80 | % | | | 0.80 | % | | | 0.82 | % | | | 0.87 | % | |
| Expenses after custodian fee reduction(4) | | | 0.84 | % | | | 0.80 | % | | | 0.80 | % | | | 0.82 | % | | | 0.87 | % | |
| Net investment income | | | 6.88 | % | | | 6.42 | % | | | 4.88 | % | | | 3.85 | % | | | 4.59 | % | |
| Portfolio Turnover of the Floating-Rate Portfolio | | | 61 | % | | | 50 | % | | | 57 | % | | | 67 | % | | | 64 | % | |
| Portfolio Turnover of the High Income Portfolio | | | 81 | % | | | 62 | % | | | 62 | % | | | 80 | % | | | 118 | % | |
(1) Net investment income per share was computed using average shares outstanding.
(2) Amount represents less than $0.0005 per share.
(3) Returns are historical and are calculated by determining the percentage change in net asset value with all distributions reinvested.
(4) Includes the Fund's share of the Portfolios' allocated expenses.
See notes to financial statements
11
Eaton Vance Floating-Rate & High Income Fund as of October 31, 2007
NOTES TO FINANCIAL STATEMENTS
1 Significant Accounting Policies
Eaton Vance Floating-Rate & High Income Fund (the Fund) is a diversified series of Eaton Vance Mutual Funds Trust (the Trust). The Trust is a Massachusetts business trust registered under the Investment Company Act of 1940, as amended (the 1940 Act), as an open-end management investment company. The Fund offers five classes of shares. The Advisers Class and Class I shares are generally sold at net asset value per share. Class A shares are generally sold subject to a sales charge imposed at time of purchase. Class B and Class C shares are sold at net asset value and are generally subject to a contingent deferred sales charge (see Note 5). Class B shares automatically convert to Class A shares eight years after their purchase as described in the Fund's prospectus. Each class represents a pro-rata interest in the Fund, but votes separately on class-specific matters and (as noted below) is subject to different expenses. Realized and unrealized gains and losses are allocated daily to each class of shares based on the relative net assets of each class to the total net assets of the Fund. Net investment income, other than class-specific expenses, is allocated daily to each class of shares based upon the ratio of the value of each class's paid shares to the total value of all paid shares. Each class of shares differs in its distribution plan and certain other class-specific expenses. The Fund invests all of its investable assets in interests in two Portfolios, Floating Rate Portfolio and High Income Portfolio (the Portfolios), both are New York trusts having the same investment objectives and policies as the Fund. The value of the Fund's investment in the Portfolios reflects the Fund's proportionate interest in the net assets of the Floating Rate Portfolio and the High Income Portfolio (17.8% and 15.6% at October 31, 2007, respectively). The performance of the Fund is directly affected by the performance of the Portfolios. The financia l statements of the Floating Rate Portfolio (Portfolio), including the portfolio of investments, are included elsewhere in this report and should be read in conjunction with the Fund's financial statements. A copy of the financial statements of High Income Portfolio is available on the EDGAR Database on The Securities and Exchange Commission's website (www.sec.gov), at the Commission's public reference room in Washington, D.C. or upon request from the Fund's principal underwriter, Eaton Vance Distributors, Inc. (EVD), by calling 1-800-225-6265.
The following is a summary of significant accounting policies of the Fund. The policies are in conformity with accounting principles generally accepted in the United States of America.
A Investment Valuation — Valuation of securities by the Floating Rate Portfolio is discussed in Note 1A of the Portfolio's Notes to Financial Statements, which are included elsewhere in this report. High Income Portfolio's valuation policies are as follows: Securities listed on a U.S. securities exchange generally are valued at the last sale price on the day of valuation or, if no sales took place on such date, at the mean between the closing bid and asked prices therefore on the exchange where such securities are principally traded. Equity securities listed on the NASDAQ Global or Global Select Market generally are valued at the NASDAQ official closing price. Unlisted or listed securities for which c losing sales prices or closing quotations are not available are valued at the mean between the latest available bid and asked prices or, in the case of preferred equity securities that are not listed or traded in the over-the-counter market, by an independent pricing service. Fixed income investments (other than short-term debt securities), including listed investments and investments for which price quotations are available, will normally be valued on the basis of market valuations furnished by a pricing service. Financial futures contracts listed on commodity exchanges are valued at closing settlement prices. Short-term debt securities with a remaining maturity of sixty days or less are valued at amortized cost, which approximates market value. If short-term debt securities are acquired with a remaining maturity of more than sixty days, they will be valued by a pricing service. The Portfolio also invests in interests in senior floating rate loans (Senior Loans). The Portfolio's investment adviser Boston Re search and Management (BMR), a subsidiary of Eaton Vance Management (EVM), has characterized certain Senior Loans as liquid based on a predetermined acceptable number and range of market quotations available. Such loans are valued on the basis of market valuations furnished by a pricing service. Investments for which there are no quotations or valuations are valued at fair value using methods determined in good faith by or at the direction of the Trustees. Other Senior Loans are valued at fair value by BMR under procedures established by the Trustees as permitted by section 2(a)(41) of the 1940 Act.
B Income — The Fund's net investment income or loss consists of the Fund's pro-rata share of the net investment income or loss of the Portfolios, less all actual and accrued expenses of the Fund.
C Federal Taxes — The Fund's policy is to comply with the provisions of the Internal Revenue Code applicable to regulated investment companies and to distribute to shareholders each year substantially all of its net investment income, and all or substantially all of its net realized capital gains. Accordingly, no provision for federal
12
Eaton Vance Floating-Rate & High Income Fund as of October 31, 2007
NOTES TO FINANCIAL STATEMENTS CONT'D
income or excise tax is necessary. At October 31, 2007, the Fund, for Federal income tax purposes, had a capital loss carryforward of $31,916,089 which will reduce the Fund's taxable income arising from future net realized gains on investment transactions, if any, to the extent permitted by the Internal Revenue Code, and thus will reduce the amount of the distributions to shareholders which would otherwise be necessary to relieve the Fund of any liability for federal income or excise tax. Such capital loss carryfoward will expire on October 31, 2009 ($4,933,389), October 31, 2010 ($16,168,986), October 31, 2011 ($2,993,864), October 31, 2012 ($2,290,023), October 31, 2013 ($2,252,412) and October 31, 2015 ($3,277,415).
D Expenses — The majority of expenses of the Trust are directly identifiable to an individual fund. Expenses which are not readily identifiable to a specific fund are allocated taking into consideration, among other things, the nature and type of expense and the relative size of the funds.
E Expense Reduction — State Street Bank and Trust Company (SSBT) serves as custodian of the Fund. Pursuant to the custodian agreement, SSBT receives a fee reduced by credits, which are determined based on the average daily cash balance the Fund maintains with SSBT. All credit balances, if any, used to reduce the Fund's custodian fees are reported as a reduction of expenses in the Statement of Operations.
F Use of Estimates — The preparation of the financial statements in conformity with accounting principles generally accepted in the United States of America requires management to make estimates and assumptions that affect the reported amounts of assets and liabilities at the date of the financial statements and the reported amounts of income and expense during the reporting period. Actual results could differ from those estimates.
G Indemnifications — Under the Trust's organizational documents, its officers and Trustees may be indemnified against certain liabilities and expenses arising out of the performance of their duties to the Fund, and shareholders are indemnified against personal liability for obligations of the Trust. Additionally, in the normal course of business, the Fund enters into agreements with service providers that may contain indemnification clauses. The Fund's maximum exposure under these arrangements is unknown as this would involve future claims that may be made against the Fund that have not yet occurred.
H Redemption Fees — Upon the redemption or exchange of shares held by Advisers Class, Class A and Class I shareholders within 90 days of the settlement of purchase, a fee of 1% of the current net asset value of these shares will be assessed and received by the Fund for the benefit of the remaining shareholders. The redemption fee is accounted for as an addition to paid-in capital.
I Other — Investment transactions are accounted for on a trade date basis. Dividends to shareholders are recorded on the ex-dividend date.
2 Distributions to Shareholders
The Fund declares dividends daily to shareholders of record at the time of declaration. Distributions are generally paid monthly. Distributions of realized capital gains, if any, are made at least annually. Distributions are declared separately for each class of shares. Shareholders may reinvest income and capital gain distributions in additional shares of the same class of the Fund at the net asset value as of the ex-dividend date or, at the election of the shareholder, receive distributions in cash. The Fund distinguishes between distributions on a tax basis and a financial reporting basis. Accounting principles generally accepted in the United States of America require that only distributions in excess of tax basis earnings and profits be reported in the financial statements as a return of capital. Permanent differences between book and tax accounting relating to distributions are reclassified to paid-in capital.
The tax character of distributions declared for the years ended October 31, 2007 and October 31, 2006 was as follows:
| | | Year Ended October 31, | |
| | | 2007 | | 2006 | |
| Distributions declared from: | |
| Ordinary income | | $ | 116,162,128 | | | $ | 114,690,594 | | |
During the year ended October 31, 2007, accumulated paid-in capital was decreased by $6,744,149, accumulated distributions in excess of net investment income was increased by $874,813, and accumulated net realized loss was decreased by $7,618,962 primarily due to differences between book and tax accounting treatment of foreign currency gains and losses, swap contracts, mixed straddles and premium amortization. These reclassifications had no effect on the net assets or net asset value per share of the Fund.
13
Eaton Vance Floating-Rate & High Income Fund as of October 31, 2007
NOTES TO FINANCIAL STATEMENTS CONT'D
As of October 31, 2007, the components of distributable earnings (accumulated losses) and unrealized appreciation (depreciation) on a tax basis were as follows:
| Undistributed ordinary income | | $ | 1,034,893 | | |
| Capital loss carryforwards | | $ | (31,916,089 | ) | |
| Unrealized appreciation (depreciation) | | $ | (22,952,117 | ) | |
| Other temporary differences | | $ | 1,998,955 | | |
The differences between the components of distributable earnings (accumulated loss) on a tax basis and the amounts reflected in the Statement of Assets and Liabilities are primarily due to differences in book and tax policies for wash sales, partnership allocations, premium amortization, and the timing of recognizing distributions to shareholders.
3 Transactions with Affiliates
The Fund is authorized to pay EVM, a fee as compensation for administrative services necessary to conduct the Fund's business. The fee is computed at the rate of 0.15% per annum of the Fund's average daily net assets. For the year ended October 31, 2007, the fee amounted to $2,681,145. The Portfolios have engaged BMR to render investment advisory services. (See Note 2 of the Portfolios' Notes to Financial Statements). EVM serves as the sub-transfer agent of the Fund and receives from the transfer agent an aggregate fee based upon the actual expenses incurred by EVM in the performance of those services. For the year ended October 31, 2007, EVM received $59,019 in sub-transfer agent fees. The Fund was informed that Eaton Vance Distributors, Inc. (EVD) the Fund's principal underwriter and a subsidiary of EVM, received $23,131 as its portion of the sales charge on sales of Class A shares for the year ended October 31, 2007. EVD also received distribution and service fees from Advisers Class, Class A, Class B, Class C and Class I shares (see Note 4) and contingent deferred sales charges (see Note 5).
Except for Trustees of the Fund and the Portfolios who are not members of EVM's or BMR's organization, officers and Trustees receive remuneration for their services to the Fund out of the investment advisory fee. Certain officers and Trustees of the Fund and of the Portfolios are officers of the above organizations.
4 Distribution Plans
The Fund has in effect distribution plans for the Advisers Class shares (Advisers Plan) and Class A shares (Class A Plan) pursuant to Rule 12b-1under the 1940 Act. The Advisers Plan and the Class A Plan provide that the Fund will pay EVD a distribution and service fee of 0.25% per annum of the Fund's average daily net assets attributable to Advisers Class shares and Class A shares for distribution services and facilities provided to the Fund by EVD, as well as for personal services and/or the maintenance of shareholder accounts. Distribution and service fees paid or accrued to EVD for the year ended October 31, 2007 amounted to $1,932,725 and $1,051,565 for Advisers shares and Class A shares, respectively. The Fund also has in effect distribution plans for Class B shares (Class B Plan) and Class C shares (Class C Plan) pursuant to Rule 12b-1 under the 1940 A ct. The Class B and Class C Plans require the Fund to pay EVD an amount equal to 0.75% per annum of the Fund's average daily net assets attributable to Class B and Class C shares for providing ongoing distribution services and facilities to the Fund. The Fund will automatically discontinue payments to EVD during any period in which there are no outstanding Uncovered Distribution Charges, which are equivalent to the sum of (i) 6.25% of the aggregate amount received by the Fund for the Class B and Class C shares sold, respectively, plus (ii) interest calculated by applying the rate of 1% over the prevailing prime rate to the outstanding balance of Uncovered Distribution Charges of EVD of each respective class, reduced by the aggregate amount of contingent deferred sales charges (see Note 5) and amounts theretofore paid or payable to EVD by each respective class. For the year ended October 31, 2007, the Fund paid or accrued to EVD $888,047 and $3,198,374 for Class B and Class C shares, respectively, representin g 0.75% of the average daily net assets for Class B and Class C shares. At October 31, 2007, the amounts of Uncovered Distribution Charges of EVD calculated under the Plans was approximately $7,231,000 and $57,739,000 for Class B and Class C shares, respectively. The Class B and Class C Plans also authorize the Fund to make payments of service fees to EVD, investment dealers, and other persons in amounts not exceeding 0.25% per annum of the average daily net assets attributable to that Class. Service fees are paid for personal services and/or the maintenance of shareholder accounts. They are separate and distinct from the Class B and Class C sales commissions and distribution fees payable to EVD and, as such, are not subject to automatic discontinuance when there are no outstanding Uncovered Distribution Charges to EVD. Service fees paid or accrued for the year ended October 31, 2007, amounted to $296,016, and $1,066,125, for Class B and Class C shares, respectively.
5 Contingent Deferred Sales Charge
A contingent deferred sales charge (CDSC) generally is imposed on redemptions of Class B shares made within six years of purchase and on redemptions of Class C shares made within one year of purchase. Class A shares may be subject to a 1% CDSC if redeemed within eighteen months of purchase (depending on the circumstances of purchase).
14
Eaton Vance Floating-Rate & High Income Fund as of October 31, 2007
NOTES TO FINANCIAL STATEMENTS CONT'D
Generally, the CDSC is based upon the lower of the net asset value at date of redemption or date of purchase. No charge is levied on shares acquired by reinvestment of dividends or capital gain distributions. The Class B CDSC is imposed at declining rates that begin at 5% in the case of redemptions in the first and second year after purchase, declining one percentage point each subsequent year. Class C shares are subject to a 1% CDSC if redeemed within one year of purchase. No CDSC is levied on shares which have been sold to EVM or its affiliates or to their respective employees or clients and may be waived under certain other limited conditions. CDSCs received on Class B and Class C redemptions are paid to EVD to reduce the amount of Uncovered Distribution Charges calculated under the Fund's Class B and Class C Plans. CDSCs received on Class B and Class C redemptions when no Uncovered Distribution Charges exist will be credited to the Fund. For the year ended October 31, 2007, the Fund was informed that EVD received approximately $33,000, $240,000 and $84,000 of CDSCs paid by Class A, Class B shares and Class C shareholders, respectively.
6 Investment Transactions
For the year ended October 31, 2007, increases and decreases in the Fund's investment in the Portfolios were as follows:
| Portfolio | | Contributions | | Withdrawals | |
| Floating Rate Portfolio | | $ | 106,903,481 | | | $ | 613,322,912 | | |
| High Income Portfolio | | | 6,901,917 | | | | 132,066,889 | | |
7 Shares of Beneficial Interest
The Fund's Declaration of Trust permits the Trustees to issue an unlimited number of full and fractional shares of beneficial interest (without par value). Such shares may be issued in a number of different series (such as the Fund) and classes. Transactions in Fund shares were as follows:
| | | Year Ended October 31, | |
| Advisers | | 2007 | | 2006 | |
| Sales | | | 25,043,537 | | | | 43,826,477 | | |
Issued to shareholders electing to
receive payments of distributions
in Fund shares | | | 3,732,446 | | | | 3,614,358 | | |
| Redemptions | | | (66,005,435 | ) | | | (33,879,133 | ) | |
| Net increase (decrease) | | | (37,229,452 | ) | | | 13,561,702 | | |
| | | Year Ended October 31, | |
| Class A | | 2007 | | 2006 | |
| Sales | | | 19,612,371 | | | | 15,347,691 | | |
Issued to shareholders electing to
receive payments of distributions
in Fund shares | | | 2,154,666 | | | | 2,070,077 | | |
| Redemptions | | | (27,776,573 | ) | | | (22,872,887 | ) | |
| Exchange from Class B shares | | | 846,108 | | | | 465,766 | | |
| Net decrease | | | (5,163,428 | ) | | | (4,989,353 | ) | |
| | | Year Ended October 31, | |
| Class B | | 2007 | | 2006 | |
| Sales | | | 696,021 | | | | 810,096 | | |
Issued to shareholders electing to
receive payments of distributions
in Fund shares | | | 474,554 | | | | 546,656 | | |
| Redemptions | | | (3,571,307 | ) | | | (3,922,996 | ) | |
| Exchange to Class A shares | | | (898,341 | ) | | | (494,760 | ) | |
| Net decrease | | | (3,299,073 | ) | | | (3,061,004 | ) | |
| | | Year Ended October 31, | |
| Class C | | 2007 | | 2006 | |
| Sales | | | 7,563,793 | | | | 9,042,842 | | |
Issued to shareholders electing to
receive payments of distributions
in Fund shares | | | 1,837,128 | | | | 1,872,062 | | |
| Redemptions | | | (14,914,690 | ) | | | (19,183,297 | ) | |
| Net decrease | | | (5,513,769 | ) | | | (8,268,393 | ) | |
| | | Year Ended October 31, | |
| Class I | | 2007 | | 2006 | |
| Sales | | | 3,613,919 | | | | 2,909,649 | | |
Issued to shareholders electing to
receive payments of distributions
in Fund shares | | | 274,759 | | | | 269,587 | | |
| Redemptions | | | (5,307,693 | ) | | | (1,577,675 | ) | |
| Net increase (decrease) | | | (1,419,015 | ) | | | 1,601,561 | | |
Redemptions or exchanges of Advisers Class, Class A and Class I shares made within 90 days of purchase are subject to a redemption fee equal to 1.00% of the amount redeemed. For the year ended October 31, 2007 the Fund received $138,956 in redemption fees.
15
Eaton Vance Floating-Rate & High Income Fund as of October 31, 2007
NOTES TO FINANCIAL STATEMENTS CONT'D
8 Recently Issued Accounting Pronouncements
In June 2006, the Financial Accounting Standards Board (FASB) issued FASB Interpretation No. 48 (FIN 48), "Accounting for Uncertainty in Income Taxes – an interpretation of FASB Statement No. 109". FIN 48 clarifies the accounting for uncertainty in income taxes recognized in accordance with FASB Statement No. 109, "Accounting for Income Taxes". This interpretation prescribes a recognition threshold and measurement attribute for the financial statement recognition and measurement of a tax position taken or expected to be taken in a tax return. It also provides guidance on de-recognition, classification, interest and penalties, accounting in interim periods, disclosure and transition. FIN 48 is effective on the last business day of the first required financial reporting period for fiscal years beginning after December 15, 2006. Management is currently evaluating the impact of applying the various provisions of FIN 48.
In September 2006, the FASB issued Statement of Financial Accounting Standards No. 157 (FAS 157), "Fair Value Measurements". FAS 157 defines fair value, establishes a framework for measuring fair value in accordance with generally accepted accounting principles and expands disclosure about fair value measurements. FAS 157 is effective for fiscal years beginning after November 15, 2007. Management is currently evaluating the impact the adoption of FAS 157 will have on the Fund's financial statement disclosures.
16
Eaton Vance Floating-Rate & High Income Fund as of October 31, 2007
REPORT OF INDEPENDENT REGISTERED PUBLIC ACCOUNTING FIRM
To the Trustees and Shareholders of Eaton Vance Floating-Rate & High Income Fund:
We have audited the accompanying statement of assets and liabilities of Eaton Vance Floating-Rate & High Income Fund (the Fund) as of October 31, 2007, and the related statement of operations for the year then ended, the statements of changes in net assets for each of the two years in the period then ended and the financial highlights for each of the five years in the period then ended. These financial statements and financial highlights are the responsibility of the Fund's management. Our responsibility is to express an opinion on these financial statements and financial highlights based on our audits.
We conducted our audits in accordance with the standards of the Public Company Accounting Oversight Board (United States). Those standards require that we plan and perform the audit to obtain reasonable assurance about whether the financial statements and financial highlights are free of material misstatement. The Fund is not required to have, nor were we engaged to perform, an audit of its internal control over financial reporting. Our audits included consideration of internal control over financial reporting as a basis for designing audit procedures that are appropriate in the circumstances, but not for the purpose of expressing an opinion on the effectiveness of the Fund's internal control over financial reporting. Accordingly, we express no such opinion. An audit also includes examining, on a test basis, evidence supporting the amounts and disclosures in the financial statements, assessing the accounting principles used and significant estimates made by management, as well as evaluating the overall financial statement presentation. We believe that our audits provide a reasonable basis for our opinion.
In our opinion, the financial statements and financial highlights referred to above present fairly, in all material respects, the financial position of the Eaton Vance Floating-Rate & High Income Fund as of October 31, 2007, the results of its operations for the year then ended, the changes in its net assets for each of the two years in the period then ended and the financial highlights for each of the five years then ended, in conformity with accounting principles generally accepted in the United States of America.
DELOITTE & TOUCHE LLP
Boston, Massachusetts
December 20, 2007
17
Eaton Vance Floating-Rate & High Income Fund as of October 31, 2007
FEDERAL TAX INFORMATION (Unaudited)
The Form 1099-DIV you receive in January 2007 will show the tax status of all distributions paid to your account in calendar 2006. Shareholders are advised to consult their own tax adviser with respect to the tax consequences of their investment in the Fund.
18
Floating Rate Portfolio as of October 31, 2007
PORTFOLIO OF INVESTMENTS
| Senior Floating-Rate Interests — 100.5%(1) | | | |
Principal
Amount* | |
Borrower/Tranche Description | |
Value | |
| Aerospace and Defense — 1.9% | | | |
| AWAS Capital, Inc. | | | |
| $ | 14,886,848 | | | Term Loan, 7.00%, Maturing March 22, 2013 | | $ | 14,179,722 | | |
| CACI International, Inc. | | | |
| | 8,082,151 | | | Term Loan, 6.79%, Maturing May 3, 2011 | | | 7,991,227 | | |
| DAE Aviation Holdings, Inc. | | | |
| | 669,056 | | | Term Loan, 7.80%, Maturing July 31, 2009 | | | 668,638 | | |
| | 757,467 | | | Term Loan, 8.93%, Maturing July 31, 2014 | | | 757,941 | | |
| | 573,477 | | | Term Loan, 8.93%, Maturing July 31, 2014 | | | 573,835 | | |
| Evergreen International Aviation | | | |
| | 7,951,619 | | | Term Loan, 8.30%, Maturing October 31, 2011 | | | 7,752,828 | | |
| Forgings International Holding | | | |
| | 1,448,068 | | | Term Loan, 7.97%, Maturing August 11, 2014 | | | 1,431,777 | | |
| GBP | 643,892 | | | Term Loan, 9.14%, Maturing August 11, 2014 | | | 1,320,312 | | |
| | 1,634,051 | | | Term Loan, 8.22%, Maturing August 11, 2015 | | | 1,623,838 | | |
| GBP | 695,408 | | | Term Loan, 9.39%, Maturing August 11, 2015 | | | 1,433,169 | | |
| Hawker Beechcraft Acquisition | | | |
| | 1,448,094 | | | Term Loan, 7.20%, Maturing March 26, 2014 | | | 1,419,245 | | |
| | 17,028,263 | | | Term Loan, 7.17%, Maturing March 26, 2014 | | | 16,689,026 | | |
| Hexcel Corp. | | | |
| | 6,706,579 | | | Term Loan, 7.03%, Maturing March 1, 2012 | | | 6,572,448 | | |
| IAP Worldwide Services, Inc. | | | |
| | 7,323,864 | | | Term Loan, 11.50%, Maturing December 30, 2012 | | | 6,657,393 | | |
| Jet Aviation Holding, AG | | | |
| | 4,106,776 | | | Term Loan, 5.77%, Maturing May 15, 2013 | | | 3,901,437 | | |
| PGS Solutions, Inc. | | | |
| | 1,990,000 | | | Term Loan, 7.62%, Maturing February 14, 2013 | | | 1,937,763 | | |
| Spirit AeroSystems, Inc. | | | |
| | 7,024,219 | | | Term Loan, 6.90%, Maturing December 31, 2011 | | | 6,971,537 | | |
| TransDigm, Inc. | | | |
| | 17,650,000 | | | Term Loan, 7.20%, Maturing June 23, 2013 | | | 17,401,806 | | |
| Vought Aircraft Industries, Inc. | | | |
| | 10,000,000 | | | Revolving Loan, 0.00%, Maturing February 22, 2010(2) | | | 9,400,000 | | |
| | 8,958,453 | | | Term Loan, 7.34%, Maturing February 22, 2011 | | | 8,880,067 | | |
| | 4,000,000 | | | Term Loan, 7.62%, Maturing February 22, 2010 | | | 3,964,168 | | |
| Wyle Laboratories, Inc. | | | |
| | 3,951,569 | | | Term Loan, 8.11%, Maturing January 28, 2011 | | | 3,892,296 | | |
| | 995,000 | | | Term Loan, 8.13%, Maturing January 28, 2011 | | | 980,075 | | |
| | | | | | | $ | 126,400,548 | | |
Principal
Amount* | |
Borrower/Tranche Description | |
Value | |
| Air Transport — 0.6% | | | |
| Airport Development and Investment, Ltd. | | | |
| GBP | 8,874,630 | | | Term Loan, 10.28%, Maturing April 7, 2011 | | $ | 17,958,504 | | |
| Delta Air Lines, Inc. | | | |
| | 8,600,000 | | | Term loan, 6.87%, Maturing April 30, 2012 | | | 8,419,400 | | |
| Northwest Airlines, Inc. | | | |
| | 17,820,000 | | | DIP Loan, 7.03%, Maturing August 21, 2008 | | | 17,188,869 | | |
| | | | | | | $ | 43,566,773 | | |
| Automotive — 3.8% | | | |
| Accuride Corp. | | | |
| $ | 11,954,274 | | | Term Loan, 7.13%, Maturing January 31, 2012 | | $ | 11,730,131 | | |
| Adesa, Inc. | | | |
| | 31,421,250 | | | Term Loan, 7.45%, Maturing October 18, 2013 | | | 30,453,350 | | |
| Affina Group, Inc. | | | |
| | 5,135,471 | | | Term Loan, 7.96%, Maturing November 30, 2011 | | | 5,132,261 | | |
| Allison Transmission, Inc. | | | |
| | 10,000,000 | | | Term Loan, 8.17%, Maturing September 30, 2014 | | | 9,770,830 | | |
| CSA Acquisition Corp. | | | |
| | 2,766,402 | | | Term Loan, 7.75%, Maturing December 23, 2011 | | | 2,732,397 | | |
| | 5,032,969 | | | Term Loan, 7.75%, Maturing December 23, 2011 | | | 4,971,104 | | |
| | 3,684,375 | | | Term Loan, 7.75%, Maturing December 23, 2012 | | | 3,665,953 | | |
| Dana Corp. | | | |
| | 13,750,000 | | | Term Loan, 7.98%, Maturing March 30, 2008 | | | 13,691,067 | | |
| Dayco Products, LLC | | | |
| | 10,233,316 | | | Term Loan, 7.76%, Maturing June 21, 2011 | | | 9,916,728 | | |
| Federal-Mogul Corp. | | | |
| | 4,982,950 | | | Revolving Loan, 6.28%, Maturing December 31, 2007(2) | | | 4,916,926 | | |
| | 16,350,000 | | | DIP Loan, 6.65%, Maturing December 31, 2007 | | | 16,289,096 | | |
| | 4,108,827 | | | Term Loan, 7.00%, Maturing December 31, 2007 | | | 4,051,476 | | |
| | 3,000,000 | | | Term Loan, 7.59%, Maturing December 31, 2007 | | | 2,956,875 | | |
| Financiere Truck (Investissement) | | | |
| EUR | 4,841,388 | | | Term Loan, 6.16%, Maturing February 15, 2012 | | | 6,872,949 | | |
| Ford Motor Co. | | | |
| | 10,000,000 | | | Revolving Loan, 0.00%, Maturing December 15, 2013(2) | | | 9,155,360 | | |
| | 9,106,063 | | | Term Loan, 8.70%, Maturing December 15, 2013 | | | 8,783,207 | | |
| Fraikin, Ltd. | | | |
| GBP | 1,612,016 | | | Term Loan, 8.03%, Maturing February 15, 2012(2) | | | 3,281,746 | | |
| GBP | 1,392,962 | | | Term Loan, 8.03%, Maturing February 15, 2012(2) | | | 2,835,796 | | |
| General Motors Corp. | | | |
| | 16,537,562 | | | Term Loan, 7.62%, Maturing November 29, 2013 | | | 16,256,424 | | |
| Goodyear Tire & Rubber Co. | | | |
| | 20,275,000 | | | Term Loan, 6.43%, Maturing April 30, 2010 | | | 19,746,998 | | |
See notes to financial statements
19
Floating Rate Portfolio as of October 31, 2007
PORTFOLIO OF INVESTMENTS CONT'D
Principal
Amount* | |
Borrower/Tranche Description | |
Value | |
| Automotive (continued) | | | |
| HLI Operating Co., Inc. | | | |
| EUR | 7,374,545 | | | Term Loan, 6.87%, Maturing May 30, 2014 | | $ | 10,335,714 | | |
| EUR | 425,455 | | | Term Loan, 7.16%, Maturing May 30, 2014 | | | 603,216 | | |
| Keystone Automotive Operations, Inc. | | | |
| | 7,195,625 | | | Term Loan, 8.65%, Maturing January 12, 2012 | | | 6,733,903 | | |
| LKQ Corp. | | | |
| | 7,275,000 | | | Term Loan, 7.36%, Maturing October 12, 2013 | | | 7,256,812 | | |
| Locafroid Services S.A.S. | | | |
| EUR | 1,666,405 | | | Term Loan, 6.48%, Maturing February 15, 2012(2) | | | 2,365,668 | | |
| Speedy 1, Ltd. | | | |
| EUR | 6,457,254 | | | Term Loan, 6.98%, Maturing August 31, 2013 | | | 8,968,352 | | |
| Tenneco Automotive, Inc. | | | |
| | 6,550,000 | | | Term Loan, 6.62%, Maturing March 17, 2014 | | | 6,451,750 | | |
| TriMas Corp. | | | |
| | 1,893,750 | | | Term Loan, 6.79%, Maturing August 2, 2011 | | | 1,862,977 | | |
| | 8,124,188 | | | Term Loan, 7.23%, Maturing August 2, 2013 | | | 7,992,169 | | |
| TRW Automotive, Inc. | | | |
| | 11,745,563 | | | Term Loan, 6.78%, Maturing February 2, 2014 | | | 11,646,465 | | |
| United Components, Inc. | | | |
| | 9,954,545 | | | Term Loan, 7.38%, Maturing June 30, 2012 | | | 9,767,898 | | |
| | | | | | | $ | 261,195,598 | | |
| Beverage and Tobacco — 0.6% | | | |
| Constellation Brands, Inc. | | | |
| $ | 10,620,000 | | | Term Loan, 6.69%, Maturing June 5, 2013 | | $ | 10,485,041 | | |
| Culligan International Co. | | | |
| | 18,453,750 | | | Term Loan, 7.28%, Maturing November 24, 2014 | | | 17,300,391 | | |
| Southern Wine & Spirits of America, Inc. | | | |
| | 11,509,636 | | | Term Loan, 6.70%, Maturing May 31, 2012 | | | 11,488,055 | | |
| Van Houtte, Inc. | | | |
| | 2,633,400 | | | Term Loan, 7.70%, Maturing July 11, 2014 | | | 2,577,440 | | |
| | 359,100 | | | Term Loan, 7.70%, Maturing July 11, 2014 | | | 351,469 | | |
| | | | | | | $ | 42,202,396 | | |
| Brokers, Dealers and Investment Houses — 0.2% | | | |
| AmeriTrade Holding Corp. | | | |
| $ | 16,578,057 | | | Term Loan, 6.25%, Maturing December 31, 2012 | | $ | 16,410,552 | | |
| | | | | | | $ | 16,410,552 | | |
| Building and Development — 5.1% | | | |
| 401 North Wabash Venture, LLC | | | |
| $ | 9,498,461 | | | Term Loan, 8.53%, Maturing May 7, 2008(2) | | $ | 9,071,030 | | |
| AIMCO Properties, L.P. | | | |
| | 19,718,750 | | | Term Loan, 6.39%, Maturing March 23, 2011 | | | 19,435,293 | | |
Principal
Amount* | |
Borrower/Tranche Description | |
Value | |
| Building and Development (continued) | | | |
| Beacon Sales Acquisition, Inc. | | | |
| $ | 5,519,250 | | | Term Loan, 7.16%, Maturing September 30, 2013 | | $ | 5,298,480 | | |
| Brickman Group Holdings, Inc. | | | |
| | 4,977,494 | | | Term Loan, 7.14%, Maturing January 23, 2014 | | | 4,840,613 | | |
| Building Materials Corp. of America | | | |
| | 11,761,347 | | | Term Loan, 7.94%, Maturing February 22, 2014 | | | 10,740,627 | | |
| Capital Automotive REIT | | | |
| | 10,788,753 | | | Term Loan, 6.88%, Maturing December 15, 2010 | | | 10,675,957 | | |
| Contech Construction Products | | | |
| | 5,898,333 | | | Term Loan, 7.03%, Maturing January 13, 2013 | | | 5,780,367 | | |
| Epco/Fantome, LLC | | | |
| | 10,320,000 | | | Term Loan, 7.59%, Maturing November 23, 2010 | | | 10,345,800 | | |
| Financiere Daunou S.A. | | | |
| EUR | 1,067,260 | | | Term Loan, 6.43%, Maturing May 31, 2015 | | | 1,418,604 | | |
| EUR | 2,613,290 | | | Term Loan, 6.43%, Maturing May 31, 2015 | | | 3,473,590 | | |
| | 1,664,521 | | | Term Loan, 7.50%, Maturing May 31, 2015 | | | 1,521,650 | | |
| EUR | 1,246,799 | | | Term Loan, 6.68%, Maturing February 28, 2016 | | | 1,664,978 | | |
| EUR | 2,423,776 | | | Term Loan, 6.68%, Maturing February 28, 2016 | | | 3,236,716 | | |
| | 2,452,266 | | | Term Loan, 7.75%, Maturing February 28, 2016 | | | 2,254,042 | | |
| General Growth Properties, Inc. | | | |
| | 10,782,895 | | | Term Loan, 6.38%, Maturing February 24, 2011 | | | 10,636,700 | | |
| Hearthstone Housing Partners II, LLC | | | |
| | 21,176,471 | | | Revolving Loan, 6.79%, Maturing December 1, 2007(2) | | | 20,647,059 | | |
| Hovstone Holdings, LLC | | | |
| | 6,358,254 | | | Term Loan, 7.63%, Maturing February 28, 2009 | | | 5,786,012 | | |
| LNR Property Corp. | | | |
| | 22,175,000 | | | Term Loan, 8.11%, Maturing July 12, 2011 | | | 21,676,062 | | |
| Mueller Water Products, Inc. | | | |
| | 8,946,117 | | | Term Loan, 6.69%, Maturing May 24, 2014 | | | 8,821,712 | | |
| NCI Building Systems, Inc. | | | |
| | 6,417,430 | | | Term Loan, 6.88%, Maturing June 18, 2010 | | | 6,297,103 | | |
| Nortek, Inc. | | | |
| | 20,893,788 | | | Term Loan, 7.05%, Maturing August 27, 2011 | | | 20,475,912 | | |
| November 2005 Land Investors | | | |
| | 793,294 | | | Term Loan, 7.57%, Maturing May 9, 2011 | | | 713,965 | | |
| Panolam Industries Holdings, Inc. | | | |
| | 4,194,448 | | | Term Loan, 7.95%, Maturing September 30, 2012 | | | 4,026,670 | | |
| PLY GEM Industries, Inc. | | | |
| | 15,466,451 | | | Term Loan, 7.95%, Maturing August 15, 2011 | | | 14,561,664 | | |
| | 577,895 | | | Term Loan, 7.95%, Maturing August 15, 2011 | | | 544,088 | | |
| Re/Max International, Inc. | | | |
| | 966,667 | | | Term Loan, Maturing January 23, 2008(3) | | | 957,000 | | |
| | 1,033,333 | | | Term Loan, Maturing January 23, 2008(3) | | | 1,023,000 | | |
| Realogy Corp. | | | |
| | 6,224,502 | | | Term Loan, Maturing September 1, 2014(3) | | | 5,801,236 | | |
| | 23,061,778 | | | Term Loan, Maturing September 1, 2014(3) | | | 21,493,577 | | |
See notes to financial statements
20
Floating Rate Portfolio as of October 31, 2007
PORTFOLIO OF INVESTMENTS CONT'D
Principal
Amount* | |
Borrower/Tranche Description | |
Value | |
| Building and Development (continued) | | | |
| Shea Capital I, LLC | | | |
| $ | 1,608,750 | | | Term Loan, 7.20%, Maturing October 27, 2011 | | $ | 1,379,503 | | |
| South Edge, LLC | | | |
| | 8,794,643 | | | Term Loan, 6.81%, Maturing October 31, 2009 | | | 7,915,179 | | |
| Standard Pacific Corp. | | | |
| | 4,680,000 | | | Term Loan, 7.27%, Maturing May 5, 2013 | | | 3,954,600 | | |
| Stile Acquisition Corp. | | | |
| | 6,433,878 | | | Term Loan, 7.12%, Maturing April 6, 2013 | | | 6,060,835 | | |
| Stile U.S. Acquisition Corp. | | | |
| | 6,441,517 | | | Term Loan, 7.12%, Maturing April 6, 2013 | | | 6,068,031 | | |
| Tousa/Kolter, LLC | | | |
| | 7,908,533 | | | Term Loan, 8.46%, Maturing January 7, 2008 | | | 7,888,762 | | |
| TRU 2005 RE Holding Co. | | | |
| | 32,825,000 | | | Term Loan, 8.13%, Maturing December 9, 2008 | | | 32,524,093 | | |
| United Subcontractors, Inc. | | | |
| | 5,925,000 | | | Term Loan, 12.36%, Maturing June 27, 2013 | | | 4,917,750 | | |
| WCI Communities, Inc. | | | |
| | 23,296,875 | | | Term Loan, 8.62%, Maturing December 23, 2010 | | | 22,399,945 | | |
| Wintergames Acquisition ULC | | | |
| | 22,303,561 | | | Term Loan, 8.13%, Maturing April 24, 2008 | | | 22,136,285 | | |
| | | | | | | $ | 348,464,490 | | |
| Business Equipment and Services — 6.3% | | | |
| ACCO Brands Corp. | | | |
| $ | 6,689,748 | | | Term Loan, 7.18%, Maturing August 17, 2012 | | $ | 6,597,764 | | |
| Activant Solutions, Inc. | | | |
| | 6,375,933 | | | Term Loan, 7.38%, Maturing May 1, 2013 | | | 6,108,941 | | |
| Acxiom Corp. | | | |
| | 11,693,182 | | | Term Loan, 6.80%, Maturing September 15, 2012 | | | 11,590,867 | | |
| Affiliated Computer Services | | | |
| | 5,993,250 | | | Term Loan, 6.82%, Maturing March 20, 2013 | | | 5,929,572 | | |
| | 16,935,625 | | | Term Loan, 6.96%, Maturing March 20, 2013 | | | 16,755,684 | | |
| Affinion Group, Inc. | | | |
| | 14,642,732 | | | Term Loan, 7.98%, Maturing October 17, 2012 | | | 14,539,018 | | |
| Allied Security Holdings, LLC | | | |
| | 9,877,273 | | | Term Loan, 8.20%, Maturing June 30, 2010 | | | 9,840,233 | | |
| Buhrmann US, Inc. | | | |
| EUR | 979,747 | | | Term Loan, 5.91%, Maturing December 23, 2010 | | | 1,389,100 | | |
| | 10,668,135 | | | Term Loan, 7.30%, Maturing December 31, 2010 | | | 10,561,454 | | |
| Cellnet Group, Inc. | | | |
| | 1,999,413 | | | Term Loan, 7.20%, Maturing July 22, 2011 | | | 1,945,055 | | |
| DynCorp International, LLC | | | |
| | 7,118,824 | | | Term Loan, 7.25%, Maturing February 11, 2011 | | | 6,887,462 | | |
| Education Management, LLC | | | |
| | 14,548,092 | | | Term Loan, 7.00%, Maturing June 1, 2013 | | | 14,148,019 | | |
Principal
Amount* | |
Borrower/Tranche Description | |
Value | |
| Business Equipment and Services (continued) | | | |
| Info USA, Inc. | | | |
| $ | 1,985,000 | | | Term Loan, 7.20%, Maturing February 14, 2012 | | $ | 1,955,225 | | |
| | 4,372,459 | | | Term Loan, 7.20%, Maturing February 14, 2012 | | | 4,306,872 | | |
| Information Resources, Inc. | | | |
| | 6,483,170 | | | Term Loan, 7.16%, Maturing May 7, 2014 | | | 6,296,779 | | |
| Intergraph Corp. | | | |
| | 3,349,524 | | | Term Loan, 7.45%, Maturing May 29, 2014 | | | 3,286,720 | | |
| iPayment, Inc. | | | |
| | 12,897,014 | | | Term Loan, 7.04%, Maturing May 10, 2013 | | | 12,316,649 | | |
| Iron Mountain, Inc. | | | |
| | 14,955,000 | | | Term Loan, 7.06%, Maturing April 16, 2014 | | | 14,940,987 | | |
| ista International GmbH | | | |
| EUR | 9,635,715 | | | Term Loan, 6.34%, Maturing May 14, 2015 | | | 13,268,345 | | |
| EUR | 1,914,285 | | | Term Loan, 6.34%, Maturing May 14, 2015 | | | 2,635,963 | | |
| Kronos, Inc. | | | |
| | 9,950,063 | | | Term Loan, 7.45%, Maturing June 11, 2014 | | | 9,645,342 | | |
| Language Line, Inc. | | | |
| | 10,360,194 | | | Term Loan, 8.42%, Maturing June 10, 2011 | | | 10,122,769 | | |
| N.E.W. Holdings I, LLC | | | |
| | 10,531,466 | | | Term Loan, 7.77%, Maturing May 22, 2014 | | | 9,975,278 | | |
| Protection One, Inc. | | | |
| | 10,317,762 | | | Term Loan, 7.39%, Maturing March 31, 2012 | | | 10,124,304 | | |
| Quantum Corp. | | | |
| | 3,728,750 | | | Term Loan, 8.70%, Maturing July 12, 2014 | | | 3,700,784 | | |
| Quintiles Transnational Corp. | | | |
| | 16,252,546 | | | Term Loan, 7.20%, Maturing March 31, 2013 | | | 15,973,213 | | |
| Sabre, Inc. | | | |
| | 29,769,734 | | | Term Loan, 6.96%, Maturing September 30, 2014 | | | 28,342,662 | | |
| Safente, Inc. | | | |
| | 3,990,000 | | | Term Loan, 7.75%, Maturing April 12, 2014 | | | 3,810,450 | | |
| Serena Software, Inc. | | | |
| | 3,795,000 | | | Term Loan, 7.18%, Maturing March 10, 2013 | | | 3,674,824 | | |
| Sitel (Client Logic) | | | |
| EUR | 1,946,407 | | | Term Loan, Maturing January 29, 2014(3) | | | 2,618,846 | | |
| | 5,201,404 | | | Term Loan, 7.30%, Maturing January 29, 2014 | | | 4,954,337 | | |
| Solera Holdings, LLC | | | |
| EUR | 3,208,875 | | | Term Loan, 6.75%, Maturing May 15, 2014 | | | 4,526,379 | | |
| Solera Nederland Holdings | | | |
| | 3,980,000 | | | Term Loan, 7.69%, Maturing May 15, 2014 | | | 3,920,300 | | |
| SunGard Data Systems, Inc. | | | |
| | 75,918,770 | | | Term Loan, 7.36%, Maturing February 11, 2013 | | | 75,056,029 | | |
| TDS Investor Corp. | | | |
| EUR | 2,105,820 | | | Term Loan, 6.98%, Maturing August 23, 2013 | | | 2,989,471 | | |
| | 12,871,734 | | | Term Loan, 7.45%, Maturing August 23, 2013 | | | 12,638,434 | | |
| | 10,972,500 | | | Term Loan, 7.45%, Maturing August 23, 2013 | | | 10,771,912 | | |
| | 2,582,721 | | | Term Loan, 7.45%, Maturing August 23, 2013 | | | 2,535,909 | | |
See notes to financial statements
21
Floating Rate Portfolio as of October 31, 2007
PORTFOLIO OF INVESTMENTS CONT'D
Principal
Amount* | |
Borrower/Tranche Description | |
Value | |
| Business Equipment and Services (continued) | | | |
| Transaction Network Services, Inc. | | | |
| $ | 5,648,739 | | | Term Loan, 7.48%, Maturing May 4, 2012 | | $ | 5,564,007 | | |
| Valassis Communications, Inc. | | | |
| | 1,302,069 | | | Term Loan, 0.00%, Maturing March 2, 2014(2) | | | 1,241,034 | | |
| | 5,735,857 | | | Term Loan, 6.95%, Maturing March 2, 2014 | | | 5,466,989 | | |
| VWR International, Inc. | | | |
| | 12,850,000 | | | Term Loan, 7.70%, Maturing June 29, 2014 | | | 12,436,397 | | |
| WAM Acquisition, S.A. | | | |
| EUR | 1,414,189 | | | Term Loan, Maturing May 4, 2014(3) | | | 1,993,783 | | |
| EUR | 885,811 | | | Term Loan, Maturing May 4, 2014(3) | | | 1,248,853 | | |
| EUR | 1,414,189 | | | Term Loan, Maturing May 4, 2015(3) | | | 2,003,082 | | |
| EUR | 885,811 | | | Term Loan, Maturing May 4, 2015(3) | | | 1,254,678 | | |
| West Corp. | | | |
| | 19,493,233 | | | Term Loan, 7.27%, Maturing October 24, 2013 | | | 19,148,047 | | |
| | 2,481,250 | | | Term Loan, 5.44%, Maturing October 24, 2013 | | | 2,437,312 | | |
| | | | | | | $ | 433,476,134 | | |
| Cable and Satellite Television — 7.1% | | | |
| Atlantic Broadband Finance, LLC | | | |
| $ | 13,978,491 | | | Term Loan, 7.45%, Maturing September 1, 2011 | | $ | 13,809,589 | | |
| Bragg Communications, Inc. | | | |
| | 2,125,000 | | | Term Loan, 8.06%, Maturing August 13, 2014 | | | 2,128,984 | | |
| Bresnan Broadband Holdings, LLC | | | |
| | 3,500,000 | | | Term Loan, 7.18%, Maturing March 29, 2014 | | | 3,420,000 | | |
| | 18,551,500 | | | Term Loan, 7.42%, Maturing March 29, 2014 | | | 18,127,468 | | |
| Cequel Communications, LLC | | | |
| | 37,347,250 | | | Term Loan, 7.27%, Maturing November 5, 2013 | | | 36,245,506 | | |
| Charter Communications Operating, Inc. | | | |
| | 77,463,117 | | | Term Loan, 6.99%, Maturing April 28, 2013 | | | 74,571,186 | | |
| CSC Holdings, Inc. | | | |
| | 3,331,731 | | | Term Loan, 6.38%, Maturing March 29, 2012 | | | 3,248,437 | | |
| | 24,116,452 | | | Term Loan, 6.88%, Maturing March 29, 2013 | | | 23,595,947 | | |
| DirecTV Holdings, LLC | | | |
| | 7,421,087 | | | Term Loan, 6.25%, Maturing April 13, 2013 | | | 7,386,045 | | |
| Insight Midwest Holdings, LLC | | | |
| | 45,950,000 | | | Term Loan, 7.00%, Maturing April 6, 2014 | | | 45,066,106 | | |
| Kabel BW GmbH & Co. KG | | | |
| EUR | 1,666,667 | | | Term Loan, 6.41%, Maturing June 9, 2012 | | | 2,306,763 | | |
| Kabel Deutschland GmbH | | | |
| EUR | 15,600,000 | | | Term Loan, 6.48%, Maturing March 31, 2012 | | | 21,993,783 | | |
| MCC Iowa, LLC | | | |
| | 1,603,250 | | | Term Loan, 6.72%, Maturing March 31, 2010 | | | 1,540,723 | | |
| Mediacom Broadband Group | | | |
| | 14,356,391 | | | Term Loan, 6.61%, Maturing January 31, 2015 | | | 13,943,645 | | |
| | 7,940,000 | | | Term Loan, 6.61%, Maturing January 31, 2015 | | | 7,711,725 | | |
Principal
Amount* | |
Borrower/Tranche Description | |
Value | |
| Cable and Satellite Television (continued) | | | |
| Mediacom Illinois, LLC | | | |
| $ | 2,000,000 | | | Term Loan, 6.69%, Maturing September 30, 2012 | | $ | 1,927,858 | | |
| | 18,474,767 | | | Term Loan, 6.61%, Maturing January 31, 2015 | | | 17,969,593 | | |
| NTL Investment Holdings, Ltd. | | | |
| | 9,000,000 | | | Term Loan, 7.22%, Maturing March 30, 2012 | | | 8,755,317 | | |
| GBP | 2,000,000 | | | Term Loan, 7.96%, Maturing March 30, 2012 | | | 4,009,472 | | |
| GBP | 4,095,825 | | | Term Loan, 8.28%, Maturing March 30, 2012 | | | 8,260,568 | | |
| GBP | 3,504,175 | | | Term Loan, 8.28%, Maturing March 30, 2012 | | | 7,067,313 | | |
| GBP | 4,408,427 | | | Term Loan, 8.29%, Maturing March 30, 2012 | | | 8,891,032 | | |
| GBP | 2,241,573 | | | Term Loan, 8.29%, Maturing March 30, 2012 | | | 4,520,864 | | |
| GBP | 3,500,000 | | | Term Loan, 8.90%, Maturing March 30, 2013 | | | 7,098,045 | | |
| Orion Cable GmbH | | | |
| EUR | 5,000,000 | | | Term Loan, Maturing October 31, 2014(3) | | | 7,140,312 | | |
| EUR | 5,000,000 | | | Term Loan, Maturing October 31, 2015(3) | | | 7,176,480 | | |
| ProSiebenSat.1 Media AG | | | |
| EUR | 2,998,397 | | | Term Loan, 6.19%, Maturing March 2, 2015(2) | | | 4,080,366 | | |
| EUR | 600,197 | | | Term Loan, 6.55%, Maturing June 26, 2015 | | | 835,704 | | |
| EUR | 12,586,345 | | | Term Loan, 6.55%, Maturing June 26, 2015 | | | 17,525,025 | | |
| EUR | 2,998,397 | | | Term Loan, 6.40%, Maturing March 2, 2016(2) | | | 4,093,380 | | |
| UPC Broadband Holding B.V. | | | |
| EUR | 27,500,000 | | | Term Loan, 6.30%, Maturing December 31, 2014 | | | 38,594,324 | | |
| EUR | 6,617,448 | | | Term Loan, 6.76%, Maturing December 31, 2014 | | | 9,285,382 | | |
| | 14,925,000 | | | Term Loan, 7.13%, Maturing December 31, 2014 | | | 14,465,594 | | |
| YPSO Holding SA | | | |
| EUR | 14,884,112 | | | Term Loan, 6.68%, Maturing July 28, 2014 | | | 20,919,882 | | |
| EUR | 5,744,037 | | | Term Loan, 6.68%, Maturing July 28, 2014 | | | 8,073,345 | | |
| EUR | 9,371,851 | | | Term Loan, 6.68%, Maturing July 28, 2014 | | | 13,172,302 | | |
| | | | | | | $ | 488,958,065 | | |
| Chemicals and Plastics — 6.5% | | | |
| Arizona Chemical, Inc. | | | |
| EUR | 3,030,763 | | | Term Loan, 6.98%, Maturing February 28, 2013 | | $ | 4,242,252 | | |
| Brenntag Holding GmbH and Co. KG | | | |
| EUR | 3,511,248 | | | Term Loan, 6.37%, Maturing January 20, 2014 | | | 4,968,776 | | |
| EUR | 845,455 | | | Term Loan, 6.66%, Maturing December 23, 2013 | | | 1,196,405 | | |
| EUR | 654,545 | | | Term Loan, 6.66%, Maturing December 23, 2013 | | | 926,249 | | |
| | 1,963,636 | | | Term Loan, 7.39%, Maturing January 20, 2014 | | | 1,924,772 | | |
| | 8,036,364 | | | Term Loan, 7.39%, Maturing January 20, 2014 | | | 7,877,308 | | |
| EUR | 525,062 | | | Term Loan, 6.62%, Maturing January 19, 2015 | | | 746,530 | | |
| EUR | 963,689 | | | Term Loan, 6.62%, Maturing January 19, 2015 | | | 1,370,167 | | |
| EUR | 770,053 | | | Term Loan, 8.75%, Maturing June 23, 2015 | | | 1,077,171 | | |
| EUR | 229,947 | | | Term Loan, 8.75%, Maturing June 23, 2015 | | | 321,551 | | |
| Celanese Holdings, LLC | | | |
| EUR | 995,000 | | | Term Loan, 6.54%, Maturing April 6, 2011 | | | 1,408,927 | | |
| | 7,000,000 | | | Term Loan, 6.87%, Maturing April 2, 2013 | | | 6,889,169 | | |
| | 27,412,250 | | | Term Loan, 6.98%, Maturing April 2, 2014 | | | 26,978,232 | | |
See notes to financial statements
22
Floating Rate Portfolio as of October 31, 2007
PORTFOLIO OF INVESTMENTS CONT'D
Principal
Amount* | |
Borrower/Tranche Description | |
Value | |
| Chemicals and Plastics (continued) | | | |
| Cognis GmbH | | | |
| EUR | 6,426,230 | | | Term Loan, 6.73%, Maturing September 15, 2013 | | $ | 8,983,369 | | |
| EUR | 1,573,770 | | | Term Loan, 6.73%, Maturing September 15, 2013 | | | 2,200,009 | | |
| Columbian Chemicals Acquisition | | | |
| | 4,653,000 | | | Term Loan, 6.95%, Maturing March 16, 2013 | | | 4,501,777 | | |
| Ferro Corp. | | | |
| | 16,104,000 | | | Term Loan, 7.06%, Maturing June 6, 2012 | | | 15,842,310 | | |
| First Chemical Holding | | | |
| EUR | 1,330,000 | | | Term Loan, 6.75%, Maturing September 19, 2014(2) | | | 1,881,819 | | |
| EUR | 1,330,000 | | | Term Loan, 7.24%, Maturing September 19, 2015(2) | | | 1,890,372 | | |
| Foamex L.P. | | | |
| | 4,391,074 | | | Term Loan, 7.44%, Maturing February 12, 2013 | | | 4,233,728 | | |
| Georgia Gulf Corp. | | | |
| | 8,295,898 | | | Term Loan, 7.63%, Maturing October 3, 2013 | | | 8,206,891 | | |
| Hexion Specialty Chemicals, Inc. | | | |
| EUR | 1,127,628 | | | Term Loan, 6.70%, Maturing May 5, 2012 | | | 1,619,161 | | |
| | 9,800,000 | | | Term Loan, 5.40%, Maturing May 5, 2013 | | | 9,718,846 | | |
| | 27,031,720 | | | Term Loan, 7.50%, Maturing May 5, 2013 | | | 26,807,871 | | |
| | 5,872,059 | | | Term Loan, 7.50%, Maturing May 5, 2013 | | | 5,823,433 | | |
| | 3,473,684 | | | Term Loan, 7.63%, Maturing May 5, 2013 | | | 3,444,919 | | |
| Huish Detergents, Inc. | | | |
| | 3,985,000 | | | Term Loan, 7.20%, Maturing April 19, 2014 | | | 3,804,607 | | |
| Huntsman International, LLC | | | |
| | 8,375,000 | | | Term Loan, 6.64%, Maturing August 16, 2012 | | | 8,318,728 | | |
| INEOS Group | | | |
| EUR | 70,008 | | | Term Loan, 7.24%, Maturing December 16, 2013 | | | 100,154 | | |
| EUR | 71,087 | | | Term Loan, 7.74%, Maturing December 16, 2014 | | | 102,207 | | |
| | 5,831,475 | | | Term Loan, 7.36%, Maturing December 16, 2012 | | | 5,715,755 | | |
| EUR | 2,000,000 | | | Term Loan, 8.49%, Maturing December 16, 2015 | | | 2,854,117 | | |
| | 7,959,750 | | | Term Loan, 7.36%, Maturing December 16, 2013 | | | 7,901,477 | | |
| | 7,959,750 | | | Term Loan, 7.86%, Maturing December 16, 2014 | | | 7,901,477 | | |
| Innophos, Inc. | | | |
| | 8,394,786 | | | Term Loan, 7.01%, Maturing August 13, 2010(2) | | | 8,331,825 | | |
| Invista B.V. | | | |
| | 3,733,500 | | | Term Loan, 6.70%, Maturing April 30, 2010 | | | 3,621,495 | | |
| | 12,199,027 | | | Term Loan, 6.70%, Maturing April 29, 2011 | | | 12,016,042 | | |
| | 7,366,191 | | | Term Loan, 6.70%, Maturing April 29, 2011 | | | 7,255,698 | | |
| ISP Chemco, Inc. | | | |
| | 25,735,500 | | | Term Loan, 7.09%, Maturing June 4, 2014 | | | 25,195,054 | | |
| Kleopatra | | | |
| EUR | 5,100,000 | | | Term Loan, 7.28%, Maturing January 3, 2016 | | | 6,800,451 | | |
| | 8,876,250 | | | Term Loan, 7.74%, Maturing January 3, 2016 | | | 8,033,006 | | |
| Kranton Polymers, LLC | | | |
| | 10,193,267 | | | Term Loan, 7.25%, Maturing May 13, 2013 | | | 9,963,918 | | |
| Lucite International Group Holdings | | | |
| | 1,708,695 | | | Term Loan, 7.45%, Maturing July 7, 2013 | | | 1,678,792 | | |
| | 4,825,935 | | | Term Loan, 7.45%, Maturing July 7, 2013 | | | 4,741,481 | | |
Principal
Amount* | |
Borrower/Tranche Description | |
Value | |
| Chemicals and Plastics (continued) | | | |
| Lyondell Chemical Co. | | | |
| $ | 28,372,950 | | | Term Loan, 6.25%, Maturing August 16, 2013 | | $ | 28,270,495 | | |
| MacDermid, Inc. | | | |
| | 4,228,750 | | | Term Loan, 7.20%, Maturing April 12, 2014 | | | 4,126,554 | | |
| Millenium Inorganic Chemicals | | | |
| | 11,450,000 | | | Term Loan, 7.45%, Maturing April 30, 2014 | | | 11,130,350 | | |
| Momentive Performance Material | | | |
| | 5,000,000 | | | Term Loan, 5.17%, Maturing December 4, 2013 | | | 4,913,395 | | |
| | 4,682,075 | | | Term Loan, 7.81%, Maturing December 4, 2013 | | | 4,600,977 | | |
| Nalco Co. | | | |
| | 18,905,907 | | | Term Loan, 6.97%, Maturing November 4, 2010 | | | 18,831,474 | | |
| Professional Paint, Inc. | | | |
| | 5,554,688 | | | Term Loan, 7.64%, Maturing May 31, 2012 | | | 5,276,953 | | |
| Propex Fabrics, Inc. | | | |
| | 5,812,901 | | | Term Loan, 10.58%, Maturing July 31, 2012 | | | 5,202,547 | | |
| Rockwood Specialties Group, Inc. | | | |
| EUR | 2,521,898 | | | Term Loan, 6.35%, Maturing July 30, 2011 | | | 3,580,145 | | |
| | 27,246,572 | | | Term Loan, 6.46%, Maturing December 10, 2012 | | | 26,853,213 | | |
| Sigmakalon (BC) Holdco B.V. | | | |
| EUR | 190,335 | | | Term Loan, 6.66%, Maturing September 9, 2013 | | | 273,990 | | |
| EUR | 3,114,528 | | | Term Loan, 6.66%, Maturing September 9, 2013 | | | 4,483,414 | | |
| EUR | 5,695,137 | | | Term Loan, 6.66%, Maturing September 9, 2013 | | | 8,198,243 | | |
| EUR | 5,825,801 | | | Term Loan, 7.41%, Maturing September 9, 2014 | | | 8,386,335 | | |
| Solo Cup Co. | | | |
| | 7,209,021 | | | Term Loan, 8.66%, Maturing February 27, 2011 | | | 7,205,157 | | |
| Solutia, Inc. | | | |
| | 5,245,516 | | | DIP Loan, 8.06%, Maturing March 31, 2008 | | | 5,240,601 | | |
| TPG Spring UK, Ltd. | | | |
| EUR | 3,896,011 | | | Term Loan, 7.48%, Maturing June 27, 2013 | | | 5,515,019 | | |
| EUR | 3,896,011 | | | Term Loan, 7.98%, Maturing June 27, 2013 | | | 5,543,201 | | |
| Wellman, Inc. | | | |
| | 5,250,000 | | | Term Loan, 9.36%, Maturing February 10, 2009 | | | 5,133,187 | | |
| | | | | | | $ | 442,183,548 | | |
| Clothing / Textiles — 0.4% | | | |
| Hanesbrands, Inc. | | | |
| $ | 13,960,000 | | | Term Loan, 6.74%, Maturing September 5, 2013 | | $ | 13,805,575 | | |
| | 5,000,000 | | | Term Loan, 8.82%, Maturing March 5, 2014 | | | 5,034,375 | | |
| St. John Knits International, Inc. | | | |
| | 3,754,872 | | | Term Loan, 8.20%, Maturing March 23, 2012 | | | 3,698,549 | | |
| The William Carter Co. | | | |
| | 2,348,539 | | | Term Loan, 6.40%, Maturing July 14, 2012 | | | 2,313,800 | | |
| Warnaco, Inc. | | | |
| | 3,836,681 | | | Term Loan, 6.74%, Maturing January 31, 2013 | | | 3,798,314 | | |
| | | | | | | $ | 28,650,613 | | |
See notes to financial statements
23
Floating Rate Portfolio as of October 31, 2007
PORTFOLIO OF INVESTMENTS CONT'D
Principal
Amount* | |
Borrower/Tranche Description | |
Value | |
| Conglomerates — 2.4% | | | |
| American Greetings Corp. | | | |
| $ | 5,497,738 | | | Term Loan, 0.00%, Maturing April 4, 2013(2) | | $ | 5,446,196 | | |
| Amsted Industries, Inc. | | | |
| | 12,710,678 | | | Term Loan, 7.28%, Maturing October 15, 2010 | | | 12,512,074 | | |
| | 12,437,054 | | | Term Loan, 7.27%, Maturing April 5, 2013 | | | 12,172,766 | | |
| Blount, Inc. | | | |
| | 5,057,907 | | | Term Loan, 6.88%, Maturing August 9, 2010 | | | 4,963,071 | | |
| Doncasters (Dunde HoldCo 4 Ltd.) | | | |
| EUR | 849,214 | | | Term Loan, 6.79%, Maturing July 13, 2015 | | | 1,197,148 | | |
| EUR | 849,214 | | | Term Loan, 7.29%, Maturing July 13, 2015 | | | 1,200,220 | | |
| | 3,931,314 | | | Term Loan, 7.61%, Maturing July 13, 2015 | | | 3,823,302 | | |
| | 3,931,314 | | | Term Loan, 8.11%, Maturing July 13, 2015 | | | 3,833,130 | | |
| GBP | 1,737,276 | | | Term Loan, 8.60%, Maturing July 13, 2015 | | | 3,517,264 | | |
| GBP | 1,737,276 | | | Term Loan, 9.10%, Maturing July 13, 2015 | | | 3,523,280 | | |
| GenTek, Inc. | | | |
| | 3,796,052 | | | Term Loan, 7.34%, Maturing February 25, 2011 | | | 3,724,876 | | |
| Goodman Global Holdings, Inc. | | | |
| | 4,611,058 | | | Term Loan, 7.19%, Maturing December 23, 2011 | | | 4,495,781 | | |
| ISS Holdings A/S | | | |
| GBP | 3,068,562 | | | Term Loan, 8.56%, Maturing December 31, 2013 | | | 6,246,989 | | |
| Jarden Corp. | | | |
| | 16,179,959 | | | Term Loan, 6.95%, Maturing January 24, 2012 | | | 15,886,697 | | |
| | 6,586,750 | | | Term Loan, 6.95%, Maturing January 24, 2012 | | | 6,467,365 | | |
| Johnson Diversey, Inc. | | | |
| | 2,487,500 | | | Term Loan, 7.36%, Maturing December 16, 2010 | | | 2,461,070 | | |
| | 12,855,976 | | | Term Loan, 7.36%, Maturing December 16, 2011 | | | 12,719,381 | | |
| Polymer Group, Inc. | | | |
| | 3,000,000 | | | Revolving Loan, 0.00%, Maturing November 22, 2010(2) | | | 2,850,000 | | |
| | 20,689,513 | | | Term Loan, 7.29%, Maturing November 22, 2012 | | | 20,534,342 | | |
| RBS Global, Inc. | | | |
| | 10,185,246 | | | Term Loan, 7.60%, Maturing July 19, 2013 | | | 10,140,685 | | |
| | 2,271,250 | | | Term Loan, 7.64%, Maturing July 19, 2013 | | | 2,261,313 | | |
| RGIS Holdings, LLC | | | |
| | 909,625 | | | Term Loan, 7.25%, Maturing April 30, 2014 | | | 875,514 | | |
| | 18,192,500 | | | Term Loan, 7.25%, Maturing April 30, 2014 | | | 17,510,281 | | |
| US Investigations Services, Inc. | | | |
| | 4,000,000 | | | Term Loan, Maturing February 21, 2015(3) | | | 3,890,000 | | |
| | | | | | | $ | 162,252,745 | | |
| Containers and Glass Products — 3.1% | | | |
| Berry Plastics Corp. | | | |
| $ | 22,787,906 | | | Term Loan, 7.36%, Maturing April 3, 2015 | | $ | 22,175,481 | | |
| Bluegrass Container Co. | | | |
| | 3,075,913 | | | Term Loan, 7.29%, Maturing June 30, 2013 | | | 3,061,905 | | |
| | 10,280,025 | | | Term Loan, 7.32%, Maturing June 30, 2013 | | | 10,233,209 | | |
Principal
Amount* | |
Borrower/Tranche Description | |
Value | |
| Containers and Glass Products (continued) | | | |
| Consolidated Container Co. | | | |
| $ | 9,950,000 | | | Term Loan, 7.23%, Maturing March 28, 2014 | | $ | 9,340,562 | | |
| Crown Americas, Inc. | | | |
| EUR | 4,455,000 | | | Term Loan, 6.25%, Maturing November 15, 2012 | | | 6,251,913 | | |
| | 9,850,500 | | | Term Loan, 7.31%, Maturing November 15, 2012 | | | 9,735,574 | | |
| | 1,435,500 | | | Term Loan, 7.31%, Maturing November 15, 2012 | | | 1,418,752 | | |
| Graham Packaging Holdings Co. | | | |
| | 33,601,138 | | | Term Loan, 7.66%, Maturing October 7, 2011 | | | 33,018,359 | | |
| Graphic Packaging International, Inc. | | | |
| | 41,259,725 | | | Term Loan, 7.39%, Maturing May 16, 2014 | | | 41,064,484 | | |
| IPG (US), Inc. | | | |
| | 6,848,146 | | | Term Loan, 9.59%, Maturing July 28, 2011 | | | 6,796,784 | | |
| JSG Acquisitions | | | |
| EUR | 6,750,000 | | | Term Loan, Maturing December 31, 2014(3) | | | 9,553,162 | | |
| EUR | 6,750,000 | | | Term Loan, Maturing December 31, 2014(3) | | | 9,596,501 | | |
| OI European Group B.V. | | | |
| EUR | 12,064,500 | | | Term Loan, 5.76%, Maturing June 14, 2013 | | | 16,908,868 | | |
| Owens-Brockway Glass Container | | | |
| | 7,139,069 | | | Term Loan, 6.59%, Maturing June 14, 2013 | | | 7,025,293 | | |
| Pregis Corp. | | | |
| | 2,646,000 | | | Term Loan, 7.45%, Maturing October 12, 2011 | | | 2,579,850 | | |
| Smurfit-Stone Container Corp. | | | |
| | 3,225,483 | | | Term Loan, 7.12%, Maturing November 1, 2010 | | | 3,199,779 | | |
| | 4,076,272 | | | Term Loan, 7.19%, Maturing November 1, 2011 | | | 4,043,789 | | |
| | 5,285,887 | | | Term Loan, 7.43%, Maturing November 1, 2011 | | | 5,243,764 | | |
| | 9,340,983 | | | Term Loan, 7.52%, Maturing November 1, 2011 | | | 9,266,544 | | |
| | | | | | | $ | 210,514,573 | | |
| Cosmetics / Toiletries — 0.3% | | | |
| American Safety Razor Co. | | | |
| $ | 3,456,250 | | | Term Loan, 7.51%, Maturing July 31, 2013 | | $ | 3,421,687 | | |
| Bausch & Lomb, Inc. | | | |
| | 835,000 | | | Term Loan, Maturing April 30, 2015(3) | | | 837,349 | | |
| | 3,340,000 | | | Term Loan, Maturing April 30, 2015(3) | | | 3,349,395 | | |
| Prestige Brands, Inc. | | | |
| | 12,275,229 | | | Term Loan, 7.73%, Maturing April 7, 2011 | | | 12,213,853 | | |
| | | | | | | $ | 19,822,284 | | |
| Drugs — 0.9% | | | |
| Chattem, Inc. | | | |
| $ | 1,608,058 | | | Term Loan, 6.97%, Maturing January 2, 2013 | | $ | 1,604,037 | | |
| Graceway Pharmaceuticals, LLC | | | |
| | 14,577,917 | | | Term Loan, 7.95%, Maturing May 3, 2012 | | | 13,983,867 | | |
| Pharmaceutical Holdings Corp. | | | |
| | 5,265,000 | | | Term Loan, 8.07%, Maturing January 30, 2012 | | | 5,133,375 | | |
See notes to financial statements
24
Floating Rate Portfolio as of October 31, 2007
PORTFOLIO OF INVESTMENTS CONT'D
Principal
Amount* | |
Borrower/Tranche Description | |
Value | |
| Drugs (continued) | | | |
| Stiefel Laboratories, Inc. | | | |
| $ | 5,412,744 | | | Term Loan, 7.50%, Maturing December 28, 2013 | | $ | 5,311,255 | | |
| | 7,076,662 | | | Term Loan, 7.50%, Maturing December 28, 2013 | | | 6,943,974 | | |
| Warner Chilcott Corp. | | | |
| | 6,927,784 | | | Term Loan, 7.20%, Maturing January 18, 2012 | | | 6,834,259 | | |
| | 23,156,216 | | | Term Loan, 7.24%, Maturing January 18, 2012 | | | 22,843,607 | | |
| | | | | | | $ | 62,654,374 | | |
| Ecological Services and Equipment — 1.3% | | | |
| Allied Waste Industries, Inc. | | | |
| $ | 9,269,894 | | | Term Loan, 6.49%, Maturing January 15, 2012 | | $ | 9,116,366 | | |
| | 3,572,392 | | | Term Loan, 7.00%, Maturing January 15, 2012 | | | 3,513,226 | | |
| Big Dumpster Merger Sub, Inc. | | | |
| | 688,822 | | | Term Loan, 7.45%, Maturing February 5, 2013 | | | 654,381 | | |
| Blue Waste B.V. (AVR Acquisition) | | | |
| EUR | 3,500,000 | | | Term Loan, 7.23%, Maturing March 31, 2014 | | | 4,986,617 | | |
| EUR | 3,500,000 | | | Term Loan, 6.98%, Maturing March 31, 2015 | | | 4,961,446 | | |
| EUR | 2,000,000 | | | Term Loan, 6.98%, Maturing April 1, 2015 | | | 2,843,466 | | |
| Casella Waste Systems, Inc. | | | |
| | 4,974,286 | | | Term Loan, 7.33%, Maturing April 28, 2010 | | | 4,896,562 | | |
| Duratek, Inc. | | | |
| | 448,998 | | | Term Loan, Maturing June 7, 2013(3) | | | 442,825 | | |
| EnergySolutions, LLC | | | |
| | 55,853 | | | Term Loan, Maturing June 7, 2013(3) | | | 55,085 | | |
| | 936,192 | | | Term Loan, Maturing June 7, 2013(3) | | | 923,319 | | |
| Environmental Systems Products Holdings, Inc. | | | |
| | 466,049 | | | Term Loan, 13.75%, Maturing December 12, 2010(4) | | | 466,049 | | |
| IESI Corp. | | | |
| | 9,267,647 | | | Term Loan, 7.17%, Maturing January 20, 2012 | | | 9,018,579 | | |
| Kemble Water Structure Ltd. | | | |
| GBP | 17,750,000 | | | Term Loan, 10.05%, Maturing October 13, 2013 | | | 36,250,731 | | |
| Sensus Metering Systems, Inc. | | | |
| | 3,000,000 | | | Revolving Loan, 7.54%, Maturing December 17, 2009(2) | | | 2,865,000 | | |
| | 8,661,047 | | | Term Loan, 7.26%, Maturing December 17, 2010 | | | 8,531,131 | | |
| | 562,717 | | | Term Loan, 7.36%, Maturing December 17, 2010 | | | 554,276 | | |
| Wastequip, Inc. | | | |
| | 311,178 | | | Term Loan, 7.04%, Maturing February 5, 2013(2) | | | 295,619 | | |
| | | | | | | $ | 90,374,678 | | |
| Electronics / Electrical — 2.8% | | | |
| AMI Semiconductor, Inc. | | | |
| $ | 7,773,318 | | | Term Loan, 6.82%, Maturing April 1, 2012 | | $ | 7,520,685 | | |
| Aspect Software, Inc. | | | |
| | 10,989,000 | | | Term Loan, 8.25%, Maturing July 11, 2011 | | | 10,659,330 | | |
Principal
Amount* | |
Borrower/Tranche Description | |
Value | |
| Electronics / Electrical (continued) | | | |
| Baldor Electric Co. | | | |
| $ | 3,440,398 | | | Term Loan, 6.96%, Maturing January 31, 2014 | | $ | 3,405,994 | | |
| EnerSys Capital, Inc. | | | |
| | 10,201,263 | | | Term Loan, 7.07%, Maturing March 17, 2011 | | | 10,022,741 | | |
| Fairchild Semiconductor Corp. | | | |
| | 16,367,813 | | | Term Loan, 6.70%, Maturing June 26, 2013 | | | 16,081,376 | | |
| FCI International S.A.S. | | | |
| EUR | 750,000 | | | Term Loan, 6.70%, Maturing November 1, 2013 | | | 1,051,380 | | |
| | 1,000,000 | | | Term Loan, 7.73%, Maturing November 1, 2013 | | | 965,750 | | |
| | 764,245 | | | Term Loan, 7.76%, Maturing November 1, 2013 | | | 741,317 | | |
| | 735,755 | | | Term Loan, 7.76%, Maturing November 1, 2013 | | | 713,683 | | |
| | 735,755 | | | Term Loan, 7.76%, Maturing November 1, 2013 | | | 710,556 | | |
| | 764,245 | | | Term Loan, 7.76%, Maturing November 1, 2013 | | | 738,069 | | |
| EUR | 750,000 | | | Term Loan, 6.70%, Maturing October 31, 2014 | | | 1,051,380 | | |
| Freescale Semiconductor, Inc. | | | |
| | 46,806,593 | | | Term Loan, 7.33%, Maturing December 1, 2013 | | | 45,031,079 | | |
| Infor Enterprise Solutions Holdings | | | |
| EUR | 2,977,500 | | | Term Loan, 7.18%, Maturing July 28, 2012 | | | 4,167,698 | | |
| | 21,698,188 | | | Term Loan, 8.95%, Maturing July 28, 2012 | | | 21,155,733 | | |
| | 11,320,794 | | | Term Loan, 8.95%, Maturing July 28, 2012 | | | 11,037,774 | | |
| Invensys International Holding | | | |
| EUR | 1,001,757 | | | Term Loan, 6.43%, Maturing December 15, 2010 | | | 1,431,780 | | |
| | 2,166,667 | | | Term Loan, 7.36%, Maturing December 15, 2010 | | | 2,126,945 | | |
| | 2,333,333 | | | Term Loan, 7.24%, Maturing January 15, 2011 | | | 2,286,667 | | |
| Network Solutions, LLC | | | |
| | 6,240,619 | | | Term Loan, 7.61%, Maturing March 7, 2014 | | | 5,928,588 | | |
| Open Solutions, Inc. | | | |
| | 12,340,175 | | | Term Loan, 7.28%, Maturing January 23, 2014 | | | 11,838,856 | | |
| Sensata Technologies Finance Co. | | | |
| | 12,835,361 | | | Term Loan, 6.76%, Maturing April 26, 2013 | | | 12,520,201 | | |
| SS&C Technologies, Inc. | | | |
| | 4,761,290 | | | Term Loan, 7.20%, Maturing November 23, 2012 | | | 4,689,871 | | |
| Vertafore, Inc. | | | |
| | 14,004,713 | | | Term Loan, 8.01%, Maturing January 31, 2012 | | | 13,812,148 | | |
| | | | | | | $ | 189,689,601 | | |
| Equipment Leasing — 0.5% | | | |
| Maxim Crane Works, L.P. | | | |
| $ | 8,478,750 | | | Term Loan, 6.81%, Maturing June 29, 2014 | | $ | 8,054,812 | | |
| The Hertz Corp. | | | |
| | 2,875,000 | | | Term Loan, 6.99%, Maturing December 21, 2012 | | | 2,835,598 | | |
| | 10,992,052 | | | Term Loan, 6.87%, Maturing December 21, 2012(2) | | | 10,841,406 | | |
| United Rentals, Inc. | | | |
| | 3,352,101 | | | Term Loan, 7.57%, Maturing February 14, 2011 | | | 3,342,045 | | |
| | 7,894,455 | | | Term Loan, 7.13%, Maturing February 14, 2011 | | | 7,870,772 | | |
| | | | | | | $ | 32,944,633 | | |
See notes to financial statements
25
Floating Rate Portfolio as of October 31, 2007
PORTFOLIO OF INVESTMENTS CONT'D
Principal
Amount* | |
Borrower/Tranche Description | |
Value | |
| Farming / Agriculture — 0.3% | | | |
| BF Bolthouse HoldCo, LLC | | | |
| $ | 6,337,125 | | | Term Loan, 7.50%, Maturing December 16, 2012 | | $ | 6,265,832 | | |
| Central Garden & Pet Co. | | | |
| | 10,859,489 | | | Term Loan, 6.56%, Maturing February 28, 2014 | | | 9,990,730 | | |
| United Agri Products, Inc. | | | |
| | 2,962,500 | | | Term Loan, 7.90%, Maturing June 8, 2012 | | | 2,962,500 | | |
| | | | | | | $ | 19,219,062 | | |
| Financial Intermediaries — 1.1% | | | |
| Asset Acceptence Capital Corp. | | | |
| $ | 2,493,750 | | | Term Loan, 7.94%, Maturing June 5, 2013 | | $ | 2,418,937 | | |
| Citco III, Ltd. | | | |
| | 10,875,000 | | | Term Loan, 7.63%, Maturing June 30, 2014 | | | 10,575,937 | | |
| Coinstar, Inc. | | | |
| | 8,339,211 | | | Term Loan, 7.13%, Maturing July 7, 2011 | | | 8,328,787 | | |
| E.A. Viner International Co. | | | |
| | 1,002,450 | | | Term Loan, 7.70%, Maturing July 31, 2013 | | | 994,932 | | |
| Grosvenor Capital Management | | | |
| | 4,334,332 | | | Term Loan, 7.33%, Maturing December 5, 2013 | | | 4,269,317 | | |
| INVESTools, Inc. | | | |
| | 3,700,000 | | | Term Loan, 8.45%, Maturing August 13, 2012 | | | 3,626,000 | | |
| Jupiter Asset Management Group | | | |
| GBP | 4,023,529 | | | Term Loan, 8.74%, Maturing June 30, 2015 | | | 7,995,738 | | |
| LPL Holdings, Inc. | | | |
| | 25,533,204 | | | Term Loan, 7.20%, Maturing December 18, 2014 | | | 25,214,039 | | |
| Oxford Acquisition III, Ltd. | | | |
| | 11,436,784 | | | Term Loan, 6.90%, Maturing May 24, 2014 | | | 10,883,324 | | |
| RJO Holdings Corp. (RJ O'Brien) | | | |
| | 4,225,000 | | | Term Loan, 7.76%, Maturing July 12, 2014 | | | 3,892,281 | | |
| | | | | | | $ | 78,199,292 | | |
| Food Products — 3.1% | | | |
| Acosta, Inc. | | | |
| $ | 18,769,962 | | | Term Loan, 7.01%, Maturing July 28, 2013 | | $ | 18,394,563 | | |
| Advantage Sales & Marketing, Inc. | | | |
| | 9,690,052 | | | Term Loan, 6.94%, Maturing March 29, 2013 | | | 9,363,013 | | |
| | 3,774,179 | | | Term Loan, 6.94%, Maturing March 29, 2013 | | | 3,646,800 | | |
| American Seafoods Group, LLC | | | |
| | 3,991,434 | | | Term Loan, 6.95%, Maturing September 28, 2012 | | | 3,906,616 | | |
| Birds Eye Foods, Inc. | | | |
| | 4,037,453 | | | Term Loan, 6.95%, Maturing March 22, 2013 | | | 3,918,852 | | |
| BL Marketing, Ltd. | | | |
| GBP | 2,200,000 | | | Term Loan, 8.81%, Maturing December 20, 2013 | | | 4,490,192 | | |
| GBP | 3,500,000 | | | Term Loan, 8.21%, Maturing December 31, 2013 | | | 7,157,120 | | |
| GBP | 2,200,000 | | | Term Loan, 9.31%, Maturing December 20, 2014 | | | 4,497,047 | | |
| GBP | 2,500,000 | | | Term Loan, 10.66%, Maturing June 30, 2015 | | | 5,053,803 | | |
Principal
Amount* | |
Borrower/Tranche Description | |
Value | |
| Food Products (continued) | | | |
| Black Lion Beverages III B.V. | | | |
| EUR | 1,500,000 | | | Term Loan, 7.10%, Maturing December 31, 2013 | | $ | 2,122,146 | | |
| EUR | 1,500,000 | | | Term Loan, 7.18%, Maturing December 31, 2014 | | | 2,132,996 | | |
| EUR | 3,000,000 | | | Term Loan, 8.97%, Maturing January 24, 2016 | | | 4,219,990 | | |
| Bumble Bee Seafood, LLC | | | |
| | 3,000,000 | | | Term Loan, 7.57%, Maturing May 2, 2012 | | | 2,962,500 | | |
| Charden International B.V. | | | |
| EUR | 1,000,000 | | | Term Loan, 7.17%, Maturing March 14, 2014 | | | 1,431,679 | | |
| EUR | 1,000,000 | | | Term Loan, 7.17%, Maturing March 14, 2015 | | | 1,438,913 | | |
| EUR | 1,500,000 | | | Term Loan, 10.26%, Maturing March 14, 2016 | | | 2,144,806 | | |
| Chiquita Brands, LLC | | | |
| | 8,497,359 | | | Term Loan, 7.88%, Maturing June 28, 2012 | | | 8,378,753 | | |
| Dean Foods Co. | | | |
| | 29,029,125 | | | Term Loan, 6.70%, Maturing April 2, 2014 | | | 28,163,186 | | |
| Dole Food Company, Inc. | | | |
| | 372,097 | | | Term Loan, Maturing April 12, 2013(3) | | | 361,993 | | |
| | 813,260 | | | Term Loan, 7.29% Maturing April 12, 2013 | | | 791,178 | | |
| | 1,219,276 | | | Term Loan, Maturing April 12, 2013(3) | | | 1,186,169 | | |
| | 1,802,386 | | | Term Loan, 7.57% Maturing April 12, 2013 | | | 1,753,446 | | |
| | 365,782 | | | Term Loan, Maturing April 12, 2013(3) | | | 355,850 | | |
| | 6,007,953 | | | Term Loan, 7.41% Maturing April 12, 2013 | | | 5,844,819 | | |
| Foodvest Limited | | | |
| EUR | 632,918 | | | Term Loan, 6.59%, Maturing March 16, 2014 | | | 889,730 | | |
| GBP | 437,500 | | | Term Loan, 8.33%, Maturing March 16, 2014 | | | 883,848 | | |
| EUR | 580,555 | | | Term Loan, 7.09%, Maturing March 16, 2015 | | | 820,320 | | |
| GBP | 401,305 | | | Term Loan, 8.83%, Maturing March 16, 2015 | | | 814,893 | | |
| GBP | 500,000 | | | Term Loan, 10.33%, Maturing September 16, 2015 | | | 998,426 | | |
| MafCo Worldwide Corp. | | | |
| | 843,632 | | | Term Loan, 7.60%, Maturing December 8, 2011 | | | 820,432 | | |
| Michael Foods, Inc. | | | |
| | 9,378,354 | | | Term Loan, 7.36%, Maturing November 21, 2010 | | | 9,261,125 | | |
| Nash-Finch Co. | | | |
| | 4,273,200 | | | Term Loan, 7.69%, Maturing November 12, 2010 | | | 4,080,906 | | |
| National Dairy Holdings, L.P. | | | |
| | 8,287,539 | | | Term Loan, 6.82%, Maturing March 15, 2012 | | | 8,101,070 | | |
| Pinnacle Foods Finance, LLC | | | |
| | 7,000,000 | | | Revolving Loan, 5.75%, Maturing April 2, 2013(2) | | | 6,685,000 | | |
| | 32,518,500 | | | Term Loan, 7.95%, Maturing April 2, 2014 | | | 31,513,906 | | |
| Reddy Ice Group, Inc. | | | |
| | 14,335,000 | | | Term Loan, 7.00%, Maturing August 9, 2012 | | | 14,084,137 | | |
| Ruby Acquisitions, Ltd. | | | |
| GBP | 2,539,204 | | | Term Loan, 8.84%, Maturing January 5, 2015 | | | 4,898,985 | | |
| United Biscuit Holdco, Ltd. | | | |
| EUR | 1,209,173 | | | Term Loan, 6.88%, Maturing December 14, 2014 | | | 1,708,917 | | |
| GBP | 2,859,511 | | | Term Loan, 8.69%, Maturing December 14, 2014 | | | 5,789,378 | | |
| | | | | | | $ | 215,067,503 | | |
See notes to financial statements
26
Floating Rate Portfolio as of October 31, 2007
PORTFOLIO OF INVESTMENTS CONT'D
Principal
Amount* | |
Borrower/Tranche Description | |
Value | |
| Food Service — 1.9% | | | |
| AFC Enterprises, Inc. | | | |
| $ | 3,206,863 | | | Term Loan, 7.50%, Maturing May 23, 2009 | | $ | 3,154,751 | | |
| Aramark Corp. | | | |
| | 2,376,596 | | | Term Loan, 5.20%, Maturing January 26, 2014 | | | 2,323,420 | | |
| | 32,987,418 | | | Term Loan, 7.20%, Maturing January 26, 2014 | | | 32,249,325 | | |
| Buffets, Inc. | | | |
| | 1,826,350 | | | Term Loan, 5.10%, Maturing May 1, 2013 | | | 1,660,837 | | |
| | 13,724,366 | | | Term Loan, 8.54%, Maturing November 1, 2013 | | | 12,480,595 | | |
| CBRL Group, Inc. | | | |
| | 9,558,325 | | | Term Loan, 6.86%, Maturing April 27, 2013 | | | 9,319,367 | | |
| | 3,877,905 | | | Term Loan, 7.43%, Maturing April 27, 2013 | | | 3,785,805 | | |
| Denny's, Inc. | | | |
| | 280,724 | | | Term Loan, 7.12%, Maturing March 31, 2012 | | | 277,215 | | |
| | 1,438,810 | | | Term Loan, 7.26%, Maturing March 31, 2012 | | | 1,420,825 | | |
| JRD Holdings, Inc. | | | |
| | 5,715,625 | | | Term Loan, 7.74%, Maturing June 26, 2014 | | | 5,601,313 | | |
| Maine Beverage Co., LLC | | | |
| | 3,103,571 | | | Term Loan, 6.98%, Maturing June 30, 2010 | | | 3,088,054 | | |
| NPC International, Inc. | | | |
| | 4,193,793 | | | Term Loan, 6.98%, Maturing March 31, 2013 | | | 4,047,010 | | |
| OSI Restaurant Partners, LLC | | | |
| | 723,182 | | | Term Loan, 5.52%, Maturing May 11, 2013 | | | 698,593 | | |
| | 8,929,439 | | | Term Loan, 7.06%, Maturing May 9, 2014 | | | 8,625,838 | | |
| QCE Finance, LLC | | | |
| | 10,077,462 | | | Term Loan, 7.45%, Maturing May 5, 2013 | | | 9,787,040 | | |
| Sagittarius Restaurants, LLC | | | |
| | 4,806,812 | | | Term Loan, 7.45%, Maturing March 29, 2013 | | | 4,446,301 | | |
| Selecta | | | |
| CHF | 18,404,850 | | | Term Loan, 5.13%, Maturing July 2, 2015 | | | 15,005,896 | | |
| SSP Financing, Ltd. | | | |
| EUR | 184,777 | | | Term Loan, 6.62%, Maturing June 15, 2014 | | | 259,507 | | |
| EUR | 840,369 | | | Term Loan, 6.95%, Maturing June 15, 2014 | | | 1,180,242 | | |
| | 3,954,516 | | | Term Loan, 7.58%, Maturing June 15, 2014 | | | 3,771,620 | | |
| EUR | 184,777 | | | Term Loan, 7.12%, Maturing June 15, 2015 | | | 260,844 | | |
| EUR | 840,369 | | | Term Loan, 7.45%, Maturing June 15, 2015 | | | 1,186,321 | | |
| | 3,954,516 | | | Term Loan, 8.08%, Maturing June 15, 2015 | | | 3,791,392 | | |
| | | | | | | $ | 128,422,111 | | |
| Food / Drug Retailers — 1.1% | | | |
| General Nutrition Centers, Inc. | | | |
| $ | 16,716,000 | | | Term Loan, 7.48%, Maturing September 16, 2013 | | $ | 15,948,117 | | |
| Pantry, Inc. (The) | | | |
| | 2,288,889 | | | Term Loan, 0.00%, Maturing May 15, 2014(2) | | | 2,221,653 | | |
| | 7,991,083 | | | Term Loan, 6.51%, Maturing May 15, 2014 | | | 7,756,345 | | |
| Rite Aid Corp. | | | |
| | 29,000,000 | | | Term Loan, 6.79%, Maturing June 1, 2014 | | | 28,275,000 | | |
Principal
Amount* | |
Borrower/Tranche Description | |
Value | |
| Food / Drug Retailers (continued) | | | |
| Roundy's Supermarkets, Inc. | | | |
| $ | 23,004,407 | | | Term Loan, 8.46%, Maturing November 3, 2011 | | $ | 22,927,733 | | |
| | | | | | | $ | 77,128,848 | | |
| Forest Products — 2.1% | | | |
| Appleton Papers, Inc. | | | |
| $ | 11,620,875 | | | Term Loan, 7.02%, Maturing June 5, 2014 | | $ | 11,203,256 | | |
| Boise Cascade Holdings, LLC | | | |
| | 32,057,111 | | | Term Loan, 6.49%, Maturing April 30, 2014 | | | 31,872,783 | | |
| | 9,087,215 | | | Term Loan, 6.72%, Maturing April 30, 2014 | | | 9,034,964 | | |
| Domtar Corp. | | | |
| | 8,706,250 | | | Term Loan, 6.48%, Maturing March 7, 2014 | | | 8,575,656 | | |
| Georgia-Pacific Corp. | | | |
| | 6,065,278 | | | Term Loan, 7.37%, Maturing December 20, 2012 | | | 5,931,514 | | |
| | 56,997,991 | | | Term Loan, 7.41%, Maturing December 20, 2012 | | | 55,740,958 | | |
| NewPage Corp. | | | |
| | 11,803,146 | | | Term Loan, 7.47%, Maturing May 2, 2011 | | | 11,714,623 | | |
| Xerium Technologies, Inc. | | | |
| EUR | 1,955,000 | | | Term Loan, 7.48%, Maturing May 18, 2012 | | | 2,665,763 | | |
| | 9,208,460 | | | Term Loan, 7.95%, Maturing May 18, 2012 | | | 8,736,526 | | |
| | | | | | | $ | 145,476,043 | | |
| Healthcare — 7.9% | | | |
| Accellent, Inc. | | | |
| $ | 4,188,062 | | | Term Loan, 8.01%, Maturing November 22, 2012 | | $ | 3,999,599 | | |
| Advanced Medical Optics, Inc. | | | |
| | 1,990,000 | | | Term Loan, 7.03%, Maturing April 2, 2014 | | | 1,920,350 | | |
| Alliance Imaging, Inc. | | | |
| | 6,832,983 | | | Term Loan, 7.63%, Maturing December 29, 2011 | | | 6,781,736 | | |
| American Medical Systems | | | |
| | 11,700,086 | | | Term Loan, 7.57%, Maturing July 20, 2012 | | | 11,422,209 | | |
| AMN Healthcare, Inc. | | | |
| | 2,507,029 | | | Term Loan, 6.95%, Maturing November 2, 2011 | | | 2,443,571 | | |
| AMR HoldCo, Inc. | | | |
| | 6,007,069 | | | Term Loan, 7.71%, Maturing February 10, 2012 | | | 5,875,664 | | |
| Biomet, Inc. | | | |
| EUR | 10,025,000 | | | Term Loan, Maturing December 26, 2014(3) | | | 14,422,086 | | |
| | 11,222,222 | | | Term Loan, 8.20%, Maturing December 26, 2014 | | | 11,183,326 | | |
| Cardinal Health 409, Inc. | | | |
| | 16,857,750 | | | Term Loan, 7.45%, Maturing April 10, 2014 | | | 16,244,027 | | |
| Carestream Health, Inc. | | | |
| | 17,075,000 | | | Term Loan, 7.11%, Maturing April 30, 2013 | | | 16,557,423 | | |
| Carl Zeiss Vision Holding GmbH | | | |
| EUR | 6,371,053 | | | Term Loan, 7.25%, Maturing July 24, 2015 | | | 9,062,930 | | |
See notes to financial statements
27
Floating Rate Portfolio as of October 31, 2007
PORTFOLIO OF INVESTMENTS CONT'D
Principal
Amount* | |
Borrower/Tranche Description | |
Value | |
| Healthcare (continued) | | | |
| CB Diagnostics AB | | | |
| $ | 999,652 | | | Term Loan, 7.27%, Maturing January 16, 2015 | | $ | 979,659 | | |
| | 2,318,673 | | | Term Loan, 7.52%, Maturing January 16, 2016 | | | 2,272,299 | | |
| Community Health Systems, Inc. | | | |
| | 4,934,261 | | | Term Loan, 0.00%, Maturing July 25, 2014(2) | | | 4,826,324 | | |
| | 66,067,691 | | | Term Loan, 7.76%, Maturing July 25, 2014 | | | 64,622,461 | | |
| Concentra, Inc. | | | |
| | 5,985,000 | | | Term Loan, 7.45%, Maturing June 25, 2014 | | | 5,827,894 | | |
| ConMed Corp. | | | |
| | 3,581,472 | | | Term Loan, 6.32%, Maturing April 13, 2013 | | | 3,527,750 | | |
| CRC Health Corp. | | | |
| | 3,861,000 | | | Term Loan, 7.45%, Maturing February 6, 2013 | | | 3,776,541 | | |
| | 3,915,574 | | | Term Loan, 7.45%, Maturing February 6, 2013 | | | 3,829,921 | | |
| Dako Equity Project Delphi | | | |
| EUR | 3,500,282 | | | Term Loan, 7.17%, Maturing May 31, 2016 | | | 4,709,551 | | |
| | 1,568,302 | | | Term Loan, 7.36%, Maturing May 31, 2015 | | | 1,458,521 | | |
| DaVita, Inc. | | | |
| | 32,753,823 | | | Term Loan, 6.75%, Maturing October 5, 2012 | | | 32,132,876 | | |
| Encore Medical Finance, LLC | | | |
| | 8,118,021 | | | Term Loan, 7.84%, Maturing November 3, 2013 | | | 8,097,726 | | |
| FHC Health Systems, Inc. | | | |
| | 888,889 | | | Term Loan, 12.11%, Maturing June 26, 2008 | | | 902,222 | | |
| | 917,817 | | | Term Loan, 12.33%, Maturing December 18, 2009 | | | 931,584 | | |
| | 642,472 | | | Term Loan, 14.33%, Maturing December 18, 2009 | | | 652,109 | | |
| | 3,250,000 | | | Term Loan, 15.33%, Maturing February 7, 2011 | | | 3,282,500 | | |
| Fresenius Medical Care Holdings | | | |
| | 17,715,942 | | | Term Loan, Maturing March 31, 2013(3) | | | 17,523,565 | | |
| Gambro Holding AB | | | |
| EUR | 1,803,396 | | | Term Loan, 6.79%, Maturing June 5, 2014 | | | 2,578,623 | | |
| | 1,324,583 | | | Term Loan, 7.56%, Maturing June 5, 2014 | | | 1,301,403 | | |
| EUR | 1,803,396 | | | Term Loan, 7.29%, Maturing June 5, 2015 | | | 2,591,668 | | |
| | 1,324,583 | | | Term Loan, 8.06%, Maturing June 5, 2015 | | | 1,308,026 | | |
| Hanger Orthopedic Group, Inc. | | | |
| | 5,406,562 | | | Term Loan, 7.45%, Maturing May 30, 2013 | | | 5,301,810 | | |
| HCA, Inc. | | | |
| | 55,964,626 | | | Term Loan, 7.45%, Maturing November 18, 2013 | | | 54,771,236 | | |
| Health Management Association, Inc. | | | |
| | 27,586,375 | | | Term Loan, 6.94%, Maturing February 28, 2014 | | | 26,421,623 | | |
| HealthSouth Corp. | | | |
| | 8,693,250 | | | Term Loan, 7.63%, Maturing March 10, 2013 | | | 8,528,278 | | |
| Iasis Healthcare, LLC | | | |
| | 702,512 | | | Term Loan, 6.79%, Maturing March 14, 2014 | | | 671,558 | | |
| | 7,671,518 | | | Term Loan, 7.07%, Maturing March 14, 2014 | | | 7,333,496 | | |
| | 2,634,420 | | | Term Loan, 7.70%, Maturing March 14, 2014(2) | | | 2,518,342 | | |
| Ikaria Acquisition, Inc. | | | |
| | 4,657,447 | | | Term Loan, 7.70%, Maturing March 28, 2013 | | | 4,564,298 | | |
Principal
Amount* | |
Borrower/Tranche Description | |
Value | |
| Healthcare (continued) | | | |
| IM U.S. Holdings, LLC | | | |
| $ | 10,673,250 | | | Term Loan, 7.20%, Maturing June 26, 2014 | | $ | 10,473,127 | | |
| inVentiv Health, Inc. | | | |
| | 490,000 | | | Term Loan, 0.00%, Maturing July 6, 2014(2) | | | 478,975 | | |
| | 8,064,788 | | | Term Loan, 6.57%, Maturing July 7, 2014 | | | 7,883,330 | | |
| Leiner Health Products, Inc. | | | |
| | 8,078,625 | | | Term Loan, 9.65%, Maturing May 27, 2011 | | | 7,661,227 | | |
| LifeCare Holdings, Inc. | | | |
| | 9,065,000 | | | Term Loan, 8.20%, Maturing August 11, 2012 | | | 8,453,113 | | |
| LifePoint Hospitals, Inc. | | | |
| | 16,519,064 | | | Term Loan, 7.17%, Maturing April 15, 2012 | | | 16,232,938 | | |
| Magellan Health Services, Inc. | | | |
| | 3,679,054 | | | Term Loan, 6.88%, Maturing August 15, 2008 | | | 3,605,473 | | |
| | 1,379,645 | | | Term Loan, 6.87%, Maturing August 15, 2008 | | | 1,352,052 | | |
| Matria Healthcare, Inc. | | | |
| | 3,141,953 | | | Term Loan, 7.34%, Maturing January 19, 2012 | | | 3,079,114 | | |
| MultiPlan Merger Corp. | | | |
| | 4,698,750 | | | Term Loan, 7.25%, Maturing April 12, 2013 | | | 4,608,689 | | |
| | 5,132,553 | | | Term Loan, 7.25%, Maturing April 12, 2013 | | | 5,034,177 | | |
| National Mentor Holdings, Inc. | | | |
| | 484,400 | | | Term Loan, 7.32%, Maturing June 29, 2013 | | | 474,712 | | |
| | 8,063,530 | | | Term Loan, 7.20%, Maturing June 29, 2013 | | | 7,902,259 | | |
| Nyco Holdings | | | |
| EUR | 9,850,000 | | | Term Loan, 7.21%, Maturing December 29, 2014 | | | 13,347,363 | | |
| | 2,903,121 | | | Term Loan, 7.70%, Maturing December 29, 2014 | | | 2,712,603 | | |
| EUR | 9,850,000 | | | Term Loan, 7.71%, Maturing December 29, 2015 | | | 13,411,490 | | |
| | 2,903,121 | | | Term Loan, 8.20%, Maturing December 29, 2015 | | | 2,727,119 | | |
| Psychiatric Solutions Inc. | | | |
| | 997,716 | | | Term Loan, 7.00%, Maturing May 31, 2014 | | | 980,256 | | |
| RadNet Management, Inc. | | | |
| | 2,471,278 | | | Term Loan, 9.22%, Maturing November 15, 2012 | | | 2,477,456 | | |
| ReAble Therapeutics Finance, LLC | | | |
| | 13,519,591 | | | Term Loan, 7.45%, Maturing November 16, 2013 | | | 13,316,797 | | |
| Renal Advantage, Inc. | | | |
| | 2,303,743 | | | Term Loan, 8.10%, Maturing October 5, 2012 | | | 2,254,788 | | |
| Select Medical Holding Corp. | | | |
| | 2,000,000 | | | Revolving Loan, 7.17%, Maturing February 24, 2010(2) | | | 1,850,000 | | |
| | 9,701,250 | | | Term Loan, 7.48%, Maturing February 24, 2012 | | | 9,333,408 | | |
| Sunrise Medical Holdings, Inc. | | | |
| | 5,745,846 | | | Term Loan, 9.42%, Maturing May 13, 2010 | | | 5,171,261 | | |
| Vanguard Health Holding Co., LLC | | | |
| | 11,799,355 | | | Term Loan, Maturing September 23, 2011(3) | | | 11,567,061 | | |
| Viant Holdings, Inc. | | | |
| | 4,862,812 | | | Term Loan, 7.45%, Maturing June 25, 2014 | | | 4,558,887 | | |
| | | | | | | $ | 538,104,460 | | |
See notes to financial statements
28
Floating Rate Portfolio as of October 31, 2007
PORTFOLIO OF INVESTMENTS CONT'D
Principal
Amount* | |
Borrower/Tranche Description | |
Value | |
| Home Furnishings — 1.3% | | | |
| Dometic Corp. | | | |
| $ | 2,790,150 | | | Term Loan, 7.22%, Maturing December 31, 2014 | | $ | 2,707,609 | | |
| | 421,159 | | | Term Loan, 7.72%, Maturing December 31, 2014 | | | 410,805 | | |
| | 1,788,692 | | | Term Loan, 8.01%, Maturing December 31, 2014 | | | 1,744,720 | | |
| Hunter Fan Co. | | | |
| | 415,714 | | | Term Loan, 0.00%, Maturing April 16, 2014(2) | | | 378,300 | | |
| | 4,424,239 | | | Term Loan, 8.03%, Maturing April 16, 2014 | | | 4,026,058 | | |
| Interline Brands, Inc. | | | |
| | 8,330,421 | | | Term Loan, 6.57%, Maturing June 23, 2013 | | | 8,153,400 | | |
| | 5,759,103 | | | Term Loan, 6.57%, Maturing June 23, 2013 | | | 5,636,722 | | |
| National Bedding Co., LLC | | | |
| | 12,785,390 | | | Term Loan, 7.09%, Maturing February 23, 2013 | | | 12,098,176 | | |
| | 1,500,000 | | | Term Loan, 9.75%, Maturing August 31, 2012 | | | 1,391,250 | | |
| Oreck Corp. | | | |
| | 4,234,418 | | | Term Loan, 9.25%, Maturing February 2, 2012 | | | 3,196,986 | | |
| Sanitec, Ltd. Oy | | | |
| EUR | 4,478,261 | | | Term Loan, 7.05%, Maturing April 7, 2013 | | | 6,194,311 | | |
| EUR | 4,478,261 | | | Term Loan, 7.55%, Maturing April 7, 2014 | | | 6,223,816 | | |
| Sealy Mattress Co. | | | |
| | 5,000,000 | | | Revolving Loan, 0.00%, Maturing April 6, 2012(2) | | | 4,750,000 | | |
| | 6,354,620 | | | Term Loan, 6.47%, Maturing August 25, 2012 | | | 6,132,208 | | |
| Simmons Co. | | | |
| | 21,880,243 | | | Term Loan, 7.36%, Maturing December 19, 2011 | | | 21,552,039 | | |
| | 2,500,000 | | | Term Loan, 10.65%, Maturing February 15, 2012 | | | 2,337,500 | | |
| | | | | | | $ | 86,933,900 | | |
| Industrial Equipment — 2.1% | | | |
| Aearo Technologies, Inc. | | | |
| $ | 8,079,750 | | | Term Loan, 7.45%, Maturing July 2, 2014 | | $ | 7,832,308 | | |
| CEVA Group PLC U.S. | | | |
| EUR | 652,779 | | | Term Loan, 7.16%, Maturing January 4, 2014 | | | 927,456 | | |
| EUR | 1,108,493 | | | Term Loan, 7.16%, Maturing January 4, 2014 | | | 1,574,925 | | |
| EUR | 1,362,345 | | | Term Loan, 7.16%, Maturing January 4, 2014 | | | 1,935,593 | | |
| EUR | 1,135,787 | | | Term Loan, 7.73%, Maturing January 4, 2014 | | | 1,613,705 | | |
| Colfax Corp. | | | |
| | 1,993,286 | | | Term Loan, 7.50%, Maturing December 19, 2011 | | | 1,980,828 | | |
| EUR | 4,912,500 | | | Term Loan, 6.98%, Maturing December 19, 2011 | | | 7,071,624 | | |
| EPD Holdings (Goodyear Engineering Products) | | | |
| | 1,353,125 | | | Term Loan, 0.00%, Maturing July 31, 2014(2) | | | 1,331,701 | | |
| | 9,471,875 | | | Term loan, 7.46%, Maturing July 31, 2014 | | | 9,321,907 | | |
| | 2,000,000 | | | Term Loan, 10.71%, Maturing July 13, 2015 | | | 1,936,666 | | |
| Flowserve Corp. | | | |
| | 13,655,506 | | | Term Loan, 6.78%, Maturing August 10, 2012 | | | 13,459,208 | | |
| FR Brand Acquisition Corp. | | | |
| | 10,149,000 | | | Term Loan, 7.53%, Maturing February 7, 2014 | | | 9,755,726 | | |
| Generac Acquisition Corp. | | | |
| | 11,895,000 | | | Term Loan, 7.73%, Maturing November 7, 2013 | | | 10,539,815 | | |
Principal
Amount* | |
Borrower/Tranche Description | |
Value | |
| Industrial Equipment (continued) | | | |
| Gleason Corp. | | | |
| $ | 4,940,737 | | | Term Loan, 7.17%, Maturing June 30, 2013 | | $ | 4,897,505 | | |
| | 1,518,056 | | | Term Loan, 7.42%, Maturing June 30, 2013 | | | 1,504,773 | | |
| Heating Finance PLC (Baxi) | | | |
| EUR | 3,253,597 | | | Term Loan, 0.00%, Maturing December 27, 2010(2)(4) | | | 4,236,427 | | |
| GBP | 2,613,085 | | | Term Loan, 8.35%, Maturing December 27, 2010 | | | 5,048,312 | | |
| Itron, Inc. | | | |
| GBP | 895,000 | | | Term Loan, 8.32%, Maturing April 18, 2014 | | | 1,826,692 | | |
| Jason, Inc. | | | |
| | 1,965,063 | | | Term Loan, Maturing April 30, 2010(3) | | | 1,915,936 | | |
| John Maneely Co. | | | |
| | 15,740,816 | | | Term Loan, 8.52%, Maturing December 8, 2013 | | | 14,717,663 | | |
| KION Group GmbH | | | |
| | 2,250,000 | | | Term Loan, 7.49%, Maturing January 28, 2015 | | | 2,214,461 | | |
| | 2,250,000 | | | Term Loan, 7.74%, Maturing January 28, 2016 | | | 2,223,664 | | |
| Polypore, Inc. | | | |
| | 5,000,000 | | | Term Loan, 0.00%, Maturing July 3, 2013(2) | | | 4,775,000 | | |
| EUR | 1,111,710 | | | Term Loan, 6.66%, Maturing July 3, 2014 | | | 1,568,157 | | |
| | 19,950,000 | | | Term Loan, 7.07%, Maturing July 3, 2014 | | | 19,476,188 | | |
| Terex Corp. | | | |
| | 5,628,750 | | | Term Loan, 6.95%, Maturing July 13, 2013 | | | 5,600,606 | | |
| TFS Acquisition Corp. | | | |
| | 5,445,000 | | | Term Loan, 8.70%, Maturing August 11, 2013 | | | 5,363,325 | | |
| | | | | | | $ | 144,650,171 | | |
| Insurance — 0.9% | | | |
| Alliant Holdings I, Inc. | | | |
| $ | 7,375,000 | | | Term Loan, Maturing August 21, 2014(3) | | $ | 7,301,250 | | |
| CCC Information Services Group, Inc. | | | |
| | 4,557,991 | | | Term Loan, 7.71%, Maturing February 10, 2013 | | | 4,518,108 | | |
| Conseco, Inc. | | | |
| | 29,506,722 | | | Term Loan, 6.82%, Maturing September 25, 2013 | | | 28,264,990 | | |
| Crump Group, Inc. | | | |
| | 8,150,000 | | | Term Loan, Maturing August 4, 2014(3) | | | 8,027,750 | | |
| Hub International Holdings, Inc. | | | |
| | 1,650,336 | | | Term Loan, 8.01%, Maturing June 13, 2014(2) | | | 1,620,424 | | |
| | 7,354,933 | | | Term Loan, 8.20%, Maturing June 13, 2014 | | | 7,221,624 | | |
| U.S.I. Holdings Corp. | | | |
| | 7,107,187 | | | Term Loan, 7.95%, Maturing May 4, 2014 | | | 7,000,580 | | |
| | | | | | | $ | 63,954,726 | | |
| Leisure Goods / Activities / Movies — 5.2% | | | |
| 24 Hour Fitness Worldwide, Inc. | | | |
| $ | 6,982,278 | | | Term Loan, 7.81%, Maturing June 8, 2012 | | $ | 6,877,544 | | |
| AMC Entertainment, Inc. | | | |
| | 2,000,000 | | | Term Loan, Maturing January 26, 2013(3) | | | 1,968,594 | | |
| | 17,697,635 | | | Term Loan, 6.60% Maturing January 26, 2013 | | | 17,419,729 | | |
See notes to financial statements
29
Floating Rate Portfolio as of October 31, 2007
PORTFOLIO OF INVESTMENTS CONT'D
Principal
Amount* | |
Borrower/Tranche Description | |
Value | |
| Leisure Goods / Activities / Movies (continued) | | | |
| AMF Bowling Worldwide, Inc. | | | |
| $ | 6,034,875 | | | Term Loan, 8.21%, Maturing June 8, 2013 | | $ | 5,884,003 | | |
| Bombardier Recreational Product | | | |
| | 14,400,000 | | | Term Loan, 7.70%, Maturing June 28, 2013 | | | 14,022,000 | | |
| Carmike Cinemas, Inc. | | | |
| | 9,288,013 | | | Term Loan, 9.00%, Maturing May 19, 2012 | | | 9,272,530 | | |
| | 6,658,978 | | | Term Loan, 9.23%, Maturing May 19, 2012 | | | 6,647,878 | | |
| Cedar Fair, L.P. | | | |
| | 4,937,500 | | | Term Loan, 6.76%, Maturing August 31, 2011 | | | 4,848,008 | | |
| | 13,016,951 | | | Term Loan, 6.75%, Maturing August 30, 2012 | | | 12,781,019 | | |
| Cinemark, Inc. | | | |
| | 31,436,214 | | | Term Loan, 7.25%, Maturing October 5, 2013 | | | 30,787,842 | | |
| Dave & Buster's, Inc. | | | |
| | 1,252,498 | | | Term Loan, 7.48%, Maturing March 8, 2013 | | | 1,241,539 | | |
| | 2,097,464 | | | Term Loan, 7.48%, Maturing March 8, 2013 | | | 2,079,111 | | |
| Deluxe Entertainment Services | | | |
| | 312,008 | | | Term Loan, 7.45%, Maturing January 28, 2011 | | | 303,428 | | |
| | 6,750,415 | | | Term Loan, 7.45%, Maturing January 28, 2011 | | | 6,564,779 | | |
| | 612,971 | | | Term Loan, 7.45%, Maturing January 28, 2011 | | | 596,114 | | |
| DW Funding, LLC | | | |
| | 5,303,505 | | | Term Loan, 7.10%, Maturing May 4, 2011 | | | 5,237,211 | | |
| Easton-Bell Sports, Inc. | | | |
| | 10,475,823 | | | Term Loan, 6.85%, Maturing March 16, 2012 | | | 10,179,556 | | |
| Fender Musical Instruments Corp. | | | |
| | 2,983,334 | | | Term Loan, 0.00%, Maturing June 9, 2014(2) | | | 2,878,917 | | |
| | 5,951,750 | | | Term Loan, 7.65%, Maturing June 9, 2014 | | | 5,743,439 | | |
| Lions Gate Entertainment, Inc. | | | |
| | 1,022,500 | | | Revolving Loan, 0.00%, Maturing December 31, 2008(2) | | | 996,938 | | |
| Mega Blocks, Inc. | | | |
| | 1,905,638 | | | Term Loan, 7.25%, Maturing July 26, 2012 | | | 1,831,795 | | |
| Metro-Goldwyn-Mayer Holdings, Inc. | | | |
| | 59,882,876 | | | Term Loan, 8.45%, Maturing April 8, 2012 | | | 57,562,415 | | |
| National CineMedia, LLC | | | |
| | 18,250,000 | | | Term Loan, 7.46%, Maturing February 13, 2015 | | | 17,668,281 | | |
| Odeon | | | |
| EUR | 1,064,322 | | | Term Loan, 6.95%, Maturing April 4, 2015 | | | 1,520,080 | | |
| GBP | 623,547 | | | Term Loan, 8.88%, Maturing April 4, 2015 | | | 1,262,401 | | |
| EUR | 1,064,322 | | | Term Loan, 6.95%, Maturing April 4, 2016 | | | 1,527,779 | | |
| GBP | 623,547 | | | Term Loan, 9.25%, Maturing April 4, 2016 | | | 1,271,037 | | |
| Regal Cinemas Corp. | | | |
| | 33,167,481 | | | Term Loan, 6.70%, Maturing November 10, 2010 | | | 32,479,621 | | |
| Revolution Studios Distribution Co., LLC | | | |
| | 10,321,697 | | | Term Loan, 8.51%, Maturing December 21, 2014 | | | 10,270,088 | | |
| Six Flags Theme Parks, Inc. | | | |
| | 26,558,437 | | | Term Loan, 7.75%, Maturing April 30, 2015 | | | 25,371,620 | | |
Principal
Amount* | |
Borrower/Tranche Description | |
Value | |
| Leisure Goods / Activities / Movies (continued) | | | |
| Southwest Sports Group, LLC | | | |
| $ | 9,500,000 | | | Term Loan, 7.75%, Maturing December 22, 2010 | | $ | 9,333,750 | | |
| Universal City Development Partners, Ltd. | | | |
| | 19,996,088 | | | Term Loan, 7.33%, Maturing June 9, 2011 | | | 19,821,122 | | |
| WMG Acquisition Corp. | | | |
| | 4,390,000 | | | Revolving Loan, 0.00%, Maturing February 28, 2010(2) | | | 4,263,788 | | |
| | 24,580,765 | | | Term Loan, 7.42%, Maturing February 28, 2011 | | | 24,058,423 | | |
| Zuffa, LLC | | | |
| | 2,493,750 | | | Term Loan, 7.56%, Maturing June 19, 2015 | | | 2,294,250 | | |
| | | | | | | $ | 356,866,629 | | |
| Lodging and Casinos — 3.5% | | | |
| Ameristar Casinos, Inc. | | | |
| $ | 5,086,727 | | | Term Loan, 8.43%, Maturing November 10, 2012 | | $ | 5,048,576 | | |
| Bally Technologies, Inc. | | | |
| | 14,541,034 | | | Term Loan, 8.64%, Maturing September 4, 2009 | | | 14,498,617 | | |
| CCM Merger, Inc. | | | |
| | 4,998,342 | | | Term Loan, 7.30%, Maturing July 13, 2012 | | | 4,892,127 | | |
| Choctaw Resort Development Enterprise | | | |
| | 3,481,983 | | | Term Loan, 6.95%, Maturing November 4, 2011 | | | 3,429,753 | | |
| Dionysos Leisure Entertainment | | | |
| EUR | 2,500,000 | | | Term Loan, 6.66%, Maturing March 2, 2014(2) | | | 3,562,622 | | |
| EUR | 2,500,000 | | | Term Loan, 7.03%, Maturing March 2, 2015(2) | | | 3,580,706 | | |
| Full Moon Holdco 3 Ltd. | | | |
| GBP | 1,500,000 | | | Term Loan, 9.20%, Maturing November 20, 2014 | | | 3,035,205 | | |
| GBP | 1,500,000 | | | Term Loan, 9.70%, Maturing November 20, 2015 | | | 3,050,785 | | |
| Gala Electric Casinos, Ltd. | | | |
| GBP | 5,000,000 | | | Term Loan, 6.81%, Maturing December 12, 2012(2) | | | 10,023,214 | | |
| GBP | 9,847,984 | | | Term Loan, 8.81%, Maturing December 12, 2013 | | | 19,750,220 | | |
| GBP | 8,897,012 | | | Term Loan, 9.30%, Maturing December 12, 2014 | | | 17,935,448 | | |
| Green Valley Ranch Gaming, LLC | | | |
| | 7,109,826 | | | Term Loan, 7.41%, Maturing February 16, 2014 | | | 6,967,630 | | |
| Herbst Gaming, Inc. | | | |
| | 3,508,038 | | | Term Loan, 8.16%, Maturing January 2, 2014 | | | 3,492,143 | | |
| | 6,308,195 | | | Term Loan, 8.17%, Maturing January 2, 2014 | | | 6,279,613 | | |
| Isle of Capri Casinos, Inc. | | | |
| | 4,142,647 | | | Term Loan, 0.00%, Maturing November 30, 2013(2) | | | 3,998,172 | | |
| | 5,509,720 | | | Term Loan, 6.64%, Maturing November 30, 2013 | | | 5,317,569 | | |
| | 10,083,552 | | | Term Loan, 6.74%, Maturing November 30, 2013 | | | 9,731,888 | | |
| LodgeNet Entertainment Corp. | | | |
| | 6,907,688 | | | Term Loan, 7.20%, Maturing April 4, 2014 | | | 6,793,282 | | |
| New World gaming Partners, Ltd | | | |
| | 9,770,833 | | | Term Loan, Maturing June 30, 2014(3) | | | 9,380,000 | | |
| | 1,954,167 | | | Term Loan, Maturing June 30, 2014(3) | | | 1,876,000 | | |
See notes to financial statements
30
Floating Rate Portfolio as of October 31, 2007
PORTFOLIO OF INVESTMENTS CONT'D
Principal
Amount* | |
Borrower/Tranche Description | |
Value | |
| Lodging and Casinos (continued) | | | |
| Penn National Gaming, Inc. | | | |
| $ | 31,976,717 | | | Term Loan, 6.90%, Maturing October 3, 2012 | | $ | 31,814,627 | | |
| Scandic Hotels | | | |
| EUR | 1,800,000 | | | Term Loan, 6.42%, Maturing April 25, 2015 | | | 2,513,005 | | |
| EUR | 1,800,000 | | | Term Loan, 6.79%, Maturing April 25, 2016 | | | 2,526,026 | | |
| Seminole Tribe of Florida | | | |
| | 3,184,008 | | | Term Loan, 6.75%, Maturing December 31, 2014 | | | 3,162,118 | | |
| | 952,227 | | | Term Loan, 6.97%, Maturing December 31, 2014(2) | | | 945,680 | | |
| | 3,213,765 | | | Term Loan, 7.13%, Maturing December 31, 2014 | | | 3,191,671 | | |
| Trump Entertainment Resorts Holdings, L.P. | | | |
| | 5,351,813 | | | Term Loan, 7.86%, Maturing May 20, 2012 | | | 5,298,294 | | |
| | 5,351,813 | | | Term Loan, 7.90%, Maturing May 20, 2012 | | | 5,298,294 | | |
| Venetian Casino Resort/Las Vegas Sands Inc. | | | |
| | 12,006,667 | | | Term Loan, 0.00%, Maturing May 23, 2014(2) | | | 11,675,907 | | |
| | 23,275,000 | | | Term Loan, 6.95%, Maturing May 23, 2014 | | | 22,633,820 | | |
| VML US Finance, LLC | | | |
| | 3,333,333 | | | Term Loan, 7.45%, Maturing May 25, 2012 | | | 3,271,130 | | |
| | 666,667 | | | Term Loan, 7.45%, Maturing May 25, 2013 | | | 654,226 | | |
| | 2,000,000 | | | Term Loan, 7.45%, Maturing May 25, 2013 | | | 1,962,678 | | |
| Wimar OpCo, LLC | | | |
| | 3,852,060 | | | Term Loan, 7.45%, Maturing January 3, 2012 | | | 3,765,389 | | |
| | | | | | | $ | 241,356,435 | | |
| Nonferrous Metals / Minerals — 1.4% | | | |
| Alpha Natural Resources, LLC | | | |
| $ | 9,142,187 | | | Term Loan, 6.95%, Maturing October 26, 2012 | | $ | 9,100,289 | | |
| Compass Minerals Group, Inc. | | | |
| | 7,315,269 | | | Term Loan, 6.70%, Maturing December 22, 2012 | | | 7,217,734 | | |
| Euramax International, Inc. | | | |
| | 4,582,479 | | | Term Loan, 8.24%, Maturing June 28, 2012 | | | 4,269,344 | | |
| GBP | 930,184 | | | Term Loan, 9.50%, Maturing June 29, 2012 | | | 1,797,056 | | |
| Magnum Coal Co. | | | |
| | 1,375,000 | | | Term Loan, 8.01%, Maturing March 21, 2013 | | | 1,254,688 | | |
| | 13,543,750 | | | Term Loan, 8.42%, Maturing March 21, 2013 | | | 12,358,672 | | |
| Murray Energy Corp. | | | |
| | 10,686,000 | | | Term Loan, 8.54%, Maturing January 28, 2010 | | | 10,686,000 | | |
| Noranda Aluminum Acquisition | | | |
| | 5,106,188 | | | Term Loan, 7.51%, Maturing May 18, 2014 | | | 5,008,317 | | |
| Novelis, Inc. | | | |
| | 3,598,789 | | | Term Loan, 7.20%, Maturing July 7, 2014 | | | 3,507,319 | | |
| | 7,917,336 | | | Term Loan, 7.20%, Maturing July 7, 2014 | | | 7,716,101 | | |
| Oxbow Carbon and Mineral Holdings | | | |
| | 17,496,808 | | | Term Loan, 7.19%, Maturing May 8, 2014 | | | 16,873,484 | | |
| | 1,536,418 | | | Term Loan, 7.20%, Maturing May 8, 2014 | | | 1,481,683 | | |
| Stillwater Mining Co. | | | |
| | 4,360,000 | | | Revolving Loan, 4.75%, Maturing July 30, 2009(2) | | | 4,283,700 | | |
| | 3,639,333 | | | Term Loan, 7.06%, Maturing July 30, 2010 | | | 3,609,763 | | |
Principal
Amount* | |
Borrower/Tranche Description | |
Value | |
| Nonferrous Metals / Minerals (continued) | | | |
| Thompson Creek Metals Co. | | | |
| $ | 6,747,396 | | | Term Loan, 9.56%, Maturing October 26, 2012 | | $ | 6,764,264 | | |
| Tube City IMS Corp. | | | |
| | 162,162 | | | Term Loan, 7.45%, Maturing January 25, 2014 | | | 156,757 | | |
| | 1,331,149 | | | Term Loan, 7.45%, Maturing January 25, 2014 | | | 1,286,777 | | |
| | | | | | | $ | 97,371,948 | | |
| Oil and Gas — 2.3% | | | |
| Atlas Pipeline Partners, L.P. | | | |
| $ | 10,960,000 | | | Term Loan, 7.55%, Maturing July 20, 2014 | | $ | 10,953,150 | | |
| Big West Oil, LLC | | | |
| | 3,423,750 | | | Term Loan, 0.00%, Maturing May 1, 2014(2) | | | 3,321,038 | | |
| | 2,785,688 | | | Term Loan, 7.45%, Maturing May 1, 2014 | | | 2,702,117 | | |
| Citgo Petroleum Corp. | | | |
| | 7,971,133 | | | Term Loan, 6.22%, Maturing November 15, 2012 | | | 7,811,710 | | |
| Dresser, Inc. | | | |
| | 14,277,976 | | | Term Loan, 7.99%, Maturing May 4, 2014 | | | 14,014,733 | | |
| Dynegy Holdings, Inc. | | | |
| | 35,419,681 | | | Term Loan, 6.32%, Maturing April 2, 2013 | | | 34,332,190 | | |
| | 2,055,319 | | | Term Loan, 6.63%, Maturing April 2, 2013 | | | 1,992,215 | | |
| El Paso Corp. | | | |
| | 10,960,000 | | | Term Loan, 7.32%, Maturing July 31, 2011 | | | 10,829,850 | | |
| Energy Transfer Equity, L.P. | | | |
| | 1,000,000 | | | Term Loan, 7.11%, Maturing February 8, 2012 | | | 985,313 | | |
| Enterprise GP Holdings L.P | | | |
| | 8,400,000 | | | Term Loan, Maturing October 31, 2014(3) | | | 8,386,879 | | |
| Hercules Offshore, Inc. | | | |
| | 6,309,188 | | | Term Loan, 6.99%, Maturing July 11, 2013 | | | 6,238,209 | | |
| Key Energy Services, Inc. | | | |
| | 3,000,000 | | | Term Loan, 7.96%, Maturing June 30, 2012 | | | 2,991,564 | | |
| | 3,762,198 | | | Term Loan, 7.64%, Maturing June 30, 2012 | | | 3,751,618 | | |
| Kinder Morgan, Inc. | | | |
| | 23,587,516 | | | Term Loan, 6.26%, Maturing May 21, 2014 | | | 23,046,961 | | |
| Primary Natural Resources, Inc. | | | |
| | 13,248,250 | | | Term Loan, 7.50%, Maturing July 28, 2010(4) | | | 13,082,647 | | |
| Targa Resources, Inc. | | | |
| | 4,828,492 | | | Term Loan, 7.20%, Maturing October 31, 2012 | | | 4,793,486 | | |
| | 10,634,944 | | | Term Loan, 7.53%, Maturing October 31, 2012 | | | 10,557,841 | | |
| | | | | | | $ | 159,791,521 | | |
| Publishing — 9.2% | | | |
| American Media Operations, Inc. | | | |
| $ | 23,000,000 | | | Term Loan, 8.80%, Maturing January 31, 2013 | | $ | 22,741,250 | | |
| Aster Zweite Beteiligungs GmbH | | | |
| EUR | 708,499 | | | Term Loan, 7.00%, Maturing September 27, 2013 | | | 995,124 | | |
| | 6,825,000 | | | Term Loan, 7.39%, Maturing September 27, 2013 | | | 6,590,391 | | |
See notes to financial statements
31
Floating Rate Portfolio as of October 31, 2007
PORTFOLIO OF INVESTMENTS CONT'D
Principal
Amount* | |
Borrower/Tranche Description | |
Value | |
| Publishing (continued) | | | |
| Black Press US Partnership | | | |
| $ | 1,701,700 | | | Term Loan, 7.54%, Maturing August 2, 2013 | | $ | 1,671,920 | | |
| | 2,802,800 | | | Term Loan, 7.54%, Maturing August 2, 2013 | | | 2,753,751 | | |
| CanWest MediaWorks, Ltd. | | | |
| | 7,381,500 | | | Term Loan, 7.54%, Maturing July 13, 2014 | | | 7,307,685 | | |
| Dex Media West, LLC | | | |
| | 7,146,484 | | | Term Loan, 7.05%, Maturing March 9, 2010 | | | 7,078,592 | | |
| | 1,961,433 | | | Term Loan, 7.01%, Maturing September 9, 2010 | | | 1,942,738 | | |
| GateHouse Media Operating, Inc. | | | |
| | 4,825,000 | | | Term Loan, 7.27%, Maturing August 28, 2014 | | | 4,502,328 | | |
| | 13,275,000 | | | Term Loan, 7.51%, Maturing August 28, 2014 | | | 12,387,234 | | |
| | 5,750,000 | | | Term Loan, 7.72%, Maturing August 28, 2014 | | | 5,369,063 | | |
| Hanley-Wood, LLC | | | |
| | 7,500,000 | | | Term Loan, 7.49%, Maturing March 8, 2014 | | | 6,234,375 | | |
| Idearc, Inc. | | | |
| | 58,408,625 | | | Term Loan, 7.20%, Maturing November 17, 2014 | | | 57,675,480 | | |
| Josten's Corp. | | | |
| | 4,000,000 | | | Revolving Loan, 6.81%, Maturing October 4, 2009(2) | | | 3,960,000 | | |
| | 9,488,152 | | | Term Loan, Maturing October 4, 2011(3) | | | 9,422,921 | | |
| Lamar Media Corp. | | | |
| | 2,000,000 | | | Term Loan, 6.50%, Maturing March 31, 2014 | | | 1,986,250 | | |
| MediaNews Group, Inc. | | | |
| | 12,040,626 | | | Term Loan, 6.64%, Maturing December 30, 2010 | | | 11,438,595 | | |
| | 7,579,063 | | | Term Loan, 7.14%, Maturing August 2, 2013 | | | 7,256,952 | | |
| Mediannuaire Holding | | | |
| EUR | 10,000,000 | | | Term Loan, 6.50%, Maturing November 23, 2013 | | | 14,146,510 | | |
| EUR | 2,000,000 | | | Term Loan, 7.00%, Maturing October 10, 2014 | | | 2,819,097 | | |
| EUR | 2,000,000 | | | Term Loan, 7.50%, Maturing October 10, 2015 | | | 2,833,564 | | |
| Merrill Communications, LLC | | | |
| | 11,380,107 | | | Term Loan, 7.27%, Maturing February 9, 2009 | | | 11,209,405 | | |
| Nebraska Book Co., Inc. | | | |
| | 11,049,120 | | | Term Loan, 7.65%, Maturing March 4, 2011 | | | 10,883,384 | | |
| Nelson Education, Ltd. | | | |
| | 4,300,000 | | | Term Loan, 7.70%, Maturing July 5, 2014 | | | 4,036,625 | | |
| Newspaper Holdings, Inc. | | | |
| | 21,650,000 | | | Term Loan, 6.31%, Maturing July 24, 2014 | | | 20,351,000 | | |
| Nielsen Finance, LLC | | | |
| | 50,403,169 | | | Term Loan, 7.36%, Maturing August 9, 2013 | | | 49,150,096 | | |
| Philadelphia Newspapers, LLC | | | |
| | 6,040,928 | | | Term Loan, 8.75%, Maturing June 29, 2013 | | | 5,557,654 | | |
| R.H. Donnelley Corp. | | | |
| | 38,817,720 | | | Term Loan, 7.01%, Maturing June 30, 2011 | | | 38,354,081 | | |
| | 10,122,608 | | | Term Loan, 7.06%, Maturing June 30, 2011 | | | 9,993,545 | | |
| Reader's Digest Association | | | |
| | 11,000,000 | | | Revolving Loan, 6.94%, Maturing March 2, 2013(2) | | | 10,285,000 | | |
| EUR | 1,130,168 | | | Term Loan, 6.72%, Maturing March 2, 2014 | | | 1,557,405 | | |
| | 37,785,362 | | | Term Loan, 7.54%, Maturing March 2, 2014 | | | 35,933,880 | | |
Principal
Amount* | |
Borrower/Tranche Description | |
Value | |
| Publishing (continued) | | | |
| Riverdeep Interactive Learning USA, Inc. | | | |
| $ | 15,426,428 | | | Term Loan, 7.95%, Maturing December 20, 2013 | | $ | 15,362,147 | | |
| Seat Pagine Gialle SpA | | | |
| EUR | 14,526,833 | | | Term Loan, 6.16%, Maturing May 25, 2012 | | | 20,876,578 | | |
| SGS International, Inc. | | | |
| | 990,831 | | | Term Loan, 7.68%, Maturing December 30, 2011(2) | | | 980,922 | | |
| | 1,203,563 | | | Term Loan, 7.84%, Maturing December 30, 2011 | | | 1,191,527 | | |
| Source Media, Inc. | | | |
| | 12,146,182 | | | Term Loan, 7.07%, Maturing November 8, 2011 | | | 11,827,345 | | |
| SP Newsprint Co. | | | |
| | 8,463,065 | | | Term Loan, 7.00%, Maturing January 9, 2010 | | | 8,293,804 | | |
| Springer Science+Business Media | | | |
| | 1,935,088 | | | Term Loan, 7.37%, Maturing June 30, 2011 | | | 1,867,360 | | |
| EUR | 1,359,516 | | | Term Loan, 6.79%, Maturing September 16, 2011 | | | 1,941,064 | | |
| | 3,008,560 | | | Term Loan, 7.75%, Maturing September 16, 2011 | | | 2,953,091 | | |
| EUR | 971,370 | | | Term Loan, 6.79%, Maturing September 16, 2011 | | | 1,383,372 | | |
| EUR | 603,718 | | | Term Loan, 7.16%, Maturing September 16, 2012 | | | 865,968 | | |
| EUR | 587,880 | | | Term Loan, 7.16%, Maturing September 16, 2012 | | | 843,251 | | |
| | 3,259,273 | | | Term Loan, 8.12%, Maturing September 16, 2012 | | | 3,214,458 | | |
| | 3,008,560 | | | Term Loan, 8.12%, Maturing September 16, 2011 | | | 2,968,134 | | |
| The Star Tribune Co. | | | |
| | 8,258,500 | | | Term Loan, 7.45%, Maturing March 5, 2014 | | | 6,888,968 | | |
| Thomas Nelson, Inc. | | | |
| | 1,975,000 | | | Term Loan, 7.41%, Maturing June 12, 2012 | | | 1,893,531 | | |
| TL Acquisitions, Inc. | | | |
| | 9,050,000 | | | Term Loan, 7.95%, Maturing July 5, 2014 | | | 8,773,468 | | |
| Trader Media Corp. | | | |
| GBP | 17,310,500 | | | Term Loan, 8.42%, Maturing March 23, 2015 | | | 34,611,468 | | |
| Tribune Co. | | | |
| | 16,100,000 | | | Term Loan, 7.74%, Maturing May 17, 2009 | | | 15,937,744 | | |
| | 25,735,500 | | | Term Loan, 8.24%, Maturing May 17, 2014 | | | 23,959,751 | | |
| World Directories Acquisition | | | |
| EUR | 10,000,000 | | | Term Loan, 6.72%, Maturing May 31, 2014 | | | 13,968,371 | | |
| Xsys US, Inc. | | | |
| EUR | 2,750,000 | | | Term Loan, 7.00%, Maturing September 27, 2013 | | | 3,862,520 | | |
| EUR | 791,501 | | | Term Loan, 7.00%, Maturing September 27, 2013 | | | 1,111,705 | | |
| | 7,701,575 | | | Term Loan, 7.39%, Maturing September 27, 2013 | | | 7,436,833 | | |
| EUR | 2,750,000 | | | Term Loan, 7.00%, Maturing September 27, 2014 | | | 3,880,758 | | |
| | 7,866,565 | | | Term Loan, 7.39%, Maturing September 27, 2014 | | | 7,625,651 | | |
| EUR | 1,000,000 | | | Term Loan, 8.55%, Maturing September 27, 2015 | | | 1,385,866 | | |
| YBR Acquisition BV | | | |
| EUR | 1,250,000 | | | Term Loan, 7.23%, Maturing June 30, 2013 | | | 1,793,420 | | |
| EUR | 3,500,000 | | | Term Loan, 7.23%, Maturing June 30, 2013 | | | 5,021,577 | | |
| EUR | 1,250,000 | | | Term Loan, 7.73%, Maturing June 30, 2014 | | | 1,799,880 | | |
| EUR | 3,500,000 | | | Term Loan, 7.73%, Maturing June 30, 2014 | | | 5,039,664 | | |
See notes to financial statements
32
Floating Rate Portfolio as of October 31, 2007
PORTFOLIO OF INVESTMENTS CONT'D
Principal
Amount* | |
Borrower/Tranche Description | |
Value | |
| Publishing (continued) | | | |
| Yell Group, PLC | | | |
| $ | 21,025,000 | | | Term Loan, 6.75%, Maturing October 27, 2012 | | $ | 20,783,549 | | |
| | | | | | | $ | 628,769,640 | | |
| Radio and Television — 4.5% | | | |
| Block Communications, Inc. | | | |
| $ | 6,980,687 | | | Term Loan, 7.20%, Maturing December 22, 2011 | | $ | 6,736,363 | | |
| Citadel Broadcasting Corp. | | | |
| | 34,925,000 | | | Term Loan, 6.63%, Maturing June 12, 2014 | | | 33,606,581 | | |
| CMP Susquehanna Corp. | | | |
| | 2,000,000 | | | Term Loan, 0.00%, Maturing May 5, 2011(2) | | | 1,950,000 | | |
| | 13,281,204 | | | Term Loan, 7.07%, Maturing May 5, 2012 | | | 12,882,768 | | |
| Cumulus Media, Inc. | | | |
| | 16,534,560 | | | Term Loan, 7.00%, Maturing June 11, 2014 | | | 16,341,651 | | |
| Discovery Communications, Inc. | | | |
| | 10,548,563 | | | Term Loan, 7.20%, Maturing May 14, 2014 | | | 10,434,290 | | |
| Emmis Operating Co. | | | |
| | 6,201,600 | | | Term Loan, 7.20%, Maturing November 1, 2013 | | | 6,069,816 | | |
| Entravision Communications Corp. | | | |
| | 935,754 | | | Term Loan, 6.73%, Maturing March 29, 2013 | | | 921,327 | | |
| Gray Television, Inc. | | | |
| | 10,808,753 | | | Term Loan, 6.73%, Maturing January 19, 2015 | | | 10,448,465 | | |
| HIT Entertainment, Inc. | | | |
| | 3,935,678 | | | Term Loan, 7.17%, Maturing June 1, 2012 | | | 3,861,884 | �� | |
| Local TV Finance, LLC | | | |
| | 1,995,000 | | | Term Loan, 7.31%, Maturing May 7, 2013 | | | 1,940,138 | | |
| NEP II, Inc. | | | |
| | 6,367,980 | | | Term Loan, 7.45%, Maturing February 16, 2014 | | | 6,093,361 | | |
| Nexstar Broadcasting, Inc. | | | |
| | 12,526,588 | | | Term Loan, 6.95%, Maturing October 1, 2012 | | | 12,103,815 | | |
| | 11,863,274 | | | Term Loan, 6.95%, Maturing October 1, 2012 | | | 11,462,888 | | |
| NextMedia Operating, Inc. | | | |
| | 1,688,423 | | | Term Loan, 7.05%, Maturing November 15, 2012 | | | 1,616,665 | | |
| | 750,410 | | | Term Loan, 7.12%, Maturing November 15, 2012 | | | 718,518 | | |
| PanAmSat Corp. | | | |
| | 24,460,656 | | | Term Loan, 7.12%, Maturing January 3, 2014 | | | 24,213,872 | | |
| Paxson Communications Corp. | | | |
| | 17,925,000 | | | Term Loan, 8.49%, Maturing January 15, 2012 | | | 17,745,750 | | |
| Raycom TV Broadcasting, LLC | | | |
| | 13,333,373 | | | Term Loan, 6.31%, Maturing June 25, 2014 | | | 13,000,038 | | |
| SFX Entertainment | | | |
| | 4,878,326 | | | Term Loan, 7.95%, Maturing June 21, 2013 | | | 4,805,151 | | |
| Spanish Broadcasting System, Inc. | | | |
| | 12,907,400 | | | Term Loan, 6.95%, Maturing June 11, 2012 | | | 12,245,896 | | |
| Tyrol Acquisition 2 SAS | | | |
| EUR | 7,300,000 | | | Term Loan, 6.37%, Maturing January 19, 2015 | | | 10,252,685 | | |
| EUR | 7,300,000 | | | Term Loan, 6.62%, Maturing January 19, 2016 | | | 10,296,145 | | |
Principal
Amount* | |
Borrower/Tranche Description | |
Value | |
| Radio and Television (continued) | | | |
| Univision Communications, Inc. | | | |
| $ | 6,125,000 | | | Term Loan, 7.25%, Maturing March 29, 2009 | | $ | 6,086,719 | | |
| | 2,458,054 | | | Term Loan, 0.00%, Maturing September 29, 2014(2) | | | 2,333,615 | | |
| | 63,275,168 | | | Term Loan, 7.20%, Maturing September 29, 2014 | | | 60,071,862 | | |
| Young Broadcasting, Inc. | | | |
| | 8,391,838 | | | Term Loan, 7.87%, Maturing November 3, 2012 | | | 8,056,164 | | |
| | 985,000 | | | Term Loan, 7.87%, Maturing November 3, 2012 | | | 945,600 | | |
| | | | | | | $ | 307,242,027 | | |
| Rail Industries — 0.4% | | | |
| Kansas City Southern Railway Co. | | | |
| $ | 15,010,000 | | | Term Loan, 6.68%, Maturing April 26, 2013 | | $ | 14,751,077 | | |
| | 1,995,000 | | | Term Loan, 7.01%, Maturing April 28, 2013 | | | 1,970,063 | | |
| RailAmerica, Inc. | | | |
| | 13,000,000 | | | Term Loan, 7.81%, Maturing August 14, 2008 | | | 12,821,250 | | |
| | | | | | | $ | 29,542,390 | | |
| Retailers (Except Food and Drug) — 2.1% | | | |
| American Achievement Corp. | | | |
| $ | 5,097,642 | | | Term Loan, 7.48%, Maturing March 25, 2011 | | $ | 4,995,689 | | |
| Amscan Holdings, Inc. | | | |
| | 4,452,625 | | | Term Loan, 7.56%, Maturing May 25, 2013 | | | 4,319,046 | | |
| Claire's Stores, Inc. | | | |
| | 3,042,375 | | | Term Loan, 7.95%, Maturing May 24, 2014 | | | 2,876,471 | | |
| Coinmach Laundry Corp. | | | |
| | 24,897,935 | | | Term Loan, 7.74%, Maturing December 19, 2012 | | | 24,773,446 | | |
| Cumberland Farms, Inc. | | | |
| | 5,940,000 | | | Term Loan, 7.64%, Maturing September 29, 2013 | | | 5,880,600 | | |
| FTD, Inc. | | | |
| | 4,516,398 | | | Term Loan, 6.50%, Maturing July 28, 2013 | | | 4,482,525 | | |
| Harbor Freight Tools USA, Inc. | | | |
| | 11,361,521 | | | Term Loan, 7.29%, Maturing July 15, 2010 | | | 10,933,691 | | |
| Mapco Express, Inc. | | | |
| �� | 3,570,432 | | | Term Loan, 7.74%, Maturing April 28, 2011 | | | 3,512,412 | | |
| Neiman Marcus Group, Inc. | | | |
| | 9,555,758 | | | Term Loan, 7.45%, Maturing April 5, 2013 | | | 9,419,990 | | |
| Orbitz Worldwide, Inc. | | | |
| | 10,750,000 | | | Term Loan, 8.20%, Maturing July 25, 2014 | | | 10,608,906 | | |
| Oriental Trading Co., Inc. | | | |
| | 2,000,000 | | | Term Loan, 10.76%, Maturing January 31, 2013 | | | 1,935,000 | | |
| | 12,520,427 | | | Term Loan, 7.40%, Maturing July 31, 2013 | | | 12,097,862 | | |
| Pep Boys - Manny, Moe, & Jack, (The) | | | |
| | 7,132,620 | | | Term Loan, 7.54%, Maturing January 27, 2011 | | | 7,043,462 | | |
| Rent-A-Center, Inc. | | | |
| | 6,807,813 | | | Term Loan, 7.20%, Maturing November 15, 2012 | | | 6,683,006 | | |
| Rover Acquisition Corp. | | | |
| | 1,980,000 | | | Term Loan, 7.33%, Maturing October 26, 2013 | | | 1,937,925 | | |
See notes to financial statements
33
Floating Rate Portfolio as of October 31, 2007
PORTFOLIO OF INVESTMENTS CONT'D
Principal
Amount* | |
Borrower/Tranche Description | |
Value | |
| Retailers (Except Food and Drug) (continued) | | | |
| Savers, Inc. | | | |
| $ | 2,804,162 | | | Term Loan, 7.99%, Maturing August 11, 2012 | | $ | 2,734,058 | | |
| | 3,044,373 | | | Term Loan, 7.99%, Maturing August 11, 2012 | | | 2,968,264 | | |
| The Yankee Candle Company, Inc. | | | |
| | 9,651,500 | | | Term Loan, 7.20%, Maturing February 6, 2014 | | | 9,404,180 | | |
| Vivarte | | | |
| EUR | 6,688,988 | | | Term Loan, 6.77%, Maturing May 29, 2015 | | | 9,049,479 | | |
| EUR | 247,396 | | | Term Loan, 6.77%, Maturing May 29, 2015 | | | 334,700 | | |
| EUR | 63,616 | | | Term Loan, 6.77%, Maturing May 29, 2015 | | | 86,066 | | |
| EUR | 6,688,988 | | | Term Loan, 7.27%, Maturing May 29, 2016 | | | 9,093,027 | | |
| EUR | 247,396 | | | Term Loan, 7.27%, Maturing May 29, 2016 | | | 336,311 | | |
| EUR | 63,616 | | | Term Loan, 7.27%, Maturing May 29, 2016 | | | 86,480 | | |
| | | | | | | $ | 145,592,596 | | |
| Steel — 0.1% | | | |
| Algoma Acquisition Corp. | | | |
| $ | 1,000,000 | | | Term Loan, Maturing June 20, 2013(3) | | $ | 965,000 | | |
| | 4,264,313 | | | Term Loan, 8.09% Maturing June 20, 2013 | | | 4,115,062 | | |
| | | | | | | $ | 5,080,062 | | |
| Surface Transport — 0.6% | | | |
| Delphi Acquisition Holding, Inc. | | | |
| $ | 1,183,488 | | | Term Loan, 7.57%, Maturing April 10, 2015 | | $ | 1,153,901 | | |
| | 282,788 | | | Term Loan, 7.57%, Maturing April 10, 2015 | | | 275,718 | | |
| | 1,466,276 | | | Term Loan, 8.07%, Maturing April 10, 2016 | | | 1,436,951 | | |
| Oshkosh Truck Corp. | | | |
| | 4,374,089 | | | Term Loan, 7.45%, Maturing December 6, 2013 | | | 4,310,529 | | |
| Ozburn-Hessey Holding Co., LLC | | | |
| | 3,925,495 | | | Term Loan, 8.53%, Maturing August 10, 2012 | | | 3,768,475 | | |
| SIRVA Worldwide, Inc. | | | |
| | 5,866,025 | | | Term Loan, 12.50%, Maturing December 1, 2010 | | | 4,155,099 | | |
| Swift Transportation Co., Inc. | | | |
| | 6,000,000 | | | Term Loan, 8.12%, Maturing May 10, 2012 | | | 5,145,000 | | |
| | 19,927,907 | | | Term Loan, 8.38%, Maturing May 10, 2014 | | | 17,611,288 | | |
| | | | | | | $ | 37,856,961 | | |
| Telecommunications — 3.5% | | | |
| Alaska Communications Systems Holdings, Inc. | | | |
| $ | 2,625,000 | | | Term Loan, 6.95%, Maturing February 1, 2012 | | $ | 2,573,156 | | |
| | 12,150,000 | | | Term Loan, 6.95%, Maturing February 1, 2012 | | | 11,910,038 | | |
| American Cellular Corp. | | | |
| | 3,000,000 | | | Term Loan, 0.00%, Maturing March 15, 2014(2) | | | 2,988,750 | | |
| Asurion Corp. | | | |
| | 20,000,000 | | | Term Loan, 8.36%, Maturing July 13, 2012 | | | 19,593,760 | | |
| | 2,000,000 | | | Term Loan, 11.72%, Maturing January 13, 2013 | | | 1,948,126 | | |
Principal
Amount* | |
Borrower/Tranche Description | |
Value | |
| Telecommunications (continued) | | | |
| BCM Luxembourg, Ltd. | | | |
| EUR | 6,000,000 | | | Term Loan, 6.63%, Maturing September 30, 2014 | | $ | 8,526,091 | | |
| EUR | 6,000,000 | | | Term Loan, 6.88%, Maturing September 30, 2015 | | | 8,573,348 | | |
| Cellular South, Inc. | | | |
| | 2,981,250 | | | Term Loan, 0.00%, Maturing May 29, 2014(2) | | | 2,932,805 | | |
| | 8,921,391 | | | Term Loan, 6.63%, Maturing May 29, 2014 | | | 8,776,418 | | |
| Centennial Cellular Operating Co., LLC | | | |
| | 4,500,000 | | | Revolving Loan, 0.00%, Maturing February 9, 2010(2) | | | 4,297,500 | | |
| | 14,147,788 | | | Term Loan, 7.22%, Maturing February 9, 2011 | | | 14,012,620 | | |
| Cincinnati Bell, Inc. | | | |
| | 2,345,250 | | | Term Loan, 7.02%, Maturing August 31, 2012 | | | 2,311,244 | | |
| Consolidated Communications, Inc. | | | |
| | 21,847,842 | | | Term Loan, 6.95%, Maturing July 27, 2015 | | | 21,779,568 | | |
| Crown Castle Operating Co. | | | |
| | 3,047,125 | | | Term Loan, 6.64%, Maturing January 9, 2014 | | | 2,982,849 | | |
| FairPoint Communications, Inc. | | | |
| | 21,785,000 | | | Term Loan, 7.00%, Maturing February 8, 2012 | | | 21,599,828 | | |
| Hargray Acquisition Co. | | | |
| | 3,665,813 | | | Term Loan, 7.45%, Maturing June 27, 2014 | | | 3,605,099 | | |
| Intelsat Subsidiary Holding Co. | | | |
| | 7,734,217 | | | Term Loan, 7.12%, Maturing July 3, 2013 | | | 7,657,842 | | |
| Iowa Telecommunications Services | | | |
| | 6,998,000 | | | Term Loan, 6.99%, Maturing November 23, 2011 | | | 6,921,463 | | |
| IPC Systems, Inc. | | | |
| | 9,226,875 | | | Term Loan, 7.45%, Maturing May 31, 2014 | | | 8,617,901 | | |
| GBP | 3,448,518 | | | Term Loan, 8.57%, Maturing May 31, 2014 | | | 6,644,405 | | |
| Macquarie UK Broadcast Ventures, Ltd. | | | |
| GBP | 7,050,000 | | | Term Loan, 8.04%, Maturing October 3, 2014 | | | 14,297,491 | | |
| NTelos, Inc. | | | |
| | 12,895,356 | | | Term Loan, 7.01%, Maturing August 24, 2011 | | | 12,774,462 | | |
| Stratos Global Corp. | | | |
| | 7,499,250 | | | Term Loan, 7.95%, Maturing February 13, 2012 | | | 7,374,260 | | |
| Telesat Canada, Inc. | | | |
| | 399,580 | | | Term Loan, Maturing October 22, 2014(3) | | | 396,333 | | |
| | 4,675,082 | | | Term Loan, Maturing October 22, 2014(3) | | | 4,637,097 | | |
| Triton PCS, Inc. | | | |
| | 16,285,998 | | | Term Loan, 8.01%, Maturing November 18, 2009 | | | 16,272,431 | | |
| Windstream Corp. | | | |
| | 13,387,155 | | | Term Loan, Maturing July 17, 2013(3) | | | 13,317,823 | | |
| | | | | | | $ | 237,322,708 | | |
| Utilities — 2.1% | | | |
| AEI Finance Holding, LLC | | | |
| $ | 1,409,088 | | | Revolving Loan, 5.10%, Maturing March 30, 2012 | | $ | 1,380,907 | | |
| | 10,057,136 | | | Term Loan, 8.20%, Maturing March 30, 2014 | | | 9,855,994 | | |
| BRSP, LLC | | | |
| | 14,588,858 | | | Term Loan, 8.38%, Maturing July 13, 2009 | | | 14,406,497 | | |
See notes to financial statements
34
Floating Rate Portfolio as of October 31, 2007
PORTFOLIO OF INVESTMENTS CONT'D
Principal
Amount* | |
Borrower/Tranche Description | |
Value | |
| Utilities (continued) | | | |
| Cogentrix Delaware Holdings, Inc. | | | |
| $ | 4,352,647 | | | Term Loan, 6.26%, Maturing April 14, 2012 | | $ | 4,271,035 | | |
| Covanta Energy Corp. | | | |
| | 5,253,608 | | | Term Loan, 5.10%, Maturing February 9, 2014 | | | 5,117,892 | | |
| | 10,618,035 | | | Term Loan, 6.88%, Maturing February 9, 2014 | | | 10,343,740 | | |
| Elster Group GmbH (Ruhrgas) | | | |
| | 1,250,000 | | | Term Loan, 7.63%, Maturing September 30, 2013 | | | 1,242,969 | | |
| | 1,250,000 | | | Term Loan, 7.88%, Maturing September 30, 2014 | | | 1,249,219 | | |
| LS Power Acquisition Co. | | | |
| | 616,451 | | | Term Loan, 7.19%, Maturing May 1, 2014 | | | 605,663 | | |
| Mirant North America, LLC | | | |
| | 6,201,591 | | | Term Loan, 6.50%, Maturing January 3, 2013 | | | 6,105,336 | | |
| NRG Energy, Inc. | | | |
| | 19,115,997 | | | Term Loan, 0.00%, Maturing June 1, 2014(2) | | | 18,743,923 | | |
| | 14,466,620 | | | Term Loan, 6.85%, Maturing June 1, 2014 | | | 14,187,240 | | |
| | 34,766,114 | | | Term Loan, 6.95%, Maturing June 1, 2014 | | | 34,094,710 | | |
| NSG Holdings, LLC | | | |
| | 306,124 | | | Term Loan, 7.21%, Maturing June 15, 2014 | | | 293,879 | | |
| | 2,647,541 | | | Term Loan, 7.21%, Maturing June 15, 2014 | | | 2,541,640 | | |
| Pike Electric, Inc. | | | |
| | 2,872,755 | | | Term Loan, 6.69%, Maturing July 2, 2012 | | | 2,842,232 | | |
| | 2,184,306 | | | Term Loan, 6.63%, Maturing December 10, 2012 | | | 2,161,098 | | |
| TXU Texas Competitive Electric Holdings Co., LLC | | | |
| | 6,325,000 | | | Term Loan, Maturing October 10, 2014(3) | | | 6,326,967 | | |
| | 6,325,000 | | | Term Loan, Maturing October 10, 2014(3) | | | 6,325,000 | | |
| | | | | | | $ | 142,095,941 | | |
Total Senior Floating-Rate Interests
(identified cost $6,984,602,203) | | $ | 6,885,806,579 | | |
| Corporate Bonds & Notes — 0.7% | | | |
Principal
Amount*
(000's omitted) | | Security | | Value | |
| Cable and Satellite Television — 0.3% | | | |
| Iesy Hessen & ISH NRW, Variable Rate | | | |
| EUR | 13,500 | | | 7.481%, 4/15/13(9) | | $ | 19,238,158 | | |
| | | | | | | $ | 19,238,158 | | |
| Electronics / Electrical — 0.1% | | | |
| NXP BV/NXP Funding, LLC, Variable Rate | | | |
| $ | 6,300 | | | 7.993%, 10/15/13(9) | | $ | 5,992,875 | | |
| | | | | | | $ | 5,992,875 | | |
Principal
Amount*
(000's omitted) | | Security | | Value | |
| Financial Intermediaries — 0.0% | | | |
| Alzette, Variable Rate | | | |
| $ | 1,180 | | | 11.86%, 12/15/20(4)(9) | | $ | 1,162,300 | | |
| | | | | | | $ | 1,162,300 | | |
| Radio and Television — 0.0% | | | |
| Paxson Communications Corp., Variable Rate | | | |
| $ | 3,000 | | | 8.493%, 1/15/12(5)(9) | | $ | 3,022,500 | | |
| | | | | | | $ | 3,022,500 | | |
| Real Estate — 0.2% | | | |
| Assemblies of God, Variable Rate | | | |
| $ | 5,995 | | | 7.708%, 6/15/29(5)(9) | | $ | 5,995,157 | | |
| Sonata Securities S.A., Series 2006-6 | | | |
| | 6,518 | | | 8.91%, 12/28/07(9) | | | 6,518,072 | | |
| | | | | | | $ | 12,513,229 | | |
| Telecommunications — 0.1% | | | |
| Qwest Corp., Sr. Notes, Variable Rate | | | |
| $ | 5,850 | | | 8.944%, 6/15/13(9) | | $ | 6,266,813 | | |
| | | | | | | $ | 6,266,813 | | |
Total Corporate Bonds & Notes
(identified cost $45,391,521) | | $ | 48,195,875 | | |
| Asset Backed Securities — 0.1% | | | |
Principal
Amount*
(000's omitted) | | Security | | Value | |
| Avalon Capital Ltd. 3, Series 1A, Class D, Variable Rate | | | |
| $ | 1,140 | | | 7.449%, 2/24/19(4)(5)(9) | | $ | 1,024,672 | | |
| Babson Ltd., 2005-1A, Class C1, Variable Rate | | | |
| | 1,500 | | | 7.193%, 4/15/19(4)(5)(9) | | | 1,327,585 | | |
| Bryant Park CDO Ltd., Series 2005-1A, Class C, Variable Rate | | | |
| | 1,500 | | | 7.293%, 1/15/19(4)(5)(9) | | | 1,345,428 | | |
| Carlyle High Yield Partners, Series 2004-6A, Class C, Variable Rate | | | |
| | 1,500 | | | 7.95%, 8/11/16(4)(5)(9) | | | 1,395,195 | | |
| Centurion CDO 8 Ltd., Series 2005-8A, Class D, Variable Rate | | | |
| | 1,000 | | | 11.224%, 3/8/17(4)(9) | | | 928,087 | | |
Morgan Stanley Investment Management Croton, Ltd.,
Series 2005-1A, Class D, Variable Rate | | | |
| | 2,000 | | | 7.193%, 1/15/18(4)(5)(9) | | | 1,777,424 | | |
Total Asset Backed Securities
(identified cost $8,581,229) | | $ | 7,798,391 | | |
See notes to financial statements
35
Floating Rate Portfolio as of October 31, 2007
PORTFOLIO OF INVESTMENTS CONT'D
| Common Stocks — 0.0% | | | |
| Shares | | Security | | Value | |
| | 2,484 | | | Environmental Systems Products Holdings, Inc.(4)(6)(7) | | $ | 0 | | |
| | 105,145 | | | Hayes Lemmerz International(6) | | | 488,925 | | |
Total Common Stocks
(identified cost $1,051,450) | | $ | 488,925 | | |
| Preferred Stocks — 0.0% | | | |
| Shares | | Security | | Value | |
| | 2,484 | | | Environmental Systems Products
Holdings Preferred (Series A)(4)(6)(7) | | $ | 43,470 | | |
| | 350 | | | Hayes Lemmerz International(4)(6)(7) | | | 9,423 | | |
Total Preferred Stocks
(identified cost $60,970) | | $ | 52,893 | | |
| Closed-End Investment Companies — 0.0% | | | |
| Shares | | Security | | Value | |
| | 4,000 | | | Pioneer Floating Rate Trust | | $ | 70,960 | | |
Total Closed-End Investment Companies
(identified cost $72,147) | | $ | 70,960 | | |
| Short-Term Investments — 0.0% | | | |
| Description | | Interest
(000's omitted) | | Value | |
| | Investment in Cash Management Portfolio, 4.83%(8) | | | | 428 | | | $ | 427,945 | | |
Total Short-Term Investments
(identified cost $427,945) | | $ | 427,945 | | |
Total Investments — 101.3%
(identified cost $7,040,187,465) | | $ | 6,942,841,568 | | |
Less Unfunded Loan
Commitments — (2.2)% | | $ | (154,156,962 | ) | |
Net Investments — 99.1%
(identified cost $6,886,030,503) | | $ | 6,788,684,606 | | |
| Other Assets, Less Liabilities — 0.9% | | $ | 62,914,937 | | |
| Net Assets — 100.0% | | $ | 6,851,599,543 | | |
DIP - Debtor in Possession
REIT - Real Estate Investment Trust
CHF - Swiss Franc
EUR - Euro
GBP - British Pound
* In U.S. dollars unless otherwise indicated
(1) Senior floating-rate interests often require prepayments from excess cash flows or permit the borrower to repay at its election. The degree to which borrowers repay, whether as a contractual requirement or at their election, cannot be predicted with accuracy. As a result, the actual remaining maturity may be substantially less than the stated maturities shown. However, it is anticipated that the senior floating-rate interests will have an expected average life of approximately two to three years. The stated interest rate represents the weighted average interest rate of all contracts within the senior loan facility. Senior Loans typically have rates of interest which are redetermined either daily, monthly, quarterly or semi-annually by reference to a base lending rate, plus a premium. These base lending rates are primarily the London - -Interbank Offered Rate ("LIBOR"), and secondarily the prime rate offered by one or more major United States banks (the "Prime Rate") and the certificate of deposit ("CD") rate or other base lending rates used by commercial lenders.
(2) Unfunded or partially unfunded loan commitments. See Note 1G for description.
(3) This Senior Loan will settle after October 31, 2007, at which time the interest rate will be determined.
(4) Security valued at fair value using methods determined in good faith by or at the direction of the Trustees.
(5) Security exempt from registration under Rule 144A of the Securities Act of 1933. These securities may be sold in transactions exempt from registration, normally to qualified institutional buyers. At October 31, 2007, the aggregate value of the securities is $15,887,961 or 0.2% of the Portfolio's net assets.
(6) Non-income producing security.
(7) Restricted security.
(8) Affiliated investment company available to Eaton Vance portfolios and funds which invests in high quality U.S. dollar denominated money market instruments. The rate shown is the annualized seven-day yield as of October 31, 2007.
(9) Adjustable rate securities. Rates shown are the rates at period end.
See notes to financial statements
36
Floating-Rate Portfolio as of October 31, 2007
FINANCIAL STATEMENTS
Statement of Assets and Liabilities
As of October 31, 2007
| Assets | |
| Unaffiliated investments, at value (identified cost, $6,885,602,558) | | $ | 6,788,256,661 | | |
| Affiliated investment, at value (identified cost, $427,945) | | | 427,945 | | |
| Cash | | | 29,599,839 | | |
| Foreign currency, at value (identified cost, $17,926,668) | | | 18,143,288 | | |
| Receivable for investments sold | | | 35,399,661 | | |
| Interest and dividends receivable | | | 56,516,188 | | |
| Interest receivable from affiliated investment | | | 366,347 | | |
| Receivable for open swap contracts | | | 1,169,695 | | |
| Receivable for open forward foreign currency exchange contracts | | | 9,162 | | |
| Other assets | | | 723,331 | | |
| Total assets | | $ | 6,930,612,117 | | |
| Liabilities | |
| Payable for investments purchased | | $ | 70,459,964 | | |
| Payable for open forward foreign currency exchange contracts | | | 4,980,382 | | |
| Payable to affiliate for investment advisory fee | | | 2,955,564 | | |
| Payable to affiliate for Trustees' fees | | | 2,969 | | |
| Accrued expenses | | | 613,695 | | |
| Total liabilities | | $ | 79,012,574 | | |
| Net Assets applicable to investors' interest in Portfolio | | $ | 6,851,599,543 | | |
| Sources of Net Assets | |
| Net proceeds from capital contributions and withdrawals | | $ | 6,951,975,020 | | |
| Net unrealized depreciation (computed on the basis of identified cost) | | | (100,375,477 | ) | |
| Total | | $ | 6,851,599,543 | | |
Statement of Operations
For the Year Ended
October 31, 2007
| Investment Income | |
| Interest | | $ | 556,327,909 | | |
| Interest income allocated from affiliated investment | | | 20,864,120 | | |
| Dividends | | | 7,635 | | |
| Expenses allocated from affiliated investment | | | (1,980,779 | ) | |
| Total investment income | | $ | 575,218,885 | | |
| Expenses | |
| Investment adviser fee | | $ | 36,920,634 | | |
| Trustees' fees and expenses | | | 33,450 | | |
| Custodian fee | | | 1,094,512 | | |
| Legal and accounting services | | | 957,110 | | |
| Interest expense | | | 3,318,273 | | |
| Miscellaneous | | | 219,699 | | |
| Total expenses | | $ | 42,543,678 | | |
Deduct —
Reduction of custodian fee | | $ | 115,637 | | |
| Total expense reductions | | $ | 115,637 | | |
| Net expenses | | $ | 42,428,041 | | |
| Net investment income | | $ | 532,790,844 | | |
| Realized and Unrealized Gain (Loss) | |
Net realized gain (loss) —
Investment transactions (identified cost basis) | | $ | 15,722,270 | | |
| Swap contracts | | | 1,605,084 | | |
Foreign currency and forward foreign currency exchange
contract transactions | | | (94,436,072 | ) | |
| Net realized loss | | $ | (77,108,718 | ) | |
Change in unrealized appreciation (depreciation) —
Investments (identified cost basis) | | $ | (134,111,241 | ) | |
| Swap contracts | | | (324,629 | ) | |
Foreign currency and forward foreign currency
exchange contracts | | | 275,377 | | |
| Net change in unrealized appreciation (depreciation) | | $ | (134,160,493 | ) | |
| Net realized and unrealized loss | | $ | (211,269,211 | ) | |
| Net increase in net assets from operations | | $ | 321,521,633 | | |
See notes to financial statements
37
Floating-Rate Portfolio as of October 31, 2007
FINANCIAL STATEMENTS CONT'D
Statements of Changes in Net Assets
Increase (Decrease)
in Net Assets | | Year Ended
October 31, 2007 | | Year Ended
October 31, 2006 | |
From operations —
Net investment income | | $ | 532,790,844 | | | $ | 451,810,783 | | |
Net realized loss from investment
transactions, swap contracts,
and foreign currency and
forward foreign currency
exchange contract transactions | | | (77,108,718 | ) | | | (22,183,786 | ) | |
Net change in unrealized appreciation
(depreciation) from investments,
swap contracts, and foreign
currency and forward foreign
currency exchange contracts | | | (134,160,493 | ) | | | (30,822 | ) | |
| Net increase in net assets from operations | | $ | 321,521,633 | | | $ | 429,596,175 | | |
Capital transactions —
Contributions | | $ | 3,205,618,648 | | | $ | 2,989,478,752 | | |
| Withdrawals | | | (4,106,033,877 | ) | | | (2,494,639,771 | ) | |
Net increase (decrease) in net assets from
capital transactions | | $ | (900,415,229 | ) | | $ | 494,838,981 | | |
| Net increase (decrease) in net assets | | $ | (578,893,596 | ) | | $ | 924,435,156 | | |
| Net Assets | |
| At beginning of year | | $ | 7,430,493,139 | | | $ | 6,506,057,983 | | |
| At end of year | | $ | 6,851,599,543 | | | $ | 7,430,493,139 | | |
See notes to financial statements
38
Floating-Rate Portfolio as of October 31, 2007
FINANCIAL STATEMENTS CONT'D
Supplementary Data
| | | Year Ended October 31, | |
| | | 2007 | | 2006 | | 2005 | | 2004 | | 2003 | |
| Ratios/Supplemental Data | |
| Ratios (As a percentage of average daily net assets): | |
| Expenses before custodian fee reduction | | | 0.58 | % | | | 0.54 | % | | | 0.54 | % | | | 0.56 | % | | | 0.61 | % | |
| Expenses after custodian fee reduction | | | 0.58 | % | | | 0.54 | % | | | 0.54 | % | | | 0.56 | % | | | 0.61 | % | |
| Net investment income | | | 6.94 | % | | | 6.44 | % | | | 4.68 | % | | | 3.27 | % | | | 4.05 | % | |
| Portfolio Turnover | | | 61 | % | | | 50 | % | | | 57 | % | | | 67 | % | | | 64 | % | |
| Total Return | | | 4.62 | % | | | 6.36 | % | | | 4.77 | % | | | 3.93 | % | | | 6.91 | % | |
| Net assets, end of year (000's omitted) | | $ | 6,851,600 | | | $ | 7,430,493 | | | $ | 6,506,058 | | | $ | 5,389,638 | | | $ | 2,217,874 | | |
See notes to financial statements
39
Floating Rate Portfolio as of October 31, 2007
NOTES TO FINANCIAL STATEMENTS
1 Significant Accounting Policies
Floating Rate Portfolio (the Portfolio) is a New York trust, registered under the Investment Company Act of 1940, as amended (the 1940 Act), as a diversified open-end management investment company. The Portfolio's investment objective is to provide a high level of current income. The Portfolio primarily invests in interests of senior floating rate loans. The Declaration of Trust permits the Trustees to issue interests in the Portfolio. At October 31, 2007, the Eaton Vance Floating-Rate Fund, Eaton Vance Floating-Rate & High Income Fund, Eaton Vance Strategic Income Fund, Eaton Vance Medallion Floating-Rate Income Fund, Eaton Vance Diversified Income Fund, Eaton Vance Medallion Strategic Income Fund and Eaton Vance Low Duration Fund held an approximate 65.1%, 17.8%, 5.6%, 6.8%, 2.0%, 1.0% and 0.1% interest in the Portfolio, respectively.
The following is a summary of significant accounting policies of the Portfolio. The policies are in conformity with accounting principles generally accepted in the United States of America.
A Investment Valuation — The Portfolio's investments are primarily in interests in senior floating rate loans (Senior Loans). Interests in Senior Loans for which reliable market quotations are readily available are valued on the basis of prices furnished by an independent pricing service. Other Senior Loans are valued at fair value by the investment adviser under procedures approved by the Trustees. In fair valuing a Senior Loan, the investment adviser utilizes one or more of the following valuation techniques: (i) a matrix pricing approach that considers the yield on the Senior Loan relative to yields on other loan interests issued by companies of comparable credit quality; (ii) a comparison of the value of the borrower's outstanding equity and debt to that of comparable public companies; (iii) a discounted cash flow analysis; or (iv) when the investment adviser believes it is likely that a borrower will be liquidated or sold, an analysis of the terms of such liquidation or sale. In certain cases, the investment adviser will use a combination of analytical methods to determine fair value, such as when only a portion of a borrower's assets are likely to be sold. In conducting its assessment and analyses for purposes of determining fair value of a Senior Loan, the investment adviser will use its discretion and judgment in considering and appraising relevant factors. Fair value determinations are made by the portfolio managers of a Portfolio based on information available to such managers. The portfolio managers of other funds and portfolios managed by Eaton Vance that invest in Senior Loans may not possess the same information about a Senior Loan borrower as the portfolio managers of the Portfolio. At tim es, the fair value of a Senior Loan determined by the portfolio managers of other funds and portfolios managed by Eaton Vance that invest in Senior Loans may vary from the fair value of the same Senior Loan determined by the portfolio managers of the Portfolio. The fair value of each Senior Loan is periodically reviewed and approved by the investment adviser's Valuation Committee and by the Portfolio's Trustees based upon procedures approved by the Trustees. Junior Loans are valued in the same manner as Senior Loans.
Other portfolio securities (other than short-term obligations, but including listed issues) may be valued on the basis of prices furnished by one or more pricing services which determine prices for normal, institutional-size trading units of such securities which may use market information, transactions for comparable securities and various relationships between securities which are generally recognized by institutional traders. Short-term debt securities with a remaining maturity of sixty days or less are valued at amortized cost, which approximates market value. If short-term debt securities are acquired with a remaining maturity of more than sixty days, they will be valued by a pricing service. Over-the-counter options are valued at the mean between the bid and the asked price provided by dealers. Equity securities listed on the NASDAQ Global or Global Select Market are valued at the NASDAQ official closing price. Financial f utures contracts listed on the commodity exchanges and options thereon are valued at closing settlement prices. The value of interest rate swaps are generally based upon a dealer quotation. Credit default swaps are valued by broker-dealer (usually counterparty to the agreement). Repurchase agreements are valued at cost plus accrued interest. Other portfolio securities for which there are no quotations or valuations and investments for which the price of the security is not believed to represent its fair market value, are valued at fair value using methods determined in good faith by or at the direction of the Trustees of the Portfolio. Occasionally, events affecting the value of foreign securities may occur between the time trading is completed abroad and the close of the Exchange which will not be reflected in the computation of the Portfolio's net asset value (unless the Trust deems that such event would materially affect its net asset value in which case an adjustment would be made and reflected in such c omputation). The Portfolio may rely on an independent fair valuation service in making any such adjustment as to the value of a foreign equity security.
40
Floating Rate Portfolio as of October 31, 2007
NOTES TO FINANCIAL STATEMENTS CONT'D
The Portfolio may invest in Cash Management Portfolio (Cash Management), an affiliated investment company managed by BMR. Cash Management values its investment securities utilizing the amortized cost valuation technique permitted by Rule 2a-7 of the 1940 Act. This technique involves initially valuing a portfolio security at its cost and thereafter assuming a constant amortization to maturity of any discount or premium.
B Investment Transactions — Investment transactions for financial statement purposes are accounted for on a trade date basis. Realized gains and losses on investments sold are determined on the basis of identified cost.
C Income — Interest income is recorded on the basis of interest accrued, adjusted for amortization of premium or accretion of discount. Fees associated with loan amendments are recognized immediately. Dividend income is recorded on the ex-dividend date for dividends received in cash and/or securities.
D Federal Taxes — The Portfolio has elected to be treated as a partnership for federal tax purposes. No provision is made by the Portfolio for federal or state taxes on any taxable income of the Portfolio because each investor in the Portfolio is ultimately responsible for the payment of any taxes on its share of taxable income. Since at least one of the Portfolio's investors is a regulated investment company that invests all or substantially all of its assets in the Portfolio, the Portfolio normally must satisfy the applicable source of income and diversification requirements (under the Internal Revenue Code) in order for its investors to satisfy them. The Portfolio will allocate, at least annually among its investors, each investor's distributive share of the Portfolio' s net investment income, net realized capital gains and any other items of income, gain, loss, deduction or credit.
E Expense Reduction — State Street Bank and Trust Company (SSBT) serves as custodian of the Portfolio. Pursuant to the custodian agreement, SSBT receives a fee reduced by credits, which are determined based on the average daily cash balance the Portfolio maintains with SSBT. All credit balances, if any, used to reduce the Portfolio's custodian fees are reported as a reduction of expenses in the Statement of Operations.
F Foreign Currency Translation — Investment valuations, other assets, and liabilities initially expressed in foreign currencies are translated each business day into U.S. dollars based upon current exchange rates. Purchases and sales of foreign investment securities and income and expenses denominated in foreign currency are translated into U.S. dollars based upon currency exchange rates in effect on the respective dates of such transactions. Recognized gains or losses on investment transactions attributable to changes in foreign currency exchange rates are recorded for financial statement purposes as net realized gains and losses on investments. That portion of unrealized gains and losses on investme nts that results from fluctuations in foreign currency exchange rates is not separately disclosed.
G Unfunded Loan Commitments — The Portfolio may enter into certain credit agreements all or a portion of which may be unfunded. The Portfolio is obligated to fund these commitments at the borrower's discretion. These commitments are disclosed in the accompanying Portfolio of Investments.
H Use of Estimates — The preparation of the financial statements in conformity with accounting principles generally accepted in the United States of America requires management to make estimates and assumptions that affect the reported amounts of assets and liabilities at the date of the financial statements and the reported amounts of income and expense during the reporting period. Actual results could differ from those estimates.
I Indemnifications — Under the Portfolio's organizational documents, its officers and Trustees may be indemnified against certain liabilities and expenses arising out of the performance of their duties to the Portfolio. Interestholders in the Portfolio are jointly and severally liable for the liabilities and obligations of the Portfolio in the event that the Portfolio fails to satisfy such liabilities and obligations; provided, however, that, to the extent assets are available in the Portfolio, the Portfolio may, under certain circumstances, indemnify interestholders from and against any claim or liability to which such holder may become subject by reason of being or having been an interestholder in the Portfolio. Additionally, in the normal course of business, the Portfo lio enters into agreements with service providers that may contain indemnification clauses. The Portfolio's maximum exposure under these arrangements is unknown as this would involve future claims that may be made against the Portfolio that have not yet occurred.
J Forward Foreign Currency Exchange Contracts — The Portfolio may enter into forward foreign currency exchange contracts for the purchase or sale of a specific foreign currency at a fixed price on a future date.
41
Floating Rate Portfolio as of October 31, 2007
NOTES TO FINANCIAL STATEMENTS CONT'D
The Portfolio enters into forward contracts for hedging purposes as well as non-hedging purposes. The forward foreign currency exchange contract is adjusted by the daily exchange rate of the underlying currency and any gains or losses are recorded for financial statement purposes as unrealized until such time as the contract has been closed or offset by another contract with the same broker for the same settlement date and currency. Risks may arise upon entering these contracts from the potential inability of counterparties to meet the terms of their contracts and from movements in the value of a foreign currency relative to the U.S. dollar.
K Interest Rate Swaps — The Portfolio may enter into interest rate swap agreements to enhance return, to hedge against fluctuations in securities prices or interest rates, or as substitution for the purchase or sale of securities. Pursuant to these agreements, the Portfolio makes periodic payments at a fixed interest rate and, in exchange, receives payments based on the interest rate of a benchmark industry index. Payments received or made are recorded as realized gains or losses. During the term of the outstanding swap agreement, changes in the underlying value of the swap are recorded as unrealized gains or losses. The value of the swap is determined by changes in the relationship between two rates of interest. The Portfolio is exposed to credit loss in the event of non - -performance by the swap counterparty. Risk may also arise from movements in interest rates.
L Credit Default Swaps — The Portfolio may enter into credit default swap contracts to buy or sell protection against default on an individual issuer or a basket of issuers of bonds. When the Portfolio is the buyer of a credit default swap contract, the Portfolio is entitled to receive the par (or other agreed-upon) value of a referenced debt obligation (or basket of debt obligations) from the counterparty to the contract in the event of a default by a third party, such as a U.S or foreign corporate issuer, on the debt obligation. In return, the Portfolio pays the counterparty a periodic stream of payments over the term of the contract provided that no event of default has occurred. If no default occurs, the Portfolio would have made a stream of payments and received no b enefit from the contract. When the Fund is the seller of a credit default swap contract, it receives the stream of payments, but is obligated to pay upon default of the referenced debt obligation. As the seller, the Fund would effectively adds leverage to its portfolio because, in addition to its total net assets, the Fund is subject to investment exposure on the notional amount of the swap. The interest fee paid or received on the swap contract, which is based on a specified interest rate on a fixed notional amount, is accrued daily as a component of unrealized appreciation (depreciation) and is recorded as realized gain upon receipt or realized loss upon payment. The Fund also records an increase or decrease to unrealized appreciation (depreciation) in an amount equal to the daily valuation. Up-front payment or receipts, if any, are recorded as other assets or other liabilities, respectively, and amortized over the life of the swap con tract as realized gains or losses. The Fund segregates assets in the form of cash and cash equivalents in an amount equal to the aggregate market value of the credit default swap of which it is the seller, marked to market on a daily basis. These transactions involve certain risks, including the risk that the seller may be unable to fulfill the transaction.
2 Investment Adviser Fee and Other Transactions with Affiliates
The investment adviser fee is earned by BMR, as compensation for management and investment advisory services rendered to the Portfolio. Pursuant to the investment advisory agreement, BMR receives a monthly advisory fee at the annual rate of 0.575% of average daily net assets of the Portfolio up to $1 billion and at reduced rates as daily net assets exceed that level. The portion of the advisory fee payable by Cash Management on the Portfolio's investment of cash therein is credited against the Portfolio's advisory fee. For the year ended October 31, 2007, the Portfolio's advisory fee totaled $38,832,438 of which $1,911,804 was allocated from Cash Management and $36,920,634 was paid or accrued directly by the Portfolio. For the year ended October 31, 2007, the Portfolio's advisory fee, including the portion allocated from Cash Management, was 0.506% of the Portfolio's average daily net assets.
Except for Trustees of the Portfolio who are not members of EVM's or BMR's organizations, officers and Trustees receive remuneration for their services to the Portfolio out of the investment advisory fee. Trustees of the Portfolio who are not affiliated with the Investment Adviser may elect to defer receipt of all or a portion of their annual fees in accordance with the terms of the Trustees Deferred Compensation Plan. For the year ended October 31, 2007, no significant amounts have been deferred. Certain officers and Trustees of the Portfolio are officers of the above organizations.
3 Purchases and Sales of Investments
The Portfolio invests primarily in Senior Loans. The ability of the issuers of the Senior Loans to meet their obligations may be affected by economic developments in a specific industry.
42
Floating Rate Portfolio as of October 31, 2007
NOTES TO FINANCIAL STATEMENTS CONT'D
The cost of purchases and proceeds from principal repayments and sales of Senior Loans for the year ended October 31, 2007 aggregated $4,505,269,399, $3,279,747,553 and $1,582,796,906, respectively.
4 Line of Credit
The Portfolio participates with other portfolios and funds managed by EVM and its affiliates in a $1.5 billion unsecured line of credit agreement with a group of banks. Borrowings will be made by the Portfolio solely to facilitate the handling of unusual and/or unanticipated short-term cash requirements. Interest is charged to the Portfolio based on its borrowings at an amount above either the Eurodollar rate or Federal Funds rate. In addition, a fee computed at an annual rate of 0.07% on the daily unused portion of the line of credit is allocated among the participating portfolios and funds at the end of each quarter. As of October 31, 2007, the Portfolio had no borrowings outstanding. Average borrowings and the average interest rate for the year ended October 31, 2007 were $50,191,781 and 5.73%, respectively.
5 Federal Income Tax Unrealized Appreciation (Depreciation)
The cost and unrealized appreciation (depreciation) of investments of the Portfolio at October 31, 2007, as determined on a federal income tax basis, were as follows:
| Aggregate cost | | $ | 6,886,275,054 | | |
| Gross unrealized appreciation | | $ | 65,485,491 | | |
| Gross unrealized depreciation | | | (163,075,939 | ) | |
| Net unrealized depreciation | | $ | (97,590,448 | ) | |
The net unrealized depreciation on October 31, 2007 on swap contracts, foreign currency, and forward foreign currency exchange contracts on a federal income tax basis was $3,029,580.
6 Financial Instruments
The Portfolio may trade in financial instruments with off-balance sheet risk in the normal course of its investing activities to assist in managing exposure to various market risks. These financial instruments may include forward foreign currency contracts, credit default swaps, and interest rate swaps and may involve, to a varying degree, elements of risk in excess of the amounts recognized for financial statement purposes. The notional or contractual amounts of these instruments represent the investment the Portfolio has in particular classes of financial instruments and does not necessarily represent the amounts potentially subject to risk. The measurement of the risks associated with these instruments is meaningful only when all related and offsetting transactions are considered. A summary of obligations under these financial instruments at October 31, 2 007 was as follows:
Forward Foreign Currency Exchange Contracts
| Sales | |
| Settlement Date | | Deliver | | In exchange for | | Net Unrealized
Appreciation
(Depreciation) | |
| 11/1/07 | | British Pound Sterling
74,996 | | United States Dollar
156,067 | | $ | 274 | | |
| 11/30/07 | | British Pound Sterling
135,491,320 | | United States Dollar
278,915,656 | | | (2,303,716 | ) | |
| 11/1/07 | | Euro Dollar
2,734,864 | | United States Dollar
3,965,554 | | | 8,888 | | |
| 11/30/07 | | Euro Dollar
463,100,283 | | United States Dollar
667,721,144 | | | (2,574,559 | ) | |
| 11/30/07 | | Swiss Franc
17,392,583 | | United States Dollar
14,947,218 | | | (87,618 | ) | |
| | | | | | | $ | (4,956,731 | ) | |
| Purchases | |
| Settlement Date | | In exchange for | | Deliver | | Net Unrealized
Depreciation | |
| 11/30/07 | | British Pound Sterling
1,047,960 | | United States Dollar
2,178,846 | | $ | (3,749 | ) | |
| 11/30/07 | | Euro Dollar
3,186,576 | | United States Dollar
4,623,021 | | | (10,740 | ) | |
| | | | | | | $ | (14,489 | ) | |
43
Floating Rate Portfolio as of October 31, 2007
NOTES TO FINANCIAL STATEMENTS CONT'D
Credit Default Swaps
| Counterparty | | Reference
Entity | | Buy/
Sell
Credit | | Notional
Amount
(000's
omitted) | | Pay/
Receive
Annual
Fixed
Rate | | Termination
Date | | Net Unrealized
Appreciation
(Depreciation) | |
| | | Avago | | | | | | | | | | | | | | |
| | |
| Lehman | | Technologies, | | | | | | | | | | | | | | |
| | |
| Brothers, Inc. | | Inc. | | Sell | | $ | 5,000 | | | | 2.10 | % | | 12/20/10 | | $ | 82,691 | | |
| Lehman | | Crown | | | | | | | | | | | | | | |
| | |
| Brothers, Inc. | | Americas, Inc.. | | Sell | | | 10,000 | | | | 2.35 | | | 12/20/09 | | | 309,521 | | |
| Lehman | | CSG Systems, | | | | | | | | | | | | | | |
| | |
| Brothers, Inc. | | Inc. | | Sell | | | 7,000 | | | | 2.15 | | | 9/21/09 | | | 119,157 | | |
| Lehman | | | | | | | | | | | | | | | | |
| | |
| Brothers, Inc. | | Inergy, L.P. | | Sell | | | 6,500 | | | | 2.20 | | | 3/20/10 | | | 182,747 | | |
| Lehman | | | | | | | | | | | | | | | | |
| | |
| Brothers, Inc. | | Inergy, L.P. | | Sell | | | 3,000 | | | | 2.40 | | | 3/20/10 | | | 97,583 | | |
| Lehman | | Owens-Illinois, | | | | | | | | | | | | | | |
| | |
| Brothers, Inc. | | Inc. | | Sell | | | 5,000 | | | | 1.95 | | | 9/20/11 | | | 59,629 | | |
| | | Pinnacle | | | | | | | | | | | | | | |
| | |
| Lehman | | Entertainment, | | | | | | | | | | | | | | |
| | |
| Brothers, Inc. | | Inc. | | Sell | | $ | 3,000 | | | | 2.00 | | | 6/20/10 | | | (7,614 | ) | |
| | | Pinnacle | | | | | | | | | | | | | | |
| | |
| Lehman | | Entertainment, | | | | | | | | | | | | | | |
| | |
| Brothers, Inc. | | Inc. | | Sell | | | 2,000 | | | | 1.95 | | | 9/20/10 | | | (7,038 | ) | |
| Lehman | | Rural Cellular | | | | | | | | | | | | | | |
| | |
| Brothers, Inc. | | Corp. | | Sell | | | 3,000 | | | | 3.25 | | | 6/20/10 | | | 198,052 | | |
| | | Syniverse | | | | | | | | | | | | | | |
| | |
| Lehman | | Technologies, | | | | | | | | | | | | | | |
| | |
| Brothers, Inc. | | Inc. | | Sell | | | 3,000 | | | | 1.85 | | | 3/20/11 | | | (641 | ) | |
| | | Syniverse | | | | | | | | | | | | | | |
| | |
| Lehman | | Technologies, | | | | | | | | | | | | | | |
| | |
| Brothers, Inc. | | Inc. | | Sell | | | 3,000 | | | | 2.30 | | | 6/20/11 | | | 31,743 | | |
| Lehman | | The Hertz | | | | | | | | | | | | | | |
| | |
| Brothers, Inc. | | Corp. | | Sell | | | 5,000 | | | | 1.80 | | | 3/20/11 | | | 103,865 | | |
| Total | | | | | | | | | | | | | | | | $ | 1,169,695 | | |
At October 31, 2007, the Portfolio had sufficient cash and/or securities segregated to cover commitments under these contracts.
7 Restricted Securities
At October 31, 2007, the Portfolio owned the following securities (representing less than 0.1% of net assets) which were restricted as to public resale and not registered under the Securities Act of 1933 (excluding Rule 144A securities). The Portfolio has various registration rights (exercisable under a variety of circumstances) with respect to these securities. The value of these securities is determined based on valuations provided by brokers when available, or if not available, they are valued at fair value using methods determined in good faith by or at the direction of the Trustees.
Restricted Securities
| Description | | Date of
Acquisition | | Shares/Face | | Cost | | Value | |
Common Stocks and
Preferred Stocks | |
Environmental Systems
Products Holdings, Inc. | | 10/25/07 | | | 2,484 | | | $ | 0 | (1) | | $ | 0 | | |
Environmental Systems
Products Holdings
Preferred (Series A) | | 10/25/07 | | | 2,484 | | | $ | 43,470 | | | $ | 43,470 | | |
Hayes Lemmerz
International | | 6/23/03 | | | 350 | | | $ | 17,500 | | | $ | 9,423 | | |
| Total Restricted Security | | | | | | | | $ | 60,970 | | | $ | 52,893 | | |
(1) Less than $0.50.
8 Risks Associated with Foreign Investments
Investing in securities issued by companies whose principal business activities are outside the United States may involve significant risks not present in domestic investments. For example, there is generally less publicly available information about foreign companies, particularly those not subject to the disclosure and reporting requirements of the U.S. securities laws. Certain foreign issuers are generally not bound by uniform accounting, auditing, and financial reporting requirements and standards of practice comparable to those applicable to domestic issuers. Investments in foreign securities also involve the risk of possible adverse changes in investment or exchange control regulations, expropriation or confiscatory taxation, limitation on the removal of funds or other assets of the Portfolio, political or financial instability or diplomatic and other developments which could affect such investments. Foreign stock markets, while growing in volume and sophistication, are generally not as developed as those in the United States, and securities of some foreign issuers (particularly those located in developing countries) may be less liquid and more volatile than securities of comparable U.S. companies. In general, there is less overall governmental supervision and regulation of foreign securities markets, broker-dealers and issuers than in the United States.
44
Floating Rate Portfolio as of October 31, 2007
NOTES TO FINANCIAL STATEMENTS CONT'D
9 Recently Issued Accounting Pronouncements
In June 2006, the Financial Accounting Standards Board (FASB) issued FASB Interpretation No. 48 (FIN 48), "Accounting for Uncertainty in Income Taxes – an interpretation of FASB Statement No. 109". FIN 48 clarifies the accounting for uncertainty in income taxes recognized in accordance with FASB Statement No. 109, "Accounting for Income Taxes". This interpretation prescribes a recognition threshold and measurement attribute for the financial statement recognition and measurement of a tax position taken or expected to be taken in a tax return. It also provides guidance on de-recognition, classification, interest and penalties, accounting in interim periods, disclosure and transition. FIN 48 is effective on the last business day of the first required financial reporting period for fiscal years beginning after December 15, 2006. Management is currently evaluating the impact of applying the various provisions of FIN 48.
In September 2006, the FASB issued Statement of Financial Accounting Standards No. 157 (FAS 157), "Fair Value Measurements". FAS 157 defines fair value, establishes a framework for measuring fair value in accordance with generally accepted accounting principles and expands disclosure about fair value measurements. FAS 157 is effective for fiscal years beginning after November 15, 2007. Management is currently evaluating the impact the adoption of FAS 157 will have on the Portfolio's financial statement disclosures.
45
Floating Rate Portfolio as of October 31, 2007
REPORT OF INDEPENDENT REGISTERED PUBLIC ACCOUNTING FIRM
To the Trustees and Investors
of Floating Rate Portfolio:
We have audited the accompanying statement of assets and liabilities of Floating Rate Portfolio (the Portfolio), including the portfolio of investments, as of October 31, 2007, and the related statement of operations for the year then ended, the statements of changes in net assets for each of the two years in the period then ended, and the supplementary data for each of the five years in the period then ended. These financial statements and supplementary data are the responsibility of the Portfolio's management. Our responsibility is to express an opinion on these financial statements and supplementary data based on our audits.
We conducted our audits in accordance with standards of the Public Company Accounting Oversight Board (United States). Those standards require that we plan and perform the audit to obtain reasonable assurance about whether the financial statements and supplementary data are free of material misstatement. The Portfolio is not required to have, nor were we engaged to perform, an audit of its internal control over financial reporting. Our audits included consideration of internal control over financial reporting as a basis for designing audit procedures that are appropriate in the circumstances, but not for the purpose of expressing an opinion on the effectiveness of the Portfolio's internal control over financial reporting. Accordingly, we express no such opinion. An audit also includes examining, on a test basis, evidence supporting the amounts and disclosures in the financial statements, assessing the accounting principles used and significant estimates made by management, as well as evaluating the overall financial statement presentation. Our procedures included confirmation of securities and senior loans, owned as of October 31, 2007 by correspondence with the custodian, and brokers and selling agent bankers; where replies were not received from brokers and selling agent bankers, we performed other auditing procedures. We believe that our audits provide a reasonable basis for our opinion.
In our opinion, the financial statements and supplementary data referred to above present fairly, in all material respects, the financial position of Floating-Rate Portfolio as of October 31, 2007, the results of its operations for the year then ended, the changes in its net assets for each of the two years in the period then ended, and the supplementary data for each of the five years in the period then ended, in conformity with accounting principles generally accepted in the United States of America.
DELOITTE & TOUCHE LLP
Boston, Massachusetts
December 20, 2007
46
Eaton Vance Floating-Rate & High Income Fund
BOARD OF TRUSTEES' ANNUAL APPROVAL OF THE INVESTMENT ADVISORY AGREEMENTS
Overview of the Contract Review Process
The Investment Company Act of 1940, as amended (the "1940 Act"), provides, in substance, that each investment advisory agreement between a fund and its investment adviser will continue in effect from year to year only if its continuance is approved at least annually by the fund's board of trustees, including by a vote of a majority of the trustees who are not "interested persons" of the fund ("Independent Trustees"), cast in person at a meeting called for the purpose of considering such approval.
At a meeting of the Boards of Trustees (each a "Board") of the Eaton Vance group of mutual funds (the "Eaton Vance Funds") held on April 23, 2007, the Board, including a majority of the Independent Trustees, voted to approve continuation of existing advisory and sub-advisory agreements for the Eaton Vance Funds for an additional one-year period. In voting its approval, the Board relied upon the affirmative recommendation of the Special Committee of the Board, which is a committee comprised exclusively of Independent Trustees. Prior to making its recommendation, the Special Committee reviewed information furnished for a series of meetings of the Special Committee held in February, March and April 2007. Such information included, among other things, the following:
Information about Fees, Performance and Expenses
• An independent report comparing the advisory and related fees paid by each fund with fees paid by comparable funds;
• An independent report comparing each fund's total expense ratio and its components to comparable funds;
• An independent report comparing the investment performance of each fund to the investment performance of comparable funds over various time periods;
• Data regarding investment performance in comparison to relevant peer groups of funds and appropriate indices;
• Comparative information concerning fees charged by each adviser for managing other mutual funds and institutional accounts using investment strategies and techniques similar to those used in managing the fund;
• Profitability analyses for each adviser with respect to each fund;
Information about Portfolio Management
• Descriptions of the investment management services provided to each fund, including the investment strategies and processes employed;
• Information concerning the allocation of brokerage and the benefits received by each adviser as a result of brokerage allocation, including information concerning the acquisition of research through "soft dollar" benefits received in connection with the funds' brokerage, and the implementation of a soft dollar reimbursement program established with respect to the funds;
• Data relating to portfolio turnover rates of each fund;
• The procedures and processes used to determine the fair value of fund assets and actions taken to monitor and test the effectiveness of such procedures and processes;
Information about each Adviser
• Reports detailing the financial results and condition of each adviser;
• Descriptions of the qualifications, education and experience of the individual investment professionals whose responsibilities include portfolio management and investment research for the funds, and information relating to their compensation and responsibilities with respect to managing other mutual funds and investment accounts;
• Copies of the Codes of Ethics of each adviser and its affiliates, together with information relating to compliance with and the administration of such codes;
• Copies of or descriptions of each adviser's proxy voting policies and procedures;
• Information concerning the resources devoted to compliance efforts undertaken by each adviser and its affiliates on behalf of the funds (including descriptions of various compliance programs) and their record of compliance with investment policies and restrictions, including policies with respect to market-timing, late trading and selective portfolio disclosure, and with policies on personal securities transactions;
• Descriptions of the business continuity and disaster recovery plans of each adviser and its affiliates;
Other Relevant Information
• Information concerning the nature, cost and character of the administrative and other non-investment management services provided by Eaton Vance Management and its affiliates;
• Information concerning management of the relationship with the custodian, subcustodians and fund accountants by each adviser or the funds' administrator; and
• The terms of each advisory agreement.
47
Eaton Vance Floating-Rate & High Income Fund
BOARD OF TRUSTEES' ANNUAL APPROVAL OF THE INVESTMENT ADVISORY AGREEMENTS CONT'D
In addition to the information identified above, the Special Committee considered information provided from time to time by each adviser throughout the year at meetings of the Board and its committees. Over the course of the twelve-month period ended April 30, 2007, the Board met ten times and the Special Committee, the Audit Committee and the Governance Committee, each of which is a Committee comprised solely of Independent Trustees, met twelve, fourteen and eight times, respectively. At such meetings, the Trustees received, among other things, presentations by the portfolio managers and other investment professionals of each adviser relating to the investment performance of each fund and the investment strategies used in pursuing the fund's investment objective.
For funds that invest through one or more underlying portfolios, the Board considered similar information about the portfolio(s) when considering the approval of advisory agreements. In addition, in cases where the fund's investment adviser has engaged a sub-adviser, the Board considered similar information about the sub-adviser when considering the approval of any sub-advisory agreement.
The Special Committee was assisted throughout the contract review process by Goodwin Procter LLP, legal counsel for the Independent Trustees. The members of the Special Committee relied upon the advice of such counsel and their own business judgment in determining the material factors to be considered in evaluating each advisory and sub-advisory agreement and the weight to be given to each such factor. The conclusions reached with respect to each advisory and sub-advisory agreement were based on a comprehensive evaluation of all the information provided and not any single factor. Moreover, each member of the Special Committee may have placed varying emphasis on particular factors in reaching conclusions with respect to each advisory and sub-advisory agreement.
Results of the Process
Based on its consideration of the foregoing, and such other information as it deemed relevant, including the factors and conclusions described below, the Special Committee concluded that the continuance of the investment advisory agreements of the Floating Rate Portfolio and the High Income Portfolio, the portfolios in which the Eaton Vance Floating-Rate & High Income Fund (the "Fund") invests (the "Portfolios"), each with Boston Management and Research (the "Adviser"), including their fee structures, is in the interests of shareholders and, therefore, the Special Committee recommended to the Board approval of each agreement. The Board accepted the recommendation of the Special Committee as well as the factors considered and conclusions reached by the Special Committee with respect to each agreement. Accordingly, the Board, including a majority of the Independent Trustees, voted to approve continuation of the investment advi sory agreements for the Portfolios.
Nature, Extent and Quality of Services
In considering whether to approve the investment advisory agreements of the Portfolios, the Board evaluated the nature, extent and quality of services provided to the Portfolios by the Adviser.
The Board considered the Adviser's management capabilities and investment process with respect to the types of investments held by the Portfolios, including the education, experience and number of its investment professionals and other personnel who provide portfolio management, investment research, and similar services to the Portfolios. In particular, the Board evaluated the abilities and experience of such investment personnel in analyzing special considerations relevant to investing in senior secured floating rate loans. For both Portfolios, the Board noted the experience of the Adviser's 30 bank loan investment professionals and other personnel who provide services to the Portfolios, including five portfolio managers and 17 analysts. The Board also took into account the resources dedicated to portfolio management and other services, including the compensation paid to recruit and retain investment personnel, and the time and attention devoted to the Fund and each Portfolio by senior management.
The Board reviewed the compliance programs of the Adviser and relevant affiliates thereof. Among other matters, the Board considered compliance and reporting matters relating to personal trading by investment personnel, selective disclosure of portfolio holdings, late trading, frequent trading, portfolio valuation, business continuity and the allocation of investment opportunities. The Board also evaluated the responses of the Adviser and its affiliates to requests from regulatory authorities such as the Securities and Exchange Commission and the National Association of Securities Dealers.
The Board considered shareholder and other administrative services provided or managed by Eaton Vance Management and its affiliates, including transfer agency and accounting services. The Board evaluated the benefits to shareholders of investing in a fund that is a part of a large family of funds, including the ability, in many cases, to exchange an investment among different funds without incurring additional sales charges.
After consideration of the foregoing factors, among others, the Board concluded that the nature, extent and quality of services provided by the Adviser, taken as a whole, are appropriate and consistent with the terms of the investment advisory agreements.
48
Eaton Vance Floating-Rate & High Income Fund
BOARD OF TRUSTEES' ANNUAL APPROVAL OF THE INVESTMENT ADVISORY AGREEMENTS CONT'D
Fund Performance
The Board compared the Fund's investment performance to a relevant universe of similarly managed funds identified by an independent data provider and appropriate benchmark indices. The Board also considered the performance of the underlying Portfolios. The Board reviewed comparative performance data for the one-, three- and five-year periods ended September 30, 2006 for the Fund. The Board concluded that the Fund's performance was satisfactory.
Management Fees and Expenses
The Board reviewed contractual investment advisory fee rates, including administrative fee rates, payable by the Portfolios and the Fund (referred to collectively as "management fees"). As part of its review, the Board considered the management fees and the Fund's total expense ratio for the year ended September 30, 2006, as compared to a group of similarly managed funds selected by an independent data provider.
After reviewing the foregoing information, and in light of the nature, extent and quality of the services provided by the Adviser, the Board concluded that the management fees charged for advisory and related services and the Fund's total expense ratio are reasonable.
Profitability
The Board reviewed the level of profits realized by the Adviser and relevant affiliates thereof in providing investment advisory and administrative services to the Fund, the Portfolios and to all Eaton Vance Funds as a group. The Board considered the level of profits realized without regard to revenue sharing or other payments by the Adviser and its affiliates to third parties in respect of distribution services. The Board also considered other direct or indirect benefits received by the Adviser and its affiliates in connection with its relationship with the Fund and the Portfolios.
The Board concluded that, in light of the foregoing factors and the nature, extent and quality of the services rendered, the profits realized by the Adviser and its affiliates are reasonable.
Economies of Scale
In reviewing management fees and profitability, the Board also considered the extent to which the Adviser and its affiliates, on the one hand, and the Fund, on the other hand, can expect to realize benefits from economies of scale as the assets of the Fund and the Portfolios increase. The Board acknowledged the difficulty in accurately measuring the benefits resulting from the economies of scale with respect to the management of any specific fund or group of funds. The Board reviewed data summarizing the increases and decreases in the assets of the Fund and of all Eaton Vance Funds as a group over various time periods, and evaluated the extent to which the total expense ratio of the Fund and the profitability of the Adviser and its affiliates may have been affected by such increases or decreases. Based upon the foregoing, the Board concluded that the benefits from economies of scale are currently being shared equitably by the Ad viser and its affiliates and the Fund. The Board also concluded that, assuming reasonably foreseeable increases in the assets of the Portfolios, the structure of the advisory fees, which include breakpoints at several asset levels, can be expected to cause the Adviser and its affiliates and the Fund to continue to share such benefits equitably.
49
Eaton Vance Floating-Rate & High Income Fund
MANAGEMENT AND ORGANIZATION
Fund Management. The Trustees of Eaton Vance Mutual Funds Trust (the Trust), Floating Rate Portfolio (FRP) and High Income Portfolio (HIP) (the Portfolios) are responsible for the overall management and supervision of the Trust's and Portfolios' affairs. The Trustees and officers of the Trust and the Portfolios are listed below. Except as indicated, each individual has held the office shown or other offices in the same company for the last five years. Trustees and officers of the Trust and the Portfolios hold indefinite terms of office. The "noninterested Trustees" consist of those Trustees who are not "interested persons" of the Trust and the Portfolios, as that term is defined under the 1940 Act. The business address of each Trustee and officer is The Eaton Vance Building, 255 State Street, Boston, Massachusetts 02109. As used below, "EVC" refers to Eaton Vance Corp., "EV" refers to Eaton Vance, Inc., "EVM" refers to Eaton Vance Management, "BMR" refers to Boston Management and Research, "Parametric" refers to Parametric Portfolio Associates and "EVD" refers to Eaton Vance Distributors, Inc. EVC and EV are the corporate parent and trustee, respectively, of EVM and BMR. EVD is the Fund's principal underwriter, the Portfolios' placement agent and a wholly-owned subsidiary of EVM. Each officer affiliated with Eaton Vance may hold a position with other Eaton Vance affiliates that is comparable to his or her position with EVM listed below.
Name and
Date of Birth | | Position(s)
with the
Trust and the
Portfolios | | Term of
Office and
Length of
Service | | Principal Occupation(s)
During Past Five Years | | Number of Portfolios
in Fund Complex
Overseen By
Trustee(1) | | Other Directorships Held | |
| Interested Trustee | | | | | | | | | | | | | |
|
| Thomas E. Faust Jr. 5/31/58 | | Trustee and President of
the Trust | | Trustee since 2007 and President of the Trust since 2002 | | Chairman, Chief Executive Officer and President of EVC, President of EV, Chief Executive Officer and President of EVM and BMR, and Director of EVD. Trustee and/or Officer of 176 registered investment companies and 5 private investment companies in the Eaton Vance Fund Complex. Mr. Faust is an interested person because of his positions with EVM, BMR, EVC and EV which are affiliates of the Trust and the Portfolios. | | | 176 | | | Director of EVC | |
|
| Noninterested Trustee(s) | | | | | | | | | | | | | |
|
| Benjamin C. Esty 1/2/63 | | Trustee | | Since 2005 | | Roy and Elizabeth Simmons Professor of Business Administration, Harvard University Graduate School of Business Administration (since 2003). Formerly, Associate Professor, Harvard University Graduate School of Business Administration (2000-2003). | | | 176 | | | None | |
|
| Allen R. Freedman 4/3/40 | | Trustee | | Since 2007 | | Former Chairman and Chief Executive Officer of Assurant, Inc. (insurance provider) (1978-2000). Formerly, a Director of Loring Ward International (fund distributor) (2005-2007). | | | 175 | | | Director of Assurant, Inc. and Stonemor Partners L.P. (owner and operator of cemeteries) | |
|
| William H. Park 9/19/47 | | Trustee | | Since 2003 | | Vice Chairman, Commercial Industrial Finance Corp. (specialty finance company) (since 2006). Formerly, President and Chief Executive Officer, Prizm Capital Management, LLC (investment management firm) (since 2002-2005). | | | 176 | | | None | |
|
| Ronald A. Pearlman 7/10/40 | | Trustee | | Since 2003 | | Professor of Law, Georgetown University Law Center. | | | 176 | | | None | |
|
| Norton H. Reamer 9/21/35 | | Trustee | | Trustee of the Trust since 1986; of FRP since 2000 and of HIP since 1993 | | President, Chief Executive Officer and a Director of Asset Management Finance Corp. (a specialty finance company serving the investment management industry) (since October 2003). President, Unicorn Corporation (an investment and financial advisory services company) (since September 2000). Formerly, Chairman and Chief Operating Officer, Hellman, Jordan Management Co., Inc. (an investment management company) (2000-2003). Formerly, Advisory Director of Berkshire Capital Corporation (investment banking firm) (2002-2003). | | | 176 | | | None | |
|
50
Eaton Vance Floating-Rate & High Income Fund
MANAGEMENT AND ORGANIZATION CONT'D
Name and
Date of Birth | | Position(s)
with the
Trust and the
Portfolios | | Term of
Office and
Length of
Service | | Principal Occupation(s)
During Past Five Years | | Number of Portfolios
in Fund Complex
Overseen By
Trustee(1) | | Other Directorships Held | |
| Noninterested Trustee(s) (continued) | | | | | | | | | | | | | |
|
| Heidi L. Steiger 7/8/53 | | Trustee | | Since 2007 | | President, Lowenhaupt Global Advisors, LLC (global wealth management firm) (since 2005); Formerly, President and Contributing Editor, Worth Magazine (2004); Formerly, Executive Vice President and Global Head of Private Asset Management (and various other positions), Neuberger Berman (investment firm) (1986-2004). | | | 173 | | | Director of Nuclear Electric Insurance Ltd. (nuclear insurance provider) and Aviva USA (insurance provider) | |
|
| Lynn A. Stout 9/14/57 | | Trustee | | Trustee of the Trust and HIP since 1998; of FRP since 2000 | | Paul Hastings Professor of Corporate and Securities Law, University of California at Los Angeles School of Law. | | | 176 | | | None | |
|
| Ralph F. Verni 1/26/43 | | Chairman of
the Board
and Trustee | | Chairman of the Board since 2007 and Trustee since 2005 | | Consultant and private investor. | | | 176 | | | None | |
|
| Principal Officers who are not Trustees | | | | | | | | | | | | | |
|
Name and
Date of Birth | | Position(s)
with the
Trust and the
Portfolios | | Term of
Office and
Length of
Service | | Principal Occupation(s)
During Past Five Years | |
| William H. Ahern, Jr. 7/28/59 | | Vice President
of the Trust | | Since 1995 | | Vice President of EVM and BMR. Officer of 74 registered investment companies managed by EVM or BMR. | |
|
| Cynthia J. Clemson 3/2/63 | | Vice President
of the Trust | | Since 2005 | | Vice President of EVM and BMR. Officer of 89 registered investment companies managed by EVM or BMR. | |
|
| Charles B. Gaffney 12/4/72 | | Vice President
of the Trust | | Since 2007 | | Vice President of EVM and BMR. Previously, Sector Portfolio Manager and Senior Equity Analyst of Brown Brothers Harriman (1997-2003). Officer of 29 registered investment companies managed by EVM or BMR. | |
|
| Thomas P. Huggins 3/7/66 | | Vice President of HIP | | Since 2000 | | Vice President of EVM and BMR. Officer of 4 registered investment companies managed by EVM or BMR. | |
|
| Christine M. Johnston 11/9/72 | | Vice President
of the Trust | | Since 2007 | | Vice President of EVM and BMR. Officer of 34 registered investment companies managed by EVM or BMR. | |
|
| Aamer Khan 6/7/60 | | Vice President
of the Trust | | Since 2005 | | Vice President of EVM and BMR. Officer of 32 registered investment companies managed by EVM or BMR. | |
|
| Thomas H. Luster 4/8/62 | | Vice President
of the Trust | | Since 2006 | | Vice President of EVM and BMR. Officer of 48 registered investment companies managed by EVM or BMR. | |
|
| Michael R. Mach 7/14/47 | | Vice President
of the Trust | | Since 1999 | | Vice President of EVM and BMR. Officer of 54 registered investment companies managed by EVM or BMR. | |
|
| Robert B. MacIntosh 1/22/57 | | Vice President
of the Trust | | Since 1998 | | Vice President of EVM and BMR. Officer of 89 registered investment companies managed by EVM or BMR. | |
|
| Scott H. Page 11/30/59 | | President of FRP | | Since 2007(2) | | Vice President of EVM and BMR. Officer of 15 registered investment companies managed by EVM or BMR. | |
|
| Duncan W. Richardson 10/26/57 | | Vice President
of the Trust | | Since 2001 | | Executive Vice President and Chief Equity Investment Officer of EVC, EVM and BMR. Officer of 80 registered investment companies managed by EVM or BMR. | |
|
| Walter A. Row, III 7/20/57 | | Vice President
of the Trust | | Since 2001 | | Director of Equity Research and a Vice President of EVM and BMR. Officer of
38 registered investment companies managed by EVM or BMR. | |
|
| Craig Russ 10/30/63 | | Vice President of FRP | | Since 2007 | | Vice President of EVM and BMR. Officer of 9 registered investment companies managed by EVM or BMR. | |
|
51
Eaton Vance Floating-Rate & High Income Fund
MANAGEMENT AND ORGANIZATION CONT'D
Name and
Date of Birth | | Position(s)
with the
Trust and the
Portfolios | | Term of
Office and
Length of
Service | | Principal Occupation(s)
During Past Five Years | |
| Principal Officers who are not Trustees (continued) | | | | | | | |
|
| Judith A. Saryan 8/21/54 | | Vice President
of the Trust | | Since 2003 | | Vice President of EVM and BMR. Officer of 53 registered investment companies managed by EVM or BMR. | |
|
| Susan Schiff 3/31/61 | | Vice President
of the Trust | | Since 2002 | | Vice President of EVM and BMR. Officer of 35 registered investment companies managed by EVM or BMR. | |
|
| Thomas Seto 9/27/62 | | Vice President
of the Trust | | Since 2007 | | Vice President and Director of Portfolio Management of Parametric. Officer of
30 registered investment companies managed by EVM or BMR. | |
|
| David M. Stein 5/4/51 | | Vice President
of the Trust | | Since 2007 | | Managing Director and Chief Investment Officer of Parametric. Officer of 30 registered investment companies managed by EVM or BMR. | |
|
| Mark S. Venezia 5/23/49 | | Vice President
of the Trust | | Since 2007 | | Vice President of EVM and BMR. Officer of 35 registered investment companies managed by EVM or BMR. | |
|
| Adam A. Weigold 3/22/75 | | Vice President
of the Trust | | Since 2007 | | Vice President of EVM and BMR. Officer of 70 registered investment companies managed by EVM or BMR. | |
|
| Michael W. Weilheimer 2/11/61 | | President of HIP | | Since 2002 | | Vice President of EVM and BMR. Officer of 25 registered investment companies managed by EVM or BMR. | |
|
| Barbara E. Campbell 6/19/57 | | Treasurer of the Trust | | Since 2005 | | Vice President of EVM and BMR. Officer of 176 registered investment companies managed by EVM or BMR. | |
|
| Maureen A. Gemma 5/24/60 | | Secretary | | Since 2007 | | Vice President and Deputy Chief Legal Officer of EVM and BMR. Officer of
176 registered investment companies managed by EVM or BMR. | |
|
| Dan A. Maalouly 3/25/62 | | Treasurer of the Portfolios | | Since 2005 | | Vice President of EVM and BMR. Previously, Senior Manager at PricewaterhouseCoopers LLP (1997-2005). Officer of 76 registered investment companies managed by EVM or BMR. | |
|
| Paul M. O'Neil 7/11/53 | | Chief Compliance Officer | | Since 2004 | | Vice President of EVM and BMR. Officer of 176 registered investment companies managed by EVM or BMR. | |
|
(1) Includes both master and feeder funds in a master-feeder structure.
(2) Prior to 2007, Mr. Page served as Vice President of FRP since 2000.
The SAI for the Fund includes additional information about the Trustees and officers of the Fund and the Portfolios and can be obtained without charge by calling 1-800-225-6265.
52
Investment Adviser of Floating Rate Portfolio
Boston Management and Research
The Eaton Vance Building
255 State Street
Boston, MA 02109
Administrator of Eaton Vance Floating-Rate & High Income Fund
Eaton Vance Management
The Eaton Vance Building
255 State Street
Boston, MA 02109
Principal Underwriter
Eaton Vance Distributors, Inc.
The Eaton Vance Building
255 State Street
Boston, MA 02109
(617) 482-8260
Custodian
State Street Bank and Trust Company
200 Clarendon Street
Boston, MA 02116
Transfer Agent
PFPC Inc.
Attn: Eaton Vance Funds
P.O. Box 9653
Providence, RI 02940-9653
(800) 262-1122
Independent Registered Public Accounting Firm
Deloitte & Touche LLP
200 Berkeley Street
Boston, MA 02116-5022
Eaton Vance Floating-Rate & High Income Fund
The Eaton Vance Building
255 State Street
Boston, MA 02109
This report must be preceded or accompanied by a current prospectus. Before investing, investors should consider carefully the Fund's investment objective(s), risks, and charges and expenses. The Fund's current prospectus contains this and other information about the Fund and is available through your financial advisor. Please read the prospectus carefully before you invest or send money. For further information please call 1-800-225-6265.
811-12/07 FRHSRC

Annual Report October 31, 2007


EATON VANCE
GOVERNMENT
OBLIGATIONS
FUND
IMPORTANT NOTICES REGARDING PRIVACY,
DELIVERY OF SHAREHOLDER DOCUMENTS,
PORTFOLIO HOLDINGS AND PROXY VOTING
Privacy. The Eaton Vance organization is committed to ensuring your financial privacy. Each of the financial institutions identified below has in effect the following policy ("Privacy Policy") with respect to nonpublic personal information about its customers:
• Only such information received from you, through application forms or otherwise, and information about your Eaton Vance fund transactions will be collected. This may include information such as name, address, social security number, tax status, account balances and transactions.
• None of such information about you (or former customers) will be disclosed to anyone, except as permitted by law (which includes disclosure to employees necessary to service your account). In the normal course of servicing a customer's account, Eaton Vance may share information with unaffiliated third parties that perform various required services such as transfer agents, custodians and broker/dealers.
• Policies and procedures (including physical, electronic and procedural safeguards) are in place that are designed to protect the confidentiality of such information.
• We reserve the right to change our Privacy Policy at any time upon proper notification to you. Customers may want to review our Policy periodically for changes by accessing the link on our homepage: www.eatonvance.com.
Our pledge of privacy applies to the following entities within the Eaton Vance organization: the Eaton Vance Family of Funds, Eaton Vance Management, Eaton Vance Investment Counsel, Boston Management and Research, and Eaton Vance Distributors, Inc.
In addition, our Privacy Policy only applies to those Eaton Vance customers who are individuals and who have a direct relationship with us. If a customer's account (i.e., fund shares) is held in the name of a third-party financial adviser/broker-dealer, it is likely that only such adviser's privacy policies apply to the customer. This notice supersedes all previously issued privacy disclosures.
For more information about Eaton Vance's Privacy Policy, please call 1-800-262-1122.
Delivery of Shareholder Documents. The Securities and Exchange Commission (the "SEC") permits funds to deliver only one copy of shareholder documents, including prospectuses, proxy statements and shareholder reports, to fund investors with multiple accounts at the same residential or post office box address. This practice is often called "householding" and it helps eliminate duplicate mailings to shareholders.
Eaton Vance, or your financial adviser, may household the mailing of your documents indefinitely unless you instruct Eaton Vance, or your financial adviser, otherwise.
If you would prefer that your Eaton Vance documents not be householded, please contact Eaton Vance at 1-800-262-1122, or contact your financial adviser.
Your instructions that householding not apply to delivery of your Eaton Vance documents will be effective within 30 days of receipt by Eaton Vance or your financial adviser.
Portfolio Holdings. Each Eaton Vance Fund and its underlying Portfolio (if applicable) will file a schedule of its portfolio holdings on Form N-Q with the SEC for the first and third quarters of each fiscal year. The Form N-Q will be available on the Eaton Vance website www.eatonvance.com, by calling Eaton Vance at 1-800-262-1122 or in the EDGAR database on the SEC's website at www.sec.gov. Form N-Q may also be reviewed and copied at the SEC's public reference room in Washington, D.C. (call 1-800-732-0330 for information on the operation of the public reference room).
Proxy Voting. From time to time, funds are required to vote proxies related to the securities held by the funds. The Eaton Vance Funds or their underlying Portfolios (if applicable) vote proxies according to a set of policies and procedures approved by the Funds' and Portfolios' Boards. You may obtain a description of these policies and procedures and information on how the Fund or Portfolio voted proxies relating to portfolio securities during the 12 month period ended June 30, without charge, upon request, by calling 1-800-262-1122. This description is also available on the SEC's website at www.sec.gov.
Eaton Vance Government Obligations Fund as of October 31, 2007
MANAGEMENT’S DISCUSSION OF FUND PERFORMANCE

Susan Schiff, CFA
Portfolio Manager
Performance for the Past Year
· The Fund’s Class A shares had a total return of 5.05% for the year ended October 31, 2007.(1) This return resulted from a decrease in net asset value (NAV) per share to $7.16 on October 31, 2007, from $7.20 on October 31, 2006, and the reinvestment of $0.393 in distributions.
· The Fund’s Class B shares had a total return of 4.27% for the year ended October 31, 2007.(1) This return resulted from a decrease in NAV per share to $7.16 on October 31, 2007, from $7.20 on October 31, 2006, and the reinvestment of $0.340 in distributions.
· The Fund’s Class C shares had a total return of 4.27% for the year ended October 31, 2007.(1) This return resulted from a decrease in NAV per share to $7.15 on October 31, 2007, from $7.19 on October 31, 2006, and the reinvestment of $0.340 in distributions.
· The Fund’s Class R shares had a total return of 4.79% for the year ended October 31, 2007.(1) This return resulted from a decrease in NAV per share to $7.13 on October 31, 2007, from $7.17 on October 31, 2006, and the reinvestment of $0.374 in distributions.
· In comparison, the Lehman Brothers Intermediate Government Bond Index – a broad-based, unmanaged market index of intermediate-maturity U.S. Government bonds – had a total return of 6.01% during the year ended October 31, 2007.(2) For comparison, the Fund’s peer group, the Lipper Short-Intermediate U.S. Government Funds Classification, had an average total return of 4.65% for the same period.(2)
Management Discussion
· The Fund currently invests its assets in a separate registered investment company with the same objective and policies as the Fund, Government Obligations Portfolio (the Portfolio). The fiscal year ended October 31, 2007 was marked by some turbulence in the fixed-income markets, exacerbated by continuing problems in the subprime market. Yield spreads for seasoned agency mortgage-backed securities (MBS) over Treasuries widened by approximately 40 basis points (0.40%) in July and August alone, reflecting even larger widenings elsewhere in the fixed-income markets. Amid increasing concerns about the weak housing sector and the potential for a credit squeeze, the Federal Reserve cut its Federal Funds rate – a key short-term interest rate – from 5.25% to 4.50% during September and October, prompting a rally in the short-to-intermediate portion of the yield curve.
· The Portfolio maintained a large position in seasoned fixed-rate MBS and a smaller position in seasoned adjustable-rate MBS during the period. While the Portfolio’s seasoned MBS had no direct exposure to subprime investments or non-agency MBS, they were nonetheless affected by the overall spread widening described above. However, that widening was partially offset by a decline in overall bond yields during the period. With MBS spreads in the 125 basis point range (1.25%) at October 31, 2007, MBS represented, in the view of management, potentially better value than in recent years.(3)
· The Portfolio had no direct subprime investments during the period. In addition, seasoned MBS held by the Portfolio typically have fewer credit issues, as the mortgages – originated in the late 1980s through the mid-1990s – typically are now very well-collateralized and have low loan-to-value ratios. Finally, a significant portion of the Portfolio’s MBS are FHA- or VA-guaranteed, representing full government guarantees as to principal and interest payments, with the remaining MBS backed by Federal National Mortgage Assn. or Federal Home Loan Mortgage Corp.(3)
· Prepayment rates for the Portfolio’s seasoned MBS were slightly lower during the fiscal year, as homeowners were less motivated to refinance their mortgages. The Portfolio’s duration was 3.41 years at October 31, 2007, up from 3.13 years on October 31, 2006. With signs of a weaker economy, management extended duration slightly. Duration is an indicator – stated in years – that measures cash flows and expected maturity of a fixed-income security or portfolio, and is used to determine price sensitivity to changes in interest rates. A longer duration increases the Portfolio’s interest rate exposure.(3)
(1) These returns do not include the 4.75% maximum sales charge for the Fund’s Class A shares or the applicable contingent deferred sales charges (CDSC) for Class B shares and Class C shares. If sales charges were deducted, the returns would be lower. Class R shares are offered to certain investors at NAV. Absent a fee reduction by the investment adviser, the returns would be lower. (2) It is not possible to invest directly in an Index or a Lipper Classification. The Index’s total returns do not reflect the expenses that would have been incurred if an investor individually purchased or sold the securities represented in the Index. The Lipper total return is the average total return, at NAV, of the funds that are in the same Lipper Classification as the Fund. (3) Portfolio investments may not be representative of the Portfolio’s current or future investments and may change due to active management.
The views expressed throughout this report are those of the portfolio manager and are current only through the end of the period of the report as stated on the cover. These views are subject to change at any time based upon market or other conditions, and the investment adviser disclaims any responsibility to update such views. These views may not be relied on as investment advice and, because investment decisions for a fund are based on many factors, may not be relied on as an indication of trading intent on behalf of any Eaton Vance fund.
Fund shares are not insured by the FDIC and are not deposits or other obligations of, or guaranteed by, any depository institution. Shares are subject to investment risks, including possible loss of principal invested.
Past performance is no guarantee of future results. Returns are historical and are calculated by determining the percentage change in net asset value or offering price (as applicable) with all distributions reinvested. Investment return and principal value will fluctuate so that shares, when redeemed, may be worth more or less than their original cost. Performance is for the stated time period only; due to market volatility, the Fund’s current performance may be lower or higher than the quoted return. For performance as of the most recent month end, please refer to www.eatonvance.com.
1
Eaton Vance Government Obligations Fund as of October 31, 2007
FUND PERFORMANCE
The line graph and table set forth below provide information about the Fund’s performance. The line graph compares the performance of Class A of the Fund with that of the Lehman Brothers Intermediate Government Bond Index, a broad-based, unmanaged market index of intermediate-maturity, U.S. Government bonds. The lines on the graph represent the total returns of a hypothetical investment of $10,000 in Class A of the Fund and in the Lehman Brothers Intermediate Government Bond Index. The chart also offers a comparison with the Lipper Short-Intermediate U.S. Government Funds Classification, the Fund’s peer Classification. Class A total returns are presented at net asset value and public offering price. The table includes the total returns of each Class of the Fund at net asset value and public offering price. The performance presented below does not reflect the deduction of taxes, if any, that a shareholder would pay on Fund distributions or the redemption of Fund shares.
Performance(1)
| | Class A | | Class B | | Class C | | Class R | |
Class Share Symbol | | EVGOX | | EMGOX | | ECGOX | | ERGOX | |
| | | | | | | | | |
Average Annual Total Returns (at net asset value) | | | | | | | | | |
One Year | | 5.05 | % | 4.27 | % | 4.27 | % | 4.79 | % |
Five Years | | 2.72 | | 1.94 | | 1.92 | | N.A. | |
Ten Years | | 4.54 | | 3.77 | | 3.72 | | N.A. | |
Life of Fund† | | 7.09 | | 4.13 | | 4.03 | | 3.84 | |
| | | | | | | | | |
SEC Average Annual Total Returns (including sales charge or applicable CDSC) | | | | | | | | | |
One Year | | 0.05 | % | -0.71 | % | 3.28 | % | 4.79 | % |
Five Years | | 1.73 | | 1.64 | | 1.92 | | N.A. | |
Ten Years | | 4.04 | | 3.77 | | 3.72 | | N.A. | |
Life of Fund† | | 6.86 | | 4.13 | | 4.03 | | 3.84 | |
† Inception Dates – Class A: 8/24/84; Class B: 11/1/93; Class C: 11/1/93; Class R: 8/12/05
(1) Average Annual Total Returns do not include the 4.75% maximum sales charge for Class A shares or the applicable contingent deferred sales charges (CDSC) for Class B or Class C shares. If sales charges were deducted, the returns would be lower. Class R shares are offered to certain investors at NAV. SEC Average Annual Total Returns for Class A reflect the maximum 4.75% sales charge. SEC Average Annual Total Returns for Class B reflect applicable CDSC based on the following schedule: 5% - 1st and 2nd years; 4% - 3rd year; 3% - - 4th year; 2% - 5th year; 1% - 6th year. SEC return for Class C reflects a 1% CDSC for the first year. Absent a fee reduction by the investment adviser, the returns would be lower.
Total Annual
Operating Expenses(2) | | Class A | | Class B | | Class C | | Class R | |
| | | | | | | | | |
Gross Expense Ratio | | 1.22 | % | 1.97 | % | 1.97 | % | 1.47 | % |
Net Expense Ratio | | 1.20 | % | 1.95 | % | 1.95 | % | 1.45 | % |
(2) Source: Prospectus dated 3/1/07. The Net Expense Ratio reflects a contractual fee waiver that cannot be terminated or decreased without the approval of the Board of Trustees and shareholders.
Comparison of Change in Value of a $10,000 Investment in Eaton Vance government Obligations Fund Class A vs. the Lehman Brother’s intermediate Government band Index and Lipper Short-Intermediate U.S. Government Funds Classification*
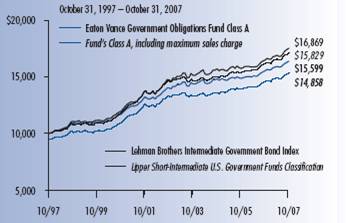
* Sources: Thomson Financial; Bloomberg, L.P. Class A of the Fund commenced operations on 8/24/84.
A $10,000 hypothetical investment at net asset value in Class B shares on 10/31/97, Class C shares on 10/31/97 and Class R shares on 8/12/05 would have been valued at $14,475, $14,412 and $10,872, respectively, on 10/31/07. The Index’s total return does not reflect the expenses that would have been incurred if an investor individually purchased or sold the securities represented in the Index. The Lipper average is the average total return, at NAV, of the funds that are in the same Lipper Classification as the Fund. It is not possible to invest directly in an Index or Classification.
Diversification By Sectors(3)
By total investments
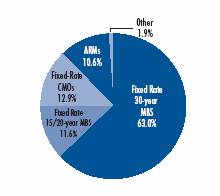
(3) As a percentage of the Portfolio’s total investments as of October 31, 2007. Portfolio information may not be representative of the Portfolio’s current or future investments and may change due to active management.
Past performance is no guarantee of future results. Returns are historical and are calculated by determining the percentage change in net asset value or offering price (as applicable) with all distributions reinvested. Investment return and principal value will fluctuate so that shares, when redeemed, may be worth more or less than their original cost. Performance is for the stated time period only; due to market volatility, the Fund’s current performance may be lower or higher than the quoted return. For performance as of the most recent month end, please refer to www.eatonvance.com.
2
Eaton Vance Government Obligations Fund as of October 31, 2007
FUND EXPENSES
Example: As a shareholder of the Fund, you incur two types of costs: (1) transaction costs, including sales charges (loads) on purchases and redemption fees (if applicable); and (2) ongoing costs, including management fees; distribution or service fees; and other Fund expenses. This Example is intended to help you understand your ongoing costs (in dollars) of investing in the Fund and to compare these costs with the ongoing costs of investing in other mutual funds. The Example is based on an investment of $1,000 invested at the beginning of the period and held for the entire period (May 1, 2007 – October 31, 2007).
Actual Expenses: The first section of the table below provides information about actual account values and actual expenses. You may use the information in this section, together with the amount you invested, to estimate the expenses that you paid over the period. Simply divide your account value by $1,000 (for example, an $8,600 account value divided by $1,000 = 8.6), then multiply the result by the number in the first section under the heading entitled "Expenses Paid During Period" to estimate the expenses you paid on your account during this period.
Hypothetical Example for Comparison Purposes: The second section of the table below provides information about hypothetical account values and hypothetical expenses based on the actual Fund expense ratio and an assumed rate of return of 5% per year (before expenses), which is not the actual return of the Fund. The hypothetical account values and expenses may not be used to estimate the actual ending account balance or expenses you paid for the period. You may use this information to compare the ongoing costs of investing in your Fund and other funds. To do so, compare this 5% hypothetical example with the 5% hypothetical examples that appear in the shareholder reports of the other funds.
Please note that the expenses shown in the table are meant to highlight your ongoing costs only and do not reflect any transactional costs, such as sales charges (loads) or redemption fees (if applicable). Therefore, the second section of the table is useful in comparing ongoing costs only, and will not help you determine the relative total costs of owning different funds. In addition, if these transactional costs were included, your costs would have been higher.
Eaton Vance Government Obligations Fund
| | | Beginning Account Value
(5/1/07) | | Ending Account Value
(10/31/07) | | Expenses Paid During Period*
(5/1/07 – 10/31/07) | |
| Actual | |
| Class A | | $ | 1,000.00 | | | $ | 1,026.70 | | | $ | 6.23 | ** | |
| Class B | | $ | 1,000.00 | | | $ | 1,022.80 | | | $ | 10.04 | ** | |
| Class C | | $ | 1,000.00 | | | $ | 1,021.40 | | | $ | 10.04 | ** | |
| Class R | | $ | 1,000.00 | | | $ | 1,024.00 | | | $ | 7.50 | ** | |
| Hypothetical | |
| (5% return per year before expenses) | |
| Class A | | $ | 1,000.00 | | | $ | 1,019.10 | | | $ | 6.21 | ** | |
| Class B | | $ | 1,000.00 | | | $ | 1,015.30 | | | $ | 10.01 | ** | |
| Class C | | $ | 1,000.00 | | | $ | 1,015.30 | | | $ | 10.01 | ** | |
| Class R | | $ | 1,000.00 | | | $ | 1,017.80 | | | $ | 7.48 | ** | |
* Expenses are equal to the Fund's annualized expense ratio of 1.22% for Class A shares, 1.97% for Class B shares, 1.97% for Class C shares and 1.47% for Class R shares multiplied by the average account value over the period, multiplied by 184/365 (to reflect the one-half year period). The Example assumes that the $1,000 was invested at the net asset value per share determined at the close of business on April 30, 2007. The Example reflects the expenses of both the Fund and the Portfolio.
** Absent a fee reduction by the investment adviser, expenses would be higher.
3
Eaton Vance Government Obligations Fund as of October 31, 2007
FINANCIAL STATEMENTS
Statement of Assets and Liabilities
As of October 31, 2007
| Assets | |
Investment in Government Obligations Portfolio, at value
(identified cost, $524,588,977) | | $ | 525,843,211 | | |
| Receivable for Fund shares sold | | | 557,574 | | |
| Total assets | | $ | 526,400,785 | | |
| Liabilities | |
| Payable for Fund shares redeemed | | $ | 1,526,490 | | |
| Dividends payable | | | 851,974 | | |
| Payable to affiliate for distribution and service fees | | | 289,754 | | |
| Payable to affiliate for Trustees' fees | | | 333 | | |
| Accrued expenses | | | 180,954 | | |
| Total liabilities | | $ | 2,849,505 | | |
| Net Assets | | $ | 523,551,280 | | |
| Sources of Net Assets | |
| Paid-in capital | | $ | 744,739,112 | | |
Accumulated net realized loss from Portfolio (computed on
the basis of identified cost) | | | (221,590,092 | ) | |
| Accumulated distributions in excess of net investment income | | | (851,974 | ) | |
Net unrealized appreciation from Portfolio (computed on the basis of
identified cost) | | | 1,254,234 | | |
| Total | | $ | 523,551,280 | | |
| Class A Shares | |
| Net Assets | | $ | 245,687,314 | | |
| Shares Outstanding | | | 34,319,884 | | |
Net Asset Value and Redemption Price Per Share
(net assets ÷ shares of beneficial interest outstanding) | | $ | 7.16 | | |
Maximum Offering Price Per Share
(100 ÷ 95.25 of $7.16) | | $ | 7.52 | | |
| Class B Shares | |
| Net Assets | | $ | 162,159,309 | | |
| Shares Outstanding | | | 22,648,788 | | |
Net Asset Value and Offering Price Per Share*
(net assets ÷ shares of beneficial interest outstanding) | | $ | 7.16 | | |
| Class C Shares | |
| Net Assets | | $ | 115,459,816 | | |
| Shares Outstanding | | | 16,146,977 | | |
Net Asset Value and Offering Price Per Share*
(net assets ÷ shares of beneficial interest outstanding) | | $ | 7.15 | | �� |
| Class R Shares | |
| Net Assets | | $ | 244,841 | | |
| Shares Outstanding | | | 34,330 | | |
Net Asset Value, Offering Price and Redemption Price Per Share
(net assets ÷ shares of beneficial interest outstanding) | | $ | 7.13 | | |
| On sales of $25,000 or more, the offering price of Class A shares is reduced. | |
* Redemption price per share is equal to the net asset value less any applicable contingent deferred sales charge.
Statement of Operations
For the Year Ended
October 31, 2007
| Investment Income | |
| Interest allocated from Portfolio | | $ | 29,572,135 | | |
| Expenses allocated from Portfolio | | | (4,373,170 | ) | |
| Net investment income from Portfolio | | $ | 25,198,965 | | |
| Expenses | |
| Trustees' fees and expenses | | $ | 3,743 | | |
Distribution and service fees
Class A | | | 611,778 | | |
| Class B | | | 1,845,900 | | |
| Class C | | | 1,166,611 | | |
| Class R | | | 1,098 | | |
| Transfer and dividend disbursing agent fees | | | 642,801 | | |
| Printing and postage | | | 89,458 | | |
| Registration fees | | | 66,792 | | |
| Legal and accounting services | | | 57,204 | | |
| Custodian fee | | | 35,314 | | |
| Miscellaneous | | | 11,456 | | |
| Total expenses | | $ | 4,532,155 | | |
| Net investment income | | $ | 20,666,810 | | |
Realized and Unrealized
Gain (Loss) from Portfolio | |
Net realized gain (loss) —
Investment transactions (identified cost basis) | | $ | (92,996 | ) | |
| Financial futures contracts | | | 685,066 | | |
| Net realized gain | | $ | 592,070 | | |
Change in unrealized appreciation (depreciation) —
Investments (identified cost basis) | | $ | 2,658,966 | | |
| Financial futures contracts | | | 149,592 | | |
| Net change in unrealized appreciation (depreciation) | | $ | 2,808,558 | | |
| Net realized and unrealized gain | | $ | 3,400,628 | | |
| Net increase in net assets from operations | | $ | 24,067,438 | | |
See notes to financial statements
4
Eaton Vance Government Obligations Fund as of October 31, 2007
FINANCIAL STATEMENTS CONT'D
Statements of Changes in Net Assets
Increase (Decrease)
in Net Assets | | Year Ended
October 31, 2007 | | Year Ended
October 31, 2006 | |
From operations —
Net investment income | | $ | 20,666,810 | | | $ | 21,638,484 | | |
Net realized gain from investment
transactions and financial
futures contracts | | | 592,070 | | | | 2,428,864 | | |
Net change in unrealized
appreciation (depreciation)
from investments and
financial futures contracts | | | 2,808,558 | | | | (38,275 | ) | |
| Net increase in net assets from operations | | $ | 24,067,438 | | | $ | 24,029,073 | | |
Distributions to shareholders —
From net investment income
Class A | | $ | (13,358,253 | ) | | $ | (15,568,109 | ) | |
| Class B | | | (8,706,645 | ) | | | (12,880,618 | ) | |
| Class C | | | (5,508,440 | ) | | | (7,901,783 | ) | |
| Class R | | | (11,417 | ) | | | (5,156 | ) | |
Tax return of capital
Class A | | | (63,516 | ) | | | (709,824 | ) | |
| Class B | | | (47,861 | ) | | | (670,288 | ) | |
| Class C | | | (30,301 | ) | | | (410,475 | ) | |
| Class R | | | (57 | ) | | | (282 | ) | |
| Total distributions to shareholders | | $ | (27,726,490 | ) | | $ | (38,146,535 | ) | |
Transactions in shares of beneficial interest —
Proceeds from sale of shares
Class A | | $ | 54,748,746 | | | $ | 41,089,168 | | |
| Class B | | | 9,336,024 | | | | 6,411,194 | | |
| Class C | | | 23,087,184 | | | | 13,857,350 | | |
| Class R | | | 138,431 | | | | 293,484 | | |
Net asset value of shares issued to
shareholders in payment of
distributions declared
Class A | | | 7,984,409 | | | | 9,120,793 | | |
| Class B | | | 4,862,045 | | | �� | 7,275,805 | | |
| Class C | | | 2,865,786 | | | | 4,138,553 | | |
| Class R | | | 11,459 | | | | 5,438 | | |
Cost of shares redeemed
Class A | | | (77,852,552 | ) | | | (92,544,876 | ) | |
| Class B | | | (55,971,358 | ) | | | (75,976,705 | ) | |
| Class C | | | (39,660,593 | ) | | | (66,912,717 | ) | |
| Class R | | | (138,288 | ) | | | (67,280 | ) | |
Net asset value of shares exchanged
Class A | | | 10,603,172 | | | | 7,553,835 | | |
| Class B | | | (10,603,172 | ) | | | (7,553,835 | ) | |
Net decrease in net assets from Fund
share transactions | | $ | (70,588,707 | ) | | $ | (153,309,793 | ) | |
| Net decrease in net assets | | $ | (74,247,759 | ) | | $ | (167,427,255 | ) | |
| Net Assets | | Year Ended
October 31, 2007 | | Year Ended
October 31, 2006 | |
| At beginning of year | | $ | 597,799,039 | | | $ | 765,226,294 | | |
| At end of year | | $ | 523,551,280 | | | $ | 597,799,039 | | |
Accumulated distributions
in excess of net investment
income included in net assets | |
| At end of year | | $ | (851,974 | ) | | $ | (1,140,325 | ) | |
See notes to financial statements
5
Eaton Vance Government Obligations Fund as of October 31, 2007
FINANCIAL STATEMENTS CONT'D
Financial Highlights
| | | Class A | |
| | | Year Ended October 31, | | Period Ended | | Year Ended December 31, | |
| | | 2007(1) | | 2006(1) | | 2005(1) | | October 31, 2004(1)(2) | | 2003(1) | | 2002(1) | |
| Net asset value — Beginning of period | | $ | 7.200 | | | $ | 7.340 | | | $ | 7.740 | | | $ | 8.050 | | | $ | 8.620 | | | $ | 8.580 | | |
| Income (loss) from operations | |
| Net investment income | | $ | 0.300 | | | $ | 0.266 | | | $ | 0.212 | | | $ | 0.215 | | | $ | 0.159 | | | $ | 0.346 | | |
| Net realized and unrealized gain (loss) | | | 0.053 | | | | 0.037 | | | | (0.090 | ) | | | (0.065 | ) | | | (0.177 | ) | | | 0.298 | | |
| Total income (loss) from operations | | $ | 0.353 | | | $ | 0.303 | | | $ | 0.122 | | | $ | 0.150 | | | $ | (0.018 | ) | | $ | 0.644 | | |
| Less distributions | |
| From net investment income | | $ | (0.391 | ) | | $ | (0.424 | ) | | $ | (0.519 | ) | | $ | (0.460 | ) | | $ | (0.548 | ) | | $ | (0.581 | ) | |
| From tax return of capital | | | (0.002 | ) | | | (0.019 | ) | | | (0.003 | ) | | | — | | | | (0.004 | ) | | | (0.023 | ) | |
| Total distributions | | $ | (0.393 | ) | | $ | (0.443 | ) | | $ | (0.522 | ) | | $ | (0.460 | ) | | $ | (0.552 | ) | | $ | (0.604 | ) | |
| Net asset value — End of period | | $ | 7.160 | | | $ | 7.200 | | | $ | 7.340 | | | $ | 7.740 | | | $ | 8.050 | | | $ | 8.620 | | |
| Total Return(3) | | | 5.05 | % | | | 4.28 | % | | | 2.03 | %(4) | | | 1.91 | %(7) | | | (0.35 | )% | | | 7.84 | % | |
| Ratios/Supplemental Data | |
| Net assets, end of period (000's omitted) | | $ | 245,687 | | | $ | 251,751 | | | $ | 291,931 | | | $ | 354,083 | | | $ | 435,022 | | | $ | 474,595 | | |
| Ratios (As a percentage of average daily net assets): | |
| Expenses before custodian fee reduction(5) | | | 1.22 | % | | | 1.20 | % | | | 1.18 | % | | | 1.13 | %(6) | | | 1.06 | % | | | 1.11 | % | |
| Expenses after custodian fee reduction(5) | | | 1.22 | % | | | 1.20 | % | | | 1.18 | % | | | 1.13 | %(6) | | | 1.06 | % | | | 1.11 | % | |
| Net investment income | | | 4.19 | % | | | 3.69 | % | | | 2.82 | % | | | 3.27 | %(6) | | | 1.90 | % | | | 4.03 | % | |
| Portfolio Turnover of the Portfolio | | | 23 | % | | | 2 | % | | | 30 | % | | | 5 | % | | | 67 | % | | | 41 | % | |
(1) Net investment income per share was computed using average shares outstanding.
(2) For the ten-month period ended October 31, 2004.
(3) Returns are historical and are calculated by determining the percentage change in net asset value with all distributions reinvested.
(4) Total return reflects an increase of 0.31% due to the change in timing of payment and reinvestment of distributions.
(5) Includes the Fund's share of the Portfolio's allocated expenses.
(6) Annualized.
(7) Not annualized.
See notes to financial statements
6
Eaton Vance Government Obligations Fund as of October 31, 2007
FINANCIAL STATEMENTS CONT'D
Financial Highlights
| | | Class B | |
| | | Year Ended October 31, | | Period Ended | | Year Ended December 31, | |
| | | 2007(1) | | 2006(1) | | 2005(1) | | October 31, 2004(1)(2) | | 2003(1) | | 2002(1) | |
| Net asset value — Beginning of period | | $ | 7.200 | | | $ | 7.340 | | | $ | 7.740 | | | $ | 8.040 | | | $ | 8.610 | | | $ | 8.570 | | |
| Income (loss) from operations | |
| Net investment income | | $ | 0.247 | | | $ | 0.213 | | | $ | 0.156 | | | $ | 0.166 | | | $ | 0.096 | | | $ | 0.282 | | |
| Net realized and unrealized gain (loss) | | | 0.053 | | | | 0.035 | | | | (0.094 | ) | | | (0.060 | ) | | | (0.179 | ) | | | 0.297 | | |
| Total income (loss) from operations | | $ | 0.300 | | | $ | 0.248 | | | $ | 0.062 | | | $ | 0.106 | | | $ | (0.083 | ) | | $ | 0.579 | | |
| Less distributions | |
| From net investment income | | $ | (0.338 | ) | | $ | (0.369 | ) | | $ | (0.459 | ) | | $ | (0.406 | ) | | $ | (0.483 | ) | | $ | (0.512 | ) | |
| From tax return of capital | | | (0.002 | ) | | | (0.019 | ) | | | (0.003 | ) | | | — | | | | (0.004 | ) | | | (0.027 | ) | |
| Total distributions | | $ | (0.340 | ) | | $ | (0.388 | ) | | $ | (0.462 | ) | | $ | (0.406 | ) | | $ | (0.487 | ) | | $ | (0.539 | ) | |
| Net asset value — End of period | | $ | 7.160 | | | $ | 7.200 | | | $ | 7.340 | | | $ | 7.740 | | | $ | 8.040 | | | $ | 8.610 | | |
| Total Return(3) | | | 4.27 | % | | | 3.50 | % | | | 1.15 | %(4) | | | 1.35 | %(7) | | | (1.03 | )% | | | 7.00 | % | |
| Ratios/Supplemental Data | |
| Net assets, end of period (000's omitted) | | $ | 162,159 | | | $ | 215,850 | | | $ | 291,079 | | | $ | 390,836 | | | $ | 555,947 | | | $ | 583,804 | | |
| Ratios (As a percentage of average daily net assets): | |
| Expenses before custodian fee reduction(5) | | | 1.97 | % | | | 1.95 | % | | | 1.93 | % | | | 1.88 | %(6) | | | 1.81 | % | | | 1.86 | % | |
| Expenses after custodian fee reduction(5) | | | 1.97 | % | | | 1.95 | % | | | 1.93 | % | | | 1.88 | %(6) | | | 1.81 | % | | | 1.86 | % | |
| Net investment income | | | 3.45 | % | | | 2.95 | % | | | 2.07 | % | | | 2.52 | %(6) | | | 1.15 | % | | | 3.29 | % | |
| Portfolio Turnover of the Portfolio | | | 23 | % | | | 2 | % | | | 30 | % | | | 5 | % | | | 67 | % | | | 41 | % | |
(1) Net investment income per share was computed using average shares outstanding.
(2) For the ten-month period ended October 31, 2004.
(3) Returns are historical and are calculated by determining the percentage change in net asset value with all distributions reinvested.
(4) Total return reflects an increase of 0.24% due to the change in timing of payment and reinvestment of distributions.
(5) Includes the Fund's share of the Portfolio's allocated expenses.
(6) Annualized.
(7) Not annualized.
See notes to financial statements
7
Eaton Vance Government Obligations Fund as of October 31, 2007
FINANCIAL STATEMENTS CONT'D
Financial Highlights
| | | Class C | |
| | | Year Ended October 31, | | Period Ended | | Year Ended December 31, | |
| | | 2007(1) | | 2006(1) | | 2005(1) | | October 31, 2004(1)(2) | | 2003(1) | | 2002(1) | |
| Net asset value — Beginning of period | | $ | 7.190 | | | $ | 7.340 | | | $ | 7.730 | | | $ | 8.040 | | | $ | 8.610 | | | $ | 8.570 | | |
| Income (loss) from operations | |
| Net investment income | | $ | 0.247 | | | $ | 0.157 | | | $ | 0.157 | | | $ | 0.166 | | | $ | 0.096 | | | $ | 0.282 | | |
| Net realized and unrealized gain (loss) | | | 0.053 | | | | (0.085 | ) | | | (0.085 | ) | | | (0.070 | ) | | | (0.179 | ) | | | 0.297 | | |
| Total income (loss) from operations | | $ | 0.300 | | | $ | 0.238 | | | $ | 0.072 | | | $ | 0.096 | | | $ | (0.083 | ) | | $ | 0.579 | | |
| Less distributions | |
| From net investment income | | $ | (0.338 | ) | | $ | (0.369 | ) | | $ | (0.459 | ) | | $ | (0.406 | ) | | $ | (0.483 | ) | | $ | (0.512 | ) | |
| From tax return of capital | | | (0.002 | ) | | | (0.019 | ) | | | (0.003 | ) | | | — | | | | (0.004 | ) | | | (0.027 | ) | |
| Total distributions | | $ | (0.340 | ) | | $ | (0.388 | ) | | $ | (0.462 | ) | | $ | (0.406 | ) | | $ | (0.487 | ) | | $ | (0.539 | ) | |
| Net asset value — End of period | | $ | 7.150 | | | $ | 7.190 | | | $ | 7.340 | | | $ | 7.730 | | | $ | 8.040 | | | $ | 8.610 | | |
| Total Return(3) | | | 4.27 | % | | | 3.36 | % | | | 1.16 | %(4) | | | 1.22 | %(7) | | | (1.02 | )% | | | 6.99 | % | |
| Ratios/Supplemental Data | |
| Net assets, end of period (000's omitted) | | $ | 115,460 | | | $ | 129,963 | | | $ | 182,214 | | | $ | 272,000 | | | $ | 436,960 | | | $ | 472,515 | | |
| Ratios (As a percentage of average daily net assets): | |
| Expenses before custodian fee reduction(5) | | | 1.97 | % | | | 1.95 | % | | | 1.93 | % | | | 1.88 | %(6) | | | 1.81 | % | | | 1.85 | % | |
| Expenses after custodian fee reduction(5) | | | 1.97 | % | | | 1.95 | % | | | 1.93 | % | | | 1.88 | %(6) | | | 1.81 | % | | | 1.85 | % | |
| Net investment income | | | 3.45 | % | | | 2.95 | % | | | 2.08 | % | | | 2.52 | %(6) | | | 1.15 | % | | | 3.29 | % | |
| Portfolio Turnover of the Portfolio | | | 23 | % | | | 2 | % | | | 30 | % | | | 5 | % | | | 67 | % | | | 41 | % | |
(1) Net investment income per share was computed using average shares outstanding.
(2) For the ten-month period ended October 31, 2004.
(3) Returns are historical and are calculated by determining the percentage change in net asset value with all distributions reinvested.
(4) Total return reflects an increase of 0.11% due to the change in timing of payment and reinvestment of distributions.
(5) Includes the Fund's share of the Portfolio's allocated expenses.
(6) Annualized.
(7) Not annualized.
See notes to financial statements
8
Eaton Vance Government Obligations Fund as of October 31, 2007
FINANCIAL STATEMENTS CONT'D
Financial Highlights
| | | Class R | |
| | | Year Ended October 31, | | Period Ended | |
| | | 2007(1) | | 2006(1) | | October 31, 2005(1)(2) | |
| Net asset value — Beginning of period | | $ | 7.170 | | | $ | 7.320 | | | $ | 7.430 | | |
| Income (loss) from operations | |
| Net investment income | | $ | 0.280 | | | $ | 0.214 | | | $ | 0.083 | | |
| Net realized and unrealized gain (loss) | | | 0.054 | | | | 0.060 | | | | (0.091 | ) | |
| Total income (loss) from operations | | $ | 0.334 | | | $ | 0.274 | | | $ | (0.008 | ) | |
| Less distributions | |
| From net investment income | | $ | (0.372 | ) | | $ | (0.405 | ) | | $ | (0.099 | ) | |
| From tax return of capital | | | (0.002 | ) | | | (0.019 | ) | | | (0.003 | ) | |
| Total distributions | | $ | (0.374 | ) | | $ | (0.424 | ) | | $ | (0.102 | ) | |
| Net asset value — End of period | | $ | 7.130 | | | $ | 7.170 | | | $ | 7.320 | | |
| Total Return(3) | | | 4.79 | % | | | 3.87 | % | | | (0.12 | )%(6) | |
| Ratios/Supplemental Data | |
| Net assets, end of year (000's omitted) | | $ | 245 | | | $ | 235 | | | $ | 2 | | |
| Ratios (As a percentage of average daily net assets): | | | | | | | | | | | | | |
| Expenses before custodian fee reduction(4) | | | 1.47 | % | | | 1.45 | % | | | 1.43 | %(5) | |
| Expenses after custodian fee reduction(4) | | | 1.47 | % | | | 1.45 | % | | | 1.43 | %(5) | |
| Net investment income | | | 3.93 | % | | | 3.01 | % | | | 4.57 | %(5) | |
| Portfolio Turnover of the Portfolio | | | 23 | % | | | 2 | % | | | 30 | % | |
(1) Net investment income per share was computed using average shares outstanding.
(2) For the period from the commencement of operations, August 12, 2005, to October 31, 2005.
(3) Returns are historical and are calculated by determining the percentage change in net asset value with all distributions reinvested.
(4) Includes the Fund's share of the Portfolio's allocated expenses.
(5) Annualized.
(6) Not annualized.
See notes to financial statements
9
Eaton Vance Government Obligations Fund as of October 31, 2007
NOTES TO FINANCIAL STATEMENTS
1 Significant Accounting Policies
Eaton Vance Government Obligations Fund (the Fund) is a diversified series of Eaton Vance Mutual Funds Trust (the Trust). The Trust is a Massachusetts business trust registered under the Investment Company Act of 1940, as amended (the 1940 Act), as an open-end management investment company. The Fund offers four classes of shares. Class A shares are generally sold subject to a sales charge imposed at time of purchase. Class B and Class C shares are sold at net asset value and are subject to a contingent deferred sales charge (see Note 5). Class B shares automatically convert to Class A shares eight years after their purchase as described in the Fund's prospectus. Class R shares are offered at net asset value and are not subject to an initial sales charge. Each class represents a pro-rata interest in the Fund, but votes separately on class-specific matters and (as noted below) is subject to different expenses. Realized and unreali zed gains and losses are allocated daily to each class of shares based on the relative net assets of each class to the total net assets of the Fund. Net investment income, other than class-specific expenses, is allocated daily to each class of shares based upon the ratio of the value of each class's paid shares to the total value of all paid shares. Each class of shares differs in its distribution plan and certain other class-specific expenses. The Fund invests all of its investable assets in interests in the Government Obligations Portfolio (the Portfolio), a New York trust, having the same investment objective and policies as the Fund. The value of the Fund's investment in the Portfolio reflects the Fund's proportionate interest in the net assets of the Portfolio (76.5% at October 31, 2007). The performance of the Fund is directly affected by the performance of the Portfolio. The financial statements of the Portfolio, including the portfolio of investments, are included elsewhere in this report and should be read in conjunction with the Fund's financial statements.
The following is a summary of significant accounting policies of the Fund. The policies are in conformity with accounting principles generally accepted in the United States of America.
A Investment Valuation — Valuation of securities by the Portfolio is discussed in Note 1A of the Portfolio's Notes to Financial Statements, which are included elsewhere in this report.
B Income — The Fund's net investment income or loss consists of the Fund's pro-rata share of the net investment income or loss of the Portfolio, less all actual and accrued expenses of the Fund.
C Federal Taxes — The Fund's policy is to comply with the provisions of the Internal Revenue Code applicable to regulated investment companies and to distribute to shareholders each year substantially all of its net investment income and all or substantially all of its net realized capital gains. Accordingly, no provision for federal income or excise tax is necessary. At October 31, 2007, the Fund, for federal income tax purposes, had a capital loss carryforward of $218,037,131 which will reduce the taxable income arising from future net realized gains on investment transactions, if any, to the extent permitted by the Internal Revenue Code, and thus will reduce the amount of distributions to shareholders which would otherwise be necessary to relieve the Fund of any liabil ity for federal income tax or excise tax. The capital loss carryforward will expire on October 31, 2008 ($4,071,870), October 31, 2010 ($21,056,795), October 31, 2011 ($78,339,789), October 31, 2012 ($67,101,638), October 31, 2013 ($23,607,593), October 31, 2014 ($17,522,954), and October 31, 2015 ($6,336,492).
D Expenses — The majority of expenses of the Trust are directly identifiable to an individual fund. Expenses which are not readily identifiable to a specific fund are allocated taking into consideration, among other things, the nature and type of expense and the relative size of the funds.
E Expense Reduction — State Street Bank and Trust Company (SSBT) serves as custodian of the Fund. Pursuant to the custodian agreement, SSBT receives a fee reduced by credits, which are determined based on the average daily cash balance the Fund maintains with SSBT. All credit balances, if any, used to reduce the Fund's custodian fees are reported as a reduction of expenses in the Statement of Operations.
F Use of Estimates — The preparation of the financial statements in conformity with accounting principles generally accepted in the United States of America requires management to make estimates and assumptions that affect the reported amounts of assets and liabilities at the date of the financial statements and the reported amounts of income and expense during the reporting period. Actual results could differ from those estimates.
G Indemnifications — Under the Trust's organizational documents, its officers and Trustees may be indemnified against certain liabilities and expenses arising out of the performance of their duties to the Fund, and shareholders are indemnified against personal liability for obligations of the Trust. Additionally, in the normal course of business, the Fund enters into agreements with service
10
Eaton Vance Government Obligations Fund as of October 31, 2007
NOTES TO FINANCIAL STATEMENTS CONT'D
providers that may contain indemnification clauses. The Fund's maximum exposure under these arrangements is unknown as this would involve future claims that may be made against the Fund that have not yet occurred.
H Other — Investment transactions are accounted for on a trade date basis. Dividends to shareholders are recorded on the ex-dividend date.
2 Distributions to Shareholders
The Fund declares dividends daily to shareholders of record at the time of declaration. Distributions are ordinarily paid monthly. Distributions of realized capital gains, if any, are made at least annually. Distributions are declared separately for each class of shares. Shareholders may reinvest income and capital gain distributions in additional shares of the same class of the Fund at the net asset value as of the ex-dividend date or, at the election of the shareholder, receive distributions in cash. The Fund distinguishes between distributions on a tax basis and a financial reporting basis. Accounting principles generally accepted in the United States of America require that only distributions in excess of tax basis earnings and profits be reported in the financial statements as a return of capital. Permanent differences between book and tax accounting relating to distributions are reclassified to paid-in capital.
The tax character of distributions declared for the years ended October 31, 2007 and October 31, 2006 was as follows:
| | | Year ended October 31, | |
| | | 2007 | | 2006 | |
| Distributions declared from: | |
| Ordinary income | | $ | 27,584,755 | | | $ | 36,355,666 | | |
| Tax return of capital | | $ | 141,735 | | | $ | 1,790,869 | | |
During the year ended October 31, 2007, accumulated distributions in excess of net investment income was decreased by $7,206,296, accumulated net realized loss was decreased by $9,177,094 and paid-in capital was decreased by $16,383,390, due to differences between book and tax accounting primarily for premium amortization and paydowns gains/losses on mortgage-backed securities, and expired capital loss carryforwards. These reclassifications had no effect on the net assets or net asset value per share of the Fund.
As of October 31, 2007, the components of distributable earnings (accumulated losses) and unrealized appreciation (depreciation) on a tax basis were as follows:
| Capital loss carryforward | | $ | (218,037,131 | ) | |
| Unrealized depreciation | | $ | (2,298,727 | ) | |
| Other temporary differences | | $ | (851,974 | ) | |
The differences between components of distributable earnings (accumulated losses) on a tax basis and the amounts reflected in the Statement of Assets and Liabilities are primarily due to wash sales, differences in book and tax policies for mixed straddle amounts, futures contracts, premium amortization and partnership allocations, and the timing of recognizing distributions to shareholders.
3 Transactions with Affiliates
Eaton Vance Management (EVM) serves as the administrator to the Fund, but receives no compensation. The Portfolio has engaged Boston Management and Research (BMR), a subsidiary of EVM, to render investment advisory services. See Note 3 of the Portfolio's Notes to Financial Statements which are included elsewhere in this report. EVM serves as the sub-transfer agent of the Fund and receives from the transfer agent an aggregate fee based upon the actual expenses incurred by EVM in the performance of those services. For the year ended October 31, 2007, EVM earned $40,516 in sub-transfer agent fees. The Fund was informed that Eaton Vance Distributors, Inc. (EVD), a subsidiary of EVM and the Fund's principal underwriter, received $31,396 as its portion of the sales charges on sales of Class A shares for the year ended October 31, 2007. EVD also received distribution and service fees from Class A, Class B, Class C, and Class R shares ( see Note 4) and contingent deferred sales charges (see Note 5).
Except for Trustees of the Fund and the Portfolio who are not members of EVM's or BMR's organizations, officers and Trustees receive remuneration for their services to the Fund out of the investment advisory fee. Certain officers and Trustees of the Fund and the Portfolio are officers of the above organizations.
4 Distribution Plans
The Fund has in effect a distribution plan for Class A shares (Class A Plan) pursuant to Rule 12b-1 under the 1940 Act. The Class A Plan provides that the Fund will pay EVD a distribution and service fee of 0.25% per annum of its average daily net assets attributable to Class A shares for distribution services and facilities provided to the Fund by EVD, as well as for personal services and/or the
11
Eaton Vance Government Obligations Fund as of October 31, 2007
NOTES TO FINANCIAL STATEMENTS CONT'D
maintenance of shareholder accounts. Distribution and service fees paid or accrued to EVD for the year ended October 31, 2007 for Class A shares amounted to $611,778. The Fund also has in effect distribution plans for the Class B shares (Class B Plan), Class C shares (Class C Plan) and Class R shares (Class R Plan) pursuant to Rule 12b-1 under the 1940 Act. The Class B and Class C Plans require the Fund to pay EVD amounts equal to 0.75% per annum of the Fund's average daily net assets attributable to Class B and Class C shares for providing ongoing distribution services and facilities to the Fund. The Fund will automatically discontinue payments to EVD during any period in which there are no outstanding Uncovered Distribution Charges, which are equivalent to the sum of (i) 5% and 6.25% of the aggregate amount received by the Fund for Class B and Class C shares sold, respectively, plus (ii) interest calculated by applying the rat e of 1% over the prevailing prime rate to the outstanding balance of Uncovered Distribution Charges of EVD of each respective class, reduced by the aggregate amount of contingent deferred sales charges (see Note 5) and amounts theretofore paid or payable to EVD by each respective class. For the year ended October 31, 2007, the Fund paid or accrued to EVD $1,384,425 and $874,958 for Class B and Class C shares, respectively, representing 0.75% of the average daily net assets of Class B and Class C shares. At October 31, 2007, the amounts of Uncovered Distribution Charges of EVD calculated under the Plans were approximately $13,282,000 and $65,084,000 for Class B and Class C shares, respectively. The Class R Plan requires the Fund to pay EVD an amount up to 0.50% per annum of the Fund's average daily net assets attributable to Class R shares for providing ongoing distribution services and facilities to the Fund. The Trustees of the Trust have currently limited Class R distribution payments to 0.25% per annum of average daily net assets attributable to Class R shares. For the year ended October 31, 2007, the Fund paid or accrued to EVD $549 for Class R shares, representing 0.25% of the average daily net assets of such class. The Class B, Class C and Class R Plans also authorize the Fund to make payments of service fees to EVD, investment dealers, and other persons in an amount not exceeding 0.25% per annum of the Fund's average daily net assets attributable to that class. Service fees paid or accrued are for personal services and/or the maintenance of shareholder accounts. They are separate and distinct from the sales commissions and distribution fees payable to EVD and, as such, are not subject to automatic discontinuance when there are no outstanding Uncovered Distribution Charges of EVD. Service fees paid or accrued for the year ended October 31, 2007 amounted to $461,475, $291,653 and $549 for Class B, Class C and Class R shares, respectively.
5 Contingent Deferred Sales Charges
A contingent deferred sales charge (CDSC) generally is imposed on redemptions of Class B shares made within six years of purchase and on redemptions of Class C shares made within one year of purchase. Class A shares may be subject to a 1% CDSC if redeemed within eighteen months of purchase (depending on the circumstances of purchase). Generally, the CDSC is based upon the lower of the net asset value at date of redemption or date of purchase. No charge is levied on shares acquired by reinvestment of dividends or capital gains distributions. The CDSC for Class B shares is imposed at declining rates that begin at 5% in the case of redemptions in the first and second year after purchase, declining one percentage point each subsequent year. Class C shares are subject to a 1% CDSC if redeemed within one year of purchase. No CDSC is levied on shares which have been sold to EVM or its affiliates or to their respective employees or clie nts and may be waived under certain other limited conditions. CDSCs received on Class B and Class C redemptions are paid to EVD to reduce the amount of Uncovered Distribution Charges calculated under the Fund's Class B and Class C Plans. CDSCs received on Class B and Class C redemptions when no Uncovered Distribution Charges exist are credited to the Fund. For the year ended October 31, 2007, the Fund was informed that EVD received approximately $6,000, $599,000 and $12,000 of CDSCs paid by Class A, Class B and Class C shareholders.
6 Investment Transactions
Increases and decreases in the Fund's investment in the Portfolio aggregated $87,026,785 and $190,809,833, respectively, for the year ended October 31, 2007.
7 Shares of Beneficial Interest
The Fund's Declaration of Trust permits the Trustees to issue an unlimited number of full and fractional shares of beneficial interest (without par value). Such shares may be issued in a number of different series (such as the Fund) and classes. Transactions in Fund shares were as follows:
| | | Year Ended October 31, | |
| Class A | | 2007 | | 2006 | |
| Sales | | | 7,651,023 | | | | 5,690,166 | | |
Issued to shareholders electing to
receive payments of distributions
in Fund shares | | | 1,116,388 | | | | 1,262,328 | | |
| Redemptions | | | (10,890,007 | ) | | | (12,796,297 | ) | |
| Exchange from Class B shares | | | 1,482,111 | | | | 1,047,866 | | |
| Net decrease | | | (640,485 | ) | | | (4,795,937 | ) | |
12
Eaton Vance Government Obligations Fund as of October 31, 2007
NOTES TO FINANCIAL STATEMENTS CONT'D
| | | Year Ended October 31, | |
| Class B | | 2007 | | 2006 | |
| Sales | | | 1,303,176 | | | | 887,301 | | |
Issued to shareholders electing to
receive payments of distributions
in Fund shares | | | 679,386 | | | | 1,006,297 | | |
| Redemptions | | | (7,822,903 | ) | | | (10,510,683 | ) | |
| Exchange to Class A shares | | | (1,480,529 | ) | | | (1,046,540 | ) | |
| Net decrease | | | (7,320,870 | ) | | | (9,663,625 | ) | |
| | | Year Ended October 31, | |
| Class C | | 2007 | | 2006 | |
| Sales | | | 3,229,148 | | | | 1,921,049 | | |
Issued to shareholders electing to
receive payments of distributions
in Fund shares | | | 400,982 | | | | 572,991 | | |
| Redemptions | | | (5,550,095 | ) | | | (9,265,880 | ) | |
| Net decrease | | | (1,919,965 | ) | | | (6,771,840 | ) | |
| | | Year Ended October 31, | |
| Class R | | 2007 | | 2006 | |
| Sales | | | 19,376 | | | | 41,111 | | |
Issued to shareholders electing to
receive payments of distributions
in Fund shares | | | 1,608 | | | | 760 | | |
| Redemptions | | | (19,350 | ) | | | (9,454 | ) | |
| Net increase | | | 1,634 | | | | 32,417 | | |
8 Recently Issued Accounting Pronouncements
In June 2006, the Financial Accounting Standards Board (FASB) issued FASB Interpretation No. 48 (FIN 48), "Accounting for Uncertainty in Income Taxes – an interpretation of FASB Statement No. 109". FIN 48 clarifies the accounting for uncertainty in income taxes recognized in accordance with FASB Statement No. 109, "Accounting for Income Taxes". This interpretation prescribes a recognition threshold and measurement attribute for the financial statement recognition and measurement of a tax position taken or expected to be taken in a tax return. It also provides guidance on de-recognition, classification, interest and penalties, accounting in interim periods, disclosure and transition. FIN 48 is effective on the last business day of the first required financial reporting period for fiscal years beginning after December 15, 2006. Management is currently evaluating the impact of applying the various provisions of FIN 48.
In September 2006, the FASB issued Statement of Financial Accounting Standards No. 157 (FAS 157), "Fair Value Measurements". FAS 157 defines fair value, establishes a framework for measuring fair value in accordance with generally accepted accounting principles and expands disclosure about fair value measurements. FAS 157 is effective for fiscal years beginning after November 15, 2007. Management is currently evaluating the impact the adoption of FAS 157 will have on the Fund's financial statement disclosures.
13
Eaton Vance Government Obligations Fund as of October 31, 2007
REPORT OF INDEPENDENT REGISTERED PUBLIC ACCOUNTING FIRM
To the Trustees of Eaton Vance Mutual Funds Trust and Shareholders of Eaton Vance Government Obligations Fund:
We have audited the accompanying statement of assets and liabilities of Eaton Vance Government Obligations Fund (one of the series of Eaton Vance Mutual Funds Trust) (the "Fund") as of October 31, 2007, and the related statement of operations, the statement of changes in net assets, and the financial highlights for the year then ended. These financial statements and financial highlights are the responsibility of the Fund's management. Our responsibility is to express an opinion on these financial statements and financial highlights based on our audit. The statement of changes in net assets and financial highlights for the year ended October 31, 2006 and all prior periods presented were audited by other auditors. Those auditors expressed an unqualified opinion on those financial statements and financial highlights in their report dated December 27, 2006.
We conducted our audit in accordance with the standards of the Public Company Accounting Oversight Board (United States). Those standards require that we plan and perform the audit to obtain reasonable assurance about whether the financial statements and financial highlights are free of material misstatement. The Fund is not required to have, nor were we engaged to perform, an audit of its internal control over financial reporting. Our audit included consideration of internal control over financial reporting as a basis for designing audit procedures that are appropriate in the circumstances, but not for the purpose of expressing an opinion on the effectiveness of the Fund's internal control over financial reporting. Accordingly, we express no such opinion. An audit also includes examining, on a test basis, evidence supporting the amounts and disclosures in the financial statements, assessing the accounting principles used and si gnificant estimates made by management, as well as evaluating the overall financial statement presentation. We believe that our audit provides a reasonable basis for our opinion.
In our opinion, the financial statements and financial highlights referred to above present fairly, in all material respects, the financial position of Eaton Vance Government Obligations Fund as of October 31, 2007, the results of its operations, the changes in its net assets, and the financial highlights for the year then ended, in conformity with accounting principles generally accepted in the United States of America.
DELOITTE & TOUCHE LLP
Boston, Massachusetts
December 17, 2007
14
Eaton Vance Government Obligations Fund as of October 31, 2007
FEDERAL TAX INFORMATION (Unaudited)
The Form 1099-DIV you receive in January 2008 will show the tax status of all distributions paid to your account in calendar 2007. Shareholders are advised to consult their own tax adviser with respect to the tax consequences of their investment in the Fund.
15
Government Obligations Portfolio as of October 31, 2007
PORTFOLIO OF INVESTMENTS
| Mortgage Backed Securities — 99.1% | |
| Mortgage Pass-Throughs — 85.4% | |
| Security | | Principal
Amount
(000's omitted) | | Value | |
| Federal Home Loan Mortgage Corp.: | | | | | | | | | |
| 5.50%, with various maturities to 2014 | | $ | 14,679 | | | $ | 14,795,306 | | |
| 6.00%, with various maturities to 2026 | | | 1,526 | | | | 1,559,102 | | |
| 6.50%, with various maturities to 2028 | | | 34,007 | | | | 35,270,988 | | |
| 6.87%, with maturity at 2024 | | | 460 | | | | 482,778 | | |
| 7.00%, with various maturities to 2026 | | | 17,599 | | | | 18,506,093 | | |
| 7.09%, with maturity at 2023 | | | 1,465 | | | | 1,548,366 | | |
| 7.25%, with maturity at 2022 | | | 2,191 | | | | 2,325,990 | | |
| 7.31%, with maturity at 2027 | | | 586 | | | | 622,386 | | |
| 7.50%, with various maturities to 2029 | | | 26,245 | | | | 27,901,896 | | |
| 7.63%, with maturity at 2019 | | | 937 | | | | 1,004,367 | | |
| 7.75%, with various maturities to 2018 | | | 59 | | | | 62,507 | | |
| 7.78%, with maturity at 2022 | | | 292 | | | | 314,707 | | |
| 7.85%, with maturity at 2020 | | | 740 | | | | 796,825 | | |
| 8.00%, with various maturities to 2028 | | | 24,869 | | | | 26,759,744 | | |
| 8.13%, with maturity at 2019 | | | 1,471 | | | | 1,583,997 | | |
| 8.15%, with maturity at 2021 | | | 487 | | | | 527,454 | | |
| 8.25%, with various maturities to 2017 | | | 268 | | | | 280,375 | | |
| 8.50%, with various maturities to 2027 | | | 11,082 | | | | 12,066,114 | | |
| 8.75%, with various maturities to 2016 | | | 59 | | | | 60,319 | | |
| 9.00%, with various maturities to 2027 | | | 17,379 | | | | 19,088,440 | | |
| 9.25%, with various maturities to 2017 | | | 543 | | | | 565,915 | | |
| 9.50%, with various maturities to 2026 | | | 5,074 | | | | 5,607,468 | | |
| 9.75%, with various maturities to 2018 | | | 122 | | | | 124,273 | | |
| 11.00%, with maturity at 2015 | | | 49 | | | | 54,640 | | |
| 13.00%, with maturity at 2015 | | | 1 | | | | 613 | | |
| 13.50%, with maturity at 2010 | | | 14 | | | | 15,031 | | |
| 15.00%, with maturity at 2011 | | | 1 | | | | 703 | | |
| | | $ | 171,926,397 | | |
| Federal National Mortgage Assn.: | | | | | | | | | |
| 0.25%, with maturity at 2014 | | $ | 1 | | | $ | 1,338 | | |
| 5.00%, with maturity at 2027 | | | 1,564 | | | | 1,543,385 | | |
| 5.50%, with various maturities to 2030 | | | 26,297 | | | | 26,461,796 | | |
| 5.527%, with various maturities to 2026(1) | | | 5,323 | | | | 5,258,135 | | |
| 5.528%, with maturity at 2022(1) | | | 3,640 | | | | 3,598,533 | | |
| 5.533%, with various maturities to 2035(1) | | | 49,212 | | | | 48,586,433 | | |
| 5.537%, with maturity at 2035(1) | | | 3,181 | | | | 3,142,425 | | |
| 5.543%, with maturity at 2033(1) | | | 6,896 | | | | 6,810,174 | | |
| 5.546%, with maturity at 2036(1) | | | 3,357 | | | | 3,317,115 | | |
| 5.557%, with maturity at 2036(1) | | | 1,351 | | | | 1,335,333 | | |
| 6.00%, with various maturities to 2031 | | | 7,996 | | | | 8,131,897 | | |
| 6.50%, with various maturities to 2029 | | | 81,924 | | | | 84,943,239 | | |
| 6.524%, with maturity at 2025(2) | | | 565 | | | | 577,489 | | |
| 7.00%, with various maturities to 2031 | | | 44,208 | | | | 46,358,398 | | |
| 7.25%, with various maturities to 2023 | | | 106 | | | | 109,812 | | |
| Security | | Principal
Amount
(000's omitted) | | Value | |
| 7.50%, with various maturities to 2029 | | $ | 18,228 | | | $ | 19,355,354 | | |
| 7.75%, with maturity at 2008 | | | 1 | | | | 725 | | |
| 7.87%, with maturity at 2030(2) | | | 67 | | | | 72,227 | | |
| 7.875%, with maturity at 2021 | | | 1,449 | | | | 1,556,232 | | |
| 8.00%, with various maturities to 2027 | | | 22,056 | | | | 23,768,781 | | |
| 8.25%, with various maturities to 2025 | | | 666 | | | | 721,053 | | |
| 8.33%, with maturity at 2020 | | | 1,497 | | | | 1,634,283 | | |
| 8.50%, with various maturities to 2027 | | | 8,310 | | | | 9,033,332 | | |
| 8.643%, with maturity at 2021(2) | | | 273 | | | | 291,421 | | |
| 8.75%, with various maturities to 2016 | | | 208 | | | | 211,229 | | |
| 8.972%, with maturity at 2010(2) | | | 78 | | | | 79,761 | | |
| 9.00%, with various maturities to 2030 | | | 3,109 | | | | 3,351,434 | | |
| 9.125%, with maturity at 2011 | | | 56 | | | | 57,566 | | |
| 9.25%, with various maturities to 2016 | | | 80 | | | | 81,575 | | |
| 9.50%, with various maturities to 2030 | | | 5,179 | | | | 5,743,705 | | |
| 9.75%, with maturity at 2019 | | | 53 | | | | 60,923 | | |
| 9.969%, with maturity at 2021(2) | | | 128 | | | | 145,563 | | |
| 10.00%, with maturity at 2012 | | | 35 | | | | 37,598 | | |
| 10.008%, with maturity at 2025(2) | | | 110 | | | | 123,366 | | |
| 10.066%, with maturity at 2021(2) | | | 122 | | | | 140,777 | | |
| 10.223%, with maturity at 2023(2) | | | 205 | | | | 236,301 | | |
| 10.271%, with maturity at 2021(2) | | | 229 | | | | 261,675 | | |
| 10.383%, with maturity at 2020(2) | | | 188 | | | | 210,681 | | |
| 10.811%, with maturity at 2025(2) | | | 110 | | | | 124,470 | | |
| 11.00%, with maturity at 2010 | | | 8 | | | | 8,359 | | |
| 11.392%, with maturity at 2019(2) | | | 191 | | | | 216,413 | | |
| 11.50%, with maturity at 2012 | | | 75 | | | | 81,611 | | |
| 11.632%, with maturity at 2018(2) | | | 308 | | | | 349,489 | | |
| 12.199%, with maturity at 2025(2) | | | 95 | | | | 108,857 | | |
| 12.395%, with maturity at 2021(2) | | | 122 | | | | 138,476 | | |
| 12.662%, with maturity at 2015(2) | | | 241 | | | | 280,452 | | |
| 13.00%, with maturity at 2010 | | | 37 | | | | 39,099 | | |
| | | $ | 308,698,290 | | |
| Government National Mortgage Assn.: | | | | | | | | | |
| 6.125%, with various maturities to 2027(1) | | $ | 1,131 | | | $ | 1,144,240 | | |
| 6.50%, with various maturities to 2024 | | | 118 | | | | 122,396 | | |
| 7.00%, with various maturities to 2025 | | | 36,456 | | | | 38,512,615 | | |
| 7.25%, with maturity at 2022 | | | 130 | | | | 138,224 | | |
| 7.50%, with various maturities to 2025 | | | 12,519 | | | | 13,294,825 | | |
| 8.00%, with various maturities to 2027 | | | 22,750 | | | | 24,559,594 | | |
| 8.25%, with various maturities to 2019 | | | 240 | | | | 261,603 | | |
| 8.30%, with maturity at 2020 | | | 74 | | | | 79,901 | | |
| 8.50%, with various maturities to 2018 | | | 3,806 | | | | 4,139,520 | | |
| 9.00%, with various maturities to 2027 | | | 12,532 | | | | 13,938,847 | | |
| 9.50%, with various maturities to 2026 | | | 9,411 | | | | 10,595,880 | | |
| | | $ | 106,787,645 | | |
Total Mortgage Pass-Throughs
(identified cost $587,315,915) | | | | | | $ | 587,412,332 | | |
See notes to financial statements
16
Government Obligations Portfolio as of October 31, 2007
PORTFOLIO OF INVESTMENTS CONT'D
Collateralized Mortgage
Obligations — 12.9% | |
| Security | | Principal
Amount
(000's omitted) | | Value | |
Federal Home Loan Mortgage Corp.,
Series 30, Class I, 7.50%, due 2024 | | $ | 490 | | | $ | 509,197 | | |
Federal Home Loan Mortgage Corp.,
Series 1822, Class Z, 6.90%, due 2026 | | | 3,153 | | | | 3,313,667 | | |
Federal Home Loan Mortgage Corp.,
Series 1896, Class Z, 6.00%, due 2026 | | | 1,600 | | | | 1,625,092 | | |
Federal Home Loan Mortgage Corp.,
Series 2075, Class PH, 6.50%, due 2028 | | | 832 | | | | 853,626 | | |
Federal Home Loan Mortgage Corp.,
Series 2091, Class ZC, 6.00%, due 2028 | | | 3,112 | | | | 3,136,638 | | |
Federal Home Loan Mortgage Corp.,
Series 2102, Class Z, 6.00%, due 2028 | | | 939 | | | | 953,293 | | |
Federal Home Loan Mortgage Corp.,
Series 2115, Class K, 6.00%, due 2029 | | | 4,709 | | | | 4,771,093 | | |
Federal Home Loan Mortgage Corp.,
Series 2142, Class Z, 6.50%, due 2029 | | | 1,715 | | | | 1,762,953 | | |
Federal Home Loan Mortgage Corp.,
Series 2245, Class A, 8.00%, due 2027 | | | 17,175 | | | | 18,515,980 | | |
Federal National Mortgage Assn.
Series G-8, Class E, 9.00%, due 2021 | | | 648 | | | | 719,065 | | |
Federal National Mortgage Assn.,
Series G92-44, Class ZQ, 8.00%, due 2022 | | | 821 | | | | 891,025 | | |
Federal National Mortgage Assn.,
Series G93-36, Class ZQ, 6.50%, due 2023 | | | 24,537 | | | | 25,376,247 | | |
Federal National Mortgage Assn.,
Series 1993-16, Class Z, 7.50%, due 2023 | | | 958 | | | | 1,015,506 | | |
Federal National Mortgage Assn.,
Series 1993-39, Class Z, 7.50%, due 2023 | | | 2,233 | | | | 2,354,056 | | |
Federal National Mortgage Assn.,
Series 1993-149, Class M, 7.00%, due 2023 | | | 1,173 | | | | 1,223,862 | | |
Federal National Mortgage Assn.,
Series 1993-250, Class Z, 7.00%, due 2023 | | | 694 | | | | 717,504 | | |
Federal National Mortgage Assn.,
Series 1994-42, Class K, 6.50%, due 2024 | | | 10,347 | | | | 10,627,556 | | |
Federal National Mortgage Assn.,
Series 1994-82, Class Z, 8.00%, due 2024 | | | 3,844 | | | | 4,128,931 | | |
Federal National Mortgage Assn.,
Series 1997-81, Class PD, 6.35%, due 2027 | | | 1,406 | | | | 1,440,210 | | |
Federal National Mortgage Assn.,
Series 2000-49, Class A, 8.00%, due 2027 | | | 1,869 | | | | 2,018,499 | | |
Federal National Mortgage Assn.,
Series 2002-1, Class G, 7.00%, due 2023 | | | 1,515 | | | | 1,581,616 | | |
Government National Mortgage Assn.,
Series 1998-19, Class ZB, 6.50%, due 2028 | | | 1,188 | | | | 1,220,693 | | |
Total Collateralized Mortgage Obligations
(identified cost $88,502,989) | | | | | | $ | 88,756,309 | | |
Commercial Mortgage
Backed Security — 0.8% | |
| Security | | Principal
Amount
(000's omitted) | | Value | |
GS Mortgage Securities Corp. II,
Series 2001-Rock, Class A2FL,
5.481 %, due 2018(3)(4) | | $ | 5,500 | | | $ | 5,557,390 | | |
Total Commercial Mortgage Backed Security
(identified cost $5,524,397) | | | | | | $ | 5,557,390 | | |
Total Mortgage Backed Securities
(identified cost $681,343,301) | | | | | | $ | 681,726,031 | | |
| U.S. Treasury Obligations — 1.1% | |
| Security | | Principal
Amount
(000's omitted) | | Value | |
| U.S. Treasury Bond, 7.125%, 2/15/23(5) | | $ | 6,000 | | | $ | 7,521,096 | | |
Total U.S. Treasury Obligations
(identified cost $6,244,255) | | | | | | $ | 7,521,096 | | |
| Short-Term Investments — 0.0% | |
| Description | | Interest
(000's omitted) | | Value | |
| Investment in Cash Management Portfolio, 4.83%(6) | | $ | 4 | | | $ | 3,983 | | |
Total Short-Term Investments
(identified cost $3,983) | | | | | | $ | 3,983 | | |
Total Investments — 100.2%
(identified cost $687,591,539) | | | | | | $ | 689,251,110 | | |
| Other Assets, Less Liabilities — (0.2)% | | | | | | $ | (1,504,159 | ) | |
| Net Assets — 100.0% | | | | | | $ | 687,746,951 | | |
(1) Adjustable rate mortgage.
(2) Weighted average fixed-rate coupon that changes/updates monthly.
(3) Security exempt from registration under Rule 144A of the Securities Act of 1933. These securities may be sold in transactions exempt from registration, normally to qualified institutional buyers. At October 31, 2007, the aggregate value of the securities is $5,557,390 or 0.8% of the Portfolio's net assets.
(4) Variable rate security. The stated interest rate represents the rate in effect at October 31, 2007.
(5) Security (or a portion thereof) has been segregated to cover margin requirements on open financial futures contracts.
(6) Affiliated investment company available to Eaton Vance portfolios and funds which invests in high quality, U.S. dollar denominated money market instruments. The rate shown is the annualized seven-day yield as of October 31, 2007.
See notes to financial statements
17
Government Obligations Portfolio as of October 31, 2007
FINANCIAL STATEMENTS
Statement of Assets and Liabilities
As of October 31, 2007
| Assets | |
| Unaffiliated investments, at value (identified cost, $687,587,556) | | $ | 689,247,127 | | |
| Affiliated investment, at value (identified cost, $3,983) | | | 3,983 | | |
| Receivable for investments sold | | | 335,149 | | |
| Interest receivable | | | 3,976,839 | | |
| Interest receivable from affiliated investment | | | 520 | | |
| Total assets | | $ | 693,563,618 | | |
| Liabilities | |
| Demand note payable | | $ | 4,800,000 | | |
| Payable to affiliate for investment advisory fee | | | 420,796 | | |
| Payable for daily variation margin on open financial futures contracts | | | 400,388 | | |
| Payable to affiliate for Trustees' fees | | | 2,102 | | |
| Accrued expenses | | | 193,381 | | |
| Total liabilities | | $ | 5,816,667 | | |
| Net Assets applicable to investors' interest in Portfolio | | $ | 687,746,951 | | |
| Sources of Net Assets | |
| Net proceeds from capital contributions and withdrawals | | $ | 685,156,947 | | |
| Net unrealized appreciation (computed on the basis of identified cost) | | | 2,590,004 | | |
| Total | | $ | 687,746,951 | | |
Statement of Operations
For the Year Ended
October 31, 2007
| Investment Income | |
| Interest | | $ | 37,322,681 | | |
| Interest income allocated from affiliated investment | | | 331,897 | | |
| Expenses allocated from affliated investment | | | (31,398 | ) | |
| Total investment income | | $ | 37,623,180 | | |
| Expenses | |
| Investment adviser fee | | $ | 5,080,916 | | |
| Trustees' fees and expenses | | | 23,548 | | |
| Custodian fee | | | 270,404 | | |
| Legal and accounting services | | | 79,493 | | |
| Interest expense | | | 68,467 | | |
| Miscellaneous | | | 12,881 | | |
| Total expenses | | $ | 5,535,709 | | |
Deduct —
Reduction of custodian fee | | $ | 177 | | |
| Total expense reductions | | $ | 177 | | |
| Net expenses | | $ | 5,535,532 | | |
| Net investment income | | $ | 32,087,648 | | |
| Realized and Unrealized Gain (Loss) | |
Net realized gain (loss) —
Investment transactions (identified cost basis) | | $ | (88,884 | ) | |
| Financial futures contracts | | | 868,914 | | |
| Net realized gain | | $ | 780,030 | | |
Change in unrealized appreciation (depreciation) —
Investments (identified cost basis) | | $ | 3,546,616 | | |
| Financial futures contracts | | | 297,623 | | |
| Net change in unrealized appreciation (depreciation) | | $ | 3,844,239 | | |
| Net realized and unrealized gain | | $ | 4,624,269 | | |
| Net increase in net assets from operations | | $ | 36,711,917 | | |
See notes to financial statements
18
Government Obligations Portfolio as of October 31, 2007
FINANCIAL STATEMENTS CONT'D
Statements of Changes in Net Assets
Increase (Decrease)
in Net Assets | | Year Ended
October 31, 2007 | | Year Ended
October 31, 2006 | |
From operations —
Net investment income | | $ | 32,087,648 | | | $ | 31,944,223 | | |
Net realized gain from investment
transactions and financial
futures contracts | | | 780,030 | | | | 1,348,494 | | |
Net change in unrealized
appreciation (depreciation)
from investments and financial
futures contracts | | | 3,844,239 | | | | 1,611,929 | | |
| Net increase in net assets from operations | | $ | 36,711,917 | | | $ | 34,904,646 | | |
Capital transactions —
Contributions | | $ | 136,530,716 | | | $ | 113,001,226 | | |
| Withdrawals | | | (213,299,802 | ) | | | (286,374,607 | ) | |
Net decrease in net assets
from capital transactions | | $ | (76,769,086 | ) | | $ | (173,373,381 | ) | |
| Net decrease in net assets | | $ | (40,057,169 | ) | | $ | (138,468,735 | ) | |
| Net Assets | |
| At beginning of year | | $ | 727,804,120 | | | $ | 866,272,855 | | |
| At end of year | | $ | 687,746,951 | | | $ | 727,804,120 | | |
See notes to financial statements
19
Government Obligations Portfolio as of October 31, 2007
FINANCIAL STATEMENTS CONT'D
Supplementary Data
| | | Year Ended October 31, | | Period Ended | | Year Ended December 31, | |
| | | 2007 | | 2006 | | 2005 | | October 31, 2004(1) | | 2003 | | 2002 | |
| Ratios/Supplemental Data | |
| Ratios (As a percentage of average daily net assets): | |
| Expenses before custodian fee reduction | | | 0.80 | % | | | 0.79 | % | | | 0.77 | % | | | 0.75 | %(2) | | | 0.70 | % | | | 0.75 | % | |
| Expenses after custodian fee reduction | | | 0.80 | % | | | 0.79 | % | | | 0.77 | % | | | 0.75 | %(2) | | | 0.70 | % | | | 0.75 | % | |
| Net investment income | | | 4.60 | % | | | 4.09 | % | | | 3.21 | % | | | 3.63 | %(2) | | | 2.26 | % | | | 4.41 | % | |
| Portfolio Turnover | | | 23 | % | | | 2 | % | | | 30 | % | | | 5 | % | | | 67 | % | | | 41 | % | |
| Total Return | | | 5.49 | % | | | 4.71 | % | | | 2.46 | % | | | 2.23 | %(3) | | | 0.01 | % | | | 8.24 | % | |
| Net assets, end of period (000's omitted) | | $ | 687,747 | | | $ | 727,804 | | | $ | 866,273 | | | $ | 1,060,801 | | | $ | 1,521,288 | | | $ | 1,572,812 | | |
(1) For the ten-month period ended October 31, 2004.
(2) Annualized.
(3 ) Not annualized.
See notes to financial statements
20
Government Obligations Portfolio as of October 31, 2007
NOTES TO FINANCIAL STATEMENTS
1 Significant Accounting Policies
Government Obligations Portfolio (the Portfolio) is a New York trust registered under the Investment Company Act of 1940, as amended (the 1940 Act), as a diversified, open-end management investment company. The Portfolio seeks to achieve a high current return by investing primarily in mortgage-backed securities (MBS) issued, backed or otherwise guaranteed by the U.S. government or its agencies or instrumentalities. The Declaration of Trust permits the Trustees to issue beneficial interests in the Portfolio. At October 31, 2007, the Eaton Vance Government Obligations Fund and Eaton Vance Diversified Income Fund held an approximate 76.5% and 20.2% interest, respectively, in the Portfolio.
The following is a summary of significant accounting policies of the Portfolio. The policies are in conformity with accounting principles generally accepted in the United States of America.
A Investment Valuation — Debt securities (including collateralized mortgage obligations and certain MBS) normally are valued by independent pricing services. The pricing services consider various factors relating to bonds or loans and/or market transactions to determine market value. Most seasoned thirty-year fixed-rate MBS are valued by the investment adviser's matrix pricing system. The matrix pricing system also considers various factors relating to bonds and market transactions to determine market value. Exchange-traded options are valued at the last sale price on a U.S. exchange or board of trade or, in the absence of a sale, at the mean between the last bid and asked price. Financial futures con tracts listed on commodity exchanges are valued at closing settlement prices. Securities for which there is no such quotation or valuation are valued at fair value using methods determined in good faith by or at the direction of the Trustees. Short-term debt securities with a remaining maturity of 60 days or less are valued at amortized cost, which approximates market value. If short-term debt securities are acquired with a remaining maturity of more than 60 days, they will be valued by a pricing service.
The Portfolio may invest in Cash Management Portfolio (Cash Management), an affiliated investment company managed by Boston Management and Research (BMR), a subsidiary of Eaton Vance Management (EVM). Cash Management values its investment securities utilizing the amortized cost valuation technique permitted by Rule 2a-7 of the 1940 Act. This technique involves initially valuing a portfolio security at its cost and thereafter assuming a constant amortization to maturity of any discount or premium.
B Investment Transactions — Investment transactions for financial statement purposes are accounted for on a trade date basis. Realized gains and losses on securities sold are determined on the basis of identified cost.
C Income — Interest income is recorded on the basis of interest accrued, adjusted for amortization of premium or accretion of discount.
D Federal Taxes — The Portfolio has elected to be treated as a partnership for federal tax purposes. No provision is made by the Portfolio for federal or state taxes on any taxable income of the Portfolio because each investor in the Portfolio is ultimately responsible for the payment of any taxes on its share of taxable income. Since at least one of the Portfolio's investors is a regulated investment company that invests all or substantially all of its assets in the Portfolio, the Portfolio normally must satisfy the applicable source of income and diversification requirements (under the Internal Revenue Code) in order for its investors to satisfy them. The Portfolio will allocate, at least annually a mong its investors, each investor's distributive share of the Portfolio's net investment income, net realized capital gains and any other items of income, gain, loss, deduction or credit.
E Expense Reduction — State Street Bank and Trust Company (SSBT) serves as custodian of the Portfolio. Pursuant to the custodian agreement, SSBT receives a fee reduced by credits, which are determined based on the average daily cash balance the Portfolio maintains with SSBT. All credit balances, if any, used to reduce the Portfolio's custodian fees are reported as a reduction of expenses in the Statement of Operations.
F Use of Estimates — The preparation of the financial statements in conformity with accounting principles generally accepted in the United States of America requires management to make estimates and assumptions that affect the reported amounts of assets and liabilities at the date of the financial statements and the reported amounts of income and expense during the reporting period. Actual results could differ from those estimates.
G Indemnifications — Under the Portfolio's organizational documents, its officers and Trustees may be indemnified against certain liabilities and expenses arising out of the performance of their duties to the Portfolio. Interestholders in the Portfolio are jointly and severally liable for the liabilities and obligations of the Portfolio in the event that the Portfolio fails to satisfy such liabilities and obligations; provided, however, that, to the extent
21
Government Obligations Portfolio as of October 31, 2007
NOTES TO FINANCIAL STATEMENTS CONT'D
assets are available in the Portfolio, the Portfolio may, under certain circumstances, indemnify interestholders from and against any claim or liability to which such holder may become subject by reason of being or having been an interestholder in the Portfolio. Additionally, in the normal course of business, the Portfolio enters into agreements with service providers that may contain indemnification clauses. The Portfolio's maximum exposure under these arrangements is unknown as this would involve future claims that may be made against the Portfolio that have not yet occurred.
H Financial Futures Contracts — The Portfolio may enter into financial futures contracts. The Portfolio's investment in financial futures contracts is designed for hedging against changes in interest rates or as a substitute for the purchase of securities. Upon entering into a financial futures contract, the Portfolio is required to deposit with the broker, either in cash or securities an amount equal to a certain percentage of the purchase price (initial margin). Subsequent payments, known as variation margin, are made or received by the Portfolio each business day, depending on the daily fluctuations in the value of the underlying security, and are recorded as unrealized gains or losses by the Portf olio. Gains (losses) are realized upon the expiration or closing of the financial futures contracts. Should market conditions change unexpectedly, the Portfolio may not achieve the anticipated benefits of the financial futures contracts and may realize a loss. In entering such contracts, the Portfolio bears the risk if the counterparties do not perform under the contracts' terms.
I Purchased Options — Upon the purchase of a call or put option, the premium paid by the Portfolio is included in the Statement of Assets and Liabilities as an investment. The amount of the investment is subsequently marked-to-market to reflect the current market value of the option purchased, in accordance with the Portfolio's policies on investment valuations discussed above. If an option which the Portfolio has purchased expires on the stipulated expiration date, the Portfolio will realize a loss in the amount of the cost of the option. If the Portfolio enters into a closing sale transaction, the Portfolio will realize a gain or loss, depending on whether the sales proceeds from the closing sale tr ansaction are greater or less than the cost of the option. If the Portfolio exercises a put option, it will realize a gain or loss from the sale of the underlying security, and the proceeds from such sale will be decreased by the premium originally paid. If the Portfolio exercises a call option, the cost of the security which the Portfolio purchases upon exercise will be increased by the premium originally paid.
J Written Options — Upon the writing of a call or a put option, an amount equal to the premium received by the Portfolio is included in the Statement of Assets and Liabilities as a liability. The amount of the liability is subsequently marked-to-market to reflect the current value of the option written in accordance with the Portfolio's policies on investment valuations discussed above. Premiums received from writing options which expire are treated as realized gains. Premiums received from writing options which are exercised or closed are added to or offset against the proceeds or amount paid on the transaction to determine the realized gain or loss. If a put option is exercised, the premium reduces the cost basis of the securities purchased by the Portfolio. The Portfolio, as writer of an option, may have no control over whether the underlying securities may be sold (call) or purchased (put) and, as a result, bears the market risk of an unfavorable change in the price of the securities underlying the written option.
2 Purchases and Sales of Investments
Purchases and sales of U.S. Government and agency obligations, other than short-term obligations and including paydowns, aggregated $155,243,682 and $168,573,305, respectively. Purchases and sales of non U.S. Government and agency obligations, including paydowns, aggregated $5,524,707 and none, respectively.
3 Investment Adviser Fee and Other Transactions with Affiliates
The investment adviser fee is earned by BMR, a subsidiary of EVM, as compensation for management and investment advisory services rendered to the Portfolio. Pursuant to the advisory agreement, BMR receives a monthly advisory fee at the annual rate of 0.75% of average daily net assets of the Portfolio up to $500 million. On net assets of $500 million or more, BMR has contractually agreed to reduce its advisory fee as follows: 0.6875% annually on average daily net assets of $500 million but less than $1 billion; 0.6250% of average daily net assets of $1 billion but less than $1.5 billion; 0.5625% of average daily net assets of $1.5 billion but less than $2 billion; 0.5000% of average daily net assets of $2 billion but less than $2.5 billion; and 0.4375% of average daily net assets of $2.5 billion and over. These contractual fee reductions cannot be terminated or decreased without the approval of the Portfolio's Board of Trustees a nd its shareholders and are intended to continue indefinitely. The portion of the advisory fee payable by Cash Management on the Portfolio's investment of cash therein is credited against the Portfolio's advisory fee. For the year ended October 31, 2007, the Portfolio's advisory fee totaled $5,111,127 of which $30,211 was allocated from Cash Management and $5,080,916 was paid or accrued directly by the Portfolio. For the year ended October 31, 2007, the Portfolio's advisory
22
Government Obligations Portfolio as of October 31, 2007
NOTES TO FINANCIAL STATEMENTS CONT'D
fee, including the portion allocated from Cash Management, was 0.73% of the Portfolio's average daily net assets.
Except for Trustees of the Portfolio who are not members of EVM's or BMR's organizations, officers and Trustees receive remuneration for their services to the Portfolio out of the investment adviser fee. Trustees of the Portfolio who are not affiliated with the Investment Adviser may elect to defer receipt of all or a percentage of their annual fees in accordance with the terms of the Trustees Deferred Compensation Plan. For the year ended October 31, 2007, no significant amounts have been deferred. Certain officers and Trustees of the Portfolio are officers of the above organizations.
4 Line of Credit
The Portfolio participates with other portfolios and funds managed by EVM and its affiliates in a $200 million unsecured line of credit agreement with a group of banks. Borrowings are made by the Portfolio solely to facilitate the handling of unusual and/or unanticipated short-term cash requirements. Interest is charged to the Portfolio based on its borrowings at an amount above either the Eurodollar rate or Federal Funds rate. In addition, a fee computed at an annual rate of 0.07% on the daily unused portion of the line of credit is allocated among the participating portfolios and funds at the end of each quarter. At October 31, 2007, the Portfolio had a balance outstanding pursuant to this line of credit of $4,800,000. Average borrowings and the average interest rate for the year ended October 31, 2007 were $1,209,863 and 5.63%, respectively.
5 Federal Income Tax Basis of Unrealized Appreciation (Depreciation)
The cost and unrealized appreciation (depreciation) of investments of the Portfolio at October 31, 2007, as determined on a federal income tax basis, were as follows:
| Aggregate cost | | $ | 696,199,437 | | |
| Gross unrealized appreciation | | $ | 3,388,167 | | |
| Gross unrealized depreciation | | | (10,336,494 | ) | |
| Net unrealized depreciation | | $ | (6,948,327 | ) | |
The net unrealized appreciation on futures contracts at October 31, 2007 on a federal income tax basis was $0.
6 Financial Instruments
The Portfolio may trade in financial instruments with off-balance sheet risk in the normal course of its investing activities to assist in managing exposure to various market risks. These financial instruments may include written options and financial futures contracts, and may involve, to a varying degree, elements of risk in excess of the amounts recognized for financial statement purposes. The notional or contractual amounts of these instruments represent the investment the Portfolio has in particular classes of financial instruments and does not necessarily represent the amounts potentially subject to risk. The measurement of the risks associated with these instruments is meaningful only when all related and offsetting transactions are considered. A summary of obligations under these financial instruments at October 31, 2007 is as follows:
Futures Contracts
Expiration
Date(s) | | Contracts | | Position | | Aggregate
Cost | | Value | | Net
Unrealized
Appreciation | |
| | 12/07 | | | 625
U.S. Treasury Note | | Long | | $ | 67,829,336 | | | $ | 68,759,769 | | | $ | 930,433 | | |
At October 31, 2007, the Portfolio had sufficient cash and/or securities to cover commitments under these contracts.
7 Recently Issued Accounting Pronouncements
In June 2006, the Financial Accounting Standards Board (FASB) issued FASB Interpretation No. 48 (FIN 48), "Accounting for Uncertainty in Income Taxes – an interpretation of FASB Statement No. 109". FIN 48 clarifies the accounting for uncertainty in income taxes recognized in accordance with FASB Statement No. 109, "Accounting for Income Taxes". This interpretation prescribes a recognition threshold and measurement attribute for the financial statement recognition and measurement of a tax position taken or expected to be taken in a tax return. It also provides guidance on de-recognition, classification, interest and penalties, accounting in interim periods, disclosure and transition. FIN 48 is effective on the last business day of the first required financial reporting period for fiscal years beginning after December 15, 2006. Management is currently evaluating the impact of applying the various provisions of FIN 48.
In September 2006, the FASB issued Statement of Financial Accounting Standards No. 157 (FAS 157), "Fair Value Measurements". FAS 157 defines fair value, establishes a framework for measuring fair value in accordance with generally accepted accounting principles and expands disclosure about fair value measurements. FAS 157 is effective for fiscal years beginning after November 15, 2007. Management is currently evaluating the impact the adoption of FAS 157 will have on the Portfolio's financial statement disclosures.
23
Government Obligations Portfolio as of October 31, 2007
REPORT OF INDEPENDENT REGISTERED PUBLIC ACCOUNTING FIRM
To the Trustees and Investors
of Government Obligations Portfolio:
We have audited the accompanying statement of assets and liabilities of Government Obligations Portfolio (the "Portfolio"), including the portfolio of investments, as of October 31, 2007, and the related statement of operations, the statement of changes in net assets, and the supplementary data for the year then ended. These financial statements and supplementary data are the responsibility of the Portfolio's management. Our responsibility is to express an opinion on these financial statements and supplementary data based on our audit. The statement of changes in net assets and supplementary data for the year ended October 31, 2006 and all prior periods presented were audited by other auditors. Those auditors expressed an unqualified opinion on those financial statements and supplementary data in their report dated December 27, 2006.
We conducted our audit in accordance with the standards of the Public Company Accounting Oversight Board (United States). Those standards require that we plan and perform the audit to obtain reasonable assurance about whether the financial statements and supplementary data are free of material misstatement. The Portfolio is not required to have, nor were we engaged to perform, an audit of its internal control over financial reporting. Our audit included consideration of internal control over financial reporting as a basis for designing audit procedures that are appropriate in the circumstances, but not for the purpose of expressing an opinion on the effectiveness of the Portfolio's internal control over financial reporting. Accordingly, we express no such opinion. An audit also includes examining, on a test basis, evidence supporting the amounts and disclosures in the financial statements, assessing the accounting principles use d and significant estimates made by management, as well as evaluating the overall financial statement presentation. Our procedures included confirmation of securities owned as of October 31, 2007, by correspondence with the custodian and brokers; where replies were not received from brokers, we performed other auditing procedures. We believe that our audit provides a reasonable basis for our opinion.
In our opinion, the financial statements and supplementary data referred to above present fairly, in all material respects, the financial position of Government Obligations Portfolio as of October 31, 2007, the results of its operations, the changes in its net assets and the supplementary data for the year then ended, in conformity with accounting principles generally accepted in the United States of America.
DELOITTE & TOUCHE LLP
Boston, Massachusetts
December 17, 2007
24
Government Obligations Fund and Portfolio as of October 31, 2007
OTHER MATTERS
Change in Independent Registered Public Accounting Firm
On August 6, 2007, PricewaterhouseCoopers LLP resigned in the ordinary course as the independent registered public accounting firm for the Fund and Portfolio.
The reports of PricewaterhouseCoopers LLP on the Fund's and Portfolio's financial statements for each of the last two fiscal years contained no adverse opinion or disclaimer of opinion and were not qualified or modified as to uncertainty, audit scope or accounting principle. There have been no disagreements with PricewaterhouseCoopers LLP during the Fund's and Portfolio's two most recent fiscal years and any subsequent interim period on any matter of accounting principles or practices, financial statement disclosure or auditing scope or procedure, which disagreements if not resolved to the satisfaction of PricewaterhouseCoopers LLP, would have caused them to make reference thereto in their reports on the Fund's and Portfolio's financial statements for such years, and there were no reportable events of the kind described in Item 304 (a)(1)(v) of Regulation S-K under the Securities Exchange Act of 1934, as amended.
At a meeting held on August 6, 2007, based on Audit Committee recommendations and approvals, the full Board of Trustees of the Fund and Portfolio approved Deloitte & Touche LLP as the Fund's and Portfolio's independent registered public accounting firm for the fiscal year ending October 31, 2007. To the best of the Fund's and Portfolio's knowledge, for the fiscal years ended October 31, 2006 and October 31, 2005, and through August 6, 2007, the Fund and Portfolio did not consult with Deloitte & Touche LLP on items which concerned the application of accounting principles to a specified transaction, either completed or proposed, or the type of audit opinion that might be rendered on the Fund's and Portfolio's financial statements or concerned the subject of a disagreement (as defined in paragraph (a)(1)(iv) of Item 304 of Regulation S-K) or reportable events (as described in paragraph (a)(1)(v) of Item 304 of Regulation S- K).
25
Eaton Vance Government Obligations Fund
BOARD OF TRUSTEES' ANNUAL APPROVAL OF THE INVESTMENT ADVISORY AGREEMENT
Overview of the Contract Review Process
The Investment Company Act of 1940, as amended (the "1940 Act"), provides, in substance, that each investment advisory agreement between a fund and its investment adviser will continue in effect from year to year only if its continuance is approved at least annually by the fund's board of trustees, including by a vote of a majority of the trustees who are not "interested persons" of the fund ("Independent Trustees"), cast in person at a meeting called for the purpose of considering such approval.
At a meeting of the Boards of Trustees (each a "Board") of the Eaton Vance group of mutual funds (the "Eaton Vance Funds") held on April 23, 2007, the Board, including a majority of the Independent Trustees, voted to approve continuation of existing advisory and sub-advisory agreements for the Eaton Vance Funds for an additional one-year period. In voting its approval, the Board relied upon the affirmative recommendation of the Special Committee of the Board, which is a committee comprised exclusively of Independent Trustees. Prior to making its recommendation, the Special Committee reviewed information furnished for a series of meetings of the Special Committee held in February, March and April 2007. Such information included, among other things, the following:
Information about Fees, Performance and Expenses
• An independent report comparing the advisory and related fees paid by each fund with fees paid by comparable funds;
• An independent report comparing each fund's total expense ratio and its components to comparable funds;
• An independent report comparing the investment performance of each fund to the investment performance of comparable funds over various time periods;
• Data regarding investment performance in comparison to relevant peer groups of funds and appropriate indices;
• Comparative information concerning fees charged by each adviser for managing other mutual funds and institutional accounts using investment strategies and techniques similar to those used in managing the fund;
• Profitability analyses for each adviser with respect to each fund;
Information about Portfolio Management
• Descriptions of the investment management services provided to each fund, including the investment strategies and processes employed;
• Information concerning the allocation of brokerage and the benefits received by each adviser as a result of brokerage allocation, including information concerning the acquisition of research through "soft dollar" benefits received in connection with the funds' brokerage, and the implementation of a soft dollar reimbursement program established with respect to the funds;
• Data relating to portfolio turnover rates of each fund;
• The procedures and processes used to determine the fair value of fund assets and actions taken to monitor and test the effectiveness of such procedures and processes;
Information about each Adviser
• Reports detailing the financial results and condition of each adviser;
• Descriptions of the qualifications, education and experience of the individual investment professionals whose responsibilities include portfolio management and investment research for the funds, and information relating to their compensation and responsibilities with respect to managing other mutual funds and investment accounts;
• Copies of the Codes of Ethics of each adviser and its affiliates, together with information relating to compliance with and the administration of such codes;
• Copies of or descriptions of each adviser's proxy voting policies and procedures;
• Information concerning the resources devoted to compliance efforts undertaken by each adviser and its affiliates on behalf of the funds (including descriptions of various compliance programs) and their record of compliance with investment policies and restrictions, including policies with respect to market-timing, late trading and selective portfolio disclosure, and with policies on personal securities transactions;
• Descriptions of the business continuity and disaster recovery plans of each adviser and its affiliates;
Other Relevant Information
• Information concerning the nature, cost and character of the administrative and other non-investment management services provided by Eaton Vance Management and its affiliates;
• Information concerning management of the relationship with the custodian, subcustodians and fund accountants by each adviser or the funds' administrator; and
• The terms of each advisory agreement.
In addition to the information identified above, the Special Committee considered information provided from time to time by each adviser throughout the year at meetings of the Board and its committees. Over the course of the twelve-month period ended April 30, 2007,
26
Eaton Vance Government Obligations Fund
BOARD OF TRUSTEES' ANNUAL APPROVAL OF THE INVESTMENT ADVISORY AGREEMENT CONT'D
the Board met ten times and the Special Committee, the Audit Committee and the Governance Committee, each of which is a Committee comprised solely of Independent Trustees, met twelve, fourteen and eight times, respectively. At such meetings, the Trustees received, among other things, presentations by the portfolio managers and other investment professionals of each adviser relating to the investment performance of each fund and the investment strategies used in pursuing the fund's investment objective.
For funds that invest through one or more underlying portfolios, the Board considered similar information about the portfolio(s) when considering the approval of advisory agreements. In addition, in cases where the fund's investment adviser has engaged a sub-adviser, the Board considered similar information about the sub-adviser when considering the approval of any sub-advisory agreement.
The Special Committee was assisted throughout the contract review process by Goodwin Procter LLP, legal counsel for the Independent Trustees. The members of the Special Committee relied upon the advice of such counsel and their own business judgment in determining the material factors to be considered in evaluating each advisory and sub-advisory agreement and the weight to be given to each such factor. The conclusions reached with respect to each advisory and sub-advisory agreement were based on a comprehensive evaluation of all the information provided and not any single factor. Moreover, each member of the Special Committee may have placed varying emphasis on particular factors in reaching conclusions with respect to each advisory and sub-advisory agreement.
Results of the Process
Based on its consideration of the foregoing, and such other information as it deemed relevant, including the factors and conclusions described below, the Special Committee concluded that the continuance of the investment advisory agreement of the Government Obligations Portfolio (the "Portfolio"), the portfolio in which the Eaton Vance Government Obligations Fund (the "Fund") invests, with Boston Management and Research (the "Adviser"), including the fee structure, is in the interests of shareholders and, therefore, the Special Committee recommended to the Board approval of the agreement. The Board accepted the recommendation of the Special Committee as well as the factors considered and conclusions reached by the Special Committee with respect to the agreement. Accordingly, the Board, including a majority of the Independent Trustees, voted to approve continuation of the investment advisory agreement for the Portfolio.
Nature, Extent and Quality of Services
In considering whether to approve the investment advisory agreement of the Portfolio, the Board evaluated the nature, extent and quality of services provided to the Portfolio by the Adviser.
The Board considered the Adviser's management capabilities and investment process with respect to the types of investments held by the Portfolio, including the education, experience and number of its investment professionals and other personnel who provide portfolio management, investment research, and similar services to the Portfolio, including recent changes to such personnel. The Board specifically noted the Adviser's experience in investing in mortgage-backed securities, including seasoned mortgage-backed securities. The Board also took into account the resources dedicated to portfolio management and other services, including the compensation paid to recruit and retain investment personnel, and the time and attention devoted to the Portfolio by senior management.
The Board reviewed the compliance programs of the Adviser and relevant affiliates thereof. Among other matters, the Board considered compliance and reporting matters relating to personal trading by investment personnel, selective disclosure of portfolio holdings, late trading, frequent trading, portfolio valuation, business continuity and the allocation of investment opportunities. The Board also evaluated the responses of the Adviser and its affiliates to requests from regulatory authorities such as the Securities and Exchange Commission and the National Association of Securities Dealers.
The Board considered shareholder and other administrative services provided or managed by Eaton Vance Management and its affiliates, including transfer agency and accounting services. The Board evaluated the benefits to shareholders of investing in a fund that is a part of a large family of funds, including the ability, in many cases, to exchange an investment among different funds without incurring additional sales charges.
After consideration of the foregoing factors, among others, the Board concluded that the nature, extent and quality of services provided by the Adviser, taken as a whole, are appropriate and consistent with the terms of the investment advisory agreement.
Fund Performance
The Board compared the Fund's investment performance to a relevant universe of similarly managed funds identified by an independent data provider and appropriate benchmark indices. The Board reviewed comparative performance data for the one-, three-, five- and ten-year periods ended September 30, 2006 for the Fund. The Board concluded that the Fund's performance was satisfactory.
27
Eaton Vance Government Obligations Fund
BOARD OF TRUSTEES' ANNUAL APPROVAL OF THE INVESTMENT ADVISORY AGREEMENT CONT'D
Management Fees and Expenses
The Board reviewed contractual investment advisory fee rates, including any administrative fee rates, payable by the Portfolio and the Fund (referred to as "management fees"). As part of its review, the Board considered the management fees and the Fund's total expense ratio for the one-year period ended September 30, 2006, as compared to a group of similarly managed funds selected by an independent data provider.
After reviewing the foregoing information, and in light of the nature, extent and quality of the services provided by the Adviser, the Board concluded that the management fees charged for advisory and related services and the Fund's total expense ratio are reasonable.
Profitability
The Board reviewed the level of profits realized by the Adviser and relevant affiliates thereof in providing investment advisory and administrative services to the Fund, the Portfolio and to all Eaton Vance Funds as a group. The Board considered the level of profits realized without regard to revenue sharing or other payments by the Adviser and its affiliates to third parties in respect of distribution services. The Board also considered other direct or indirect benefits received by the Adviser and its affiliates in connection with its relationship with the Fund.
The Board concluded that, in light of the foregoing factors and the nature, extent and quality of the services rendered, the profits realized by the Adviser and its affiliates are reasonable.
Economies of Scale
In reviewing management fees and profitability, the Board also considered the extent to which the Adviser and its affiliates, on the one hand, and the Fund, on the other hand, can expect to realize benefits from economies of scale as the assets of the Portfolio increase. The Board acknowledged the difficulty in accurately measuring the benefits resulting from the economies of scale with respect to the management of any specific fund or group of funds. The Board reviewed data summarizing the increases and decreases in the assets of the Fund and of all Eaton Vance Funds as a group over various time periods, and evaluated the extent to which the total expense ratio of the Fund and the profitability of the Adviser and its affiliates may have been affected by such increases or decreases. Based upon the foregoing, the Board concluded that the benefits from economies of scale are currently being shared equitably by the Adviser and its affiliates and the Fund. The Board also concluded that, assuming reasonably foreseeable increases in the assets of the Portfolio, the structure of the advisory fee, which includes breakpoints at several asset levels, can be expected to cause the Adviser and its affiliates and the Fund to continue to share such benefits equitably.
28
Eaton Vance Government Obligations Fund
MANAGEMENT AND ORGANIZATION
Fund Management. The Trustees of Eaton Vance Mutual Funds Trust (the Trust) and Government Obligations Portfolio (the Portfolio) are responsible for the overall management and supervision of the Trust's and Portfolio's affairs. The Trustees and officers of the Trust and the Portfolio are listed below. Except as indicated, each individual has held the office shown or other offices in the same company for the last five years. Trustees and officers of the Trust and the Portfolio hold indefinite terms of office. The "noninterested Trustees" consist of those Trustees who are not "interested persons" of the Trust and the Portfolio, as that term is defined under the 1940 Act. The business address of each Trustee and officer is The Eaton Vance Building, 255 State Street, Boston, Massachusetts 02109. As used below, "EVC" refers to Eaton Vance Corp., "EV" refers to Ea ton Vance, Inc., "EVM" refers to Eaton Vance Management, "BMR" refers to Boston Management and Research, "Parametric" refers to Parametric Portfolio Associates and "EVD" refers to Eaton Vance Distributors, Inc. EVC and EV are the corporate parent and trustee, respectively, of EVM and BMR. EVD is the Fund's principal underwriter, the Portfolio's placement agent and a wholly-owned subsidiary of EVM. Each officer affiliated with Eaton Vance may hold a position with other Eaton Vance affiliates that is comparable to his or her position with EVM listed below.
Name and
Date of Birth | | Position(s)
with the
Trust and
the Portfolio | | Term of
Office and
Length of
Service | | Principal Occupation(s)
During Past Five Years | | Number of Portfolios
in Fund Complex
Overseen By
Trustee(1) | | Other Directorships Held | |
| Interested Trustee | | | | | | | | | | | | | |
|
| Thomas E. Faust Jr. 5/31/58 | | Trustee and President of the Trust | | Trustee since 2007 and President of the Trust since 2002 | | Chairman, Chief Executive Officer and President of EVC, President of EV, Chief Executive Officer and President of EVM and BMR, and Director of EVD. Trustee and/or Officer of 176 registered investment companies and 5 private investment companies in the Eaton Vance Fund Complex. Mr. Faust is an interested person because of his positions with EVM, BMR, EVC and EV which are affiliates of the Trust and the Portfolio. | | | 176 | | | Director of EVC | |
|
| Noninterested Trustee(s) | | | | | | | | | | | | | |
|
| Benjamin C. Esty 1/2/63 | | Trustee | | Since 2005 | | Roy and Elizabeth Simmons Professor of Business Administration, Harvard University Graduate School of Business Administration (since 2003). Formerly, Associate Professor, Harvard University Graduate School of Business Administration (2000-2003). | | | 176 | | | None | |
|
| Allen R. Freedman 4/3/40 | | Trustee | | Since 2007 | | Former Chairman and Chief Executive Officer of Assurant, Inc. (insurance provider) (1978-2000). Formerly, a Director of Loring Ward International (fund distributor) (2005-2007). | | | 175 | | | Director of Assurant, Inc. and Stonemor Partners L.P. (owner and operator of cemeteries) | |
|
| William H. Park 9/19/47 | | Trustee | | Since 2003 | | Vice Chairman, Commercial Industrial Finance Corp. (specialty finance company) (since 2006). Formerly, President and Chief Executive Officer, Prizm Capital Management, LLC (investment management firm) (2002-2005). | | | 176 | | | None | |
|
| Ronald A. Pearlman 7/10/40 | | Trustee | | Since 2003 | | Professor of Law, Georgetown University Law Center. | | | 176 | | | None | |
|
| Norton H. Reamer 9/21/35 | | Trustee | | Trustee of the Trust since 1986 and of the Portfolio since 1993 | | President, Chief Executive Officer and a Director of Asset Management Finance Corp. (a specialty finance company serving the investment management industry) (since October 2003). President, Unicorn Corporation (an investment and financial advisory services company) (since September 2000). Formerly, Chairman and Chief Operating Officer, Hellman, Jordan Management Co., Inc. (an investment management company) (2000-2003). Formerly, Advisory Director of Berkshire Capital Corporation (investment banking firm) (2002-2003). | | | 176 | | | None | |
|
29
Eaton Vance Government Obligations Fund
MANAGEMENT AND ORGANIZATION CONT'D
Name and
Date of Birth | | Position(s)
with the
Trust and
the Portfolio | | Term of
Office and
Length of
Service | | Principal Occupation(s)
During Past Five Years | | Number of Portfolios
in Fund Complex
Overseen By
Trustee(1) | | Other Directorships Held | |
| Noninterested Trustee(s) (continued) | | | | | | | | | | | | | |
|
| Heidi L. Steiger 7/8/53 | | Trustee | | Since 2007 | | President, Lowenhaupt Global Advisors, LLC (global wealth management firm) (since 2005); Formerly, President and Contributing Editor, Worth Magazine (2004); Formerly, Executive Vice President and Global Head of Private Asset Management (and various other positions), Neuberger Berman (investment firm) (1986-2004). | | | 173 | | | Director of Nuclear Electric Insurance Ltd. (nuclear insurance provider) and Aviva USA (insurance provider) | |
|
| Lynn A. Stout 9/14/57 | | Trustee | | Since 1998 | | Paul Hastings Professor of Corporate and Securities Law, University of California at Los Angeles School of Law. | | | 176 | | | None | |
|
| Ralph F. Verni 1/26/43 | | Chairman of the Board and Trustee | | Chairman of the Board since 2007 and Trustee since 2005 | | Consultant and private investor. | | | 176 | | | None | |
|
| Principal Officers who are not Trustees | | | | | | | |
|
Name and
Date of Birth | | Position(s)
with the
Trust and
the Portfolio | | Term of
Office and
Length of
Service | | Principal Occupation(s)
During Past Five Years | |
| William H. Ahern, Jr. 7/28/59 | | Vice President
of the Trust | | Since 1995 | | Vice President of EVM and BMR. Officer of 74 registered investment companies managed by EVM or BMR. | |
|
| Cynthia J. Clemson 3/2/63 | | Vice President
of the Trust | | Since 2005 | | Vice President of EVM and BMR. Officer of 89 registered investment companies managed by EVM or BMR. | |
|
| Charles B. Gaffney 12/4/72 | | Vice President
of the Trust | | Since 2007 | | Vice President of EVM and BMR. Previously, Sector Portfolio Manager and Senior Equity Analyst of Brown Brothers Harriman (1997-2003). Officer of 29 registered investment companies managed by EVM or BMR. | |
|
| Christine M. Johnston 11/9/72 | | Vice President
of the Trust | | Since 2007 | | Vice President of EVM and BMR. Officer of 34 registered investment companies managed by EVM or BMR. | |
|
| Aamer Khan 6/7/60 | | Vice President
of the Trust | | Since 2005 | | Vice President of EVM and BMR. Officer of 32 registered investment companies managed by EVM or BMR. | |
|
| Thomas H. Luster 4/8/62 | | Vice President
of the Trust | | Since 2006 | | Vice President of EVM and BMR. Officer of 48 registered investment companies managed by EVM or BMR. | |
|
| Michael R. Mach 7/15/47 | | Vice President
of the Trust | | Since 1999 | | Vice President of EVM and BMR. Officer of 54 registered investment companies managed by EVM or BMR. | |
|
| Robert B MacIntosh 1/22/57 | | Vice President
of the Trust | | Since 1998 | | Vice President of EVM and BMR. Officer of 89 registered investment companies managed by EVM or BMR. | |
|
| Duncan W. Richardson 10/26/57 | | Vice President
of the Trust | | Since 2001 | | Executive Vice President and Chief Equity Investment Officer of EVC, EVM and BMR. Officer of 80 registered investment companies managed by EVM or BMR. | |
|
| Walter A. Row, III 7/20/57 | | Vice President
of the Trust | | Since 2001 | | Director of Equity Research and a Vice President of EVM and BMR. Officer of 38 registered investment companies managed by EVM or BMR. | |
|
| Judith A. Saryan 8/21/54 | | Vice President
of the Trust | | Since 2003 | | Vice President of EVM and BMR. Officer of 53 registered investment companies managed by EVM or BMR. | |
|
| Susan Schiff 3/13/61 | | Vice President | | Vice President of the Trust since 2002 and of the Portfolio since 1993 | | Vice President of EVM and BMR. Officer of 35 registered investment companies managed by EVM or BMR. | |
|
30
Eaton Vance Government Obligations Fund
MANAGEMENT AND ORGANIZATION CONT'D
Name and
Date of Birth | | Position(s)
with the
Trust and
the Portfolio | | Term of
Office and
Length of
Service | | Principal Occupation(s)
During Past Five Years | |
| Principal Officers who are not Trustees (continued) | | | | | | | |
|
| Thomas Seto 9/27/62 | | Vice President
of the Trust | | Since 2007 | | Vice President and Director of Portfolio Management of Parametric. Officer of 30 registered investment companies managed by EVM or BMR. | |
|
| David M. Stein 5/4/51 | | Vice President
of the Trust | | Since 2007 | | Managing Director and Chief Investment Officer of Parametric. Officer of 30 registered investment companies managed by EVM or BMR. | |
|
| Mark S. Venezia 5/23/49 | | Vice President of the Trust and President of the Portfolio | | Since 2002 | | Vice President of EVM and BMR. Officer of 35 registered investment companies managed by EVM or BMR. | |
|
| Adam A. Weigold 3/22/75 | | Vice President
of the Trust | | Since 2007 | | Vice President of EVM and BMR. Officer of 70 registered investment companies managed by EVM or BMR. | |
|
| Barbara E. Campbell 6/19/57 | | Treasurer of the Trust | | Since 2005 | | Vice President of EVM and BMR. Officer of 176 registered investment companies managed by EVM or BMR. | |
|
| Maureen A. Gemma 5/24/60 | | Secretary | | Since 2007 | | Deputy Chief Legal Officer and Vice President of EVM and BMR. Officer of 176 registered investment companies managed by EVM or BMR. | |
|
| Dan A. Maalouly 3/25/62 | | Treasurer of
the Portfolio | | Since 2005 | | Vice President of EVM and BMR. Previously, Senior Manager at Pricewaterhouse Coopers LLP (1997-2005). Officer of 76 registered investment companies managed by EVM or BMR. | |
|
| Paul M. O'Neil 7/11/53 | | Chief Compliance Officer | | Since 2004 | | Vice President of EVM and BMR. Officer of 176 registered investment companies managed by EVM or BMR. | |
|
(1) Includes both master and feeder funds in a master-feeder structure.
The SAI for the Fund includes additional information about the Trustees and officers of the Fund and the Portfolio and can be obtained without charge on Eaton Vance's website at eatonvance.com or by calling 1-800-225-6265.
31
This Page Intentionally Left Blank
Investment Adviser of Government Obligations Portfolio
Boston Management and Research
The Eaton Vance Building
255 State Street
Boston, MA 02109
Administrator of Eaton Vance Government Obligations Fund
Eaton Vance Management
The Eaton Vance Building
255 State Street
Boston, MA 02109
Principal Underwriter
Eaton Vance Distributors, Inc.
The Eaton Vance Building
255 State Street
Boston, MA 02109
(617) 482-8260
Custodian
State Street Bank and Trust Company
200 Clarendon Street
Boston, MA 02116
Transfer Agent
PFPC Inc.
Attn: Eaton Vance Funds
P.O. Box 9653
Providence, RI 02940-9653
(800) 262-1122
Independent Registered Public Accounting Firm
Deloitte & Touche LLP
200 Berkeley Street
Boston, MA 02116-5022
Eaton Vance Government Obligations Fund
The Eaton Vance Building
255 State Street
Boston, MA 02109
This report must be preceded or accompanied by a current prospectus. Before investing, investors should consider carefully the Fund's investment objective, risks, and charges and expenses. The Fund's current prospectus contains this and other information about the Fund and is available through your financial advisor. Please read the prospectus carefully before you invest or send money. For further information please call 1-800-225-6265.
140-12/07 GOSRC

Annual Report October 31, 2007


EATON VANCE
HIGH
INCOME
FUND
IMPORTANT NOTICES REGARDING PRIVACY,
DELIVERY OF SHAREHOLDER DOCUMENTS,
PORTFOLIO HOLDINGS AND PROXY VOTING
Privacy. The Eaton Vance organization is committed to ensuring your financial privacy. Each of the financial institutions identified below has in effect the following policy ("Privacy Policy") with respect to nonpublic personal information about its customers:
• Only such information received from you, through application forms or otherwise, and information about your Eaton Vance fund transactions will be collected. This may include information such as name, address, social security number, tax status, account balances and transactions.
• None of such information about you (or former customers) will be disclosed to anyone, except as permitted by law (which includes disclosure to employees necessary to service your account). In the normal course of servicing a customer's account, Eaton Vance may share information with unaffiliated third parties that perform various required services such as transfer agents, custodians and broker/dealers.
• Policies and procedures (including physical, electronic and procedural safeguards) are in place that are designed to protect the confidentiality of such information.
• We reserve the right to change our Privacy Policy at any time upon proper notification to you. Customers may want to review our Policy periodically for changes by accessing the link on our homepage: www.eatonvance.com.
Our pledge of privacy applies to the following entities within the Eaton Vance organization: the Eaton Vance Family of Funds, Eaton Vance Management, Eaton Vance Investment Counsel, Boston Management and Research, and Eaton Vance Distributors, Inc.
In addition, our Privacy Policy only applies to those Eaton Vance customers who are individuals and who have a direct relationship with us. If a customer's account (i.e., fund shares) is held in the name of a third-party financial adviser/broker-dealer, it is likely that only such adviser's privacy policies apply to the customer. This notice supersedes all previously issued privacy disclosures.
For more information about Eaton Vance's Privacy Policy, please call 1-800-262-1122.
Delivery of Shareholder Documents. The Securities and Exchange Commission (the "SEC") permits funds to deliver only one copy of shareholder documents, including prospectuses, proxy statements and shareholder reports, to fund investors with multiple accounts at the same residential or post office box address. This practice is often called "householding" and it helps eliminate duplicate mailings to shareholders.
Eaton Vance, or your financial adviser, may household the mailing of your documents indefinitely unless you instruct Eaton Vance, or your financial adviser, otherwise.
If you would prefer that your Eaton Vance documents not be householded, please contact Eaton Vance at 1-800-262-1122, or contact your financial adviser.
Your instructions that householding not apply to delivery of your Eaton Vance documents will be effective within 30 days of receipt by Eaton Vance or your financial adviser.
Portfolio Holdings. Each Eaton Vance Fund and Portfolio (if applicable) will file a schedule of its portfolio holdings on Form N-Q with the SEC for the first and third quarters of each fiscal year. The Form N-Q will be available on the Eaton Vance website www.eatonvance.com, by calling Eaton Vance at 1-800-262-1122 or in the EDGAR database on the SEC's website at www.sec.gov. Form N-Q may also be reviewed and copied at the SEC's public reference room in Washington, D.C. (call 1-800-732-0330 for information on the operation of the public reference room).
Proxy Voting. From time to time, funds are required to vote proxies related to the securities held by the funds. The Eaton Vance Funds or their underlying Portfolios (if applicable) vote proxies according to a set of policies and procedures approved by the Funds' and Portfolios' Boards. You may obtain a description of these policies and procedures and information on how the Funds or Portfolios voted proxies relating to Portfolio securities during the most recent 12 month period ended June 30, without charge, upon request, by calling 1-800-262-1122. This description is also available on the SEC's website at www.sec.gov.
Eaton Vance High Income Fund as of October 31, 2007
MANAGEMENT’S DISCUSSION OF FUND PERFORMANCE
Performance for the Past Year
· For the year ended October 31, 2007, the Fund’s Class A shares had a total return of 6.11% .(1) This return resulted from a decrease in net asset value (NAV) per share to $5.13 on October 31, 2007 from $5.23 on October 31, 2006 and the reinvestment of $0.413 in dividend income.
· The Fund’s Class B shares had a total return of 5.30% for the year ended October 31, 2007.(1) This return resulted from a decrease in NAV per share to $5.12 on October 31, 2007 from $5.22 on October 31, 2006 and the reinvestment of $0.372 in dividend income.
· The Fund’s Class C shares had a total return of 5.09% for the year ended October 31, 2007.(1) This return resulted from a decrease in NAV per share to $5.11 on October 31, 2007 from $5.22 on October 31, 2006 and the reinvestment of $0.372 in dividend income.
· For comparison, the Merrill Lynch U.S. High Yield Master II Index, an unmanaged index of below-investment grade U.S. dollar-denominated corporate bonds publicly issued in the U.S. domestic market, had a return of 6.85% for the year ended October 31, 2007.(2) The Merrill Lynch U.S. High Yield Master II Constrained Index – whose constituents are capped at a maximum allocation of 2% of the Index – had a total return of 6.96% for the same period.(2) The Fund’s peer group, the Lipper High Current Yield Funds Classification, had a total return of 6.21% for the same period.(2)
· Based on each share Class’s most recent dividends and NAV on October 31, 2007 of $5.13 per share for Class A, $5.12 for Class B and $5.11 for Class C, the distribution rates were 8.05%, 7.27% and 7.28%, respectively.(3) The SEC 30-day yields for Class A, Class B and Class C were 7.55%, 7.15% and 7.17%, respectively.(4)
Management Discussion
· In the first half of the fiscal year, high-yield spreads narrowed to historically tight levels. However, beginning in June, amid the crisis involving subprime mortgage lending and derivative investment vehicles, the high-yield market underwent a severe but brief correction. Spreads quickly widened by 200 basis points (2.00%) to around 460 basis points (4.60%), closer to their historical norms. In the market dislocation, many deals failed to come to market, creating an overhang of roughly $90 billion in pending supply. By mid-August, the market began to recover somewhat, getting a boost from interest rate cuts by the Federal Reserve and from signs of continued corporate profitablity. Spreads narrowed somewhat in September, but widened again in October.
· The Fund currently invests its assets in High Income Portfolio (the “Portfolio”), a separate registered investment company with the same objective and policies as the Fund. The Fund lagged the Merrill Lynch U.S. High Yield Master II Index in the first eight months of the fiscal year. With spreads very narrow, the Portfolio focused on shorter maturity bonds, bonds senior in the capital structure and senior loans. As spreads tightened further, the Fund lagged due to a lower duration. However, that strategy provided a significant advantage in the market turmoil of midsummer, as shorter maturity bonds and bonds senior in the capital structure were less impacted by the market decline. The Portfolio used the market decline as an opportunity to buy selected longer maturities that management felt represented better value in the wake of the decline. The Portfolio continued to focus on credits management believed could potentially fare well in a slowing economy. Excluding cash, the Portfolio had a duration of 3.53 years at October 31, 2007.
· Among the Portfolio’s stronger performing sectors were metals, specialty retailers, energy and health care.(5)
· Cyclical sectors were among the Portfolio’s lagging performers. Most notable were homebuilders, which struggled in a weak housing market, and financials, which suffered from the credit crunch. The Portfolio remained underweighted in both sectors.(5)
The views expressed throughout this report are those of the portfolio managers and are current only through the end of the period of the report as stated on the cover. These views are subject to change at any time based upon market or other conditions, and the investment adviser disclaims any responsibility to update such views. These views may not be relied on as investment advice and, because investment decisions for a fund are based on many factors, may not be relied on as an indication of trading intent on behalf of any Eaton Vance fund.
Fund shares are not insured by the FDIC and are not deposits or other obligations of, or guaranteed by, any depository institution. Shares are subject to investment risks, including possible loss of principal invested.
(1) These returns do not include the 4.75% maximum sales charge for the Fund’s Class A shares or the applicable contingent deferred sales charges (CDSC) for Class B shares and Class C shares. If sales charges were deducted, the returns would be lower. Class A shares are subject to a 1% redemption fee if redeemed or exchanged within 90 days of the settlement of the purchase. (2) It is not possible to invest directly in an Index or Lipper Classification. The Indices’ total returns do not reflect the expenses that would have been incurred if an investor individually purchased or sold the securities represented in the Indices. The Lipper total return is the average total return, at NAV, of the funds that are in the same Lipper Classification as the Fund.(3) The Fund’s distribution rate represents actual distributions paid to shareholders and is calculated daily by dividing the last distribution per share (annualized) by the NAV. (4) The Fund’s SEC yield is calculated by dividing the net investment income per share for the 30-day period by the offering price at the end of the period and annualizing the result. (5) Portfolio investments may not be representative of the Portfolio’s current or future investments due to active management.
Past performance is no guarantee of future results. Returns are historical and are calculated by determining the percentage change in net asset value or offering price (as applicable) with all distributions reinvested. Investment return and principal value will fluctuate so that shares, when redeemed, may be worth more or less than their original cost. Performance is for the stated time period only; due to market volatility, the Fund’s current performance may be lower or higher than the quoted return. For performance as of the most recent month end, please refer to www.eatonvance.com.
1
Eaton Vance High Income Fund as of October 31, 2007
FUND PERFORMANCE
The line graph and table set forth below provide information about the Fund’s performance. The line graph compares the performance of Class B of the Fund with that of the Merrill Lynch U.S. High Yield Master II Index, an unmanaged index of below-investment grade U.S. dollar-denominated corporate bonds publicly issued in the U.S. domestic market and the Merrill Lynch U.S. High Yield Master II Constrained Index, whose constituents are capped at a maximum allocation of 2% of the Index. The lines on the graph represent the total returns of a hypothetical investment of $10,000 in each of Class B of the Fund, the Merrill Lynch U.S. High Yield Master II Index and the Merrill Lynch U.S. High Yield Master II Constrained Index. The table includes the total returns of each Class of the Fund at net asset value and public offering price. The performance presented below does not reflect the deduction of taxes, if any, that a shareholder would pay on Fund distributions or the redemption of Fund shares.
FUND PERFORMANCE(1) As of 10/31/07
| | Class A | | Class B | | Class C | |
Class Share Symbols | | ETHIX | | EVHIX | | ECHIX | |
| | | | | | | |
Average Annual Total Returns (at net asset value) | | | | | | | |
| | | | | | | |
One Year | | 6.11 | % | 5.30 | % | 5.09 | % |
Five Years | | N.A. | | 12.72 | | 1 2.63 | |
Ten Years | | N.A. | | 5.00 | | 4.95 | |
Life of Fund† | | 7.79 | | 7.40 | | 6.44 | |
| | | | | | | |
SEC Average Annual Total Returns (including sales charge or applicable CDSC) | | | | | | | |
| | | | | | | |
One Year | | 1.08 | % | 0.39 | % | 4.12 | % |
Five Years | | N.A. | | 12.47 | | 1 2.63 | |
Ten Years | | N.A. | | 5.00 | | 4.95 | |
Life of Fund† | | 6.36 | | 7.40 | | 6.44 | |
† Inception Dates – Class A: 3/11/04; Class B: 8/19/86; Class C: 6/8/94
(1) Average Annual Total Returns do not include the 4.75% maximum sales charge for Class A shares or the applicable contingent deferred sales charges (CDSC) for Class B or Class C shares. If sales charges were deducted, the returns would be lower. SEC returns for Class A reflect the maximum 4.75% sales charge. SEC returns for Class B reflect applicable CDSC based on the following schedule: 5% - 1st and 2nd years; 4% - 3rd year; 3% - 4th year; 2% - 5th year; 1% - 6th year. SEC 1-Year return for Class C reflects 1% CDSC for the first year. Class A shares are subject to a 1% redemption fee if redeemed or exchanged within 90 days of the settlement of the purchase.
Total Annual | | | | | | | |
Operating Expenses(2) | | Class A | | Class B | | Class C | |
| | | | | | | |
Expense Ratio | | 0.97 | % | 1.72 | % | 1.72 | % |
(2) Source: Prospectus dated 3/1/07.
Comparison of Change in Value of a $10,000 Investment in Eaton Vance High Income Fund Class B vs. the Merrill Lynch U.S. High Yield Master II Index and the Merrill Lynch U.S. High yield Master II Constrained Index*
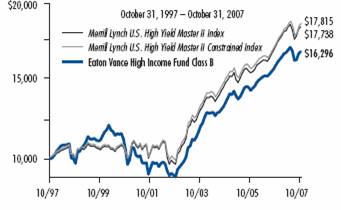
* Sources: Thomson Financial; Bloomberg, L.P. Class B of the Fund commenced operations on 8/19/86.
A $10,000 hypothetical investment at net asset value in Class A on 3/11/04 and Class C on 10/31/97 of the Fund would have been valued at $13,139 ($12,515 at the maximum offering price) and $16,210, respectively, on 10/31/07. It is not possible to invest directly in an Index. The Indices’ total returns do not reflect expenses that would have been incurred if an investor individually purchased or sold the securities represented in the Indices.
Portfolio Credit Quality Ratings(3)
By total investments
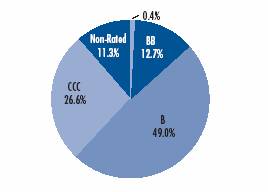
(3) Credit Quality ratings are those provided by Standard & Poor’s, a nationally recognized bond rating service. As a percentage of the Portfolio’s total investments as of October 31, 2007. Portfolio information may not be representative of the Portfolio’s current or future investments and may change due to active management.
Past performance is no guarantee of future results. Returns are historical and are calculated by determining the percentage change in net asset value or offering price (as applicable) with all distributions reinvested. Investment return and principal value will fluctuate so that shares, when redeemed, may be worth more or less than their original cost. Performance is for the stated time period only; due to market volatility, the Fund’s current performance may be lower or higher than the quoted return. For performance as of the most recent month end, please refer to www.eatonvance.com.
2
Eaton Vance High Income Fund as of October 31, 2007
FUND EXPENSES
Example: As a shareholder of the Fund, you incur two types of costs: (1) transaction costs, including sales charges (loads) on purchases and redemption fees (if applicable); and (2) ongoing costs, including management fees; distribution or service fees; and other Fund expenses. This Example is intended to help you understand your ongoing costs (in dollars) of investing in the Fund and to compare these costs with the ongoing costs of investing in other mutual funds. The Example is based on an investment of $1,000 invested at the beginning of the period and held for the entire period (May 1, 2007 – October 31, 2007).
Actual Expenses: The first section of the table below provides information about actual account values and actual expenses. You may use the information in this section, together with the amount you invested, to estimate the expenses that you paid over the period. Simply divide your account value by $1,000 (for example, an $8,600 account value divided by $1,000 = 8.6), then multiply the result by the number in the first section under the heading entitled "Expenses Paid During Period" to estimate the expenses you paid on your account during this period.
Hypothetical Example for Comparison Purposes: The second section of the table below provides information about hypothetical account values and hypothetical expenses based on the actual Fund expense ratio and an assumed rate of return of 5% per year (before expenses), which is not the actual return of the Fund. The hypothetical account values and expenses may not be used to estimate the actual ending account balance or expenses you paid for the period. You may use this information to compare the ongoing costs of investing in your Fund and other funds. To do so, compare this 5% hypothetical example with the 5% hypothetical examples that appear in the shareholder reports of the other funds.
Please note that the expenses shown in the table are meant to highlight your ongoing costs only and do not reflect any transactional costs, such as sales charges (loads) or redemption fees (if applicable). Therefore, the second section of the table is useful in comparing ongoing costs only, and will not help you determine the relative total costs of owning different funds. In addition, if these transactional costs were included, your costs would have been higher.
Eaton Vance High Income Fund
| | | Beginning Account Value
(5/1/07) | | Ending Account Value
(10/31/07) | | Expenses Paid During Period*
(5/1/07 – 10/31/07) | |
| Actual | |
| Class A | | $ | 1,000.00 | | | $ | 996.30 | | | $ | 5.43 | | |
| Class B | | $ | 1,000.00 | | | $ | 994.20 | | | $ | 9.25 | | |
| Class C | | $ | 1,000.00 | | | $ | 992.30 | | | $ | 9.24 | | |
| Hypothetical | |
| (5% return per year before expenses) | |
| Class A | | $ | 1,000.00 | | | $ | 1,019.80 | | | $ | 5.50 | | |
| Class B | | $ | 1,000.00 | | | $ | 1,015.90 | | | $ | 9.35 | | |
| Class C | | $ | 1,000.00 | | | $ | 1,015.90 | | | $ | 9.35 | | |
* Expenses are equal to the Fund's annualized expense ratio of 1.08% for Class A shares, 1.84% for Class B shares and 1.84% for Class C shares multiplied by the average account value over the period, multiplied by 184/365 (to reflect the one-half year period). The Example assumes that the $1,000 was invested at the net asset value per share determined at the close of business on April 30, 2007. The Example reflects the expenses of both the Fund and the Portfolio.
3
Eaton Vance High Income Fund as of October 31, 2007
FINANCIAL STATEMENTS
Statement of Assets and Liabilities
As of October 31, 2007
| Assets | |
Investment in High Income Portfolio, at value
(identified cost, $647,209,375) | | $ | 641,865,572 | | |
| Receivable for Fund shares sold | | | 848,205 | | |
| Total assets | | $ | 642,713,777 | | |
| Liabilities | |
| Dividends payable | | $ | 2,294,326 | | |
| Payable for Fund shares redeemed | | | 1,717,714 | | |
| Payable to affiliate for distribution and service fees | | | 383,508 | | |
| Payable to affiliate for Trustees' fees | | | 333 | | |
| Accrued expenses | | | 221,265 | | |
| Total liabilities | | $ | 4,617,146 | | |
| Net Assets | | $ | 638,096,631 | | |
| Sources of Net Assets | |
| Paid-in capital | | $ | 1,017,929,277 | | |
Accumulated net realized loss from Portfolio (computed on the basis
of identified cost) | | | (373,771,852 | ) | |
| Accumulated distributions in excess of net investment income | | | (716,991 | ) | |
Net unrealized depreciation from Portfolio (computed on the basis of
identified cost) | | | (5,343,803 | ) | |
| Total | | $ | 638,096,631 | | |
| Class A Shares | |
| Net Assets | | $ | 254,507,736 | | |
| Shares Outstanding | | | 49,634,068 | | |
Net Asset Value and Redemption Price Per Share
(net assets ÷ shares of beneficial interest outstanding) | | $ | 5.13 | | |
Maximum Offering Price Per Share
(100 ÷ 95.25 of $5.13) | | $ | 5.39 | | |
| Class B Shares | |
| Net Assets | | $ | 221,435,966 | | |
| Shares Outstanding | | | 43,287,038 | | |
Net Asset Value and Offering Price Per Share*
(net assets ÷ shares of beneficial interest outstanding) | | $ | 5.12 | | |
| Class C Shares | |
| Net Assets | | $ | 162,152,929 | | |
| Shares Outstanding | | | 31,706,740 | | |
Net Asset Value and Offering Price Per Share*
(net assets ÷ shares of beneficial interest outstanding) | | $ | 5.11 | | |
| On sales of $25,000 or more, the offering price of Class A shares is reduced. | |
* Redemption price per share is equal to the net asset value less any applicable contingent deferred sales charge.
Statement of Operations
For the Year Ended
October 31, 2007
| Investment Income | |
| Interest and other income allocated from Portfolio | | $ | 61,618,638 | | |
| Dividends allocated from Portfolio | | | 623,264 | | |
| Expenses allocated from Portfolio | | | (4,401,251 | ) | |
| Net investment income from Portfolio | | $ | 57,840,651 | | |
| Expenses | |
| Trustees' fees and expenses | | $ | 3,743 | | |
Distribution and service fees
Class A | | | 616,286 | | |
| Class B | | | 2,710,392 | | |
| Class C | | | 1,732,353 | | |
| Transfer and dividend disbursing agent fees | | | 714,122 | | |
| Printing and postage | | | 119,609 | | |
| Registration fees | | | 109,988 | | |
| Custodian fee | | | 38,750 | | |
| Legal and accounting services | | | 29,848 | | |
| Miscellaneous | | | 7,629 | | |
| Total expenses | | $ | 6,082,720 | | |
| Net investment income | | $ | 51,757,931 | | |
Realized and Unrealized
Gain (Loss) from Portfolio | |
Net realized gain (loss) —
Investment transactions (identified cost basis) | | $ | 18,295,535 | | |
| Swap contracts | | | (406,301 | ) | |
| Foreign currency transactions | | | 816 | | |
| Net realized gain | | $ | 17,890,050 | | |
Change in unrealized appreciation (depreciation) —
Investments (identified cost basis) | | $ | (34,142,669 | ) | |
| Swap contracts | | | 473,773 | | |
| Net change in unrealized appreciation (depreciation) | | $ | (33,668,896 | ) | |
| Net realized and unrealized loss | | $ | (15,778,846 | ) | |
| Net increase in net assets from operations | | $ | 35,979,085 | | |
See notes to financial statements
4
Eaton Vance High Income Fund as of October 31, 2007
FINANCIAL STATEMENTS CONT'D
Statements of Changes in Net Assets
Increase (Decrease)
in Net Assets | | Year Ended
October 31, 2007 | | Year Ended
October 31, 2006 | |
From operations —
Net investment income | | $ | 51,757,931 | | | $ | 49,810,329 | | |
Net realized gain from investment
transactions, swap contracts, and
foreign currency and forward foreign
currency exchange contract transactions | | | 17,890,050 | | | | 16,524,463 | | |
Net change in unrealized appreciation
(depreciation) from investments,
swaps contracts, foreign currency
and forward foreign currency
exchange contracts | | | (33,668,896 | ) | | | 3,145,364 | | |
| Net increase in net assets from operations | | $ | 35,979,085 | | | $ | 69,480,156 | | |
Distributions to shareholders —
From net investment income
Class A | | $ | (19,407,696 | ) | | $ | (14,147,508 | ) | |
| Class B | | | (19,246,612 | ) | | | (24,307,320 | ) | |
| Class C | | | (12,304,402 | ) | | | (12,679,760 | ) | |
| Total distributions to shareholders | | $ | (50,958,710 | ) | | $ | (51,134,588 | ) | |
Transactions in shares of beneficial interest —
Proceeds from sale of shares
Class A | | $ | 104,586,233 | | | $ | 33,549,505 | | |
| Class B | | | 13,804,283 | | | | 16,275,549 | | |
| Class C | | | 28,850,891 | | | | 27,908,844 | | |
Net asset value of shares issued to
shareholders in payment of
distributions declared
Class A | | | 8,052,036 | | | | 5,740,369 | | |
| Class B | | | 8,006,586 | | | | 10,193,029 | | |
| Class C | | | 4,923,939 | | | | 5,185,071 | | |
Cost of shares redeemed
Class A | | | (83,529,390 | ) | | | (30,098,777 | ) | |
| Class B | | | (68,934,760 | ) | | | (79,092,598 | ) | |
| Class C | | | (40,223,946 | ) | | | (54,096,757 | ) | |
Net asset value of shares exchanged
Class A | | | 32,628,687 | | | | 20,770,613 | | |
| Class B | | | (32,628,687 | ) | | | (20,770,613 | ) | |
| Redemption fees | | | 10,279 | | | | 4,435 | | |
Net decrease in net assets from
Fund share transactions | | $ | (24,453,849 | ) | | $ | (64,431,330 | ) | |
| Net decrease in net assets | | $ | (39,433,474 | ) | | $ | (46,085,762 | ) | |
| Net Assets | |
| At beginning of year | | $ | 677,530,105 | | | $ | 723,615,867 | | |
| At end of year | | $ | 638,096,631 | | | $ | 677,530,105 | | |
Accumulated distributions
in excess of net investment
income included in net assets | |
| At end of year | | $ | (716,991 | ) | | $ | (2,484,246 | ) | |
See notes to financial statements
5
Eaton Vance High Income Fund as of October 31, 2007
FINANCIAL STATEMENTS CONT'D
Financial Highlights
| | | Class A | |
| | | Year Ended October 31, | |
| | | 2007(1) | | 2006(1) | | 2005(1) | | 2004(1)(2) | |
| Net asset value — Beginning of year | | $ | 5.230 | | | $ | 5.100 | | | $ | 5.210 | | | $ | 5.230 | | |
| Income (loss) from operations | |
| Net investment income | | $ | 0.418 | | | $ | 0.401 | | | $ | 0.402 | | | $ | 0.262 | | |
| Net realized and unrealized gain (loss) | | | (0.105 | ) | | | 0.142 | | | | (0.095 | ) | | | (0.001 | ) | |
| Total income from operations | | $ | 0.313 | | | $ | 0.543 | | | $ | 0.307 | | | $ | 0.261 | | |
| Less distributions | |
| From net investment income | | $ | (0.413 | ) | | $ | (0.413 | ) | | $ | (0.417 | ) | | $ | (0.281 | ) | |
| Total distributions | | $ | (0.413 | ) | | $ | (0.413 | ) | | $ | (0.417 | ) | | $ | (0.281 | ) | |
| Redemption fees | | $ | 0.000 | (3) | | $ | 0.000 | (3) | | $ | 0.000 | (3) | | $ | 0.000 | (3) | |
| Net asset value — End of year | | $ | 5.130 | | | $ | 5.230 | | | $ | 5.100 | | | $ | 5.210 | | |
| Total Return(4) | | | 6.11 | % | | | 11.04 | % | | | 6.01 | % | | | 5.20 | %(7) | |
| Ratios/Supplemental Data | |
| Net assets, end of year (000's omitted) | | $ | 254,508 | | | $ | 199,812 | | | $ | 165,125 | | | $ | 150,042 | | |
| Ratios (As a percentage of average daily net assets): | | | | | | | | | | | | | | | | | |
| Expenses before custodian fee reduction(5) | | | 1.04 | % | | | 0.97 | % | | | 0.97 | % | | | 0.96 | %(6) | |
| Expenses after custodian fee reduction(5) | | | 1.04 | % | | | 0.97 | % | | | 0.97 | % | | | 0.96 | %(6) | |
| Net investment income | | | 7.98 | % | | | 7.77 | % | | | 7.70 | % | | | 7.98 | %(6) | |
| Portfolio Turnover of the Portfolio | | | 81 | % | | | 62 | % | | | 62 | % | | | 80 | % | |
(1) Net investment income per share was computed using average shares outstanding.
(2) For the period from the commencement of offering of Class A shares, March 11, 2004, to October 31, 2004.
(3) Amounts represent less than $0.0005.
(4) Returns are historical and are calculated by determining the percentage change in net asset value with all distributions reinvested.
(5) Includes the Fund's share of the Portfolio's allocated expenses.
(6) Annualized.
(7) Not annualized.
See notes to financial statements
6
Eaton Vance High Income Fund as of October 31, 2007
FINANCIAL STATEMENTS CONT'D
Financial Highlights
| | | Class B | |
| | | Year Ended October 31, | |
| | | 2007(1) | | 2006(1) | | 2005(1) | | 2004(1) | | 2003 | |
| Net asset value — Beginning of year | | $ | 5.220 | | | $ | 5.080 | | | $ | 5.200 | | | $ | 5.050 | | | $ | 4.150 | | |
| Income (loss) from operations | |
| Net investment income | | $ | 0.379 | | | $ | 0.363 | | | $ | 0.363 | | | $ | 0.392 | | | $ | 0.416 | | |
| Net realized and unrealized gain (loss) | | | (0.107 | ) | | | 0.149 | | | | (0.106 | ) | | | 0.169 | | | | 0.904 | | |
| Total income from operations | | $ | 0.272 | | | $ | 0.512 | | | $ | 0.257 | | | $ | 0.561 | | | $ | 1.320 | | |
| Less distributions | |
| From net investment income | | $ | (0.372 | ) | | $ | (0.372 | ) | | $ | (0.377 | ) | | $ | (0.411 | ) | | $ | (0.420 | ) | |
| Total distributions | | $ | (0.372 | ) | | $ | (0.372 | ) | | $ | (0.377 | ) | | $ | (0.411 | ) | | $ | (0.420 | ) | |
| Redemption fees | | $ | 0.000 | (2) | | $ | 0.000 | (2) | | $ | 0.000 | (2) | | $ | 0.000 | (2) | | $ | — | | |
| Net asset value — End of year | | $ | 5.120 | | | $ | 5.220 | | | $ | 5.080 | | | $ | 5.200 | | | $ | 5.050 | | |
| Total Return(3) | | | 5.30 | % | | | 10.41 | % | | | 5.34 | %(4) | | | 11.55 | % | | | 33.26 | % | |
| Ratios/Supplemental Data | |
| Net assets, end of year (000's omitted) | | $ | 221,436 | | | $ | 305,519 | | | $ | 370,036 | | | $ | 474,861 | | | $ | 662,381 | | |
| Ratios (As a percentage of average daily net assets): | | | | | | | | | | | | | | | | | | | | | |
| Expenses before custodian fee reduction(5) | | | 1.78 | % | | | 1.72 | % | | | 1.72 | % | | | 1.71 | % | | | 1.80 | % | |
| Expenses after custodian fee reduction(5) | | | 1.78 | % | | | 1.72 | % | | | 1.72 | % | | | 1.71 | % | | | 1.80 | % | |
| Net investment income | | | 7.23 | % | | | 7.05 | % | | | 6.95 | % | | | 7.60 | % | | | 8.96 | % | |
| Portfolio Turnover of the Portfolio | | | 81 | % | | | 62 | % | | | 62 | % | | | 80 | % | | | 122 | % | |
(1) Net investment income per share was computed using average shares outstanding.
(2) Amount represent less than $0.0005.
(3) Returns are historical and are calculated by determining the percentage change in net asset value with all distributions reinvested.
(4) Total return reflects an increase of 0.33% due to a change in the timing of the payment and reinvestment of distributions.
(5) Includes the Fund's share of the Portfolio's allocated expenses.
See notes to financial statements
7
Eaton Vance High Income Fund as of October 31, 2007
FINANCIAL STATEMENTS CONT'D
Financial Highlights
| | | Class C | |
| | | Year Ended October 31, | |
| | | 2007(1) | | 2006(1) | | 2005(1) | | 2004(1) | | 2003 | |
| Net asset value — Beginning of year | | $ | 5.220 | | | $ | 5.080 | | | $ | 5.200 | | | $ | 5.050 | | | $ | 4.150 | | |
| Income (loss) from operations | |
| Net investment income | | $ | 0.378 | | | $ | 0.363 | | | $ | 0.363 | | | $ | 0.389 | | | $ | 0.417 | | |
| Net realized and unrealized gain (loss) | | | (0.116 | ) | | | 0.149 | | | | (0.107 | ) | | | 0.171 | | | | 0.903 | | |
| Total income from operations | | $ | 0.262 | | | $ | 0.512 | | | $ | 0.256 | | | $ | 0.560 | | | $ | 1.320 | | |
| Less distributions | |
| From net investment income | | $ | (0.372 | ) | | $ | (0.372 | ) | | $ | (0.376 | ) | | $ | (0.410 | ) | | $ | (0.420 | ) | |
| Total distributions | | $ | (0.372 | ) | | $ | (0.372 | ) | | $ | (0.376 | ) | | $ | (0.410 | ) | | $ | (0.420 | ) | |
| Redemption fees | | $ | 0.000 | (2) | | $ | 0.000 | (2) | | $ | 0.000 | (2) | | $ | 0.000 | (2) | | $ | — | | |
| Net asset value — End of year | | $ | 5.110 | | | $ | 5.220 | | | $ | 5.080 | | | $ | 5.200 | | | $ | 5.050 | | |
| Total Return(3) | | | 5.09 | % | | | 10.41 | % | | | 5.32 | %(4) | | | 11.38 | % | | | 33.24 | % | |
| Ratios/Supplemental Data | |
| Net assets, end of year (000's omitted) | | $ | 162,153 | | | $ | 172,200 | | | $ | 188,454 | | | $ | 239,308 | | | $ | 281,103 | | |
| Ratios (As a percentage of average daily net assets): | |
| Expenses before custodian fee reduction(5) | | | 1.79 | % | | | 1.72 | % | | | 1.72 | % | | | 1.71 | % | | | 1.80 | % | |
| Expenses after custodian fee reduction(5) | | | 1.79 | % | | | 1.72 | % | | | 1.72 | % | | | 1.71 | % | | | 1.80 | % | |
| Net investment income | | | 7.22 | % | | | 7.05 | % | | | 6.96 | % | | | 7.56 | % | | | 8.93 | % | |
| Portfolio Turnover of the Portfolio | | | 81 | % | | | 62 | % | | | 62 | % | | | 80 | % | | | 122 | % | |
(1) Net investment income per share was computed using average shares outstanding.
(2) Amounts represent less than $0.0005.
(3) Returns are historical and are calculated by determining the percentage change in net asset value with all distributions reinvested.
(4) Total return reflects an increase of 0.20% due to a change in the timing of the payment and reinvestment of distributions.
(5) Includes the Fund's share of the Portfolio's allocated expenses.
See notes to financial statements
8
Eaton Vance High Income Fund as of October 31, 2007
NOTES TO FINANCIAL STATEMENTS
1 Significant Accounting Policies
Eaton Vance High Income Fund (the Fund) is a diversified series of Eaton Vance Mutual Funds Trust (the Trust). The Trust is a Massachusetts business trust registered under the Investment Company Act of 1940, as amended (the 1940 Act), as an open-end management investment company. The Fund offers three classes of shares. Class A shares are generally sold subject to a sales charge imposed at time of purchase. Class B and Class C shares are sold at net asset value and are generally subject to a contingent deferred sales charge (see Note 5). Class B shares automatically convert to Class A shares eight years after their purchase as described in the Fund's prospectus. Each class represents a pro-rata interest in the Fund, but votes separately on class-specific matters and (as noted below) is subject to different expenses. Realized and unrealized gains and losses are allocated daily to each class of shares based on the relative net ass ets of each class to the total net assets of the Fund. Net investment income, other than class-specific expenses, is allocated daily to each class of shares based upon the ratio of the value of each class's paid shares to the total value of all paid shares. Each class of shares differs in its distribution plan and certain other class-specific expenses. The Fund invests all of its investable assets in interests in the High Income Portfolio (the Portfolio), a New York trust, having the same investment objective and policies as the Fund. The value of the Fund's investment in the Portfolio reflects the Fund's proportionate interest in the net assets of the Portfolio (73.6% at October 31, 2007). The performance of the Fund is directly affected by the performance of the Portfolio. The financial statements of the Portfolio, including the portfolio of investments, are included elsewhere in this report and should be read in conjunction with the Fund's financial statements.
The following is a summary of significant accounting policies of the Fund. The policies are in conformity with accounting principles generally accepted in the United States of America.
A Investment Valuation — Valuation of securities by the Portfolio is discussed in Note 1A of the Portfolio's Notes to Financial Statements, which are included elsewhere in this report.
B Income — The Fund's net investment income or loss consists of the Fund's pro-rata share of the net investment income or loss of the Portfolio, less all actual and accrued expenses of the Fund.
C Federal Taxes — The Fund's policy is to comply with the provisions of the Internal Revenue Code applicable to regulated investment companies and to distribute to shareholders each year substantially all of its net investment income, and all or substantially all of its net realized capital gains. Accordingly, no provision for federal income or excise tax is necessary. At October 31, 2007, the Fund, for federal income tax purposes, had a capital loss carryforward of $370,656,452, which will reduce the Fund's taxable income arising from future net realized gains on investment transactions, if any, to the extent permitted by the Internal Revenue Code and thus will reduce the amount of distributions to shareholders which would otherwise be necessary to relieve the Fund of an y liability for federal income or excise tax. The capital loss carryforward will expire on October 31, 2009 ($227,375,994), and October 31, 2010 ($143,280,458). During the year ended October 31, 2007, a capital loss carryforward of $14,854,546 was utilized to offset net realized gains by the Fund.
D Expenses — The majority of expenses of the Trust are directly identifiable to an individual fund. Expenses which are not readily identifiable to a specific fund are allocated taking into consideration, among other things, the nature and type of expense and the relative size of the funds.
E Expense Reduction — State Street Bank and Trust Company (SSBT) serves as custodian of the Fund. Pursuant to the custodian agreement, SSBT receives a fee reduced by credits, which are determined based on the average daily cash balance the Fund maintains with SSBT. All credit balances, if any, used to reduce the Fund's custodian fees are reported as a reduction of expenses in the Statement of Operations.
F Use of Estimates — The preparation of the financial statements in conformity with accounting principles generally accepted in the United States of America requires management to make estimates and assumptions that affect the reported amounts of assets and liabilities at the date of the financial statements and the reported amounts of income and expense during the reporting period. Actual results could differ from those estimates.
G Indemnifications — Under the Trust's organizational documents, its officers and Trustees may be indemnified against certain liabilities and expenses arising out of the performance of their duties to the Fund, and shareholders are indemnified against personal liability for obligations of the Trust. Additionally, in the normal course of business, the Fund enters into agreements with service
9
Eaton Vance High Income Fund as of October 31, 2007
NOTES TO FINANCIAL STATEMENTS CONT'D
providers that may contain indemnification clauses. The Fund's maximum exposure under these arrangements is unknown as this would involve future claims that may be made against the Fund that have not yet occurred.
H Redemption Fees — Upon the redemption or exchange of shares by Class A shareholders within 90 days of the settlement of purchase, a fee of 1% of the current net asset value of these shares will be assessed and retained by the Fund for the benefit of the remaining shareholders. The redemption fee is accounted for as an addition to paid-in capital.
I Other — Investment transactions are accounted for on a trade date basis. Dividends to shareholders are recorded on the ex-dividend date.
2 Distributions to Shareholders
The Fund declares dividends daily to shareholders of record at the time of declaration. Distributions are generally paid monthly. Distributions of realized capital gains, if any, are made at least annually. Distributions are declared seperately for each class of shares. Shareholders may reinvest income and capital gain distributions in additional shares of the same class of the Fund at the net asset value as of the ex-dividend date or, at the election of the shareholder, receive distributions in cash. The Fund distinguishes between distributions on a tax basis and a financial reporting basis. Accounting principles generally accepted in the United States of America require that only distributions in excess of tax basis earnings and profits be reported in the financial statements as a return of capital. Permanent differences between book and tax accounting relating to distributions are reclassified to paid-in capital.
The tax character of distributions declared for the years ended October 31, 2007 and October 31, 2006 was as follows:
| | | Year ended October 31, | |
| | | 2007 | | 2006 | |
| Distributions declared from: | |
| Ordinary income | | $ | 50,958,710 | | | $ | 51,134,588 | | |
During the year ended October 31, 2007, paid-in capital was decreased by $8,883, distributions in excess of net investment income was decreased by $968,034 and accumulated net realized loss was increased by $959,151 due to differences between book and tax accounting, primarily for premium amortization, foreign currency gain/loss and swap contracts. These reclassifications had no effect on the net assets or net asset value per share of the Fund.
As of October 31, 2007, the components of distributable earnings (accumulated losses) and unrealized appreciation (depreciation) on a tax basis were as follows:
| Undistributed ordinary income | | $ | 1,577,335 | | |
| Capital loss carryforward | | $ | (370,656,452 | ) | |
| Unrealized depreciation | | $ | (8,459,203 | ) | |
| Other temporary differences | | $ | (2,294,326 | ) | |
The differences between components of distributable earnings (accumulated losses) on a tax basis and the amounts reflected in the Statement of Assets and Liabilities are primarily due to premium amortization, wash sales, the timing of recognizing distributions to shareholders, and differences between book and tax accounting for partnership allocations.
3 Transactions with Affiliates
Eaton Vance Management (EVM) serves as the administrator of the Fund, but receives no compensation. The Portfolio has engaged Boston Management and Research (BMR), a subsidiary of EVM, to render investment advisory services. See Note 2 of the Portfolio's Notes to Financial Statements which are included elsewhere in this report. EVM serves as the sub-transfer agent of the Fund and receives from the transfer agent an aggregate fee based upon the actual expenses incurred by EVM in the performance of these services. For the year ended October 31, 2007, EVM earned $41,792 in sub-transfer agent fees. The Fund was informed that Eaton Vance Distributors, Inc. (EVD), a subsidiary of EVM and the Fund's principal underwriter, received $40,000 as its portion of the sales charges on sales of Class A shares for the year ended October 31, 2007. EVD also received distribution and service fees from Class A, Class B and Class C shares (see Note 4) and contingent deferred sales charges (see Note 5).
Except for Trustees of the Fund and the Portfolio who are not members of EVM's or BMR's organizations, officers and Trustees receive remuneration for their services to the Fund out of the investment advisory fee. Certain officers and Trustees of the Fund and the Portfolio are officers of the above organizations.
4 Distribution Plans
The Fund has in effect a distribution plan for Class A shares (Class A Plan) pursuant to Rule 12b-1 under the 1940 Act.
10
Eaton Vance High Income Fund as of October 31, 2007
NOTES TO FINANCIAL STATEMENTS CONT'D
The Class A Plan provides that the Fund will pay EVD a distribution and service fee of 0.25% per annum of its average daily net assets attributable to Class A shares for distribution services and facilities provided to the Fund by EVD, as well as for personal services and/or the maintenance of shareholder accounts. Distribution and service fees paid or accrued to EVD for the year ended October 31, 2007 for Class A shares amounted to $616,286. The Fund also has in effect distribution plans for Class B shares (Class B Plan) and Class C shares (Class C Plan) pursuant to Rule 12b-1 under the 1940 Act. The Class B and Class C Plans require the Fund to pay EVD amounts equal to 0.75% per annum of the Fund's average daily net assets attributable to Class B and Class C shares for providing ongoing distribution services and facilities to the Fund. The Fund will automatically discontinue payments to EVD during any period in which there are no outstanding Uncovered Distribution Charges, which are equivalent to the sum of (i) 5% and 6.25% of the aggregate amount received by the Fund for Class B and Class C shares sold, respectively, plus (ii) interest calculated by applying the rate of 1% over the prevailing prime rate to the outstanding balance of Uncovered Distribution Charges of EVD of each respective class, reduced by the aggregate amount of contingent deferred sales charges (see Note 5) and amounts theretofore paid or payable to EVD by each respective class. For the year ended October 31, 2007, the Fund paid or accrued to EVD $2,032,794 and $1,299,265 for Class B and Class C shares, respectively, representing 0.75% of the average daily net assets of Class B and Class C shares. At October 31, 2007, the amounts of Uncovered Distribution Charges of EVD calculated under the Plans were approximately $22,284,000 and $43,659,000 for Class B and Class C shares, respectively. The Class B and Class C Plans also authorize the Fund to make payments of service fees to EVD, investment dealers, and other persons in amounts not exceeding 0.25% per annum of the Fund's average daily net assets attributable to that class. Service fees paid or accrued are for personal services and/or the maintenance of shareholder accounts. They are separate and distinct from the sales commissions and distribution fees payable to EVD and, as such, are not subject to automatic discontinuance when there are no outstanding Uncovered Distribution Charges of EVD. Service fees paid or accrued for the year ended October 31, 2007 amounted to $677,598 and $433,088 for Class B and Class C shares, respectively.
5 Contingent Deferred Sales Charges
A contingent deferred sales charge (CDSC) generally is imposed on redemptions of Class B shares made within six years of purchase and on redemptions of Class C shares made within one year of purchase. Class A shares may be subject to a 1% CDSC if redeemed within eighteen months of purchase (depending on the circumstances of purchase). Generally, the CDSC is based upon the lower of the net asset value at date of redemption or date of purchase. No charge is levied on shares acquired by reinvestment of dividends or capital gains distributions. The CDSC for Class B shares is imposed at declining rates that begin at 5% in the case of redemptions in the first and second year after purchase, declining one percentage point each subsequent year. Class C shares are subject to a 1% CDSC if redeemed within one year of purchase. No CDSC is levied on shares which have bee n sold to EVM or its affiliates or to their respective employees or clients and may be waived under certain other limited conditions. CDSCs received on Class B and Class C redemptions are paid to EVD to reduce the amount of Uncovered Distribution Charges calculated under the Fund's Class B and Class C Plans. CDSCs received on Class B and Class C redemptions when no Uncovered Distribution Charges exist are credited to the Fund. For the year ended October 31, 2007, the Fund was informed that EVD received approximately $29,000, $425,000, and $19,000 of CDSCs paid by Class A, Class B and Class C shareholders, respectively.
6 Investment Transactions
Increases and decreases in the Fund's investment in the Portfolio aggregated $147,639,181 and $228,594,870, respectively, for the year ended October 31, 2007.
7 Shares of Beneficial Interest
The Fund's Declaration of Trust permits the Trustees to issue an unlimited number of full and fractional shares of beneficial interest (without par value). Such shares may be issued in a number of different series (such as the Fund) and classes. Transactions in Fund shares were as follows:
| | | Year Ended October 31, | |
| Class A | | 2007 | | 2006 | |
| Sales | | | 19,787,228 | | | | 10,492,618 | | |
Issued to shareholders electing to
receive payments of distributions
in Fund shares | | | 1,539,130 | | | | 1,109,833 | | |
| Redemptions | | | (16,113,233 | ) | | | (5,808,810 | ) | |
| Exchange from Class B shares | | | 6,230,723 | | | | 4,022,524 | | |
| Net increase | | | 11,443,848 | | | | 9,816,165 | | |
11
Eaton Vance High Income Fund as of October 31, 2007
NOTES TO FINANCIAL STATEMENTS CONT'D
| | | Year Ended October 31, | |
| Class B | | 2007 | | 2006 | |
| Sales | | | 2,627,637 | | | | 3,159,504 | | |
Issued to shareholders electing to
receive payments of distributions
in Fund shares | | | 1,530,122 | | | | 1,976,003 | | |
| Redemptions | | | (13,168,211 | ) | | | (19,394,106 | ) | |
| Exchange to Class A shares | | | (6,242,616 | ) | | | (4,029,508 | ) | |
| Net decrease | | | (15,253,068 | ) | | | (18,288,107 | ) | |
| | | Year Ended October 31, | |
| Class C | | 2007 | | 2006 | |
| Sales | | | 5,490,216 | | | | 5,414,798 | | |
Issued to shareholders electing to
receive payments of distributions
in Fund shares | | | 941,950 | | | | 1,005,116 | | |
| Redemptions | | | (7,727,036 | ) | | | (10,502,329 | ) | |
| Net decrease | | | (1,294,870 | ) | | | (4,082,415 | ) | |
For the years ended October 31, 2007 and October 31, 2006, the Fund received $10,279 and $4,435, respectively, in redemption fees on Class A shares.
8 Recently Issued Accounting Pronouncements
In June 2006, the Financial Accounting Standards Board (FASB) issued FASB Interpretation No. 48 (FIN 48), "Accounting for Uncertainty in Income Taxes – an interpretation of FASB Statement No. 109". FIN 48 clarifies the accounting for uncertainty in income taxes recognized in accordance with FASB Statement No. 109, "Accounting for Income Taxes". This interpretation prescribes a recognition threshold and measurement attribute for the financial statement recognition and measurement of a tax position taken or expected to be taken in a tax return. It also provides guidance on de-recognition, classification, interest and penalties, accounting in interim periods, disclosure and transition. FIN 48 is effective on the last business day of the first required financial reporting period for fiscal years beginning after December 15, 2006. Management is currently evaluating the impact of applying the various provisions of FIN 48.
In September 2006, the FASB issued Statement of Financial Accounting Standards No. 157 (FAS 157), "Fair Value Measurements". FAS 157 defines fair value, establishes a framework for measuring fair value in accordance with generally accepted accounting principles and expands disclosure about fair value measurements. FAS 157 is effective for fiscal years beginning after November 15, 2007. Management is currently evaluating the impact the adoption of FAS 157 will have on the Fund's financial statement disclosures.
12
Eaton Vance High Income Fund as of October 31, 2007
REPORT OF INDEPENDENT REGISTERED PUBLIC ACCOUNTING FIRM
To the Trustees of Eaton Vance Mutual Funds Trust and Shareholders of Eaton Vance High Income Fund:
We have audited the accompanying statement of assets and liabilities of Eaton Vance High Income Fund ("the Fund") (one of the series of Eaton Vance Mutual Funds Trust) as of October 31, 2007, and the related statement of operations for the year then ended, the statements of changes in net assets for each of the two years in the period then ended, and the financial highlights for each of the five years in the period then ended. These financial statements and financial highlights are the responsibility of the Fund's management. Our responsibility is to express an opinion on these financial statements and financial highlights based on our audits.
We conducted our audits in accordance with the standards of the Public Company Accounting Oversight Board (United States). Those standards require that we plan and perform the audit to obtain reasonable assurance about whether the financial statements and financial highlights are free of material misstatement. The Fund is not required to have, nor were we engaged to perform, an audit of its internal control over financial reporting. Our audits included consideration of internal control over financial reporting as a basis for designing audit procedures that are appropriate in the circumstances, but not for the purpose of expressing an opinion on the effectiveness of the Fund's internal control over financial reporting. Accordingly, we express no such opinion. An audit also includes examining, on a test basis, evidence supporting the amounts and disclosures in the financial statements, assessing the accounting principles used and significant estimates made by management, as well as evaluating the overall financial statement presentation. We believe that our audits provide a reasonable basis for our opinion.
In our opinion, the financial statements and financial highlights referred to above present fairly, in all material respects, the financial position of Eaton Vance High Income Fund as of October 31, 2007, the results of its operations for the year then ended, the changes in its net assets for each of the two years in the period then ended, and the financial highlights for each of the five years in the period then ended, in conformity with accounting principles generally accepted in the United States of America.
DELOITTE & TOUCHE LLP
Boston, Massachusetts
December 17, 2007
13
Eaton Vance High Income Fund as of October 31, 2007
FEDERAL TAX INFORMATION (Unaudited)
The Form 1099-DIV you receive in January 2008 will show the tax status of all distributions paid to your account in calendar 2007. Shareholders are advised to consult their own tax adviser with respect to the tax consequences of their investment in the Fund.
Qualified Dividend Income. The Fund designates approximately $519,147, or up to the maximum amount of such dividend allowable pursuant to the Internal Revenue Code, as qualified dividend income eligible for the reduced tax rate of 15%.
Dividends Received Deduction. Corporate shareholders are generally entitled to take the dividends received deduction on the portion of the Fund's dividend distribution that qualifies under tax law. For the Fund's fiscal 2007 ordinary income dividends, 1.09% qualifies for the corporate dividends received deduction.
14
High Income Portfolio as of October 31, 2007
PORTFOLIO OF INVESTMENTS
| Senior Floating-Rate Interests — 13.7%(1) | |
| Security | | Principal
Amount | | Value | |
| Aerospace — 0.3% | |
Hawker Beechcraft Acquisition, Term Loan,
5.20%, Maturing 3/26/14 | | $ | 2,528,291 | | | $ | 2,477,922 | | |
| | | $ | 2,477,922 | | |
| Automotive & Auto Parts — 0.3% | |
EPD Holdings, Term Loan,
10.71%, Maturing 7/13/15 | | $ | 2,560,000 | | | $ | 2,478,932 | | |
| | | $ | 2,478,932 | | |
| Broadcasting — 1.0% | |
HIT Entertainment Inc., Term Loan,
10.86%, Maturing 2/5/13 | | $ | 9,180,000 | | | $ | 8,766,900 | | |
| | | $ | 8,766,900 | | |
| Building Materials — 0.7% | |
PLY GEM Industries, Inc., Term Loan,
7.95%, Maturing 8/15/11 | | $ | 6,964,987 | | | $ | 6,557,536 | | |
| | | $ | 6,557,536 | | |
| Capital Goods — 0.4% | |
Dresser, Inc., Term Loan,
7.99%, Maturing 5/4/14 | | $ | 2,147,883 | | | $ | 2,108,282 | | |
Dresser, Inc., Term Loan,
11.13%, Maturing 5/4/15 | | | 1,080,000 | | | | 1,055,025 | | |
| | | $ | 3,163,307 | | |
| Consumer Products — 0.2% | |
Amscan Holdings, Inc., Term Loan,
7.56%, Maturing 5/25/13 | | $ | 1,542,250 | | | $ | 1,495,983 | | |
| | | $ | 1,495,983 | | |
| Energy — 0.7% | |
SandRidge Energy Inc., Term Loan,
8.63%, Maturing 4/1/13 | | $ | 6,240,000 | | | $ | 6,162,000 | | |
| | | $ | 6,162,000 | | |
| Food Service — 0.1% | |
ARAMARK Corp., Term Loan,
Maturing 1/26/14(2) | | $ | 896,708 | | | $ | 876,644 | | |
| | | $ | 876,644 | | |
| Security | | Principal
Amount | | Value | |
| Gaming — 1.4% | |
BLB Worldwide Holdings, Term Loan,
9.72%, Maturing 6/30/12 | | $ | 5,410,000 | | | $ | 5,098,925 | | |
Cannery Casino Resorts, LLC, Term Loan,
9.76%, Maturing 5/18/14 | | | 1,580,000 | | | | 1,520,750 | | |
Great Lakes Entertainment, Term Loan,
9.00%, Maturing 8/15/12 | | | 5,423,413 | | | | 5,328,503 | | |
| | | $ | 11,948,178 | | |
| Healthcare — 1.4% | |
Advanced Medical Optics, Inc., Term Loan,
7.03%, Maturing 4/2/14 | | $ | 1,393,000 | | | $ | 1,344,245 | | |
Community Health Systems, Inc., Term Loan,
0.00%, Maturing 7/25/14(3) | | | 98,995 | | | | 96,829 | | |
Community Health Systems, Inc., Term Loan,
7.76%, Maturing 7/25/14 | | | 1,501,005 | | | | 1,468,171 | | |
HCA, Inc., Term Loan,
7.45%, Maturing 11/18/13 | | | 9,269,950 | | | | 9,072,278 | | |
| | | $ | 11,981,523 | | |
| Homebuilders / Real Estate — 0.7% | |
Realogy Corp., Term Loan,
4.97%, Maturing 9/1/14 | | $ | 1,470,000 | | | $ | 1,370,040 | | |
Realogy Corp., Term Loan,
8.24%, Maturing 9/1/14 | | | 5,446,350 | | | | 5,075,998 | | |
| | | $ | 6,446,038 | | |
| Insurance — 0.1% | |
U.S.I. Holdings Corp., Term Loan,
7.95%, Maturing 5/4/14 | | $ | 1,356,600 | | | $ | 1,336,251 | | |
| | | $ | 1,336,251 | | |
| Publishing / Printing — 1.9% | |
Houghton Mifflin, Inc., Term Loan,
11.94%, Maturing 12/21/07 | | $ | 2,554,783 | | | $ | 2,556,380 | | |
Laureate Education, Inc., Term Loan,
Maturing 8/22/15(2) | | | 2,010,000 | | | | 1,929,600 | | |
Laureate Education, Inc., Term Loan,
9.21%, Maturing 8/22/15 | | | 5,450,000 | | | | 5,313,750 | | |
Laureate Education, Inc., Term Loan,
9.44%, Maturing 8/22/15 | | | 3,300,000 | | | | 3,287,475 | | |
Laureate Education, Inc., Term Loan,
10.73%, Maturing 5/22/08 | | | 3,930,000 | | | | 3,871,050 | | |
| | | $ | 16,958,255 | | |
See notes to financial statements
15
High Income Portfolio as of October 31, 2007
PORTFOLIO OF INVESTMENTS CONT'D
| Security | | Principal
Amount | | Value | |
| Services — 1.3% | |
Adesa, Inc., Term Loan,
7.45%, Maturing 10/18/13 | | $ | 5,406,450 | | | $ | 5,239,910 | | |
Catalina Marketing Corp., Term Loan,
Maturing 10/1/08(2) | | | 2,965,000 | | | | 2,920,525 | | |
Neff Rental, Inc., Term Loan,
8.90%, Maturing 5/31/13 | | | 1,310,000 | | | | 1,186,641 | | |
Rental Service Corp., Term Loan,
8.75%, Maturing 11/30/13 | | | 1,854,309 | | | | 1,812,587 | | |
| | | $ | 11,159,663 | | |
| Super Retail — 0.7% | |
Claire's Stores, Inc., Term Loan,
7.95%, Maturing 5/24/14 | | $ | 6,443,850 | | | $ | 6,092,460 | | |
| | | $ | 6,092,460 | | |
| Telecommunications — 2.5% | |
Intelsat Bermuda, Ltd., Term Loan,
7.86%, Maturing 2/1/14 | | $ | 2,500,000 | | | $ | 2,478,125 | | |
Level 3 Communications, Inc., Term Loan,
7.49%, Maturing 3/13/14 | | | 4,280,000 | | | | 4,178,645 | | |
Telesat Canada, Term Loan,
Maturing 10/31/08(2) | | | 15,150,000 | | | | 15,150,000 | | |
| | | $ | 21,806,770 | | |
Total Senior Floating-Rate Interests
(identified cost $122,640,851) | | | | | | $ | 119,708,362 | | |
| Corporate Bonds & Notes — 80.9% | |
| Security | | Principal
Amount
(000's omitted) | | Value | |
| Aerospace — 0.5% | |
Alion Science and Technologies, Corp.,
10.25%, 2/1/15 | | $ | 1,625 | | | $ | 1,527,501 | | |
| Bombardier, Inc., 8.00%, 11/15/14(4) | | | 1,510 | | | | 1,577,950 | | |
DRS Technologies, Inc., Sr. Sub. Notes,
7.625%, 2/1/18 | | | 935 | | | | 960,712 | | |
| | | $ | 4,066,163 | | |
| Air Transportation — 0.2% | |
| Continental Airlines, 7.033%, 6/15/11 | | $ | 1,369 | | | $ | 1,330,200 | | |
| | | $ | 1,330,200 | | |
| Security | | Principal
Amount
(000's omitted) | | Value | |
| Automotive & Auto Parts — 3.9% | |
| Altra Industrial Motion, Inc., 9.00%, 12/1/11 | | $ | 3,965 | | | $ | 4,004,650 | | |
American Axle & Manufacturing, Inc.,
7.875%, 3/1/17 | | | 1,620 | | | | 1,587,600 | | |
Commercial Vehicle Group, Inc., Sr. Notes,
8.00%, 7/1/13 | | | 1,230 | | | | 1,186,950 | | |
| Ford Motor Credit Co., 7.375%, 10/28/09 | | | 9,280 | | | | 8,954,151 | | |
| Ford Motor Credit Co., 7.875%, 6/15/10 | | | 4,405 | | | | 4,249,010 | | |
| Ford Motor Credit Co., Sr. Notes, 5.80%, 1/12/09 | | | 910 | | | | 878,171 | | |
| Ford Motor Credit Co., Sr. Notes, 9.875%, 8/10/11 | | | 190 | | | | 189,859 | | |
| General Motors Acceptance Corp., 5.85%, 1/14/09 | | | 1,140 | | | | 1,100,322 | | |
| General Motors Acceptance Corp., 6.808%, 5/15/09 | | | 955 | | | | 898,865 | | |
| General Motors Acceptance Corp., 7.00%, 2/1/12 | | | 470 | | | | 429,624 | | |
| General Motors Acceptance Corp., 7.25%, 3/2/11 | | | 5,205 | | | | 4,925,330 | | |
| General Motors Acceptance Corp., 7.75%, 1/19/10 | | | 1,408 | | | | 1,363,566 | | |
Goodyear Tire & Rubber Co., Sr. Notes, Variable Rate,
9.135%, 12/1/09 | | | 2,150 | | | | 2,187,625 | | |
United Components, Inc., Sr. Sub. Notes,
9.375%, 6/15/13 | | | 1,670 | | | | 1,711,750 | | |
| Venture Holding Trust, Sr. Notes, 9.50%, 7/1/05(5) | | | 3,811 | | | | 19,055 | | |
| | | $ | 33,686,528 | | |
| Broadcasting — 0.3% | |
Rainbow National Services, LLC, Sr. Sub. Debs.,
10.375%, 9/1/14(4) | | $ | 2,395 | | | $ | 2,646,475 | | |
| | | $ | 2,646,475 | | |
| Building Materials — 2.3% | |
| Interface, Inc., Sr. Sub. Notes, 9.50%, 2/1/14 | | $ | 745 | | | $ | 789,700 | | |
Interline Brands, Inc., Sr. Sub. Notes,
8.125%, 6/15/14 | | | 1,555 | | | | 1,558,887 | | |
| Nortek, Inc., Sr. Sub. Notes, 8.50%, 9/1/14 | | | 10,710 | | | | 9,531,900 | | |
NTK Holdings, Inc., Sr. Disc. Notes,
10.75%, (0% until 2009), 3/1/14 | | | 4,345 | | | | 2,867,700 | | |
Panolam Industries International, Sr. Sub. Notes,
10.75%, 10/1/13(4) | | | 5,185 | | | | 4,951,675 | | |
| | | $ | 19,699,862 | | |
| Cable / Satellite TV — 2.3% | |
| CCH I Holdings, LLC, 11.75%, 5/15/14 | | $ | 1,080 | | | $ | 947,700 | | |
| CCH I, LLC/CCH I Capital Co., 11.00%, 10/1/15 | | | 3,455 | | | | 3,368,625 | | |
CCH II, LLC/CCH II Capital Co., Sr. Notes,
10.25%, 9/15/10 | | | 3,150 | | | | 3,220,875 | | |
See notes to financial statements
16
High Income Portfolio as of October 31, 2007
PORTFOLIO OF INVESTMENTS CONT'D
| Security | | Principal
Amount
(000's omitted) | | Value | |
| Cable / Satellite TV (continued) | |
CCO Holdings, LLC/CCO Capital Corp., Sr. Notes,
8.75%, 11/15/13 | | $ | 5,240 | | | $ | 5,266,200 | | |
| CSC Holdings, Inc., 6.75%, 4/15/12 | | | 1,435 | | | | 1,395,537 | | |
| CSC Holdings, Inc., Sr. Notes, 7.875%, 12/15/07 | | | 15 | | | | 15,056 | | |
Insight Communications, Sr. Disc. Notes,
12.25%, 2/15/11 | | | 2,210 | | | | 2,292,875 | | |
| Kabel Deutschland GmbH, 10.625%, 7/1/14 | | | 3,065 | | | | 3,340,850 | | |
| | | $ | 19,847,718 | | |
| Capital Goods — 1.4% | |
| American Railcar Industry, 7.50%, 3/1/14 | | $ | 1,620 | | | $ | 1,607,850 | | |
Chart Industries, Inc., Sr. Sub. Notes,
9.125%, 10/15/15 | | | 2,370 | | | | 2,482,575 | | |
| ESCO Corp., Sr. Notes, 8.625%, 12/15/13(4) | | | 1,720 | | | | 1,758,700 | | |
ESCO Corp., Sr. Notes, Variable Rate,
9.569%, 12/15/13(4) | | | 1,720 | | | | 1,728,600 | | |
| RBS Global & Rexnord Corp., 9.50%, 8/1/14 | | | 2,105 | | | | 2,183,937 | | |
| RBS Global & Rexnord Corp., 11.75%, 8/1/16 | | | 1,870 | | | | 1,991,550 | | |
| | | $ | 11,753,212 | | |
| Chemicals — 1.6% | |
Equistar Chemical, Sr. Notes,
10.625%, 5/1/11 | | $ | 1,694 | | | $ | 1,778,700 | | |
| INEOS Group Holdings PLC, 8.50%, 2/15/16(4) | | | 4,395 | | | | 4,197,225 | | |
Nova Chemicals Corp., Sr. Notes, Variable Rate,
8.484%, 11/15/13 | | | 2,325 | | | | 2,295,937 | | |
Reichhold Industries, Inc., Sr. Notes,
9.00%, 8/15/14(4) | | | 5,520 | | | | 5,630,400 | | |
| | | $ | 13,902,262 | | |
| Consumer Products — 1.1% | |
Amscan Holdings, Inc., Sr. Sub. Notes,
8.75%, 5/1/14 | | $ | 5,705 | | | $ | 5,419,750 | | |
Revlon Consumer Products Corp., Sr. Sub. Notes,
8.625%, 2/1/08 | | | 3,975 | | | | 3,885,562 | | |
| | | $ | 9,305,312 | | |
| Containers — 1.1% | |
Intertape Polymer US, Inc., Sr. Sub. Notes,
8.50%, 8/1/14 | | $ | 3,855 | | | $ | 3,604,425 | | |
| Pliant Corp. (PIK), 11.85%, 6/15/09 | | | 5,738 | | | | 5,854,375 | | |
| | | $ | 9,458,800 | | |
| Security | | Principal
Amount
(000's omitted) | | Value | |
| Diversified Financial Services — 1.6% | |
| E*Trade Financial Corp., 7.875%, 12/1/15 | | $ | 4,235 | | | $ | 4,044,425 | | |
| Nuveen Investments, Inc., 5.00%, 9/15/10 | | | 515 | | | | 452,441 | | |
Nuveen Investments, Inc., Sr. Notes,
10.50%, 11/15/15(4) | | | 3,495 | | | | 3,543,056 | | |
Residential Capital LLC, Sub. Notes, Variable Rate,
8.044%, 4/17/09(4) | | | 9,495 | | | | 5,898,769 | | |
| | | $ | 13,938,691 | | |
| Diversified Media — 1.9% | |
| Affinion Group, Inc., 10.125%, 10/15/13 | | $ | 1,125 | | | $ | 1,178,437 | | |
| Affinion Group, Inc., 11.50%, 10/15/15 | | | 1,580 | | | | 1,655,050 | | |
| CanWest Media, Inc., 8.00%, 9/15/12 | | | 8,653 | | | | 8,479,791 | | |
LBI Media, Inc., Sr. Disc. Notes, 11.00%,
(0.00% until 2008), 10/15/13 | | | 2,760 | | | | 2,542,650 | | |
| Nielsen Finance, LLC, 10.00%, 8/1/14 | | | 1,985 | | | | 2,099,137 | | |
Warner Music Group, Sr. Sub. Notes,
7.375%, 4/15/14 | | | 510 | | | | 455,175 | | |
| | | $ | 16,410,240 | | |
| Energy — 9.0% | |
| Alliant Holdings I, Inc., 11.00%, 5/1/15(4) | | $ | 1,795 | | | $ | 1,732,175 | | |
| Allis-Chalmers Energy, Inc., 8.50%, 3/1/17 | | | 1,050 | | | | 1,031,625 | | |
Allis-Chalmers Energy, Inc., Sr. Notes,
9.00%, 1/15/14 | | | 4,995 | | | | 5,082,412 | | |
| Cimarex Energy Co., Sr. Notes, 7.125%, 5/1/17 | | | 1,375 | | | | 1,380,156 | | |
| Clayton Williams Energy, Inc., 7.75%, 8/1/13 | | | 2,385 | | | | 2,247,862 | | |
| Compton Pet Finance Corp., 7.625%, 12/1/13 | | | 2,545 | | | | 2,449,562 | | |
Denbury Resources, Inc., Sr. Sub. Notes,
7.50%, 12/15/15 | | | 595 | | | | 606,900 | | |
| El Paso Corp., Sr. Notes, 9.625%, 5/15/12 | | | 2,880 | | | | 3,152,926 | | |
Encore Acquisition Co., Sr. Sub. Notes,
7.25%, 12/1/17 | | | 1,870 | | | | 1,799,875 | | |
Inergy L.P./Finance, Sr. Notes,
6.875%, 12/15/14 | | | 4,700 | | | | 4,629,500 | | |
Ocean Rig Norway AS, Sr. Notes,
8.375%, 7/1/13(4) | | | 2,745 | | | | 2,820,487 | | |
| OPTI Canada, Inc., 7.875%, 12/15/14(4) | | | 1,915 | | | | 1,910,212 | | |
| OPTI Canada, Inc., 8.25%, 12/15/14(4) | | | 2,135 | | | | 2,151,012 | | |
| Parker Drilling Co., Sr. Notes, 9.625%, 10/1/13 | | | 665 | | | | 713,212 | | |
| Petrohawk Energy Corp., 9.125%, 7/15/13 | | | 9,200 | | | | 9,809,500 | | |
| Petroplus Finance, Ltd., 6.75%, 5/1/14(4) | | | 200 | | | | 191,000 | | |
| Petroplus Finance, Ltd., 7.00%, 5/1/17(4) | | | 3,145 | | | | 2,972,025 | | |
Plains Exploration & Production Co.,
7.00%, 3/15/17 | | | 2,955 | | | | 2,822,025 | | |
See notes to financial statements
17
High Income Portfolio as of October 31, 2007
PORTFOLIO OF INVESTMENTS CONT'D
| Security | | Principal
Amount
(000's omitted) | | Value | |
| Energy (continued) | |
| Quicksilver Resources, Inc., 7.125%, 4/1/16 | | $ | 2,445 | | | $ | 2,420,550 | | |
| RAM Energy, Inc., Sr. Notes, 11.50%, 2/15/08 | | | 4,602 | | | | 4,648,020 | | |
| SemGroup L.P., Sr. Notes, 8.75%, 11/15/15(4) | | | 6,330 | | | | 6,108,450 | | |
| SESI, LLC, 6.875%, 6/1/14 | | | 700 | | | | 682,500 | | |
Stewart & Stevenson, LLC, Sr. Notes,
10.00%, 7/15/14 | | | 4,255 | | | | 4,393,287 | | |
| United Refining Co., Sr. Notes, 10.50%, 8/15/12 | | | 11,420 | | | | 11,862,525 | | |
| VeraSun Energy Corp., 9.875%, 12/15/12 | | | 1,240 | | | | 1,235,350 | | |
| | | $ | 78,853,148 | | |
| Entertainment / Film — 1.3% | |
| AMC Entertainment, Inc., 11.00%, 2/1/16 | | $ | 2,570 | | | $ | 2,794,875 | | |
Marquee Holdings, Inc., Sr. Disc. Notes,
9.505%, 8/15/14 | | | 9,605 | | | | 8,188,262 | | |
| | | $ | 10,983,137 | | |
| Environmental — 0.6% | |
Waste Services, Inc., Sr. Sub. Notes,
9.50%, 4/15/14 | | $ | 5,390 | | | $ | 5,416,950 | | |
| | | $ | 5,416,950 | | |
| Food & Drug Retail — 1.3% | |
| Rite Aid Corp., 8.625%, 3/1/15 | | $ | 1,570 | | | $ | 1,401,225 | | |
| Rite Aid Corp., 9.375%, 12/15/15(4) | | | 1,765 | | | | 1,637,037 | | |
| Rite Aid Corp., 9.50%, 6/15/17(4) | | | 9,158 | | | | 8,516,940 | | |
| | | $ | 11,555,202 | | |
| Food / Beverage / Tobacco — 1.2% | |
ASG Consolidated, LLC/ASG Finance, Inc.,
Sr. Disc. Notes, 11.50%,
(0.00% until 2008), 11/1/11 | | $ | 6,270 | | | $ | 5,831,100 | | |
| Dole Foods Co., 7.25%, 6/15/10 | | | 3,995 | | | | 3,815,225 | | |
| Dole Foods Co., Sr. Notes, 8.625%, 5/1/09 | | | 870 | | | | 878,700 | | |
| | | $ | 10,525,025 | | |
| Gaming — 9.3% | |
Buffalo Thunder Development Authority,
9.375%, 12/15/14(4) | | $ | 4,410 | | | $ | 4,145,400 | | |
| CCM Merger, Inc., 8.00%, 8/1/13(4) | | | 2,435 | | | | 2,349,775 | | |
Chukchansi EDA, Sr. Notes, Variable Rate,
8.859%, 11/15/12(4) | | | 2,595 | | | | 2,607,975 | | |
| Eldorado Casino Shreveport (PIK), 10.00%, 8/1/12 | | | 990 | | | | 994,458 | | |
| Fontainebleau Las Vegas, LLC, 10.25%, 6/15/15(4) | | | 9,480 | | | | 8,911,200 | | |
| Security | | Principal
Amount
(000's omitted) | | Value | |
| Gaming (continued) | |
Galaxy Entertainment Finance,
9.875%, 12/15/12(4) | | $ | 505 | | | $ | 544,137 | | |
Galaxy Entertainment Finance, Variable Rate,
10.409%, 12/15/10(4) | | | 4,780 | | | | 4,971,200 | | |
Greektown Holdings, LLC, Sr. Notes,
10.75%, 12/1/13(4) | | | 1,225 | | | | 1,225,000 | | |
Indianapolis Downs, LLC & Capital Corp., Sr. Notes,
11.00%, 11/1/12(4) | | | 1,840 | | | | 1,858,400 | | |
Inn of the Mountain Gods, Sr. Notes,
12.00%, 11/15/10 | | | 4,945 | | | | 5,241,700 | | |
| Las Vegas Sands Corp., 6.375%, 2/15/15 | | | 390 | | | | 380,737 | | |
Majestic HoldCo, LLC, 12.50%,
(0.00% until 2008), 10/15/11(4) | | | 1,620 | | | | 1,158,300 | | |
| Majestic Star Casino, LLC, 9.50%, 10/15/10 | | | 3,505 | | | | 3,469,950 | | |
| MGM Mirage, Inc., 7.50%, 6/1/16 | | | 1,985 | | | | 1,982,519 | | |
Mohegan Tribal Gaming Authority, Sr. Sub. Notes,
8.00%, 4/1/12 | | | 1,570 | | | | 1,611,212 | | |
| OED Corp./Diamond Jo, LLC, 8.75%, 4/15/12 | | | 5,725 | | | | 5,739,312 | | |
Pinnacle Entertainment Inc., Sr. Sub. Notes,
7.50%, 6/15/15(4) | | | 2,795 | | | | 2,711,150 | | |
Pokagon Gaming Authority, Sr. Notes,
10.375%, 6/15/14(4) | | | 1,270 | | | | 1,409,700 | | |
| San Pasqual Casino, 8.00%, 9/15/13(4) | | | 1,335 | | | | 1,355,025 | | |
Seminole Hard Rock Entertainment, Variable Rate,
8.194%, 3/15/14(4) | | | 2,190 | | | | 2,151,675 | | |
| Station Casinos, Inc., 7.75%, 8/15/16 | | | 1,465 | | | | 1,441,194 | | |
| Station Casinos, Inc., Sr. Notes, 6.00%, 4/1/12 | | | 1,100 | | | | 1,025,750 | | |
| Trump Entertainment Resorts, Inc., 8.50%, 6/1/15 | | | 15,550 | | | | 13,256,375 | | |
Tunica-Biloxi Gaming Authority, Sr. Notes,
9.00%, 11/15/15(4) | | | 3,605 | | | | 3,767,225 | | |
Turning Stone Resort Casinos, Sr. Notes,
9.125%, 9/15/14(4) | | | 875 | | | | 910,000 | | |
Waterford Gaming, LLC, Sr. Notes,
8.625%, 9/15/14(4) | | | 6,266 | | | | 6,297,330 | | |
| | | $ | 81,516,699 | | |
| Healthcare — 6.0% | |
| Accellent, Inc., 10.50%, 12/1/13 | | $ | 2,465 | | | $ | 2,335,587 | | |
AMR HoldCo, Inc./EmCare HoldCo, Inc.,
Sr. Sub. Notes, 10.00%, 2/15/15 | | | 4,860 | | | | 5,188,050 | | |
Bausch & Lomb, Inc., Sr. Notes,
9.875%, 11/1/15(4) | | | 2,490 | | | | 2,570,925 | | |
| HCA, Inc., 7.875%, 2/1/11 | | | 1,720 | | | | 1,707,100 | | |
| HCA, Inc., 8.75%, 9/1/10 | | | 10,559 | | | | 10,796,577 | | |
| HCA, Inc., 9.125%, 11/15/14 | | | 1,123 | | | | 1,165,112 | | |
| HCA, Inc., 9.25%, 11/15/16 | | | 4,165 | | | | 4,394,075 | | |
See notes to financial statements
18
High Income Portfolio as of October 31, 2007
PORTFOLIO OF INVESTMENTS CONT'D
| Security | | Principal
Amount
(000's omitted) | | Value | |
| Healthcare (continued) | |
MultiPlan, Inc., Sr. Sub. Notes,
10.375%, 4/15/16(4) | | $ | 5,535 | | | $ | 5,687,213 | | |
| National Mentor Holdings, Inc., 11.25%, 7/1/14 | | | 3,960 | | | | 4,217,400 | | |
| Res-Care, Inc., Sr. Notes, 7.75%, 10/15/13 | | | 2,370 | | | | 2,358,150 | | |
Service Corp. International, Sr. Notes,
7.00%, 6/15/17 | | | 745 | | | | 731,963 | | |
Universal Hospital Services, Inc., (PIK)
8.50%, 6/1/15(4) | | | 745 | | | | 761,763 | | |
Universal Hospital Services, Inc., Variable Rate,
8.759%, 6/1/15(4) | | | 745 | | | | 750,588 | | |
| US Oncology, Inc., 9.00%, 8/15/12 | | | 2,665 | | | | 2,684,988 | | |
| US Oncology, Inc., 10.75%, 8/15/14 | | | 6,350 | | | | 6,635,750 | | |
Varietal Distribution Merger, Inc., Sr. Notes (PIK),
10.25%, 7/15/15(4) | | | 775 | | | | 763,375 | | |
| | | $ | 52,748,616 | | |
| Homebuilders / Real Estate — 0.1% | |
| Realogy Corp., Sr. Notes, 10.50%, 4/15/14(4) | | $ | 575 | | | $ | 479,406 | | |
| Stanley Martin Co., 9.75%, 8/15/15 | | | 955 | | | | 654,175 | | |
| | | $ | 1,133,581 | | |
| Leisure — 2.7% | |
HRP Myrtle Beach Capital Corp., Sr. Notes (PIK),
14.50%, 4/1/14(4) | | $ | 2,942 | | | $ | 2,868,296 | | |
HRP Myrtle Beach Operations, LLC/HRP Myrtle
Beach Capital Corp., 12.50%, 4/1/13(4) | | | 2,315 | | | | 2,257,125 | | |
HRP Myrtle Beach Operations, LLC/HRP Myrtle
Beach Capital Corp., Variable Rate,
9.894%, 4/1/12(4) | | | 3,985 | | | | 4,009,906 | | |
Universal City Development Partners, Sr. Notes,
11.75%, 4/1/10 | | | 3,130 | | | | 3,294,325 | | |
Universal City Florida Holdings, Sr. Notes,
Variable Rate, 10.106%, 5/1/10 | | | 10,535 | | | | 10,824,713 | | |
| | | $ | 23,254,365 | | |
| Metals / Mining — 1.9% | |
Aleris International, Inc., Sr. Notes,
9.00%, 12/15/14 | | $ | 730 | | | $ | 662,475 | | |
Aleris International, Inc., Sr. Sub. Notes,
10.00%, 12/15/16 | | | 5,660 | | | | 5,009,100 | | |
Alpha Natural Resources, Sr. Notes,
10.00%, 6/1/12 | | | 1,665 | | | | 1,781,550 | | |
FMG Finance PTY, Ltd.,
10.625%, 9/1/16(4) | | | 5,820 | | | | 6,925,800 | | |
FMG Finance PTY, Ltd., Variable Rate,
9.621%, 9/1/11(4) | | | 2,340 | | | | 2,439,450 | | |
| | | $ | 16,818,375 | | |
| Security | | Principal
Amount
(000's omitted) | | Value | |
| Paper — 2.0% | |
| Abitibi-Consolidated Finance LP, 7.875%, 8/1/09 | | $ | 3,305 | | | $ | 3,189,325 | | |
| Georgia-Pacific Corp., 9.50%, 12/1/11 | | | 510 | | | | 540,600 | | |
| Jefferson Smurfit Corp., 7.50%, 6/1/13 | | | 887 | | | | 869,260 | | |
| NewPage Corp., 10.00%, 5/1/12 | | | 6,490 | | | | 6,895,625 | | |
| NewPage Corp., 12.00%, 5/1/13 | | | 1,160 | | | | 1,258,600 | | |
| NewPage Corp., Variable Rate, 11.606%, 5/1/12 | | | 1,655 | | | | 1,791,538 | | |
Smurfit-Stone Container Enterprises, Inc., Sr. Notes,
8.00%, 3/15/17 | | | 2,665 | | | | 2,661,669 | | |
| | | $ | 17,206,617 | | |
| Publishing / Printing — 1.8% | |
| Dex Media West, LLC, 9.875%, 8/15/13 | | $ | 2,120 | | | $ | 2,271,050 | | |
| Harland Clarke Holdings, 9.50%, 5/15/15 | | | 1,165 | | | | 1,065,975 | | |
MediaNews Group, Inc., Sr. Sub. Notes,
6.875%, 10/1/13 | | | 1,135 | | | | 868,275 | | |
| R.H. Donnelley Corp., 8.875%, 10/15/17(4) | | | 5,285 | | | | 5,311,425 | | |
Reader's Digest Association, Inc. (The), Sr. Sub. Notes,
9.00%, 2/15/17(4) | | | 7,230 | | | | 6,479,888 | | |
| | | $ | 15,996,613 | | |
| Railroad — 1.0% | |
Kansas City Southern Mexico, Sr. Notes,
7.375%, 6/1/14(4) | | $ | 1,150 | | | $ | 1,152,875 | | |
Kansas City Southern Mexico, Sr. Notes,
7.625%, 12/1/13 | | | 200 | | | | 205,000 | | |
| Kansas City Southern Railway Co., 9.50%, 10/1/08 | | | 1,095 | | | | 1,125,113 | | |
| TFM SA de C.V., Sr. Notes, 9.375%, 5/1/12 | | | 6,050 | | | | 6,443,250 | | |
| | | $ | 8,926,238 | | |
| Restaurants — 1.0% | |
| El Pollo Loco, Inc., 11.75%, 11/15/13 | | $ | 4,315 | | | $ | 4,358,150 | | |
| NPC International, Inc., 9.50%, 5/1/14 | | | 4,695 | | | | 4,413,300 | | |
| | | $ | 8,771,450 | | |
| Services — 5.9% | |
| Ceridian Corp., Sr. Notes, 11.25%, 11/15/15(4) | | $ | 5,835 | | | $ | 5,791,238 | | |
| Education Management, LLC, 8.75%, 6/1/14 | | | 3,235 | | | | 3,356,313 | | |
| Education Management, LLC, 10.25%, 6/1/16 | | | 8,395 | | | | 8,856,725 | | |
KAR Holdings, Inc., Sr. Notes, Variable Rate,
9.356%, 5/1/14(4) | | | 1,475 | | | | 1,408,625 | | |
MediMedia USA, Inc., Sr. Sub Notes,
11.375%, 11/15/14(4) | | | 2,575 | | | | 2,703,750 | | |
See notes to financial statements
19
High Income Portfolio as of October 31, 2007
PORTFOLIO OF INVESTMENTS CONT'D
| Security | | Principal
Amount
(000's omitted) | | Value | |
| Services (continued) | |
Muzak, LLC/Muzak Finance, Sr. Notes,
10.00%, 2/15/09 | | $ | 2,640 | | | $ | 2,498,100 | | |
| Neff Corp., Sr. Notes, 10.00%, 6/1/15 | | | 750 | | | | 543,750 | | |
Norcross Safety Products, LLC/Norcross Capital
Corp., Sr. Sub. Notes, Series B, 9.875%, 8/15/11 | | | 5,555 | | | | 5,777,200 | | |
Safety Products Holdings, Inc. Sr. Notes (PIK),
11.75%, 1/1/12 | | | 4,964 | | | | 5,116,917 | | |
| Travelport LLC, 9.875%, 9/1/14 | | | 5,465 | | | | 5,656,275 | | |
| Travelport LLC, 11.875%, 9/1/16 | | | 1,252 | | | | 1,358,420 | | |
| West Corp., 9.50%, 10/15/14 | | | 8,015 | | | | 8,275,488 | | |
| | | $ | 51,342,801 | | |
| Steel — 0.7% | |
| RathGibson, Inc., 11.25%, 2/15/14 | | $ | 5,225 | | | $ | 5,420,938 | | |
| Ryerson, Inc., Sr. Notes, 12.00%, 11/1/15(4) | | | 525 | | | | 542,063 | | |
Ryerson, Inc., Sr. Notes, Variable Rate,
12.574%, 11/1/14(4) | | | 345 | | | | 353,625 | | |
| | | $ | 6,316,626 | | |
| Super Retail — 5.8% | |
Bon-Ton Department Stores, Inc.,
10.25%, 3/15/14 | | $ | 1,860 | | | $ | 1,636,800 | | |
| GameStop Corp., 8.00%, 10/1/12 | | | 10,183 | | | | 10,679,421 | | |
General Nutrition Center, Sr. Notes,
Variable Rate (PIK), 10.009%, 3/15/14 | | | 3,965 | | | | 3,836,138 | | |
General Nutrition Center, Sr. Sub. Notes,
10.75%, 3/15/15 | | | 3,965 | | | | 3,875,788 | | |
| Michaels Stores, Inc., Sr. Notes, 10.00%, 11/1/14 | | | 2,886 | | | | 2,922,075 | | |
Michaels Stores, Inc., Sr. Sub. Notes,
11.375%, 11/1/16 | | | 2,556 | | | | 2,562,390 | | |
| Neiman Marcus Group, Inc., 9.00%, 10/15/15 | | | 3,685 | | | | 3,906,100 | | |
| Neiman Marcus Group, Inc., 10.375%, 10/15/15 | | | 11,290 | | | | 12,334,325 | | |
| Sally Holdings, LLC, Sr. Notes, 9.25%, 11/15/14 | | | 1,645 | | | | 1,661,450 | | |
| Yankee Acquisition Corp., 8.50%, 2/15/15 | | | 2,901 | | | | 2,734,193 | | |
Yankee Acquisition Corp., Series B,
9.75%, 2/15/17 | | | 5,025 | | | | 4,673,250 | | |
| | | $ | 50,821,930 | | |
| Technology — 1.4% | |
Advanced Micro Devices, Inc., Sr. Notes,
7.75%, 11/1/12 | | $ | 7,410 | | | $ | 6,872,775 | | |
Amkor Technologies, Inc., Sr. Notes,
7.75%, 5/15/13 | | | 1,918 | | | | 1,862,858 | | |
| Avago Technologies Finance, 11.875%, 12/1/15 | | | 1,240 | | | | 1,395,000 | | |
| Security | | Principal
Amount
(000's omitted) | | Value | |
| Technology (continued) | |
Avago Technologies Finance, Variable Rate,
10.125%, 12/1/13 | | $ | 1,945 | | | $ | 2,110,325 | | |
| NXP BV/NXP Funding, LLC, 7.875%, 10/15/14 | | | 94 | | | | 92,238 | | |
| SunGard Data Systems, Inc., 9.125%, 8/15/13 | | | 196 | | | | 200,900 | | |
| | | $ | 12,534,096 | | |
| Telecommunications — 3.7% | |
Centennial Cellular Operating Co./Centennial
Communication Corp., Sr. Notes, 10.125%, 6/15/13 | | $ | 4,105 | | | $ | 4,382,088 | | |
| Digicel Group, Ltd., Sr. Notes, 8.875%, 1/15/15(4) | | | 4,905 | | | | 4,592,552 | | |
| Digicel Group, Ltd., Sr. Notes, 9.125%, 1/15/15(4) | | | 5,262 | | | | 4,926,811 | | |
| Digicel Group, Ltd., Sr. Notes, 9.25%, 9/1/12(4) | | | 3,475 | | | | 3,579,250 | | |
| Intelsat Bermuda, Ltd., 9.25%, 6/15/16 | | | 3,770 | | | | 3,930,225 | | |
| Level 3 Financing, Inc. Sr. Notes, 8.75%, 2/15/17 | | | 4,000 | | | | 3,670,000 | | |
| Level 3 Financing, Inc. Sr. Notes, 9.25%, 11/1/14 | | | 2,665 | | | | 2,525,088 | | |
| Qwest Capital Funding, Inc., 7.90%, 8/15/10 | | | 935 | | | | 963,050 | | |
Qwest Communications International, Inc., Sr. Notes,
7.50%, 11/1/08 | | | 710 | | | | 710,000 | | |
| Qwest Corp., Sr. Notes, 7.625%, 6/15/15 | | | 2,510 | | | | 2,654,325 | | |
| U.S. West Communications, 7.20%, 11/10/26 | | | 585 | | | | 567,450 | | |
| | | $ | 32,500,839 | | |
| Textiles / Apparel — 2.0% | |
| Levi Strauss & Co., Sr. Notes, 8.875%, 4/1/16 | | $ | 630 | | | $ | 648,900 | | |
| Levi Strauss & Co., Sr. Notes, 9.75%, 1/15/15 | | | 1,640 | | | | 1,719,950 | | |
| Oxford Industries, Inc., Sr. Notes, 8.875%, 6/1/11 | | | 8,555 | | | | 8,597,775 | | |
Perry Ellis International, Inc., Sr. Sub. Notes,
8.875%, 9/15/13 | | | 5,710 | | | | 5,738,550 | | |
| Phillips-Van Heusen, Sr. Notes, 7.25%, 2/15/11 | | | 485 | | | | 489,850 | | |
| | | $ | 17,195,025 | | |
| Transportation Ex Air / Rail — 0.4% | |
| CEVA Group PLC, 10.00%, 9/1/14(4) | | $ | 3,515 | | | $ | 3,677,569 | | |
| | | $ | 3,677,569 | | |
| Utilities — 3.6% | |
| AES Corp., Sr. Notes, 8.00%, 10/15/17(4) | | $ | 1,270 | | | $ | 1,287,463 | | |
| AES Corp., Sr. Notes, 8.875%, 2/15/11 | | | 457 | | | | 479,279 | | |
| AES Eastern Energy, Series 99-A, 9.00%, 1/2/17 | | | 2,333 | | | | 2,525,463 | | |
| Dynegy Holdings, Inc., 7.75%, 6/1/19(4) | | | 570 | | | | 537,938 | | |
| Dynegy Holdings, Inc., 8.375%, 5/1/16 | | | 1,065 | | | | 1,072,988 | | |
| Edison Mission Energy, 7.50%, 6/15/13 | | | 315 | | | | 320,906 | | |
See notes to financial statements
20
High Income Portfolio as of October 31, 2007
PORTFOLIO OF INVESTMENTS CONT'D
| Security | | Principal
Amount
(000's omitted) | | Value | |
| Utilities (continued) | |
Energy Future Holdings, Sr. Note,
10.875%, 11/1/17(4) | | $ | 6,490 | | | $ | 6,595,463 | | |
| NGC Corp., 7.625%, 10/15/26 | | | 3,205 | | | | 2,860,463 | | |
| NRG Energy, Inc., 7.25%, 2/1/14 | | | 150 | | | | 150,375 | | |
| NRG Energy, Inc., 7.375%, 1/15/17 | | | 4,050 | | | | 4,039,875 | | |
Orion Power Holdings, Inc., Sr. Notes,
12.00%, 5/1/10 | | | 6,490 | | | | 7,203,900 | | |
| Reliant Energy, Inc., Sr. Notes, 7.625%, 6/15/14 | | | 370 | | | | 375,088 | | |
Texas Competitive Electric Holdings Co. LLC, Sr. Notes,
10.25%, 11/1/15(4) | | | 4,270 | | | | 4,312,700 | | |
| | | $ | 31,761,901 | | |
Total Corporate Bonds & Notes
(identified cost $714,095,814) | | | | | | $ | 705,902,266 | | |
| Convertible Bonds — 0.6% | |
| Security | | Principal
Amount
(000's omitted) | | Value | |
| Aerospace — 0.6% | |
| L-3 Communications Corp., 3.00%, 8/1/35(4) | | $ | 3,890 | | | $ | 4,726,350 | | |
Total Convertible Bonds
(identified cost $3,930,567) | | | | | | $ | 4,726,350 | | |
| Common Stocks — 1.3% | |
| Security | | Shares | | Value | |
| Cable / Satellite TV — 0.5% | |
| Time Warner Cable, Inc., Class A(7) | | | 164,253 | | | $ | 4,695,993 | | |
| | | $ | 4,695,993 | | |
| Gaming — 0.6% | |
| Fontainebleau Equity Holdings, Class A(6)(8) | | | 148,726 | | | $ | 1,784,712 | | |
| Shreveport Gaming Holdings, Inc.(6) | | | 6,014 | | | | 150,350 | | |
| Trump Entertainment Resorts, Inc.(7) | | | 409,960 | | | | 3,193,588 | | |
| | | $ | 5,128,650 | | |
| Healthcare — 0.1% | |
| Universal Health Services, Inc., Class B | | | 11,666 | | | $ | 568,718 | | |
| | | $ | 568,718 | | |
| Security | | Shares | | Value | |
| Leisure — 0.0% | |
| HRP, Class B(4)(6)(7) | | | 2,375 | | | $ | 24 | | |
| | | $ | 24 | | |
| Super Retail — 0.1% | |
| GNC Acquisition Holdings, Class A(6)(8) | | | 108,818 | | | $ | 544,090 | | |
| | | $ | 544,090 | | |
| Utilities — 0.0% | |
| Mirant Corp.(7) | | | 5,162 | | | $ | 218,662 | | |
| | | $ | 218,662 | | |
Total Common Stocks
(identified cost $8,042,230) | | | | | | $ | 11,156,137 | | |
| Convertible Preferred Stocks — 1.4% | |
| Security | | Shares | | Value | |
| Energy — 0.9% | |
| Chesapeake Energy Corp., 4.50% | | | 61,160 | | | $ | 6,431,586 | | |
| Chesapeake Energy Corp., 5.00%(4) | | | 14,401 | | | | 1,746,121 | | |
| | | $ | 8,177,707 | | |
| Telecommunications — 0.5% | |
| Crown Castle International Corp., (PIK), 6.25% | | | 67,777 | | | $ | 4,075,092 | | |
| | | $ | 4,075,092 | | |
Total Convertible Preferred Stocks
(identified cost $10,581,706) | | | | | | $ | 12,252,799 | | |
| Preferred Stocks — 0.4% | |
| Security | | Units | | Value | |
| Gaming — 0.4% | |
| Fontainebleau Resorts LLC (PIK)(6)(8) | | | 3,553 | | | $ | 3,394,865 | | |
| | | $ | 3,394,865 | | |
See notes to financial statements
21
High Income Portfolio as of October 31, 2007
PORTFOLIO OF INVESTMENTS CONT'D
| Security | | Shares | | Value | |
| Super Retail — 0.0% | |
| GNC Acquisition Holdings(6)(8) | | | 37,182 | | | $ | 185,910 | | |
| | | $ | 185,910 | | |
Total Preferred Stocks
(identified cost $3,743,723) | | | | | | $ | 3,580,775 | | |
| Miscellaneous — 0.3% | |
| Security | | Shares | | Value | |
| Cable / Satellite TV — 0.3% | |
| Adelphia, Inc., Escrow Certificate(7) | | | 7,585,000 | | | $ | 1,270,487 | | |
| Adelphia, Inc., Escrow Certificate(7) | | | 3,555,000 | | | | 586,575 | | |
| Adelphia Recovery Trust(7) | | | 10,758,837 | | | | 934,728 | | |
| | | $ | 2,791,790 | | |
| Utilities — 0.0% | |
| Mirant Corp., Escrow Certificate(6)(7) | | | 1,440,000 | | | $ | 144 | | |
| Mirant Corp., Escrow Certificate(6)(7)(8) | | | 3,200,000 | | | | 320 | | |
| | | $ | 464 | | |
Total Miscellaneous
(identified cost $9,898,658) | | | | | | $ | 2,792,254 | | |
| Warrants — 0.5% | |
| Security | | Shares | | Value | |
| Consumer Products — 0.0% | |
| HF Holdings, Inc., Exp. 9/27/09(6)(7) | | | 13,600 | | | $ | 0 | | |
| | | $ | 0 | | |
| Gaming — 0.1% | |
Peninsula Gaming LLC, Convertible Preferred
Membership Interests, Exp. 9/27/09(6)(8) | | | 25,351 | | | $ | 1,318,262 | | |
| | | $ | 1,318,262 | | |
| Telecommunications — 0.4% | |
| American Tower Corp., Exp. 8/1/08(4)(7) | | | 5,070 | | | $ | 3,142,133 | | |
| | | $ | 3,142,133 | | |
Total Warrants
(identified cost $1,070,114) | | | | | | $ | 4,460,395 | | |
| Short-Term Investments — 1.9% | |
| Description | | Interest
(000's omitted) | | Value | |
| Investment in Cash Management Portfolio, 4.83%(9) | | $ | 16,365 | | | $ | 16,365,354 | | |
Total Short-Term Investments
(identified cost $16,365,354) | | | | $ | 16,365,354 | | |
Total Investments — 101.0%
(identified cost $890,369,017) | | | | $ | 880,944,692 | | |
Less Unfunded Loan
Commitments — (0.0)% | | | | $ | (98,995 | ) | |
Net Investments — 101.0%
(identified cost $890,270,022) | | | | $ | 880,845,697 | | |
| Other Assets, Less Liabilities — (1.0)% | | | | $ | (8,578,087 | ) | |
| Net Assets — 100.0% | | | | $ | 872,267,610 | | |
PIK - Payment In Kind.
(1) Senior floating-rate interests often require prepayments from excess cash flows or permit the borrowers to repay at their election. The degree to which borrowers repay, whether as a contractual requirement or at their election, cannot be predicted with accuracy. As a result, the actual remaining maturity may be substantially less than the stated maturities shown. However, it is anticipated that the senior floating-rate interests will have an expected average life of approximately two to four years. The stated interest rate represents the weighted average interest rate of all contracts within the senior loan facility. Senior Loans typically have rates of interest which are redetermined either daily, monthly, quarterly or semi-annually by reference to a base lending rate, plus a premium. These base rates are primarily the London-Inter bank Offered Rate ("LIBOR"), and secondarily the prime rate offered by one or more major United States banks (the "Prime Rate") and the certificate of deposit ("CD") rate or other base lending used by commercial lenders.
(2) This Senior Loan will settle after October 31, 2007, at which time the interest rate will be determined.
(3) Unfunded or partially unfunded loan commitment. The Portfolio is obligated to fund these commitments at the borrower's discretion.
(4) Security exempt from registration under Rule 144A of the Securities Act of 1933. These securities may be sold in transactions exempt from registration, normally to qualified institutional buyers. At October 31, 2007, the aggregate value of the securities is $198,727,390 or 22.8% of the Portfolio's net assets.
(5) Defaulted security.
(6) Security valued at fair value using methods determined in good faith by or at the direction of the Trustees.
See notes to financial statements
22
High Income Portfolio as of October 31, 2007
PORTFOLIO OF INVESTMENTS CONT'D
(7) Non-income producing security.
(8) Restricted security.
(9) Affiliated investment company available to Eaton Vance portfolios and funds which invests in high quality U.S. dollar denominated money market instruments. The rate shown is the annualized seven-day yield as of October 31, 2007.
See notes to financial statements
23
High Income Portfolio as of October 31, 2007
FINANCIAL STATEMENTS
Statement of Assets and Liabilities
As of October 31, 2007
| Assets | |
| Unaffiliated investments, at value (identified cost, $873,904,668) | | $ | 864,480,343 | | |
| Affiliated investment, at value (identified cost, $16,365,354) | | | 16,365,354 | | |
| Receivable for investments sold | | | 9,952,027 | | |
| Dividends and interest receivable | | | 18,768,964 | | |
| Interest receivable from affiliated investment | | | 5,434 | | |
| Receivable for open swap contracts | | | 789,136 | | |
| Total assets | | $ | 910,361,258 | | |
| Liabilities | |
| Payable for investments purchased | | $ | 37,350,796 | | |
| Payable to affiliate for investment advisory fee | | | 422,223 | | |
| Payable to affiliate for Trustees' fees | | | 2,502 | | |
| Payable for open swap contracts | | | 37,202 | | |
| Accrued expenses | | | 280,925 | | |
| Total liabilities | | $ | 38,093,648 | | |
| Net Assets applicable to investors' interest in Portfolio | | $ | 872,267,610 | | |
| Sources of Net Assets | |
| Net proceeds from capital contributions and withdrawals | | $ | 880,940,001 | | |
| Net unrealized depreciation (computed on the basis of identified cost) | | | (8,672,391 | ) | |
| Total | | $ | 872,267,610 | | |
Statement of Operations
For the Year Ended
October 31, 2007
| Investment Income | |
| Interest and other income | | $ | 90,533,429 | | |
| Dividends | | | 900,959 | | |
| Interest income allocated from affiliated investment | | | 470,145 | | |
| Expenses allocated from affliated investment | | | (44,493 | ) | |
| Total investment income | | $ | 91,860,040 | | |
| Expenses | |
| Investment adviser fee | | $ | 5,588,278 | | |
| Trustees' fees and expenses | | | 28,209 | | |
| Custodian fee | | | 308,282 | | |
| Legal and accounting services | | | 122,354 | | |
| Interest expense | | | 371,400 | | |
| Miscellaneous | | | 17,728 | | |
| Total expenses | | $ | 6,436,251 | | |
| Net investment income | | $ | 85,423,789 | | |
| Realized and Unrealized Gain (Loss) | |
Net realized gain (loss) —
Investment transactions (identified cost basis) | | $ | 25,133,478 | | |
| Swap contracts | | | (588,029 | ) | |
| Foreign currency transactions | | | 1,304 | | |
| Net realized gain | | $ | 24,546,753 | | |
Change in unrealized appreciation (depreciation) —
Investments (identified cost basis) | | $ | (44,442,764 | ) | |
| Swap contracts | | | 672,390 | | |
| Net change in unrealized appreciation (depreciation) | | $ | (43,770,374 | ) | |
| Net realized and unrealized loss | | $ | (19,223,621 | ) | |
| Net increase in net assets from operations | | $ | 66,200,168 | | |
See notes to financial statements
24
High Income Portfolio as of October 31, 2007
FINANCIAL STATEMENTS CONT'D
Statements of Changes in Net Assets
Increase (Decrease)
in Net Assets | | Year Ended
October 31, 2007 | | Year Ended
October 31, 2006 | |
From operations —
Net investment income | | $ | 85,423,789 | | | $ | 88,462,098 | | |
Net realized gain from investment
transactions, swaps contracts, and
foreign currency and forward
foreign currency exchange
contract transactions | | | 24,546,753 | | | | 22,038,918 | | |
Net change in unrealized appreciation
(depreciation) from investments,
swap contracts, foreign currency
and forward foreign currency
exchange contracts | | | (43,770,374 | ) | | | 8,747,052 | | |
| Net increase in net assets from operations | | $ | 66,200,168 | | | $ | 119,248,068 | | |
Capital transactions —
Contributions | | $ | 171,543,814 | | | $ | 116,555,183 | | |
| Withdrawals | | | (452,800,848 | ) | | | (258,617,627 | ) | |
Net decrease in net assets from
capital transactions | | $ | (281,257,034 | ) | | $ | (142,062,444 | ) | |
| Net decrease in net assets | | $ | (215,056,866 | ) | | $ | (22,814,376 | ) | |
| Net Assets | |
| At beginning of year | | $ | 1,087,324,476 | | | $ | 1,110,138,852 | | |
| At end of year | | $ | 872,267,610 | | | $ | 1,087,324,476 | | |
See notes to financial statements
25
High Income Portfolio as of October 31, 2007
FINANCIAL STATEMENTS CONT'D
Supplementary Data
| | | Year Ended October 31, | |
| | | 2007 | | 2006 | | 2005 | | 2004 | | 2003 | |
| Ratios/Supplemental Data | |
| Ratios (As a percentage of average daily net assets): | |
| Expenses before custodian fee reduction | | | 0.63 | % | | | 0.59 | % | | | 0.58 | % | | | 0.59 | % | | | 0.66 | % | |
| Expenses after custodian fee reduction | | | 0.63 | % | | | 0.59 | % | | | 0.58 | % | | | 0.59 | % | | | 0.66 | % | |
| Net investment income | | | 8.33 | % | | | 8.13 | % | | | 8.06 | % | | | 8.61 | % | | | 10.04 | % | |
| Portfolio Turnover | | | 81 | % | | | 62 | % | | | 62 | % | | | 80 | % | | | 122 | % | |
| Total Return | | | 6.54 | % | | | 11.66 | % | | | 6.54 | % | | | 12.79 | % | | | 34.76 | % | |
| Net assets, end of year (000's omitted) | | $ | 872,268 | | | $ | 1,087,324 | | | $ | 1,110,139 | | | $ | 1,291,973 | | | $ | 1,164,043 | | |
See notes to financial statements
26
High Income Portfolio as of October 31, 2007
NOTES TO FINANCIAL STATEMENTS
1 Significant Accounting Policies
High Income Portfolio (the Portfolio) is a New York trust registered under the Investment Company Act of 1940, as amended (the 1940 Act), as a diversified, open-end management investment company. The Portfolio's investment objective is to provide a high level of current income. The Declaration of Trust permits the Trustees to issue interests in the Portfolio. At October 31, 2007, Eaton Vance High Income Fund, Eaton Vance Floating-Rate High Income Fund, Eaton Vance Strategic Income Fund and Eaton Vance Medallion Strategic Income Fund held an approximate 73.6%, 15.6%, 0.7% and 0.1% interest, respectively, in the Portfolio.
The following is a summary of significant accounting policies of the Portfolio. The policies are in conformity with accounting principles generally accepted in the United States of America.
A Investment Valuation — Securities listed on a U.S. securities exchange generally are valued at the last sale price on the day of valuation or, if no sales took place on such date, at the mean between the closing bid and asked prices therefore on the exchange where such securities are principally traded. Equity securities listed on the NASDAQ Global or Global Select Market generally are valued at the NASDAQ official closing price. Unlisted or listed securities for which closing sales prices or closing quotations are not available are valued at the mean between the latest available bid and asked prices or, in the case of preferred equity securities that are not listed or traded in the over-the-counter market, by an independent pricing service. Financial futures contracts listed on commodity exchanges are valued at closing settlement prices. Interest rate swaps are generally valued on the basis of valuations furnished by a pricing service. Credit default swaps are valued by a broker dealer (usually the counterparty to the agreement). Short-term debt securities with a remaining maturity of 60 days or less are valued at amortized cost, which approximates market value. If short-term debt securities are acquired with a remaining maturity of more than 60 days, they will be valued by a pricing service. Other fixed income investments, including listed securities and securities for which price quotations are available, will normally be valued on the basis of valuations furnished by a pricing service. The Portfolio also invests in interests in senior floating-rate loans (Senior Loans). The Portfolio's investment adviser, Boston Management and Research (BMR) has characterized certain Senior Loans as liquid based on a predetermined acceptable number and range of market quotations available. Such loans are valued on the basis of market valuations furnished by a pricing service. Other Senior Loans are valued at fair value by BMR under procedures established by the Trustees as permitted by the 1940 Act. Investments for which valuations or market quotations are not readily available are valued at fair value using methods determined in good faith by or at the direction of the Trustees of the Portfolio considering relevant factors, data and information including the market value of freely tradable securities of the same class in the principal market on which such securities are normally traded.
The Portfolio may invest in Cash Management Portfolio (Cash Management), an affiliated investment company managed by BMR, a subsidiary of Eaton Vance Management (EVM). Cash Management values its investment securities utilizing the amortized cost valuation technique permitted by Rule 2a-7 of the 1940 Act. This technique involves initially valuing a portfolio security at its cost and thereafter assuming a constant amortization to maturity of any discount or premium.
B Investment Transactions — Investment transactions for financial statement purposes are accounted for on a trade date basis. Realized gains and losses on investments sold are determined on the basis of identified cost.
C Income — Interest income is recorded on the basis of interest accrued, adjusted for amortization of premium or accretion of discount. Fees associated with loan amendments are recognized immediately. Dividend income is recorded on the ex-dividend date for dividends received in cash and/or securities.
D Federal Taxes — The Portfolio has elected to be treated as a partnership for federal tax purposes. No provision is made by the Portfolio for federal or state taxes on any taxable income of the Portfolio because each investor in the Portfolio is ultimately responsible for the payment of any taxes on its share of taxable income. Since at least one of the Portfolio's investors is a regulated investment company that invests all or substantially all of its assets in the Portfolio, the Portfolio normally must satisfy the applicable source of income and diversification requirements (under the Internal Revenue Code) in order for its investors to satisfy them. The Portfolio will allocate, at least annually among its investors, each investor's distributive share of the Portfolio' s net investment income, net realized capital gains and any other items of income, gain, loss, deduction or credit.
E Expense Reduction — State Street Bank and Trust Company (SSBT) serves as custodian of the Portfolio. Pursuant to the custodian agreement, SSBT receives a fee reduced by credits, which are determined based on the average daily cash balance the Portfolio maintains with
27
High Income Portfolio as of October 31, 2007
NOTES TO FINANCIAL STATEMENTS CONT'D
SSBT. All credit balances, if any, used to reduce the Portfolio's custodian fees are reported as a reduction of expenses in the Statement of Operations.
F Foreign Currency Translation — Investment valuations, other assets, and liabilities initially expressed in foreign currencies are translated each business day into U.S. dollars based upon current exchange rates. Purchases and sales of foreign investment securities and income and expenses denominated in foreign currencies are translated into U.S. dollars based upon currency exchange rates in effect on the respective dates of such transactions. Recognized gains or losses on investment transactions attributable to changes in foreign currency exchange rates are recorded for financial statement purposes as net realized gains and losses on investments. That portion of unrealized gains and losses on invest ments that results from fluctuations in foreign currency exchange rates is not separately disclosed.
G Use of Estimates — The preparation of the financial statements in conformity with accounting principles generally accepted in the United States of America requires management to make estimates and assumptions that affect the reported amounts of assets and liabilities at the date of the financial statements and the reported amounts of income and expense during the reporting period. Actual results could differ from those estimates.
H Indemnifications — Under the Portfolio's organizational documents, its officers and Trustees may be indemnified against certain liabilities and expenses arising out of the performance of their duties to the Portfolio. Interestholders in the Portfolio are jointly and severally liable for the liabilities and obligations of the Portfolio in the event that the Portfolio fails to satisfy such liabilities and obligations; provided, however, that, to the extent assets are available in the Portfolio, the Portfolio may, under certain circumstances, indemnify interestholders from and against any claim or liability to which such holder may become subject by reason of being or having been an interestholder in the Portfolio. Additionally, in the normal course of business, the Portfo lio enters into agreements with service providers that may contain indemnification clauses. The Portfolio's maximum exposure under these arrangements is unknown as this would involve future claims that may be made against the Portfolio that have not yet occurred.
I Financial Futures Contracts — The Portfolio may enter into financial futures contracts. The Portfolio's investment in financial futures contracts is designed for hedging against changes in interest rates or as a substitute for the purchase of securities. Upon entering into a financial futures contract, the Portfolio is required to deposit with the broker, either in cash or securities an amount equal to a certain percentage of the purchase price (initial margin). Subsequent payments, known as variation margin, are made or received by the Portfolio each business day, depending on the daily fluctuations in the value of the underlyi ng security, and are recorded as unrealized gains or losses by the Portfolio. Gains (losses) are realized upon the expiration or closing of the financial futures contracts. Should market conditions change unexpectedly, the Portfolio may not achieve the anticipated benefits of the financial futures contracts and may realize a loss. In entering such contracts, the Portfolio bears the risk if the counterparties do not perform under the contracts' terms.
J Forward Foreign Currency Exchange Contracts — The Portfolio may enter into forward foreign currency exchange contracts for the purchase or sale of a specific foreign currency at a fixed price on a future date. The Portfolio may enter into forward contracts for hedging purposes as well as non-hedging purposes. The forward foreign currency exchange contracts are adjusted by the daily exchange rate of the underlying currency and any gains or losses are recorded as unrealized until such time as the contracts have been closed or offset. Risks may arise upon entering these contracts from the potential inability of counterparties to meet the terms of their contracts and from movements in the value of a for eign currency relative to the U.S. dollar.
K Credit Default Swaps — The Portfolio may enter into credit default swap contracts to buy or sell credit protection against default on an individual issuer or a basket of issuers of bonds. When the Portfolio is the buyer of a credit default swap contract, the Portfolio is entitled to receive the par (or other agreed-upon) value of a referenced debt obligation (or basket of debt obligations) from the counterparty to the contract in the event of a default by a third party, such as a U.S. or foreign corporate issuer, on the debt obligation. In return, the Portfolio pays the counterparty a periodic stream of payments over the term of the contract provided that no event of default has occurred. If no defa ult occurs, the Portfolio would have spent the stream of payments and received no benefit from the contract. When the Portfolio is the seller of a credit default swap contract, it receives the stream of payments, but is obligated to pay upon default of the referenced debt obligation. As the seller, the Portfolio effectively adds leverage to its portfolio because, in addition to its total net assets, the Portfolio is subject to investment exposure on the notional amount of the swap. The interest fee paid or received on the swap contract, which is based on a specified interest rate on a fixed notional amount, is accrued daily as a component of unrealized appreciation (depreciation) and is recorded as realized gain upon receipt or realized loss upon payment. The Portfolio also records an
28
High Income Portfolio as of October 31, 2007
NOTES TO FINANCIAL STATEMENTS CONT'D
increase or decrease to unrealized appreciation (depreciation) in an amount equal to the daily valuation. Up front payments or receipts, if any, are recorded as other assets or other liabilities, respectively, and amortized over the life of the swap contract as realized gains or losses. The Portfolio segregates assets in the form of cash and cash equivalents in an amount equal to the aggregate market value of the credit default swaps of which it is the seller, marked to market on a daily basis. These transactions involve certain risks, including the risk that the seller may be unable to fulfill the transaction.
2 Investment Adviser Fee and Other Transactions with Affiliates
The investment adviser fee is earned by BMR, as compensation for management and investment advisory services rendered to the Portfolio. Pursuant to the advisory agreement, BMR receives a monthly advisory fee at the annual rate of 0.30% of the average daily net assets of the Portfolio up to $500 million and 0.275% of the average daily net assets from $500 million up to $1 billion, plus 3% of gross daily income when daily net assets are less than $500 million and 2.75% when daily net assets are $500 million but less than $1 billion (i.e., income other than gains from the sale of securities). The advisory fee rate is further reduced as daily net assets exceed $1 billion. The portion of the advisory fee payable by Cash Management on the Portfolio's investment of cash therein is credited against the Portfolio's advisory fee. For the year ended October 31, 2007, the Portfolio's advisory fee totaled $5,631,344 of which $43,066 was allo cated from Cash Management and $5,588,278 was paid or accrued directly by the Portfolio. For the year ended October 31, 2007, the Portfolio's advisory fee, including the portion allocated from Cash Management, was 0.55% of the Portfolio's average daily net assets.
Except for Trustees of the Portfolio who are not members of EVM's or BMR's organizations, officers and Trustees receive remuneration for their services to the Portfolio out of the investment adviser fee. Trustees of the Portfolio who are not affiliated with the investment adviser may elect to defer receipt of all or a portion of their annual fees in accordance with the terms of the Trustees Deferred Compensation Plan. For the year ended October 31, 2007, no significant amounts have been deferred. Certain officers and Trustees of the Portfolio are officers of the above organizations.
3 Purchases and Sales of Investments
The Portfolio invests primarily in debt securities. The ability of the issuers of the debt securities held by the Portfolio to meet their obligations may be affected by economic developments in a specific industry. Purchases and sales of investments, other than short-term obligations, aggregated $805,759,959 and $971,812,426, respectively, for the year ended October 31, 2007.
4 Line of Credit
The Portfolio participates with other portfolios and funds managed by EVM and its affiliates in a $200 million unsecured line of credit agreement with a group of banks. Borrowings are made by the Portfolio solely to facilitate the handling of unusual and/or unanticipated short-term cash requirements. Interest is charged to the Portfolio based on its borrowings at an amount above either the Eurodollar rate or Federal Funds rate. In addition, a fee computed at an annual rate of 0.07% on the daily unused portion of the line of credit is allocated among the participating portfolios and the funds at the end of each quarter. Average borrowings and the average interest rate for the year ended October 31, 2007 were $6,681,644 and 5.56%, respectively.
5 Financial Instruments
The Portfolio may trade in financial instruments with off-balance sheet risk in the normal course of its investing activities to assist in managing exposure to various market risks. These financial instruments may include written options, forward foreign currency contracts, financial futures contracts and swap contracts and may involve, to a varying degree, elements of risk in excess of the amounts recognized for financial statement purposes. The notional or contractual amounts of these instruments represent the investment the Portfolio has in particular classes of financial instruments and does not necessarily represent the amounts potentially subject to risk. The measurement of the risks associated with these instruments is meaningful only when all related and offsetting transactions are considered.
A summary of obligations under these financial instruments at October 31, 2007 is as follows:
Credit Default Swaps
| Counterparty | | Reference
Entity | | Buy/
Sell | | Notional
Amount
(000s
omitted) | | Pay/
Receive
Annual
Fixed
Rate | | Termination
Date | | Net
Unrealized
Appreciation
(Depreciation) | |
| Bank of America | | First Data | | | | | | | | | | | | | | |
| | |
| | Corp. | | Sell | | $ | 1,525 | | | | 3.20 | % | | 12/20/2009 | | $ | (149 | ) | |
Citigroup, Inc.
| | First Data
Corp. | | Sell | | | 3,050 | | | | 3.20 | | | 12/20/2009 | | | (309 | ) | |
| | First Data
Corp. | | Sell | | | 3,050 | | | | 3.55 | | | 12/20/2009 | | | 20,424 | | |
Goldman Sachs
Capital
Markets L.P. | | General
Motors Corp. | | Sell | | | 1,600 | | | | 7.25 | | | 9/20/2010 | | | 122,742 | | |
JPMorgan
Chase Bank | | Ford
Motor Corp. | | Sell | | | 3,200 | | | | 6.75 | | | 9/20/2008 | | | 74,661 | | |
| | LCDX
Series 9 | | Buy | | | 11,230 | | | | 3.75 | | | 12/20/2012 | | | 197,715 | | |
| | Levi Strauss
& Co. | |
Sell | | |
3,200 | | | |
3.90 | | |
9/20/2012 | | |
40,160 | | |
29
High Income Portfolio as of October 31, 2007
NOTES TO FINANCIAL STATEMENTS CONT'D
| Counterparty | | Reference
Entity | | Buy/
Sell | | Notional
Amount
(000s
omitted) | | Pay/
Receive
Annual
Fixed
Rate | | Termination
Date | | Net
Unrealized
Appreciation
(Depreciation) | |
| Lehman | | General | | | | | | | | | | | | | | |
| | |
| Brothers, Inc. | | Motors Corp. | | Sell | | $ | 3,200 | | | | 4.65 | % | | 9/20/2010 | | $ | 39,558 | | |
| | General
Motors Corp. | | Sell | | | 4,800 | | | | 6.50 | | | 9/20/2008 | | | 143,050 | | |
Morgan Stanley
Capital
Services, Inc. | | ARAMARK | | Sell | | | 3,200 | | | | 4.82 | | | 9/20/2012 | | | 150,826 | | |
RBS Greenwich
Capital | | First Data
Corp., | | Sell | | | 3,040 | | | | 3.95 | | | 12/20/2010 | | | (23,155 | ) | |
| | | First Data
Corp., | | Sell | | | 1,520 | | | | 3.90 | | | 12/20/2010 | | | (13,589 | ) | |
| | | | | | | | | | | | | | | | | $ | 751,934 | | |
At October 31, 2007, the Portfolio had sufficient cash and/or securities to cover commitments under these contracts.
6 Federal Income Tax Basis of Unrealized Appreciation (Depreciation)
The cost and unrealized appreciation (depreciation) of investments of the Portfolio at October 31, 2007 as determined on a federal income tax basis, were as follows:
| Aggregate cost | | $ | 892,061,643 | | |
| Gross unrealized appreciation | | $ | 24,990,958 | | |
| Gross unrealized depreciation | | | (36,206,904 | ) | |
| Net unrealized depreciation | | $ | (11,215,946 | ) | |
The net unrealized appreciation on swap contracts at October 31, 2007 on a federal income tax basis was $0.
7 Restricted Securities
At October 31, 2007, the Portfolio owned the following securities (representing less than 0.1% of net assets) which were restricted as to public resale and not registered under the Securities Act of 1933 (excluding Rule 144A securities). The Portfolio has various registration rights (exercisable under a variety of circumstances) with respect to these securities. The fair value of these securities is determined based on valuations provided by brokers when available, or if not available, they are valued at fair value using methods determined in good faith by or at the direction of the Trustees.
| Description | | Date of
Acquisition | | Shares/Units | | Cost | | Value | |
GNC Acquisition
Holdings, Class A | | 3/15/07 | | | 108,818 | | | $ | 544,090 | | | $ | 544,090 | | |
GNC Acquisition
Holdings, Preferred | | 3/15/07 | | | 37,182 | | | | 185,910 | | | | 185,910 | | |
Fontainebleau Equity
Holdings, Class A | | 6/01/07 | | | 148,726 | | | | 1,784,712 | | | | 1,784,712 | | |
Fontainebleau
Resorts LLC (PIK),
Preferred | | 6/01/07 | | | 3,558 | | | | 3,557,813 | | | | 3,394,865 | | |
Mirant Corp.,
Escrow Certificate | | 1/05/06 | | | 3,200,000 | | | | 0 | | | | 320 | | |
Penninsula Gaming
LLC, Convertible
Preferred Membership
Interests, Exp. 9/27/09 | | 7/08/99 | | | 25,351 | | | | 0 | (1) | | | 1,318,262 | | |
| Total Restricted Securities | | | | | | | | $ | 6,072,525 | | | $ | 7,228,159 | | |
(1) Less than $0.50.
8 Recently Issued Accounting Pronouncements
In June 2006, the Financial Accounting Standards Board (FASB) issued FASB Interpretation No. 48 (FIN 48), "Accounting for Uncertainty in Income Taxes – an interpretation of FASB Statement No. 109". FIN 48 clarifies the accounting for uncertainty in income taxes recognized in accordance with FASB Statement No. 109, "Accounting for Income Taxes". This interpretation prescribes a recognition threshold and measurement attribute for the financial statement recognition and measurement of a tax position taken or expected to be taken in a tax return. It also provides guidance on de-recognition, classification, interest and penalties, accounting in interim periods, disclosure and transition. FIN 48 is effective on the last business day of the first required financial reporting period for fiscal years beginning after December 15, 2006. Management is currently evaluating the impact of applying the various provisions of FIN 48.
In September 2006, the FASB issued Statement of Financial Accounting Standards No. 157 (FAS 157), "Fair Value Measurements". FAS 157 defines fair value, establishes a framework for measuring fair value in accordance with generally accepted accounting principles and expands disclosure about fair value measurements. FAS 157 is effective for fiscal years beginning after November 15, 2007. Management is currently evaluating the impact the adoption of FAS 157 will have on the Portfolio's financial statement disclosures.
30
High Income Portfolio as of October 31, 2007
REPORT OF INDEPENDENT REGISTERED PUBLIC ACCOUNTING FIRM
To the Trustees and Investors
of High Income Portfolio:
We have audited the accompanying statement of assets and liabilities of High Income Portfolio ("the Portfolio"), including the portfolio of investments, as of October 31, 2007, and the related statement of operations for the year then ended, the statements of changes in net assets for each of the two years in the period then ended, and the supplementary data for each of the five years in the period then ended. These financial statements and supplementary data are the responsibility of the Portfolio's management. Our responsibility is to express an opinion on these financial statements and supplementary data based on our audits.
We conducted our audits in accordance with standards of the Public Company Accounting Oversight Board (United States). Those standards require that we plan and perform the audit to obtain reasonable assurance about whether the financial statements and supplementary data are free of material misstatement. The Portfolio is not required to have, nor were we engaged to perform, an audit of its internal control over financial reporting. Our audits included consideration of internal control over financial reporting as a basis for designing audit procedures that are appropriate in the circumstances, but not for the purpose of expressing an opinion on the effectiveness of the Portfolio's internal control over financial reporting. Accordingly, we express no such opinion. An audit also includes examining, on a test basis, evidence supporting the amounts and disclosures in the financial statements, assessing the accounting principles used and significant estimates made by management, as well as evaluating the overall financial statement presentation. Our procedures included confirmation of securities and Senior Loans owned at October 31, 2007, by correspondence with the custodian, brokers and agent banks; where replies were not received from brokers and selling or agent banks, we performed other auditing procedures. We believe that our audits provide a reasonable basis for our opinion.
In our opinion, the financial statements and supplementary data referred to above present fairly, in all material respects, the financial position of High Income Portfolio at October 31, 2007, the results of its operations for the year then ended, the changes in its net assets for each of the two years in the period then ended, and the supplementary data for each of the five years in the period then ended, in conformity with accounting principles generally accepted in the United States of America.
DELOITTE & TOUCHE LLP
Boston, Massachusetts
December 17, 2007
31
Eaton Vance High Income Fund
BOARD OF TRUSTEES' ANNUAL APPROVAL OF THE INVESTMENT ADVISORY AGREEMENT
Overview of the Contract Review Process
The Investment Company Act of 1940, as amended (the "1940 Act"), provides, in substance, that each investment advisory agreement between a fund and its investment adviser will continue in effect from year to year only if its continuance is approved at least annually by the fund's board of trustees, including by a vote of a majority of the trustees who are not "interested persons" of the fund ("Independent Trustees"), cast in person at a meeting called for the purpose of considering such approval.
At a meeting of the Boards of Trustees (each a "Board") of the Eaton Vance group of mutual funds (the "Eaton Vance Funds") held on April 23, 2007, the Board, including a majority of the Independent Trustees, voted to approve continuation of existing advisory and sub-advisory agreements for the Eaton Vance Funds for an additional one-year period. In voting its approval, the Board relied upon the affirmative recommendation of the Special Committee of the Board, which is a committee comprised exclusively of Independent Trustees. Prior to making its recommendation, the Special Committee reviewed information furnished for a series of meetings of the Special Committee held in February, March and April 2007. Such information included, among other things, the following:
Information about Fees, Performance and Expenses
• An independent report comparing the advisory and related fees paid by each fund with fees paid by comparable funds;
• An independent report comparing each fund's total expense ratio and its components to comparable funds;
• An independent report comparing the investment performance of each fund to the investment performance of comparable funds over various time periods;
• Data regarding investment performance in comparison to relevant peer groups of funds and appropriate indices;
• Comparative information concerning fees charged by each adviser for managing other mutual funds and institutional accounts using investment strategies and techniques similar to those used in managing the fund;
• Profitability analyses for each adviser with respect to each fund;
Information about Portfolio Management
• Descriptions of the investment management services provided to each fund, including the investment strategies and processes employed;
• Information concerning the allocation of brokerage and the benefits received by each adviser as a result of brokerage allocation, including information concerning the acquisition of research through "soft dollar" benefits received in connection with the funds' brokerage, and the implementation of a soft dollar reimbursement program established with respect to the funds;
• Data relating to portfolio turnover rates of each fund;
• The procedures and processes used to determine the fair value of fund assets and actions taken to monitor and test the effectiveness of such procedures and processes;
Information about each Adviser
• Reports detailing the financial results and condition of each adviser;
• Descriptions of the qualifications, education and experience of the individual investment professionals whose responsibilities include portfolio management and investment research for the funds, and information relating to their compensation and responsibilities with respect to managing other mutual funds and investment accounts;
• Copies of the Codes of Ethics of each adviser and its affiliates, together with information relating to compliance with and the administration of such codes;
• Copies of or descriptions of each adviser's proxy voting policies and procedures;
• Information concerning the resources devoted to compliance efforts undertaken by each adviser and its affiliates on behalf of the funds (including descriptions of various compliance programs) and their record of compliance with investment policies and restrictions, including policies with respect to market-timing, late trading and selective portfolio disclosure, and with policies on personal securities transactions;
• Descriptions of the business continuity and disaster recovery plans of each adviser and its affiliates;
Other Relevant Information
• Information concerning the nature, cost and character of the administrative and other non-investment management services provided by Eaton Vance Management and its affiliates;
• Information concerning management of the relationship with the custodian, subcustodians and fund accountants by each adviser or the funds' administrator; and
• The terms of each advisory agreement.
In addition to the information identified above, the Special Committee considered information provided from time to time by each adviser throughout the year at meetings of the Board and its committees. Over the course of the twelve-month period ended April 30, 2007, the
32
Eaton Vance High Income Fund
BOARD OF TRUSTEES' ANNUAL APPROVAL OF THE INVESTMENT ADVISORY AGREEMENT CONT'D
Board met ten times and the Special Committee, the Audit Committee and the Governance Committee, each of which is a Committee comprised solely of Independent Trustees, met twelve, fourteen and eight times, respectively. At such meetings, the Trustees received, among other things, presentations by the portfolio managers and other investment professionals of each adviser relating to the investment performance of each fund and the investment strategies used in pursuing the fund's investment objective.
For funds that invest through one or more underlying portfolios, the Board considered similar information about the portfolio(s) when considering the approval of advisory agreements. In addition, in cases where the fund's investment adviser has engaged a sub-adviser, the Board considered similar information about the sub-adviser when considering the approval of any sub-advisory agreement.
The Special Committee was assisted throughout the contract review process by Goodwin Procter LLP, legal counsel for the Independent Trustees. The members of the Special Committee relied upon the advice of such counsel and their own business judgment in determining the material factors to be considered in evaluating each advisory and sub-advisory agreement and the weight to be given to each such factor. The conclusions reached with respect to each advisory and sub-advisory agreement were based on a comprehensive evaluation of all the information provided and not any single factor. Moreover, each member of the Special Committee may have placed varying emphasis on particular factors in reaching conclusions with respect to each advisory and sub-advisory agreement.
Results of the Process
Based on its consideration of the foregoing, and such other information as it deemed relevant, including the factors and conclusions described below, the Special Committee concluded that the continuance of the investment advisory agreement of the High Income Portfolio (the "Portfolio"), the portfolio in which the Eaton Vance High Income Fund (the "Fund") invests, with Boston Management and Research (the "Adviser"), including the fee structure, is in the interests of shareholders and, therefore, the Special Committee recommended to the Board approval of the agreement. The Board accepted the recommendation of the Special Committee as well as the factors considered and conclusions reached by the Special Committee with respect to the agreement. Accordingly, the Board, including a majority of the Independent Trustees, voted to approve continuation of the investment advisory agreement for the Portfolio.
Nature, Extent and Quality of Services
In considering whether to approve the investment advisory agreement of the Portfolio, the Board evaluated the nature, extent and quality of services provided to the Portfolio by the Adviser.
The Board considered the Adviser's management capabilities and investment process with respect to the types of investments held by the Portfolio, including the education, experience and number of its investment professionals and other personnel who provide portfolio management, investment research, and similar services to the Portfolio. In particular, the Board evaluated the abilities and experience of such investment personnel in analyzing special considerations relevant to investing in high-yield debt. The Board also took into account the resources dedicated to portfolio management and other services, including the compensation paid to recruit and retain investment personnel, and the time and attention devoted to the Portfolio by senior management.
The Board reviewed the compliance programs of the Adviser and relevant affiliates thereof. Among other matters, the Board considered compliance and reporting matters relating to personal trading by investment personnel, selective disclosure of portfolio holdings, late trading, frequent trading, portfolio valuation, business continuity and the allocation of investment opportunities. The Board also evaluated the responses of the Adviser and its affiliates to requests from regulatory authorities such as the Securities and Exchange Commission and the National Association of Securities Dealers.
The Board considered shareholder and other administrative services provided or managed by Eaton Vance Management and its affiliates, including transfer agency and accounting services. The Board evaluated the benefits to shareholders of investing in a fund that is a part of a large family of funds, including the ability, in many cases, to exchange an investment among different funds without incurring additional sales charges.
After consideration of the foregoing factors, among others, the Board concluded that the nature, extent and quality of services provided by the Adviser, taken as a whole, are appropriate and consistent with the terms of the investment advisory agreement.
Fund Performance
The Board compared the Fund's investment performance to a relevant universe of similarly managed funds identified by an independent data provider and appropriate benchmark indices. The Board reviewed comparative performance data for the one-, three-, five- and ten-year periods ended September 30, 2006 for the Fund. The Board concluded that the performance of the Fund was satisfactory.
33
Eaton Vance High Income Fund
BOARD OF TRUSTEES' ANNUAL APPROVAL OF THE INVESTMENT ADVISORY AGREEMENT CONT'D
Management Fees and Expenses
The Board reviewed contractual investment advisory fee rates, including any administrative fee rates, payable by the Fund (referred to as "management fees"). As part of its review, the Board considered the management fees and the Fund's total expense ratio for the year ended September 30, 2006, as compared to a group of similarly managed funds selected by an independent data provider.
After reviewing the foregoing information, and in light of the nature, extent and quality of the services provided by the Adviser, the Board concluded that the management fees charged for advisory and related services and the Fund's total expense ratio are reasonable.
Profitability
The Board reviewed the level of profits realized by the Adviser and its affiliates in providing investment advisory and administrative services to the Fund, the Portfolio and all Eaton Vance Funds as a group. The Board considered the level of profits realized without regard to revenue sharing or other payments by the Adviser and its affiliates to third parties in respect of distribution services. The Board also considered other direct or indirect benefits received by the Adviser and its affiliates in connection with its relationship with the Fund and the Portfolio.
The Board concluded that, in light of the foregoing factors and the nature, extent and quality of the services rendered, the profits realized by the Adviser and its affiliates are reasonable.
Economies of Scale
In reviewing management fees and profitability, the Board also considered the extent to which the Adviser and its affiliates, on the one hand, and the Fund, on the other hand, can expect to realize benefits from economies of scale as the assets of the Fund and the Portfolio increase. The Board acknowledged the difficulty in accurately measuring the benefits resulting from the economies of scale with respect to the management of any specific fund or group of funds. The Board reviewed data summarizing the increases and decreases in the assets of the Fund and of all Eaton Vance Funds as a group over various time periods, and evaluated the extent to which the total expense ratio of the Fund and the profitability of the Adviser and its affiliates may have been affected by such increases or decreases. Based upon the foregoing, the Board concluded that the benefits from economies of scale are currently being shared equitably by the Adv iser and its affiliates and the Fund. The Board also concluded that, assuming reasonably foreseeable increases in the assets of the Portfolio, the structure of the advisory fee, which includes breakpoints at several asset levels, can be expected to cause the Adviser and its affiliates and the Fund to continue to share such benefits equitably.
34
Eaton Vance High Income Fund
MANAGEMENT AND ORGANIZATION
Fund Management. The Trustees of Eaton Vance Mutual Funds Trust (the Trust) and High Income Portfolio (the Portfolio) are responsible for the overall management and supervision of the Trust's and Portfolio's affairs. The Trustees and officers of the Trust and the Portfolio are listed below. Except as indicated, each individual has held the office shown or other offices in the same company for the last five years. Trustees and officers of the Trust and the Portfolio hold indefinite terms of office. The "noninterested Trustees" consist of those Trustees who are not "interested persons" of the Trust and the Portfolio, as that term is defined under the 1940 Act. The business address of each Trustee and officer is The Eaton Vance Building, 255 State Street, Boston, Massachusetts 02109. As used below, "EVC" refers to Eaton Vance Corp., "EV" refers to Eaton Vance, Inc., "EVM" refers to Eaton Vance Management, "BMR" refers to Boston Management and Research, "Parametric" refers to Parametric Portfolio Associates and "EVD" refers to Eaton Vance Distributors, Inc. EVC and EV are the corporate parent and trustee, respectively, of EVM and BMR. EVD is the Fund's principal underwriter, the Portfolio's placement agent and a wholly-owned subsidiary of EVM. Each officer affiliated with Eaton Vance may hold a position with other Eaton Vance affiliates that is comparable to his or her position with EVM listed below.
Name and
Date of Birth | | Position(s)
with the
Trust and
the Portfolio | | Term of
Office and
Length of
Service | | Principal Occupation(s)
During Past Five Years | | Number of Portfolios
in Fund Complex
Overseen By
Trustee(1) | | Other Directorships Held | |
| Interested Trustee | | | | | | | | | | | | | |
|
Thomas E. Faust Jr.
5/31/58 | | Trustee and President of
the Trust | | Trustee since 2007 and President of the Trust since 2002 | | Chairman, Chief Executive Officer and President of EVC, President of EV, Chief Executive Officer and President of EVM and BMR, and Director of EVD. Trustee and/or Officer of 176 registered investment companies and 5 private investment companies in the Eaton Vance Fund Complex. Mr. Faust is an interested person because of his positions with EVM, BMR, EVC and EV which are affiliates of the Trust and the Portfolio. | | | 176 | | | Director of EVC | |
|
| Noninterested Trustee(s) | | | | | | | | | | | | | |
|
Benjamin C. Esty
1/2/63 | | Trustee | | Since 2005 | | Roy and Elizabeth Simmons Professor of Business Administration, Harvard University Graduate School of Business Administration (since 2003). Formerly, Associate Professor, Harvard University Graduate School of Business Administration (2000-2003). | | | 176 | | | None | |
|
Allen R. Freedman
4/3/40 | | Trustee | | Since 2007 | | Former Chairman and Chief Executive Officer of Assurant, Inc. (insurance provider) (1978-2000). Formerly, a Director of Loring Ward International (fund distributor) (2005-2007). | | | 175 | | | Director of Assurant, Inc. and Stonemor Partners L.P. (owner and operator of cemeteries) | |
|
William H. Park
9/19/47 | | Trustee | | Since 2003 | | Vice Chairman, Commercial Industrial Finance Corp. (specialty finance company) (since 2006). Formerly, President and Chief Executive Officer, Prizm Capital Management, LLC (investment management firm) (2002-2005). | | | 176 | | | None | |
|
Ronald A. Pearlman
7/10/40 | | Trustee | | Since 2003 | | Professor of Law, Georgetown University Law Center. | | | 176 | | | None | |
|
Norton H. Reamer
9/21/35 | | Trustee | | Trustee of the Trust since 1986 and of the Portfolio since 1993 | | President, Chief Executive Officer and a Director of Asset Management Finance Corp. (a specialty finance company serving the investment management industry) (since October 2003). President, Unicorn Corporation (an investment and financial advisory services company) (since September 2000). Formerly, Chairman and Chief Operating Officer, Hellman, Jordan Management Co., Inc. (an investment management company) (2000-2003). Formerly, Advisory Director of Berkshire Capital Corporation (investment banking firm) (2002-2003). | | | 176 | | | None | |
|
35
Eaton Vance High Income Fund
MANAGEMENT AND ORGANIZATION CONT'D
Name and
Date of Birth | | Position(s)
with the
Trust and
the Portfolio | | Term of
Office and
Length of
Service | | Principal Occupation(s)
During Past Five Years | | Number of Portfolios
in Fund Complex
Overseen By
Trustee(1) | | Other Directorships Held | |
| Noninterested Trustee(s) (continued) | | | | | | | | | | | | | |
|
Heidi L. Steiger
7/8/53 | | Trustee | | Since 2007 | | President, Lowenhaupt Global Advisors, LLC (global wealth management firm) (since 2005); Formerly, President and Contributing Editor, Worth Magazine (2004); Formerly, Executive Vice President and Global Head of Private Asset Management (and various other positions), Neuberger Berman (investment firm) (1986-2004). | | | 173 | | | Director of Nuclear Electric Insurance Ltd. (nuclear insurance provider) and Aviva USA (insurance provider) | |
|
Lynn A. Stout
9/14/57 | | Trustee | | Since 1998 | | Paul Hastings Professor of Corporate and Securities Law, University of California at Los Angeles School of Law. | | | 176 | | | None | |
|
Ralph F. Verni
1/26/43 | | Chairman of
the Board
and Trustee | | Chairman of the Board since 2007 and Trustee since 2005 | | Consultant and private investor. | | | 176 | | | None | |
|
| Principal Officers who are not Trustees | | | | | | | |
|
Name and
Date of Birth | | Position(s)
with the
Trust and
the Portfolio | | Term of
Office and
Length of
Service | | Principal Occupation(s)
During Past Five Years | |
William H. Ahern, Jr.
7/28/59 | | Vice President of
the Trust | | Since 1995 | | Vice President of EVM and BMR. Officer of 74 registered investment companies managed by EVM or BMR. | |
|
Cynthia J. Clemson
3/2/63 | | Vice President of
the Trust | | Since 2005 | | Vice President of EVM and BMR. Officer of 89 registered investment companies managed by EVM or BMR. | |
|
Charles B. Gaffney
12/4/72 | | Vice President of
the Trust | | Since 2007 | | Vice President of EVM and BMR. Previously, Sector Portfolio Manager and Senior Equity Analyst of Brown Brothers Harriman (1997-2003). Officer of 29 registered investment companies managed by EVM or BMR. | |
|
Thomas P. Huggins
3/7/66 | | Vice President of
the Portfolio | | Since 2000 | | Vice President of EVM and BMR. Officer of 4 registered investment companies managed by EVM or BMR. | |
|
Christine M. Johnston
11/9/72 | | Vice President of
the Trust | | Since 2007 | | Vice President of EVM and BMR. Officer of 34 registered investment companies managed by EVM or BMR. | |
|
Aamer Khan
6/7/60 | | Vice President of
the Trust | | Since 2005 | | Vice President of EVM and BMR. Officer of 32 registered investment companies managed by EVM or BMR. | |
|
Thomas H. Luster
4/8/62 | | Vice President of
the Trust | | Since 2006 | | Vice President of EVM and BMR. Officer of 48 registered investment companies managed by EVM or BMR. | |
|
Michael R. Mach
7/15/47 | | Vice President of
the Trust | | Since 1999 | | Vice President of EVM and BMR. Officer of 54 registered investment companies managed by EVM or BMR. | |
|
Robert B. MacIntosh
1/22/57 | | Vice President of
the Trust | | Since 1998 | | Vice President of EVM and BMR. Officer of 89 registered investment companies managed by EVM or BMR. | |
|
Duncan W. Richardson
10/26/57 | | Vice President of
the Trust | | Since 2001 | | Executive Vice President and Chief Equity Investment Officer of EVC, EVM and BMR. Officer of 80 registered investment companies managed by EVM or BMR. | |
|
36
Eaton Vance High Income Fund
MANAGEMENT AND ORGANIZATION CONT'D
Name and
Date of Birth | | Position(s)
with the
Trust and
the Portfolio | | Term of
Office and
Length of
Service | | Principal Occupation(s)
During Past Five Years | |
| Principal Officers who are not Trustees (continued) | | | | | | | |
|
Walter A. Row, III
7/20/57 | | Vice President of
the Trust | | Since 2001 | | Director of Equity Research and a Vice President of EVM and BMR. Officer of 38 registered investment companies managed by EVM or BMR. | |
|
Judith A. Saryan
8/21/54 | | Vice President of
the Trust | | Since 2003 | | Vice President of EVM and BMR. Officer of 53 registered investment companies managed by EVM or BMR. | |
|
Susan Schiff
3/13/61 | | Vice President of
the Trust | | Since 2002 | | Vice President of EVM and BMR. Officer of 35 registered investment companies managed by EVM or BMR. | |
|
Thomas Seto
9/27/62 | | Vice President of
the Trust | | Since 2007 | | Vice President and Director of Portfolio Management of Parametric. Officer of 30 registered investment companies managed by EVM or BMR. | |
|
David M. Stein
5/4/51 | | Vice President of
the Trust | | Since 2007 | | Managing Director and Chief Investment Officer of Parametric. Officer of 30 registered investment companies managed by EVM or BMR. | |
|
Mark S. Venezia
5/23/49 | | Vice President of
the Trust | | Since 2007 | | Vice President of EVM and BMR. Officer of 35 registered investment companies managed by EVM or BMR. | |
|
Adam A. Weigold
3/22/75 | | Vice President of
the Trust | | Since 2007 | | Vice President of EVM and BMR. Officer of 70 registered investment companies managed by EVM or BMR. | |
|
Michael W. Weilheimer
2/11/61 | | President of
the Portfolio | | Since 2002 | | Vice President of EVM and BMR. Officer of 25 registered investment companies managed by EVM or BMR. | |
|
Barbara E. Campbell
6/19/57 | | Treasurer of the Trust | | Since 2005 | | Vice President of EVM and BMR. Officer of 176 registered investment companies managed by EVM or BMR. | |
|
Maureen A. Gemma
5/24/60 | | Secretary | | Since 2007 | | Deputy Chief Legal Officer and Vice President of EVM and BMR. Officer of 176 registered investment companies managed by EVM or BMR. | |
|
Dan A. Maalouly
3/25/62 | | Treasurer of
the Portfolio | | Since 2005 | | Vice President of EVM and BMR. Previously Senior Manager at Pricewaterhouse Coopers LLP (1997-2005). Officer of 71 registered investment companies managed by EVM or BMR. | |
|
Paul M. O'Neil
7/11/53 | | Chief
Compliance Officer | | Since 2004 | | Vice President of EVM and BMR. Officer of 176 registered investment companies managed by EVM or BMR. | |
|
(1) Includes both master and feeder funds in a master-feeder structure.
The SAI for the Fund includes additional information about the Trustees and officers of the Fund and the Portfolio and can be obtained without charge by calling 1-800-225-6265.
37
This Page Intentionally Left Blank
This Page Intentionally Left Blank
This Page Intentionally Left Blank
Investment Adviser of High Income Portfolio
Boston Management and Research
The Eaton Vance Building
255 State Street
Boston, MA 02109
Administrator of Eaton Vance High Income Fund
Eaton Vance Management
The Eaton Vance Building
255 State Street
Boston, MA 02109
Principal Underwriter
Eaton Vance Distributors, Inc.
The Eaton Vance Building
255 State Street
Boston, MA 02109
(617) 482-8260
Custodian
State Street Bank and Trust Company
200 Clarendon Street
Boston, MA 02116
Transfer Agent
PFPC Inc.
Attn: Eaton Vance Funds
P.O. Box 9653
Providence, RI 02940-9653
(800) 262-1122
Independent Registered Public Accounting Firm
Deloitte & Touche LLP
200 Berkeley Street
Boston, MA 02116-5022
Eaton Vance High Income Fund
The Eaton Vance Building
255 State Street
Boston, MA 02109
This report must be preceded or accompanied by a current prospectus. Before investing, investors should consider carefully the Fund's investment objective(s), risks, and charges and expenses. The Fund's current prospectus contains this and other information about the Fund and is available through your financial advisor. Please read the prospectus carefully before you invest or send money. For further information please call 1-800-225-6265.
446-12/07 HISRC

Annual Report October 31, 2007


EATON VANCE
INTERNATIONAL
EQUITY
FUND
IMPORTANT NOTICES REGARDING PRIVACY,
DELIVERY OF SHAREHOLDER DOCUMENTS,
PORTFOLIO HOLDINGS AND PROXY VOTING
Privacy. The Eaton Vance organization is committed to ensuring your financial privacy. Each of the financial institutions identified below has in effect the following policy ("Privacy Policy") with respect to nonpublic personal information about its customers:
• Only such information received from you, through application forms or otherwise, and information about your Eaton Vance fund transactions will be collected. This may include information such as name, address, social security number, tax status, account balances and transactions.
• None of such information about you (or former customers) will be disclosed to anyone, except as permitted by law (which includes disclosure to employees necessary to service your account). In the normal course of servicing a customer's account, Eaton Vance may share information with unaffiliated third parties that perform various required services such as transfer agents, custodians and broker/dealers.
• Policies and procedures (including physical, electronic and procedural safeguards) are in place that are designed to protect the confidentiality of such information.
• We reserve the right to change our Privacy Policy at any time upon proper notification to you. Customers may want to review our Policy periodically for changes by accessing the link on our homepage: www.eatonvance.com.
Our pledge of privacy applies to the following entities within the Eaton Vance organization: the Eaton Vance Family of Funds, Eaton Vance Management, Eaton Vance Investment Counsel, Boston Management and Research, and Eaton Vance Distributors, Inc.
In addition, our Privacy Policy only applies to those Eaton Vance customers who are individuals and who have a direct relationship with us. If a customer's account (i.e. fund shares) is held in the name of a third-party financial adviser/ broker-dealer, it is likely that only such adviser's privacy policies apply to the customer. This notice supersedes all previously issued privacy disclosures.
For more information about Eaton Vance's Privacy Policy, please call 1-800-262-1122.
Delivery of Shareholder Documents. The Securities and Exchange Commission (the "SEC") permits funds to deliver only one copy of shareholder documents, including prospectuses, proxy statements and shareholder reports, to fund investors with multiple accounts at the same residential or post office box address. This practice is often called "householding" and it helps eliminate duplicate mailings to shareholders.
Eaton Vance, or your financial adviser, may household the mailing of your documents indefinitely unless you instruct Eaton Vance, or your financial adviser, otherwise.
If you would prefer that your Eaton Vance documents not be householded, please contact Eaton Vance at 1-800-262-1122, or contact your financial adviser.
Your instructions that householding not apply to delivery of your Eaton Vance documents will be effective within 30 days of receipt by Eaton Vance or your financial adviser.
Portfolio Holdings. Each Eaton Vance Fund and its underlying Portfolio (if applicable) will file a schedule of its portfolio holdings on Form N-Q with the SEC for the first and third quarters of each fiscal year. The Form N-Q will be available on the Eaton Vance website www.eatonvance.com, by calling Eaton Vance at 1-800-262-1122 or in the EDGAR database on the SEC's website at www.sec.gov. Form N-Q may also be reviewed and copied at the SEC's public reference room in Washington, D.C. (call 1-800-732-0330 for information on the operation of the public reference room).
Proxy Voting. From time to time, funds are required to vote proxies related to the securities held by the funds. The Eaton Vance Funds or their underlying Portfolios (if applicable) vote proxies according to a set of policies and procedures approved by the Funds' and Portfolios' Boards. You may obtain a description of these policies and procedures and information on how the Funds or Portfolios voted proxies relating to portfolio securities during the most recent 12 month period ended June 30, without charge, upon request, by calling 1-800-262-1122. This description is also available on the SEC's website at www.sec.gov.
Eaton Vance International Equity Fund as of October 31, 2007
MANAGEMENT’S DISCUSSION OF FUND PERFORMANCE

Edward R. Allen III, CFA
Eagle Global Advisors
Co-Portfolio Manager

Thomas N. Hunt III, CFA
Eagle Global Advisors
Co-Portfolio Manager
The Fund
Performance for the Past Year
· For the year ended October 31, 2007, the Fund’s Class A shares had a total return of 33.78%.(1)
· The Fund’s Class C shares had a total return of 32.79% for the same period.(1)
· The Fund’s Class I shares had a total return of 34.09% for the same period.(1)
· For comparison, the Fund’s benchmark, the Morgan Stanley Capital International Europe, Australasia, and Far East Index (“MSCI EAFE Index”) — a broadbased, unmanaged market index of international stocks – had a total return of 24.91% for the year ended October 31, 2007. The Fund’s peer group, the Lipper International Multi-Cap Core Funds Classification, had an average return of 27.22% for the same period.(2)
Management Discussion
· During the year ended October 31, 2007, reduced expectations for U.S. growth, combined with greater expectations for European and developing countries’ economic growth, led to a weak dollar and stronger foreign currencies. Strong moves by the Euro and the British pound and, to a lesser extent, the Asian currencies, have boosted U.S. investor returns on foreign stocks. The Bank of England and the European Central Bank took measures to inject liquidity into their markets during the year, while rethinking previous inflation concerns in light of the negative impacts of stronger currencies on exporters and subprime lending woes. Japan’s economy continued to soften and deflation became a concern again. Japan has paused raising interest rates, currently at 0.5%, also in response to continued volatility in the financial markets and to signs of a slowdown in the U.S. economy. China, on the other hand, experienced strong growth along with higher inflation, prompting authorities to take measures to reduce liquidity by raising interest rates and increasing reserve requirements for banks.
· While overseas economies are not immune to the strains on the U.S. economy, at October 31, 2007, the global economy continued to be relatively strong, propelled by the rapidly developing economies in Asia, Latin America and Eastern Europe.
· The Fund currently invests its assets in a separate registered investment company, International Equity Portfolio (the “Portfolio”), with the same objectives and policies as the Fund. For the year ended October 31, 2007, the Fund had strong returns, outperforming the benchmark MSCI EAFE Index, due to both stock selection and sector allocation.(2) The Portfolio’s largecap focus benefited returns, as larger-capitalization stocks outperformed smaller-capitalization names, especially in the latter half of the year. The Fund also benefited from its general growth orientation, as international growth securities outpaced value securities during the period.(2), (3)
· The Fund’s outperformance of the MSCI EAFE Index for the period was primarily due to stock selection in the industrials, information technology, materials and energy sectors. Although the Portfolio’s underweighting in the consumer discretionary sector was a positive, stock selection in this sector detracted from returns. During the period, the Portfolio reduced its weighting in financials, which helped performance as volatility in the credit markets created uncertainty. The Portfolio increased its weightings in the telecommunications and information technology sectors during the period, which proved positive for performance.(1)
(1) | These returns do not include the 5.75% maximum sales charge for Class A shares or the applicable contingent deferred sales charge (CDSC) for Class C shares. Class A and Class I shares are subject to a 1% redemption fee if redeemed or exchanged within 90 days of settlement of purchase. If sales charges were deducted, the returns would be lower. Class I shares are offered to certain investors at net asset value. Absent an expense waiver by the adviser and sub-adviser of the Portfolio and an allocation of certain expenses to the sub-adviser of the Portfolio and administrator of the Fund, the returns would be lower. |
| |
(2) | It is not possible to invest directly in an Index or Lipper Classification. The Index’s total return does not reflect commissions or expenses that would have been incurred if an investor individually purchased or sold the securities represented in the Index. The Lipper total return is the average total return, at net asset value, of the funds that are in the same Lipper Classification as the Fund. |
| |
(3) | Holdings and sector weightings are subject to change due to active management. |
Past performance is no guarantee of future results. Returns are historical and are calculated by determining the percentage change in net asset value or offering price (as applicable) with all distributions reinvested. Investment return and principal value will fluctuate so that shares, when redeemed, may be worth more or less than their original cost. Performance is for the stated time period only; due to market volatility, the Fund’s current performance may be lower or higher than the quoted return. Fund performance during certain periods reflects the strong stock market performance and/or the strong performance of stocks held during those periods. This performance is not typical and may not be repeated. For performance as of the most recent month end, please refer to www.eatonvance.com.
Fund shares are not insured by the FDIC and are not deposits or other obligations of, or guaranteed by, any depository institution. Shares are subject to investment risks, including possible loss of principal invested.
1
· The Fund benefited from the Portfolio’s exposure to Canadian companies and the emerging markets, which outperformed developed markets, and the Portfolio’s underweight to Japan, which was a poor performer in this period. However, the Portfolio’s Japanese holdings performed well, as did stocks in Singapore, Norway and Australia.(1)
(1) Holdings and sector weightings are subject to change due to active management.
Global Allocation*
By net assets
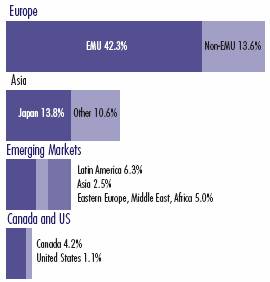
* | As a percentage of the Portfolio’s net assets as of October 31, 2007. Portfolio information may not be representative of the Portfolio’s current or future investments and may change due to active management. |
Ten Largest Equity Holdings**
By net assets
Nintendo Co., Ltd. | | 4.5 | % |
Rio Tinto PLC ADR | | 2.9 | |
Nestle SA ADR | | 2.7 | |
Keppel Corp., Ltd. ADR | | 2.6 | |
Total SA ADR | | 2.4 | |
Petroleo Brasileiro SA ADR | | 2.2 | |
Turkcell Iletisim Hizmetleri AS ADR | | 2.2 | |
RWE AG ADR | | 2.1 | |
Mitsubishi Corp. ADR | | 2.1 | |
Companhia Vale do Rio Dore ADR | | 2.0 | |
** | Ten Largest Equity Holdings represented 25.7% of Portfolio net assets as of October 31, 2007. Holdings are subject to change due to active management. |
The views expressed throughout this report are those of the portfolio managers and are current only through the end of the period of the report as stated on the cover. These views are subject to change at any time based upon market or other conditions, and the investment adviser disclaims any responsibility to update such views. These views may not be relied on as investment advice and, because investment decisions for a fund are based on many factors, may not be relied on as an indication of trading intent on behalf of any Eaton Vance fund.
2
Eaton Vance International Equity Fund as of October 31, 2007
Fund Performance
The line graphs and table set forth below provide information about the Fund’s performance. The line graphs compare the performance of Class A, Class C, and Class I of the Fund with that of the MSCI EAFE Index, a broad-based, unmanaged index of international stocks. The lines on the graphs represent the total returns of a hypothetical investment of $10,000 in each of Class A, Class C, and Class I and the MSCI EAFE Index. Class A total returns are presented at net asset value and maximum public offering price. The table includes the total returns of each Class of the Fund at net asset value and public offering price. The performance presented below does not reflect the deduction of taxes, if any, that a shareholder would pay on distributions or redemptions of Fund shares.
Performance(1) | | Class A | | Class C | | Class I | |
Symbol | | EAIEX | | ECIEX | | N/A | |
Average Annual Total Returns (at net asset value) | | | | | | | |
One Year | | 33.78 | % | 32.79 | % | 34.09 | % |
Life of Fund† | | 28.33 | | 27.40 | | 28.63 | |
SEC Average Annual Total Returns (including sales charge or applicable CDSC) | | | | | | | |
One Year | | 26.09 | % | 31.79 | % | 34.09 | % |
Life of Fund† | | 23.09 | | 27.40 | | 28.63 | |
†Inception Dates – Class A: 5/31/06; Class C: 5/31/06; Class I: 5/31/06
(1) | Average annual total returns at net asset value do not include the 5.75% maximum sales charge for Class A shares or the applicable contingent deferred sales charge (CDSC) for Class C shares. If sales charges were deducted, the returns would be lower. Class A and Class I shares are subject to a 1% redemption fee if redeemed or exchanged within 90 days of settlement of purchase. SEC average annual total returns for Class A reflect the maximum 5.75% sales charge. SEC returns for Class C reflect a 1% CDSC. Class I are offered to certain investors at net asset value. Absent an expense waiver by the adviser and sub-adviser of the Portfolio and an allocation of certain expenses to the sub-adviser of the Portfolio and administrator of the Fund, the returns would be lower. |
Total Annual
Operating Expenses(2) | | Class A | | Class C | | Class I | |
Gross Expense Ratio | | 5.31 | % | 6.06 | % | 5.06 | % |
Net Expense Ratio | | 1.50 | % | 2.25 | % | 1.25 | % |
(2) | From the Fund’s prospectus dated 3/1/07. Reflects a contractual expense limitation that continues through February 28, 2008. Thereafter, the expense limitation may be changed or terminated at any time. Without this expense limitation, performance would have been lower. |
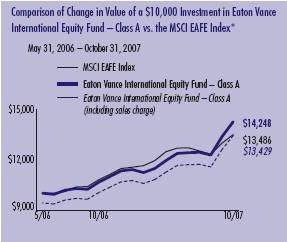
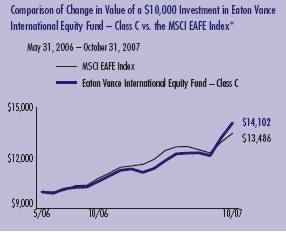
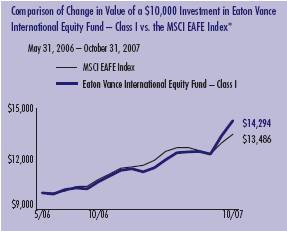
* | Source: Thomson Financial. Class A, Class C and Class I of the Fund commenced investment operations on 5/31/06. It is not possible to invest directly in an Index. The Index’s total returns do not reflect commissions or expenses that would have been incurred if an investor individually purchased or sold the securities represented in the Index. Absent an expense waiver by the adviser and sub-adviser of the Portfolio and an allocation of certain expenses to the sub-adviser of the Portfolio and administrator of the Fund, the returns would be lower. |
Past performance is no guarantee of future results. Returns are historical and are calculated by determining the percentage change in net asset value or offering price (as applicable) with all distributions reinvested. Investment return and principal value will fluctuate so that shares, when redeemed, may be worth more or less than their original cost. Performance is for the stated time period only; due to market volatility, the Fund’s current performance may be lower or higher than the quoted return. Fund performance during certain periods reflects the strong stock market performance and/or the strong performance of stocks held during those periods. This performance is not typical and may not be repeated. For performance as of the most recent month end, please refer to www.eatonvance.com.
3
Eaton Vance International Equity Fund as of October 31, 2007
FUND EXPENSES
Example: As a shareholder of the Fund, you incur two types of costs: (1) transaction costs, including sales charges (loads) on purchases and redemption fees (if applicable); and (2) ongoing costs, including management fees; distribution or service fees; and other Fund expenses. This Example is intended to help you understand your ongoing costs (in dollars) of investing in the Fund and to compare these costs with the ongoing costs of investing in other mutual funds. The Example is based on an investment of $1,000 invested at the beginning of the period and held for the entire period (May 1, 2007 – October 31, 2007).
Actual Expenses: The first section of the table below provides information about actual account values and actual expenses. You may use the information in this section, together with the amount you invested, to estimate the expenses that you paid over the period. Simply divide your account value by $1,000 (for example, an $8,600 account value divided by $1,000 = 8.6), then multiply the result by the number in the first section under the heading entitled "Expenses Paid During Period" to estimate the expenses you paid on your account during this period.
Hypothetical Example for Comparison Purposes: The second section of the table below provides information about hypothetical account values and hypothetical expenses based on the actual Fund expense ratio and an assumed rate of return of 5% per year (before expenses), which is not the actual return of the Fund. The hypothetical account values and expenses may not be used to estimate the actual ending account balance or expenses you paid for the period. You may use this information to compare the ongoing costs of investing in your Fund and other funds. To do so, compare this 5% hypothetical example with the 5% hypothetical examples that appear in the shareholder reports of the other funds.
Please note that the expenses shown in the table are meant to highlight your ongoing costs only and do not reflect any transactional costs, such as sales charges (loads) or redemption fees (if applicable). Therefore, the second section of the table is useful in comparing ongoing costs only, and will not help you determine the relative total costs of owning different funds. In addition, if these transactional costs were included, your costs would have been higher.
Eaton Vance International Equity Fund
| | | Beginning Account Value
(5/1/07) | | Ending Account Value
(10/31/07) | | Expenses Paid During Period*
(5/1/07 – 10/31/07) | |
| Actual | |
| Class A | | $ | 1,000.00 | | | $ | 1,193.30 | | | $ | 8.29 | ** | |
| Class C | | $ | 1,000.00 | | | $ | 1,189.30 | | | $ | 12.42 | ** | |
| Class I | | $ | 1,000.00 | | | $ | 1,194.60 | | | $ | 6.91 | ** | |
| Hypothetical | |
| (5% return per year before expenses) | |
| Class A | | $ | 1,000.00 | | | $ | 1,017.60 | | | $ | 7.63 | ** | |
| Class C | | $ | 1,000.00 | | | $ | 1,013.90 | | | $ | 11.42 | ** | |
| Class I | | $ | 1,000.00 | | | $ | 1,018.90 | | | $ | 6.36 | ** | |
* Expenses are equal to the Fund's annualized expense ratio of 1.50% for Class A shares, 2.25% for Class C shares and 1.25% for Class I shares, multiplied by the average account value over the period, multiplied by 184/365 (to reflect the one-half year period). The Example assumes that the $1,000 was invested at the net asset value per share determined at the close of business on April 30, 2007. The Example reflects the expenses of both the Fund and the Portfolio.
** Absent an expense waiver by the adviser and sub-adviser of the Portfolio and an allocation of certain expenses to the adviser and sub-adviser of the Portfolio and the administrator of the Fund, expenses would be higher.
4
Eaton Vance International Equity Fund as of October 31, 2007
FINANCIAL STATEMENTS
Statement of Assets and Liabilities
As of October 31, 2007
| Assets | |
Investment in International Equity Portfolio, at value
(identified cost, $12,184,195) | | $ | 15,044,706 | | |
| Receivable for Fund shares sold | | | 48,702 | | |
Receivable from the administrator of the Fund and the sub-adviser of
the Portfolio | | | 54,020 | | |
| Total assets | | $ | 15,147,428 | | |
| Liabilities | |
| Payable to affiliate for distribution and service fees | | $ | 1,724 | | |
| Payable for Fund shares redeemed | | | 640 | | |
| Payable to affiliate for Trustees' fees | | | 17 | | |
| Accrued expenses | | | 33,855 | | |
| Total liabilities | | $ | 36,236 | | |
| Net Assets | | $ | 15,111,192 | | |
| Sources of Net Assets | |
| Paid-in capital | | $ | 12,051,933 | | |
Accumulated net realized loss from Portfolio (computed on the basis
of identified cost) | | | (80,846 | ) | |
| Accumulated undistributed net investment income | | | 279,594 | | |
Net unrealized appreciation from Portfolio (computed on the basis of
identified cost) | | | 2,860,511 | | |
| Total | | $ | 15,111,192 | | |
| Class A Shares | |
| Net Assets | | $ | 4,123,798 | | |
| Shares Outstanding | | | 290,369 | | |
Net Asset Value and Redemption Price Per Share
(net assets ÷ shares of beneficial interest outstanding) | | $ | 14.20 | | |
Maximum Offering Price Per Share
(100 ÷ 94.25 of $14.20) | | $ | 15.07 | | |
| Class C Shares | |
| Net Assets | | $ | 1,200,365 | | |
| Shares Outstanding | | | 85,347 | | |
Net Asset Value and Offering Price Per Share*
(net assets ÷ shares of beneficial interest outstanding) | | $ | 14.06 | | |
| Class I Shares | |
| Net Assets | | $ | 9,787,029 | | |
| Shares Outstanding | | | 687,387 | | |
Net Asset Value, Offering Price and Redemption Price Per Share
(net assets ÷ shares of beneficial interest outstanding) | | $ | 14.24 | | |
| On sales of $50,000 or more, the offering price of Class A shares is reduced. | |
* Redemption price per share is equal to the net asset value less any applicable contingent deferred sales charge.
Statement of Operations
For the Year Ended
October 31, 2007
| Investment Income | |
| Dividends allocated from Portfolio (net of foreign taxes, $19,353) | | $ | 406,509 | | |
| Interest allocated from Portfolio | | | 16,230 | | |
| Expenses allocated from Portfolio | | | (79,143 | ) | |
| Net investment income from Portfolio | | $ | 343,596 | | |
| Expenses | |
| Trustees' fees and expenses | | $ | 117 | | |
Distribution and service fees
Class A | | | 4,531 | | |
| Class C | | | 6,327 | | |
| Registration fees | | | 34,899 | | |
| Legal and accounting services | | | 22,771 | | |
| Custodian fee | | | 8,503 | | |
| Printing and postage | | | 7,194 | | |
| Transfer and dividend disbursing agent fees | | | 6,485 | | |
| Miscellaneous | | | 4,241 | | |
| Total expenses | | $ | 95,068 | | |
Deduct —
Allocation of expenses to the administrator of the Fund and the
sub-adviser of the Portfolio | | $ | 54,050 | | |
| Total expense reductions | | $ | 54,050 | | |
| Net expenses | | $ | 41,018 | | |
| Net investment income | | $ | 302,578 | | |
Realized and Unrealized
Gain (Loss) from Portfolio | |
Net realized gain (loss) —
Investment transactions (identified cost basis) | | $ | (73,503 | ) | |
| Foreign currency transactions | | | (6,780 | ) | |
| Net realized loss | | $ | (80,283 | ) | |
Change in unrealized appreciation (depreciation) —
Investments (identified cost basis) | | $ | 2,706,856 | | |
| Foreign currency | | | 178 | | |
| Net change in unrealized appreciation (depreciation) | | $ | 2,707,034 | | |
| Net realized and unrealized gain | | $ | 2,626,751 | | |
| Net increase in net assets from operations | | $ | 2,929,329 | | |
See notes to financial statements
5
Eaton Vance International Equity Fund as of October 31, 2007
FINANCIAL STATEMENTS CONT'D
Statements of Changes in Net Assets
Increase (Decrease)
in Net Assets | | Year Ended
October 31, 2007 | | Period Ended
October 31, 2006(1) | |
From operations —
Net investment income | | $ | 302,578 | | | $ | 4,827 | | |
Net realized loss from investment
and foreign currency transactions | | | (80,283 | ) | | | (9,115 | ) | |
Net change in unrealized appreciation
(depreciation) from investments and
foreign currency | | | 2,707,034 | | | | 153,477 | | |
| Net increase in net assets from operations | | $ | 2,929,329 | | | $ | 149,189 | | |
Distributions to shareholders —
From net investment income
Class A | | $ | (3,071 | ) | | $ | — | | |
| Class C | | | (771 | ) | | | — | | |
| Class I | | | (15,417 | ) | | | — | | |
| Total distributions to shareholders | | $ | (19,259 | ) | | $ | — | | |
Transactions in shares of beneficial interest —
Proceeds from sale of shares
Class A | | $ | 3,159,566 | | | $ | 418,090 | | |
| Class C | | | 1,104,672 | | | | 163,442 | | |
| Class I | | | 5,282,824 | | | | 2,603,516 | | |
Net asset value of shares issued to
shareholders in payment of
distributions declared
Class A | | | 1,735 | | | | — | | |
| Class C | | | 636 | | | | — | | |
| Class I | | | 13,413 | | | | — | | |
Cost of shares redeemed
Class A | | | (130,804 | ) | | | (4,360 | ) | |
| Class C | | | (269,863 | ) | | | — | | |
| Class I | | | (288,484 | ) | | | (3,011 | ) | |
| Redemption fees | | | 487 | | | | 44 | | |
Net increase in net assets from
Fund share transactions | | $ | 8,874,182 | | | $ | 3,177,721 | | |
| Net increase in net assets | | $ | 11,784,252 | | | $ | 3,326,910 | | |
| Net Assets | |
| At beginning of period | | $ | 3,326,940 | | | $ | 30 | | |
| At end of period | | $ | 15,111,192 | | | $ | 3,326,940 | | |
Accumulated undistributed
net investment income
included in net assets | |
| At end of period | | $ | 279,594 | | | $ | 3,054 | | |
(1) For the period from the start of business, May 31, 2006 to October 31, 2006.
See notes to financial statements
6
Eaton Vance International Equity Fund as of October 31, 2007
FINANCIAL STATEMENTS CONT'D
Financial Highlights
| | | Class A | |
| | | Year Ended
October 31, 2007(2) | | Period Ended
October 31, 2006(1)(2) | |
| Net asset value — Beginning of period | | $ | 10.650 | | | $ | 10.000 | | |
| Income (loss) from operations | |
| Net investment income (loss) | | $ | 0.468 | (7) | | $ | (0.003 | ) | |
| Net realized and unrealized gain | | | 3.119 | | | | 0.653 | | |
| Total income from operations | | $ | 3.587 | | | $ | 0.650 | | |
| Less distributions | |
| From net investment income | | $ | (0.038 | ) | | $ | — | | |
| Total distributions | | $ | (0.038 | ) | | $ | — | | |
| Redemption fees | | $ | 0.001 | | | $ | 0.000 | (3) | |
| Net asset value — End of period | | $ | 14.200 | | | $ | 10.650 | | |
| Total Return(4) | | | 33.78 | % | | | 6.50 | %(9) | |
| Ratios/Supplemental Data | |
| Net assets, end of period (000's omitted) | | $ | 4,124 | | | $ | 430 | | |
| Ratios (As a percentage of average daily net assets): | |
| Expenses before custodian fee reduction(5)(6) | | | 1.50 | % | | | 1.51 | %(8) | |
| Expenses after custodian fee reduction(5)(6) | | | 1.50 | % | | | 1.50 | %(8) | |
| Net investment income (loss) | | | 3.82 | % | | | (0.08 | )%(8) | |
| Portfolio Turnover of the Portfolio | | | 21 | % | | | 1 | % | |
(1) For the period from the start of business, May 31, 2006 to October 31, 2006.
(2) Net investment income (loss) and redemption fees per share were computed using average shares outstanding.
(3) Amount represents less than $0.0005 per share.
(4) Returns are historical and are calculated by determining the percentage change in net asset value with all distributions reinvested.
(5) Includes the Fund's share of the Portfolio's allocated expenses.
(6) The investment adviser waived all or a portion of its investment advisory fee and the investment adviser and administrator subsidized certain operating expenses (equal to 1.17% and 19.97% of average daily net assets for the year ended October 31, 2007 and the period ended October 31, 2006, respectively). A portion of the waiver and subsidy was borne by the sub-adviser of the Portfolio. Absent the waivers and allocation, total return would be lower.
(7) Net investment income per share reflects a dividend resulting from a corporate action allocated from the Portfolio which amounted to $0.342 per share. Excluding this dividend, the ratio of net investment income to average daily net assets would have been 1.02%.
(8) Annualized.
(9) Not annualized.
See notes to financial statements
7
Eaton Vance International Equity Fund as of October 31, 2007
FINANCIAL STATEMENTS CONT'D
Financial Highlights
| | | Class C | |
| | | Year Ended
October 31, 2007(2) | | Period Ended
October 31, 2006(1)(2) | |
| Net asset value — Beginning of period | | $ | 10.620 | | | $ | 10.000 | | |
| Income (loss) from operations | |
| Net investment income (loss) | | $ | 0.338 | (7) | | $ | (0.037 | ) | |
| Net realized and unrealized gain | | | 3.127 | | | | 0.657 | | |
| Total income from operations | | $ | 3.465 | | | $ | 0.620 | | |
| Less distributions | |
| From net investment income | | $ | (0.026 | ) | | $ | — | | |
| Total distributions | | $ | (0.026 | ) | | $ | — | | |
| Redemption fees | | $ | 0.001 | | | $ | 0.000 | (3) | |
| Net asset value — End of period | | $ | 14.060 | | | $ | 10.620 | | |
| Total Return(4) | | | 32.79 | % | | | 6.20 | %(9) | |
| Ratios/Supplemental Data | |
| Net assets, end of period (000's omitted) | | $ | 1,200 | | | $ | 170 | | |
| Ratios (As a percentage of average daily net assets): | |
| Expenses before custodian fee reduction(5)(6) | | | 2.25 | % | | | 2.26 | %(8) | |
| Expenses after custodian fee reduction(5)(6) | | | 2.25 | % | | | 2.25 | %(8) | |
| Net investment income (loss) | | | 2.78 | % | | | (0.87 | )%(8) | |
| Portfolio Turnover of the Portfolio | | | 21 | % | | | 1 | % | |
(1) For the period from the start of business, May 31, 2006 to October 31, 2006.
(2) Net investment income (loss) and redemption fees per share were computed using average shares outstanding.
(3) Amount represents less than $0.0005 per share.
(4) Returns are historical and are calculated by determining the percentage change in net asset value with all distributions reinvested.
(5) Includes the Fund's share of the Portfolio's allocated expenses.
(6) The investment adviser waived all or a portion of its investment advisory fee and the investment adviser and administrator subsidized certain operating expenses (equal to 1.17% and 19.97% of average daily net assets for the year ended October 31, 2007 and the period ended October 31, 2006, respectively). A portion of the waiver and subsidy was borne by the sub-adviser of the Portfolio. Absent the waivers and allocation, total return would be lower.
(7) Net investment income per share reflects a dividend resulting from a corporate action allocated from the Portfolio which amounted to $0.290 per share. Excluding this dividend, the ratio of net investment income to average daily net assets would have been 0.39%.
(8) Annualized.
(9) Not annualized.
See notes to financial statements
8
Eaton Vance International Equity Fund as of October 31, 2007
FINANCIAL STATEMENTS CONT'D
Financial Highlights
| | | Class I | |
| | | Year Ended
October 31, 2007(2) | | Period Ended
October 31, 2006(1)(2) | |
| Net asset value — Beginning of period | | $ | 10.660 | | | $ | 10.000 | | |
| Income (loss) from operations | |
| Net investment income | | $ | 0.416 | (7) | | $ | 0.037 | | |
| Net realized and unrealized gain | | | 3.206 | | | | 0.623 | | |
| Total income from operations | | $ | 3.622 | | | $ | 0.660 | | |
| Less distributions | |
| From net investment income | | $ | (0.043 | ) | | $ | — | | |
| Total distributions | | $ | (0.043 | ) | | $ | — | | |
| Redemption fees | | $ | 0.001 | | | $ | 0.000 | (3) | |
| Net asset value — End of period | | $ | 14.240 | | | $ | 10.660 | | |
| Total Return(4) | | | 34.09 | % | | | 6.60 | %(9) | |
| Ratios/Supplemental Data | |
| Net assets, end of period (000's omitted) | | $ | 9,787 | | | $ | 2,726 | | |
| Ratios (As a percentage of average daily net assets): | |
| Expenses before custodian fee reduction(5)(6) | | | 1.25 | % | | | 1.26 | %(8) | |
| Expenses after custodian fee reduction(5)(6) | | | 1.25 | % | | | 1.25 | %(8) | |
| Net investment income | | | 3.43 | % | | | 0.87 | %(8) | |
| Portfolio Turnover of the Portfolio | | | 21 | % | | | 1 | % | |
(1) For the period from the start of business, May 31, 2006 to October 31, 2006.
(2) Net investment income and redemption fees per share were computed using average shares outstanding.
(3) Amount represents less than $0.0005 per share.
(4) Returns are historical and are calculated by determining the percentage change in net asset value with all distributions reinvested.
(5) Includes the Fund's share of the Portfolio's allocated expenses.
(6) The investment adviser waived all or a portion of its investment advisory fee and the investment adviser and administrator subsidized certain operating expenses (equal to 1.17% and 19.97% of average daily net assets for the year ended October 31, 2007 and the period ended October 31, 2006, respectively). A portion of the waiver and subsidy was borne by the sub-adviser of the Portfolio. Absent the waivers and allocation, total return would be lower.
(7) Net investment income per share reflects a dividend resulting from a corporate action allocated from the Portfolio which amounted to $0.241 per share. Excluding this dividend, the ratio of net investment income to average daily net assets would have been 1.44%.
(8) Annualized.
(9) Not annualized.
See notes to financial statements
9
Eaton Vance International Equity Fund as of October 31, 2007
NOTES TO FINANCIAL STATEMENTS
1 Significant Accounting Policies
Eaton Vance International Equity Fund (the Fund) is a diversified series of Eaton Vance Mutual Funds Trust (the Trust). The Trust is a Massachusetts business trust registered under the Investment Company Act of 1940, as amended (the 1940 Act), as an open-end management investment company. The Fund offers three classes of shares. Class A shares are generally sold subject to a sales charge imposed at time of purchase. Class C shares are sold at net asset value and are subject to a contingent deferred sales charge (see Note 6). Class I shares are sold at net asset value. Each class represents a pro-rata interest in the Fund, but votes separately on class-specific matters and (as noted below) is subject to different expenses. Realized and unrealized gains and losses and net investment income and losses, other than class-specific expenses, are allocated daily to each class of shares based on the relative net assets of each class to t he total net assets of the Fund. Each class of shares differs in its distribution plan and certain other class-specific expenses. The Fund invests all of its investable assets in interests in the International Equity Portfolio (the Portfolio), a New York trust, having the same investment objective and policies as the Fund. The value of the Fund's investment in the Portfolio reflects the Fund's proportionate interest in the net assets of the Portfolio (53.2% at October 31, 2007). The performance of the Fund is directly affected by the performance of the Portfolio. The financial statements of the Portfolio, including the portfolio of investments, are included elsewhere in this report and should be read in conjunction with the Fund's financial statements.
The following is a summary of significant accounting policies of the Fund. The policies are in conformity with accounting principles generally accepted in the United States of America.
A Investment Valuation — Valuation of securities by the Portfolio is discussed in Note 1A of the Portfolio's Notes to Financial Statements, which are included elsewhere in this report.
B Income — The Fund's net investment income or loss consists of the Fund's pro-rata share of the net investment income or loss of the Portfolio, less all actual and accrued expenses of the Fund.
C Federal Taxes — The Fund's policy is to comply with the provisions of the Internal Revenue Code applicable to regulated investment companies and to distribute to shareholders each year substantially all of its net investment income, and all or substantially all of its net realized capital gains. Accordingly, no provision for federal income or excise tax is necessary. At October 31, 2007, the Fund, for federal income tax purposes, had a capital loss carryforward of $72,803 which will reduce the taxable income arising from future net realized gains on investment transactions, if any, to the extent permitted by the Internal Revenue Code, and thus will reduce the amount of distributions to shareholders which would otherwise be necessary to relieve the Fund of any liability for federal income or excise tax. Such capital loss carryforward will expire on October 31, 2014 ($7,211) and October 31, 2015 ($65,592).
D Expenses — The majority of expenses of the Trust are directly identifiable to an individual fund. Expenses which are not readily identifiable to a specific fund are allocated taking into consideration, among other things, the nature and type of expense and the relative size of the funds.
E Expense Reduction — State Street Bank and Trust Company (SSBT) serves as custodian of the Fund. Pursuant to the custodian agreement, SSBT receives a fee reduced by credits, which are determined based on the average daily cash balance the Fund maintains with SSBT. All credit balances, if any, used to reduce the Fund's custodian fees are reported as a reduction of expenses in the Statement of Operations.
F Use of Estimates — The preparation of the financial statements in conformity with accounting principles generally accepted in the United States of America requires management to make estimates and assumptions that affect the reported amounts of assets and liabilities at the date of the financial statements and the reported amounts of income and expense during the reporting period. Actual results could differ from those estimates.
G Indemnifications — Under the Trust's organizational documents, its officers and Trustees may be indemnified against certain liabilities and expenses arising out of the performance of their duties to the Fund, and shareholders are indemnified against personal liability for obligations of the Trust. Additionally, in the normal course of business, the Fund enters into agreements with service providers that may contain indemnification clauses. The Fund's maximum exposure under these arrangements is unknown as this would involve future claims that may be made against the Fund that have not yet occurred.
H Redemption Fees — Upon the redemption or exchange of shares by Class A and Class I shareholders within 90 days of the settlement of purchase, a fee of 1% of the current net asset value of these shares will be assessed and retained by the Fund for the benefit of the remaining shareholders. The redemption fee is accounted for as an addition to paid-in capital.
10
Eaton Vance International Equity Fund as of October 31, 2007
NOTES TO FINANCIAL STATEMENTS CONT'D
I Other — Investment transactions are accounted for on a trade date basis. Dividends to shareholders are recorded on the ex-dividend date.
2 Distributions to Shareholders
It is the present policy of the Fund to make at least one distribution annually (normally in December) of all or substantially all of its net investment income and to distribute annually all or substantially all of its net realized capital gains (reduced by available capital loss carryforwards from prior years, if any). Distributions are declared separately for each class of shares. Shareholders may reinvest distributions in shares of the same class of the Fund at the net asset value as of the ex-dividend date or, at the election of the shareholder, receive distributions in cash. The Fund distinguishes between distributions on a tax basis and a financial reporting basis. Accounting principles generally accepted in the United States of America require that only distributions in excess of tax basis earnings and profits be reported in the financial statements as a return of capital. Permanent differences between book and tax accoun ting relating to distributions are reclassified to paid-in capital.
The tax character of distributions declared for the year ended October 31, 2007 and period ended October 31, 2006 was as follows:
| | | Year Ended
October 31, 2007 | | Period Ended
October 31, 2006 | |
| Distributions declared from: | |
| Ordinary income | | $ | 19,259 | | | $ | — | | |
During the year ended October 31, 2007, accumulated net investment income was decreased by $6,779 and accumulated net realized loss was decreased by $6,779 due to differences between book and tax accounting primarily for foreign currency gains/losses. These reclassifications had no effect on the net assets or net asset value per share of the Fund.
At October 31, 2007, the components of distributable earnings (accumulated losses) and unrealized appreciation (depreciation) on a tax basis were as follows:
| Undistributed income | | $ | 279,594 | | |
| Capital loss carryforward | | $ | (72,803 | ) | |
| Unrealized appreciation | | $ | 2,852,468 | | |
The differences between components of distributable earnings (accumulated losses) on a tax basis and the amounts reflected in the Statement of Assets and Liabilities are primarily due to wash sales and differences between book and tax accounting for partnership allocations.
3 Shares of Beneficial Interest
The Fund's Declaration of Trust permits the Trustees to issue an unlimited number of full and fractional shares of beneficial interest (without par value). Such shares may be issued in a number of different series (such as the Fund) and classes. Transactions in Fund shares were as follows:
| Class A | | Year Ended
October 31, 2007 | | Period Ended
October 31, 2006(1) | |
| Sales | | | 260,692 | | | | 40,814 | | |
Issued to shareholders electing to
receive payments of distributions
in Fund shares | | | 154 | | | | — | | |
| Redemptions | | | (10,867 | ) | | | (424 | ) | |
| Net increase | | | 249,979 | | | | 40,390 | | |
| Class C | | Year Ended
October 31, 2007 | | Period Ended
October 31, 2006(1) | |
| Sales | | | 91,800 | | | | 16,019 | | |
Issued to shareholders electing to
receive payments of distributions
in Fund shares | | | 56 | | | | — | | |
| Redemptions | | | (22,528 | ) | | | — | | |
| Net increase | | | 69,328 | | | | 16,019 | | |
| Class I | | Year Ended
October 31, 2007 | | Period Ended
October 31, 2006(1) | |
| Sales | | | 453,017 | | | | 256,020 | | |
Issued to shareholders electing to
receive payments of distributions
in Fund shares | | | 1,186 | | | | — | | |
| Redemptions | | | (22,537 | ) | | | (299 | ) | |
| Net increase | | | 431,666 | | | | 255,721 | | |
(1) For the period from the start of business, May 31, 2006 to October 31, 2006.
For the year ended October 31, 2007 and the period from May 31, 2006 (the start of business) through October 31, 2006, the Fund received $487 and $44, respectively, in redemption fees.
4 Transactions with Affiliates
Eaton Vance Management (EVM) serves as the administrator of the Fund, but receives no compensation. The Portfolio has engaged Boston Management and Research (BMR), a subsidiary of EVM, to render investment advisory services. See Note 2 of the Portfolio's Notes to Financial Statements which are included elsewhere in this report. EVM and the sub-adviser of the Portfolio, Eagle Global Advisors, L.L.C. (Eagle), have agreed
11
Eaton Vance International Equity Fund as of October 31, 2007
NOTES TO FINANCIAL STATEMENTS CONT'D
to limit the total fund operating expenses of Class A, Class C and Class I to an annual rate of 1.50%, 2.25% and 1.25%, respectively, of the average daily net assets of the respective class. This expense limitation will continue through February 28, 2008 and may be changed or terminated at any time thereafter. Pursuant to this agreement, EVM and Eagle were allocated $27,025 and $27,025, respectively, of the Fund's operating expenses for the year ended October 31, 2007. EVM serves as the sub-transfer agent of the Fund and receives from the transfer agent an aggregate fee based upon the actual expenses incurred by EVM in the performance of these services. For the year ended October 31, 2007, EVM earned $363 in sub-transfer agent fees. The Fund was informed that Eaton Vance Distributors, Inc. (EVD), a subsidiary of EVM and the Fund's principal underwriter, received $13,617 as its portion of the sales charge on sales of Class A shar es for the year ended October 31, 2007. EVD also received distribution and service fees from Class A and Class C shares (see Note 5) and contingent deferred sales charges (see Note 6).
Except for Trustees of the Fund and the Portfolio who are not members of EVM's or BMR's organizations, officers and Trustees receive remuneration for their services to the Fund out of the investment adviser fees earned by BMR. Certain officers and Trustees of the Fund and the Portfolio are officers of the above organizations.
5 Distribution Plans
The Fund has in effect a distribution plan for Class A shares (Class A Plan) pursuant to Rule 12b-1 under the 1940 Act. The Class A Plan provides that the Fund will pay EVD a distribution and service fee of 0.25% per annum of its average daily net assets attributable to Class A shares for distribution services and facilities provided to the Fund by EVD, as well as for personal services and/or the maintenance of shareholder accounts. Distribution and service fees paid or accrued to EVD for the year ended October 31, 2007 for Class A shares amounted to $4,531. The Fund also has in effect a distribution plan for Class C shares (Class C Plan) pursuant to Rule 12b-1 under the 1940 Act. The Class C Plan requires the Fund to pay EVD amounts equal to 0.75% per annum of its average daily net assets attributable to Class C shares for providing ongoing distribution services and facilities to the Fund. The Fund will automatically discontinu e payments to EVD during any period in which there are no outstanding Uncovered Distribution Charges, which are equivalent to the sum of (i) 6.25% of the aggregate amount received by the Fund for Class C shares sold, plus (ii) interest calculated by applying the rate of 1% over the prevailing prime rate to the outstanding balance of Uncovered Distribution Charges of EVD, reduced by the aggregate amount of contingent deferred sales charges (see Note 6) and daily amounts theretofore paid or payable to EVD by Class C. For the year ended October 31, 2007, the Fund paid or accrued to EVD $4,745 for Class C shares, representing 0.75% of the average daily net assets of Class C shares. At October 31, 2007, the amount of Uncovered Distribution Charges of EVD calculated under the Plan was approximately $35,000 for Class C shares. The Class C Plan also authorizes the Fund to make payments of service fees to EVD, investment dealers, and other person s in amounts not exceeding 0.25% per annum of its average daily net assets attributable to Class C shares. Service fees paid or accrued are for personal services and/or the maintenance of shareholder accounts. They are separate and distinct from the sales commissions and distribution fees payable to EVD and, as such, are not subject to automatic discontinuance when there are no outstanding Uncovered Distribution Charges of EVD. Service fees paid or accrued for the year ended October 31, 2007 amounted to $1,582 for Class C shares.
6 Contingent Deferred Sales Charges
A 1% contingent deferred sales charge (CDSC) generally is imposed on redemptions of Class C shares made within one year of purchase. Class A shares may be subject to a 1% CDSC if redeemed within 18 months of purchase (depending on the circumstances of purchase). Generally, the CDSC is based upon the lower of the net asset value at date of redemption or date of purchase. No charge is levied on shares acquired by reinvestment of dividends or capital gains distributions. No CDSC is levied on shares which have been sold to EVM or its affiliates or to their respective employees or clients and may be waived under certain other limited conditions. CDSCs received on Class C redemptions are paid to EVD to reduce the amount of Uncovered Distribution Charges calculated under the Fund's Class C Plan. CDSCs received on Class C redemptions when no Uncovered Distribution Charges exist are credited to the Fund. For the year ended October 31, 20 07, the Fund was informed that EVD received approximately $0 and $90 of CDSCs paid by Class A and Class C shareholders, respectively.
7 Investment Transactions
Increases and decreases in the Fund's investment in the Portfolio aggregated $9,498,848 and $692,050, respectively, for the year ended October 31, 2007.
8 Recently Issued Accounting Pronouncements
In June 2006, the Financial Accounting Standards Board (FASB) issued FASB Interpretation No. 48 (FIN 48), "Accounting for Uncertainty in Income Taxes – an interpretation of FASB Statement No. 109". FIN 48 clarifies
12
Eaton Vance International Equity Fund as of October 31, 2007
NOTES TO FINANCIAL STATEMENTS CONT'D
the accounting for uncertainty in income taxes recognized in accordance with FASB Statement No. 109, "Accounting for Income Taxes". This interpretation prescribes a recognition threshold and measurement attribute for the financial statement recognition and measurement of a tax position taken or expected to be taken in a tax return. It also provides guidance on de-recognition, classification, interest and penalties, accounting in interim periods, disclosure and transition. FIN 48 is effective on the last business day of the first required financial reporting period for fiscal years beginning after December 15, 2006. Management is currently evaluating the impact of applying the various provisions of FIN 48.
In September 2006, the FASB issued Statement of Financial Accounting Standards No. 157 (FAS 157), "Fair Value Measurements". FAS 157 defines fair value, establishes a framework for measuring fair value in accordance with generally accepted accounting principles and expands disclosure about fair value measurements. FAS 157 is effective for fiscal years beginning after November 15, 2007. Management is currently evaluating the impact the adoption of FAS 157 will have on the Fund's financial statement disclosures.
13
Eaton Vance International Equity Fund as of October 31, 2007
REPORT OF INDEPENDENT REGISTERED PUBLIC ACCOUNTING FIRM
To the Trustees of Eaton Vance Mutual Funds Trust and the Shareholders
of Eaton Vance International Equity Fund:
We have audited the accompanying statement of assets and liabilities of Eaton Vance International Equity Fund (the "Fund") (one of the series of Eaton Vance Mutual Funds Trust), as of October 31, 2007, and the related statement of operations for the year then ended, the statements of changes in net assets, and the financial highlights for the year then ended and for the period from the start of business, May 31, 2006, to October 31, 2006. These financial statements and financial highlights are the responsibility of the Fund's management. Our responsibility is to express an opinion on these financial statements and financial highlights based on our audits.
We conducted our audits in accordance with the standards of the Public Company Accounting Oversight Board (United States). Those standards require that we plan and perform the audit to obtain reasonable assurance about whether the financial statements and financial highlights are free of material misstatement. The Fund is not required to have, nor were we engaged to perform, an audit of its internal control over financial reporting. Our audits included consideration of internal control over financial reporting as a basis for designing audit procedures that are appropriate in the circumstances, but not for the purpose of expressing an opinion on the effectiveness of the Fund's internal control over financial reporting. Accordingly, we express no such opinion. An audit also includes examining, on a test basis, evidence supporting the amou nts and disclosures in the financial statements, assessing the accounting principles used and significant estimates made by management, as well as evaluating the overall financial statement presentation. We believe that our audits provide a reasonable basis for our opinion.
In our opinion, the financial statements and financial highlights referred to above present fairly, in all material respects, the financial position of Eaton Vance International Equity Fund as of October 31, 2007, the results of its operations for the year then ended, the changes in its net assets, and the financial highlights for the year then ended and for the period from the start of business, May 31, 2006, to October 31, 2006, in conformity with accounting principles generally accepted in the United States of America.
DELOITTE & TOUCHE LLP
Boston, Massachusetts
December 17, 2007
14
Eaton Vance International Equity Fund as of October 31, 2007
FEDERAL TAX INFORMATION (Unaudited)
The Form 1099-DIV you receive in January 2008 will show the tax status of all distributions paid to your account in calendar 2007. Shareholders are advised to consult their own tax adviser with respect to the tax consequences of their investment in the Fund. As required by the Internal Revenue Code regulations, shareholders must be notified within 60 days of the Fund's fiscal year-end regarding the status of the qualified dividend income for individuals and the foreign tax credit.
Qualified Dividend Income. The Fund designates approximately $425,470, or up to the maximum amount of such dividends allowable pursuant to the Internal Revenue Code, as qualified dividend income eligible for the reduced tax rate of 15%.
Foreign Tax Credit. The Fund designates a foreign tax credit of $19,353 and recognizes foreign source income of $421,518.
15
International Equity Portfolio as of October 31, 2007
PORTFOLIO OF INVESTMENTS
| Common Stocks — 97.4% | |
| Security | | Shares | | Value | |
| Airlines — 0.4% | |
| Air France-KLM | | | 3,200 | | | $ | 121,958 | | |
| | | $ | 121,958 | | |
| Auto Components — 0.3% | |
| Aisin Seiki Co., Ltd. | | | 2,200 | | | $ | 90,461 | | |
| | | $ | 90,461 | | |
| Automobiles — 1.8% | |
| Honda Motor Co., Ltd. ADR | | | 7,800 | | | $ | 291,954 | | |
| Toyota Motor Corp. ADR | | | 1,800 | | | | 205,992 | | |
| | | $ | 497,946 | | |
| Beverages — 3.4% | |
| Diageo PLC ADR | | | 2,500 | | | $ | 229,375 | | |
| Fomento Economico Mexicano SA de C.V. ADR | | | 9,100 | | | | 324,051 | | |
| Heineken Holding NV | | | 3,000 | | | | 177,748 | | |
| InBev NV | | | 2,400 | | | | 226,871 | | |
| | | $ | 958,045 | | |
| Capital Markets — 2.0% | |
| Invesco PLC ADR | | | 9,000 | | | $ | 275,940 | | |
| UBS AG | | | 5,700 | | | | 306,033 | | |
| | | $ | 581,973 | | |
| Chemicals — 2.4% | |
| Agrium, Inc. | | | 5,200 | | | $ | 330,564 | | |
| BASF AG ADR | | | 1,200 | | | | 165,840 | | |
| Makhteshim-Agan Industries, Ltd.(1) | | | 18,000 | | | | 172,893 | | |
| | | $ | 669,297 | | |
| Commercial Banks — 11.6% | |
| Anglo Irish Bank Corp. PLC | | | 9,000 | | | $ | 151,738 | | |
| Australia and New Zealand Banking Group, Ltd. ADR | | | 1,800 | | | | 244,980 | | |
| Banco Bilbao Vizcaya Argentaria SA ADR | | | 8,000 | | | | 201,920 | | |
| Banco Santander SA ADR | | | 23,000 | | | | 499,330 | | |
| Barclays PLC ADR | | | 5,500 | | | | 279,675 | | |
| BNP Paribas SA | | | 1,200 | | | | 132,833 | | |
| Commerzbank AG ADR | | | 9,000 | | | | 368,820 | | |
| Security | | Shares | | Value | |
| Commercial Banks (continued) | |
| Danske Bank A/S | | | 2,700 | | | $ | 119,355 | | |
| DBS Group Holdings, Ltd. ADR | | | 6,400 | | | | 392,320 | | |
| Erste Bank der oesterreichischen Sparkassen AG | | | 3,500 | | | | 284,590 | | |
| Grupo Financiero Banorte SA de C.V. | | | 26,000 | | | | 121,702 | | |
| Intesa Sanpaolo | | | 21,000 | | | | 166,387 | | |
| Societe Generale | | | 900 | | | | 151,858 | | |
| Woori Finance Holdings Co., Ltd. ADR | | | 2,500 | | | | 164,875 | | |
| | | $ | 3,280,383 | | |
| Communications Equipment — 1.3% | |
| Nokia Oyj ADR | | | 9,000 | | | $ | 357,480 | | |
| | | $ | 357,480 | | |
| Computer Peripherals — 1.1% | |
| Lenovo Group, Ltd. | | | 280,000 | | | $ | 318,862 | | |
| | | $ | 318,862 | | |
| Construction & Engineering — 0.8% | |
| Vinci SA | | | 2,600 | | | $ | 214,281 | | |
| | | $ | 214,281 | | |
| Construction Materials — 0.9% | |
| Lafarge Malayan Cement Berhad | | | 440,000 | | | $ | 242,029 | | |
| | | $ | 242,029 | | |
| Consumer Finance — 1.0% | |
| Orix Corp. ADR | | | 2,700 | | | $ | 278,775 | | |
| | | $ | 278,775 | | |
| Diversified Financial Services — 1.6% | |
| Fortis | | | 2,200 | | | $ | 70,597 | | |
| ING Groep NV ADR | | | 8,500 | | | | 382,415 | | |
| | | $ | 453,012 | | |
| Diversified Telecommunication Services — 6.5% | |
| BT Group PLC ADR | | | 6,750 | | | $ | 459,607 | | |
| France Telecom SA ADR | | | 10,300 | | | | 381,100 | | |
| Koninklijke KPN NV | | | 27,400 | | | | 516,704 | | |
| Telefonica SA | | | 9,300 | | | | 307,553 | | |
| TeliaSonera AB | | | 17,000 | | | | 167,480 | | |
| | | $ | 1,832,444 | | |
See notes to financial statements
16
International Equity Portfolio as of October 31, 2007
PORTFOLIO OF INVESTMENTS CONT'D
| Security | | Shares | | Value | |
| Electric Utilities — 4.1% | |
| E.ON AG ADR | | | 8,000 | | | $ | 520,800 | | |
| Enel SPA ADR | | | 6,200 | | | | 372,620 | | |
| Scottish and Southern Energy PLC | | | 8,000 | | | | 259,179 | | |
| | | $ | 1,152,599 | | |
| Electrical Equipment — 1.1% | |
| ABB, Ltd. ADR | | | 10,500 | | | $ | 317,310 | | |
| | | $ | 317,310 | | |
| Electronic Equipment & Instruments — 0.9% | |
| Ibiden Co., Ltd. | | | 3,100 | | | $ | 262,954 | | |
| | | $ | 262,954 | | |
| Energy Equipment & Services — 2.0% | |
| Acergy SA ADR | | | 19,500 | | | $ | 564,330 | | |
| | | $ | 564,330 | | |
| Food & Staples Retailing — 0.5% | |
| Controladora Comercial Mexicana SA de C.V., unit | | | 45,000 | | | $ | 139,963 | | |
| | | $ | 139,963 | | |
| Food Products — 2.7% | |
| Nestle SA ADR | | | 6,600 | | | $ | 753,390 | | |
| | | $ | 753,390 | | |
| Industrial Conglomerates — 2.6% | |
| Keppel Corp., Ltd. ADR | | | 37,000 | | | $ | 750,360 | | |
| | | $ | 750,360 | | |
| Insurance — 2.9% | |
| Aviva PLC | | | 9,000 | | | $ | 141,666 | | |
| AXA SA ADR | | | 11,000 | | | | 492,030 | | |
| Muenchener Rueckversicherungs-Gesellschaft AG | | | 1,000 | | | | 191,723 | | |
| | | $ | 825,419 | | |
| Machinery — 3.9% | |
| Atlas Copco AB, Class B | | | 20,000 | | | $ | 312,996 | | |
| Komatsu, Ltd. ADR | | | 3,700 | | | | 510,230 | | |
| SKF AB ADR | | | 5,000 | | | | 99,500 | | |
| Vallourec SA | | | 600 | | | | 174,504 | | |
| | | $ | 1,097,230 | | |
| Security | | Shares | | Value | |
| Marine — 0.6% | |
| Cosco Corp. Singapore, Ltd. | | | 30,000 | | | $ | 162,705 | | |
| | | $ | 162,705 | | |
| Metals & Mining — 11.7% | |
| Anglo American PLC ADR | | | 9,463 | | | $ | 330,732 | | |
| BHP Billiton, Ltd. | | | 8,200 | | | | 355,284 | | |
| Companhia Vale do Rio Doce ADR | | | 18,000 | | | | 568,260 | | |
| JSC MMC Norilsk Nickel ADR | | | 1,300 | | | | 385,450 | | |
| Norsk Hydro ASA ADR | | | 18,400 | | | | 270,480 | | |
| Rio Tinto PLC ADR | | | 2,200 | | | | 825,000 | | |
| Silver Wheaton Corp.(1) | | | 17,900 | | | | 301,973 | | |
| Teck Cominco, Ltd., Class B | | | 5,500 | | | | 275,000 | | |
| | | $ | 3,312,179 | | |
| Multi-Utilities — 2.1% | |
| RWE AG ADR | | | 4,300 | | | $ | 596,625 | | |
| | | $ | 596,625 | | |
| Office Electronics — 1.4% | |
| Canon, Inc. ADR | | | 8,000 | | | $ | 404,560 | | |
| | | $ | 404,560 | | |
| Oil, Gas & Consumable Fuels — 8.0% | |
| ENI SPA ADR | | | 1,700 | | | $ | 124,236 | | |
| Nexen, Inc. | | | 8,400 | | | | 284,004 | | |
| Petroleo Brasileiro SA ADR | | | 7,600 | | | | 632,244 | | |
| Sibir Energy PLC | | | 12,000 | | | | 135,766 | | |
| StatoilHydro ASA ADR | | | 12,191 | | | | 415,469 | | |
| Total SA ADR | | | 8,400 | | | | 677,124 | | |
| | | $ | 2,268,843 | | |
| Pharmaceuticals — 1.9% | |
| Novartis AG ADR | | | 2,800 | | | $ | 148,876 | | |
| Roche Holding AG ADR | | | 4,700 | | | | 397,855 | | |
| | | $ | 546,731 | | |
| Real Estate Management & Development — 0.8% | |
| Sun Hung Kai Properties, Ltd. ADR | | | 11,000 | | | $ | 215,050 | | |
| | | $ | 215,050 | | |
| Software — 5.4% | |
| Nintendo Co., Ltd. | | | 2,000 | | | $ | 1,271,039 | | |
| UbiSoft Entertainment SA(1) | | | 3,200 | | | | 263,492 | | |
| | | $ | 1,534,531 | | |
See notes to financial statements
17
International Equity Portfolio as of October 31, 2007
PORTFOLIO OF INVESTMENTS CONT'D
| Security | | Shares | | Value | |
| Textiles, Apparel & Luxury Goods — 0.5% | |
| Stella International Holdings, Ltd. | | | 62,000 | | | $ | 135,986 | | |
| | | $ | 135,986 | | |
| Tobacco — 0.8% | |
| British American Tobacco PLC ADR | | | 3,000 | | | $ | 230,040 | | |
| | | $ | 230,040 | | |
| Trading Companies & Distributors — 2.1% | |
| Mitsubishi Corp. ADR | | | 9,000 | | | $ | 583,200 | | |
| | | $ | 583,200 | | |
| Wireless Telecommunication Services — 6.3% | |
| Bouygues SA | | | 2,200 | | | $ | 212,060 | | |
| China Mobile, Ltd. ADR | | | 4,000 | | | | 414,720 | | |
| Philippine Long Distance Telephone Co. ADR | | | 4,100 | | | | 281,260 | | |
| Turkcell Iletisim Hizmetleri AS ADR | | | 25,400 | | | | 610,616 | | |
| Vodafone Group PLC ADR | | | 7,000 | | | | 274,890 | | |
| | | $ | 1,793,546 | | |
Total Common Stocks
(identified cost $21,731,837) | | $ | 27,544,497 | | |
| Closed-End Funds — 0.9% | |
| Security | | Shares | | Value | |
| Central Europe and Russia Fund, Inc. | | | 3,800 | | | $ | 243,960 | | |
Total Closed-End Funds
(identified cost $195,745) | | $ | 243,960 | | |
| Short-Term Investments — 1.1% | |
| Description | | Interest
(000's omitted) | | Value | |
| Investment in Cash Management Portfolio, 4.83%(2) | | $ | 315 | | | $ | 314,686 | | |
Total Short-Term Investments
(identified cost $314,686) | | $ | 314,686 | | |
Total Investments — 99.4%
(identified cost $22,242,268) | | $ | 28,103,143 | | |
| Other Assets, Less Liabilities — 0.6% | | $ | 168,802 | | |
| Net Assets — 100.0% | | $ | 28,271,945 | | |
ADR - American Depository Receipt
(1) Non-income producing security.
(2) Affiliated investment company available to Eaton Vance portfolios and funds which invests in high quality, U.S. dollar denominated money market instruments. The rate shown is the annualized seven-day yield as of October 31, 2007.
See notes to financial statements
18
International Equity Portfolio as of October 31, 2007
PORTFOLIO OF INVESTMENTS CONT'D
| Country Concentration of Portfolio | |
| Country | | Percentage
of Net Assets | | Value | |
| Japan | | | 13.8 | % | | $ | 3,899,165 | | |
| United Kingdom | | | 12.2 | | | | 3,441,870 | | |
| France | | | 10.0 | | | | 2,821,241 | | |
| Switzerland | | | 6.8 | | | | 1,923,464 | | |
| Germany | | | 6.5 | | | | 1,843,808 | | |
| Singapore | | | 4.6 | | | | 1,305,384 | | |
| Norway | | | 4.4 | | | | 1,250,279 | | |
| Brazil | | | 4.2 | | | | 1,200,504 | | |
| Canada | | | 4.2 | | | | 1,191,541 | | |
| Netherlands | | | 3.8 | | | | 1,076,867 | | |
| Spain | | | 3.6 | | | | 1,008,803 | | |
| China | | | 3.1 | | | | 869,568 | | |
| Italy | | | 2.3 | | | | 663,243 | | |
| Russia | | | 2.2 | | | | 629,410 | | |
| Turkey | | | 2.2 | | | | 610,616 | | |
| Australia | | | 2.1 | | | | 600,264 | | |
| Mexico | | | 2.1 | | | | 585,716 | | |
| Sweden | | | 2.0 | | | | 579,976 | | |
| Finland | | | 1.3 | | | | 357,480 | | |
| United States | | | 1.1 | | | | 314,686 | | |
| Belgium | | | 1.1 | | | | 297,468 | | |
| Austria | | | 1.0 | | | | 284,590 | | |
| Philippines | | | 1.0 | | | | 281,260 | | |
| Malaysia | | | 0.9 | | | | 242,029 | | |
| Hong Kong | | | 0.8 | | | | 215,050 | | |
| Israel | | | 0.6 | | | | 172,893 | | |
| Republic of Korea | | | 0.6 | | | | 164,875 | | |
| Ireland | | | 0.5 | | | | 151,738 | | |
| Denmark | | | 0.4 | | | | 119,355 | | |
| Total Investments | | | 99.4 | % | | $ | 28,103,143 | | |
See notes to financial statements
19
International Equity Portfolio as of October 31, 2007
FINANCIAL STATEMENTS
Statement of Assets and Liabilities
As of October 31, 2007
| Assets | |
| Unaffiliated investments, at value (identified cost, $21,927,582) | | $ | 27,788,457 | | |
| Affiliated investment, at value (identified cost, $314,686) | | | 314,686 | | |
| Receivable for investments sold | | | 207,182 | | |
| Receivable from the investment adviser and the sub-adviser | | | 4,483 | | |
| Dividends receivable | | | 22,649 | | |
| Interest receivable from affiliated investment | | | 2,987 | | |
| Tax reclaims receivable | | | 5,790 | | |
| Total assets | | $ | 28,346,234 | | |
| Liabilities | |
| Payable to affiliate for investment advisory fee | | $ | 22,029 | | |
| Payable to affiliate for Trustees' fees | | | 17 | | |
| Accrued expenses | | | 52,243 | | |
| Total liabilities | | $ | 74,289 | | |
| Net Assets applicable to investors' interest in Portfolio | | $ | 28,271,945 | | |
| Sources of Net Assets | |
| Net proceeds from capital contributions and withdrawals | | $ | 22,410,730 | | |
| Net unrealized appreciation (computed on the basis of identified cost) | | | 5,861,215 | | |
| Total | | $ | 28,271,945 | | |
Statement of Operations
For the Year Ended
October 31, 2007
| Investment Income | |
| Dividends (net of foreign taxes, $41,183) | | $ | 827,282 | | |
| Interest | | | 1,070 | | |
| Interest income allocated from affiliated investment | | | 34,523 | | |
| Expenses allocated from affiliated investment | | | (3,240 | ) | |
| Total investment income | | $ | 859,635 | | |
| Expenses | |
| Investment adviser fee | | $ | 183,247 | | |
| Trustees' fees and expenses | | | 117 | | |
| Custodian fee | | | 39,583 | | |
| Legal and accounting services | | | 39,140 | | |
| Miscellaneous | | | 1,192 | | |
| Total expenses | | $ | 263,279 | | |
Deduct —
Reduction of custodian fee | | $ | 9 | | |
| Reduction of investment adviser fee | | | 95,782 | | |
| Allocation of expenses to the investment adviser and the sub-adviser | | | 4,483 | | |
| Total expense reductions | | $ | 100,274 | | |
| Net expenses | | $ | 163,005 | | |
| Net investment income | | $ | 696,630 | | |
| Realized and Unrealized Gain (Loss) | |
Net realized gain (loss) —
Investment transactions (identified cost basis) | | $ | (117,044 | ) | |
| Foreign currency transactions | | | (14,040 | ) | |
| Net realized loss | | $ | (131,084 | ) | |
Change in unrealized appreciation (depreciation) —
Investments (identified cost basis) | | $ | 5,594,372 | | |
| Foreign currency | | | 340 | | |
| Net change in unrealized appreciation (depreciation) | | $ | 5,594,712 | | |
| Net realized and unrealized gain | | $ | 5,463,628 | | |
| Net increase in net assets from operations | | $ | 6,160,258 | | |
See notes to financial statements
20
International Equity Portfolio as of October 31, 2007
FINANCIAL STATEMENTS CONT'D
Statements of Changes in Net Assets
Increase (Decrease)
in Net Assets | | Year Ended
October 31, 2007 | | Period Ended
October 31, 2006(1) | |
From operations —
Net investment income | | $ | 696,630 | | | $ | 7,544 | | |
Net realized loss from
investment and foreign
currency transactions | | | (131,084 | ) | | | (12,592 | ) | |
Net change in unrealized
appreciation (depreciation) from
investments and foreign currency | | | 5,594,712 | | | | 266,503 | | |
Net increase in net assets
from operations | | $ | 6,160,258 | | | $ | 261,455 | | |
Capital transactions —
Contributions | | $ | 13,297,044 | | | $ | 10,596,807 | | |
| Withdrawals | | | (2,058,858 | ) | | | (84,771 | ) | |
Net increase in net assets from
capital transactions | | $ | 11,238,186 | | | $ | 10,512,036 | | |
| Net increase in net assets | | $ | 17,398,444 | | | $ | 10,773,491 | | |
| Net Assets | |
| At beginning of year | | $ | 10,873,501 | | | $ | 100,010 | | |
| At end of year | | $ | 28,271,945 | | | $ | 10,873,501 | | |
(1) For the period from the commencement of investment operations, May 31, 2006 to October 31, 2006.
See notes to financial statements
21
International Equity Portfolio as of October 31, 2007
FINANCIAL STATEMENTS CONT'D
Supplementary Data
| | | Year Ended
October 31, 2007 | | Period Ended
October 31, 2006(1) | |
| Ratios/Supplemental Data | |
| Ratios (As a percentage of average daily net assets): | |
| Expenses before custodian fee reduction(2) | | | 0.87 | % | | | 1.26 | %(4) | |
| Expenses after custodian fee reduction(2) | | | 0.87 | % | | | 1.25 | %(4) | |
| Net investment income | | | 3.72 | %(3) | | | 0.92 | %(4) | |
| Portfolio Turnover | | | 21 | % | | | 1 | % | |
| Total Return | | | 34.59 | % | | | 6.60 | %(5) | |
| Net assets, end of year (000's omitted) | | $ | 28,272 | | | $ | 10,874 | | |
(1) For the period from the commencement of investment operations, May 31, 2006 to October 31, 2006.
(2) The investment adviser waived all or a portion of its investment advisory fee and/or the investment adviser and sub-adviser subsidized certain operating expenses (equal to 0.55% and 5.21% of average daily net assets for the year ended October 31, 2007 and the period ended October 31, 2006, respectively). A portion of the wavier and subsidy was borne by the sub-adviser.
(3) Includes a dividend resulting from a corporate action equal to 1.93% of average daily net assets.
(4) Annualized.
(5) Not annualized.
See notes to financial statements
22
International Equity Portfolio as of October 31, 2007
NOTES TO FINANCIAL STATEMENTS
1 Significant Accounting Policies
International Equity Portfolio (the Portfolio) is a New York trust registered under the Investment Company Act of 1940, as amended (the 1940 Act), as a diversified, open-end management investment company. The Portfolio seeks to achieve total return by investing in a diversified portfolio of foreign equity securities. The Declaration of Trust permits the Trustees to issue interests in the Portfolio. At October 31, 2007, the Eaton Vance International Equity Fund and Eaton Vance Equity Asset Allocation Fund held an approximate 53.2% and 6.0% interest, respectively, in the Portfolio.
The following is a summary of significant accounting policies of the Portfolio. The policies are in conformity with accounting principles generally accepted in the United States of America.
A Investment Valuation — Securities listed on a U.S. securities exchange generally are valued at the last sale price on the day of valuation or, if no sales took place on such date, at the mean between the closing bid and asked prices therefore on the exchange where such securities are principally traded. Equity securities listed on the NASDAQ Global or Global Select Market generally are valued at the official NASDAQ closing price. Unlisted or listed securities for which closing sales prices or closing quotations are not available are valued at the mean between the latest available bid and asked prices or, in the case of preferred equity securities that are not listed or traded in the over-the-counter market, by an independent pricing service. Exchange-traded options are valued at the last sale price for the day of valuation as quoted on the principal exchange or board of trade on which the options are traded or, in the absence of sales on such date, at the mean between the latest bid and asked prices therefore. Financial futures contracts listed on commodity exchanges are valued at closing settlement prices. Short-term debt securities with a remaining maturity of 60 days or less are valued at amortized cost, which approximates market value. If short-term debt securities are acquired with a remaining maturity of more than 60 days, they will be valued by a pricing service. Other fixed income and debt securities, including listed securities and securities for which price quotations are available, will normally be valued on the basis of valuations furnished by a pricing service. Foreign securities and currencies are valued in U.S. dollars, based on foreign currency exchange rate quotations supplied by an independent quotation service. The daily valuation of exchange-traded fore ign securities generally is determined as of the close of trading on the principal exchange on which such securities trade. Events occurring after the close of trading on foreign exchanges may result in adjustments to the valuation of foreign securities to more accurately reflect their fair value as of the close of regular trading on the New York Stock Exchange. When valuing foreign equity securities that meet certain criteria, the Trustees have approved the use of a fair value service that values such securities to reflect market trading that occurs after the close of the applicable foreign markets of comparable securities or other instruments that have a strong correlation to the fair-valued securities. Investments for which valuations or market quotations are not readily available are valued at fair value using methods determined in good faith by or at the direction of the Trustees of the Portfolio considering relevant factors, data a nd information including the market value of freely tradable securities of the same class in the principal market on which such securities are normally traded.
The Portfolio may invest in Cash Management Portfolio (Cash Management), an affiliated investment company managed by Boston Management and Research (BMR), a subsidiary of Eaton Vance Management (EVM). Cash Management values its investment securities utilizing the amortized cost valuation technique permitted by Rule 2a-7 of the 1940 Act. This technique involves initially valuing a portfolio security at its cost and thereafter assuming a constant amortization to maturity of any discount or premium.
B Investment Transactions — Investment transactions for financial statement purposes are accounted for on a trade date basis. Realized gains and losses on investments sold are determined on the basis of identified cost.
C Income — Dividend income is recorded on the ex-dividend date for dividends received in cash and/or securities. However, if the ex-dividend date has passed, certain dividends from foreign securities are recorded as the Portfolio is informed of the ex-dividend date. Withholding taxes on foreign dividends and capital gains have been provided for in accordance with the Portfolio's understanding of the applicable countries' tax rules and rates. Interest income is recorded on the basis of interest accrued, adjusted for amortization of premium or accretion of discount.
D Federal Taxes — The Portfolio has elected to be treated as a partnership for federal tax purposes. No provision is made by the Portfolio for federal or state taxes on any taxable income of the Portfolio because each investor in the Portfolio is ultimately responsible for the payment of any taxes on its share of taxable income. Since at least one of the Portfolio's investors is a regulated
23
International Equity Portfolio as of October 31, 2007
NOTES TO FINANCIAL STATEMENTS CONT'D
investment company that invests all or substantially all of its assets in the Portfolio, the Portfolio normally must satisfy the applicable source of income and diversification requirements (under the Internal Revenue Code) in order for its investors to satisfy them. The Portfolio will allocate, at least annually among its investors, each investor's distributive share of the Portfolio's net investment income, net realized capital gains and any other items of income, gain, loss, deduction or credit.
E Expense Reduction — State Street Bank and Trust Company (SSBT) serves as custodian of the Portfolio. Pursuant to the custodian agreement, SSBT receives a fee reduced by credits, which are determined based on the average daily cash balance the Portfolio maintains with SSBT. All credit balances, if any, used to reduce the Portfolio's custodian fees are reported as a reduction of expenses in the Statement of Operations.
F Organization Costs — Costs incurred by the Portfolio in connection with its organization have been expensed.
G Foreign Currency Translation — Investment valuations, other assets, and liabilities initially expressed in foreign currencies are translated each business day into U.S. dollars based upon current exchange rates. Purchases and sales of foreign investment securities and income and expenses denominated in foreign currencies are translated into U.S. dollars based upon currency exchange rates in effect on the respective dates of such transactions. Recognized gains or losses on investment transactions attributable to changes in foreign currency exchange rates are recorded for financial statement purposes as net realized gains and losses on investments. That portion of unrealized gains and losses on investments that results from fluctuations in foreign currency exchange rates is not separately disclosed.
H Use of Estimates — The preparation of the financial statements in conformity with accounting principles generally accepted in the United States of America requires management to make estimates and assumptions that affect the reported amounts of assets and liabilities at the date of the financial statements and the reported amounts of income and expense during the reporting period. Actual results could differ from those estimates.
I Indemnifications — Under the Portfolio's organizational documents, its officers and Trustees may be indemnified against certain liabilities and expenses arising out of the performance of their duties to the Portfolio.
Interestholders in the Portfolio are jointly and severally liable for the liabilities and obligations of the Portfolio in the event that the Portfolio fails to satisfy such liabilities and obligations; provided, however, that, to the extent assets are available in the Portfolio, the Portfolio may, under certain circumstances, indemnify interestholders from and against any claim or liability to which such holder may become subject by reason of being or having been an interestholder in the Portfolio. Additionally, in the normal course of business, the Portfolio enters into agreements with service providers that may contain indemnification clauses. The Portfolio's maximum exposure under these arrangements is unknown as this would involve future claims that may be made against the Portfolio that have not yet occurred.
J Financial Futures Contracts — The Portfolio may enter into financial futures contracts. The Portfolio's investment in financial futures contracts is designed for hedging against changes in interest rates or as a substitute for the purchase of securities. Upon entering into a financial futures contract, the Portfolio is required to deposit with the broker, either in cash or securities an amount equal to a certain percentage of the purchase price (initial margin). Subsequent payments, known as variation margin, are made or received by the Portfolio each business day, depending on the daily fluctuations in the value of the underlying security, and are recorded as unrealized gains or losses by the Portfolio. Gains (losses) are realized upon the expiration or closing of the financial futures contracts. Should market conditions change unexpectedly, the Portfolio may not achieve the anticipated benefits of the financial futures contracts and may realize a loss. In entering such contracts, the Portfolio bears the risk if the counterparties do not perform under the contracts' terms.
K Purchased Options — Upon the purchase of a call or put option, the premium paid by the Portfolio is included in the Statement of Assets and Liabilities as an investment. The amount of the investment is subsequently marked-to-market to reflect the current market value of the option purchased, in accordance with the Portfolio's policies on investment valuations discussed above. If an option which the Portfolio has purchased expires on the stipulated expiration date, the Portfolio will realize a loss in the amount of the cost of the option. If the Portfolio enters into a closing sale transaction, the Portfolio will realize a gain or loss, depending on whether the sales proceeds from the closing sale transaction are greater or less than the cost of the option. If the Portfo lio exercises a put option, it will realize a gain or loss from the sale of the underlying security, and the proceeds from such sale will be decreased by the premium originally paid. If the Portfolio exercises a call option, the cost
24
International Equity Portfolio as of October 31, 2007
NOTES TO FINANCIAL STATEMENTS CONT'D
of the security which the Portfolio purchases upon exercise will be increased by the premium originally paid.
L Forward Foreign Currency Exchange Contracts — The Portfolio may enter into forward foreign currency exchange contracts for the purchase or sale of a specific foreign currency at a fixed price on a future date. The Portfolio may enter into forward contracts for hedging purposes as well as non-hedging purposes. The forward foreign currency exchange contracts are adjusted by the daily exchange rate of the underlying currency and any gains or losses are recorded as unrealized until such time as the contracts have been closed or offset. Risks may arise upon entering these contracts from the potential inability of counterparties to meet the terms of their contracts and from movements in the value of a foreign currency relative to the U.S. dollar.
2 Investment Adviser Fee and Other Transactions with Affiliates
The investment adviser fee is earned by BMR, as compensation for management and investment advisory services rendered to the Portfolio. Pursuant to the advisory agreement, BMR receives a monthly advisory fee at the annual rate of 1.00% of the average daily net assets of the Portfolio up to $500 million and at reduced rates as daily net assets exceed that level. The portion of the advisory fee payable by Cash Management on the Portfolio's investment of cash therein is credited against the Portfolio's advisory fee. For the year ended October 31, 2007, the Portfolio's advisory fee totaled $186,373 of which $3,126 was allocated from Cash Management and $183,247 was paid or accrued directly by the Portfolio. Pursuant to a sub-advisory agreement, BMR has delegated the investment management of the Portfolio to Eagle Global Advisors, L.L.C. (Eagle). BMR pays Eagle a monthly sub-advisory fee equal to 0.50% annually of the average daily n et assets of the Portfolio up to $500 million, and at reduced rates as daily net assets exceed that level. For the year ended October 31, 2007, BMR waived $95,782 of its investment advisory fee, and Eagle, in turn, waived $47,891 of its sub-advisory fee. In addition, pursuant to a voluntary expense reimbursement, BMR and Eagle were allocated $2,242 and $2,241, respectively, of the Portfolio's operating expenses for the year ended October 31, 2007.
Except for Trustees of the Portfolio who are not members of EVM's or BMR's organizations, officers and Trustees receive remuneration for their services to the Portfolio out of the investment adviser and sub-adviser fees. Trustees of the Portfolio who are not affiliated with BMR may elect to defer receipt of all or a percentage of their annual fees in accordance with the terms of the Trustees Deferred Compensation Plan. For the year ended October 31, 2007, no significant amounts have been deferred. Certain officers and Trustees of the Portfolio are officers of the above organizations.
3 Purchase and Sales of Investments
Purchases and sales of investments, other than short-term obligations, aggregated $15,709,801 and $3,924,694, respectively, for the year ended October 31, 2007.
4 Federal Income Tax Basis of Investments
The cost and unrealized appreciation (depreciation) of investments of the Portfolio at October 31, 2007, as determined on a federal income tax basis, were as follows:
| Aggregate cost | | $ | 22,248,845 | | |
| Gross unrealized appreciation | | $ | 6,325,158 | | |
| Gross unrealized depreciation | | | (470,860 | ) | |
| Net unrealized appreciation | | $ | 5,854,298 | | |
The net unrealized appreciation on foreign currency at October 31, 2007 on a federal income tax basis was $340.
5 Financial Instruments
The Portfolio may trade in financial instruments with off-balance sheet risk in the normal course of its investing activities to assist in managing exposure to various market risks. These financial instruments may include written options, forward foreign currency exchange contracts and financial futures contracts and may involve, to a varying degree, elements of risk in excess of the amounts recognized for financial statement purposes. The notional or contractual amounts of these instruments represent the investment the Portfolio has in particular classes of financial instruments and does not necessarily represent the amounts potentially subject to risk. The measurement of the risks associated with these instruments is meaningful only when all related and offsetting transactions are considered. The Portfolio did not have any open financial instruments at October 31, 2007.
6 Line of Credit
The Portfolio participates with other portfolios and funds managed by EVM and its affiliates in a $200 million unsecured line of credit agreement with a group of banks. Borrowings are made by the Portfolio solely to facilitate the
25
International Equity Portfolio as of October 31, 2007
NOTES TO FINANCIAL STATEMENTS CONT'D
handling of unusual and/or unanticipated short-term cash requirements. Interest is charged to the Portfolio based on its borrowings at an amount above either the Eurodollar rate or Federal Funds rate. In addition, a fee computed at an annual rate of 0.07% on the daily unused portion of the line of credit is allocated among the participating portfolios and funds at the end of each quarter. The Portfolio did not have any significant borrowings or allocated fees during the year ended October 31, 2007.
7 Risks Associated with Foreign Investments
Investing in securities issued by companies whose principal business activities are outside the United States may involve significant risks not present in domestic investments. For example, there is generally less publicly available information about foreign companies, particularly those not subject to the disclosure and reporting requirements of the U.S. securities laws. Foreign issuers are generally not bound by uniform accounting, auditing, and financial reporting requirements and standards of practice comparable to those applicable to domestic issuers. Investments in foreign securities also involve the risk of possible adverse changes in investment or exchange control regulations, expropriation or confiscatory taxation, limitation on the removal of funds or other assets of the Portfolio, political or financial instability or diplomatic and other developments which could affect such investments. Foreign stock markets, while g rowing in volume and sophistication, are generally not as developed as those in the United States, and securities of some foreign issuers (particularly those located in developing countries) may be less liquid and more volatile than securities of comparable U.S. companies. In general, there is less overall governmental supervision and regulation of foreign securities markets, broker-dealers and issuers than in the United States.
8 Recently Issued Accounting Pronouncements
In June 2006, the Financial Accounting Standards Board (FASB) issued FASB Interpretation No. 48 (FIN 48), "Accounting for Uncertainty in Income Taxes – an interpretation of FASB Statement No. 109". FIN 48 clarifies the accounting for uncertainty in income taxes recognized in accordance with FASB Statement No. 109, "Accounting for Income Taxes". This interpretation prescribes a recognition threshold and measurement attribute for the financial statement recognition and measurement of a tax position taken or expected to be taken in a tax return. It also provides guidance on de-recognition, classification, interest and penalties, accounting in interim periods, disclosure and transition. FIN 48 is effective on the last business day of the first required financial reporting period for fiscal years beginning after December 15, 2006. Management is currently eva luating the impact of applying the various provisions of FIN 48.
In September 2006, the FASB issued Statement of Financial Accounting Standards No. 157 (FAS 157), "Fair Value Measurements". FAS 157 defines fair value, establishes a framework for measuring fair value in accordance with generally accepted accounting principles and expands disclosure about fair value measurements. FAS 157 is effective for fiscal years beginning after November 15, 2007. Management is currently evaluating the impact the adoption of FAS 157 will have on the Portfolio's financial statement disclosures.
26
International Equity Portfolio as of October 31, 2007
REPORT OF INDEPENDENT REGISTERED PUBLIC ACCOUNTING FIRM
To the Trustees and Investors
of International Equity Portfolio:
We have audited the accompanying statement of assets and liabilities of International Equity Portfolio (the "Portfolio"), including the portfolio of investments, as of October 31, 2007, and the related statement of operations for the year then ended, the statements of changes in net assets, and the supplementary data for the year then ended and for the period from the start of business, May 31, 2006, to October 31, 2006. These financial statements and supplementary data are the responsibility of the Portfolio's management. Our responsibility is to express an opinion on these financial statements and supplementary data based on our audits.
We conducted our audits in accordance with the standards of the Public Company Accounting Oversight Board (United States). Those standards require that we plan and perform the audit to obtain reasonable assurance about whether the financial statements and supplementary data are free of material misstatement. The Portfolio is not required to have, nor were we engaged to perform, an audit of its internal control over financial reporting. Our audits included consideration of internal control over financial reporting as a basis for designing audit procedures that are appropriate in the circumstances, but not for the purpose of expressing an opinion on the effectiveness of the Portfolio's internal control over financial reporting. Accordingly, we express no such opinion. An audit also include s examining, on a test basis, evidence supporting the amounts and disclosures in the financial statements, assessing the accounting principles used and significant estimates made by management, as well as evaluating the overall financial statement presentation. Our procedures included confirmation of securities owned as of October 31, 2007, by correspondence with the custodian and brokers; where replies were not received from brokers, we performed other auditing procedures. We believe that our audits provide a reasonable basis for our opinion.
In our opinion, the financial statements and supplementary data referred to above present fairly, in all material respects, the financial position of International Equity Portfolio as of October 31, 2007, the results of its operations for the year then ended, the changes in its net assets, and the supplementary data for the year then ended and for the period from the start of business, May 31, 2006, to October 31, 2006, in conformity with accounting principles generally accepted in the United States of America.
DELOITTE & TOUCHE LLP
Boston, Massachusetts
December 17, 2007
27
Eaton Vance International Equity Fund
BOARD OF TRUSTEES' ANNUAL APPROVAL OF THE INVESTMENT ADVISORY AGREEMENTS
Overview of the Contract Review Process
The Investment Company Act of 1940, as amended (the "1940 Act"), provides, in substance, that each investment advisory agreement between a fund and its investment adviser will continue in effect from year to year only if its continuance is approved at least annually by the fund's board of trustees, including by a vote of a majority of the trustees who are not "interested persons" of the fund ("Independent Trustees"), cast in person at a meeting called for the purpose of considering such approval.
At a meeting of the Boards of Trustees (each a "Board") of the Eaton Vance group of mutual funds (the "Eaton Vance Funds") held on April 23, 2007, the Board, including a majority of the Independent Trustees, voted to approve continuation of existing advisory and sub-advisory agreements for the Eaton Vance Funds for an additional one-year period. In voting its approval, the Board relied upon the affirmative recommendation of the Special Committee of the Board, which is a committee comprised exclusively of Independent Trustees. Prior to making its recommendation, the Special Committee reviewed information furnished for a series of meetings of the Special Committee held in February, March and April 2007. Such information included, among other things, the following:
Information about Fees, Performance and Expenses
• An independent report comparing the advisory and related fees paid by each fund with fees paid by comparable funds;
• An independent report comparing each fund's total expense ratio and its components to comparable funds;
• An independent report comparing the investment performance of each fund to the investment performance of comparable funds over various time periods;
• Data regarding investment performance in comparison to relevant peer groups of funds and appropriate indices;
• Comparative information concerning fees charged by each adviser for managing other mutual funds and institutional accounts using investment strategies and techniques similar to those used in managing the fund;
• Profitability analyses for each adviser with respect to each fund;
Information about Portfolio Management
• Descriptions of the investment management services provided to each fund, including the investment strategies and processes employed;
• Information concerning the allocation of brokerage and the benefits received by each adviser as a result of brokerage allocation, including information concerning the acquisition of research through "soft dollar" benefits received in connection with the funds' brokerage, and the implementation of a soft dollar reimbursement program established with respect to the funds;
• Data relating to portfolio turnover rates of each fund;
• The procedures and processes used to determine the fair value of fund assets and actions taken to monitor and test the effectiveness of such procedures and processes;
Information about each Adviser
• Reports detailing the financial results and condition of each adviser;
• Descriptions of the qualifications, education and experience of the individual investment professionals whose responsibilities include portfolio management and investment research for the funds, and information relating to their compensation and responsibilities with respect to managing other mutual funds and investment accounts;
• Copies of the Codes of Ethics of each adviser and its affiliates, together with information relating to compliance with and the administration of such codes;
• Copies of or descriptions of each adviser's proxy voting policies and procedures;
• Information concerning the resources devoted to compliance efforts undertaken by each adviser and its affiliates on behalf of the funds (including descriptions of various compliance programs) and their record of compliance with investment policies and restrictions, including policies with respect to market-timing, late trading and selective portfolio disclosure, and with policies on personal securities transactions;
• Descriptions of the business continuity and disaster recovery plans of each adviser and its affiliates;
Other Relevant Information
• Information concerning the nature, cost and character of the administrative and other non-investment management services provided by Eaton Vance Management and its affiliates;
• Information concerning management of the relationship with the custodian, subcustodians and fund accountants by each adviser or the funds' administrator; and
• The terms of each advisory agreement.
28
Eaton Vance International Equity Fund
BOARD OF TRUSTEES' ANNUAL APPROVAL OF THE INVESTMENT ADVISORY AGREEMENTS CONT'D
In addition to the information identified above, the Special Committee considered information provided from time to time by each adviser throughout the year at meetings of the Board and its committees. Over the course of the twelve-month period ended April 30, 2007, the Board met ten times and the Special Committee, the Audit Committee and the Governance Committee, each of which is a Committee comprised solely of Independent Trustees, met twelve, fourteen and eight times, respectively. At such meetings, the Trustees received, among other things, presentations by the portfolio managers and other investment professionals of each adviser relating to the investment performance of each fund and the investment strategies used in pursuing the fund's investment objective.
For funds that invest through one or more underlying portfolios, the Board considered similar information about the portfolio(s) when considering the approval of advisory agreements. In addition, in cases where the fund's investment adviser has engaged a sub-adviser, the Board considered similar information about the sub-adviser when considering the approval of any sub-advisory agreement.
The Special Committee was assisted throughout the contract review process by Goodwin Procter LLP, legal counsel for the Independent Trustees. The members of the Special Committee relied upon the advice of such counsel and their own business judgment in determining the material factors to be considered in evaluating each advisory and sub-advisory agreement and the weight to be given to each such factor. The conclusions reached with respect to each advisory and sub-advisory agreement were based on a comprehensive evaluation of all the information provided and not any single factor. Moreover, each member of the Special Committee may have placed varying emphasis on particular factors in reaching conclusions with respect to each advisory and sub-advisory agreement.
Results of the Process
Based on its consideration of the foregoing, and such other information as it deemed relevant, including the factors and conclusions described below, the Special Committee concluded that the continuance of the investment advisory agreement of the International Equity Portfolio (the "Portfolio"), the portfolio in which the Eaton Vance International Equity Fund (the "Fund") invests, with Boston Management and Research ("BMR" or the "Adviser") and the sub-advisory agreement with Eagle Global Advisors, L.L.C. ("Eagle" or the "Sub-adviser"), including their fee structures, is in the interests of shareholders and, therefore, the Special Committee recommended to the Board approval of the respective agreements. The Board accepted the recommendation of the Special Committee as well as the factors considered and conclusions reached by the Special Committee with respect to the agreements. Accordingly, the Board, including a majority of the Independent Trustees, voted to approve continuation of the investment advisory agreement and sub-advisory agreement for the Portfolio.
Nature, Extent and Quality of Services
In considering whether to approve the investment advisory agreement with BMR and sub-advisory agreement with Eagle for the Portfolio, the Board evaluated the nature, extent and quality of services provided to the Portfolio by BMR and by Eagle.
The Board considered BMR's and Eagle's management capabilities and investment process with respect to the types of investments held by the Portfolio, including the education, experience and number of its investment professionals and other personnel who provide portfolio management, investment research, and similar services to the Portfolio and who also supervise Eagle's management of the Portfolio. The Board specifically noted BMR's in-house equity research capabilities. The Board also took into account the resources dedicated to portfolio management and other services, including the compensation paid to recruit and retain investment personnel, and the time and attention devoted to the Portfolio by senior management.
The Board reviewed the compliance programs of BMR, relevant affiliates thereof, and Eagle. Among other matters, the Board considered compliance and reporting matters relating to personal trading by investment personnel, selective disclosure of portfolio holdings, late trading, frequent trading, portfolio valuation, business continuity and the allocation of investment opportunities. The Board also evaluated the responses of BMR and its affiliates to requests from regulatory authorities such as the Securities and Exchange Commission and the National Association of Securities Dealers.
The Board considered shareholder and other administrative services provided or managed by BMR and its affiliates, including transfer agency and accounting services. The Board evaluated the benefits to shareholders of investing in a fund that is a part of a large family of funds, including the ability, in many cases, to exchange an investment among different funds without incurring additional sales charges.
After consideration of the foregoing factors, among others, the Board concluded that the nature, extent and quality of services provided by BMR and Eagle, taken as a whole, are appropriate and consistent with the terms of the investment advisory agreement with respect to BMR, and consistent with the investment sub-advisory agreement with respect to Eagle.
29
Eaton Vance International Equity Fund
BOARD OF TRUSTEES' ANNUAL APPROVAL OF THE INVESTMENT ADVISORY AGREEMENTS CONT'D
Fund Performance
The Board compared the Fund's investment performance to a relevant universe of similarly managed funds identified by an independent data provider and appropriate benchmark indices. The Board reviewed comparative performance data for the period from inception (May 2006) through September 30, 2006. In light of the Fund's extremely brief operating history, the Board concluded that additional time was required to evaluate Fund performance.
Management Fees and Expenses
The Board reviewed contractual investment advisory fee rates, including any administrative fee rates, payable by the Portfolio and the Fund (referred to collectively as "management fees"). As part of its review, the Board considered the Fund's management fees and total expense ratio for the period from inception through September 30, 2006.
After reviewing the foregoing information, and in light of the nature, extent and quality of the services provided by BMR, the Board concluded that the management fees charged for advisory and related services and the Fund's total expense ratio are reasonable.
Profitability
The Board reviewed the level of profits realized by BMR and relevant affiliates thereof in providing investment advisory and administrative services to the Fund, the Portfolio and all Eaton Vance Funds as a group. The Board considered the level of profits realized without regard to revenue sharing or other payments by BMR and its affiliates to third parties in respect of distribution services. The Board also considered other direct or indirect benefits received by BMR and its affiliates in connection with its relationship with the Fund and the Portfolio, including the benefits of research services that may be available to BMR as a result of securities transactions effected for the Portfolio and other advisory clients. The Board also concluded that, in light of its role as a sub-adviser not affiliated with the Adviser, the Sub-adviser's profitability in managing the Portfolio was not a material factor.
The Board concluded that, in light of the foregoing factors and the nature, extent and quality of the services rendered, the profits realized by BMR and its affiliates are reasonable.
Economies of Scale
In reviewing management fees and profitability, the Board also considered the extent to which BMR and its affiliates, on the one hand, and the Fund, on the other hand, can expect to realize benefits from economies of scale as the assets of the Fund and the Portfolio increase. The Board acknowledged the difficulty in accurately measuring the benefits resulting from the economies of scale with respect to the management of any specific fund or group of funds. The Board reviewed data summarizing the increases and decreases in the assets of the Fund and of all Eaton Vance Funds as a group over various time periods, and evaluated the extent to which the total expense ratio of the Fund and the profitability of BMR and its affiliates may have been affected by such increases or decreases. Based upon the foregoing, the Board concluded that the benefits from economies of scale are currently being shared equitably by BMR and its affiliates and the Fund. The Board also concluded that, assuming reasonably foreseeable increases in the assets of the Portfolio, the structure of the Portfolio advisory fee, which includes breakpoints at several asset levels, can be expected to cause BMR and its affiliates, Eagle, and the Fund and the Portfolio to continue to share such benefits equitably.
30
Eaton Vance International Equity Fund
MANAGEMENT AND ORGANIZATION
Fund Management. The Trustees of Eaton Vance Mutual Funds Trust (the Trust) and International Equity Portfolio (the Portfolio) are responsible for the overall management and supervision of the Trust's and Portfolio's affairs. The Trustees and officers of the Trust and the Portfolio are listed below. Except as indicated, each individual has held the office shown or other offices in the same company for the last five years. Trustees and officers of the Trust and the Portfolio hold indefinite terms of office. The "noninterested Trustees" consist of those Trustees who are not "interested persons" of the Trust and the Portfolio, as that term is defined under the 1940 Act. The business address of each Trustee and officer is The Eaton Vance Building, 255 State Street, Boston, Massachusetts 02109. As used below, "EVC" refers to Eaton Vance Corp., "EV" refers to Eato n Vance, Inc., "EVM" refers to Eaton Vance Management, "BMR" refers to Boston Management and Research, "Eagle" refers to Eagle Global Advisors, L.L.C., "Parametric" refers to Parametric Portfolio Associates and "EVD" refers to Eaton Vance Distributors, Inc. EVC and EV are the corporate parent and trustee, respectively, of EVM and BMR. EVD is the Fund's principal underwriter, the Portfolio's placement agent and a wholly-owned subsidiary of EVM. Each officer affiliated with Eaton Vance may hold a position with other Eaton Vance affiliates that is comparable to his or her position with EVM listed below.
Name and
Date of Birth | | Position(s)
with the
Trust and
the Portfolio | | Term of
Office and
Length of
Service | | Principal Occupation(s)
During Past Five Years | | Number of Portfolios
in Fund Complex
Overseen By
Trustee(1) | | Other Directorships Held | |
| Interested Trustee | |
|
Thomas E. Faust Jr.
5/31/58 | | Trustee and President of the Trust | | Trustee since 2007 and President of the Trust since 2002 | | Chairman, Chief Executive Officer and President of EVC, President of EV, Chief Executive Officer and President of EVM and BMR, and Director of EVD. Trustee and/or Officer of 176 registered investment companies and 5 private investment companies in the Eaton Vance Fund Complex. Mr. Faust is an interested person because of his positions with EVM, BMR, EVC and EV which are affiliates of the Trust and the Portfolio. | | | 176 | | | Director of EVC | |
|
| Noninterested Trustees(s) | |
|
Benjamin C. Esty
1/26/63 | | Trustee | | Trustee of the Trust since 2005 and of the Portfolio since 2006 | | Roy and Elizabeth Simmons Professor of Business Administration, Harvard University Graduate School of Business Administration (since 2003). Formerly, Associate Professor, Harvard University Graduate School of Business Administration (2000-2003). | | | 176 | | | None | |
|
Allen R. Freedman
4/3/40 | | Trustee | | Since 2007 | | Former Chairman and Chief Executive Officer of Assurant, Inc. (insurance provider) (1978-2000). Formerly, a Director of Loring Ward International (fund distributor) (2005-2007). | | | 175 | | | Director of Assurant, Inc. and Stonemor Partners L.P. (owner and operator of cemeteries) | |
|
William H. Park
9/19/47 | | Trustee | | Trustee of the Trust since 2003 and of the Portfolio since 2006 | | Vice Chairman, Commercial Industrial Finance Corp. (specialty finance company) (since 2006). Formerly, President and Chief Executive Officer, Prizm Capital Management, LLC (investment management firm) (2002-2005). | | | 176 | | | None | |
|
Ronald A. Pearlman
7/10/40 | | Trustee | | Trustee of the Trust since 2003 and of the Portfolio since 2006 | | Professor of Law, Georgetown University Law Center. | | | 176 | | | None | |
|
Norton H. Reamer
9/21/35 | | Trustee | | Trustee of the Trust since 1986 and of the Portfolio since 2006 | | President, Chief Executive Officer and a Director of Asset Management Finance Corp. (a specialty finance company serving the investment management industry) (since October 2003). President, Unicorn Corporation (an investment and financial advisory services company) (since September 2000). Formerly, Chairman and Chief Operating Officer, Hellman, Jordan Management Co., Inc. (an investment management company) (2000-2003). Formerly, Advisory Director of Berkshire Capital Corporation (investment banking firm) (2002-2003). | | | 176 | | | None | |
|
31
Eaton Vance International Equity Fund
MANAGEMENT AND ORGANIZATION CONT'D
Name and
Date of Birth | | Position(s)
with the
Trust and
the Portfolio | | Term of
Office and
Length of
Service | | Principal Occupation(s)
During Past Five Years | | Number of Portfolios
in Fund Complex
Overseen By
Trustee(1) | | Other Directorships Held | |
| Noninterested Trustees(s) (continued) | |
|
Heidi L. Steiger
7/8/53 | | Trustee | | Since 2007 | | President, Lowenhaupt Global Advisors, LLC (global wealth management firm) (since 2005); Formerly, President and Contributing Editor, Worth Magazine (2004); Formerly, Executive Vice President and Global Head of Private Asset Management (and various other positions), Neuberger Berman (investment firm) (1986-2004). | | | 173 | | | Director of Nuclear Electric Insurance Ltd. (nuclear insurance provider) and Aviva USA (insurance provider) | |
|
Lynn A. Stout
9/14/57 | | Trustee | | Trustee of the Trust since 1998 and of the Portfolio since 2006 | | Paul Hastings Professor of Corporate and Securities Law, University of California at Los Angeles School of Law. | | | 176 | | | None | |
|
Ralph F. Verni
1/26/43 | | Chairman of the Board and Trustee | | Chairman of the Board since 2007. Trustee of the Trust since 2005 and of the Portfolio since 2006 | | Consultant and private investor. | | | 176 | | | None | |
|
| Principal Officers who are not Trustees | |
|
Name and
Date of Birth | | Position(s)
with the
Trust and
the Portfolio | | Term of
Office and
Length of
Service | | Principal Occupation(s)
During Past Five Years | |
William H. Ahern, Jr.
7/28/59 | | Vice President of the Trust | | Since 1995 | | Vice President of EVM and BMR. Officer of 74 registered investment companies managed by EVM or BMR. | |
|
Edward R. Allen, III
7/5/60 | | Vice President of the Portfolio | | Since 2006 | | Partner and Chairman of the International Investment Committee of Eagle. Officer of 3 registered investment companies managed by EVM or BMR. | |
|
Cynthia J. Clemson
3/2/63 | | Vice President of the Trust | | Since 2005 | | Vice President of EVM and BMR. Officer of 89 registered investment companies managed by EVM or BMR | |
|
Charles B. Gaffney
12/4/72 | | Vice President of the Trust | | Since 2007 | | Vice President of EVM and BMR. Previously, Sector Portfolio Manager and Senior Equity Analyst of Brown Brothers Harriman (1997-2003). Officer of 29 registered investment companies managed by EVM or BMR. | |
|
Thomas N. Hunt, III
11/6/64 | | Vice President of the Portfolio | | Since 2006 | | Partner of Eagle. Officer of 3 registered investment companies managed by EVM or BMR. | |
|
Christine M. Johnston
11/9/72 | | Vice President of the Trust | | Since 2007 | | Vice President of EVM and BMR. Officer of 34 registered investment companies managed by EVM or BMR. | |
|
Aamer Khan
6/7/60 | | Vice President of the Trust | | Since 2005 | | Vice President of EVM and BMR. Officer of 32 registered investment companies managed by EVM or BMR. | |
|
Thomas H. Luster
4/8/62 | | Vice President of the Trust | | Since 2006 | | Vice President of EVM and BMR. Officer of 48 registered investment companies managed by EVM or BMR. | |
|
Michael R. Mach
7/15/47 | | Vice President of the Trust | | Since 1999 | | Vice President of EVM and BMR. Officer of 54 registered investment companies managed by EVM or BMR. | |
|
Robert B. MacIntosh
1/22/57 | | Vice President of the Trust | | Since 1998 | | Vice President of EVM and BMR. Officer of 89 registered investment companies managed by EVM and BMR. | |
|
32
Eaton Vance International Equity Fund
MANAGEMENT AND ORGANIZATION CONT'D
Name and
Date of Birth | | Position(s)
with the
Trust and the
Portfolio | | Term of
Office and
Length of
Service | | Principal Occupation(s)
During Past Five Years | |
| Principal Officers who are not Trustees (continued) | |
|
Duncan W. Richardson
10/26/57 | | Vice President of the Trust and President of the Portfolio | | Vice President of the Trust since 2001 and President of the Portfolio since 2006 | | Executive Vice President and Chief Equity Investment Officer of EVC, EVM and BMR. Officer 80 registered investment companies managed by EVM or BMR. | |
|
Walter A. Row, III
7/20/57 | | Vice President of the Trust | | Since 2001 | | Director of Equity Research and a Vice President of EVM and BMR. Officer of 38 registered investment companies managed by EVM or BMR. | |
|
Judith A. Saryan
8/21/54 | | Vice President of the Trust | | Since 2003 | | Vice President of EVM and BMR. Officer of 53 registered investment companies managed by EVM or BMR. | |
|
Susan Schiff
3/13/61 | | Vice President of the Trust | | Since 2002 | | Vice President of EVM and BMR. Officer of 35 registered investment companies managed by EVM or BMR. | |
|
Thomas Seto
9/27/62 | | Vice President of the Trust | | Since 2007 | | Vice President and Director of Portfolio Management of Parametric. Officer of 30 registered investment companies managed by EVM or BMR. | |
|
David M. Stein
5/4/51 | | Vice President of the Trust | | Since 2007 | | Managing Director and Chief Investment Officer of Parametric. Officer of 30 registered investment companies managed by EVM or BMR. | |
|
Mark S. Venezia
5/23/49 | | Vice President of the Trust | | Since 2007 | | Vice President of EVM and BMR. Officer of 35 registered investment companies managed by EVM or BMR. | |
|
Adam A. Weigold
3/22/75 | | Vice President of the Trust | | Since 2007 | | Vice President of EVM and BMR. Officer of 70 registered investment companies managed by EVM or BMR. | |
|
Kristin S. Anagnost
6/12/65 | | Treasurer of the Portfolio | | Since 2006 | | Vice President of EVM and BMR. Officer of 95 registered investment companies managed by EVM or BMR. | |
|
Barbara E. Campbell
6/19/57 | | Treasurer of the Trust | | Since 2005 | | Vice President of EVM and BMR. Officer of 176 registered investment companies managed by EVM or BMR. | |
|
Maureen A. Gemma
5/24/60 | | Secretary | | Since 2007 | | Deputy Chief Legal Officer and Vice President of EVM and BMR. Officer of 176 registered investment companies managed by EVM or BMR. | |
|
Paul M. O'Neil
7/11/53 | | Chief Compliance Officer | | Chief Compliance Officer of the Trust since 2004 and of the Portfolio since 2006 | | Vice President of EVM and BMR. Officer of 176 registered investment companies managed by EVM or BMR. | |
|
(1) Includes both master and feeder funds in a master-feeder structure.
The SAI for the Fund includes additional information about the Trustees and officers of the Fund and the Portfolio and can be obtained without charge by calling 1-800-225-6265.
33
This Page Intentionally Left Blank
This Page Intentionally Left Blank
This Page Intentionally Left Blank
Investment Adviser of International Equity Portfolio
Boston Management and Research
The Eaton Vance Building
255 State Street
Boston, MA 02109
Sub-Adviser of International Equity Portfolio
Eagle Global Advisors, L.L.C.
5847 San Felipe, Suite 930
Houston, TX 77057
Administrator of Eaton Vance International Equity Fund
Eaton Vance Management
The Eaton Vance Building
255 State Street
Boston, MA 02109
Principal Underwriter
Eaton Vance Distributors, Inc.
The Eaton Vance Building
255 State Street
Boston, MA 02109
(617) 482-8260
Custodian
State Street Bank & Trust Company
200 Clarendon Street
Boston, MA 02116
Transfer Agent
PFPC Inc.
Attn: Eaton Vance Funds
P.O. Box 9653
Providence, RI 02940-9653
(800) 262-1122
Independent Registered Public Accounting Firm
Deloitte & Touche LLP
200 Berkeley Street
Boston, MA 02116-5022
Eaton Vance International Equity Fund
The Eaton Vance Building
255 State Street
Boston, MA 02109
This report must be preceded or accompanied by a current prospectus. Before investing, investors should consider carefully the Fund's investment objective(s), risks, and charges and expenses. The Fund's current prospectus contains this and other information about the Fund and is available through your financial advisor. Please read the prospectus carefully before you invest or send money. For further information please call 1-800-225-6265.
2773-12/07 IEFSRC


Annual Report October 31, 2007
EATON VANCE
INTERNATIONAL INCOME
FUND


IMPORTANT NOTICES REGARDING PRIVACY,
DELIVERY OF SHAREHOLDER DOCUMENTS,
PORTFOLIO HOLDINGS AND PROXY VOTING
Privacy. The Eaton Vance organization is committed to ensuring your financial privacy. Each of the financial institutions identified below has in effect the following policy ("Privacy Policy") with respect to nonpublic personal information about its customers:
• Only such information received from you, through application forms or otherwise, and information about your Eaton Vance fund transactions will be collected. This may include information such as name, address, social security number, tax status, account balances and transactions.
• None of such information about you (or former customers) will be disclosed to anyone, except as permitted by law (which includes disclosure to employees necessary to service your account). In the normal course of servicing a customer's account, Eaton Vance may share information with unaffiliated third parties that perform various required services such as transfer agents, custodians and broker/dealers.
• Policies and procedures (including physical, electronic and procedural safeguards) are in place that are designed to protect the confidentiality of such information.
• We reserve the right to change our Privacy Policy at any time upon proper notification to you. Customers may want to review our Policy periodically for changes by accessing the link on our homepage: www.eatonvance.com.
Our pledge of privacy applies to the following entities within the Eaton Vance organization: the Eaton Vance Family of Funds, Eaton Vance Management, Eaton Vance Investment Counsel, Boston Management and Research, and Eaton Vance Distributors, Inc.
In addition, our Privacy Policy only applies to those Eaton Vance customers who are individuals and who have a direct relationship with us. If a customer's account (i.e., fund shares) is held in the name of a third-party financial adviser/broker-dealer, it is likely that only such adviser's privacy policies apply to the customer. This notice supersedes all previously issued privacy disclosures.
For more information about Eaton Vance's Privacy Policy, please call 1-800-262-1122.
Delivery of Shareholder Documents. The Securities and Exchange Commission (the "SEC") permits funds to deliver only one copy of shareholder documents, including prospectuses, proxy statements and shareholder reports, to fund investors with multiple accounts at the same residential or post office box address. This practice is often called "householding" and it helps eliminate duplicate mailings to shareholders.
Eaton Vance, or your financial adviser, may household the mailing of your documents indefinitely unless you instruct Eaton Vance, or your financial adviser, otherwise.
If you would prefer that your Eaton Vance documents not be householded, please contact Eaton Vance at 1-800-262-1122, or contact your financial adviser.
Your instructions that householding not apply to delivery of your Eaton Vance documents will be effective within 30 days of receipt by Eaton Vance or your financial adviser.
Portfolio Holdings. Each Eaton Vance Fund and its underlying Portfolio (if applicable) will file a schedule of its portfolio holdings on Form N-Q with the SEC for the first and third quarters of each fiscal year. The Form N-Q will be available on the Eaton Vance website www.eatonvance.com, by calling Eaton Vance at 1-800-262-1122 or in the EDGAR database on the SEC's website at www.sec.gov. Form N-Q may also be reviewed and copied at the SEC's public reference room in Washington, D.C. (call 1-800-732-0330 for information on the operation of the public reference room).
Proxy Voting. From time to time, funds are required to vote proxies related to the securities held by the funds. The Eaton Vance Funds or their underlying Portfolios (if applicable) vote proxies according to a set of policies and procedures approved by the Funds' and Portfolios' Boards. You may obtain a description of these policies and procedures and information on how the Funds or Portfolios voted proxies relating to portfolio securities during the most recent 12 month period ended June 30, without charge, upon request, by calling 1-800-262-1122. This description is also available on the SEC's website at www.sec.gov.
Eaton Vance International Income Fund as of October 31, 2007
MANAGEMENT’S DISCUSSION OF FUND PERFORMANCE
Performance Since Inception
· The Fund’s Class A shares had a total return of 10.05% during the period from inception on June 27, 2007 through October 31, 2007.(1)
· In comparison, the JP Morgan Government Bond Index – Global, ex U.S. – an unmanaged, broad-based index consisting entirely of foreign-denominated securities – had a return of 10.09% for the period ended October 31, 2007.(2)
Management Discussion
· The Fund seeks to provide total return by investing principally (over 50% of net assets) in a portfolio of securities denominated in foreign currencies, fixed-income instruments issued by foreign entities or sovereigns and/or derivative instruments, denominated in or based on the currencies, interest rates or issues of, foreign countries. The Fund invests its assets in International Income Portfolio (the “Portfolio”), a separate investment company with the same objective and investment policies as the Fund.
· As the Fund commenced operations in June, the global bond markets were encountering increasing volatility. The U.S. credit squeeze resulted in broad deleveraging and a flight to quality in the global bond markets. Some high-yield and emerging markets reacted negatively, while the flight to quality benefited the G7 sovereigns, the Euro and the Yen. Amid the turmoil, central banks – including the Federal Reserve – injected liquidity to preserve economic stability. While the credit squeeze and a weakening U.S. economy concerned investors, stronger domestic economies insulated some Asian and Latin American countries from slowing U.S. demand.
· The Portfolio’largest bond exposures were in western Europe, specifically, in Germany and France. With the European Central Bank injecting liquidity into the tight financial markets, the Fund benefited from higher-duration positions in more liquid, developed countries such as Germany and France. The Portfolio was further diversified in Europe in the U.K., Denmark, Belgium and the Netherlands. Positions in Euro-denominated bonds also benefited from the dollar’s continued decline.(3)
· The Portfolio’s second largest currency exposure, after the Euro, was the Yen. Japan’s economy has improved modestly in 2007, reflecting a stronger consumer and an increase in business investment and a rise in exports to neighboring Asian countries. Those trends, together with the continued unraveling of the yen-carry trade, has resulted in a significant appreciation of the yen versus the dollar.(3)
· The Portfolio’s largest emerging market position in Asia was Malaysia, whose export-oriented economy has benefited from the Asian region’s broad economic uptrend. Following the de-pegging of its currency, the Ringgit, from the U.S. dollar and the easing of capital controls, Malaysia has seen an inflow of investment, a stronger economy and an appreciating currency.(3)
· In Eastern Europe, Poland was the Portfolio’s largest currency position during the period. Improving economic fundamentals, large remittances from abroad and the recent election of a reform-minded government committed to selling state-owned industries and convergence with the Euro have pushed Poland’s currency higher. The Portfolio cross-hedged some of its Eastern Europe investments – which have attractive yields spreads over the Euro – with short-Euro positions.(3)
· In Latin America, Brazil was the Portfolio’s largest position during the period. Brazil’s government has stabilized its economy in recent years, resulting in lower inflation, an accumulation of reserves and an inflow of capital – trends that have resulted in a further appreciation of Brazil’s currency.(3)
The views expressed throughout this report are those of the portfolio managers and are current only through the end of the period of the report as stated on the cover. These views are subject to change at any time based upon market or other conditions, and the investment adviser disclaims any responsibility to update such views. These views may not be relied on as investment advice and, because investment decisions for a fund are based on many factors, may not be relied on as an indication of trading intent on behalf of any Eaton Vance fund.
(1) These returns do not include the 4.75% maximum sales charge for the Class A shares. If sales charges were deducted, the returns would be lower. Absent a voluntary allocation of expenses to the administrator, the return would be lower.
(2) It is not possible to invest directly in an Index. The index’s total return does not reflect the expenses that would have been incurred if an investor individually purchased or sold the securities represented in the Index.
(3) Fund allocations are subject to change due to active management.
Fund shares are not insured by the FDIC and are not deposits or other obligations of, or guaranteed by, any depository institution. Shares are subject to investment risks, including possible loss of principal invested.
Past performance is no guarantee of future results. Returns are historical and are calculated by determining the percentage change in net asset value or offering price (as applicable) with all distributions reinvested. Investment return and principal value will fluctuate so that shares, when redeemed, may be worth more or less than their original cost. Performance is for the stated time period only; due to market volatility, the Fund’s current performance may be lower or higher than the quoted return. For performance as of the most recent month end, please refer to www.eatonvance.com.
1
Eaton Vance International Income Fund as of October 31, 2007
PORTFOLIO PROFILE
· The Portfolio also had positions in northern and sub-Saharan Africa. Unlike some other developing economies, these countries tend to be de-linked from broad short-term global financial tides. Egyptian T-bills remained attractive, as high energy prices produced a continuing influx of Middle Eastern petro-dollars into the Egyptian financial markets.(1)
· The Fund’s duration was 4.6 years at October 31, 2007. Duration is a measure of the sensitivity of a fund or a fixed-income security to changes in interest rates. A shorter duration instrument normally has less exposure to interest rate risk than longer duration instruments.
(1) Portfolio holdings may change due to active management.
Securities Holdings (excludes derivatives)(2)
By total net assets
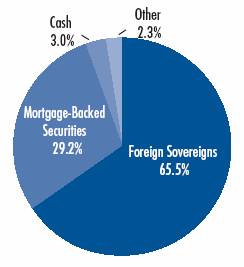
(2) Securities Holdings reflect the Portfolio’s investments as of 10/31/07. Securities Holdings do not reflect derivatives positions. For International and Emerging Market exposures please refer to the Regional Currency Exposure table. Fund Statistics may not be representative of the Portfolio’s current or future investments and are subject to change due to active management.
Regional Currency Exposures (including derivatives)(3)
By total net assets
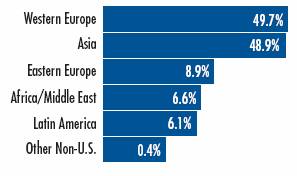
(3) The Regional Currency Exposures reflects the Portfolio’s investments as of 10/31/07. Total exposures may exceed 100% due to implicit leverage created by derivatives. Portfolio Statistics may not be representative of the Portfolio’s current or future investments and are subject to change due to active management.
Currency positions(4)
By total net assets
Euro | | 38.5 | % |
Japan | | 28.1 | |
Malaysia | | 7.8 | |
United Kingdom | | 7.5 | |
Poland | | 6.3 | |
Egypt | | 6.1 | |
Philippines | | 4.6 | |
Brazil | | 4.5 | |
Indonesia | | 4.3 | |
India | | 3.6 | |
Denmark | | 2.9 | |
Turkey | | 2.6 | |
Mexico | | 1.6 | |
Sweden | | 0.9 | |
South Korea | | 0.6 | |
Nigeria | | 0.5 | |
Australia | | 0.4 | |
(4) Currency Positions reflect the Portfolio’s investments as of 10/31/07. Currency exposures include all long foreign exchange denominated assets and all long currency derivatives. Net short positions and other foreign derivatives are excluded. Short Currency Exposures are 1.0%. Other Foreign Long derivatives are 2.9%. Other Foreign Short Derivatives are 24.5%. All numbers are a percentage of net assets. Total exposures may exceed 100% due to implicit leverage created by derivatives. Portfolio Statistics may not be representative of the Portfolio’s current or future investments and are subject to change due to active management.
2
Eaton Vance International Income Fund as ofOctober31,2007
Fund perforMance
The line graph and table set forth below provide information about the Fund’s performance. The line graph compares the performance of Class A of the Fund with that of the JP Morgan Government Bond Index - Global, ex U.S., an unmanaged, broad-based market index consisting entirely of foreign denominated securities. The lines on the graph represent the total returns of a hypothetical investment of $10,000 in Class A of the Fund and in the JP Morgan Government Bond Index - Global, ex U.S. The table includes the total returns of Class A of the Fund at net asset value and public offering price. The performance presented below does not reflect the deduction of taxes, if any, that a shareholder would pay on Fund distributions or the redemption of Fund shares.
Fund performance(1) As of 10/31/07
| | Class A | |
Share Class Symbol | | EAIIX | |
| | | |
Cumulative Total Return (at net asset value) | | | |
Life of Fund† | | 10.05 | % |
| | | |
SEC Cumulative Total Return (including sales charge or applicable CDSC) | | | |
Life of Fund† | | 4.81 | % |
† Inception Date – Class A: 6/27/07.
(1) Cumulative Total Return does not include the 4.75% maximum sales charge for Class A shares. If sales charges were deducted, the returns would be lower. SEC Cumulative Total Return for Class A reflects the maximum 4.75% sales charge. Absent a voluntary allocation of expenses to the administrator, the return would be lower.
Total Annual | | | |
Operating Expenses(2) | | Class A | |
| | | |
Expense Ratio | | 1.10 | % |
(2) Source: Prospectus dated 6/27/07.
Comparison of Change in Value of a $10,000 Investment in Eaton Vance International Income Fund, Class A vs. the JP Morgan Government Bond Index – Global, ex U.S. (JP Morgan Index)*
June 30, 2007 – October 31, 2007
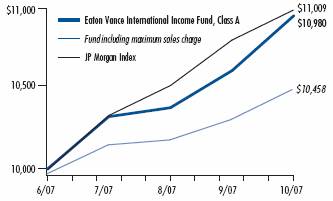
* Sources: Thomson Financial; Lipper. Class A of the Fund commenced operations on 6/27/07. Index data is available as of month end only.
It is not possible to invest directly in an Index. The Index’s total return does not reflect the expenses that would have been incurred if an investor individually purchased or sold the securities represented in the Index.
Past performance is no guarantee of future results. Returns are historical and are calculated by determining the percentage change in net asset value or offering price (as applicable) with all distributions reinvested. Investment return and principal value will fluctuate so that shares, when redeemed, may be worth more or less than their original cost. Performance is for the stated time period only; due to market volatility, the Fund’s current performance may be lower or higher than the quoted return. For performance as of the most recent month end, please refer to www.eatonvance.com.
3
Eaton Vance International Income Fund as of October 31, 2007
FUND EXPENSES
Example: As a shareholder of the Fund, you incur two types of costs: (1) transaction costs, including sales charges (loads) on purchases and redemption fees (if applicable); and (2) ongoing costs, including management fees; distribution or service fees; and other Fund expenses. This Example is intended to help you understand your ongoing costs (in dollars) of investing in the Fund and to compare these costs with the ongoing costs of investing in other mutual funds. The Example is based on an investment of $1,000 invested at the beginning of the period and held for the entire period (June 27, 2007 – October 31, 2007).
Actual Expenses: The first section of the table below provides information about actual account values and actual expenses. You may use the information in this section, together with the amount you invested, to estimate the expenses that you paid over the period. Simply divide your account value by $1,000 (for example, an $8,600 account value divided by $1,000 = 8.6), then multiply the result by the number in the first section under the heading entitled "Expenses Paid During Period" to estimate the expenses you paid on your account during this period.
Hypothetical Example for Comparison Purposes: The second section of the table below provides information about hypothetical account values and hypothetical expenses based on the actual Fund expense ratio and an assumed rate of return of 5% per year (before expenses), which is not the actual return of the Fund. The hypothetical account values and expenses may not be used to estimate the actual ending account balance or expenses you paid for the period. You may use this information to compare the ongoing costs of investing in your Fund and other funds. To do so, compare this 5% hypothetical example with the 5% hypothetical examples that appear in the shareholder reports of the other funds.
Please note that the expenses shown in the table are meant to highlight your ongoing costs only and do not reflect any transactional costs, such as sales charges (loads) or redemption fees (if applicable). Therefore, the second section of the table is useful in comparing ongoing costs only, and will not help you determine the relative total costs of owning different funds. In addition, if these transactional costs were included, your costs would have been higher.
Eaton Vance International Income Fund
| | | Beginning Account Value
(6/27/07) | | Ending Account Value
(10/31/07) | | Expenses Paid During Period
(6/27/07 – 10/31/07) | |
| Actual* | |
| Class A | | $ | 1,000.00 | | | $ | 1,100.50 | | | $ | 4.57 | *** | |
| Hypothetical** | |
| (5% return per year before expenses) | |
| Class A | | $ | 1,000.00 | | | $ | 1,018.90 | | | $ | 6.36 | *** | |
* Actual expense are equal to the Fund's annualized expense ratio of 1.25% for Class A shares, mulitplied by average account value over the period, multiplied by 127/365 (to reflect the period from start of business, June 27, 2007 to October 31, 2007). The Example assumes that the $1,000 was invested at the net asset per share determined at the close of business on June 26, 2007. The Example reflects the expenses of both the Fund and the Portfolio.
** Hypothetical expenses are equal to the Fund's annualized expense ratio of 1.25% for Class A shares, multiplied by the average account value over the period, multiplied by the 184/365 (to reflect the one-half-year period). The Example assumes that the $1,000 was invested at the net asset value per share determined at the start of business, June 27, 2007. The Example reflects the expenses of both the Fund and the Portfolio.
*** Absent a voluntary allocation of expenses to the administrator, the expenses would have been higher.
4
Eaton Vance International Income Fund as of October 31, 2007
FINANCIAL STATEMENTS
Statement of Assets and Liabilities
As of October 31, 2007
| Assets | |
Investment in International Income Portfolio, at value
(identified cost, $181,924) | | $ | 187,233 | | |
| Receivable for Fund shares sold | | | 51,976 | | |
| Receivable from the administrator | | | 34,557 | | |
| Total assets | | $ | 273,766 | | |
| Liabilities | |
| Dividends payable | | $ | 60 | | |
| Payable to affiliate for service fees | | | 56 | | |
| Accrued expenses | | | 28,429 | | |
| Total liabilities | | $ | 28,545 | | |
| Net Assets | | $ | 245,221 | | |
| Sources of Net Assets | |
| Paid-in capital | | $ | 238,781 | | |
| Accumulated undistributed net realized gain from Portfolio | | | 1,208 | | |
| Distributions in excess of net investment income | | | (77 | ) | |
| Net unrealized appreciation from Portfolio | | | 5,309 | | |
| Total | | $ | 245,221 | | |
| Class A Shares | |
| Net Assets | | $ | 245,221 | | |
| Shares Outstanding | | | 22,597 | | |
Net Asset Value, Offering Price and Redemption Price Per Share
(net assets ÷ shares of beneficial interest outstanding) | | $ | 10.85 | | |
Maxium Offering Price Per Share
(100 ÷ 95.25 of $10.85) | | $ | 11.39 | | |
Statement of Operations
For the Period Ended
October 31, 2007(1)
| Investment Income | |
| Interest allocated from Portfolio (net of foreign taxes, $1) | | $ | 855 | | |
| Expenses allocated from Portfolio | | | (227 | ) | |
| Net investment income from Portfolio | | $ | 628 | | |
| Expenses | |
Service fees
Class A | | $ | 56 | | |
| Legal and accounting services | | | 20,729 | | |
| Printing and postage | | | 4,983 | | |
| Registration fees | | | 25,946 | | |
| Custodian fee | | | 2,728 | | |
| Miscellaneous | | | 1,180 | | |
| Total expenses | | $ | 55,622 | | |
Deduct —
Allocation of expenses to the administrator | | $ | 55,619 | | |
| Total expense reductions | | $ | 55,619 | | |
| Net expenses | | $ | 3 | | |
| Net investment income | | $ | 625 | | |
Realized and Unrealized
Gain (Loss) from Portfolio | |
Net realized gain (loss) —
Investment transactions | | $ | (505 | ) | |
| Swap contracts | | | (55 | ) | |
| Foreign currency and forward foreign currency exchange contract transactions | | | 1,724 | | |
| Net realized gain | | $ | 1,164 | | |
Change in unrealized appreciation (depreciation) —
Investments | | $ | 5,205 | | |
| Swap contracts | | | 41 | | |
| Foreign currency and forward foreign currency exchange contracts | | | 63 | | |
| Net change in unrealized appreciation (depreciation) | | $ | 5,309 | | |
| Net realized and unrealized gain | | $ | 6,473 | | |
| Net increase in net assets from operations | | $ | 7,098 | | |
(1) For the period from the start of business, June 27, 2007 to October 31, 2007.
See notes to financial statements
5
Eaton Vance International Income Fund as of October 31, 2007
FINANCIAL STATEMENTS CONT'D
Statement of Changes in Net Assets
Increase (Decrease)
in Net Assets | | Period Ended
October 31, 2007(1) | |
From operations —
Net investment income | | $ | 625 | | |
Net realized gain from investments, swap contracts, and foreign
currency and forward foreign currency exchange
contract transactions | | | 1,164 | | |
Net change in unrealized appreciation (depreciation) from investments,
financial futures contracts, swap contracts and foreign currency
and forward foreign currency exchange contracts | | | 5,309 | | |
| Net increase in net assets from operations | | $ | 7,098 | | |
Distributions to shareholders —
From net investment income
Class A | | $ | (60 | ) | |
| From net realized gains | | | (597 | ) | |
| Total distributions to shareholders | | $ | (657 | ) | |
Transactions in shares of beneficial interest —
Proceeds from sale of shares
Class A | | $ | 437,846 | | |
Net asset value of shares issued to shareholders in payment of
distributions declared
Class A | | | 484 | | |
Cost of shares redeemed
Class A | | | (201,599 | ) | |
| Capital contribution from administrator | | | 2,049 | | |
| Net increase in net assets from Fund share transactions | | $ | 238,780 | | |
| Net increase in net assets | | $ | 245,221 | | |
| Net Assets | |
| At beginning of period | | $ | — | | |
| At end of period | | $ | 245,221 | | |
| Distributions in excess of net investment income | |
| At end of period | | $ | (77 | ) | |
(1) For the period from the start of business, June 27, 2007 to October 31, 2007.
See notes to financial statements
6
Eaton Vance International Income Fund as of October 31, 2007
FINANCIAL STATEMENTS CONT'D
Financial Highlights
| | | Class A | |
| | | Period Ended
October 31, 2007(1)(2) | |
| Net asset value — Beginning of period | | $ | 10.000 | | |
| Income (loss) from operations | |
| Net investment income | | $ | 0.124 | | |
| Net realized and unrealized gain | | | 0.468 | | |
| Total income from operations | | $ | 0.592 | | |
| Less distributions | |
| From net investment income | | $ | (0.014 | ) | |
| From net realized gain | | | (0.135 | ) | |
| Total distributions | | $ | (0.149 | ) | |
| Capital Contribution from Administrator | | $ | 0.407 | | |
| Net asset value — End of period | | $ | 10.850 | | |
| Total Return(3) | | | 10.05 | %(7)(8) | |
| Ratios/Supplemental Data | |
| Net assets, end of period (000's omitted) | | $ | 245 | | |
| Ratios (As a percentage of average daily net assets): | |
| Expenses(4) | | | 1.25 | %(5)(6) | |
| Net investment income(4) | | | 3.38 | %(5)(6) | |
| Portfolio Turnover of the Portfolio | | | 2 | % | |
(1) Net investment income per share was computed using average shares outstanding.
(2) For the period from the start of business, June 27,2007 to October 31,2007.
(3) Returns are historical and are calculated by determining the percentage change in net asset value with all distributions reinvested.
(4) Includes the Fund's share of the Portfolio's allocated expenses.
(5) The administrator subsidized certain operating expenses (equal to 301.15% of average net assets for the period from the start of business, June 27, 2007 to October 31, 2007).
(6) Annualized.
(7) Not annualized.
(8) Absent a capital contribution by the administrator in the period, total return would have been 9.14%.
See notes to financial statements
7
Eaton Vance International Income Fund as of October 31, 2007
NOTES TO FINANCIAL STATEMENTS
1 Significant Accounting Policies
Eaton Vance International Income Fund (the Fund), is a non-diversified series of Eaton Vance Mutual Funds Trust (the Trust). The Trust is a Massachusetts business trust registered under the Investment Company Act of 1940, as amended (the 1940 Act), as an open-end management investment company. The Fund offers one classes of shares. Class A shares are generally sold subject to a sales charge imposed at the time of purchase. The Fund invests all of its investable assets in interests in the International Income Portfolio (the Portfolio), a New York trust, having the same investment objective and policies as the Fund. The value of the Fund's investment in the Portfolio reflects the Fund's proportionate interest in the net assets of the Portfolio (0.8% at October 31, 2007). The performance of the Fund is directly affected by the performance of the Portfolio. The financial statements of the Portfolio, including the portfolio of invest ments, are included elsewhere in this report and should be read in conjunction with the Fund's financial statements.
The following is a summary of significant accounting policies of the Fund. The policies are in conformity with accounting principles generally accepted in the United States of America.
A Investment Valuation — Valuation of securities by the Portfolio is discussed in Note 1A of the Portfolio's Notes to Financial Statements, which are included elsewhere in this report.
B Income — The Fund's net investment income or loss consists of the Fund's pro-rata share of the net investment income or loss of the Portfolio, less all actual and accrued expenses of the Fund.
C Federal Taxes — The Fund's policy is to comply with the provisions of the Internal Revenue Code applicable to regulated investment companies and to distribute to shareholders each year substantially all of its net investment income, and all or substantially all of its net realized capital gains. Accordingly, no provision for federal income or excise tax is necessary.
In June 2006, the Financial Accounting Standards Board (FASB) issued FASB Interpretation No. 48 (FIN 48), "Accounting for Uncertainty in Income Taxes – an interpretation of FASB Statement No. 109". FIN 48 clarifies the accounting for uncertainty in income taxes recognized in accordance with FASB Statement No. 109, "Accounting for Income Taxes". This interpretation prescribes a recognition threshold and measurement attribute for the financial statement recognition and measurement of a tax position taken or expected to be taken in a tax return. It also provides guidance on de-recognition, classification, interest and penalties, accounting in interim periods, disclosure and transition. FIN 48 is effective on the last business day of the first required financial reporting period for fiscal years beginning after December 15, 2006. Management has concluded th at as of October 31, 2007, there are no uncertain tax positions that would require financial statement recognition, derecognition, or disclosure.
D Expenses — The majority of expenses of the Trust are directly identifiable to an individual fund. Expenses which are not readily identifiable to a specific fund are allocated taking into consideration, among other things, the nature and type of expense and the relative size of the funds.
E Expense Reduction — State Street Bank and Trust Company (SSBT) serves as custodian of the Fund. Pursuant to the custodian agreement, SSBT receives a fee reduced by credits, which are determined based on the average daily cash balance the Fund maintains with SSBT. All credit balances, if any, used to reduce the Fund's custodian fees are reported as a reduction of expenses in the Statement of Operations.
F Use of Estimates — The preparation of the financial statements in conformity with accounting principles generally accepted in the United States of America requires management to make estimates and assumptions that affect the reported amounts of assets and liabilities at the date of the financial statements and the reported amounts of income and expense during the reporting period. Actual results could differ from those estimates.
G Indemnifications — Under the Trust's organizational documents, its officers and Trustees may be indemnified against certain liabilities and expenses arising out of the performance of their duties to the Fund, and shareholders are indemnified against personal liability for obligations of the Trust. Additionally, in the normal course of business, the Fund enters into agreements with service providers that may contain indemnification clauses. The Fund's maximum exposure under these arrangements is unknown as this would involve future claims that may be made against the Fund that have not yet occurred.
H Other — Investment transactions are accounted for on a trade date basis. Dividends to shareholders are recorded on the ex-dividend date.
8
Eaton Vance International Income Fund as of October 31, 2007
NOTES TO FINANCIAL STATEMENTS CONT'D
2 Distributions to Shareholders
The Fund declares dividends daily to shareholders of record at the time of declaration. Distributions are generally paid monthly. Distributions of realized capital gains, if any, are made at least annually. Shareholders may reinvest income and capital gain distributions in additional shares of the Fund at the net asset value as of the ex-dividend date or, at the election of the shareholder, receive distributions in cash. The Fund distinguishes between distributions on a tax basis and a financial reporting basis. Accounting principles generally accepted in the United States of America require that only distributions in excess of tax basis earnings and profits be reported in the financial statements as a return of capital. Permanent differences between book and tax accounting relating to distributions are reclassified to paid-in capital.
The tax character of the distributions declared for the period from start of business, June 27, 2007 to October 31, 2007 was as follows:
| | | Period Ended
October 31, 2007 | |
| Distributions declared from: | |
| Ordinary income | | $ | 87 | | |
| Long-term capital gain | | | 570 | | |
During the period from the start of business, June 27, 2007 to October 31, 2007, distributions in excess of net investment income was increased by $45, accumulated undistributed net realized gain was increased by $44, and paid-in-capital was increased by $1, due to differences between book and tax accounting primarily for foreign currency gain (loss), premium amortization and accounting for swaps. These reclassifications had no effect on the net assets or net asset value per share of the Fund.
As of October 31, 2007, the components of distributable earnings (accumulated losses) and unrealized appreciation (depreciation) on a tax basis were as follows:
| Accumulated undistributed long-term capital gains | | $ | 1,982 | | |
| Unrealized appreciation | | $ | 4,518 | | |
| Other temporary differences | | $ | (60 | ) | |
The differences between components of distributable earnings (accumulated loss) on a tax basis and the amounts reflected in the Statement of Assets and Liabilities are primarily due to differences in book and tax policies for swaps, foreign currency transactions, premium amortization, partnership allocations and the timing of recognizing distributions to shareholders.
3 Transactions with Affiliates
Eaton Vance Management (EVM) serves as an administrator of the Fund, but receives no compensation. The Fund has engaged EVM, to render investment advisory services. Under the investment advisory agreement, EVM receives a monthly advisory fee equal to 0.625% annually of the average daily net assets of the Fund up to $1 billion that are invested directly in securities. On net assets of $1 billion and over that are invested directly in securities, the annual fee is reduced. For the period from the start of business, June 27, 2007, to October 31, 2007 the fund held no direct investments and incurred no direct advisory fees. To the extent the Fund's assets are invested in the Portfolio, the Fund is allocated its share of the Portfolio's advisory fee. The Portfolio has engaged Boston Management and Research (BMR), a subsidiary of EVM, to render investment advisory services (See Note 2 of the Portfolio notes to financial statements whi ch are included elsewhere in this report). Pursuant to a voluntary expense reimbursement, the administrator was allocated $55,619 of the Fund's operating expense for the period ended October 31, 2007. During the period ended October 31, 2007, the administrator reimbursed the Fund $2,049 for forgone investment return resulting from the payment by the Fund of expenses that the administrator had intended to pay on behalf of the Fund. EVM serves as the sub-transfer agent of the Fund and receives from the transfer agent an aggregate fee based upon the actual expenses incurred by EVM in the performance of those services. For the period from the start of business June 27, 2007 to October 31, 2007, EVM received no sub-transfer agent fees. The Fund was informed that Eaton Vance Distributors Inc. (EVD), the Fund's principal underwriter and a subsidiary of EVM, received $1,800 as its portion of the sales charge on sales of Class A shares for the period from the start of business, June 27, 2007 to October 31, 2007. EVD also received distribution and service fees from Class A shares (see Note 4) and contingent deferred sales charges (see Note 5).
Except for Trustees of the Fund and the Portfolio who are not members of EVM's and BMR's organization, officers and Trustees receive remuneration for their services to the Fund out of the investment advisory fee. Certain officers and Trustees of the Fund and of the Portfolio are officers of the above organizations.
4 Distribution Plans
The Fund has in effect a distribution plan for Class A shares (Class A Plan) pursuant to Rule 12b-1 under the 1940 Act. The Class A Plan provides that the Fund will pay EVD a distribution and service fee of 0.30% per annum of its average daily net assets attributable to Class A shares for distribution services and facilities provided to the Fund by
9
Eaton Vance International Income Fund as of October 31, 2007
NOTES TO FINANCIAL STATEMENTS CONT'D
EVD, as well as for personal services and/or the maintenance of shareholder accounts. Distribution and service fees paid or accrued to EVD for the period from start of business, June 27, 2007 to October 31, 2007 for Class A shares amounted to $56.
5 Contingent Deferred Sales Charges
Class A shares may be subject to a 1% contingent deferred sales charge (CDSC) if redeemed within eighteen months of purchase (depending on the circumstances of purchase). Generally, the CDSC is based upon the lower of the net asset value at date of redemption or date of purchase. No charge is levied on shares acquired by reinvestment of dividends or capital gains distributions. No CDSC is levied on shares which have been sold to EVM or its affiliates or to their respective employees or clients and may be waived under certain other limited conditions. From the start of business, June 27, 2007 to October 31, 2007, the Fund was informed that EVD received no CDSC's paid by shareholders of Class A shares.
6 Investment Transactions
Increases and decreases in the Fund's investment in the Portfolio aggregated $385,870 and $205,737 respectively for the period from the start of business, June 27, 2007 to October 31, 2007.
7 Shares of Beneficial Interest
The Fund's Declaration of Trust permits the Trustees to issue an unlimited number of full and fractional shares of beneficial interest (without par value). Transactions in Fund shares were as follows:
| Class A | | Period Ended
October 31, 2007(1) | |
| Sales | | | 41,679 | | |
Issued to shareholders electing to receive payments of distributions
in Fund shares | | | 45 | | |
| Redemptions | | | (19,127 | ) | |
| Net increase | | | 22,597 | | |
(1) For the period from the start of business, June 27, 2007 to October 31, 2007.
8 Recently Issued Accounting Pronouncements
In September 2006, the FASB issued Statement of Financial Accounting Standards No. 157 (FAS 157), "Fair Value Measurements". FAS 157 defines fair value, establishes a framework for measuring fair value in accordance with generally accepted accounting principles and expands disclosure about fair value measurements. FAS 157 is effective for fiscal years beginning after November 15, 2007. Management is currently evaluating the impact the adoption of FAS 157 will have on the Fund's financial statement disclosures.
10
Eaton Vance International Income Fund as of October 31, 2007
REPORT OF INDEPENDENT REGISTERED PUBLIC ACCOUNTING FIRM
To the Trustees of Eaton Vance Mutual Funds
Trust and Shareholders of Eaton Vance
International Income Fund:
We have audited the accompanying statement of assets and liabilities of Eaton Vance International Income Fund (the "Fund") (one of the series of Eaton Vance Mutual Funds Trust) as of October 31, 2007, and the related statement of operations, the statement of changes in net assets, and the financial highlights for the period from the start of business, June 27, 2007, to October 31, 2007. These financial statements and financial highlights are the responsibility of the Fund's management. Our responsibility is to express an opinion on these financial statements and financial highlights based on our audit.
We conducted our audit in accordance with the standards of the Public Company Accounting Oversight Board (United States). Those standards require that we plan and perform the audit to obtain reasonable assurance about whether the financial statements and financial highlights are free of material misstatement. The Fund is not required to have, nor were we engaged to perform, an audit of its internal control over financial reporting. Our audit included consideration of internal control over financial reporting as a basis for designing audit procedures that are appropriate in the circumstances, but not for the purpose of expressing an opinion on the effectiveness of the Fund's internal control over financial reporting. Accordingly, we express no such opinion. An audit also includes examining, on a test basis, evidence supporting the amounts and disclosures in the financial statements, assessing the accounting principles used and si gnificant estimates made by management, as well as evaluating the overall financial statement presentation. We believe that our audit provides a reasonable basis for our opinion.
In our opinion, the financial statements and financial highlights referred to above present fairly, in all material respects, the financial position of Eaton Vance International Income Fund as of October 31, 2007, the results of its operations, the changes in its net assets, and the financial highlights for the period from the start of business, June 27, 2007, to October 31, 2007, in conformity with accounting principles generally accepted in the United States of America.
DELOITTE & TOUCHE LLP
Boston, Massachusetts
December 17, 2007
11
Eaton Vance International Income Fund as of October 31, 2007
FEDERAL TAX INFORMATION (Unaudited)
The Form 1099-DIV you receive in January 2008 will show the tax status of all distributions paid to your account in calendar 2007. Shareholders are advised to consult their own tax adviser with respect to the tax consequences of their investment in the Fund. As required by the Internal Revenue Code regulations, shareholders must be notified within 60 days of the Fund's fiscal year-end regarding the status of long term capital gain distributions.
Long Term Capital Gain Distributions. The Fund hereby designates $570 as a long term capital gain distribution.
12
International Income Portfolio as of October 31, 2007
PORTFOLIO OF INVESTMENTS
| Bonds & Notes — 93.4% | |
| Security | | Principal | | U.S. $ Value | |
| Australia — 0.4% | |
| Commonwealth of Australia, 6.50%, 5/15/13 | | AUD | 105,000 | | | $ | 97,551 | | |
| Total Australia (identified cost $94,686) | | | | | | $ | 97,551 | | |
| Belgium — 4.1% | |
| Kingdom of Belgium, 3.75%, 3/28/09 | | EUR | 274,000 | | | $ | 394,228 | | |
| Kingdom of Belgium, 4.00%, 3/28/13 | | EUR | 211,000 | | | | 301,917 | | |
| Kingdom of Belgium, 5.50%, 3/28/28 | | EUR | 168,000 | | | | 272,536 | | |
| Total Belgium (identified cost $888,440) | | | | | | $ | 968,681 | | |
| Brazil — 1.8% | |
| Nota Do Tesouro Nacional, 10.00%, 1/1/14 | | BRL | 800,000 | | | $ | 425,810 | | |
| Total Brazil (identified cost $414,963) | | | | | | $ | 425,810 | | |
| Canada — 2.6% | |
| Canada Government, 4.00%, 6/1/16 | | CAD | 590,000 | | | $ | 608,499 | | |
| Total Canada (identified cost $578,430) | | | | | | $ | 608,499 | | |
| Denmark — 2.7% | |
| Kingdom of Denmark, 4.00%, 11/15/17 | | DKK | 969,000 | | | $ | 183,181 | | |
| Kingdom of Denmark, 5.00%, 11/15/13 | | DKK | 896,000 | | | | 180,673 | | |
| Kingdom of Denmark, 6.00%, 11/15/09 | | DKK | 1,390,000 | | | | 278,713 | | |
| Total Denmark (identified cost $592,544) | | | | | | $ | 642,567 | | |
| Egypt — 4.2% | |
| Egyptian Treasury Bill, 0.00%, 1/22/08 | | EGP | 5,500,000 | | | $ | 982,504 | | |
| Total Egypt (identified cost $980,672) | | | | | | $ | 982,504 | | |
| France — 16.2% | |
| Government of France, 4.00%, 4/25/09 | | EUR | 1,055,000 | | | $ | 1,522,627 | | |
| Government of France, 4.00%, 10/25/13 | | EUR | 871,000 | | | | 1,247,125 | | |
| Government of France, 5.50%, 4/25/29 | | EUR | 641,000 | | | | 1,044,496 | | |
| Total France (identified cost $3,497,216) | | | | | | $ | 3,814,248 | | |
| Security | | Principal | | U.S. $ Value | |
| Germany — 19.4% | |
| Bundesrepub Deutschland, 3.75%, 7/4/13 | | EUR | 1,056,000 | | | $ | 1,496,869 | | |
| Bundesrepub Deutschland, 6.25%, 1/4/30 | | EUR | 697,000 | | | | 1,247,140 | | |
| Bundesschatzanweisungen, 3.75%, 3/13/09 | | EUR | 1,280,000 | | | | 1,841,718 | | |
| Total Germany (identified cost $4,200,435) | | | | | | $ | 4,585,727 | | |
| Netherlands — 4.0% | |
| Government of Netherlands, 3.75%, 7/15/09 | | EUR | 234,000 | | | $ | 336,327 | | |
| Government of Netherlands, 3.75%, 1/15/23 | | EUR | 218,000 | | | | 290,676 | | |
| Government of Netherlands, 5.00%, 7/15/12 | | EUR | 212,000 | | | | 317,226 | | |
| Total Netherlands (identified cost $866,301) | | | | | | $ | 944,229 | | |
| Nigeria — 0.5% | |
| Republic of Nigeria, 9.35%, 8/31/17 | | NGN | 6,841,000 | | | $ | 54,773 | | |
| Republic of Nigeria, 12.00%, 4/28/09 | | NGN | 6,343,000 | | | | 55,548 | | |
| Total Nigeria (identified cost $109,544) | | | | | | $ | 110,321 | | |
| Sweden — 0.9% | |
| Swedish Government, 3.75%, 8/12/17 | | SEK | 460,000 | | | $ | 69,463 | | |
| Swedish Government, 5.00%, 1/28/09 | | SEK | 450,000 | | | | 71,528 | | |
| Swedish Government, 6.75%, 5/5/14 | | SEK | 395,000 | | | | 70,740 | | |
| Total Sweden (identified cost $194,441) | | | | | | $ | 211,731 | | |
| United Kingdom — 7.4% | |
| United Kingdom Treasury Bond, 4.25%, 3/7/36 | | GBP | 279,000 | | | $ | 553,306 | | |
| United Kingdom Treasury Bond, 4.75%, 6/7/10 | | GBP | 295,000 | | | | 608,816 | | |
| United Kingdom Treasury Bond, 4.75%, 3/7/20 | | GBP | 285,000 | | | | 585,264 | | |
Total United Kingdom
(identified cost $1,630,021) | | | | | | $ | 1,747,386 | | |
See notes to financial statements
13
International Income Portfolio as of October 31, 2007
PORTFOLIO OF INVESTMENTS CONT'D
| Security | | Principal | | U.S. $ Value | |
| United States — 29.2% | |
| Collateralized Mortgage Obligations — 5.4% | |
Federal National Mortgage Association,
Series 1991-139, Class PN, 7.50%, 10/25/21—
(identified cost, $1,261,401) | | $ | 1,206,999 | | | $ | 1,273,156 | | |
| Government National Mortgage Association — 23.8% | |
| 8.00% with maturity at 2016 | | | 2,762,316 | | | | 2,930,834 | | |
| 9.00% with various maturities to 2024 | | | 2,399,675 | | | | 2,674,300 | | |
| | | $ | 5,605,134 | | |
Total Government National
Mortgage Association
(identified cost, $5,519,195) | | | | | | $ | 5,605,134 | | |
Total United States
(identified cost $6,780,596) | | | | | | $ | 6,878,290 | | |
Total Bonds & Notes
(identified cost $20,828,289) | | | | | | $ | 22,017,544 | | |
| Call Options Purchased — 1.4% | |
| Security | | Contracts
(000's omitted) | | Value | |
Japanese Yen Call Option, Expires 7/1/2008,
Strike Price 117.95 | | | 660,520 | | | $ | 315,180 | | |
South Korean Won Call Option, Expires 7/28/2009,
Strike Price 905.2 | | | 452,600 | | | | 14,542 | | |
Total Call Options Purchased
(identified cost $161,787) | | | | | | $ | 329,722 | | |
| Put Options Purchased — 0.0% | |
| Security | | Contracts
(000's omitted) | | Value | |
South Korean Won Put Option, Expires 7/28/2009,
Strike Price 905.2 | | | 452,600 | | | $ | 9,355 | | |
Total Put Options Purchased
(identified cost $10,825) | | | | | | $ | 9,355 | | |
| Short-Term Investments — 3.1% | |
| Description | | Interest
(000's omitted) | | Value | |
| Investment in Cash Management Portfolio, 4.83%(1) | | | 720 | | | $ | 719,773 | | |
Total Short-Term Investments
(identified cost $719,773) | | | | $ | 719,773 | | |
Total Investments — 97.9%
(identified cost $21,720,674) | | | | $ | 23,076,394 | | |
| Other Assets, Less Liabilities — 2.1% | | | | $ | 503,437 | | |
| Net Assets — 100.0% | | | | $ | 23,579,831 | | |
AUD - Australian Dollar
BRL - Brazilian Real
CAD - Canadian Dollar
DKK - Danish Krone
EGP - Egyptian Pound
EUR - Euro
GBP - British Pound Sterling
NGN - Nigerian Naira
SEK - Swedish Krona
(1) Affiliated investment company available to Eaton Vance portfolios and funds which invests in high quality U.S. dollar denominated money market instruments. The rate shown is the annualized seven-day yield as of October 31, 2007.
See notes to financial statements
14
International Income Portfolio as of October 31, 2007
FINANCIAL STATEMENTS
Statement of Assets and Liabilities
As of October 31, 2007
| Assets | |
| Unaffiliated investments, at value (identified cost, $21,000,901) | | $ | 22,356,621 | | |
| Affiliated investment, at value (identified cost, $719,773) | | | 719,773 | | |
| Foreign currency, at value (identified cost, $49,617) | | | 50,451 | | |
| Interest receivable | | | 344,530 | | |
| Interest receivable from affiliated investments | | | 2,446 | | |
| Receivable for open swap contracts | | | 13,748 | | |
| Receivable for open forward foreign currency contracts | | | 130,381 | | |
| Receivable for closed forward foreign currency contracts | | | 77,924 | | |
| Total assets | | $ | 23,695,874 | | |
| Liabilities | |
| Payable to affiliate for investment advisory fees | | $ | 11,619 | | |
| Payable for open swap contracts | | | 11,804 | | |
| Payable for open forward foreign currency contracts | | | 30,001 | | |
| Payable for closed forward foreign currency contracts | | | 3,682 | | |
| Accrued expenses and other liabilities | | | 58,937 | | |
| Total liabilities | | $ | 116,043 | | |
| Net Assets applicable to investors' interest in Portfolio | | $ | 23,579,831 | | |
| Sources of Net Assets | |
| Net proceeds from capital contributions and withdrawals | | $ | 22,101,005 | | |
| Net unrealized appreciation | | | 1,478,826 | | |
| Total | | $ | 23,579,831 | | |
Statement of Operations
For the Period Ended
October 31, 2007(1)
| Investment Income | |
| Interest (net of foreign taxes, $1,596) | | $ | 339,752 | | |
| Interest income allocated from affiliated investment | | | 33,853 | | |
| Expenses allocated from affliated investment | | | (4,158 | ) | |
| Total investment income | | $ | 369,447 | | |
| Expenses | |
| Investment adviser fee | | $ | 41,375 | | |
| Legal and accounting services | | | 43,840 | | |
| Custodian fee | | | 9,031 | | |
| Miscellaneous | | | 595 | | |
| Total expenses | | $ | 94,841 | | |
| Net investment income | | $ | 274,606 | | |
| Realized and Unrealized Gain (Loss) | |
Net realized gain (loss) —
Investment transactions | | $ | (20,653 | ) | |
| Swap contracts | | | 11,438 | | |
Foreign currency and forward foreign currency exchange
contract transactions | | | 365,900 | | |
| Net realized gain | | $ | 356,685 | | |
Change in unrealized appreciation (depreciation) —
Investments | | $ | 1,355,720 | | |
| Swap contracts | | | 1,944 | | |
| Foreign currency and forward foreign currency exchange contracts | | | 121,162 | | |
| Net change in unrealized appreciation (depreciation) | | $ | 1,478,826 | | |
| Net realized and unrealized gain | | $ | 1,835,511 | | |
| Net increase in net assets from operations | | $ | 2,110,117 | | |
(1) For the period from the start of business, June 27, 2007 to October 31, 2007.
See notes to financial statements
15
International Income Portfolio as of October 31, 2007
FINANCIAL STATEMENTS CONT'D
Statement of Changes in Net Assets
Increase (Decrease)
in Net Assets | | Period Ended
October 31, 2007(1) | |
From operations —
Net investment income | | $ | 274,606 | | |
Net realized gain from investment transactions,
swap contracts and foreign currency transactions and
forward foreign currency exchange contract transactions | | | 356,685 | | |
Net change in unrealized appreciation (depreciation) from
investments, swap contracts and foreign currency and
forward foreign currency exchange contracts | | | 1,478,826 | | |
| Net increase in net assets from operations | | $ | 2,110,117 | | |
Capital transactions —
Contributions | | $ | 24,936,962 | | |
| Withdrawals | | | (3,467,248 | ) | |
| Net increase in net assets from capital transactions | | $ | 21,469,714 | | |
| Net increase in net assets | | $ | 23,579,831 | | |
| Net Assets | |
| At beginning of period | | $ | — | | |
| At end of period | | $ | 23,579,831 | | |
(1) For the period from the start of business, June 27, 2007 to October 31, 2007.
See notes to financial statements
16
International Income Portfolio as of October 31, 2007
FINANCIAL STATEMENTS CONT'D
Supplementary Data
| | | Period Ended October 31, | |
| | | 2007(1) | |
| Ratios/Supplemental Data | |
| Ratios (As a percentage of average daily net assets): | |
| Expenses before custodian fee reduction | | | 1.35 | %(2) | |
| Expenses after custodian fee reduction | | | 1.35 | %(2) | |
| Net investment income | | | 3.75 | %(2) | |
| Portfolio Turnover | | | 2 | % | |
| Total Return | | | 10.05 | %(3) | |
| Net assets, end of period (000's omitted) | | $ | 23,580 | | |
(1) For the period from the start of business, June 27, 2007 to October 31, 2007.
(2) Annualized.
(3) Not annualized.
See notes to financial statements
17
International Income Portfolio as of October 31, 2007
NOTES TO FINANCIAL STATEMENTS
1 Significant Accounting Policies
International Income Portfolio (the Portfolio) is a New York trust, registered under the Investment Company Act of 1940, as amended (the 1940 Act), as a non-diversified open-end management investment company. The Portfolio's investment objective is to provide a high level of income and total return by investing in a global portfolio consisting primarily of high grade debt securities. The Declaration of Trust permits the Trustees to issue interests in the Portfolio. At October 31, 2007, Eaton Vance International Income Fund, Eaton Vance Medallion Strategic Income, and Eaton Vance Strategic Income Fund held an approximate 0.80%, 14.40%, and 84.3% interest, respectively, in the Portfolio.
The following is a summary of significant accounting policies of the Portfolio. The policies are in conformity with accounting principles generally accepted in the United States of America.
A Investment Valuation — Most seasoned fixed rate 30 years mortgage-backed securities (MBS) are valued by the investment adviser's matrix pricing system. The matrix pricing system also considers various factors relating to bonds and market transactions to determine market value. Debt securities, including those issued by foreign entities, certain MBS, and collateralized mortgage obligations, will normally be valued on the basis of market valuations furnished by pricing services. The pricing services consider various factors relating to bonds or loans and/or market transactions to determine market value. Equity securities that are listed on foreign or U.S. securities exchanges are valued at closing sale prices on the exchange where such securities are principally traded. E quity securities listed in the NASDAQ Global or Global Select Market are valued at the NASDAQ official closing price. Unlisted or listed securities for which closing sale prices are not available are valued at the mean between the latest wholesale bid and ask prices. Financial futures contracts and options thereon listed on commodity exchanges and exchange-traded options are valued at closing settlement prices. The value of interest rate swaps are generally based upon a dealer quotation. Credit default swaps are valued by a broker dealer (usually the counterparty to the agreement). Short-term debt securities and money-market securities (of U.S. issuers) purchased with a remaining maturing of sixty days or less are valued at amortized cost, which approximates market value. If short-term debt securities are acquired with a remaining maturity of more than sixty days, they will be valued by a pricing service. Other fixed income and debt securities including listed securities and securities for which price quotat ions are available will normally be valued on the basis of valuation furnished by a pricing service. Foreign securities and currencies are valued in U.S. dollars, based on foreign currency exchange rate quotations supplied by an independent quotation service. The daily valuation of exchange-traded foreign securities generally is determined as of the close of trading on the principal exchange on which such securities trade. Events occurring after the close of trading on foreign exchanges may result in adjustments to the valuation of foreign securities to more accurately reflect their fair value as of the close of regular trading on the New York Stock Exchange. When valuing foreign equity securities that meet certain criteria, the Trustees have approved the use of a fair value service that values such securities to reflect market trading that occurs after the close of the applicable foreign markets of comparable securities or other instrum ents that have a strong correlation to the fair-valued securities. Investments for which valuations or market quotations are not readily available are valued at fair value using methods determined in good faith by or at the direction of the Trustees of the Portfolio considering relevant factors, data and information including the market value of freely tradable securities of the same class in the principal market on which such securities are normally traded.
The Portfolio may invest in Cash Management Portfolio (Cash Management), an affiliated investment company managed by Boston Management and Research (BMR), a subsidiary of Eaton Vance Management (EVM). Cash Management values its investment securities utilizing the amortized cost valuation technique permitted by Rule 2a-7 of the 1940 Act. This technique involves initially valuing a portfolio security at its cost and thereafter assuming a constant amortization to maturity of any discount or premium.
B Investment Transactions — Investment transactions for financial statement purposes are accounted for on a trade date basis. Realized gains and losses on securities sold are determined on the basis of identified cost.
C Income — Interest income is recorded on the basis of interest accrued, adjusted for amortization of premium or accretion of discount. Dividend income is recorded on the ex-dividend date for dividends received in cash and/or securities. However, if the ex-dividend date has passed, certain dividends from foreign securities are recorded as the Portfolio is informed of the ex-dividend date. Withholding taxes on foreign dividends and capital gains have been provided for in accordance with the Portfolio's understanding of the applicable countries tax rules and rates.
D Federal Taxes — The Portfolio has elected to be treated as a partnership for federal tax purposes. No provision is made by the Portfolio for federal or state taxes on any taxable income of the Portfolio because each investor in the Portfolio is ultimately responsible for the
18
International Income Portfolio as of October 31, 2007
NOTES TO FINANCIAL STATEMENTS CONT'D
payment of any taxes on its share of taxable income. Since at least one of the Portfolio's investors is a regulated investment company that invests all or substantially all of its assets in the Portfolio, the Portfolio normally must satisfy the applicable source of income and diversification requirements (under the Internal Revenue Code) in order for its investors to satisfy them. The Portfolio will allocate, at least annually among its investors, each investor's distributive share of the Portfolio's net investment income, net realized capital gains and any other items of income, gain, loss, deduction or credit.
In June 2006, the Financial Accounting Standards Board (FASB) issued FASB Interpretation No. 48 (FIN 48), "Accounting for Uncertainty in Income Taxes – an interpretation of FASB Statement No. 109". FIN 48 clarifies the accounting for uncertainty in income taxes recognized in accordance with FASB Statement No. 109, "Accounting for Income Taxes". This interpretation prescribes a recognition threshold and measurement attribute for the financial statement recognition and measurement of a tax position taken or expected to be taken in a tax return. It also provides guidance on de-recognition, classification, interest and penalties, accounting in interim periods, disclosure and transition. FIN 48 is effective on the last business day of the first required financial reporting period for fiscal years beginning after December 15, 2006. Management has concluded that as of October 31, 2007, there are no uncertain tax positions that wou ld require financial statement recognition, derecognition, or disclosure.
E Expense Reduction — State Street Bank and Trust Company (SSBT) serves as custodian of the Portfolio. Pursuant to the custodian agreement, SSBT receives a fee reduced by credits, which are determined based on the average daily cash balance the Portfolio maintains with SSBT. All credit balances, if any, used to reduce the Portfolio's custodian fees are reported as a reduction of expenses in the Statement of Operations.
F Foreign Currency Translation — Investment valuations, other assets, and liabilities initially expressed in foreign currencies are translated each business day into U.S. dollars based upon current exchange rates. Purchases and sales of foreign investment securities and income and expenses denominated in foreign currencies are translated into U.S. dollars based upon currency exchange rates in effect on the respective dates of such transactions. Recognized gains or losses on investment transactions attributable to changes in foreign currency exchange rates are recorded for financial statement purposes as net realized gains and losses on investments. That portion of unrealized gains and losses on investments that results from fluctuations in foreign currency exchange rates is not separately disclosed.
G Use of Estimates — The preparation of the financial statements in conformity with accounting principles generally accepted in the United States of America requires management to make estimates and assumptions that affect the reported amounts of assets and liabilities at the date of the financial statements and the reported amounts of income and expense during the reporting period. Actual results could differ from those estimates.
H Indemnifications — Under the Portfolio's organizational documents, its officers and Trustees may be indemnified against certain liabilities and expenses arising out of the performance of their duties to the Portfolio. Interestholders in the Portfolio are jointly and severally liable for the liabilities and obligations of the Portfolio in the event that the Portfolio fails to satisfy such liabilities and obligations; provided, however, that, to the extent assets are available in the Portfolio, the Portfolio may, under certain circumstances, indemnify interestholders from and against any claim or liability to which such holder may become subject by reason of being or having been an interestholder in the Portfolio. Additionally, in the normal course of business, the Portfo lio enters into agreements with service providers that may contain indemnification clauses. The Portfolio's maximum exposure under these arrangements is unknown as this would involve future claims that may be made against the Portfolio that have not yet occurred.
I Financial Futures Contracts — The Portfolio may enter into financial futures contracts. The Portfolio's investment in financial futures contracts is designed for hedging against changes in interest rates or as a substitute for the purchase of securities. Upon entering into a financial futures contract, the Portfolio is required to deposit with the broker, either in cash or securities an amount equal to a certain percentage of the purchase price (initial margin). Subsequent payments, known as variation margin, are made or received by the Portfolio each business day, depending on the daily fluctuations in the value of the underlying security, and are recorded as unrealized gains or losses by the Portfolio. Gains (losses) are realized upon the expiration or closing of the financial futures contracts. Should market conditions change unexpectedly, the Portfolio may not achieve the anticipated benefits of the financial futures contracts and may realize a loss. In entering such contracts, the Portfolio bears the risk if the counterparties do not perform under the contracts' terms.
J Purchased Options — Upon the purchase of a call or put option, the premium paid by the Portfolio is
19
International Income Portfolio as of October 31, 2007
NOTES TO FINANCIAL STATEMENTS CONT'D
included in the Statement of Assets and Liabilities as an investment. The amount of the investment is subsequently marked-to-market to reflect the current market value of the option purchased, in accordance with the Portfolio's policies on investment valuations discussed above. If an option which the Portfolio has purchased expires on the stipulated expiration date, the Portfolio will realize a loss in the amount of the cost of the option. If the Portfolio enters into a closing sale transaction, the Portfolio will realize a gain or loss, depending on whether the sales proceeds from the closing sale transaction are greater or less than the cost of the option. If the Portfolio exercises a put option, it will realize a gain or loss from the sale of the underlying security, and the proceeds from such sale will be decreased by the premium originally paid. If the Portfolio exercises a call option, the cost of the security which the Po rtfolio purchases upon exercise will be increased by the premium originally paid.
K Written Options — Upon the writing of a call or a put option, an amount equal to the premium received by the Portfolio is included in the Statement of Assets and Liabilities as a liability. The amount of the liability is subsequently marked-to-market to reflect the current value of the option written in accordance with the Portfolio's policies on investment valuations discussed above. Premiums received from writing options which expire are treated as realized gains. Premiums received from writing options which are exercised or are closed are added to or offset against the proceeds or amount paid on the transaction to determine the realized gain or loss. If a put option is exercised, the premium reduces the cost basis of the securities purchased by the Portfolio. The Por tfolio, as writer of an option, may have no control over whether the underlying securities may be sold (call) or purchased (put) and, as a result, bears the market risk of an unfavorable change in the price of the securities underlying the written option.
L Forward Foreign Currency Exchange Contracts — The Portfolio may enter into forward foreign currency exchange contracts for the purchase or sale of a specific foreign currency at a fixed price on a future date. The Portfolio will enter into forward contracts for hedging purposes as well as non-hedging purposes. The forward foreign currency exchange contract is adjusted by the daily exchange rate of the underlying currency and any gains or losses are recorded for financial statement purposes as unrealized until such time as the contract has been closed by another contract with the same broker for the same settlement date and currency. Risks may arise upon entering these contracts from the potential inability of counterparties to meet the terms of their contracts and from movements in the value of a foreign currency relative to the U.S. dollar.
M Interest Rate Swaps — The Portfolio may enter into interest rate swap agreements to enhance return, to hedge against fluctuations in securities prices or interest rates, or as substitution for the purchase or sale of securities. Pursuant to these agreements, the Portfolio makes periodic payments at a fixed interest rate and, in exchange, receives payments based on the interest rate of a benchmark industry index. Payments received or made are recorded as realized gains or losses. During the term of the outstanding swap agreement, changes in the underlying value of the swap are recorded as unrealized gains or losses. The value of the swap is determined by changes in the relationship between two rates of interest. The Portfolio is exposed to credit loss in the event of non - -performance by the swap counterparty. Risk may also arise from movements in interest rates.
N Credit Default Swaps — The Portfolio may enter into credit default swaps to buy or sell protection against default on an individual issuer or a basket of issuers of bonds. When the Portfolio is the buyer of a credit default swap contract, the Portfolio is entitled to receive the par (or other agreed-upon) value of a referenced debt obligation (or basket of debt obligations) from the counterparty to the contract in the event of default by a third party, such as a U.S. or foreign corporate issuer, on the debt obligation. In return, the Portfolio would pays the counterparty a periodic stream of payments over the term of the contract provided that no event of default has occurred. If no default occurs, the Portfolio would have spent the stream of payments and received no be nefit from the contract. When the Portfolio is the seller of a credit default swap contract, it receives the stream of payments, but is obligated to pay upon default of the referenced debt obligation. As the seller, the Portfolio would effectively add leverage to its portfolio because, in addition to its total net assets, the Portfolio would be subject to investment exposure on the notional amount of the swap. The interest fee paid or received on the swap contract, which is based on a specified interest rate on a fixed notional amount, is accrued daily as a component of unrealized appreciation (depreciation) and is recorded as realized gain upon receipt or realized loss upon payment. The Portfolio also records an increase or decrease to unrealized appreciation (depreciation) in an amount equal to the daily valuation. Up-front payment or receipts, if any, are recorded as other assets or other liabilities, respectively, and amortized over the life of the swap contract as realized gains or losses. The Portfolio segregates assets in the form of cash and cash equivalents in an amount equal to the aggregate market value of the credit default swap of which it is the seller, market to market on a daily basis. These transactions involve certain
20
International Income Portfolio as of October 31, 2007
NOTES TO FINANCIAL STATEMENTS CONT'D
risks, including the risk that the seller may be unable to fulfill the transaction.
O Total Return Swaps — The Portfolio may enter into total return swap agreements to enhance return, to hedge against fluctuations in securities prices or interest rates or as substitution for the purchase or sale of securities. In a total return swap, the Portfolio makes payments at a rate equal to a predetermined spread to the one or three-month LIBOR. In exchange, the Portfolio receives payments based on the rate of return of a benchmark industry index or basket of securities. During the term of the outstanding swap agreement, changes in the underlying value of the swap are recorded as unrealized gains and losses. Periodic payments received or made are recorded as realized gains or losses. The value of the swap is determined by changes in the relationship between the ra te of interest and the benchmark industry index or basket of securities. The Portfolio is exposed to credit loss in the event of nonperformance by the swap counterparty. However, the Portfolio does not anticipate nonperformance by the counterparty. Risk may also arise from the unanticipated movements in value of interest rates, securities, or the index.
2 Investment Adviser Fee and Other Transactions with Affiliates
The investment adviser fee is earned by BMR as compensation for management and investment advisory services rendered to the Portfolio. Under the investment advisory agreement, BMR receives a monthly fee of 0.625% annually of the average daily net assets of the Portfolio up to $1 billion, and at reduced rates as daily net assets exceed that level. The portion of the advisory fee payable by Cash Management on the Portfolio's investment of cash therein is credited against the Portfolio's advisory fee. For the period from the start of business, June 27, 2007 to October 31, 2007, the Portfolio's advisory fee totaled $45,358 of which $3,983 was allocated from Cash Management and $41,375 was paid or accrued directly by the Portfolio. BMR serves as administrator of the Portfolio but currently does not receive any fees.
Except for Trustees of the Portfolio who are not members of EVM's or BMR's organization, officers and Trustees receive remuneration for their services to the Portfolio out of such investment advisory fee. Trustees of the Portfolio that are not affiliated with the Investment Adviser may elect to defer receipt of all or a portion of their annual fees in accordance with the terms of the Trustees Deferred Compensation Plan. For the period from the start of business, June 27, 2007 to October 31, 2007, no significant amounts have been deferred. Certain officers and Trustees of the Portfolio are officers of the above organizations.
3 Purchases and Sales of Investments
The Portfolio invests primarily in foreign government and U.S. Government debt securities. The ability of the issuers of the debt securities to meet their obligations may be affected by economic developments in a specific industry or country. The Portfolio regularly invests in lower rated and comparable quality unrated high yield securities. These investments have different risks than investments in debt securities rated investment grade and held by the Portfolio. Risk of loss upon default by the borrower is significantly greater with respect to such debt securities than with other debt securities because these securities are generally unsecured and are more sensitive to adverse economic conditions, such as recession or increasing interest rates, than are investment grade issuers. Purchases and sales of investments, other than short-term obligations, and including paydowns on mortgage backed securities, for the period from the s tart of business, June 27, 2007 to October 31, 2007 were as follows:
| Purchases | |
| Investments (non-U.S. Government) | | $ | 12,580,689 | | |
| U.S. Government Securities | | | 8,786,321 | | |
| | | $ | 21,367,010 | | |
| Sales | |
| Investments (non-U.S. Government) | | $ | — | | |
| U.S. Government Securities | | | (351,966 | ) | |
| | | $ | (351,966 | ) | |
4 Federal Income Tax Basis of Unrealized Appreciation (Depreciation)
The cost and unrealized appreciation (depreciation) of investments of the Portfolio at October 31, 2007, as determined on a federal income tax basis, were as follows:
| Aggregate cost | | $ | 21,708,577 | | |
| Gross unrealized appreciation | | $ | 1,367,867 | | |
| Gross unrealized depreciation | | | (50 | ) | |
| Net unrealized appreciation | | $ | 1,367,817 | | |
The net unrealized appreciation on swaps, foreign currency and forward foreign currency contracts at October 31, 2007 on a federal income tax basis was $123,106.
21
International Income Portfolio as of October 31, 2007
NOTES TO FINANCIAL STATEMENTS CONT'D
5 Financial Instruments
The Portfolio may trade in financial instruments with off-balance sheet risk in the normal course of its investing activities to assist in managing exposure to various market risks. These financial instruments may include forward foreign currency exchange contracts, interest rate swaps, credit default swaps and financial futures contracts and may involve, to a varying degree, elements of risk in excess of the amounts recognized for financial statement purposes. The notional or contractual amounts of these instruments represent the investment the Portfolio has in particular classes of financial instruments and does not necessarily represent the amounts potentially subject to risk. The measurement of the risks associated with these instruments is meaningful only when all related and offsetting transactions are considered.
A summary of obligations under these financial instruments at October 31, 2007 is as follows:
Forward Foreign Currency Exchange Contracts
Sales
Settlement
Date(s) | | Deliver | | In Exchange For | | Net Unrealized
Depreciation | |
11/6/07
| | Canadian Dollar
584,894 | | United States Dollar
597,163 | | $ | (18,653 | ) | |
11/19/07
| | South African Rand
1,495,702 | | United States Dollar
219,038 | | | (9,079 | ) | |
| | | | | | | $ | (27,732 | ) | |
Purchases
Settlement
Date(s) | | In Exchange For | | Deliver | | Net Unrealized
Appreciation
(Depreciation) | |
12/4/07
| | Brazilian Real
1,065,000 | | United States Dollar
608,432 | | $ | 1,506 | | |
11/30/07
| | Egyptian Pound
1,243,958 | | United States Dollar
225,000 | | | 243 | | |
12/3/07
| | Egyptian Pound
1,243,350 | | United States Dollar
225,000 | | | 110 | | |
11/5/07
| | EURO
583,971 | | Polish Zloty
2,117,000 | | | 600 | | |
11/5/07
| | Indian Rupee
8,746,000 | | United States Dollar
219,418 | | | 2,961 | | |
11/13/07
| | Indian Rupee
8,520,000 | | United States Dollar
214,989 | | | 1,558 | | |
Settlement
Date(s) | | In Exchange For | | Deliver | | Net Unrealized
Appreciation
(Depreciation) | |
11/26/07
| | Indian Rupee
4,268,000 | | United States Dollar
107,969 | | $ | 438 | | |
12/3/07
| | Indian Rupee
11,425,000 | | United States Dollar
288,729 | | | 1,367 | | |
11/13/07
| | Indonesian Rupiah
2,015,000,000 | | United States Dollar
221,113 | | | 203 | | |
11/19/07
| | Indonesian Rupiah
1,929,515,000 | | United States Dollar
212,058 | | | (228 | ) | |
11/26/07
| | Indonesian Rupiah
5,350,000,000 | | United States Dollar
582,345 | | | 4,687 | | |
11/19/07
| | Japanese Yen
246,500,000 | | United States Dollar
2,123,151 | | | 19,200 | | |
11/9/07
| | Malaysian Ringgit
4,000,000 | | United States Dollar
1,176,471 | | | 23,169 | | |
11/13/07
| | Malaysian Ringgit
902,000 | | United States Dollar
266,903 | | | 3,647 | | |
11/26/07
| | Malaysian Ringgit
1,216,000 | | United States Dollar
361,421 | | | 3,446 | | |
11/20/07
| | New Mexican Peso
3,000,000 | | United States Dollar
276,885 | | | 3,026 | | |
11/26/07
| | New Mexican Peso
1,059,179 | | United States Dollar
97,733 | | | 1,057 | | |
11/23/07
| | Philippine Peso
11,610,000 | | United States Dollar
263,594 | | | 1,998 | | |
11/30/07
| | Philippine Peso
35,300,000 | | United States Dollar
809,225 | | | (2,041 | ) | |
11/5/07
| | Polish Zloty
2,117,000 | | EURO
561,516 | | | 31,888 | | |
11/8/07
| | Polish Zloty
3,353,130 | | EURO
916,431 | | | 11,302 | | |
11/26/07
| | Polish Zloty
346,000 | | EURO
95,019 | | | 458 | | |
11/9/07
| | Turkish Lira
233,050 | | United States Dollar
195,037 | | | 3,420 | | |
11/19/07
| | Turkish Lira
493,050 | | United States Dollar
404,404 | | | 14,096 | | |
| | | | | | | $ | 128,112 | | |
At October 31, 2007, closed forward foreign currency purchases and sales excluded above amounted to a receivable of $77,924 and a payable of $3,682.
Credit Default Swaps
The Portfolio has entered into credit default swaps whereby the Portfolio is buying exposure against default exposing the
22
International Income Portfolio as of October 31, 2007
NOTES TO FINANCIAL STATEMENTS CONT'D
Portfolio to risks associated with changes in credit spreads of the underlying instruments.
| Counterparty | | Reference
Entity | | Buy/
Sell
Protection | | Notional
Amount
(000s
omitted) | | Pay/
Receive
Annual
Fixed
Rate | | Termination
Date | | Net
Unrealized
Appreciation
(Depreciation) | |
Lehman
Brothers, Inc. Turkey | | (Republic of) | | Buy | | $ | 843 | | | | 1.45 | % | | 7/20/12 | | $ | 3,239 | | |
Lehman
Brothers, Inc. | | CDX.EM.8* | | Buy | | | 1,100 | | | | 1.75 | | | 12/20/12 | | | (11,633 | ) | |
| JP Morgan | | Greece | | Buy | | | 4,000 | | | | 0.13 | | | 9/20/17 | | | 10,509 | | |
| | | | | | | | | | | | | | | | | $ | 2,115 | | |
* CDX.EM. 8 Index is composed of issues from (i) Latin America; (ii) Eastern Europe, the Middle East and Africa; and (iii) Asia as determined by Market Partners.
Interest Rate Swaps
Counterparty | | Notional
Amount
(000s
omitted) | | Annual
Fixed Rate
Paid By Fund | | Floating
Rate
Paid To Fund | | Termination
Date | | Unrealized
Appreciation
(Depreciation) | |
J.P. Morgan
Chase, N.A. | |
BRL 1,207 | |
11.34% | | Brazilian Interbank
Deposit Rate | | January 2, 2009 | | $ | (171 | ) | |
At October 31, 2007 the Portfolio had sufficient cash and/or securities to cover commitments under these contracts.
6 Line of Credit
The Portfolio participates with other portfolios and funds managed by EVM and its affiliates in a $200 million unsecured line of credit agreement with a group of banks. Borrowings are be made by the Portfolio solely to facilitate the handling of unusual and/or unanticipated short-term cash requirements. Interest is charged to the Portfolio based on its borrowings at an amount above either the Eurodollar rate or Federal Funds rate. In addition, a fee computed at an annual rate of 0.07% on the daily unused portion of the line of credit is allocated among the participating portfolios and funds at the end of each quarter. The Portfolio did not have any significant borrowings or allocated fees for the period from the start of business, June 27, 2007 to October 31, 2007.
7 Risks Associated with Foreign Investments
Investing in securities issued by companies whose principal business activities are outside the United States may involve significant risks not present in domestic investments. For example, there is generally less publicly available information about foreign companies, particularly those not subject to the disclosure and reporting requirements of the U.S. securities laws. Certain foreign issuers are generally not bound by uniform accounting, auditing, and financial reporting requirements and standards of practice comparable to those applicable to domestic issuers. Investments in foreign securities also involve the risk of possible adverse changes in investment or exchange control regulations, expropriation or confiscatory taxation, limitation on the removal of funds or other assets of the Portfolio, political or financial instability or diplomatic and other developments which could affect such investments. Foreign stock markets, while growing in volume and sophistication, are generally not as developed as those in the United States, and securities of some foreign issuers (particularly those located in developing countries) may be less liquid and more volatile than securities of comparable U.S. companies. In general, there is less overall governmental supervision and regulation of foreign securities markets, broker-dealers and issuers than in the United States.
8 Recently Issued Accounting Pronouncements
In September 2006, the FASB issued Statement of Financial Accounting Standards No. 157 (FAS 157), "Fair Value Measurements". FAS 157 defines fair value, establishes a framework for measuring fair value in accordance with generally accepted accounting principles and expands disclosure about fair value measurements. FAS 157 is effective for fiscal years beginning after November 15, 2007. Management is currently evaluating the impact the adoption of FAS 157 will have on the Portfolio's financial statement disclosures.
23
International Income Portfolio as of October 31, 2007
REPORT OF INDEPENDENT REGISTERED PUBLIC ACCOUNTING FIRM
To the Trustees and Investors
of International Income Portfolio:
We have audited the accompanying statement of assets and liabilities of International Income Portfolio (the "Portfolio"), including the portfolio of investments, as of October 31, 2007, and the related statement of operations, the statement of changes in net assets, and the supplementary data for the period from the start of business June 27, 2007, to October 31, 2007. These financial statements and supplementary data are the responsibility of the Portfolio's management. Our responsibility is to express an opinion on these financial statements and supplementary data based on our audit.
We conducted our audit in accordance with standards of the Public Company Accounting Oversight Board (United States). Those standards require that we plan and perform the audit to obtain reasonable assurance about whether the financial statements and supplementary data are free of material misstatement. The Portfolio is not required to have, nor were we engaged to perform, an audit of its internal control over financial reporting. Our audit included consideration of internal control over financial reporting as a basis for designing audit procedures that are appropriate in the circumstances, but not for the purpose of expressing an opinion on the effectiveness of the Portfolio's internal control over financial reporting. Accordingly, we express no such opinion. An audit also includes examining, on a test basis, evidence supporting the amounts and disclosures in the financial statements, assessing the accounting principles used an d significant estimates made by management, as well as evaluating the overall financial statement presentation. Our procedures included confirmation of securities owned as of October 31, 2007, by correspondence with the custodian and brokers; where replies were not received from brokers, we performed other auditing procedures. We believe that our audit provides a reasonable basis for our opinion.
In our opinion, the financial statements and supplementary data referred to above present fairly, in all material respects, the financial position of International Income Portfolio as of October 31, 2007, the results of its operations, the changes in its net assets, and the supplementary data for the period from the start of business June 27, 2007, to October 31, 2007, in conformity with accounting principles generally accepted in the United States of America.
DELOITTE & TOUCHE LLP
Boston, Massachusetts
December 17, 2007
24
Eaton Vance International Income Fund
BOARD OF TRUSTEES' APPROVAL OF THE INVESTMENT ADVISORY AGREEMENTS
Overview of the Contract Review Process
The Investment Company Act of 1940, as amended (the "1940 Act"), provides, in substance, that for a fund to enter into an investment advisory agreement with an investment adviser, the fund's board of trustees, including a majority of the trustees who are not "interested persons" of the fund ("Independent Trustees"), must approve the agreement and its terms at an in-person meeting called for the purpose of considering such approval.
At a meeting of the Boards of Trustees (each a "Board") of the Eaton Vance group of mutual funds (the "Eaton Vance Funds") held on March 12, 2007, the Board, including a majority of the Independent Trustees, voted to approve the investment advisory agreement of the International Income Fund (the "Fund") with Eaton Vance Management ("EVM"), as well as the investment advisory agreement of the International Income Portfolio (the "Portfolio"), the portfolio in which the Fund will invest substantially all of its assets, with Boston Management and Research ("BMR"), an affiliate of EVM (EVM, with respect to the Fund, and BMR, with respect to the Portfolio, are each referred to herein as the "Adviser"). The Board reviewed information furnished for the March 2007 meeting as well as information previously furnished with respect to the approval of other investment advisory agreements for other Eaton Vance Funds. Such information included, among other things, the following:
Information about Fees and Expenses
• The advisory and related fees to be paid by the Fund directly or indirectly through the Portfolio and the estimated expense ratio of the Fund;
• Comparative information concerning fees charged by the Adviser for managing other mutual funds and institutional accounts using investment strategies and techniques similar to those to be used in managing the Fund and the Portfolio, and concerning fees charged by other advisers for managing funds similar to the Fund and Portfolio;
Information about Portfolio Management
• Descriptions of the investment management services to be provided to the Fund and the Portfolio, including the investment strategies and processes to be employed;
• Information concerning the allocation of brokerage and the benefits expected to be received by the Adviser as a result of brokerage allocation, including information concerning the acquisition of research through "soft dollar" benefits received in connection with the Eaton Vance Funds' brokerage, and the implementation of the soft dollar reimbursement program established with respect to the Eaton Vance Funds;
• The procedures and processes to be used to determine the fair value of Fund and Portfolio assets and actions to be taken to monitor and test the effectiveness of such procedures and processes;
Information about the Adviser
• Reports detailing the financial results and condition of the Adviser;
• Descriptions of the qualifications, education and experience of the individual investment professionals whose responsibilities include portfolio management and investment research for the Fund and the Portfolio, and information relating to their compensation and responsibilities with respect to managing other mutual funds and investment accounts;
• Copies of the Codes of Ethics of the Adviser and its affiliates, together with information relating to compliance with and the administration of such codes;
• Information concerning the resources devoted to compliance efforts undertaken by the Adviser and its affiliates on behalf of the Eaton Vance Funds (including descriptions of various compliance programs) and their record of compliance with investment policies and restrictions, including policies with respect to market-timing, late trading and selective portfolio disclosure, and with policies on personal securities transactions;
• Descriptions of the business continuity and disaster recovery plans of the Adviser and its affiliates;
Other Relevant Information
• Information concerning the nature, cost and character of the administrative and other non-investment management services to be provided by Eaton Vance Management and its affiliates;
• Information concerning management of the relationship with the custodian, subcustodians and fund accountants by the Adviser or the administrator; and
• The terms of the advisory agreement for the Fund and for the Portfolio.
25
Eaton Vance International Income Fund
BOARD OF TRUSTEES' APPROVAL OF THE INVESTMENT ADVISORY AGREEMENTS CONT'D
Results of the Process
Based on its consideration of the foregoing, and such other information as it deemed relevant, including the factors and conclusions described below, the Board concluded that the investment advisory agreement of the Fund with EVM, as well as the terms of the investment advisory agreement of the Portfolio with BMR, including the fee structure of each agreement, is in the interests of shareholders and, therefore, the Board, including a majority of the Independent Trustees, voted to approve the investment advisory agreements for the Fund and the Portfolio.
Nature, Extent and Quality of Services
In considering whether to approve the investment advisory agreements of the Fund and the Portfolio, the Board evaluated the nature, extent and quality of services to be provided to the Fund by EVM and the Portfolio by BMR. The Board considered EVM's and BMR's management capabilities and investment process with respect to the types of investments to be held by the Fund and the Portfolio, including the education, experience and number of its investment professionals and other personnel who provide portfolio management, investment research, and similar services to the Portfolio and the Fund. The Board specifically noted EVM's and BMR's expertise with respect to global markets and in-house research capabilities. The Board also took into account the resources dedicated to portfolio management and other services, including the compensation paid to recruit and retain investment personnel, and the time and attention devoted to each fund in the complex by senior management.
The Board noted that under the terms of the investment advisory agreement of the Fund, EVM may invest assets of the Fund directly in securities, for which it may receive a fee, or in the Portfolio, for which it receives no separate fee but for which BMR receives an advisory fee from the Portfolio. The Trustees considered the potential benefits to the Fund of the ability to make direct investments, such as an improved ability to: manage the Fund's duration, or other general market exposures, using certain derivatives; add exposure to specific market sectors or asset classes without changing the Portfolio's investments, which would affect any other fund investing in the Portfolio; hedge some of the general market risks of the Portfolio while retaining the value added by the individual manager; and hedge a portion of the exposures of the Portfolio while retaining others (e.g., hedging the U.S. government exposure of the Portfolio w hile retaining its exposure to high-grade corporate bonds).
The Board reviewed the compliance programs of the Adviser and relevant affiliates thereof. Among other matters, the Board considered compliance and reporting matters relating to personal trading by investment personnel, selective disclosure of portfolio holdings, late trading, frequent trading, portfolio valuation, business continuity and the allocation of investment opportunities. The Board also evaluated the responses of the Adviser and its affiliates to requests from regulatory authorities such as the Securities and Exchange Commission and the National Association of Securities Dealers.
The Board considered shareholder and other administrative services provided or managed by EVM and its affiliates, including transfer agency and accounting services. The Board evaluated the benefits to shareholders of investing in a fund that is a part of a large family of funds, including the ability, in many cases, to exchange an investment among different funds without incurring additional sales charges.
After consideration of the foregoing factors, among others, the Board concluded that the nature, extent and quality of services provided by the Adviser, taken as a whole, are appropriate and consistent with the terms of the investment advisory agreements.
Management Fees and Expenses
The Board reviewed contractual investment advisory fee rates to be paid by the Fund directly or indirectly through its pro rata share of the expenses of the Portfolio (referred to as "management fees"). As part of its review, the Board considered the Fund's management fees and estimated expense ratio for a one-year period.
After reviewing the foregoing information, and in light of the nature, extent and quality of the services provided by the Adviser, the Board concluded that the management fees proposed to be charged for advisory and related services and the Fund's total expense ratio are reasonable.
Economies of Scale
In reviewing management fees and profitability, the Board also considered the extent to which the Adviser and its affiliates, on the one hand, and the Fund and the Portfolio, on the other hand, can expect to realize benefits from economies of scale as the assets of the Fund and the Portfolios increase. The Board noted the structure of the advisory fee, which includes breakpoints at several asset levels both at the Fund and at the Portfolio level. Based upon the foregoing, the Board concluded that the Adviser and its affiliates and the Fund and the Portfolio can be expected to share such benefits equitably.
26
Eaton Vance International Income Fund
MANAGEMENT AND ORGANIZATION
Fund Management. The Trustees of Eaton Vance Mutual Funds Trust (the Trust) and International Income Portfolio (the Portfolio) are responsible for the overall management and supervision of the Trust's and Portfolio's affairs. The Trustees and officers of the Trust and the Portfolio are listed below. Except as indicated, each individual has held the office shown or other offices in the same company for the last five years. Trustees and officers of the Trust and the Portfolio hold indefinite terms of office. The "noninterested Trustees" consist of those Trustees who are not "interested persons" of the Trust and the Portfolio, as that term is defined under the 1940 Act. The business address of each Trustee and officer is The Eaton Vance Building, 255 State Street, Boston, Massachusetts 02109. As used below, "EVC" refers to Eaton Vance Corp., "EV" refers to Eato n Vance, Inc., "EVM" refers to Eaton Vance Management, "BMR" refers to Boston Management and Research "Parametric" refers to Parametric Portfolio Associates and "EVD" refers to Eaton Vance Distributors, Inc. EVC and EV are the corporate parent and trustee, respectively, of EVM and BMR. EVD is the Fund's principal underwriter, the Portfolio's placement agent and a wholly-owned subsidiary of EVM. Each officer affiliated with Eaton Vance may hold a position with other Eaton Vance affiliates that is comparable to his or her position with EVM listed below.
Name and
Date of Birth | | Position(s)
with the
Trust and
the Portfolio | | Term of
Office and
Length of
Service | | Principal Occupation(s)
During Past Five Years | | Number of Portfolios
in Fund Complex
Overseen By
Trustee(1) | | Other Directorships Held | |
| Interested Trustee | | | | | | | | | | | | | |
|
Thomas E. Faust Jr.
5/31/58 | | Trustee and President of the Trust | | Trustee since 2007 and President of the Trust since 2002 | | Chairman, Chief Executive Officer and President of EVC, President of EV, Chief Executive Officer and President of EVM and BMR, and Director of EVD. Trustee and/or Officer of 176 registered investment companies and 5 private investment companies in the Eaton Vance Fund Complex. Mr. Faust is an interested person because of his positions with EVM, BMR, EVC and EV which are affiliates of the Trust and Portfolio | | | 176 | | | Director of EVC | |
|
| Noninterested Trustee(s) | | | | | | | | | | | | | |
|
| Benjamin C. Esty 1/2/63 | | Trustee | | Trustee of the Trust since 2005 and of the Portfolio since 2007 | | Roy and Elizabeth Simmons Professor of Business Administration, Harvard University Graduate School of Business Administration (since 2003). Formerly, Associate Professor, Harvard University Graduate School of Business Administration (2000-2003). | | | 176 | | | None | |
|
| Allen R. Freedman 4/3/40 | | Trustee | | Since 2007 | | Former Chairman and Chief Executive Officer of Assurant, Inc. (insurance provider) (1978-2000). Formerly, a Director of Loring Ward International (fund distributor) (2005-2007). | | | 175 | | | Director of Assurant, Inc. and Stonemor Partners L.P. (owner and operator of cemeteries) | |
|
| William H. Park 9/19/47 | | Trustee | | Trustee of the Trust since 2003 and of the Portfolio since 2007 | | Vice Chairman, Commercial Industrial Finance Corp. (specialty finance company) (since 2006). Formerly, President and Chief Executive Officer, Prizm Capital Management, LLC (investment management firm) (2002-2005). | | | 176 | | | None | |
|
| Ronald A. Pearlman 7/10/40 | | Trustee | | Trustee of the Trust since 2003 and of the Portfolio since 2007 | | Professor of Law, Georgetown University Law Center. | | | 176 | | | None | |
|
| Norton H. Reamer 9/21/35 | | Trustee | | Trustee of the Trust since 1986 and of the Portfolio since 2007 | | President, Chief Executive Officer and a Director of Asset Management Finance Corp. (a specialty finance company serving the investment management industry) (since October 2003). President, Unicorn Corporation (an investment and financial advisory services company) (since September 2000). Formerly, Chairman and Chief Operating Officer, Hellman, Jordan Management Co., Inc. (an investment management company) (2000-2003). Formerly, Advisory Director of Berkshire Capital Corporation (investment banking firm) (2002-2003). | | | 176 | | | None | |
|
27
Eaton Vance International Income Fund
MANAGEMENT AND ORGANIZATION CONT'D
Name and
Date of Birth | | Position(s)
with the
Trust and
the Portfolio | | Term of
Office and
Length of
Service | | Principal Occupation(s)
During Past Five Years | | Number of Portfolios
in Fund Complex
Overseen By
Trustee(1) | | Other Directorships Held | |
| Noninterested Trustee(s) (continued) | | | | | | | | | | | | | |
|
| Heidi L. Steiger 7/8/53 | | Trustee | | Since 2007 | | President, Lowenhaupt Global Advisors, LLC (global wealth management firm) (since 2005); Formerly, President and Contributing Editor, Worth Magazine (2004); Formerly, Executive Vice President and Global Head of Private Asset Management (and various other positions), Neuberger Berman (investment firm) (1986-2004). | | | 173 | | | Director of Nuclear Electric Insurance Ltd. (nuclear insurance provider) and Aviva USA (insurance provider) | |
|
| Lynn A. Stout 9/14/57 | | Trustee | | Trustee of the Trust since 1998 and of the Portfolio since 2007 | | Paul Hastings Professor of Corporate and Securities Law, University of California at Los Angeles School of Law. | | | 176 | | | None | |
|
| Ralph F. Verni 1/26/43 | | Chairman of
the Board
and Trustee | | Chairman of the Board and Trustee of the Portfolio since 2007; Trustee of the Trust since 2005 | | Consultant and private investor. | | | 176 | | | None | |
|
| Principal Officers who are not Trustees | | | | | | | | | | | | | |
|
Name and
Date of Birth | | Position(s)
with the
Trust and
the Portfolio | | Term of
Office and
Length of
Service | | Principal Occupation(s)
During Past Five Years | |
| William H. Ahern, Jr. 7/28/59 | | Vice President of the Trust | | Since 1995 | | Vice President of EVM and BMR. Officer of 74 registered investment companies managed by EVM or BMR. | |
|
| John R. Baur 2/10/70 | | Vice President of the Portfolio | | Since 2007 | | Vice President of EVM and BMR (since 2007) and employed as a Global Analyst of Eaton Vance since 2005. Officer of 4 registered investment companies managed by EVM or BMR. | |
|
| Michael A. Cirami 12/24/75 | | Vice President of the Portfolio | | Since 2007 | | Vice President of EVM and BMR (since 2005) and employed as a Global Analyst of Eaton Vance since 2003. Officer of 4 registered investment companies managed by EVM or BMR. | |
|
| Cynthia J. Clemson 3/2/63 | | Vice President of the Trust | | Since 2005 | | Vice President of EVM and BMR. Officer of 89 registered investment companies managed by EVM or BMR. | |
|
| Charles B. Gaffney 12/4/72 | | Vice President of the Trust | | Since 2007 | | Vice President of EVM and BMR. Previously, Sector Portfolio Manager and Senior Equity Analyst of Brown Brothers Harriman (1997-2003). Officer of 29 registered investment companies managed by EVM or BMR. | |
|
| Christine M. Johnston 11/9/72 | | Vice President | | Since 2007 | | Vice President of EVM and BMR. Officer of 34 registered investment companies managed by EVM or BMR. | |
|
| Aamer Khan 6/7/60 | | Vice President of the Trust | | Since 2005 | | Vice President of EVM and BMR. Officer of 32 registered investment companies managed by EVM or BMR. | |
|
| Thomas H. Luster 4/8/62 | | Vice President of the Trust | | Since 2006 | | Vice President of EVM and BMR. Officer of 48 registered investment companies managed by EVM or BMR. | |
|
| Michael R. Mach 7/15/47 | | Vice President of the Trust | | Since 1999 | | Vice President of EVM and BMR. Officer of 54 registered investment companies managed by EVM or BMR. | |
|
| Robert B. MacIntosh 1/22/57 | | Vice President of the Trust | | Since 1998 | | Vice President of EVM and BMR. Officer of 89 registered investment companies managed by EVM or BMR. | |
|
28
Eaton Vance International Income Fund
MANAGEMENT AND ORGANIZATION CONT'D
| Principal Officers who are not Trustees (continued) | |
|
Name and
Date of Birth | | Position(s)
with the
Trust and
the Portfolio | | Term of
Office and
Length of
Service | | Principal Occupation(s)
During Past Five Years | |
| Duncan W. Richardson 10/26/57 | | Vice President of the Trust | | Since 2001 | | Executive Vice President and Chief Equity Investment Officer of EVC, EVM and BMR. Officer 80 registered investment companies managed by EVM or BMR. | |
|
| Walter A. Row, III 7/20/57 | | Vice President of the Trust | | Since 2001 | | Director of Equity Research and a Vice President of EVM and BMR. Officer of 38 registered investment companies managed by EVM or BMR. | |
|
| Judith A. Saryan 8/21/54 | | Vice President of the Trust | | Since 2003 | | Vice President of EVM and BMR. Officer of 53 registered investment companies managed by EVM or BMR. | |
|
| Susan Schiff 3/13/61 | | Vice President | | Vice President of the Trust since 2002 and the Portfolio since 2007 | | Vice President of EVM and BMR. Officer of 35 registered investment companies managed by EVM or BMR. | |
|
| Thomas Seto 9/27/62 | | Vice President of the Trust | | Since 2007 | | Vice President and Director of Portfolio Management of Parametric. Officer of 30 registered investment companies managed by EVM or BMR. | |
|
| David M. Stein 5/4/51 | | Vice President of the Trust | | Since 2007 | | Managing Director and Chief Investment Officer of Parametric. Officer of 30 registered investment companies managed by EVM or BMR. | |
|
| Mark S. Venezia 5/23/49 | | Vice President of the Trust and President of the Portfolio | | Since 2007 | | Vice President of EVM and BMR. Officer of 35 registered investment companies managed by EVM or BMR. | |
|
| Adam A. Weigold 3/22/75 | | Vice President of the Trust | | Since 2007 | | Vice President of EVM and BMR. Officer of 70 registered investment companies managed by EVM or BMR. | |
|
| Barbara E. Campbell 6/19/57 | | Treasurer of the Trust | | Since 2005 | | Vice President of EVM and BMR. Officer of 176 registered investment companies managed by EVM or BMR. | |
|
| Maureen A. Gemma 5/24/60 | | Secretary | | Since 2007 | | Vice President and Deputy Chief Legal Officer of EVM and BMR. Officer of 176 registered investment companies managed by EVM or BMR. | |
|
| Dan A. Maalouly 3/25/62 | | Treasurer of the Portfolio | | Since 2007 | | Vice President of EVM and BMR. Previously Senior Manager at Pricewaterhouse Coopers LLP (1997-2005). Officer of 76 registered investment companies managed by EVM or BMR. | |
|
| Paul M. O'Neil 7/11/53 | | Chief Compliance Officer | | Chief Compliance Officer of the Trust since 2004 and of the Portfolio since 2007 | | Vice President of EVM and BMR. Officer of 176 registered investment companies managed by EVM or BMR. | |
|
(1) Includes both master and feeder funds in a master-feeder structure.
The SAI for the Fund includes additional information about the Trustees and officers of the Fund and the Portfolio and can be obtained without charge by calling 1-800-225-6265.
29
This Page Intentionally Left Blank
This Page Intentionally Left Blank
This Page Intentionally Left Blank
Investment Adviser of International Income Portfolio
Boston Management and Research
The Eaton Vance Building
255 State Street
Boston, MA 02109
Administrator of Eaton Vance International Income Fund
Eaton Vance Management
The Eaton Vance Building
255 State Street
Boston, MA 02109
Principal Underwriter
Eaton Vance Distributors, Inc.
The Eaton Vance Building
255 State Street
Boston, MA 02109
(617) 482-8260
Custodian
State Street Bank and Trust Company
200 Clarendon Street
Boston, MA 02116
Transfer Agent
PFPC Inc.
Attn: Eaton Vance Funds
P.O. Box 9653
Providence, RI 02940-9653
(800) 262-1122
Independent Registered Public Accounting Firm
Deloitte & Touche LLP
200 Berkeley Street
Boston, MA 02116-5022
Eaton Vance International Income Fund
The Eaton Vance Building
255 State Street
Boston, MA 02109
This report must be preceded or accompanied by a current prospectus. Before investing, investors should consider carefully the Fund's investment objective(s), risks, and charges and expenses. The Fund's current prospectus contains this and other information about the Fund and is available through your financial advisor. Please read the prospectus carefully before you invest or send money. For further information please call 1-800-225-6265.
3042-12/07 INTLISRC

Annual Report October 31, 2007


EATON VANCE
LOW
DURATION
FUND
IMPORTANT NOTICES REGARDING PRIVACY,
DELIVERY OF SHAREHOLDER DOCUMENTS,
PORTFOLIO HOLDINGS AND PROXY VOTING
Privacy. The Eaton Vance organization is committed to ensuring your financial privacy. Each of the financial institutions identified below has in effect the following policy ("Privacy Policy") with respect to nonpublic personal information about its customers:
• Only such information received from you, through application forms or otherwise, and information about your Eaton Vance fund transactions will be collected. This may include information such as name, address, social security number, tax status, account balances and transactions.
• None of such information about you (or former customers) will be disclosed to anyone, except as permitted by law (which includes disclosure to employees necessary to service your account). In the normal course of servicing a customer's account, Eaton Vance may share information with unaffiliated third parties that perform various required services such as transfer agents, custodians and broker/dealers.
• Policies and procedures (including physical, electronic and procedural safeguards) are in place that are designed to protect the confidentiality of such information.
• We reserve the right to change our Privacy Policy at any time upon proper notification to you. Customers may want to review our Policy periodically for changes by accessing the link on our homepage: www.eatonvance.com.
Our pledge of privacy applies to the following entities within the Eaton Vance organization: the Eaton Vance Family of Funds, Eaton Vance Management, Eaton Vance Investment Counsel, Boston Management and Research, and Eaton Vance Distributors, Inc.
In addition, our Privacy Policy only applies to those Eaton Vance customers who are individuals and who have a direct relationship with us. If a customer's account (i.e., fund shares) is held in the name of a third-party financial adviser/broker-dealer, it is likely that only such adviser's privacy policies apply to the customer. This notice supersedes all previously issued privacy disclosures.
For more information about Eaton Vance's Privacy Policy, please call 1-800-262-1122.
Delivery of Shareholder Documents. The Securities and Exchange Commission (the "SEC") permits funds to deliver only one copy of shareholder documents, including prospectuses, proxy statements and shareholder reports, to fund investors with multiple accounts at the same residential or post office box address. This practice is often called "householding" and it helps eliminate duplicate mailings to shareholders.
Eaton Vance, or your financial adviser, may household the mailing of your documents indefinitely unless you instruct Eaton Vance, or your financial adviser, otherwise.
If you would prefer that your Eaton Vance documents not be householded, please contact Eaton Vance at 1-800-262-1122, or contact your financial adviser.
Your instructions that householding not apply to delivery of your Eaton Vance documents will be effective within 30 days of receipt by Eaton Vance or your financial adviser.
Portfolio Holdings. Each Eaton Vance Fund and its underlying Portfolio (if applicable) will file a schedule of its portfolio holdings on Form N-Q with the SEC for the first and third quarters of each fiscal year. The Form N-Q will be available on the Eaton Vance website www.eatonvance.com, by calling Eaton Vance at 1-800-262-1122 or in the EDGAR database on the SEC's website at www.sec.gov. Form N-Q may also be reviewed and copied at the SEC's public reference room in Washington, D.C.
(call 1-800-732-0330 for information on the operation of the public reference room).
Proxy Voting. From time to time, funds are required to vote proxies related to the securities held by the funds. The Eaton Vance Funds or their underlying Portfolios (if applicable) vote proxies according to a set of policies and procedures approved by the Funds' and Portfolios' Boards. You may obtain a description of these policies and procedures and information on how the Funds or Portfolios voted proxies relating to portfolio securities during the most recent 12 month period ended June 30, without charge, upon request, by calling 1-800-262-1122. This description is also available on the SEC's website at www.sec.gov.
Eaton Vance Low Duration Fund as of October 31, 2007
MANAGEMENT’S DISCUSSION OF FUND PERFORMANCE

Susan Schiff, CFA
Portfolio Manager
Performance for the Past Year
· The Fund’s Class A shares had a total return of 4.82% for the year ended October 31, 2007.(1) This return resulted from a decrease in net asset value (NAV) per share to $8.99 on October 31, 2007 from $9.06 on October 31, 2006, and the reinvestment of $0.495 in dividend income.
· The Fund’s Class B shares had a total return of 4.14% for the year ended October 31, 2007.(1) This return resulted from a decrease in NAV per share to $9.00 on October 31, 2007 from $9.06 on October 31, 2006, and the reinvestment of $0.426 in dividend income.
· The Fund’s Class C shares had a total return of 4.30% for the year ended October 31, 2007.(1) This return resulted from a decrease in NAV per share to $9.00 on October 31, 2007 from $9.06 on October 31, 2006, and the reinvestment of $0.440 in dividend income.
· In comparison, the Merrill Lynch 1-3 Year Treasury Index – an unmanaged market index of short-term U.S. Treasury securities – had a total return of 5.78% for the year ended October 31, 2007.(2) The Fund’s peer group, the Lipper Short U.S. Government Funds Classification, had an average total return of 4.46% for the same period.(2)
Management Discussion
· Low Duration Fund seeks total return, an objective it pursues primarily through investments in securities issued by the U.S. government (or its agencies and instrumentalities) and at least 90% of the Fund’s net assets is invested in investment grade securities. The Fund currently pursues its objective by investing in one or more registered investment companies (each a “Portfolio”), that are managed by Eaton Vance Management or its affiliates: Floating Rate Portfolio and Investment Portfolio.
· The fiscal year ended October 31, 2007 saw turbulence in the fixed-income markets, exacerbated by continuing problems in the subprime market. Yield spreads for seasoned mortgage-backed securities (MBS) over Treasuries widened by approximately 40 basis points (0.40%) in July and August alone, reflecting similar widenings elsewhere in the fixed-income markets. Amid increasing concerns about the weak housing sector and the potential for a credit squeeze, the Federal Reserve cut its Federal Funds rate – a key short-term interest rate – from 5.25% to 4.50% during September and October, prompting a rally in the short-to-intermediate portion of the yield curve.
· Through its investment in Investment Portfolio, the Fund had a large position in seasoned fixed-rate MBS and a smaller position in seasoned adjustable-rate MBS during the period. While the Portfolio’s seasoned MBS had no direct exposure to subprime investments or non-agency MBS, they were nonetheless affected by the overall spread widening described above. However, that widening was partially offset by a decline in overall bond yields. With MBS spreads in the 125 basis point range (1.25%) at October 31, 2007, MBS represented, in the view of management, potentially better value than in recent years.(3)
· The Fund had a 10% investment in Floating Rate Portfolio. The loan market underwent an unprecedented correction in the third quarter of 2007 that resulted from a decline in loan demand, combined with a increase in the supply of new loan issuance. Average loan market prices fell 4%-5% in July and August. The risk aversion that began in the subprime mortgage area spread to the leveraged loan market through increased credit spreads and loan price volatility, which in turn further reduced demand from key market participants, including hedge funds, collateralized loan participation funds and mutual funds. With investor demand falling and loan supply rising to record levels, prices fell to levels not seen since 2002.
· Investment Portfolio had no direct subprime investments during the period. In addition, seasoned MBS held by the Portfolio typically have fewer credit issues, as the mortgages – originated in the late 1980s through mid-1990s – are now very well-collateralized with very low loan-to-value ratios. The Portfolio also
(1) These returns do not include the 2.25% maximum sales charge for the Fund’s Class A shares or the applicable contingent deferred sales charges (CDSC) for Class B shares and Class C shares. If sales charges were deducted, the returns would be lower. Absent a fee waiver and expense reimbursement by the investment adviser, the returns would be lower.
(2) It is not possible to invest directly in an Index or Lipper Classification. The Index’s total return does not reflect the expenses that would have been incurred if an investor individually purchased or sold the securities represented in the Index. The Lipper total return is the average total return, at NAV, of the funds that are in the same Lipper Classification as the Fund.
(3) Portfolio investments may not be representative of the Portfolios’ current or future investments and may change due to active management.
Fund shares are not insured by the FDIC and are not deposits or other obligations of, or guaranteed by, any depository institution. Shares are subject to investment risks, including possible loss of principal invested.
Past performance is no guarantee of future results. Returns are historical and are calculated by determining the percentage change in net asset value or offering price (as applicable) with all distributions reinvested. Investment return and principal value will fluctuate so that shares, when redeemed, may be worth more or less than their original cost. Performance is for the stated time period only; due to market volatility, the Fund’s current performance may be lower or higher than the quoted return. For performance as of the most recent month-end, please refer to www.eatonvance.com.
The views expressed throughout this report are those of the portfolio manager and are current only through the end of the period of the report as stated on the cover. These views are subject to change at any time based upon market or other conditions, and the investment adviser disclaims any responsibility to update such views. These views may not be relied on as investment advice and, because investment decisions for a fund are based on many factors, may not be relied on as an indication of trading intent on behalf of any Eaton Vance fund.
1
had a roughly10% investment in commercial property MBS. These AAA-rated securities, collateralized with Treasury bonds, saw price declines during the subprime crisis and, in the view of management, were undervalued as a result.(1)
· Prepayment rates for the Fund’s seasoned MBS were stable-to-slightly lower during the fiscal year, as homeowners were less motivated to refinance their mortgages. The Fund’s duration was 2.11 years at October 31, 2007, up from 1.73 years on October 31, 2006. With signs of a weaker economy, management extended duration. Duration is an indicator – stated in years – that measures cash flows and expected maturity of a fixed-income security or portfolio, and is used to determine price sensitivity to changes in interest rates. A longer duration increases a portfolio’s interest rate exposure.(1)
(1) Portfolio holdings may change due to active management.
Diversification by Sectors(2)
By total investments
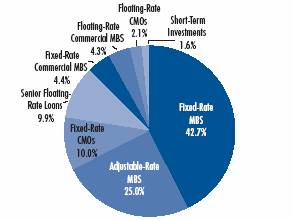
(2) The Diversification by Sectors breakdown reflects the Fund’s investments in Investment Portfolio and Floating Rate Portfolio, as of October 31, 2007. Sectors are shown as a percentage of the Fund’s total investments. Portfolio information may not be representative of the Portfolios’ current or future investments and may change due to active management.
2
Eaton Vance Low Duration Fund as of October 31, 2007
FUND PERFORMANCE
The line graphs and table set forth below provide information about the Fund’s performance. The line graphs compare the performance of each class of the Fund with that of the Merrill Lynch 1-3 Year Treasury Index, an unmanaged market index of short-term U.S. Treasury securities and the Lipper Short U.S. Government Fund Classification. The lines on the graph represent the total returns of a hypothetical investment of $10,000 in each Class, the Merrill Lynch 1-3 Year Treasury Index (ML 1-3 Year Treasury Index) and the Lipper Short U.S. Government Fund Classification. Class A total returns are presented at net asset value and maximum public offering price. The table includes the total returns of each Class of the Fund at net asset value and public offering price. The performance presented below does not reflect the deduction of taxes, if any, that a shareholder would pay on Fund distributions or the redemption of Fund shares.
Performance(1) | | Class A | | Class B | | Class C | |
Class Share Symbol | | EALDX | | EBLDX | | ECLDX | |
| | | | | | | |
Average Annual Total Returns (at net asset value) | | | | | | | |
One year | | 4.82 | % | 4.14 | % | 4.30 | % |
Five years | | 2.40 | | 1.65 | | 1.81 | |
Life of Fund† | | 2.45 | | 1.70 | | 1.85 | |
| | | | | | | |
SEC Average Annual Total Returns (including sales charge or applicable CDSC) | | | | | | | |
One year | | 2.44 | % | 1.16 | % | 3.31 | % |
Five years | | 1.94 | | 1.65 | | 1.81 | |
Life of Fund† | | 1.99 | | 1.70 | | 1.85 | |
†Inception Dates – Class A: 9/30/02; Class B: 9/30/02; Class C: 9/30/02 |
|
(1) Average Annual Total Returns do not include the 2.25% maximum sales charge for Class A shares or the applicable contingent deferred sales charge (CDSC) for Class B and Class C shares. If sales charges were deducted, the returns would be lower. SEC returns for Class A reflect the maximum 2.25% sales charge. SEC Average Annual Total Returns for Class B reflect applicable CDSC based on the following schedule: 3% - 1st year; 2.5% - 2nd year; 2.0% - 3rd year; 1% - 4th year. SEC return for Class C reflects a 1% CDSC for the first year. Absent a fee waiver and expense reimbursement by the investment adviser, the returns would be lower. |
Total Annual | | | | | | | |
Operating Expenses(2) | | Class A | | Class B | | Class C | |
| | | | | | | |
Gross Expense Ratio | | 1.44 | % | 2.19 | % | 2.04 | % |
Net Expense Ratio | | 1.00 | | 1.75 | | 1.60 | |
(2) Source: Prospectus dated 3/1/07. The Net Expense Ratio reflects a contractual advisory fee and administration fee waiver that cannot be eliminated without the approval of the Board of Trustees and shareholders, as well as a contractual expense reimbursement on total operating expenses that continues through April 30, 2010. Thereafter, the expense reimbursement may be changed or terminated at any time. |
Comparison of Change in Value of a $10,000 Investment in Eaton Vance Low Duration Fund Class A vs. Merrill Lynch 1-3 Yr. Treasury Index and the Lipper Short U.S. Government Fund Classification*
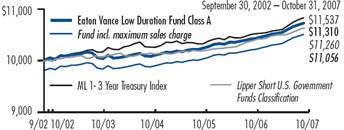
Comparison of Change in Value of a $10,000 Investment in Eaton Vance Low Duration Fund Class B vs. Merrill Lynch 1-3 Yr. Treasury Index and the Lipper Short U.S. Government Fund Classification*
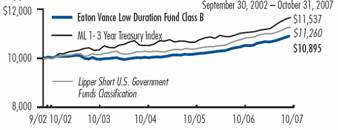
Comparison of Change in Value of a $10,000 Investment in Eaton Vance Low Duration Fund Class C vs. Merrill Lynch 1-3 Yr. Treasury Index and the Lipper Short U.S. Government Fund Classification*
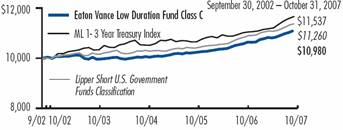
* Sources: Thomson Financial; Bloomberg, L.P. Class A, Class B and Class C of the Fund commenced operations on 9/30/02. |
|
The Index’s total return does not reflect the expenses that would have been incurred if an investor individually purchased or sold the securities represented in the Index. The Lipper average is the average total return, at NAV, of the funds that are in the same Lipper Classification as the Fund. It is not possible to invest directly in an Index or Classification. |
Past performance is no guarantee of future results. Returns are historical and are calculated by determining the percentage change in net asset value or offering price (as applicable) with all distributions reinvested. Investment return and principal value will fluctuate so that shares, when redeemed, may be worth more or less than their original cost. Performance is for the stated time period only; due to market volatility, the Fund’s current performance may be lower or higher than the quoted return. For performance as of the most recent month-end, please refer to www.eatonvance.com.
3
Eaton Vance Low Duration Fund as of October 31, 2007
FUND EXPENSES
Example: As a shareholder of the Fund, you incur two types of costs: (1) transaction costs, including sales charges (loads) on purchases and redemption fees (if applicable); and (2) ongoing costs, including management fees; distribution or service fees; and other Fund expenses. This Example is intended to help you understand your ongoing costs (in dollars) of investing in the Fund and to compare these costs with the ongoing costs of investing in other mutual funds. The Example is based on an investment of $1,000 invested at the beginning of the period and held for the entire period (May 1, 2007 – October 31, 2007).
Actual Expenses: The first section of the table below provides information about actual account values and actual expenses. You may use the information in this section, together with the amount you invested, to estimate the expenses that you paid over the period. Simply divide your account value by $1,000 (for example, an $8,600 account value divided by $1,000 = 8.6), then multiply the result by the number in the first section under the heading entitled "Expenses Paid During Period" to estimate the expenses you paid on your account during this period.
Hypothetical Example for Comparison Purposes: The second section of the table below provides information about hypothetical account values and hypothetical expenses based on the Fund's actual expense ratio and an assumed rate of return of 5% per year (before expenses), which is not the actual return of the Fund. The hypothetical account values and expenses may not be used to estimate the actual ending account balance or expenses you paid for the period. You may use this information to compare the ongoing costs of investing in your Fund and other funds. To do so, compare this 5% hypothetical example with the 5% hypothetical examples that appear in the shareholder reports of the other funds.
Please note that the expenses shown in the table are meant to highlight your ongoing costs only and do not reflect any transactional costs, such as sales charges (loads) or redemption fees (if applicable). Therefore, the second section of the table is useful in comparing ongoing costs only, and will not help you determine the relative total costs of owning different funds. In addition, if these transactional costs were included, your costs would have been higher.
Eaton Vance Low Duration Fund
| | | Beginning Account Value
(5/1/07) | | Ending Account Value
(10/31/07) | | Expenses Paid During Period*
(5/1/07 – 10/31/07) | |
| Actual | |
| Class A | | $ | 1,000.00 | | | $ | 1,023.60 | | | $ | 5.25 | ** | |
| Class B | | $ | 1,000.00 | | | $ | 1,020.70 | | | $ | 8.71 | ** | |
| Class C | | $ | 1,000.00 | | | $ | 1,021.50 | | | $ | 8.41 | ** | |
| Hypothetical | |
| (5% return per year before expenses) | |
| Class A | | $ | 1,000.00 | | | $ | 1,020.00 | | | $ | 5.24 | ** | |
| Class B | | $ | 1,000.00 | | | $ | 1,016.60 | | | $ | 8.69 | ** | |
| Class C | | $ | 1,000.00 | | | $ | 1,016.90 | | | $ | 8.39 | ** | |
* Expenses are equal to the Fund's annualized expense ratio of 1.00% for Class A shares, 1.75% for Class B shares, and 1.60% for Class C shares multiplied by the average account value over the period, multiplied by 184/365 (to reflect the one-half period). The Example assumes that the $1,000 was invested at the net asset value per share determined at the close of business on April 30, 2007. The Example reflects the expenses of both the Fund and the Portfolio.
** Absent a fee waiver and expense reimbursement by the investment adviser, the expense would be higher.
4
Eaton Vance Low Duration Fund as of October 31, 2007
FINANCIAL STATEMENTS
Statement of Assets and Liabilities
As of October 31, 2007
| Assets | |
Investment in Investment Portfolio, at value
(identified cost, $36,587,593) | | $ | 36,619,034 | | |
Investment in Floating Rate Portfolio, at value
(identified cost, $4,057,936) | | | 4,044,429 | | |
| Receivable for Fund shares sold | | | 82,056 | | |
| Receivable from the administrator | | | 91,180 | | |
| Total assets | | $ | 40,836,699 | | |
| Liabilities | |
| Dividends payable | | $ | 55,459 | | |
| Payable for Fund shares redeemed | | | 35,323 | | |
| Payable to affiliate for distribution and service fees | | | 19,132 | | |
| Payable to affiliate for Trustees' fees | | | 17 | | |
| Accrued expenses | | | 63,772 | | |
| Total liabilities | | $ | 173,703 | | |
| Net Assets | | $ | 40,662,996 | | |
| Sources of Net Assets | |
| Paid-in capital | | $ | 50,606,918 | | |
Accumulated net realized loss from Portfolios (computed on the basis of
identified cost) | | | (9,906,397 | ) | |
| Accumulated distributions in excess of net investment income | | | (55,459 | ) | |
Net unrealized appreciation from Portfolios (computed on the basis of
identified cost) | | | 17,934 | | |
| Total | | $ | 40,662,996 | | |
| Class A Shares | |
| Net Assets | | $ | 20,998,007 | | |
| Shares Outstanding | | | 2,334,720 | | |
Net Asset Value and Redemption Price Per Share
(net assets ÷ shares of beneficial interest outstanding) | | $ | 8.99 | | |
Maximum Offering Price Per Share
(100 ÷ 97.75 of $8.99) | | $ | 9.20 | | |
| Class B Shares | |
| Net Assets | | $ | 3,366,557 | | |
| Shares Outstanding | | | 374,232 | | |
Net Asset Value and Offering Price Per Share*
(net assets ÷ shares of beneficial interest outstanding) | | $ | 9.00 | | |
| Class C Shares | |
| Net Assets | | $ | 16,298,432 | | |
| Shares Outstanding | | | 1,811,658 | | |
Net Asset Value and Offering Price Per Share*
(net assets ÷ shares of beneficial interest outstanding) | | $ | 9.00 | | |
| On sales of $100,000 or more, the offering price of Class A shares is reduced. | |
* Redemption price per share is equal to the net asset value less any applicable contingent deferred sales charge.
Statement of Operations
For the Year Ended
October 31, 2007
| Investment Income | |
| Interest and dividends allocated from Portfolios | | $ | 2,132,861 | | |
| Expenses allocated from Portfolios | | | (257,635 | ) | |
| Net investment income from Portfolios | | $ | 1,875,226 | | |
| Expenses | |
| Investment advisor and administration fees | | $ | 57,350 | | |
| Trustees' fees and expenses | | | 187 | | |
| Distribution and service fees | |
| Class A | | | 47,912 | | |
| Class B | | | 43,969 | | |
| Class C | | | 124,707 | | |
| Transfer and dividend disbursing agent fees | | | 56,565 | | |
| Registration fees | | | 48,496 | | |
| Legal and accounting services | | | 37,568 | | |
| Custodian fee | | | 21,379 | | |
| Printing and postage | | | 17,502 | | |
| Miscellaneous | | | 6,138 | | |
| Total expenses | | $ | 461,773 | | |
Deduct —
Expense reimbursement | | $ | 91,180 | | |
| Reduction of investment adviser fee and administration fee | | | 57,350 | | |
| Total expense reductions | | $ | 148,530 | | |
| Net expenses | | $ | 313,243 | | |
| Net investment income | | $ | 1,561,983 | | |
Realized and Unrealized
Gain (Loss) from Portfolios | |
Net realized gain (loss) —
Investment transactions (identified cost basis) | | $ | (8,970 | ) | |
| Financial futures contracts | | | 41,894 | | |
| Swap contracts | | | 780 | | |
| Foreign currency transactions | | | (47,913 | ) | |
| Net realized loss | | $ | (14,209 | ) | |
Change in unrealized appreciation (depreciation) —
Investments (identified cost basis) | | $ | 169,265 | | |
| Financial futures contracts | | | 15,576 | | |
| Swap contracts | | | 3 | | |
| Foreign currency | | | 684 | | |
| Net change in unrealized appreciation (depreciation) | | $ | 185,528 | | |
| Net realized and unrealized gain | | $ | 171,319 | | |
| Net increase in net assets from operations | | $ | 1,733,302 | | |
See notes to financial statements
5
Eaton Vance Low Duration Fund as of October 31, 2007
FINANCIAL STATEMENTS CONT'D
Statements of Changes in Net Assets
Increase (Decrease)
in Net Assets | | Year Ended
October 31, 2007 | | Year Ended
October 31, 2006 | |
From operations —
Net investment income | | $ | 1,561,983 | | | $ | 1,586,406 | | |
Net realized gain (loss) from investments,
financial futures contracts, swaps
contracts and foreign currency
exchange contract transactions | | | (14,209 | ) | | | (1,197,379 | ) | |
Net change in unrealized appreciation
(depreciation) from investments,
financial futures contracts, swaps
contracts and foreign currency
exchange contract transactions | | | 185,528 | | | | 1,178,245 | | |
| Net increase in net assets from operations | | $ | 1,733,302 | | | $ | 1,567,272 | | |
Distributions to shareholders —
From net investment income
Class A | | $ | (1,030,092 | ) | | $ | (1,178,013 | ) | |
| Class B | | | (201,516 | ) | | | (364,800 | ) | |
| Class C | | | (697,083 | ) | | | (905,762 | ) | |
From tax return of capital
Class A | | | (27,746 | ) | | | — | | |
| Class B | | | (6,347 | ) | | | — | | |
| Class C | | | (21,243 | ) | | | — | | |
| Total distributions to shareholders | | $ | (1,984,027 | ) | | $ | (2,448,575 | ) | |
Transactions in shares of beneficial interest —
Proceeds from sale of shares
Class A | | $ | 13,252,931 | | | $ | 7,381,939 | | |
| Class B | | | 2,107,781 | | | | 1,429,030 | | |
| Class C | | | 7,275,909 | | | | 1,810,127 | | |
Net asset value of shares issued to
shareholders in payment of
distributions declared | | | | | | | | | |
| Class A | | | 625,845 | | | | 728,317 | | |
| Class B | | | 128,682 | | | | 220,006 | | |
| Class C | | | 467,001 | | | | 565,649 | | |
Cost of shares redeemed
Class A | | | (17,468,719 | ) | | | (12,378,340 | ) | |
| Class B | | | (1,769,335 | ) | | | (2,779,941 | ) | |
| Class C | | | (6,291,399 | ) | | | (12,140,360 | ) | |
Net asset value of shares exchanged
Class A | | | 3,558,902 | | | | 1,942,840 | | |
| Class B | | | (3,558,902 | ) | | | (1,942,840 | ) | |
Net decrease in net assets from Fund
share transactions | | $ | (1,671,304 | ) | | $ | (15,163,573 | ) | |
| Net decrease in net assets | | $ | (1,922,029 | ) | | $ | (16,044,876 | ) | |
| Net Assets | | Year Ended
October 31, 2007 | | Year Ended
October 31, 2006 | |
| At beginning of year | | $ | 42,585,025 | | | $ | 58,629,901 | | |
| At end of year | | $ | 40,662,996 | | | $ | 42,585,025 | | |
Accumulated distributions
in excess of net investment
income included in net assets | |
| At end of year | | $ | (55,459 | ) | | $ | (49,200 | ) | |
See notes to financial statements
6
Eaton Vance Low Duration Fund as of October 31, 2007
FINANCIAL STATEMENTS CONT'D
Financial Highlights
| | | Class A | |
| | | Year Ended October 31, | | Period Ended | | Year Ended | | Period Ended | |
| | | 2007(1) | | 2006(1) | | 2005(1) | | October 31, 2004(1)(2) | | December 31, 2003(1) | | December 31, 2002(1)(3) | |
| Net asset value — Beginning of period | | $ | 9.060 | | | $ | 9.220 | | | $ | 9.420 | | | $ | 9.590 | | | $ | 9.990 | | | $ | 10.000 | | |
| Income (loss) from operations | |
| Net investment income | | $ | 0.397 | | | $ | 0.333 | | | $ | 0.224 | | | $ | 0.142 | | | $ | 0.098 | | | $ | 0.056 | | |
| Net realized and unrealized gain (loss) | | | 0.028 | | | | 0.002 | | | | (0.033 | ) | | | (0.027 | ) | | | (0.120 | ) | | | 0.035 | | |
| Total income (loss) from operations | | $ | 0.425 | | | $ | 0.335 | | | $ | 0.191 | | | $ | 0.115 | | | $ | (0.022 | ) | | $ | 0.091 | | |
| Less distributions | |
| From net investment income | | $ | (0.482 | ) | | $ | (0.495 | ) | | $ | (0.391 | ) | | $ | (0.285 | ) | | $ | (0.378 | ) | | $ | (0.101 | ) | |
| From tax return of captial | | | (0.013 | ) | | | — | | | | — | | | | — | | | | — | | | | — | | |
| Total distributions | | $ | (0.495 | ) | | $ | (0.495 | ) | | $ | (0.391 | ) | | $ | (0.285 | ) | | $ | (0.378 | ) | | $ | (0.101 | ) | |
| Net asset value — End of period | | $ | 8.990 | | | $ | 9.060 | | | $ | 9.220 | | | $ | 9.420 | | | $ | 9.590 | | | $ | 9.990 | | |
| Total Return(4) | | | 4.82 | % | | | 3.74 | % | | | 2.06 | % | | | 1.22 | %(8) | | | (0.23 | )% | | | 0.91 | %(8) | |
| Ratios/Supplemental Data | |
| Net assets, end of period (000's omitted) | | $ | 20,998 | | | $ | 21,157 | | | $ | 23,876 | | | $ | 38,147 | | | $ | 63,709 | | | $ | 27,033 | | |
| Ratios (As a percentage of average daily net assets): | |
| Expenses before custodian fee reduction(5)(6) | | | 1.17 | % | | | 1.29 | % | | | 1.24 | % | | | 1.20 | %(7) | | | 1.21 | % | | | 1.16 | %(7) | |
| Expenses after custodian fee reduction(5)(6) | | | 1.17 | % | | | 1.29 | % | | | 1.24 | % | | | 1.20 | %(7) | | | 1.21 | % | | | 1.16 | %(7) | |
| Net investment income | | | 4.40 | % | | | 3.65 | % | | | 2.41 | % | | | 1.80 | %(7) | | | 1.00 | % | | | 2.18 | %(7) | |
| Portfolio Turnover of the Investment Portfolio | | | 35 | % | | | 46 | % | | | 67 | % | | | 92 | % | | | 43 | % | | | 0 | % | |
| Portfolio Turnover of the Floating Rate Portfolio | | | 61 | % | | | 50 | % | | | 57 | % | | | 67 | % | | | — | | | | — | | |
| Portfolio Turnover of the Government Obligations Portfolio | | | n/a | | | | 2 | % | | | 30 | % | | | 5 | % | | | 67 | % | | | 41 | % | |
(1) Net investment income per share was computed using average shares outstanding.
(2) For the ten-month period ended October 31, 2004.
(3) For the period from the start of business, September 30, 2002, to December 31, 2002.
(4) Returns are historical and are calculated by determining the percentage change in net asset value with all distributions reinvested.
Total returns would have been lower had certain expenses not been reduced during the periods shown.
(5) Includes the Fund's share of the Portfolios' allocated expenses.
(6) The investment adviser waived a portion of its investment adviser and administration fees and the administrator reimbursed expenses (equal to 0.39%, 0.15%, 0.11%, 0.02% and 1.04% of daily net assets for the years ended October 31, 2007, 2006 and 2005, the period ended October 31, 2004, the year ended December 31, 2003 and the period ended December 31, 2002, respectively.)
(7) Annualized.
(8) Not annualized.
See notes to financial statements
7
Eaton Vance Low Duration Fund as of October 31, 2007
FINANCIAL STATEMENTS CONT'D
Financial Highlights
| | | Class B | |
| | | Year Ended October 31, | | Period Ended | | Year Ended | | Period Ended | |
| | | 2007(1) | | 2006(1) | | 2005(1) | | October 31, 2004(1)(2) | | December 31, 2003(1) | | December 31, 2002(1)(3) | |
| Net asset value — Beginning of period | | $ | 9.060 | | | $ | 9.210 | | | $ | 9.420 | | | $ | 9.590 | | | $ | 9.990 | | | $ | 10.000 | | |
| Income (loss) from operations | |
| Net investment income | | $ | 0.330 | | | $ | 0.266 | | | $ | 0.153 | | | $ | 0.083 | | | $ | 0.024 | | | $ | 0.039 | | |
| Net realized and unrealized gain (loss) | | | 0.036 | | | | 0.010 | | | | (0.043 | ) | | | (0.028 | ) | | | (0.121 | ) | | | 0.033 | | |
| Total income (loss) from operations | | $ | 0.366 | | | $ | 0.276 | | | $ | 0.110 | | | $ | 0.055 | | | $ | (0.097 | ) | | $ | 0.072 | | |
| Less distributions | |
| From net investment income | | $ | (0.413 | ) | | $ | (0.426 | ) | | $ | (0.320 | ) | | $ | (0.225 | ) | | $ | (0.303 | ) | | $ | (0.082 | ) | |
| From tax return of capital | | | (0.013 | ) | | | — | | | | — | | | | — | | | | — | | | | — | | |
| Total distributions | | $ | (0.426 | ) | | $ | (0.426 | ) | | $ | (0.320 | ) | | $ | (0.225 | ) | | $ | (0.303 | ) | | $ | (0.082 | ) | |
| Net asset value — End of period | | $ | 9.000 | | | $ | 9.060 | | | $ | 9.210 | | | $ | 9.420 | | | $ | 9.590 | | | $ | 9.990 | | |
| Total Return(4) | | | 4.14 | % | | | 3.07 | % | | | 1.18 | % | | | 0.58 | %(8) | | | (0.98 | )% | | | 0.72 | %(8) | |
| Ratios/Supplemental Data | |
| Net assets, end of period (000's omitted) | | $ | 3,367 | | | $ | 6,491 | | | $ | 9,704 | | | $ | 14,022 | | | $ | 17,547 | | | $ | 10,725 | | |
| Ratios (As a percentage of average daily net assets): | |
| Expenses before custodian fee reduction(5)(6) | | | 1.92 | % | | | 2.04 | % | | | 1.99 | % | | | 1.95 | %(7) | | | 1.96 | % | | | 1.91 | %(7) | |
| Expenses after custodian fee reduction(5)(6) | | | 1.92 | % | | | 2.04 | % | | | 1.99 | % | | | 1.95 | %(7) | | | 1.96 | % | | | 1.91 | %(7) | |
| Net investment income | | | 3.66 | % | | | 2.91 | % | | | 1.64 | % | | | 1.05 | %(7) | | | 0.25 | % | | | 1.49 | %(7) | |
| Portfolio Turnover of the Investment Portfolio | | | 35 | % | | | 46 | % | | | 67 | % | | | 92 | % | | | 43 | % | | | 0 | % | |
| Portfolio Turnover of the Floating Rate Portfolio | | | 61 | % | | | 50 | % | | | 57 | % | | | 67 | % | | | — | | | | — | | |
| Portfolio Turnover of the Government Obligations Portfolio | | | n/a | | | | 2 | % | | | 30 | % | | | 5 | % | | | 67 | % | | | 41 | % | |
(1) Net investment income per share was computed using average shares outstanding.
(2) For the ten-month period ended October 31, 2004.
(3) For the period from the start of business, September 30, 2002, to December 31, 2002.
(4) Returns are historical and are calculated by determining the percentage change in net asset value with all distributions reinvested.
Total returns would have been lower had certain expenses not been reduced during the periods shown.
(5) Includes the Fund's share of the Portfolios' allocated expenses.
(6) The investment adviser waived a portion of its investment adviser and administration fees and the administrator reimbursed expenses (equal to 0.39%, 0.15%, 0.11%, 0.02% and 1.04% of daily net assets for the years ended October 31, 2007, 2006 and 2005, the period ended October 31, 2004, the year ended December 31, 2003 and the period ended December 31, 2002, respectively.)
(7) Annualized.
(8) Not annualized.
See notes to financial statements
8
Eaton Vance Low Duration Fund as of October 31, 2007
FINANCIAL STATEMENTS CONT'D
Financial Highlights
| | | Class C | |
| | | Year Ended October 31, | | Period Ended | | Year Ended | | Period Ended | |
| | | 2007(1) | | 2006(1) | | 2005(1) | | October 31, 2004(1)(2) | | December 31, 2003(1) | | December 31, 2002(1)(3) | |
| Net asset value — Beginning of period | | $ | 9.060 | | | $ | 9.220 | | | $ | 9.420 | | | $ | 9.590 | | | $ | 9.980 | | | $ | 10.000 | | |
| Income (loss) from operations | |
| Net investment income | | $ | 0.342 | | | $ | 0.277 | | | $ | 0.167 | | | $ | 0.095 | | | $ | 0.040 | | | $ | 0.041 | | |
| Net realized and unrealized gain (loss) | | | 0.038 | | | | 0.003 | | | | (0.033 | ) | | | (0.028 | ) | | | (0.112 | ) | | | 0.025 | | |
| Total income (loss) from operations | | $ | 0.380 | | | $ | 0.280 | | | $ | 0.134 | | | $ | 0.067 | | | $ | (0.072 | ) | | $ | 0.066 | | |
| Less distributions | |
| From net investment income | | $ | (0.427 | ) | | $ | (0.440 | ) | | $ | (0.334 | ) | | $ | (0.237 | ) | | $ | (0.318 | ) | | $ | (0.086 | ) | |
| From tax return of capital | | | (0.013 | ) | | | — | | | | — | | | | — | | | | — | | | | — | | |
| Total distributions | | $ | (0.440 | ) | | $ | (0.440 | ) | | $ | (0.334 | ) | | $ | (0.237 | ) | | $ | (0.318 | ) | | $ | (0.086 | ) | |
| Net asset value — End of period | | $ | 9.000 | | | $ | 9.060 | | | $ | 9.220 | | | $ | 9.420 | | | $ | 9.590 | | | $ | 9.980 | | |
| Total Return(4) | | | 4.30 | % | | | 3.12 | % | | | 1.45 | % | | | 0.71 | %(8) | | | (0.74 | )% | | | 0.66 | %(8) | |
| Ratios/Supplemental Data | |
| Net assets, end of period (000's omitted) | | $ | 16,298 | | | $ | 14,937 | | | $ | 25,050 | | | $ | 34,495 | | | $ | 55,078 | | | $ | 18,387 | | |
| Ratios (As a percentage of average daily net assets): | |
| Expenses before custodian fee reduction(5)(6) | | | 1.78 | % | | | 1.89 | % | | | 1.84 | % | | | 1.80 | %(7) | | | 1.81 | % | | | 1.76 | %(7) | |
| Expenses after custodian fee reduction(5)(6) | | | 1.78 | % | | | 1.89 | % | | | 1.84 | % | | | 1.80 | %(7) | | | 1.81 | % | | | 1.76 | %(7) | |
| Net investment income | | | 3.80 | % | | | 3.04 | % | | | 1.79 | % | | | 1.20 | %(7) | | | 0.41 | % | | | 1.56 | %(7) | |
| Portfolio Turnover of the Investment Portfolio | | | 35 | % | | | 46 | % | | | 67 | % | | | 92 | % | | | 43 | % | | | 0 | % | |
| Portfolio Turnover of the Floating Rate Portfolio | | | 61 | % | | | 50 | % | | | 57 | % | | | 67 | % | | | — | | | | — | | |
| Portfolio Turnover of the Government Obligations Portfolio | | | n/a | | | | 2 | % | | | 30 | % | | | 5 | % | | | 67 | % | | | 41 | % | |
(1) Net investment income per share was computed using average shares outstanding.
(2) For the ten-month period ended October 31, 2004.
(3) For the period from the start of business, September 30, 2002, to December 31, 2002.
(4) Returns are historical and are calculated by determining the percentage change in net asset value with all distributions reinvested.
Total returns would have been lower had certain expenses not been reduced during the periods shown.
(5) Includes the Fund's share of the Portfolios' allocated expenses.
(6) The investment adviser waived a portion of its investment adviser and administration fees and the administrator reimbursed expenses (equal to 0.39%, 0.15%, 0.11%, 0.02% and 1.04% of daily net assets for the years ended October 31, 2007, 2006 and 2005, the period ended October 31, 2004, the year ended December 31, 2003 and the period ended December 31, 2002, respectively.)
(7) Annualized.
(8) Not annualized.
See notes to financial statements
9
Eaton Vance Low Duration Fund as of October 31, 2007
NOTES TO FINANCIAL STATEMENTS
1 Significant Accounting Policies
Eaton Vance Low Duration Fund (the Fund) is a diversified series of Eaton Vance Mutual Funds Trust (the Trust). The Trust is an entity of the type commonly known as a Massachusetts business trust and is registered under the Investment Company Act of 1940, as amended (the 1940 Act), as an open-end management investment company. The Fund offers three classes of shares. Class A shares are generally sold subject to a sales charge imposed at time of purchase. Class B and Class C shares are sold at net asset value and are generally subject to a contingent deferred sales charge (see Note 6). After the longer of four years or the time when the CDSC applicable to Class B shares expires, Class B shares will automatically convert to Class A shares. Each class represents a pro rata interest in the Fund, but votes separately on class-specific matters and (as noted below) is subject to different expenses. Realized and unrealized gains and losses are allocated daily to each class of shares based on the relative net assets of each class to the total net assets of the Fund. Net investment income, other than class specific expenses, is allocated daily to each class of shares based on the ratio of the value of each class' paid shares to the total value of all paid shares. Each class of shares differs in its distribution plan and certain other class-specific expenses. The Fund is structured as a fund-of-funds and as of October 31, 2007, invested all of its investable assets in interests in two Portfolios, Investment Portfolio and Floating Rate Portfolio (the Portfolios), which are New York Trusts. Each Portfolio has an investment objective and investment policies that are similar to or complementary to those of the Fund. The value of the Fund's investment in the Portfolios reflects the Fund's proportionate interest in the net assets of the Investment Portfoli o and Floating Rate Portfolio (86.5% and 0.1%, respectively, at October 31, 2007). The performance of the Fund is directly affected by the performance of the Portfolios. The financial statements of the Investment Portfolio, including the portfolio of investments, are included elsewhere in this report and should be read in conjunction with the Fund's financial statements. A copy of the Floating Rate Portfolio's financial statements are available on the EDGAR Database on the Securities and Exchange Commission's website (www.sec.gov), at the Commission's public reference room in Washington, DC or upon request from the Fund's principal underwriter, Eaton Vance Distributors Inc. (EVD) by calling 1-800-225-6265.
The following is a summary of significant accounting policies of the Fund. The policies are in conformity with accounting principles generally accepted in the United States of America.
A Investment Valuation — Valuation of securities by the Portfolio is discussed in Note 1A of the Portfolio's Notes to Financial Statements, which are included elsewhere in this report.
Floating Rate Portfolio's valuation policies are as follows: Certain Senior Loans are deemed to be liquid because reliable market quotations are readily available for them. Liquid Senior Loans are valued on the basis of prices furnished by a pricing service. Other Senior Loans are valued at fair value by the investment adviser under procedures approved by the Trustees. In fair valuing a Senior Loan, the investment adviser utilizes one or more of the following valuation techniques: (i) a matrix pricing approach that considers the yield on the Senior Loan relative to yields on other loan interests issued by companies of comparable credit quality; (ii) a comparison of the value of the borrower's outstanding equity and debt to that of comparable public companies; (iii) a discounted cash flow analysis; or (iv) when the investment adviser believes it is likely that a borrower will be liquidated or sold, an analysis of the terms of suc h liquidation or sale. In certain cases, the investment adviser will use a combination of analytical methods to determine fair value, such as when only a portion of a borrower's assets are likely to be sold. In conducting its assessment and analyses for purposes of determining fair value of a Senior Loan, the investment adviser will use its discretion and judgment in considering and appraising relevant factors. Junior loans are valued in the same manner as Senior Loans.
Debt obligations (other than short-term obligations maturing in sixty days or less), including listed securities and securities for which price quotations are available and forward contracts, will normally be valued on the basis of market valuations furnished by dealers or pricing services. Financial futures contracts listed on commodity exchanges and exchange-traded options are valued at closing settlement prices. Over-the-counter options are valued at the mean between the bid and asked prices provided by dealers. Marketable securities listed on the NASDAQ Global or Global Select Market are valued at the NASDAQ official closing price. The value of interest rate swaps will be based upon a dealer quotation. Short-term obligations and money market securities maturing in sixty days or less are valued at amortized cost which approximates value. Investments for which reliable market quotations are unavailable are valued at fair value using methods determined in good faith by or at the direction of the Trustees of the Portfolio. Occasionally, events affecting the value of foreign securities may occur between the time trading is completed abroad and the
10
Eaton Vance Low Duration Fund as of October 31, 2007
NOTES TO FINANCIAL STATEMENTS CONT'D
close of the Exchange which will not be reflected in the computation of the Portfolio's net asset value (unless the Portfolio deems that such event would materially affect its net asset value in which case an adjustment would be made and reflected in such computation). The Portfolio may rely on an independent fair valuation service in making any such adjustment.
The Portfolios may invest in Cash Management Portfolio (Cash Management) an affiliated investment company managed by Boston Management and Research (BMR), a subsidiary of Eaton Vance Management (EVM). Cash Management values its investment securities utilizing the amortized cost valuation technique permitted by Rule 2a-7 of the 1940 Act. This technique involves initially valuing a portfolio security at its cost and thereafter assuming a constant amortization to maturity of any discount or premium.
B Income — The Fund's net investment income or loss consists of the Fund's pro rata share of the net investment income or loss of the Portfolios, less all actual and accrued expenses of the Fund.
C Federal Taxes — The Fund's policy is to comply with the provisions of the Internal Revenue Code applicable to regulated investment companies and to distribute to shareholders, each year, substantially all of its net investment income and all or substantially all of its net realized capital gains. Accordingly, no provision for federal income or excise tax is necessary. At October 31, 2007, the Fund, for federal income tax purposes, had capital loss carryforwards of $9,988,543 which will reduce the Fund's taxable income arising from future net realized gain on investment transactions, if any, to the extent permitted by the Internal Revenue Code and thus will reduce the amount of distributions to shareholders which would otherwise be necessary to relieve the Fund of any li ability for federal income or excise tax. Such capital loss carryforwards will expire on October 31, 2010 ($5,478), October 31, 2011 ($4,082,489), October 31, 2012 ($3,697,770), October 31, 2013 ($1,016,104), October 31, 2014 ($811,882) and October 31, 2015 ($374,820), respectively.
D Expenses — The majority of expenses of the Trust are directly identifiable to an individual fund. Expenses which are not readily identifiable to a specific fund are allocated taking into consideration, among other things, the nature and type of expense and the relative size of the funds.
E Expense Reduction — State Street Bank and Trust Company (SSBT) serves as custodian of the Fund. Pursuant to the custodian agreement, SSBT receives a fee reduced by credits, which are determined based on the average daily cash balance the Fund maintains with SSBT. All credit balances, if any, used to reduce the Fund's custodian fees are reported as a reduction of expenses in the Statement of Operations.
F Use of Estimates — The preparation of the financial statements in conformity with accounting principles generally accepted in the United States of America requires management to make estimates and assumptions that affect the reported amounts of assets and liabilities at the date of the financial statements and the reported amounts of income and expense during the reporting period. Actual results could differ from those estimates.
G Indemnifications — Under the Trust's organizational documents, its officers and Trustees may be indemnified against certain liabilities and expenses arising out of the performance of their duties to the Fund, and shareholders are indemnified against personal liability for obligations of the Trust. Additionally, in the normal course of business, the Fund enters into agreements with service providers that may contain indemnification clauses. The Fund's maximum exposure under these arrangements is unknown as this would involve future claims that may be made against the Fund that have not yet occurred.
H Other — Investment transactions are accounted for on a trade date basis. Dividends to shareholders are recorded on the ex-dividend date.
2 Distributions to Shareholders
The Fund declares dividends daily to shareholders of record at the time of declaration. Distributions are ordinarily paid monthly. Distributions of allocated realized capital gains, if any, are made at least annually. Shareholders may reinvest income and capital gain distributions in additional shares of the same class of the Fund at the net asset value as of the ex-dividend date. Distributions are paid in the form of additional shares of the Fund or, at the election of the shareholder, in cash. The Fund distinguishes between distributions on a tax basis and a financial reporting basis. Accounting principles generally accepted in the United States of America require that only distributions in excess of tax basis earnings and profits be reported in the financial statements as a return of capital. Permanent differences between book and tax accounting relating to distributions are reclassified to paid-in capital.
11
Eaton Vance Low Duration Fund as of October 31, 2007
NOTES TO FINANCIAL STATEMENTS CONT'D
The tax character of distributions paid for the years ended October 31, 2007 and October 31, 2006 was as follows:
| | | Year Ended October 31, | |
| | | 2007 | | 2006 | |
| Distributions declared from: | |
| Ordinary income | | $ | 1,928,691 | | | $ | 2,448,575 | | |
| Return of capital | | | 55,336 | | | | — | | |
During the year ended October 31, 2007, accumulated distributions in excess of net investment income was decreased by $360,449, accumulated undistributed net realized loss was increased by $304,720, and paid-in capital was decreased by $55,729, due to differences in book and tax accounting, primarily for paydowns, currency gain/loss, mixed straddles, swaps, premium amortization and partnership allocations. These reclassifications had no effect on the net assets or net asset value per share of the Fund.
As of October 31, 2007, the components of distributable earnings (accumulated losses) and unrealized appreciation (depreciation) on a tax basis were as follows:
| Capital loss carryforward | | $ | (9,988,543 | ) | |
| Unrealized appreciation | | $ | 100,080 | | |
| Other temporary differences | | $ | (55,459 | ) | |
The differences between components of distributable earnings (accumulated losses) on a tax basis and the amounts reflected in the Statement of Assets and Liabilities are primarily due to differences in book and tax policies and for wash sales, futures contracts, partnership allocations, premium amortization, and the timing of recognizing distributions to shareholders.
3 Shares of Beneficial Interest
The Fund's Declaration of Trust permits the Trustees to issue an unlimited number of full and fractional shares of beneficial interest (without par value). Such shares may be issued in a number of different series (such as the Fund) and classes. Transactions in Fund shares were as follows:
| | | Year Ended October 31, | |
| Class A | | 2007 | | 2006 | |
| Sales | | | 1,473,045 | | | | 811,742 | | |
Issued to shareholders electing to receive
payments of distributions in Fund shares | | | 69,494 | | | | 79,915 | | |
| Redemptions | | | (1,938,771 | ) | | | (1,359,274 | ) | |
| Exchange from Class B shares | | | 394,836 | | | | 212,880 | | |
| Net decrease | | | (1,396 | ) | | | (254,737 | ) | |
| | | Year Ended October 31, | |
| Class B | | 2007 | | 2006 | |
| Sales | | | 234,323 | | | | 156,749 | | |
Issued to shareholders electing to receive
payments of distributions in Fund shares | | | 14,276 | | | | 24,141 | | |
| Redemptions | | | (196,842 | ) | | | (304,470 | ) | |
| Exchange to Class A shares | | | (394,196 | ) | | | (212,880 | ) | |
| Net decrease | | | (342,439 | ) | | | (336,460 | ) | |
| | | Year Ended October 31, | |
| Class C | | 2007 | | 2006 | |
| Sales | | | 808,686 | | | | 198,848 | | |
Issued to shareholders electing to receive
payments of distributions in Fund shares | | | 51,844 | | | | 62,045 | | |
| Redemptions | | | (698,324 | ) | | | (1,329,515 | ) | |
| Net increase (decrease) | | | 162,206 | | | | (1,068,622 | ) | |
4 Transactions with Affiliates
EVM serves as the investment adviser and administrator of the Fund, providing the Fund with investment advisory services (relating to the investment of the Fund's assets in the Portfolios), and administering the business affairs of the Fund. Under the investment advisory and administrative agreement, EVM earns a fee in the amount of 0.15% per annum of average daily net assets of the Fund. Effective March 15, 2004, Eaton Vance agreed to waive its 0.15% fee in its entirety, such agreement being memorialized in a Fee Waiver Agreement between EVM and the Fund. This fee waiver cannot be eliminated or decreased without the approval of the Fund's Board of Trustees and shareholders and is intended to continue indefinitely. For the year ended October 31, 2007, the advisory and administration fee amounted to $57,350. Pursuant to the agreement, EVM waived $57,350 of the Fund's investment advisory and administrative fee for the year ended O ctober 31, 2007. Effective April 23, 2007, EVM agreed to reimburse the Fund's expenses to the extent that total Fund operating expenses exceed 1.00% for Class A shares, 1.75% for Class B shares and 1.60% for Class C shares. This expense reimbursement will continue through April 30, 2010. Thereafter, the expense reimbursement may be changed or terminated at any time. Pursuant to this agreement, EVM reimbursed the Fund $91,180 for the year ended October 31, 2007. The Portfolios have engaged BMR to render investment advisory services and the Fund is allocated its share of the investment advisory fee paid by each Portfolio in which it invests. EVM serves as the sub-transfer agent of the Fund and receives from the transfer agent an aggregate fee based upon the actual expenses
12
Eaton Vance Low Duration Fund as of October 31, 2007
NOTES TO FINANCIAL STATEMENTS CONT'D
incurred by EVM in the performance of those services. For the year ended October 31, 2007, EVM earned $2,568 in sub-transfer agent fees. Certain officers and Trustees of the Fund and Portfolios are officers of the above organizations. Except as to Trustees of the Fund and the Portfolios who are not members of EVM's or BMR's organization, officers and Trustees receive remuneration for their services to the Fund out of the investment adviser fee earned by BMR. The Fund was informed that EVD received $35,327 as its portion of the sales charge on sales of Class A shares for the year ended October 31, 2007. EVD also received distribution and service fees from Class A, Class B and Class C shares (see Note 5) and contingent deferred sales charges (see Note 6).
5 Distribution Plans
The Fund has in effect a distribution plan for Class A shares (Class A Plan) pursuant to Rule 12b-1 of the 1940 Act. The Class A Plan provides that the Fund will pay EVD a distribution and service fee of 0.25% per annum of the Fund's average daily net assets attributable to Class A shares for distribution services and facilities provided to the Fund by EVD, as well as for personal services and/or the maintenance of shareholder accounts. Distribution and service fees paid or accrued for the year ended October 31, 2007 amounted to $47,912 for Class A shares. The Fund also has in effect distribution plans for Class B shares (Class B Plan) and Class C shares (Class C Plan) pursuant to Rule 12b-1 the 1940 Act. The Class B Plan requires the Fund to pay EVD amounts equal to 0.75% per annum of the Fund's average daily net assets attributable to Class B shares for providing ongoing distribution services and facilities to the Fund. The Cl ass C Plan requires the Fund to pay EVD amounts equal to 0.60% per annum of the Fund's average daily net assets attributable to Class C shares for providing ongoing distribution services and facilities to the Fund. The Fund will automatically discontinue payments to EVD during any period in which there are no outstanding Uncovered Distribution Charges, which are equivalent to the sum of (i) 6.25% of the aggregate amount received by the Fund for the Class B and Class C shares sold, respectively, plus (ii) interest calculated by applying the rate of 1% over the prevailing prime rate to the outstanding balance of Uncovered Distribution Charges of EVD of each respective class, reduced by the aggregate amount of contingent deferred sales charges (see Note 6) and daily amounts theretofore paid to EVD by each respective class. The Fund paid or accrued $32,977 and $88,028 for Class B and Class C shares, respectively, to or payable to EVD for the year ended October 31, 2007, representing 0.75% and 0.60% of the averag e daily net assets for Class B and Class C shares, respectively. At October 31, 2007, the amount of Uncovered Distribution Charges of EVD calculated under the Plans was approximately $813,400 and $5,028,000 for Class B and Class C shares, respectively. The Class B and Class C Plans also authorize the Fund to make payments of service fees to EVD, investment dealers and other persons in amounts not exceeding 0.25% per annum of the average daily net assets attributable to that Class. Service fees are paid for personal services and/or the maintenance of shareholder accounts. They are separate and distinct from the Class B and Class C sales commissions and distribution fees and, as such, are not subject to automatic discontinuance when there are no outstanding Uncovered Distribution Charges to EVD. Service fees paid or accrued for the year ended October 31, 2007 amounted to $10,992, and $36,679, for Class B and Class C shares, respectively.
6 Contingent Deferred Sales Charge
A contingent deferred sales charge (CDSC) generally is imposed on redemptions of Class B shares made within four years of purchase and on redemptions of Class C shares made within one year of purchase. Class A shares of $1 million or more will be subject to a 1% CDSC in the event of redemption within eighteen months of purchase. Generally, the CDSC is based upon the lower of the net asset value at date of redemption or date of purchase. No charge is levied on shares acquired by reinvestment of dividends or capital gain distributions. The Class B CDSC is imposed at declining rates that begin at 3% in the case of redemptions in the first year after purchase, declining to 2.5% in the second year, 2.0% in the third year, 1.0% in the fourth year and 0.0% thereafter. Class C shares will be subject to a 1% CDSC if redeemed within one year of purchase. No CDSC is levied on shares which have been sold to EVM or its affiliates or to their respective employees or clients and may be waived under certain other limited conditions. CDSC charges are paid to EVD to reduce the amount of Uncovered Distribution Charges calculated under the Fund's Distribution Plans (see Note 5). CDSC charges received when no Uncovered Distribution Charges exist will be retained by the Fund. The Fund was informed that EVD received approximately $10,900, $12,100, and $1,800 of CDSC paid by shareholders for redemptions of Class A, Class B shares, and Class C shares, respectively, for the year ended October 31, 2007.
7 Investment Transactions
Increases and decreases in the Fund's investment in the Portfolios for the year ended October 31, 2007 are aggregated as follows:
| Portfolio | | Increases | | Decreases | |
| Investment Portfolio | | $ | 28,783,327 | | | $ | 32,748,902 | | |
| Floating-Rate Portfolio | | $ | 2,508,991 | | | $ | 2,658,049 | | |
13
Eaton Vance Low Duration Fund as of October 31, 2007
NOTES TO FINANCIAL STATEMENTS CONT'D
8 Recently Issued Accounting Pronouncements
In June 2006, the Financial Accounting Standards Board (FASB) issued FASB Interpretation No. 48 (FIN 48), "Accounting for Uncertainty in Income Taxes – an interpretation of FASB Statement No. 109". FIN 48 clarifies the accounting for uncertainty in income taxes recognized in accordance with FASB Statement No. 109, "Accounting for Income Taxes". This interpretation prescribes a recognition threshold and measurement attribute for the financial statement recognition and measurement of a tax position taken or expected to be taken in a tax return. It also provides guidance on de-recognition, classification, interest and penalties, accounting in interim periods, disclosure and transition. FIN 48 is effective on the last business day of the first required financial reporting period for fiscal years beginning after December 15, 2006. Management is currently evaluating the impact of applying the various provisions of FIN 48.
In September 2006, the FASB issued Statement of Financial Accounting Standards No. 157 (FAS 157), "Fair Value Measurements". FAS 157 defines fair value, establishes a framework for measuring fair value in accordance with generally accepted accounting principles and expands disclosure about fair value measurements. FAS 157 is effective for fiscal years beginning after November 15, 2007. Management is currently evaluating the impact the adoption of FAS 157 will have on the Fund's financial statement disclosures.
14
Eaton Vance Low Duration Fund as of October 31, 2007
REPORT OF INDEPENDENT REGISTERED PUBLIC ACCOUNTING FIRM
To the Trustees of the Eaton Vance Mutual Funds Trust and Shareholders of Eaton Vance Low Duration Fund:
We have audited the accompanying statement of assets and liabilities of Eaton Vance Low Duration Fund (the "Fund") (one of the series of Eaton Vance Mutual Funds Trust) as of October 31, 2007, and the related statement of operations, the statements of changes in net assets, and the financial highlights for the year then ended. These financial statements and financial highlights are the responsibility of the Fund's management. Our responsibility is to express an opinion on these financial statements and financial highlights based on our audit. The statement of changes in net assets for the year ended October 31, 2006 and the financial highlights for the year ended October 31, 2006 and all prior periods presented were audited by other auditors. Those auditors expressed an unqualified opinion on those financial statements and financial highlights in their report dated December 27, 2006.
We conducted our audit in accordance with the standards of the Public Company Accounting Oversight Board (United States). Those standards require that we plan and perform the audit to obtain reasonable assurance about whether the financial statements and financial highlights are free of material misstatement. The Fund is not required to have, nor were we engaged to perform, an audit of its internal control over financial reporting. Our audit included consideration of internal control over financial reporting as a basis for designing audit procedures that are appropriate in the circumstances, but not for the purpose of expressing an opinion on the effectiveness of the Fund's internal control over financial reporting. Accordingly, we express no such opinion. An audit also includes examining, on a test basis, evidence supporting the amounts and disclosures in the financial statements, assessing the accounting principles used and si gnificant estimates made by management, as well as evaluating the overall financial statement presentation. We believe that our audit provides a reasonable basis for our opinion.
In our opinion, the financial statements and financial highlights referred to above present fairly, in all material respects, the financial position of Eaton Vance Low Duration Fund as of October 31, 2007, the results of its operations, the changes in its net assets, and the financial highlights for the year then ended, in conformity with accounting principles generally accepted in the United States of America.
DELOITTE & TOUCHE LLP
Boston, Massachusetts
December 20, 2007
15
Eaton Vance Low Duration Fund as of October 31, 2007
FEDERAL TAX INFORMATION (Unaudited)
The Form 1099-DIV you receive in January 2008 will show the tax status of all distributions paid to your account in calendar 2007. Shareholders are advised to consult their own tax adviser with respect to the tax consequences of their investment in the Fund.
16
Investment Portfolio as of October 31, 2007
PORTFOLIO OF INVESTMENTS
| Mortgage Backed Securities — 97.8% | |
| Security | | Principal
Amount
(000's omitted) | | Value | |
| Mortgage Pass Throughs — 74.8% | |
| Federal Home Loan Mortgage Corp.: | |
| 5.527%, with various maturities to 2037(1) | | $ | 1,205 | | | $ | 1,185,975 | | |
| 6.25%, with maturity at 2022(1) | | | 863 | | | | 855,552 | | |
| 6.50%, with maturity at 2019 | | | 671 | | | | 696,294 | | |
| 7.50%, with maturity at 2017 | | | 587 | | | | 615,295 | | |
| 8.00%, with various maturities to 2025 | | | 1,047 | | | | 1,126,158 | | |
| 9.25%, with maturity at 2017 | | | 72 | | | | 73,920 | | |
| | | $ | 4,553,194 | | |
| Federal National Mortgage Association: | |
| 5.00%, with maturity at 2014 | | $ | 1,541 | | | $ | 1,542,959 | | |
| 5.50%, with maturity at 2018(1) | | | 73 | | | | 71,921 | | |
| 5.50%, with various maturities to 2016 | | | 2,555 | | | | 2,572,699 | | |
| 5.527%, with various maturities to 2035(1) | | | 2,287 | | | | 2,258,351 | | |
| 5.561%, with maturity at 2036(1) | | | 1,295 | | | | 1,279,476 | | |
| 5.569%, with maturity at 2036(1) | | | 1,119 | | | | 1,105,705 | | |
| 5.609%, with maturity at 2027(1) | | | 1,775 | | | | 1,753,218 | | |
| 5.664%, with maturity at 2018(1) | | | 194 | | | | 191,094 | | |
| 6.00%, with various maturities to 2031 | | | 2,350 | | | | 2,388,164 | | |
| 6.344%, with maturity at 2032(1) | | | 1,216 | | | | 1,220,291 | | |
| 6.50%, with various maturities to 2019 | | | 3,510 | | | | 3,592,999 | | |
| 7.00%, with various maturities to 2016 | | | 1,785 | | | | 1,850,768 | | |
| 8.00%, with maturity at 2023 | | | 365 | | | | 397,546 | | |
| 9.00%, with maturity at 2011 | | | 382 | | | | 387,271 | | |
| 9.50%, with various maturities to 2022 | | | 2,000 | | | | 2,182,785 | | |
| 9.601%, with maturity at 2018(2) | | | 979 | | | | 1,084,773 | | |
| | | $ | 23,880,020 | | |
| Goverment National Mortgage Association: | |
| 6.125%, with various maturities to 2027(1) | | $ | 1,767 | | | $ | 1,787,613 | | |
| 8.25%, with maturity at 2020 | | | 555 | | | | 605,385 | | |
| 9.00%, with maturity at 2017 | | | 747 | | | | 824,363 | | |
| | | $ | 3,217,361 | | |
| | | $ | 31,650,575 | | |
| Collateralized Mortgage Obligations — 13.4% | |
| Security | | Principal
Amount
(000's omitted) | | Value | |
| FHLMC, Series 1395, Class F, 5.009%, due 2022(3) | | $ | 202 | | | $ | 197,497 | | |
| FHLMC, Series 1694, Class PQ, 6.50%, due 2023 | | | 95 | | | | 95,006 | | |
| FNMA, Series 1993-140, Class J, 6.65%, due 2013 | | | 1,157 | | | | 1,163,102 | | |
| FNMA, Series 1993-250, Class Z, 7.00%, due 2023 | | | 826 | | | | 854,172 | | |
| FNMA, Series 2001-4, Class GA, 10.246%, due 2025(3)(4) | | | 552 | | | | 612,463 | | |
| FNMA, Series G93-17, Class FA, 5.875%, due 2023(3) | | | 407 | | | | 415,624 | | |
| FNMA, Series G93-36, Class ZQ, 6.50%, due 2023 | | | 1,880 | | | | 1,943,795 | | |
| Security | | Principal
Amount
(000's omitted) | | Value | |
| FNMA, Series G97-4, Class FA, 5.863%, due 2027(3) | | $ | 369 | | | $ | 374,537 | | |
| | | $ | 5,656,196 | | |
| Commercial Mortgage Backed Securities — 9.6% | |
| Security | | Principal
Amount
(000's omitted) | | Value | |
GS Mortgage Securities Corp. II, Series 2001-LIB, Class A2,
144A, 6.615%, due 2016(5) | | $ | 1,000 | | | $ | 1,059,610 | | |
GS Mortgage Securities Corp. II, Series 2001-Rock, Class A2FL,
5.481%, due 2018(3)(5) | | | 2,000 | | | | 2,020,869 | | |
Mortgage Capital Funding, Inc., Series 1998-MC1, Class C,
6.947%, due 2030 | | | 1,000 | | | | 999,157 | | |
| | | $ | 4,079,636 | | |
Total Mortgage Backed Securities
(identified cost $41,383,884) | | $ | 41,386,407 | | |
| Short-Term Investments — 1.7% | |
| Description | | Interest
(000's omitted) | | Value | |
| Investment in Cash Management Portfolio, 4.83%(6) | | $ | 746 | | | $ | 746,202 | | |
Total Short-Term Investments
(identified cost, $746,202) | | $ | 746,202 | | |
Total Investments — 99.5%
(identified cost $42,130,086) | | $ | 42,132,609 | | |
| Other Assets, Less Liabilities — 0.5% | | $ | 191,049 | | |
| Net Assets — 100.0% | | $ | 42,323,658 | | |
FHLMC - Federal Home Loan Mortgage Corporation (Freddie Mac)
FNMA - Federal National Mortgage Association (Fannie Mae)
GNMA - Government National Mortgage Association (Ginnie Mae)
(1) Adjustable rate mortgage.
(2) Weighted average fixed-rate coupon that changes/updates monthly.
(3) Variable rate obligation. The stated interest rate represents the rate in effect at October 31, 2007.
(4) Security (or a portion thereof) has been segregated to cover margin requirements on open financial futures contracts.
(5) Security exempt from registration under Rule 144A of the Securities Act of 1933. These securities may be sold in transactions exempt from registration, normally to qualified institutional buyers. At October 31, 2007, the aggregate value of the securities is $3,080,479 or 7.3% of the Portfolio's net assets.
(6) Affiliated investment company available to Eaton Vance portfolios and funds which invests in high quality U.S. dollar denominated money market instruments. The rate shown is the annualized seven-day yield as of October 31, 2007.
See notes to financial statements
17
Investment Portfolio as of October 31, 2007
FINANCIAL STATEMENTS
Statement of Assets and Liabilities
As of October 31, 2007
| Assets | |
| Unaffiliated investments, at value (identified cost, $41,383,884) | | $ | 41,386,407 | | |
| Affiliated investment, at value (identified cost, $746,202) | | | 746,202 | | |
| Receivable for investments sold | | | 44,340 | | |
| Interest receivable | | | 226,945 | | |
| Interest receivable from affiliated investment | | | 1,510 | | |
| Total assets | | $ | 42,405,404 | | |
| Liabilities | |
| Payable for daily variation margin on open financial futures contracts | | $ | 19,219 | | |
| Payable to affiliate for investment advisory fees | | | 17,821 | | |
| Payable to affiliate for Trustees' fees | | | 166 | | |
| Accrued expenses | | | 44,540 | | |
| Total liabilities | | $ | 81,746 | | |
| Net Assets applicable to investors' interest in Portfolio | | $ | 42,323,658 | | |
| Sources of Net Assets | |
| Net proceeds from capital contributions and withdrawals | | $ | 42,276,474 | | |
| Net unrealized appreciation (computed on the basis of identified cost) | | | 47,184 | | |
| Total | | $ | 42,323,658 | | |
Statement of Operations
For the Year Ended
October 31, 2007
| Investment Income | |
| Interest | | $ | 1,862,267 | | |
| Interest income allocated from affiliated investment | | | 119,594 | | |
| Expenses allocated from affliated investment | | | (11,251 | ) | |
| Total investment income | | $ | 1,970,610 | | |
| Expenses | |
| Investment adviser fee | | $ | 174,214 | | |
| Trustees' fees and expenses | | | 1,871 | | |
| Custodian fee | | | 31,305 | | |
| Legal and accounting services | | | 30,760 | | |
| Miscellaneous | | | 3,190 | | |
| Total expenses | | $ | 241,340 | | |
Deduct —
Reduction of custodian fee | | $ | 71 | | |
| Total expense reductions | | $ | 71 | | |
| Net expenses | | $ | 241,269 | | |
| Net investment income | | $ | 1,729,341 | | |
| Realized and Unrealized Gain (Loss) | |
Net realized gain (loss) —
Investment transactions (identified cost basis) | | $ | (28,855 | ) | |
| Financial futures contracts | | | 44,811 | | |
| Net realized gain | | $ | 15,956 | | |
Change in unrealized appreciation (depreciation) —
Investments (identified cost basis) | | $ | 215,329 | | |
| Financial futures contracts | | | 17,317 | | |
| Net change in unrealized appreciation (depreciation) | | $ | 232,646 | | |
| Net realized and unrealized gain | | $ | 248,602 | | |
| Net increase in net assets from operations | | $ | 1,977,943 | | |
See notes to financial statements
18
Investment Portfolio as of October 31, 2007
FINANCIAL STATEMENTS CONT'D
Statements of Changes in Net Assets
Increase (Decrease)
in Net Assets | | Year Ended
October 31, 2007 | | Year Ended
October 31, 2006 | |
From operations —
Net investment income | | $ | 1,729,341 | | | $ | 1,619,104 | | |
Net realized gain (loss) from investment
transactions and financial
futures contracts | | | 15,956 | | | | (132,593 | ) | |
Net change in unrealized appreciation
(depreciation) from investments and
financial futures contracts | | | 232,646 | | | | 177,397 | | |
| Net increase in net assets from operations | | $ | 1,977,943 | | | $ | 1,663,908 | | |
Capital transactions —
Contributions | | $ | 34,404,809 | | | $ | 23,127,039 | | |
| Withdrawals | | | (32,894,354 | ) | | | (31,997,057 | ) | |
Net increase (decrease) in net assets from
capital transactions | | $ | 1,510,455 | | | $ | (8,870,018 | ) | |
| Net increase (decrease) in net assets | | $ | 3,488,398 | | | $ | (7,206,110 | ) | |
| Net Assets | |
| At beginning of year | | $ | 38,835,260 | | | $ | 46,041,370 | | |
| At end of year | | $ | 42,323,658 | | | $ | 38,835,260 | | |
See notes to financial statements
19
Investment Portfolio as of October 31, 2007
FINANCIAL STATEMENTS CONT'D
Supplementary Data
| | | Year Ended October 31, | | Period Ended | | Year Ended | | Period Ended | |
| | | 2007 | | 2006 | | 2005 | | October 31, 2004(1) | | December 31, 2003 | | December 31, 2002(2) | |
| Ratios/Supplemental Data | |
| Ratios (As a percentage of average daily net assets): | |
| Expenses before custodian fee reduction | | | 0.65 | % | | | 0.66 | % | | | 0.65 | % | | | 0.62 | %(3) | | | 0.59 | % | | | 0.50 | %(3)(4) | |
| Expenses after custodian fee reduction | | | 0.65 | % | | | 0.66 | % | | | 0.64 | % | | | 0.62 | %(3) | | | 0.59 | % | | | 0.50 | %(3)(4) | |
| Net investment income | | | 4.67 | % | | | 4.03 | % | | | 2.65 | % | | | 1.51 | %(3) | | | 0.92 | % | | | 0.84 | %(3) | |
| Portfolio Turnover | | | 35 | % | | | 46 | % | | | 67 | % | | | 92 | % | | | 43 | % | | | 0 | % | |
| Total Return | | | 5.52 | % | | | 4.29 | % | | | 2.32 | % | | | 1.12 | %(5) | | | 0.74 | % | | | 0.23 | %(5) | |
| Net assets, end of year (000's omitted) | | $ | 42,324 | | | $ | 38,835 | | | $ | 46,041 | | | $ | 58,345 | | | $ | 72,157 | | | $ | 25,058 | | |
(1) For the ten-month period ended October 31, 2004.
(2) For the period from the start of business, September 30, 2002, to December 31, 2002.
(3) Annualized.
(4) The investment adviser waived a portion of its investment advisory fee (equal to 0.57% of average daily net assets for the period ended December 31, 2002).
(5) Not annualized.
See notes to financial statements
20
Investment Portfolio as of October 31, 2007
NOTES TO FINANCIAL STATEMENTS
1 Significant Accounting Policies
Investment Portfolio (the Portfolio) is registered under the Investment Company Act of 1940, as amended (the 1940 Act), as a diversified open-end management investment company. The Portfolio was organized as a trust under the laws of the State of New York on June 18, 2002. The Portfolio seeks total return by investing in a broad range of fixed income securities, including mortgage backed securities (MBS) issued, backed or otherwise guaranteed by the U.S. Government or its agencies or instrumentalities, U.S. Government obligations, corporate bonds, preferred stocks, asset-backed securities and money market instruments. The Declaration of Trust permits the Trustees to issue interests in the Portfolio. At October 31, 2007, Eaton Vance Low Duration Fund and Eaton Vance Strategic Income Fund held an approximate 86.5% and 11.5% interest in the Portfolio, respectively. The following is a summary of significant accounting policies of the Portfolio. The policies are in conformity with accounting principles generally accepted in the United States of America.
A Investment Valuation — Debt securities (including collateralized mortgage obligations and certain MBS) normally are valued by an independent pricing service. The pricing service considers various factors relating to bonds or loans and/or market transactions to determine market value. Most seasoned 30-year fixed rate MBS are valued by the investment adviser's matrix pricing system. The matrix pricing system also considers various factors relating to bonds and market transactions to determine market value. Short-term debt securities with a remaining maturity of 60 days or less are valued at amortized cost, which approximates marke t value. If short-term debt securities are acquired with a remaining maturity of more than 60 days, they will be valued by a pricing service. Investments held by the Portfolio for which valuations or market quotations are unavailable are valued at fair value using methods determined in good faith by or at the direction of the Trustees of the Portfolio considering relevant factors, data and information including the market value of freely tradable securities of the same class in the principal market on which such securities are normally traded.
The Portfolio may invest in Cash Management Portfolio (Cash Management), an affiliated investment company managed by Boston Management and Research (BMR), a subsidiary of Eaton Vance Management (EVM). Cash Management values its investment securities utilizing the amortized cost valuation technique permitted by Rule 2a-7 of the 1940 Act. This technique involves initially valuing a portfolio security at its cost and thereafter assuming a constant amortization to maturity of any discount or premium.
B Investment Transactions — Investment transactions are accounted for on a trade date basis. Realized gains and losses on securities sold are determined on the basis of identified cost.
C Income — Interest income is determined on the basis of interest accrued adjusted for amortization of premium or accretion of discount. Dividend income is recorded on the ex-dividend date for dividend, received in cash and/or securities.
D Federal Taxes — The Portfolio has elected to be treated as a partnership for federal tax purposes. No provision is made by the Portfolio for federal or state taxes on any taxable income of the Portfolio because each investor in the Portfolio is ultimately responsible for the payment of any taxes on its share of taxable income. Since at least one of the Portfolio's investors is a regulated investment company that invests all or substantially all of its assets in the Portfolio, the Portfolio normally must satisfy the applicable source of income and diversification requirements (under the Internal Revenue Code) in order for its investors to satisfy them. The Portfolio will allocate, at least annually among its investors, each investor's distributive share of the Portfolio' s net investment income, net realized capital gains and any other items of income, gain, loss, deduction or credit.
E Expense Reduction — State Street Bank and Trust Company (SSBT) serves as custodian of the Portfolio. Pursuant to the custodian agreement, SSBT receives a fee reduced by credits, which are determined based on the average daily cash balance the Portfolio maintains with SSBT. All credit balances, if any, used to reduce the Portfolio's custodian fees are reported as a reduction of expenses in the Statement of Operations.
F Use of Estimates — The preparation of the financial statements in conformity with accounting principles generally accepted in the United States of America requires management to make estimates and assumptions that affect the reported amounts of assets and liabilities at the date of the financial statements and the reported amounts of income and expense during the reporting period. Actual results could differ from those estimates.
G Indemnifications — Under the Portfolio's organizational documents, its officers and Trustees may be indemnified against certain liabilities and expenses arising out of the performance of their duties to the Portfolio. Interestholders in the Portfolio are jointly and severally liable for the liabilities and obligations of the Portfolio in the event that the Portfolio fails to satisfy such liabilities
21
Investment Portfolio as of October 31, 2007
NOTES TO FINANCIAL STATEMENTS CONT'D
and obligations; provided, however, that, to the extent assets are available in the Portfolio, the Portfolio may, under certain circumstances, indemnify interestholders from and against any claim or liability to which such holder may become subject by reason of being or having been an interestholder in the Portfolio. Additionally, in the normal course of business, the Portfolio enters into agreements with service providers that may contain indemnification clauses. The Portfolio's maximum exposure under these arrangements is unknown as this would involve future claims that may be made against the Portfolio that have not yet occurred.
2 Investment Adviser Fee and Other Transactions with Affiliates
The investment adviser fee is earned by BMR, as compensation for management and investment advisory services rendered to the Portfolio. The fee is computed at a rate of 0.50% per annum of the Portfolio's average daily net assets. For the year ended October 31, 2007, the Portfolio's advisory fee totaled $185,055 of which $10,841 was allocated from Cash Management and $174,214 was paid or accrued directly by the Portfolio. For the year ended October 31, 2007, the Portfolio's advisory fee, including the portion allocated from Cash Management, was 0.50% of the Portfolio's average daily net assets. Except as to Trustees of the Portfolio who are not members of EVM's or BMR's organization, officers and Trustees receive remuneration for their services to the Portfolio out of such investment adviser fee. Trustees of the Portfolio that are not affiliated with the investment adviser may elect to defer receipt of all or a percentage of thei r annual fees in accordance with the terms of the Trustees Deferred Compensation Plan. For the year ended October 31, 2007, no significant amounts have been deferred.
Certain officers and Trustees of the Portfolio are officers of the above organizations.
3 Investment Transactions
Purchases and sales of U.S. Government and agency obligations, other than short-term obligations and including paydowns on mortgage backed securities in Investment Portfolio, aggregated $15,011,408 and $12,138,919, respectively. Purchases and sales of non-U.S. Government and agency obligations including paydowns aggregated $4,055,351 and none, respectively.
4 Federal Income Tax Basis of Unrealized Appreciation (Depreciation)
The cost and unrealized appreciation (depreciation) in value of the investments owned at October 31, 2007, as determined on a federal income tax basis, were as follows:
| Aggregate cost | | $ | 42,313,234 | | |
| Gross unrealized appreciation | | $ | 305,912 | | |
| Gross unrealized depreciation | | | (486,537 | ) | |
| Net unrealized depreciation | | $ | (180,625 | ) | |
5 Line of Credit
The Portfolio participates with other portfolios and funds managed by EVM and its affiliates in a $200 million unsecured line of credit agreement with a group of banks. Borrowings will be made by the Portfolio solely to facilitate the handling of unusual and/or unanticipated short-term cash requirements. Interest is charged to the Portfolio based on its borrowings at an amount above either the Eurodollar rate or Federal Funds rate. In addition, a fee computed at an annual rate of 0.07% on the daily unused portion of the line of credit is allocated among the participating portfolios and funds at the end of each quarter. The Portfolio did not have any significant borrowings or allocated fees during the year ended October 31, 2007.
6 Financial Instruments
The Portfolio may trade in financial instruments with off-balance sheet risk in the normal course of its investing activities to assist in managing exposure to various market risks. These financial instruments may include written options and financial futures contractsand may involve, to a varying degree, elements of risk in excess of the amounts recognized for financial statement purposes. The notional or contractual amounts of these instruments represent the investment the Portfolio has in particular classes of financial instruments and does not necessarily represent the amounts potentially subject to risk. The measurement of the risks associated with these instruments is meaningful only when all related and offsetting transactions are considered. A summary of obligations under these financial instruments at October 31, 2007 is as follows:
Futures Contracts
Expiration
Date | | Contracts | | Position | | Aggregate
Cost | | Value | | Net Unrealized
Appreciation | |
| | 12/07 | | | | 30 | U.S Treasury Note | | Long | | $ | 3,255,808 | | | $ | 3,300,469 | | | $ | 44,661 | | |
22
Investment Portfolio as of October 31, 2007
NOTES TO FINANCIAL STATEMENTS CONT'D
At October 31, 2007, the Portfolio had sufficient cash and/or securities to cover margin requirements on any open futures contracts.
7 Recently Issued Accounting Pronouncements
In June 2006, the Financial Accounting Standards Board (FASB) issued FASB Interpretation No. 48 (FIN 48), "Accounting for Uncertainty in Income Taxes – an interpretation of FASB Statement No. 109". FIN 48 clarifies the accounting for uncertainty in income taxes recognized in accordance with FASB Statement No. 109, "Accounting for Income Taxes". This interpretation prescribes a recognition threshold and measurement attribute for the financial statement recognition and measurement of a tax position taken or expected to be taken in a tax return. It also provides guidance on de-recognition, classification, interest and penalties, accounting in interim periods, disclosure and transition. FIN 48 is effective on the last business day of the first required financial reporting period for fiscal years beginning after December 15, 2006. Management is currently evaluating the impact of applying the various provisions of FIN 48.
In September 2006, the FASB issued Statement of Financial Accounting Standards No. 157 (FAS 157), "Fair Value Measurements". FAS 157 defines fair value, establishes a framework for measuring fair value in accordance with generally accepted accounting principles and expands disclosure about fair value measurements. FAS 157 is effective for fiscal years beginning after November 15, 2007. Management is currently evaluating the impact the adoption of FAS 157 will have on the Portfolio's financial statement disclosures.
23
Investment Portfolio as of October 31, 2007
REPORT OF INDEPENDENT REGISTERED PUBLIC ACCOUNTING FIRM
To the Trustees and Investors
of Investment Portfolio:
We have audited the accompanying statement of assets and liabilities of Investment Portfolio (the "Portfolio"), including the portfolio of investments, as of October 31, 2007, and the related statements of operations, the statement of changes in net assets, and the supplementary data for the year then ended. These financial statements and supplementary data are the responsibility of the Portfolio's management. Our responsibility is to express an opinion on these financial statements and supplementary data based on our audit. The statement of changes in net assets for the year ended October 31, 2006 and the supplementary data for the year ended October 31, 2006 and all prior periods presented, were audited by other auditors. Those auditors expressed an unqualified opinion on those financial statements and supplementary data in their report dated December 27, 2006.
We conducted our audit in accordance with the standards of the Public Company Accounting Oversight Board (United States). Those standards require that we plan and perform the audit to obtain reasonable assurance about whether the financial statements and supplementary data are free of material misstatement. The Portfolio is not required to have, nor were we engaged to perform, an audit of its internal control over financial reporting. Our audit included consideration of internal control over financial reporting as a basis for designing audit procedures that are appropriate in the circumstances, but not for the purpose of expressing an opinion on the effectiveness of the Portfolio's internal control over financial reporting. Accordingly, we express no such opinion. An audit also includes examining, on a test basis, evidence supporting the amounts and disclosures in the financial statements, assessing the accounting principles used and significant estimates made by management, as well as evaluating the overall financial statement presentation. We believe that our audit provides a reasonable basis for our opinion.
In our opinion, the financial statements and supplementary data referred to above present fairly, in all material respects, the financial position of Investment Portfolio as of October 31, 2007, the results of its operations for the year then ended, the changes in its net assets, and the supplementary data for the year then ended, in conformity with accounting principles generally accepted in the United States of America.
DELOITTE & TOUCHE LLP
Boston, Massachusetts
December 20, 2007
24
Eaton Vance Low Duration Fund and Investment Portfolio as of October 31, 2007
OTHER MATTERS (unaudited)
Change in Independent Registered Public Accounting Firm
On August 6, 2007, PricewaterhouseCoopers LLP resigned in the ordinary course as the independent registered public accounting firm for the Fund and Portfolio.
The reports of PricewaterhouseCoopers LLP on the Fund's and Portfolio's financial statements for each of the last two fiscal years contained no adverse opinion or disclaimer of opinion and were not qualified or modified as to uncertainty, audit scope or accounting principle. There have been no disagreements with PricewaterhouseCoopers LLP during the Fund's and Portfolio's two most recent fiscal years and any subsequent interim period on any matter of accounting principles or practices, financial statement disclosure or auditing scope or procedure, which disagreements if not resolved to the satisfaction of PricewaterhouseCoopers LLP, would have caused them to make reference thereto in their reports on the Fund's and Portfolio's financial statements for such years, and there were no reportable events of the kind described in Item 304 (a)(1)(v) of Regulation S-K under the Securities Exchange Act of 1934, as amended.
At a meeting held on August 6, 2007, based on Audit Committee recommendations and approvals, the full Board of Trustees of the Fund and Portfolio approved Deloitte & Touche LLP as the Fund's and Portfolio's independent registered public accounting firm for the fiscal year ending October 31, 2007. To the best of the Fund's and Portfolio's knowledge, for the fiscal years ended October 31, 2006 and October 31, 2005, and through August 6, 2007, the Fund and Portfolio did not consult with Deloitte & Touche LLP on items which concerned the application of accounting principles to a specified transaction, either completed or proposed, or the type of audit opinion that might be rendered on the Fund's and Portfolio's financial statements or concerned the subject of a disagreement (as defined in paragraph (a)(1)(iv) of Item 304 of Regulation S-K) or reportable events (as described in paragraph (a)(1)(v) of Item 304 of Regulation S- K).
25
Eaton Vance Low Duration Fund
BOARD OF TRUSTEES' ANNUAL APPROVAL OF THE INVESTMENT ADVISORY AGREEMENTS
Overview of the Contract Review Process
The Investment Company Act of 1940, as amended (the "1940 Act"), provides, in substance, that each investment advisory agreement between a fund and its investment adviser will continue in effect from year to year only if its continuance is approved at least annually by the fund's board of trustees, including by a vote of a majority of the trustees who are not "interested persons" of the fund ("Independent Trustees"), cast in person at a meeting called for the purpose of considering such approval.
At a meeting of the Boards of Trustees (each a "Board") of the Eaton Vance group of mutual funds (the "Eaton Vance Funds") held on April 23, 2007, the Board, including a majority of the Independent Trustees, voted to approve continuation of existing advisory and sub-advisory agreements for the Eaton Vance Funds for an additional one-year period. In voting its approval, the Board relied upon the affirmative recommendation of the Special Committee of the Board, which is a committee comprised exclusively of Independent Trustees. Prior to making its recommendation, the Special Committee reviewed information furnished for a series of meetings of the Special Committee held in February, March and April 2007. Such information included, among other things, the following:
Information about Fees, Performance and Expenses
• An independent report comparing the advisory and related fees paid by each fund with fees paid by comparable funds;
• An independent report comparing each fund's total expense ratio and its components to comparable funds;
• An independent report comparing the investment performance of each fund to the investment performance of comparable funds over various time periods;
• Data regarding investment performance in comparison to relevant peer groups of funds and appropriate indices;
• Comparative information concerning fees charged by each adviser for managing other mutual funds and institutional accounts using investment strategies and techniques similar to those used in managing the fund;
• Profitability analyses for each adviser with respect to each fund;
Information about Portfolio Management
• Descriptions of the investment management services provided to each fund, including the investment strategies and processes employed;
• Information concerning the allocation of brokerage and the benefits received by each adviser as a result of brokerage allocation, including information concerning the acquisition of research through "soft dollar" benefits received in connection with the funds' brokerage, and the implementation of a soft dollar reimbursement program established with respect to the funds;
• Data relating to portfolio turnover rates of each fund;
• The procedures and processes used to determine the fair value of fund assets and actions taken to monitor and test the effectiveness of such procedures and processes;
Information about each Adviser
• Reports detailing the financial results and condition of each adviser;
• Descriptions of the qualifications, education and experience of the individual investment professionals whose responsibilities include portfolio management and investment research for the funds, and information relating to their compensation and responsibilities with respect to managing other mutual funds and investment accounts;
• Copies of the Codes of Ethics of each adviser and its affiliates, together with information relating to compliance with and the administration of such codes;
• Copies of or descriptions of each adviser's proxy voting policies and procedures;
• Information concerning the resources devoted to compliance efforts undertaken by each adviser and its affiliates on behalf of the funds (including descriptions of various compliance programs) and their record of compliance with investment policies and restrictions, including policies with respect to market-timing, late trading and selective portfolio disclosure, and with policies on personal securities transactions;
• Descriptions of the business continuity and disaster recovery plans of each adviser and its affiliates;
Other Relevant Information
• Information concerning the nature, cost and character of the administrative and other non-investment management services provided by Eaton Vance Management and its affiliates;
• Information concerning management of the relationship with the custodian, subcustodians and fund accountants by each adviser or the funds' administrator; and
• The terms of each advisory agreement.
26
Eaton Vance Low Duration Fund
BOARD OF TRUSTEES' ANNUAL APPROVAL OF THE INVESTMENT ADVISORY AGREEMENTS CONT'D
In addition to the information identified above, the Special Committee considered information provided from time to time by each adviser throughout the year at meetings of the Board and its committees. Over the course of the twelve-month period ended April 30, 2007, the Board met ten times and the Special Committee, the Audit Committee and the Governance Committee, each of which is a Committee comprised solely of Independent Trustees, met twelve, fourteen and eight times, respectively. At such meetings, the Trustees received, among other things, presentations by the portfolio managers and other investment professionals of each adviser relating to the investment performance of each fund and the investment strategies used in pursuing the fund's investment objective.
For funds that invest through one or more underlying portfolios, the Board considered similar information about the portfolio(s) when considering the approval of advisory agreements. In addition, in cases where the fund's investment adviser has engaged a sub-adviser, the Board considered similar information about the sub-adviser when considering the approval of any sub-advisory agreement.
The Special Committee was assisted throughout the contract review process by Goodwin Procter LLP, legal counsel for the Independent Trustees. The members of the Special Committee relied upon the advice of such counsel and their own business judgment in determining the material factors to be considered in evaluating each advisory and sub-advisory agreement and the weight to be given to each such factor. The conclusions reached with respect to each advisory and sub-advisory agreement were based on a comprehensive evaluation of all the information provided and not any single factor. Moreover, each member of the Special Committee may have placed varying emphasis on particular factors in reaching conclusions with respect to each advisory and sub-advisory agreement.
Results of the Process
Based on its consideration of the foregoing, and such other information as it deemed relevant, including the factors and conclusions described below, the Special Committee concluded that the continuance of the investment advisory agreement of the Eaton Vance Low Duration Fund (the "Fund") with Eaton Vance Management ("EVM"), as well as the investment advisory agreements of the Floating Rate Portfolio, the Government Obligations Portfolio and the Investment Portfolio (the "Portfolios"), the portfolios in which the Fund invests, each with Boston Management and Research ("BMR"), including their fee structures, is in the interests of shareholders and, therefore, the Special Committee recommended to the Board approval of each agreement. The Board accepted the recommendation of the Special Committee as well as the factors considered and conclusions reached by the Special Committee with respect to each agreement. Accordingly, the Board , including a majority of the Independent Trustees, voted to approve continuation of the investment advisory agreements for the Fund and the Portfolios. EVM and BMR are each referred to as an "Adviser" herein; EVM with respect to the Fund and BMR with respect to the Portfolios. EVM and BMR are affiliates.
Nature, Extent and Quality of Services
In considering whether to approve the investment advisory agreement of the Fund and each Portfolio, the Board evaluated the nature, extent and quality of services provided to each Portfolio by BMR and to the Fund by EVM. BMR manages the Portfolios, while EVM allocates the assets of the Fund among the Portfolios.
The Board considered BMR's management capabilities and investment process with respect to the types of investments held by the Portfolios, including the education, experience and number of its investment professionals and other personnel who provide portfolio management, investment research, and similar services to the Portfolios. In particular, the Board evaluated the abilities and experience of such investment personnel in analyzing special considerations relevant to investing in investment grade securities. With respect to the Floating Rate Portfolio, the Board noted the experience of BMR's 30 bank loan investment professionals and other personnel who provide services to the Portfolios, including five portfolio managers and 17 analysts. With respect to the Government Obligations Portfolio, the Board noted the Adviser's experience in investing in mortgage-backed securities, including seasoned mortgage-backed securities. For al l the Portfolios, the Board also took into account the resources dedicated to portfolio management and other services, including the compensation paid to recruit and retain investment personnel, and the time and attention devoted to the Fund by senior management.
The Board reviewed the compliance programs of the Adviser and relevant affiliates thereof. Among other matters, the Board considered compliance and reporting matters relating to personal trading by investment personnel, selective disclosure of portfolio holdings, late trading, frequent trading, portfolio valuation, business continuity and the allocation of investment opportunities. The Board also evaluated the responses of the Adviser and its affiliates to requests from regulatory authorities such as the Securities and Exchange Commission and the National Association of Securities Dealers.
The Board considered shareholder and other administrative services provided or managed by Eaton Vance Management and its affiliates, including transfer agency and accounting services. The Board evaluated the benefits to shareholders of investing in a fund that is a part of a large family of funds, including the ability, in many cases, to exchange an investment among different funds without incurring additional sales charges.
27
Eaton Vance Low Duration Fund
BOARD OF TRUSTEES' ANNUAL APPROVAL OF THE INVESTMENT ADVISORY AGREEMENTS CONT'D
After consideration of the foregoing factors, among others, the Board concluded that the nature, extent and quality of services provided by the Adviser, taken as a whole, are appropriate and consistent with the terms of the investment advisory agreements.
Fund Performance
The Board compared the Fund's investment performance to a relevant universe of similarly managed funds identified by an independent data provider and appropriate benchmark indices for the one- and three-year periods ended September 30, 2006 for the Fund. The Board also considered the performance of the underlying Portfolios. The Board concluded that the Fund's performance was satisfactory.
Management Fees and Expenses
The Board reviewed contractual investment advisory fee rates, including any administrative fee rates, payable by the Portfolios and the Fund (referred to as "management fees"). As part of its review, the Board considered the management fees and the Fund's total expense ratio for the one-year period ended September 30, 2006, as compared to a group of similarly managed funds selected by an independent data provider. The Board considered that EVM is waiving its investment advisory and administration fee in its entirety and has agreed to pay other expenses of the Fund, which will lower the Fund's total expense ratios.
After reviewing the foregoing information, and in light of the nature, extent and quality of the services provided by the Adviser, the Board concluded that, given the small asset size of the Fund, the management fees charged for advisory and related services and the Fund's total expense ratio are reasonable.
Profitability
The Board reviewed the level of profits realized by the Adviser and relevant affiliates thereof in providing investment advisory and administrative services to the Fund, the Portfolios and all Eaton Vance Funds as a group. The Board considered the level of profits realized without regard to revenue sharing or other payments by the Adviser and its affiliates to third parties in respect of distribution services. The Board also considered other direct or indirect benefits received by the Adviser and its affiliates in connection with its relationship with the Fund and the Portfolios.
The Board concluded that, in light of the foregoing factors and the nature, extent and quality of the services rendered, the profits realized by the Adviser and its affiliates are reasonable.
Economies of Scale
In reviewing management fees and profitability, the Board also considered the extent to which the Adviser and its affiliates, on the one hand, and the Fund, on the other hand, can expect to realize benefits from economies of scale as the assets of the Fund and the Portfolios increase. The Board acknowledged the difficulty in accurately measuring the benefits resulting from the economies of scale with respect to the management of any specific fund or group of funds. The Board reviewed data summarizing the increases and decreases in the assets of the Portfolios and of all Eaton Vance Funds as a group over various time periods, and evaluated the extent to which the total expense ratio of the Fund and the profitability of the Adviser and its affiliates may have been affected by such increases or decreases. Based upon the foregoing, the Board concluded that the benefits from economies of scale are currently being shared equitably by the Adviser and its affiliates and the Fund. The Board also concluded that, assuming reasonably foreseeable increases in the assets of the Portfolios, the structure of the advisory fees, which include breakpoints at several asset levels, can be expected to cause the Adviser and its affiliates and the Fund to continue to share such benefits equitably.
28
Eaton Vance Low Duration Fund
MANAGEMENT AND ORGANIZATION
Fund Management. The Trustees of Eaton Vance Mutual Funds Trust (the Trust), Floating Rate Portfolio (FRP), Government Obligations Portfolio (GOP), and Investment Portfolio (IP), are responsible for the overall management and supervision of the Trust's and Portfolios' affairs. The Trustees and officers of the Trust and the Portfolios are listed below. Except as indicated, each individual has held the office shown or other offices in the same company for the last five years. Trustees and officers of the Trust and the Portfolios hold indefinite terms of office. The "noninterested Trustees" consist of those Trustees who are not "interested persons" of the Trust and the Portfolios, as that term is defined under the 1940 Act. The business address of each Trustee and officer is The Eaton Vance Building, 255 State Street, Boston, Massachusetts 02109. As used below, "EVC" refers to Eaton Vance Corp., "EV" refers to Eaton Vance, Inc., "EVM" refers to Eaton Vance Management, "BMR" refers to Boston Management and Research, "Parametric" refers to Parametric Portfolio Associates, and "EVD" refers to Eaton Vance Distributors, Inc. EVC and EV are the corporate parent and trustee, respectively, of EVM and BMR. EVD is the Fund's principal underwriter, the Portfolios' placement agent and a wholly-owned subsidiary of EVM. Each officer affiliated with Eaton Vance may hold a position with other Eaton Vance affiliates that is comparable to his or her position with EVM listed below.
Name and
Date of Birth | | Position(s)
with the
Trust and
the Portfolios | | Term of
Office and
Length of
Service | | Principal Occupation(s)
During Past Five Years | | Number of Portfolios
in Fund Complex
Overseen By
Trustee(1) | | Other Directorships Held | |
| Interested Trustee | | | | | | | | | | | | | |
|
| Thomas E. Faust Jr. 5/31/58 | | Trustee and President of the Trust | | Trustee since 2007 and President of the Trust since 2002 | | Chairman, Chief Executive Officer and President of EVC, President of EV, Chief Executive Officer and President of EVM and BMR, and Director of EVD. Trustee and/or Officer of 176 registered investment companies and 5 private investment companies in the Eaton Vance Fund Complex. Mr. Faust is an interested person because of his positions with EVM, BMR, EVC and EV which are affiliates of the Trust and the Portfolios. | | | 176 | | | Director of EVC | |
|
| Noninterested Trustee(s) | | | | | | | | | | | | | |
|
| Benjamin C. Esty 1/2/63 | | Trustee | | Since 2005 | | Roy and Elizabeth Simmons Professor of Business Administration, Harvard University Graduate School of Business Administration (since 2003). Formerly, Associate Professor, Harvard University Graduate School of Business Administration (2000-2003). | | | 176 | | | None | |
|
| Allen R. Freedman 4/3/40 | | Trustee | | Since 2007 | | Former Chairman and Chief Executive Officer of Assurant, Inc. (insurance provider) (1978-2000). Formerly, a Director of Loring Ward International (fund distributor) (2005-2007). | | | 175 | | | Director of Assurant, Inc. and Stonemor Partners L.P. (owner and operator of cemeteries) | |
|
| William H. Park 9/19/47 | | Trustee | | Since 2003 | | Vice Chairman, Commercial Industrial Finance Corp. (specialty finance company) (since 2006). Formerly, President and Chief Executive Officer, Prizm Capital Management, LLC (investment management firm) (2002-2005). | | | 176 | | | None | |
|
| Ronald A. Pearlman 7/10/40 | | Trustee | | Since 2003 | | Professor of Law, Georgetown University Law Center. | | | 176 | | | None | |
|
| Norton H. Reamer 9/21/35 | | Trustee | | Trustee of the Trust since 1986; of GOP since 1993; of FRP since 2000 and of IP since 2002 | | President, Chief Executive Officer and a Director of Asset Management Finance Corp. (a specialty finance company serving the investment management industry) (since October 2003). President, Unicorn Corporation (an investment and financial advisory services company) (since September 2000). Formerly, Chairman and Chief Operating Officer, Hellman, Jordan Management Co., Inc. (an investment management company) (2000-2003). Formerly, Advisory Director of Berkshire Capital Corporation (investment banking firm) (2002-2003). | | | 176 | | | None | |
|
29
Eaton Vance Low Duration Fund
MANAGEMENT AND ORGANIZATION CONT'D
Name and
Date of Birth | | Position(s)
with the
Trust and
the Portfolios | | Term of
Office and
Length of
Service | | Principal Occupation(s)
During Past Five Years | | Number of Portfolios
in Fund Complex
Overseen By
Trustee(1) | | Other Directorships Held | |
| Noninterested Trustee(s) (continued) | | | | | | | | | |
|
| Heidi L. Steiger 7/8/53 | | Trustee | | Since 2007 | | President, Lowenhaupt Global Advisors, LLC (global wealth management firm) (since 2005); Formerly, President and Contributing Editor, Worth Magazine (2004); Formerly, Executive Vice President and Global Head of Private Asset Management (and various other positions), Neuberger Berman (investment firm) (1986-2004). | | | 173 | | | Director of Nuclear Electric Insurance Ltd.
(nuclear insurance provider) and Aviva USA (insurance provider) | |
|
| Lynn A. Stout 9/14/57 | | Trustee | | Trustee of the Trust, and GOP since 1998; of FRP since 2000 and of IP since 2002 | | Paul Hastings Professor of Corporate and Securities Law, University of California at Los Angeles School of Law. | | | 176 | | | None | |
|
| Ralph F. Verni 1/26/43 | | Chairman of the Board and Trustee | | Chairman of the Board since 2007 and Trustee since 2005 | | Consultant and private investor. | | | 176 | | | None | |
|
| Principal Officers who are not Trustees | | | | | | | | | |
|
Name and
Date of Birth | | Position(s)
with the
Trust and
the Portfolios | | Term of
Office and
Length of
Service | |
Principal Occupation(s)
During Past Five Years | |
| William H. Ahern, Jr. 7/28/59 | | Vice President of the Trust | | Since 1995 | | Vice President of EVM and BMR. Officer of 74 registered investment companies managed by EVM or BMR. | |
|
| Cynthia J. Clemson 3/2/63 | | Vice President of the Trust | | Since 2005 | | Vice President of EVM and BMR. Officer of 89 registered investment companies managed by EVM or BMR. | |
|
| Charles B. Gaffney 12/4/72 | | Vice President of the Trust | | Since 2007 | | Vice President of EVM and BMR. Previously, Sector Portfolio Manager and Senior Equity Analyst of Brown Brothers Harriman (1997-2003). Officer of 29 registered investment companies managed by EVM or BMR. | |
|
| Christine M. Johnston 11/9/72 | | Vice President of the Trust | | Since 2007 | | Vice President of EVM and BMR. Officer of 34 registered investment companies managed by EVM or BMR. | |
|
| Aamer Khan 6/7/60 | | Vice President of the Trust | | Since 2005 | | Vice President of EVM and BMR. Officer of 32 registered investment companies managed by EVM or BMR. | |
|
| Thomas H. Luster 4/8/62 | | Vice President of the Trust | | Since 2006 | | Vice President of EVM and BMR. Officer of 48 registered investment companies managed by EVM or BMR. | |
|
| Michael R. Mach 7/15/47 | | Vice President of the Trust | | Since 1999 | | Vice President of EVM and BMR. Officer of 54 registered investment companies managed by EVM or BMR. | |
|
| Robert B. MacIntosh 1/22/57 | | Vice President of the Trust | | Since 1998 | | Vice President of EVM and BMR. Officer of 89 registered investment companies managed by EVM or BMR. | |
|
| Scott H. Page 11/30/59 | | President of FRP | | Since 2007(2) | | Vice President of EVM and BMR. Officer of 15 registered investment companies managed by EVM or BMR. | |
|
| Duncan W. Richardson 10/26/57 | | Vice President the Trust | | Since 2001 | | Executive Vice President and Chief Equity Investment Officer of EVC, EVM and BMR. Officer of 80 registered investment companies managed by EVM or BMR. | |
|
| Walter A. Row, III 7/20/57 | | Vice President of the Trust | | Since 2001 | | Director of Equity Research and a Vice President of EVM and BMR. Officer of 38 registered investment companies managed by EVM or BMR. | |
|
30
Eaton Vance Low Duration Fund
MANAGEMENT AND ORGANIZATION CONT'D
Name and
Date of Birth | | Position(s)
with the
Trust and
the Portfolios | | Term of
Office and
Length of
Service | |
Principal Occupation(s)
During Past Five Years | |
| Principal Officers who are not Trustees (continued) | | | | | | | |
|
| Craig Russ 10/30/63 | | Vice President of FRP | | Since 2007 | | Vice President of EVM and BMR. Officer of 9 registered investment companies managed by EVM or BMR. | |
|
| Judith A. Saryan 8/21/54 | | Vice President of the Trust | | Since 2003 | | Vice President of EVM and BMR. Officer of 53 registered investment companies managed by EVM or BMR. | |
|
| Susan Schiff 3/13/61 | | Vice President of the Trust, GOP and IP | | Vice President of the Trust and IP since 2002; of GOP since 1993 | | Vice President of EVM and BMR. Officer of 35 registered investment companies managed by EVM or BMR. | |
|
| Thomas Seto 9/27/62 | | Vice President of the Trust | | Since 2007 | | Vice President and Director of Portfolio Management of Parametric. Officer of 30 registered investment companies managed by EVM or BMR. | |
|
| David M. Stein 5/4/51 | | Vice President of the Trust | | Since 2007 | | Managing Director and Chief Investment Officer of Parametric. Officer of 30 registered investment companies managed by EVM or BMR. | |
|
| Mark S. Venezia 5/23/49 | | Vice President of the Trust and President of GOP and IP | | Since 2002 | | Vice President of EVM and BMR. Officer of 35 registered investment companies managed by EVM or BMR. | |
|
| Adam A. Weigold 3/22/75 | | Vice President of the Trust | | Since 2007 | | Vice President of EVM and BMR. Officer of 70 registered investment companies managed by EVM or BMR. | |
|
| Barbara E. Campbell 6/19/57 | | Treasurer of the Trust | | Since 2005 | | Vice President of EVM and BMR. Officer of 176 registered investment companies managed by EVM or BMR. | |
|
| Maureen A. Gemma 5/24/60 | | Secretary | | Since 2007 | | Vice President and Deputy Chief Legal Officer of EVM and BMR. Officer of 176 registered investment companies managed by EVM or BMR. | |
|
| Dan A. Maalouly 3/25/62 | | Treasurer of the Portfolios | | Since 2005 | | Vice President of EVM and BMR. Previously Senior Manager at Pricewaterhouse Coopers LLP (1997-2005). Officer of 76 registered investment companies managed by EVM and BMR. | |
|
| Paul M. O'Neil 7/11/53 | | Chief Compliance Officer | | Since 2004 | | Vice President of EVM and BMR. Officer of 176 registered investment companies managed by EVM or BMR. | |
|
(1) Includes both master and feeder funds in a master-feeder structure.
(2) Prior to 2007, Mr. Page served as Vice President of FRP since 2000.
The SAI for the Fund includes additional information about the Trustees and officers of the Fund and the Portfolios and can be obtained without charge by calling 1-800-225-6265.
31
This Page Intentionally Left Blank
Investment Adviser of Investment Portfolio
Boston Management and Research
The Eaton Vance Building
255 State Street
Boston, MA 02109
Investment Adviser and Administrator of Eaton Vance Low Duration Fund
Eaton Vance Management
The Eaton Vance Building
255 State Street
Boston, MA 02109
Principal Underwriter
Eaton Vance Distributors, Inc.
The Eaton Vance Building
255 State Street
Boston, MA 02109
(617) 482-8260
Custodian
State Street Bank & Trust Company
200 Clarendon Street
Boston, MA 02116
Transfer Agent
PFPC Inc.
Attn: Eaton Vance Funds
P.O. Box 9653
Providence, RI 02940-9653
(800) 262-1122
Independent Registered Public Accounting Firm
Deloitte & Touche LLP
200 Berkeley Street
Boston, MA 02116-5022
Eaton Vance Low Duration Fund
The Eaton Vance Building
255 State Street
Boston, MA 02109
This report must be preceded or accompanied by a current prospectus. Before investing, investors should consider carefully the Fund's investment objective, risks, and charges and expenses. The Fund's current prospectus contains this and other information about the Fund and is available
through your financial advisor. Please read the prospectus carefully before you invest or send money. For further information please call 1-800-225-6265.
1560-12/07 LDSRC

Annual Report October 31, 2007


EATON VANCE
STRATEGIC
INCOME
FUND
IMPORTANT NOTICES REGARDING PRIVACY,
DELIVERY OF SHAREHOLDER DOCUMENTS,
PORTFOLIO HOLDINGS AND PROXY VOTING
Privacy. The Eaton Vance organization is committed to ensuring your financial privacy. Each of the financial institutions identified below has in effect the following policy ("Privacy Policy") with respect to nonpublic personal information about its customers:
• Only such information received from you, through application forms or otherwise, and information about your Eaton Vance fund transactions will be collected. This may include information such as name, address, social security number, tax status, account balances and transactions.
• None of such information about you (or former customers) will be disclosed to anyone, except as permitted by law (which includes disclosure to employees necessary to service your account). In the normal course of servicing a customer's account, Eaton Vance may share information with unaffiliated third parties that perform various required services such as transfer agents, custodians and broker/dealers.
• Policies and procedures (including physical, electronic and procedural safeguards) are in place that are designed to protect the confidentiality of such information.
• We reserve the right to change our Privacy Policy at any time upon proper notification to you. Customers may want to review our Policy periodically for changes by accessing the link on our homepage: www.eatonvance.com.
Our pledge of privacy applies to the following entities within the Eaton Vance organization: the Eaton Vance Family of Funds, Eaton Vance Management, Eaton Vance Investment Counsel, Boston Management and Research, and Eaton Vance Distributors, Inc.
In addition, our Privacy Policy only applies to those Eaton Vance customers who are individuals and who have a direct relationship with us. If a customer's account (i.e., fund shares) is held in the name of a third-party financial adviser/ broker-dealer, it is likely that only such adviser's privacy policies apply to the customer. This notice supersedes all previously issued privacy disclosures.
For more information about Eaton Vance's Privacy Policy, please call 1-800-262-1122.
Delivery of Shareholder Documents. The Securities and Exchange Commission (the "SEC") permits funds to deliver only one copy of shareholder documents, including prospectuses, proxy statements and shareholder reports, to fund investors with multiple accounts at the same residential or post office box address. This practice is often called "householding" and it helps eliminate duplicate mailings to shareholders.
Eaton Vance, or your financial adviser, may household the mailing of your documents indefinitely unless you instruct Eaton Vance, or your financial adviser, otherwise.
If you would prefer that your Eaton Vance documents not be householded, please contact Eaton Vance at 1-800-262-1122, or contact your financial adviser.
Your instructions that householding not apply to delivery of your Eaton Vance documents will be effective within 30 days of receipt by Eaton Vance or your financial adviser.
Portfolio Holdings. Each Eaton Vance Fund and its underlying Portfolio (if applicable) will file a schedule of its portfolio holdings on Form N-Q with the SEC for the first and third quarters of each fiscal year. The Form N-Q will be available on the Eaton Vance website www.eatonvance.com, by calling Eaton Vance at 1-800-262-1122 or in the EDGAR database on the SEC's website at www.sec.gov. Form N-Q may also be reviewed and copied at the SEC's public reference room in Washington, D.C. (call 1-800-732-0330 for information on the operation of the public reference room).
Proxy Voting. From time to time, funds are required to vote proxies related to the securities held by the funds. The Eaton Vance Funds or their underlying Portfolios (if applicable) vote proxies according to a set of policies and procedures approved by the Funds' and Portfolios' Boards. You may obtain a description of these policies and procedures and information on how the Funds or Portfolios voted proxies relating to portfolio securities during the most recent 12 month period ended June 30, without charge, upon request, by calling 1-800-262-1122. This description is also available on the SEC's website at www.sec.gov.
Eaton Vance Strategic Income Fund as of October 31, 2007
MANAGEMENT’S DISCUSSION OF FUND PERFORMANCE

Mark S. Venezia, CFA
Portfolio Manager
Performance for the Past Year
• The Fund’s Class A shares had a total return of 8.61% during the year ended October 31, 2007.(1) This return resulted from an increase in net asset value (NAV) per share to $8.02 on October 31, 2007, from $7.89 on October 31, 2006, and the reinvestment of $0.527 in distribution payments during the year.
• The Fund’s Class B shares had a total return of 7.77% during the year ended October 31, 2007.(1) This return resulted from an increase in NAV to $7.59 on October 31, 2007, from $7.47 on October 31, 2006, and the reinvestment of $0.443 in distribution payments during the year.
• The Fund’s Class C shares had a total return of 7.91% during the year ended October 31, 2007.(1) This return resulted from a decrease in NAV to $7.60 on October 31, 2007, from $7.47 on October 31, 2006, and the reinvestment of $0.443 in distribution payments during the year.
• In comparison, the Lehman Brothers Aggregate Bond Index, an unmanaged, broad-based index of investment-grade, fixed-income securities traded in the U.S., had a return of 5.38% for the year ended October 31, 2007,(2) and the Fund’s peer group, the Lipper Multi-Sector Income Funds Classification, had an average return of 6.49%.(2)
Management Discussion
• The Fund seeks to provide total return by investing in a global portfolio consisting primarily (over 50% of net assets) of high-grade debt securities. The Fund also invests in non-investment-grade debt securities, senior floating-rate loans of various credit ratings, including those below-investment-grade quality, and derivative instruments in different countries and currencies. At October 31, 2007, the Fund was invested in these positions through its holdings in Global Macro Portfolio (GMP), at 53.8% of net assets, Floating Rate Portfolio (FRP), at 35.4%, Emerging Markets Income Portfolio, at 4.3%, International Income Portfolio, at 1.8%, High Income Portfolio (HIP), at 0.6% and Investment Portfolio, at 0.4%.
• At mid-year 2007, the global bond markets were encountering increasing volatility. The U.S. credit squeeze resulted in broad deleveraging and a flight to quality in the global bond markets. Some high yield – including senior secured loans – and emerging markets reacted negatively, while the flight to quality benefited the G7 sovereigns, the Euro and the Yen. Amid the turmoil, central banks – including the Federal Reserve – injected liquidity to preserve economic stability. While the credit squeeze and a weakening U.S. economy concerned investors, stronger domestic economies insulated some Asian and Latin American countries from slowing U.S. demand.
• The Fund was characterized by lower volatility than its Lipper peer group. That was due, in part, to gains in the Fund’s diverse foreign holdings, which offset other losses. GMP’s asset mix contributed to relative NAV stability. Relative-value European currency trades, insurance on emerging market sovereign bonds and seasoned mortgage-backed securities (MBS) helped limit volatility.(3)
• The Fund was widely diversified. In Asia, GMP’s largest exposure was in Malaysia, whose export-oriented economy has benefited from the Asian region’s broad economic uptrend. Following the 2005 de-pegging of its currency, the Ringgit, from the U.S. dollar and the easing of capital controls, Malaysia has seen an inflow of investment, a stronger economy and an appreciating currency.(3)
• In Eastern Europe, Poland was GMP’s largest currency position during the period. Improving economic fundamentals, large remittances from abroad and the recent election of a reform-minded government committed to selling state-owned industries and convergence with the Euro have pushed Poland’s currency higher. GMP cross-hedged some of its Eastern Europe investments – which have attractive yields spreads over the Euro – with short-Euro positions.(3)
• In Latin America, Brazil was GMP’s largest position during the period. Brazil’s government has stabilized its economy in recent years, resulting in lower inflation, an accumulation of reserves and an inflow of
Fund shares are not insured by the FDIC and are not deposits or other obligations of, or guaranteed by, any depository institution. Shares are subject to investment risks, including possible loss of principal invested.
The views expressed throughout this report are those of the portfolio manager and are current only through the end of the period of the report as stated on the cover. These views are subject to change at any time based upon market or other conditions, and the investment adviser disclaims any responsibility to update such views. These views may not be relied on as investment advice and, because investment decisions for a fund are based on many factors, may not be relied on as an indication of trading intent on behalf of any Eaton Vance fund.
(1) | These returns do not include the 4.75% maximum sales charge for the Class A shares or the applicable contingent deferred sales charges (CDSC) for Class B shares and Class C shares. If sales charges were deducted, the returns would be lower. |
| |
(2) | It is not possible to invest directly in an Index or Lipper Classification. The Index’s total return does not reflect the commissions or expenses that would have been incurred if an investor individually purchased or sold the securities represented in the Index. The Lipper total return is the average total return, at net asset value, of the funds that are in the same Lipper Classification as the Fund. |
| |
(3) | Fund allocations are subject to change due to active management. |
Past performance is no guarantee of future results. Returns are historical and are calculated by determining the percentage change in net asset value or offering price (as applicable) with all distributions reinvested. Investment return and principal value will fluctuate so that shares, when redeemed, may be worth more or less than their original cost. Performance is for the stated time period only; due to market volatility, the Fund’s current performance may be lower or higher than the quoted return. For performance as of the most recent month end, please refer to www.eatonvance.com.
1
Eaton Vance Strategic Income Fund as of October 31, 2007
PORTFOLIO PROFILE
capital – trends that have resulted in a further appreciation of Brazil’s currency.(1)
• GMP also had positions in northern and sub-Saharan Africa. Unlike some other developing economies, these countries tend to be de-linked from broad short-term global financial tides. Egyptian T-bills remained attractive, as high energy prices produced a continuing influx of Middle Eastern petro-dollars into the Egyptian financial markets.(1)
• The Fund’s credit quality improved during the fiscal year. Investments in mortgage-backed securities (MBS) were increased slightly through an investment in GMP.(1) Yield spreads for MBS over U.S. Treasuries widened by approximately 40 basis points (0.40%) during the fiscal year, reflecting similar widenings throughout the fixed-income markets. However, the widening was generally offset by a decline in overall bond yields. Five-year U.S. Treasury bond yields declined by roughly 45 basis points (0.45%) over the period, as the Federal Reserve cut its Federal Funds rate – a key short-term interest rate – from 5.25% to 4.50% during September and October 2007. In another positive trend, prepayment rates continued to decline during the fiscal year, while foreign central banks became increasingly aggressive buyers of MBS for their quality and attractive spreads.
• The Fund dramatically reduced its investments in below-investment-grade bonds, with its investment in HIP declining to less than 1% at October 31, 2007. This segment of the bond market registered a significant correction at mid-year over concerns about widespread deleveraging by institutional investors. Unfortunately, the Fund’s performance was hurt by its weighting in senior secured floating-rate corporate loans, through its investment in FRP.(1) The market for these loans was, in management’s view, unduly impacted by the credit crunch.
• The Fund’s duration declined during the year, from 1.9 years at October 31, 2006, to 1.4 years at October 31, 2007. Duration is a measure of the sensitivity of a fund or a fixed-income security to changes in interest rates. A shorter duration instrument normally has less exposure to interest rate risk than longer duration instruments.
(1) | Fund Allocations are subject to change due to active management. |
Securities Holdings (excludes derivatives)(2)
By total net assets
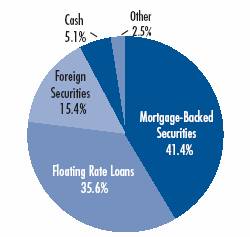
(2) | Securities Holdings reflect the Fund’s investments as of 10/31/07. Securities Holdings do not reflect derivatives positions. For International and Emerging Market exposures please refer to the Regional Currency Exposure table. Fund Statistics may not be representative of the Portfolio’s current or future investments and are subject to change due to active management. |
Regional Currency Exposures (including derivatives)(3)
By total net assets
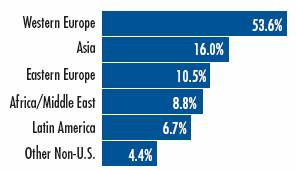
(3) | The Regional Currency Exposures reflects the Fund’s investments as of 10/31/07. Fund Statistics may not be representative of current or future investments and are subject to change due to active management. |
Currency Positions(4)
By total net assets
Egypt | | 6.6 | % |
Poland | | 6.0 | |
Malaysia | | 5.2 | |
Brazil | | 3.9 | |
Iceland | | 3.4 | |
Indonesia | | 3.1 | |
Philippines | | 2.9 | |
Turkey | | 2.6 | |
India | | 2.4 | |
Mexico | | 1.4 | |
Nigeria | | 1.1 | |
Romania | | 0.9 | |
Kazakhstan | | 0.9 | |
South Korea | | 0.6 | |
Uruguay | | 0.6 | |
Ghana | | 0.5 | |
Japan | | 0.5 | |
Czech Republic | | 0.4 | |
Hungary | | 0.4 | |
Germany | | 0.4 | |
Chile | | 0.4 | |
Mongolia | | 0.3 | |
France | | 0.3 | |
Guatemala | | 0.3 | |
Uganda | | 0.2 | |
Hong Kong | | 0.2 | |
Other Countries | | 1.1 | |
(4) | Currency Positions reflect the Fund’s investments in Global Macro Portfolio as of 10/31/07. Currency exposures include all long foreign exchange denominated assets and all long currency derivatives. Net short positions and other foreign derivatives are excluded. Short Currency Exposures are 12.1%. Other Foreign Long derivatives are 4.1%. Other Foreign Short Derivatives are 24.5%. All numbers are a percentage of net assets. Total exposures may exceed 100% due to implicit leverage created by derivatives. Portfolio Statistics may not be representative of the Portfolio’s current or future investments and are subject to change due to active management. |
2
Eaton Vance Strategic Income Fund as of October 31, 2007
FUND PERFORMANCE
The line graph and table set forth below provide information about the Fund’s performance. The line graph compares the performance of Class B of the Fund with that of the Lehman Brothers Aggregate Bond Index, an unmanaged, broad-based index containing only investment-grade, fixed-income securities traded in the U.S. The lines on the graph represent the total returns of a hypothetical investment of $10,000 in Class B of the Fund and in the Lehman Brothers Aggregate Bond Index. The graph also offers a comparison to the Lipper Multi-Sector Income Fund Classification average, reflecting the total returns of the funds in the same classification as this Fund. The fund classification is established by Lipper Inc., a nationally recognized monitor of mutual fund performance. Funds within a classification have similar investment policies. The table includes the total returns of each Class of the Fund at net asset value and public offering price. The performance presented below does not reflect the deduction of taxes, if any, that a shareholder would pay on Fund distributions or the redemption of Fund shares.
Fund Performance(1) As of 10/31/07 | | Class A | | Class B | | Class C | |
Share Class Symbols | | ETSIX | | EVSGX | | ECSIX | |
| | | | | | | |
Average Annual Total Returns (at net asset value) | | | | | | | |
One Year | | 8.61 | % | 7.77 | % | 7.91 | % |
Five Years | | 9.05 | | 8.23 | | 8.28 | |
Ten Years | | N.A. | | 5.45 | | 5.48 | |
Life of Fund† | | 6.24 | | 6.17 | | 6.98 | |
| | | | | | | |
SEC Average Annual Total Returns (including sales charge or applicable CDSC) | | | | | | | |
One Year | | 3.50 | % | 2.77 | % | 6.91 | % |
Five Years | | 7.98 | | 7.94 | | 8.28 | |
Ten Years | | N.A. | | 5.45 | | 5.48 | |
Life of Fund† | | 5.71 | | 6.17 | | 6.98 | |
† Inception Dates – Class A: 1/23/98; Class B: 11/26/90; Class C: 5/25/94
(1) | Average Annual Total Returns do not include the 4.75% maximum sales charge for Class A shares or the applicable contingent deferred sales charges (CDSC) for Class B or Class C shares. If sales charges were reflected, the performance would be lower. SEC Average Annual Total Returns for Class A reflect the maximum 4.75% sales charge. SEC Returns for Class B reflect applicable CDSC based on the following schedule: 5% - 1st and 2nd years; 4% - 3rd year; 3% - 4th year; 2% - 5th year; 1% - 6th year. SEC returns for Class C reflect a 1% CDSC for the first year. |
Total Annual | | | | | | | |
Operating Expenses(2) | | Class A | | Class B | | Class C | |
| | | | | | | |
Expense Ratio | | 0.99 | % | 1.74 | % | 1.74 | % |
(2) Source: Prospectus dated 3/1/07.
Comparison of Change in Value of a $10,000 Investment in Eaton Vance Strategic Income Fund, Class B vs. the Lehman Brothers Aggregate Bond Index & the Lipper Multi-Sector Income Fund Classification*
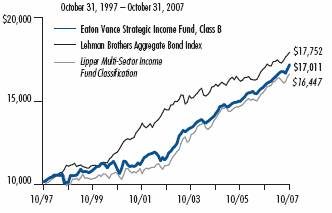
* Sources: Thomson Financial; Lipper. Class B of the Fund commenced operations on 11/26/90.
A $10,000 hypothetical investment at net asset value in Class A shares on 1/23/98 and Class C shares on 10/31/97 would have been valued at $18,069 ($17,210 at maximum offering price after investment at net asset value) and $17,050, respectively, on 10/31/07. It is not possible to invest directly in an Index or Lipper Classification. The Index’s total return does not reflect the expenses that would have been incurred if an investor individually purchased or sold the securities represented in the Index. The Lipper average is the average total return, at net asset value, of the funds that are in the same Lipper Classification as the Fund.
Past performance is no guarantee of future results. Returns are historical and are calculated by determining the percentage change in net asset value or offering price (as applicable) with all distributions reinvested. Investment return and principal value will fluctuate so that shares, when redeemed, may be worth more or less than their original cost. Performance is for the stated time period only; due to market volatility, the Fund’s current performance may be lower or higher than the quoted return. For performance as of the most recent month end, please refer to www.eatonvance.com.
3
Eaton Vance Strategic Income Fund as of October 31, 2007
FUND EXPENSES
Example: As a shareholder of the Fund, you incur two types of costs: (1) transaction costs, including sales charges (loads) on purchases and redemption fees (if applicable); and (2) ongoing costs, including management fees; distribution or service fees; and other Fund expenses. This Example is intended to help you understand your ongoing costs (in dollars) of investing in the Fund and to compare these costs with the ongoing costs of investing in other mutual funds. The Example is based on an investment of $1,000 invested at the beginning of the period and held for the entire period (May 1, 2007 – October 31, 2007).
Actual Expenses: The first section of the table below provides information about actual account values and actual expenses. You may use the information in this section, together with the amount you invested, to estimate the expenses that you paid over the period. Simply divide your account value by $1,000 (for example, an $8,600 account value divided by $1,000 = 8.6), then multiply the result by the number in the first section under the heading entitled "Expenses Paid During Period" to estimate the expenses you paid on your account during this period.
Hypothetical Example for Comparison Purposes: The second section of the table below provides information about hypothetical account values and hypothetical expenses based on the actual Fund expense ratio and an assumed rate of return of 5% per year (before expenses), which is not the actual return of the Fund. The hypothetical account values and expenses may not be used to estimate the actual ending account balance or expenses you paid for the period. You may use this information to compare the ongoing costs of investing in your Fund and other funds. To do so, compare this 5% hypothetical example with the 5% hypothetical examples that appear in the shareholder reports of the other funds.
Please note that the expenses shown in the table are meant to highlight your ongoing costs only and do not reflect any transactional costs, such as sales charges (loads) or redemption fees (if applicable). Therefore, the second section of the table is useful in comparing ongoing costs only, and will not help you determine the relative total costs of owning different funds. In addition, if these transactional costs were included, your costs would have been higher.
Eaton Vance Strategic Income Fund
| | | Beginning Account Value
(5/1/07) | | Ending Account Value
(10/31/07) | | Expenses Paid During Period*
(5/1/07 – 10/31/07) | |
| Actual | |
| Class A | | $ | 1,000.00 | | | $ | 1,040.90 | | | $ | 5.56 | | |
| Class B | | $ | 1,000.00 | | | $ | 1,037.50 | | | $ | 9.40 | | |
| Class C | | $ | 1,000.00 | | | $ | 1,037.50 | | | $ | 9.40 | | |
| Hypothetical | |
| (5% return per year before expenses) | |
| Class A | | $ | 1,000.00 | | | $ | 1,019.80 | | | $ | 5.50 | | |
| Class B | | $ | 1,000.00 | | | $ | 1,016.00 | | | $ | 9.30 | | |
| Class C | | $ | 1,000.00 | | | $ | 1,016.00 | | | $ | 9.30 | | |
* Expenses are equal to the Fund's annualized expense ratio of 1.08% for Class A shares, 1.83% for Class B shares and 1.83% for Class C shares multiplied by 184/365 (to reflect the one-half year period). The Example assumes that the $1,000 was invested at the net asset value per share determined at the close of business on April 30, 2007. The Example reflects the expenses of both the Fund and the Portfolios.
4
Strategic Income Fund as of October 31, 2007
PORTFOLIO OF INVESTMENTS
| Investments in Portfolios — 96.6% | |
| Security | | | | Value | |
| Emerging Markets Income Portfolio(1) | | | | $ | 47,562,557 | | |
| (identified cost $45,497,475) | | | | | | | |
Floating Rate Portfolio(1)
(identified cost $391,818,610) | |
| | | 387,069,267
| | |
Global Macro Portfolio(1)
(identified cost $587,421,086) | |
| | | 587,915,030
| | |
High Income Portfolio(1)
(identified cost $5,010,008) | |
| | | 6,217,782
| | |
International Income Portfolio(1)
(identified cost $18,518,662) | |
| | | 19,881,656
| | |
Investment Portfolio(1)
(identified cost $4,854,874) | |
| | | 4,872,112
| | |
Total Investments in Portfolios
(identified cost $1,053,120,715) | | $ | 1,053,518,404 | | |
| U.S. Treasury Obligations — 0.2% | |
| Security | | Principal | | Value | |
| U.S. Treasury Notes, 4.875%, 6/30/12 | | $ | 2,000,000 | | | $ | 2,062,344 | | |
Total U.S. Treasury Obligations
(identified cost $2,035,625) | | $ | 2,062,344 | | |
| Short-Term Investments — 3.3% | |
| Security | | Principal | | Value | |
| BNP Paribas Time Deposit, 4.75%, 11/1/07 | | $ | 36,255,506 | | | $ | 36,255,506 | | |
Total Short-Term Investments
(identified cost $36,255,506) | | $ | 36,255,506 | | |
Total Investments — 100.1%
(identified cost $1,091,411,846) | | | | $ | 1,091,836,254 | | |
| Other Assets, Less Liabilities — (0.1)% | | | | $ | (1,492,785 | ) | |
| Net Assets — 100.0% | | | | $ | 1,090,343,469 | | |
(1) Affiliated investments.
See notes to financial statements
5
Eaton Vance Strategic Income Fund as of October 31, 2007
FINANCIAL STATEMENTS
Statement of Assets and Liabilities
As of October 31, 2007
| Assets | |
Investments in unaffiliated securities, at value
(identified cost, $38,291,131) | | $ | 38,317,850 | | |
Investments in affiliated Portfolios, at value
(identified cost, $1,053,120,715) | | | 1,053,518,404 | | |
| Cash | | | 9,089 | | |
| Receivable for Fund shares sold | | | 4,391,915 | | |
| Interest receivable | | | 37,637 | | |
| Total assets | | $ | 1,096,274,895 | | |
| Liabilities | |
| Payable for Fund shares redeemed | | $ | 2,956,598 | | |
| Dividends payable | | | 2,164,500 | | |
| Payable to affiliate for distribution and service fees | | | 537,164 | | |
| Payable to affiliate for investment advisory fee | | | 30,897 | | |
| Payable to affiliate for Trustees' fees | | | 333 | | |
| Accrued expenses | | | 241,934 | | |
| Total liabilities | | $ | 5,931,426 | | |
| Net Assets | | $ | 1,090,343,469 | | |
| Sources of Net Assets | |
| Paid-in capital | | $ | 1,105,068,053 | | |
| Accumulated net realized loss | | | (30,969,049 | ) | |
| Undistributed net investment income | | | 15,820,057 | | |
| Net unrealized appreciation | | | 424,408 | | |
| Total | | $ | 1,090,343,469 | | |
| Class A Shares | |
| Net Assets | | $ | 598,155,332 | | |
| Shares Outstanding | | | 74,560,445 | | |
Net Asset Value and Redemption Price Per Share
(net assets ÷ shares of beneficial interest outstanding) | | $ | 8.02 | | |
Maximum Offering Price Per Share
(100 ÷ 95.25 of $8.02) | | $ | 8.42 | | |
| Class B Shares | |
| Net Assets | | $ | 180,870,814 | | |
| Shares Outstanding | | | 23,834,209 | | |
Net Asset Value and Offering Price Per Share*
(net assets ÷ shares of beneficial interest outstanding) | | $ | 7.59 | | |
| Class C Shares | |
| Net Assets | | $ | 311,317,323 | | |
| Shares Outstanding | | | 40,984,990 | | |
Net Asset Value and Offering Price Per Share*
(net assets ÷ shares of beneficial interest outstanding) | | $ | 7.60 | | |
On sales of $25,000 or more, the offering price of Class A shares is reduced.
* Redemption price per share is equal to the net asset value less any applicable contingent deferred sales charge.
Statement of Operations
For the Year Ended
October 31, 2007
| Investment Income | |
| Interest income | | $ | 522,867 | | |
| Interest income allocated from affiliated Portfolios | | | 61,362,236 | | |
| Dividends allocated from Portfolios | | | 24,637 | | |
| Expenses allocated from affiliated Portfolios | | | (6,108,056 | ) | |
| Net investment income from Portfolios | | $ | 55,801,684 | | |
| Expenses | |
| Investment adviser fee | | $ | 62,609 | | |
| Trustees' fees and expenses | | | 3,743 | | |
Distribution and service fees
Class A | | | 1,236,951 | | |
| Class B | | | 1,869,189 | | |
| Class C | | | 2,661,085 | | |
| Transfer and dividend disbursing agent fees | | | 717,587 | | |
| Printing and postage | | | 297,911 | | |
| Legal and accounting services | | | 135,305 | | |
| Registration fees | | | 82,908 | | |
| Custodian fee | | | 43,264 | | |
| Miscellaneous | | | 10,931 | | |
| Total expenses | | $ | 7,121,483 | | |
| Net investment income | | $ | 48,680,201 | | |
| Realized and Unrealized Gain (Loss) | |
Net realized gain (loss) —
Financial futures contracts | | $ | 2,753,351 | | |
| Net realized gain (loss) allocated from affiliated Portfolios — | | | | | |
| Investment transactions | | | 4,734,968 | | |
| Financial futures contracts | | | (5,026,662 | ) | |
| Swap contracts | | | 1,336,547 | | |
Foreign currency and forward foreign currency exchange
contract transactions | | | 19,852,624 | | |
| Net realized gain | | $ | 23,650,828 | | |
| Change in unrealized appreciation (depreciation) — | |
| Investments | | $ | 26,719 | | |
Change in unrealized appreciation (depreciation) allocated
from affiliated Porttfolios — | |
| Investments | | | 2,049,124 | | |
| Financial futures contracts | | | (1,139,245 | ) | |
| Swap contracts | | | (1,041,742 | ) | |
| Foreign currency and forward foreign currency exchange contracts | | | 3,603,879 | | |
| Net change in unrealized appreciation (depreciation) | | $ | 3,498,735 | | |
| Net realized and unrealized gain | | $ | 27,149,563 | | |
| Net increase in net assets from operations | | $ | 75,829,764 | | |
See notes to financial statements
6
Eaton Vance Strategic Income Fund as of October 31, 2007
FINANCIAL STATEMENTS CONT'D
Statements of Changes in Net Assets
Increase (Decrease)
in Net Assets | | Year Ended
October 31, 2007 | | Year Ended
October 31, 2006 | |
From operations —
Net investment income | | $ | 48,680,201 | | | $ | 32,677,331 | | |
Net realized gain from investments,
financial futures contracts, swap
contracts, and foreign currency and
forward foreign currency exchange
contract transactions | | | 23,650,828 | | | | 9,564,973 | | |
Net change in unrealized appreciation
(depreciation) from investments,
financial futures contracts,
swap contracts, and foreign currency
and forward foreign currency
exchange contracts | | | 3,498,735 | | | | 4,283,478 | | |
| Net increase in net assets from operations | | $ | 75,829,764 | | | $ | 46,525,782 | | |
Distributions to shareholders —
From net investment income
Class A | | $ | (32,848,581 | ) | | $ | (23,178,195 | ) | |
| Class B | | | (11,061,989 | ) | | | (12,559,493 | ) | |
| Class C | | | (15,659,037 | ) | | | (11,396,339 | ) | |
Tax return of capital
Class A | | | — | | | | (250,996 | ) | |
| Class B | | | — | | | | (159,237 | ) | |
| Class C | | | — | | | | (145,751 | ) | |
| Total distributions to shareholders | | $ | (59,569,607 | ) | | $ | (47,690,011 | ) | |
Transactions in shares of beneficial interest —
Proceeds from sale of shares
Class A | | $ | 286,655,999 | | | $ | 254,028,611 | | |
| Class B | | | 28,631,188 | | | | 38,705,907 | | |
| Class C | | | 129,421,778 | | | | 111,040,586 | | |
Net asset value of shares issued to
shareholders in payment of
distributions declared
Class A | | | 20,752,041 | | | | 13,809,763 | | |
| Class B | | | 4,761,298 | | | | 5,282,097 | | |
| Class C | | | 8,379,375 | | | | 5,632,409 | | |
Cost of shares redeemed
Class A | | | (145,149,166 | ) | | | (100,111,423 | ) | |
| Class B | | | (37,458,867 | ) | | | (37,304,209 | ) | |
| Class C | | | (57,129,220 | ) | | | (38,980,835 | ) | |
Net asset value of shares exchanged
Class A | | | 12,358,352 | | | | 8,801,199 | | |
| Class B | | | (12,358,352 | ) | | | (8,801,199 | ) | |
Net increase in net assets from Fund
share transactions | | $ | 238,864,426 | | | $ | 252,102,906 | | |
| Net increase in net assets | | $ | 255,124,583 | | | $ | 250,938,677 | | |
| Net Assets | | Year Ended
October 31, 2007 | | Year Ended
October 31, 2006 | |
| At beginning of year | | $ | 835,218,886 | | | $ | 584,280,209 | | |
| At end of year | | $ | 1,090,343,469 | | | $ | 835,218,886 | | |
Undistributed net investment
income included in
net assets | |
| At end of year | | $ | 15,820,057 | | | $ | (316,899 | ) | |
See notes to financial statements
7
Eaton Vance Strategic Income Fund as of October 31, 2007
FINANCIAL STATEMENTS CONT'D
Financial Highlights
| | | Class A | |
| | | Year Ended October 31, | |
| | | 2007(1) | | 2006(1) | | 2005(1) | | 2004(1) | | 2003(1) | |
| Net asset value — Beginning of year | | $ | 7.890 | | | $ | 7.900 | | | $ | 8.030 | | | $ | 8.100 | | | $ | 7.550 | | |
| Income (loss) from operations | |
| Net investment income | | $ | 0.436 | | | $ | 0.398 | | | $ | 0.294 | | | $ | 0.286 | | | $ | 0.336 | | |
| Net realized and unrealized gain | | | 0.221 | | | | 0.161 | | | | 0.166 | | | | 0.273 | | | | 0.883 | | |
| Total income from operations | | $ | 0.657 | | | $ | 0.559 | | | $ | 0.460 | | | $ | 0.559 | | | $ | 1.219 | | |
| Less distributions | |
| From net investment income | | $ | (0.527 | ) | | $ | (0.563 | ) | | $ | (0.590 | ) | | $ | (0.629 | ) | | $ | (0.669 | ) | |
| From tax return of capital | | | — | | | | (0.006 | ) | | | — | | | | — | | | | — | | |
| Total distributions | | $ | (0.527 | ) | | $ | (0.569 | ) | | $ | (0.590 | ) | | $ | (0.629 | ) | | $ | (0.669 | ) | |
| Net asset value — End of year | | $ | 8.020 | | | $ | 7.890 | | | $ | 7.900 | | | $ | 8.030 | | | $ | 8.100 | | |
| Total Return(2) | | | 8.61 | % | | | 7.30 | % | | | 5.85 | % | | | 7.18 | % | | | 16.65 | % | |
| Ratios/Supplemental Data | |
| Net assets, end of year (000's omitted) | | $ | 598,155 | | | $ | 414,882 | | | $ | 238,973 | | | $ | 162,022 | | | $ | 48,738 | | |
| Ratios (As a percentage of average daily net assets): | |
| Expenses before custodian fee reduction(3) | | | 1.04 | % | | | 0.99 | % | | | 1.02 | % | | | 1.06 | % | | | 1.11 | % | |
| Expenses after custodian fee reduction(3) | | | 1.04 | % | | | 0.99 | % | | | 1.02 | % | | | 1.06 | % | | | 1.11 | % | |
| Net investment income | | | 5.49 | % | | | 5.04 | % | | | 3.66 | % | | | 3.57 | % | | | 4.19 | % | |
| Portfolio Turnover of the Global Macro Portfolio | | | 45 | % | | | 41 | % | | | 59 | % | | | 55 | % | | | 71 | % | |
| Portfolio Turnover of the High Income Portfolio | | | 81 | % | | | 62 | % | | | 62 | % | | | 80 | % | | | 122 | % | |
| Portfolio Turnover of the Floating Rate Portfolio | | | 61 | % | | | 50 | % | | | 57 | % | | | 67 | % | | | — | | |
| Portfolio Turnover of the Investment Portfolio | | | 35 | % | | | — | | | | — | | | | — | | | | — | | |
| Portfolio Turnover of the International Income Portfolio | | | 2 | % | | | — | | | | — | | | | — | | | | — | | |
| Portfolio Turnover of the Emerging Markets Income Portfolio | | | 2 | % | | | — | | | | — | | | | — | | | | — | | |
(1) Net investment income per share was computed using average shares outstanding.
(2) Returns are historical and are calculated by determining the percentage change in net asset value with all distributions reinvested.
(3) Includes the Fund's share of the Portfolios' allocated expenses.
See notes to financial statements
8
Eaton Vance Strategic Income Fund as of October 31, 2007
FINANCIAL STATEMENTS CONT'D
Financial Highlights
| | | Class B | |
| | | Year Ended October 31, | |
| | | 2007(1) | | 2006(1) | | 2005(1) | | 2004(1) | | 2003(1) | |
| Net asset value — Beginning of year | | $ | 7.470 | | | $ | 7.480 | | | $ | 7.600 | | | $ | 7.660 | | | $ | 7.150 | | |
| Income (loss) from operations | |
| Net investment income | | $ | 0.356 | | | $ | 0.320 | | | $ | 0.223 | | | $ | 0.224 | | | $ | 0.269 | | |
| Net realized and unrealized gain | | | 0.207 | | | | 0.153 | | | | 0.159 | | | | 0.254 | | | | 0.817 | | |
| Total income from operations | | $ | 0.563 | | | $ | 0.473 | | | $ | 0.382 | | | $ | 0.478 | | | $ | 1.086 | | |
| Less distributions | |
| From net investment income | | $ | (0.443 | ) | | $ | (0.477 | ) | | $ | (0.502 | ) | | $ | (0.538 | ) | | $ | (0.576 | ) | |
| From tax return of capital | | | — | | | | (0.006 | ) | | | — | | | | — | | | | — | | |
| Total distributions | | $ | (0.443 | ) | | $ | (0.483 | ) | | $ | (0.502 | ) | | $ | (0.538 | ) | | $ | (0.576 | ) | |
| Net asset value — End of year | | $ | 7.590 | | | $ | 7.470 | | | $ | 7.480 | | | $ | 7.600 | | | $ | 7.660 | | |
| Total Return(2) | | | 7.77 | % | | | 6.50 | % | | | 5.12 | % | | | 6.47 | % | | | 15.61 | % | |
| Ratios/Supplemental Data | |
| Net assets, end of year (000's omitted) | | $ | 180,871 | | | $ | 194,351 | | | $ | 196,766 | | | $ | 191,765 | | | $ | 217,341 | | |
| Ratios (As a percentage of average daily net assets): | |
| Expenses before custodian fee reduction(3) | | | 1.78 | % | | | 1.74 | % | | | 1.77 | % | | | 1.81 | % | | | 1.86 | % | |
| Expenses after custodian fee reduction(3) | | | 1.78 | % | | | 1.74 | % | | | 1.77 | % | | | 1.81 | % | | | 1.86 | % | |
| Net investment income | | | 4.74 | % | | | 4.27 | % | | | 2.94 | % | | | 2.95 | % | | | 3.57 | % | |
| Portfolio Turnover of the Global Macro Portfolio | | | 45 | % | | | 41 | % | | | 59 | % | | | 55 | % | | | 71 | % | |
| Portfolio Turnover of the High Income Portfolio | | | 81 | % | | | 62 | % | | | 62 | % | | | 80 | % | | | 122 | % | |
| Portfolio Turnover of the Floating Rate Portfolio | | | 61 | % | | | 50 | % | | | 57 | % | | | 67 | % | | | — | | |
| Portfolio Turnover of the Investment Portfolio | | | 35 | % | | | — | | | | — | | | | — | | | | — | | |
| Portfolio Turnover of the International Income Portfolio | | | 2 | % | | | — | | | | — | | | | — | | | | — | | |
| Portfolio Turnover of the Emerging Markets Income Portfolio | | | 2 | % | | | — | | | | — | | | | — | | | | — | | |
(1) Net investment income per share was computed using average shares outstanding.
(2) Returns are historical and are calculated by determining the percentage change in net asset value with all distributions reinvested.
(3) Includes the Fund's share of the Portfolios' allocated expenses.
See notes to financial statements
9
Eaton Vance Strategic Income Fund as of October 31, 2007
FINANCIAL STATEMENTS CONT'D
Financial Highlights
| | | Class C | |
| | | Year Ended October 31, | |
| | | 2007(1) | | 2006(1) | | 2005(1) | | 2004(1) | | 2003(1) | |
| Net asset value — Beginning of year | | $ | 7.470 | | | $ | 7.480 | | | $ | 7.610 | | | $ | 7.670 | | | $ | 7.160 | | |
| Income (loss) from operations | |
| Net investment income | | $ | 0.356 | | | $ | 0.320 | | | $ | 0.222 | | | $ | 0.219 | | | $ | 0.267 | | |
| Net realized and unrealized gain | | | 0.217 | | | | 0.153 | | | | 0.150 | | | | 0.260 | | | | 0.819 | | |
| Total income from operations | | $ | 0.573 | | | $ | 0.473 | | | $ | 0.372 | | | $ | 0.479 | | | $ | 1.086 | | |
| Less distributions | |
| From net investment income | | $ | (0.443 | ) | | $ | (0.477 | ) | | $ | (0.502 | ) | | $ | (0.539 | ) | | $ | (0.576 | ) | |
| From tax return of capital | | | — | | | | (0.006 | ) | | | — | | | | — | | | | — | | |
| Total distributions | | $ | (0.443 | ) | | $ | (0.483 | ) | | $ | (0.502 | ) | | $ | (0.539 | ) | | $ | (0.576 | ) | |
| Net asset value — End of year | | $ | 7.600 | | | $ | 7.470 | | | $ | 7.480 | | | $ | 7.610 | | | $ | 7.670 | | |
| Total Return(2) | | | 7.91 | % | | | 6.50 | % | | | 5.21 | %(3) | | | 6.45 | % | | | 15.68 | % | |
| Ratios/Supplemental Data | |
| Net assets, end of year (000's omitted) | | $ | 311,317 | | | $ | 225,985 | | | $ | 148,541 | | | $ | 103,355 | | | $ | 74,117 | | |
| Ratios (As a percentage of average daily net assets): | |
| Expenses before custodian fee reduction(4) | | | 1.78 | % | | | 1.74 | % | | | 1.77 | % | | | 1.81 | % | | | 1.86 | % | |
| Expenses after custodian fee reduction(4) | | | 1.78 | % | | | 1.74 | % | | | 1.77 | % | | | 1.81 | % | | | 1.86 | % | |
| Net investment income | | | 4.74 | % | | | 4.29 | % | | | 2.91 | % | | | 2.89 | % | | | 3.53 | % | |
| Portfolio Turnover of the Global Macro Portfolio | | | 45 | % | | | 41 | % | | | 59 | % | | | 55 | % | | | 71 | % | |
| Portfolio Turnover of the High Income Portfolio | | | 81 | % | | | 62 | % | | | 62 | % | | | 80 | % | | | 122 | % | |
| Portfolio Turnover of the Floating Rate Portfolio | | | 61 | % | | | 50 | % | | | 57 | % | | | 67 | % | | | — | | |
| Portfolio Turnover of the Investment Portfolio | | | 35 | % | | | — | | | | — | | | | — | | | | — | | |
| Portfolio Turnover of the International Income Portfolio | | | 2 | % | | | — | | | | — | | | | — | | | | — | | |
| Portfolio Turnover of the Emerging Markets Income Portfolio | | | 2 | % | | | — | | | | — | | | | — | | | | — | | |
(1) Net investment income per share was computed using average shares outstanding.
(2) Returns are historical and are calculated by determining the percentage change in net asset value with all distributions reinvested.
(3) Total return reflects an increase of 0.17% due to a change in the timing of the payment and reinvestment of distributions.
(4) Includes the Fund's share of the Portfolios' allocated expenses.
See notes to financial statements
10
Eaton Vance Strategic Income Fund as of October 31, 2007
NOTES TO FINANCIAL STATEMENTS
1 Significant Accounting Policies
Eaton Vance Strategic Income Fund (the Fund) is a non-diversified series of Eaton Vance Mutual Funds Trust (the Trust). The Trust is registered under the Investment Company Act of 1940, as amended (the 1940 Act), as an open-end management investment company. The investment objective of the Fund is to provide a high level of income and total return. The Fund offers three classes of shares. Class A shares are generally sold subject to a sales charge imposed at the time of purchase. Class B and Class C shares are sold at net asset value and are generally subject to a contingent deferred sales charge (see Note 5). Class B shares automatically convert to Class A shares eight years after their purchase as described in the Fund's prospectus. Each class represents a pro-rata interest in the Fund, but votes separately on class-specific matters and (as noted below) is subject to different expenses. Realized and unrealized gains and losses are allocated daily to each class of shares based on the relative net assets of each class to the total net assets of the Fund. Net investment income, other than class-specific expenses, is allocated daily to each class of shares based upon the ratio of the value of each class's paid shares to the total value of all paid shares. Each class of shares differs in its distribution plan and certain other class specific expenses. The Fund is structured as a fund-of-funds and as of October 31, 2007, invested all of its investable assets in interests in six Portfolios: Global Macro Portfolio (formerly Strategic Income Portfolio), Emerging Markets Income Portfolio, International Income Portfolio, High Income Portfolio, Investment Portfolio, and Floating Rate Portfolio (the Portfolios), which are New York trusts. The value of the Fund's investment in the Portfolios reflects the Fund's proportionate interest in the net assets of the Global Macro Portfolio, Emerging Markets Income Portfolio, International Income Portfo lio, High Income Portfolio, Investment Portfolio, and Floating Rate Portfolio (85.4%, 85.2%, 84.3%, 0.7%, 11.5%, and 5.6%, respectively, at October 31, 2007). The performance of the Fund is directly affected by the performance of the Portfolios. See Note 8 for further information on the results of operations of the Portfolios. A copy of the financial statements of each Portfolio is available on the EDGAR Database on the Securities and Exchange Commission's website (www.sec.gov), at the Commission's public reference room in Washington, DC or upon request from the Fund's principal underwriter, Eaton Vance Distributors Inc. (EVD) by calling 1-800-225-6265.
The following is a summary of significant accounting policies of the Fund. The policies are in conformity with accounting principles generally accepted in the United States of America.
A Investment Valuation — The valuation policies common to the Portfolios are as follows: Equity securities that are listed on foreign or U.S. securities exchanges are valued at closing sale prices on the exchange where such securities are principally traded. Equity securities listed in the NASDAQ Global or Global Select Market are valued at the NASDAQ official closing price. Unlisted or listed securities for which closing sale prices are not available are valued at the mean between the latest available bid and ask prices. Short-term debt securities and money-market securities (of U.S. issuers) maturing in sixty days or less are valued at amortized cost, which approximates market value. If short-term debt securities are acquired with a remaining maturity of more than sixty days, they will be valued by a pricing service. Non-U.S. dollar denominated short-term obligations are valued at amortized cost as calculated in the base currency and translated to U.S. dollars at the current exchange rate. Financial futures contracts and options thereon listed on commodity exchanges and exchange-traded options are valued at closing settlement prices. The value of interest rate swaps is based upon a dealer quotation. Credit default swaps are valued by the broker-dealer (usually the counterparty to the agreement). Foreign exchange rates for foreign exchange forward contracts and for the translation of non-U.S. dollar-denominated investments into U.S. dollars are obtained from a pricing service. Sovereign credit default swaps are valued by a pricing service. Foreign interest rate swaps and over-the-counter currency options are valued using inputs from a third party into a valuation model. Occasionally, events affecting the value of foreign securities may occur between the time trading is comp leted abroad and the close of the Exchange which will not be reflected in the computation of the Portfolios' net asset value (unless the Portfolios deem that such event would materially affect their net asset values in which case adjustments would be made and reflected in such computations). The Portfolios may rely on an independent fair valuation service in making any such adjustment. Investments for which valuations or market quotations are not readily available are valued at fair value using methods determined in good faith by or at the direction of the Trustees.
Additional valuation policies for Global Macro Portfolio, Emerging Markets Income Portfolio, Investment Portfolio and International Income Portfolio are as follows: Most seasoned fixed-rate 30 year mortgage-backed securities ("MBS") are valued by the investment adviser's matrix pricing system. The matrix pricing system also considers various factors relating to bonds and market transactions to determine market value. Debt securities including those issued by foreign entities, certain MBS, and collateralized mortgage obligations, will
11
Eaton Vance Strategic Income Fund as of October 31, 2007
NOTES TO FINANCIAL STATEMENTS CONT'D
normally be valued on the basis of market valuations furnished by pricing services. The pricing services consider various factors relating to bonds or loans and/or market transactions to determine market value.
An additional investment valuation for Floating Rate Portfolio is as follows: The Portfolio's investments are primarily in interests in senior floating-rate loans (Senior Loans). Interests in Senior Loans for which reliable market quotations are readily available are valued on the basis of prices furnished by an independent pricing service. Other Senior Loans are valued at fair value by the investment adviser under procedures approved by the Trustees. In fair valuing a Senior Loan, the investment adviser utilizes one or more of the following valuation techniques: (i) a matrix pricing approach that considers the yield on the Senior Loan relative to yields on other loan interests issued by companies of comparable credit quality; (ii) a comparison of the value of the borrower's outstanding equity and debt to that of comparable public companies; (iii) a discounted cash flow analysis; or (iv) when the investment adviser believes it i s likely that a borrower will be liquidated or sold, an analysis of the terms of such liquidation or sale. In certain cases, the investment adviser will use a combination of analytical methods to determine fair value, such as when only a portion of a borrower's assets are likely to be sold. In conducting its assessment and analyses for purposes of determining fair value of a Senior Loan, the investment adviser will use its discretion and judgment in considering and appraising relevant factors. Fair value determinations are made by the portfolio managers of the Portfolio based on information available to such managers. The portfolio managers of other funds and portfolios managed by Eaton Vance that invest in Senior Loans may not possess the same information about a Senior Loan borrower as the portfolio managers of the Portfolio. At times, the fair value of a Senior Loan determined by the portfolio managers of other funds or portfolios managed by Eaton Vance that invest in Senior Loans may vary from the fair v alue of the same Senior Loan determined by the portfolio managers of other Eaton Vance funds or portfolios. The fair value of each Senior Loan is periodically reviewed and approved by the investment adviser's Valuation Committee and by the Trustees based upon procedures approved by the Trustees. Junior loans are valued in the same manner as Senior Loans.
High Income Portfolio's valuation policies also include the following: Fixed income investments, including listed securities and securities for which quotations are available, will normally be valued on the basis of valuations furnished by a pricing service. The Portfolio also invests in interests in senior floating-rate loans (Senior Loans). The Portfolio's investment adviser, Boston Management and Research (BMR) has characterized certain Senior Loans as liquid based on a predetermined acceptable number and range of market quotations available. Such loans are valued on the basis of market valuations furnished by a pricing service. Other Senior Loans are valued at fair value by BMR under procedures established by the Trustees as permitted by the 1940 Act.
In addition to investing in the Portfolios, the Fund may invest directly in securities. The valuation policies of the Fund are consistent with the valuation policies of the Portfolios.
The Portfolios may invest in Cash management Portfolio (Cash Management), an affiliated investment company managed by Boston Management and Research (BMR), a subsidiary of Eaton Vance Management (EVM). Cash Management values its investment securities utilizing the amortized cost valuation technique permitted by Rule 2a-7 of the 1940 Act. This technique involves initially valuing a portfolio security at its cost and thereafter assuming a constant amortization to maturity of any discount or premium.
B Income — The Fund's net investment income or loss consists of the Fund's pro-rata share of the net investment income or loss of the Portfolios, less all actual and accrued expenses of the Fund.
C Federal Taxes — The Fund's policy is to comply with the provisions of the Internal Revenue Code applicable to regulated investment companies and to distribute to shareholders each year, substantially all of its net investment income and all or substantially all of its net realized capital gains. Accordingly, no provision for federal income or excise tax is necessary. At October 31, 2007, the Fund, for federal income tax purposes, had a capital loss carryforward of $29,418,933, which will reduce the Fund's taxable income arising from future net realized gains on investment transactions, if any, to the extent permitted by the Internal Revenue Code, and thus will reduce the amount of the distributions to shareholders which would otherwise be necessary to relieve the Fund o f any liability for federal income or excise tax. Such capital loss carryforward will expire on October 31, 2009 ($9,854,300), October 31, 2010 ($14,208,464), October 31, 2011 ($1,234,272), October 31, 2012 ($2,342,991), October 31, 2014 ($1,560,737) and October 31, 2015 ($218,169).
D Expenses — The majority of expenses of the Trust are directly identifiable to an individual fund. Expenses which are not readily identifiable to a specific fund are
12
Eaton Vance Strategic Income Fund as of October 31, 2007
NOTES TO FINANCIAL STATEMENTS CONT'D
allocated taking into consideration, among other things, the nature and type of expense and the relative size of the funds.
E Expense Reduction — State Street Bank and Trust Company (SSBT) serves as custodian of the Fund. Pursuant to the custodian agreement, SSBT receives a fee reduced by credits, which are determined based on the average daily cash balance the Fund maintains with SSBT. All credit balances, if any, used to reduce the Fund's custodian fees are reported as a reduction of expenses in the Statement of Operations.
F Use of Estimates — The preparation of the financial statements in conformity with accounting principles generally accepted in the United States of America requires management to make estimates and assumptions that affect the reported amounts of assets and liabilities at the date of the financial statements and the reported amounts of income and expense during the reporting period. Actual results could differ from those estimates.
G Indemnifications — Under the Trust's organizational documents, its officers and Trustees may be indemnified against certain liabilities and expenses arising out of the performance of their duties to the Fund, and shareholders are indemnified against personal liability for obligations of the Trust. Additionally, in the normal course of business, the Fund enters into agreements with service providers that may contain indemnification clauses. The Fund's maximum exposure under these arrangements is unknown as this would involve future claims that may be made against the Fund that have not yet occurred.
H Other — Investment transactions are accounted for on a trade date basis. Dividends to shareholders are recorded on the ex-dividend date.
2 Distributions to Shareholders
The Fund declares dividends daily to shareholders of record at the time of declaration. Distributions are generally paid monthly. Distributions of realized capital gains, if any, are made at least annually. Distributions are declared separately for each class of shares. Shareholders may reinvest income and capital gain distributions in additional shares of the Fund at the net asset value as of the ex-dividend date or, at the election of the shareholder, receive distributions in cash. The Fund distinguishes between distributions on a tax basis and a financial reporting basis. Accounting principles generally accepted in the United States of America require that only distributions in excess of tax basis earnings and profits be reported in the financial statements as a return of capital. Permanent differences between book and tax accounting relating to distribut ions are reclassified to paid-in capital.
The tax character of distributions declared for the years ended October 31, 2007 and October 31, 2006 was as follows:
| | | Year Ended October 31, | |
| | | 2007 | | 2006 | |
| Distributions declared from: | |
| Ordinary income | | $ | 59,569,607 | | | $ | 47,134,027 | | |
| Tax return of capital | | | — | | | | 555,984 | | |
During the year ended October 31, 2007, distributions in excess of net investment income was decreased by $27,026,362, accumulated net realized loss was increased by $14,980,473, and paid-in capital was decreased by $12,045,889, primarily due to differences between book and tax accounting for mixed straddles, swaps, foreign currency transactions, premium amortization, expired capital loss carryovers and paydown gain/loss. These reclassifications change had no effect on the net assets or net asset value per share of the Fund.
As of October 31, 2007, the components of distributable earnings (accumulated losses) and unrealized appreciation (depreciation) on a tax basis were as follows:
| Undistributed ordinary income | | $ | 15,373,780 | | |
| Capital loss carryforwards | | $ | (29,418,933 | ) | |
| Unrealized appreciation | | $ | 1,485,069 | | |
| Other temporary differences | | $ | (2,164,500 | ) | |
The differences between components of distributable earnings (accumulated losses) on a tax basis and the amounts reflected in the Statement of Assets and Liabilities are primarily due to differences in book and tax policies for wash sales, swap contracts, financial futures contracts, mixed straddles, the timing of recognizing distributions to shareholders, real estate investment trusts and premium amortization.
3 Investment Adviser Fee and Other Transactions with Affiliates
EVM serves as administrator of the Fund, but receives no compensation. Effective June 22, 2007, the Fund has engaged EVM to render investment advisory services. Under the investment advisory agreement, EVM receives a
13
Eaton Vance Strategic Income Fund as of October 31, 2007
NOTES TO FINANCIAL STATEMENTS CONT'D
monthly advisory fee equal to 0.615% annually of the average daily net assets of the Fund up to $500 million that are invested directly in securities. On net assets of $500 million and over that are invested directly in securities, the annual fee is reduced. For the year ended October 31, 2007 EVM received $62,609 in advisory fees on securities directly held by the Fund. To the extent the Fund's assets are invested in the Portfolios, the Fund is allocated its share of each Portfolios' advisory fee. The Portfolios have engaged BMR, to render investment advisory services. (See Note 2 of each of the Portfolios' Notes to financial statements.) EVM serves as the sub-transfer agent of the Fund and receives an aggregate fee based upon the actual expenses incurred by EVM in the performance of those services. For the year ended October 31, 2007, EVM received $40,921 in sub-transfer agent fees. The Fund was informed that Eaton Vance Distr ibutors Inc. (EVD), the Fund's principal underwriter and a subsidiary of EVM, received $144,815 as its portion of the sales charge on sales of Class A shares for the year ended October 31, 2007. EVD also received distribution and service fees from the Fund (see Note 4) and contingent deferred sales charges (see Note 5).
Except for Trustees of the Fund and the Portfolios who are not members of EVM's or BMR's organization, officers and Trustees receive remuneration for their services to the Fund out of the investment advisory fee. Certain officers and Trustees of the Fund and of the Portfolios are officers of the above organizations.
4 Distribution Plans
The Fund has in effect a distribution plan for Class A shares (Class A Plan) pursuant to Rule 12b-1 under the 1940 Act. The Class A Plan provides that the Fund will pay EVD a distribution and service fee of 0.25% per annum of the Fund's average daily net assets attributable to Class A shares for distribution services and facilities provided to the Fund by EVD, as well as for personal services and/or the maintenance of shareholder accounts. Distribution and service fees paid or accrued to EVD for the year ended October 31, 2007 amounted to $1,236,951 for Class A shares. The Fund also has in effect distribution plans for Class B shares (Class B Plan) and Class C shares (Class C Plan) pursuant to Rule 12b-1 under the 1940 Act. The Class B and Class C Plans require the Fund to pay EVD amounts equal to 0.75% per annum of its average daily net assets attributable to Class B and Class C shares for providing ongoing distribution service s and facilities to the Fund. The Fund will automatically discontinue payments to EVD during any period in which there are no outstanding Uncovered Distribution Charges, which are equivalent to the sum of (i) 4.5% and 6.25% of the aggregate amount received by the Fund for the Class B and Class C shares sold, respectively, plus (ii) interest calculated by applying the rate of 1% over the prevailing prime rate to the outstanding balance of Uncovered Distribution Charges of EVD of each respective class, reduced by the aggregate amount of contingent deferred sales charges (see Note 5) and amounts theretofore paid or payable to EVD by each respective class. For the year ended October 31, 2007, the Fund paid or accrued to EVD $1,401,892 and $1,995,814 for Class B and Class C shares, respectively, representing 0.75% per annum of the average daily net assets of Class B and Class C shares. At October 31, 2007, the amounts of Uncovered Distributio n Charges of EVD calculated under the Plans were approximately $40,424,000 and $22,910,000 for Class B and Class C shares, respectively. The Class B and Class C Plans also authorize the Fund to make payments of service fees to EVD, investment dealers and other persons in amounts not exceeding 0.25% per annum of the average daily net assets attributable to that Class. Service fees paid or accrued are for personal services and/or the maintenance of shareholder accounts. They are separate and distinct from the Class B and Class C sales commissions and distribution fees and, as such, are not subject to automatic discontinuance when there are no outstanding Uncovered Distribution Charges to EVD. Service fees paid or accrued for the year ended October 31, 2007 amounted to $467,297 and $665,271 for Class B and Class C shares, respectively.
5 Contingent Deferred Sales Charge
A contingent deferred sales charge (CDSC) generally is imposed on redemptions of Class B shares made within six years of purchase and on redemptions of Class C shares made within one year of purchase. Class A shares may be subject to a 1% CDSC if redeemed within eighteen months of purchase (depending on the circumstances of purchase). Generally, the CDSC is based upon the lower of the net asset value at date of redemption or date of purchase. No charge is levied on shares acquired by reinvestment of dividends or capital gain distributions. The CDSC for Class B is imposed at declining rates that begin at 5% in the case of redemption in the first and second year after purchase, declining one percentage point in each subsequent year. Class C shares are subject to a 1% CDSC if redeemed within one year of purchase. No CDSC is levied on shares which have been sold to EVM or its affiliates or to their respective employees or clients an d may be waived under certain other limited conditions. CDSCs received on Class B and Class C redemptions are paid to EVD to reduce the amount of Uncovered Distribution Charges calculated under the Fund's Class B and Class C Plans, respectively. CDSCs received on Class B and Class C redemptions when
14
Eaton Vance Strategic Income Fund as of October 31, 2007
NOTES TO FINANCIAL STATEMENTS CONT'D
no Uncovered Distribution Charges exist are credited to the Fund. For the year ended October 31, 2007, the Fund was informed that EVD received approximately $44,000, $526,000 and $90,000 of CDSC paid by shareholders of Class A, Class B and Class C shares, respectively.
6 Investment Transactions
Increases and decreases in the Fund's investment in the Portfolios for the year ended October 31, 2007 are aggregated as follows:
| Portfolio | | Increases | | Decreases | |
| Global Macro Portfolio | | $ | 298,462,805 | | | $ | 261,259,399 | | |
| Emerging Markets Income Portfolio | | | 50,538,808 | | | | 7,493,655 | | |
| International Income Portfolio | | | 21,072,058 | | | | 3,108,894 | | |
| High Income Portfolio | | | — | | | | 65,610,400 | | |
| Investment Portfolio | | | 4,761,963 | | | | — | | |
| Floating Rate Portfolio | | | 99,307,375 | | | | — | | |
7 Federal Income Tax Basis of Unrealized Appreciation (Depreciation)
The cost and unrealized appreciation (depreciation) of investments of the Fund at October 31, 2007, as determined on a federal income tax basis, were as follows:
| Aggregate cost | | $ | 1,090,351,185 | | |
| Gross unrealized appreciation | | $ | 1,485,069 | | |
| Gross unrealized depreciation | | | — | | |
| Net unrealized appreciation | | $ | 1,485,069 | | |
8 Shares of Beneficial Interest
The Fund's Declaration of Trust permits the Trustees to issue an unlimited number of full and fractional shares of beneficial interest (without par value). Such shares may be issued in a number of different series (such as the Fund) and classes. Transactions in Fund shares were as follows:
| | | Year Ended October 31, | |
| Class A | | 2007 | | 2006 | |
| Sales | | | 36,133,235 | | | | 32,136,571 | | |
Issued to shareholders electing to receive
payments of distributions in Fund shares | | | 2,614,322 | | | | 1,747,890 | | |
| Redemptions | | | (18,311,473 | ) | | | (12,677,736 | ) | |
| Exchange from Class B shares | | | 1,558,993 | | | | 1,115,186 | | |
| Net increase | | | 21,995,077 | | | | 22,321,911 | | |
| | | Year Ended October 31, | |
| Class B | | 2007 | | 2006 | |
| Sales | | | 3,819,059 | | | | 5,168,892 | | |
Issued to shareholders electing to receive
payments of distributions in Fund shares | | | 634,051 | | | | 705,805 | | |
| Redemptions | | | (4,995,212 | ) | | | (4,988,803 | ) | |
| Exchange to Class A shares | | | (1,646,768 | ) | | | (1,177,540 | ) | |
| Net decrease | | | (2,188,870 | ) | | | (291,646 | ) | |
| | | Year Ended October 31, | |
| Class C | | 2007 | | 2006 | |
| Sales | | | 17,241,126 | | | | 14,847,438 | | |
Issued to shareholders electing to receive
payments of distributions in Fund shares | | | 1,114,681 | | | | 753,078 | | |
| Redemptions | | | (7,609,311 | ) | | | (5,216,478 | ) | |
| Net increase | | | 10,746,496 | | | | 10,384,038 | | |
15
Eaton Vance Strategic Income Fund as of October 31, 2007
NOTES TO FINANCIAL STATEMENTS CONT'D
9 Investment in Portfolios and Unaffiliated Investments
For the year ended October 31, 2007, the Fund was allocated net investment income and realized and unrealized gain (loss) from the Portfolios and unaffiliated investments as follows:
| | | Global
Macro
Portfolio | | Other
Portfolios and
Unaffiliated
Investments | | Total | |
| Interest income (net of foreign taxes, of $144,265, and $220,429, respectively) | | $ | 32,400,447 | | | $ | 29,484,656 | | | $ | 61,885,103 | | |
| Dividend income | | | 3,898 | | | | 20,739 | | | | 24,637 | | |
| Expenses | | | (3,697,475 | ) | | | (2,410,581 | ) | | | (6,108,056 | ) | |
| Net investment income | | $ | 28,706,870 | | | $ | 27,094,814 | | | $ | 55,801,684 | | |
Net realized gain (loss) —
Investment transactions | | $ | 2,396,714 | | | $ | 2,338,254 | | | $ | 4,734,968 | | |
| Financial futures contracts | | | (5,029,686 | ) | | | 2,756,375 | | | | (2,273,311 | ) | |
| Swap contracts | | | 1,261,797 | | | | 74,750 | | | | 1,336,547 | | |
| Foreign currency and forward foreign currency exchange contract transactions | | | 22,202,152 | | | | (2,349,528 | ) | | | 19,852,624 | | |
| Net realized gain (loss) | | $ | 20,830,977 | | | $ | 2,819,851 | | | $ | 23,650,828 | | |
Change in unrealized appreciation (depreciation)
Investments | | $ | 5,311,507 | | | $ | (3,235,664 | ) | | $ | 2,075,843 | | |
| Financial futures contracts | | | (1,140,737 | ) | | | 1,492 | | | | (1,139,245 | ) | |
| Swap contracts | | | (1,111,431 | ) | | | 69,689 | | | | (1,041,742 | ) | |
| Foreign currency and forward foreign currency exchange contracts | | | 2,774,619 | | | | 829,260 | | | | 3,603,879 | | |
| Net change in unrealized appreciation (depreciation) | | $ | 5,833,958 | | | $ | (2,335,223 | ) | | $ | 3,498,735 | | |
10 Recently Issued Accounting Pronouncements
In June 2006, the Financial Accounting Standards Board (FASB) issued FASB Interpretation No. 48 (FIN 48), "Accounting for Uncertainty in Income Taxes – an interpretation of FASB Statement No. 109". FIN 48 clarifies the accounting for uncertainty in income taxes recognized in accordance with FASB Statement No. 109, "Accounting for Income Taxes". This interpretation prescribes a recognition threshold and measurement attribute for the financial statement recognition and measurement of a tax position taken or expected to be taken in a tax return. It also provides guidance on de-recognition, classification, interest and penalties, accounting in interim periods, disclosure and transition. FIN 48 is effective on the last business day of the first required financial reporting period for fiscal years beginning after December 15, 2006. Management is currently eva luating the impact of applying the various provisions of FIN 48.
In September 2006, the FASB issued Statement of Financial Accounting Standards No. 157 (FAS 157), "Fair Value Measurements". FAS 157 defines fair value, establishes a framework for measuring fair value in accordance with generally accepted accounting principles and expands disclosure about fair value measurements. FAS 157 is effective for fiscal years beginning after November 15, 2007. Management is currently evaluating the impact the adoption of FAS 157 will have on the Fund's financial statement disclosures.
16
Eaton Vance Strategic Income Fund as of October 31, 2007
REPORT OF INDEPENDENT REGISTERED PUBLIC ACCOUNTING FIRM
To the Trustees of Eaton Vance Mutual Funds Trust and Shareholders of Eaton Vance Strategic Income Fund:
We have audited the accompanying statement of assets and liabilities of Eaton Vance Strategic Income Fund (one of the series of Eaton Vance Mutual Funds Trust) (the "Fund"), including the portfolio of investments, as of October 31, 2007, and the related statement of operations, the statement of changes in net assets, and the financial highlights for the year then ended. These financial statements and financial highlights are the responsibility of the Fund's management. Our responsibility is to express an opinion on these financial statements and financial highlights based on our audit. The statement of changes in net assets for the year ended October 31, 2006 and the financial highlights for each of the four years in the period ended October 31, 2006 were audited by other auditors. Those auditors expressed an unqualified opinion on those financial statements and financial highlights in their report dated December 27, 2006.
We conducted our audit in accordance with the standards of the Public Company Accounting Oversight Board (United States). Those standards require that we plan and perform the audit to obtain reasonable assurance about whether the financial statements and financial highlights are free of material misstatement. The Fund is not required to have, nor were we engaged to perform, an audit of its internal control over financial reporting. Our audit included consideration of internal control over financial reporting as a basis for designing audit procedures that are appropriate in the circumstances, but not for the purpose of expressing an opinion on the effectiveness of the Fund's internal control over financial reporting. Accordingly, we express no such opinion. An audit also includes examining, on a test basis, evidence supporting the amounts and disclosures in the financial statements, assessing the accounting principles used and si gnificant estimates made by management, as well as evaluating the overall financial statement presentation. We believe that our audit provides a reasonable basis for our opinion.
In our opinion, the financial statements and financial highlights referred to above present fairly, in all material respects, the financial position of Eaton Vance Strategic Income Fund as of October 31, 2007, and the results of its operations, the changes in its net assets, and the financial highlights for the year then ended, in conformity with accounting principles generally accepted in the United States of America.
DELOITTE & TOUCHE LLP
Boston, Massachusetts
December 20, 2007
17
Eaton Vance Strategic Income Fund as of October 31, 2007
SPECIAL MEETING OF SHAREHOLDERS (Unaudited)
The Fund held a Special Meeting of Shareholders on June 21, 2007. The following action was taken by the shareholders:
Item 1: To approve an Investment Advisory Agreement between Eaton Vance Management and Eaton Vance Strategic Income Fund:
| | | Number of Shares | |
| | | For | | Withheld | |
| | | 54,681,646 | | | | 2,357,763 | | |
Item 2: To approve a new Investment Advisory Agreement between Boston Management and Research and Global Macro Portfolio:
| | | Number of Shares | |
| | | For | | Withheld | |
| | | 53,434,727 | | | | 3,231,318 | | |
Item 3: To authorize the Board of Trustees to select investment sub-advisers:
| | | Number of Shares | |
| | | For | | Withheld | |
| | | 51,845,250 | | | | 4,844,446 | | |
Results are rounded to the nearest whole number.
18
Eaton Vance Strategic Income Fund as of October 31, 2007
OTHER MATTERS
Change in Independent Registered Public Accounting Firm
On August 6, 2007, PricewaterhouseCoopers LLP resigned in the ordinary course as the independent registered public accounting firm for the Fund.
The reports of PricewaterhouseCoopers LLP on the Fund's financial statements for each of the last two fiscal years contained no adverse opinion or disclaimer of opinion and were not qualified or modified as to uncertainty, audit scope or accounting principle. There have been no disagreements with PricewaterhouseCoopers LLP during the Fund's two most recent fiscal years and any subsequent interim period on any matter of accounting principles or practices, financial statement disclosure or auditing scope or procedure, which disagreements if not resolved to the satisfaction of PricewaterhouseCoopers LLP, would have caused them to make reference thereto in their reports on the Fund's financial statements for such years, and there were no reportable events of the kind described in Item 304 (a)(1)(v) of Regulation S-K under the Securities Exchange Act of 1934, as amended.
At a meeting held on August 6, 2007, based on Audit Committee recommendations and approvals, the full Board of Trustees of the Fund approved Deloitte & Touche LLP as the Fund's independent registered public accounting firm for the fiscal year ending October 31, 2007. To the best of the Fund's knowledge, for the fiscal years ended October 31, 2006 and October 31, 2005, and through August 6, 2007, the Fund did not consult with Deloitte & Touche LLP on items which concerned the application of accounting principles to a specified transaction, either completed or proposed, or the type of audit opinion that might be rendered on the Fund's financial statements or concerned the subject of a disagreement (as defined in paragraph (a)(1)(iv) of Item 304 of Regulation S-K) or reportable events (as described in paragraph (a)(1)(v) of Item 304 of Regulation S-K).
19
Eaton Vance Strategic Income Fund as of October 31, 2007
FEDERAL TAX INFORMATION
The Form 1099-DIV you receive in January 2008 will show the tax status of all distributions paid to your account in calendar 2007. Shareholders are advised to consult their own tax adviser with respect to the tax consequences of their investment in the Fund.
20
Eaton Vance Strategic Income Fund
BOARD OF TRUSTEES' ANNUAL APPROVAL OF THE INVESTMENT ADVISORY AGREEMENTS
Overview of the Contract Review Process
The Investment Company Act of 1940, as amended (the "1940 Act"), provides, in substance, that each investment advisory agreement between a fund and its investment adviser will continue in effect from year to year only if its continuance is approved at least annually by the fund's board of trustees, including by a vote of a majority of the trustees who are not "interested persons" of the fund ("Independent Trustees"), cast in person at a meeting called for the purpose of considering such approval.
At a meeting of the Boards of Trustees (each a "Board") of the Eaton Vance group of mutual funds (the "Eaton Vance Funds") held on April 23, 2007, the Board, including a majority of the Independent Trustees, voted to approve continuation of existing advisory and sub-advisory agreements for the Eaton Vance Funds for an additional one-year period. In voting its approval, the Board relied upon the affirmative recommendation of the Special Committee of the Board, which is a committee comprised exclusively of Independent Trustees. Prior to making its recommendation, the Special Committee reviewed information furnished for a series of meetings of the Special Committee held in February, March and April 2007. Such information included, among other things, the following:
Information about Fees, Performance and Expenses
• An independent report comparing the advisory and related fees paid by each fund with fees paid by comparable funds;
• An independent report comparing each fund's total expense ratio and its components to comparable funds;
• An independent report comparing the investment performance of each fund to the investment performance of comparable funds over various time periods;
• Data regarding investment performance in comparison to relevant peer groups of funds and appropriate indices;
• Comparative information concerning fees charged by each adviser for managing other mutual funds and institutional accounts using investment strategies and techniques similar to those used in managing the fund;
• Profitability analyses for each adviser with respect to each fund;
Information about Portfolio Management
• Descriptions of the investment management services provided to each fund, including the investment strategies and processes employed;
• Information concerning the allocation of brokerage and the benefits received by each adviser as a result of brokerage allocation, including information concerning the acquisition of research through "soft dollar" benefits received in connection with the funds' brokerage, and the implementation of a soft dollar reimbursement program established with respect to the funds;
• Data relating to portfolio turnover rates of each fund;
• The procedures and processes used to determine the fair value of fund assets and actions taken to monitor and test the effectiveness of such procedures and processes;
Information about each Adviser
• Reports detailing the financial results and condition of each adviser;
• Descriptions of the qualifications, education and experience of the individual investment professionals whose responsibilities include portfolio management and investment research for the funds, and information relating to their compensation and responsibilities with respect to managing other mutual funds and investment accounts;
• Copies of the Codes of Ethics of each adviser and its affiliates, together with information relating to compliance with and the administration of such codes;
• Copies of or descriptions of each adviser's proxy voting policies and procedures;
• Information concerning the resources devoted to compliance efforts undertaken by each adviser and its affiliates on behalf of the funds (including descriptions of various compliance programs) and their record of compliance with investment policies and restrictions, including policies with respect to market-timing, late trading and selective portfolio disclosure, and with policies on personal securities transactions;
• Descriptions of the business continuity and disaster recovery plans of each adviser and its affiliates;
Other Relevant Information
• Information concerning the nature, cost and character of the administrative and other non-investment management services provided by Eaton Vance Management and its affiliates;
• Information concerning management of the relationship with the custodian, subcustodians and fund accountants by each adviser or the funds' administrator; and
• The terms of each advisory agreement.
In addition to the information identified above, the Special Committee considered information provided from time to time by each adviser throughout the year at meetings of the Board and its committees. Over the course of the twelve-month period ended April 30,
21
Eaton Vance Strategic Income Fund
BOARD OF TRUSTEES' ANNUAL APPROVAL OF THE INVESTMENT ADVISORY AGREEMENTS CONT'D
2007, the Board met ten times and the Special Committee, the Audit Committee and the Governance Committee, each of which is a Committee comprised solely of Independent Trustees, met twelve, fourteen and eight times, respectively. At such meetings, the Trustees received, among other things, presentations by the portfolio managers and other investment professionals of each adviser relating to the investment performance of each fund and the investment strategies used in pursuing the fund's investment objective.
For funds that invest through one or more underlying portfolios, the Board considered similar information about the portfolio(s) when considering the approval of advisory agreements. In addition, in cases where the fund's investment adviser has engaged a sub-adviser, the Board considered similar information about the sub-adviser when considering the approval of any sub-advisory agreement.
The Special Committee was assisted throughout the contract review process by Goodwin Procter LLP, legal counsel for the Independent Trustees. The members of the Special Committee relied upon the advice of such counsel and their own business judgment in determining the material factors to be considered in evaluating each advisory and sub-advisory agreement and the weight to be given to each such factor. The conclusions reached with respect to each advisory and sub-advisory agreement were based on a comprehensive evaluation of all the information provided and not any single factor. Moreover, each member of the Special Committee may have placed varying emphasis on particular factors in reaching conclusions with respect to each advisory and sub-advisory agreement.
Results of the Process
Based on its consideration of the foregoing, and such other information as it deemed relevant, including the factors and conclusions described below, the Board concluded that the terms of the Fund's investment advisory agreement with the Adviser, including its fee structure, is in the interests of shareholders and, therefore, the Board, including a majority of the Independent Trustees, voted to approve the advisory agreement for the Fund.
Nature, Extent and Quality of Services
In considering whether to approve the investment advisory agreement of the Fund, the Board evaluated the nature, extent and quality of services to be provided to the Fund and to the Underlying Funds by the Adviser and BMR.
The Board considered the Adviser's and BMR's management capabilities and investment process with respect to the types of investments to be held by the Underlying Funds and by the Fund, including the education, experience and number of its investment professionals and other personnel who provide portfolio management, investment research, and similar services to the Underlying Funds and the Fund. The Board noted the Adviser's and BMR's in-house equity research capabilities. The Board also took into account the resources dedicated to portfolio management and other services, including the compensation paid to recruit and retain investment personnel, and the time and attention devoted to each Fund in the complex by senior management. In approving the Advisory Agreement, the Trustees considered the potential benefits to the Fund of the ability to make direct investments, such as an improved ability to: manage the Fund's duration, or o ther general market exposures, using certain derivatives; add exposure to specific market sectors or asset classes without changing an underlying portfolio's investments, which would affect any other fund investing in that portfolio; hedge some of the general market risks of an underlying portfolio while retaining the value added by the individual manager; and hedge a portion of the exposures of an underlying portfolio while retaining others (e.g., hedging the U.S. government exposure of an underlying portfolio while retaining its exposure to high-grade corporate bonds). The Board further noted that the Adviser would be responsible for periodic rebalancing of assets among the Underlying Funds and, potentially, for investing in other securities, but would not receive a separate fee for the rebalancing.
The Board reviewed the compliance programs of the Adviser and relevant affiliates thereof. Among other matters, the Board considered compliance and reporting matters relating to personal trading by investment personnel, selective disclosure of portfolio holdings, late trading, frequent trading, portfolio valuation, business continuity and the allocation of investment opportunities. The Board also evaluated the responses of the Adviser and its affiliates to requests from regulatory authorities such as the Securities and Exchange Commission and the National Association of Securities Dealers.
The Board considered shareholder and other administrative services provided or managed by Eaton Vance Management and its affiliates, including transfer agency and accounting services. The Board evaluated the benefits to shareholders of investing in a fund that is a part of a large family of funds, including the ability, in many cases, to exchange an investment among different funds without incurring additional sales charges.
After consideration of the foregoing factors, among others, the Board concluded that the nature, extent and quality of services to be provided by the Adviser, taken as a whole, are appropriate and consistent with the terms of the investment advisory agreement.
22
Eaton Vance Strategic Income Fund
BOARD OF TRUSTEES' ANNUAL APPROVAL OF THE INVESTMENT ADVISORY AGREEMENTS CONT'D
Fund Performance
The Board compared the Fund's investment performance to a relevant universe of similarly managed funds identified by an independent data provider and appropriate benchmark indices. The Board reviewed comparative performance data for the one- and three-year periods ended September 30, 2006 for the Fund. The Board concluded that the Fund's performance was satisfactory.
Management Fees and Expenses
The Board reviewed contractual investment advisory fee rates, to be payable by the Fund, directly or indirectly through the Underlying Funds (referred to as "management fees"). As part of its review, the Board considered the Fund's management fees and estimated expense ratio under the new Agreement. The Board noted that there is no separate advisory fee for assets invested in the Underlying Funds and that for assets the Fund invests in directly, the advisory fee would approximate the total fees to be paid on the expected allocation among the Underlying Fund(s).
After reviewing the foregoing information, and in light of the nature, extent and quality of the services to be provided by the Adviser and BMR, the Board concluded with respect to the Fund that the management fees proposed to be charged to the Fund for advisory and related services and the total expense ratio of the Fund are reasonable.
Economies of Scale
In reviewing management fees, the Board also considered the extent to which the Adviser and its affiliates, on the one hand, and the Fund, on the other hand, can expect to realize benefits from economies of scale as the assets of the Fund increase. The Board noted the structure of the advisory fee, which includes breakpoints at several asset levels for assets directly held by the Fund and includes no separate advisory fee for assets invested in the Underlying Funds. The Board noted that for assets invested in Underlying Funds, the Fund will automatically receive the benefits of such breakpoints as have been established for the Underlying Funds based on their total assets. Based upon the foregoing, the Board concluded that the Adviser and its affiliates and the Fund can be expected to share such benefits equitably.
23
Eaton Vance Strategic Income Fund
MANAGEMENT AND ORGANIZATION
Fund Management. The Trustees of Eaton Vance Mutual Funds Trust (the Trust), Boston Income Portfolio (BIP), Emerging Markets Income Portfolio (EMIP), Floating Rate Portfolio (FRP), Global Macro Portfolio (GMP), High Income Portfolio (HIP), International Income Portfolio (IIP), Investment Grade Income Portfolio (IGIP) and Investment Portfolio (IP) (the Portfolios) are responsible for the overall management and supervision of the Trust's and Portfolios' affairs. The Trustees and officers of the Trust and the Portfolios are listed below. Except as indicated, each individual has held the office shown or other offices in the same company for the last five years. Trustees and officers of the Trust and the Portfolios hold indefinite terms of office. The "noninterested Trustees" consist of those Trustees who are not "interested persons" of the Trust and the Portfoli os, as that term is defined under the 1940 Act. The business address of each Trustee and officer is The Eaton Vance Building, 255 State Street, Boston, Massachusetts 02109. As used below, "EVC" refers to Eaton Vance Corp., "EV" refers to Eaton Vance, Inc., "EVM" refers to Eaton Vance Management, "BMR" refers to Boston Management and Research, "Parametric" refers to Parametric Portfolio Associates and "EVD" refers to Eaton Vance Distributors, Inc. EVC and EV are the corporate parent and trustee, respectively, of EVM and BMR. EVD is the Fund's principal underwriter, the Portfolios' placement agent and a wholly-owned subsidiary of EVM. Each officer affiliated with Eaton Vance may hold a position with other Eaton Vance affiliates that is comparable to his or her position with EVM listed below.
Name and
Date of Birth | | Position(s)
with the
Trust and
the Portfolios | | Term of
Office and
Length of
Service | | Principal Occupation(s)
During Past Five Years | | Number of Portfolios
in Fund Complex
Overseen By
Trustee(1) | | Other Directorships Held | |
| Interested Trustee | | | | | | | | | | | | | |
|
Thomas E. Faust Jr.
5/31/58 | | Trustee and President of the Trust | | Trustee since 2007 and President of the Trust since 2002 | | Chairman, Chief Executive Officer and President of EVC, President of EV, Chief Executive Officer and President of EVM and BMR, and Director of EVD. Trustee and/or Officer of 176 registered investment companies and 5 private investment companies in the Eaton Vance Fund Complex. Mr. Faust is an interested person because of his positions with EVM, BMR, EVC and EV which are affiliates of the Trust and Portfolios. | | | 176 | | | Director of EVC | |
|
| Noninterested Trustee(s) | | | | | | | | | | | | | |
|
Benjamin C. Esty
1/2/63 | | Trustee | | Trustee of the Trust, BIP, FRP, GMP, HIP, IP and IGIP since 2005; of EMIP and IIP since 2007 | | Roy and Elizabeth Simmons Professor of Business Administration, Harvard University Graduate School of Business Administration (since 2003). Formerly, Associate Professor, Harvard University Graduate School of Business Administration (2000-2003). | | | 176 | | | None | |
|
Allen R. Freedman
4/3/40 | | Trustee | | Since 2007 | | Former Chairman and Chief Executive Officer of Assurant, Inc. (insurance provider) (1978-2000). Formerly, a Director of Loring Ward International (fund distributor) (2005-2007). | | | 175 | | | Director of Assurant, Inc. and Stonemor Partners L.P. (owner and operator of cemeteries) | |
|
William H. Park
9/19/47 | | Trustee | | Trustee of the Trust, BIP, FRP, GMP, HIP, IP and IGIP since 2003; of EMIP and IIP since 2007 | | Vice Chairman, Commercial Industrial Finance Corp. (specialty finance company) (since 2006). Formerly, President and Chief Executive Officer, Prizm Capital Management, LLC (investment management firm) (since 2002-2005). | | | 176 | | | None | |
|
Ronald A. Pearlman
7/10/40 | | Trustee | | Trustee of the Trust, BIP, FRP, GMP, HIP, IP and IGIP since 2003; of EMIP and IIP since 2007 | | Professor of Law, Georgetown University Law Center. | | | 176 | | | None | |
|
24
Eaton Vance Strategic Income Fund
MANAGEMENT AND ORGANIZATION CONT'D
Name and
Date of Birth | | Position(s)
with the
Trust and
the Portfolios | | Term of
Office and
Length of
Service | | Principal Occupation(s)
During Past Five Years | | Number of Portfolios
in Fund Complex
Overseen By
Trustee(1) | | Other Directorships Held | |
| Noninterested Trustee(s) (continued) | | | | | | | | | | | | | |
|
Norton H. Reamer
9/21/35 | | Trustee | | Trustee of the Trust since 1986; of HIP and GMP since 1993; of FRP and IGIP since 2000; of BIP since 2001; of IP since 2002; and of EMIP and IIP since 2007 | | President, Chief Executive Officer and a Director of Asset Management Finance Corp. (a specialty finance company serving the investment management industry) (since October 2003). President, Unicorn Corporation (an investment and financial advisory services company) (since September 2000). Formerly, Chairman and Chief Operating Officer, Hellman, Jordan Management Co., Inc. (an investment management company) (2000-2003). Formerly, Advisory Director of Berkshire Capital Corporation (investment banking firm) (2002-2003). | | | 176 | | | None | |
|
Heidi L. Steiger
7/8/53 | | Trustee | | Since 2007 | | President, Lowenhaupt Global Advisors, LLC (global wealth management firm) (since 2005); Formerly, President and Contributing Editor, Worth Magazine (2004); Formerly, Executive Vice President and Global Head of Private Asset Management (and various other positions), Neuberger Berman (investment firm) (1986-2004). | | | 173 | | | Director of Nuclear Electric Insurance Ltd. (nuclear insurance provider) and Aviva USA (insurance provider) | |
|
Lynn A. Stout
9/14/57 | | Trustee | | Trustee of the Trust, HIP and GMP since 1998; of FRP and IGIP since 2000; of BIP since 2001; of IP since 2002; of EMIP and IIP since 2007 | | Paul Hastings Professor of Corporate and Securities Law, University of California at Los Angeles School of Law. | | | 176 | | | None | |
|
Ralph F. Verni
1/26/43 | | Chairman of the Board and Trustee | | Chairman of the Board since 2007. Trustee of the Trust, BIP, FRP, GMP, HIP, IP and IGIP since 2005; of EMIP and IIP since 2007 | | Consultant and private investor. | | | 176 | | | None | |
|
| Principal Officers who are not Trustees | | | | | | | | | | | | | |
|
Name and
Date of Birth | | Position(s)
with the
Trust and
the Portfolios | | Term of
Office and
Length of
Service | | Principal Occupation(s)
During Past Five Years | |
William H. Ahern, Jr.
7/28/59 | | Vice President of the Trust | | Since 1995 | | Vice President of EVM and BMR. Officer of 74 registered investment companies managed by EVM or BMR. | |
|
John R. Baur
2/10/70 | | Vice President of EMIP, GMP and IIP | | Since 2007 | | Vice President of EVM and BMR. Previously, attended business school at Johnson Graduate School of Business (2002-2005). Officer of 4 registered investment companies managed by EVM or BMR. | |
|
Michael A. Cirami
12/24/75 | | Vice President of EMIP, GMP and IIP | | Since 2007 | | Vice President of EVM and BMR. Previously, attended business school at the University of Rochester Simon School of Business (2001-2003). Officer of 4 registered investment companies managed by EVM or BMR. | |
|
Cynthia J. Clemson
3/2/63 | | Vice President of the Trust | | Since 2005 | | Vice President of EVM and BMR. Officer of 89 registered investment companies managed by EVM or BMR. | |
|
Charles B. Gaffney
12/4/72 | | Vice President of the Trust | | Since 2007 | | Vice President of EVM and BMR. Previously, Sector Portfolio Manager and Senior Equity Analyst of Brown Brothers Harriman (1997-2003). Officer of 29 registered investment companies managed by EVM or BMR. | |
|
25
Eaton Vance Strategic Income Fund
MANAGEMENT AND ORGANIZATION CONT'D
Name and
Date of Birth | | Position(s)
with the
Trust and
the Portfolios | | Term of
Office and
Length of
Service | | Principal Occupation(s)
During Past Five Years | |
| Principal Officers who are not Trustees (continued) | | | | | | | |
|
Thomas P. Huggins
3/7/66 | | Vice President of BIP and HIP | | Vice President of HIP since 2000 and of BIP since 2001 | | Vice President of EVM and BMR. Officer of 4 registered investment companies managed by EVM or BMR. | |
|
Christine M. Johnston
11/9/72 | | Vice President of the Trust, EMIP and IIP | | Since 2007 | | Vice President of EVM and BMR. Officer of 34 registered investment companies managed by EVM or BMR. | |
|
Aamer Khan
6/7/60 | | Vice President of the Trust | | Since 2005 | | Vice President of EVM and BMR. Officer of 32 registered investment companies managed by EVM or BMR. | |
|
Elizabeth S. Kenyon
9/8/59 | | President of IGIP | | Since 2002 | | Vice President of EVM and BMR. Officer of 17 registered investment companies managed by EVM or BMR. | |
|
Duke E. Laflamme
4/8/69 | | Vice President of IGIP | | Since 2006 | | Vice President of EVM and BMR. Officer of 16 registered investment companies managed by EVM or BMR. | |
|
Thomas H. Luster
4/8/62 | | Vice President of the Trust and IGIP | | Vice President of the Trust since 2006 and of IGIP since 2002 | | Vice President of EVM and BMR. Officer of 48 registered investment companies managed by EVM or BMR. | |
|
Michael R. Mach
7/15/47 | | Vice President of the Trust | | Since 1999 | | Vice President of EVM and BMR. Officer of 54 registered investment companies managed by EVM or BMR. | |
|
Robert B. MacIntosh
1/22/57 | | Vice President of the Trust | | Since 1998 | | Vice President of EVM and BMR. Officer of 89 registered investment companies managed by EVM or BMR. | |
|
Scott H. Page
11/30/59 | | President of FRP | | Since 2007(2) | | Vice President of EVM and BMR. Officer of 15 registered investment companies managed by EVM or BMR. | |
|
Duncan W. Richardson
10/26/57 | | Vice President of the Trust | | Since 2001 | | Executive Vice President and Chief Equity Investment Officer of EVC, EVM and BMR. Officer of 80 registered investment companies managed by EVM or BMR. | |
|
Walter A. Row, III
7/20/57 | | Vice President of the Trust | | Since 2001 | | Director of Equity Research and a Vice President of EVM and BMR. Officer of 38 registered investment companies managed by EVM or BMR. | |
|
Craig P. Russ
10/30/63 | | Vice President of FRP | | Since 2007 | | Vice President of EVM and BMR. Officer of 9 registered investment companies managed by EVM or BMR. | |
|
Judith A. Saryan
8/21/54 | | Vice President of the Trust | | Since 2003 | | Vice President of EVM and BMR. Officer of 53 registered investment companies managed by EVM or BMR. | |
|
Susan Schiff
3/13/61 | | Vice President of the Trust, EMIP, GMP, IIP and IP | | Vice President of the Trust, GMP and IP since 2002; of EMIP and IIP since 2007 | | Vice President of EVM and BMR. Officer of 35 registered investment companies managed by EVM or BMR. | |
|
Thomas Seto
9/27/62 | | Vice President of the Trust | | Since 2007 | | Vice President and Director of Portfolio Management of Parametric. Officer of 30 registered investment companies managed by EVM or BMR. | |
|
David M. Stein
5/4/51 | | Vice President of the Trust | | Since 2007 | | Managing Director and Chief Investment Officer of Parametric. Officer of 30 registered investment companies managed by EVM or BMR. | |
|
Mark S. Venezia
5/23/49 | | Vice President of the Trust; President of EMIP, GMP, IIP and IP | | Vice President of the Trust since 2002; President of GMP and IP since 2002; of EMIP and IIP since 2007 | | Vice President of EVM and BMR. Officer of 35 registered investment companies managed by EVM or BMR. | |
|
Adam A. Weigold
3/22/75 | | Vice President of the Trust | | Since 2007 | | Vice President of EVM and BMR. Officer of 70 registered investment companies managed by EVM or BMR. | |
|
Michael W. Weilheimer
2/11/61 | | President of BIP and HIP | | Since 2002 | | Vice President of EVM and BMR. Officer of 24 registered investment companies managed by EVM or BMR. | |
|
26
Eaton Vance Strategic Income Fund
MANAGEMENT AND ORGANIZATION CONT'D
Name and
Date of Birth | | Position(s)
with the
Trust and
the Portfolios | | Term of
Office and
Length of
Service | | Principal Occupation(s)
During Past Five Years | |
| Principal Officers who are not Trustees (continued) | | | | | | | |
|
William J. Austin, Jr.
12/27/51 | | Treasurer of IGIP | | Since 2002 | | Vice President of EVM and BMR. Officer of 51 registered investment companies managed by EVM or BMR. | |
|
Barbara E. Campbell
6/19/57 | | Treasurer of the Trust | | Since 2005 | | Vice President of EVM and BMR. Officer of 176 registered investment companies managed by EVM or BMR. | |
|
Maureen A. Gemma
5/24/60 | | Secretary | | Since 2007 | | Vice President and Deputy Chief Legal Officer of EVM and BMR. Officer of 176 registered investment companies managed by EVM or BMR. | |
|
Dan A. Maalouly
3/25/62 | | Treasurer of BIP, EMIP, FRP, GMP, HIP, IIP and IP | | Treasurer of BIP, FRP, GMP, HIP and IP since 2005 of EMIP and IIP since 2007 | | Vice President of EVM and BMR. Previously, Senior Manager at Pricewaterhouse Coopers, LLP (1997-2005). Officer of 76 registered investment companies managed by EVM or BMR. | |
|
Paul M. O'Neil
7/11/53 | | Chief Compliance Officer | | Since 2004 | | Vice President of EVM and BMR. Officer of 176 registered investment companies managed by EVM or BMR. | |
|
(1) Includes both master and feeder funds in a master-feeder structure.
(2) Prior to 2007, Mr. Page served as Vice President of FRP since 2000.
The SAI for the Fund includes additional information about the Trustees and officers of the Fund and the Portfolios and can be obtained without charge by calling 1-800-225-6265.
27
This Page Intentionally Left Blank
Administrator of Eaton Vance Strategic Income Fund
Eaton Vance Management
The Eaton Vance Building
255 State Street
Boston, MA 02109
Principal Underwriter
Eaton Vance Distributors, Inc.
The Eaton Vance Building
255 State Street
Boston, MA 02109
(617) 482-8260
Custodian
State Street Bank and Trust Company
200 Clarendon Street
Boston, MA 02116
Transfer Agent
PFPC Inc.
Attn: Eaton Vance Funds
P.O. Box 9653
Providence, RI 02940-9653
(800) 262-1122
Independent Registered Public Accounting Firm
Deloitte & Touche LLP
200 Berkeley Street
Boston, MA 02116-5022
Eaton Vance Strategic Income Fund
The Eaton Vance Building
255 State Street
Boston, MA 02109
This report must be preceded or accompanied by a current prospectus. Before investing, investors should consider carefully the Fund's investment
objective(s), risks, and charges and expenses. The Fund's current prospectus contains this and other information about the Fund and is available
through your financial advisor. Please read the prospectus carefully before you invest or send money. For further information please call 1-800-225-6265.
028-12/07 SISRC

Annual Report October 31, 2007


EATON VANCE
GLOBAL
MACRO
FUND
IMPORTANT NOTICES REGARDING PRIVACY,
DELIVERY OF SHAREHOLDER DOCUMENTS,
PORTFOLIO HOLDINGS AND PROXY VOTING
Privacy. The Eaton Vance organization is committed to ensuring your financial privacy. Each of the financial institutions identified below has in effect the following policy ("Privacy Policy") with respect to nonpublic personal information about its customers:
• Only such information received from you, through application forms or otherwise, and information about your Eaton Vance fund transactions will be collected. This may include information such as name, address, social security number, tax status, account balances and transactions.
• None of such information about you (or former customers) will be disclosed to anyone, except as permitted by law (which includes disclosure to employees necessary to service your account). In the normal course of servicing a customer's account, Eaton Vance may share information with unaffiliated third parties that perform various required services such as transfer agents, custodians and broker/dealers.
• Policies and procedures (including physical, electronic and procedural safeguards) are in place that are designed to protect the confidentiality of such information.
• We reserve the right to change our Privacy Policy at any time upon proper notification to you. Customers may want to review our Policy periodically for changes by accessing the link on our homepage: www.eatonvance.com.
Our pledge of privacy applies to the following entities within the Eaton Vance organization: the Eaton Vance Family of Funds, Eaton Vance Management, Eaton Vance Investment Counsel, Boston Management and Research, and Eaton Vance Distributors, Inc.
In addition, our Privacy Policy only applies to those Eaton Vance customers who are individuals and who have a direct relationship with us. If a customer's account (i.e., fund shares) is held in the name of a third-party financial adviser/ broker-dealer, it is likely that only such adviser's privacy policies apply to the customer. This notice supersedes all previously issued privacy disclosures.
For more information about Eaton Vance's Privacy Policy, please call 1-800-262-1122.
Delivery of Shareholder Documents. The Securities and Exchange Commission (the "SEC") permits funds to deliver only one copy of shareholder documents, including prospectuses, proxy statements and shareholder reports, to fund investors with multiple accounts at the same residential or post office box address. This practice is often called "householding" and it helps eliminate duplicate mailings to shareholders.
Eaton Vance, or your financial adviser, may household the mailing of your documents indefinitely unless you instruct Eaton Vance, or your financial adviser, otherwise.
If you would prefer that your Eaton Vance documents not be householded, please contact Eaton Vance at 1-800-262-1122, or contact your financial adviser.
Your instructions that householding not apply to delivery of your Eaton Vance documents will be effective within 30 days of receipt by Eaton Vance or your financial adviser.
Portfolio Holdings. Each Eaton Vance Fund and its underlying Portfolio (if applicable) will file a schedule of its portfolio holdings on Form N-Q with the SEC for the first and third quarters of each fiscal year. The Form N-Q will be available on the Eaton Vance website www.eatonvance.com, by calling Eaton Vance at 1-800-262-1122 or in the EDGAR database on the SEC's website at www.sec.gov. Form N-Q may also be reviewed and copied at the SEC's public reference room in Washington, D.C. (call 1-800-732-0330 for information on the operation of the public reference room).
Proxy Voting. From time to time, funds are required to vote proxies related to the securities held by the funds. The Eaton Vance Funds or their underlying Portfolios (if applicable) vote proxies according to a set of policies and procedures approved by the Funds' and Portfolios' Boards. You may obtain a description of these policies and procedures and information on how the Funds or Portfolios voted proxies relating to portfolio securities during the most recent 12 month period ended June 30, without charge, upon request, by calling 1-800-262-1122. This description is also available on the SEC's website at www.sec.gov.
Eaton Vance Global Macro Fund as of October 31, 2007
MANAGEMENT’S DISCUSSION OF FUND PERFORMANCE

Mark S. Venezia, CFA
Portfolio Manager
Performance Since Inception
· The Fund’s Class A shares had a total return of 4.50% during the period from inception on June 27, 2007 through October 31,
2007.(1)
· The Fund’s Class I shares had a total return of 4.50% during the period from inception on June 27, 2007 through October 31,
2007.(1)
· In comparison, the Merrill Lynch 3-Month U.S. Treasury Bill Index, an unmanaged market index of U.S. Treasury securities maturing in 90 days that assumes reinvestment of all income, had a return of 1.65% for the period from June 30, 2007 through October 31, 2007,(2) and the Fund’s peer group, the Lipper Global Income Funds Classification, had an average return of 4.11%.(2)
Management Discussion
· The Fund seeks to provide total return by typically investing in a portfolio consisting primarily (over 50% of net assets) of high-grade debt securities. The Fund may also invest in lower-rated debt securities, foreign securities, sovereign debt, emerging market debt, high-yield corporate bonds and derivatives. The Fund invests in these positions through its investments in Global Macro Portfolio (the “Portfolio”), a separate investment company with the same objectives and investment policies as the Fund.
· As the Fund commenced operations in June, the global bond markets were encountering increasing volatility. The U.S. credit squeeze resulted in broad deleveraging and a flight to quality in the global bond markets. Some high-yield – including senior secured loans – and emerging markets reacted negatively, while the flight to quality benefited the G7 sovereigns, the Euro and the Yen. Amid the turmoil, central banks – including the Federal Reserve – injected liquidity to preserve economic stability. While the credit squeeze and a weakening U.S. economy concerned investors, stronger domestic economies insulated some Asian and Latin American countries from slowing U.S. demand.
· The portfolio’s asset mix contributed to relative NAV stability. Relative-value European currency trades, Class A shares had a insurance on emerging market sovereign bonds and seasoned mortgage-backed securities (MBS) helped limit volatility.
· The Portfolio was widely diversified. In Asia, the Portfolio’s largest exposure was in Malaysia, whose export-oriented economy has benefited from the Asian region’s broad economic uptrend. Following the de-pegging of its currency, the Ringgit, from the U.S. dollar and the easing of capital controls, Malaysia has seen an inflow of investment, a stronger economy and an appreciating currency.(3)
· In Eastern Europe, Poland was the Portfolio’s largest currency position during the period. Improving economic fundamentals, large remittances from abroad and the recent election of a reform-minded government committed to selling state-owned industries and convergence with the Euro have pushed Poland’s currency higher. The Portfolio cross-hedged some of its Eastern Europe investments – which have attractive yields spreads over the Euro – with short-Euro positions.(3)
· In Latin America, Brazil was the Portfolio’s largest position during the period. Brazil’s government has stabilized its economy in recent years, resulting in lower inflation, an accumulation of reserves and an inflow of capital – trends that have resulted in a further appreciation of Brazil’s currency.
· The Portfolio also had positions in northern and sub-Saharan Africa. Unlike some other developing economies, these countries tend to be de-linked from broad short-term global financial tides. Egyptian T-bills remained attractive, as high energy prices produced a continuing influx of Middle Eastern petro-dollars into the Egyptian financial markets.(3)
· Investments in mortgage-backed securities (MBS) provided a buffer against volatility during the period.(1) Yield spreads for MBS over Treasuries widened from June through September by approximately 40 basis points (0.40%), reflecting similar widenings throughout the fixed-income markets. However, the widening was generally offset by a decline in overall
Fund shares are not insured by the FDIC and are not deposits or other obligations of, or guaranteed by, any depository institution. Shares are subject to investment risks, including possible loss of principal invested.
The views expressed throughout this report are those of the portfolio manager and are current only through the end of the period of the report as stated on the cover. These views are subject to change at any time based upon market or other conditions, and the investment adviser disclaims any responsibility to update such views. These views may not be relied on as investment advice and, because investment decisions for a fund are based on many factors, may not be relied on as an indication of trading intent on behalf of any Eaton Vance fund.
(1) These returns do not include the 4.75% maximum sales charge for Class A shares. If sales charges were deducted, the returns would be lower. Class I shares are offered to investors at net asset value. Absent a voluntary allocation of expenses to the administrator, the return would be lower.
(2) It is not possible to invest directly in an Index or Lipper Classification. The Index’s total return does not reflect the commissions or expenses that would have been incurred if an investor individually purchased or sold the securities represented in the Index. The Lipper total return is the average total return, at net asset value, of the funds that are in the same Lipper Classification as the Fund.
(3) Fund allocations are subject to change due to active management.
Past performance is no guarantee of future results. Returns are historical and are calculated by determining the percentage change in net asset value or offering price (as applicable) with all distributions reinvested. Investment return and principal value will fluctuate so that shares, when redeemed, may be worth more or less than their original cost. Performance is for the stated time period only; due to market volatility, the Fund’s current performance may be lower or higher than the quoted return. For performance as of the most recent month end, please refer to www.eatonvance.com.
1
Eaton Vance Global Macro Fund as of October 31, 2007
PORTFOLIO PROFILE
bond yields. Five-year Treasury bond yields declined by roughly 45 basis points (0.45%), as the Federal Reserve cut its Federal Funds rate – a key short-term interest rate – from 5.25% to 4.50% during September and October. In another positive trend, prepayment rates continued to decline during the fiscal year, while foreign central banks became increasingly aggressive buyers of MBS for their quality and attractive spreads.
· The Fund’s duration was 2.0 years at October 31, 2007. Duration is a measure of the sensitivity of a fund or a fixed-income security to changes in interest rates. A shorter duration instrument normally has less exposure to interest rate risk than longer duration instruments.
(1) Fund Allocations are subject to change due to active management.
Securities Holdings (excludes derivatives)(2)
By total net assets

(2) Securities Holdings reflect the Portfolio’s investments as of 10/31/07. Securities Holdings do not reflect derivatives positions. For International and Emerging Market exposures please refer to the Regional Currency Exposure table. Portfolio Statistics may not be representative of the Portfolio’s current or future investments and are subject to change due to active management.
Regional Currency Positions (including derivatives) (3)
By total net assets
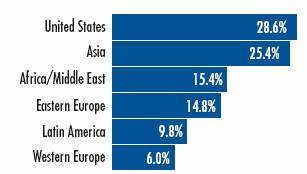
(3) The Regional Currency Exposures reflects the Portfolio’s investments as of 10/31/07. Portfolio Statistics may not be representative of the Portfolio’s current or future investments and are subject to change due to active management.
Currency Positions(4)
By total net assets
Egypt | 11.4 | % |
Poland | 9.7 | |
Malaysia | 8.3 | |
Brazil | 6.1 | |
Iceland | 6.0 | |
Philippines | 4.9 | |
Indonesia | 4.6 | |
India | 4.2 | |
Turkey | 3.5 | |
Nigeria | 1.9 | |
Mexico | 1.7 | |
Romania | 1.6 | |
Kazakhstan | 1.5 | |
South Korea | 1.0 | |
Uruguay | 1.0 | |
Ghana | 0.9 | |
Mongolia | 0.6 | |
Chile | 0.6 | |
Guatemala | 0.5 | |
Uganda | 0.4 | |
Hong Kong | 0.3 | |
Zambia | 0.2 | |
Mauritius | 0.2 | |
Botswana | 0.2 | |
Kenya | 0.2 | |
(4) Currency Positions reflect the Portfolio’s investments as of 10/31/07. Currency exposures include all long foreign exchange denominated assets and all long currency derivatives. Net short positions and other foreign derivatives are excluded. Short Currency Exposures are 18.1%. Other Foreign Long derivatives are 8.6%. Other Foreign Short Derivatives are 46.0%. All numbers are a percentage of net assets. Total exposures may exceed 100% due to implicit leverage created by derivatives. Portfolio Statistics may not be representative of the Portfolio’s current or future investments and are subject to change due to active management.
2
Eaton Vance Global Macro Fund as of October 31, 2007
FUND PERFORMANCE
The line graph and table set forth below provide information about the Fund’s performance. The line graph compares the performance of Class A and Class I of the Fund with that of the Merrill Lynch 3-Month U.S. Treasury Bill Index, an unmanaged market index U.S. Treasury securities maturing in 90 days that assumes reinvestment of all income. The lines on the graph represent the total returns of a hypothetical investment of $10,000 in Class A and Class I of the Fund and in the Merrill Lynch 3-Month U.S. Treasury Bill Index. The table includes the total returns of each Class of the Fund at net asset value and public offering price. The performance presented below does not reflect the deduction of taxes, if any, that a shareholder would pay on Fund distributions or the redemption of Fund shares.
Fund Performance(1) As of 10/31/07 | | Class A | | Class I | |
Share Class Symbols | | EAGMX | | EIGMX | |
| | | | | |
Cumulative Total Returns (at net asset value) | | | | | |
Life of Fund† | | 4.50 | % | 4.50 | % |
| | | | | |
SEC Cumulative Total Returns (including sales charge or applicable CDSC) | | | | | |
Life of Fund† | | -0.48 | % | 4.50 | % |
† Inception Dates – Class A: 6/27/07; Class I: 6/27/07.
(1) Cumulative Total Return does not include the 4.75% maximum sales charge for Class A shares. If sales charges were deducted, the returns would be lower. SEC Cumulative Total Returs for Class A reflects the maximum 4.75% sales charge. Class I shares are offered to investors at net asset value. Absent a voluntary allocation of expenses to the administrator, the return would be lower.
Total Annual | | | | | |
Operating Expenses(2) | | Class A | | Class I | |
| | | | | |
Expense Ratio | | 1.05 | % | 0.75 | % |
(2) Source: Prospectus dated 6/27/07.
Comparison of Change in Value of $10,000 Investment in Eaton Vance Global Macro Fund Class A vs. Merrill Lynch
3-Month U.S. Treasury Bill Index*
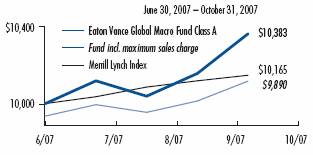
Comparison of Change in Value of $10,000 Investment in Eaton Vance Global Macro Fund Class I vs. Merrill Lynch
3-Month U.S. Treasury Bill Index*
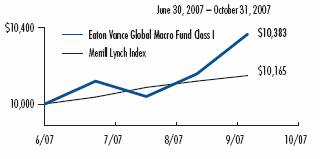
* Sources: Thomson Financial; Lipper. Class A and Class I of the Fund commenced operations on 6/27/07. Index data is available as of month end only.
It is not possible to invest directly in an Index. The Index’s total return does not reflect the expenses that would have been incurred if an investor individually purchased or sold the securities represented in the Index.
Past performance is no guarantee of future results. Returns are historical and are calculated by determining the percentage change in net asset value or offering price (as applicable) with all distributions reinvested. Investment return and principal value will fluctuate so that shares, when redeemed, may be worth more or less than their original cost. Performance is for the stated time period only; due to market volatility, the Fund’s current performance may be lower or higher than the quoted return. For performance as of the most recent month end, please refer to www.eatonvance.com.
3
Eaton Vance Global Macro Fund as of October 31, 2007
FUND EXPENSES
Example: As a shareholder of the Fund, you incur two types of costs: (1) transaction costs, including sales charges (loads) on purchases and redemption fees (if applicable); and (2) ongoing costs, including management fees; distribution or service fees; and other Fund expenses. This Example is intended to help you understand your ongoing costs (in dollars) of investing in the Fund and to compare these costs with the ongoing costs of investing in other mutual funds. The actual expense Example is based on an investment of $1,000 invested at the beginning of the period and held for the entire period (start of business June 27, 2007 – October 31, 2007). The hypothetical expense Example is based on an investment of $1,000 invested for the one-half year period (May 1, 2007 – October 31, 2007).
Actual Expenses: The first section of the table below provides information about actual account values and actual expenses. You may use the information in this section, together with the amount you invested, to estimate the expenses that you paid over the period. Simply divide your account value by $1,000 (for example, an $8,600 account value divided by $1,000 = 8.6), then multiply the result by the number in the first section under the heading entitled "Expenses Paid During Period" to estimate the expenses you paid on your account during this period.
Hypothetical Example for Comparison Purposes: The second section of the table below provides information about hypothetical account values and hypothetical expenses based on the actual Fund expense ratio and an assumed rate of return of 5% per year (before expenses), which is not the actual return of the Fund. The hypothetical account values and expenses may not be used to estimate the actual ending account balance or expenses you paid for the period. You may use this information to compare the ongoing costs of investing in your Fund and other funds. To do so, compare this 5% hypothetical example with the 5% hypothetical examples that appear in the shareholder reports of the other funds.
Please note that the expenses shown in the table are meant to highlight your ongoing costs only and do not reflect any transactional costs, such as sales charges (loads) or redemption fees (if applicable). Therefore, the second section of the table is useful in comparing ongoing costs only, and will not help you determine the relative total costs of owning different funds. In addition, if these transactional costs were included, your costs would have been higher.
Eaton Vance Global Macro Fund
| | | Beginning Account Value
(6/27/07) | | Ending Account Value
(10/31/07) | | Expenses Paid During Period
(6/27/07 – 10/31/07) | |
| Actual* | |
| Class A | | $ | 1,000.00 | | | $ | 1,045.00 | | | $ | 3.70 | *** | |
| Class I | | $ | 1,000.00 | | | $ | 1,045.00 | | | $ | 2.63 | *** | |
| Hypothetical** | |
| (5% return per year before expenses) | |
| Class A | | $ | 1,000.00 | | | $ | 1,020.00 | | | $ | 5.30 | *** | |
| Class I | | $ | 1,000.00 | | | $ | 1,021.50 | | | $ | 3.77 | *** | |
* Actual expenses are equal to the Fund's annualized expense ratio of 1.04% for Class A shares and 0.74% for Class I shares, multiplied by the average account value over the period, multiplied by 127/365 (to reflect the period from the start of business, June 27, 2007 to October 31, 2007). The Example assumes that the $1,000 was invested at the net asset value per share determined at the start of business on June 27, 2007. The Example reflects the expenses of both the Fund and the Portfolio.
** Hypothetical expenses are equal to the Fund's annualized expense ratio of 1.04% for Class A shares and 0.74% for Class I shares, multiplied by the average account value over the period, multiplied by 184/365 (to reflect the one-half year period). The Example assumes that the $1,000 was invested at the net asset value per share determined at the start of business on June 27, 2007. The Example reflects the expenses of both the Fund and the Portfolio.
*** Absent a voluntary allocation of expenses to the administrator, the expenses would have been higher.
4
Eaton Vance Global Macro Fund as of October 31, 2007
FINANCIAL STATEMENTS
Statement of Assets and Liabilities
As of October 31, 2007
| Assets | |
Investment in Global Macro Portfolio, at value
(identified cost, $27,008) | | $ | 27,291 | | |
| Receivable from the administrator | | | 50,910 | | |
| Total assets | | $ | 78,201 | | |
| Liabilities | |
| Dividends payable | | $ | 114 | | |
| Payable to affiliate for distribution and service fees | | | 12 | | |
| Accrued expenses | | | 42,498 | | |
| Total liabilities | | $ | 42,624 | | |
| Net Assets | | $ | 35,577 | | |
| Sources of Net Assets | |
| Paid-in capital | | $ | 35,216 | | |
| Accumulated net realized loss from Portfolio | | | (2,574 | ) | |
| Accumulated undistributed net investment income | | | 2,652 | | |
Net unrealized appreciation from Portfolio (computed on the basis of
identified cost) | | | 283 | | |
| Total | | $ | 35,577 | | |
| Class A Shares | |
| Net Assets | | $ | 25,364 | | |
| Shares Outstanding | | | 2,481 | | |
Net Asset Value and Redemption Price Per Share
(net assets ÷ shares of beneficial interest outstanding) | | $ | 10.22 | | |
Maximum Offering Price Per Share
(100 ÷ 95.25 of $10.22) | | $ | 10.73 | | |
| Class I Shares | |
| Net Assets | | $ | 10,213 | | |
| Shares Outstanding | | | 1,000 | | |
Net Asset Value, Offering Price and Redemption Price Per Share
(net assets ÷ shares of beneficial interest outstanding) | | $ | 10.21 | | |
| On sales of $25,000 or more, the offering price of Class A shares is reduced. | |
Statement of Operations
For the Period Ended
October 31, 2007(1)
| Investment Income | |
| Interest allocated from Portfolio (net of foreign taxes, $2) | | $ | 355 | | |
| Expenses allocated from Portfolio | | | (45 | ) | |
| Net investment income from Portfolio | | $ | 310 | | |
| Expenses | |
Distribution and service fees
Class A | | $ | 12 | | |
| Legal and accounting services | | | 32,348 | | |
| Printing and postage | | | 8,690 | | |
| Custodian fee | | | 2,625 | | |
| Transfer and dividend disbursing agent fees | | | 1,001 | | |
| Registration fees | | | 4,709 | | |
| Miscellaneous | | | 1,352 | | |
| Total expenses | | $ | 50,737 | | |
Deduct —
Allocation of expenses to the administrator | | $ | 50,715 | | |
| Total expense reductions | | $ | 50,715 | | |
| Net expenses | | $ | 22 | | |
| Net investment income | | $ | 288 | | |
Realized and Unrealized
Gain (Loss) from Portfolio | |
Net realized gain (loss) —
Investment transactions | | $ | 84 | | |
| Financial futures contracts | | | (84 | ) | |
| Swap contracts | | | 44 | | |
| Foreign currency and forward foreign currency exchange contract transactions | | | 223 | | |
| Net realized gain | | $ | 267 | | |
Change in unrealized appreciation (depreciation) —
Investments | | $ | 153 | | |
| Financial futures contracts | | | 24 | | |
| Swap contracts | | | (9 | ) | |
| Foreign currency and forward foreign currency exchange contracts | | | 115 | | |
| Net change in unrealized appreciation (depreciation) | | $ | 283 | | |
| Net realized and unrealized gain | | $ | 550 | | |
| Net increase in net assets from operations | | $ | 838 | | |
(1) For the period from the start of business, June 27, 2007 to October 31, 2007.
See notes to financial statements
5
Eaton Vance Global Macro Fund as of October 31, 2007
FINANCIAL STATEMENTS CONT'D
Statement of Changes in Net Assets
| Increase (Decrease) in Net Assets | | Period Ended
October 31, 2007(1) | |
From operations —
Net investment income | | $ | 288 | | |
Net realized gain from investment transactions, financial futures
contracts, swap contracts, and foreign currency and forward
foreign currency exchange contract transactions | | | 267 | | |
Net change in unrealized appreciation (depreciation) from investments,
financial futures contracts, swap contracts, and foreign currency
and forward foreign currency exchange contracts | | | 283 | | |
| Net increase in net assets from operations | | $ | 838 | | |
Distributions to shareholders —
From net investment income
Class A | | $ | (242 | ) | |
| Class I | | | (235 | ) | |
| Total distributions to shareholders | | $ | (477 | ) | |
Transactions in shares of beneficial interest —
Proceeds from sale of shares
Class A | | $ | 25,000 | | |
| Class I | | | 10,000 | | |
Net asset value of shares issued to shareholders in payment of
distributions declared
Class A | | | 21 | | |
Capital contribution from administrator
Class A | | | 139 | | |
| Class I | | | 56 | | |
| Net increase in net assets from Fund share transactions | | $ | 35,216 | | |
| Net increase in net assets | | $ | 35,577 | | |
| Net Assets | |
| At beginning of period | | $ | — | | |
| At end of period | | $ | 35,577 | | |
Accumulated undistributed net
investment income included in net assets | |
| At end of period | | $ | 2,652 | | |
(1) For the period from the start of business, June 27, 2007 to October 31, 2007.
See notes to financial statements
6
Eaton Vance Global Macro Fund as of October 31, 2007
FINANCIAL STATEMENTS CONT'D
Financial Highlights
| | | Class A | |
| | | Period Ended
October 31, 2007(1)(2) | |
| Net asset value — Beginning of period | | $ | 10.000 | | |
| Income (loss) from operations | |
| Net investment income | | $ | 0.123 | | |
| Net realized and unrealized gain | | | 0.201 | | |
| Total income from operations | | $ | 0.324 | | |
| Less distributions | |
| From net investment income | | $ | (0.225 | ) | |
| Total distributions | | $ | (0.225 | ) | |
| Capital contribution from administrator | | $ | 0.121 | | |
| Net asset value — End of period | | $ | 10.220 | | |
| Total Return(3) | | | 4.50 | %(7)(8) | |
| Ratios/Supplemental Data | |
| Net assets, end of period (000's omitted) | | $ | 25 | | |
| Ratios (As a percentage of average daily net assets): | |
| Expenses(4) | | | 1.05 | %(5)(6) | |
| Net investment income | | | 3.55 | %(5) | |
| Portfolio Turnover of the Portfolio | | | 45 | % | |
(1) For the period from the start of business, June 27, 2007 to October 31, 2007.
(2) Net investment income per share was computed using average shares outstanding.
(3) Returns are historical and are calculated by determining the percentage change in net asset value with all distributions reinvested.
(4) Includes the Fund's share of the Portfolio's allocated expenses.
(5) Annualized.
(6) The administrator subsidized certain operating expenses (equal to 673.39% of average net assets for the period from the start of business, June 27, 2007 to October 31, 2007).
(7) Not annualized.
(8) Absent a capital contribution by the administrator in the period, total return would have been 3.99%.
See notes to financial statements
7
Eaton Vance Global Macro Fund as of October 31, 2007
FINANCIAL STATEMENTS CONT'D
Financial Highlights
| | | Class I | |
| | | Period Ended
October 31, 2007(1)(2) | |
| Net asset value — Beginning of period | | $ | 10.000 | | |
| Income (loss) from operations | |
| Net investment income | | $ | 0.146 | | |
| Net realized and unrealized gain | | | 0.243 | | |
| Total income from operations | | $ | 0.389 | | |
| Less distributions | |
| From net investment income | | $ | (0.235 | ) | |
| Total distributions | | $ | (0.235 | ) | |
| Capital contribution from administrator | | $ | 0.056 | | |
| Net asset value — End of period | | $ | 10.210 | | |
| Total Return(3) | | | 4.50 | %(7)(8) | |
| Ratios/Supplemental Data | |
| Net assets, end of period (000's omitted) | | $ | 10 | | |
| Ratios (As a percentage of average daily net assets): | |
| Expenses(4) | | | 0.75 | %(5)(6) | |
| Net investment income | | | 4.15 | %(5)(6) | |
| Portfolio Turnover of the Portfolio | | | 45 | % | |
(1) For the period from the start of business, June 27, 2007 to October 31, 2007.
(2) Net investment income per share was computed using average shares outstanding.
(3) Returns are historical and are calculated by determining the percentage change in net asset value with all distributions reinvested.
(4) Includes the Fund's share of the Portfolio's allocated expenses.
(5) Annualized.
(6) The administrator subsidized certain operating expenses (equal to 673.39% of average net assets for the period from the start of business, June 27, 2007 to October 31, 2007).
(7) Not annualized.
(8) Absent a capital contribution by the administrator in the period, total return would have been 3.99%.
See notes to financial statements
8
Eaton Vance Global Macro Fund as of October 31, 2007
NOTES TO FINANCIAL STATEMENTS
1 Significant Accounting Policies
Eaton Vance Global Macro Fund (the Fund) is a non-diversified series of Eaton Vance Mutual Funds Trust (the Trust). The Trust is a Massachusetts business trust registered under the Investment Company Act of 1940, as amended (the 1940 Act), as an open-end management investment company. The Fund offers two classes of shares. Class A shares are generally sold subject to a sales charge imposed at the time of purchase. Class I shares are sold at net asset value and are not subject to an initial sales charge. Each class represents a pro-rata interest in the Fund, but votes separately on class-specific matters and (as noted below) is subject to different expenses. Realized and unrealized gains and losses are allocated daily to each class of shares based on the relative net assets of each class to the total net assets of the Fund. Net investment income, other than class-specific expenses, is allocated daily to each class of shares based upon the ratio of the value of each class's paid shares to the total value of all paid shares. Each class of shares differs in its distribution plan and certain other class-specific expenses. The Fund invests all of its investable assets in interests in the Global Macro Portfolio (the Portfolio), a New York trust, having the same investment objective and policies as the Fund. The value of the Fund's investment in the Portfolio reflects the Fund's proportionate interest in the net assets of the Portfolio (less than 0.01% at October 31, 2007). The performance of the Fund is directly affected by the performance of the Portfolio. The financial statements of the Portfolio, including the portfolio of investments, are included elsewhere in this report and should be read in conjunction with the Fund's financial statements.
The following is a summary of significant accounting policies of the Fund. The policies are in conformity with accounting principles generally accepted in the United States of America.
A Investment Valuation — Valuation of securities by the Portfolio is discussed in Note 1A of the Portfolio's Notes to Financial Statements, which are included elsewhere in this report.
B Income — The Fund's net investment income or loss consists of the Fund's pro-rata share of the net investment income or loss of the Portfolio, less all actual and accrued expenses of the Fund.
C Federal Taxes — The Fund's policy is to comply with the provisions of the Internal Revenue Code applicable to regulated investment companies and to distribute to shareholders each year substantially all of its net investment income and all or substantially all of its net realized capital gains. Accordingly, no provision for federal income or excise tax is necessary. At October 31, 2007, the Fund, for federal income tax purposes, had a capital loss carryforward of $2,455, which will reduce the Fund's taxable income arising from future net realized gains on investment transactions, if any, to the extent permitted by the Internal Revenue Code, and thus will reduce the amount of distributions to shareho lders which would otherwise be necessary to relieve the Fund of any liability for federal income or excise tax. Such capital loss carryforward will expire on October 31, 2015.
In June 2006, the Financial Accounting Standards Board (FASB) issued FASB Interpretation No. 48 (FIN 48), "Accounting for Uncertainty in Income Taxes – an interpretation of FASB Statement No. 109". FIN 48 clarifies the accounting for uncertainty in income taxes recognized in accordance with FASB Statement No. 109, "Accounting for Income Taxes". This interpretation prescribes a recognition threshold and measurement attribute for the financial statement recognition and measurement of a tax position taken or expected to be taken in a tax return. It also provides guidance on de-recognition, classification, interest and penalties, accounting in interim periods, disclosure and transition. FIN 48 is effective on the last business day of the first required financial reporting period for fiscal years beginning after December 15, 2006. Management has concluded that as of October 31, 2007, there are no uncertain tax positions that wou ld require financial statement recognition, derecognition, or disclosure.
D Expenses — The majority of expenses of the Trust are directly identifiable to an individual fund. Expenses which are not readily identifiable to a specific fund are allocated taking into consideration, among other things, the nature and type of expense and the relative size of the funds.
E Expense Reduction — State Street Bank and Trust Company (SSBT) serves as custodian of the Fund. Pursuant to the custodian agreement, SSBT receives a fee reduced by credits, which are determined based on the average daily cash balance the Fund maintains with SSBT. All credit balances, if any, used to reduce the Fund's custodian fees are reported as a reduction of expenses in the Statement of Operations.
F Use of Estimates — The preparation of the financial statements in conformity with accounting principles generally accepted in the United States of America requires management to make estimates and assumptions
9
Eaton Vance Global Macro Fund as of October 31, 2007
NOTES TO FINANCIAL STATEMENTS CONT'D
that affect the reported amounts of assets and liabilities at the date of the financial statements and the reported amounts of income and expense during the reporting period. Actual results could differ from those estimates.
G Indemnifications — Under the Trust's organizational documents, its officers and Trustees may be indemnified against certain liabilities and expenses arising out of the performance of their duties to the Fund, and shareholders are indemnified against personal liability for obligations of the Trust. Additionally, in the normal course of business, the Fund enters into agreements with service providers that may contain indemnification clauses. The Fund's maximum exposure under these arrangements is unknown as this would involve future claims that may be made against the Fund that have not yet occurred.
H Other — Investment transactions are accounted for on a trade date basis. Dividends to shareholders are recorded on the ex-dividend date.
2 Distributions to Shareholders
The Fund declares dividends daily to shareholders of record at the time of declaration. Distributions are generally paid monthly. Distributions of realized capital gains, if any, are made at least annually. Distributions are declared separately for each class of shares. Shareholders may reinvest income and capital gain distributions in additional shares of the same class of the Fund at the net asset value as of the ex-dividend date or, at the election of the shareholder, receive distributions in cash. The Fund distinguishes between distributions on a tax basis and a financial reporting basis. Accounting principles generally accepted in the United States of America require that only distributions in excess of tax basis earnings and profits be reported in the financial statements as a return of capital. Permanent differences between book and tax accounting relating to distributions are reclassified to paid-in capital.
The tax character of distributions declared for the period from start of business, June 27, 2007 to October 31, 2007 was as follows:
| | | Period Ended
October 31, 2007 | |
| Distributions declared from: | |
| Ordinary income | | $ | 477 | | |
During the period from the start of business, June 27, 2007 to October 31, 2007, accumulated net realized loss was increased by $2,841 and accumulated undistributed net investment income was increased by $2,841 due to differences between book and tax accounting, primarily for foreign currency gain/loss, swap contracts, premium amortization and paydown gain/loss. These reclassifications had no effect on the net assets or net asset value per share of the Fund.
As of October 31, 2007, the components of distributable earnings (accumulated losses) and unrealized appreciation (depreciation) on a tax basis were as follows:
| Undistributed ordinary income | | $ | 2,462 | | |
| Capital loss carryforward | | $ | (2,455 | ) | |
| Unrealized appreciation | | $ | 468 | | |
| Other temporary difference | | $ | (114 | ) | |
The differences between components of distributable earnings (accumulated losses) on a tax basis and the amounts reflected in the Statement of Assets and Liabilities are primarily due to differences in book and tax policies for swap contracts, financial futures contracts, foreign currency transactions, premium amortization, and the timing of recognizing distributions to shareholders.
3 Transactions with Affiliates
Eaton Vance Management (EVM) serves as the administrator of the Fund, but receives no compensation. The Fund has engaged EVM to render investment advisory services. Under the investment advisory agreement, EVM receives a monthly advisory fee equal to 0.615% annually of the average daily net assets of the Fund up to $500 million that are invested directly in securities. On net assets of $500 million and over that are invested directly in securities, the annual fee is reduced. For the period from the start of business, June 27, 2007, to October 31, 2007 the Fund held no direct investments and incurred no direct advisory fees. To the extent the Fund's assets are invested in the Portfolio, the Fund is allocated its share of the Portfolio's advisory fee. The Portfolio has engaged Boston Management and Research (BMR), a subsidiary of EVM to render investment advisory services at the Portfolio level. (See Note 2 of the Portfolio's Note s to Financial Statements which are included elsewhere in this report.) Pursuant to a voluntary expense reimbursement, the administrator was allocated $50,715 of the Fund's operating expenses for the period ended October 31, 2007. During the period ended October 31, 2007, the administrator reimbursed the Fund $195 for forgone investment return resulting from the payment by the Fund of expenses that the administrator had intended to pay on behalf of the Fund. EVM serves as
10
Eaton Vance Global Macro Fund as of October 31, 2007
NOTES TO FINANCIAL STATEMENTS CONT'D
the sub-transfer agent of the Fund and receives from the transfer agent an aggregate fee based upon the actual expenses incurred by EVM in the performance of these services. For the period from the start of business June 27, 2007 to October 31, 2007, EVM earned $1 in sub-transfer agent fees. The Fund was informed that Eaton Vance Distributors Inc. (EVD), the Fund's principal underwriter and a subsidiary of EVM, received no sales charge on sales of Class A shares for the period from the start of business, June 27, 2007, to October 31, 2007. EVD received distribution and service fees from Class A shares (see Note 4).
Except for Trustees of the Fund and the Portfolio who are not members of EVM's and BMR's organizations, officers and Trustees receive remuneration for their services to the Fund out of the investment advisory fee. Certain officers and Trustees of the Fund and the Portfolio are officers of the above organizations.
4 Distribution Plans
The Fund has in effect a distribution plan for Class A shares (Class A Plan) pursuant to Rule 12b-1 under the 1940 Act. The Class A Plan provides that the Fund will pay EVD a distribution and service fee of 0.30% per annum of its average daily net assets attributable to Class A shares for distribution services and facilities provided to the Fund by EVD, as well as for personal services and/or the maintenance of shareholder accounts. Distribution and service fees paid or accrued to EVD for the period from start of business, June 27, 2007 to October 31, 2007 for Class A shares amounted to $12.
5 Contingent Deferred Sales Charges
Class A shares may be subject to a 1% contingent deferred sales charge (CDSC) if redeemed within eighteen months of purchase (depending on the circumstances of purchase). Generally, the CDSC is based upon the lower of the net asset value at date of redemption or date of purchase. No charge is levied on shares acquired by reinvestment of dividends or capital gains distributions. No CDSC is levied on shares which have been sold to EVM or its affiliates or to their respective employees or clients and may be waived under certain other limited conditions. From the start of business, June 27, 2007 to October 31, 2007, there were no CDSC fees paid by shareholders of Class A shares.
6 Investment Transactions
Increases and decreases in the Fund's investment in the Portfolio aggregated $35,000 and $8,570, respectively for the period from the start of business, June 27, 2007 to October 31, 2007.
7 Shares of Beneficial Interest
The Fund's Declaration of Trust permits the Trustees to issue an unlimited number of full and fractional shares of beneficial interest (without par value). Such shares may be issued in a number of different series (such as the Fund) and classes. Transactions in Fund shares were as follows:
| Class A | | Period Ended
October 31, 2007(1) | |
| Sales | | | 2,479 | | |
Issued to shareholders electing to receive
payments of distributions in Fund shares | | | 2 | | |
| Redemptions | | | — | | |
| Net increase | | | 2,481 | | |
| Class I | | Period Ended
October 31, 2007(1) | |
| Sales | | | 1,000 | | |
| Redemptions | | | — | | |
| Net increase | | | 1,000 | | |
(1) For the period from the start of business, June 27, 2007 to October 31, 2007.
At October 31, 2007, EVM owned 57.4% of the value of outstanding shares of the Fund.
8 Recently Issued Accounting Pronouncements
In September 2006, the FASB issued Statement of Financial Accounting Standards No. 157 (FAS 157), "Fair Value Measurements". FAS 157 defines fair value, establishes a framework for measuring fair value in accordance with generally accepted accounting principles and expands disclosure about fair value measurements. FAS 157 is effective for fiscal years beginning after November 15, 2007. Management is currently evaluating the impact the adoption of FAS 157 will have on the Fund's financial statement disclosures.
11
Eaton Vance Global Macro Fund as of October 31, 2007
REPORT OF INDEPENDENT REGISTERED PUBLIC ACCOUNTING FIRM
To the Trustees of Eaton Vance Mutual Funds Trust and Shareholders of Eaton Vance Global Macro Fund:
We have audited the accompanying statement of assets and liabilities of Eaton Vance Global Macro Fund (one of the series of Eaton Vance Mutual Funds Trust) (the "Fund") as of October 31, 2007, and the related statement of operations, the statement of changes in net assets, and the financial highlights for the period from the start of business, June 27, 2007, to October 31, 2007. These financial statements and financial highlights are the responsibility of the Fund's management. Our responsibility is to express an opinion on these financial statements and financial highlights based on our audit.
We conducted our audit in accordance with the standards of the Public Company Accounting Oversight Board (United States). Those standards require that we plan and perform the audit to obtain reasonable assurance about whether the financial statements and financial highlights are free of material misstatement. The Fund is not required to have, nor were we engaged to perform, an audit of its internal control over financial reporting. Our audit included consideration of internal control over financial reporting as a basis for designing audit procedures that are appropriate in the circumstances, but not for the purpose of expressing an opinion on the effectiveness of the Fund's internal control over financial reporting. Accordingly, we express no such opinion. An audit also includes examining, on a test basis, evidence supporting the amounts and disclosures in the financial statements, assessing the accounting principles used and si gnificant estimates made by management, as well as evaluating the overall financial statement presentation. We believe that our audit provides a reasonable basis for our opinion.
In our opinion, the financial statements and financial highlights referred to above present fairly, in all material respects, the financial position of Eaton Vance Global Macro Fund as of October 31, 2007, the results of its operations, the changes in its net assets, and the financial highlights for the period from the start of business, June 27, 2007, to October 31, 2007, in conformity with accounting principles generally accepted in the United States of America.
DELOITTE & TOUCHE LLP
Boston, Massachusetts
December 17, 2007
12
Eaton Vance Global Macro Fund as of October 31, 2007
FEDERAL TAX INFORMATION (Unaudited)
The Form 1099-DIV you receive in January 2008 will show the tax status of all distributions paid to your account in calendar 2007. Shareholders are advised to consult their own tax adviser with respect to the tax consequences of their investment in the Fund.
13
Global Macro Portfolio as of October 31, 2007
PORTFOLIO OF INVESTMENTS
| Bonds & Notes — 97.8% | |
| Security | | Principal | | U.S. $ Value | |
| Brazil — 0.8% | |
| Nota Do Tesouro Nacional, 10.00%, 1/1/14 | | BRL | 10,642,000 | | | $ | 5,664,339 | | |
| Total Brazil (identified cost $4,095,942) | | $ | 5,664,339 | | |
| Chile — 0.5% | |
JP Morgan Chilean Inflation Linked Note,
7.433%, 11/17/15(1) | | $ | 3,000,000 | | | $ | 3,595,051 | | |
| Total Chile (identified cost $3,000,000) | | $ | 3,595,051 | | |
| Egypt — 11.4% | |
| Arab Republic of Egypt, 8.75%, 7/18/12(2) | | EGP | 25,500,000 | | | $ | 4,819,465 | | |
| Egyptian Treasury Bill, 0.00%, 11/13/07 | | EGP | 21,000,000 | | | | 3,797,698 | | |
| Egyptian Treasury Bill, 0.00%, 11/20/07 | | EGP | 31,375,000 | | | | 5,666,948 | | |
| Egyptian Treasury Bill, 0.00%, 1/15/08 | | EGP | 64,000,000 | | | | 11,446,459 | | |
| Egyptian Treasury Bill, 0.00%, 1/29/08 | | EGP | 28,000,000 | | | | 4,995,799 | | |
| Egyptian Treasury Bill, 0.00%, 2/19/08 | | EGP | 17,000,000 | | | | 3,021,918 | | |
| Egyptian Treasury Bill, 0.00%, 11/6/07 | | EGP | 30,950,000 | | | | 5,603,703 | | |
| Egyptian Treasury Bill, 0.00%, 1/1/08 | | EGP | 85,975,000 | | | | 15,413,950 | | |
| Egyptian Treasury Bill, 0.00%, 1/8/08 | | EGP | 54,250,000 | | | | 9,714,462 | | |
| Egyptian Treasury Bill, 0.00%, 1/22/08 | | EGP | 78,225,000 | | | | 13,973,884 | | |
| Total Egypt (identified cost $77,096,082) | | $ | 78,454,286 | | |
| Ghana — 0.9% | |
Ghanaian Government Bond,
13.00%, 8/2/10(3) GHS | | | 600,000 | | | $ | 623,064 | | |
Ghanaian Treasury Bond,
13.50%, 3/29/10(3) GHS | | | 980,000 | | | | 1,028,185 | | |
Ghanaian Treasury Bond,
13.67%, 6/15/12(3) GHS | | | 4,300,000 | | | | 4,465,790 | | |
| Total Ghana (identified cost $6,338,519) | | $ | 6,117,039 | | |
| Indonesia — 2.8% | |
| APP Finance VI, 0.00%, 11/18/12(4)(5)(6) | | $ | 4,000,000 | | | $ | 20,000 | | |
| APP Finance VII, 3.50%, 4/30/24(4)(5)(6) | | | 2,000,000 | | | | 10,000 | | |
| Indonesia Recapital, 14.00%, 6/15/09 | | IDR | 76,000,000,000 | | | | 9,143,894 | | |
| Republic of Indonesia, 12.00%, 9/15/11 | | IDR | 83,946,000,000 | | | | 10,312,153 | | |
| Total Indonesia (identified cost $21,929,933) | | $ | 19,486,047 | | |
| Security | | Principal | | U.S. $ Value | |
| Kenya — 0.0% | |
| Kenyan Treasury Bond, 9.50%, 3/23/09 | | KES | 12,500,000 | | | $ | 192,955 | | |
| Total Kenya (identified cost $181,418) | | $ | 192,955 | | |
| Mongolia — 0.6% | |
ING Bank Mongolian Credit Linked Note,
10.80%, 6/12/08 | | $ | 4,000,000 | | | $ | 3,949,108 | | |
| Total Mongolia (identified cost $4,000,000) | | $ | 3,949,108 | | |
| Nigeria — 1.9% | |
| Nigerian Treasury Bill , 0.00%, 9/4/08(3) | | NGN | 145,188,000 | | | $ | 1,127,765 | | |
| Nigerian Treasury Bond, 9.35%, 8/31/17 | | NGN | 404,606,000 | | | | 3,239,520 | | |
| Nigerian Treasury Bond, 12.00%, 4/28/09 | | NGN | 523,213,000 | | | | 4,581,947 | | |
| Nigerian Treasury Bond, 17.00%, 12/16/08 | | NGN | 444,300,000 | | | | 4,061,045 | | |
| Total Nigeria (identified cost $12,778,831) | | $ | 13,010,277 | | |
| Republic of Uganda — 0.1% | |
| Ugandan Treasury Bill , 0.00%, 10/23/08(3) UGX | | | 1,096,000,000 | | | $ | 566,375 | | |
Total Republic of Uganda
(identified cost $565,654) | | $ | 566,375 | | |
| United States — 77.7% | |
| Corporate Bonds & Notes — 0.2% | |
| Eaton Corp., 8.875%, 6/15/19 | | $ | 500,000 | | | $ | 629,766 | | |
| Ingersoll-Rand Co., 6.48%, 6/1/25 | | | 1,050,000 | | | | 1,050,479 | | |
Total Corporate Bonds & Notes
(identified cost $1,529,497) | | $ | 1,680,245 | | |
| Collateralized Mortgage Obligations — 15.0% | |
Federal Home Loan Mortgage Corp.,
Series 1548, Class Z, 7.00%, 7/15/23 | | $ | 819,745 | | | $ | 847,214 | | |
Federal Home Loan Mortgage Corp.,
Series 1817, Class Z, 6.50%, 2/15/26 | | | 692,079 | | | | 708,911 | | |
Federal Home Loan Mortgage Corp.,
Series 1927, Class ZA, 6.50%, 1/15/27 | | | 2,736,160 | | | | 2,805,551 | | |
Federal Home Loan Mortgage Corp.,
Series 4, Class D, 8.00%, 12/25/22 | | | 599,906 | | | | 616,464 | | |
Federal National Mortgage Association,
Series 1992-180, Class F, 6.025%, 10/25/22(7) | | | 2,800,771 | | | | 2,870,107 | | |
Federal National Mortgage Association,
Series 1993-104, Class ZB, 6.50%, 7/25/23 | | | 890,571 | | | | 913,847 | | |
Federal National Mortgage Association,
Series 1993-121, Class Z, 7.00%, 7/25/23 | | | 10,900,752 | | | | 11,404,363 | | |
See notes to financial statements
14
Global Macro Portfolio as of October 31, 2007
PORTFOLIO OF INVESTMENTS CONT'D
| Security | | Principal | | U.S. $ Value | |
| United States (continued) | |
Federal National Mortgage Association,
Series 1993-141, Class Z, 7.00%, 8/25/23 | | $ | 2,074,033 | | | $ | 2,163,601 | | |
Federal National Mortgage Association,
Series 1993-16, Class Z, 7.50%, 2/25/23 | | | 2,725,953 | | | | 2,890,826 | | |
Federal National Mortgage Association,
Series 1993-79, Class PL, 7.00%, 6/25/23 | | | 1,964,686 | | | | 2,055,589 | | |
Federal National Mortgage Association,
Series 1994-42, Class ZQ, 7.00%, 4/25/24 | | | 12,782,236 | | | | 13,359,797 | | |
Federal National Mortgage Association,
Series 1994-63, Class PJ, 7.00%, 12/25/23 | | | 2,565,864 | | | | 2,588,017 | | |
Federal National Mortgage Association,
Series 1994-79, Class Z, 7.00%, 4/25/24 | | | 2,494,438 | | | | 2,611,389 | | |
Federal National Mortgage Association,
Series 1994-89, Class ZQ, 8.00%, 7/25/24 | | | 1,642,102 | | | | 1,796,609 | | |
Federal National Mortgage Association,
Series 1996-35, Class Z, 7.00%, 7/25/26 | | | 635,833 | | | | 665,512 | | |
Federal National Mortgage Association,
Series 1998-16, Class H, 7.00%, 4/18/28 | | | 1,849,819 | | | | 1,933,008 | | |
Federal National Mortgage Association,
Series 1999-25, Class Z, 6.00%, 6/25/29 | | | 5,777,773 | | | | 5,865,807 | | |
Federal National Mortgage Association,
Series 2000-49, Class A, 8.00%, 3/18/27 | | | 2,010,039 | | | | 2,170,311 | | |
Federal National Mortgage Association,
Series 2001-37, Class GA, 8.00%, 7/25/16 | | | 357,218 | | | | 377,893 | | |
Federal National Mortgage Association,
Series G93-1, Class K, 6.675%, 1/25/23 | | | 2,984,558 | | | | 3,081,931 | | |
Federal National Mortgage Association,
Series G93-31, Class PN, 7.00%, 9/25/23 | | | 9,447,667 | | | | 9,896,901 | | |
Federal National Mortgage Association,
Series G93-41, Class ZQ, 7.00%, 12/25/23 | | | 18,699,935 | | | | 19,683,007 | | |
Government National Mortgage Association,
Series 1996-22, Class Z, 7.00%, 10/16/26 | | | 1,659,607 | | | | 1,728,417 | | |
Government National Mortgage Association,
Series 1999-42, Class Z, 8.00%, 11/16/29 | | | 3,759,849 | | | | 4,112,484 | | |
Government National Mortgage Association,
Series 2001-35, Class K, 6.45%, 10/26/23 | | | 677,115 | | | | 699,436 | | |
Government National Mortgage Association,
Series 2002-48, Class OC, 6.00%, 9/16/30 | | | 5,000,000 | | | | 5,117,687 | | |
Total Collateralized Mortgage Obligations
(identified cost $102,801,104) | | $ | 102,964,679 | | |
| Commercial Mortgage Backed Security — 3.3% | |
JPMCC, Series 2005-LDP5, Class AM,
5.387%, 12/15/44(11) | | $ | 9,960,000 | | | $ | 9,753,786 | | |
MLMT, Series 2006-C2, Class A2,
5.756%, 8/12/43(11) | | | 7,000,000 | | | | 7,056,873 | | |
WBCMT, Series 2005-C17, Class A4,
5.083%, 3/15/42(11) | | | 6,000,000 | | | | 5,820,418 | | |
Total Commercial Mortgage Backed Security
(identified cost $22,632,711) | | $ | 22,631,077 | | |
| Security | | Principal | | U.S. $ Value | |
| United States (continued) | |
| Mortgage Pass-Throughs — 58.9% | |
| Federal Home Loan Mortgage Corp.: | |
| 5.50% with maturity at 2013 | | $ | 20,856,370 | | | $ | 21,021,826 | | |
| 6.00% with maturity at 2024 | | | 6,305,909 | | | | 6,441,290 | | |
| 6.50% with various maturities to 2024 | | | 7,548,821 | | | | 7,827,804 | | |
| 6.552% with maturity at 2023(9) | | | 1,290,561 | | | | 1,287,752 | | |
| 7.00% with various maturities to 2031 | | | 8,137,990 | | | | 8,578,046 | | |
| 7.31% with maturity at 2026 | | | 473,648 | | | | 492,280 | | |
| 7.50% with various maturities to 2027 | | | 12,415,880 | | | | 13,301,161 | | |
| 7.95% with maturity at 2022 | | | 825,354 | | | | 895,335 | | |
| 8.00% with various maturities to 2030 | | | 4,714,097 | | | | 5,096,628 | | |
| 8.15% with maturity at 2021 | | | 510,866 | | | | 546,644 | | |
| 8.30% with maturity at 2021 | | | 414,657 | | | | 450,412 | | |
| 8.47% with maturity at 2018 | | | 438,352 | | | | 480,562 | | |
| 8.50% with various maturities to 2028 | | | 2,590,578 | | | | 2,841,072 | | |
| 9.00% with various maturities to 2027 | | | 5,397,045 | | | | 5,960,116 | | |
| 9.25% with various maturities to 2016 | | | 76,359 | | | | 77,053 | | |
| 9.50% with various maturities to 2027 | | | 540,889 | | | | 611,860 | | |
| 9.75% with various maturities to 2020 | | | 33,862 | | | | 35,759 | | |
| 10.00% with various maturities to 2020 | | | 2,099,959 | | | | 2,367,689 | | |
| 10.50% with maturity at 2021 | | | 813,307 | | | | 943,292 | | |
| 11.00% with maturity at 2016(10) | | | 1,393,888 | | | | 1,596,254 | | |
| 13.25% with maturity at 2013 | | | 1,851 | | | | 2,061 | | |
| | | $ | 80,854,896 | | |
| Federal National Mortgage Association: | |
| 5.50% with maturity at 2018 | | $ | 1,179,170 | | | $ | 1,186,965 | | |
| 5.527% with various maturities to 2035(9) | | | 73,453,867 | | | | 72,509,026 | | |
| 5.533% with various maturities to 2033(9) | | | 35,230,504 | | | | 34,793,327 | | |
| 5.56% with maturity at 2035(9) | | | 10,138,834 | | | | 10,014,572 | | |
| 5.597% with maturity at 2022(9) | | | 4,317,384 | | | | 4,266,357 | | |
| 5.677% with maturity at 2025(9) | | | 2,526,821 | | | | 2,503,357 | | |
| 5.877% with maturity at 2024(9) | | | 2,143,268 | | | | 2,132,430 | | |
| 6.33% with maturity at 2023(9) | | | 432,004 | | | | 430,654 | | |
| 6.344% with maturity at 2032(9) | | | 7,932,068 | | | | 7,958,419 | | |
| 6.50% with various maturities to 2030 | | | 18,086,574 | | | | 18,668,637 | | |
| 7.00% with various maturities to 2032 | | | 29,603,079 | | | | 30,954,154 | | |
| 7.061% with maturity at 2025(9) | | | 1,046,485 | | | | 1,078,502 | | |
| 7.176% with maturity at 2028(9) | | | 566,400 | | | | 572,455 | | |
| 7.50% with various maturities to 2028 | | | 19,705,383 | | | | 20,918,099 | | |
| 8.00% with various maturities to 2030 | | | 15,709,633 | | | | 17,090,322 | | |
| 8.50% with various maturities to 2026 | | | 182,224 | | | | 195,124 | | |
| 8.972% with maturity at 2010(11) | | | 77,879 | | | | 79,603 | | |
| 9.00% with various maturities to 2027 | | | 2,223,206 | | | | 2,432,933 | | |
| 9.033% with maturity at 2028(11) | | | 1,511,599 | | | | 1,636,552 | | |
| 9.50% with various maturities to 2030 | | | 3,848,701 | | | | 4,285,916 | | |
| 10.50% with maturity at 2029 | | | 938,746 | | | | 1,103,217 | | |
| 10.968% with maturity at 2027(11) | | | 1,631,464 | | | | 1,892,647 | | |
| 11.00% with maturity at 2016 | | | 147,608 | | | | 162,995 | | |
| 11.50% with maturity at 2031 | | | 976,658 | | | | 1,183,169 | | |
| | | $ | 238,049,432 | | |
See notes to financial statements
15
Global Macro Portfolio as of October 31, 2007
PORTFOLIO OF INVESTMENTS CONT'D
| Security | | Principal | | U.S. $ Value | |
| United States (continued) | |
| Government National Mortgage Association: | |
| 6.125% with maturity at 2024(9) | | $ | 1,096,903 | | | $ | 1,108,605 | | |
| 7.00% with various maturities to 2026 | | | 20,234,155 | | | | 21,340,610 | | |
| 7.50% with various maturities to 2031 | | | 16,341,590 | | | | 17,446,830 | | |
| 7.75% with maturity at 2019 | | | 45,540 | | | | 49,070 | | |
| 8.00% with various maturities to 2034 | | | 35,049,408 | | | | 38,218,658 | | |
| 8.30% with various maturities to 2020 | | | 320,753 | | | | 342,549 | | |
| 8.50% with various maturities to 2021 | | | 3,108,781 | | | | 3,390,259 | | |
| 9.00% with various maturities to 2025 | | | 976,292 | | | | 1,084,630 | | |
| 9.50% with various maturities to 2026(12) | | | 3,046,669 | | | | 3,502,260 | | |
| | | $ | 86,483,471 | | |
Total Mortgage Pass-Throughs
(identified cost $405,848,578) | | $ | 405,387,799 | | |
| U.S. Treasury Obligations — 0.3% | |
United States Treasury Bond,
7.875%, 2/15/21 —
(identified cost $1,799,336) | | $ | 1,500,000 | | | $ | 1,962,423 | | |
Total United States
(identified cost $534,609,592) | | $ | 534,626,223 | | |
| Uruguay — 1.1% | |
| Republic of Uruguay, 5.00%, 9/14/18(13) | | UYU | 148,416,043 | | | $ | 7,344,474 | | |
| Total Uruguay (identified cost $6,832,886) | | $ | 7,344,474 | | |
Total Bonds & Notes
(identified cost $671,428,857) | | $ | 673,006,174 | | |
| Common Stocks — 0.3% | |
| Security | | Shares | | Value | |
| China — 0.3% | |
| Business Services — 0.0% | |
| APP China(4) | | | 8,155 | | | $ | 326,200 | | |
| | | $ | 326,200 | | |
| Commercial Banks — 0.3% | |
| Industrial and Commercial Bank of China | | | 2,191,752 | | | $ | 2,069,931 | | |
| | | $ | 2,069,931 | | |
| Total China (identified cost $2,395,650) | | $ | 2,396,131 | | |
Total Common Stocks
(identified cost $2,395,650) | | $ | 2,396,131 | | |
| Short-Term Investments — 0.6% | |
| Description | | Principal/Interest
(000's omitted) | | Value | |
Investment in Cash Management Portfolio,
4.83%(8) | | | 2,483 | | | $ | 2,483,039 | | |
State Street Bank and Trust Time Deposit,
4.00%, 11/1/07 | | | 1,300 | | | | 1,300,000 | | |
Total Short-Term Investments
(identified cost $3,783,039) | | $ | 3,783,039 | | |
| Call Options Purchased — 0.2% | |
| Security | | Contracts
(000's omitted) | | Value | |
Euro Call Option, Expires 1/8/2009,
Strike Price 1.3270 | | | 800 | | | $ | 95,277 | | |
Euro Call Option, Expires 10/10/2008,
Strike Price 1.2950 | | | 800 | | | | 117,743 | | |
Euro Call Option, Expires 10/16/2008,
Strike Price 1.2990 | | | 800 | | | | 114,756 | | |
Euro Call Option, Expires 10/2/2008,
Strike Price 1.2738 | | | 800 | | | | 133,518 | | |
Euro Call Option, Expires 10/30/2008,
Strike Price 1.3155 | | | 800 | | | | 102,858 | | |
Euro Call Option, Expires 11/13/2008,
Strike Price 1.3195 | | | 800 | | | | 100,115 | | |
Euro Call Option, Expires 11/26/2008,
Strike Price 1.3540 | | | 800 | | | | 77,511 | | |
Euro Call Option, Expires 12/11/2008,
Strike Price 1.3506 | | | 800 | | | | 79,814 | | |
Euro Call Option, Expires 2/12/2009,
Strike Price 1.3375 | | | 800 | | | | 88,738 | | |
Euro Call Option, Expires 4/8/2009,
Strike Price 1.3705 | | | 800 | | | | 69,872 | | |
Euro Call Option, Expires 5/13/2009,
Strike Price 1.3745 | | | 800 | | | | 68,298 | | |
South Korean Won Call Option, Expires 3/3/2009,
Strike Price 932.4 | | | 7,459,200 | | | | 368,410 | | |
South Korean Won Call Option, Expires 6/2/2009,
Strike Price 915.5 | | | 7,324,000 | | | | 278,166 | | |
Total Call Options Purchased
(identified cost $795,382) | | $ | 1,695,076 | | |
| Security | | Contracts
(000's omitted) | | Value | |
Euro Put Option, Expires 1/8/2009,
Strike Price 1.3270 | | | 800 | | | $ | 4,502 | | |
See notes to financial statements
16
Global Macro Portfolio as of October 31, 2007
PORTFOLIO OF INVESTMENTS CONT'D
| Put Options Purchased — 0.0% | |
Euro Put Option, Expires 10/10/2008,
Strike Price 1.2950 | | | 800 | | | | 1,273 | | |
Euro Put Option, Expires 10/16/2008,
Strike Price 1.2990 | | | 800 | | | | 1,481 | | |
Euro Put Option, Expires 10/2/2008,
Strike Price 1.2738 | | | 800 | | | | 625 | | |
Euro Put Option, Expires 10/30/2008,
Strike Price 1.3155 | | | 800 | | | | 2,500 | | |
Euro Put Option, Expires 11/13/2008,
Strike Price 1.3195 | | | 800 | | | | 2,975 | | |
Euro Put Option, Expires 11/26/2008,
Strike Price 1.3540 | | | 800 | | | | 6,805 | | |
Euro Put Option, Expires 12/11/2008,
Strike Price 1.3506 | | | 800 | | | | 6,632 | | |
Euro Put Option, Expires 2/12/2009,
Strike Price 1.3375 | | | 800 | | | | 6,262 | | |
Euro Put Option, Expires 4/8/2009,
Strike Price 1.3705 | | | 800 | | | | 12,662 | | |
Euro Put Option, Expires 5/13/2009,
Strike Price 1.3745 | | | 800 | | | | 14,317 | | |
South Korean Won Put Option, Expires 3/3/2009,
Strike Price 932.4 | | | 7,459,200 | | | | 54,079 | | |
South Korean Won Put Option, Expires 6/2/2009,
Strike Price 915.5 | | | 7,324,000 | | | | 107,663 | | |
Total Put Options Purchased
(identified cost $780,782) | | $ | 221,776 | | |
Total Investments — 98.9%
(identified cost $679,183,710) | | $ | 681,102,196 | | |
| Other Assets, Less Liabilities — 1.1% | | $ | 7,290,408 | | |
| Net Assets — 100.0% | | $ | 688,392,604 | | |
BRL - Brazilian Real
EGP - Egyptian Pound
GHS - Ghanaian Cedi
IDR - Indonesian Rupiah
KES - Kenyan Shilling
NGN - Nigerian Naira
UGX - Ugandan Shilling
UYU - Uruguyan Peso
(1) Bond pays a coupon of 3.8% on the face at the end of the payment period. Principal grows based on annual increases in the Chilean UF Rate, for an effective yield of 7.433%.
(2) Security exempt from registration under Rule 144A of the Securities Act of 1933. These securities may be sold in transactions exempt from registration, normally to qualified institutional buyers. At October 31, 2007, the aggregate value of the securities is $4,819,465 or 0.7% of the Portfolio's net assets.
(3) Security valued at fair value using methods determined in good faith by or at the direction of the Trustees.
(4) Non-income producing security.
(5) Convertible bond.
(6) Defaulted security.
(7) Floating-Rate.
(8) Affiliated investment company available to Eaton Vance portfolios and funds which invests in high quality U.S. dollar denominated money market instruments. The rate shown is the annualized seven-day yield as of October 31, 2007.
(9) Adjustable rate securities. Rates shown are the rates at period end.
(10) Security (or a portion thereof) has been segregated to cover swap contracts.
(11) Weighted average fixed-rate coupon that changes/updates monthly.
(12) Security (or a portion thereof) has been segregated to cover margin requirements on open financial futures contracts.
(13) Bond pays a coupon of 5% on the face at the end of the payment period. Principal grows with the Uruguayan inflation rate. Original face of the bond is UYU 135,030,000.
See notes to financial statements
17
Global Macro Portfolio as of October 31, 2007
FINANCIAL STATEMENTS
Statement of Assets and Liabilities
As of October 31, 2007
| Assets | |
| Unaffiliated investments, at value (identified cost, $676,700,671) | | $ | 678,619,157 | | |
| Affiliated investment, at value (identified cost, $2,483,039) | | | 2,483,039 | | |
| Foreign currency, at value (identified cost, $63,333) | | | 62,386 | | |
| Receivable for investments sold | | | 72,173 | | |
| Interest receivable | | | 4,828,940 | | |
| Interest receivable from affiliated investment | | | 140,485 | | |
| Receivable for daily variation margin on open financial futures contracts | | | 28,553 | | |
| Receivable for open swap contracts | | | 401,644 | | |
| Receivable for open forward foreign currency exchange contracts | | | 4,840,555 | | |
| Receivable for closed forward foreign currency exchange contracts | | | 2,557,324 | | |
| Total assets | | $ | 694,034,256 | | |
| Liabilities | |
| Payable for open swap contracts | | $ | 3,719,084 | | |
| Payable for open forward foreign currency exchange contracts | | | 1,263,202 | | |
| Payable for closed forward foreign currency exchange contracts | | | 166,451 | | |
| Payable to affiliate for investment advisory fee | | | 326,308 | | |
| Payable to affiliate for Trustees' fees | | | 2,102 | | |
| Accrued expenses | | | 164,505 | | |
| Total liabilities | | $ | 5,641,652 | | |
| Net Assets applicable to investors' interest in Portfolio | | $ | 688,392,604 | | |
| Sources of Net Assets | |
| Net proceeds from capital contributions and withdrawals | | $ | 686,409,021 | | |
| Net unrealized appreciation | | | 1,983,583 | | |
| Total | | $ | 688,392,604 | | |
Statement of Operations
For the Year Ended
October 31, 2007
| Investment Income | |
| Interest (net of foreign taxes, $168,917) | | $ | 31,383,344 | | |
| Interest income allocated from affiliated investment | | | 6,502,098 | | |
| Dividends | | | 4,585 | | |
| Expenses allocated from affiliated investment | | | (618,896 | ) | |
| Total investment income | | $ | 37,271,131 | | |
| Expenses | |
| Investment adviser fee | | $ | 2,713,279 | | |
| Administration fee | | | 648,976 | | |
| Trustees' fees and expenses | | | 23,887 | | |
| Custodian fee | | | 172,339 | | |
| Legal and accounting services | | | 139,666 | | |
| Miscellaneous | | | 13,437 | | |
| Total expenses | | $ | 3,711,584 | | |
Deduct —
Reduction of custodian fee | | $ | 535 | | |
| Total expense reductions | | $ | 535 | | |
| Net expenses | | $ | 3,711,049 | | |
| Net investment income | | $ | 33,560,082 | | |
| Realized and Unrealized Gain (Loss) | |
Net realized gain (loss) —
Investment transactions | | $ | 2,426,628 | | |
| Financial futures contracts | | | (5,899,608 | ) | |
| Swap contracts | | | 1,542,661 | | |
Foreign currency and forward foreign currency
exchange contract transactions | | | 25,870,037 | | |
| Net realized gain | | $ | 23,939,718 | | |
Change in unrealized appreciation (depreciation) —
Investments | | $ | 6,639,313 | | |
| Financial futures contracts | | | (1,339,479 | ) | |
| Swap contracts | | | (1,283,824 | ) | |
| Foreign currency and forward foreign currency exchange contracts | | | 3,081,908 | | |
| Net change in unrealized appreciation (depreciation) | | $ | 7,097,918 | | |
| Net realized and unrealized gain | | $ | 31,037,636 | | |
| Net increase in net assets from operations | | $ | 64,597,718 | | |
See notes to financial statements
18
Global Macro Portfolio as of October 31, 2007
FINANCIAL STATEMENTS CONT'D
Statements of Changes in Net Assets
Increase (Decrease)
in Net Assets | | Year Ended
October 31, 2007 | | Year Ended
October 31, 2006 | |
From operations —
Net investment income | | $ | 33,560,082 | | | $ | 21,969,155 | | |
Net realized gain from investment
transactions, financial futures
contracts, swap contracts, foreign
currency and forward foreign currency
exchange contract transactions | | | 23,939,718 | | | | 9,633,573 | | |
Net change in unrealized appreciation
(depreciation) from investments,
financial futures contracts, swap
contracts, foreign currency and
forward foreign currency
exchange contracts | | | 7,097,918 | | | | 3,996,602 | | |
| Net increase in net assets from operations | | $ | 64,597,718 | | | $ | 35,599,330 | | |
Capital transactions —
Contributions | | $ | 398,182,177 | | | $ | 547,451,590 | | |
| Withdrawals | | | (337,613,129 | ) | | | (430,504,785 | ) | |
Net increase in net assets from
capital transactions | | $ | 60,569,048 | | | $ | 116,946,805 | | |
| Net increase in net assets | | $ | 125,166,766 | | | $ | 152,546,135 | | |
| Net Assets | |
| At beginning of year | | $ | 563,225,838 | | | $ | 410,679,703 | | |
| At end of year | | $ | 688,392,604 | | | $ | 563,225,838 | | |
See notes to financial statements
19
Global Macro Portfolio as of October 31, 2007
FINANCIAL STATEMENTS CONT'D
Supplementary Data
| | | Year Ended October 31, | |
| | | 2007 | | 2006 | | 2005 | | 2004 | | 2003 | |
| Ratios/Supplemental Data | |
| Ratios (As a percentage of average daily net assets): | |
| Expenses before custodian fee reduction | | | 0.67 | % | | | 0.66 | % | | | 0.66 | % | | | 0.68 | % | | | 0.71 | % | |
| Expenses after custodian fee reduction | | | 0.67 | % | | | 0.66 | % | | | 0.66 | % | | | 0.68 | % | | | 0.71 | % | |
| Net investment income | | | 5.16 | % | | | 4.49 | % | | | 3.23 | % | | | 3.10 | % | | | 3.36 | % | |
| Portfolio Turnover | | | 45 | % | | | 41 | % | | | 59 | % | | | 55 | % | | | 71 | % | |
| Total Return | | | 10.34 | % | | | 7.60 | % | | | 6.48 | % | | | 6.97 | % | | | 12.97 | % | |
| Net assets, end of year (000's omitted) | | $ | 688,393 | | | $ | 563,226 | | | $ | 410,680 | | | $ | 323,944 | | | $ | 277,081 | | |
See notes to financial statements
20
Global Macro Portfolio as of October 31, 2007
NOTES TO FINANCIAL STATEMENTS
1 Significant Accounting Policies
Global Macro Portfolio (the "Portfolio") (formerly Strategic Income Portfolio) is a New York trust registered under the Investment Company Act of 1940, as amended (the 1940 Act), as a non-diversified open-end investment company. The Portfolio's investment objective is to provide a high level of income and total return by investing in a global portfolio consisting primarily of high grade debt securities. The Declaration of Trust permits the Trustees to issue interests in the Portfolio. At October 31, 2007, Eaton Vance Strategic Income Fund, Eaton Vance Global Macro Fund and Eaton Vance Medallion Strategic Income Fund held an approximate 85.40%, 0.01%, and 14.59% interest, respectively, in the Portfolio.
The following is a summary of significant accounting policies of the Portfolio. The policies are in conformity with accounting principles generally accepted in the United States of America.
A Investment Valuation — Most seasoned fixed rate 30 years mortgage-backed securities ("MBS") are valued by the investment adviser's matrix pricing system. The matrix pricing system also considers various factors relating to bonds and market transactions to determine market value. Debt securities, including those issued by foreign entities, certain MBS, and collateralized mortgage obligations, will normally be valued on the basis of market valuations furnished by pricing services. The pricing services consider various factors relating to bonds or loans and/or market transactions to determine market value. Equity securities that are listed on foreign or U.S. securities exchanges are valued at closing sale prices on the exchange where such securities are principally traded. Equity securities listed in the NASDAQ Global or Global Select Market are valued at the NASDAQ official closing price. Unlisted or listed securities for which closing sale prices are not available are valued at the mean between the latest available bid and ask prices. When valuing foreign investments that meet certain criteria, the Trustees have approved the use of a fair value service that values such securities to reflect market trading that occurs after the close of the applicable foreign markets of comparable or other instruments that have strong correlation to the fair-valued securities. Financial futures contracts and options thereon listed on commodity exchanges and exchange-traded options are valued at closing settlement prices. The value of interest rate swaps is generally based upon a dealer quotation. Credit default swaps are valued by the broker-dealer (usually the counterparty to the agreement). Short-term debt securities and money-market securities (of U.S. issuers) maturing in sixty days or l ess are valued at amortized cost, which approximates market value. If short-term debt securities are acquired with a remaining maturity of more than sixty days, they will be valued by a pricing service. Non-U.S. dollar denominated short-term obligations are valued at amortized cost as calculated in the base currency and translated to U.S. dollars at the current exchange rate. Foreign exchange rates for foreign exchange forward contracts and for the translation of non-U.S. dollar-denominated investments into U.S. dollars are obtained from a pricing service. Sovereign credit default swaps are valued by a pricing service. Foreign interest rate swaps and over-the-counter currency options are valued using inputs from a third party into a valuation model. Investments for which valuations or market quotations are not readily available and investments for which the price of the security is not believed to represent its fair market value, are val ued at fair value using methods determined in good faith by or at the direction of the Trustees.
The Portfolio may invest in Cash Management Portfolio (Cash Management), an affiliated investment company managed by Boston Management and Research (BMR), a subsidiary of Eaton Vance Management (EVM). Cash Management values its investment securities utilizing the amortized cost valuation technique permitted by Rule 2a-7 of the 1940 Act. This technique involves initially valuing a portfolio security at its cost and thereafter assuming a constant amortization to maturity of any discount or premium.
B Investment Transactions — Investment transactions for financial statement purposes are accounted for on a trade date basis. Realized gains and losses on investments sold are determined on the basis of identified cost.
C Income — Interest income is recorded on the basis of interest accrued, adjusted for amortization of premium or accretion of discount. Dividend income is recorded on the ex-dividend date for dividends received in cash and/or securities. However, if the ex-dividend date has passed, certain dividends from foreign securities are recorded as the Portfolio is informed of the ex-dividend date.
D Federal Taxes — The Portfolio has elected to be treated as a partnership for federal tax purposes. No provision is made by the Portfolio for federal or state taxes on any taxable income of the Portfolio because each investor in the Portfolio is ultimately responsible for the payment of any taxes on its share of taxable income. Since at least one of the Portfolio's investors is a regulated investment company that invests all or substantially all of
21
Global Macro Portfolio as of October 31, 2007
NOTES TO FINANCIAL STATEMENTS CONT'D
its assets in the Portfolio, the Portfolio normally must satisfy the applicable source of income and diversification requirements (under the Internal Revenue Code) in order for its investors to satisfy them. The Portfolio will allocate, at least annually among its investors, each investor's distributive share of the Portfolio's net investment income, net realized capital gains and any other items of income, gain, loss, deduction or credit.
E Expense Reduction — State Street Bank and Trust Company (SSBT) serves as custodian of the Portfolio. Pursuant to the custodian agreement, SSBT receives a fee reduced by credits, which are determined based on the average daily cash balance the Portfolio maintains with SSBT. All credit balances, if any, used to reduce the Portfolio's custodian fees are reported as a reduction of expenses in the Statement of Operations.
F Foreign Currency Translation — Investment valuations, other assets, and liabilities initially expressed in foreign currencies are translated each business day into U.S. dollars based upon current exchange rates. Purchases and sales of foreign investment securities and income and expenses denominated in foreign currencies are translated into U.S. dollars based upon currency exchange rates in effect on the respective dates of such transactions. Recognized gains or losses on investment transactions attributable to changes in foreign currency exchange rates are recorded for financial statement purposes as net realized gains and losses on investments. That portion of unrealized gains and losses on investments that results from fluctuations in foreign currency exchange rates is not separately disclosed.
G Use of Estimates — The preparation of the financial statements in conformity with accounting principles generally accepted in the United States of America requires management to make estimates and assumptions that affect the reported amounts of assets and liabilities at the date of the financial statements and the reported amounts of income and expense during the reporting period. Actual results could differ from those estimates.
H Indemnifications — Under the Portfolio's organizational documents, its officers and Trustees may be indemnified against certain liabilities and expenses arising out of the performance of their duties to the Portfolio. Interestholders in the Portfolio are jointly and severally liable for the liabilities and obligations of the Portfolio in the event that the Portfolio fails to satisfy such liabilities and obligations; provided, however, that, to the extent assets are available in the Portfolio, the Portfolio may, under certain circumstances, indemnify interestholders from and against any claim or liability to which such holder may become subject by reason of being or having been an interestholder in t he Portfolio. Additionally, in the normal course of business, the Portfolio enters into agreements with service providers that may contain indemnification clauses. The Portfolio's maximum exposure under these arrangements is unknown as this would involve future claims that may be made against the Portfolio that have not yet occurred.
I Financial Futures Contracts — The Portfolio may enter into financial futures contracts. The Portfolio's investment in financial futures contracts is designed for hedging against changes in interest rates or as a substitute for the purchase of securities. Upon entering into a financial futures contract, the Portfolio is required to deposit with the broker, either in cash or securities an amount equal to a certain percentage of the purchase price (initial margin). Subsequent payments, known as variation margin, are made or received by the Portfolio each business day, depending on the daily fluctuations in the value of the underlying security, and are recorded as unrealized gains or losses by the Portfolio. Gains (losses) are realized upon the expiration or closing of the financial futures contracts. Should market conditions change unexpectedly, the Portfolio may not achieve the anticipated benefits of the financial futures contracts and may realize a loss. In entering such contracts, the Portfolio bears the risk if the counterparties do not perform under the contracts' terms.
J Purchased Options — Upon the purchase of a call or put option, the premium paid by the Portfolio is included in the Statement of Assets and Liabilities as an investment. The amount of the investment is subsequently marked-to-market to reflect the current market value of the option purchased, in accordance with the Portfolio's policies on investment valuations discussed above. If an option which the Portfolio has purchased expires on the stipulated expiration date, the Portfolio will realize a loss in the amount of the cost of the option. If the Portfolio enters into a closing sale transaction, the Portfolio will realize a gain or loss, depending on whether the sales proceeds from the closing sale transaction are greater or less than the cost of the option. If a Portfoli o exercises a put option, it will realize a gain or loss from the sale of the underlying security, and the proceeds from such sale will be decreased by the premium originally paid. If the Portfolio exercises a call option, the cost of the security which the Portfolio purchases upon exercise will be increased by the premium originally paid.
22
Global Macro Portfolio as of October 31, 2007
NOTES TO FINANCIAL STATEMENTS CONT'D
K Written Options — Upon the writing of a call or a put option, an amount equal to the premium received by the Portfolio is included in the Statement of Assets and Liabilities as a liability. The amount of the liability is subsequently marked-to-market to reflect the current value of the option written in accordance with the Portfolio's policies on investment valuations discussed above. Premiums received from writing options which expire are treated as realized gains. Premiums received from writing options which are exercised or are closed are added to or offset against the proceeds or amount paid on the transaction to determine the realized gain or loss. If a put option is exercised, the premium reduces the cost basis of the securities purchased by the Portfolio. The Por tfolio, as writer of an option, may have no control over whether the underlying securities may be sold (call) or purchased (put) and, as a result, bears the market risk of an unfavorable change in the price of the securities underlying the written option.
L Forward Foreign Currency Exchange Contracts — The Portfolio may enter into forward foreign currency exchange contracts for the purchase or sale of a specific foreign currency at a fixed price on a future date. The Portfolio enters into forward contracts for hedging purposes as well as non-hedging purposes. The forward foreign currency exchange contract is adjusted by the daily exchange rate of the underlying currency and any gains or losses are recorded for financial statement purposes as unrealized until such time as the contract has been closed or offset by another contract with the same broker for the same settlement date and currency. Risks may arise upon entering these contracts from the potential inability of counterparties to meet the terms of their contracts and from movements in the value of a foreign currency relative to the U.S. dollar.
M Interest Rate Swaps — The Portfolio may enter into interest rate swap agreements to enhance return, to hedge against fluctuations in securities prices or interest rates, or as substitution for the purchase or sale of securities. Pursuant to these agreements, the Portfolio makes periodic payments at a fixed interest rate and, in exchange, receives payments based on the interest rate of a benchmark industry index. Payments received or made are recorded as realized gains or losses. During the term of the outstanding swap agreement, changes in the underlying value of the swap are recorded as unrealized gains or losses. The value of the swap is determined by changes in the relationship between two rates of interest. The Portfolio is exposed to credit loss in the event of non - -performance by the swap counterparty. Risk may also arise from movements in interest rates.
N Total Return Swaps — The Portfolio may enter into swap agreements to enhance return, to hedge against fluctuations in securities prices or interest rates or as substitution for the purchase or sale of securities. In a total return swap, the Portfolio makes payments at a rate equal to a predetermined spread to the one or three-month LIBOR. In exchange, the Portfolio receives payments based on the rate of return of a benchmark industry index or basket of securities. During the term of the outstanding swap agreement, changes in the underlying value of the swap are recorded as unrealized gains and losses. Periodic payments received or made are recorded as realized gains or losses. The value of the swap is determined by changes in the relationship between the rate of interes t and the benchmark industry index or basket of securities. The Portfolio is exposed to credit loss in the event of nonperformance by the swap counterparty. However, the Portfolio does not anticipate nonperformance by the counterparty. Risk may also arise from the unanticipated movements in value of interest rates, securities, or the index.
O Credit Default Swaps — The Portfolio may enter into credit default swap contracts to buy or sell protection against default on an individual issuer or a basket of issuers of bonds. When the Portfolio is the buyer of a credit default swap contract, the Portfolio is entitled to receive the par (or other agreed-upon) value of a referenced debt obligation (or basket of debt obligations) from the counterparty to the contract in the event of a default by a third party, such as a U.S. or foreign corporate issuer, on the debt obligation. In return, the Portfolio pays the counterparty a periodic stream of payments over the term of the contract provided that no event of default has occurred. If no default occurs, the Portfolio would have spent the stream of payments and received no benefit from the contract. When the Portfolio is the seller of a credit default swap contract, it receives the stream of payments, but is obligated to pay upon default of the referenced debt obligation. As the seller, the Portfolio effectively adds leverage to its portfolio because, in addition to its total net assets, the Portfolio is subject to investment exposure on the notional amount of the swap. The interest fee paid or received on the swap contract, which is based on a specified interest rate on a fixed notional amount, is accrued daily as a component of unrealized appreciation (depreciation) and is recorded as realized gain upon receipt or realized loss upon payment. The Portfolio also records an increase or decrease to unrealized appreciation (depreciation) in an amount equal to the daily valuation. Up-front payments or receipts, if any, are recorded as other assets or other liabilities, respectively, and amortized over the life of the swap contract as realized gains or losses. The Portfolio segr egates assets in the form of cash and cash equivalents in an amount equal to the aggregate market
23
Global Macro Portfolio as of October 31, 2007
NOTES TO FINANCIAL STATEMENTS CONT'D
value of the credit default swap of which it is the seller, marked to market on a daily basis. These transactions involve certain risks, including the risk that the seller may be unable to fulfill the transaction.
2 Investment Adviser Fee and Other Transactions with Affiliates
The investment adviser fee is earned by BMR, as compensation for management and investment advisory services rendered to the Portfolio. Pursuant to the investment advisory agreement, effective June 22, 2007, BMR receives a monthly advisory fee based upon a percentage of average daily net assets (0.615% annually up to $500 million of average net assets). Such percentage is reduced as average daily net assets exceed certain levels. Prior to June 22, 2007, the Portfolio's advisory fee was based upon a percentage of average daily net assets (0.275% annually up to $500 million of average net assets) plus a percentage of gross income (i.e. income other than gains from the sale of investments and paydown gain/losses). Such percentages were reduced as average daily net assets and gross income exceeded certain levels. The portion of the advisory fee payable by Cash Management on the Portfolio's investment of cash therein is credited agai nst the Portfolio's advisory fee. For the year ended October 31, 2007, the Portfolio's advisory fee totaled $3,311,496 of which $598,217 was allocated from Cash Management and $2,713,279 was paid or accrued directly by the Portfolio. For the year ended October 31, 2007, the Portfolio's advisory fee, including the portion allocated from Cash Management, was 0.51% of the Portfolio's average daily net assets. Prior to June 22, 2007, an administration fee, computed at an effective annual rate of 0.15% of average daily net assets was also paid to BMR for administrative services and office facilities. Such fee amounted to $648,976 for the period from November 1, 2006 to June 21, 2007. Effective June 22, 2007, the administration fee rate for the Portfolio was reduced to zero.
Except for Trustees of the Portfolio who are not members of EVM's or BMR's organizations, officers and Trustees receive remuneration for their services to the Portfolio out of the advisory fee. Trustees of the Portfolio who are not affiliated with the investment adviser may elect to defer receipt of all or a portion of their annual fees in accordance with the terms of the Trustees Deferred Compensation Plan. For the year ended October 31, 2007, no significant amounts have been deferred. Certain officers and Trustees of the Portfolio are officers of the above organizations.
3 Purchases and Sales of Investments
The Portfolio invests primarily in foreign government and U.S. Government debt securities. The ability of the issuers of the debt securities to meet their obligations may be affected by economic developments in a specific industry or country. The Portfolio regularly invests in lower rated and comparable quality unrated high yield securities. These investments have different risks than investments in debt securities rated investment grade and held by the Portfolio. Risk of loss upon default by the borrower is significantly greater with respect to such debt securities than with other debt securities because these securities are generally unsecured and are more sensitive to adverse economic conditions, such as recession or increasing interest rates, than are investment grade issuers. At October 31, 2007, the Portfolio had invested approximately 7.20% of its net assets or approximately $49,565,000 in high yield securities. Purchases and sales of investments, other than short-term obligations, and including paydowns on mortgage backed securities, for the year ended October 31, 2007 were as follows:
| Purchases | |
| Investments (non-U.S. Government) | | $ | 248,931,763 | | |
| U.S. Government Securities | | | 274,642,246 | | |
| | | $ | 523,574,009 | | |
| Sales | |
| Investments (non-U.S. Government) | | $ | 148,027,975 | | |
| U.S. Government Securities | | | 79,480,013 | | |
| | | $ | 227,507,988 | | |
4 Federal Income Tax Basis of Unrealized Appreciation (Depreciation)
The cost and unrealized appreciation (depreciation) of investments of the Portfolio at October 31, 2007, as determined on a federal income tax basis, were as follows:
| Aggregate cost | | $ | 679,927,009 | | |
| Gross unrealized appreciation | | $ | 8,575,709 | | |
| Gross unrealized depreciation | | | (7,400,522 | ) | |
| Net unrealized depreciation | | $ | 1,175,187 | | |
The net unrealized appreciation on futures contracts, swaps, foreign currency, and forward foreign currency exchange contracts at October 31, 2007 on a federal income tax basis was $65,097.
24
Global Macro Portfolio as of October 31, 2007
NOTES TO FINANCIAL STATEMENTS CONT'D
5 Financial Instruments
The Portfolio may trade in financial instruments with off-balance sheet risk in the normal course of its investing activities to assist in managing exposure to various market risks. These financial instruments may include forward foreign currency contracts, financial futures contracts and swaps and may involve, to a varying degree, elements of risk in excess of the amounts recognized for financial statement purposes. The notional or contractual amounts of these instruments represent the investment the Portfolio has in particular classes of financial instruments and does not necessarily represent the amounts potentially subject to risk. The measurement of the risks associated with these instruments is meaningful only when all related and offsetting transactions are considered. A summary of obligations under these financial instruments at October 31, 2007 is as follows:
Forward Foreign Currency Exchange Contracts
| Sales | |
Settlement
Date(s) | | Deliver | | In Exchange For | | Net Unrealized
Depreciation | |
| 11/6/07 | | Canadian Dollar
12,360,000 | | United States Dollar
12,619,263 | | $ | (394,174 | ) | |
| 11/14/07 | | Canadian Dollar
11,078,000 | | United States Dollar
11,606,502 | | | (57,405 | ) | |
| 11/8/07 | | New Zealand Dollar
13,323,002 | | United States Dollar
10,018,631 | | | (222,464 | ) | |
| 11/19/07 | | South African Rand
44,451,444 | | United States Dollar
6,509,694 | | | (269,798 | ) | |
| | | | | | | $ | (943,841 | ) | |
| Purchases | |
Settlement
Date(s) | | In Exchange For | | Deliver | | Net Unrealized
Appreciation
(Depreciation) | |
| 11/30/07 | | Botswana Pula
6,740,000 | | United States Dollar
1,058,989 | | $ | 77,840 | | |
| 12/4/07 | | Brazilian Real
62,246,900 | | United States Dollar
35,499,656 | | | 149,856 | | |
| 11/1/07 | | Euro
54,106 | | United States Dollar
78,124 | | | 154 | | |
| 11/1/07 | | Euro
6,416,733 | | Icelandic Krona
557,293,250 | | | (39,775 | ) | |
| 11/1/07 | | Euro
8,842,922 | | Serbian Dinar
684,000,000 | | | 4,865 | | |
| 11/5/07 | | Euro
12,748,661 | | Polish Zloty
46,405,125 | | | (62,242 | ) | |
Settlement
Date(s) | | In Exchange For | | Deliver | | Net Unrealized
Appreciation
(Depreciation) | |
| 7/21/08 | | Guatemalan Quetzal
24,719,931 | | United States Dollar
3,166,396 | | $ | (7,396 | ) | |
| 11/1/07 | | Icelandic Krona
557,293,250 | | Euro
6,465,119 | | | (30,228 | ) | |
| 11/5/07 | | Icelandic Krona
803,086,500 | | Euro
9,097,038 | | | 263,497 | | |
| 11/9/07 | | Icelandic Krona
548,877,000 | | Euro
6,296,555 | | | 56,067 | | |
| 11/16/07 | | Icelandic Krona
557,293,250 | | Euro
6,487,320 | | | (96,392 | ) | |
| 12/3/07 | | Icelandic Krona
557,293,250 | | Euro
6,364,701 | | | 40,051 | | |
| 11/5/07 | | Indian Rupee
257,342,000 | | United States Dollar
6,456,146 | | | 87,117 | | |
| 11/13/07 | | Indian Rupee
255,462,000 | | United States Dollar
6,446,177 | | | 46,728 | | |
| 11/26/07 | | Indian Rupee
256,241,000 | | United States Dollar
6,482,191 | | | 26,351 | | |
| 12/3/07 | | Indian Rupee
362,750,000 | | United States Dollar
9,167,298 | | | 43,412 | | |
| 11/13/07 | | Indonesian Rupiah
59,508,000,000 | | United States Dollar
6,530,012 | | | 6,004 | | |
| 11/26/07 | | Indonesian Rupiah
45,000,000,000 | | United States Dollar
4,898,226 | | | 39,425 | | |
| 11/9/07 | | Kazakh Tenge
356,000,000 | | United States Dollar
2,929,077 | | | 11,930 | | |
| 12/7/07 | | Kazakh Tenge
163,000,000 | | United States Dollar
1,309,237 | | | 33,014 | | |
| 10/14/08 | | Kazakh Tenge
757,300,000 | | United States Dollar
6,058,400 | | | (46,597 | ) | |
| 11/5/07 | | Kenyan Shilling
61,000,000 | | United States Dollar
913,966 | | | (2,160 | ) | |
| 11/9/07 | | Malaysian Ringgit
41,400,000 | | United States Dollar
12,176,471 | | | 239,802 | | |
| 11/13/07 | | Malaysian Ringgit
21,941,000 | | United States Dollar
6,492,381 | | | 88,695 | | |
| 11/19/07 | | Malaysian Ringgit
43,750,000 | | United States Dollar
12,982,966 | | | 141,841 | | |
| 11/26/07 | | Malaysian Ringgit
39,000,000 | | United States Dollar
11,591,618 | | | 110,549 | | |
| 12/3/07 | | Malaysian Ringgit
43,500,000 | | United States Dollar
12,957,998 | | | 97,028 | | |
| 1/18/08 | | Maritian Rupee
36,600,000 | | United States Dollar
1,202,223 | | | 3,481 | | |
| 11/20/07 | | Mexican Peso
62,450,000 | | United States Dollar
5,763,835 | | | 62,978 | | |
25
Global Macro Portfolio as of October 31, 2007
NOTES TO FINANCIAL STATEMENTS CONT'D
Settlement
Date(s) | | In Exchange For | | Deliver | | Net Unrealized
Appreciation
(Depreciation) | |
| 11/26/07 | | Mexican Peso
62,200,000 | | United States Dollar
5,739,331 | | $ | 62,091 | | |
| 11/9/07 | | New Turkish Lira
8,795,867 | | United States Dollar
7,361,174 | | | 129,069 | | |
| 11/19/07 | | New Turkish Lira
19,794,301 | | United States Dollar
16,235,483 | | | 565,903 | | |
| 11/9/07 | | Philippine Peso
370,750,000 | | United States Dollar
8,398,650 | | | 87,766 | | |
| 11/16/07 | | Philippine Peso
370,750,000 | | United States Dollar
8,414,280 | | | 69,598 | | |
| 11/23/07 | | Philippine Peso
370,750,000 | | United States Dollar
8,417,528 | | | 63,814 | | |
| 11/30/07 | | Philippine Peso
370,750,000 | | United States Dollar
8,499,152 | | | (21,430 | ) | |
| 11/5/07 | | Polish Zloty
46,405,125 | | Euro
12,377,060 | | | 599,882 | | |
| 11/8/07 | | Polish Zloty
40,078,125 | | Euro
10,953,599 | | | 135,078 | | |
| 11/9/07 | | Polish Zloty
80,788,750 | | Euro
21,421,706 | | | 1,224,230 | | |
| 11/26/07 | | Polish Zloty
46,405,125 | | Euro
12,743,829 | | | 61,381 | | |
| 11/13/07 | | Romanian Leu
24,892,250 | | Euro
7,404,001 | | | 97,319 | | |
| 11/1/07 | | Serbian Dinar
684,000,000 | | Euro
8,848,642 | | | (13,141 | ) | |
| 4/4/08 | | Uganda Shilling
4,563,765,520 | | United States Dollar
2,565,144 | | | 14,691 | | |
| 11/7/07 | | Zambian Kwacha
2,250,000,000 | | United States Dollar
541,490 | | | 52,476 | | |
| 2/7/08 | | Zambian Kwacha
2,765,475,000 | | United States Dollar
671,993 | | | 46,572 | | |
| | | | | | | $ | 4,521,194 | | |
At October 31, 2007, closed forward foreign currency purchases and sales excluded above amounted to a receivable of $2,557,324 and a payable of $166,451.
| Futures Contracts | |
Expiration
Date(s) | | Contracts | | Position | | Aggregate
Cost | | Value | | Net Unrealized
Appreciation
(Depreciation) | |
| 12/07 | | 273 U.S. | | | | | | | |
| |
| | | Treasury Note | | Long | | $ | 29,845,401 | | | $ | 30,034,267 | | | $ | 188,866 | | |
| 12/07 | | 80 Nikkei
225 | | Long | | | 6,372,420 | | | | 6,742,000 | | | | 369,580 | | |
Expiration
Date(s) | | Contracts | | Position | | Aggregate
Cost | | Value | | Net Unrealized
Appreciation
(Depreciation) | |
| 12/07 | | 21 DAX | | | | | | | | | | | | |
| | |
| | | 30 Index | | Long | | $ | 5,942,763 | | | $ | 6,121,544 | | | $ | 178,781 | | |
| 12/07 | | 68 Japan
10 Year Bond | | Short | | | (79,881,955 | ) | | | (80,189,097 | ) | | | (307,142 | ) | |
| 12/07 | | 165 FTSE/
JSE Top 40 | | Short | | | (6,649,122 | ) | | | (7,286,347 | ) | | | (637,225 | ) | |
| | | $ | (207,140 | ) | |
Descriptions of the underlying instruments to Futures Contracts: US Treasury Note: United States Treasury Note having a maturity 61/2 years or more but less than 10 years. Nikkei 225: The Nikkei 225 Stock Average is a price-weighted average of 225 top-rated Japanese companies listed in the First Section of the Tokyo Stock Exchange. Dax 30 Index: The Dax 30 Index is a Blue Chip Stock market index consisting of the 30 major German companies trading on the Frankfurt Stock Exchange. Japan 10 Year Bond: Japanese Government Bonds (JGB) having a maturity of 7 years or more but less than 11 years. FTSE/JSE Top 40 Index: The FTSE/JSE Top 40 Index is a capitalization weighted index of the 40 largest companies by market capitalization included in the FTSE/JSE All Shares Index.
26
Global Macro Portfolio as of October 31, 2007
NOTES TO FINANCIAL STATEMENTS CONT'D
Credit Default Swaps
The Portfolio has entered into credit default swaps whereby the Portfolio is buying or selling protection against default exposing the Portfolio to risks associated with changes in credit spreads of the underlying instruments.
| Counterparty | | Reference Entity | | Buy/Sell | | Notional
Amount
(000's omitted) | | Pay/Receive
Annual Fixed
Rate | | Termination
Date | | Net
Unrealized
Appreciation
(Depreciation) | |
| Barclays Capital Bank PLC | | Egypt | | Buy | | $ | 6,000 | | | | 0.75 | % | | 1/20/11 | | $ | (25,261 | ) | |
| Citigroup Global Markets | | Indonesia | | Buy | | | 10,000 | | | | 1.73 | | | 6/20/11 | | | (225,809 | ) | |
| Citigroup Global Markets | | Philippines (Republic of the) | | Buy | | | 5,000 | | | | 1.88 | | | 6/20/11 | | | (124,374 | ) | |
| Credit Suisse First Boston | | Greece | | Buy | | | 20,000 | | | | 0.195 | | | 6/20/20 | | | (43,373 | ) | |
| Credit Suisse First Boston | | Italy | | Buy | | | 18,200 | | | | 0.20 | | | 12/20/16 | | | (64,918 | ) | |
| Credit Suisse First Boston | | Philippines (Republic of the) | | Buy | | | 5,000 | | | | 1.88 | | | 6/20/11 | | | (124,374 | ) | |
| Credit Suisse First Boston | | Turkey | | Buy | | | 5,000 | | | | 2.87 | | | 7/20/11 | | | (267,304 | ) | |
| Goldman Sachs, Inc. | | Greece | | Buy | | | 30,000 | | | | 0.20 | | | 6/20/20 | | | (79,085 | ) | |
| Goldman Sachs, Inc. | | Greece | | Buy | | | 50,000 | | | | 0.29 | | | 6/20/15 | | | (527,568 | ) | |
| HSBC Bank USA | | Serbia | | Buy | | | 7,000 | | | | 1.30 | | | 5/20/11 | | | 28,210 | | |
| J.P. Morgan Chase Bank | | Greece | | Buy | | | 20,000 | | | | 0.12625 | | | 9/20/17 | | | 52,550 | | |
| J.P. Morgan Chase Bank | | Indonesia | | Buy | | | 5,000 | | | | 2.09 | | | 9/20/11 | | | (173,513 | ) | |
| J.P. Morgan Chase Bank | | Philippines (Republic of the) | | Buy | | | 5,000 | | | | 1.88 | | | 6/20/11 | | | (124,374 | ) | |
| J.P. Morgan Chase Bank | | Turkey | | Buy | | | 4,000 | | | | 3.60 | | | 4/6/09 | | | (160,633 | ) | |
| J.P. Morgan Chase Bank | | Turkey | | Buy | | | 10,000 | | | | 3.16 | | | 4/20/10 | | | (510,928 | ) | |
| Morgan Stanley | | Turkey | | Buy | | | 3,000 | | | | 3.40 | | | 1/29/09 | | | (100,511 | ) | |
| Morgan Stanley | | Turkey | | Buy | | | 5,000 | | | | 4.05 | | | 4/6/14 | | | (565,865 | ) | |
| | | $ | (3,037,130 | ) | |
Interest Rate Swaps
| Counterparty | | Notional Amount | | Portfolio
Pay/Receive
Floating Rate | | Floating Rate Index | | Annual
Fixed Rate | | Termination
Date | | Net
Unrealized
Appreciation
(Depreciation) | |
| Barclays Capital Bank PLC | | | 36,000,000 | MYR | | Pay | | KLIBOR | | | 3.85 | % | | March 27, 2012 | | $ | (67,338 | ) | |
| J.P. Morgan Chase Bank | | | 12,290,767 | BRL | | Pay | | Brazil Interbank Deposit Rate | | | 10.35 | | | January 2, 2012 | | | (372,104 | ) | |
| J.P. Morgan Chase Bank | | | 38,710,005 | BRL | | Pay | | Brazil Interbank Deposit Rate | | | 11.34 | | | January 2, 2009 | | | (5,518 | ) | |
| J.P. Morgan Chase Bank | | | 10,533,705 | BRL | | Pay | | Brazil Interbank Deposit Rate | | | 12.73 | | | January 2, 2012 | | | 320, 884 | | |
| Merrill Lynch Capital Services | | | 241,500,000 | INR | | Receive | | MIBOR | | | 7.85 | | | March 31, 2012 | | | (156,234 | ) | |
| | | $ | (280,310 | ) | |
At October 31, 2007 the Portfolio had sufficient cash and/or securities to cover commitments under these contracts.
27
Global Macro Portfolio as of October 31, 2007
NOTES TO FINANCIAL STATEMENTS CONT'D
6 Line of Credit
The Portfolio participates with other portfolios and funds managed by EVM and its affiliates in a $200 million unsecured line of credit agreement with a group of banks. Borrowings are made by the Portfolio solely to facilitate the handling of unusual and/or unanticipated short-term cash requirements. Interest is charged to the Portfolio based on its borrowings at an amount above either the Eurodollar rate or Federal Funds rate. In addition, a fee computed at an annual rate of 0.07% on the daily unused portion of the line of credit is allocated among the participating portfolios and funds at the end of each quarter. The Portfolio did not have any significant borrowings or allocated fees during the year ended October 31, 2007.
7 Name Change
Effective March 1, 2007, the Board of Trustees approved a change in the name of the Portfolio to Global Macro Portfolio (from Strategic Income Portfolio).
8 Risks Associated with Foreign Investments
Investing in securities issued by companies whose principal business activities are outside the United States may involve significant risks not present in domestic investments. For example, there is generally less publicly available information about foreign companies, particularly those not subject to the disclosure and reporting requirements of the U.S. securities laws. Certain foreign issuers are generally not bound by uniform accounting, auditing, and financial reporting requirements and standards of practice comparable to those applicable to domestic issuers. Investments in foreign securities also involve the risk of possible adverse changes in investment or exchange control regulations, expropriation or confiscatory taxation, limitation on the removal of funds or other assets of the Portfolio, political or financial instability or diplomatic and other developments which could affect such investments. Foreign stock markets, while growing in volume and sophistication, are generally not as developed as those in the United States, and securities of some foreign issuers (particularly those located in developing countries) may be less liquid and more volatile than securities of comparable U.S. companies. In general, there is less overall governmental supervision and regulation of foreign securities markets, broker-dealers and issuers than in the United States.
9 Recently Issued Accounting Pronouncements
In June 2006, the Financial Accounting Standards Board (FASB) issued FASB Interpretation No. 48 (FIN 48), "Accounting for Uncertainty in Income Taxes – an interpretation of FASB Statement No. 109". FIN 48 clarifies the accounting for uncertainty in income taxes recognized in accordance with FASB Statement No. 109, "Accounting for Income Taxes". This interpretation prescribes a recognition threshold and measurement attribute for the financial statement recognition and measurement of a tax position taken or expected to be taken in a tax return. It also provides guidance on de-recognition, classification, interest and penalties, accounting in interim periods, disclosure and transition. FIN 48 is effective on the last business day of the first required financial reporting period for fiscal years beginning after December 15, 2006. Management is currently evaluating the impact of applying the various provisions of FIN 48.
In September 2006, the FASB issued Statement of Financial Accounting Standards No. 157 (FAS 157), "Fair Value Measurements". FAS 157 defines fair value, establishes a framework for measuring fair value in accordance with generally accepted accounting principles and expands disclosure about fair value measurements. FAS 157 is effective for fiscal years beginning after November 15, 2007. Management is currently evaluating the impact the adoption of FAS 157 will have on the Portfolio's financial statement disclosures.
28
Global Macro Portfolio as of October 31, 2007
REPORT OF INDEPENDENT REGISTERED PUBLIC ACCOUNTING FIRM
To the Trustees and Investors of Global Macro Portfolio:
We have audited the accompanying statement of assets and liabilities of Global Macro Portfolio (the "Portfolio") (formerly Strategic Income Portfolio), including the portfolio of investments as of October 31, 2007, and the related statement of operations for the year then ended, and the statement of changes in net assets, and the supplementary data for year then ended. These financial statements and supplementary data are the responsibility of the Portfolio's management. Our responsibility is to express an opinion on these financial statements and supplementary data based on our audit. The statement of changes in net assets of the Portfolio for the year ended October 31, 2006 and the supplementary data for the years ended October 31, 2006, 2005, 2004 and 2003 were audited by other auditors. Those auditors expressed an unqualified opinion on those financial statements in their report dated December 27, 2006.
We conducted our audit in accordance with the standards of the Public Company Accounting Oversight Board (United States). Those standards require that we plan and perform the audit to obtain reasonable assurance about whether the financial statements and supplementary data are free of material misstatement. The Portfolio is not required to have, nor were we engaged to perform, an audit of its internal control over financial reporting. Our audit included consideration of internal control over financial reporting as a basis for designing audit procedures that are appropriate in the circumstances, but not for the purpose of expressing an opinion on the effectiveness of the Portfolio's internal control over financial reporting. Accordingly, we express no such opinion. An audit also includes examining, on a test basis, evidence supporting the amounts and disclosures in the financial statements, assessing the accounting principles use d and significant estimates made by management, as well as evaluating the overall financial statement presentation. Our procedures included confirmation of securities owned as of October 31, 2007, by correspondence with the custodian and brokers, where replies were not received from brokers, we performed other auditing procedures. We believe that our audit provides a reasonable basis for our opinion.
In our opinion, the financial statements and supplementary data referred to above present fairly, in all material respects, the financial position of Global Macro Portfolio as of October 31, 2007, the results of its operations, the changes in its net assets, and the supplementary data for the year then ended, in conformity with accounting principles generally accepted in the United States of America.
DELOITTE & TOUCHE LLP
Boston, Massachusetts
December 17, 2007
29
Global Macro Portfolio as of October 31, 2007
OTHER MATTERS
Change in Independent Registered Public Accounting Firm
On August 6, 2007, PricewaterhouseCoopers LLP resigned in the ordinary course as the independent registered public accounting firm for the Portfolio.
The reports of PricewaterhouseCoopers LLP on the Portfolio's financial statements for each of the last two fiscal years contained no adverse opinion or disclaimer of opinion and were not qualified or modified as to uncertainty, audit scope or accounting principle. There have been no disagreements with PricewaterhouseCoopers LLP during the Portfolio's two most recent fiscal years and any subsequent interim period on any matter of accounting principles or practices, financial statement disclosure or auditing scope or procedure, which disagreements if not resolved to the satisfaction of PricewaterhouseCoopers LLP, would have caused them to make reference thereto in their reports on the Portfolio's financial statements for such years, and there were no reportable events of the kind described in Item 304 (a)(1)(v) of Regulation S-K under the Securities Exchange Act of 1934, as amended.
At a meeting held on August 6, 2007, based on Audit Committee recommendations and approvals, the full Board of Trustees of the Portfolio approved Deloitte & Touche LLP as the Portfolio's independent registered public accounting firm for the fiscal year ending October 31, 2007. To the best of the Portfolio's knowledge, for the fiscal years ended October 31, 2006 and October 31, 2005, and through August 6, 2007, the Portfolio did not consult with Deloitte & Touche LLP on items which concerned the application of accounting principles to a specified transaction, either completed or proposed, or the type of audit opinion that might be rendered on the Portfolio's financial statements or concerned the subject of a disagreement (as defined in paragraph (a)(1)(iv) of Item 304 of Regulation S-K) or reportable events (as described in paragraph (a)(1)(v) of Item 304 of Regulation S-K).
30
Eaton Vance Global Macro Fund
BOARD OF TRUSTEES' ANNUAL APPROVAL OF THE INVESTMENT ADVISORY AGREEMENTS
Overview of the Contract Review Process
The Investment Company Act of 1940, as amended (the "1940 Act"), provides, in substance, that for a fund to enter into an investment advisory agreement with an investment adviser, the fund's board of trustees, including a majority of the trustees who are not "interested persons" of the fund ("Independent Trustees"), must approve the agreement and its terms at an in-person meeting called for the purpose of considering such approval.
At a meeting of the Boards of Trustees (each a "Board") of the Eaton Vance group of mutual funds (the "Eaton Vance Funds") held on March 12, 2007, the Board, including a majority of the Independent Trustees, voted to approve the investment advisory agreement of the Global Macro Fund (the "Fund") with Eaton Vance Management ("EVM"), as well as a new investment advisory agreement for the Global Macro Portfolio (the "Portfolio"), the portfolio in which the Fund will invest substantially all of its assets, with Boston Management and Research ("BMR"), an affiliate of EVM (EVM, with respect to the Fund, and BMR, with respect to the Portfolio, are each referred to herein as the "Adviser"). The Board reviewed information furnished for the March 2007 meeting as well as information previously furnished with respect to the approval of other investment advisory agreements for other Eaton Vance Funds. Such information included, among other t hings, the following:
Information about Fees, Portfolio Performance and Expenses
• An independent report comparing the investment performance of the Portfolio to the investment performance of comparable funds over various time periods;
• The advisory and related fees to be paid by the Fund directly or indirectly through the Portfolio and the estimated expense ratio of the Fund;
• Comparative information concerning fees charged by the Adviser for managing other mutual funds and institutional accounts using investment strategies and techniques similar to those to be used in managing the Fund and the Portfolio, and concerning fees charged by other advisers for managing funds similar to the Fund and Portfolio;
Information about Portfolio Management
• Descriptions of the investment management services to be provided to the Fund and the Portfolio, including the investment strategies and processes to be employed;
• Information concerning the allocation of brokerage and the benefits expected to be received by the Adviser as a result of brokerage allocation, including information concerning the acquisition of research through "soft dollar" benefits received in connection with the Eaton Vance Funds' brokerage, and the implementation of the soft dollar reimbursement program established with respect to the Eaton Vance Funds;
• The procedures and processes to be used to determine the fair value of Fund and Portfolio assets and actions to be taken to monitor and test the effectiveness of such procedures and processes;
Information about the Adviser
• Reports detailing the financial results and condition of the Adviser;
• Descriptions of the qualifications, education and experience of the individual investment professionals whose responsibilities include portfolio management and investment research for the Fund and the Portfolio, and information relating to their compensation and responsibilities with respect to managing other mutual funds and investment accounts;
• Copies of the Codes of Ethics of the Adviser and its affiliates, together with information relating to compliance with and the administration of such codes;
• Information concerning the resources devoted to compliance efforts undertaken by the Adviser and its affiliates on behalf of the Eaton Vance Funds (including descriptions of various compliance programs) and their record of compliance with investment policies and restrictions, including policies with respect to market-timing, late trading and selective portfolio disclosure, and with policies on personal securities transactions;
• Descriptions of the business continuity and disaster recovery plans of the Adviser and its affiliates;
Other Relevant Information
• Information concerning the nature, cost and character of the administrative and other non-investment management services to be provided by Eaton Vance Management and its affiliates;
• Information concerning management of the relationship with the custodian, subcustodians and fund accountants by the Adviser or the administrator; and
• The terms of the advisory agreement for the Fund and for the Portfolio.
31
Eaton Vance Global Macro Fund
BOARD OF TRUSTEES' ANNUAL APPROVAL OF THE INVESTMENT ADVISORY AGREEMENTS CONT'D
Results of the Process
Based on its consideration of the foregoing, and such other information as it deemed relevant, including the factors and conclusions described below, the Board concluded that the investment advisory agreement of the Fund with EVM, as well as the terms of the new investment advisory agreement of the Portfolio with BMR, including the fee structure of each agreement, is in the interests of shareholders and, therefore, the Board, including a majority of the Independent Trustees, voted to approve the investment advisory agreements for the Fund and the Portfolio.
Nature, Extent and Quality of Services
In considering whether to approve the investment advisory agreements of the Fund and the Portfolio, the Board evaluated the nature, extent and quality of services to be provided to the Fund by EVM and Portfolio by BMR. The Board considered EVM's and BMR's management capabilities and investment process with respect to the types of investments to be held by the Fund and the Portfolio, including the education, experience and number of its investment professionals and other personnel who provide portfolio management, investment research, and similar services to the Fund and the Portfolio. The Board specifically noted EVM's and BMR's expertise with respect to global markets and in-house research capabilities. The Board also took into account the resources dedicated to portfolio management and other services, including the compensation paid to recruit and retain investment personnel, and the time and attention devoted to each fund in the complex by senior management.
The Board noted that, under the terms of the investment advisory agreement of the Fund, EVM may invest assets of the Fund directly in securities, for which it may receive a fee, or in the Portfolio, for which it receives no separate fee but for which BMR receives an advisory fee from the Portfolio. The Trustees considered the potential benefits to the Fund of the ability to make direct investments, such as an improved ability to: manage the Fund's duration, or other general market exposures, using certain derivatives; add exposure to specific market sectors or asset classes without changing the Portfolio's investments, which would affect any other fund investing in the Portfolio; hedge some of the general market risks of the Portfolio while retaining the value added by the individual manager; and hedge a portion of the exposures of the Portfolio while retaining others (e.g., hedging the U.S. government exposure of the Portfolio while retaining its exposure to high-grade corporate bonds).
The Board reviewed the compliance programs of the Adviser and relevant affiliates thereof. Among other matters, the Board considered compliance and reporting matters relating to personal trading by investment personnel, selective disclosure of portfolio holdings, late trading, frequent trading, portfolio valuation, business continuity and the allocation of investment opportunities. The Board also evaluated the responses of the Adviser and its affiliates to requests from regulatory authorities such as the Securities and Exchange Commission and the National Association of Securities Dealers.
The Board considered shareholder and other administrative services provided or managed by EVM and its affiliates, including transfer agency and accounting services. The Board evaluated the benefits to shareholders of investing in a fund that is a part of a large family of funds, including the ability, in many cases, to exchange an investment among different funds without incurring additional sales charges.
After consideration of the foregoing factors, among others, the Board concluded that the nature, extent and quality of services provided by the Adviser, taken as a whole, are appropriate and consistent with the terms of the investment advisory agreements.
Portfolio Performance
Although the Fund is a new and has no prior operating history, the Portfolio has existed for over ten years. The Board compared the Portfolio's investment performance to a relevant universe of similarly managed funds identified by an independent data provider and appropriate benchmark indices. The Board reviewed comparative performance data for the one- and three-year periods ended September 30, 2006 for the Portfolio. The Board concluded that the Portfolio's performance was satisfactory.
Management Fees and Expenses
The Board reviewed contractual investment advisory fee rates to be paid by the Fund directly or indirectly through its pro rata share of the expenses of the Portfolio (referred to as "management fees") and the Fund's estimated expense ratio for a one-year period.
After reviewing the foregoing information, and in light of the nature, extent and quality of the services provided by the Adviser, the Board concluded that the management fees proposed to be charged for advisory and related services and the Fund's total expense ratio are reasonable.
32
Eaton Vance Global Macro Fund
BOARD OF TRUSTEES' ANNUAL APPROVAL OF THE INVESTMENT ADVISORY AGREEMENTS CONT'D
Economies of Scale
In reviewing management fees and profitability, the Board also considered the extent to which the Adviser and its affiliates, on the one hand, and the Fund and the Portfolio, on the other hand, can expect to realize benefits from economies of scale as the assets of the Fund and the Portfolios increase. The Board noted the structure of the advisory fee, which includes breakpoints at several asset levels both at the Fund and at the Portfolio level. Based upon the foregoing, the Board concluded that the Adviser and its affiliates and the Fund and the Portfolio can be expected to share such benefits equitably.
33
Eaton Vance Global Macro Fund
MANAGEMENT AND ORGANIZATION
Fund Management. The Trustees of Eaton Vance Mutual Funds Trust (the Trust) and Global Macro Portfolio (the Portfolio) are responsible for the overall management and supervision of the Trust's and Portfolios' affairs. The Trustees and officers of the Trust and the Portfolio are listed below. Except as indicated, each individual has held the office shown or other offices in the same company for the last five years. Trustees and officers of the Trust and the Portfolio hold indefinite terms of office. The "noninterested Trustees" consist of those Trustees who are not "interested persons" of the Trust and the Portfolio, as that term is defined under the 1940 Act. The business address of each Trustee and officer is The Eaton Vance Building, 255 State Street, Boston, Massachusetts 02109. As used below, "EVC" refers to Eaton Vance Corp., "EV" refers to Eaton Vance, Inc., "EVM" refers to Eaton Vance Management, "BMR" refers to Boston Management and Research, "Parametric" refers to Parametric Portfolio Associates and "EVD" refers to Eaton Vance Distributors, Inc. EVC and EV are the corporate parent and trustee, respectively, of EVM and BMR. EVD is the Fund's principal underwriter, the Portfolio's placement agent and a wholly-owned subsidiary of EVM. Each officer affiliated with Eaton Vance may hold a position with other Eaton Vance affiliates that is comparable to his or her position with EVM listed below.
Name and
Date of Birth | | Position(s)
with the
Trust and
the Portfolio | | Term of
Office and
Length
of Service | | Principal Occupation(s)
During Past Five Years | | Number of Portfolios
in Fund Complex
Overseen
By Trustee(1) | | Other Directorships Held | |
| Interested Trustee | | | | | | | | | | | | | |
|
| Thomas E. Faust Jr. 5/31/58 | | Trustee and President of the Trust | | Trustee since 2007 and President of the Trust since 2002 | | Chairman, Chief Executive Officer and President of EVC, President of EV, Chief Executive Officer and President of EVM and BMR, and Director of EVD. Trustee and/or Officer of 176 registered investment companies and 5 private investment companies in the Eaton Vance Fund Complex. Mr. Faust is an interested person because of his positions with EVM, BMR, EVC and EV which are affiliates of the Trust and Portfolio. | | | 176 | | | Director of EVC | |
|
| Noninterested Trustee(s) | | | | | | | | | | | | | |
|
| Benjamin C. Esty 1/2/63 | | Trustee | | Since 2005 | | Roy and Elizabeth Simmons Professor of Business Administration, Harvard University Graduate School of Business Administration (since 2003). Formerly, Associate Professor, Harvard University Graduate School of Business Administration (2000-2003). | | | 176 | | | None | |
|
| Allen R. Freedman 4/3/40 | | Trustee | | Since 2007 | | Former Chairman and Chief Executive Officer of Assurant, Inc. (insurance provider) (1978-2000). Formerly, a Director of Loring Ward International (fund distributor) (2005-2007). | | | 175 | | | Director of Assurant, Inc. and Stonemor Partners L.P. (owner and operator of cemeteries) | |
|
| William H. Park 9/19/47 | | Trustee | | Since 2003 | | Vice Chairman, Commercial Industrial Finance Corp. (specialty finance company) (since 2006). Formerly, President and Chief Executive Officer, Prizm Capital Management, LLC (investment management firm) (since 2002-2005). | | | 176 | | | None | |
|
| Ronald A. Pearlman 7/10/40 | | Trustee | | Since 2003 | | Professor of Law, Georgetown University Law Center. | | | 176 | | | None | |
|
| Norton H. Reamer 9/21/35 | | Trustee | | Trustee of the Trust since 1986 and of the Portfolio since 1993 | | President, Chief Executive Officer and a Director of Asset Management Finance Corp. (a specialty finance company serving the investment management industry) (since October 2003). President, Unicorn Corporation (an investment and financial advisory services company) (since September 2000). Formerly, Chairman and Chief Operating Officer, Hellman, Jordan Management Co., Inc. (an investment management company) (2000-2003). Formerly, Advisory Director of Berkshire Capital Corporation (investment banking firm) (2002-2003). | | | 176 | | | None | |
|
34
Eaton Vance Global Macro Fund
MANAGEMENT AND ORGANIZATION CONT'D
Name and
Date of Birth | | Position(s)
with the
Trust and
the Portfolio | | Term of
Office and
Length
of Service | | Principal Occupation(s)
During Past Five Years | | Number of Portfolios
in Fund Complex
Overseen
By Trustee(1) | | Other Directorships Held | |
| Noninterested Trustee(s) (continued) | | | | | | | | | | | | | |
|
| Heidi L. Steiger 7/8/53 | | Trustee | | Since 2007 | | President, Lowenhaupt Global Advisors, LLC (global wealth management firm) (since 2005); Formerly, President and Contributing Editor, Worth Magazine (2004); Formerly, Executive Vice President and Global Head of Private Asset Management (and various other positions), Neuberger Berman (investment firm) (1986-2004). | | | 173 | | | Director of Nuclear Electric Insurance Ltd. (nuclear insurance provider) and Aviva USA (insurance provider) | |
|
| Lynn A. Stout 9/14/57 | | Trustee | | Since 1998 | | Paul Hastings Professor of Corporate and Securities Law, University of California at Los Angeles School of Law. | | | 176 | | | None | |
|
| Ralph F. Verni 1/26/43 | | Chairman of the Board and Trustee | | Chairman of the Board since 2007 and Trustee since 2005 | | Consultant and private investor. | | | 176 | | | None | |
|
| Principal Officers who are not Trustees | | | | | | | | | | | | | |
|
Name and
Date of Birth | | Position(s)
with the
Trust and
the Portfolio | | Term of
Office and
Length
of Service | | Principal Occupation(s)
During Past Five Years | |
| William H. Ahern, Jr. 7/28/59 | | Vice President of the Trust | | Since 1995 | | Vice President of EVM and BMR. Officer of 74 registered investment companies managed by EVM or BMR. | |
|
| John R. Baur 2/10/70 | | Vice President of the Portfolio | | Since 2007 | | Vice President of EVM and BMR. Previously, attended business school at Johnson Graduate School of Business (2002-2005). | |
|
| Michael A. Cirami 12/24/75 | | Vice President of the Portfolio | | Since 2007 | | Vice President of EVM and BMR. Previously, attended business school at the University of Rochester Simon School of Business (2001-2003). | |
|
| Charles B. Gaffney 12/4/72 | | Vice President of the Trust | | Since 2007 | | Vice President of EVM and BMR. Previously, Sector Portfolio Manager and Senior Equity Analyst of Brown Brothers Harriman (1997-2003). Officer of 29 registered investment companies managed by EVM or BMR. | |
|
| Christine M. Johnston 11/9/72 | | Vice President | | Since 2007 | | Vice President of EVM and BMR. Officer of 34 registered investment companies managed by EVM or BMR. | |
|
| Aamer Khan 6/7/60 | | Vice President of the Trust | | Since 2005 | | Vice President of EVM and BMR. Officer of 32 registered investment companies managed by EVM or BMR. | |
|
| Thomas H. Luster 4/8/62 | | Vice President of the Trust | | Since 2006 | | Vice President of EVM and BMR. Officer of 48 registered investment companies managed by EVM or BMR. | |
|
| Michael R. Mach 7/15/47 | | Vice President of the Trust | | Since 1999 | | Vice President of EVM and BMR. Officer of 54 registered investment companies managed by EVM or BMR. | |
|
| Robert B. MacIntosh 1/22/57 | | Vice President of the Trust | | Since 1998 | | Vice President of EVM and BMR. Officer of 89 registered investment companies managed by EVM or BMR. | |
|
| Duncan W. Richardson 10/26/57 | | Vice President of the Trust | | Since 2001 | | Executive Vice President and Chief Equity Investment Officer of EVC, EVM and BMR. Officer of 80 registered investment companies managed by EVM or BMR. | |
|
| Walter A. Row, III 7/20/57 | | Vice President of the Trust | | Since 2001 | | Director of Equity Research and a Vice President of EVM and BMR. Officer of 38 registered investment companies managed by EVM or BMR. | |
|
35
Eaton Vance Global Macro Fund
MANAGEMENT AND ORGANIZATION CONT'D
| Principal Officers who are not Trustees (continued) | |
|
Name and
Date of Birth | | Position(s)
with the
Trust and
the Portfolio | | Term of
Office and
Length
of Service | | Principal Occupation(s)
During Past Five Years | |
| Judith A. Saryan 8/21/54 | | Vice President of the Trust | | Since 2003 | | Vice President of EVM and BMR. Officer of 53 registered investment companies managed by EVM or BMR. | |
|
| Susan Schiff 3/13/61 | | Vice President | | Since 2002 | | Vice President of EVM and BMR. Officer of 35 registered investment companies managed by EVM or BMR. | |
|
| Thomas Seto 9/27/62 | | Vice President of the Trust | | Since 2007 | | Vice President and Director of Portfolio Management of Parametric. Officer of 30 registered investment companies managed by EVM or BMR. | |
|
| David M. Stein 5/4/51 | | Vice President of the Trust | | Since 2007 | | Managing Director and Chief Investment Officer of Parametric. Officer of 30 registered investment companies managed by EVM or BMR. | |
|
| Mark S. Venezia 5/23/49 | | Vice Prest of the Trust and President of the Portfolio | | Since 2002 | | Vice President of EVM and BMR. Officer of 35 registered investment companies managed by EVM or BMR. | |
|
| Adam A. Weigold 3/22/75 | | Vice President of the Trust | | Since 2007 | | Vice President of EVM and BMR. Officer of 70 registered investment companies managed by EVM or BMR. | |
|
| Barbara E. Campbell 6/19/57 | | Treasurer of the Trust | | Since 2005 | | Vice President of EVM and BMR. Officer of 176 registered investment companies managed by EVM or BMR. | |
|
| Maureen A. Gemma 5/24/60 | | Secretary | | Since 2007 | | Vice President and Deputy Chief Legal Officer of EVM and BMR. Officer of 176 registered investment companies managed by EVM or BMR. | |
|
| Dan A. Maalouly 3/25/62 | | Treasurer of the Portfolio | | Since 2005 | | Vice President of EVM and BMR. Previously, Senior Manager at Pricewaterhouse Coopers, LLP (1997-2005). Officer of 76 registered investment companies managed by EVM or BMR. | |
|
| Paul M. O'Neil 7/11/53 | | Chief Compliance Officer | | Since 2004 | | Vice President of EVM and BMR. Officer of 176 registered investment companies managed by EVM or BMR. | |
|
(1) Includes both master and feeder funds in a master-feeder structure.
The SAI for the Fund includes additional information about the Trustees and officers of the Fund and the Portfolios and can be obtained without charge by calling 1-800-225-6265.
36
Investment Adviser of Global Macro Portfolio
Boston Management and Research
The Eaton Vance Building
255 State Street
Boston, MA 02109
Administrator of Eaton Vance Global Macro Fund
Eaton Vance Management
The Eaton Vance Building
255 State Street
Boston, MA 02109
Principal Underwriter
Eaton Vance Distributors, Inc.
The Eaton Vance Building
255 State Street
Boston, MA 02109
(617) 482-8260
Custodian
State Street Bank and Trust Company
200 Clarendon Street
Boston, MA 02116
Transfer Agent
PFPC Inc.
Attn: Eaton Vance Funds
P.O. Box 9653
Providence, RI 02940-9653
(800) 262-1122
Independent Registered Public Accounting Firm
Deloitte & Touche LLP
200 Berkeley Street
Boston, MA 02116-5022
Eaton Vance Global Macro Fund
The Eaton Vance Building
255 State Street
Boston, MA 02109
This report must be preceded or accompanied by a current prospectus. Before investing, investors should consider carefully the Fund's investment
objective(s), risks, and charges and expenses. The Fund's current prospectus contains this and other information about the Fund and is available
through your financial advisor. Please read the prospectus carefully before you invest or send money. For further information please call 1-800-225-6265.
3041-12/07 GMSRC

Annual Report October 31, 2007


EATON VANCE
TAX-MANAGED
DIVIDEND
INCOME
FUND
IMPORTANT NOTICES REGARDING PRIVACY,
DELIVERY OF SHAREHOLDER DOCUMENTS,
PORTFOLIO HOLDINGS AND PROXY VOTING
Privacy. The Eaton Vance organization is committed to ensuring your financial privacy. Each of the financial institutions identified below has in effect the following policy ("Privacy Policy") with respect to nonpublic personal information about its customers:
• Only such information received from you, through application forms or otherwise, and information about your Eaton Vance fund transactions will be collected. This may include information such as name, address, social security number, tax status, account balances and transactions.
• None of such information about you (or former customers) will be disclosed to anyone, except as permitted by law (which includes disclosure to employees necessary to service your account). In the normal course of servicing a customer's account, Eaton Vance may share information with unaffiliated third parties that perform various required services such as transfer agents, custodians and broker/dealers.
• Policies and procedures (including physical, electronic and procedural safeguards) are in place that are designed to protect the confidentiality of such information.
• We reserve the right to change our Privacy Policy at any time upon proper notification to you. Customers may want to review our Policy periodically for changes by accessing the link on our homepage: www.eatonvance.com.
Our pledge of privacy applies to the following entities within the Eaton Vance organization: the Eaton Vance Family of Funds, Eaton Vance Management, Eaton Vance Investment Counsel, Boston Management and Research, and Eaton Vance Distributors, Inc.
In addition, our Privacy Policy only applies to those Eaton Vance customers who are individuals and who have a direct relationship with us. If a customer's account (i.e., fund shares) is held in the name of a third-party financial adviser/ broker-dealer, it is likely that only such adviser's privacy policies apply to the customer. This notice supersedes all previously issued privacy disclosures.
For more information about Eaton Vance's Privacy Policy, please call 1-800-262-1122.
Delivery of Shareholder Documents. The Securities and Exchange Commission (the "SEC") permits funds to deliver only one copy of shareholder documents, including prospectuses, proxy statements and shareholder reports, to fund investors with multiple accounts at the same residential or post office box address. This practice is often called "householding" and it helps eliminate duplicate mailings to shareholders.
Eaton Vance, or your financial adviser, may household the mailing of your documents indefinitely unless you instruct Eaton Vance, or your financial adviser, otherwise.
If you would prefer that your Eaton Vance documents not be householded, please contact Eaton Vance at 1-800-262-1122, or contact your financial adviser.
Your instructions that householding not apply to delivery of your Eaton Vance documents will be effective within 30 days of receipt by Eaton Vance or your financial adviser.
Portfolio Holdings. Each Eaton Vance Fund and its underlying Portfolio (if applicable) will file a schedule of its portfolio holdings on Form N-Q with the SEC for the first and third quarters of each fiscal year. The Form N-Q will be available on the Eaton Vance website www.eatonvance.com, by calling Eaton Vance at 1-800-262-1122 or in the EDGAR database on the SEC's website at www.sec.gov. Form N-Q may also be reviewed and copied at the SEC's public reference room in Washington, D.C. (call 1-800-732-0330 for information on the operation of the public reference room).
Proxy Voting. From time to time, funds are required to vote proxies related to the securities held by the funds. The Eaton Vance Funds or their underlying Portfolios (if applicable) vote proxies according to a set of policies and procedures approved by the Funds' and Portfolios' Boards. You may obtain a description of these policies and procedures and information on how the Funds or Portfolios voted proxies relating to portfolio securities during the most recent 12 month period ended June 30, without charge, upon request, by calling 1-800-262-1122. This description is also available on the SEC's website at www.sec.gov.
Eaton Vance Tax-Managed Dividend Income Fund as of October 31, 2007
MANAGEMENT’S DISCUSSION OF FUND PERFORMANCE

Aamer Khan, CFA
Co-Portfolio Manager

Thomas H. Luster, CFA
Co-Portfolio Manager

Michael R. Mach, CFA
Co-Portfolio Manager

Judith A. Saryan, CFA
Co-Portfolio Manager
The Fund
Performance for the Past Year
· For the year ended October 31, 2007, the Fund’s Class A shares had a total return of 14.47%.(1)
· The Fund’s Class B shares had a total return of 13.62% during the same period.(1)
· The Fund’s Class C shares had a total return of 13.63% during the same period.(1)
· For the period from inception on August 27, 2007, through October 31, 2007, the Fund’s Class I shares had a total return of
4.04%.(1)
· For comparison, the Fund’s benchmark, the Russell 1000 Value Index (the “Index”) – a broad-based, unmanaged market index of 1000 U.S. value stocks – had a total return of 10.83% for the year ended October 31, 2007. The Fund’s peer group, the Lipper Equity Income Funds Classification, had an average return at NAV of 13.44% for the same period.(2)
See pages 3 and 4 for more performance information, including after-tax returns.
Management Discussion
· During the year ended October 31, 2007, U.S. stock markets moved higher amid a significant increase in volatility. In the first half of the period, investors were cautiously optimistic about the economy, inflation, interest rates, and corporate profits, although markets both in the U.S. and abroad saw sharp declines from late February through mid-March 2007. Markets recovered strongly through mid-July 2007, only to decline again more dramatically in late July and August 2007 due to fallout from the subprime mortgage crisis. The Federal Reserve Board (the “Fed”) responded to the subprime situation by lowering the Fed Funds Rate — a key short-term interest rate benchmark — to 4.50% by period’s end. This eased some concerns about the economy and helped move markets higher through early October 2007, though another decline, caused in part by a spike in oil prices, occurred in the final weeks of the period.
· Based on the Fund’s objective of achieving after-tax total return, consisting primarily of tax-favored dividend income and capital
appreciation, during the year ended October 31, 2007, the Fund was primarily invested in securities that generated a relatively high level of qualified dividend income (QDI). At the end of the period, the Fund had approximately 89% of total investments invested in common stocks, approximately 10% of total investments invested in preferred stocks and 1% of total investments in cash equivalents. Within the common stock portfolio, the Fund had a significant exposure to the higher-yielding financial, energy and utility sectors.(3)
· During the year ended October 31, 2007, the Fund outperformed its benchmark Index, the Russell 1000 Value Index, and the average return of the Lipper Equity Income Funds Classification.(2) Stock selection was a key driver of the Fund’s performance during the fiscal year, although sector allocation decisions were also beneficial. The largest contribution to relative performance came from the materials sector, where an overweight allocation relative to the Index, along with strong investment selections in the metals and mining industry, benefited returns. Financial stocks were the second-strongest contributors to relative performance during the fiscal year, both because the Fund was underweighted relative to the Index (the sector performed poorly) and also because management’s selections outperformed those in the Index.(3) The
(1) These returns do not include the 5.75% maximum sales charge for Class A shares or the applicable contingent deferred sales charge (CDSC) for Class B and Class C shares. If sales charges were deducted, the returns would be lower. Class I shares are offered to certain investors at net asset value.
(2) It is not possible to invest directly in an Index or a Lipper Classification. The Index’s total return does not reflect commissions or expenses that would have been incurred if an investor individually purchased or sold the securities represented in the Index. The Lipper Average is the average total return, at net asset value, of the funds that are in the same Lipper Classification as the Fund.
(3) Sector weightings are subject to change due to active management.
Past performance is no guarantee of future results. Returns are historical and are calculated by determining the percentage change in net asset value or offering price (as applicable) with all distributions reinvested. Investment return and principal value will fluctuate so that shares, when redeemed, may be worth more or less than their original cost. Performance is for stated time period only; due to market volatility, the Fund’s current performance may be lower or higher than the quoted return. For performance as of the most recent month end, please refer to www.eatonvance.com.
Fund shares are not insured by the FDIC and are not deposits or other obligations of, or guaranteed by, any depository institution. Shares are subject to investment risks, including possible loss of principal invested.
1
information technology sector made a solid contribution during the fiscal year, primarily due to strong performance from holdings of communications equipment stocks, and the utilities and consumer discretionary sectors also contributed positively.(1)
· Limiting the Fund’s returns relative to the Index during the fiscal year were holdings and allocations in the energy, industrials and health care sectors.(1) In the energy sector, the Fund was underweighted in oil and gas companies, detracting from returns, while in the industrials sector, the Fund’s holdings of machinery stocks underperformed. In health care, pharmaceuticals detracted from the Fund’s performance. (1)
· During the year ended October 31, 2007, a portion of Fund assets was invested in non-U.S. common and preferred stocks. These investments provided the Fund with international diversification and dividend yields often more attractive than the yields available on stocks issued by similar domestic corporations. As of October 31, 2007, approximately 8% of the Fund’s total investments was invested in non-U.S. dollar denominated common stocks. In addition, approximately 4% of the Fund’s total investments was invested in “Yankee” preferreds. Yankee preferreds are preferred stocks of non-U.S. issuers that are denominated in U.S. dollars.
· In March 2007, the Fund increased its monthly dividend from $0.0605 to $0.066 per share for Class A shares — a 9.1% increase. The Fund expects that all of the dividends paid by the Fund during the year will be qualified dividends subject to federal income tax at long-term capital gain rates (up to 15%, as long as certain holding periods and other requirements have been met by receiving Fund shareholders).
· The increases in the Fund’s monthly dividend reflected both the effective implementation of the Fund’s dividend capture strategy and the significant number of dividend increases announced by companies represented in the Fund’s common stock portfolio.
· The Fund’s dividend capture strategy is a trading strategy designed to enhance the level of qualified dividend income earned by the Fund. By implementing dividend capture trading, the Fund has been able to collect a greater number of dividend payments than it would have collected by simply adhering to a buyand- hold strategy. (There can be no assurance that the continued use of dividend capture trading will be successful in the future.)
· In closing, we would like to thank you for your continued confidence and participation in the Fund.
(1) Sector weightings are subject to change due to active management.
The views expressed throughout this report are those of the portfolio managers and are current only through the end of the period of the report as stated on the cover. These views are subject to change at any time based upon market or other conditions, and the investment adviser disclaims any responsibility to update such views. These views may not be relied on as investment advice and, because investment decisions for a fund are based on many factors, may not be relied on as an indication of trading intent on behalf of any Eaton Vance fund.
Top Ten Common Stock Holdings(2)
By net assets
Southern Copper Corp. | | 3.3 | % |
Verizon Communications | | 2.6 | |
Kimberly-Clark Corp. | | 2.5 | |
ConocoPhillips | | 2.5 | |
International Business Machines Corp. | | 2.5 | |
AT&T, Inc. | | 2.5 | |
Johnson & Johnson | | 2.5 | |
Pfizer, Inc. | | 2.5 | |
General Electric Co. | | 2.4 | |
Altria Group, Inc. | | 2.4 | |
(2) Top Ten Common Stock Holdings represented 25.7% of Fund net assets as of 10/31/07. Holdings are subject to change due to active management.
Common Stock Industry Sectors(3)
By net assets
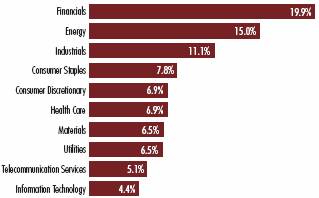
(3) As a percentage of the Fund’s net assets as of 10/31/07. Fund information may not be representative of the Fund’s current or future investments and may change due to active management.
2
The line graphs and table set forth below provide information about the Fund's performance. The line graphs compare the performance of Class A, Class B, Class C and Class I of the Fund with that of the Russell 1000 Value Index, a broad-based, unmanaged market index of 1000 U.S. value stocks. The lines on the graph represent the total returns of a hypothetical investment of $10,000 in each of Class A, Class B, Class C and Class I of the Fund and the Russell 1000 Value Index. Class A total returns are presented at net asset value and maximum public offering price. The table includes the total returns of each class of the Fund at net asset value and public offering price. The performance presented below does not reflect the deduction of taxes, if any, that a shareholder would pay on distributions or redemptions of Fund shares. It is not possible to invest directly in an Index. The Index’s total returns do not reflect any commissions or expenses that would have been incurred if an investor individually purchased or sold the securities represented in the Index.
Performance(1)
| | Class A | | Class B | | Class C | | Class I | |
Share Class Symbol | | EADIX | | EBDIX | | ECDIX | | EIDIX | |
Average Annual Total Returns (at net asset value) | | | | | | | | | |
One Year | | 14.47 | % | 13.62 | % | 13.63 | % | N.A. | |
Life of Fund | | 14.13 | | 13.29 | | 13.29 | | 4.04 | %†† |
| | | | | | | | | |
SEC Average Annual Total Returns (including sales charge or applicable CDSC) | | | | | | | | | |
One Year | | 7.87 | % | 8.62 | % | 12.63 | % | N.A. | |
Life of Fund | | 12.61 | | 12.99 | | 13.29 | | 4.04 | %†† |
† Inception Dates – Class A: 5/30/03; Class B: 5/30/03; Class C: 5/30/03; Class I: 8/27/07
†† Return since inception on 8/27/07
(1) Average annual total returns do not include the 5.75% maximum sales charge for Class A shares or the applicable contingent deferred sales charge (CDSC) for Class B and Class C shares. If sales charges were deducted, the returns would be lower.SEC average annual total returns for Class A reflect the maximum 5.75% sales charge. SEC returns for Class B shares reflect the applicable CDSC based on the following schedule: 5% - 1st and 2nd years; 4% - 3rd year; 3% - 4th year; 2% - 5th year; 1% - 6th year. SEC returns for Class C reflect a 1% CDSC for the first year. Class I shares are offered to certain investors at net asset value.
Total Annual
Operating Expenses(2)
| | Class A | | Class B | | Class C | | Class I | |
Expense Ratio | | 1.19 | % | 1.94 | % | 1.94 | % | 0.94 | % |
(2) Source: Prospectus dated 3/1/07 for Class A, B and C and dated 8/27/07 for Class I.
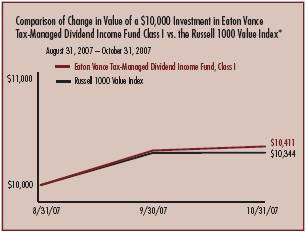
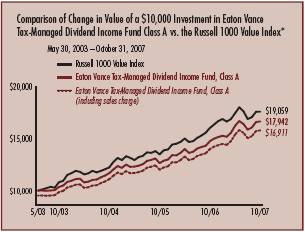
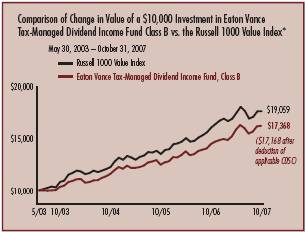
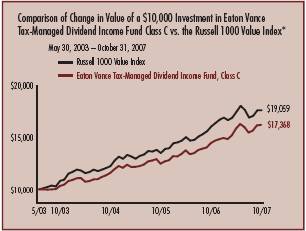
* Source: Thomson Financial. Investment operations for Class A, Class B and Class C commenced on 5/30/03. Investment operations for Class I commenced on 8/27/07. It is not possible to invest directly in an Index. The Index’s total return does not reflect commissions or expenses that would have been incurred if an investor individually purchased or sold the securities represented in the Index. Index returns are available as of month end only.
Past performance is no guarantee of future results. Returns are historical and are calculated by determining the percentage change in net asset value or offering price (as applicable) with all distributions reinvested. Investment return and principal value will fluctuate so that shares, when redeemed, may be worth more or less than their original cost. Performance is for stated time period only; due to market volatility, the Fund’s current performance may be lower or higher than the quoted return. For performance as of the most recent month end, please refer to www.eatonvance.com.
3
“Return Before Taxes” does not take into consideration shareholder taxes. It is most relevant to tax-free or tax-deferred shareholder accounts. “Return After Taxes on Distributions” reflects the impact of federal income taxes due on Fund distributions of dividends and capital gains. It is most relevant to taxpaying shareholders who continue to hold their shares. “Return After Taxes on Distributions and Sale of Fund Shares” also reflects the impact of taxes on capital gain or loss realized upon a sale of shares. It is most relevant to taxpaying shareholders who sell their shares.
Average Annual Total Returns
(For the periods ended October 31, 2007)
Returns at Net Asset Value (NAV) (Class A)
| | One Year | | Life of Fund | |
Return Before Taxes | | 14.47 | % | 14.13 | % |
Return After Taxes on Distributions | | 13.55 | | 13.31 | |
Return After Taxes on Distributions and Sale of Fund Shares | | 10.55 | | 12.20 | |
Returns at Public Offering Price (POP) (ClassA)
| | One Year | | Life of Fund | |
Return Before Taxes | | 7.87 | % | 12.61 | % |
Return After Taxes on Distributions | | 7.00 | | 11.81 | |
Return After Taxes on Distributions and Sale of Fund Shares | | 6.20 | | 10.84 | |
Average Annual Total Returns | | | | | |
(For the periods ended October 31, 2007) | | | | | |
| | | | | |
Returns at Net Asset Value (NAV) (Class B) | | | | | |
| | One Year | | Life of Fund | |
Return Before Taxes | | 13.62 | % | 13.29 | % |
Return After Taxes on Distributions | | 12.83 | | 12.60 | |
Return After Taxes on Distributions and Sale of Fund Shares | | 9.84 | | 11.48 | |
Returns at Public Offering Price (POP) (Class B) | | | | | |
| | One Year | | Life of Fund | |
Return Before Taxes | | 8.62 | % | 12.99 | % |
Return After Taxes on Distributions | | 7.83 | | 12.30 | |
Return After Taxes on Distributions and Sale of Fund Shares | | 6.59 | | 11.22 | |
Average Annual Total Returns | | | | | |
(For the periods ended October 31, 2007) | | | | | |
| | | | | |
Returns at Net Asset Value (NAV) (Class C) | | | | | |
| | One Year | | Life of Fund | |
Return Before Taxes | | 13.63 | % | 13.29 | % |
Return After Taxes on Distributions | | 12.83 | | 12.60 | |
Return After Taxes on Distributions and Sale of Fund Shares | | 9.84 | | 11.48 | |
Returns at Public Offering Price (POP) (ClassC) | | | | | |
| | One Year | | Life of Fund | |
Return Before Taxes | | 12.63 | % | 13.29 | % |
Return After Taxes on Distributions | | 11.83 | | 12.60 | |
Return After Taxes on Distributions and Sale of Fund Shares | | 9.19 | | 11.48 | |
Class A, Class B and Class C commenced investment operations on 5/30/03. Returns at Public Offering Price (POP) reflect the deduction of the maximum initial sales charge and applicable CDSC, while Returns at Net Asset Value (NAV) do not.
After-tax returns are calculated using certain assumptions. After-tax returns are calculated using the highest historical individual federal income tax rate and do not reflect the impact of state and local taxes. Actual after-tax returns depend on a shareholder’s tax situation and the actual characterization of distributions and may differ from those shown. After-tax returns are not relevant for shareholders who hold shares in tax-deferred accounts or to shares held by non-taxable entities. Return After Taxes on Distributions for a period may be the same as Return Before Taxes for the same period because no taxable distributions were paid during that period. Return After Taxes on Distributions and Sale of Fund Shares for a period may be greater than Return After Taxes on Distributions for the same period because of losses realized on the sale of Fund shares.
Past performance is no guarantee of future results. Returns are historical and are calculated by determining the percentage change in net asset value or offering price (as applicable) with all distributions reinvested. Investment return and principal value will fluctuate so that shares, when redeemed, may be worth more or less than their original cost. Performance is for the stated time period only; due to market volatility, the Fund’s current performance may be lower or higher than the quoted return. For performance as of the most recent month end, please refer to www.eatonvance.com.
4
Eaton Vance Tax-Managed Dividend Income Fund as of October 31, 2007
FUND EXPENSES
Example: As a shareholder of the Fund, you incur two types of costs: (1) transaction costs, including sales charges (loads) on purchases and redemption fees (if applicable); and (2) ongoing costs, including management fees; distribution or service fees; and other Fund expenses. This Example is intended to help you understand your ongoing costs (in dollars) of investing in the Fund and to compare these costs with the ongoing costs of investing in other mutual funds. The Example is based on an investment of $1,000 invested at the beginning of the period and held for the entire period (May 1, 2007 – October 31, 2007).
Actual Expenses: The first section of the table below provides information about actual account values and actual expenses. You may use the information in this section, together with the amount you invested, to estimate the expenses that you paid over the period. Simply divide your account value by $1,000 (for example, an $8,600 account value divided by $1,000 = 8.6), then multiply the result by the number in the first section under the heading entitled "Expenses Paid During Period" to estimate the expenses you paid on your account during this period.
Hypothetical Example for Comparison Purposes: The second section of the table below provides information about hypothetical account values and hypothetical expenses based on the actual Fund expense ratio and an assumed rate of return of 5% per year (before expenses), which is not the actual return of the Fund. The hypothetical account values and expenses may not be used to estimate the actual ending account balance or expenses you paid for the period. You may use this information to compare the ongoing costs of investing in your Fund and other funds. To do so, compare this 5% hypothetical example with the 5% hypothetical examples that appear in the shareholder reports of the other funds.
Please note that the expenses shown in the table are meant to highlight your ongoing costs only and do not reflect any transactional costs, such as sales charges (loads) or redemption fees (if applicable). Therefore, the second section of the table is useful in comparing ongoing costs only, and will not help you determine the relative total costs of owning different funds. In addition, if these transactional costs were included, your costs would have been higher.
Eaton Vance Tax-Managed Dividend Income Fund
| | | Beginning Account Value
(5/1/07) | | Ending Account Value
(10/31/07) | | Expenses Paid During Period
(5/1/07 – 10/31/07) | |
| Actual* | |
| Class A | | $ | 1,000.00 | | | $ | 1,029.00 | | | $ | 5.88 | | |
| Class B | | $ | 1,000.00 | | | $ | 1,025.20 | | | $ | 9.70 | | |
| Class C | | $ | 1,000.00 | | | $ | 1,025.30 | | | $ | 9.70 | | |
| Class I | | $ | 1,000.00 | | | $ | 1,040.40 | | | $ | 1.64 | | |
* Actual expenses are equal to the Fund's annualized expense ratio of 1.15% for Class A shares, 1.90% for class B shares, 1.90% for Class C shares, and 0.89% for Class I shares multiplied by the average account value over the period, multiplied by 184/365 for Class A, Class B and Class C (to reflect the one-half year period), and by 66/365 for Class I (to reflect the initial ssuance of shares on August 27, 2007 to October 31, 2007). The Example assumes that the $1,000 was invested at net asset value per share determined at the close of business on April 30, 2007 for Class A, Class B and Class C and on August 27, 2007 for Class I.
| Hypothetical** | |
| (5% return per year before expenses) | |
| Class A | | $ | 1,000.00 | | | $ | 1,019.40 | | | $ | 5.85 | | |
| Class B | | $ | 1,000.00 | | | $ | 1,015.60 | | | $ | 9.65 | | |
| Class C | | $ | 1,000.00 | | | $ | 1,015.60 | | | $ | 9.65 | | |
| Class I | | $ | 1,000.00 | | | $ | 1,020.70 | | | $ | 4.53 | | |
** Hypothetical expenses are equal to the Fund's annualized expenses ratio of 1.15% for Class A shares, 1.90% for Class B shares, 1.90% for Class C shares, and 0.89% for Class I shares multiplied by the average account value over the period, multiplied by 184/365 (to reflect the one-half year period). The Example assumes that the $1,000 was invested at asset value per share determined at the close of business on April 30, 2007.
5
Eaton Vance Tax-Managed Dividend Income Fund as of October 31, 2007
PORTFOLIO OF INVESTMENTS
| Common Stocks — 90.1% | |
| Security | | Shares | | Value | |
| Aerospace & Defense — 3.6% | |
| General Dynamics Corp. | | | 400,000 | | | $ | 36,384,000 | | |
| United Technologies Corp. | | | 500,000 | | | | 38,295,000 | | |
| | | $ | 74,679,000 | | |
| Commercial Banks — 5.1% | |
| TCF Financial Corp. | | | 600,000 | | | $ | 13,662,000 | | |
| Wachovia Corp. | | | 950,000 | | | | 43,443,500 | | |
| Wells Fargo & Co. | | | 1,500,000 | | | | 51,015,000 | | |
| | | $ | 108,120,500 | | |
| Communications Equipment — 1.9% | |
| Nokia Oyj ADR | | | 1,000,000 | | | $ | 39,720,000 | | |
| | | $ | 39,720,000 | | |
| Computer Peripherals — 2.5% | |
| International Business Machines Corp. | | | 450,000 | | | $ | 52,254,000 | | |
| | | $ | 52,254,000 | | |
| Containers & Packaging — 1.5% | |
| Temple-Inland, Inc. | | | 600,000 | | | $ | 32,202,000 | | |
| | | $ | 32,202,000 | | |
| Diversified Financial Services — 6.3% | |
| Bank of America Corp. | | | 850,000 | | | $ | 41,038,000 | | |
| Citigroup, Inc. | | | 1,050,000 | | | | 43,995,000 | | |
| JPMorgan Chase & Co. | | | 1,000,000 | | | | 47,000,000 | | |
| | | $ | 132,033,000 | | |
| Diversified Telecommunication Services — 5.1% | |
| AT&T, Inc. | | | 1,250,000 | | | $ | 52,237,500 | | |
| Verizon Communications Inc. | | | 1,200,000 | | | | 55,284,000 | | |
| | | $ | 107,521,500 | | |
| Electric Utilities — 6.5% | |
| E. ON AG(1) | | | 125,000 | | | $ | 24,407,247 | | |
| Edison International | | | 750,000 | | | | 43,567,500 | | |
| FirstEnergy Corp. | | | 600,000 | | | | 41,820,000 | | |
| Fortum Oyj(1) | | | 600,000 | | | | 26,057,774 | | |
| | | $ | 135,852,521 | | |
| Security | | Shares | | Value | |
| Energy Equipment & Services — 3.6% | |
| Diamond Offshore Drilling, Inc. | | | 375,000 | | | $ | 42,461,250 | | |
| GlobalSantaFe Corp.(1) | | | 400,000 | | | | 32,412,000 | | |
| | | $ | 74,873,250 | | |
| Food Products — 2.2% | |
| Nestle SA(1) | | | 100,000 | | | $ | 46,162,289 | | |
| | | $ | 46,162,289 | | |
| Hotels, Restaurants & Leisure — 1.7% | |
| McDonald's Corp. | | | 600,000 | | | $ | 35,820,000 | | |
| | | $ | 35,820,000 | | |
| Household Durables — 1.6% | |
| Stanley Works (The) | | | 600,000 | | | $ | 34,530,000 | | |
| | | $ | 34,530,000 | | |
| Household Products — 3.1% | |
| Kimberly-Clark Corp. | | | 750,000 | | | $ | 53,167,500 | | |
| Kimberly-Clark de Mexico S.A. de C.V.(1) | | | 3,000,000 | | | | 13,005,457 | | |
| | | $ | 66,172,957 | | |
| Industrial Conglomerates — 2.4% | |
| General Electric Co. | | | 1,250,000 | | | $ | 51,450,000 | | |
| | | $ | 51,450,000 | | |
| Insurance — 5.4% | |
| American International Group, Inc. | | | 500,000 | | | $ | 31,560,000 | | |
| Lincoln National Corp. | | | 600,000 | | | | 37,422,000 | | |
| St. Paul Travelers Cos., Inc. | | | 850,000 | | | | 44,378,500 | | |
| | | $ | 113,360,500 | | |
| Leisure Equipment & Products — 1.5% | |
| Mattel, Inc. | | | 1,500,000 | | | $ | 31,335,000 | | |
| | | $ | 31,335,000 | | |
| Machinery — 3.4% | |
| Illinois Tool Works, Inc. | | | 600,000 | | | $ | 34,356,000 | | |
| Paccar, Inc. | | | 650,000 | | | | 36,114,000 | | |
| | | $ | 70,470,000 | | |
See notes to financial statements
6
Eaton Vance Tax-Managed Dividend Income Fund as of October 31, 2007
PORTFOLIO OF INVESTMENTS CONT'D
| Security | | Shares | | Value | |
| Metals & Mining — 5.0% | |
| Freeport-McMoRan Copper & Gold, Inc. | | | 300,000 | | | $ | 35,304,000 | | |
| Southern Copper Corp. | | | 500,000 | | | | 69,850,000 | | |
| | | $ | 105,154,000 | | |
| Oil, Gas & Consumable Fuels — 11.5% | |
| ChevronTexaco Corp. | | | 500,000 | | | $ | 45,755,000 | | |
| ConocoPhillips | | | 625,000 | | | | 53,100,000 | | |
| Exxon Mobil Corp. | | | 525,000 | | | | 48,294,750 | | |
| Marathon Oil Corp. | | | 800,000 | | | | 47,304,000 | | |
| Total SA ADR | | | 600,000 | | | | 48,366,000 | | |
| | | $ | 242,819,750 | | |
| Pharmaceuticals — 6.9% | |
| Johnson & Johnson | | | 800,000 | | | $ | 52,136,000 | | |
| Pfizer, Inc. | | | 2,100,000 | | | | 51,681,000 | | |
| Wyeth | | | 850,000 | | | | 41,335,500 | | |
| | | $ | 145,152,500 | | |
| Real Estate Investment Trusts (REITs) — 1.7% | |
| Simon Property Group, Inc. | | | 350,000 | | | $ | 36,438,500 | | |
| | | $ | 36,438,500 | | |
| Road & Rail — 1.7% | |
| Canadian National Railway Co.(1) | | | 650,000 | | | $ | 36,393,500 | | |
| | | $ | 36,393,500 | | |
| Textiles, Apparel & Luxury Goods — 2.1% | |
| VF Corp. | | | 500,000 | | | $ | 43,565,000 | | |
| | | $ | 43,565,000 | | |
| Thrifts & Mortgage Finance — 1.4% | |
| Fannie Mae | | | 500,000 | | | $ | 28,520,000 | | |
| | | $ | 28,520,000 | | |
| Tobacco — 2.4% | |
| Altria Group, Inc. | | | 700,000 | | | $ | 51,051,000 | | |
| | | $ | 51,051,000 | | |
Total Common Stocks
(identified cost $1,572,642,927) | | | | | | $ | 1,895,650,767 | | |
| Preferred Stocks — 10.1% | |
| Security | | Shares | | Value | |
| Auto Components — 0.3% | |
| Porsche International Finance PLC, 7.20%(1)(2) | | | 55,000 | | | $ | 5,666,210 | | |
| | | $ | 5,666,210 | | |
| Capital Markets — 0.2% | |
| UBS Preferred Funding Trust I, 8.622%(2)(3) | | | 43,700 | | | $ | 4,777,105 | | |
| | | $ | 4,777,105 | | |
| Commercial Banks — 3.5% | |
| Abbey National Capital Trust I, 8.963%(2)(3) | | | 35,000 | | | $ | 4,388,510 | | |
| Auction Pass-Through Trust 2006-5B - USB H, 0.00%(3)(4) | | | 40 | | | | 1,013,500 | | |
| Auction Pass-Through Trust 2006-6B - USB H, 0.00%(3)(4) | | | 40 | | | | 1,013,500 | | |
| Deutsche Bank Capital Funding VIII, 6.375% | | | 115,000 | | | | 2,670,300 | | |
| Deutsche Bank Contingent Capital Trust II, 6.55% | | | 160,000 | | | | 3,832,000 | | |
| HBOS PLC, 6.657%(1)(2)(3)(4) | | | 113,500 | | | | 10,453,089 | | |
| HSBC Capital Funding LP, 10.176%(1)(2)(3)(4) | | | 32,500 | | | | 4,397,048 | | |
| HSBC Capital Funding LP, 9.547%(1)(2)(3)(4) | | | 40,000 | | | | 4,496,164 | | |
| Landsbanki Islands HF, 7.431%(2)(3)(4) | | | 135,000 | | | | 13,336,785 | | |
| Merrill Lynch & Co., Inc., 6.25% | | | 95,000 | | | | 2,280,000 | | |
| Merrill Lynch & Co., Inc., 6.70% | | | 162,350 | | | | 3,938,611 | | |
| Royal Bank of Scotland Group PLC, 4.53%(1)(2) | | | 100,000 | | | | 10,442,860 | | |
| Royal Bank of Scotland Group PLC, 9.118%(1)(2) | | | 8,000 | | | | 862,542 | | |
| Standard Chartered PLC, 6.409%(1)(2)(3)(4) | | | 22,500 | | | | 2,175,833 | | |
| Standard Chartered PLC, 7.014%(1)(2)(3)(4) | | | 74,500 | | | | 7,645,130 | | |
| | | $ | 72,945,872 | | |
| Diversified Financial Services — 0.8% | |
| Countrywide Financial Corp., 6.75% | | | 281,700 | | | $ | 5,014,260 | | |
| ING Group NV, 6.125%(1) | | | 242,000 | | | | 5,311,900 | | |
| IXE Banco SA, 9.75%(1)(2)(4) | | | 50,000 | | | | 5,288,755 | | |
Structured Auction Rate Securities/Stock
Custodial-Receipts Merrill H, 5.88%(3)(4) | | | 2,100 | | | | 1,407,750 | | |
| | | $ | 17,022,665 | | |
| Food Products — 0.1% | |
| Ocean Spray Cranberries, Inc., 6.25%(4) | | | 13,250 | | | $ | 1,184,633 | | |
| | | $ | 1,184,633 | | |
See notes to financial statements
7
Eaton Vance Tax-Managed Dividend Income Fund as of October 31, 2007
PORTFOLIO OF INVESTMENTS CONT'D
| Security | | Shares | | Value | |
| Insurance — 1.4% | |
| Aegon NV, 6.375%(1) | | | 46,000 | | | $ | 1,057,080 | | |
| Aegon NV, 6.50%(1) | | | 159,000 | | | | 3,671,310 | | |
| Arch Capital Group, Ltd., 7.875%(1) | | | 26,500 | | | | 654,815 | | |
| Arch Capital Group, Ltd., 8.00%(1) | | | 185,500 | | | | 4,637,500 | | |
| AXA SA, 6.463%(1)(2)(3)(4) | | | 50,000 | | | | 4,781,724 | | |
| Endurance Specialty Holdings, Ltd., 7.75%(1) | | | 181,550 | | | | 4,605,924 | | |
| ING Capital Funding Trust III, 8.439%(2)(3) | | | 37,500 | | | | 4,162,369 | | |
| PartnerRe, Ltd., 6.50%(1) | | | 52,000 | | | | 1,178,320 | | |
| PartnerRe, Ltd., 6.75%(1) | | | 139,700 | | | | 3,282,950 | | |
| RenaissanceRe Holdings, Ltd., 6.08%(1) | | | 82,000 | | | | 1,623,600 | | |
| | | $ | 29,655,592 | | |
| Investment Services — 2.3% | |
| Kinder Morgan GP, Inc., 8.33%(3)(4) | | | 4,000 | | | $ | 4,155,250 | | |
Preferred Pass-Through Trust 2006,
Series 07-A Mer, Class A, 6.689%(2)(4) | | | 375,000 | | | | 37,977,150 | | |
Preferred Pass-Through Trust 2006,
Series 07-A Mer, Class B, 11.24%(3)(4) | | | 300,000 | | | | 2,297,940 | | |
| RAM Holdings, Ltd. Preferred, 7.50%(1)(3) | | | 5,000 | | | | 4,723,700 | | |
| | | $ | 49,154,040 | | |
| Real Estate — 0.1% | |
| Duke Realty Corp., 6.95% | | | 120,000 | | | $ | 2,820,000 | | |
| | | $ | 2,820,000 | | |
| Real Estate Investment Trusts (REITs) — 0.6% | |
| AMB Property Corp., 6.75% | | | 79,900 | | | $ | 1,845,690 | | |
| BRE Properties, Series D, 6.75% | | | 40,000 | | | | 883,600 | | |
| Health Care Property, Inc., 7.10% | | | 150,000 | | | | 3,352,500 | | |
| Prologis Trust, 6.75% | | | 65,000 | | | | 1,502,800 | | |
| PS Business Parks, Inc., 6.70% | | | 50,000 | | | | 1,096,000 | | |
| PS Business Parks, Inc., 7.95% | | | 50,000 | | | | 1,257,500 | | |
| Vornado Realty Trust, 6.75% | | | 75,000 | | | | 1,655,250 | | |
| | | $ | 11,593,340 | | |
| Thrifts & Mortgage Finance — 0.8% | |
| Federal National Mortgage Association, 6.75% | | | 400,000 | | | $ | 10,050,000 | | |
| Indymac Bank FSB, 8.50%(4) | | | 475,000 | | | | 6,694,555 | | |
| | | $ | 16,744,555 | | |
Total Preferred Stocks
(identified cost $225,825,241) | | | | | | $ | 211,564,012 | | |
| Other Investments — 0.0% | |
| Description | | Shares | | Value | |
| Cairn Energy PLC, Class B, Deferred Shares(1)(2)(5) | | | 350,000 | | | $ | 0 | | |
| | | $ | 0 | | |
Total Other Investments
(identified cost $0) | | | | $ | 0 | | |
| Short-Term Investments — 0.6% | |
| Description | | Interest
(000's omitted) | | Value | |
| Investment in Cash Management Portfolio, 4.83%(6) | | $ | 13,307 | | | $ | 13,307,139 | | |
Total Short-Term Investments
(identified cost $13,307,139) | | | | $ | 13,307,139 | | |
Total Investments — 100.8%
(identified cost $1,811,775,307) | | | | $ | 2,120,521,918 | | |
| Other Assets, Less Liabilities — (0.8)% | | | | $ | (17,613,552 | ) | |
| Net Assets — 100.0% | | | | $ | 2,102,908,366 | | |
ADR - American Depository Receipt
(1) Foreign security.
(2) Security valued at fair value using methods determined in good faith by or at the direction of the Trustees.
(3) Variable rate security. The stated interest rate represents the rate in effect at October 31, 2007.
(4) Security exempt from registration under Rule 144A of the Securities Act of 1933. These securities may be sold in transactions exempt from registration, normally to qualified institutional buyers. At October 31, 2007, the aggregate value of the securities is $108,318,806 or 5.2% of the net assets.
(5) Non-income producing security.
(6) Affiliated investment company available to Eaton Vance portfolios and funds which invests in high quality U.S. dollar denominated money market instruments. The rate shown is the annualized seven-day yield as of October 31, 2007.
See notes to financial statements
8
Eaton Vance Tax-Managed Dividend Income Fund as of October 31, 2007
PORTFOLIO OF INVESTMENTS CONT'D
| Country Concentration of Portfolio | |
| Country | | Percentage
of Net Assets | | Value | |
| United States | | | 87.6 | % | | $ | 1,841,790,411 | | |
| Switzerland | | | 2.2 | | | | 46,162,289 | | |
| United Kingdom | | | 1.9 | | | | 40,472,667 | | |
| Canada | | | 1.7 | | | | 36,393,500 | | |
| Cayman Islands | | | 1.5 | | | | 32,412,000 | | |
| Finland | | | 1.2 | | | | 26,057,774 | | |
| Germany | | | 1.2 | | | | 24,407,247 | | |
| Bermuda | | | 1.0 | | | | 20,706,809 | | |
| Mexico | | | 0.9 | | | | 18,294,211 | | |
| Iceland | | | 0.6 | | | | 13,336,785 | | |
| Netherlands | | | 0.5 | | | | 10,040,290 | | |
| Ireland | | | 0.3 | | | | 5,666,210 | | |
| France | | | 0.2 | | | | 4,781,725 | | |
| | | | 100.8 | % | | $ | 2,120,521,918 | | |
See notes to financial statements
9
Eaton Vance Tax-Managed Dividend Income Fund as of October 31, 2007
FINANCIAL STATEMENTS
Statement of Assets and Liabilities
As of October 31, 2007
| Assets | |
| Unaffiliated investments, at value (identified cost, $1,798,468,168) | | $ | 2,107,214,779 | | |
| Affiliated investments, at value (identified cost, $13,307,139) | | | 13,307,139 | | |
| Receivable for investments sold | | | 41,221,302 | | |
| Receivable for Fund shares sold | | | 8,319,215 | | |
| Dividends receivable | | | 5,060,866 | | |
| Interest receivable from affiliated investment | | | 80,922 | | |
| Tax reclaims receivable | | | 1,035,478 | | |
| Total assets | | $ | 2,176,239,701 | | |
| Liabilities | |
| Payable for investments purchased | | $ | 66,428,289 | | |
| Payable for Fund shares redeemed | | | 3,942,141 | | |
| Payable to affiliate for investment advisory fee | | | 1,088,495 | | |
| Payable to affiliate for distribution and service fees | | | 1,052,570 | | |
| Payable to affiliate for administration fee | | | 266,223 | | |
| Payable to affiliate for Trustees' fees | | | 2,702 | | |
| Other accrued expenses | | | 550,915 | | |
| Total liabilities | | $ | 73,331,335 | | |
| Net assets | | $ | 2,102,908,366 | | |
| Sources of Net Assets | |
| Paid-in capital | | $ | 1,831,722,885 | | |
| Accumulated net realized loss (computed on the basis of identified cost) | | | (48,870,564 | ) | |
| Accumulated undistributed net investment income | | | 11,250,564 | | |
| Net unrealized appreciation (computed on the basis of identified cost) | | | 308,805,481 | | |
| Total | | $ | 2,102,908,366 | | |
| Class A Shares | |
| Net Assets | | $ | 1,141,383,372 | | |
| Shares Outstanding | | | 78,582,488 | | |
Net Asset Value and Redemption Price Per Share
(net assets ÷ shares of beneficial interest outstanding) | | $ | 14.52 | | |
Maximum Offering Price Per Share
(100 ÷ 94.25 of $14.52) | | $ | 15.41 | | |
| Class B Shares | |
| Net Assets | | $ | 181,741,041 | | |
| Shares Outstanding | | | 12,538,638 | | |
Net Asset Value and Offering Price Per Share*
(net assets ÷ shares of beneficial interest outstanding) | | $ | 14.49 | | |
| Class C Shares | |
| Net Assets | | $ | 779,330,490 | | |
| Shares Outstanding | | | 53,757,615 | | |
Net Asset Value and Offering Price Per Share*
(net assets ÷ shares of beneficial interest outstanding) | | $ | 14.50 | | |
| Class I Shares | |
| Net Assets | | $ | 453,463 | | |
| Shares Outstanding | | | 31,219 | | |
Net Asset Value, Offering Price and Redemption Price Per Share
(net assets ÷ shares of beneficial interest outstanding) | | $ | 14.53 | | |
On sales of $50,000 or more, the offering price of Class A shares is reduced.
* Redemption price per share is equal to the net asset value less any applicable contingent deferred sales charge.
Statement of Operations
For the Year Ended
October 31, 2007
| Investment Income | |
| Dividends (net of foreign taxes, $4,755,523) | | $ | 118,447,111 | | |
| Interest income allocated from affiliated investments | | | 1,504,297 | | |
| Interest | | | 39,292 | | |
| Miscellaneous | | | 8,755 | | |
| Expenses allocated from affliated investments | | | (141,778 | ) | |
| Total investment income | | $ | 119,857,677 | | |
| Expenses | |
| Investment adviser fee | | $ | 10,696,994 | | |
| Administration fee | | | 2,614,771 | | |
| Trustees' fees and expenses | | | 30,614 | | |
Distribution and service fees
Class A | | | 2,314,434 | | |
| Class B | | | 1,678,616 | | |
| Class C | | | 6,494,999 | | |
| Transfer and dividend disbursing agent fees | | | 1,013,566 | | |
| Custodian fee | | | 579,523 | | |
| Registration fees | | | 160,262 | | |
| Printing and postage | | | 156,344 | | |
| Legal and accounting services | | | 118,506 | | |
| Miscellaneous | | | 80,670 | | |
| Total expenses | | $ | 25,939,299 | | |
Deduct —
Reduction of custodian fee | | $ | 9,753 | | |
| Total expense reductions | | $ | 9,753 | | |
| Net expenses | | $ | 25,929,546 | | |
| Net investment income | | $ | 93,928,131 | | |
| Realized and Unrealized Gain (Loss) | |
Net realized gain (loss) —
Investment transactions (identified cost basis) | | $ | (10,707,097 | ) | |
| Foreign currency transactions | | | (107,507 | ) | |
| Net realized loss | | $ | (10,814,604 | ) | |
Change in unrealized appreciation (depreciation) —
Investments (identified cost basis) | | $ | 133,332,357 | | |
| Foreign currency | | | 43,598 | | |
| Net change in unrealized appreciation (depreciation) | | $ | 133,375,955 | | |
| Net realized and unrealized gain | | $ | 122,561,351 | | |
| Net increase in net assets from operations | | $ | 216,489,482 | | |
See notes to financial statements
10
Eaton Vance Tax-Managed Dividend Income Fund as of October 31, 2007
FINANCIAL STATEMENTS CONT'D
Statements of Changes in Net Assets
| Increase (Decrease) in Net Assets | | Year Ended
October 31, 2007 | | Period Ended
October 31, 2006(1) | | Year Ended
April 30, 2006 | |
From operations —
Net investment income | | $ | 93,928,131 | | | $ | 17,674,162 | | | $ | 47,422,646 | | |
| Net realized loss from investment transactions and foreign currency | | | (10,814,604 | ) | | | (32,159,711 | ) | | | (6,295,359 | ) | |
| Net change in unrealized appreciation (depreciation) of investments and foreign currency | | | 133,375,955 | | | | 85,149,432 | | | | 60,991,865 | | |
| Net increase in net assets from operations | | $ | 216,489,482 | | | $ | 70,663,883 | | | $ | 102,119,152 | | |
Distributions to shareholders —
From net investment income
Class A | | $ | (50,655,751 | ) | | $ | (14,892,374 | ) | | $ | (16,854,194 | ) | |
| Class B | | | (7,862,281 | ) | | | (3,116,092 | ) | | | (4,458,473 | ) | |
| Class C | | | (30,524,646 | ) | | | (9,831,898 | ) | | | (11,849,664 | ) | |
| Class I | | | (3,118 | ) | | | — | | | | — | | |
| Total distributions to shareholders | | $ | (89,045,796 | ) | | $ | (27,840,364 | ) | | $ | (33,162,331 | ) | |
Transactions in shares of beneficial interest —
Proceeds from sale of shares
Class A | | $ | 516,071,451 | | | $ | 211,021,600 | | | $ | 251,392,106 | | |
| Class B | | | 45,311,998 | | | | 26,571,508 | | | | 42,104,047 | | |
| Class C | | | 289,421,744 | | | | 139,299,888 | | | | 162,588,198 | | |
| Class I | | | 451,000 | | | | — | | | | — | | |
Net asset value of shares issued to shareholders in payment of distributions declared
Class A | | | 34,879,017 | | | | 9,886,452 | | | | 11,286,235 | | |
| Class B | | | 4,910,874 | | | | 1,971,057 | | | | 2,821,775 | | |
| Class C | | | 16,632,343 | | | | 5,144,929 | | | | 6,109,408 | | |
| Class I | | | 1,545 | | | | — | | | | — | | |
Cost of shares redeemed
Class A | | | (142,102,164 | ) | | | (37,791,536 | ) | | | (60,580,545 | ) | |
| Class B | | | (19,341,240 | ) | | | (7,675,616 | ) | | | (12,211,050 | ) | |
| Class C | | | (64,509,162 | ) | | | (21,329,327 | ) | | | (29,585,505 | ) | |
Net asset value of shares exchanged
Class A | | | 5,875,976 | | | | 1,952,983 | | | | 2,017,596 | | |
| Class B | | | (5,875,976 | ) | | | (1,952,983 | ) | | | (2,017,596 | ) | |
| Net increase in net assets from Fund share transactions | | $ | 681,727,406 | | | $ | 327,098,955 | | | $ | 373,924,669 | | |
| Net increase in net assets | | $ | 809,171,092 | | | $ | 369,922,474 | | | $ | 442,881,490 | | |
| Net Assets | |
| At beginning of year | | $ | 1,293,737,274 | | | $ | 923,814,800 | | | $ | 480,933,310 | | |
| At end of year | | $ | 2,102,908,366 | | | $ | 1,293,737,274 | | | $ | 923,814,800 | | |
Accumulated undistributed net investment
income included in net assets | |
| At end of year | | $ | 11,250,564 | | | $ | 7,267,903 | | | $ | 17,520,182 | | |
(1) For the six months ended October 31, 2006.
See notes to financial statements
11
Eaton Vance Tax-Managed Dividend Income Fund as of October 31, 2007
FINANCIAL STATEMENTS CONT'D
Financial Highlights
| | | Class A | |
| | | Year Ended | | Period Ended | | Year Ended April 30, | | Period Ended | |
| | | October 31, 2007 | | October 31, 2006(1) | | 2006 | | 2005 | | April 30, 2004(2) | |
| Net asset value — Beginning of year | | $ | 13.400 | | | $ | 12.990 | | | $ | 11.820 | | | $ | 10.640 | | | $ | 10.000 | | |
| Income (loss) from operations | |
| Net investment income(3) | | $ | 0.810 | | | $ | 0.239 | | | $ | 0.922 | | | $ | 0.743 | | | $ | 0.500 | | |
| Net realized and unrealized gain | | | 1.080 | | | | 0.534 | | | | 0.889 | | | | 0.989 | | | | 0.437 | | |
| Total income from operations | | $ | 1.890 | | | $ | 0.773 | | | $ | 1.811 | | | $ | 1.732 | | | $ | 0.937 | | |
| Less distributions | |
| From net investment income | | $ | (0.770 | ) | | $ | (0.363 | ) | | $ | (0.641 | ) | | $ | (0.552 | ) | | $ | (0.297 | ) | |
| Total distributions | | $ | (0.770 | ) | | $ | (0.363 | ) | | $ | (0.641 | ) | | $ | (0.552 | ) | | $ | (0.297 | ) | |
| Net asset value — End of year | | $ | 14.520 | | | $ | 13.400 | | | $ | 12.990 | | | $ | 11.820 | | | $ | 10.640 | | |
| Total Return(4) | | | 14.47 | % | | | 6.14 | %(7) | | | 15.78 | % | | | 16.54 | % | | | 9.44 | %(7) | |
| Ratios/Supplemental Data | |
| Net assets, end of year (000's omitted) | | $ | 1,141,383 | | | $ | 659,950 | | | $ | 452,785 | | | $ | 215,759 | | | $ | 104,169 | | |
| Ratios (As a percentage of average daily net assets): | |
| Expenses before custodian fee reduction(5) | | | 1.14 | % | | | 1.19 | %(6) | | | 1.21 | % | | | 1.25 | % | | | 1.40 | %(6) | |
| Expenses after custodian fee reduction(5) | | | 1.14 | % | | | 1.19 | %(6) | | | 1.21 | % | | | 1.25 | % | | | 1.40 | %(6) | |
| Net investment income | | | 5.72 | % | | | 3.69 | %(6) | | | 7.49 | % | | | 6.46 | % | | | 5.05 | %(6) | |
| Portfolio Turnover | | | 139 | % | | | 46 | % | | | 247 | % | | | 162 | % | | | 117 | % | |
(1) For the six month period ended October 31, 2006. During the period ended October 31, 2006, the Fund changed its fiscal year end from April 30 to October 31.
(2) For the period from the start of business, May 30, 2003, to April 30, 2004.
(3) Net investment income per share was computed using average shares outstanding.
(4) Returns are historical and are calculated by determining the percentage change in net asset value with all distributions reinvested.
(5) The investment adviser waived a portion of its advisory fee and/or the administrator subsized certain operating expenses (equal to 0.01%, 0.01% and 0.07% of average daily net assets for the fiscal years ended April 30, 2006, 2005 and 2004, respectively).
(6) Annualized.
(7) Not annualized.
See notes to financial statements
12
Eaton Vance Tax-Managed Dividend Income Fund as of October 31, 2007
FINANCIAL STATEMENTS CONT'D
Financial Highlights
| | | Class B | |
| | | Year Ended | | Period Ended | | Year Ended April 30, | | Period Ended | |
| | | October 31, 2007 | | October 31, 2006(1) | | 2006 | | 2005 | | April 30, 2004(2) | |
| Net asset value — Beginning of year | | $ | 13.370 | | | $ | 12.960 | | | $ | 11.790 | | | $ | 10.630 | | | $ | 10.000 | | |
| Income (loss) from operations | |
| Net investment income(3) | | $ | 0.716 | | | $ | 0.200 | | | $ | 0.801 | | | $ | 0.648 | | | $ | 0.427 | | |
| Net realized and unrealized gain | | | 1.064 | | | | 0.526 | | | | 0.919 | | | | 0.986 | | | | 0.446 | | |
| Total income from operations | | $ | 1.780 | | | $ | 0.726 | | | $ | 1.720 | | | $ | 1.634 | | | $ | 0.873 | | |
| Less distributions | |
| From net investment income | | $ | (0.660 | ) | | $ | (0.316 | ) | | $ | (0.550 | ) | | $ | (0.474 | ) | | $ | (0.243 | ) | |
| Total distributions | | $ | (0.660 | ) | | $ | (0.316 | ) | | $ | (0.550 | ) | | $ | (0.474 | ) | | $ | (0.243 | ) | |
| Net asset value — End of year | | $ | 14.490 | | | $ | 13.370 | | | $ | 12.960 | | | $ | 11.790 | | | $ | 10.630 | | |
| Total Return(4) | | | 13.62 | % | | | 5.76 | %(7) | | | 14.97 | % | | | 15.57 | % | | | 8.79 | %(7) | |
| Ratios/Supplemental Data | |
| Net assets, end of year (000's omitted) | | $ | 181,741 | | | $ | 143,731 | | | $ | 120,272 | | | $ | 79,871 | | | $ | 40,731 | | |
| Ratios (As a percentage of average daily net assets): | |
| Expenses before custodian fee reduction(5) | | | 1.89 | % | | | 1.94 | %(6) | | | 1.96 | % | | | 2.00 | % | | | 2.15 | %(6) | |
| Expenses after custodian fee reduction(5) | | | 1.89 | % | | | 1.94 | %(6) | | | 1.96 | % | | | 2.00 | % | | | 2.15 | %(6) | |
| Net investment income | | | 5.08 | % | | | 3.11 | %(6) | | | 6.53 | % | | | 5.65 | % | | | 4.31 | %(6) | |
| Portfolio Turnover | | | 139 | % | | | 46 | % | | | 247 | % | | | 162 | % | | | 117 | % | |
(1) For the six month period ended October 31, 2006. During the period ended October 31, 2006, the Fund changed its fiscal year end from April 30 to October 31.
(2) For the period from the start of business, May 30, 2003, to April 30, 2004.
(3) Net investment income per share was computed using average shares outstanding.
(4) Returns are historical and are calculated by determining the percentage change in net asset value with all distributions reinvested.
(5) The investment adviser waived a portion of its advisory fee and/or the administrator subsized certain operating expenses (equal to 0.01%, 0.01% and 0.07% of average daily net assets for the fiscal years ended April 30, 2006, 2005 and 2004, respectively).
(6) Annualized.
(7) Not annualized.
See notes to financial statements
13
Eaton Vance Tax-Managed Dividend Income Fund as of October 31, 2007
FINANCIAL STATEMENTS CONT'D
Financial Highlights
| | | Class C | |
| | | Year Ended | | Period Ended | | Year Ended April 30, | | Period Ended | |
| | | October 31, 2007 | | October 31, 2006(1) | | 2006 | | 2005 | | April 30, 2004(2) | |
| Net asset value — Beginning of year | | $ | 13.370 | | | $ | 12.960 | | | $ | 11.800 | | | $ | 10.630 | | | $ | 10.000 | | |
| Income (loss) from operations | |
| Net investment income(3) | | $ | 0.704 | | | $ | 0.192 | | | $ | 0.817 | | | $ | 0.653 | | | $ | 0.432 | | |
| Net realized and unrealized gain | | | 1.086 | | | | 0.534 | | | | 0.893 | | | | 0.991 | | | | 0.441 | | |
| Total income from operations | | $ | 1.790 | | | $ | 0.726 | | | $ | 1.710 | | | $ | 1.644 | | | $ | 0.873 | | |
| Less distributions | |
| From net investment income | | $ | (0.660 | ) | | $ | (0.316 | ) | | $ | (0.550 | ) | | $ | (0.474 | ) | | $ | (0.243 | ) | |
| Total distributions | | $ | (0.660 | ) | | $ | (0.316 | ) | | $ | (0.550 | ) | | $ | (0.474 | ) | | $ | (0.243 | ) | |
| Net asset value — End of year | | $ | 14.500 | | | $ | 13.370 | | | $ | 12.960 | | | $ | 11.800 | | | $ | 10.630 | | |
| Total Return(4) | | | 13.63 | % | | | 5.76 | %(7) | | | 14.87 | % | | | 15.66 | % | | | 8.79 | %(7) | |
| Ratios/Supplemental Data | |
| Net assets, end of year (000's omitted) | | $ | 779,330 | | | $ | 490,056 | | | $ | 350,758 | | | $ | 185,303 | | | $ | 92,329 | | |
| Ratios (As a percentage of average daily net assets): | |
| Expenses before custodian fee reduction(5) | | | 1.89 | % | | | 1.94 | %(6) | | | 1.96 | % | | | 2.00 | % | | | 2.15 | %(6) | |
| Expenses after custodian fee reduction(5) | | | 1.89 | % | | | 1.94 | %(6) | | | 1.96 | % | | | 2.00 | % | | | 2.15 | %(6) | |
| Net investment income | | | 4.98 | % | | | 2.98 | %(6) | | | 6.65 | % | | | 5.69 | % | | | 4.34 | %(6) | |
| Portfolio Turnover | | | 139 | % | | | 46 | % | | | 247 | % | | | 162 | % | | | 117 | % | |
(1) For the six month period ended October 31, 2006. During the period ended October 31, 2006, the Fund changed its fiscal year end from April 30 to October 31.
(2) For the period from the start of business, May 30, 2003, to April 30, 2004.
(3) Net investment income per share was computed using average shares outstanding.
(4) Returns are historical and are calculated by determining the percentage change in net asset value with all distributions reinvested.
(5) The investment adviser waived a portion of its advisory fee and/or the administrator subsized certain operating expenses (equal to 0.01%, 0.01% and 0.07% of average daily net assets for the fiscal years ended April 30, 2006, 2005 and 2004, respectively).
(6) Annualized.
(7) Not annualized.
See notes to financial statements
14
Eaton Vance Tax-Managed Dividend Income Fund as of October 31, 2007
FINANCIAL STATEMENTS CONT'D
Financial Highlights
| | | Class I | |
| | | Period Ended
October 31, 2007(1) | |
| Net asset value — Beginning of period | | $ | 14.10 | | |
| Income (loss) from operations | |
| Net investment income(2) | | $ | 0.054 | | |
| Net realized and unrealized gain | | | 0.514 | | |
| Total income from operations | | $ | 0.568 | | |
| Less distributions | |
| From net investment income | | $ | (0.138 | ) | |
| Total distributions | | $ | (0.138 | ) | |
| Net asset value — End of period | | $ | 14.530 | | |
| Total Return(3) | | | 4.04 | %(4) | |
| Ratios/Supplemental Data | |
| Net assets, end of period (000's omitted) | | $ | 453 | | |
| Ratios (As a percentage of average daily net assets): | |
| Expenses before custodian fee reduction | | | 0.89 | %(5) | |
| Expenses after custodian fee reduction | | | 0.89 | %(5) | |
| Net investment income | | | 2.06 | %(5) | |
| Portfolio Turnover | | | 139 | % | |
(1) For the period from the initial issuance, August 27, 2007, to October 31, 2007.
(2) Net investment income per share was computed using average shares outstanding.
(3) Returns are historical and are calculated by determining the percentage change in net asset value with all distributions reinvested.
(4) Not annualized.
(5) Annualized.
See notes to financial statements
15
Eaton Vance Tax-Managed Dividend Income Fund as of October 31, 2007
NOTES TO FINANCIAL STATEMENTS
1 Significant Accounting Policies
Eaton Vance Tax-Managed Dividend Income Fund (the Fund) is a diversified series of Eaton Vance Mutual Funds Trust (the Trust). The Trust is a Massachusetts business trust registered under the Investment Company Act of 1940, as amended (the 1940 Act), as an open-end management investment company. The Fund seeks to achieve after-tax total return by investing primarily in a diversified portfolio of common and preferred stocks that pay dividends that qualify for federal income taxation at long–term capital gains rates ("tax-favored dividends"). The Fund offers four classes of shares. Class A shares are generally sold subject to a sales charge imposed at time of purchase. Class B and Class C shares are sold at net asset value and are subject to a contingent deferred sales charge (see Note 6). Class B shares held for eight years will automatically convert to Class A shares. Class I shares, which were initially issued on August 27 , 2007, are offered at net asset value and are not subject to a sales charge. Each class represents a pro-rata interest in the Fund, but votes separately on class-specific matters and (as noted below) is subject to different expenses. Realized and unrealized gains and losses and net investment income and losses, other than class-specific expenses, are allocated daily to each class of shares based on the relative net assets of each class to the total net assets of the Fund. Each class of shares differs in its distribution plan and certain other class-specific expenses.
The following is a summary of significant accounting policies of the Fund. The policies are in conformity with accounting principles generally accepted in the United States of America.
A Investment Valuation — Securities listed on a U.S. securities exchange generally are valued at the last sale price on the day of valuation or, if no sales took place on such date, at the mean between the closing bid and asked prices therefore on the exchange where such securities are principally traded. Equity securities listed on the NASDAQ Global or Global Select Market generally are valued at the official NASDAQ closing price. Unlisted or listed securities for which closing sales prices or closing quotations are not available are valued at the mean between the latest available bid and asked prices or, in the case of preferred equity securities that are not listed or traded in the over-the-counter market, by an independent pricing service. The value of preferred equit y securities that are valued by a pricing service on a bond basis will be adjusted by an income factor, to be determined by the investment adviser, to reflect the next anticipated regular dividend. Exchange-traded options are valued at the last sale price for the day of valuation as quoted on the principal exchange or board of trade on which the options are traded or, in the absence of sales on such date, at the mean between the latest bid and asked prices therefore. Futures positions on securities and currencies generally are valued at closing settlement prices. Short-term debt securities with a remaining maturity of 60 days or less are valued at amortized cost, which approximates market value. If short-term debt securities are acquired with a remaining maturity of more than 60 days, they will be valued by a pricing service. Other fixed income and debt securities, including listed securities and securities for which price quotations are available, will normally be valued on the basis of valuations furnished by a pricing service. Foreign securities and currencies are valued in U.S. dollars, based on foreign currency exchange rate quotations supplied by an independent quotation service. The daily valuation of exchange traded foreign securities generally is determined as of the close of trading on the principal exchange on which such securities trade. Events occurring after the close of trading on foreign exchanges may result in adjustments to the valuation of foreign securities to more accurately reflect their fair value as of the close of regular trading on the New York Stock Exchange. When valuing foreign equity securities that meet certain criteria, the Trustees have approved the use of a fair value service that values such securities to reflect market trading that occurs after the close of the applicable foreign markets of comparable securities or other instruments that have a strong correlation to the fair valued securities. Investments held by the Fund for which valuations or market quotations are unavailable are valued at fair value using methods determined in good faith by or at the direction of the Trustees of the Fund considering relevant factors, data and information including the market value of freely tradable securities of the same class in the principal market on which such securities are normally traded.
The Fund may invest in Cash Management Portfolio (Cash Management), an affiliated investment company managed by Boston Management and Research (BMR), a subsidiary of Eaton Vance Management (EVM). Cash Management values its investment securities utilizing the amortized cost valuation technique permitted by Rule 2a-7 of the 1940 Act. This technique involves initially valuing a portfolio security at its cost and thereafter assuming a constant amortization to maturity of any discount or premium.
16
Eaton Vance Tax-Managed Dividend Income Fund as of October 31, 2007
NOTES TO FINANCIAL STATEMENTS CONT'D
B Income — Dividend income is recorded on the ex-dividend date for dividends received in cash and/or securities. However, if the ex-dividend date has passed, certain dividends from foreign securities are recorded as the Fund is informed of the ex-dividend date. Withholding taxes on foreign dividends and capital gains have been provided for in accordance with the Fund's understanding of the applicable countries' tax rules and rates. Interest income is recorded on the basis of interest accrued, adjusted for amortization of premium or accretion of discount.
C Expenses — The majority of expenses of the Trust are directly identifiable to an individual fund. Expenses which are not readily identifiable to a specific fund are allocated taking into consideration, among other things, the nature and type of expense and the relative size of the funds.
D Federal Taxes — The Fund's policy is to comply with the provisions of the Internal Revenue Code applicable to regulated investment companies and to distribute to shareholders each year substantially all of its net investment income, and all or substantially all of its net realized capital gains. Accordingly, no provision for federal income or excise tax is necessary. At October 31, 2007, the Fund, for federal income tax purposes, had a capital loss carryforward of $44,918,600, which will reduce the Fund's taxable income arising from future net realized gain on investments, if any, to the extent permitted by the Internal Revenue Code, and thus will reduce the amount of distributions to shareholders which would otherwise be necessary to relieve the Fund of any liability for federal income or excise tax. Such capital loss carryforward will expire on: October 31, 2011 ($252,492), October 31, 2012 ($2,039,433), October 31, 2013 ($4,586,180), October 31, 2014 ($31,957,656), and October 31, 2015 ($6,082,839).
E Expense Reduction — State Street Bank and Trust Company (SSBT) serves as custodian of the Fund. Pursuant to the custodian agreement, SSBT receives a fee reduced by credits, which are determined based on the average daily cash balance the Fund maintains with SSBT. All credit balances, if any, used to reduce the Fund's custodian fees are reported as a reduction of expenses in the Statement of Operations.
F Foreign Currency Translation — Investment valuations, other assets, and liabilities initially expressed in foreign currencies are converted each business day into U.S. dollars based upon current exchange rates. Purchases and sales of foreign investment securities and income and expenses are converted into U.S. dollars based upon currency exchange rates prevailing on the respective dates of such transactions. Recognized gains or losses on investment transactions attributable to changes in foreign currency exchange rates are recorded for financial statement purposes as net realized gains and losses on investments. That portion of unrealized gains and losses on investments that results from fluctuation s in foreign currency exchange rates is not separately disclosed.
G Use of Estimates — The preparation of the financial statements in conformity with accounting principles generally accepted in the United States of America requires management to make estimates and assumptions that affect the reported amounts of assets and liabilities at the date of the financial statements and the reported amounts of income and expense during the reporting period. Actual results could differ from those estimates.
H Indemnifications — Under the Trust's organizational documents, its officers and Trustees may be indemnified against certain liabilities and expenses arising out of the performance of their duties to the Fund, and shareholders are indemnified against personal liability for obligations of the Trust. Additionally, in the normal course of business, the Fund enters into agreements with service providers that may contain indemnification clauses. The Fund's maximum exposure under these arrangements is unknown as this would involve future claims that may be made against the Fund that have not yet occurred.
I Investment Transactions — Investment transactions for financial statement purposes are accounted for on a trade date basis. Dividends to shareholders are recorded on the ex-dividend date. Realized gains and losses on securities sold are determined on the basis of identified cost.
2 Distribution to Shareholders
It is the present policy of the Fund to make monthly dividend distributions to shareholders and at least one distribution annually of all or substantially all of its net realized capital gains, if any (reduced by available capital loss carryforwards from prior years, if any). Distributions are declared separately for each class of shares. Distributions are paid in the form of additional shares of the same class of the Fund or, at the election of the shareholder, in cash. Shareholders may reinvest all distributions in additional shares of the same class of the Fund at the net asset value as of the close of business on the ex-dividend date. The Fund distinguishes between
17
Eaton Vance Tax-Managed Dividend Income Fund as of October 31, 2007
NOTES TO FINANCIAL STATEMENTS CONT'D
distributions on a tax basis and a financial reporting basis. Accounting principles generally accepted in the United States of America require that only distributions in excess of tax basis earnings and profits be reported in the financial statements as a return of capital. Permanent differences between book and tax accounting relating to distributions are reclassified to paid-in capital.
The tax character of distributions paid was as follows:
| | | Year Ended
October 31,2007 | | Period Ended
October 31, 2006(1) | | Year Ended
April 30, 2006 | |
| Distributions declared from: | |
| Ordinary income | | $ | 89,045,796 | | | $ | 27,840,364 | | | $ | 33,162,331 | | |
(1) For the period from May 1, 2006 to October 31, 2006.
During the year ended October 31, 2007, the following amounts were reclassified due to differences between book and tax accounting, primarily for foreign currency gains and losses and certain dividends received from Real Estate Investment Trusts (REITs):
| Increase (decrease): | | | | | |
| Accumulated net realized loss | | $ | 899,674 | | |
| Accumulated undistributed net investment income | | $ | (899,674 | ) | |
These reclassifications had no effect on the net assets or net asset value per share of the Fund.
As of October 31, 2007, the components of distributable earnings (accumulated losses) and unrealized appreciation (depreciation) on a tax basis were as follows:
| Undistributed ordinary income | | $ | 11,217,558 | | |
| Capital loss carryforwards | | $ | (44,918,600 | ) | |
| Unrealized appreciation (depreciation) | | $ | 304,886,523 | | |
The differences between components of distributable earnings (accumulated losses) on a tax basis and the amounts reflected in the Statement of Assets and Liabilities are primarily due to wash sales and certain dividends received from the Fund's investment in REITs.
3 Shares of Beneficial Interest
The Fund's Declaration of Trust permits the Trustees to issue an unlimited number of full and fractional shares of beneficial interest (without par value). Such shares may be issued in a number of different series (such as the Fund) and classes. Transactions in Fund shares were as follows:
| Class A | | Year Ended
October 31,
2007 | | Period Ended
October 31,
2006(1) | | Year Ended
April 30,
2006 | |
| Sales | | | 36,503,881 | | | | 16,412,434 | | | | 20,439,240 | | |
Issued to shareholders electing
to receive payments of
distributions in Fund shares | | | 2,453,960 | | | | 776,077 | | | | 918,038 | | |
| Redemptions | | | (10,041,320 | ) | | | (2,959,859 | ) | | | (4,913,417 | ) | |
| Exchanges from Class B shares | | | 415,268 | | | | 154,366 | | | | 163,619 | | |
| Net increase | | | 29,331,789 | | | | 14,383,018 | | | | 16,607,480 | | |
| Class B | | Year Ended
October 31,
2007 | | Period Ended
October 31,
2006(1) | | Year Ended
April 30,
2006 | |
| Sales | | | 3,227,137 | | | | 2,071,311 | | | | 3,436,193 | | |
Issued to shareholders electing
to receive payments of
distributions in Fund shares | | | 346,877 | | | | 155,293 | | | | 230,280 | | |
| Redemptions | | | (1,369,909 | ) | | | (602,906 | ) | | | (993,777 | ) | |
| Exchanges to Class A shares | | | (416,181 | ) | | | (154,674 | ) | | | (163,946 | ) | |
| Net increase | | | 1,787,924 | | | | 1,469,024 | | | | 2,508,750 | | |
| Class C | | Year Ended
October 31,
2007 | | Period Ended
October 31,
2006(1) | | Year Ended
April 30,
2006 | |
| Sales | | | 20,514,400 | | | | 10,852,246 | | | | 13,261,839 | | |
Issued to shareholders electing
to receive payments of
distributions in Fund shares | | | 1,172,364 | | | | 404,714 | | | | 497,886 | | |
| Redemptions | | | (4,576,769 | ) | | | (1,671,681 | ) | | | (2,407,104 | ) | |
| Net increase | | | 17,109,995 | | | | 9,585,279 | | | | 11,352,621 | | |
| Class I | | Period Ended
October 31, 2007(2) | |
| Sales | | | 31,110 | | |
Issued to shareholders electing to receive payments
of distributions in Fund shares | | | 109 | | |
| Redemptions | | | — | | |
| Net increase | | | 31,219 | | |
(1) For the period from May 1, 2006 to October 31, 2006.
(2) For the period from the initial issuance of shares, August 27, 2007, to October 31, 2007.
18
Eaton Vance Tax-Managed Dividend Income Fund as of October 31, 2007
NOTES TO FINANCIAL STATEMENTS CONT'D
4 Investment Adviser Fee and Other Transactions with Affiliates
The investment adviser fee is earned by EVM, as compensation for management and investment advisory services rendered to the Fund. Pursuant to the investment advisory agreement, EVM receives a monthly fee at the annual rate of 0.65% of the Fund's average daily net assets of the Fund up to $500 million and at reduced rates as daily net assets exceed that level. The portion of the investment advisory fee payable by Cash Management on the Fund's investment of cash therein is credited against the Fund's investment advisory fees. For the year ended October 31, 2007, the Fund's investment advisory fee totaled $10,834,084, of which $137,090 was allocated from Cash Management and $10,696,994 was paid or accrued directly by the Fund. The Fund's investment advisory fee, including the portion allocated from Cash Management, was 0.62% of the Fund's average daily net assets. The administration fee is earned by EVM as compensation for managin g and administering the business affairs of the Fund. Under the administration agreement, EVM earns a fee in the amount of 0.15% per annum of the average daily net assets of the Fund. For the year ended October 31, 2007, the administration fee amounted to $2,614,771.
Except for Trustees of the Fund who are not members of EVM's organization, officers and Trustees receive remuneration for their services to the Fund out of such investment adviser fee. Trustees of the Fund who are not affiliated with the investment adviser may elect to defer receipt of all or a percentage of their annual fees in accordance with the terms of the Trustees Deferred Compensation Plan. For the year ended October 31, 2007, no significant amounts have been deferred.
EVM serves as the sub-transfer agent of the Fund and receives from the transfer agent an aggregate fee based upon the actual expenses incurred by EVM in the performance of those activities. For the year ended October 31, 2007, EVM received $59,710 in sub-transfer agent fees.
Eaton Vance Distributors, Inc. (EVD), a subsidiary of EVM and the Fund's principal underwriter, received $1,225,156 as its portion of the sales charge on sales of Class A shares for the year ended October 31, 2007. EVD also received distribution and service fees from Class A, Class B, and Class C shares (see note 5) and contingent deferred sales charges (see note 6).
During the year ended October 31, 2007, the Fund engaged in purchases and sales transactions in the amounts of $57,917,929 and $17,129,014, respectively, with a Fund which utilizes EVM as investment adviser. These transactions complied with Rule 17a-7 under the 1940 Act.
Certain officers and Trustees of the Fund are officers of the above organizations.
5 Distribution Plans
The Fund has in effect a distribution plan for Class A shares pursuant to Rule 12b-1 under the 1940 Act (Class A Plan). The Class A Plan provides that the Fund will pay EVD a distribution and service fee of 0.25% per annum of its average daily net assets attributable to Class A shares for distribution services and facilities provided to the Fund by EVD, as well as for personal services and/or the maintenance of shareholder accounts. Distribution and service fees paid or accrued to EVD for the year ended October 31, 2007 for Class A shares amounted to $2,314,434. The Fund also has in effect distribution plans for Class B shares (Class B Plan) and Class C shares (Class C Plan) pursuant to Rule 12b-1 under the 1940 Act. The Class B and Class C Plans require the Fund to pay EVD amounts equal to 0.75% per annum of the Fund's average daily net assets attributable to Class B and Class C shares for providing ongoing distribution service s and facilities to the Fund. The Fund will automatically discontinue payments to EVD during any period in which there are no outstanding Uncovered Distribution Charges, which are equivalent to the sum of (i) 6.25% of the aggregate amount received by the Fund for the Class B and Class C shares sold, plus (ii) interest calculated by applying the rate of 1% over the prevailing prime rate to the outstanding balance of Uncovered Distribution Charges of EVD of each respective class, reduced by the aggregate amount of contingent deferred sales charges (see Note 6) and amounts theretofore paid or payable to EVD by each respective class. For the year ended October 31, 2007, the Fund paid or accrued $1,258,962 and $4,871,249 for Class B and Class C shares, respectively, to or payable to EVD, representing 0.75% of the average daily net assets of Class B and Class C shares. At October 31, 2007, the amount of Uncovered Distribution Charges of EVD calculated under the Plans were approximately $6,461,000 and $38,955,000 f or Class B and Class C shares, respectively. The Class B and Class C Plans also authorize the Fund to make payments of service fees to EVD, investment dealers, and other persons in amounts not exceeding 0.25% per annum of the Fund's average daily net assets attributable to the Class B and Class C shares. Service fees paid or accrued are for personal services and/or the maintenance of shareholder accounts. They are separate and distinct from the sales
19
Eaton Vance Tax-Managed Dividend Income Fund as of October 31, 2007
NOTES TO FINANCIAL STATEMENTS CONT'D
commissions and distribution fees payable to EVD and, as such, are not subject to automatic discontinuance when there are no outstanding Uncovered Distribution Charges of EVD. Service fees paid or accrued for the year ended October 31, 2007 amounted to $419,654 and $1,623,750, for Class B and Class C shares, respectively.
6 Contingent Deferred Sales Charge
A contingent deferred sales charge (CDSC) generally is imposed on redemptions of Class B shares made within six years of purchase and on redemptions of Class C shares made within one year of purchase. Class A shares may be subject to a CDSC of up to 1% if redeemed within two years of purchase (depending upon the circumstances of purchase). Generally, the CDSC is based upon the lower of the net asset value at date of redemption or date of purchase. No charge is levied on shares acquired by reinvestment of dividends or capital gains distributions. The Class B CDSC is imposed at declining rates that begin at 5% in the case of redemptions in the first and second year after purchase, declining one percentage point each subsequent year. Class C shares will be subject to a 1% CDSC if redeemed w ithin one year of purchase.
No CDSC is levied on shares which have been sold to EVM or its affiliates or to their respective employees or clients and may be waived under certain other limited conditions. CDSC received on Class B and Class C redemptions are paid to EVD to reduce the amount of Uncovered Distribution Charges calculated under the Fund's Class B and Class C Plans. CDSC received on Class B and Class C redemptions when no Uncovered Distribution Charges exist are credited to the Fund. The Fund was informed that EVD received approximately $53,925, $163,000 and $76,000 of CDSC paid by shareholders of Class A, Class B and Class C shares, respectively, for the year ended October 31, 2007.
7 Investments Transactions
Purchases and sales of investments, other than short-term obligations, aggregated $3,088,471,452 and $2,373,008,122, respectively, for the year ended October 31, 2007.
8 Federal Income Tax Basis of Unrealized Appreciation (Depreciation)
The cost and unrealized appreciation (depreciation) in value of investments owned at October 31, 2007, as determined on a federal income tax basis, were as follows:
| Aggregate cost | | $ | 1,815,694,265 | | |
| Gross unrealized appreciation | | $ | 336,201,285 | | |
| Gross unrealized depreciation | | | (31,373,632 | ) | |
| Net unrealized appreciation | | $ | 304,827,653 | | |
The unrealized gain on foreign currency at October 31, 2007 on a federal income tax basis was $58,870.
9 Risks Associated with Foreign Investments
Investing in securities issued by companies whose principal business activities are outside the United States may involve significant risks not present in domestic investments. For example, there is generally less publicly available information about foreign companies, particularly those not subject to the disclosure and reporting requirements of the U.S. securities laws. Foreign issuers are generally not bound by uniform accounting, auditing, and financial reporting requirements and standards of practice comparable to those applicable to domestic issuers. Investments in foreign securities also involve the risk of possible adverse changes in investment or exchange control regulations, expropriation or confiscatory taxation, limitation on the removal of funds or other assets of the Fund, political or financial instability or diplomatic and other developments which could affect such investments. Foreign stock markets, while growin g in volume and sophistication, are generally not as developed as those in the United States, and securities of some foreign issuers (particularly those located in developing countries) may be less liquid and more volatile than securities of comparable U.S. companies. In general, there is less overall governmental supervision and regulation of foreign securities markets, broker-dealers and issuers than in the United States.
20
Eaton Vance Tax-Managed Dividend Income Fund as of October 31, 2007
NOTES TO FINANCIAL STATEMENTS CONT'D
10 Financial Instruments
The Fund may trade in financial instruments with off-balance sheet risk in the normal course of its investing activities to assist in managing exposure to various market risks. These financial instruments may include written options and financial futures contracts and may involve, to a varying degree, elements of risk in excess of the amounts recognized for financial statement purposes. The notional or contractual amounts of these instruments represent the investment the Fund has in particular classes of financial instruments and does not necessarily represent the amounts potentially subject to risk. The measurement of the risks associated with these instruments is meaningful only when all related and offsetting transactions are considered. The Fund did not have any open obligations under these financial instruments at October 31, 2007.
11 Line of Credit
The Fund participates with other portfolios and funds managed by EVM and its affiliates in a $200 million unsecured line of credit agreement with a group of banks. Borrowings will be made by the Fund solely to facilitate the handling of unusual and/or unanticipated short-term cash requirements. Interest is charged to the Fund based on its borrowings at an amount above either the Eurodollar rate or Federal Funds rate. In addition, a fee computed at an annual rate of 0.07% on the daily unused portion of the line of credit is allocated among the participating portfolios and funds at the end of each quarter. The Fund did not have any significant borrowings or allocated fees during the year ended October 31, 2007.
12 Recently Issued Accounting Pronouncements
In June 2006, the Financial Accounting Standards Board (FASB) issued FASB Interpretation No. 48 (FIN 48), "Accounting for Uncertainty in Income Taxes – an interpretation of FASB Statement No. 109". FIN 48 clarifies the accounting for uncertainty in income taxes recognized in accordance with FASB Statement No. 109, "Accounting for Income Taxes". This interpretation prescribes a recognition threshold and measurement attribute for the financial statement recognition and measurement of a tax position taken or expected to be taken in a tax return. It also provides guidance on de-recognition, classification, interest and penalties, accounting in interim periods, disclosure and transition. FIN 48 is effective on the last business day of the first required financial reporting period for fiscal years beginning after December 15, 2006. Management is currently evaluating the impact of applying the various provisions of FIN 48.
In September 2006, the FASB issued Statement of Financial Accounting Standards No. 157 (FAS 157), "Fair Value Measurements". FAS 157 defines fair value, establishes a framework for measuring fair value in accordance with generally accepted accounting principles and expands disclosure about fair value measurements. FAS 157 is effective for fiscal years beginning after November 15, 2007. Management is currently evaluating the impact the adoption of FAS 157 will have on the Fund's financial statement disclosures.
21
Eaton Vance Tax-Managed Dividend Income Fund as of October 31, 2007
REPORT OF INDEPENDENT REGISTERED PUBLIC ACCOUNTING FIRM
To the Trustees of Eaton Vance Mutual Funds Trust and Shareholders of Eaton Vance
Tax-Managed Dividend Income Fund:
We have audited the accompanying statement of assets and liabilities of Eaton Vance Tax-Managed Dividend Income Fund (one of the series of Eaton Vance Mutual Funds Trust) (the "Fund"), including the portfolio of investments, as of October 31, 2007, and the related statement of operations for the year then ended, the statements of changes in net assets for the year ended October 31, 2007, the six month period ended October 31, 2006, and the year ended April 30, 2006, and the financial highlights for the periods presented. These financial statements and financial highlights are the responsibility of the Fund's management. Our responsibility is to express an opinion on these financial statements and financial highlights based on our audits.
We conducted our audits in accordance with the standards of the Public Company Accounting Oversight Board (United States). Those standards require that we plan and perform the audit to obtain reasonable assurance about whether the financial statements and financial highlights are free of material misstatement. The Fund is not required to have, nor were we engaged to perform, an audit of its internal control over financial reporting. Our audits included consideration of internal control over financial reporting as a basis for designing audit procedures that are appropriate in the circumstances, but not for the purpose of expressing an opinion on the effectiveness of the Fund's internal control over financial reporting. Accordingly, we express no such opinion. An audit also includes examining, on a test basis, evidence supporting the amounts and disclosures in the financial statements, assessing the accounting principles used and significant estimates made by management, as well as evaluating the overall financial statement presentation. Our procedures included confirmation of securities owned as of October 31, 2007, by correspondence with the custodian and brokers; where replies were not received from brokers, we performed other auditing procedures. We believe that our audits provide a reasonable basis for our opinion.
In our opinion, the financial statements and financial highlights referred to above present fairly, in all material respects, the financial position of Eaton Vance Tax-Managed Dividend Income Fund as of October 31, 2007, the results of its operations for the year then ended, the changes in its net assets for the year ended October 31, 2007, the six month period ended October 31, 2006 and the year ended April 30, 2006, and the financial hightlights for the periods presented, in conformity with accounting principles generally accepted in the United States of America.
DELOITTE & TOUCHE LLP
Boston, Massachusetts
December 17, 2007
22
Eaton Vance Tax-Managed Dividend Income Fund as of October 31, 2007
FEDERAL TAX INFORMATION (Unaudited)
The Form 1099-DIV you receive in January 2008 will show the tax status of all distributions paid to your account in calendar year 2007. Shareholders are advised to consult their own tax adviser with respect to the tax consequences of their investment in the Fund. As required by the Internal Revenue Code regulations, shareholders must be notified within 60 days of the Fund's fiscal year end regarding the status of qualified dividend income for individuals, the dividends received deduction for corporations, and the foreign tax credit.
Qualified Dividend Income. The Fund designates approximately $109,011,024, or up to the maximum amount of such dividend allowable pursuant to the Internal Revenue Code, as qualified dividend income eligible for the reduced tax rate of 15%.
Dividends Received Deduction. Corporate shareholders are generally entitled to take the dividends received deduction on the portion of the Fund's dividend distribution that qualifies under tax law. For the Fund's fiscal 2007 ordinary income dividends, 71.87% qualifies for the corporate dividends received deduction.
23
Eaton Vance Tax-Managed Dividend Income Fund
BOARD OF TRUSTEES' ANNUAL APPROVAL OF THE INVESTMENT ADVISORY AGREEMENT
Overview of the Contract Review Process
The Investment Company Act of 1940, as amended (the "1940 Act"), provides, in substance, that each investment advisory agreement between a fund and its investment adviser will continue in effect from year to year only if its continuance is approved at least annually by the fund's board of trustees, including by a vote of a majority of the trustees who are not "interested persons" of the fund ("Independent Trustees"), cast in person at a meeting called for the purpose of considering such approval.
At a meeting of the Boards of Trustees (each a "Board") of the Eaton Vance group of mutual funds (the "Eaton Vance Funds") held on April 23, 2007, the Board, including a majority of the Independent Trustees, voted to approve continuation of existing advisory and sub-advisory agreements for the Eaton Vance Funds for an additional one-year period. In voting its approval, the Board relied upon the affirmative recommendation of the Special Committee of the Board, which is a committee comprised exclusively of Independent Trustees. Prior to making its recommendation, the Special Committee reviewed information furnished for a series of meetings of the Special Committee held in February, March and April 2007. Such information included, among other things, the following:
Information about Fees, Performance and Expenses
• An independent report comparing the advisory and related fees paid by each fund with fees paid by comparable funds;
• An independent report comparing each fund's total expense ratio and its components to comparable funds;
• An independent report comparing the investment performance of each fund to the investment performance of comparable funds over various time periods;
• Data regarding investment performance in comparison to relevant peer groups of funds and appropriate indices;
• Comparative information concerning fees charged by each adviser for managing other mutual funds and institutional accounts using investment strategies and techniques similar to those used in managing the fund;
• Profitability analyses for each adviser with respect to each fund;
Information about Portfolio Management
• Descriptions of the investment management services provided to each fund, including the investment strategies and processes employed;
• Information concerning the allocation of brokerage and the benefits received by each adviser as a result of brokerage allocation, including information concerning the acquisition of research through "soft dollar" benefits received in connection with the funds' brokerage, and the implementation of a soft dollar reimbursement program established with respect to the funds;
• Data relating to portfolio turnover rates of each fund;
• The procedures and processes used to determine the fair value of fund assets and actions taken to monitor and test the effectiveness of such procedures and processes;
Information about each Adviser
• Reports detailing the financial results and condition of each adviser;
• Descriptions of the qualifications, education and experience of the individual investment professionals whose responsibilities include portfolio management and investment research for the funds, and information relating to their compensation and responsibilities with respect to managing other mutual funds and investment accounts;
• Copies of the Codes of Ethics of each adviser and its affiliates, together with information relating to compliance with and the administration of such codes;
• Copies of or descriptions of each adviser's proxy voting policies and procedures;
• Information concerning the resources devoted to compliance efforts undertaken by each adviser and its affiliates on behalf of the funds (including descriptions of various compliance programs) and their record of compliance with investment policies and restrictions, including policies with respect to market-timing, late trading and selective portfolio disclosure, and with policies on personal securities transactions;
• Descriptions of the business continuity and disaster recovery plans of each adviser and its affiliates;
Other Relevant Information
• Information concerning the nature, cost and character of the administrative and other non-investment management services provided by Eaton Vance Management and its affiliates;
• Information concerning management of the relationship with the custodian, subcustodians and fund accountants by each adviser or the funds' administrator; and
• The terms of each advisory agreement.
24
Eaton Vance Tax-Managed Dividend Income Fund
BOARD OF TRUSTEES' ANNUAL APPROVAL OF THE INVESTMENT ADVISORY AGREEMENT CONT'D
In addition to the information identified above, the Special Committee considered information provided from time to time by each adviser throughout the year at meetings of the Board and its committees. Over the course of the twelve-month period ended April 30, 2007, the Board met ten times and the Special Committee, the Audit Committee and the Governance Committee, each of which is a Committee comprised solely of Independent Trustees, met twelve, fourteen and eight times, respectively. At such meetings, the Trustees received, among other things, presentations by the portfolio managers and other investment professionals of each adviser relating to the investment performance of each fund and the investment strategies used in pursuing the fund's investment objective.
For funds that invest through one or more underlying portfolios, the Board considered similar information about the portfolio(s) when considering the approval of advisory agreements. In addition, in cases where the fund's investment adviser has engaged a sub-adviser, the Board considered similar information about the sub-adviser when considering the approval of any sub-advisory agreement.
The Special Committee was assisted throughout the contract review process by Goodwin Procter LLP, legal counsel for the Independent Trustees. The members of the Special Committee relied upon the advice of such counsel and their own business judgment in determining the material factors to be considered in evaluating each advisory and sub-advisory agreement and the weight to be given to each such factor. The conclusions reached with respect to each advisory and sub-advisory agreement were based on a comprehensive evaluation of all the information provided and not any single factor. Moreover, each member of the Special Committee may have placed varying emphasis on particular factors in reaching conclusions with respect to each advisory and sub-advisory agreement.
Results of the Process
Based on its consideration of the foregoing, and such other information as it deemed relevant, including the factors and conclusions described below, the Special Committee concluded that the continuance of the investment advisory agreement of the Eaton Vance Tax-Managed Dividend Income Fund (the "Fund") with Eaton Vance Management (the "Adviser"), including its fee structure, is in the interests of shareholders and, therefore, the Special Committee recommended to the Board approval of the agreement. The Board accepted the recommendation of the Special Committee as well as the factors considered and conclusions reached by the Special Committee with respect to the agreement. Accordingly, the Board, including a majority of the Independent Trustees, voted to approve continuation of the advisory agreement for the Fund.
Nature, Extent and Quality of Services
In considering whether to approve the investment advisory agreement of the Fund, the Board evaluated the nature, extent and quality of services provided to the Fund by the Adviser.
The Board considered the Adviser's management capabilities and investment process with respect to the types of investments held by the Fund, including the education, experience and number of its investment professionals and other personnel who provide portfolio management, investment research, and similar services to the Fund, including recent changes to such personnel. The Board evaluated the abilities and experience of such investment personnel in analyzing factors such as special considerations relevant to investing in foreign markets. The Board specifically noted the Adviser's in-house equity research capabilities and experience in managing funds that seek to maximize after-tax returns. The Board also took into account the resources dedicated to portfolio management and other services, including the compensation paid to recruit and retain investment personnel, and the time and attention devoted to the Fund by senior manageme nt.
The Board reviewed the compliance programs of the Adviser and relevant affiliates thereof. Among other matters, the Board considered compliance and reporting matters relating to personal trading by investment personnel, selective disclosure of portfolio holdings, late trading, frequent trading, portfolio valuation, business continuity and the allocation of investment opportunities. The Board also evaluated the responses of the Adviser and its affiliates to requests from regulatory authorities such as the Securities and Exchange Commission and the National Association of Securities Dealers.
The Board considered shareholder and other administrative services provided or managed by Eaton Vance Management and its affiliates, including transfer agency and accounting services. The Board evaluated the benefits to shareholders of investing in a fund that is a part of a large family of funds, including the ability, in many cases, to exchange an investment among different funds without incurring additional sales charges.
After consideration of the foregoing factors, among others, the Board concluded that the nature, extent and quality of services provided by the Adviser, taken as a whole, are appropriate and consistent with the terms of the investment advisory agreement.
25
Eaton Vance Tax-Managed Dividend Income Fund
BOARD OF TRUSTEES' ANNUAL APPROVAL OF THE INVESTMENT ADVISORY AGREEMENT CONT'D
Fund Performance
The Board compared the Fund's investment performance to a relevant universe of similarly managed funds identified by an independent data provider and appropriate benchmark indices. The Board reviewed comparative performance data for the year ended September 30, 2006 for the Fund. On the basis of the foregoing and other relevant information, the Board concluded that the performance of the Fund is satisfactory.
Management Fees and Expenses
The Board reviewed contractual investment advisory fee rates, including any administrative fee rates, payable by the Fund (referred to collectively as "management fees").
As part of its review, the Board considered the Fund's management fees (including administrative fees) and total expense ratio for the one-year period ended September 30, 2006, as compared to a group of similarly managed funds selected by an independent data provider.
After reviewing the foregoing information, and in light of the nature, extent and quality of the services provided by the Adviser, the Board concluded that the management fees charged for advisory and related services and the Fund's total expense ratio are reasonable.
Profitability
The Board reviewed the level of profits realized by the Adviser and relevant affiliates thereof in providing investment advisory and administrative services to the Fund and to all Eaton Vance Funds as a group. The Board considered the level of profits realized without regard to revenue sharing or other payments by the Adviser and its affiliates to third parties in respect of distribution services. The Board also considered other direct or indirect benefits received by the Adviser in connection with its relationship with the Fund, including the benefits of research services that may be available to the Adviser as a result of securities transactions effected for the Fund and other investment advisory clients.
The Board concluded that, in light of the foregoing factors and the nature, extent and quality of the services rendered, the profits realized by the Adviser and its affiliates are reasonable.
Economies of Scale
In reviewing management fees and profitability, the Board also considered the extent to which the Adviser and its affiliates, on the one hand, and the Fund, on the other hand, can expect to realize benefits from economies of scale as the assets of the Fund increase. The Board acknowledged the difficulty in accurately measuring the benefits resulting from the economies of scale with respect to the management of any specific fund or group of funds. The Board reviewed data summarizing the increases and decreases in the assets of the Fund and of all Eaton Vance Funds as a group over various time periods, and evaluated the extent to which the total expense ratio of the Fund and the Adviser's profitability may have been affected by such increases or decreases. Based upon the foregoing, the Board concluded that the benefits from economies of scale are currently being shared equitably by the Adviser and the Fund. The Board also conclude d that the structure of the advisory fee, which includes breakpoints at several asset levels, can be expected to cause the Adviser and its affiliates and the Fund to continue to share such benefits equitably.
26
Eaton Vance Tax-Managed Dividend Income Fund
MANAGEMENT AND ORGANIZATION
Fund Management. The Trustees of Eaton Vance Mutual Funds Trust (the Trust) are responsible for the overall management and supervision of the Trust's affairs. The Trustees and officers of the Trust are listed below. Except as indicated, each individual has held the office shown or other offices in the same company for the last five years. Trustees and officers of the Trust hold indefinite terms of office. The "noninterested Trustees" consist of those Trustees who are not "interested persons" of the Trust, as that term is defined under the 1940 Act. The business address of each Trustee and officer is The Eaton Vance Building, 255 State Street, Boston, Massachusetts 02109. As used below, "EVC" refers to Eaton Vance Corp., "EV" refers to Eaton Vance, Inc., "EVM" refers to Eaton Vance Management, "BMR" refers to Boston Management and Research, "Parametric" refer s to Parametric Portfolio Associates and "EVD" refers to Eaton Vance Distributors, Inc. EVC and EV are the corporate parent and trustee, respectively, of EVM and BMR. EVD is the Fund's principal underwriter and a wholly-owned subsidiary of EVM. Each officer affiliated with Eaton Vance may hold a position with other Eaton Vance affiliates that is comparable to his or her position with EVM listed below.
Name and
Date of Birth | | Position(s)
with the
Trust | | Term of
Office and
Length of
Service | | Principal Occupation(s)
During Past Five Years | | Number of Portfolios
in Fund Complex
Overseen By
Trustee(1) | | Other Directorships Held | |
| Interested Trustee | | | | | | | | | | | | | |
|
| Thomas E. Faust Jr. 5/31/58 | | Trustee and President of
the Trust | | Trustee since 2007
and President of
the Trust since 2002 | | Chairman, Chief Executive Officer and President of EVC, President of EV, Chief Executive Officer and President of EVM and BMR, and Director of EVD. Trustee and/or Officer of 176 registered investment companies in the Eaton Vance Fund Complex. Mr. Faust is an interested person because of his positions with EVM, BMR, EVC and EV which are affiliates of the Trust. | | | 176 | | | Director of EVC | |
|
| Noninterested Trustee(s) | | | | | | | | | | | | | |
|
| Benjamin C. Esty 1/2/63 | | Trustee | | Since 2005 | | Roy and Elizabeth Simmons Professor of Business Administration, Harvard University Graduate School of Business Administration (since 2003). Formerly, Associate Professor, Harvard University Graduate School of Business Administration (2000-2003). | | | 176 | | | None | |
|
| Allen R. Freedman 4/3/40 | | Trustee | | Since 2007 | | Former Chairman and Chief Executive Officer of Assurant, Inc. (insurance provider) (1978-2000). Formerly, a Director of Loring Ward International (fund distributor) (2005-2007). | | | 175 | | | Director of Assurant, Inc. and Stonemor Partners L.P. (owner and operator of cemeteries) | |
|
| William H. Park 9/19/47 | | Trustee | | Since 2003 | | Vice Chairman, Commercial Industrial Finance Corp. (specialty finance company) (since 2006). Formerly, President and Chief Executive Officer, Prizm Capital Management, LLC (investment management firm) (since 2002-2005). | | | 176 | | | None | |
|
| Ronald A. Pearlman 7/10/40 | | Trustee | | Since 2003 | | Professor of Law, Georgetown University Law Center. | | | 176 | | | None | |
|
| Norton H. Reamer 9/21/35 | | Trustee | | Since 1986 | | President, Chief Executive Officer and a Director of Asset Management Finance Corp. (a specialty finance company serving the investment management industry) (since October 2003). President, Unicorn Corporation (an investment and financial advisory services company) (since September 2000). Formerly, Chairman and Chief Operating Officer, Hellman, Jordan Management Co., Inc. (an investment management company) (2000-2003). Formerly, Advisory Director of Berkshire Capital Corporation (investment banking firm) (2002-2003). | | | 176 | | | None | |
|
27
Eaton Vance Tax-Managed Dividend Income Fund
MANAGEMENT AND ORGANIZATION CONT'D
Name and
Date of Birth | | Position(s)
with the
Trust | | Term of
Office and
Length of
Service | | Principal Occupation(s)
During Past Five Years | | Number of Portfolios
in Fund Complex
Overseen By
Trustee(1) | | Other Directorships Held | |
| Noninterested Trustee(s) (continued) | | | | | | | | | | | | | |
|
| Heidi L. Steiger 7/8/53 | | Trustee | | Since 2007 | | President, Lowenhaupt Global Advisors, LLC (global wealth management firm) (since 2005); Formerly, President and Contributing Editor, Worth Magazine (2004); Formerly, Executive Vice President and Global Head of Private Asset Management (and various other positions), Neuberger Berman (investment firm) (1986-2004). | | | 173 | | | Director of Nuclear Electric Insurance Ltd.
(nuclear insurance provider) and Aviva USA (insurance provider) | |
|
| Lynn A. Stout 9/14/57 | | Trustee | | Since 1998 | | Paul Hastings Professor of Corporate and Securities Law, University of California at Los Angeles School of Law. | | | 176 | | | None | |
|
| Ralph F. Verni 1/26/43 | | Chairman of the Board and Trustee | | Chairman of
the Board
since 2007 and
Trustee since 2005 | | Consultant and private investor. | | | 176 | | | None | |
|
| Principal Officers who are not Trustees | | | | | | | | | | | | | |
|
Name and
Date of Birth | | Position(s)
with the
Trust | | Term of
Office and
Length of
Service | | Principal Occupation(s)
During Past Five Years | |
| William H. Ahern, Jr. 7/28/59 | | Vice President | | Since 1995 | | Vice President of EVM and BMR. Officer of 74 registered investment companies managed by EVM or BMR. | |
|
| Cynthia J. Clemson 3/2/63 | | Vice President | | Since 2005 | | Vice President of EVM and BMR. Officer of 89 registered investment companies managed by EVM or BMR. | |
|
| Charles B. Gaffney 12/4/72 | | Vice President | | Since 2007 | | Vice President of EVM and BMR. Previously, Sector Portfolio Manager and Senior Equity Analyst of Brown Brothers Harriman (1997-2003). Officer of 29 registered investment companies managed by EVM or BMR. | |
|
| Christine M. Johnston 11/9/72 | | Vice President | | Since 2007 | | Vice President of EVM and BMR. Officer of 34 registered investment companies managed by EVM or BMR. | |
|
| Aamer Khan 6/7/60 | | Vice President | | Since 2005 | | Vice President of EVM and BMR. Officer of 32 registered investment companies managed by EVM or BMR. | |
|
| Thomas H. Luster 4/8/62 | | Vice President | | Since 2006 | | Vice President of EVM and BMR. Officer of 48 registered investment companies managed by EVM or BMR. | |
|
| Michael R. Mach 7/15/47 | | Vice President | | Since 1999 | | Vice President of EVM and BMR. Officer of 54 registered investment companies managed by EVM or BMR. | |
|
| Robert B. MacIntosh 1/22/57 | | Vice President | | Since 1998 | | Vice President of EVM and BMR. Officer of 89 registered investment companies managed by EVM or BMR. | |
|
| Duncan W. Richardson 10/26/57 | | Vice President | | Since 2001 | | Executive Vice President and Chief Equity Investment Officer of EVC, EVM and BMR. Officer of 80 registered investment companies managed by EVM or BMR. | |
|
| Walter A. Row, III 7/20/57 | | Vice President | | Since 2001 | | Director of Equity Research and a Vice President of EVM and BMR. Officer of 38 registered investment companies managed by EVM or BMR. | |
|
| Judith A. Saryan 8/21/54 | | Vice President | | Since 2003 | | Vice President of EVM and BMR. Officer of 53 registered investment companies managed by EVM or BMR. | |
|
| Susan Schiff 3/13/61 | | Vice President | | Since 2002 | | Vice President of EVM and BMR. Officer of 35 registered investment companies managed by EVM or BMR. | |
|
28
Eaton Vance Tax-Managed Dividend Income Fund
MANAGEMENT AND ORGANIZATION CONT'D
Name and
Date of Birth | | Position(s)
with the
Trust | | Term of
Office and
Length of
Service | | Principal Occupation(s)
During Past Five Years | |
| Principal Officers who are not Trustees (continued) | |
|
| Thomas Seto 9/27/62 | | Vice President | | Since 2007 | | Vice President and Director of Portfolio Management of Parametric. Officer of 30 registered investment companies managed by EVM or BMR. | |
|
| David M. Stein 5/4/51 | | Vice President | | Since 2007 | | Managing Director and Chief Investment Officer of Parametric. Officer of 30 registered investment companies managed by EVM or BMR. | |
|
| Mark S. Venezia 5/23/49 | | Vice President | | Since 2007 | | Vice President of EVM and BMR. Officer of 35 registered investment companies managed by EVM or BMR. | |
|
| Adam A. Weigold 3/22/75 | | Vice President | | Since 2007 | | Vice President of EVM and BMR. Officer of 70 registered investment companies managed by EVM or BMR. | |
|
| Barbara E. Campbell 6/19/57 | | Treasurer | | Since 2005 | | Vice President of EVM and BMR. Officer of 176 registered investment companies managed by EVM or BMR. | |
|
| Maureen A. Gemma 5/24/60 | | Secretary | | Since 2007 | | Deputy Chief Legal Officer and Vice President of EVM and BMR. Officer of 176 registered investment companies managed by EVM or BMR. | |
|
| Paul M. O'Neil 7/11/53 | | Chief Compliance Officer | | Since 2004 | | Vice President of EVM and BMR. Officer of 176 registered investment companies managed by EVM or BMR. | |
|
(1) Includes both master and feeder funds in a master-feeder structure.
The SAI for the Fund includes additional information about the Trustees and officers of the Fund and can be obtained without charge by calling 1-800-225-6265.
29
This Page Intentionally Left Blank
This Page Intentionally Left Blank
This Page Intentionally Left Blank
Investment Advisor and Administrator of
Eaton Vance Tax-Managed Dividend Income Fund
Eaton Vance Management
The Eaton Vance Building
255 State Street
Boston, MA 02109
Principal Underwriter
Eaton Vance Distributors, Inc.
The Eaton Vance Building
255 State Street
Boston, MA 02109
(617) 482-8260
Custodian
State Street Bank and Trust Company
200 Clarendon Street
Boston, MA 02116
Transfer Agent
PFPC Inc.
Attn: Eaton Vance Funds
P.O. Box 9653
Providence, RI 02940-9653
(800) 262-1122
Independent Registered Public Accounting Firm
Deloitte & Touche LLP
200 Berkeley Street
Boston, MA 02116-5022
Eaton Vance Tax-Managed Dividend Income Fund
The Eaton Vance Building
255 State Street
Boston, MA 02109
This report must be preceded or accompanied by a current prospectus. Before investing, investors should consider carefully the Fund's investment objective(s), risks, and charges and expenses. The Fund's current prospectus contains this and other information about the Fund and is available through your financial advisor. Please read the prospectus carefully before you invest or send money. For further information please call 1-800-225-6265.
1857-12/07 TMDISRC

Annual Report October 31, 2007


EATON VANCE
TAX-MANAGED
INTERNATIONAL
EQUITY
FUND
IMPORTANT NOTICES REGARDING PRIVACY,
DELIVERY OF SHAREHOLDER DOCUMENTS,
PORTFOLIO HOLDINGS AND PROXY VOTING
Privacy. The Eaton Vance organization is committed to ensuring your financial privacy. Each of the financial institutions identified below has in effect the following policy ("Privacy Policy") with respect to nonpublic personal information about its customers:
• Only such information received from you, through application forms or otherwise, and information about your Eaton Vance fund transactions will be collected. This may include information such as name, address, social security number, tax status, account balances and transactions.
• None of such information about you (or former customers) will be disclosed to anyone, except as permitted by law (which includes disclosure to employees necessary to service your account). In the normal course of servicing a customer's account, Eaton Vance may share information with unaffiliated third parties that perform various required services such as transfer agents, custodians and broker/dealers.
• Policies and procedures (including physical, electronic and procedural safeguards) are in place that are designed to protect the confidentiality of such information.
• We reserve the right to change our Privacy Policy at any time upon proper notification to you. Customers may want to review our Policy periodically for changes by accessing the link on our homepage: www.eatonvance.com.
Our pledge of privacy applies to the following entities within the Eaton Vance organization: the Eaton Vance Family of Funds, Eaton Vance Management, Eaton Vance Investment Counsel, Boston Management and Research, and Eaton Vance Distributors, Inc.
In addition, our Privacy Policy only applies to those Eaton Vance customers who are individuals and who have a direct relationship with us. If a customer's account (i.e. fund shares) is held in the name of a third-party financial adviser/ broker-dealer, it is likely that only such adviser's privacy policies apply to the customer. This notice supersedes all previously issued privacy disclosures.
For more information about Eaton Vance's Privacy Policy, please call 1-800-262-1122.
Delivery of Shareholder Documents. The Securities and Exchange Commission (the "SEC") permits funds to deliver only one copy of shareholder documents, including prospectuses, proxy statements and shareholder reports, to fund investors with multiple accounts at the same residential or post office box address. This practice is often called "householding" and it helps eliminate duplicate mailings to shareholders.
Eaton Vance, or your financial adviser, may household the mailing of your documents indefinitely unless you instruct Eaton Vance, or your financial adviser, otherwise.
If you would prefer that your Eaton Vance documents not be householded, please contact Eaton Vance at 1-800-262-1122, or contact your financial adviser.
Your instructions that householding not apply to delivery of your Eaton Vance documents will be effective within 30 days of receipt by Eaton Vance or your financial adviser.
Portfolio Holdings. Each Eaton Vance Fund and its underlying Portfolio (if applicable) will file a schedule of its portfolio holdings on Form N-Q with the SEC for the first and third quarters of each fiscal year. The Form N-Q will be available on the Eaton Vance website www.eatonvance.com, by calling Eaton Vance at 1-800-262-1122 or in the EDGAR database on the SEC's website at www.sec.gov. Form N-Q may also be reviewed and copied at the SEC's public reference room in Washington, D.C. (call 1-800-732-0330 for information on the operation of the public reference room).
Proxy Voting. From time to time, funds are required to vote proxies related to the securities held by the funds. The Eaton Vance Funds or their underlying Portfolios (if applicable) vote proxies according to a set of policies and procedures approved by the Funds' and Portfolios' Boards. You may obtain a description of these policies and procedures and information on how the Funds or Portfolios voted proxies relating to Portfolio securities during the most recent 12 month period ended June 30, without charge, upon request, by calling 1-800-262-1122. This description is also available on the SEC's website at www.sec.gov.
Eaton Vance Tax-Managed International Equity Fund as of October 31, 2007
MANAGEMENT’S DISCUSSION OF FUND PERFORMANCE

Edward R. Allen, III, CFA
Eagle Global Advisors
Co-Portfolio Manager

Thomas N. Hunt, III, CFA
Eagle Global Advisors
Co-Portfolio Manager
The Fund
Performance for the Past Year
· For the year ended October 31, 2007, the Fund’s Class A shares had a total return of 36.35%. This return was the result of an increase in net asset value (NAV) per share to $14.97 on October 31, 2007, from $11.08 on October 31, 2006, and the reinvestment of $0.107 per share in dividend income.(1)
· The Fund’s Class B shares had a total return of 35.29% for the same period, the result of an increase in NAV per share to $14.20 from $10.51 and the reinvestment of $0.015 per share in dividend income.(1)
· The Fund’s Class C shares had a total return of 35.27% for the same period, the result of an increase in NAV per share to $14.15 from $10.50 and the reinvestment of $0.042 per share in dividend income.(1)
· For comparison, the Fund’s benchmark, the Morgan Stanley Capital International Europe, Australasia, and Far East Index (“MSCI EAFE Index”) – a broad-based, unmanaged index of international stocks – had a total return of 24.91% for the year ended October 31, 2007. The Fund’s peer group, the Lipper International Multi-Cap Core Funds Classification, had an average return of 27.22% for the same period.(2)
See pages 3 and 4 for more performance information, including after-tax returns.
Management Discussion
· Reduced expectations for U.S. growth, combined with greater expectations for European and developing countries’ economic growth, led to a weak dollar and stronger foreign currencies during the year ended October 31, 2007. Strong moves by the Euro and the pound and, to a lesser extent, the Asian currencies, have boosted U.S. investor returns on foreign stocks. The Bank of England and the European Central Bank took measures to inject liquidity into their markets during the year, while rethinking previous inflation concerns in light of the negative impacts of stronger currencies on exporters and subprime lending woes. Japan’s economy continued to soften and deflation became a concern again. Japan has paused raising interest rates, currently at 0.5%, also in response to continued volatility in the financial markets and to signs of a slowdown in the U.S. economy. China, on the other hand, experienced strong growth along with higher inflation, prompting authorities to take measures to reduce liquidity by raising interest rates and increasing reserve requirements for banks.
· While overseas economies are not immune to the strains on the U.S. economy, the global economy continued to be relatively strong, propelled by the rapidly developing economies in Asia, Latin America and Eastern Europe.
· The Fund currently invests its assets in a separate registered investment company, Tax-Managed International Equity Portfolio (the “Portfolio”), with the same objectives and policies as the Fund. For the year ended October 31, 2007, the Fund had strong returns, outperforming the benchmark MSCI EAFE Index, due to both stock selection and sector allocation.(2) The Portfolio’s large-cap focus benefited returns, as larger-capitalization stocks outperformed smaller-capitalization names, especially in the latter half of the year. The Fund also benefited from its general growth orientation, as international growth securities outpaced value securities during the period. (2), (3)
Past performance is no guarantee of future results. Returns are historical and are calculated by determining the percentage change in net asset value or offering price (as applicable) with all distributions reinvested. Investment return and principal value will fluctuate so that shares, when redeemed, may be worth more or less than their original cost. Performance is for the stated time period only; due to market volatility, the Fund’s current performance may be lower or higher than the quoted return. Fund performance during certain periods reflects the strong stock market performance and/or the strong performance of stocks held during those periods. This performance is not typical and may not be repeated. For performance as of the most recent month end, please refer to www.eatonvance.com.
(1) These returns do not include the 5.75% maximum sales charge for Class A shares or the applicable contingent deferred sales charge (CDSC) for Class B and Class C shares. Class A shares are subject to a 1% redemption fee if redeemed or exchanged within 90 days of settlement of purchase. If sales charges were deducted, the returns would be lower.
(2) It is not possible to invest directly in an Index or a Lipper Classification. The Index’s total return does not reflect commissions or expenses that would have been incurred if an investor individually purchased or sold the securities represented in the Index. The Lipper Average is the average total return, at net asset value, of the funds that are in the same Lipper Classification as the Fund. Lipper Averages are available as of month end only.
(3) Holdings and sector weightings are subject to change due to active management.
Fund shares are not insured by the FDIC and are not deposits or other obligations of, or guaranteed by, any depository institution. Shares are subject to investment risks, including possible loss of principal invested.
1
· The Fund’s outperformance of the MSCI EAFE Index for the Fund’s fiscal year was primarily due to strong stock selection in the industrials, information technology,materials and energy sectors. Although the Portfolio’s underweighting in the consumer discretionary sector was a positive, stock selection in this sector detracted from returns. During the period, the Portfolio reduced its weighting in financials, which helped performance as volatility in the credit markets created uncertainty. The Portfolio increased its weightings in the telecommunications and information technology sectors during the period, which proved positive for performance. (1),(2)
· The Fund benefited from the Portfolio’s exposure to Canadian companies and the emerging markets, which outperformed developed markets, and the Portfolio’s underweight to Japan, which was a poor performer in this period. However, the Portfolio’s Japanese holdings performed very well, as did stocks in Singapore, Norway and Australia.(1), (2)
(1) It is not possible to invest directly in an Index. The Index’s total return does not reflect commissions or expenses that would have been incurred if an investor individually purchased or sold the securities represented in the Index.
(2) Holdings and sector weightings are subject to change due to active management.
The views expressed throughout this report are those of the portfolio managers and are current only through the end of the period of the report as stated on the cover. These views are subject to change at any time based upon market or other conditions, and the investment adviser disclaims any responsibility to update such views. These views may not be relied on as investment advice and, because investment decisions for a fund are based on many factors, may not be relied on as an indication of trading intent on behalf of any Eaton Vance fund.
Global Aallocation*
By net assets
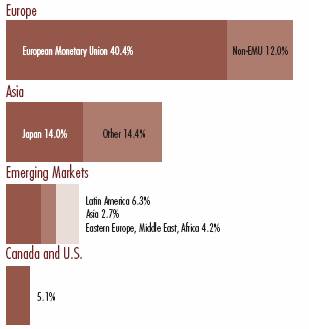
* As a percentage of the Portfolio’s net assets as of October 31, 2007. Portfolio information may not be representative of the Portfolio’s current or future investments and may change due to active management.
Top Ten Equity Holdings**
By net assets
Nintendo Co., Ltd. | | 4.7 | % |
Rio Tinto, Ltd. | | 3.0 | |
Keppel Corp., Ltd. | | 2.3 | |
Turkcell Iletisim Hizmetleri AS ADR | | 2.2 | |
Acergy SA | | 2.2 | |
Komatsu, Ltd. | | 2.1 | |
RWE AG | | 2.0 | |
Total SA | | 2.0 | |
BT Group PLC | | 2.0 | |
Petroleo Brasileiro SA ADR | | 1.9 | |
** Top Ten Equity Holdings represented 24.4% of Portfolio net assets as of October 31, 2007. Holdings are subject to change due to active management.
2
Eaton Vance Tax-Managed International Equity Fund as of October 31, 2007
FUND PERFORMANCE
The line graphs and table set forth below provide information about the Fund’s performance. The line graphs compare the performance of Class A, Class B and Class C of the Fund with that of the MSCI EAFE Index, a broad-based, unmanaged index of international stocks. The lines on the graphs represent the total returns of a hypothetical investment of $10,000 in each of Class A, Class B and Class C and the MSCI EAFE Index. Class A total returns are presented at net asset value and maximum public offering price. The table includes the total returns of each Class of the Fund at net asset value and public offering price. The performance presented below does not reflect the deduction of taxes, if any, that a shareholder would pay on distributions or redemptions of Fund shares.
Performance(1) | | Class A | | Class B | | Class C | |
Symbol | | ETIGX | | EMIGX | | ECIGX | |
Average Annual Total Returns (at net asset value) | | | | | | | |
One Year | | 36.35 | % | 35.29 | % | 35.27 | % |
Five Years | | 23.35 | | 22.44 | | 22.48 | |
Life of Fund† | | 4.59 | | 3.80 | | 3.78 | |
SEC Average Annual Total Returns (including sales charge or applicable CDSC) | | | | | | | |
One Year | | 28.46 | % | 30.29 | % | 34.27 | % |
Five Years | | 21.88 | | 22.26 | | 22.48 | |
Life of Fund† | | 3.94 | | 3.80 | | 3.78 | |
† Inception Dates – Class A: 4/22/98; Class B: 4/22/98; Class C: 4/22/98
(1) Average annual total returns do not include the 5.75% maximum sales charge for Class A shares or the applicable contingent deferred sales charge (CDSC) for Class B and Class C shares. If sales charges were deducted, the returns would be lower. Class A shares are subject to a 1% redemption fee if redeemed or exchanged within 90 days of settlement of purchase. SEC average annual total returns for Class A reflect the maximum 5.75% sales charge. SEC returns for Class B shares reflect the applicable CDSC based on the following schedule: 5% - 1st and 2nd years; 4% - 3rd year; 3% - 4th year; 2% - 5th year; 1% - 6th year. SEC returns for Class C reflect a 1% CDSC for the first year.
Total Annual
Operating Expenses(2) | | Class A | | Class B | | Class C | |
Expense Ratio | | 1.67 | % | 2.42 | % | 2.42 | % |
(2) From the Fund’s prospectus dated 3/1/07.
Past performance is no guarantee of future results. Returns are historical and are calculated by determining the percentage change in net asset value or offering price (as applicable) with all distributions reinvested. Investment return and principal value will fluctuate so that shares, when redeemed, may be worth more or less than their original cost. Performance is for the stated time period only; due to market volatility, the Fund’s current performance may be lower or higher than the quoted return. Fund performance during certain periods reflects the strong stock market performance and/or the strong performance of stocks held during those periods. This performance is not typical and may not be repeated. For performance as of the most recent month end, please refer to www.eatonvance.com.
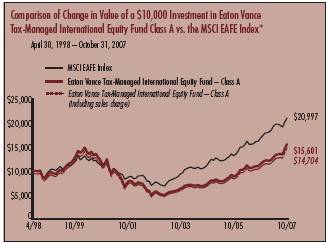
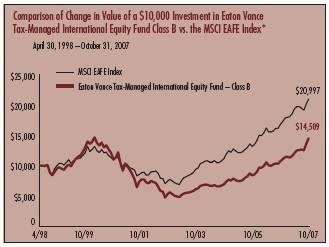
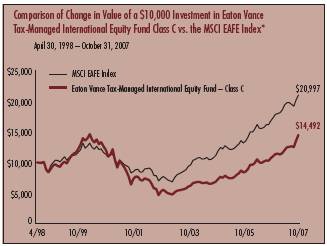
* Source: Thomson Financial. Class A, Class B and Class C of the Fund commenced investment operations on 4/22/98. It is not possible to invest directly in an Index. The Index’s total returns do not reflect commissions or expenses that would have been incurred if an investor individually purchased or sold the securities represented in the Index.
3
“Return Before Taxes” does not take into consideration shareholder taxes. It is most relevant to tax-free or tax-deferred shareholder accounts. “Return After Taxes on Distributions” reflects the impact of federal income taxes due on Fund distributions of dividends and capital gains. It is most relevant to taxpaying shareholders who continue to hold their shares. “Return After Taxes on Distributions and Sale of Fund Shares” also reflects the impact of taxes on capital gain or loss realized upon a sale of shares. It is most relevant to taxpaying shareholders who sell their shares.
Average Annual Total Returns
(For the periods ended October 31, 2007)
Returns at Net Asset Value (NAV) (Class A)
| | One Year | | Five Years | | Life of Fund | |
Return Before Taxes | | 36.35 | % | 23.35 | % | 4.59 | % |
Return After Taxes on Distributions | | 36.49 | | 23.51 | | 4.64 | |
Return After Taxes on Distributions and Sale of Fund Shares | | 24.09 | | 21.04 | | 4.08 | |
Returns at Public Offering Price (POP) (Class A)
| | One Year | | Five Years | | Life of Fund | |
Return Before Taxes | | 28.46 | % | 21.88 | % | 3.94 | % |
Return After Taxes on Distributions | | 28.59 | | 22.03 | | 3.99 | |
Return After Taxes on Distributions and Sale of Fund Shares | | 18.94 | | 19.68 | | 3.50 | |
Average Annual Total Returns
(For the periods ended October 31, 2007)
Returns at Net Asset Value (NAV) (Class C)
| | One Year | | Five Years | | Life of Fund | |
Return Before Taxes | | 35.27 | % | 22.48 | % | 3.78 | % |
Return After Taxes on Distributions | | 35.33 | | 22.64 | | 3.86 | |
Return After Taxes on Distributions and Sale of Fund Shares | | 23.12 | | 20.22 | | 3.37 | |
Returns at Public Offering Price (POP) (Class C)
| | One Year | | Five Years | | Life of Fund | |
Return Before Taxes | | 34.27 | % | 22.48 | % | 3.78 | % |
Return After Taxes on Distributions | | 34.33 | | 22.64 | | 3.86 | |
Return After Taxes on Distributions and Sale of Fund Shares | | 22.47 | | 20.22 | | 3.37 | |
Average Annual Total Returns
(For the periods ended October 31, 2007)
Returns at Net Asset Value (NAV) (Class B)
| | One Year | | Five Years | | Life of Fund | |
Return Before Taxes | | 35.29 | % | 22.44 | % | 3.80 | % |
Return After Taxes on Distributions | | 35.31 | | 22.60 | | 3.87 | |
Return After Taxes on Distributions and Sale of Fund Shares | | 23.01 | | 20.17 | | 3.38 | |
Returns at Public Offering Price (POP) (Class B)
| | One Year | | Five Years | | Life of Fund | |
Return Before Taxes | | 30.29 | % | 22.26 | % | 3.80 | % |
Return After Taxes on Distributions | | 30.31 | | 22.42 | | 3.87 | |
Return After Taxes on Distributions and Sale of Fund Shares | | 19.76 | | 20.01 | | 3.38 | |
Class A, Class B and Class C of the Fund commenced investment operations on 4/22/98. Returns at Public Offering Price (POP) reflect the deduction of the maximum initial sales charge and applicable CDSC, while Returns at Net Asset Value (NAV) do not.
After-tax returns are calculated using certain assumptions. After-tax returns are calculated using the highest historical individual federal income tax rates and do not reflect the impact of state and local taxes. Actual after-tax returns depend on a shareholder’s tax situation and the actual characterization of distributions and may differ from those shown. After-tax returns are not relevant to shareholders who hold shares in tax-deferred accounts or to shares held by non-taxable entities. Return After Taxes on Distributions for a period may be the same as Return Before Taxes for the same period because no taxable distributions were made during that period. Return After Taxes on Distributions and Sale of Fund Shares for a period may be greater than or equal to Return After Taxes on Distributions for the same period because of losses realized on the sale of Fund shares. The Fund’s after-tax returns also may reflect foreign tax credits passed by the Fund to its shareholders.
Past performance is no guarantee of future results. Returns are historical and are calculated by determining the percentage change in net asset value or offering price (as applicable) with all distributions reinvested. Investment return and principal value will fluctuate so that shares, when redeemed, may be worth more or less than their original cost. Performance is for the stated time period only; due to market volatility, the Fund’s current performance may be lower or higher than the quoted return. Fund performance during certain periods reflects the strong stock market performance and/or the strong performance of stocks held during those periods. This performance is not typical and may not be repeated. For performance as of the most recent month end, please refer to www.eatonvance.com.
4
Eaton Vance Tax-Managed International Equity Fund as of October 31, 2007
FUND EXPENSES
Example: As a shareholder of the Fund, you incur two types of costs: (1) transaction costs, including sales charges (loads) on purchases and redemption fees (if applicable); and (2) ongoing costs, including management fees; distribution or service fees; and other Fund expenses. This Example is intended to help you understand your ongoing costs (in dollars) of investing in the Fund and to compare these costs with the ongoing costs of investing in other mutual funds. The Example is based on an investment of $1,000 invested at the beginning of the period and held for the entire period (May 1, 2007 – October 31, 2007).
Actual Expenses: The first section of the table below provides information about actual account values and actual expenses. You may use the information in this section, together with the amount you invested, to estimate the expenses that you paid over the period. Simply divide your account value by $1,000 (for example, an $8,600 account value divided by $1,000 = 8.6), then multiply the result by the number in the first section under the heading entitled "Expenses Paid During Period" to estimate the expenses you paid on your account during this period.
Hypothetical Example for Comparison Purposes: The second section of the table below provides information about hypothetical account values and hypothetical expenses based on the actual Fund expense ratio and an assumed rate of return of 5% per year (before expenses), which is not the actual return of the Fund. The hypothetical account values and expenses may not be used to estimate the actual ending account balance or expenses you paid for the period. You may use this information to compare the ongoing costs of investing in your Fund and other funds. To do so, compare this 5% hypothetical example with the 5% hypothetical examples that appear in the shareholder reports of the other funds.
Please note that the expenses shown in the table are meant to highlight your ongoing costs only and do not reflect any transactional costs, such as sales charges (loads) or redemption fees (if applicable). Therefore, the second section of the table is useful in comparing ongoing costs only, and will not help you determine the relative total costs of owning different funds. In addition, if these transactional costs were included, your costs would have been higher.
Eaton Vance Tax-Managed International Equity Fund
| | | Beginning Account Value
(5/1/07) | | Ending Account Value
(10/31/07) | | Expenses Paid During Period*
(5/1/07 – 10/31/07) | |
| Actual | |
| Class A | | $ | 1,000.00 | | | $ | 1,208.20 | | | $ | 8.52 | | |
| Class B | | $ | 1,000.00 | | | $ | 1,203.40 | | | $ | 12.72 | | |
| Class C | | $ | 1,000.00 | | | $ | 1,204.30 | | | $ | 12.67 | | |
| Hypothetical | |
| (5% return per year before expenses) | |
| Class A | | $ | 1,000.00 | | | $ | 1,017.50 | | | $ | 7.78 | | |
| Class B | | $ | 1,000.00 | | | $ | 1,013.70 | | | $ | 11.62 | | |
| Class C | | $ | 1,000.00 | | | $ | 1,013.70 | | | $ | 11.57 | | |
* Expenses are equal to the Fund's annualized expense ratio of 1.53% for Class A shares, 2.29% for Class B shares, and 2.28% for Class C shares multiplied by the average account value over the period, multiplied by 184/365 (to reflect the one-half year period). The Example assumes that the $1,000 was invested at the net asset value per share determined at the close of business on April 30, 2007. The Example reflects the expenses of both the Fund and the Portfolio.
5
Eaton Vance Tax-Managed International Equity Fund as of October 31, 2007
FINANCIAL STATEMENTS
Statement of Assets and Liabilities
As of October 31, 2007
| Assets | |
Investment in Tax-Managed International Equity Portfolio, at value
(identified cost, $126,914,207) | | $ | 209,791,873 | | |
| Receivable for Fund shares sold | | | 918,930 | | |
| Total assets | | $ | 210,710,803 | | |
| Liabilities | |
| Payable for Fund shares redeemed | | $ | 152,258 | | |
| Payable to affiliate for distribution and service fees | | | 93,967 | | |
| Payable to affiliate for Trustees' fees | | | 334 | | |
| Accrued expenses | | | 81,860 | | |
| Total liabilities | | $ | 328,419 | | |
| Net Assets | | $ | 210,382,384 | | |
| Sources of Net Assets | |
| Paid-in capital | | $ | 231,182,694 | | |
Accumulated net realized loss from Portfolio
(computed on the basis of identified cost) | | | (105,359,834 | ) | |
| Accumulated undistributed net investment income | | | 1,681,858 | | |
Net unrealized appreciation from Portfolio
(computed on the basis of identified cost) | | | 82,877,666 | | |
| Total | | $ | 210,382,384 | | |
| Class A Shares | |
| Net Assets | | $ | 125,310,601 | | |
| Shares Outstanding | | | 8,372,688 | | |
Net Asset Value and Redemption Price Per Share
(net assets ÷ shares of beneficial interest outstanding) | | $ | 14.97 | | |
Maximum Offering Price Per Share
(100 ÷ 94.25 of $14.97) | | $ | 15.88 | | |
| Class B Shares | |
| Net Assets | | $ | 31,891,990 | | |
| Shares Outstanding | | | 2,245,174 | | |
Net Asset Value and Offering Price Per Share*
(net assets ÷ shares of beneficial interest outstanding) | | $ | 14.20 | | |
| Class C Shares | |
| Net Assets | | $ | 53,179,793 | | |
| Shares Outstanding | | | 3,758,627 | | |
Net Asset Value and Offering Price Per Share*
(net assets ÷ shares of beneficial interest outstanding) | | $ | 14.15 | | |
On sales of $50,000 or more, the offering price of Class A shares is reduced.
* Redemption price per share is equal to the net asset value less any applicable contingent deferred sales charge.
Statement of Operations
For the Year Ended
October 31, 2007
| Investment Income | |
| Dividends allocated from Portfolio (net of foreign taxes, $416,074) | | $ | 5,473,774 | | |
| Interest allocated from Portfolio | | | 155,905 | | |
| Expenses allocated from Portfolio | | | (1,699,610 | ) | |
| Net investment income from Portfolio | | $ | 3,930,069 | | |
| Expenses | |
| Trustees' fees and expenses | | $ | 3,884 | | |
Distribution and service fees
Class A | | | 217,090 | | |
| Class B | | | 297,563 | | |
| Class C | | | 384,649 | | |
| Transfer and dividend disbursing agent fees | | | 201,026 | | |
| Registration fees | | | 47,482 | | |
| Printing and postage | | | 35,726 | | |
| Custodian fee | | | 29,131 | | |
| Legal and accounting services | | | 23,022 | | |
| Miscellaneous | | | 6,551 | | |
| Total expenses | | $ | 1,246,124 | | |
| Net investment income | | $ | 2,683,945 | | |
| Realized and Unrealized Gain (Loss) from Portfolio | |
Net realized gain (loss) —
Investment transactions (identified cost basis) | | $ | 6,267,125 | | |
| Foreign currency transactions | | | (119,638 | ) | |
| Net realized gain | | $ | 6,147,487 | | |
Change in unrealized appreciation (depreciation) —
Investments (identified cost basis) | | $ | 41,539,271 | | |
| Foreign currency | | | 17,244 | | |
| Net change in unrealized appreciation (depreciation) | | $ | 41,556,515 | | |
| Net realized and unrealized gain | | $ | 47,704,002 | | |
| Net increase in net assets from operations | | $ | 50,387,947 | | |
See notes to financial statements
6
Eaton Vance Tax-Managed International Equity Fund as of October 31, 2007
FINANCIAL STATEMENTS CONT'D
Statements of Changes in Net Assets
Increase (Decrease)
in Net Assets | | Year Ended
October 31, 2007 | | Year Ended
October 31, 2006 | |
From operations —
Net investment income | | $ | 2,683,945 | | | $ | 384,837 | | |
Net realized gain from investment and
foreign currency transactions | | | 6,147,487 | | | | 4,178,831 | | |
Net change in unrealized appreciation
(depreciation) from investments and
foreign currency | | | 41,556,515 | | | | 18,124,538 | | |
| Net increase in net assets from operations | | $ | 50,387,947 | | | $ | 22,688,206 | | |
Distributions to shareholders —
From net investment income | |
| Class A | | $ | (612,786 | ) | | $ | (266,710 | ) | |
| Class B | | | (41,077 | ) | | | (29,574 | ) | |
| Class C | | | (120,816 | ) | | | (35,806 | ) | |
| Total distributions to shareholders | | $ | (774,679 | ) | | $ | (332,090 | ) | |
Transactions in shares of beneficial interest —
Proceeds from sale of shares
Class A | | $ | 46,330,072 | | | $ | 26,439,564 | | |
| Class B | | | 3,517,847 | | | | 3,438,109 | | |
| Class C | | | 17,068,814 | | | | 8,151,469 | | |
Net asset value of shares issued to
shareholders in payment of
distributions declared
Class A | | | 463,056 | | | | 205,637 | | |
| Class B | | | 35,468 | | | | 25,416 | | |
| Class C | | | 93,928 | | | | 27,556 | | |
Cost of shares redeemed
Class A | | | (12,860,695 | ) | | | (8,678,616 | ) | |
| Class B | | | (6,353,502 | ) | | | (7,058,912 | ) | |
| Class C | | | (4,457,400 | ) | | | (4,128,144 | ) | |
Net asset value of shares exchanged
Class A | | | 3,487,781 | | | | 2,198,364 | | |
| Class B | | | (3,487,781 | ) | | | (2,198,364 | ) | |
| Redemption fees | | | 6,630 | | | | 4,264 | | |
Net increase in net assets from Fund
share transactions | | $ | 43,844,218 | | | $ | 18,426,343 | | |
| Net increase in net assets | | $ | 93,457,486 | | | $ | 40,782,459 | | |
| Net Assets | |
| At beginning of year | | $ | 116,924,898 | | | $ | 76,142,439 | | |
| At end of year | | $ | 210,382,384 | | | $ | 116,924,898 | | |
Accumulated undistributed
net investment income (loss)
included in net assets | |
| At end of year | | $ | 1,681,858 | | | $ | (107,773 | ) | |
See notes to financial statements
7
Eaton Vance Tax-Managed International Equity Fund as of October 31, 2007
FINANCIAL STATEMENTS CONT'D
Financial Highlights
| | | Class A | |
| | | Year Ended October 31, | |
| | | 2007(1) | | 2006(1) | | 2005(1) | | 2004(1) | | 2003(1) | |
| Net asset value — Beginning of year | | $ | 11.080 | | | $ | 8.670 | | | $ | 7.080 | | | $ | 6.210 | | | $ | 5.330 | | |
| Income (loss) from operations | |
| Net investment income | | $ | 0.266 | (5) | | $ | 0.082 | | | $ | 0.056 | | | $ | 0.026 | | | $ | 0.015 | | |
| Net realized and unrealized gain | | | 3.731 | | | | 2.403 | | | | 1.534 | | | | 0.844 | | | | 0.865 | | |
| Total income from operations | | $ | 3.997 | | | $ | 2.485 | | | $ | 1.590 | | | $ | 0.870 | | | $ | 0.880 | | |
| Less distributions | |
| From net investment income | | $ | (0.107 | ) | | $ | (0.075 | ) | | $ | — | | | $ | — | | | $ | — | | |
| Total distributions | | $ | (0.107 | ) | | $ | (0.075 | ) | | $ | — | | | $ | — | | | $ | — | | |
| Redemption fees | | $ | 0.000 | (2) | | $ | 0.000 | (2) | | $ | 0.000 | (2) | | $ | 0.000 | (2) | | $ | — | | |
| Net asset value — End of year | | $ | 14.970 | | | $ | 11.080 | | | $ | 8.670 | | | $ | 7.080 | | | $ | 6.210 | | |
| Total Return(3) | | | 36.35 | % | | | 28.85 | % | | | 22.46 | % | | | 14.01 | % | | | 16.51 | % | |
| Ratios/Supplemental Data | |
| Net assets, end of year (000's omitted) | | $ | 125,311 | | | $ | 59,486 | | | $ | 29,634 | | | $ | 24,714 | | | $ | 23,857 | | |
| Ratios (As a percentage of average daily net assets): | |
| Expenses before custodian fee reduction(4) | | | 1.57 | % | | | 1.67 | % | | | 1.89 | % | | | 2.08 | % | | | 2.09 | % | |
| Expenses after custodian fee reduction(4) | | | 1.57 | % | | | 1.67 | % | | | 1.89 | % | | | 2.08 | % | | | 2.09 | % | |
| Net investment income | | | 2.12 | % | | | 0.81 | % | | | 0.70 | % | | | 0.38 | % | | | 0.28 | % | |
| Portfolio Turnover | | | 23 | % | | | 25 | % | | | 39 | % | | | 62 | % | | | 100 | % | |
(1) Net investment income and redemption fees per share were computed using average shares outstanding.
(2) Amount represents less than $0.0005 per share.
(3) Returns are historical and are calculated by determining the percentage change in net asset value with all distributions reinvested.
(4) Includes the Fund's share of the Portfolio's allocated expenses.
(5) Net investment income per share reflects a dividend resulting from a corporate action allocated from the Portfolio which amounted to $0.132 per share. Excluding this dividend, the ratio of net investment income to average daily net assets would have been 1.07%.
See notes to financial statements
8
Eaton Vance Tax-Managed International Equity Fund as of October 31, 2007
FINANCIAL STATEMENTS CONT'D
Financial Highlights
| | | Class B | |
| | | Year Ended October 31, | |
| | | 2007(1) | | 2006(1) | | 2005(1) | | 2004(1) | | 2003(1) | |
| Net asset value — Beginning of year | | $ | 10.510 | | | $ | 8.230 | | | $ | 6.770 | | | $ | 5.980 | | | $ | 5.170 | | |
| Income (loss) from operations | |
| Net investment income (loss) | | $ | 0.132 | (5) | | $ | 0.008 | | | $ | (0.004 | ) | | $ | (0.026 | ) | | $ | (0.024 | ) | |
| Net realized and unrealized gain | | | 3.573 | | | | 2.281 | | | | 1.464 | | | | 0.816 | | | | 0.834 | | |
| Total income from operations | | $ | 3.705 | | | $ | 2.289 | | | $ | 1.460 | | | $ | 0.790 | | | $ | 0.810 | | |
| Less distributions | |
| From net investment income | | $ | (0.015 | ) | | $ | (0.009 | ) | | $ | — | | | $ | — | | | $ | — | | |
| Total distributions | | $ | (0.015 | ) | | $ | (0.009 | ) | | $ | — | | | $ | — | | | $ | — | | |
| Redemption fees | | $ | 0.000 | (2) | | $ | 0.000 | (2) | | $ | 0.000 | (2) | | $ | 0.000 | (2) | | $ | — | | |
| Net asset value — End of year | | $ | 14.200 | | | $ | 10.510 | | | $ | 8.230 | | | $ | 6.770 | | | $ | 5.980 | | |
| Total Return(3) | | | 35.29 | % | | | 27.83 | % | | | 21.56 | % | | | 13.21 | % | | | 15.67 | % | |
| Ratios/Supplemental Data | |
| Net assets, end of year (000's omitted) | | $ | 31,892 | | | $ | 29,214 | | | $ | 27,861 | | | $ | 27,546 | | | $ | 27,764 | | |
| Ratios (As a percentage of average daily net assets): | |
| Expenses before custodian fee reduction(4) | | | 2.32 | % | | | 2.42 | % | | | 2.64 | % | | | 2.83 | % | | | 2.84 | % | |
| Expenses after custodian fee reduction(4) | | | 2.32 | % | | | 2.42 | % | | | 2.64 | % | | | 2.83 | % | | | 2.84 | % | |
| Net investment income (loss) | | | 1.12 | % | | | 0.08 | % | | | (0.05 | )% | | | (0.40 | )% | | | (0.46 | )% | |
| Portfolio Turnover | | | 23 | % | | | 25 | % | | | 39 | % | | | 62 | % | | | 100 | % | |
(1) Net investment income (loss) and redemption fees per share were computed using average shares outstanding.
(2) Amount represents less than $0.0005 per share.
(3) Returns are historical and are calculated by determining the percentage change in net asset value with all distributions reinvested.
(4) Includes the Fund's share of the Portfolio's allocated expenses.
(5) Net investment income per share reflects a dividend resulting from a corporate action allocated from the Portfolio which amounted to $0.097 per share. Excluding this dividend, the ratio of net investment income to average daily net assets would have been 0.29%.
See notes to financial statements
9
Eaton Vance Tax-Managed International Equity Fund as of October 31, 2007
FINANCIAL STATEMENTS CONT'D
Financial Highlights
| | | Class C | |
| | | Year Ended October 31, | |
| | | 2007(1) | | 2006(1) | | 2005(1) | | 2004(1) | | 2003(1) | |
| Net asset value — Beginning of year | | $ | 10.500 | | | $ | 8.220 | | | $ | 6.760 | | | $ | 5.970 | | | $ | 5.160 | | |
| Income (loss) from operations | |
| Net investment income (loss) | | $ | 0.156 | (5) | | $ | 0.009 | | | $ | (0.004 | ) | | $ | (0.025 | ) | | $ | (0.023 | ) | |
| Net realized and unrealized gain | | | 3.536 | | | | 2.287 | | | | 1.464 | | | | 0.815 | | | | 0.833 | | |
| Total income from operations | | $ | 3.692 | | | $ | 2.296 | | | $ | 1.460 | | | $ | 0.790 | | | $ | 0.810 | | |
| Less distributions | |
| From net investment income | | $ | (0.042 | ) | | $ | (0.016 | ) | | $ | — | | | $ | — | | | $ | — | | |
| Total distributions | | $ | (0.042 | ) | | $ | (0.016 | ) | | $ | — | | | $ | — | | | $ | — | | |
| Redemption fees | | $ | 0.000 | (2) | | $ | 0.000 | (2) | | $ | 0.000 | (2) | | $ | 0.000 | (2) | | $ | — | | |
| Net asset value — End of year | | $ | 14.150 | | | $ | 10.500 | | | $ | 8.220 | | | $ | 6.760 | | | $ | 5.970 | | |
| Total Return(3) | | | 35.27 | % | | | 27.96 | % | | | 21.60 | % | | | 13.23 | % | | | 15.70 | % | |
| Ratios/Supplemental Data | |
| Net assets, end of year (000's omitted) | | $ | 53,180 | | | $ | 28,225 | | | $ | 18,647 | | | $ | 17,797 | | | $ | 18,616 | | |
| Ratios (As a percentage of average daily net assets): | |
| Expenses before custodian fee reduction(4) | | | 2.32 | % | | | 2.42 | % | | | 2.64 | % | | | 2.83 | % | | | 2.84 | % | |
| Expenses after custodian fee reduction(4) | | | 2.32 | % | | | 2.42 | % | | | 2.64 | % | | | 2.83 | % | | | 2.84 | % | |
| Net investment income (loss) | | | 1.32 | % | | | 0.09 | % | | | (0.06 | )% | | | (0.39 | )% | | | (0.44 | )% | |
| Portfolio Turnover | | | 23 | % | | | 25 | % | | | 39 | % | | | 62 | % | | | 100 | % | |
(1) Net investment income (loss) and redemption fees per share were computed using average shares outstanding.
(2) Amount represents less than $0.0005 per share.
(3) Returns are historical and are calculated by determining the percentage change in net asset value with all distributions reinvested.
(4) Includes the Fund's share of the Portfolio's allocated expenses.
(5) Net investment income per share reflects a dividend resulting from a corporate action allocated from the Portfolio which amounted to $0.119 per share. Excluding this dividend, the ratio of net investment income to average daily net assets would have been 0.31%.
See notes to financial statements
10
Eaton Vance Tax-Managed International Equity Fund as of October 31, 2007
NOTES TO FINANCIAL STATEMENTS
1 Significant Accounting Policies
Eaton Vance Tax-Managed International Equity Fund (the Fund) is a diversified series of Eaton Vance Mutual Funds Trust (the Trust). The Trust is a Massachusetts business trust registered under the Investment Company Act of 1940, as amended (the 1940 Act), as an open-end management investment company. The Fund offers three classes of shares. Class A shares are generally sold subject to a sales charge imposed at time of purchase. Class B and Class C shares are sold at net asset value and are subject to a contingent deferred sales charge (see Note 6). Class B shares automatically convert to Class A shares eight years after their purchase as described in the Fund's prospectus. Each class represents a pro-rata interest in the Fund, but votes separately on class-specific matters and (as noted below) is subject to different expenses. Realized and unrealized gains and losses and net investment income and losses, other than class-specifi c expenses, are allocated daily to each class of shares based on the relative net assets of each class to the total net assets of the Fund. Each class of shares differs in its distribution plan and certain other class-specific expenses. The Fund invests all of its investable assets in interests in the Tax-Managed International Equity Portfolio (the Portfolio), a New York trust, having the same investment objective and policies as the Fund. The value of the Fund's investment in the Portfolio reflects the Fund's proportionate interest in the net assets of the Portfolio (53.6% at October 31, 2007). The performance of the Fund is directly affected by the performance of the Portfolio. The financial statements of the Portfolio, including the portfolio of investments, are included elsewhere in this report and should be read in conjunction with the Fund's financial statements.
The following is a summary of significant accounting policies of the Fund. The policies are in conformity with accounting principles generally accepted in the United States of America.
A Investment Valuation — Valuation of securities by the Portfolio is discussed in Note 1A of the Portfolio's Notes to Financial Statements, which are included elsewhere in this report.
B Income — The Fund's net investment income or loss consists of the Fund's pro-rata share of the net investment income or loss of the Portfolio, less all actual and accrued expenses of the Fund.
C Federal Taxes — The Fund's policy is to comply with the provisions of the Internal Revenue Code applicable to regulated investment companies and to distribute to shareholders each year substantially all of its net investment income, and all or substantially all of its net realized capital gains. Accordingly, no provision for federal income or excise tax is necessary. At October 31, 2007, the Fund, for federal income tax purposes, had a capital loss carryforward of $105,110,588 which will reduce the taxable income arising from future net realized gains on investment transactions, if any, to the extent permitted by the Internal Revenue Code, and thus will reduce the amount of distributions to sharehol ders which would otherwise be necessary to relieve the Fund of any liability for federal income or excise tax. The capital loss carryforward will expire on October 31, 2009 ($16,044,050), October 31, 2010 ($49,131,487) and October 31, 2011 ($39,935,051). During the year ended October 31, 2007, capital loss carryforwards of $6,276,708 were utilized to offset net realized gains.
D Expenses — The majority of expenses of the Trust are directly identifiable to an individual fund. Expenses which are not readily identifiable to a specific fund are allocated taking into consideration, among other things, the nature and type of expense and the relative size of the funds.
E Expense Reduction — State Street Bank and Trust Company (SSBT) serves as custodian of the Fund. Pursuant to the custodian agreement, SSBT receives a fee reduced by credits, which are determined based on the average daily cash balance the Fund maintains with SSBT. All credit balances, if any, used to reduce the Fund's custodian fees are reported as a reduction of expenses in the Statement of Operations.
F Use of Estimates — The preparation of the financial statements in conformity with accounting principles generally accepted in the United States of America requires management to make estimates and assumptions that affect the reported amounts of assets and liabilities at the date of the financial statements and the reported amounts of income and expense during the reporting period. Actual results could differ from those estimates.
G Indemnifications — Under the Trust's organizational documents, its officers and Trustees may be indemnified against certain liabilities and expenses arising out of the performance of their duties to the Fund, and shareholders are indemnified against personal liability for obligations of the Trust. Additionally, in the normal course of business, the Fund enters into agreements with service providers that may contain indemnification clauses. The Fund's maximum exposure under these arrangements is unknown as this would involve future claims that may be made against the Fund that have not yet occurred.
11
Eaton Vance Tax-Managed International Equity Fund as of October 31, 2007
NOTES TO FINANCIAL STATEMENTS CONT'D
H Redemption Fees — Upon the redemption or exchange of shares by Class A shareholders within 90 days of the settlement of purchase, a fee of 1% of the current net asset value of these shares will be assessed and retained by the Fund for the benefit of the remaining shareholders. The redemption fee is accounted for as an addition to paid-in capital.
I Other — Investment transactions are accounted for on a trade date basis. Dividends to shareholders are recorded on the ex-dividend date.
2 Distributions to Shareholders
It is the present policy of the Fund to make at least one distribution annually (normally in December) of all or substantially all of its net investment income and to distribute annually all or substantially all of its net realized capital gains (reduced by available capital loss carryforwards from prior years, if any). Distributions are declared separately for each class of shares. Shareholders may reinvest distributions in shares of the same class of the Fund at the net asset value as of the ex-dividend date or, at the election of the shareholder, receive distributions in cash. The Fund distinguishes between distributions on a tax basis and a financial reporting basis. Accounting principles generally accepted in the United States of America require that only distributions in excess of tax basis earnings and profits be reported in the financial statements as a return of capital. Permanent differences between book and tax accoun ting relating to distributions are reclassified to paid-in capital.
The tax character of distributions declared for the years ended October 31, 2007 and October 31, 2006 was as follows:
| | | Year Ended October 31, | |
| | | 2007 | | 2006 | |
| Distributions declared from: | |
| Ordinary income | | $ | 774,679 | | | $ | 332,090 | | |
During the year ended October 31, 2007, accumulated undistributed net investment income was decreased by $119,635 and accumulated net realized loss was decreased by $119,635 due to differences between book and tax accounting, primarily for foreign currency gain (loss). These reclassifications had no effect on the net assets or net asset value per share of the Fund.
At October 31, 2007, the components of distributable earnings (accumulated losses) and unrealized appreciation (depreciation) on a tax basis were as follows:
| Undistributed ordinary income | | $ | 2,139,480 | | |
| Capital loss carryforward | | $ | (105,110,588 | ) | |
| Unrealized appreciation | | $ | 82,170,798 | | |
The differences between components of distributable earnings (accumulated losses) on a tax basis and the amounts reflected in the Statement of Assets and Liabilities are primarily due to wash sales, investments in passive foreign investment companies and differences between book and tax accounting for partnership allocations.
3 Shares of Beneficial Interest
The Fund's Declaration of Trust permits the Trustees to issue an unlimited number of full and fractional shares of beneficial interest (without par value). Such shares may be issued in a number of different series (such as the Fund) and classes. Transactions in Fund shares were as follows:
| | | Year Ended October 31, | |
| Class A | | 2007 | | 2006 | |
| Sales | | | 3,726,794 | | | | 2,576,187 | | |
Issued to shareholders electing to receive
payments of distributions in Fund shares | | | 39,578 | | | | 22,400 | | |
| Redemptions | | | (1,037,452 | ) | | | (865,189 | ) | |
| Exchange from Class B shares | | | 275,806 | | | | 217,520 | | |
| Net increase | | | 3,004,726 | | | | 1,950,918 | | |
| | | Year Ended October 31, | |
| Class B | | 2007 | | 2006 | |
| Sales | | | 295,582 | | | | 357,782 | | |
Issued to shareholders electing to receive
payments of distributions in Fund shares | | | 3,172 | | | | 2,901 | | |
| Redemptions | | | (542,019 | ) | | | (738,547 | ) | |
| Exchange to Class A shares | | | (289,919 | ) | | | (228,763 | ) | |
| Net decrease | | | (533,184 | ) | | | (606,627 | ) | |
| | | Year Ended October 31, | |
| Class C | | 2007 | | 2006 | |
| Sales | | | 1,444,871 | | | | 851,048 | | |
Issued to shareholders electing to receive
payments of distributions in Fund shares | | | 8,439 | | | | 3,149 | | |
| Redemptions | | | (383,223 | ) | | | (433,492 | ) | |
| Net increase | | | 1,070,087 | | | | 420,705 | | |
12
Eaton Vance Tax-Managed International Equity Fund as of October 31, 2007
NOTES TO FINANCIAL STATEMENTS CONT'D
For the years ended October 31, 2007 and October 31, 2006, the Fund received $6,630 and $4,264, respectively, in redemption fees on Class A shares.
4 Transactions with Affiliates
Eaton Vance Management (EVM) serves as the administrator of the Fund, but receives no compensation. The Portfolio has engaged Boston Management and Research (BMR), a subsidiary of EVM, to render investment advisory services. See Note 2 of the Portfolio's Notes to Financial Statements which are included elsewhere in this report. EVM serves as the sub-transfer agent of the Fund and receives from the transfer agent an aggregate fee based upon the actual expenses incurred by EVM in the performance of these services. For the year ended October 31, 2007, EVM earned $14,381 in sub-transfer agent fees. The Fund was informed that Eaton Vance Distributors, Inc. (EVD), a subsidiary of EVM and the Fund's principal underwriter, received $72,672 as its portion of the sales charge on sales of Class A shares for the year ended October 31, 2007. EVD also received distribution and service fees from Class A, Class B and Class C shares (see Note 5) and contingent deferred sales charges (see Note 6).
Except for Trustees of the Fund and the Portfolio who are not members of EVM's or BMR's organizations, officers and Trustees receive remuneration for their services to the Fund out of the investment advisory fee. Certain officers and Trustees of the Fund and the Portfolio are officers of the above organizations.
5 Distribution Plans
The Fund has in effect a distribution plan for Class A shares (Class A Plan) pursuant to Rule 12b-1 under the 1940 Act. The Class A Plan provides that the Fund will pay EVD a distribution and service fee of 0.25% per annum of its average daily net assets attributable to Class A shares for distribution services and facilities provided to the Fund by EVD, as well as for personal services and/or the maintenance of shareholder accounts. Distribution and service fees paid or accrued to EVD for the year ended October 31, 2007 for Class A shares amounted to $217,090. The Fund also has in effect distribution plans for Class B shares (Class B Plan) and Class C shares (Class C Plan) pursuant to Rule 12b-1 under the 1940 Act. The Class B and Class C Plans require the Fund to pay EVD amounts equal to 0.75% per annum of its average daily net assets attributable to Class B and Class C shares for providing ongoing distribution services and fac ilities to the Fund. The Fund will automatically discontinue payments to EVD during any period in which there are no outstanding Uncovered Distribution Charges, which are equivalent to the sum of (i) 5% and 6.25% of the aggregate amount received by the Fund for Class B and Class C shares sold, respectively, plus (ii) interest calculated by applying the rate of 1% over the prevailing prime rate to the outstanding balance of Uncovered Distribution Charges of EVD of each respective class, reduced by the aggregate amount of contingent deferred sales charges (see Note 6) and amounts theretofore paid or payable to EVD by each respective class. For the year ended October 31, 2007, the Fund paid or accrued to EVD $223,172 and $288,487 for Class B and Class C shares, respectively, representing 0.75% of the average daily net assets of Class B and Class C shares. At October 31, 2007, the amounts of Uncovered Distribution Charges of EVD calculated u nder the Plans were approximately $3,874,000 and $8,513,000 for Class B and Class C shares, respectively. The Class B and Class C Plans also authorize the Fund to make payments of service fees to EVD, investment dealers, and other persons in amounts not exceeding 0.25% per annum of its average daily net assets attributable to that class. Service fees paid or accrued are for personal services and/or the maintenance of shareholder accounts. They are separate and distinct from the sales commissions and distribution fees payable to EVD and, as such, are not subject to automatic discontinuance when there are no outstanding Uncovered Distribution Charges of EVD. Service fees paid or accrued for the year ended October 31, 2007 amounted to $74,391 and $96,162 for Class B and Class C shares, respectively.
6 Contingent Deferred Sales Charges
A contingent deferred sales charge (CDSC) generally is imposed on redemptions of Class B shares made within six years of purchase and on redemptions of Class C shares made within one year of purchase. Class A shares may be subject to a CDSC of up to 1% if redeemed within two years of purchase (depending on the circumstances of purchase). Generally, the CDSC is based upon the lower of the net asset value at date of redemption or date of purchase. No charge is levied on shares acquired by reinvestment of dividends or capital gains distributions. The CDSC for Class B shares is imposed at declining rates that begin at 5% in the case of redemptions in the first and second year after purchase, declining one percentage point each subsequent year. Class C shares are subject to a 1% CDSC if redeemed within one year of purchase. No CDSC is levied on shares which have been sold to EVM or its affiliates or to their respective employees or c lients and may be waived under certain other limited conditions. CDSCs received on Class B and Class C redemptions are paid to EVD to reduce the amount of Uncovered Distribution Charges calculated under the Fund's Class B and Class C Plans. CDSCs received on Class B and
13
Eaton Vance Tax-Managed International Equity Fund as of October 31, 2007
NOTES TO FINANCIAL STATEMENTS CONT'D
Class C redemptions when no Uncovered Distribution Charges exist are credited to the Fund. For the year ended October 31, 2007, the Fund was informed that EVD received approximately $2,000, $17,000 and $4,000 of CDSCs paid by Class A, Class B and Class C shareholders, respectively.
7 Investment Transactions
Increases and decreases in the Fund's investment in the Portfolio aggregated $66,430,903 and $25,042,108, respectively, for the year ended October 31, 2007.
8 Recently Issued Accounting Pronouncements
In June 2006, the Financial Accounting Standards Board (FASB) issued FASB Interpretation No. 48 (FIN 48), "Accounting for Uncertainty in Income Taxes – an interpretation of FASB Statement No. 109". FIN 48 clarifies the accounting for uncertainty in income taxes recognized in accordance with FASB Statement No. 109, "Accounting for Income Taxes". This interpretation prescribes a recognition threshold and measurement attribute for the financial statement recognition and measurement of a tax position taken or expected to be taken in a tax return. It also provides guidance on de-recognition, classification, interest and penalties, accounting in interim periods, disclosure and transition. FIN 48 is effective on the last business day of the first required financial reporting period for fiscal years beginning after December 15, 2006. Management is currently evaluating the impact of applying the various provisions of FIN 48.
In September 2006, the FASB issued Statement of Financial Accounting Standards No. 157 (FAS 157), "Fair Value Measurements". FAS 157 defines fair value, establishes a framework for measuring fair value in accordance with generally accepted accounting principles and expands disclosure about fair value measurements. FAS 157 is effective for fiscal years beginning after November 15, 2007. Management is currently evaluating the impact the adoption of FAS 157 will have on the Fund's financial statement disclosures.
14
Eaton Vance Tax-Managed International Equity Fund as of October 31, 2007
REPORT OF INDEPENDENT REGISTERED PUBLIC ACCOUNTING FIRM
To the Trustees of Eaton Vance Mutual Funds Trust and the Shareholders of Eaton Vance Tax-Managed International Equity Fund:
We have audited the accompanying statement of assets and liabilities of Eaton Vance Tax-Managed International Equity Fund (the "Fund") (one of the series of Eaton Vance Mutual Funds Trust), as of October 31, 2007, and the related statement of operations for the year then ended, the statements of changes in net assets for each of the two years in the period then ended, and the financial highlights for each of the five years in the period then ended. These financial statements and financial highlights are the responsibility of the Fund's management. Our responsibility is to express an opinion on these financial statements and financial highlights based on our audits.
We conducted our audits in accordance with the standards of the Public Company Accounting Oversight Board (United States). Those standards require that we plan and perform the audit to obtain reasonable assurance about whether the financial statements and financial highlights are free of material misstatement. The Fund is not required to have, nor were we engaged to perform, an audit of its internal control over financial reporting. Our audits included consideration of internal control over financial reporting as a basis for designing audit procedures that are appropriate in the circumstances, but not for the purpose of expressing an opinion on the effectiveness of the Fund's internal control over financial reporting. Accordingly, we express no such opinion. An audit also includes examining, on a test basis, evidence supporting the amounts and disclosures in the financial statements, assessing the accounting principles used and significant estimates made by management, as well as evaluating the overall financial statement presentation. We believe that our audits provide a reasonable basis for our opinion.
In our opinion, the financial statements and financial highlights referred to above present fairly, in all material respects, the financial position of Eaton Vance Tax-Managed International Equity Fund as of October 31, 2007, the results of its operations for the year then ended, the changes in its net assets for each of the two years in the period then ended, and the financial highlights for each of the five years in the period then ended, in conformity with accounting principles generally accepted in the United States of America.
DELOITTE & TOUCHE LLP
Boston, Massachusetts
December 14, 2007
15
Eaton Vance Tax-Managed International Equity Fund as of October 31, 2007
FEDERAL TAX INFORMATION (Unaudited)
The Form 1099-DIV you receive in January 2008 will show the tax status of all distributions paid to your account in calendar 2007. Shareholders are advised to consult their own tax adviser with respect to the tax consequences of their investment in the Fund. As required by the Internal Revenue Code regulations, shareholders must be notified within 60 days of the Fund's fiscal year-end regarding the status of the qualified dividend income for individuals and the foreign tax credit.
Qualified Dividend Income. The Fund designates approximately $5,889,848, or up to the maximum amount of such dividends allowable pursuant to the Internal Revenue Code, as qualified dividend income eligible for the reduced tax rate of 15%.
Foreign Tax Credit. The Fund designates a foreign tax credit of $416,074 and recognizes foreign source income of $5,884,122.
16
Tax-Managed International Equity Portfolio as of October 31, 2007
PORTFOLIO OF INVESTMENTS
| Common Stocks — 98.3% | |
| Security | | Shares | | Value | |
| Airlines — 0.6% | |
| Air France-KLM | | | 62,000 | | | $ | 2,362,940 | | |
| | | $ | 2,362,940 | | |
| Auto Components — 0.4% | |
| Aisin Seiki Co., Ltd. | | | 40,000 | | | $ | 1,644,746 | | |
| | | $ | 1,644,746 | | |
| Automobiles — 1.9% | |
| Honda Motor Co., Ltd. | | | 106,000 | | | $ | 3,972,122 | | |
| Toyota Motor Corp. | | | 60,000 | | | | 3,437,036 | | |
| | | $ | 7,409,158 | | |
| Beverages — 3.9% | |
| Coca-Cola Icecek Uretim AS | | | 100,000 | | | $ | 854,375 | | |
| Diageo PLC | | | 150,000 | | | | 3,438,308 | | |
| Fomento Economico Mexicano SA de C.V. ADR | | | 132,000 | | | | 4,700,520 | | |
| Heineken Holding NV | | | 45,000 | | | | 2,666,213 | | |
| InBev NV | | | 37,400 | | | | 3,535,412 | | |
| | | $ | 15,194,828 | | |
| Capital Markets — 2.1% | |
| Invesco PLC ADR | | | 115,000 | | | $ | 3,525,900 | | |
| UBS AG | | | 84,000 | | | | 4,500,912 | | |
| | | $ | 8,026,812 | | |
| Chemicals — 2.5% | |
| Agrium, Inc. | | | 75,000 | | | $ | 4,767,750 | | |
| BASF AG | | | 20,000 | | | | 2,765,288 | | |
| Makhteshim-Agan Industries, Ltd.(1) | | | 230,000 | | | | 2,209,190 | | |
| | | $ | 9,742,228 | | |
| Commercial Banks — 12.2% | |
| Anglo Irish Bank Corp. PLC | | | 77,400 | | | $ | 1,304,949 | | |
| Australia and New Zealand Banking Group, Ltd. | | | 138,500 | | | | 3,890,631 | | |
| Banco Bilbao Vizcaya Argentaria SA | | | 116,700 | | | | 2,949,664 | | |
| Banco Santander SA | | | 300,000 | | | | 6,552,795 | | |
| Bank of Ireland | | | 120,000 | | | | 2,208,735 | | |
| Barclays PLC | | | 306,800 | | | | 3,879,348 | | |
| BNP Paribas SA | | | 26,500 | | | | 2,933,402 | | |
| Commerzbank AG | | | 85,000 | | | | 3,596,869 | | |
| Security | | Shares | | Value | |
| Commercial Banks (continued) | |
| Danske Bank A/S | | | 52,700 | | | $ | 2,329,638 | | |
| DBS Group Holdings, Ltd. | | | 400,000 | | | | 6,252,286 | | |
| Erste Bank der oesterreichischen Sparkassen AG | | | 43,500 | | | | 3,537,042 | | |
| Grupo Financiero Banorte SA de C.V. | | | 500,000 | | | | 2,340,422 | | |
| Intesa Sanpaolo | | | 230,000 | | | | 1,822,335 | | |
| Societe Generale | | | 12,300 | | | | 2,075,396 | | |
| Woori Finance Holdings Co., Ltd. ADR | | | 34,145 | | | | 2,251,863 | | |
| | | $ | 47,925,375 | | |
| Communications Equipment — 1.2% | |
| Nokia Oyj | | | 120,000 | | | $ | 4,759,937 | | |
| | | $ | 4,759,937 | | |
| Computer Peripherals — 1.1% | |
| Lenovo Group, Ltd. | | | 3,900,000 | | | $ | 4,441,289 | | |
| | | $ | 4,441,289 | | |
| Construction & Engineering — 0.8% | |
| Vinci SA | | | 38,000 | | | $ | 3,131,801 | | |
| | | $ | 3,131,801 | | |
| Construction Materials — 0.8% | |
| Lafarge Malayan Cement Berhad | | | 6,000,000 | | | $ | 3,300,396 | | |
| | | $ | 3,300,396 | | |
| Consumer Finance — 0.8% | |
| Orix Corp. | | | 15,300 | | | $ | 3,140,610 | | |
| | | $ | 3,140,610 | | |
| Diversified Financial Services — 1.8% | |
| Fortis | | | 35,000 | | | $ | 1,123,129 | | |
| ING Groep NV | | | 130,439 | | | | 5,888,382 | | |
| | | $ | 7,011,511 | | |
| Diversified Telecommunication Services — 6.4% | |
| BT Group PLC | | | 1,130,000 | | | $ | 7,673,666 | | |
| France Telecom SA ADR | | | 100,000 | | | | 3,700,000 | | |
| Koninklijke KPN NV | | | 350,000 | | | | 6,600,233 | | |
| Telefonica SA | | | 130,000 | | | | 4,299,127 | | |
| TeliaSonera AB | | | 300,000 | | | | 2,955,522 | | |
| | | $ | 25,228,548 | | |
See notes to financial statements
17
Tax-Managed International Equity Portfolio as of October 31, 2007
PORTFOLIO OF INVESTMENTS CONT'D
| Security | | Shares | | Value | |
| Electric Utilities — 4.4% | |
| E.ON AG | | | 19,340 | | | $ | 3,776,289 | | |
| E.ON AG ADR | | | 51,350 | | | | 3,342,885 | | |
| Enel SPA | | | 460,000 | | | | 5,508,738 | | |
| Scottish and Southern Energy PLC | | | 145,000 | | | | 4,697,615 | | |
| | | $ | 17,325,527 | | |
| Electrical Equipment — 1.0% | |
| ABB, Ltd. ADR | | | 125,000 | | | $ | 3,777,500 | | |
| | | $ | 3,777,500 | | |
| Electronic Equipment & Instruments — 1.0% | |
| Ibiden Co., Ltd. | | | 46,000 | | | $ | 3,901,899 | | |
| | | $ | 3,901,899 | | |
| Energy Equipment & Services — 2.2% | |
| Acergy SA | | | 300,000 | | | $ | 8,655,354 | | |
| | | $ | 8,655,354 | | |
| Food & Staples Retailing — 0.8% | |
| Controladora Comercial Mexicana SA de C.V., unit | | | 1,000,000 | | | $ | 3,110,285 | | |
| | | $ | 3,110,285 | | |
| Food Products — 1.8% | |
| Nestle SA | | | 15,000 | | | $ | 6,924,343 | | |
| | | $ | 6,924,343 | | |
| Gas Utilities — 0.3% | |
| Samchully Co., Ltd. | | | 5,500 | | | $ | 1,204,892 | | |
| | | $ | 1,204,892 | | |
| Industrial Conglomerates — 2.3% | |
| Keppel Corp., Ltd. | | | 890,000 | | | $ | 9,136,114 | | |
| | | $ | 9,136,114 | | |
| Insurance — 3.3% | |
| Aviva PLC | | | 156,700 | | | $ | 2,466,563 | | |
| AXA SA | | | 145,900 | | | | 6,545,180 | | |
| Muenchener Rueckversicherungs-Gesellschaft AG | | | 21,000 | | | | 4,026,183 | | |
| | | $ | 13,037,926 | | |
| Security | | Shares | | Value | |
| Machinery — 4.1% | |
| Atlas Copco AB, Class B | | | 286,000 | | | $ | 4,475,844 | | |
| Komatsu, Ltd. | | | 250,000 | | | | 8,387,481 | | |
| SKF AB ADR | | | 50,000 | | | | 995,000 | | |
| Vallourec SA | | | 8,000 | | | | 2,326,724 | | |
| | | $ | 16,185,049 | | |
| Marine — 1.0% | |
| Cosco Corp. Singapore, Ltd. | | | 700,000 | | | $ | 3,796,439 | | |
| | | $ | 3,796,439 | | |
| Metals & Mining — 11.1% | |
| Anglo American PLC ADR | | | 127,400 | | | $ | 4,452,630 | | |
| BHP Billiton, Ltd. | | | 130,000 | | | | 5,632,553 | | |
| Companhia Vale do Rio Doce ADR | | | 220,000 | | | | 6,945,400 | | |
| JSC MMC Norilsk Nickel ADR | | | 16,000 | | | | 4,744,000 | | |
| Norsk Hydro ASA | | | 100,000 | | | | 1,463,443 | | |
| Rio Tinto, Ltd. | | | 112,500 | | | | 11,619,119 | | |
| Silver Wheaton Corp.(1) | | | 280,000 | | | | 4,723,600 | | |
| Teck Cominco Ltd., Class B | | | 74,000 | | | | 3,685,976 | | |
| | | $ | 43,266,721 | | |
| Multi-Utilities — 2.0% | |
| RWE AG | | | 58,000 | | | $ | 7,913,522 | | |
| | | $ | 7,913,522 | | |
| Office Electronics — 1.4% | |
| Canon, Inc. | | | 111,250 | | | $ | 5,633,089 | | |
| | | $ | 5,633,089 | | |
| Oil, Gas & Consumable Fuels — 6.8% | |
| ENI SPA | | | 75,000 | | | $ | 2,735,094 | | |
| Nexen, Inc. | | | 110,000 | | | | 3,719,100 | | |
| Petroleo Brasileiro SA ADR | | | 90,000 | | | | 7,487,100 | | |
| Sibir Energy PLC | | | 170,000 | | | | 1,923,347 | | |
| StatoilHydro ASA | | | 86,220 | | | | 2,923,842 | | |
| Total SA | | | 96,000 | | | | 7,737,241 | | |
| | | $ | 26,525,724 | | |
| Pharmaceuticals — 2.1% | |
| Novartis AG | | | 50,000 | | | $ | 2,658,225 | | |
| Roche Holding AG | | | 33,500 | | | | 5,718,697 | | |
| | | $ | 8,376,922 | | |
See notes to financial statements
18
Tax-Managed International Equity Portfolio as of October 31, 2007
PORTFOLIO OF INVESTMENTS CONT'D
| Security | | Shares | | Value | |
| Real Estate Management & Development — 0.8% | |
| Sun Hung Kai Properties, Ltd. | | | 155,000 | | | $ | 2,961,987 | | |
| | | $ | 2,961,987 | | |
| Software — 5.6% | |
| Nintendo Co., Ltd. | | | 29,000 | | | $ | 18,430,063 | | |
| UbiSoft Entertainment SA(1) | | | 40,000 | | | | 3,293,648 | | |
| | | $ | 21,723,711 | | |
| Textiles, Apparel & Luxury Goods — 0.5% | |
| Stella International Holdings, Ltd. | | | 800,000 | | | $ | 1,754,658 | | |
| | | $ | 1,754,658 | | |
| Tobacco — 0.9% | |
| British American Tobacco PLC | | | 95,000 | | | $ | 3,615,874 | | |
| | | $ | 3,615,874 | | |
| Trading Companies & Distributors — 1.6% | |
| Mitsubishi Corp. | | | 200,000 | | | $ | 6,231,398 | | |
| | | $ | 6,231,398 | | |
| Wireless Telecommunication Services — 6.8% | |
| Bouygues SA | | | 35,000 | | | $ | 3,373,682 | | |
| China Mobile, Ltd. ADR | | | 65,000 | | | | 6,739,200 | | |
| Philippine Long Distance Telephone Co. ADR | | | 60,300 | | | | 4,136,580 | | |
| Turkcell Iletisim Hizmetleri AS ADR | | | 365,000 | | | | 8,774,600 | | |
| Vodafone Group PLC ADR | | | 95,000 | | | | 3,730,650 | | |
| | | $ | 26,754,712 | | |
Total Common Stocks
(identified cost $225,837,671) | | $ | 385,133,825 | | |
| Short-Term Investments — 0.8% | |
| Description | | Interest
(000's omitted) | | Value | |
| Investment in Cash Management Portfolio, 4.83%(2) | | $ | 3,125 | | | $ | 3,125,331 | | |
Total Short-Term Investments
(identified cost $3,125,331) | | $ | 3,125,331 | | |
Total Investments — 99.1%
(identified cost $228,963,002) | | $ | 388,259,156 | | |
| Other Assets, Less Liabilities — 0.9% | | $ | 3,413,857 | | |
| Net Assets — 100.0% | | $ | 391,673,013 | | |
ADR - American Depository Receipt
(1) Non-income producing security.
(2) Affiliated investment company available to Eaton Vance portfolios and funds which invests in high quality, U.S. dollar denominated money market instruments. The rate shown is the annualized seven-day yield as of October 31, 2007.
See notes to financial statements
19
Tax-Managed International Equity Portfolio as of October 31, 2007
PORTFOLIO OF INVESTMENTS CONT'D
| Country Concentration of Portfolio | |
| Country | | Percentage
of Net Assets | | Value | |
| Japan | | | 14.0 | % | | $ | 54,778,444 | | |
| United Kingdom | | | 10.1 | | | | 39,403,902 | | |
| France | | | 9.6 | | | | 37,480,013 | | |
| Germany | | | 6.5 | | | | 25,421,036 | | |
| Switzerland | | | 6.0 | | | | 23,579,678 | | |
| Australia | | | 5.4 | | | | 21,142,302 | | |
| Singapore | | | 4.9 | | | | 19,184,839 | | |
| Canada | | | 4.3 | | | | 16,896,426 | | |
| Netherlands | | | 3.9 | | | | 15,154,828 | | |
| Brazil | | | 3.7 | | | | 14,432,500 | | |
| Spain | | | 3.5 | | | | 13,801,586 | | |
| Norway | | | 3.3 | | | | 13,042,639 | | |
| China | | | 3.3 | | | | 12,935,147 | | |
| Mexico | | | 2.6 | | | | 10,151,227 | | |
| Italy | | | 2.6 | | | | 10,066,167 | | |
| Turkey | | | 2.4 | | | | 9,628,975 | | |
| Sweden | | | 2.1 | | | | 8,426,366 | | |
| Finland | | | 1.2 | | | | 4,759,937 | | |
| Russia | | | 1.2 | | | | 4,744,000 | | |
| Belgium | | | 1.2 | | | | 4,658,541 | | |
| Philippines | | | 1.0 | | | | 4,136,580 | | |
| Austria | | | 0.9 | | | | 3,537,042 | | |
| Ireland | | | 0.9 | | | | 3,513,684 | | |
| Republic of Korea | | | 0.9 | | | | 3,456,755 | | |
| Malaysia | | | 0.8 | | | | 3,300,396 | | |
| United States | | | 0.8 | | | | 3,125,331 | | |
| Hong Kong | | | 0.8 | | | | 2,961,987 | | |
| Denmark | | | 0.6 | | | | 2,329,638 | | |
| Israel | | | 0.6 | | | | 2,209,190 | | |
| Total Investments | | | 99.1 | % | | $ | 388,259,156 | | |
See notes to financial statements
20
Tax-Managed International Equity Portfolio as of October 31, 2007
FINANCIAL STATEMENTS
Statement of Assets and Liabilities
As of October 31, 2007
| Assets | |
| Unaffiliated investments, at value (identified cost, $225,837,671) | | $ | 385,133,825 | | |
| Affiliated investment, at value (identified cost, $3,125,331) | | | 3,125,331 | | |
| Receivable for investments sold | | | 3,135,429 | | |
| Dividends receivable | | | 386,786 | | |
| Interest receivable from affiliated investment | | | 20,247 | | |
| Tax reclaims receivable | | | 305,786 | | |
| Total assets | | $ | 392,107,404 | | |
| Liabilities | |
| Payable to affiliate for investment advisory fee | | $ | 309,625 | | |
| Payable to affiliate for Trustees' fees | | | 1,502 | | |
| Accrued expenses | | | 123,264 | | |
| Total liabilities | | $ | 434,391 | | |
| Net Assets applicable to investors' interest in Portfolio | | $ | 391,673,013 | | |
| Sources of Net Assets | |
| Net proceeds from capital contributions and withdrawals | | $ | 232,339,800 | | |
| Net unrealized appreciation (computed on the basis of identified cost) | | | 159,333,213 | | |
| Total | | $ | 391,673,013 | | |
Statement of Operations
For the Year Ended
October 31, 2007
| Investment Income | |
| Dividends (net of foreign taxes, $814,686) | | $ | 10,589,353 | | |
| Interest | | | 12,674 | | |
| Interest income allocated from affiliated investment | | | 293,240 | | |
| Expenses allocated from affiliated investment | | | (27,654 | ) | |
| Total investment income | | $ | 10,867,613 | | |
| Expenses | |
| Investment adviser fee | | $ | 2,991,018 | | |
| Trustees' fees and expenses | | | 16,304 | | |
| Custodian fee | | | 236,187 | | |
| Legal and accounting services | | | 35,068 | | |
| Miscellaneous | | | 6,470 | | |
| Total expenses | | $ | 3,285,047 | | |
Deduct —
Reduction of custodian fee | | $ | 13 | | |
| Total expense reductions | | $ | 13 | | |
| Net expenses | | $ | 3,285,034 | | |
| Net investment income | | $ | 7,582,579 | | |
| Realized and Unrealized Gain (Loss) | |
Net realized gain (loss) —
Investment transactions (identified cost basis) | | $ | 11,984,349 | | |
| Foreign currency transactions | | | (234,576 | ) | |
| Net realized gain | | $ | 11,749,773 | | |
Change in unrealized appreciation (depreciation) —
Investments (identified cost basis) | | $ | 80,172,608 | | |
| Foreign currency | | | 32,517 | | |
| Net change in unrealized appreciation (depreciation) | | $ | 80,205,125 | | |
| Net realized and unrealized gain | | $ | 91,954,898 | | |
| Net increase in net assets from operations | | $ | 99,537,477 | | |
See notes to financial statements
21
Tax-Managed International Equity Portfolio as of October 31, 2007
FINANCIAL STATEMENTS CONT'D
Statements of Changes in Net Assets
Increase (Decrease)
in Net Assets | | Year Ended
October 31, 2007 | | Year Ended
October 31, 2006 | |
From operations —
Net investment income | | $ | 7,582,579 | | | $ | 2,620,011 | | |
Net realized gain from investment
and foreign currency transactions | | | 11,749,773 | | | | 7,701,613 | | |
Net change in unrealized appreciation
(depreciation) from investments
and foreign currency | | | 80,205,125 | | | | 36,902,784 | | |
| Net increase in net assets from operations | | $ | 99,537,477 | | | $ | 47,224,408 | | |
Capital transactions —
Contributions | | $ | 88,908,570 | | | $ | 50,247,326 | | |
| Withdrawals | | | (25,049,824 | ) | | | (20,795,552 | ) | |
Net increase in net assets from
capital transactions | | $ | 63,858,746 | | | $ | 29,451,774 | | |
| Net increase in net assets | | $ | 163,396,223 | | | $ | 76,676,182 | | |
| Net Assets | |
| At beginning of year | | $ | 228,276,790 | | | $ | 151,600,608 | | |
| At end of year | | $ | 391,673,013 | | | $ | 228,276,790 | | |
See notes to financial statements
22
Tax-Managed International Equity Portfolio as of October 31, 2007
FINANCIAL STATEMENTS CONT'D
Supplementary Data
| | | Year Ended October 31, | |
| | | 2007 | | 2006 | | 2005 | | 2004 | | 2003 | |
| Ratios/Supplemental Data | |
| Ratios (As a percentage of average daily net assets): | |
| Expenses before custodian fee reduction | | | 1.10 | % | | | 1.12 | % | | | 1.16 | % | | | 1.21 | % | | | 1.23 | % | |
| Expenses after custodian fee reduction | | | 1.10 | % | | | 1.12 | % | | | 1.16 | % | | | 1.21 | % | | | 1.23 | % | |
| Net investment income | | | 2.51 | %(1) | | | 1.38 | % | | | 1.42 | % | | | 1.24 | % | | | 1.15 | % | |
| Portfolio Turnover | | | 23 | % | | | 25 | % | | | 39 | % | | | 62 | % | | | 100 | % | |
| Total Return | | | 36.97 | % | | | 29.54 | % | | | 23.36 | % | | | 15.04 | % | | | 17.52 | % | |
| Net assets, end of year (000's omitted) | | $ | 391,673 | | | $ | 228,277 | | | $ | 151,601 | | | $ | 132,015 | | | $ | 108,454 | | |
(1) Includes a dividend resulting from a corporate action equal to 0.96% of average daily net assets.
See notes to financial statements
23
Tax-Managed International Equity Portfolio as of October 31, 2007
NOTES TO FINANCIAL STATEMENTS
1 Significant Accounting Policies
Tax-Managed International Equity Portfolio (the Portfolio) is a New York trust registered under the Investment Company Act of 1940, as amended (the 1940 Act), as a diversified, open-end management investment company. The Portfolio seeks to achieve long-term after-tax returns by investing in a diversified portfolio of foreign equity securities. The Declaration of Trust permits the Trustees to issue interests in the Portfolio. At October 31, 2007, the Eaton Vance Tax-Managed International Equity Fund and Eaton Vance Tax-Managed Equity Asset Allocation Fund held an approximate 53.6% and 46.3% interest, respectively, in the Portfolio.
The following is a summary of significant accounting policies of the Portfolio. The policies are in conformity with accounting principles generally accepted in the United States of America.
A Investment Valuation — Securities listed on a U.S. securities exchange generally are valued at the last sale price on the day of valuation or, if no sales took place on such date, at the mean between the closing bid and asked prices therefore on the exchange where such securities are principally traded. Equity securities listed on the NASDAQ Global or Global Select Market generally are valued at the official NASDAQ closing price. Unlisted or listed securities for which closing sales prices or closing quotations are not available are valued at the mean between the latest available bid and asked prices or, in the case of preferred equity securities that are not listed or traded in the over-the-counter market, by an independent pricing service. Exchange-traded options are valued at the last sale price for the day of valuation as quoted on the principal exchange or board of trade on which the options are traded or, in the absence of sales on such date, at the mean between the latest bid and asked prices therefore. Financial futures contracts listed on commodity exchanges are valued at closing settlement prices. Short-term debt securities with a remaining maturity of 60 days or less are valued at amortized cost, which approximates market value. If short-term debt securities are acquired with a remaining maturity of more than 60 days, they will be valued by a pricing service. Other fixed income and debt securities, including listed securities and securities for which price quotations are available, will normally be valued on the basis of valuations furnished by a pricing service. Foreign securities and currencies are valued in U.S. dollars, based on foreign currency exchange rate quotations supplied by an independent quotation service. The daily valuation of exchange-traded fore ign securities generally is determined as of the close of trading on the principal exchange on which such securities trade. Events occurring after the close of trading on foreign exchanges may result in adjustments to the valuation of foreign securities to more accurately reflect their fair value as of the close of regular trading on the New York Stock Exchange. When valuing foreign equity securities that meet certain criteria, the Trustees have approved the use of a fair value service that values such securities to reflect market trading that occurs after the close of the applicable foreign markets of comparable securities or other instruments that have a strong correlation to the fair-valued securities. Investments for which valuations or market quotations are not readily available are valued at fair value using methods determined in good faith by or at the direction of the Trustees of the Portfolio considering relevant factors, data a nd information including the market value of freely tradable securities of the same class in the principal market on which such securities are normally traded.
The Portfolio may invest in Cash Management Portfolio (Cash Management), an affiliated investment company managed by Boston Management and Research (BMR), a subsidiary of Eaton Vance Management (EVM). Cash Management values its investment securities utilizing the amortized cost valuation technique permitted by Rule 2a-7 of the 1940 Act. This technique involves initially valuing a portfolio security at its cost and thereafter assuming a constant amortization to maturity of any discount or premium.
B Investment Transactions — Investment transactions for financial statement purposes are accounted for on a trade date basis. Realized gains and losses on investments sold are determined on the basis of identified cost.
C Income — Dividend income is recorded on the ex-dividend date for dividends received in cash and/or securities. However, if the ex-dividend date has passed, certain dividends from foreign securities are recorded as the Portfolio is informed of the ex-dividend date. Withholding taxes on foreign dividends and capital gains have been provided for in accordance with the Portfolio's understanding of the applicable countries' tax rules and rates. Interest income is recorded on the basis of interest accrued, adjusted for amortization of premium or accretion of discount.
D Foreign Currency Translation — Investment valuations, other assets, and liabilities initially expressed in foreign currencies are translated each business day into
24
Tax-Managed International Equity Portfolio as of October 31, 2007
NOTES TO FINANCIAL STATEMENTS CONT'D
U.S. dollars based upon current exchange rates. Purchases and sales of foreign investment securities and income and expenses denominated in foreign currencies are translated into U.S. dollars based upon currency exchange rates in effect on the respective dates of such transactions. Recognized gains or losses on investment transactions attributable to changes in foreign currency exchange rates are recorded for financial statement purposes as net realized gains and losses on investments. That portion of unrealized gains and losses on investments that results from fluctuations in foreign currency exchange rates is not separately disclosed.
E Federal Taxes — The Portfolio has elected to be treated as a partnership for federal tax purposes. No provision is made by the Portfolio for federal or state taxes on any taxable income of the Portfolio because each investor in the Portfolio is ultimately responsible for the payment of any taxes on its share of taxable income. Since at least one of the Portfolio's investors is a regulated investment company that invests all or substantially all of its assets in the Portfolio, the Portfolio normally must satisfy the applicable source of income and diversification requirements (under the Internal Revenue Code) in order for its investors to satisfy them. The Portfolio will allocate, at least annually a mong its investors, each investor's distributive share of the Portfolio's net investment income, net realized capital gains and any other items of income, gain, loss, deduction or credit.
F Expense Reduction — State Street Bank and Trust Company (SSBT) serves as custodian of the Portfolio. Pursuant to the custodian agreement, SSBT receives a fee reduced by credits, which are determined based on the average daily cash balance the Portfolio maintains with SSBT. All credit balances, if any, used to reduce the Portfolio's custodian fees are reported as a reduction of expenses in the Statement of Operations.
G Use of Estimates — The preparation of the financial statements in conformity with accounting principles generally accepted in the United States of America requires management to make estimates and assumptions that affect the reported amounts of assets and liabilities at the date of the financial statements and the reported amounts of income and expense during the reporting period. Actual results could differ from those estimates.
H Indemnifications — Under the Portfolio's organizational documents, its officers and Trustees may be indemnified against certain liabilities and expenses arising out of the performance of their duties to the Portfolio. Interestholders in the Portfolio are jointly and severally liable for the liabilities and obligations of the Portfolio in the event that the Portfolio fails to satisfy such liabilities and obligations; provided, however, that, to the extent assets are available in the Portfolio, the Portfolio may, under certain circumstances, indemnify interestholders from and against any claim or liability to which such holder may become subject by reason of being or having been an interestholder in the Portfolio. Additionally, in the normal course of business, the Portfolio enters into agreements with service providers that may contain indemnification clauses. The Portfolio's maximum exposure under these arrangements is unknown as this would involve future claims that may be made against the Portfolio that have not yet occurred.
I Financial Futures Contracts — The Portfolio may enter into financial futures contracts. The Portfolio's investment in financial futures contracts is designed for hedging against changes in interest rates or as a substitute for the purchase of securities. Upon entering into a financial futures contract, the Portfolio is required to deposit with the broker, either in cash or securities an amount equal to a certain percentage of the purchase price (initial margin). Subsequent payments, known as variation margin, are made or received by the Portfolio each business day, depending on the daily fluctuations in the value of the underlying security, and are recorded as unrealized gains or losses by the Portfolio. Gains (losses) are realized upon the expiration or closing of the financial futures contracts. Should market conditions change unexpectedly, the Portfolio may not achieve the anticipated benefits of the financial futures contracts and may realize a loss. In entering such contracts, the Portfolio bears the risk if the counterparties do not perform under the contracts' terms.
J Purchased Options — Upon the purchase of a call or put option, the premium paid by the Portfolio is included in the Statement of Assets and Liabilities as an investment. The amount of the investment is subsequently marked-to-market to reflect the current market value of the option purchased, in accordance with the Portfolio's policies on investment valuations discussed above. If an option which the Portfolio has purchased expires on the stipulated expiration date, the Portfolio will realize a loss in the amount of the cost of the option. If the Portfolio enters into a closing sale transaction, the Portfolio will realize a gain or loss, depending on whether the sales proceeds from the closing sale tr ansaction are greater or less than the cost of the option. If the Portfolio exercises a put option, it will realize a gain or loss from the sale of the underlying security, and the proceeds from such sale will be decreased
25
Tax-Managed International Equity Portfolio as of October 31, 2007
NOTES TO FINANCIAL STATEMENTS CONT'D
by the premium originally paid. If the Portfolio exercises a call option, the cost of the security which the Portfolio purchases upon exercise will be increased by the premium originally paid.
K Forward Foreign Currency Exchange Contracts — The Portfolio may enter into forward foreign currency exchange contracts for the purchase or sale of a specific foreign currency at a fixed price on a future date. The Portfolio may enter into forward contracts for hedging purposes as well as non-hedging purposes. The forward foreign currency exchange contracts are adjusted by the daily exchange rate of the underlying currency and any gains or losses are recorded as unrealized until such time as the contracts have been closed or offset. Risks may arise upon entering these contracts from the potential inability of counterparties to meet the terms of their contracts and from movements in the value of a for eign currency relative to the U.S. dollar.
2 Investment Adviser Fee and Other Transactions with Affiliates
The investment adviser fee is earned by BMR as compensation for management and investment advisory services rendered to the Portfolio. Pursuant to the advisory agreement, BMR receives a monthly advisory fee at the annual rate of 1.00% of the average daily net assets of the Portfolio up to $500 million and at reduced rates as daily net assets exceed that level. The portion of the advisory fee payable by Cash Management on the Portfolio's investment of cash therein is credited against the Portfolio's advisory fee. For the year ended October 31, 2007, the Portfolio's advisory fee totaled $3,017,772, of which $26,754 was allocated from Cash Management and $2,991,018 was paid or accrued directly by the Portfolio. Pursuant to a sub-advisory agreement, BMR has delegated the investment management of the Portfolio to Eagle Global Advisors, L.L.C. ("Eagle"). BMR pays Eagle a monthly sub-advisory fee equal to 0.50% annually of the average daily net assets of the Portfolio up to $500 million, and at reduced rates as daily net assets exceed that level.
Except for Trustees of the Portfolio who are not members of EVM's or BMR's organizations, officers and Trustees receive remuneration for their services to the Portfolio out of the investment adviser and sub-adviser fees. Trustees of the Portfolio who are not affiliated with BMR may elect to defer receipt of all or a percentage of their annual fees in accordance with the terms of the Trustees Deferred Compensation Plan. For the year ended October 31, 2007, no significant amounts have been deferred. Certain officers and Trustees of the Portfolio are officers of the above organizations.
3 Purchases and Sales of Investments
Purchases and sales of investments, other than short-term obligations, aggregated $139,180,506 and $69,020,094, respectively, for the year ended October 31, 2007.
4 Federal Income Tax Basis of Investments
The cost and unrealized appreciation (depreciation) of investments of the Portfolio at October 31, 2007, as determined on a federal income tax basis, were as follows:
| Aggregate cost | | $ | 229,892,756 | | |
| Gross unrealized appreciation | | $ | 159,241,059 | | |
| Gross unrealized depreciation | | | (874,659 | ) | |
| Net unrealized appreciation | | $ | 158,366,400 | | |
The net unrealized appreciation on foreign currency at October 31, 2007 on a federal income tax basis was $37,059.
5 Financial Instruments
The Portfolio may trade in financial instruments with off-balance sheet risk in the normal course of its investing activities to assist in managing exposure to various market risks. These financial instruments may include written options, forward foreign currency exchange contracts and financial futures contracts and may involve, to a varying degree, elements of risk in excess of the amounts recognized for financial statement purposes. The notional or contractual amounts of these instruments represent the investment the Portfolio has in particular classes of financial instruments and does not necessarily represent the amounts potentially subject to risk. The measurement of the risks associated with these instruments is meaningful only when all related and offsetting transactions are considered. The Portfolio did not have any open financial instruments at October 31, 2007.
6 Line of Credit
The Portfolio participates with other portfolios and funds managed by EVM and its affiliates in a $200 million unsecured line of credit agreement with a group of banks. Borrowings are made by the Portfolio solely to facilitate the handling of unusual and/or unanticipated short-term cash requirements. Interest is charged to the Portfolio based on
26
Tax-Managed International Equity Portfolio as of October 31, 2007
NOTES TO FINANCIAL STATEMENTS CONT'D
its borrowings at an amount above either the Eurodollar rate or Federal Funds rate. In addition, a fee computed at an annual rate of 0.07% on the daily unused portion of the line of credit is allocated among the participating portfolios and funds at the end of each quarter. The Portfolio did not have any significant borrowings or allocated fees during the year ended October 31, 2007.
7 Risks Associated with Foreign Investments
Investing in securities issued by companies whose principal business activities are outside the United States may involve significant risks not present in domestic investments. For example, there is generally less publicly available information about foreign companies, particularly those not subject to the disclosure and reporting requirements of the U.S. securities laws. Foreign issuers are generally not bound by uniform accounting, auditing, and financial reporting requirements and standards of practice comparable to those applicable to domestic issuers. Investments in foreign securities also involve the risk of possible adverse changes in investment or exchange control regulations, expropriation or confiscatory taxation, limitation on the removal of funds or other assets of the Portfolio, political or financial instability or diplomatic and other developments which could affect such investments. Foreign stock markets, while g rowing in volume and sophistication, are generally not as developed as those in the United States, and securities of some foreign issuers (particularly those located in developing countries) may be less liquid and more volatile than securities of comparable U.S. companies. In general, there is less overall governmental supervision and regulation of foreign securities markets, broker-dealers and issuers than in the United States.
8 Recently Issued Accounting Pronouncements
In June 2006, the Financial Accounting Standards Board (FASB) issued FASB Interpretation No. 48 (FIN 48), "Accounting for Uncertainty in Income Taxes – an interpretation of FASB Statement No. 109". FIN 48 clarifies the accounting for uncertainty in income taxes recognized in accordance with FASB Statement No. 109, "Accounting for Income Taxes". This interpretation prescribes a recognition threshold and measurement attribute for the financial statement recognition and measurement of a tax position taken or expected to be taken in a tax return. It also provides guidance on de-recognition, classification, interest and penalties, accounting in interim periods, disclosure and transition. FIN 48 is effective on the last business day of the first required financial reporting period for fiscal years beginning after December 15, 2006. Management is currently eva luating the impact of applying the various provisions of FIN 48.
In September 2006, the FASB issued Statement of Financial Accounting Standards No. 157 (FAS 157), "Fair Value Measurements". FAS 157 defines fair value, establishes a framework for measuring fair value in accordance with generally accepted accounting principles and expands disclosure about fair value measurements. FAS 157 is effective for fiscal years beginning after November 15, 2007. Management is currently evaluating the impact the adoption of FAS 157 will have on the Portfolio's financial statement disclosures.
27
Tax-Managed International Equity Portfolio as of October 31, 2007
REPORT OF INDEPENDENT REGISTERED PUBLIC ACCOUNTING FIRM
To the Trustees and Investors
of Tax-Managed International Equity Portfolio:
We have audited the accompanying statement of assets and liabilities of Tax-Managed International Equity Portfolio (the "Portfolio"), including the portfolio of investments, as of October 31, 2007, and the related statement of operations for the year then ended, the statements of changes in net assets for each of the two years in the period then ended, and the supplementary data for each of the five years in the period then ended. These financial statements and supplementary data are the responsibility of the Portfolio's management. Our responsibility is to express an opinion on these financial statements and supplementary data based on our audits.
We conducted our audits in accordance with the standards of the Public Company Accounting Oversight Board (United States). Those standards require that we plan and perform the audit to obtain reasonable assurance about whether the financial statements and supplementary data are free of material misstatement. The Portfolio is not required to have, nor were we engaged to perform, an audit of its internal control over financial reporting. Our audits included consideration of internal control over financial reporting as a basis for designing audit procedures that are appropriate in the circumstances, but not for the purpose of expressing an opinion on the effectiveness of the Portfolio's internal control over financial reporting. Accordingly, we express no such opinion. An audit also includes examining, on a test basis, evidence supporting the amounts and disclosures in the financial statements, assessing the accounting principles u sed and significant estimates made by management, as well as evaluating the overall financial statement presentation. Our procedures included confirmation of securities owned as of October 31, 2007, by correspondence with the custodian and brokers. We believe that our audits provide a reasonable basis for our opinion.
In our opinion, the financial statements and supplementary data referred to above present fairly, in all material respects, the financial position of Tax-Managed International Equity Portfolio as of October 31, 2007, the results of its operations for the year then ended, the changes in its net assets for each of the two years in the period then ended, and the supplementary data for each of the five years in the period then ended, in conformity with accounting principles generally accepted in the United States of America.
DELOITTE & TOUCHE LLP
Boston, Massachusetts
December 14, 2007
28
Eaton Vance Tax-Managed International Equity Fund
BOARD OF TRUSTEES' ANNUAL APPROVAL OF THE INVESTMENT ADVISORY AGREEMENT
Overview of the Contract Review Process
The Investment Company Act of 1940, as amended (the "1940 Act"), provides, in substance, that each investment advisory agreement between a fund and its investment adviser will continue in effect from year to year only if its continuance is approved at least annually by the fund's board of trustees, including by a vote of a majority of the trustees who are not "interested persons" of the fund ("Independent Trustees"), cast in person at a meeting called for the purpose of considering such approval.
At a meeting of the Boards of Trustees (each a "Board") of the Eaton Vance group of mutual funds (the "Eaton Vance Funds") held on April 23, 2007, the Board, including a majority of the Independent Trustees, voted to approve continuation of existing advisory and sub-advisory agreements for the Eaton Vance Funds for an additional one-year period. In voting its approval, the Board relied upon the affirmative recommendation of the Special Committee of the Board, which is a committee comprised exclusively of Independent Trustees. Prior to making its recommendation, the Special Committee reviewed information furnished for a series of meetings of the Special Committee held in February, March and April 2007. Such information included, among other things, the following:
Information about Fees, Performance and Expenses
• An independent report comparing the advisory and related fees paid by each fund with fees paid by comparable funds;
• An independent report comparing each fund's total expense ratio and its components to comparable funds;
• An independent report comparing the investment performance of each fund to the investment performance of comparable funds over various time periods;
• Data regarding investment performance in comparison to relevant peer groups of funds and appropriate indices;
• Comparative information concerning fees charged by each adviser for managing other mutual funds and institutional accounts using investment strategies and techniques similar to those used in managing the fund;
• Profitability analyses for each adviser with respect to each fund;
Information about Portfolio Management
• Descriptions of the investment management services provided to each fund, including the investment strategies and processes employed;
• Information concerning the allocation of brokerage and the benefits received by each adviser as a result of brokerage allocation, including information concerning the acquisition of research through "soft dollar" benefits received in connection with the funds' brokerage, and the implementation of a soft dollar reimbursement program established with respect to the funds;
• Data relating to portfolio turnover rates of each fund;
• The procedures and processes used to determine the fair value of fund assets and actions taken to monitor and test the effectiveness of such procedures and processes;
Information about each Adviser
• Reports detailing the financial results and condition of each adviser;
• Descriptions of the qualifications, education and experience of the individual investment professionals whose responsibilities include portfolio management and investment research for the funds, and information relating to their compensation and responsibilities with respect to managing other mutual funds and investment accounts;
• Copies of the Codes of Ethics of each adviser and its affiliates, together with information relating to compliance with and the administration of such codes;
• Copies of or descriptions of each adviser's proxy voting policies and procedures;
• Information concerning the resources devoted to compliance efforts undertaken by each adviser and its affiliates on behalf of the funds (including descriptions of various compliance programs) and their record of compliance with investment policies and restrictions, including policies with respect to market-timing, late trading and selective portfolio disclosure, and with policies on personal securities transactions;
• Descriptions of the business continuity and disaster recovery plans of each adviser and its affiliates;
Other Relevant Information
• Information concerning the nature, cost and character of the administrative and other non-investment management services provided by Eaton Vance Management and its affiliates;
• Information concerning management of the relationship with the custodian, subcustodians and fund accountants by each adviser or the funds' administrator; and
• The terms of each advisory agreement.
29
Eaton Vance Tax-Managed International Equity Fund
BOARD OF TRUSTEES' ANNUAL APPROVAL OF THE INVESTMENT ADVISORY AGREEMENT CONT'D
In addition to the information identified above, the Special Committee considered information provided from time to time by each adviser throughout the year at meetings of the Board and its committees. Over the course of the twelve-month period ended April 30, 2007, the Board met ten times and the Special Committee, the Audit Committee and the Governance Committee, each of which is a Committee comprised solely of Independent Trustees, met twelve, fourteen and eight times, respectively. At such meetings, the Trustees received, among other things, presentations by the portfolio managers and other investment professionals of each adviser relating to the investment performance of each fund and the investment strategies used in pursuing the fund's investment objective.
For funds that invest through one or more underlying portfolios, the Board considered similar information about the portfolio(s) when considering the approval of advisory agreements. In addition, in cases where the fund's investment adviser has engaged a sub-adviser, the Board considered similar information about the sub-adviser when considering the approval of any sub-advisory agreement.
The Special Committee was assisted throughout the contract review process by Goodwin Procter LLP, legal counsel for the Independent Trustees. The members of the Special Committee relied upon the advice of such counsel and their own business judgment in determining the material factors to be considered in evaluating each advisory and sub-advisory agreement and the weight to be given to each such factor. The conclusions reached with respect to each advisory and sub-advisory agreement were based on a comprehensive evaluation of all the information provided and not any single factor. Moreover, each member of the Special Committee may have placed varying emphasis on particular factors in reaching conclusions with respect to each advisory and sub-advisory agreement.
Results of the Process
Based on its consideration of the foregoing, and such other information as it deemed relevant, including the factors and conclusions described below, the Special Committee concluded that the continuance of the investment advisory agreement of the Tax-Managed International Equity Portfolio, the portfolio in which the Eaton Vance Tax-Managed International Equity Fund (the "Fund") invests, with Boston Management and Research (the "Adviser"), and the sub-advisory agreement with Eagle Global Advisors, LLC ("Eagle" or the "Sub-adviser") including the fee structures, is in the interests of shareholders and, therefore, the Special Committee recommended to the Board approval of the respective agreements. The Board accepted the recommendation of the Special Committee as well as the factors considered and conclusions reached by the Special Committee with respect to the agreements. Accordingly, the Board, including a majority of the Indepen dent Trustees, voted to approve continuation of the investment advisory agreement and the sub-advisory agreement for the Portfolio.
Nature, Extent and Quality of Services
In considering whether to approve the investment advisory agreement and sub-advisory agreement of the Portfolio, the Board evaluated the nature, extent and quality of services provided to the Portfolio by the Adviser and the Sub-adviser.
The Board considered the Adviser's and the Sub-adviser's management capabilities and investment process with respect to the types of investments held by the Portfolio, including the education, experience and number of its investment professionals and other personnel who provide portfolio management, investment research, and similar services to the Portfolio and whose responsibilities include supervising the Sub-adviser. The Board specifically noted the Adviser's in-house equity research capabilities, which aids the Adviser in supervising Eagle's management of the Portfolio. The Board also took into account the resources dedicated to portfolio management and other services, including the compensation paid to recruit and retain investment personnel, and the time and attention devoted to the Portfolio by senior management. With respect to the Sub-adviser, the Board took into consideration the resources available to the Sub-adviser in fulfilling its duties under the sub-advisory agreement and the Sub-adviser's experience in managing international equity portfolios, as well as recent changes in personnel.
The Board reviewed the compliance programs of the Adviser and relevant affiliates thereof, and of the Sub-adviser. Among other matters, the Board considered compliance and reporting matters relating to personal trading by investment personnel, selective disclosure of portfolio holdings, late trading, frequent trading, portfolio valuation, business continuity and the allocation of investment opportunities. The Board also evaluated the responses of the Adviser and its affiliates to requests from regulatory authorities such as the Securities and Exchange Commission and the National Association of Securities Dealers.
The Board considered shareholder and other administrative services provided or managed by Eaton Vance Management and its affiliates, including transfer agency and accounting services. The Board evaluated the benefits to shareholders of investing in a fund that is a part of a large family of funds, including the ability, in many cases, to exchange an investment among different funds without incurring additional sales charges.
30
Eaton Vance Tax-Managed International Equity Fund
BOARD OF TRUSTEES' ANNUAL APPROVAL OF THE INVESTMENT ADVISORY AGREEMENT CONT'D
After consideration of the foregoing factors, among others, the Board concluded that the nature, extent and quality of services provided by the Adviser and Sub-adviser, taken as a whole, are appropriate and consistent with the terms of the investment advisory agreement and sub-advisory agreement, respectively.
Fund Performance
The Board compared the Fund's investment performance to a relevant universe of similarly managed funds identified by an independent data provider and appropriate benchmark indices. The Board reviewed comparative performance data for the one-, three- and five-year periods ended September 30, 2006 for the Fund. The Board concluded that the performance of the Fund was satisfactory.
Management Fees and Expenses
The Board reviewed contractual investment advisory fee rates, including any administrative fee rates, payable by the Portfolio and the Fund (referred to as "management fees"). As part of its review, the Board considered the management fees and the Fund's total expense ratio for the year ended September 30, 2006, as compared to a group of similarly managed funds selected by an independent data provider.
After reviewing the foregoing information, and in light of the nature, extent and quality of the services provided by the Adviser, the Board concluded that the management fees charged for advisory and related services and the Fund's total expense ratio are reasonable.
Profitability
The Board reviewed the level of profits realized by the Adviser and relevant affiliates thereof in providing investment advisory and administrative services to the Fund, to the Portfolio and to all Eaton Vance Funds as a group. The Board considered the level of profits realized without regard to revenue sharing or other payments by the Adviser and its affiliates to third parties in respect of distribution services. The Board also considered other direct or indirect benefits received by the Adviser and its affiliates in connection with its relationship with the Fund. The Board also concluded that, in light of its role as a sub-adviser not affiliated with the Adviser, the Sub-adviser's profitability in managing the Portfolio was not a material factor.
The Board concluded that, in light of the foregoing factors and the nature, extent and quality of the services rendered, the profits realized by the Adviser and its affiliates are reasonable.
Economies of Scale
In reviewing management fees and profitability, the Board also considered the extent to which the Adviser and its affiliates, on the one hand, and the Fund, on the other hand, can expect to realize benefits from economies of scale as the assets of the Fund and Portfolio increase. The Board acknowledged the difficulty in accurately measuring the benefits resulting from the economies of scale with respect to the management of any specific fund or group of funds. The Board reviewed data summarizing the increases and decreases in the assets of the Fund and of all Eaton Vance Funds as a group over various time periods, and evaluated the extent to which the total expense ratio of the Fund and the profitability of the Adviser and its affiliates may have been affected by such increases or decreases. Based upon the foregoing, the Board concluded that the benefits from economies of scale are currently being shared equitably by the Adviser and its affiliates and the Fund. The Board also concluded that, assuming reasonably foreseeable increases in the assets of the Portfolio, the structure of the advisory fee, which includes breakpoints at several asset levels, can be expected to cause the Adviser and its affiliates and the Fund to continue to share such benefits equitably.
31
Eaton Vance Tax-Managed International Equity Fund
MANAGEMENT AND ORGANIZATION
Fund Management. The Trustees of Eaton Vance Mutual Funds Trust (the Trust) and Tax-Managed International Equity Portfolio (the Portfolio) are responsible for the overall management and supervision of the Trust's and Portfolio's affairs. The Trustees and officers of the Trust and the Portfolio are listed below. Except as indicated, each individual has held the office shown or other offices in the same company for the last five years. Trustees and officers of the Trust and the Portfolio hold indefinite terms of office. The "noninterested Trustees" consist of those Trustees who are not "interested persons" of the Trust and the Portfolio, as that term is defined under the 1940 Act. The business address of each Trustee and officer is The Eaton Vance Building, 255 State Street, Boston, Massachusetts 02109. As used below, "EVC" refers to Eaton Vance Corp., "EV" re fers to Eaton Vance, Inc., "EVM" refers to Eaton Vance Management, "BMR" refers to Boston Management and Research, "EVD" refers to Eaton Vance Distributors, Inc., "Parametric" refers to Parametric Portfolio Associates and "Eagle" refers to Eagle Global Advisors, L.L.C. EVC and EV are the corporate parent and trustee, respectively, of EVM and BMR. EVD is the Fund's principal underwriter, the Portfolio's placement agent and a wholly-owned subsidiary of EVM. Each officer affiliated with Eaton Vance may hold a position with other Eaton Vance affiliates that is comparable to his or her position with EVM listed below.
Name and
Date of Birth | | Position(s)
with the
Trust and
the Portfolio | | Term of
Office and
Length of
Service | | Principal Occupation(s)
During Past Five Years | | Number of Portfolios
in Fund Complex
Overseen By
Trustee(1) | | Other Directorships Held | |
| Interested Trustee | | | | | | | | | | | | | |
|
| Thomas E. Faust Jr. 5/31/58 | | Trustee and President of the Trust | | Trustee since 2007 and President of the Trust since 2002 | | Chairman, Chief Executive Officer and President of EVC, President of EV, Chief Executive Officer and President of EVM and BMR, and Director of EVD. Trustee and/or Officer of 176 registered investment companies and 5 private investment companies in the Eaton Vance Fund Complex. Mr. Faust is an interested person because of his positions with EVM, BMR, EVC and EV which are affiliates of the Trust and the Portfolio. | | | 176 | | | Director of EVC | |
|
| Noninterested Trustees(s) | | | | | | | | | | | | | |
|
| Benjamin C. Esty 1/26/63 | | Trustee | | Since 2005 | | Roy and Elizabeth Simmons Professor of Business Administration, Harvard University Graduate School of Business Administration (since 2003). Formerly, Associate Professor, Harvard University Graduate School of Business Administration (2000-2003). | | | 176 | | | None | |
|
| Allen R. Freedman 4/3/40 | | Trustee | | Since 2007 | | Former Chairman and Chief Executive Officer of Assurant, Inc. (insurance provider) (1978-2000). Formerly, a Director of Loring Ward International (fund distributor) (2005-2007). | | | 175 | | | Director of Assurant, Inc. and Stonemor Partners L.P. (owner and operator of cemeteries) | |
|
| William H. Park 9/19/47 | | Trustee | | Since 2003 | | Vice Chairman, Commercial Industrial Finance Corp. (specialty finance company) (since 2006). Formerly, President and Chief Executive Officer, Prizm Capital Management, LLC (investment management firm) (2002-2005). | | | 176 | | | None | |
|
| Ronald A. Pearlman 7/10/40 | | Trustee | | Since 2003 | | Professor of Law, Georgetown University Law Center. | | | 176 | | | None | |
|
| Norton H. Reamer 9/21/35 | | Trustee | | Trustee of the Trust since 1986 and of the Portfolio since 1998 | | President, Chief Executive Officer and a Director of Asset Management Finance Corp. (a specialty finance company serving the investment management industry) (since October 2003). President, Unicorn Corporation (an investment and financial advisory services company) (since September 2000). Formerly, Chairman and Chief Operating Officer, Hellman, Jordan Management Co., Inc. (an investment management company) (2000-2003). Formerly, Advisory Director of Berkshire Capital Corporation (investment banking firm) (2002-2003). | | | 176 | | | None | |
|
32
Eaton Vance Tax-Managed International Equity Fund
MANAGEMENT AND ORGANIZATION CONT'D
Name and
Date of Birth | | Position(s)
with the
Trust and
the Portfolio | | Term of
Office and
Length of
Service | | Principal Occupation(s)
During Past Five Years | | Number of Portfolios
in Fund Complex
Overseen By
Trustee(1) | | Other Directorships Held | |
| Noninterested Trustees(s) (continued) | | | | | | | | | | | | | |
|
| Heidi L. Steiger 7/8/53 | | Trustee | | Since 2007 | | President, Lowenhaupt Global Advisors, LLC (global wealth management firm) (since 2005); Formerly, President and Contributing Editor, Worth Magazine (2004); Formerly, Executive Vice President and Global Head of Private Asset Management (and various other positions), Neuberger Berman (investment firm) (1986-2004). | | | 173 | | | Director of Nuclear Electric Insurance Ltd. (nuclear insurance provider) and Aviva USA (insurance provider) | |
|
| Lynn A. Stout 9/14/57 | | Trustee | | Since 1998 | | Paul Hastings Professor of Corporate and Securities Law, University of California at Los Angeles School of Law. | | | 176 | | | None | |
|
| Ralph F. Verni 1/26/43 | | Chairman of the Board and Trustee | | Chairman of the Board since 2007 and Trustee since 2005 | | Consultant and private investor. | | | 176 | | | None | |
|
| Principal Officers who are not Trustees | | | | | | | | | | | | | |
|
Name and
Date of Birth | | Position(s)
with the
Trust and
the Portfolio | | Term of
Office and
Length of
Service | | Principal Occupation(s)
During Past Five Years | |
| William H. Ahern, Jr. 7/28/59 | | Vice President of the Trust | | Since 1995 | | Vice President of EVM and BMR. Officer of 74 registered investment companies managed by EVM or BMR. | |
|
| Edward R. Allen, III 7/5/60 | | Vice President of the Portfolio | | Since 2004 | | Partner and Chairman of the International Investment Committee of Eagle. Officer of 3 registered investment companies managed by EVM or BMR. | |
|
| Cynthia J. Clemson 3/2/63 | | Vice President of the Trust | | Since 2005 | | Vice President of EVM and BMR. Officer of 89 registered investment companies managed by EVM or BMR. | |
|
| Charles B. Gaffney 12/4/72 | | Vice President of the Trust | | Since 2007 | | Vice President of EVM and BMR. Previously, Sector Portfolio Manager and Senior Equity Analyst of Brown Brothers Harriman (1997-2003). Officer of 29 registered investment companies managed by EVM or BMR. | |
|
| Thomas N. Hunt, III 11/6/64 | | Vice President of the Portfolio | | Since 2004 | | Partner of Eagle. Officer of 3 registered investment companies managed by EVM or BMR. | |
|
| Christine M. Johnston 11/9/72 | | Vice President of the Trust | | Since 2007 | | Vice President of EVM and BMR. Officer of 34 registered investment companies managed by EVM or BMR. | |
|
| Aamer Khan 6/7/60 | | Vice President of the Trust | | Since 2005 | | Vice President of EVM and BMR. Officer of 32 registered investment companies managed by EVM or BMR. | |
|
| Thomas H. Luster 4/8/62 | | Vice President of the Trust | | Since 2006 | | Vice President of EVM and BMR. Officer of 48 registered investment companies managed by EVM or BMR. | |
|
| Michael R. Mach 7/15/47 | | Vice President of the Trust | | Since 1999 | | Vice President of EVM and BMR. Officer of 54 registered investment companies managed by EVM or BMR. | |
|
| Robert B. MacIntosh 1/22/57 | | Vice President of the Trust | | Since 1998 | | Vice President of EVM and BMR. Officer of 89 registered investment companies managed by EVM and BMR. | |
|
| Duncan W. Richardson 10/26/57 | | Vice President of the Trust; President of the Portfolio | | Vice President of the Trust since 2001; President of the Portfolio since 2002 | | Executive Vice President and Chief Equity Investment Officer of EVC, EVM and BMR. Officer of 80 registered investment companies managed by EVM or BMR. | |
|
| Walter A. Row, III 7/20/57 | | Vice President of the Trust | | Since 2001 | | Director of Equity Research and a Vice President of EVM and BMR. Officer of 38 registered investment companies managed by EVM or BMR. | |
|
33
Eaton Vance Tax-Managed International Equity Fund
MANAGEMENT AND ORGANIZATION CONT'D
Name and
Date of Birth | | Position(s)
with the
Trust and
the Portfolio | | Term of
Office and
Length of
Service | | Principal Occupation(s)
During Past Five Years | |
| Principal Officers who are not Trustees (continued) | | | |
|
| Judith A. Saryan 8/21/54 | | Vice President of the Trust | | Since 2003 | | Vice President of EVM and BMR. Officer of 53 registered investment companies managed by EVM or BMR. | |
|
| Susan Schiff 3/13/61 | | Vice President of the Trust | | Since 2002 | | Vice President of EVM and BMR. Officer of 35 registered investment companies managed by EVM or BMR. | |
|
| Thomas Seto 9/27/62 | | Vice President of the Trust | | Since 2007 | | Vice President and Director of Portfolio Management of Parametric. Officer of 30 registered investment companies managed by EVM or BMR. | |
|
| David M. Stein 5/4/51 | | Vice President of the Trust | | Since 2007 | | Managing Director and Chief Investment Officer of Parametric. Officer of 30 registered investment companies managed by EVM or BMR. | |
|
| Mark S. Venezia 5/23/49 | | Vice President of the Trust | | Since 2007 | | Vice President of EVM and BMR. Officer of 35 registered investment companies managed by EVM or BMR. | |
|
| Adam A. Weigold 3/22/75 | | Vice President of the Trust | | Since 2007 | | Vice President of EVM and BMR. Officer of 70 registered investment companies managed by EVM or BMR. | |
|
| Kristin S. Anagnost 6/12/65 | | Treasurer of the Portfolio | | Since 2002 | | Vice President of EVM and BMR. Officer of 97 registered investment companies managed by EVM or BMR. | |
|
| Barbara E. Campbell 6/19/57 | | Treasurer of the Trust | | Since 2005 | | Vice President of EVM and BMR. Officer of 176 registered investment companies managed by EVM or BMR. | |
|
| Maureen A. Gemma 5/24/60 | | Secretary | | Since 2007 | | Deputy Chief Legal Officer and Vice President of EVM and BMR. Officer of 176 registered investment companies managed by EVM or BMR. | |
|
| Paul M. O'Neil 7/11/53 | | Chief Compliance Officer | | Since 2004 | | Vice President of EVM and BMR. Officer of 176 registered investment companies managed by EVM or BMR. | |
|
(1) Includes both master and feeder funds in a master-feeder structure.
The SAI for the Fund includes additional information about the Trustees and officers of the Fund and the Portfolio and can be obtained without charge by calling 1-800-225-6265.
34
This Page Intentionally Left Blank
This Page Intentionally Left Blank
Investment Adviser of Tax-Managed International Equity Portfolio
Boston Management and Research
The Eaton Vance Building
255 State Street
Boston, MA 02109
Sub-Adviser of Tax-Managed International Equity Portfolio
Eagle Global Advisors, L.L.C.
5847 San Felipe, Suite 930
Houston, TX 77057
Administrator of Eaton Vance Tax-Managed International Equity Fund
Eaton Vance Management
The Eaton Vance Building
255 State Street
Boston, MA 02109
Principal Underwriter
Eaton Vance Distributors, Inc.
The Eaton Vance Building
255 State Street
Boston, MA 02109
(617) 482-8260
Custodian
State Street Bank and Trust Company
200 Clarendon Street
Boston, MA 02116
Transfer Agent
PFPC Inc.
Attn: Eaton Vance Funds
P.O. Box 9653
Providence, RI 02940-9653
(800) 262-1122
Independent Registered Public Accounting Firm
Deloitte & Touche LLP
200 Berkeley Street
Boston, MA 02116-5022
Eaton Vance Tax-Managed International Equity Fund
The Eaton Vance Building
255 State Street
Boston, MA 02109
This report must be preceded or accompanied by a current prospectus. Before investing, investors should consider carefully the Fund's investment objective(s), risks, and charges and expenses. The Fund's current prospectus contains this and other information about the Fund and is available through your financial advisor. Please read the prospectus carefully before you invest or send money. For further information please call 1-800-225-6265.
038-12/07 IGSRC

Annual Report October 31, 2007


EATON VANCE
TAX-MANAGED
MID-CAP
CORE
FUND
IMPORTANT NOTICES REGARDING PRIVACY,
DELIVERY OF SHAREHOLDER DOCUMENTS,
PORTFOLIO HOLDINGS AND PROXY VOTING
Privacy. The Eaton Vance organization is committed to ensuring your financial privacy. Each of the financial institutions identified below has in effect the following policy ("Privacy Policy") with respect to nonpublic personal information about its customers:
• Only such information received from you, through application forms or otherwise, and information about your Eaton Vance fund transactions will be collected. This may include information such as name, address, social security number, tax status, account balances and transactions.
• None of such information about you (or former customers) will be disclosed to anyone, except as permitted by law (which includes disclosure to employees necessary to service your account). In the normal course of servicing a customer's account, Eaton Vance may share information with unaffiliated third parties that perform various required services such as transfer agents, custodians and broker/dealers.
• Policies and procedures (including physical, electronic and procedural safeguards) are in place that are designed to protect the confidentiality of such information.
• We reserve the right to change our Privacy Policy at any time upon proper notification to you. Customers may want to review our Policy periodically for changes by accessing the link on our homepage: www.eatonvance.com.
Our pledge of privacy applies to the following entities within the Eaton Vance organization: the Eaton Vance Family of Funds, Eaton Vance Management, Eaton Vance Investment Counsel, Boston Management and Research, and Eaton Vance Distributors, Inc.
In addition, our Privacy Policy only applies to those Eaton Vance customers who are individuals and who have a direct relationship with us. If a customer's account (i.e., fund shares) is held in the name of a third-party financial adviser/ broker- dealer, it is likely that only such adviser's privacy policies apply to the customer. This notice supersedes all previously issued privacy disclosures.
For more information about Eaton Vance's Privacy Policy, please call 1-800-262-1122.
Delivery of Shareholder Documents. The Securities and Exchange Commission (the "SEC") permits funds to deliver only one copy of shareholder documents, including prospectuses, proxy statements and shareholder reports, to fund investors with multiple accounts at the same residential or post office box address. This practice is often called "householding" and it helps eliminate duplicate mailings to shareholders.
Eaton Vance, or your financial adviser, may household the mailing of your documents indefinitely unless you instruct Eaton Vance, or your financial adviser, otherwise.
If you would prefer that your Eaton Vance documents not be householded, please contact Eaton Vance at 1-800-262-1122, or contact your financial adviser.
Your instructions that householding not apply to delivery of your Eaton Vance documents will be effective within 30 days of receipt by Eaton Vance or your financial adviser.
Portfolio Holdings. Each Eaton Vance Fund and its underlying Portfolio (if applicable) will file a schedule of its portfolio holdings on Form N-Q with the SEC for the first and third quarters of each fiscal year. The Form N-Q will be available on the Eaton Vance website www.eatonvance.com, by calling Eaton Vance at 1-800-262-1122 or in the EDGAR database on the SEC's website at www.sec.gov. Form N-Q may also be reviewed and copied at the SEC's public reference room in Washington, D.C. (call 1-800-732-0330 for information on the operation of the public reference room).
Proxy Voting. From time to time, funds are required to vote proxies related to the securities held by the funds. The Eaton Vance Funds or their underlying Portfolios (if applicable) vote proxies according to a set of policies and procedures approved by the Funds' and Portfolios' Boards. You may obtain a description of these policies and procedures and information on how the Funds or Portfolios voted proxies relating to portfolio securities during the most recent 12 month period ended June 30, without charge, upon request, by calling 1-800-262-1122. This description is also available on the SEC's website at www.sec.gov.
Eaton Vance Tax-Managed Mid-Cap Core Fund as of October 31, 2007
MANAGEMENT’S DISCUSSION OF FUND PERFORMANCE

William R. Hackney, III, CFA
Co-Portfolio Manager

William O. Bell, IV, CFA
Co-Portfolio Manager

Marilyn Robinson Irvin, CFA
Co-Portfolio Manager
The Fund
Performance for the Past Year
· For the year ended October 31, 2007, the Fund’s Class A shares had a total return of 16.93%. This return was the result of an increase in net asset value (NAV) per share to $15.40 on October 31, 2007, from $13.89 on October 31, 2006, and the distribution of $0.740 per share in capital gains.(1)
· The Fund’s Class B shares had a total return of 16.07% during the same period, the result of an increase in NAV per share to $14.74 from $13.42 and the distribution of $0.740 per share in capital gains.(1)
· The Fund’s Class C shares had a total return of 16.07% during the same period, the result of an increase in NAV per share to $14.74 from $13.42 and the distribution of $0.740 per share in capital gains.(1)
· For comparison, the S&P MidCap 400 Index, a broad-based, unmanaged index commonly used to measure U.S. mid-cap stock performance, had a total return of 17.02% during the same period, while the average return of funds in the Lipper Mid-Cap Core Classification was 16.05%.(2)
See pages 3 and 4 for more performance information, including after-tax returns.
Management Discussion
· The stock market continued to post solid gains for the 12 months ended October 31, 2007, even in the face of a severe downturn in the U.S. housing market and an eventual financial crisis sparked by subprime mortgage loans.
· Nine of the 10 economic sectors of the S&P MidCap 400 Index posted gains over the 12-month period ended October 31, 2007, with the strongest performance generally coming from sectors most exposed to robust global growth. Conversely, the weakest performance came from sectors most influenced by the domestic economy. The energy and materials sectors, up 42.1% and 37.8% respectively, showed the strongest gains as world commodity prices soared in the face of surging demand from emerging market economies. Not surprisingly, given the problems surrounding the U.S. housing market and subprime lending, the worst performance among the 10 sectors was seen in the financials, down 1.4%, and consumer discretionary, up 3.8%.
· The Fund currently invests its assets in a separate registered investment company, Tax-Managed Mid-Cap Core Portfolio (the Portfolio), with the same objectives and policies as the Fund. The Portfolio seeks to add value through a high-quality investment discipline and portfolio stock selection, rather than significantly over-weighting or underweighting particular economic sectors versus the Fund’s benchmark. As of October 31, 2007, the Portfolio was broadly diversified across nine of the 10 economic sectors of the S&P MidCap 400 Index. At that time, the Portfolio had no exposure to the telecom services sector, which represents less than 1% of the market capitalization of the S&P MidCap 400 Index.(3)
(1) | These returns do not include the 5.75% maximum sales charge for Class A shares or the applicable contingent deferred sales charge (CDSC) for Class B and Class C shares. If sales charges were deducted, the returns would be lower. Absent an allocation of certain expenses to the administrator of the Fund and sub-adviser of the Portfolio, the returns would be lower. |
(2) | It is not possible to invest directly in an Index or a Lipper Classification. The Index’s total return does not reflect commissions or expenses that would have been incurred if an investor individually purchased or sold the securities represented in the Index. The Lipper total return is the average total return, at net asset value, of the funds that are in the same Lipper Classification as the Fund. |
(3) | Sector weightings are subject to change due to active management. |
Past performance is no guarantee of future results. Returns are historical and are calculated by determining the percentage change in net asset value or offering price (as applicable) with all distributions reinvested. Investment return and principal value will fluctuate so that shares, when redeemed, may be worth more or less than their original cost. Performance is for stated time period only; due to market volatility, the Fund’s current performance may be lower or higher than the quoted return. For performance as of the most recent month end, please refer to www.eatonvance.com.
Fund shares are not insured by the FDIC and are not deposits or other obligations of, or guaranteed by, any depository institution. Shares are subject to investment risks, including possible loss of principal invested.
1
· For the year ended October 31, 2007, Fund returns were slightly below those of the S&P MidCap 400 Index benchmark. Stock selection within the financials sector of the Portfolio was favorable to the Fund’s performance. Stock selection emphasis within financials was on asset management, capital markets and insurance companies, rather than on banks and other lenders that might be more affected by the growing problems in the housing market. Stock selection was least favorable in the materials sector due to the absence of metals and mining stocks in the Portfolio, which posted the best returns within that sector during the fiscal year. The strong relative performance of lower-quality stocks over high-quality issues, which negatively affected the Portfolio in prior periods, seemed to abate in the wake of the recent financial crisis during the Fund’s fiscal year.(1)
· The Portfolio continues to seek to invest in a wide variety of different industries, with a focus on stocks that, in management’s opinion, have attractive relative valuations and/or the potential for above-average sustainable growth. At the end of the fiscal year ended October 31, 2007, the Portfolio held 76 stocks representing nine of the 10 economic sectors that make up the S&P MidCap 400 Index.(1), (2)
(1) | Sector weightings are subject to change due to active management. |
| |
(2) | It is not possible to invest directly in an Index. The Index’s total return does not reflect commissions or expenses that would have been incurred if an investor individually purchased or sold the securities represented in the Index. |
Top Ten Holdings*
By net assets
FMC Technologies, Inc. | | 3.2 | % |
Jacobs Engineering Group | | 2.6 | |
Affiliated Managers Group | | 2.2 | |
Amphenol Corp., Class A | | 2.2 | |
Respironics, Inc. | | 2.2 | |
Jack Henry & Associates, Inc. | | 2.1 | |
Holly Corp. | | 2.0 | |
Universal Corporation, VA | | 1.9 | |
AMETEK, Inc. | | 1.8 | |
Questar Corp. | | 1.8 | |
* | Top Ten Holdings represented 22.0% of Portfolio net assets as of October 31, 2007. Holdings are subject to change due to active management. |
Common Stock Investments by Sector**
By net assets
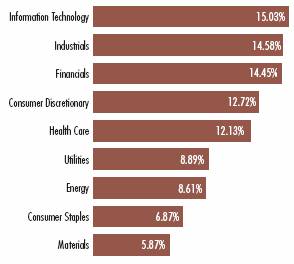
** | As a percentage of the Portfolio’s net assets of October 31, 2007. Portfolio information may not be representative of the Portfolio’s current or future investments and may change due to active management. |
The views expressed throughout this report are those of the portfolio managers and are current only through the end of the period of the report as stated on the cover. These views are subject to change at any time based upon market or other conditions, and the investment adviser disclaims any responsibility to update such views. These views may not be relied on as investment advice and, because investment decisions for a fund are based on many factors, may not be relied on as an indication of trading intent on behalf of any Eaton Vance fund.
2
Eaton Vance Tax-Managed Mid-Cap Core Fund as of October 31, 2007
FUND PERFORMANCE
The line graphs and table set forth below provide information about the Fund’s performance. The line graphs compare the performance of Class A, Class B and Class C of the Fund with that of the S&P Midcap 400 Index, a broad-based, unmanaged index commonly used to measure U.S. mid-cap stock performance. The lines on the graphs represent the total returns of a hypothetical investment of $10,000 in each of Class A, Class B and Class C and the S&P Midcap 400 Index. Class A total returns are presented at net asset value and maximum public offering price. The table includes the total returns of each Class of the Fund at net asset value and public offering price. The performance presented below does not reflect the deduction of taxes, if any, that a shareholder would pay on distributions or redemptions of Fund shares.
Performance(1) | | Class A | | Class B | | Class C | |
Symbol | | EXMCX | | EBMCX | | ECMCX | |
Average Annual Total Returns (at net asset value) | | | | | | | |
One Year | | 16.93 | % | 16.07 | % | 16.07 | % |
Five Years | | 13.85 | % | 13.02 | % | 13.02 | % |
Life of Fund† | | 9.04 | % | 8.24 | % | 8.24 | % |
SEC Average Annual Total Returns (including sales charge or applicable CDSC) | | | | | | | |
One Year | | 10.19 | % | 11.07 | % | 15.07 | % |
Five Years | | 12.52 | % | 12.77 | % | 13.02 | % |
Life of Fund† | | 7.91 | % | 8.12 | % | 8.24 | % |
†Inception Dates – Class A: 3/4/02; Class B: 3/4/02; Class C: 3/4/02
(1) | Average annual total returns do not include the 5.75% maximum sales charge for Class A shares or the applicable contingent deferred sales charge (CDSC) for Class B and Class C shares. If sales charges were deducted, the returns would be lower. SEC average annual total returns for Class A reflect the maximum 5.75% sales charge. SEC returns for Class B shares reflect the applicable CDSC based on the following schedule: 5% - 1st and 2nd years; 4% - 3rd year; 3% - 4th year; 2% - 5th year; 1% - 6th year. SEC returns for Class C reflect a 1% CDSC for the first year. Absent an allocation of certain expenses to the administrator of the Fund and sub-adviser of the Portfolio, the returns would be lower. |
Total Annual
Operating Expenses(2) | | Class A | | Class B | | Class C | |
Gross Expense Ratio | | 1.77 | % | 2.52 | % | 2.52 | % |
Net Expense Ratio | | 1.70 | % | 2.45 | % | 2.45 | % |
(2) | From the Fund’s prospectus dated 3/1/07. The net expense ratio reflects a voluntary expense allocation to the Fund’s administrator and sub-adviser of the Portfolio. Without this expense allocation, performance would have been lower. |
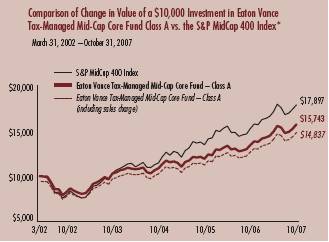
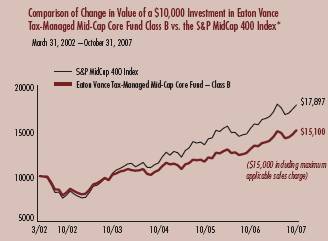
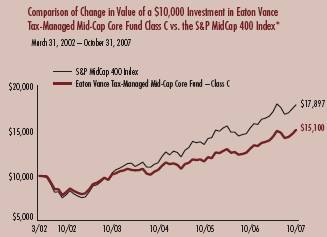
* Source: Thomson Financial. Class A, Class B, and Class C of the Fund commenced investment operations on 3/4/02. It is not possible to invest directly in an Index. The Index’s total returns do not reflect commissions or expenses that would have been incurred if an investor individually purchased or sold the securities represented in the Index.
Past performance is no guarantee of future results. Returns are historical and are calculated by determining the percentage change in net asset value or offering price (as applicable) with all distributions reinvested. Investment return and principal value will fluctuate so that shares, when redeemed, may be worth more or less than their original cost. Performance is for the stated time period only; due to market volatility, the Fund’s current performance may be lower or higher than the quoted return. For performance as of the most recent month end, please refer to www.eatonvance.com.
3
“Return Before Taxes” does not take into consideration shareholder taxes. It is most relevant to tax-free or tax-deferred shareholder accounts. “Return After Taxes on Distributions” reflects the impact of federal income taxes due on Fund distributions of dividends and capital gains. It is most relevant to taxpaying shareholders who continue to hold their shares. “Return After Taxes on Distributions and Sale of Fund Shares” also reflects the impact of taxes on capital gain or loss realized upon a sale of shares. It is most relevant to taxpaying shareholders who sell their shares.
Average Annual Total Returns
(For the periods ended October 31, 2007)
Returns at Net Asset Value (NAV) (Class A)
| | One Year | | Five Years | | Life of Fund | |
Return Before Taxes | | 16.93 | % | 13.85 | % | 9.04 | % |
Return After Taxes on Distributions | | 16.02 | | 13.66 | | 8.88 | |
Return After Taxes on Distributions and Sale of Fund Shares | | 12.00 | | 12.13 | | 7.85 | |
Returns at Public Offering Price (POP) (Class A)
| | One Year | | Five Years | | Life of Fund | |
Return Before Taxes | | 10.19 | % | 12.52 | % | 7.91 | % |
Return After Taxes on Distributions | | 9.33 | | 12.32 | | 7.74 | |
Return After Taxes on Distributions and Sale of Fund Shares | | 7.56 | | 10.92 | | 6.84 | |
Average Annual Total Returns
(For the periods ended October 31, 2007)
Returns at Net Asset Value (NAV) (Class C)
| | One Year | | Five Years | | Life of Fund | |
Return Before Taxes | | 16.07 | % | 13.02 | % | 8.24 | % |
Return After Taxes on Distributions | | 15.13 | | 12.82 | | 8.07 | |
Return After Taxes on Distributions and Sale of Fund Shares | | 11.48 | | 11.37 | | 7.14 | |
Returns at Public Offering Price (POP) (Class C)
| | One Year | | Five Years | | Life of Fund | |
Return Before Taxes | | 15.07 | % | 13.02 | % | 8.24 | % |
Return After Taxes on Distributions | | 14.13 | | 12.82 | | 8.07 | |
Return After Taxes on Distributions and Sale of Fund Shares | | 10.83 | | 11.37 | | 7.14 | |
Average Annual Total Returns
(For the periods ended October 31, 2007)
Returns at Net Asset Value (NAV) (Class B)
| | One Year | | Five Years | | Life of Fund | |
Return Before Taxes | | 16.07 | % | 13.02 | % | 8.24 | % |
Return After Taxes on Distributions | | 15.13 | | 12.82 | | 8.07 | |
Return After Taxes on Distributions and Sale of Fund Shares | | 11.48 | | 11.37 | | 7.14 | |
Returns at Public Offering Price (POP) (Class B)
| | One Year | | Five Years | | Life of Fund | |
Return Before Taxes | | 11.07 | % | 12.77 | % | 8.12 | % |
Return After Taxes on Distributions | | 10.13 | | 12.57 | | 7.95 | |
Return After Taxes on Distributions and Sale of Fund Shares | | 8.23 | | 11.15 | | 7.03 | |
Class A, Class B and Class C of the Fund commenced investment operations on 3/4/02. Returns at Public Offering Price (POP) reflect the deduction of the maximum initial sales charge and applicable CDSC, while Returns at Net Asset Value (NAV) do not.
After-tax returns are calculated using certain assumptions. After-tax returns are calculated using the highest historical individual federal income tax rates and do not reflect the impact of state and local taxes. Actual after-tax returns depend on a shareholder’s tax situation and the actual characterization of distributions and may differ from those shown. After-tax returns are not relevant to shareholders who hold shares in tax-deferred accounts or to shares held by non-taxable entities. Return After Taxes on Distributions for a period may be the same as Return Before Taxes for the same period because no taxable distributions were made during that period. Return After Taxes on Distributions and Sale of Fund Shares for a period may be greater than or equal to Return After Taxes on Distributions for the same period because of losses realized on the sale of Fund shares. Absent an allocation of certain expenses to the administrator of the Fund and sub-adviser of the Portfolio, the returns would be lower.
Past performance is no guarantee of future results. Returns are historical and are calculated by determining the percentage change in net asset value or offering price (as applicable) with all distributions reinvested. Investment return and principal value will fluctuate so that shares, when redeemed, may be worth more or less than their original cost. Performance is for the stated time period only; due to market volatility, the Fund’s current performance may be lower or higher than the quoted return. For performance as of the most recent month end, please refer to www.eatonvance.com.
4
Eaton Vance Tax-Managed Mid-Cap Core Fund as of October 31, 2007
FUND EXPENSES
Example: As a shareholder of the Fund, you incur two types of costs: (1) transaction costs, including sales charges (loads) on purchases and redemption fees (if applicable); and (2) ongoing costs, including management fees; distribution or service fees; and other Fund expenses. This Example is intended to help you understand your ongoing costs (in dollars) of investing in the Fund and to compare these costs with the ongoing costs of investing in other mutual funds. The Example is based on an investment of $1,000 invested at the beginning of the period and held for the entire period (May 1, 2007 – October 31, 2007).
Actual Expenses: The first section of the table below provides information about actual account values and actual expenses. You may use the information in this section, together with the amount you invested, to estimate the expenses that you paid over the period. Simply divide your account value by $1,000 (for example, an $8,600 account value divided by $1,000 = 8.6), then multiply the result by the number in the first section under the heading entitled "Expenses Paid During Period" to estimate the expenses you paid on your account during this period.
Hypothetical Example for Comparison Purposes: The second section of the table below provides information about hypothetical account values and hypothetical expenses based on the actual Fund expense ratio and an assumed rate of return of 5% per year (before expenses), which is not the actual return of the Fund. The hypothetical account values and expenses may not be used to estimate the actual ending account balance or expenses you paid for the period. You may use this information to compare the ongoing costs of investing in your Fund and other funds. To do so, compare this 5% hypothetical example with the 5% hypothetical examples that appear in the shareholder reports of the other funds.
Please note that the expenses shown in the table are meant to highlight your ongoing costs only and do not reflect any transactional costs, such as sales charges (loads) or redemption fees (if applicable). Therefore, the second section of the table is useful in comparing ongoing costs only, and will not help you determine the relative total costs of owning different funds. In addition, if these transactional costs were included, your costs would have been higher.
Eaton Vance Tax-Managed Mid-Cap Core Fund
| | | Beginning Account Value
(5/1/07) | | Ending Account Value
(10/31/07) | | Expenses Paid During Period*
(5/1/07 – 10/31/07) | |
| Actual | |
| Class A | | $ | 1,000.00 | | | $ | 1,054.80 | | | $ | 8.29 | ** | |
| Class B | | $ | 1,000.00 | | | $ | 1,051.40 | | | $ | 12.15 | ** | |
| Class C | | $ | 1,000.00 | | | $ | 1,051.40 | | | $ | 12.15 | ** | |
| Hypothetical | |
| (5% return per year before expenses) | |
| Class A | | $ | 1,000.00 | | | $ | 1,017.10 | | | $ | 8.13 | ** | |
| Class B | | $ | 1,000.00 | | | $ | 1,013.40 | | | $ | 11.93 | ** | |
| Class C | | $ | 1,000.00 | | | $ | 1,013.40 | | | $ | 11.93 | ** | |
* Expenses are equal to the Fund's annualized expense ratio of 1.60% for Class A shares, 2.35% for Class B shares, and 2.35% for Class C shares multiplied by the average account value over the period, multiplied by 184/365 (to reflect the one-half year period). The Example assumes that the $1,000 was invested at the net asset value per share determined at the close of business on April 30, 2007. The Example reflects the expenses of both the Fund and the Portfolio.
** Absent an allocation of certain expenses to the administrator of the Fund and sub-adviser of the Portfolio, expenses would be higher.
5
Eaton Vance Tax-Managed Mid-Cap Core Fund as of October 31, 2007
FINANCIAL STATEMENTS
Statement of Assets and Liabilities
As of October 31, 2007
| Assets | |
Investment in Tax-Managed Mid-Cap Core Portfolio, at value
(identified cost, $29,132,370) | | $ | 39,108,831 | | |
| Receivable for Fund shares sold | | | 123,444 | | |
| Receivable from affiliates | | | 22,506 | | |
| Total assets | | $ | 39,254,781 | | |
| Liabilities | |
| Payable for Fund shares redeemed | | $ | 98,172 | | |
| Payable to affiliate for distribution and service fees | | | 17,425 | | |
| Payable to affiliate for administration fee | | | 4,904 | | |
| Payable to affiliate for Trustees' fees | | | 301 | | |
| Other accrued expenses | | | 43,325 | | |
| Total liabilities | | $ | 164,127 | | |
| Net Assets | | $ | 39,090,654 | | |
| Sources of Net Assets | |
| Paid-in capital | | $ | 26,514,871 | | |
Accumulated undistributed net realized gain from Portfolio (computed on
the basis of identified cost) | | | 2,594,608 | | |
| Accumulated undistributed net investment income | | | 4,714 | | |
Net unrealized appreciation from Portfolio (computed on the basis of
identified cost) | | | 9,976,461 | | |
| Total | | $ | 39,090,654 | | |
| Class A Shares | |
| Net Assets | | $ | 24,406,260 | | |
| Shares Outstanding | | | 1,584,872 | | |
Net Asset Value and Redemption Price Per Share
(net assets ÷ shares of beneficial interest outstanding) | | $ | 15.40 | | |
Maximum Offering Price Per Share
(100 ÷ 94.25 of $15.40) | | $ | 16.34 | | |
| Class B Shares | |
| Net Assets | | $ | 5,949,735 | | |
| Shares Outstanding | | | 403,667 | | |
Net Asset Value and Offering Price Per Share*
(net assets ÷ shares of beneficial interest outstanding) | | $ | 14.74 | | |
| Class C Shares | |
| Net Assets | | $ | 8,734,659 | | |
| Shares Outstanding | | | 592,675 | | |
Net Asset Value and Offering Price Per Share*
(net assets ÷ shares of beneficial interest outstanding) | | $ | 14.74 | | |
| On sales of $50,000 or more, the offering price of Class A shares is reduced. | |
* Redemption price per share is equal to the net asset value less any applicable contingent deferred sales charge.
Statement of Operations
For the Year Ended
October 31, 2007
| Investment Income | |
| Dividends allocated from Portfolio | | $ | 448,167 | | |
| Interest allocated from Portfolio | | | 9,929 | | |
| Expenses allocated from Portfolio | | | (313,725 | ) | |
| Net investment income from Portfolio | | $ | 144,371 | | |
| Expenses | |
| Administration fee | | $ | 52,488 | | |
| Trustees' fees and expenses | | | 247 | | |
Distribution and service fees
Class A | | | 51,676 | | |
| Class B | | | 63,939 | | |
| Class C | | | 79,279 | | |
| Registration fees | | | 48,294 | | |
| Transfer and dividend disbursing agent fees | | | 42,223 | | |
| Custodian fee | | | 18,167 | | |
| Legal and accounting services | | | 18,087 | | |
| Printing and postage | | | 9,683 | | |
| Miscellaneous | | | 7,669 | | |
| Total expenses | | $ | 391,752 | | |
Deduct —
Allocation of Fund expenses to affiliates | | $ | 22,506 | | |
| Total expense reductions | | $ | 22,506 | | |
| Net expenses | | $ | 369,246 | | |
| Net investment loss | | $ | (224,875 | ) | |
Realized and Unrealized
Gain (Loss) from Portfolio | |
Net realized gain (loss) —
Investment transactions (identified cost basis) | | $ | 2,630,199 | | |
| Net realized gain | | $ | 2,630,199 | | |
Change in unrealized appreciation (depreciation) —
Investments (identified cost basis) | | $ | 2,853,010 | | |
| Net change in unrealized appreciation (depreciation) | | $ | 2,853,010 | | |
| Net realized and unrealized gain | | $ | 5,483,209 | | |
| Net increase in net assets from operations | | $ | 5,258,334 | | |
See notes to financial statements
6
Eaton Vance Tax-Managed Mid-Cap Core Fund as of October 31, 2007
FINANCIAL STATEMENTS CONT'D
Statements of Changes in Net Assets
Increase (Decrease)
in Net Assets | | Year Ended
October 31, 2007 | | Year Ended
October 31, 2006 | |
From operations —
Net investment loss | | $ | (224,875 | ) | | $ | (245,495 | ) | |
Net realized gain from
investment transactions | | | 2,630,199 | | | | 1,740,586 | | |
Net change in unrealized appreciation
(depreciation) of investments | | | 2,853,010 | | | | 1,876,307 | | |
| Net increase in net assets from operations | | $ | 5,258,334 | | | $ | 3,371,398 | | |
Distributions to shareholders —
From net realized gain
Class A | | $ | (947,771 | ) | | $ | (74,592 | ) | |
| Class B | | | (355,120 | ) | | | (34,859 | ) | |
| Class C | | | (393,590 | ) | | | (33,382 | ) | |
| Total distributions to shareholders | | $ | (1,696,481 | ) | | $ | (142,833 | ) | |
Transactions in shares of beneficial interest —
Proceeds from sale of shares
Class A | | $ | 6,448,468 | | | $ | 3,860,518 | | |
| Class B | | | 301,473 | | | | 916,692 | | |
| Class C | | | 1,813,005 | | | | 1,208,244 | | |
Net asset value of shares issued to
shareholders in payment of
distributions declared
Class A | | | 818,042 | | | | 64,988 | | |
| Class B | | | 324,495 | | | | 32,163 | | |
| Class C | | | 323,252 | | | | 28,293 | | |
Cost of shares redeemed
Class A | | | (3,433,448 | ) | | | (2,262,728 | ) | |
| Class B | | | (1,198,300 | ) | | | (1,037,730 | ) | |
| Class C | | | (1,214,224 | ) | | | (917,815 | ) | |
Net asset value of shares exchanged
Class A | | | 671,373 | | | | 486,142 | | |
| Class B | | | (671,373 | ) | | | (486,142 | ) | |
Net increase in net assets from
Fund share transactions | | $ | 4,182,763 | | | $ | 1,892,625 | | |
| Net increase in net assets | | $ | 7,744,616 | | | $ | 5,121,190 | | |
| Net Assets | |
| At beginning of year | | $ | 31,346,038 | | | $ | 26,224,848 | | |
| At end of year | | $ | 39,090,654 | | | $ | 31,346,038 | | |
Accumulated undistributed
net investment income
included in net assets | |
| At end of year | | $ | 4,714 | | | $ | 718 | | |
See notes to financial statements
7
Eaton Vance Tax-Managed Mid-Cap Core Fund as of October 31, 2007
FINANCIAL STATEMENTS CONT'D
Financial Highlights
| | | Class A | |
| | | Year Ended October 31, | |
| | | 2007 | | 2006 | | 2005 | | 2004 | | 2003 | |
| Net asset value — Beginning of year | | $ | 13.890 | | | $ | 12.360 | | | $ | 11.270 | | | $ | 10.670 | | | $ | 8.530 | | |
| Income (loss) from operations | |
| Net investment loss(1) | | $ | (0.049 | ) | | $ | (0.067 | ) | | $ | (0.108 | ) | | $ | (0.102 | ) | | $ | (0.087 | ) | |
| Net realized and unrealized gain | | | 2.299 | | | | 1.663 | | | | 1.198 | | | | 0.702 | | | | 2.227 | | |
| Total income from operations | | $ | 2.250 | | | $ | 1.596 | | | $ | 1.090 | | | $ | 0.600 | | | $ | 2.140 | | |
| Less distributions | |
| From net realized gain | | $ | (0.740 | ) | | $ | (0.066 | ) | | $ | — | | | $ | — | | | $ | — | | |
| Total distributions | | $ | (0.740 | ) | | $ | (0.066 | ) | | $ | — | | | $ | — | | | $ | — | | |
| Net asset value — End of year | | $ | 15.400 | | | $ | 13.890 | | | $ | 12.360 | | | $ | 11.270 | | | $ | 10.670 | | |
| Total Return(2) | | | 16.93 | % | | | 12.96 | % | | | 9.67 | % | | | 5.62 | % | | | 25.09 | % | |
| Ratios/Supplemental Data | |
| Net assets, end of year (000's omitted) | | $ | 24,406 | | | $ | 17,718 | | | $ | 13,761 | | | $ | 11,226 | | | $ | 7,054 | | |
| Ratios (As a percentage of average daily net assets): | |
| Expenses(3)(4) | | | 1.64 | % | | | 1.70 | % | | | 1.70 | % | | | 1.70 | % | | | 1.70 | % | |
| Net investment loss | | | (0.34 | )% | | | (0.50 | )% | | | (0.89 | )% | | | (0.93 | )% | | | (0.93 | )% | |
| Portfolio Turnover of the Portfolio | | | 38 | % | | | 55 | % | | | 53 | % | | | 42 | % | | | 50 | % | |
(1) Net investment loss per share was computed using average shares outstanding.
(2) Returns are historical and are calculated by determining the percentage change in net asset value with all distributions reinvested.
(3) Includes the Fund's share of the Portfolio's allocated expenses.
(4) The investment adviser waived a portion of its investment advisory fee and the administrator subsidized certain operating expenses (equal to 0.07%, 0.07%, 0.16%, 0.22% and 0.73% of average daily net assets for each of the years ended October 31, 2007, 2006, 2005, 2004 and 2003, respectively). A portion of the waiver and subsidy was borne by the sub-adviser of the Portfolio.
See notes to financial statements
8
Eaton Vance Tax-Managed Mid-Cap Core Fund as of October 31, 2007
FINANCIAL STATEMENTS CONT'D
Financial Highlights
| | | Class B | |
| | | Year Ended October 31, | |
| | | 2007 | | 2006 | | 2005 | | 2004 | | 2003 | |
| Net asset value — Beginning of year | | $ | 13.420 | | | $ | 12.030 | | | $ | 11.050 | | | $ | 10.540 | | | $ | 8.490 | | |
| Income (loss) from operations | |
| Net investment loss(1) | | $ | (0.151 | ) | | $ | (0.161 | ) | | $ | (0.194 | ) | | $ | (0.182 | ) | | $ | (0.158 | ) | |
| Net realized and unrealized gain | | | 2.211 | | | | 1.617 | | | | 1.174 | | | | 0.692 | | | | 2.208 | | |
| Total income from operations | | $ | 2.060 | | | $ | 1.456 | | | $ | 0.980 | | | $ | 0.510 | | | $ | 2.050 | | |
| Less distributions | |
| From net realized gain | | $ | (0.740 | ) | | $ | (0.066 | ) | | $ | — | | | $ | — | | | $ | — | | |
| Total distributions | | $ | (0.740 | ) | | $ | (0.066 | ) | | $ | — | | | $ | — | | | $ | — | | |
| Net asset value — End of year | | $ | 14.740 | | | $ | 13.420 | | | $ | 12.030 | | | $ | 11.050 | | | $ | 10.540 | | |
| Total Return(2) | | | 16.07 | % | | | 12.15 | % | | | 8.87 | % | | | 4.84 | % | | | 24.15 | % | |
| Ratios/Supplemental Data | |
| Net assets, end of year (000's omitted) | | $ | 5,950 | | | $ | 6,577 | | | $ | 6,436 | | | $ | 5,741 | | | $ | 4,139 | | |
| Ratios (As a percentage of average daily net assets): | |
| Expenses(3)(4) | | | 2.39 | % | | | 2.45 | % | | | 2.45 | % | | | 2.45 | % | | | 2.45 | % | |
| Net investment loss | | | (1.08 | )% | | | (1.25 | )% | | | (1.64 | )% | | | (1.67 | )% | | | (1.69 | )% | |
| Portfolio Turnover of the Portfolio | | | 38 | % | | | 55 | % | | | 53 | % | | | 42 | % | | | 50 | % | |
(1) Net investment loss per share was computed using average shares outstanding.
(2) Returns are historical and are calculated by determining the percentage change in net asset value with all distributions reinvested.
(3) Includes the Fund's share of the Portfolio's allocated expenses.
(4) The investment adviser waived a portion of its investment advisory fee and the administrator subsidized certain operating expenses (equal to 0.07%, 0.07%, 0.16%, 0.22% and 0.73% of average daily net assets for each of the years ended October 31, 2007, 2006, 2005, 2004 and 2003, respectively). A portion of the waiver and subsidy was borne by the sub-adviser of the Portfolio.
See notes to financial statements
9
Eaton Vance Tax-Managed Mid-Cap Core Fund as of October 31, 2007
FINANCIAL STATEMENTS CONT'D
Financial Highlights
| | | Class C | |
| | | Year Ended October 31, | |
| | | 2007 | | 2006 | | 2005 | | 2004 | | 2003 | |
| Net asset value — Beginning of year | | $ | 13.420 | | | $ | 12.030 | | | $ | 11.050 | | | $ | 10.540 | | | $ | 8.490 | | |
| Income (loss) from operations | |
| Net investment loss(1) | | $ | (0.151 | ) | | $ | (0.161 | ) | | $ | (0.194 | ) | | $ | (0.182 | ) | | $ | (0.157 | ) | |
| Net realized and unrealized gain | | | 2.211 | | | | 1.617 | | | | 1.174 | | | | 0.692 | | | | 2.207 | | |
| Total income from operations | | $ | 2.060 | | | $ | 1.456 | | | $ | 0.980 | | | $ | 0.510 | | | $ | 2.050 | | |
| Less distributions | |
| From net realized gain | | $ | (0.740 | ) | | $ | (0.066 | ) | | $ | — | | | $ | — | | | $ | — | | |
| Total distributions | | $ | (0.740 | ) | | $ | (0.066 | ) | | $ | — | | | $ | — | | | $ | — | | |
| Net asset value — End of year | | $ | 14.740 | | | $ | 13.420 | | | $ | 12.030 | | | $ | 11.050 | | | $ | 10.540 | | |
| Total Return(2) | | | 16.07 | % | | | 12.15 | % | | | 8.87 | % | | | 4.84 | % | | | 24.15 | % | |
| Ratios/Supplemental Data | |
| Net assets, end of year (000's omitted) | | $ | 8,735 | | | $ | 7,051 | | | $ | 6,027 | | | $ | 5,450 | | | $ | 4,056 | | |
| Ratios (As a percentage of average daily net assets): | |
| Expenses(3)(4) | | | 2.39 | % | | | 2.45 | % | | | 2.45 | % | | | 2.45 | % | | | 2.45 | % | |
| Net investment loss | | | (1.08 | )% | | | (1.25 | )% | | | (1.64 | )% | | | (1.68 | )% | | | (1.70 | )% | |
| Portfolio Turnover of the Portfolio | | | 38 | % | | | 55 | % | | | 53 | % | | | 42 | % | | | 50 | % | |
(1) Net investment loss per share was computed using average shares outstanding.
(2) Returns are historical and are calculated by determining the percentage change in net asset value with all distributions reinvested.
(3) Includes the Fund's share of the Portfolio's allocated expenses.
(4) The investment adviser waived a portion of its investment advisory fee and the administrator subsidized certain operating expenses (equal to 0.07%, 0.07%, 0.16%, 0.22% and 0.73% of average daily net assets for each of the years ended October 31, 2007, 2006, 2005, 2004 and 2003, respectively). A portion of the waiver and subsidy was borne by the sub-adviser of the Portfolio.
See notes to financial statements
10
Eaton Vance Tax-Managed Mid-Cap Core Fund as of October 31, 2007
NOTES TO FINANCIAL STATEMENTS
1 Significant Accounting Policies
Eaton Vance Tax-Managed Mid-Cap Core Fund (the Fund) is a diversified series of Eaton Vance Mutual Funds Trust (the Trust). The Trust is a Massachusetts business trust registered under the Investment Company Act of 1940, as amended (the 1940 Act), as an open-end management investment company. The Fund offers three classes of shares. Class A shares are generally sold subject to a sales charge imposed at time of purchase. Class B and Class C shares are sold at net asset value and are generally subject to a contingent deferred sales charge (see Note 6). Class B shares held for eight years will automatically convert to Class A shares. Each class represents a pro-rata interest in the Fund, but votes separately on class-specific matters and (as noted below) is subject to different expenses. Realized and unrealized gains and losses and net investment income and losses, other than class-specific expenses, are allocated daily to each cla ss of shares based on the relative net assets of each class to the total net assets of the Fund. Each class of shares differs in its distribution plan and certain other class-specific expenses. The Fund invests all of its investable assets in interests of the Tax-Managed Mid-Cap Core Portfolio (the Portfolio), a New York trust, having the same investment objective and policies as the Fund. The value of the Fund's investment in the Portfolio reflects the Fund's proportionate interest in the net assets of the Portfolio (35.5% at October 31, 2007). The performance of the Fund is directly affected by the performance of the Portfolio. The financial statements of the Portfolio, including the Portfolio of Investments, are included elsewhere in this report and should be read in conjunction with the Fund's financial statements.
The following is a summary of significant accounting policies of the Fund. The policies are in conformity with accounting principles generally accepted in the United States of America.
A Investment Valuation — Valuation of securities by the Portfolio is discussed in Note 1A of the Portfolio's Notes to Financial Statements, which are included elsewhere in this report.
B Income — The Fund's net investment income or loss consists of the Fund's pro-rata share of the net investment income or loss of the Portfolio, less all actual and accrued expenses of the Fund.
C Expenses — The majority of expenses of the Trust are directly identifiable to an individual fund. Expenses which are not readily identifiable to a specific fund are allocated taking into consideration, among other things, the nature and type of expense and the relative size of the funds.
D Federal Taxes — The Fund's policy is to comply with the provisions of the Internal Revenue Code applicable to regulated investment companies and to distribute to shareholders each year substantially all of its net investment income, and all or substantially all of its net realized capital gains. Accordingly, no provision for federal income or excise tax is necessary.
E Expense Reduction — State Street Bank and Trust Company (SSBT) serves as custodian of the Fund. Pursuant to the custodian agreement, SSBT receives a fee reduced by credits, which are determined based on the average daily cash balance the Fund maintains with SSBT. All credit balances, if any, used to reduce the Fund's custodian fees are reported as a reduction of expenses in the Statement of Operations.
F Other — Investment transactions are accounted for on a trade date basis. Dividends to shareholders are recorded on the ex-dividend date.
G Use of Estimates — The preparation of the financial statements in conformity with accounting principles generally accepted in the United States of America requires management to make estimates and assumptions that affect the reported amounts of assets and liabilities at the date of the financial statements and the reported amounts of income and expense during the reporting period. Actual results could differ from those estimates.
H Indemnifications — Under the Trust's organizational documents, its officers and Trustees may be indemnified against certain liabilities and expenses arising out of the performance of their duties to the Fund, and shareholders are indemnified against personal liability for obligations of the Trust. Additionally, in the normal course of business, the Fund enters into agreements with service providers that may contain indemnification clauses. The Fund's maximum exposure under these arrangements is unknown as this would involve future claims that may be made against the Fund that have not yet occurred.
2 Distributions to Shareholders
It is the present policy of the Fund to make at least one distribution annually (normally in December) of all or substantially all of its net investment income and at least one distribution annually of all or substantially all of its net realized capital gains (reduced by available capital loss
11
Eaton Vance Tax-Managed Mid-Cap Core Fund as of October 31, 2007
NOTES TO FINANCIAL STATEMENTS CONT'D
carryforwards from prior years, if any). Distributions are declared separately for each class of shares. Shareholders may reinvest distributions in shares of the same class of the Fund at the net asset value as of the reinvestment date or, at the election of the shareholder, receive distributions in cash. The Fund distinguishes between distributions on a tax basis and a financial reporting basis. Accounting principles generally accepted in the United States of America require that only distributions in excess of tax basis earnings and profits be reported in the financial statements as a return of capital. Permanent differences between book and tax accounting relating to distributions are reclassified to paid-in capital.
The tax character of distributions paid for the years ended October 31, 2007 and October 31, 2006 was as follows:
| | | Year Ended October 31, | |
| | | 2007 | | 2006 | |
| Distributions declared from: | |
| Long-Term Capital Gains | | $ | 1,696,481 | | | $ | 142,833 | | |
During the year ended October 31, 2007, the following amounts were reclassified due to differences between book and tax accounting for net operating losses and real estate investment trusts:
| Increase (decrease): | |
| Paid-in capital | | $ | (233,924 | ) | |
| Accumulated net realized gain | | $ | 5,053 | | |
| Accumulated net investment loss | | $ | 228,871 | | |
These reclassifications had no effect on the net assets or net asset value per share of the Fund.
As of October 31, 2007, the components of distributable earnings (accumulated losses) and unrealized appreciation (depreciation) on a tax basis were as follows:
| Undistributed long term capital gain | | $ | 2,637,895 | | |
| Unrealized appreciation | | $ | 9,937,888 | | |
The difference between components of distributable earnings (accumulated losses) on a tax basis and the amounts reflected in the Statement of Assets and Liabilities is primarily due to wash sales, partnership allocations and real estate investment trusts.
3 Shares of Beneficial Interest
The Fund's Declaration of Trust permits the Trustees to issue an unlimited number of full and fractional shares of beneficial interest (without par value). Such shares may be issued in a number of different series (such as the Fund) and classes. Transactions in Fund shares were as follows:
| | | Year Ended October 31, | |
| Class A | | 2007 | | 2006 | |
| Sales | | | 439,915 | | | | 291,430 | | |
Issued to shareholders electing to
receive payments of distributions
in Fund shares | | | 60,372 | | | | 5,069 | | |
| Redemptions | | | (237,133 | ) | | | (171,032 | ) | |
| Exchanges from Class B shares | | | 45,930 | | | | 36,594 | | |
| Net increase | | | 309,084 | | | | 162,061 | | |
| | | Year Ended October 31, | |
| Class B | | 2007 | | 2006 | |
| Sales | | | 21,797 | | | | 71,659 | | |
Issued to shareholders electing to
receive payments of distributions
in Fund shares | | | 24,865 | | | | 2,581 | | |
| Redemptions | | | (85,330 | ) | | | (81,383 | ) | |
| Exchanges to Class A shares | | | (47,798 | ) | | | (37,711 | ) | |
| Net decrease | | | (86,466 | ) | | | (44,854 | ) | |
| | | Year Ended October 31, | |
| Class C | | 2007 | | 2006 | |
| Sales | | | 129,288 | | | | 93,800 | | |
Issued to shareholders electing to
receive payments of distributions
in Fund shares | | | 24,770 | | | | 2,271 | | |
| Redemptions | | | (86,912 | ) | | | (71,657 | ) | |
| Net increase | | | 67,146 | | | | 24,414 | | |
4 Transactions with Affiliates
The administration fee is earned by Eaton Vance Management (EVM) as compensation for managing and administering the business affairs of the Fund. Under the administration agreement, EVM earns a fee in the amount of 0.15% per annum of average daily net assets of the Fund. For the year ended October 31, 2007, the administration fee amounted to $52,488. Pursuant to an expense reimbursement agreement, EVM and Atlanta Capital Management LLC (Atlanta Capital), a majority owned subsidiary of EVM and sub-adviser to the Portfolio, were allocated $7,033 and $15,473, respectively, of the Fund's operating expenses for the year ended October 31, 2007. Prior to April 23, 2007, this expense reimbursement
12
Eaton Vance Tax-Managed Mid-Cap Core Fund as of October 31, 2007
NOTES TO FINANCIAL STATEMENTS CONT'D
agreement was voluntary and could be terminated at any time. Effective April 23, 2007, EVM and Atlanta Capital have agreed to reimburse the Fund's expenses to the extent that the Total Annual Operating Expenses exceeded 1.60% for Class A shares and 2.35% for Class B and Class C shares. This expense reimbursement will continue through April 30, 2010. The Portfolio has engaged Boston Management and Research (BMR), a subsidiary of EVM, to render investment advisory services. See Note 2 of the Portfolio's Notes to Financial Statements which are included elsewhere in this report. EVM serves as the sub-transfer agent of the Fund and receives from the transfer agent an aggregate fee based upon the actual expenses incurred by EVM in the performance of those services. During the year ended October 31, 2007, EVM received approximately $3,144 in sub-transfer agent fees.
Eaton Vance Distributors, Inc. (EVD), a subsidiary of EVM and the Fund's principal underwriter, received $16,151 as its portion of the sales charge on sales of Class A shares for the year ended October 31, 2007. EVD also received distribution and service fees from Class A, Class B and Class C shares (see Note 5) and contingent deferred sales charges (see Note 6).
Except for Trustees of the Fund and the Portfolio who are not members of EVM's or BMR's organizations, officers and Trustees receive remuneration for their services to the Fund out of the investment adviser fee earned by BMR. Trustees of the Fund that are not affiliated with EVM or BMR may elect to defer receipt of all or a percentage of their annual fees in accordance with the terms of the Trustees Deferred Compensation Plan. For the year ended October 31, 2007, no significant amounts have been deferred.
Certain officers and Trustees of the Fund and of the Portfolio are officers of the above organizations.
5 Distribution Plans
The Fund has in effect a distribution plan for Class A shares (Class A Plan) pursuant to Rule 12b-1 under the 1940 Act. The Class A Plan provides that the Fund will pay EVD a distribution and service fee of 0.25% per annum of its average daily net assets attributable to Class A shares for distribution services and facilities provided to the Fund by EVD, as well as for personal services and/or the maintenance of shareholder accounts. Distribution and service fees paid or accrued to EVD for the year ended October 31, 2007 amounted to $51,676 for Class A shares.
The Fund also has in effect distribution plans for Class B shares (Class B Plan) and Class C shares (Class C Plan) pursuant to Rule 12b-1 under the 1940 Act. The Class B and Class C Plans require the Fund to pay EVD amounts equal to 0.75% per annum of the Fund's average daily net assets attributable to Class B and Class C shares for providing ongoing distribution services and facilities to the Fund. The Fund will automatically discontinue payments to EVD during any period in which there are no outstanding Uncovered Distribution Charges, which are equivalent to the sum of (i) 6.25% of the aggregate amount received by the Fund for the Class B and Class C shares sold, plus (ii) interest calculated by applying the rate of 1% over the prevailing prime rate to the outstanding balance of Uncovered Distribution Charges of EVD of each respective class, reduced by the aggregate amount of contingent deferred sales charges (see Note 6) and amounts theretofore paid or payable to EVD by each respective class. For the year ended October 31, 2007, the Fund paid or accrued $47,954 and $59,459 for Class B and Class C shares, respectively, to or payable to EVD, representing 0.75% of the average daily net assets of Class B and Class C shares. At October 31, 2007, the amount of Uncovered Distribution Charges of EVD calculated under the Plans was approximately $92,000 and $463,000 for Class B and Class C shares, respectively. The Class B and Class C Plans also authorize the Fund to make payments of service fees to EVD, investment dealers, and other persons in amounts not exceeding 0.25% per annum of the Fund's average daily net assets attributable to the Class B and Class C shares. Service fees paid or accrued are for personal services and/or the maintenance of shareholder accounts. They are separate and distinct from the sales commissions and distribution fees payable to EVD and, a s such, are not subject to automatic discontinuance when there are no outstanding Uncovered Distribution Charges of EVD. Service fees paid or accrued for the year ended October 31, 2007 amounted to $15,985, and $19,820, for Class B and Class C shares, respectively.
6 Contingent Deferred Sales Charge
A contingent deferred sales charge (CDSC) generally is imposed on redemptions of Class B shares made within six years of purchase and on redemptions of Class C shares made within one year of purchase. Class A shares may be subject to a CDSC of up to 1% if redeemed within two years of purchase (depending upon the circumstances of purchase). Generally, the CDSC is based upon the lower of the net asset value at date of redemption or date of purchase. No charge is levied on shares acquired by reinvestment of dividends or capital gains distributions. The Class B CDSC is imposed at declining rates that begin at 5% in the case of redemptions in the first and second year after purchase, declining one percentage point each subsequent
13
Eaton Vance Tax-Managed Mid-Cap Core Fund as of October 31, 2007
NOTES TO FINANCIAL STATEMENTS CONT'D
year. Class C shares are subject to a 1% CDSC if redeemed within one year of purchase. No CDSC is levied on shares which have been sold to EVM or its affiliates or to their respective employees or clients and may be waived under certain other limited conditions. CDSC received on Class B and Class C redemptions are paid to EVD to reduce the amount of Uncovered Distribution Charges calculated under the Fund's Class B and Class C Plans. CDSC received on Class B and Class C redemptions when no Uncovered Distribution Charges exist are credited to the Fund. The Fund was informed that EVD received approximately $7,000 and $1,000 of CDSC paid by shareholders for Class B and Class C shares, respectively, for the year ended October 31, 2007. EVD did not receive any CDSC from shareholders of Class A shares for the year ended October 31, 2007.
7 Investment Transactions
Increases and decreases in the Fund's investment in the Portfolio for the year ended October 31, 2007 aggregated $8,454,067 and $6,343,985, respectively.
8 Recently Issued Accounting Pronouncements
In June 2006, the Financial Accounting Standards Board (FASB) issued FASB Interpretation No. 48 (FIN 48), "Accounting for Uncertainty in Income Taxes – an interpretation of FASB Statement No. 109". FIN 48 clarifies the accounting for uncertainty in income taxes recognized in accordance with FASB Statement No. 109, "Accounting for Income Taxes". This interpretation prescribes a recognition threshold and measurement attribute for the financial statement recognition and measurement of a tax position taken or expected to be taken in a tax return. It also provides guidance on de-recognition, classification, interest and penalties, accounting in interim periods, disclosure and transition. FIN 48 is effective on the last business day of the first required financial reporting period for fiscal years beginning after December 15, 2006. Management is currently evaluating the impact of applying the various provisions of FIN 48.
In September 2006, the FASB issued Statement of Financial Accounting Standards No. 157 (FAS 157), "Fair Value Measurements". FAS 157 defines fair value, establishes a framework for measuring fair value in accordance with generally accepted accounting principles and expands disclosure about fair value measurements. FAS 157 is effective for fiscal years beginning after November 15, 2007. Management is currently evaluating the impact the adoption of FAS 157 will have on the Fund's financial statement disclosures.
14
Eaton Vance Tax-Managed Mid-Cap Core Fund as of October 31, 2007
REPORT OF INDEPENDENT REGISTERED PUBLIC ACCOUNTING FIRM
To the Trustees of Eaton Vance Mutual Funds Trust and Shareholders of Eaton Vance
Tax-Managed Mid-Cap Core Fund:
We have audited the accompanying statement of assets and liabilities of Eaton Vance Tax-Managed Mid-Cap Core Fund (the "Fund") (one of the series of Eaton Vance Mutual Funds Trust) as of October 31, 2007, and the related statement of operations for the year then ended, the statements of changes in net assets for each of the two years in the period then ended, and the financial highlights for each of the five years in the period then ended. These financial statements and financial highlights are the responsibility of the Fund's management. Our responsibility is to express an opinion on these financial statements and financial highlights based on our audits.
We conducted our audits in accordance with the standards of the Public Company Accounting Oversight Board (United States). Those standards require that we plan and perform the audit to obtain reasonable assurance about whether the financial statements and financial highlights are free of material misstatement. The Fund is not required to have, nor were we engaged to perform, an audit of its internal control over financial reporting. Our audits included consideration of internal control over financial reporting as a basis for designing audit procedures that are appropriate in the circumstances, but not for the purpose of expressing an opinion on the effectiveness of the Fund's internal control over financial reporting. Accordingly, we express no such opinion. An audit also includes examining, on a test basis, evidence supporting the amounts and disclosures in the financial statements, assessing the accounting principles used and significant estimates made by management, as well as evaluating the overall financial statement presentation. We believe that our audits provide a reasonable basis for our opinion.
In our opinion, the financial statements and financial highlights referred to above present fairly, in all material respects, the financial position of Eaton Vance Tax-Managed Mid-Cap Core Fund as of October 31, 2007, the results of its operations for the year then ended, the changes in its net assets for each of the two years in the period then ended, and the financial highlights for each of the five years in the period then ended, in conformity with accounting principles generally accepted in the United States of America.
DELOITTE & TOUCHE LLP
Boston, Massachusetts
December 14, 2007
15
Eaton Vance Tax-Managed Mid-Cap Core Fund as of October 31, 2007
FEDERAL TAX INFORMATION (Unaudited)
The Form 1099-DIV you receive in January 2008 will show the tax status of all distributions paid to your account in calendar year 2007. Shareholders are advised to consult their own tax adviser with respect to the tax consequences of their investment in the Fund. As required by the Internal Revenue Code regulations, shareholders must be notified within 60 days of the Fund's fiscal year end regarding the status of long-term capital gains distributions.
Long-term Capital Gains Distributions — The Fund designates $1,696,481 as a long-term capital gain distribution.
16
Tax-Managed Mid-Cap Core Portfolio as of October 31, 2007
PORTFOLIO OF INVESTMENTS
| Common Stocks — 99.2% | |
| Security | | Shares | | Value | |
| Air Freight & Logistics — 2.1% | |
| C.H. Robinson Worldwide, Inc. | | | 18,200 | | | $ | 908,544 | | |
| Expeditors International of Washington, Inc. | | | 28,300 | | | | 1,433,395 | | |
| | | $ | 2,341,939 | | |
| Airlines — 0.6% | |
| SkyWest, Inc. | | | 26,000 | | | $ | 709,540 | | |
| | | $ | 709,540 | | |
| Auto Components — 0.7% | |
| BorgWarner, Inc. | | | 7,000 | | | $ | 739,970 | | |
| | | $ | 739,970 | | |
| Automobiles — 1.1% | |
| Thor Industries, Inc. | | | 25,000 | | | $ | 1,200,000 | | |
| | | $ | 1,200,000 | | |
| Capital Markets — 6.9% | |
| Affiliated Managers Group(1) | | | 18,800 | | | $ | 2,473,140 | | |
| Federated Investors, Inc., Class B | | | 19,000 | | | | 817,000 | | |
| Nuveen Investments, Class A | | | 21,000 | | | | 1,360,800 | | |
| Raymond James Financial, Corp. | | | 42,000 | | | | 1,564,500 | | |
| SEI Investments Co. | | | 44,600 | | | | 1,410,252 | | |
| | | $ | 7,625,692 | | |
| Chemicals — 2.6% | |
| Albemarle Corp. | | | 35,200 | | | $ | 1,681,152 | | |
| RPM International, Inc. | | | 56,000 | | | | 1,200,080 | | |
| | | $ | 2,881,232 | | |
| Commercial Banks — 3.5% | |
| City National Corp. | | | 22,000 | | | $ | 1,487,200 | | |
| Cullen/Frost Bankers, Inc. | | | 31,700 | | | | 1,685,806 | | |
| TCF Financial Corp. | | | 32,000 | | | | 728,640 | | |
| | | $ | 3,901,646 | | |
| Commercial Services & Supplies — 1.3% | |
| FTI Consulting, Inc.(1) | | | 27,000 | | | $ | 1,466,100 | | |
| | | $ | 1,466,100 | | |
| Security | | Shares | | Value | |
| Computer Peripherals — 1.2% | |
| Diebold, Inc. | | | 31,500 | | | $ | 1,317,960 | | |
| | | $ | 1,317,960 | | |
| Construction & Engineering — 2.6% | |
| Jacobs Engineering Group(1) | | | 33,000 | | | $ | 2,875,950 | | |
| | | $ | 2,875,950 | | |
| Construction Materials — 1.1% | |
| Martin Marietta Materials | | | 9,000 | | | $ | 1,164,150 | | |
| | | $ | 1,164,150 | | |
| Containers & Packaging — 1.1% | |
| Sonoco Products Co. | | | 40,300 | | | $ | 1,246,076 | | |
| | | $ | 1,246,076 | | |
| Diversified Consumer Services — 1.5% | |
| Apollo Group, Inc., Class A(1) | | | 21,500 | | | $ | 1,704,090 | | |
| | | $ | 1,704,090 | | |
| Electric Utilities — 1.5% | |
| DPL, Inc. | | | 56,600 | | | $ | 1,643,664 | | |
| | | $ | 1,643,664 | | |
| Electrical Equipment — 2.9% | |
| AMETEK, Inc. | | | 42,000 | | | $ | 1,974,000 | | |
| Hubbell, Inc., Class B | | | 23,000 | | | | 1,265,000 | | |
| | | $ | 3,239,000 | | |
| Electronic Equipment & Instruments — 3.8% | |
| Amphenol Corp., Class A | | | 55,000 | | | $ | 2,434,850 | | |
| National Instruments Corp. | | | 55,000 | | | | 1,784,200 | | |
| | | $ | 4,219,050 | | |
| Energy Equipment & Services — 4.8% | |
| FMC Technologies, Inc.(1) | | | 58,000 | | | $ | 3,516,540 | | |
| Grant Prideco, Inc.(1) | | | 36,000 | | | | 1,769,760 | | |
| | | $ | 5,286,300 | | |
See notes to financial statements
17
Tax-Managed Mid-Cap Core Portfolio as of October 31, 2007
PORTFOLIO OF INVESTMENTS CONT'D
| Security | | Shares | | Value | |
| Food & Staples Retailing — 1.1% | |
| Ruddick Corp. | | | 36,000 | | | $ | 1,224,000 | | |
| | | $ | 1,224,000 | | |
| Food Products — 2.2% | |
| Corn Products International, Inc. | | | 26,000 | | | $ | 1,106,040 | | |
| Hormel Foods Corp. | | | 35,000 | | | | 1,276,800 | | |
| | | $ | 2,382,840 | | |
| Gas Utilities — 4.7% | |
| AGL Resources, Inc. | | | 41,100 | | | $ | 1,624,683 | | |
| Piedmont Natural Gas Co. | | | 61,200 | | | | 1,562,436 | | |
| Questar Corp. | | | 34,000 | | | | 1,940,720 | | |
| | | $ | 5,127,839 | | |
| Health Care Equipment & Supplies — 8.9% | |
| Beckman Coulter, Inc. | | | 11,400 | | | $ | 807,348 | | |
| Bard (C.R.), Inc. | | | 15,800 | | | | 1,321,038 | | |
| DENTSPLY International, Inc. | | | 45,800 | | | | 1,899,784 | | |
| Mentor Corp. | | | 34,000 | | | | 1,447,380 | | |
| Respironics, Inc.(1) | | | 48,500 | | | | 2,427,910 | | |
| Varian Medical Systems, Inc.(1) | | | 39,000 | | | | 1,902,030 | | |
| | | $ | 9,805,490 | | |
| Health Care Providers & Services — 2.8% | |
| Henry Schein, Inc.(1) | | | 25,000 | | | $ | 1,497,500 | | |
| Owens & Minor, Inc. | | | 38,000 | | | | 1,540,520 | | |
| | | $ | 3,038,020 | | |
| Hotels, Restaurants & Leisure — 3.2% | |
| Applebee's International, Inc. | | | 43,000 | | | $ | 1,089,620 | | |
| International Speedway Corp., Class A | | | 18,500 | | | | 821,955 | | |
| Sonic Corp.(1) | | | 63,850 | | | | 1,582,203 | | |
| | | $ | 3,493,778 | | |
| Household Durables — 1.5% | |
| Harman International Industries | | | 11,000 | | | $ | 926,200 | | |
| Mohawk Industries, Inc.(1) | | | 8,500 | | | | 725,390 | | |
| | | $ | 1,651,590 | | |
| Security | | Shares | | Value | |
| Insurance — 2.8% | |
| HCC Insurance Holdings, Inc. | | | 39,000 | | | $ | 1,165,710 | | |
| Markel Corp.(1) | | | 2,300 | | | | 1,249,406 | | |
| Protective Life Corp. | | | 16,700 | | | | 715,929 | | |
| | | $ | 3,131,045 | | |
| IT Services — 1.8% | |
| Cognizant Technology Solutions Corp.(1) | | | 22,000 | | | $ | 912,120 | | |
| Fiserv, Inc.(1) | | | 20,200 | | | | 1,119,080 | | |
| | | $ | 2,031,200 | | |
| Life Sciences Tools & Services — 0.5% | |
| Pharmaceutical Product Development | | | 12,500 | | | $ | 528,000 | | |
| | | $ | 528,000 | | |
| Machinery — 3.9% | |
| Donaldson Co., Inc. | | | 35,000 | | | $ | 1,500,100 | | |
| Dover Corp. | | | 30,300 | | | | 1,393,800 | | |
| Graco, Inc. | | | 36,200 | | | | 1,424,832 | | |
| | | $ | 4,318,732 | | |
| Media — 1.7% | |
| Washington Post Co., Class B | | | 2,200 | | | $ | 1,867,800 | | |
| | | $ | 1,867,800 | | |
| Metals & Mining — 1.1% | |
| Reliance Steel & Aluminum Co. | | | 20,000 | | | $ | 1,167,000 | | |
| | | $ | 1,167,000 | | |
| Multiline Retail — 0.7% | |
| Family Dollar Stores | | | 30,000 | | | $ | 760,500 | | |
| | | $ | 760,500 | | |
| Multi-Utilities — 2.8% | |
| NSTAR | | | 40,000 | | | $ | 1,406,400 | | |
| OGE Energy Corp. | | | 42,300 | | | | 1,620,090 | | |
| | | $ | 3,026,490 | | |
| Office Electronics — 1.3% | |
| Zebra Technologies Corp., Class A(1) | | | 36,275 | | | $ | 1,417,990 | | |
| | | $ | 1,417,990 | | |
See notes to financial statements
18
Tax-Managed Mid-Cap Core Portfolio as of October 31, 2007
PORTFOLIO OF INVESTMENTS CONT'D
| Security | | Shares | | Value | |
| Oil, Gas & Consumable Fuels — 3.8% | |
| Holly Corp. | | | 35,000 | | | $ | 2,198,000 | | |
| Peabody Energy Corp. | | | 20,000 | | | | 1,115,000 | | |
| Pogo Producing Co. | | | 15,000 | | | | 893,400 | | |
| | | $ | 4,206,400 | | |
| Personal Products — 1.7% | |
| Alberto-Culver Co. | | | 72,000 | | | $ | 1,871,280 | | |
| | | $ | 1,871,280 | | |
| Real Estate Investment Trusts (REITs) — 1.2% | |
| Developers Diversified Realty | | | 25,300 | | | $ | 1,275,120 | | |
| | | $ | 1,275,120 | | |
| Semiconductors & Semiconductor Equipment — 1.3% | |
| Microchip Technology, Inc. | | | 42,050 | | | $ | 1,394,798 | | |
| | | $ | 1,394,798 | | |
| Software — 5.6% | |
| ANSYS, Inc.(1) | | | 42,200 | | | $ | 1,637,782 | | |
| Citrix Systems, Inc.(1) | | | 42,500 | | | | 1,827,075 | | |
| Fair Isaac, Inc. | | | 11,000 | | | | 417,120 | | |
| Jack Henry & Associates, Inc. | | | 78,500 | | | | 2,293,770 | | |
| | | $ | 6,175,747 | | |
| Specialty Retail — 2.4% | |
| O'Reilly Automotive, Inc.(1) | | | 45,000 | | | $ | 1,485,900 | | |
| Ross Stores, Inc. | | | 41,500 | | | | 1,121,330 | | |
| | | $ | 2,607,230 | | |
| Tobacco — 1.9% | |
| Universal Corp., VA | | | 43,000 | | | $ | 2,095,820 | | |
| | | $ | 2,095,820 | | |
| Security | | Shares | | Value | |
| Trading Companies & Distributors — 1.0% | |
| MSC Industrial Direct Co., Class A | | | 23,000 | | | $ | 1,120,330 | | |
| | | $ | 1,120,330 | | |
Total Common Stocks
(identified cost $79,349,483) | | $ | 109,281,398 | | |
Total Investments — 99.2%
(identified cost $79,349,483) | | $ | 109,281,398 | | |
| Other Assets, Less Liabilities — 0.8% | | $ | 883,209 | | |
| Net Assets — 100.0% | | $ | 110,164,607 | | |
(1) Non-income producing security.
See notes to financial statements
19
Tax-Managed Mid-Cap Core Portfolio as of October 31, 2007
FINANCIAL STATEMENTS
Statement of Assets and Liabilities
As of October 31, 2007
| Assets | |
| Investments, at value (identified cost, $79,349,483) | | $ | 109,281,398 | | |
| Cash | | | 1,087,820 | | |
| Dividends and interest receivable | | | 77,303 | | |
| Total assets | | $ | 110,446,521 | | |
| Liabilities | |
| Payable for investments purchased | | $ | 151,077 | | |
| Payable to affiliate for investment advisory fee | | | 72,219 | | |
| Payable to affiliate for Trustees' fees | | | 835 | | |
| Other accrued expenses | | | 57,783 | | |
| Total liabilities | | $ | 281,914 | | |
| Net Assets applicable to investors' interest in Portfolio | | $ | 110,164,607 | | |
| Sources of Net Assets | |
| Net proceeds from capital contributions and withdrawals | | $ | 80,232,692 | | |
| Net unrealized appreciation (computed on the basis of identified cost) | | | 29,931,915 | | |
| Total | | $ | 110,164,607 | | |
Statement of Operations
For the Year Ended
October 31, 2007
| Investment Income | |
| Dividends | | $ | 1,336,644 | | |
| Interest | | | 29,751 | | |
| Total investment income | | $ | 1,366,395 | | |
| Expenses | |
| Investment adviser fee | | $ | 834,737 | | |
| Trustees' fees and expenses | | | 8,306 | | |
| Custodian fee | | | 58,846 | | |
| Legal and accounting services | | | 30,727 | | |
| Miscellaneous | | | 4,728 | | |
| Total expenses | | $ | 937,344 | | |
Deduct —
Reduction of investment adviser fee | | $ | 2,403 | | |
| Total expense reductions | | $ | 2,403 | | |
| Net expenses | | $ | 934,941 | | |
| Net investment income | | $ | 431,454 | | |
| Realized and Unrealized Gain (Loss) | |
Net realized gain (loss) —
Investment transactions (identified cost basis) | | $ | 8,082,328 | | |
| Net realized gain | | $ | 8,082,328 | | |
Change in unrealized appreciation (depreciation) —
Investments (identified cost basis) | | $ | 8,326,667 | | |
| Net change in unrealized appreciation (depreciation) | | $ | 8,326,667 | | |
| Net realized and unrealized gain | | $ | 16,408,995 | | |
| Net increase in net assets from operations | | $ | 16,840,449 | | |
See notes to financial statements
20
Tax-Managed Mid-Cap Core Portfolio as of October 31, 2007
FINANCIAL STATEMENTS CONT'D
Statements of Changes in Net Assets
Increase (Decrease)
in Net Assets | | Year Ended
October 31, 2007 | | Year Ended
October 31, 2006 | |
From operations —
Net investment income | | $ | 431,454 | | | $ | 261,470 | | |
Net realized gain from
investment transactions | | | 8,082,328 | | | | 4,855,443 | | |
Net change in unrealized
appreciation (depreciation)
of investments | | | 8,326,667 | | | | 6,129,045 | | |
| Net increase in net assets from operations | | $ | 16,840,449 | | | $ | 11,245,958 | | |
Capital transactions —
Contributions | | $ | 8,454,067 | | | $ | 16,793,678 | | |
| Withdrawals | | | (13,006,661 | ) | | | (6,253,468 | ) | |
Net increase (decrease) in net assets from
capital transactions | | $ | (4,552,594 | ) | | $ | 10,540,210 | | |
| Net increase in net assets | | $ | 12,287,855 | | | $ | 21,786,168 | | |
| Net Assets | |
| At beginning of year | | $ | 97,876,752 | | | $ | 76,090,584 | | |
| At end of year | | $ | 110,164,607 | | | $ | 97,876,752 | | |
See notes to financial statements
21
Tax-Managed Mid-Cap Core Portfolio as of October 31, 2007
FINANCIAL STATEMENTS CONT'D
Supplementary Data
| | | Year Ended October 31, | |
| | | 2007 | | 2006 | | 2005 | | 2004 | | 2003 | |
| Ratios/Supplemental Data | |
| Ratios (As a percentage of average daily net assets): | |
| Expenses(1) | | | 0.90 | % | | | 0.91 | % | | | 0.91 | % | | | 0.93 | % | | | 0.99 | % | |
| Net investment income (loss) | | | 0.41 | % | | | 0.29 | % | | | (0.11 | )% | | | (0.15 | )% | | | (0.22 | )% | |
| Portfolio Turnover | | | 38 | % | | | 55 | % | | | 53 | % | | | 42 | % | | | 50 | % | |
| Total Return | | | 17.79 | % | | | 13.85 | % | | | 10.54 | % | | | 6.43 | % | | | 25.97 | % | |
| Net assets, end of year (000's omitted) | | $ | 110,165 | | | $ | 97,877 | | | $ | 76,091 | | | $ | 67,130 | | | $ | 46,112 | | |
(1) The investment adviser waived a portion of its investment advisory fee (equal to less than 0.01% of average daily net assets for each of the years ended October 31, 2007, 2006, 2005, and 2004). A portion of the waiver was borne by the sub-adviser.
See notes to financial statements
22
Tax-Managed Mid-Cap Core Portfolio as of October 31, 2007
NOTES TO FINANCIAL STATEMENTS
1 Significant Accounting Policies
Tax-Managed Mid-Cap Core Portfolio (the Portfolio) is registered under the Investment Company Act of 1940, as amended (the 1940 Act), as a diversified open-end management investment company. The Portfolio, which was organized as a trust under the laws of the State of New York on December 10, 2001, seeks to achieve long-term, after-tax returns by investing in a diversified portfolio of common stocks of mid-cap companies. The Declaration of Trust permits the Trustees to issue interests in the Portfolio. At October 31, 2007, the Eaton Vance Tax-Managed Mid-Cap Core Fund and the Eaton Vance Tax-Managed Equity Asset Allocation Fund held 35.5% and 64.5% interests in the Portfolio, respectively. The following is a summary of significant accounting policies followed by the Portfolio in the prepa ration of its financial statements. The policies are in conformity with accounting principles generally accepted in the United States of America.
A Investment Valuation — Securities listed on a U.S. securities exchange generally are valued at the last sale price on the day of valuation or, if no sales took place on such date, at the mean between the closing bid and asked prices therefore on the exchange where such securities are principally traded. Equity securities listed on the NASDAQ Global or Global Select Market generally are valued at the official NASDAQ closing price. Unlisted or listed securities for which closing sales prices or closing quotations are not available are valued at the mean between the latest available bid and asked prices, or, in the case of preferred equity securities that are not listed or traded in the over-the-counter market, by an independent pricing service. Exchange-traded options are valued at the last sale price for the day of valuation as quoted on the principal exchange or board of trade on which the options are traded or, in the absence of sales on such date, at the mean between the latest bid and asked prices therefore. Futures positions on securities and currencies generally are valued at closing settlement prices. Short-term debt securities with a remaining maturity of 60 days or less are valued at amortized cost. If short-term debt securities are acquired with a remaining maturity of more than 60 days, they will be valued by a pricing service. Other fixed income and debt securities, including listed securities and securities for which price quotations are available, will normally be valued on the basis of valuations furnished by a pricing service. Foreign securities and currencies are valued in U.S. dollars, based on foreign currency exchange rate quotations supplied by an independent quotation service. The daily valuation of exchange-traded foreign securities generally is deter mined as of the close of trading on the principal exchange on which such securities trade. Events occurring after the close of trading on foreign exchanges may result in adjustments to the valuation of foreign securities to more accurately reflect their fair value as of the close of regular trading on the New York Stock Exchange. When valuing foreign securities that meet certain criteria, the Trustees have approved the use of a fair value service that values such securities to reflect market trading that occurs after the close of the applicable foreign markets of comparable securities or other instruments that have a strong correlation to the fair-valued securities. Investments held by the Portfolio for which valuations or market quotations are unavailable are valued at fair value using methods determined in good faith by or at the direction of the Trustees of the Portfolio considering relevant factors, data and information including the market value of freely tradable securities of the same class in the principal market on which such securities are normally traded.
B Income — Dividend income is recorded on the ex-dividend date for dividends received in cash and/or securities. Interest income is recorded on the basis of interest accrued, adjusted for amortization of premium or accretion of discount.
C Federal Taxes — The Portfolio has elected to be treated as a partnership for federal tax purposes. No provision is made by the Portfolio for federal or state taxes on any taxable income of the Portfolio because each investor in the Portfolio is ultimately responsible for the payment of any taxes on its share of taxable income. Since at least one of the Portfolio's investors is a regulated investment company that invests all or substantially all of its assets in the Portfolio, the Portfolio normally must satisfy the applicable source of income and diversification requirements (under the Internal Revenue Code) in order for its investors to satisfy them. The Portfolio will allocate, at least annually a mong its investors, each investor's distributive share of the Portfolio's net investment income, net realized capital gains, and any other items of income, gain, loss, deduction or credit.
D Expense Reduction — State Street Bank and Trust Company (SSBT) serves as custodian of the Portfolio. Pursuant to the custodian agreement, SSBT receives a fee reduced by credits, which are determined based on the average daily cash balance the Portfolio maintains with SSBT. All credit balances, if any, used to reduce the Portfolio's custodian fees are reported as a reduction of expenses in the Statement of Operations.
23
Tax-Managed Mid-Cap Core Portfolio as of October 31, 2007
NOTES TO FINANCIAL STATEMENTS CONT'D
E Use of Estimates — The preparation of the financial statements in conformity with accounting principles generally accepted in the United States of America requires management to make estimates and assumptions that affect the reported amounts of assets and liabilities at the date of the financial statements and the reported amounts of income and expense during the reporting period. Actual results could differ from those estimates.
F Investment Transactions — Investment transactions for financial statement purposes are accounted for on a trade date basis. Realized gains and losses on securities sold are determined on the basis of identified cost.
G Indemnifications — Under the Portfolio's organizational documents, its officers and Trustees may be indemnified against certain liabilities and expenses arising out of the performance of their duties to the Portfolio. Interestholders in the Portfolio are jointly and severally liable for the liabilities and obligations of the Portfolio in the event that the Portfolio fails to satisfy such liabilities and obligations; provided, however, that, to the extent assets are available in the Portfolio, the Portfolio may, under certain circumstances, indemnify interestholders from and against any claim or liability to which such holder may become subject by reason of being or having been an interestholder in t he Portfolio. Additionally, in the normal course of business, the Portfolio enters into agreements with service providers that may contain indemnification clauses. The Portfolio's maximum exposure under these arrangements is unknown as this would involve future claims that may be made against the Portfolio that have not yet occurred.
2 Investment Adviser Fee and Other Transactions with Affiliates
The investment adviser fee is earned by Boston Management and Research (BMR), a subsidiary of Eaton Vance Management (EVM), as compensation for management and investment advisory services rendered to the Portfolio. Pursuant to the investment advisory agreement, BMR receives a monthly fee at the annual rate of 0.80% of the Portfolio's average daily net assets up to $500 million and at reduced rates as daily net assets exceed that level. For the year ended October 31, 2007, the Portfolio's investment advisory fee totaled $834,737. Pursuant to a sub-advisory agreement, BMR has delegated the investment management of the Portfolio to Atlanta Capital. BMR pays Atlanta Capital a monthly fee for sub-advisory services provided to the Portfolio equal to 0.55% per annum of the average daily net assets up to $500 million and at reduced rates as daily net assets exceed that level. BMR and Atlanta Capital have agreed to reduce their respectiv e investment advisory fee by an amount equal to that portion of commissions paid to broker dealers in execution of Portfolio transactions that is consideration for third-party research services. For the year ended October 31, 2007, BMR waived $2,403 of its advisory fee. Atlanta Capital, in turn, waived $2,403 of its sub-advisory fee. Except for the Trustees of the Portfolio who are not members of EVM's or BMR's organizations, officers and Trustees receive remuneration for their services to the Portfolio out of such investment adviser fee and sub-adviser fees. Certain officers and Trustees of the Portfolio are officers of the above organizations. Trustees of the Portfolio who are not affiliated with BMR may elect to defer receipt of all or a percentage of their annual fees in accordance with the terms of the Trustees Deferred Compensation Plan. For the year ended October 31, 2007, no significant amounts have been deferred. Certain officer s and Trustees of the Fund and of the Portfolio are officers of the above organizations.
3 Investment Transactions
Purchases and sales of investments, other than short-term obligations, aggregated $39,689,849 and $43,097,323, respectively, for the year ended October 31, 2007.
4 Federal Income Tax Basis of Unrealized Appreciation (Depreciation)
The cost and unrealized appreciation (depreciation) in value of the investments owned at October 31, 2007, as determined on a federal income tax basis, were as follows:
| Aggregate cost | | $ | 79,414,305 | | |
| Gross unrealized appreciation | | $ | 30,256,505 | | |
| Gross unrealized depreciation | | | (389,412 | ) | |
| Net unrealized appreciation | | $ | 29,867,093 | | |
5 Financial Instruments
The Portfolio may trade in financial instruments with off-balance sheet risk in the normal course of its investing activities to assist in managing exposure to various market risks. These financial instruments may include written options and financial futures contracts and may involve, to a varying degree, elements of risk in excess of the amounts recognized for financial statement purposes. The notional or contractual amounts of these instruments represent the investment the Portfolio has in particular classes of financial instruments and does not necessarily represent the amounts potentially subject to risk. The measurement of the risks associated with these instruments is meaningful only when all related and offsetting transactions are considered. The
24
Tax-Managed Mid-Cap Core Portfolio as of October 31, 2007
NOTES TO FINANCIAL STATEMENTS CONT'D
Portfolio did not have any open obligations under these financial instruments at October 31, 2007.
6 Line of Credit
The Portfolio participates with other portfolios and funds managed by EVM and its affiliates in a $200 million unsecured line of credit agreement with a group of banks. Borrowings will be made by the Portfolio solely to facilitate the handling of unusual and/or unanticipated short-term cash requirements. Interest is charged to each portfolio based on its borrowings at an amount above either the Eurodollar rate or Federal Funds rate. In addition, a fee computed at an annual rate of 0.07% on the daily unused portion of the line of credit is allocated among the participating portfolios and funds at the end of each quarter. The Portfolio did not have any significant borrowings or allocated fees during the year ended October 31, 2007.
7 Recently Issued Accounting Pronouncements
In June 2006, the Financial Accounting Standards Board (FASB) issued FASB Interpretation No. 48 (FIN 48), "Accounting for Uncertainty in Income Taxes – an interpretation of FASB Statement No. 109". FIN 48 clarifies the accounting for uncertainty in income taxes recognized in accordance with FASB Statement No. 109, "Accounting for Income Taxes". This interpretation prescribes a recognition threshold and measurement attribute for the financial statement recognition and measurement of a tax position taken or expected to be taken in a tax return. It also provides guidance on de-recognition, classification, interest and penalties, accounting in interim periods, disclosure and transition. FIN 48 is effective on the last business day of the first required financial reporting period for fiscal years beginning after December 15, 2006. Management is currently evaluating the impact of applying the various provisions of FIN 48.
In September 2006, the FASB issued Statement of Financial Accounting Standards No. 157 (FAS 157), "Fair Value Measurements". FAS 157 defines fair value, establishes a framework for measuring fair value in accordance with generally accepted accounting principles and expands disclosure about fair value measurements. FAS 157 is effective for fiscal years beginning after November 15, 2007. Management is currently evaluating the impact the adoption of FAS 157 will have on the Portfolio's financial statement disclosures.
25
Tax-Managed Mid-Cap Core Portfolio as of October 31, 2007
REPORT OF INDEPENDENT REGISTERED PUBLIC ACCOUNTING FIRM
To the Trustees and Investors of
Tax-Managed Mid-Cap Core Portfolio:
We have audited the accompanying statement of assets and liabilities of Tax-Managed Mid-Cap Core Portfolio (the "Portfolio"), including the portfolio of investments, as of October 31, 2007, and the related statement of operations for the year then ended, the statements of changes in net assets for each of the two years in the period then ended, and the supplementary data for each of the five years in the period then ended. These financial statements and supplementary data are the responsibility of the Portfolio's management. Our responsibility is to express an opinion on these financial statements and supplementary data based on our audits.
We conducted our audits in accordance with standards of the Public Company Accounting Oversight Board (United States). Those standards require that we plan and perform the audit to obtain reasonable assurance about whether the financial statements and supplementary data are free of material misstatement. The Portfolio is not required to have, nor were we engaged to perform, an audit of its internal control over financial reporting. Our audits included consideration of internal control over financial reporting as a basis for designing audit procedures that are appropriate in the circumstances, but not for the purpose of expressing an opinion on the effectiveness of the Portfolio's internal control over financial reporting. Accordingly, we express no such opinion. An audit also includes examining, on a test basis, evidence supporting the amounts and disclosures in the financial statements, assessing the accounting principles used and significant estimates made by management, as well as evaluating the overall financial statement presentation. Our procedures included confirmation of securities owned as of October 31, 2007, by correspondence with the custodian and brokers; when replies were not received from brokers, we performed other auditing procedures. We believe that our audits provide a reasonable basis for our opinion.
In our opinion, the financial statements and supplementary data referred to above present fairly, in all material respects, the financial position of Tax-Managed Mid-Cap Core Portfolio as of October 31, 2007, the results of its operations for the year then ended, the changes in its net assets for each of the two years in the period then ended, and the supplementary data for each of the five years in the period then ended, in conformity with accounting principles generally accepted in the United States of America.
DELOITTE & TOUCHE LLP
Boston, Massachusetts
December 14, 2007
26
Eaton Vance Tax-Managed Mid-Cap Core Fund
BOARD OF TRUSTEES' ANNUAL APPROVAL OF THE INVESTMENT ADVISORY AGREEMENTS
Overview of the Contract Review Process
The Investment Company Act of 1940, as amended (the "1940 Act"), provides, in substance, that each investment advisory agreement between a fund and its investment adviser will continue in effect from year to year only if its continuance is approved at least annually by the fund's board of trustees, including by a vote of a majority of the trustees who are not "interested persons" of the fund ("Independent Trustees"), cast in person at a meeting called for the purpose of considering such approval.
At a meeting of the Boards of Trustees (each a "Board") of the Eaton Vance group of mutual funds (the "Eaton Vance Funds") held on April 23, 2007, the Board, including a majority of the Independent Trustees, voted to approve continuation of existing advisory and sub-advisory agreements for the Eaton Vance Funds for an additional one-year period. In voting its approval, the Board relied upon the affirmative recommendation of the Special Committee of the Board, which is a committee comprised exclusively of Independent Trustees. Prior to making its recommendation, the Special Committee reviewed information furnished for a series of meetings of the Special Committee held in February, March and April 2007. Such information included, among other things, the following:
Information about Fees, Performance and Expenses
• An independent report comparing the advisory and related fees paid by each fund with fees paid by comparable funds;
• An independent report comparing each fund's total expense ratio and its components to comparable funds;
• An independent report comparing the investment performance of each fund to the investment performance of comparable funds over various time periods;
• Data regarding investment performance in comparison to relevant peer groups of funds and appropriate indices;
• Comparative information concerning fees charged by each adviser for managing other mutual funds and institutional accounts using investment strategies and techniques similar to those used in managing the fund;
• Profitability analyses for each adviser with respect to each fund;
Information about Portfolio Management
• Descriptions of the investment management services provided to each fund, including the investment strategies and processes employed;
• Information concerning the allocation of brokerage and the benefits received by each adviser as a result of brokerage allocation, including information concerning the acquisition of research through "soft dollar" benefits received in connection with the funds' brokerage, and the implementation of a soft dollar reimbursement program established with respect to the funds;
• Data relating to portfolio turnover rates of each fund;
• The procedures and processes used to determine the fair value of fund assets and actions taken to monitor and test the effectiveness of such procedures and processes;
Information about each Adviser
• Reports detailing the financial results and condition of each adviser;
• Descriptions of the qualifications, education and experience of the individual investment professionals whose responsibilities include portfolio management and investment research for the funds, and information relating to their compensation and responsibilities with respect to managing other mutual funds and investment accounts;
• Copies of the Codes of Ethics of each adviser and its affiliates, together with information relating to compliance with and the administration of such codes;
• Copies of or descriptions of each adviser's proxy voting policies and procedures;
• Information concerning the resources devoted to compliance efforts undertaken by each adviser and its affiliates on behalf of the funds (including descriptions of various compliance programs) and their record of compliance with investment policies and restrictions, including policies with respect to market-timing, late trading and selective portfolio disclosure, and with policies on personal securities transactions;
• Descriptions of the business continuity and disaster recovery plans of each adviser and its affiliates;
Other Relevant Information
• Information concerning the nature, cost and character of the administrative and other non-investment management services provided by Eaton Vance Management and its affiliates;
• Information concerning management of the relationship with the custodian, subcustodians and fund accountants by each adviser or the funds' administrator; and
• The terms of each advisory agreement.
In addition to the information identified above, the Special Committee considered information provided from time to time by each adviser throughout the year at meetings of the Board and its committees. Over the course of the twelve-month period ended
27
Eaton Vance Tax-Managed Mid-Cap Core Fund
BOARD OF TRUSTEES' ANNUAL APPROVAL OF THE INVESTMENT ADVISORY AGREEMENTS CONT'D
April 30, 2007, the Board met ten times and the Special Committee, the Audit Committee and the Governance Committee, each of which is a Committee comprised solely of Independent Trustees, met twelve, fourteen and eight times, respectively. At such meetings, the Trustees received, among other things, presentations by the portfolio managers and other investment professionals of each adviser relating to the investment performance of each fund and the investment strategies used in pursuing the fund's investment objective.
For funds that invest through one or more underlying portfolios, the Board considered similar information about the portfolio(s) when considering the approval of advisory agreements. In addition, in cases where the fund's investment adviser has engaged a sub-adviser, the Board considered similar information about the sub-adviser when considering the approval of any sub-advisory agreement.
The Special Committee was assisted throughout the contract review process by Goodwin Procter LLP, legal counsel for the Independent Trustees. The members of the Special Committee relied upon the advice of such counsel and their own business judgment in determining the material factors to be considered in evaluating each advisory and sub-advisory agreement and the weight to be given to each such factor. The conclusions reached with respect to each advisory and sub-advisory agreement were based on a comprehensive evaluation of all the information provided and not any single factor. Moreover, each member of the Special Committee may have placed varying emphasis on particular factors in reaching conclusions with respect to each advisory and sub-advisory agreement.
Results of the Process
Based on its consideration of the foregoing, and such other information as it deemed relevant, including the factors and conclusions described below, the Special Committee concluded that the continuance of the investment advisory agreement of the Tax-Managed Mid-Cap Core Portfolio (the "Portfolio"), the portfolio in which the Eaton Vance Tax-Managed Mid-Cap Core Fund (the "Fund") invests, with Boston Management and Research (the "Adviser"), and the sub-advisory agreement with Atlanta Capital Management (the "Sub-adviser"), including their fee structures, is in the interests of shareholders and, therefore, the Special Committee recommended to the Board approval of the respective agreements. The Board accepted the recommendation of the Special Committee as well as the factors considered and conclusions reached by the Special Committee with respect to the agreements. Accordingly, the Board, including a majority of the Independent T rustees, voted to approve continuation of the investment advisory agreement and the sub-advisory agreement for the Portfolio.
Nature, Extent and Quality of Services
In considering whether to approve the investment advisory agreement and sub-advisory agreements of the Portfolio, the Board evaluated the nature, extent and quality of services provided to the Portfolio by the Adviser and the Sub-adviser.
The Board considered the Adviser's and the Sub-adviser's management capabilities and investment process with respect to the types of investments held by the Portfolio, including the education, experience and number of its investment professionals and other personnel who provide portfolio management, investment research, and similar services to the Portfolio and whose responsibilities include supervising the Sub-adviser. The Board specifically noted the Adviser's in-house equity research capabilities. The Board also took into account the resources dedicated to portfolio management and other services, including the compensation paid to recruit and retain investment personnel, and the time and attention devoted to the Portfolio by senior management. With respect to the Sub-adviser, the Board took into account the resources available to the Sub-adviser in fulfilling its duties under the sub-advisory agreement and the Sub-adviser's e xperience in managing equity portfolios.
The Board reviewed the compliance programs of the Adviser and relevant affiliates thereof, including the Sub-adviser. Among other matters, the Board considered compliance and reporting matters relating to personal trading by investment personnel, selective disclosure of portfolio holdings, late trading, frequent trading, portfolio valuation, business continuity and the allocation of investment opportunities. The Board also evaluated the responses of the Adviser and its affiliates to requests from regulatory authorities such as the Securities and Exchange Commission and the National Association of Securities Dealers.
The Board considered shareholder and other administrative services provided or managed by Eaton Vance Management and its affiliates, including transfer agency and accounting services. The Board evaluated the benefits to shareholders of investing in a fund that is a part of a large family of funds, including the ability, in many cases, to exchange an investment among different funds without incurring additional sales charges.
After consideration of the foregoing factors, among others, the Board concluded that the nature, extent and quality of services provided by the Adviser and Sub-adviser, taken as a whole, are appropriate and consistent with the terms of the investment advisory agreement and sub-advisory agreement, respectively.
28
Eaton Vance Tax-Managed Mid-Cap Core Fund
BOARD OF TRUSTEES' ANNUAL APPROVAL OF THE INVESTMENT ADVISORY AGREEMENTS CONT'D
Fund Performance
The Board compared the Fund's investment performance to a relevant universe of similarly managed funds identified by an independent data provider and appropriate benchmark indices. The Board reviewed comparative performance data for the one- and three-year periods ended September 30, 2006 for the Fund. The Board noted that action was taken during 2006 to improve the performance of the Fund and concluded that such actions were effective.
Management Fees and Expenses
The Board reviewed contractual investment advisory fee rates, including any administrative fee rates, payable by the Portfolio and the Fund (referred to collectively as "management fees"). As part of its review, the Board considered the management fees (including administrative fees) and the Fund's total expense ratio for the one-year period ended September 30, 2006, as compared to a group of similarly managed funds selected by an independent data provider. The Board considered the fact that the Adviser waived fees and/or paid expenses for the Fund and had agreed to waive fees and/or pay expenses in an additional amount for the next three years.
After reviewing the foregoing information, and in light of the nature, extent and quality of the services provided by the Adviser, the Board concluded that the management fees charged for advisory and related services and the Fund's total expense ratio are reasonable.
Profitability
The Board reviewed the level of profits realized by the Adviser and relevant affiliates thereof, including the Sub-adviser, in providing investment advisory and administrative services to the Portfolio, the Fund and to all Eaton Vance Funds as a group. The Board considered the level of profits realized without regard to revenue sharing or other payments by the Adviser and its affiliates to third parties in respect of distribution services. The Board also considered other direct or indirect benefits received by the Adviser and its affiliates in connection with its relationship with the Portfolio and the Fund, including the benefits of research services that may be available to the Adviser or Sub-adviser as a result of securities transactions effected for the Portfolio and other advisory clients.
The Board concluded that, in light of the foregoing factors and the nature, extent and quality of the services rendered, the profits realized by the Adviser and its affiliates, including the Sub-adviser, are reasonable.
Economies of Scale
In reviewing management fees and profitability, the Board also considered the extent to which the Adviser and its affiliates, on the one hand, and the Fund, on the other hand, can expect to realize benefits from economies of scale as the assets of the Fund and the Portfolio increase. The Board acknowledged the difficulty in accurately measuring the benefits resulting from the economies of scale with respect to the management of any specific fund or group of funds. The Board reviewed data summarizing the increases and decreases in the assets of the Fund and of all Eaton Vance Funds as a group over various time periods, and evaluated the extent to which the total expense ratio of the Fund and the profitability of the Adviser and its affiliates may have been affected by such increases or decreases. Based upon the foregoing, the Board concluded that the benefits from economies of scale are currently being shared equitably by the Adv iser and its affiliates and the Fund. The Board also concluded that, assuming reasonably foreseeable increases in the assets of the Portfolio, the structure of the advisory fee, which includes breakpoints at several asset levels, can be expected to cause the Adviser and its affiliates and the Fund to continue to share such benefits equitably.
29
Eaton Vance Tax-Managed Mid-Cap Core Fund
MANAGEMENT AND ORGANIZATION
Fund Management. The Trustees of Eaton Vance Mutual Funds Trust (the Trust) and Tax-Managed Mid-Cap Core Portfolio (the Portfolio) are responsible for the overall management and supervision of the Trust's and Portfolio's affairs. The Trustees and officers of the Trust and the Portfolio are listed below. Except as indicated, each individual has held the office shown or other offices in the same company for the last five years. Trustees and officers of the Trust and the Portfolio hold indefinite terms of office. The "noninterested Trustees" consist of those Trustees who are not "interested persons" of the Trust and the Portfolio, as that term is defined under the 1940 Act. The business address of each Trustee and officer is The Eaton Vance Building, 255 State Street, Boston, Massachusetts 02109. As used below, "EVC" refers to Eaton Vance Corp., "EV" refers to Eaton Vance, Inc., "EVM" refers to Eaton Vance Management, "BMR" refers to Boston Management and Research, "Parametric" refers to Parametric Portfolio Associates, "EVD" refers to Eaton Vance Distributors, Inc. and "Atlanta Capital" refers to Atlanta Capital Management Company, LLC. EVC and EV are the corporate parent and trustee, respectively, of EVM and BMR. EVD is the Fund's principal underwriter, the Portfolio's placement agent and a wholly-owned subsidiary of EVM. Each officer affiliated with Eaton Vance may hold a position with other Eaton Vance affiliates that is comparable to his or her position with EVM listed below.
Name and
Date of Birth | | Position(s)
with the
Trust and
the Portfolio | | Term of
Office and
Length of
Service | | Principal Occupation(s)
During Past Five Years | | Number of Portfolios
in Fund Complex
Overseen By
Trustee(1) | | Other Directorships Held | |
| Interested Trustee | | | | | | | | | | | | | |
|
| Thomas E. Faust Jr. 5/31/58 | | Trustee, President of the Trust and Vice President of the Portfolio | | Trustee since 2007, President of the Trust since 2002 and Vice President of the Portfolio since 2001 | | Chairman, Chief Executive Officer and President of EVC, President of EV, Chief Executive Officer and President of EVM and BMR, and Director of EVD. Trustee and/or Officer of 176 registered investment companies and 5 private investment companies in the Eaton Vance Fund Complex. Mr. Faust is an interested person because of his positions with EVM, BMR, EVC and EV which are affiliates of the Trust and the Portfolio. | | | 176 | | | Director of EVC | |
|
| Noninterested Trustee(s) | | | | | | | | | | | | | |
|
| Benjamin C. Esty 1/2/63 | | Trustee | | Since 2005 | | Roy and Elizabeth Simmons Professor of Business Administration, Harvard University Graduate School of Business Administration (since 2003). Formerly, Associate Professor, Harvard University Graduate School of Business Administration (2000-2003). | | | 176 | | | None | |
|
| Allen R. Freedman 4/3/40 | | Trustee | | Since 2007 | | Former Chairman and Chief Executive Officer of Assurant, Inc. (insurance provider) (1978-2000). Formerly, a Director of Loring Ward International (fund distributor) (2005-2007). | | | 175 | | | Director of Assurant, Inc. and Stonemor Partners L.P. (owner and operator of cemeteries) | |
|
| William H. Park 9/19/47 | | Trustee | | Since 2003 | | Vice Chairman, Commercial Industrial Finance Corp. (specialty finance company) (since 2006). Formerly, President and Chief Executive Officer, Prizm Capital Management, LLC (investment management firm) (2002-2005). | | | 176 | | | None | |
|
| Ronald A. Pearlman 7/10/40 | | Trustee | | Since 2003 | | Professor of Law, Georgetown University Law Center. | | | 176 | | | None | |
|
| Norton H. Reamer 9/21/35 | | Trustee | | Trustee of the Trust since 1986 and of the Portfolio since 2001 | | President, Chief Executive Officer and a Director of Asset Management Finance Corp. (a specialty finance company serving the investment management industry) (since October 2003). President, Unicorn Corporation (an investment and financial advisory services company) (since September 2000). Formerly, Chairman and Chief Operating Officer, Hellman, Jordan Management Co., Inc. (an investment management company) (2000-2003). Formerly, Advisory Director of Berkshire Capital Corporation (investment banking firm) (2002-2003). | | | 176 | | | None | |
|
30
Eaton Vance Tax-Managed Mid-Cap Core Fund
MANAGEMENT AND ORGANIZATION CONT'D
Name and
Date of Birth | | Position(s)
with the
Trust and
the Portfolio | | Term of
Office and
Length of
Service | | Principal Occupation(s)
During Past Five Years | | Number of Portfolios
in Fund Complex
Overseen By
Trustee(1) | | Other Directorships Held | |
| Noninterested Trustee(s) (continued) | | | | | | | | | | | | | |
|
| Heidi L. Steiger 7/8/53 | | Trustee | | Since 2007 | | President, Lowenhaupt Global Advisors, LLC (global wealth management firm) (since 2005); Formerly, President and Contributing Editor, Worth Magazine (2004); Formerly, Executive Vice President and Global Head of Private Asset Management (and various other positions), Neuberger Berman (investment firm) (1986-2004). | | | 173 | | | Director of Nuclear Electric Insurance Ltd. (nuclear insurance provider) and Aviva USA (insurance provider) | |
|
| Lynn A. Stout 9/14/57 | | Trustee | | Trustee of the Trust since 1998 and of the Portfolio since 2001 | | Paul Hastings Professor of Corporate and Securities Law, University of California at Los Angeles School of Law. | | | 176 | | | None | |
|
| Ralph F. Verni 1/26/43 | | Chairman of the Board and Trustee | | Chairman of the Board since 2007 and Trustee since 2005 | | Consultant and private investor. | | | 176 | | | None | |
|
| Principal Officers who are not Trustees | | | | | | | | | | | | | |
|
Name and
Date of Birth | | Position(s)
with the
Trust and
the Portfolio | | Term of
Office and
Length of
Service | | Principal Occupation(s)
During Past Five Years | |
| William H. Ahern, Jr. 7/28/59 | | Vice President of the Trust | | Since 1995 | | Vice President of EVM and BMR. Officer of 74 registered investment companies managed by EVM or BMR. | |
|
| William O. Bell, IV 7/26/73 | | Vice President of the Portfolio | | Since 2005 | | Vice President of Atlanta Capital. Officer of 2 registered investment companies managed by EVM or BMR. | |
|
| Cynthia J. Clemson 3/2/63 | | Vice President of the Trust | | Since 2005 | | Vice President of EVM and BMR. Officer of 89 registered investment companies managed by EVM or BMR. | |
|
| Charles B. Gaffney 12/4/72 | | Vice President of the Trust | | Since 2007 | | Vice President of EVM and BMR. Previously, Sector Portfolio Manager and Senior Equity Analyst of Brown Brothers Harriman (1997-2003). Officer of 29 registered investment companies managed by EVM or BMR. | |
|
| William R. Hackney, III 4/12/48 | | Vice President of the Portfolio | | Since 2001 | | Managing Partner and member of the Executive Committee of Atlanta Capital. Officer of 3 registered investment companies managed by EVM or BMR. | |
|
| Marilyn Robinson Irvin 6/17/58 | | Vice President of the Portfolio | | Since 2005 | | Senior Vice President and Principal of Atlanta Capital. Officer of 2 registered investment companies managed by EVM or BMR. | |
|
| Christine M. Johnston 11/9/72 | | Vice President of the Trust | | Since 2007 | | Vice President of EVM and BMR. Officer of 34 registered investment companies managed by EVM or BMR. | |
|
| Aamer Khan 6/7/60 | | Vice President of the Trust | | Since 2005 | | Vice President of EVM and BMR. Officer of 32 registered investment companies managed by EVM or BMR. | |
|
| Thomas H. Luster 4/8/62 | | Vice President of the Trust | | Since 2006 | | Vice President of EVM and BMR. Officer of 48 registered investment companies managed by EVM or BMR. | |
|
| Michael R. Mach 7/15/47 | | Vice President of the Trust | | Since 1999 | | Vice President of EVM and BMR. Officer of 54 registered investment companies managed by EVM or BMR. | |
|
| Robert B. MacIntosh 1/22/57 | | Vice President of the Trust | | Since 1998 | | Vice President of EVM and BMR. Officer of 89 registered investment companies managed by EVM or BMR. | |
|
| Duncan W. Richardson 10/26/57 | | Vice President of the Trust and President of the Portfolio | | Vice President of the Trust since 2001 and President of the Portfolio since 2007 | | Executive Vice President and Chief Equity Investment Officer of EVC, EVM and BMR. Officer of 80 registered investment companies managed by EVM or BMR. | |
|
31
Eaton Vance Tax-Managed Mid-Cap Core Fund
MANAGEMENT AND ORGANIZATION CONT'D
Name and
Date of Birth | | Position(s)
with the
Trust and
the Portfolio | | Term of
Office and
Length of
Service | | Principal Occupation(s)
During Past Five Years | |
| Principal Officers who are not Trustees (continued) | | | | | | | |
|
| Walter A. Row, III 7/20/57 | | Vice President of the Trust | | Since 2001 | | Director of Equity Research and a Vice President of EVM and BMR. Officer of 38 registered investment companies managed by EVM or BMR. | |
|
| Judith A. Saryan 8/21/54 | | Vice President of the Trust | | Since 2003 | | Vice President of EVM and BMR. Officer of 53 registered investment companies managed by EVM or BMR. | |
|
| Susan Schiff 3/13/61 | | Vice President of the Trust | | Since 2002 | | Vice President Of EVM and BMR. Officer of 35 registered investment companies managed by EVM or BMR. | |
|
| Thomas Seto 9/27/62 | | Vice President of the Trust | | Since 2007 | | Vice President and Director of Portfolio Management of Parametric. Officer of 30 registered investment companies managed by EVM or BMR. | |
|
| David M. Stein 5/4/51 | | Vice President of the Trust | | Since 2007 | | Managing Director and Chief Investment Officer of Parametric. Officer of 30 registered investment companies managed by EVM or BMR. | |
|
| Mark S. Venezia 5/23/49 | | Vice President of the Trust | | Since 2007 | | Vice President of EVM and BMR. Officer of 35 registered investment companies managed by EVM or BMR. | |
|
| Adam A. Weigold 3/22/75 | | Vice President of the Trust | | Since 2007 | | Vice President of EVM and BMR. Officer of 70 registered investment companies managed by EVM or BMR. | |
|
| Barbara E. Campbell 6/19/57 | | Treasurer of the Trust | | Since 2005 | | Vice President of EVM and BMR. Officer of 176 registered investment companies managed by EVM or BMR. | |
|
| Maureen A. Gemma 5/24/60 | | Secretary | | Since 2007 | | Deputy Chief Legal Officer and Vice President of EVM and BMR. Officer of 176 registered investment companies managed by EVM or BMR. | |
|
| Michelle A. Green 8/25/69 | | Treasurer of the Portfolio | | Since 2002 | | Vice President of EVM and BMR. Officer of 68 registered investment companies managed by EVM or BMR. | |
|
| Paul M. O'Neil 7/11/53 | | Chief Compliance Officer | | Since 2004 | | Vice President of EVM and BMR. Officer of 176 registered investment companies managed by EVM or BMR. | |
|
(1) Includes both master and feeder funds in a master-feeder structure.
The SAI for the Fund includes additional information about the Trustees and officers of the Fund and the Portfolio and can be obtained without charge by calling 1-800-225-6265.
32
Investment Adviser of Tax-Managed Mid-Cap Core Portfolio
Boston Management and Research
The Eaton Vance Building
255 State Street
Boston, MA 02109
Sub-Adviser of Tax-Managed Mid-Cap Core Portfolio
Atlanta Capital Management Company LLC
1349 West Peachtree Street
Suite 1600
Atlanta, GA 30309
Administrator of Eaton Vance Tax-Managed Mid-Cap Core Fund
Eaton Vance Management
The Eaton Vance Building
255 State Street
Boston, MA 02109
Principal Underwriter
Eaton Vance Distributors, Inc.
The Eaton Vance Building
255 State Street
Boston, MA 02109
(617) 482-8260
Custodian
State Street Bank and Trust Company
200 Clarendon Street
Boston, MA 02116
Transfer Agent
PFPC Inc.
Attn: Eaton Vance Funds
P.O. Box 9653
Providence, RI 02940-9653
(800) 262-1122
Independent Registered Public Accounting Firm
Deloitte & Touche LLP
200 Berkeley Street
Boston, MA 02116-5022
Eaton Vance Tax-Managed Mid-Cap Core Fund
The Eaton Vance Building
255 State Street
Boston, MA 02109
This report must be preceded or accompanied by a current prospectus. Before investing, investors should consider carefully the Fund's investment
objective, risks, and charges and expenses. The Fund's current prospectus contains this and other information about the Fund and is available
through your financial advisor. Please read the prospectus carefully before you invest or send money. For further information please call 1-800-225-6265.
1301-12/07 TMMCCSRC

Annual Report October 31, 2007


EATON VANCE
TAX-MANAGED
MULTI-CAP
GROWTH
FUND
IMPORTANT NOTICES REGARDING PRIVACY,
DELIVERY OF SHAREHOLDER DOCUMENTS,
PORTFOLIO HOLDINGS AND PROXY VOTING
Privacy. The Eaton Vance organization is committed to ensuring your financial privacy. Each of the financial institutions identified below has in effect the following policy ("Privacy Policy") with respect to nonpublic personal information about
its customers:
• Only such information received from you, through application forms or otherwise, and information about your Eaton Vance fund transactions will be collected. This may include information such as name, address, social security number, tax status, account balances and transactions.
• None of such information about you (or former customers) will be disclosed to anyone, except as permitted by law (which includes disclosure to employees necessary to service your account). In the normal course of servicing a customer's account, Eaton Vance may share information with unaffiliated third parties that perform various required services such as transfer agents, custodians and broker/dealers.
• Policies and procedures (including physical, electronic and procedural safeguards) are in place that are designed to protect the confidentiality of such information.
• We reserve the right to change our Privacy Policy at any time upon proper notification to you. Customers may want to review our Policy periodically for changes by accessing the link on our homepage: www.eatonvance.com.
Our pledge of privacy applies to the following entities within the Eaton Vance organization: the Eaton Vance Family of Funds, Eaton Vance Management, Eaton Vance Investment Counsel, Boston Management and Research, and Eaton Vance Distributors, Inc.
In addition, our Privacy Policy only applies to those Eaton Vance customers who are individuals and who have a direct relationship with us. If a customer's account (i.e., fund shares) is held in the name of a third-party financial adviser/ broker-dealer, it is likely that only such adviser's privacy policies apply to the customer. This notice supersedes all previously issued privacy disclosures.
For more information about Eaton Vance's Privacy Policy, please call 1-800-262-1122.
Delivery of Shareholder Documents. The Securities and Exchange Commission (the "SEC") permits funds to deliver only one copy of shareholder documents, including prospectuses, proxy statements and shareholder reports, to fund investors with multiple accounts at the same residential or post office box address. This practice is often called "householding" and it helps eliminate duplicate mailings to shareholders.
Eaton Vance, or your financial adviser, may household the mailing of your documents indefinitely unless you instruct Eaton Vance, or your financial adviser, otherwise.
If you would prefer that your Eaton Vance documents not be householded, please contact Eaton Vance at 1-800-262-1122, or contact your financial adviser.
Your instructions that householding not apply to delivery of your Eaton Vance documents will be effective within 30 days of receipt by Eaton Vance or your financial adviser.
Portfolio Holdings. Each Eaton Vance Fund and its underlying Portfolio (if applicable) will file a schedule of its portfolio holdings on Form N-Q with the SEC for the first and third quarters of each fiscal year. The Form N-Q will be available on the Eaton Vance website www.eatonvance.com, by calling Eaton Vance at 1-800-262-1122 or in the EDGAR database on the SEC's website at www.sec.gov. Form N-Q may also be reviewed and copied at the SEC's public reference room in Washington, D.C. (call 1-800-732-0330 for information on the operation of the public reference room).
Proxy Voting. From time to time, funds are required to vote proxies related to the securities held by the funds. The Eaton Vance Funds or their underlying Portfolios (if applicable) vote proxies according to a set of policies and procedures approved by the Funds' and Portfolios' Boards. You may obtain a description of these policies and procedures and information on how the Funds or Portfolios voted proxies relating to portfolio securities during the most recent 12 month period ended June 30, without charge, upon request, by calling 1-800-262-1122. This description is also available on the SEC's website at www.sec.gov.
Eaton Vance Tax-Managed Multi-Cap Growth Fund as of October 31, 2007
MANAGEMENT’S DISCUSSION OF FUND PERFORMANCE

Arieh Coll
Portfolio Manager
The Fund
Performance For The Past Year
· During the year ended October 31, 2007, the Fund’s Class A shares had a total return of 43.76%. This return was the result of an increase in net asset value (NAV) per share to $17.99 on October 31, 2007, from $12.75 on October 31, 2006, plus the reinvestment of $0.2529 per share in distributions from net realized gains.(1)
· The Fund’s Class B shares had a total return of 42.64% during the same period, the result of an increase in NAV per share to $16.88 from $12.07, plus the reinvestment of $0.2529 per share in distributions from net realized gains.(1)
· The Fund’s Class C shares had a total return of 42.65% during the same period, the result of an increase in NAV per share to $16.91 from $12.09, plus the reinvestment of $0.2529 per share in distributions from net realized gains.(1)
· For comparison, the Fund’s benchmark, the S&P 500 Index – a broad-based, unmanaged market index of common stocks – had a total return of 14.55% during the same period. The Russell Mid-Cap Growth Index (the “Mid-Cap Index”), an unmanaged index of mid-cap growth companies that more closely tracks the Fund’s investments, had a total return of 19.72%. The Fund’s peer group, the Lipper Mid-Cap Growth Funds Classification, had an average return of 26.07% for the same period.(2) See pages 3-4 for more performance information, including an historical chart on page 3 and after-tax returns on page 4.
· Effective July 1, 2007, the Fund changed its name from Eaton Vance Tax-Managed Multi-Cap Opportunity Fund, and the Portfolio in which it invests changed its name from Tax-Managed Multi-Cap Opportunity Portfolio.
Management Discussion
· During the year ended October 31, 2007, U.S. stock markets moved higher amid a significant increase in volatility. In the first half of the period, investors were cautiously optimistic about the economy, inflation, interest rates, and corporate profits, although markets both in the U.S. and abroad saw sharp declines from late February through mid-March 2007. Markets recovered strongly through mid-July, only to decline again more dramatically in late July and August due to fallout from the subprime mortgage crisis. The Federal Reserve Board (the “Fed”) responded to the subprime situation by lowering the Fed Funds Rate — a key short-term interest-rate benchmark — to 4.50% by period’s end. This eased some concerns about the economy and helped move markets higher through early October 2007, though another decline, caused in part by a spike in oil prices, occurred in the final weeks of the period.
· The Fund currently invests its assets in a separate registered investment company, Tax-Managed Multi-Cap Growth Portfolio (the “Portfolio”), with the same objective and policies as the Fund.
· The Fund’s strong outperformance during this volatile period was primarily the result of successful stock selection in a broad range of industry sectors.(3) In particular, management’s strategy of seeking companies that it believes have products addressing underpenetrated markets and have competitive advantages that may increase the likelihood that they may become industry leaders, was successful during the year. The returns also reflect management’s continued strategy of focusing on companies that it expects to have earnings growth over the long term that is faster than the growth rates of the U.S. economy and the stock market as a whole.
· During the fiscal year, Portfolio holdings in the information technology, industrials, materials, consumer discretionary, health care, telecommunications services
Continued on page 2.
(1) | These returns do not include the 5.75% maximum sales charge for Class A shares or the applicable contingent deferred sales charge (CDSC) for Class B and Class C shares. If sales charges were deducted, the returns would be lower. |
(2) | It is not possible to invest directly in an Index or a Lipper Classification. The Indices’ total returns do not reflect commissions or expenses that would have been incurred if an investor individually purchased or sold the securities represented in the Indices. The Lipper Average is the average total return, at net asset value, of the funds that are in the same Lipper Classification as the Fund. |
(3) | Sector weightings are subject to change due to active management. |
Past performance is no guarantee of future results. Returns are historical and are calculated by determining the percentage change in net asset value or offering price (as applicable) with all distributions reinvested. Investment return and principal value will fluctuate so that shares, when redeemed, may be worth more or less than their original cost. Performance is for the stated time period only; due to market volatility, the Fund’s current performance may be lower or higher than the quoted return. Fund performance during certain periods reflects the strong stock market performance and/or the strong performance of stocks held during those periods. This performance is not typical and may not be repeated. For performance as of the most recent month end, please refer to www.eatonvance.com.
The views expressed throughout this report are those of the portfolio manager and are current only through the end of the period of the report as stated on the cover. These views are subject to change at any time based upon market or other conditions, and the investment adviser disclaims any responsibility to update such views. These views may not be relied on as investment advice and, because investment decisions for a fund are based on many factors, may not be relied on as an indication of trading intent on behalf of any Eaton Vance fund.
Fund shares are not insured by the FDIC and are not deposits or other obligations of, or guaranteed by, any depository institution. Shares are subject to investment risks, including possible loss of principal invested.
1
Eaton Vance Tax-Managed Multi-Cap Growth Fund as of October 31, 2007
PORTFOLIO INFORMATION
and utilities sectors all outperformed similar holdings in the Mid-Cap Index. In the top-performing information technology sector, Portfolio holdings in the communications equipment, semiconductor, and computer industries had the strongest returns. In industrials, construction and engineering stocks outperformed similar holdings in the Mid-Cap Index, while metals and mining stocks continued to see strong performance in the materials sector. Specialty retail stocks led in the consumer discretionary sector, though many other industries within that sector contributed positively to the Portfolio’s performance. The Portfolio’s pharmaceutical selections had strong returns in the health care sector during the year; although pharmaceuticals had negative performance in the Mid-Cap Index. Finally, in telecommunications services, wireless stocks were the strongest contributors for the Portfolio.(1)
· The only sectors detracting from performance during the year were financials and energy, but their impact on the Fund’s relative returns was minimal.
· As of October 31, 2007, Eaton Vance Tax-Managed Multi-Cap Growth Fund, Class A, was ranked #21 out of 604 funds in the Lipper Mid-Cap Growth Funds Classification for one year. For three years, the Fund was ranked #27 out of 484 funds. For five years, the Fund was ranked #40 out of 397 funds. Rankings are based on percentage change in net asset value with all distributions reinvested and do not take sales charges into consideration. Past performance is no guarantee of future results. Source: Lipper, Inc.
(1) | Sector weightings are subject to change due to active management. |
Top Ten Holdings(2)
By net assets
Research In Motion Ltd. | | 5.1 | % |
MEMC Electronic Materials, Inc. | | 4.2 | |
Annaly Capital Management Inc. | | 4.1 | |
Thompson Creek Metals Co. Inc. | | 4.1 | |
Foster Wheeler Ltd. | | 3.8 | |
Google Inc. (Cl A) | | 3.5 | |
Carolina Group | | 3.2 | |
Hess Corp. | | 3.1 | |
Shire PLC (ADS) | | 2.6 | |
Diamond Offshore Drilling Inc. | | 2.4 | |
(2) | Top Ten Holdings represented 36.1% of Portfolio net assets as of 10/31/07. Holdings are subject to change due to active management. |
Common Stock Investments by Sector(3)
By net assets
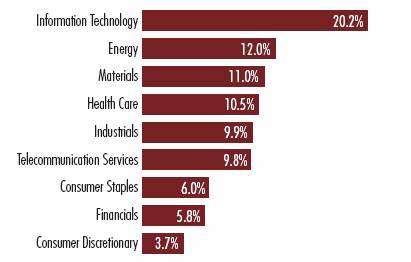
(3) | As a percentage of the Portfolio’s net assets as of 10/31/07. Portfolio information may not be representative of the Portfolio’s current or future investments and may change due to active management. |
2
Eaton Vance Tax-Managed Multi-Cap Growth Fund as of October 31, 2007
FUND PERFORMANCE
The line graph and table set forth below provide information about the Fund’s performance. The line graph compares the performance of Class A of the Fund with that of the S&P 500 Index, a broad-based, unmanaged market index of common stocks, and the Russell Mid-Cap Growth Index, an unmanaged index of mid-cap growth companies. The lines on the graph represent the total returns of a hypothetical investment of $10,000 in each of Class A, the S&P 500 Index and the Russell Mid-Cap Growth Index. Class A total returns are presented at net asset value and maximum public offering price. The table includes the total returns of each Class of the Fund at net asset value and public offering price. The performance presented below does not reflect the deduction of taxes, if any, that a shareholder would pay on distributions or redemptions of Fund shares.
Performance(1) | | Class A | | Class B | | Class C | |
| | | | | | | |
Average Annual Total Returns (at net asset value) | | | | | | | |
One Year | | 43.76 | % | 42.64 | % | 42.65 | % |
Five Years | | 20.84 | | 19.93 | | 19.94 | |
Life of Fund† | | 8.90 | | 8.02 | | 8.04 | |
| | | | | | | |
SEC Average Annual Total Returns (including sales charge or applicable CDSC) | | | | | | | |
One Year | | 35.47 | % | 37.64 | % | 41.65 | % |
Five Years | | 19.43 | | 19.74 | | 19.94 | |
Life of Fund† | | 8.02 | | 8.02 | | 8.04 | |
† Inception Dates – Class A: 6/30/00; Class B: 7/10/00; Class C: 7/10/00
(1) | Average annual total returns do not include the 5.75% maximum sales charge for Class A shares or the applicable contingent deferred sales charge (CDSC) for Class B and Class C shares. If sales charges were deducted, the returns would be lower. SEC average annual total returns for Class A reflect the maximum 5.75% sales charge. SEC returns for Class B shares reflect the applicable CDSC based on the following schedule: 5% - 1st and 2nd years; 4% - 3rd year; 3% - 4th year; 2% - 5th year; 1% - 6th year. SEC returns for Class C reflect a 1% CDSC for the first year. Absent a waiver of a portion of the investment advisor fee by the investment adviser to the Portfolio, the returns for certain periods would be lower. |
Total Annual
Operating Expenses(2) | | Class A | | Class B | | Class C | |
| | | | | | | |
Expense Ratio | | 1.50 | % | 2.25 | % | 2.25 | % |
(2) From the Fund’s prospectus dated 3/1/07.

* Source: Thomson Financial. Class A of the Fund commenced investment operations on June 30, 2000.
A $10,000 hypothetical investment on 7/10/00 (inception date) at net asset value in Class B shares and Class C shares would have been valued at $17,575 and $17,605, respectively, on 10/31/07. It is not possible to invest directly in an Index. The Indices’ total returns do not reflect commissions or expenses that would have been incurred if an investor individually purchased or sold the securities represented in the Indices.
Past performance is no guarantee of future results. Returns are historical and are calculated by determining the percentage change in net asset value or offering price (as applicable) with all distributions reinvested. Investment return and principal value will fluctuate so that shares, when redeemed, may be worth more or less than their original cost. Performance is for the stated time period only; due to market volatility, the Fund’s current performance may be lower or higher than the quoted return. Fund performance during certain periods reflects the strong stock market performance and/or the strong performance of stocks held during those periods. This performance is not typical and may not be repeated. For performance as of the most recent month end, please refer to www.eatonvance.com.
3
“Return Before Taxes” does not take into consideration shareholder taxes. It is most relevant to tax-free or tax-deferred shareholder accounts. “Return After Taxes on Distributions” reflects the impact of federal income taxes due on Fund distributions of dividends and capital gains. It is most relevant to taxpaying shareholders who continue to hold their shares. “Return After Taxes on Distributions and Sale of Fund Shares” also reflects the impact of taxes on capital gain or loss realized upon a sale of shares. It is most relevant to taxpaying shareholders who sell their shares.
Average Annual Total Returns
(For the periods ended October 31, 2007)
Returns at Net Asset Value (NAV) (Class A)
| | One Year | | Five Years | | Life of Fund | |
Return Before Taxes | | 43.76 | % | 20.84 | % | 8.90 | % |
Return After Taxes on Distributions | | 43.36 | | 20.70 | | 8.81 | |
Return After Taxes on Distributions and Sale of Fund Shares | | 28.77 | | 18.48 | | 7.79 | |
Returns At Public Offering Price (Pop) (Class A)
| | One Year | | Five Years | | Life of Fund | |
Return Before Taxes | | 35.47 | % | 19.43 | % | 8.02 | % |
Return After Taxes on Distributions | | 35.10 | | 19.29 | | 7.94 | |
Return After Taxes on Distributions and Sale of Fund Shares | | 23.37 | | 17.18 | | 7.00 | |
Average Annual Total Returns
(For The Periods Ended October 31, 2007)
Returns At Net Asset Value (Nav) (Class C)
| | One Year | | Five Years | | Life of Fund | |
Return Before Taxes | | 42.65 | % | 19.94 | % | 8.04 | % |
Return After Taxes on Distributions | | 42.24 | | 19.79 | | 7.95 | |
Return After Taxes on Distributions and Sale of Fund Shares | | 28.08 | | 17.65 | | 7.02 | |
Returns At Public Offering Price (Pop) (Class C)
| | One Year | | Five Years | | Life of Fund | |
Return Before Taxes | | 41.65 | % | 19.94 | % | 8.04 | % |
Return After Taxes on Distributions | | 41.24 | | 19.79 | | 7.95 | |
Return After Taxes on Distributions and Sale of Fund Shares | | 27.43 | | 17.65 | | 7.02 | |
Average Annual Total Returns
(For The Periods Ended October 31, 2007)
Returns At Net Asset Value (Nav) (Class B)
| | One Year | | Five Years | | Life of Fund | |
Return Before Taxes | | 42.64 | % | 19.93 | % | 8.02 | % |
Return After Taxes on Distributions | | 42.22 | | 19.79 | | 7.93 | |
Return After Taxes on Distributions and Sale of Fund Shares | | 28.07 | | 17.64 | | 7.00 | |
Returns At Public Offering Price (Pop) (Class B)
| | One Year | | Five Years | | Life of Fund | |
Return Before Taxes | | 37.64 | % | 19.74 | % | 8.02 | % |
Return After Taxes on Distributions | | 37.22 | | 19.59 | | 7.93 | |
Return After Taxes on Distributions and Sale of Fund Shares | | 24.82 | | 17.46 | | 7.00 | |
Class A of the Fund commenced investment operations on 6/30/00. Class B and Class C of the Fund commenced investment operations on 7/10/00. Returns at Public Offering Price (POP) reflect the deduction of the maximum initial sales charge and applicable CDSC, while Returns at Net Asset Value (NAV) do not. Absent a waiver of a portion of the investment advisor fee by the investment adviser to the Portfolio, the returns for certain periods would be lower.
After-tax returns are calculated using certain assumptions. After-tax returns are calculated using the highest historical individual federal income tax rate and do not reflect the impact of state and local taxes. Actual after-tax returns depend on a shareholder’s tax situation and may differ from those shown. After-tax returns are not relevant for shareholders who hold Fund shares in tax-deferred accounts or to shares held by non-taxable entities. Return After Taxes on Distributions for a period may be the same as Return Before Taxes for that period because no taxable distributions were paid during that period, or because the taxable portion of distributions made during the period was insignificant. Also, Return After Taxes on Distributions and Sale of Fund Shares for a period may be greater than Return After Taxes on Distributions for the same period because of realized losses on the sale of Fund shares.
Past performance is no guarantee of future results. Returns are historical and are calculated by determining the percentage change in net asset value or offering price (as applicable) with all distributions reinvested. Investment return and principal value will fluctuate so that shares, when redeemed, may be worth more or less than their original cost. Performance is for the stated time period only; due to market volatility, the Fund’s current performance may be lower or higher than the quoted return. Fund performance during certain periods reflects the strong stock market performance and/or the strong performance of stocks held during those periods. This performance is not typical and may not be repeated. For performance as of the most recent month end, please refer to www.eatonvance.com.
4
Eaton Vance Tax-Managed Multi-Cap Growth Fund as of October 31, 2007
FUND EXPENSES
Example: As a shareholder of the Fund, you incur two types of costs: (1) transaction costs, including sales charges (loads) on purchases and redemption fees (if applicable); and (2) ongoing costs, including management fees; distribution or service fees; and other Fund expenses. This Example is intended to help you understand your ongoing costs (in dollars) of investing in the Fund and to compare these costs with the ongoing costs of investing in other mutual funds. The Example is based on an investment of $1,000 invested at the beginning of the period and held for the entire period (May 1, 2007 – October 31, 2007).
Actual Expenses: The first section of the table below provides information about actual account values and actual expenses. You may use the information in this section, together with the amount you invested, to estimate the expenses that you paid over the period. Simply divide your account value by $1,000 (for example, an $8,600 account value divided by $1,000 = 8.6), then multiply the result by the number in the first section under the heading entitled "Expenses Paid During Period" to estimate the expenses you paid on your account during this period.
Hypothetical Example for Comparison Purposes: The second section of the table below provides information about hypothetical account values and hypothetical expenses based on the actual Fund expense ratio and an assumed rate of return of 5% per year (before expenses), which is not the actual return of the Fund. The hypothetical account values and expenses may not be used to estimate the actual ending account balance or expenses you paid for the period. You may use this information to compare the ongoing costs of investing in your Fund and other funds. To do so, compare this 5% hypothetical example with the 5% hypothetical examples that appear in the shareholder reports of the other funds.
Please note that the expenses shown in the table are meant to highlight your ongoing costs only and do not reflect any transactional costs, such as sales charges (loads) or redemption fees (if applicable). Therefore, the second section of the table is useful in comparing ongoing costs only, and will not help you determine the relative total costs of owning different funds. In addition, if these transactional costs were included, your costs would have been higher.
Eaton Vance Tax-Managed Multi-Cap Growth Fund
| | | Beginning Account Value
(5/1/07) | | Ending Account Value
(10/31/07) | | Expenses Paid During Period*
(5/1/07 – 10/31/07) | |
| Actual | |
| Class A | | $ | 1,000.00 | | | $ | 1,224.60 | | | $ | 7.79 | | |
| Class B | | $ | 1,000.00 | | | $ | 1,219.70 | | | $ | 11.97 | | |
| Class C | | $ | 1,000.00 | | | $ | 1,220.10 | | | $ | 11.98 | | |
| Hypothetical | |
| (5% return per year before expenses) | |
| Class A | | $ | 1,000.00 | | | $ | 1,018.20 | | | $ | 7.07 | | |
| Class B | | $ | 1,000.00 | | | $ | 1,014.40 | | | $ | 10.87 | | |
| Class C | | $ | 1,000.00 | | | $ | 1,014.40 | | | $ | 10.87 | | |
* Expenses are equal to the Fund's annualized expense ratio of 1.39% for Class A shares, 2.14% for Class B shares, and 2.14% for Class C shares, multiplied by the average account value over the period, multiplied by 184/365 (to reflect the one-half year period). The example assumes that the $1,000 was invested at the net asset value per share determined at the close of business on April 30, 2007. The Example reflects the expenses of both the Fund and the Portfolio.
5
Eaton Vance Tax-Managed Multi-Cap Growth Fund as of October 31, 2007
FINANCIAL STATEMENTS
Statement of Assets and Liabilities
As of October 31, 2007
| Assets | |
Investment in Tax-Managed Multi-Cap Growth Portfolio, at value
(identified cost, $69,221,129) | | $ | 98,623,802 | | |
| Receivable for Fund shares sold | | | 385,555 | | |
| Total assets | | $ | 99,009,357 | | |
| Liabilities | |
| Payable to affiliate for distribution and service fees | | $ | 50,288 | | |
| Payable for Fund shares redeemed | | | 29,787 | | |
| Payable to affiliate for Administration fees | | | 12,005 | | |
| Payable to affiliate for Trustees' fees | | | 167 | | |
| Accrued expenses | | | 47,822 | | |
| Total liabilities | | $ | 140,069 | | |
| Net Assets | | $ | 98,869,288 | | |
| Sources of Net Assets | |
| Paid-in capital | | $ | 55,426,332 | | |
Undistributed net realized gain from Portfolio (computed on
the basis of identified cost) | | | 13,216,325 | | |
| Undistributed net investment income | | | 823,958 | | |
Net unrealized appreciation from Portfolio (computed on the basis of
identified cost) | | | 29,402,673 | | |
| Total | | $ | 98,869,288 | | |
| Class A Shares | |
| Net Assets | | $ | 49,517,047 | | |
| Shares Outstanding | | | 2,752,645 | | |
Net Asset Value and Redemption Price Per Share
(net assets ÷ shares of beneficial interest outstanding) | | $ | 17.99 | | |
Maximum Offering Price Per Share
(100 ÷ 94.25 of $17.99) | | $ | 19.09 | | |
| Class B Shares | |
| Net Assets | | $ | 20,815,487 | | |
| Shares Outstanding | | | 1,233,119 | | |
Net Asset Value and Offering Price Per Share*
(net assets ÷ shares of beneficial interest outstanding) | | $ | 16.88 | | |
| Class C Shares | |
| Net Assets | | $ | 28,536,755 | | |
| Shares Outstanding | | | 1,687,459 | | |
Net Asset Value and Offering Price Per Share*
(net assets ÷ shares of beneficial interest outstanding) | | $ | 16.91 | | |
| On sales of $50,000 or more, the offering price of Class A shares is reduced. | |
* Redemption price per share is equal to the net asset value less any applicable contingent deferred sales charge.
Statement of Operations
For the Year Ended
October 31, 2007
| Investment Income | |
| Dividends allocated from Portfolio (net of foreign taxes, $9,527) | | $ | 1,856,775 | | |
| Interest allocated from Portfolio | | | 241,607 | | |
| Security lending income allocated from Portfolio, net | | | 84,224 | | |
| Expenses allocated from Portfolio | | | (551,927 | ) | |
| Net investment income from Portfolio | | $ | 1,630,679 | | |
| Expenses | |
| Administration fee | | $ | 110,943 | | |
| Trustees' fees and expenses | | | 1,862 | | |
Distribution and service fees
Class A | | | 83,006 | | |
| Class B | | | 187,200 | | |
| Class C | | | 220,397 | | |
| Transfer and dividend disbursing agent fees | | | 91,748 | | |
| Registration fees | | | 54,580 | | |
| Legal and accounting services | | | 21,691 | | |
| Printing and postage | | | 19,226 | | |
| Custodian fee | | | 18,141 | | |
| Miscellaneous | | | 6,105 | | |
| Total expenses | | $ | 814,899 | | |
Deduct —
Reduction of custodian fee | | $ | 10 | | |
| Total expense reductions | | $ | 10 | | |
| Net expenses | | $ | 814,889 | | |
| Net investment income | | $ | 815,790 | | |
Realized and Unrealized
Gain (Loss) from Portfolio | |
Net realized gain (loss) —
Investment transactions | | $ | 13,326,150 | | |
| Foreign currency transactions | | | 8,168 | | |
| Net realized gain | | $ | 13,334,318 | | |
Change in unrealized appreciation (depreciation) —
Investments | | $ | 13,077,692 | | |
| Foreign currency | | | (14 | ) | |
| Net change in unrealized appreciation (depreciation) | | $ | 13,077,678 | | |
| Net realized and unrealized gain | | $ | 26,411,996 | | |
| Net increase in net assets from operations | | $ | 27,227,786 | | |
See notes to financial statements
6
Eaton Vance Tax-Managed Multi-Cap Growth Fund as of October 31, 2007
FINANCIAL STATEMENTS CONT'D
Statements of Changes in Net Assets
Increase (Decrease)
in Net Assets | | Year Ended
October 31, 2007 | | Year Ended
October 31, 2006 | |
From operations —
Net investment income (loss) | | $ | 815,790 | | | $ | (356,940 | ) | |
Net realized gain from investment
and foreign currency transactions | | | 13,334,318 | | | | 2,047,034 | | |
Net change in unrealized
appreciation (depreciation)
from investments and foreign currency | | | 13,077,678 | | | | 8,858,896 | | |
| Net increase in net assets from operations | | $ | 27,227,786 | | | $ | 10,548,990 | | |
Distributions to shareholders —
From net realized gain
Class A | | $ | (505,546 | ) | | $ | (447,887 | ) | |
| Class B | | | (360,203 | ) | | | (395,639 | ) | |
| Class C | | | (382,895 | ) | | | (366,402 | ) | |
| Total distributions to shareholders | | $ | (1,248,644 | ) | | $ | (1,209,928 | ) | |
Transactions in shares of beneficial interest —
Proceeds from sale of shares
Class A | | $ | 15,006,829 | | | $ | 3,970,806 | | |
| Class B | | | 1,502,391 | | | | 898,574 | | |
| Class C | | | 4,826,669 | | | | 1,548,690 | | |
Net asset value of shares issued to
shareholders in payment of
distributions declared
Class A | | | 454,534 | | | | 398,777 | | |
| Class B | | | 304,962 | | | | 337,218 | | |
| Class C | | | 296,062 | | | | 287,811 | | |
Cost of shares redeemed
Class A | | | (4,426,455 | ) | | | (5,412,727 | ) | |
| Class B | | | (4,227,231 | ) | | | (4,094,237 | ) | |
| Class C | | | (2,428,086 | ) | | | (3,402,799 | ) | |
Net asset value of shares exchanged
Class A | | | 905,115 | | | | 827,803 | | |
| Class B | | | (905,115 | ) | | | (827,803 | ) | |
Net increase (decrease) in net assets from
Fund share transactions | | $ | 11,309,675 | | | $ | (5,467,887 | ) | |
| Net increase in net assets | | $ | 37,288,817 | | | $ | 3,871,175 | | |
| Net Assets | |
| At beginning of year | | $ | 61,580,471 | | | $ | 57,709,296 | | |
| At end of year | | $ | 98,869,288 | | | $ | 61,580,471 | | |
Undistributed
net investment income
included in net assets | |
| At end of year | | $ | 823,958 | | | $ | — | | |
See notes to financial statements
7
Eaton Vance Tax-Managed Multi-Cap Growth Fund as of October 31, 2007
FINANCIAL STATEMENTS CONT'D
Financial Highlights
| | | Class A | |
| | | Year Ended October 31, | |
| | | 2007(1) | | 2006(1) | | 2005(1) | | 2004(1) | | 2003(1) | |
| Net asset value — Beginning of year | | $ | 12.750 | | | $ | 10.850 | | | $ | 10.060 | | | $ | 9.690 | | | $ | 7.250 | | |
| Income (loss) from operations | |
| Net investment income (loss) | | $ | 0.217 | (4) | | $ | (0.019 | ) | | $ | (0.072 | ) | | $ | (0.083 | ) | | $ | (0.116 | ) | |
| Net realized and unrealized gain | | | 5.276 | | | | 2.144 | | | | 0.862 | | | | 0.453 | | | | 2.556 | | |
| Total income from operations | | $ | 5.493 | | | $ | 2.125 | | | $ | 0.790 | | | $ | 0.370 | | | $ | 2.440 | | |
| Less distributions | |
| From net realized gain | | $ | (0.253 | ) | | $ | (0.225 | ) | | $ | — | | | $ | — | | | $ | — | | |
| Total distributions | | $ | (0.253 | ) | | $ | (0.225 | ) | | $ | — | | | $ | — | | | $ | — | | |
| Net asset value — End of year | | $ | 17.990 | | | $ | 12.750 | | | $ | 10.850 | | | $ | 10.060 | | | $ | 9.690 | | |
| Total Return(2) | | | 43.76 | % | | | 19.84 | % | | | 7.85 | % | | | 3.82 | % | | | 33.66 | % | |
| Ratios/Supplemental Data | |
| Net assets, end of year (000's omitted) | | $ | 49,517 | | | $ | 25,559 | | | $ | 21,998 | | | $ | 23,462 | | | $ | 19,884 | | |
| Ratios (As a percentage of average daily net assets): | |
| Expenses before custodian fee reduction(3) | | | 1.43 | % | | | 1.49 | % | | | 1.55 | % | | | 1.52 | % | | | 1.66 | % | |
| Expenses after custodian fee reduction(3) | | | 1.43 | % | | | 1.49 | % | | | 1.55 | % | | | 1.52 | % | | | 1.66 | % | |
| Net investment income (loss) | | | 1.45 | %(4) | | | (0.16 | )% | | | (0.67 | )% | | | (0.84 | )% | | | (1.42 | )% | |
| Portfolio Turnover | | | 157 | % | | | 181 | % | | | 217 | % | | | 239 | % | | | 224 | % | |
(1) Net investment income (loss) per share was computed using average shares outstanding.
(2) Returns are historical and are calculated by determining the percentage change in net asset value with all distributions reinvested.
(3) Includes the Fund's share of the Portfolio's allocated expenses. The Portfolio's advisor voluntarily waived a portion of its investment advisory fee (equal to 0.01% of average net assets for 2006 and 2004, respectively).
(4) Net investment loss per share reflects special dividends allocated from the Portfolio which amounted to $0.265 per share. Excluding special dividends, the ratio of net investment loss to average daily net assets would have been (0.31)%.
See notes to financial statements
8
Eaton Vance Tax-Managed Multi-Cap Growth Fund as of October 31, 2007
FINANCIAL STATEMENTS CONT'D
Financial Highlights
| | | Class B | |
| | | Year Ended October 31, | |
| | | 2007(1) | | 2006(1) | | 2005(1) | | 2004(1) | | 2003(1) | |
| Net asset value — Beginning of year | | $ | 12.070 | | | $ | 10.350 | | | $ | 9.680 | | | $ | 9.390 | | | $ | 7.080 | | |
| Income (loss) from operations | |
| Net investment income (loss) | | $ | 0.120 | (4) | | $ | (0.096 | ) | | $ | (0.146 | ) | | $ | (0.153 | ) | | $ | (0.173 | ) | |
| Net realized and unrealized gain | | | 4.943 | | | | 2.041 | | | | 0.816 | | | | 0.443 | | | | 2.483 | | |
| Total income from operations | | $ | 5.063 | | | $ | 1.945 | | | $ | 0.670 | | | $ | 0.290 | | | $ | 2.310 | | |
| Less distributions | |
| From net realized gain | | $ | (0.253 | ) | | $ | (0.225 | ) | | $ | — | | | $ | — | | | $ | — | | |
| Total distributions | | $ | (0.253 | ) | | $ | (0.225 | ) | | $ | — | | | $ | — | | | $ | — | | |
| Net asset value — End of year | | $ | 16.880 | | | $ | 12.070 | | | $ | 10.350 | | | $ | 9.680 | | | $ | 9.390 | | |
| Total Return(2) | | | 42.64 | % | | | 19.04 | % | | | 6.92 | % | | | 3.09 | % | | | 32.63 | % | |
| Ratios/Supplemental Data | |
| Net assets, end of year (000's omitted) | | $ | 20,815 | | | $ | 17,797 | | | $ | 18,653 | | | $ | 20,928 | | | $ | 20,868 | | |
| Ratios (As a percentage of average daily net assets): | |
| Expenses before custodian fee reduction(3) | | | 2.19 | % | | | 2.24 | % | | | 2.30 | % | | | 2.27 | % | | | 2.41 | % | |
| Expenses after custodian fee reduction(3) | | | 2.19 | % | | | 2.24 | % | | | 2.30 | % | | | 2.27 | % | | | 2.41 | % | |
| Net investment income (loss) | | | 0.86 | %(4) | | | (0.85 | )% | | | (1.42 | )% | | | (1.60 | )% | | | (2.16 | )% | |
| Portfolio Turnover | | | 157 | % | | | 181 | % | | | 217 | % | | | 239 | % | | | 224 | % | |
(1) Net investment income (loss) per share was computed using average shares outstanding.
(2) Returns are historical and are calculated by determining the percentage change in net asset value with all distributions reinvested.
(3) Includes the Fund's share of the Portfolio's allocated expenses. The Portfolio's advisor voluntarily waived a portion of its investment advisory fee (equal to 0.01% of average net assets for 2006 and 2004, respectively).
(4) Net investment loss per share reflects special dividends allocated from the Portfolio which amounted to $0.263 per share. Excluding special dividends, the ratio of net investment loss to average daily net assets would have been (1.02)%.
See notes to financial statements
9
Eaton Vance Tax-Managed Multi-Cap Growth Fund as of October 31, 2007
FINANCIAL STATEMENTS CONT'D
Financial Highlights
| | | Class C | |
| | | Year Ended October 31, | |
| | | 2007(1) | | 2006(1) | | 2005(1) | | 2004(1) | | 2003(1) | |
| Net asset value — Beginning of year | | $ | 12.090 | | | $ | 10.370 | | | $ | 9.700 | | | $ | 9.410 | | | $ | 7.090 | | |
| Income (loss) from operations | |
| Net investment income (loss) | | $ | 0.111 | (4) | | $ | (0.100 | ) | | $ | (0.146 | ) | | $ | (0.151 | ) | | $ | (0.172 | ) | |
| Net realized and unrealized gain | | | 4.962 | | | | 2.045 | | | | 0.816 | | | | 0.441 | | | | 2.492 | | |
| Total income from operations | | $ | 5.073 | | | $ | 1.945 | | | $ | 0.670 | | | $ | 0.290 | | | $ | 2.320 | | |
| Less distributions | |
| From net realized gain | | $ | (0.253 | ) | | $ | (0.225 | ) | | $ | — | | | $ | — | | | $ | — | | |
| Total distributions | | $ | (0.253 | ) | | $ | (0.225 | ) | | $ | — | | | $ | — | | | $ | — | | |
| Net asset value — End of year | | $ | 16.910 | | | $ | 12.090 | | | $ | 10.370 | | | $ | 9.700 | | | $ | 9.410 | | |
| Total Return(2) | | | 42.65 | % | | | 19.01 | % | | | 6.91 | % | | | 3.08 | % | | | 32.72 | % | |
| Ratios/Supplemental Data | |
| Net assets, end of year (000's omitted) | | $ | 28,537 | | | $ | 18,224 | | | $ | 17,058 | | | $ | 18,373 | | | $ | 15,902 | | |
| Ratios (As a percentage of average daily net assets): | |
| Expenses before custodian fee reduction(3) | | | 2.18 | % | | | 2.24 | % | | | 2.30 | % | | | 2.27 | % | | | 2.41 | % | |
| Expenses after custodian fee reduction(3) | | | 2.18 | % | | | 2.24 | % | | | 2.30 | % | | | 2.27 | % | | | 2.41 | % | |
| Net investment income (loss) | | | 0.79 | %(4) | | | (0.89 | )% | | | (1.42 | )% | | | (1.57 | )% | | | (2.16 | )% | |
| Portfolio Turnover | | | 157 | % | | | 181 | % | | | 217 | % | | | 239 | % | | | 224 | % | |
(1) Net investment income (loss) per share was computed using average shares outstanding.
(2) Returns are historical and are calculated by determining the percentage change in net asset value with all distributions reinvested.
(3) Includes the Fund's share of the Portfolio's allocated expenses. The Portfolio's advisor voluntarily waived a portion of its investment advisory fee (equal to 0.01% of average net assets for 2006 and 2004, respectively).
(4) Net investment loss per share reflects special dividends allocated from the Portfolio which amounted to $0.260 per share. Excluding special dividends, the ratio of net investment loss to average daily net assets would have been (1.05)%.
See notes to financial statements
10
Eaton Vance Tax-Managed Multi-Cap Growth Fund as of October 31, 2007
NOTES TO FINANCIAL STATEMENTS
1 Significant Accounting Policies
Eaton Vance Tax-Managed Multi-Cap Growth Fund (the Fund) (formerly Eaton Vance Tax-Managed Multi-Cap Opportunity Fund) is a diversified series of Eaton Vance Mutual Funds Trust (the Trust). The Trust is an entity of the type commonly known as a Massachusetts business trust and is registered under the Investment Company Act of 1940, as amended (the 1940 Act), as an open-end management investment company. The Fund currently offers three classes of shares. Class A shares are generally sold subject to a sales charge imposed at time of purchase. Class B and Class C shares are sold at net asset value and are subject to a contingent deferred sales charge (see Note 5). Class B shares held for eight years will automatically convert to Class A shares. Each class represents a pro rata interest in the Fund, but votes separately on class-specific matters and (as noted below) is subject to different expenses. Realized and unrealized gains and losses and net investment income, other than class-specific expenses, are allocated daily to each class of shares based on the relative net assets of each class to the total net assets of the Fund. Each class of shares differs in its distribution plan and certain other class-specific expenses. The Fund invests all of its investable assets in interests in the Tax-Managed Multi-Cap Growth Portfolio (the Portfolio) (formerly Tax-Managed Multi-Cap Opportunity Portfolio), a New York Trust, having the same investment objective as the Fund. The value of the Fund's investment in the Portfolio reflects the Fund's proportionate interest in the net assets of the Portfolio (45.0%) at October 31, 2007. The performance of the Fund is directly affected by the performance of the Portfolio. The financial statements of the Portfolio, including the portfolio of investments, are included elsewhere in this report and should be read in conjunction with the Fund's financial statements.
The following is a summary of significant accounting policies of the Fund. The policies are in conformity with accounting principles generally accepted in the United States of America.
A Investment Valuation — Valuation of securities by the Portfolio is discussed in Note 1A of the Portfolio's Notes to Financial Statements, which are included elsewhere in this report.
B Income — The Fund's net investment income or loss consists of the Fund's pro-rata share of the net investment income or loss of the Portfolio, less all actual and accrued expenses of the Fund.
C Federal Taxes — The Fund's policy is to comply with the provisions of the Internal Revenue Code applicable to regulated investment companies and to distribute to shareholders each year substantially all of its net investment income, and all or substantially all of its net realized capital gains. Accordingly, no provision for federal income or excise tax is necessary.
D Expenses — The majority of expenses of the Trust are directly identifiable to an individual fund. Expenses which are not readily identifiable to a specific fund are allocated taking into consideration, among other things, the nature and type of expense and the relative size of the funds.
E Expense Reduction — State Street Bank and Trust Company (SSBT) serves as custodian of the Fund. Pursuant to the custodian agreement, SSBT receives a fee reduced by credits, which are determined based on the average daily cash balance the Fund maintains with SSBT. All credit balances, if any, used to reduce the Fund's custodian fees are reported as a reduction of expenses in the Statement of Operations.
F Use of Estimates — The preparation of the financial statements in conformity with accounting principles generally accepted in the United States of America requires management to make estimates and assumptions that affect the reported amounts of assets and liabilities at the date of the financial statements and the reported amounts of income and expense during the reporting period. Actual results could differ from those estimates.
G Indemnifications — Under the Trust's organizational documents, its officers and Trustees may be indemnified against certain liabilities and expenses arising out of the performance of their duties to the Fund, and shareholders are indemnified against personal liability for obligations of the Trust. Additionally, in the normal course of business, the Fund enters into agreements with service providers that may contain indemnification clauses. The Fund's maximum exposure under these arrangements is unknown as this would involve future claims that may be made against the Fund that have not yet occurred.
H Other — Investment transactions are accounted for on a trade date basis. Distributions to shareholders are recorded on the ex-dividend date.
11
Eaton Vance Tax-Managed Multi-Cap Growth Fund as of October 31, 2007
NOTES TO FINANCIAL STATEMENTS CONT'D
2 Distributions to Shareholders
It is the present policy of the Fund to make at least one distribution annually of all or substantially all of the net investment income allocated to the Fund by the Portfolio, less the Fund's direct and allocated expenses, and to distribute at least annually all or substantially all of its net realized capital gains allocated to the Fund by the Portfolio (reduced by available capital loss carryforwards from prior years, if any). Distributions are declared separately for each class of shares. Distributions are paid in the form of additional shares of the same class of the Fund or, at the election of the shareholder, in cash. Shareholders may reinvest distributions in additional shares of the same class of the Fund at the net asset value as of the ex-dividend date. The Fund distinguishes between distributions on a tax basis and those on a financial reporting basis. Accounting principles generally accepted in the United States of America require that only distributions in excess of tax basis earnings and profits be reported in the financial statements as a return of capital. Permanent differences between book and tax accounting relating to distributions are reclassified to paid-in capital.
The tax character of distributions paid for the years ended October 31, 2007 and October 31, 2006 was as follows:
| | | Year Ended October 31, | |
| | | 2007 | | 2006 | |
| Distributions declared from: | |
| Long-Term Capital Gains Distribution | | $ | 1,248,644 | | | $ | 1,209,928 | | |
During the year ended October 31, 2007, the following amounts were reclassified due to differences between book and tax accounting, primarily for foreign currency gain (loss).
| Increase (decrease): | | | | | |
| Paid-in capital | | $ | (34,940 | ) | |
| Accumulated net realized gain | | $ | 26,772 | | |
| Accumulated net investment income | | $ | 8,168 | | |
These reclassifications had no effect on the net assets or net asset value per share of the Fund.
As of October 31, 2007, the components of distributable earnings (accumulated losses) and unrealized appreciation (depreciation) on a tax basis were as follows:
| Undistributed long term capital gain | | $ | 8,847,673 | | |
| Undistributed ordinary income | | $ | 5,271,271 | | |
| Unrealized appreciation (depreciation) | | $ | 29,324,012 | | |
The differences between components of distributable earnings (accumulated losses) on a tax basis and the amounts reflected in the Statement of Assets and Liabilities are primarily due to wash sales, passive foreign investment companies, partnership allocations and the treatment of short-term capital gains as ordinary income for tax purposes.
3 Transactions with Affiliates
The administration fee is earned by Eaton Vance Management (EVM) as compensation for managing and administering the business affairs of the Fund. Under the administration agreement, EVM earns a fee in the amount of 0.15% per annum of the average daily net assets of the Fund. For the year ended October 31, 2007, the administration fee amounted to $110,943. The Portfolio has engaged Boston Management and Research (BMR), a subsidiary of EVM, to render investment advisory services. See Note 2 of the Portfolio's Notes to Financial Statements which are included elsewhere in this report. EVM serves as the sub-transfer agent of the Fund and receives from the transfer agent an aggregate fee based upon the actual expenses incurred by EVM in the performance of those services. During the year ended October 31, 2007, EVM received $4,507 in sub-transfer agent fees. The Fund was informed that EVD received $27,436 as its portion of the sales ch arge on sales of Class A for the year ended October 31, 2007. EVD also received distribution and service fees from Class A, Class B and Class C shares (see Note 4) and contingent deferred sales charges (see Note 5).
Except as to Trustees of the Fund and the Portfolio who are not members of EVM's or BMR's organizations, officers and Trustees receive remuneration for their services to the Fund out of the investment adviser and administrative fees earned by EVM and BMR. Certain officers and Trustees of the Fund and Portfolio are officers of the above organizations.
4 Distribution Plans
The Fund has in effect a distribution plan for Class A shares (Class A Plan) pursuant to Rule 12b-1 under the 1940 Act. The Class A Plan provides that the Fund will pay EVD a distribution and service fee of 0.25% per annum of the Fund's average daily net assets attributable to Class A shares for distribution services and facilities provided to the Fund by EVD, as well as for personal services and/or the maintenance of shareholder accounts. Distribution and service fees paid or accrued for the year ended October 31, 2007 amounted to $83,006 for Class A shares. The Fund also has in effect distribution plans for Class B shares (Class B Plan) and Class C shares (Class C Plan) pursuant to Rule 12b-1 under the 1940 Act. The Class B and Class C Plans require the Fund to pay EVD amounts equal to 0.75% per annum of the Fund's average daily net assets attributable to Class B and Class C shares for providing
12
Eaton Vance Tax-Managed Multi-Cap Growth Fund as of October 31, 2007
NOTES TO FINANCIAL STATEMENTS CONT'D
ongoing distribution services and facilities to the Fund. The Fund will automatically discontinue payments to EVD during any period in which there are no outstanding Uncovered Distribution Charges, which are equivalent to the sum of (i) 6.25% of the aggregate amount received by the Fund for the Class B and Class C shares sold, plus (ii) interest calculated by applying the rate of 1% over the prevailing prime rate to the outstanding balance of Uncovered Distribution Charges of EVD, of each respective class, reduced by the aggregate amount of contingent deferred sales charges (see Note 5) and amounts theretofore paid to EVD by each respective class. The Fund paid or accrued $140,400 and $165,298 for Class B and Class C shares, respectively, to or payable to EVD for the year ended October 31, 2007, representing 0.75% of the average daily net assets for Class B and Class C shares. At October 31, 2007, the amount of Uncovered Distrib ution Charges of EVD calculated under the Plans was approximately $587,000 and $1,116,000 for Class B and Class C shares, respectively. The Class B and Class C Plans also authorize the Fund to make payments of service fees to EVD, investment dealers and other persons in amounts not exceeding 0.25% per annum of the Fund's average daily net assets attributable to Class B and Class C shares. Service fees are paid for personal services and/or the maintenance of shareholder accounts. They are separate and distinct from the sales commissions and distribution fees payable by the Fund to EVD and as such, are not subject to automatic discontinuance when there are no outstanding Uncovered Distribution Charges to EVD. Service fees paid or accrued for the year ended October 31, 2007 amounted to $46,800 and $55,099, for Class B and Class C shares, respectively.
5 Contingent Deferred Sales Charge
A contingent deferred sales charge (CDSC) generally is imposed on redemptions of Class B shares made within six years of purchase and on redemptions of Class C shares made within one year of purchase. Purchases of Class A shares of $1 million or more will be subject to a CDSC up to 1% if redeemed within two years of purchase (depending upon the circumstances of purchase). Generally, the CDSC is based upon the lower of the net asset value at date of redemption or date of purchase. No charge is levied on shares acquired by reinvestment of dividends or capital gain distributions. The Class B CDSC is imposed at declining rates that begin at 5% in the case of redemptions in the first and second year after purchase, declining one percentage point each subsequent year. Class C shares are subject to a 1% CDSC if redeemed within one year of purchase. No CDSC is levied on shares which have been sold to EVM or its affiliates or to their re spective employees or clients and may be waived under certain other limited conditions. CDSC are paid to EVD to reduce the amount of Uncovered Distribution Charges calculated under the Plans. CDSC received when no Uncovered Distribution Charges exist will be credited to the Fund. The Fund was informed that EVD received approximately $26,000 and $1,000 of CDSC paid by shareholders for Class B and Class C shares, respectively, and none paid by shareholders of Class A shares for the year ended October 31, 2007.
6 Investment Transactions
Increases and decreases in the Fund's investment in the Portfolio for the year ended October 31, 2007 aggregated $21,049,018 and $12,123,213, respectively.
7 Shares of Beneficial Interest
The Fund's Declaration of Trust permits the Trustees to issue an unlimited number of full and fractional shares of beneficial interest (without par value). Such shares may be issued in a number of different series (such as the Fund) and classes. Transactions in Fund shares were as follows:
| | | Year Ended October 31, | |
| Class A | | 2007 | | 2006 | |
| Sales | | | 955,035 | | | | 329,204 | | |
Issued to shareholders electing to
receive payments of distributions
in Fund shares | | | 33,895 | | | | 35,104 | | |
| Redemptions | | | (302,334 | ) | | | (457,212 | ) | |
| Exchange from Class B shares | | | 61,431 | | | | 69,376 | | |
| Net increase (decrease) | | | 748,027 | | | | (23,528 | ) | |
| | | Year Ended October 31, | |
| Class B | | 2007 | | 2006 | |
| Sales | | | 100,763 | | | | 78,552 | | |
Issued to shareholders electing to
receive payments of distributions
in Fund shares | | | 24,070 | | | | 31,138 | | |
| Redemptions | | | (301,178 | ) | | | (363,548 | ) | |
| Exchange to Class A shares | | | (65,166 | ) | | | (73,046 | ) | |
| Net decrease | | | (241,511 | ) | | | (326,904 | ) | |
| | | Year Ended October 31, | |
| Class C | | 2007 | | 2006 | |
| Sales | | | 327,367 | | | | 137,125 | | |
Issued to shareholders electing to
receive payments of distributions
in Fund shares | | | 23,330 | | | | 26,551 | | |
| Redemptions | | | (170,576 | ) | | | (301,010 | ) | |
| Net increase (decrease) | | | 180,121 | | | | (137,334 | ) | |
13
Eaton Vance Tax-Managed Multi-Cap Growth Fund as of October 31, 2007
NOTES TO FINANCIAL STATEMENTS CONT'D
8 Recently Issued Accounting Pronouncements
In June 2006, the Financial Accounting Standards Board (FASB) issued FASB Interpretation No. 48 (FIN 48), "Accounting for Uncertainty in Income Taxes – an interpretation of FASB Statement No. 109". FIN 48 clarifies the accounting for uncertainty in income taxes recognized in accordance with FASB Statement No. 109, "Accounting for Income Taxes". This interpretation prescribes a recognition threshold and measurement attribute for the financial statement recognition and measurement of a tax position taken or expected to be taken in a tax return. It also provides guidance on de-recognition, classification, interest and penalties, accounting in interim periods, disclosure and transition. FIN 48 is effective on the last business day of the first required financial reporting period for fiscal years beginning after December 15, 2006. Management is currently evaluating the impact of applying the various provisions of FIN 48.
In September 2006, the FASB issued Statement of Financial Accounting Standards No. 157 (FAS 157), "Fair Value Measurements". FAS 157 defines fair value, establishes a framework for measuring fair value in accordance with generally accepted accounting principles and expands disclosure about fair value measurements. FAS 157 is effective for fiscal years beginning after November 15, 2007. Management is currently evaluating the impact the adoption of FAS 157 will have on the Fund's financial statement disclosures.
14
Eaton Vance Tax-Managed Multi-Cap Growth Fund as of October 31, 2007
REPORT OF INDEPENDENT REGISTERED PUBLIC ACCOUNTING FIRM
To the Trustees of Eaton Vance Mutual Funds Trust and Shareholders of the Eaton Vance Tax-Managed Multi-Cap Growth Fund:
We have audited the accompanying statement of assets and liabilities of Eaton Vance Tax-Managed Multi-Cap Growth Fund (the "Fund") (formerly Eaton Vance Tax-Managed Multi-Cap Opportunity Fund) (one of the series of Eaton Vance Mutual Funds Trust) as of October 31, 2007, and the related statement of operations for the year then ended, the statements of changes in net assets for each of the two years in the period then ended, and the financial highlights for each of the five years in the period then ended. These financial statements and financial highlights are the responsibility of the Fund's management. Our responsibility is to express an opinion on these financial statements and financial highlights based on our audits.
We conducted our audits in accordance with the standards of the Public Company Accounting Oversight Board (United States). Those standards require that we plan and perform the audit to obtain reasonable assurance about whether the financial statements and financial highlights are free of material misstatement. The Fund is not required to have, nor were we engaged to perform, an audit of its internal control over financial reporting. Our audits included consideration of internal control over financial reporting as a basis for designing audit procedures that are appropriate in the circumstances, but not for the purpose of expressing an opinion on the effectiveness of the Fund's internal control over financial reporting. Accordingly, we express no such opinion. An audit also includes examining, on a test basis, evidence supporting the amounts and disclosures in the financial statements, assessing the accounting principles used and significant estimates made by management, as well as evaluating the overall financial statement presentation. We believe that our audits provide a reasonable basis for our opinion.
In our opinion, the financial statements and financial highlights referred to above present fairly, in all material respects, the financial position of Eaton Vance Tax-Managed Multi-Cap Growth Fund as of October 31, 2007, the results of its operations for the year ended, the changes in its net assets for each of the two years in the period then ended, and the financial highlights for each of the five years in the period then ended, in conformity with accounting principles generally accepted in the United States of America.
DELOITTE & TOUCHE LLP
Boston, Massachusetts
December 14, 2007
15
Eaton Vance Tax-Managed Multi-Cap Growth Fund as of October 31, 2007
FEDERAL TAX INFORMATION (Unaudited)
The Form 1099-DIV you receive in January 2008 will show the tax status of all distributions paid to your account in calendar year 2007. Shareholders are advised to consult their own tax adviser with respect to the tax consequences of their investment in the Fund. As required by the Internal Revenue Code regulations, shareholders must be notified within 60 days of the Fund's fiscal year end regarding the status of long-term capital gains distributions.
Long-term Capital Gains Distributions — The Fund designates $1,248,644 as a long-term capital gain distribution.
16
Tax-Managed Multi-Cap Growth Portfolio as of October 31, 2007
PORTFOLIO OF INVESTMENTS
| Common Stocks — 88.9% | |
| Security | | Shares | | Value | |
| Biotechnology — 2.3% | |
| Celgene Corp.(1)(2) | | | 42,000 | | | $ | 2,772,000 | | |
| Cephalon, Inc.(1)(2) | | | 1,000 | | | | 73,740 | | |
| Genzyme Corp.(1) | | | 30,000 | | | | 2,279,100 | | |
| | | | | | | $ | 5,124,840 | | |
| Capital Markets — 0.0% | |
| FCStone Group, Inc.(1) | | | 60 | | | $ | 2,115 | | |
| | | | | | | $ | 2,115 | | |
| Chemicals — 0.1% | |
| Potash Corporation of Saskatchewan, Inc. | | | 1,500 | | | $ | 184,230 | | |
| | | | | | | $ | 184,230 | | |
| Commercial Banks — 0.5% | |
| Banco Itau Holding Financeira SA ADR(2) | | | 34,774 | | | $ | 992,798 | | |
| | | | | | | $ | 992,798 | | |
| Commercial Services & Supplies — 1.0% | |
| Manpower, Inc. | | | 30,000 | | | $ | 2,242,200 | | |
| | | | | | | $ | 2,242,200 | | |
| Communications Equipment — 5.6% | |
| BigBand Networks, Inc.(1) | | | 893 | | | $ | 5,358 | | |
| Research In Motion, Ltd.(1) | | | 89,865 | | | | 11,189,091 | | |
| Riverbed Technology, Inc.(1)(2) | | | 32,000 | | | | 1,081,280 | | |
| | | | | | | $ | 12,275,729 | | |
| Computer Peripherals — 3.3% | |
| Apple, Inc.(1) | | | 14,500 | | | $ | 2,754,275 | | |
| Brocade Communications Systems, Inc.(1) | | | 460,000 | | | | 4,374,600 | | |
| | | | | | | $ | 7,128,875 | | |
| Construction & Engineering — 5.8% | |
| Fluor Corp. | | | 26,800 | | | $ | 4,234,400 | | |
| Foster Wheeler, Ltd.(1) | | | 56,600 | | | | 8,390,950 | | |
| | | | | | | $ | 12,625,350 | | |
| Security | | Shares | | Value | |
| Consumer Finance — 0.4% | |
| First Marblehead Corp. (The)(2) | | | 24,000 | | | $ | 931,920 | | |
| | | | | | | $ | 931,920 | | |
| Containers & Packaging — 1.6% | |
| Owens-Illinois, Inc.(1) | | | 77,100 | | | $ | 3,424,782 | | |
| | | | | | | $ | 3,424,782 | | |
| Diversified Consumer Services — 0.0% | |
| Bright Horizons Family Solutions, Inc.(1) | | | 100 | | | $ | 3,880 | | |
| Capella Education Co.(1)(2) | | | 100 | | | | 6,200 | | |
| | | | | | | $ | 10,080 | | |
| Diversified Telecommunication Services — 0.3% | |
| Maxcom Telecomunicaciones SAB de CV, ADR(1)(2) | | | 35,239 | | | $ | 611,749 | | |
| | | | | | | $ | 611,749 | | |
| Electrical Equipment — 2.3% | |
| JA Solar Holdings Co. Ltd. ADR(1) | | | 78,000 | | | $ | 4,492,800 | | |
| Solaria Energia y Medio Ambiente SA(1) | | | 18,279 | | | | 528,903 | | |
| | | | | | | $ | 5,021,703 | | |
| Energy Equipment & Services — 3.3% | |
| Diamond Offshore Drilling, Inc. | | | 47,000 | | | $ | 5,321,810 | | |
| Tenaris S.A. ADR(2) | | | 36,000 | | | | 1,936,800 | | |
| | | | | | | $ | 7,258,610 | | |
| Food & Staples Retailing — 1.9% | |
| Shoppers Drug Mart Corp. | | | 53,000 | | | $ | 3,090,272 | | |
| Susser Holdings Corp.(1) | | | 39,232 | | | | 978,446 | | |
| | | | | | | $ | 4,068,718 | | |
| Health Care Equipment & Supplies — 0.0% | |
| Thoratec Corp.(1)(2) | | | 625 | | | $ | 12,481 | | |
| | | | | | | $ | 12,481 | | |
| Health Care Providers & Services — 2.2% | |
| DaVita, Inc.(1) | | | 47,075 | | | $ | 3,068,819 | | |
| Henry Schein, Inc.(1)(2) | | | 28,000 | | | | 1,677,200 | | |
| | | | | | | $ | 4,746,019 | | |
See notes to financial statements
17
Tax-Managed Multi-Cap Growth Portfolio as of October 31, 2007
PORTFOLIO OF INVESTMENTS CONT'D
| Security | | Shares | | Value | |
| Household Durables — 0.0% | |
| Standard-Pacific Corp.(2) | | | 100 | | | $ | 480 | | |
| | | | | | | $ | 480 | | |
| Industrial Conglomerates — 0.0% | |
| McDermott International, Inc.(1) | | | 200 | | | $ | 12,212 | | |
| | | | | | | $ | 12,212 | | |
| Insurance — 0.0% | |
| Admiral Group PLC | | | 1,000 | | | $ | 21,504 | | |
| Progressive Corp. | | | 400 | | | | 7,400 | | |
| | | | | | | $ | 28,904 | | |
| Internet & Catalog Retail — 1.9% | |
| Priceline.com, Inc.(1)(2) | | | 43,900 | | | $ | 4,087,090 | | |
| | | | | | | $ | 4,087,090 | | |
| Internet Software & Services — 8.0% | |
| Ariba, Inc.(1) | | | 308,110 | | | $ | 3,986,943 | | |
| DealerTrack Holdings, Inc.(1) | | | 42,225 | | | | 2,072,825 | | |
| Equinix, Inc.(1)(2) | | | 500 | | | | 58,330 | | |
| Google Inc., Class A(1) | | | 10,892 | | | | 7,700,644 | | |
| Omniture, Inc.(1)(2) | | | 1,000 | | | | 34,160 | | |
| SAVVIS, Inc.(1)(2) | | | 50,000 | | | | 1,889,000 | | |
| Skillsoft PLC ADR(1) | | | 56,000 | | | | 501,200 | | |
| Switch & Data Facilities Co., Inc.(1)(2) | | | 61,448 | | | | 1,209,297 | | |
| | | | | | | $ | 17,452,399 | | |
| IT Services — 2.2% | |
| MasterCard, Inc., Class A(2) | | | 26,000 | | | $ | 4,928,300 | | |
| WNS Holdings, Ltd. ADR(1) | | | 52 | | | | 1,114 | | |
| | | | | | | $ | 4,929,414 | | |
| Life Sciences Tools & Services — 0.9% | |
| WuXi PharmaTech Cayman, Inc. ADR(1)(2) | | | 54,000 | | | $ | 2,078,460 | | |
| | | | | | | $ | 2,078,460 | | |
| Machinery — 0.8% | |
| Flowserve Corp. | | | 1,000 | | | $ | 78,960 | | |
| Titan International, Inc.(2) | | | 58,000 | | | | 1,755,080 | | |
| | | | | | | $ | 1,834,040 | | |
| Security | | Shares | | Value | |
| Media — 0.9% | |
| Central European Media Enterprises, Ltd., Class A(1) | | | 4,450 | | | $ | 510,637 | | |
| CTC Media, Inc.(1) | | | 3,830 | | | | 96,095 | | |
| Focus Media Holding, Ltd. ADR(1)(2) | | | 18,885 | | | | 1,170,870 | | |
| Tribune Co. | | | 4,531 | | | | 137,108 | | |
| | | | | | | $ | 1,914,710 | | |
| Metals & Mining — 9.4% | |
| Aber Diamond Corp.(2) | | | 16,927 | | | $ | 743,603 | | |
| Bolnisi Gold NL(1) | | | 100 | | | | 264 | | |
| Century Aluminum Co.(1) | | | 100 | | | | 5,819 | | |
| Gammon Gold, Inc.(1)(2) | | | 421,000 | | | | 4,348,930 | | |
| Golden Star Resources, Ltd.(1) | | | 782,000 | | | | 2,815,200 | | |
| Kinross Gold Corp.(1) | | | 138,000 | | | | 2,715,840 | | |
| Roca Mines, Inc.(1) | | | 152,739 | | | | 617,517 | | |
| Thompson Creek Metals Co., Inc.(1) | | | 340,000 | | | | 8,942,093 | | |
| United States Steel Corp. | | | 1,000 | | | | 107,900 | | |
| Western Copper Corp.(1) | | | 110,000 | | | | 185,302 | | |
| | | | | | | $ | 20,482,468 | | |
| Oil, Gas & Consumable Fuels — 8.6% | |
| CNX Gas Corp.(1)(2) | | | 40,000 | | | $ | 1,276,800 | | |
| ConocoPhillips | | | 42,000 | | | | 3,568,320 | | |
| Goodrich Petroleum Corp.(1)(2) | | | 1,000 | | | | 33,210 | | |
| Hess Corp. | | | 93,400 | | | | 6,688,374 | | |
| Massey Energy Co. | | | 36,000 | | | | 1,140,480 | | |
| Occidental Petroleum Corp. | | | 21,000 | | | | 1,450,050 | | |
| Peabody Energy Corp. | | | 22,500 | | | | 1,254,375 | | |
| Quicksilver Resources, Inc.(1)(2) | | | 61,000 | | | | 3,477,000 | | |
| Rosetta Resources, Inc.(1) | | | 100 | | | | 1,900 | | |
| W&T Offshore, Inc. | | | 1,000 | | | | 26,820 | | |
| | | | | | | $ | 18,917,329 | | |
| Personal Products — 0.9% | |
| Herbalife, Ltd. | | | 44,730 | | | $ | 1,972,146 | | |
| | | | | | | $ | 1,972,146 | | |
| Pharmaceuticals — 5.0% | |
| Elan Corp. PLC Sponsored ADR(1)(2) | | | 189,000 | | | $ | 4,498,200 | | |
| Flamel Technologies SA Sponsored ADR(1) | | | 100 | | | | 946 | | |
| Ipsen SA | | | 14,500 | | | | 826,206 | | |
| Shire Pharmaceuticals Group PLC ADR | | | 75,000 | | | | 5,636,250 | | |
| | | | | | | $ | 10,961,602 | | |
See notes to financial statements
18
Tax-Managed Multi-Cap Growth Portfolio as of October 31, 2007
PORTFOLIO OF INVESTMENTS CONT'D
| Security | | Shares | | Value | |
| Real Estate Investment Trusts (REITs) — 4.4% | |
| Annaly Capital Management, Inc.(2) | | | 528,396 | | | $ | 9,030,288 | | |
| MFA Mortgage Investments, Inc.(2) | | | 66,221 | | | | 566,852 | | |
| | | | | | | $ | 9,597,140 | | |
| Real Estate Management & Development — 0.0% | |
| Move, Inc.(1) | | | 1,013 | | | $ | 2,573 | | |
| | | | | | | $ | 2,573 | | |
| Semiconductors & Semiconductor Equipment — 6.2% | |
| Atheros Communications, Inc.(1)(2) | | | 127,000 | | | $ | 4,457,700 | | |
| Cavium Networks, Inc.(1)(2) | | | 1,800 | | | | 52,344 | | |
| MEMC Electronic Materials, Inc.(1) | | | 124,500 | | | | 9,115,890 | | |
| Tessera Technologies, Inc.(1) | | | 500 | | | | 19,095 | | |
| | | | | | | $ | 13,645,029 | | |
| Software — 0.6% | |
| Nintendo Co., Ltd. | | | 2,000 | | | $ | 1,271,039 | | |
| | | | | | | $ | 1,271,039 | | |
| Specialty Retail — 0.4% | |
| Coldwater Creek, Inc.(1)(2) | | | 500 | | | $ | 4,475 | | |
| DSW, Inc., Class A(1) | | | 500 | | | | 11,250 | | |
| GameStop Corp., Class A(1) | | | 13,000 | | | | 769,860 | | |
| | | | | | | $ | 785,585 | | |
| Textiles, Apparel & Luxury Goods — 0.6% | |
| Crocs, Inc.(1)(2) | | | 17,500 | | | $ | 1,308,125 | | |
| | | | | | | $ | 1,308,125 | | |
| Thrifts & Mortgage Finance — 0.4% | |
| BankUnited Financial Corp., Class A(2) | | | 500 | | | $ | 4,315 | | |
| Hudson City Bancorp, Inc. | | | 62,000 | | | | 970,920 | | |
| | | | | | | $ | 975,235 | | |
| Tobacco — 3.2% | |
| Loews Corp. - Carolina Group | | | 82,773 | | | $ | 7,100,268 | | |
| | | | | | | $ | 7,100,268 | | |
| Security | | Shares | | Value | |
| Wireless Telecommunication Services — 3.9% | |
| China Mobile, Ltd. ADR | | | 1,000 | | | $ | 103,680 | | |
| Leap Wireless International, Inc.(1) | | | 13,000 | | | | 927,030 | | |
| Millicom International Cellular SA(1)(2) | | | 11,677 | | | | 1,371,814 | | |
| NII Holdings, Inc., Class B(1) | | | 67,115 | | | | 3,892,670 | | |
| Philippine Long Distance Telephone Co. Sponsored ADR | | | 1,000 | | | | 68,600 | | |
| Rogers Communications, Inc., Class B | | | 41,000 | | | | 2,089,360 | | |
| | | | | | | $ | 8,453,154 | | |
Total Common Stocks
(identified cost $128,008,767) | | | | | | $ | 194,471,601 | | |
| Investment Funds — 2.6% | |
| Security | | Shares | | Value | |
| Investment Services — 2.6% | |
| iShares FTSE/Xinhua China 25 Index Fund(2) | | | 18,100 | | | $ | 3,962,271 | | |
| LYXOR CAC 40(2) | | | 22,000 | | | | 1,861,967 | | |
| | | | | | | $ | 5,824,238 | | |
Total Investment Funds
(identified cost $4,572,967) | | | | | | $ | 5,824,238 | | |
| Short-Term Investments — 28.2% | |
| Description | | Shares/Interest
(000's omitted) | | Value | |
| Eaton Vance Cash Collateral Fund, LLC, 5.28%(3)(4) | | | 42,927 | | | $ | 42,927,068 | | |
| Investment in Cash Management Portfolio, 4.83%(4) | | | 18,780 | | | | 18,779,788 | | |
Total Short-Term Investments
(identified cost $61,706,856) | | | | | | $ | 61,706,856 | | |
Total Investments — 119.7%
(identified cost $194,288,590) | | | | | | $ | 262,002,695 | | |
| Other Assets, Less Liabilities — (19.7)% | | | | | | $ | (43,071,578 | ) | |
| Net Assets — 100.0% | | | | | | $ | 218,931,117 | | |
See notes to financial statements
19
Tax-Managed Multi-Cap Growth Portfolio as of October 31, 2007
PORTFOLIO OF INVESTMENTS CONT'D
ADR - American Depository Receipt
CAC 40 - Continuous Assisted Quotation, French Stock Market Index
(1) Non-income producing security.
(2) All or a portion of these securities were on loan at October 31, 2007.
(3) The amount invested in Eaton Vance Cash Collateral Fund, LLC represents cash collateral received for securities on loan at October 31, 2007. Other Assets, Less Liabilities includes an equal and offsetting liability of the Portfolio to repay collateral amounts upon the return of loaned securities.
(4) Affiliated investment company available to Eaton Vance portfolios and funds which invests in high quality U.S. dollar denominated money market instruments. The rate shown is the annualized seven-day yield as of October 31, 2007.
See notes to financial statements
20
Tax-Managed Multi-Cap Growth Portfolio as of October 31, 2007
FINANCIAL STATEMENTS
Statement of Assets and Liabilities
As of October 31, 2007
| Assets | |
Unaffiliated investments, at value including $41,589,925
of securities on loan (identified cost, $132,581,734) | | $ | 200,295,839 | | |
| Affiliated investments, at value (identified cost, $61,706,856) | | | 61,706,856 | | |
| Cash | | | 28,409 | | |
| Receivable for investments sold | | | 5,968,943 | | |
| Dividends and interest receivable | | | 106,443 | | |
| Interest receivable from affiliated investments | | | 60,131 | | |
| Securities lending income receivable | | | 29,984 | | |
| Total assets | | $ | 268,196,605 | | |
| Liabilities | |
| Collateral for securities loaned | | $ | 42,927,068 | | |
| Payable for investments purchased | | | 6,139,367 | | |
| Payable to affiliate for investment advisory fees | | | 110,550 | | |
| Payable to affiliate for Trustees' fees | | | 1,102 | | |
| Accrued expenses | | | 87,401 | | |
| Total liabilities | | $ | 49,265,488 | | |
| Net Assets applicable to investors' interest in Portfolio | | $ | 218,931,117 | | |
| Sources of Net Assets | |
| Net proceeds from capital contributions and withdrawals | | $ | 151,217,012 | | |
| Net unrealized appreciation (computed on the basis of identified cost) | | | 67,714,105 | | |
| Total | | $ | 218,931,117 | | |
Statement of Operations
For the Year Ended
October 31, 2007
| Investment Income | |
| Dividends (net of foreign taxes, $22,414) | | $ | 4,485,591 | | |
| Interest | | | 14,640 | | |
| Interest income allocated from affiliated investments | | | 554,086 | | |
| Security lending income, net | | | 202,869 | | |
| Expenses allocated from affiliated investments | | | (51,828 | ) | |
| Total investment income | | $ | 5,205,358 | | |
| Expenses | |
| Investment adviser fee | | $ | 1,094,912 | | |
| Trustees' fees and expenses | | | 11,266 | | |
| Custodian fee | | | 112,770 | | |
| Legal and accounting services | | | 34,765 | | |
| Miscellaneous | | | 7,745 | | |
| Total expenses | | $ | 1,261,458 | | |
Deduct —
Reduction of custodian fee | | $ | 25 | | |
| Total expense reductions | | $ | 25 | | |
| Net expenses | | $ | 1,261,433 | | |
| Net investment income | | $ | 3,943,925 | | |
| Realized and Unrealized Gain (Loss) | |
Net realized gain (loss) —
Investment transactions | | $ | 32,214,023 | | |
| Foreign currency transactions | | | 18,861 | | |
| Net realized gain | | $ | 32,232,884 | | |
Change in unrealized appreciation (depreciation) —
Investments | | $ | 29,932,482 | | |
| Net change in unrealized appreciation (depreciation) | | $ | 29,932,482 | | |
| Net realized and unrealized gain | | $ | 62,165,366 | | |
| Net increase in net assets from operations | | $ | 66,109,291 | | |
See notes to financial statements
21
Tax-Managed Multi-Cap Growth Portfolio as of October 31, 2007
FINANCIAL STATEMENTS CONT'D
Statements of Changes in Net Assets
Increase (Decrease)
in Net Assets | | Year Ended
October 31, 2007 | | Year Ended
October 31, 2006 | |
| From operations — | |
| Net investment income | | $ | 3,943,925 | | | $ | 849,450 | | |
Net realized gain from investment
and foreign currency transactions | | | 32,232,884 | | | | 2,581,130 | | |
Net change in unrealized
appreciation (depreciation)
from investments and foreign currency | | | 29,932,482 | | | | 23,593,390 | | |
| Net increase in net assets from operations | | $ | 66,109,291 | | | $ | 27,023,970 | | |
Capital transactions —
Contributions | | $ | 21,049,018 | | | $ | 8,380,760 | | |
| Withdrawals | | | (18,789,888 | ) | | | (20,616,323 | ) | |
Net increase (decrease) in net assets from
capital transactions | | $ | 2,259,130 | | | $ | (12,235,563 | ) | |
| Net increase in net assets | | $ | 68,368,421 | | | $ | 14,788,407 | | |
| Net Assets | |
| At beginning of year | | $ | 150,562,696 | | | $ | 135,774,289 | | |
| At end of year | | $ | 218,931,117 | | | $ | 150,562,696 | | |
See notes to financial statements
22
Tax-Managed Multi-Cap Growth Portfolio as of October 31, 2007
FINANCIAL STATEMENTS CONT'D
Supplementary Data
| | | Year Ended October 31, | |
| | | 2007 | | 2006 | | 2005 | | 2004 | | 2003 | |
| Ratios/Supplemental Data | |
| Ratios (As a percentage of average daily net assets): | |
| Expenses before custodian fee reduction(1) | | | 0.72 | % | | | 0.76 | % | | | 0.77 | % | | | 0.76 | % | | | 0.79 | % | |
| Expenses after custodian fee reduction(1) | | | 0.72 | % | | | 0.76 | % | | | 0.77 | % | | | 0.76 | % | | | 0.79 | % | |
| Net investment income (loss) | | | 2.24 | %(2) | | | 0.59 | % | | | 0.10 | % | | | (0.06 | )% | | | (0.54 | )% | |
| Portfolio Turnover | | | 157 | % | | | 181 | % | | | 217 | % | | | 239 | % | | | 224 | % | |
| Total Return | | | 44.75 | % | | | 20.69 | % | | | 8.71 | % | | | 4.60 | % | | | 34.80 | % | |
| Net assets, end of year (000's omitted) | | $ | 218,931 | | | $ | 150,563 | | | $ | 135,774 | | | $ | 108,894 | | | $ | 86,988 | | |
(1) The investment adviser voluntarily waived a portion of its investment advisory fee (equal to 0.01% of average net assets for 2006 and 2004, respectively).
(2) Includes special dividends equal to 1.85% of average daily net assets.
See notes to financial statements
23
Tax-Managed Multi-Cap Growth Portfolio as of October 31, 2007
NOTES TO FINANCIAL STATEMENTS
1 Significant Accounting Policies
Tax-Managed Multi-Cap Growth Portfolio (the Portfolio) (formerly Tax-Managed Multi-Cap Opportunity Portfolio) is registered under the Investment Company Act of 1940, as amended (the 1940 Act), as a diversified open-end investment management company. The Portfolio, which was organized as a trust under the laws of the State of New York on February 28, 2000, seeks to achieve long-term after-tax returns by investing in a diversified portfolio of equity securities. The Declaration of Trust permits the Trustees to issue beneficial interests in the Portfolio. At October 31, 2007, Eaton Vance Tax-Managed Multi-Cap Growth Fund and the Eaton Vance Tax-Managed Equity Asset Allocation Fund held 45.0% and 54.8% interests in the Portfolio, respectively. The following is a summary of significant accounting policies consistently followed by the Portfolio in the preparation of its financial statements. The policies are in conformity with account ing principles generally accepted in the United States of America.
A Investment Valuation — Securities listed on a U.S. securities exchange generally are valued at the last sale price on the day of valuation or, if no sales took place on such date, at the mean between the closing bid and asked prices therefore on the exchange where such securities are principally traded. Equity securities listed on the NASDAQ Global or Global Select Market generally are valued at the official NASDAQ closing price. Unlisted or listed securities for which closing sales prices or closing quotations are not available are valued at the mean between the latest available bid and asked prices or, in the case of preferred equity securities that are not listed or traded in the over-the-counter market, by an independent pricing service. Exchange-traded options are valued at the last sale price for the day of valuation as quoted on the principal exchange or board of trade on which the options are traded or, in the absence of sales on such date, at the mean between the latest bid and asked prices therefore. Futures positions on securities and currencies generally are valued at closing settlement prices. Short-term debt securities with a remaining maturity of 60 days or less are valued at amortized cost. If short-term debt securities are acquired with a remaining maturity of more than 60 days, they will be valued by a pricing service. Other fixed income and debt securities, including listed securities and securities for which price quotations are available, will normally be valued on the basis of valuations furnished by a pricing service. Foreign securities and currencies are valued in U.S. dollars, based on foreign currency exchange rate quotations supplied by an independent quotation service. The daily valuation of exchange traded foreign securities generally is determ ined as of the close of trading on the principal exchange on which such securities trade. Events occurring after the close of trading on foreign exchanges may result in adjustments to the valuation of foreign securities to more accurately reflect their fair value as of the close of regular trading on the New York Stock Exchange. When valuing foreign equity securities that meet certain criteria, the Trustees have approved the use of a fair value service that values such securities to reflect market trading that occurs after the close of the applicable foreign markets of comparable securities or other instruments that have a strong correlation to the fair valued securities. Investments held by the Portfolio for which valuations or market quotations are unavailable are valued at fair value using methods determined in good faith by or at the direction of the Trustees of the Portfolio considering relevant factors, data and information includi ng the market value of freely tradable securities of the same class in the principal market on which such securities are normally traded.
The Portfolio may invest in Cash Management Portfolio (Cash Management) and Eaton Vance Cash Collateral Fund, LLC (Cash Collateral Fund), affiliated investment companies managed by Boston Management and Research (BMR), a subsidiary of Eaton Vance Management (EVM). Cash Management values its investment securities utilizing the amortized cost valuation technique permitted by Rule 2a-7 of the 1940 Act. This technique involves initially valuing a portfolio security at its cost and thereafter assuming a constant amortization to maturity of any discount or premium. Investments in Cash Collateral Fund are valued at the net asset value per share on the valuation date.
B Income — Dividend income is recorded on the ex-dividend date for dividends received in cash and/or securities. However, if the ex-dividend date has passed, certain dividends from foreign securities are recorded as the Portfolio is informed of the ex-dividend date. Withholding taxes on foreign dividends and capital gains have been provided for in accordance with the Portfolio's understanding of the applicable countries' tax rules and rates. Interest income is recorded on the basis of interest accrued, adjusted for amortization of premium or accretion of discount.
C Federal Taxes — The Portfolio has elected to be treated as a partnership for federal tax purposes. No provision is made by the Portfolio for federal or state taxes on any taxable income of the Portfolio because each investor in the Portfolio is ultimately responsible for the payment of any taxes on its share of taxable income. Since at least one of the Portfolio's investors is a regulated investment company that invests all or substantially all of its assets in the Portfolio, the Portfolio normally must
24
Tax-Managed Multi-Cap Growth Portfolio as of October 31, 2007
NOTES TO FINANCIAL STATEMENTS CONT'D
satisfy the applicable source of income and diversification requirements (under the Internal Revenue Code) in order for its investors to satisfy them. The Portfolio will allocate, at least annually among its investors, each investor's distributive share of the Portfolio's net investment income, net realized capital gains, and any other items of income, gain, loss, deduction or credit.
D Expense Reduction — State Street Bank and Trust Company (SSBT) serves as custodian of the Portfolio. Pursuant to the custodian agreement, SSBT receives a fee reduced by credits, which are determined based on the average daily cash balance the Portfolio maintains with SSBT. All credit balances, if any, used to reduce the Portfolio's custodian fees are reported as a reduction of expenses in the Statement of Operations.
E Foreign Currency Translation — Investment valuations, other assets, and liabilities initially expressed in foreign currencies are converted each business day into U.S. dollars based upon current exchange rates. Purchases and sales of foreign investment securities and income and expenses are converted into U.S. dollars based upon currency exchange rates prevailing on the respective dates of such transactions. Recognized gains or losses on investment transactions attributable to changes in foreign currency exchange rates are recorded for financial statement purposes as net realized gains and losses on investments. That portion of unrealized gains and losses on investments that results from fluctuations in foreign currency exchange rates is not separately disclosed.
F Use of Estimates — The preparation of the financial statements in conformity with accounting principles generally accepted in the United States of America requires management to make estimates and assumptions that affect the reported amounts of assets and liabilities at the date of the financial statements and the reported amounts of income and expense during the reporting period. Actual results could differ from those estimates.
G Indemnifications — Under the Portfolio's organizational documents, its officers and Trustees may be indemnified against certain liabilities and expenses arising out of the performance of their duties to the Portfolio. Interestholders in the Portfolio are jointly and severally liable for the liabilities and obligations of the Portfolio in the event that the Portfolio fails to satisfy such liabilities and obligations; provided, however, that, to the extent assets are available in the Portfolio, the Portfolio may, under certain circumstances, indemnify interestholders from and against any claim or liability to which such holder may become subject by reason of being or having been an interestholder in t he Portfolio. Additionally, in the normal course of business, the Portfolio enters into agreements with service providers that may contain indemnification clauses. The Portfolio's maximum exposure under these arrangements is unknown as this would involve future claims that may be made against the Portfolio that have not yet occurred.
H Financial Futures Contract — The Portfolio may enter into financial futures contracts. The Portfolio's investment in financial futures contracts is designed for hedging against changes in interest rates or as a substitute for the purchase of securities. Upon entering into a financial futures contract, the Portfolio is required to deposit with the broker, either in cash or securities an amount equal to a certain percentage of the purchase price (initial margin). Subsequent payments, known as variation margin, are made or received by the Portfolio each business day, depending on the daily fluctuations in the value of the underlying security, and are recorded as unrealized gains or losses by the Portfolio. Gains (losses) are realized upon the expiration or closing of the f inancial futures contracts. Should market conditions change unexpectedly, the Portfolio may not achieve the anticipated benefits of the financial futures contracts and may realize a loss. In entering such contracts, the Portfolio bears the risk if the counterparties do not perform under the contracts' terms.
I Purchased Options — Upon the purchase of a call or put option, the premium paid by the Portfolio is included in the Statement of Assets and Liabilities as an investment. The amount of the investment is subsequently marked-to-market to reflect the current market value of the option purchased, in accordance with the Portfolio's policies on investment valuations discussed above. If an option which the Portfolio has purchased expires on the stipulated expiration date, the Portfolio will realize a loss in the amount of the cost of the option. If the Portfolio enters into a closing sale transaction, the Portfolio will realize a gain or loss, depending on whether the sales proceeds from the closing sale transaction are greater or less than the cost of the option. If the Portfo lio exercises a put option, it will realize a gain or loss from the sale of the underlying security, and the proceeds from such sale will be decreased by the premium originally paid. If the Portfolio exercises a call option, the cost of the security which the Portfolio purchases upon exercise will be increased by the premium originally paid.
J Securities Sold Short — The Portfolio may sell a security short if it owns at least an equal amount of the security sold short or another security exchangeable for an
25
Tax-Managed Multi-Cap Growth Portfolio as of October 31, 2007
NOTES TO FINANCIAL STATEMENTS CONT'D
equal amount of the security sold short without payment of further compensation (a short sale against the box) in anticipation of a decline in the market price of the securities or in order to hedge portfolio positions. The Portfolio will generally borrow the security sold in order to make the delivery to the buyer. Upon executing the transaction, the Portfolio records the proceeds as deposits with brokers in the Statement of Assets and Liabilities and establishes an offsetting payable for securities sold short for the securities due on settlement. The proceeds are retained by the broker as collateral for the short position. The liability is marked-to-market on a daily basis and the Portfolio is required to pay the lending broker any dividend or interest income earned while the short position is open. A gain or loss is recorded when the security is delivered to the broker. The Portfolio may recognize a loss on the transaction if the market value of the securities sold increases before the securities are delivered.
K Other — Investment transactions are accounted for on the date the securities are purchased or sold. Realized gains and losses on securities sold are determined on the basis of identified cost.
2 Investment Adviser Fee and Other Transactions with Affiliates
The investment adviser fee is earned by BMR as compensation for management and investment advisory services rendered to the Portfolio. Pursuant to the advisory agreement, BMR receives a monthly fee at the annual rate of 0.65% of the Portfolio's average daily net assets up to $500 million and at reduced rates as daily net assets exceed that level. The portion of the advisory fee payable by Cash Management on the Portfolio's investment of cash therein is credited against the Portfolio's advisory fees. For the year ended October 31, 2007, the Portfolio's advisory fee totaled $1,144,856, of which $49,944 was allocated from Cash Management and $1,094,912 was paid or accrued directly by the Portfolio. For the year ended October 31, 2007, the Portfolio's advisory fee, including the portion allocated from Cash Management, was 0.65% of the Portfolio's average daily net assets. Except as to the Trustees of the Portfolio who are not member s of EVM's or BMR's organizations, officers and Trustees receive remuneration for their services to the Portfolio out of such investment adviser fee. Certain officers and Trustees of the Portfolio are officers of the above organizations. Trustees of the Portfolio that are not affiliated with the investment adviser may elect to defer receipt of all or a percentage of their annual fees in accordance with the terms of the Trustees Deferred Compensation Plan. For the year ended October 31, 2007, no significant amounts have been deferred.
3 Investment Transactions
Purchases and sales of investments, other than short-term obligations, aggregated $261,091,822 and $262,877,560, respectively, for the year ended October 31, 2007.
4 Federal Income Tax Basis of Unrealized Appreciation (Depreciation)
The cost and unrealized appreciation (depreciation) in value of the investments owned at October 31, 2007 as determined on a federal income tax basis, were as follows:
| Aggregate cost | | $ | 194,686,052 | | |
| Gross unrealized appreciation | | $ | 67,657,134 | | |
| Gross unrealized depreciation | | | (340,491 | ) | |
| Net unrealized appreciation | | $ | 67,316,643 | | |
5 Financial Instruments
The Portfolio may trade in financial instruments with off-balance sheet risk in the normal course of its investing activities to assist in managing exposure to various market risks. These financial instruments may include written options and financial futures contracts and may involve, to a varying degree, elements of risk in excess of the amounts recognized for financial statement purposes. The notional or contractual amounts of these instruments represent the investment the Portfolio has in particular classes of financial instruments and does not necessarily represent the amounts potentially subject to risk. The measurement of the risks associated with these instruments is meaningful only when all related and offsetting transactions are considered. The Portfolio did not have any open obligations under these financial instruments at October 31, 2007.
6 Line of Credit
The Portfolio participates with other portfolios and funds managed by EVM and its affiliates in a $200 million unsecured line of credit agreement with a group of banks. Borrowings will be made by the Portfolio solely to facilitate the handling of unusual and/or unanticipated short-term cash requirements. Interest is charged to the Portfolio based on its borrowings at an amount above either the Eurodollar rate or Federal Funds rate. In addition, a fee computed at an annual rate of 0.07% on the daily unused portion of the line of credit is allocated among the participating portfolios and funds at the end of each quarter. The Portfolio did not have any significant borrowings or allocated fees during the year ended October 31, 2007.
26
Tax-Managed Multi-Cap Growth Portfolio as of October 31, 2007
NOTES TO FINANCIAL STATEMENTS CONT'D
7 Securities Lending Agreement
The Portfolio has established a securities lending agreement with SSBT as securities lending agent in which the Portfolio lends portfolio securities to qualified borrowers in exchange for collateral consisting of either cash or U.S. government securities in an amount at least equal to the market value of the securities on loan. Cash collateral is invested in Cash Collateral Fund. The Portfolio earns interest on the amount invested in Cash Collateral Fund but it must pay the broker a loan rebate fee computed as a varying percentage of the collateral received. The loan rebate fee paid by the Portfolio amounted to $2,067,133 for the year ended October 31, 2007. At October 31, 2007, the value of the securities loaned and the value of the collateral amounted to $41,589,925 and $42,927,068, respectively. In the event of counterparty default, the Portfolio is subject to potential loss if it is delayed or prevented from exercising its r ight to dispose of the collateral. The Portfolio bears risk in the event that invested collateral is not sufficient to meet obligations due on loans.
8 Recently Issued Accounting Pronouncements
In June 2006, the Financial Accounting Standards Board (FASB) issued FASB Interpretation No. 48 (FIN 48), "Accounting for Uncertainty in Income Taxes – an interpretation of FASB Statement No. 109". FIN 48 clarifies the accounting for uncertainty in income taxes recognized in accordance with FASB Statement No. 109, "Accounting for Income Taxes". This interpretation prescribes a recognition threshold and measurement attribute for the financial statement recognition and measurement of a tax position taken or expected to be taken in a tax return. It also provides guidance on de-recognition, classification, interest and penalties, accounting in interim periods, disclosure and transition. FIN 48 is effective on the last business day of the first required financial reporting period for fiscal years beginning after December 15, 2006. Management is currently evaluating the impact of applying the various provisions of FIN 48.
In September 2006, the FASB issued Statement of Financial Accounting Standards No. 157 (FAS 157), "Fair Value Measurements". FAS 157 defines fair value, establishes a framework for measuring fair value in accordance with generally accepted accounting principles and expands disclosure about fair value measurements. FAS 157 is effective for fiscal years beginning after November 15, 2007. Management is currently evaluating the impact the adoption of FAS 157 will have on the Portfolio's financial statement disclosures.
27
Tax-Managed Multi-Cap Growth Portfolio as of October 31, 2007
REPORT OF INDEPENDENT REGISTERED PUBLIC ACCOUNTING FIRM
To the Trustees and Investors of
Tax-Managed Multi-Cap Growth Portfolio:
We have audited the accompanying statement of assets and liabilities of Tax-Managed Multi-Cap Growth Portfolio (the "Portfolio") (formerly Tax-Managed Multi-Cap Opportunity Portfolio), including the portfolio of investments, as of October 31, 2007, and the related statement of operations for the year then ended, the statements of changes in net assets for each of the two years in the period then ended, and the supplementary data for each of the five years in the period then ended. These financial statements and supplementary data are the responsibility of the Portfolio's management. Our responsibility is to express an opinion on these financial statements and supplementary data based on our audits.
We conducted our audits in accordance with standards of the Public Company Accounting Oversight Board (United States). Those standards require that we plan and perform the audit to obtain reasonable assurance about whether the financial statements and supplementary data are free of material misstatement. The Portfolio is not required to have, nor were we engaged to perform, an audit of its internal control over financial reporting. Our audits included consideration of internal control over financial reporting as a basis for designing audit procedures that are appropriate in the circumstances, but not for the purpose of expressing an opinion on the effectiveness of the Portfolio's internal control over financial reporting. Accordingly, we express no such opinion. An audit also includes examining, on a test basis, evidence supporting the amounts and disclosures in the financial statements, assessing the accounting principles used and significant estimates made by management, as well as evaluating the overall financial statement presentation. Our procedures included confirmation of securities owned as of October 31, 2007, by correspondence with the custodian and brokers; where replies were not received from brokers, we performed other auditing procedures. We believe that our audits provide a reasonable basis for our opinion.
In our opinion, the financial statements and supplementary data referred to above present fairly, in all material respects, the financial position of Tax-Managed Multi-Cap Growth Portfolio as of October 31, 2007, the results of its operations for the year then ended, the changes in its net assets for each of the two years in the period then ended, and the supplementary data for each of the five years in the period then ended, in conformity with accounting principles generally accepted in the United States of America.
DELOITTE & TOUCHE LLP
Boston, Massachusetts
December 14, 2007
28
Eaton Vance Tax-Managed Multi-Cap Growth Fund
BOARD OF TRUSTEES' ANNUAL APPROVAL OF THE INVESTMENT ADVISORY AGREEMENT
Overview of the Contract Review Process
The Investment Company Act of 1940, as amended (the "1940 Act"), provides, in substance, that each investment advisory agreement between a fund and its investment adviser will continue in effect from year to year only if its continuance is approved at least annually by the fund's board of trustees, including by a vote of a majority of the trustees who are not "interested persons" of the fund ("Independent Trustees"), cast in person at a meeting called for the purpose of considering such approval.
At a meeting of the Boards of Trustees (each a "Board") of the Eaton Vance group of mutual funds (the "Eaton Vance Funds") held on April 23, 2007, the Board, including a majority of the Independent Trustees, voted to approve continuation of existing advisory and sub-advisory agreements for the Eaton Vance Funds for an additional one-year period. In voting its approval, the Board relied upon the affirmative recommendation of the Special Committee of the Board, which is a committee comprised exclusively of Independent Trustees. Prior to making its recommendation, the Special Committee reviewed information furnished for a series of meetings of the Special Committee held in February, March and April 2007. Such information included, among other things, the following:
Information about Fees, Performance and Expenses
• An independent report comparing the advisory and related fees paid by each fund with fees paid by comparable funds;
• An independent report comparing each fund's total expense ratio and its components to comparable funds;
• An independent report comparing the investment performance of each fund to the investment performance of comparable funds over various time periods;
• Data regarding investment performance in comparison to relevant peer groups of funds and appropriate indices;
• Comparative information concerning fees charged by each adviser for managing other mutual funds and institutional accounts using investment strategies and techniques similar to those used in managing the fund;
• Profitability analyses for each adviser with respect to each fund;
Information about Portfolio Management
• Descriptions of the investment management services provided to each fund, including the investment strategies and processes employed;
• Information concerning the allocation of brokerage and the benefits received by each adviser as a result of brokerage allocation, including information concerning the acquisition of research through "soft dollar" benefits received in connection with the funds' brokerage, and the implementation of a soft dollar reimbursement program established with respect to the funds;
• Data relating to portfolio turnover rates of each fund;
• The procedures and processes used to determine the fair value of fund assets and actions taken to monitor and test the effectiveness of such procedures and processes;
Information about each Adviser
• Reports detailing the financial results and condition of each adviser;
• Descriptions of the qualifications, education and experience of the individual investment professionals whose responsibilities include portfolio management and investment research for the funds, and information relating to their compensation and responsibilities with respect to managing other mutual funds and investment accounts;
• Copies of the Codes of Ethics of each adviser and its affiliates, together with information relating to compliance with and the administration of such codes;
• Copies of or descriptions of each adviser's proxy voting policies and procedures;
• Information concerning the resources devoted to compliance efforts undertaken by each adviser and its affiliates on behalf of the funds (including descriptions of various compliance programs) and their record of compliance with investment policies and restrictions, including policies with respect to market-timing, late trading and selective portfolio disclosure, and with policies on personal securities transactions;
• Descriptions of the business continuity and disaster recovery plans of each adviser and its affiliates;
Other Relevant Information
• Information concerning the nature, cost and character of the administrative and other non-investment management services provided by Eaton Vance Management and its affiliates;
• Information concerning management of the relationship with the custodian, subcustodians and fund accountants by each adviser or the funds' administrator; and
• The terms of each advisory agreement.
29
Eaton Vance Tax-Managed Multi-Cap Growth Fund
BOARD OF TRUSTEES' ANNUAL APPROVAL OF THE INVESTMENT ADVISORY AGREEMENT CONT'D
In addition to the information identified above, the Special Committee considered information provided from time to time by each adviser throughout the year at meetings of the Board and its committees. Over the course of the twelve-month period ended April 30, 2007, the Board met ten times and the Special Committee, the Audit Committee and the Governance Committee, each of which is a Committee comprised solely of Independent Trustees, met twelve, fourteen and eight times, respectively. At such meetings, the Trustees received, among other things, presentations by the portfolio managers and other investment professionals of each adviser relating to the investment performance of each fund and the investment strategies used in pursuing the fund's investment objective.
For funds that invest through one or more underlying portfolios, the Board considered similar information about the portfolio(s) when considering the approval of advisory agreements. In addition, in cases where the fund's investment adviser has engaged a sub-adviser, the Board considered similar information about the sub-adviser when considering the approval of any sub-advisory agreement.
The Special Committee was assisted throughout the contract review process by Goodwin Procter LLP, legal counsel for the Independent Trustees. The members of the Special Committee relied upon the advice of such counsel and their own business judgment in determining the material factors to be considered in evaluating each advisory and sub-advisory agreement and the weight to be given to each such factor. The conclusions reached with respect to each advisory and sub-advisory agreement were based on a comprehensive evaluation of all the information provided and not any single factor. Moreover, each member of the Special Committee may have placed varying emphasis on particular factors in reaching conclusions with respect to each advisory and sub-advisory agreement.
Results of the Process
Based on its consideration of the foregoing, and such other information as it deemed relevant, including the factors and conclusions described below, the Special Committee concluded that the continuance of the investment advisory agreement of the Tax-Managed Multi-Cap Opportunity Portfolio (the "Portfolio"), the portfolio in which the Eaton Vance Tax-Managed Multi-Cap Opportunity Fund (the "Fund") invests, with Boston Management and Research (the "Adviser"), including its fee structure, is in the interests of shareholders and, therefore, the Special Committee recommended to the Board approval of the agreement. The Board accepted the recommendation of the Special Committee as well as the factors considered and conclusions reached by the Special Committee with respect to the agreement. Accordingly, the Board, including a majority of the Independent Trustees, voted to approve continuation of the investment advisory agreement for th e Portfolio.
Nature, Extent and Quality of Services
In considering whether to approve the investment advisory agreement of the Portfolio, the Board evaluated the nature, extent and quality of services provided to the Portfolio by the Adviser.
The Board considered the Adviser's management capabilities and investment process with respect to the types of investments held by the Portfolio, including the education, experience and number of its investment professionals and other personnel who provide portfolio management, investment research, and similar services to the Portfolio. The Board specifically noted the Adviser's in-house equity research capabilities and experience in managing funds that seek to maximize after-tax returns. The Board also took into account the resources dedicated to portfolio management and other services, including the compensation paid to recruit and retain investment personnel, and the time and attention devoted to the Portfolio by senior management.
The Board reviewed the compliance programs of the Adviser and relevant affiliates thereof. Among other matters, the Board considered compliance and reporting matters relating to personal trading by investment personnel, selective disclosure of portfolio holdings, late trading, frequent trading, portfolio valuation, business continuity and the allocation of investment opportunities. The Board also evaluated the responses of the Adviser and its affiliates to requests from regulatory authorities such as the Securities and Exchange Commission and the National Association of Securities Dealers.
The Board considered shareholder and other administrative services provided or managed by Eaton Vance Management and its affiliates, including transfer agency and accounting services. The Board evaluated the benefits to shareholders of investing in a fund that is a part of a large family of funds, including the ability, in many cases, to exchange an investment among different funds without incurring additional sales charges.
After consideration of the foregoing factors, among others, the Board concluded that the nature, extent and quality of services provided by the Adviser, taken as a whole, are appropriate and consistent with the terms of the investment advisory agreement.
30
Eaton Vance Tax-Managed Multi-Cap Growth Fund
BOARD OF TRUSTEES' ANNUAL APPROVAL OF THE INVESTMENT ADVISORY AGREEMENT CONT'D
Fund Performance
The Board compared the Fund's investment performance to a relevant universe of similarly managed funds identified by an independent data provider and appropriate benchmark indices. The Board reviewed comparative performance data for the one-, three- and five-year periods ended September 30, 2006 for the Fund. The Board concluded that performance of the Fund was satisfactory.
Management Fees and Expenses
The Board reviewed contractual investment advisory fee rates, including any administrative fee rates, payable by the Fund (referred to collectively as "management fees"). As part of its review, the Board considered the management fees (including administrative fees) and the Fund's total expense ratio for the one-year period ended September 30, 2006, as compared to a group of similarly managed funds selected by an independent data provider.
After reviewing the foregoing information, and in light of the nature, extent and quality of the services provided by the Adviser, the Board concluded that the management fees charged for advisory and related services and the Fund's total expense ratio are reasonable.
Profitability
The Board reviewed the level of profits realized by the Adviser and relevant affiliates thereof in providing investment advisory and administrative services to the Fund, the Portfolio and all Eaton Vance Funds as a group. The Board considered the level of profits realized without regard to revenue sharing or other payments by the Adviser and its affiliates to third parties in respect of distribution services. The Board also considered other direct or indirect benefits received by the Adviser and its affiliates in connection with its relationship with the Fund and the Portfolio, including the benefits of research services that may be available to the Adviser as a result of securities transactions effected for the Portfolio and other advisory clients.
The Board concluded that, in light of the foregoing factors and the nature, extent and quality of the services rendered, the profits realized by the Adviser and its affiliates are reasonable.
Economies of Scale
In reviewing management fees and profitability, the Board also considered the extent to which the Adviser and its affiliates, on the one hand, and the Fund, on the other hand, can expect to realize benefits from economies of scale as the assets of the Fund and the Portfolio increase. The Board acknowledged the difficulty in accurately measuring the benefits resulting from the economies of scale with respect to the management of any specific fund or group of funds. The Board reviewed data summarizing the increases and decreases in the assets of the Fund and of all Eaton Vance Funds as a group over various time periods, and evaluated the extent to which the total expense ratio of the Fund and the profitability of the Adviser and its affiliates may have been affected by such increases or decreases. Based upon the foregoing, the Board concluded that the benefits from economies of scale are currently being shared equitably by the Adv iser and its affiliates and the Fund. The Board also concluded that, assuming reasonably foreseeable increases in the assets of the Portfolio, the structure of the advisory fee, which includes breakpoints at several asset levels, can be expected to cause the Adviser and its affiliates and the Fund to continue to share such benefits equitably.
31
Eaton Vance Tax-Managed Multi-Cap Growth Fund
MANAGEMENT AND ORGANIZATION
Fund Management. The Trustees of Eaton Vance Mutual Funds Trust (the Trust) and Tax-Managed Multi-Cap Growth Portfolio (the Portfolio) are responsible for the overall management and supervision of the Trust's and Portfolio's affairs. The Trustees and officers of the Trust and the Portfolio are listed below. Except as indicated, each individual has held the office shown or other offices in the same company for the last five years. Trustees and officers of the Trust and the Portfolio hold indefinite terms of office. The "noninterested Trustees" consist of those Trustees who are not "interested persons" of the Trust and the Portfolio, as that term is defined under the 1940 Act. The business address of each Trustee and officer is The Eaton Vance Building, 255 State Street, Boston, Massachusetts 02109. As used below, "EVC" refers to Eaton Vance Corp., "EV" refers to Eaton Vance, Inc., "EVM" refers to Eaton Vance Management, "BMR" refers to Boston Management and Research, "Parametric" refers to Parametric Portfolio Associates and "EVD" refers to Eaton Vance Distributors, Inc. EVC and EV are the corporate parent and trustee, respectively, of EVM and BMR. EVD is the Fund's principal underwriter, the Portfolio's placement agent and wholly-owned subsidiary of EVM. Each officer affiliated with Eaton Vance may hold a position with other Eaton Vance affiliates that is comparable to his or her position with EVM listed below.
Name and
Date of Birth | | Position(s)
with the
Trust and
the Portfolio | | Term of
Office and
Length of
Service | | Principal Occupation(s)
During Past Five Years | | Number of Portfolios
in Fund Complex
Overseen By
Trustee(1) | | Other Directorships Held | |
| Interested Trustee | | | | | | | | | | | | | |
|
| Thomas E. Faust Jr. 5/31/58 | | Trustee and President of the Trust | | Trustee since 2007 and President of the Trust since 2002 | | Chairman, Chief Executive Officer and President of EVC, President of EV, Chief Executive Officer and President of EVM and BMR, and Director of EVD. Trustee and/or Officer of 176 registered investment companies and 5 private investment companies in the Eaton Vance Fund Complex. Mr. Faust is an interested person because of his positions with EVM, BMR, EVC and EV which are affiliates of the Trust and Portfolio. | | | 176 | | | Director of EVC | |
|
| Noninterested Trustee(s) | | | | | | | | | | | | | |
|
| Benjamin C. Esty 1/2/63 | | Trustee | | Since 2005 | | Roy and Elizabeth Simmons Professor of Business Administration, Harvard University Graduate School of Business Administration (since 2003). Formerly, Associate Professor, Harvard University Graduate School of Business Administration (2000-2003). | | | 176 | | | None | |
|
| Allen R. Freedman 4/3/40 | | Trustee | | Since 2007 | | Former Chairman and Chief Executive Officer of Assurant, Inc. (insurance provider) (1978-2000). | | | 175 | | | Direct or Assurant, Inc. and Stonernor Partners L.P. (owner and operator of cemeteries) | |
|
| William H. Park 9/19/47 | | Trustee | | Since 2003 | | Vice Chairman, Commercial Industrial Finance Corp. (specialty finance company) (since 2006). Formerly, President and Chief Executive Officer, Prizm Capital Management, LLC (investment management firm) (since 2002-2005). | | | 176 | | | None | |
|
| Ronald A. Pearlman 7/10/40 | | Trustee | | Since 2003 | | Professor of Law, Georgetown University Law Center. | | | 176 | | | None | |
|
| Norton H. Reamer 9/21/35 | | Trustee | | Trustee of the Trust since 1986 and of the Portfolio since 2000 | | President, Chief Executive Officer and a Director of Asset Management Finance Corp. (a specialty finance company serving the investment management industry) (since October 2003). President, Unicorn Corporation (an investment and financial advisory services company) (since September 2000). Formerly, Chairman and Chief Operating Officer, Hellman, Jordan Management Co., Inc. (an investment management company) (2000-2003). Formerly, Advisory Director of Berkshire Capital Corporation (investment banking firm) (2002-2003). | | | 176 | | | None | |
|
32
Eaton Vance Tax-Managed Multi-Cap Growth Fund
MANAGEMENT AND ORGANIZATION CONT'D
Name and
Date of Birth | | Position(s)
with the
Trust and
the Portfolio | | Term of
Office and
Length of
Service | | Principal Occupation(s)
During Past Five Years | | Number of Portfolios
in Fund Complex
Overseen By
Trustee(1) | | Other Directorships Held | |
| Noninterested Trustee(s) (continued) | | | | | | | | | | | | | |
|
| Heidi L. Steiger 7/8/53 | | Trustee | | Since 2007 | | President, Lowenhaupt Global Advisors, LLC (global wealth management firm) (since 2005); Formerly, President and Contributing Editor, Worth Magazine (2004); Formerly, Executive Vice President and Global Head of Private Asset Management (and various other positions), Neuberger Berman (investment firm) (1986-2004). | | | 173 | | | Direct of Nuclear Electric Insurance Ltd. (nuclear insurance provider) and Aviva USA (insurance provider) | |
|
| Lynn A. Stout 9/14/57 | | Trustee | | Trustee of the Trust since 1998; of the Portfolio since 2000 | | Paul Hastings Professor of Corporate and Securities Law, University of California at Los Angeles School of Law. | | | 176 | | | None | |
|
| Ralph F. Verni 1/26/43 | | Chairman of the Board and Trustee | | Chairman of the Board since 2007 and Trustee since 2005 | | Consultant and private investor. | | | 176 | | | None | |
|
| Principal Officers who are not Trustees | | | | | | | |
|
Name and
Date of Birth | | Position(s)
with the
Trust and
the Portfolio | | Term of
Office and
Length of
Service | | Principal Occupation(s)
During Past Five Years | |
| William H. Ahern, Jr. 7/28/59 | | Vice President of the Trust | | Since 1995 | | Vice President of EVM and BMR. Officer of 74 registered investment companies managed by EVM or BMR. | |
|
| Cynthia J. Clemson 3/2/63 | | Vice President of the Trust | | Since 2005 | | Vice President of EVM and BMR. Officer of 89 registered investment companies managed by EVM or BMR. | |
|
Arieh Coll
11/9/63 | | Vice President of the Portfolio | | Since 2000 | | Vice President of EVM and BMR. Officer of 4 registered investment companies managed by EVM or BMR. | |
|
| Charles B. Gaffney 12/4/72 | | Vice President of the Trust | | Since 2007 | | Vice President of EVM and BMR. Previously, Sector Portfolio Manager and Senior Equity Analyst of Brown Brothers Harriman (1997-2003). Officer of 29 registered investment companies managed by EVM or BMR. | |
|
| Christine M. Johnston 11/9/72 | | Vice President of the Trust | | Since 2007 | | Vice President of EVM and BMR. Officer of 34 registered investment companies managed by EVM or BMR. | |
|
| Aamer Khan 6/7/60 | | Vice President of the Trust | | Since 2005 | | Vice President of EVM and BMR. Officer of 32 registered investment companies managed by EVM or BMR. | |
|
| Thomas H. Luster 4/8/62 | | Vice President of the Trust | | Since 2006 | | Vice President of EVM and BMR. Officer of 48 registered investment companies managed by EVM or BMR. | |
|
| Michael R. Mach 7/15/47 | | Vice President of the Trust | | Since 1999 | | Vice President of EVM and BMR. Officer of 54 registered investment companies managed by EVM or BMR. | |
|
| Robert B. MacIntosh 1/22/57 | | Vice President of the Trust | | Since 1998 | | Vice President of EVM and BMR. Officer of 89 registered investment companies managed by EVM or BMR. | |
|
| Duncan W. Richardson 10/26/57 | | Vice President of the Trust and President of the Portfolio | | Vice President of the Trust since 2001and President of the Portfolio since 2002 | | Executive Vice President and Chief Equity Investment Officer of EVC, EVM and BMR. Officer of 80 registered investment companies managed by EVM or BMR. | |
|
| Walter A. Row, III 7/20/57 | | Vice President of the Trust | | Since 2001 | | Director of Equity Research and a Vice President of EVM and BMR. Officer of 38 registered investment companies managed by EVM or BMR. | |
|
| Judith A. Saryan 8/21/54 | | Vice President of the Trust | | Since 2003 | | Vice President of EVM and BMR. Officer of 53 registered investment companies managed by EVM or BMR. | |
|
33
Eaton Vance Tax-Managed Multi-Cap Growth Fund
MANAGEMENT AND ORGANIZATION CONT'D
Name and
Date of Birth | | Position(s)
with the
Trust and
the Portfolio | | Term of
Office and
Length of
Service | | Principal Occupation(s)
During Past Five Years | |
| Principal Officers who are not Trustees (continued) | | | | | | | |
|
| Susan Schiff 3/13/61 | | Vice President of the Trust | | Since 2002 | | Vice President of EVM and BMR. Officer of 35 registered investment companies managed by EVM or BMR. | |
|
| Thomas Seto 9/27/62 | | Vice President of the Trust | | Since 2007 | | Vice President and Director of Portfolio Management of Parametric. Officer of 30 registered investment companies managed by EVM or BMR. | |
|
| David M. Stein 5/4/51 | | Vice President of the Trust | | Since 2007 | | Managing Director and Chief Investment Officer of Parametric. Officer of 30 registered investment companies managed by EVM or BMR. | |
|
| Mark S. Venezia 5/23/49 | | Vice President of the Trust | | Since 2007 | | Vice President of EVM and BMR. Officer of 35 registered investment companies managed by EVM or BMR. | |
|
| Adam A. Weigold 3/22/75 | | Vice President of the Trust | | Since 2007 | | Vice President of EVM and BMR. Officer of 70 registered investment companies managed by EVM or BMR. | |
|
| Barbara E. Campbell 6/19/57 | | Treasurer of the Trust | | Since 2005 | | Vice President of EVM and BMR. Officer of 176 registered investment companies managed by EVM or BMR. | |
|
| Kevin M. Connerty 4/20/64 | | Treasurer of the Portfolio | | Since 2005 | | Vice President of EVM and BMR. Previously, Director and Vice President of PFPC Inc. (1999-2005). Officer of 98 registered investment companies managed by EVM or BMR. | |
|
| Maureen A. Gemma 5/24/60 | | Secretary | | Since 2007 | | Vice President and Deputy Chief Legal Officer of EVM and BMR. Officer of 176 registered investment companies managed by EVM or BMR. | |
|
| Paul M. O'Neil 7/11/53 | | Chief Compliance Officer | | Since 2004 | | Vice President of EVM and BMR. Officer of 176 registered investment companies managed by EVM or BMR. | |
|
(1) Includes both master and feeder funds in a master-feeder structure
The SAI for the Fund includes additional information about the Trustees and officers of the Fund and the Portfolio and can be obtained without charge by calling 1-800-225-6265.
34
This Page Intentionally Left Blank
This Page Intentionally Left Blank
Investment Adviser of Tax-Managed Multi-Cap Opportunity Portfolio
Boston Management and Research
The Eaton Vance Building
255 State Street
Boston, MA 02109
Administrator of Eaton Vance Tax-Managed Multi-Cap Opportunity Fund
Eaton Vance Management
The Eaton Vance Building
255 State Street
Boston, MA 02109
Principal Underwriter
Eaton Vance Distributors, Inc.
The Eaton Vance Building
255 State Street
Boston, MA 02109
(617) 482-8260
Custodian
State Street Bank and Trust Company
200 Clarendon Street
Boston, MA 02116
Transfer Agent
PFPC Inc.
Attn: Eaton Vance Funds
P.O. Box 9653
Providence, RI 02940-9653
(800) 262-1122
Independent Registered Public Accounting Firm
Deloitte & Touche LLP
200 Berkeley Street
Boston, MA 02116-5022
Eaton Vance Tax-Managed Multi-Cap Opportunity Fund
The Eaton Vance Building
255 State Street
Boston, MA 02109
This report must be preceded or accompanied by a current prospectus. Before investing, investors should consider carefully the Fund's investment objective(s), risks, and charges and expenses. The Fund's current prospectus contains this and other information about the Fund and is available through your financial advisor. Please read the prospectus carefully before you invest or send money. For further information please call 1-800-225-6265.
824-12/07 TMCAPSRC

Annual Report October 31, 2007


EATON VANCE
TAX-MANAGED
SMALL-CAP
GROWTH FUND
IMPORTANT NOTICES REGARDING PRIVACY,
DELIVERY OF SHAREHOLDER DOCUMENTS,
PORTFOLIO HOLDINGS AND PROXY VOTING
Privacy. The Eaton Vance organization is committed to ensuring your financial privacy. Each of the financial institutions identified below has in effect the following policy ("Privacy Policy") with respect to nonpublic personal information about its customers:
• Only such information received from you, through application forms or otherwise, and information about your Eaton Vance fund transactions will be collected. This may include information such as name, address, social security number, tax status, account balances and transactions.
• None of such information about you (or former customers) will be disclosed to anyone, except as permitted by law (which includes disclosure to employees necessary to service your account). In the normal course of servicing a customer's account, Eaton Vance may share information with unaffiliated third parties that perform various required services such as transfer agents, custodians and broker/dealers.
• Policies and procedures (including physical, electronic and procedural safeguards) are in place that are designed to protect the confidentiality of such information.
• We reserve the right to change our Privacy Policy at any time upon proper notification to you. Customers may want to review our Policy periodically for changes by accessing the link on our homepage: www.eatonvance.com.
Our pledge of privacy applies to the following entities within the Eaton Vance organization: the Eaton Vance Family of Funds, Eaton Vance Management, Eaton Vance Investment Counsel, Boston Management and Research, and Eaton Vance Distributors, Inc.
In addition, our Privacy Policy only applies to those Eaton Vance customers who are individuals and who have a direct relationship with us. If a customer's account (i.e., fund shares) is held in the name of a third-party financial adviser/broker-dealer, it is likely that only such adviser's privacy policies apply to the customer. This notice supersedes all previously issued privacy disclosures.
For more information about Eaton Vance's Privacy Policy, please call 1-800-262-1122.
Delivery of Shareholder Documents. The Securities and Exchange Commission ("the SEC") permits funds to deliver only one copy of shareholder documents, including prospectuses, proxy statements and shareholder reports, to fund investors with multiple accounts at the same residential or post office box address. This practice is often called "householding" and it helps eliminate duplicate mailings to shareholders.
Eaton Vance, or your financial adviser, may household the mailing of your documents indefinitely unless you instruct Eaton Vance, or your financial adviser, otherwise.
If you would prefer that your Eaton Vance documents not be householded, please contact Eaton Vance at 1-800-262-1122, or contact your financial adviser.
Your instructions that householding not apply to delivery of your Eaton Vance documents will be effective within 30 days of receipt by Eaton Vance or your financial adviser.
Portfolio Holdings. Each Eaton Vance Fund and its underlying Portfolio (if applicable) will file a schedule of its portfolio holdings on Form N-Q with the SEC for the first and third quarters of each fiscal year. The Form N-Q will be available on the Eaton Vance website www.eatonvance.com, by calling Eaton Vance at 1-800-262-1122 or in the EDGAR database on the SEC's website at www.sec.gov. Form N-Q may also be reviewed and copied at the SEC's public reference room in Washington, D.C. (call 1-800-732-0330 for information on the operation of the public reference room).
Proxy Voting. From time to time, funds are required to vote proxies related to the securities held by the funds. The Eaton Vance Funds or their underlying Portfolios (if applicable) vote proxies according to a set of policies and procedures approved by the Funds' and Portfolios' Boards. You may obtain a description of these policies and procedures and information on how the Funds or Portfolios voted proxies relating to portfolio securities during the most recent 12 month period ended June 30, without charge, upon request, by calling 1-800-262-1122. This description is also available on the SEC's website at www.sec.gov.
Eaton Vance Tax-Managed Small-Cap Growth Fund as of October 31, 2007
Management’s Discussion of Performance

Nancy B. Tooke, CFA
Portfolio Manager
Performance for the Past Year
· For the year ended October 31, 2007, the Fund’s Class A shares had a total return of 28.91%. This return was the result of an increase in net asset value (NAV) per share to $16.14 on October 31, 2007, from $12.52 on October 31, 2006.(1)
· The Fund’s Class B shares had a total return of 27.89% for the same period, the result of an increase in NAV per share to $14.95 from $11.69.(1)
· The Fund’s Class C shares had a total return of 27.90% for the same period, the result of an increase in NAV per share to $14.90 from $11.65.(1)
· For comparison, the S&P SmallCap 600 Index – a broad-based, unmanaged market index of 600 small-capitalization stocks trading in the U.S. – had a total return of 11.55%, while the Russell 2000 Index – a market capitalization weighted index of 2,000 small company stocks – had a total return of 9.27%. The Fund’s peer group, the Lipper Small-Cap Growth Funds Classification, had an average total return of 20.37% for the same period.(2)
See pages 2 and 4 for more performance information, including after-tax returns.
Management Discussion
· During the year ended October 31, 2007, U.S. stock markets moved higher amid a significant increase in volatility. In the first half of the period, investors were cautiously optimistic about the economy, inflation, interest rates and corporate profits, although markets both in the U.S. and abroad saw sharp declines from late February through mid-March 2007. Markets recovered strongly through mid-July 2007, only to decline again more dramatically in late July and August 2007 due to fallout from the subprime mortgage crisis. The Federal Reserve Board (the “Fed”) responded to the subprime situation by lowering the Fed Funds Rate – a key short-term interest rate benchmark – to 4.50% by period’s end. This eased concerns about the economy and helped move markets higher through early October. However, another decline, caused in part by a spike in oil prices, occurred in the final weeks of the period. While growth stocks outperformed value stocks, small-caps generally lagged large-caps.
· For the year ended October 31, 2007, the Fund outperformed its primary benchmark, the S&P SmallCap 600 Index.(2) The Fund invests its assets in Tax-Managed Small Cap Growth Portfolio (the “Portfolio”), a separate registered investment company with the same objectives and investment policies as the Fund. The Portfolio’s leading performers during the fiscal year ended October 31, 2007 were in the consumer discretionary, energy, industrial and materials sectors.
· With consumers increasingly pinched by rising energy costs, stock selection in the consumer discretionary area was even more important. Education companies fared well, posting good revenue growth, higher student retention rates and improving operating leverage during the fiscal year. In the energy sector, the Portfolio’s oil and gas exploration companies enjoyed strong earnings growth. The companies posted record production levels, taking advantage of surging oil prices. Energy equipment and utilities stocks also performed well during the fiscal year. Makers of turbines, compressors and control systems benefited from increased spending on drilling infrastructure, while selected utilities benefited from mergers, rate increases and cost efficiencies.(3)
· An overweighting in the materials sector helped the Portfolio’s performance during the fiscal year. A leading fertilizer manufacturer enjoyed robust demand, as agricultural commodity prices continued to rise. In the industrial sector, construction and engineering stocks benefited from renewed capital investment in the energy and power generation areas, especially for equipment used in oil and gas refineries and power generation plants. Another strong performer during the year was a manufacturer of wheels for large, off-road vehicles due to a very strong demand from the farm segment.(3)
Past performance is no guarantee of future results. Returns are historical and are calculated by determining the percentage change in net asset value or offering price (as applicable) with all distributions reinvested. Investment return and principal value will fluctuate so that shares, when redeemed, may be worth more or less than their original cost. Performance is for the stated time period only; due to market volatility, the Fund’s current performance may be lower or higher than the quoted return. Fund performance during certain periods reflects the strong stock market performance and/or the strong performance of stocks held during those periods. This performance is not typical and may not be repeated. For performance as of the most recent month end, please refer to www.eatonvance.com.
(1) These returns do not include the 5.75% maximum sales charge for Class A shares or the applicable contingent deferred sales charge (CDSC) for Class B and Class C shares. If sales charges were deducted, the returns would be lower.
(2) It is not possible to invest directly in an Index or a Lipper Classification. The Indices’ total return does not reflect commissions or expenses that would have been incurred if an investor individually purchased or sold the securities represented in the Indices. The Lipper total return is the average total return, at net asset value, of the funds that are in the same Lipper Classification as the Fund.
(3) Sector and industry weightings are subject to change due to active management.
Fund shares are not insured by the FDIC and are not deposits or other obligations of, or guaranteed by, any depository institution. Shares are subject to investment risks, including possible loss of principal invested.
1
Eaton Vance Tax-Managed Small-Cap Growth Fund as of October 31, 2007
PORTFOLIO INFORMATION
· Amid the subprime debacle, some financial stocks were among the Portfolio’s less successful performers during the fiscal year ended October 31, 2007. However, relative performance was helped by underweightings in the commercial bank and consumer finance areas. Telecom services stocks were another segment that detracted somewhat from performance during the year, as a wireless operator had slower subscriber growth and telecom equipment makers saw higher costs.(1)
(1) Sector and industry weightings are subject to change due to active management
The views expressed throughout this report are those of the portfolio managers and are current only through the end of the period of the report as stated on the cover. These views are subject to change at any time based upon market or other conditions, and the investment adviser disclaims any responsibility to update such views. These views may not be relied on as investment advice and, because investment decisions for a fund are based on many factors, may not be relied on as an indication of trading intent on behalf of any Eaton Vance fund.1 Sector and industry weightings are subject to change due to active management
Top Ten Common Stock Holdings(2)
By net assets
Terra Industries, Inc. | | 3.5 | % |
Foster Wheeler, Ltd. | | 3.4 | % |
Denbury Resources, Inc. | | 2.7 | % |
FLIR Systems, Inc. | | 2.1 | % |
Sybase, Inc. | | 2.1 | % |
Central European Media Enterprises, Ltd. | | 2.0 | % |
Petrohawk Energy Corp. | | 2.0 | % |
FTI Consulting, Inc. | | 2.0 | % |
Range Resources Corp. | | 1.9 | % |
Natco Group, Inc | | 1.9 | % |
(2) Top Ten Common Stock Holdings represented 23.6% of Portfolio net assets as of 10/31/07. Holdings are subject to change due to active management.
Common Stock Investments by Sector(3)
By net assets
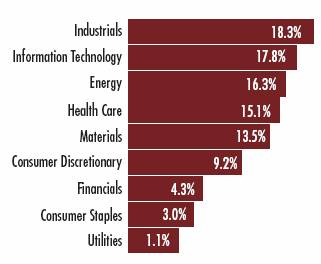
(3) As a percentage of the Portfolio’s net assets as of 10/31/07. Portfolio information may not be representative of the Portfolio’s current or future investments and may change due to active management.
2
Eaton Vance Tax-Managed Small-Cap Growth Fund as of October 31, 2007
FUND PERFORMANCE
The line graph and table set forth below provide information about the Fund’s performance. The line graph compares the performance of Class A of the Fund with that of the S&P Small Cap 600 Index, a broad-based, unmanaged market index of 600 small-capitalization stocks traded in the U.S., and the Russell 2000 Index, a market capitalization weighted index of 2,000 small company stocks The lines on the graph represent the total returns of a hypothetical investment of $10,000 in each of Class A, the S&P SmallCap 600 Index and the Russell 2000 Index. Class A total returns are presented at net asset value and maximum public offering price. The table includes the total returns of each Class of the Fund at net asset value and public offering price. The performance presented below does not reflect the deduction of taxes, if any, that a shareholder would pay on distributions or redemptions of Fund shares.
Fund Performance(1) As of 10/31/07 | | Class A | | Class B | | Class C | |
Share Class Symbol | | ETMGX | | EMMGX | | ECMGX | |
Average Annual Total Returns (at net asset value) | | | | | | | |
One Year | | 28.91 | % | 27.89 | % | 27.90 | % |
Five Years | | 16.19 | | 15.31 | | 15.30 | |
Ten Years | | 5.18 | | 4.38 | | 4.36 | |
Life of Fund† | | 4.85 | | 4.06 | | 4.03 | |
SEC Average Annual Total Returns (including sales charge or applicable CDSC) | | | | | | | |
One Year | | 21.54 | % | 22.89 | % | 26.90 | % |
Five Years | | 14.83 | | 15.08 | | 15.30 | |
Ten Years | | 4.56 | | 4.38 | | 4.36 | |
Life of Fund† | | 4.24 | | 4.06 | | 4.03 | |
† Inception Dates – Class A: 9/25/97; Class B: 9/29/97; Class C: 9/29/97
(1) Average annual total returns do not include the 5.75% maximum sales charge for Class A shares or the applicable contingent deferred sales charge (CDSC) for Class B and Class C shares. If sales charges were deducted, the returns would be lower. SEC average annual total returns for Class A reflect the maximum 5.75% sales charge. SEC returns for Class B shares reflect the applicable CDSC based on the following schedule: 5% - 1st and 2nd years; 4% - 3rd year; 3% - 4th year; 2% - 5th year; 1% - 6th year. SEC returns for Class C reflect a 1% CDSC for the first year.
Total Annual | | | | | | | |
Operating Expenses(2) | | Class A | | Class B | | Class C | |
Expense Ratio | | 1.41 | % | 2.16 | % | 2.16 | % |
(2) Source: Prospectus dated 3/1/07.
Past performance is no guarantee of future results. Returns are historical and are calculated by determining the percentage change in net asset value or offering price (as applicable) with all distributions reinvested. Investment return and principal value will fluctuate so that shares, when redeemed, may be worth more or less than their original cost. Performance is for the stated time period only; due to market volatility, the Fund’s current performance may be lower or higher than the quoted return. Fund performance during certain periods reflects the strong stock market performance and/or the strong performance of stocks held during those periods. This performance is not typical and may not be repeated. For performance as of the most recent month end, please refer to www.eatonvance.com.
Comparison of Change in Value of a $10,000 Investment in Eaton Vance Tax-Managed Small-Cap Growth Fund Class A vs. the S&P SmallCap 600 Index and the Russell 2000 Index*

* Source: Thomson Financial. Class A of the Fund commenced investment operations on 9/25/97. A $10,000 hypothetical investment at net asset value in Class B shares and Class C shares on 10/31/97 would have been valued at $15,349 and $15,329, respectively, on 10/31/07. It is not possible to invest directly in an Index. The Indices’ total returns do not reflect commissions or expenses that would have been incurred if an investor individually purchased or sold the securities represented in the Indices.
3
“Return Before Taxes” does not take into consideration shareholder taxes. It is most relevant to tax-free or tax-deferred shareholder accounts. “Return After Taxes on Distributions” reflects the impact of federal income taxes due on Fund distributions of dividends and capital gains. It is most relevant to taxpaying shareholders who continue to hold their shares. “Return After Taxes on Distributions and Sale of Fund Shares” also reflects the impact of taxes on capital gain or loss realized upon a sale of shares. It is most relevant to taxpaying shareholders who sell their shares.
Average Annual Total Returns
(For the periods ended October 31, 2007)
Returns at Net Asset Value (NAV) (Class A)
| | One Year | | Five Years | | Ten Years | |
Return Before Taxes | | 28.91 | % | 16.19 | % | 5.18 | % |
Return After Taxes on Distributions | | 28.91 | % | 16.19 | % | 5.18 | % |
Return After Taxes on Distributions and Sale of Fund Shares | | 18.79 | % | 14.29 | % | 4.53 | % |
Returns at Public Offering Price (POP) (Class A)
| | One Year | | Five Years | | Ten Years | |
Return Before Taxes | | 21.54 | % | 14.83 | % | 4.56 | % |
Return After Taxes on Distributions | | 21.54 | % | 14.83 | % | 4.56 | % |
Return After Taxes on Distributions and Sale of Fund Shares | | 14.00 | % | 13.06 | % | 3.98 | % |
Average Annual Total Returns
(For the periods ended October 31, 2007)
Returns at Net Asset Value (NAV) (Class C)
| | One Year | | Five Years | | Ten Years | |
Return Before Taxes | | 27.90 | % | 15.30 | % | 4.36 | % |
Return After Taxes on Distributions | | 27.90 | % | 15.30 | % | 4.36 | % |
Return After Taxes on Distributions and Sale of Fund Shares | | 18.13 | % | 13.48 | % | 3.80 | % |
Returns at Public Offering Price (POP) (Class C)
| | One Year | | Five Years | | Ten Years | |
Return Before Taxes | | 26.90 | % | 15.30 | % | 4.36 | % |
Return After Taxes on Distributions | | 26.90 | % | 15.30 | % | 4.36 | % |
Return After Taxes on Distributions and Sale of Fund Shares | | 17.48 | % | 13.48 | % | 3.80 | % |
Average Annual Total Returns
(For the periods ended October 31, 2007)
Returns at Net Asset Value (NAV) (Class B)
| | One Year | | Five Years | | Ten Years | |
Return Before Taxes | | 27.89 | % | 15.31 | % | 4.38 | % |
Return After Taxes on Distributions | | 27.89 | % | 15.31 | % | 4.38 | % |
Return After Taxes on Distributions and Sale of Fund Shares | | 18.13 | % | 13.49 | % | 3.82 | % |
Returns at Public Offering Price (POP) (Class B)
| | One Year | | Five Years | | Ten Years | |
Return Before Taxes | | 22.89 | % | 15.08 | % | 4.38 | % |
Return After Taxes on Distributions | | 22.89 | % | 15.08 | % | 4.38 | % |
Return After Taxes on Distributions and Sale of Fund Shares | | 14.88 | % | 13.29 | % | 3.82 | % |
Class A of the Fund commenced investment operations on 9/25/97, and Class B and Class C of the Fund commenced investment operations on 9/29/97. Returns at Public Offering Price (POP) reflect the deduction of the maximum initial sales charge and applicable CDSC, while Returns at Net Asset Value (NAV) do not.
After-tax returns are calculated using certain assumptions. After-tax returns are calculated using the highest historical individual federal income tax rates and do not reflect the impact of state and local taxes. Actual after-tax returns depend on a shareholder’s tax situation and the actual characterization of distributions and may differ from those shown. After-tax returns are not relevant for shareholders who hold Fund shares in tax-deferred accounts or to shares held by non-taxable entities. Return After Taxes on Distributions for a period may be the same as Return Before Taxes for the same period because no taxable distributions were made during that period. Return After Taxes on Distributions and Sale of Fund Shares for a period may be greater than or equal to Return After Taxes on Distributions for the same period because of losses realized on the sale of Fund shares.
Past performance is no guarantee of future results. Returns are historical and are calculated by determining the percentage change in net asset value or offering price (as applicable) with all distributions reinvested. Investment return and principal value will fluctuate so that shares, when redeemed, may be worth more or less than their original cost. Performance is for the stated time period only; due to market volatility, the Fund’s current performance may be lower or higher than the quoted return. Fund performance during certain periods reflects the strong stock market performance and/or the strong performance of stocks held during those periods. This performance is not typical and may not be repeated. For performance as of the most recent month end, please refer to www.eatonvance.com.
4
Eaton Vance Tax-Managed Small-Cap Growth Fund as of October 31, 2007
FUND EXPENSES
Example: As a shareholder of the Fund, you incur two types of costs: (1) transaction costs, including sales charges (loads) on purchases and redemption fees (if applicable); and (2) ongoing costs, including management fees; distribution or service fees; and other Fund expenses. This Example is intended to help you understand your ongoing costs (in dollars) of investing in the Fund and to compare these costs with the ongoing costs of investing in other mutual funds. The Example is based on an investment of $1,000 invested at the beginning of the period and held for the entire period (May 1, 2007 – October 31, 2007).
Actual Expenses: The first section of the table below provides information about actual account values and actual expenses. You may use the information in this section, together with the amount you invested, to estimate the expenses that you paid over the period. Simply divide your account value by $1,000 (for example, an $8,600 account value divided by $1,000 = 8.6), then multiply the result by the number in the first section under the heading entitled "Expenses Paid During Period" to estimate the expenses you paid on your account during this period.
Hypothetical Example for Comparison Purposes: The second section of the table below provides information about hypothetical account values and hypothetical expenses based on the actual Fund expense ratio and an assumed rate of return of 5% per year (before expenses), which is not the actual return of the Fund. The hypothetical account values and expenses may not be used to estimate the actual ending account balance or expenses you paid for the period. You may use this information to compare the ongoing costs of investing in your Fund and other funds. To do so, compare this 5% hypothetical example with the 5% hypothetical examples that appear in the shareholder reports of the other funds.
Please note that the expenses shown in the table are meant to highlight your ongoing costs only and do not reflect any transactional costs, such as sales charges (loads) or redemption fees (if applicable). Therefore, the second section of the table is useful in comparing ongoing costs only, and will not help you determine the relative total costs of owning different funds. In addition, if these transactional costs were included, your costs would have been higher.
Eaton Vance Tax-Managed Small-Cap Growth Fund
| | | Beginning Account Value
(5/1/07) | | Ending Account Value
(10/31/07) | | Expenses Paid During Period*
(5/1/07 – 10/31/07) | |
| Actual | |
| Class A | | $ | 1,000.00 | | | $ | 1,120.80 | | | $ | 7.11 | | |
| Class B | | $ | 1,000.00 | | | $ | 1,115.70 | | | $ | 11.09 | | |
| Class C | | $ | 1,000.00 | | | $ | 1,116.10 | | | $ | 11.09 | | |
| Hypothetical | |
| (5% return per year before expenses) | |
| Class A | | $ | 1,000.00 | | | $ | 1,018.50 | | | $ | 6.77 | | |
| Class B | | $ | 1,000.00 | | | $ | 1,014.70 | | | $ | 10.56 | | |
| Class C | | $ | 1,000.00 | | | $ | 1,014.70 | | | $ | 10.56 | | |
* Expenses are equal to the Fund's annualized expense ratio of 1.33% for Class A shares, 2.08% for Class B shares and 2.08% for Class C shares multiplied by the average account value over the period, multiplied by 184/365 (to reflect the one-half year period). The Example assumes that the $1,000 was invested at the net asset value per share determined at the close of business on April 30, 2007. The Example reflects the expenses of both the Fund and the Portfolio.
5
Eaton Vance Tax-Managed Small-Cap Growth Fund as of October 31, 2007
FINANCIAL STATEMENTS
Statement of Assets and Liabilities
As of October 31, 2007
| Assets | |
Investment in Tax-Managed Small-Cap Growth Portfolio, at value
(identified cost, $102,937,005) | | $ | 133,483,887 | | |
| Receivable for Fund shares sold | | | 50,876 | | |
| Total assets | | $ | 133,534,763 | | |
| Liabilities | |
| Payable for Fund shares redeemed | | $ | 151,549 | | |
| Payable to affiliate for distribution and service fees | | | 70,762 | | |
| Payable to affiliate for Trustees' fees | | | 584 | | |
| Other accrued expenses | | | 102,337 | | |
| Total liabilities | | $ | 325,232 | | |
| Net Assets | | $ | 133,209,531 | | |
| Sources of Net Assets | |
| Paid-in capital | | $ | 203,138,561 | | |
Accumulated net realized loss from Portfolio (computed on
the basis of identified cost) | | | (100,475,912 | ) | |
Net unrealized appreciation from Portfolio (computed on
the basis of identified cost) | | | 30,546,882 | | |
| Total | | $ | 133,209,531 | | |
| Class A Shares | |
| Net Assets | | $ | 65,184,575 | | |
| Shares Outstanding | | | 4,039,229 | | |
Net Asset Value and Redemption Price Per Share
(net assets ÷ shares of beneficial interest outstanding) | | $ | 16.14 | | |
Maximum Offering Price Per Share
(100 ÷ 94.25 of $16.14) | | $ | 17.12 | | |
| Class B Shares | |
| Net Assets | | $ | 36,554,365 | | |
| Shares Outstanding | | | 2,444,627 | | |
Net Asset Value and Offering Price Per Share*
(net assets ÷ shares of beneficial interest outstanding) | | $ | 14.95 | | |
| Class C Shares | |
| Net Assets | | $ | 31,470,591 | | |
| Shares Outstanding | | | 2,112,490 | | |
Net Asset Value and Offering Price Per Share*
(net assets ÷ shares of beneficial interest outstanding) | | $ | 14.90 | | |
| On sales of $50,000 or more, the offering price of Class A shares is reduced. | |
* Redemption price per share is equal to the net asset value less any applicable contingent deferred sales charge.
Statement of Operations
For the Year Ended
October 31, 2007
| Investment Income | |
| Dividends allocated from Portfolio (net of foreign taxes, $9,825) | | $ | 443,089 | | |
| Interest allocated from Portfolio | | | 201,972 | | |
| Expenses allocated from Portfolio | | | (911,446 | ) | |
| Net investment loss from Portfolio | | $ | (266,385 | ) | |
| Expenses | |
| Trustees' fees and expenses | | $ | 4,120 | | |
Distribution and service fees
Class A | | | 137,667 | | |
| Class B | | | 396,301 | | |
| Class C | | | 288,697 | | |
| Transfer and dividend disbursing agent fees | | | 255,905 | | |
| Registration fees | | | 52,358 | | |
| Printing and postage | | | 41,596 | | |
| Legal and accounting services | | | 36,829 | | |
| Custodian fee | | | 31,663 | | |
| Miscellaneous | | | 9,498 | | |
| Total expenses | | $ | 1,254,634 | | |
| Net investment loss | | $ | (1,521,019 | ) | |
Realized and Unrealized
Gain (Loss) from Portfolio | |
Net realized gain (loss) —
Investment transactions (identified cost basis) | | $ | 14,367,791 | | |
| Foreign currency transactions | | | (856 | ) | |
| Net realized gain | | $ | 14,366,935 | | |
Change in unrealized appreciation (depreciation) —
Investments (identified cost basis) | | $ | 17,930,513 | | |
| Net change in unrealized appreciation (depreciation) | | $ | 17,930,513 | | |
| Net realized and unrealized gain | | $ | 32,297,448 | | |
| Net increase in net assets from operations | | $ | 30,776,429 | | |
See notes to financial statements
6
Eaton Vance Tax-Managed Small-Cap Growth Fund as of October 31, 2007
FINANCIAL STATEMENTS CONT'D
Statements of Changes in Net Assets
Increase (Decrease)
in Net Assets | | Year Ended
October 31, 2007 | | Year Ended
October 31, 2006 | |
From operations —
Net investment loss | | $ | (1,521,019 | ) | | $ | (1,183,805 | ) | |
Net realized gain from investment
transactions and foreign
currency transactions | | | 14,366,935 | | | | 18,110,402 | | |
Net change in unrealized appreciation
(depreciation) of investments | | | 17,930,513 | | | | (187,670 | ) | |
| Net increase in net assets from operations | | $ | 30,776,429 | | | $ | 16,738,927 | | |
Transactions in shares of beneficial interest —
Proceeds from sale of shares
Class A | | $ | 7,251,380 | | | $ | 2,101,706 | | |
| Class B | | | 623,643 | | | | 533,172 | | |
| Class C | | | 3,430,081 | | | | 669,239 | | |
Issued in reorganization of Eaton Vance
Tax-Managed Small-Cap Growth 1.2
Class A | | | — | | | | 13,881,608 | | |
| Class B | | | — | | | | 12,235,505 | | |
| Class C | | | — | | | | 10,183,286 | | |
Cost of shares redeemed
Class A | | | (10,620,119 | ) | | | (10,091,563 | ) | |
| Class B | | | (9,211,666 | ) | | | (14,186,537 | ) | |
| Class C | | | (5,669,347 | ) | | | (5,854,588 | ) | |
Net asset value of shares exchanged
Class A | | | 7,697,320 | | | | 10,671,193 | | |
| Class B | | | (7,697,320 | ) | | | (10,671,193 | ) | |
Net increase (decrease) in net assets from
Fund share transactions | | $ | (14,196,028 | ) | | $ | 9,471,828 | | |
| Net increase in net assets | | $ | 16,580,401 | | | $ | 26,210,755 | | |
| Net Assets | |
| At beginning of year | | $ | 116,629,130 | | | $ | 90,418,375 | | |
| At end of year | | $ | 133,209,531 | | | $ | 116,629,130 | | |
See notes to financial statements
7
Eaton Vance Tax-Managed Small-Cap Growth Fund as of October 31, 2007
FINANCIAL STATEMENTS CONT'D
Financial Highlights
| | | Class A | |
| | | Year Ended October 31, | |
| | | 2007 | | 2006 | | 2005 | | 2004 | | 2003 | |
| Net asset value — Beginning of year | | $ | 12.520 | | | $ | 10.300 | | | $ | 9.470 | | | $ | 9.630 | | | $ | 7.620 | | |
| Income (loss) from operations | |
| Net investment loss(1) | | $ | (0.117 | ) | | $ | (0.073 | ) | | $ | (0.105 | ) | | $ | (0.107 | ) | | $ | (0.100 | ) | |
| Net realized and unrealized gain (loss) | | | 3.737 | | | | 2.293 | | | | 0.935 | | | | (0.053 | ) | | | 2.110 | | |
| Total income (loss) from operations | | $ | 3.620 | | | $ | 2.220 | | | $ | 0.830 | | | $ | (0.160 | ) | | $ | 2.010 | | |
| Net asset value — End of year | | $ | 16.140 | | | $ | 12.520 | | | $ | 10.300 | | | $ | 9.470 | | | $ | 9.630 | | |
| Total Return(2) | | | 28.91 | % | | | 21.55 | % | | | 8.76 | % | | | (1.66 | )%(3) | | | 26.38 | % | |
| Ratios/Supplemental Data | |
| Net assets, end of year (000's omitted) | | $ | 65,185 | | | $ | 46,895 | | | $ | 24,855 | | | $ | 30,172 | | | $ | 40,514 | | |
| Ratios (As a percentage of average daily net assets): | |
| Expenses before custodian fee reduction(4) | | | 1.34 | % | | | 1.41 | %(5) | | | 1.44 | %(5) | | | 1.37 | % | | | 1.43 | % | |
| Expenses after custodian fee reduction(4) | | | 1.34 | % | | | 1.41 | %(5) | | | 1.44 | %(5) | | | 1.37 | % | | | 1.43 | % | |
| Net investment loss | | | (0.82 | )% | | | (0.63 | )% | | | (1.04 | )% | | | (1.12 | )% | | | (1.23 | )% | |
| Portfolio Turnover of the Portfolio | | | 78 | % | | | 99 | % | | | 223 | % | | | 282 | % | | | 248 | % | |
(1) Net investment loss per share was computed using average shares outstanding.
(2) Returns are historical and are calculated by determining the percentage change in net asset value with all distributions reinvested.
(3) The effect of the Fund's net increase from payments by affiliate and net gains (losses), through its investment in the Portfolio, realized on the disposal of investments purchased which did not meet the Portfolio's investment guidelines amounted to less than $0.01 per share and had no effect on total return for the year ended October 31, 2004.
(4) Includes the Fund's share of the Portfolio's allocated expenses.
(5) The investment adviser waived a portion of its investment advisory fee (equal to less than 0.01% and 0.01% of average daily net assets for 2006 and 2005, respectively).
See notes to financial statements
8
Eaton Vance Tax-Managed Small-Cap Growth Fund as of October 31, 2007
FINANCIAL STATEMENTS CONT'D
Financial Highlights
| | | Class B | |
| | | Year Ended October 31, | |
| | | 2007 | | 2006 | | 2005 | | 2004 | | 2003 | |
| Net asset value — Beginning of year | | $ | 11.690 | | | $ | 9.680 | | | $ | 8.980 | | | $ | 9.190 | | | $ | 7.330 | | |
| Income (loss) from operations | |
| Net investment loss(1) | | $ | (0.205 | ) | | $ | (0.152 | ) | | $ | (0.170 | ) | | $ | (0.170 | ) | | $ | (0.155 | ) | |
| Net realized and unrealized gain (loss) | | | 3.465 | | | | 2.162 | | | | 0.870 | | | | (0.040 | ) | | | 2.015 | | |
| Total income (loss) from operations | | $ | 3.260 | | | $ | 2.010 | | | $ | 0.700 | | | $ | (0.210 | ) | | $ | 1.860 | | |
| Net asset value — End of year | | $ | 14.950 | | | $ | 11.690 | | | $ | 9.680 | | | $ | 8.980 | | | $ | 9.190 | | |
| Total Return(2) | | | 27.89 | % | | | 20.76 | % | | | 7.80 | % | | | (2.28 | )%(3) | | | 25.38 | % | |
| Ratios/Supplemental Data | |
| Net assets, end of year (000's omitted) | | $ | 36,554 | | | $ | 43,053 | | | $ | 47,222 | | | $ | 62,553 | | | $ | 82,345 | | |
| Ratios (As a percentage of average daily net assets): | |
| Expenses before custodian fee reduction(4) | | | 2.09 | % | | | 2.16 | %(5) | | | 2.19 | %(5) | | | 2.12 | % | | | 2.18 | % | |
| Expenses after custodian fee reduction(4) | | | 2.09 | % | | | 2.16 | %(5) | | | 2.19 | %(5) | | | 2.12 | % | | | 2.18 | % | |
| Net investment loss | | | (1.56 | )% | | | (1.40 | )% | | | (1.79 | )% | | | (1.87 | )% | | | (1.98 | )% | |
| Portfolio Turnover of the Portfolio | | | 78 | % | | | 99 | % | | | 223 | % | | | 282 | % | | | 248 | % | |
(1) Net investment loss per share was computed using average shares outstanding.
(2) Returns are historical and are calculated by determining the percentage change in net asset value with all distributions reinvested.
(3) The effect of the Fund's net increase from payments by affiliate and net gains (losses), through its investment in the Portfolio, realized on the disposal of investments purchased which did not meet the Portfolio's investment guidelines amounted to less than $0.01 per share and had no effect on total return for the year ended October 31, 2004.
(4) Includes the Fund's share of the Portfolio's allocated expenses.
(5) The investment adviser waived a portion of its investment advisory fee (equal to less than 0.01% and 0.01% of average daily net assets for 2006 and 2005, respectively).
See notes to financial statements
9
Eaton Vance Tax-Managed Small-Cap Growth Fund as of October 31, 2007
FINANCIAL STATEMENTS CONT'D
Financial Highlights
| | | Class C | |
| | | Year Ended October 31, | |
| | | 2007 | | 2006 | | 2005 | | 2004 | | 2003 | |
| Net asset value — Beginning of year | | $ | 11.650 | | | $ | 9.650 | | | $ | 8.940 | | | $ | 9.160 | | | $ | 7.310 | | |
| Income (loss) from operations | |
| Net investment loss(1) | | $ | (0.206 | ) | | $ | (0.150 | ) | | $ | (0.170 | ) | | $ | (0.170 | ) | | $ | (0.154 | ) | |
| Net realized and unrealized gain (loss) | | | 3.456 | | | | 2.150 | | | | 0.880 | | | | (0.050 | ) | | | 2.004 | | |
| Total income (loss) from operations | | $ | 3.250 | | | $ | 2.000 | | | $ | 0.710 | | | $ | (0.220 | ) | | $ | 1.850 | | |
| Net asset value — End of year | | $ | 14.900 | | | $ | 11.650 | | | $ | 9.650 | | | $ | 8.940 | | | $ | 9.160 | | |
| Total Return(2) | | | 27.90 | % | | | 20.72 | % | | | 7.94 | % | | | (2.40 | )%(3) | | | 25.31 | % | |
| Ratios/Supplemental Data | |
| Net assets, end of year (000's omitted) | | $ | 31,471 | | | $ | 26,681 | | | $ | 18,341 | | | $ | 25,282 | | | $ | 35,855 | | |
| Ratios (As a percentage of average daily net assets): | |
| Expenses before custodian fee reduction(4) | | | 2.09 | % | | | 2.16 | %(5) | | | 2.19 | %(5) | | | 2.12 | % | | | 2.18 | % | |
| Expenses after custodian fee reduction(4) | | | 2.09 | % | | | 2.16 | %(5) | | | 2.19 | %(5) | | | 2.12 | % | | | 2.18 | % | |
| Net investment loss | | | (1.57 | )% | | | (1.38 | )% | | | (1.79 | )% | | | (1.87 | )% | | | (1.97 | )% | |
| Portfolio Turnover of the Portfolio | | | 78 | % | | | 99 | % | | | 223 | % | | | 282 | % | | | 248 | % | |
(1) Net investment loss per share was computed using average shares outstanding.
(2) Returns are historical and are calculated by determining the percentage change in net asset value with all distributions reinvested.
(3) The effect of the Fund's net increase from payments by affiliate and net gains (losses), through its investment in the Portfolio, realized on the disposal of investments purchased which did not meet the Portfolio's investment guidelines amounted to less than $0.01 per share and had no effect on total return for the year ended October 31, 2004.
(4) Includes the Fund's share of the Portfolio's allocated expenses.
(5) The investment adviser waived a portion of its investment advisory fee (equal to less than 0.01% and 0.01% of average daily net assets for 2006 and 2005, respectively).
See notes to financial statements
10
Eaton Vance Tax-Managed Small-Cap Growth Fund as of October 31, 2007
NOTES TO FINANCIAL STATEMENTS
1 Significant Accounting Policies
Eaton Vance Tax-Managed Small-Cap Growth Fund (formerly Eaton Vance Tax-Managed Small-Cap Growth Fund 1.1) (the Fund) is a diversified series of Eaton Vance Mutual Funds Trust (the Trust). The Trust is a Massachusetts business trust registered under the Investment Company Act of 1940, as amended (the 1940 Act), as an open-end management investment company. The Fund offers three classes of shares. Class A shares are generally sold subject to a sales charge imposed at time of purchase. Class B and Class C shares are sold at net asset value and are subject to a contingent deferred sales charge (see Note 6). The Trustees have adopted a conversion feature pursuant to which Class B shares of the Fund automatically convert to Class A shares eight years after their purchase as described in the Fund's prospectus. Each class represents a pro-rata interest in the Fund, but votes separately on class-specific matters and (as noted below) is subject to different expenses. Realized and unrealized gains and losses and net investment income and losses, other than class-specific expenses, are allocated daily to each class of shares based on the relative net assets of each class to the total net assets of the Fund. Each class of shares differs in its distribution plan and certain other class-specific expenses. The Fund invests all of its investable assets in interests of the Tax-Managed Small-Cap Growth Portfolio (the Portfolio), a New York trust, having the same investment objective and policies as the Fund. The value of the Fund's investment in the Portfolio reflects the Fund's proportionate interest in the net assets of the Portfolio (71.0% at October 31, 2007). The performance of the Fund is directly affected by the performance of the Portfolio. The financial statements of the Portfolio, including the portfolio of investments, are included elsewhere in this report and should be read in conjunction with the Fund's financial statements.
The following is a summary of significant accounting policies of the Fund. The policies are in conformity with accounting principles generally accepted in the United States of America.
A Investment Valuation — Valuation of securities by the Portfolio is discussed in Note 1A of the Portfolio's Notes to Financial Statements, which are included elsewhere in this report.
B Income — The Fund's net investment income or loss consists of the Fund's pro-rata share of the net investment income or loss of the Portfolio, less all actual and accrued expenses of the Fund.
C Federal Taxes — The Fund's policy is to comply with the provisions of the Internal Revenue Code applicable to regulated investment companies and to distribute to shareholders, each year, substantially all of its net investment income, and all or substantially all of its net realized capital gains. Accordingly, no provision for federal income or excise tax is necessary. At October 31, 2007, the Fund, for federal income tax purposes, had a capital loss carryforward of $103,192,760 which will reduce the taxable income arising from future net realized gain on investments, if any, to the extent permitted by the Internal Revenue Code and thus will reduce the amount of distributions to shareholders which would otherwise be necessary to relieve the Fund of any liability for fed eral income or excise tax. Such capital loss carryforward will expire on October 31, 2009, ($47,247,022), on October 31, 2010, ($55,945,738).
During the year ended October 31, 2007, a capital loss carryforward of $14,402,581 was utilized to offset net realized gains of the Fund.
A capital loss carryforward of $1,555,676, included in the number above, is available to the Fund as a result of the reorganization of Tax-Managed Small-Cap Growth Fund 1.2 on April 28, 2006 (see Note 8). Utilization of this capital loss carryforward may be limited in accordance with certain income tax regulations.
D Expenses — The majority of expenses of the Trust are directly identifiable to an individual fund. Expenses which are not readily identifiable to a specific fund are allocated taking into consideration, among other things, the nature and type of expense and the relative size of the funds.
E Expense Reduction — State Street Bank and Trust Company (SSBT) serves as custodian of the Fund. Pursuant to the custodian agreement, SSBT receives a fee reduced by credits, which are determined based on the average daily cash balance the Fund maintains with SSBT. All credit balances, if any, used to reduce the Fund's custodian fees are reported as a reduction of expenses in the Statement of Operations.
F Use of Estimates — The preparation of the financial statements in conformity with accounting principles generally accepted in the United States of America requires management to make estimates and assumptions that affect the reported amounts of assets and liabilities at the date of the financial statements and the reported amounts of income and expense during the reporting period. Actual results could differ from those estimates.
11
Eaton Vance Tax-Managed Small-Cap Growth Fund as of October 31, 2007
NOTES TO FINANCIAL STATEMENTS CONT'D
G Indemnifications — Under the Trust's organizational documents, its officers and Trustees may be indemnified against certain liabilities and expenses arising out of the performance of their duties to the Fund, and shareholders are indemnified against personal liability for obligations of the Trust. Additionally, in the normal course of business, the Fund enters into agreements with service providers that may contain indemnification clauses. The Fund's maximum exposure under these arrangements is unknown as this would involve future claims that may be made against the Fund that have not yet occurred.
H Other — Investment transactions are accounted for on a trade date basis. Dividends to shareholders are recorded on the ex-dividend date.
2 Distributions to Shareholders
It is the present policy of the Fund to make at least one distribution annually (normally in December) of all or substantially all of its net investment income and at least one distribution annually of all or substantially all of its net realized capital gains (reduced by available capital loss carryforwards from prior years, if any). Distributions are declared separately for each class of shares. Shareholders may reinvest distributions in shares of the same class of the Fund at the net asset value as of the ex-dividend date or, at the election of the shareholder, receive distributions in cash. The Fund distinguishes between distributions on a tax basis and a financial reporting basis. Accounting principles generally accepted in the United States of America require that only distributions in excess of tax basis earnings and profits be reported in the financial statements as a return of capital. Permanent differences between book and tax accounting relating to distributions are reclassified to paid-in capital.
During the year ended October 31, 2007, the following amounts were reclassified due to differences between book and tax accounting, primarily for expired net operating losses, foreign currency gain (loss) and real estate investment trusts.
| Increase (decrease): | | | | | |
| Paid-in capital | | $ | (1,559,935 | ) | |
| Accumulated net realized loss | | $ | 38,916 | | |
| Accumulated net investment loss | | $ | (1,521,019 | ) | |
These reclassifications had no effect on the net assets or net asset value per share of the Fund.
As of October 31, 2007, the components of distributable earnings (accumulated losses) and unrealized appreciation (depreciation) on a tax basis were as follows:
| Capital loss carryforward | | $ | (103,192,760 | ) | |
| Unrealized appreciation | | $ | 33,263,730 | | |
The differences between components of distributable earnings (accumulated losses) on a tax basis and the amounts reflected in the Statement of Assets and Liabilities are primarily due to differences in book and tax policies for partnership allocations.
3 Shares of Beneficial Interest
The Fund's Declaration of Trust permits the Trustees to issue an unlimited number of full and fractional shares of beneficial interest (without par value). Such shares may be issued in a number of different series (such as the Fund) and classes. Transactions in Fund shares were as follows:
| | | Year Ended October 31, | |
| Class A | | 2007 | | 2006 | |
| Sales | | | 502,180 | | | | 175,888 | | |
| Redemptions | | | (746,269 | ) | | | (870,120 | ) | |
| Exchange from Class B shares | | | 538,163 | | | | 918,538 | | |
Issued to Eaton Vance Tax-Managed
Small-Cap Growth Fund 1.2 shareholders | | | — | | | | 1,106,591 | | |
| Net increase | | | 294,074 | | | | 1,330,897 | | |
| | | Year Ended October 31, | |
| Class B | | 2007 | | 2006 | |
| Sales | | | 46,544 | | | | 48,656 | | |
| Redemptions | | | (706,301 | ) | | | (1,302,068 | ) | |
| Exchange to Class A shares | | | (578,610 | ) | | | (980,419 | ) | |
Issued to Eaton Vance Tax-Managed
Small-Cap Growth Fund 1.2 shareholders | | | — | | | | 1,040,817 | | |
| Net decrease | | | (1,238,367 | ) | | | (1,193,014 | ) | |
| | | Year Ended October 31, | |
| Class C | | 2007 | | 2006 | |
| Sales | | | 255,373 | | | | 60,848 | | |
| Redemptions | | | (433,923 | ) | | | (540,263 | ) | |
Issued to Eaton Vance Tax-Managed
Small-Cap Growth Fund 1.2 shareholders | | | — | | | | 869,466 | | |
| Net increase (decrease) | | | (178,550 | ) | | | 390,051 | | |
12
Eaton Vance Tax-Managed Small-Cap Growth Fund as of October 31, 2007
NOTES TO FINANCIAL STATEMENTS CONT'D
4 Transactions with Affiliates
Eaton Vance Management (EVM) serves as the administrator to the Fund, but receives no compensation. The Portfolio has engaged Boston Management and Research (BMR), a subsidiary of EVM, to render investment advisory services. See Note 2 of the Portfolio's Notes to Financial Statements which are included elsewhere in this report. EVM serves as the sub-transfer agent of the Fund and receives from the transfer agent an aggregate fee based upon the actual expenses incurred by EVM in the performance of those services. For the year ended October 31, 2007, EVM received approximately $14,000 in sub-transfer agent fees.
Eaton Vance Distributors, Inc. (EVD), a subsidiary of EVM and the Fund's principal underwriter, received $12,020 as its portion of the sales charge on sales of Class A shares for the year ended October 31, 2007. EVD also received distribution and service fees from Class A, Class B, and Class C shares (see Note 5) and contingent deferred sales charges (see Note 6).
Except for Trustees of the Fund and the Portfolio who are not members of EVM's or BMR's organizations, officers and Trustees receive remuneration for their services to the Fund out of the investment adviser fee earned by BMR. Certain officers and Trustees of the Fund and Portfolio are officers of the above organizations.
5 Distribution Plans
The Fund has in effect a distribution plan for Class A shares (Class A Plan) pursuant to Rule 12b-1 under the 1940 Act. The Class A Plan provides that the Fund will pay EVD a distribution and service fee of 0.25% per annum of its average daily net assets attributable to Class A shares for distribution services and facilities provided to the Fund by EVD, as well as for personal services and/or the maintenance of shareholder accounts. Distribution and service fees paid or accrued to EVD for the year ended October 31, 2007 amounted to $137,667 for Class A shares. The Fund also has in effect distribution plans for Class B shares (Class B Plan) and Class C shares (Class C Plan) pursuant to Rule 12b-1 under the 1940 Act. The Class B and Class C Plans require the Fund to pay EVD amounts equal to 0.75% per annum of the Fund's average daily net assets attributable to Class B and Class C shares for providing ongoing distribution services and facilities to the Fund. The Fund will automatically discontinue payments to EVD during any period in which there are no outstanding Uncovered Distribution Charges, which are equivalent to the sum of (i) 5% and 6.25% of the aggregate amount received by the Fund for the Class B and Class C shares sold, respectively, plus (ii) interest calculated by applying the rate of 1% over the prevailing prime rate to the outstanding balance of Uncovered Distribution Charges of EVD of each respective class, reduced by the aggregate amount of contingent deferred sales charges (see Note 6) and amounts theretofore paid or payable to EVD by each respective class. Distribution fees paid or accrued for the year ended October 31, 2007, amounted to $297,226 and $216,523 for Class B and Class C shares, respectively. At October 31, 2007, the amount of Uncovered Distribution Charges of EVD calculated under the Plans was approximately $6,444,000 and $10,041,00 0 for Class B and Class C shares, respectively. The Class B and Class C Plans also authorize the Fund to make payments of service fees to EVD, investment dealers, and other persons in amounts not exceeding 0.25% per annum of the Fund's average daily net assets attributable to the Class B and Class C shares. Service fees paid or accrued are for personal services and/or the maintenance of shareholder accounts. They are separate and distinct from the sales commissions and distribution fees payable to EVD and, as such, are not subject to automatic discontinuance when there are no outstanding Uncovered Distribution Charges to EVD. Service fees paid or accrued for the year ended October 31, 2007 amounted to $99,075 and $72,174, for Class B and Class C shares, respectively.
6 Contingent Deferred Sales Charge
A contingent deferred sales charge (CDSC) generally is imposed on redemptions of Class B shares made within six years of purchase and on redemptions of Class C shares made within one year of purchase. Class A shares may be subject to a CDSC up to 1% if redeemed within two years of purchase (depending upon the circumstances of purchase). Generally, the CDSC is based upon the lower of the net asset value at date of redemption or date of purchase. No charge is levied on shares acquired by reinvestment of dividends or capital gains distributions. The Class B CDSC is imposed at declining rates that begin at 5% in the case of redemptions in the first and second year after purchase, declining one percentage point each subsequent year. Class C shares are subject to a 1% CDSC if redeemed within one year of purchase. No CDSC is levied on shares which have been sold to EVM or its affiliates or to their respective employees or clients and m ay be waived under certain other limited conditions. CDSC received on Class B and Class C redemptions are paid to EVD to reduce the amount of Uncovered Distribution Charges calculated under the Fund's Class B and Class C Plans. CDSC received on Class B and Class C redemptions when no Uncovered Distribution Charges exist are credited to the Fund. The Fund was informed that EVD received approximately $1,000 and $24,000 of CDSC paid by shareholders for
13
Eaton Vance Tax-Managed Small-Cap Growth Fund as of October 31, 2007
NOTES TO FINANCIAL STATEMENTS CONT'D
Class B and Class C shares, respectively, and none paid by shareholders of Class A shares for the year ended October 31, 2007.
7 Investment Transactions
Increases and decreases in the Fund's investment in the Portfolio aggregated $11,310,255 and $26,801,830 respectively for the year ended October 31, 2007.
8 Transfer of Net Assets
At the close of business on April 28, 2006, Eaton Vance Tax-Managed Small-Cap Growth Fund 1.1 acquired the net assets of Eaton Vance Tax-Managed Small-Cap Growth Fund 1.2 pursuant to an Agreement and Plan of Reorganization dated November 14, 2005. In accordance with the agreement, Eaton Vance Tax-Managed Small-Cap Growth Fund 1.1 issued 0.806895 shares of Class A, 0.829113 shares of Class B and 0.83155 shares of Class C for each share of Class A, Class B and Class C, respectively, of Eaton Vance Tax-Managed Small-Cap Growth Fund 1.2. As a result, Eaton Vance Tax-Managed Small-Cap Growth Fund 1.1 issued 1,106,591 Class A shares, 1,040,817 Class B shares and 869,466 Class C shares having a total aggregate value of $36,300,399. The transaction was structured for tax purposes to qualify as a tax free reorganization under the Internal Revenue Code. The Eaton Vance Tax-Managed Small-Cap Growth Fund 1.2's net assets at the date of the transaction amounted to $36,300,399, including $7,235,328 of unrealized appreciation. Directly after the merger, the combined net assets of the Eaton Vance Tax-Managed Small-Cap Growth Fund 1.1 was $130,106,468 with a net asset value of $12.55, $11.75 and $11.72 for Class A, Class B and Class C, respectively.
9 Recently Issued Accounting Pronouncements
In June 2006, the Financial Accounting Standards Board (FASB) issued FASB Interpretation No. 48 (FIN 48), "Accounting for Uncertainty in Income Taxes – an interpretation of FASB Statement No. 109". FIN 48 clarifies the accounting for uncertainty in income taxes recognized in accordance with FASB Statement No. 109, "Accounting for Income Taxes". This interpretation prescribes a recognition threshold and measurement attribute for the financial statement recognition and measurement of a tax position taken or expected to be taken in a tax return. It also provides guidance on de-recognition, classification, interest and penalties, accounting in interim periods, disclosure and transition. FIN 48 is effective on the last business day of the first required financial reporting period for fiscal years beginning after December 15, 2006.
Management is currently evaluating the impact of applying the various provisions of FIN 48.
In September 2006, the FASB issued Statement of Financial Accounting Standards No. 157 (FAS 157), "Fair Value Measurements". FAS 157 defines fair value, establishes a framework for measuring fair value in accordance with generally accepted accounting principles and expands disclosure about fair value measurements. FAS 157 is effective for fiscal years beginning after November 15, 2007. Management is currently evaluating the impact the adoption of FAS 157 will have on the Fund's financial statement disclosures.
14
Eaton Vance Tax-Managed Small-Cap Growth Fund as of October 31, 2007
REPORT OF INDEPENDENT REGISTERED PUBLIC ACCOUNTING FIRM
To the Trustees of Eaton Vance Mutual Funds Trust and Shareholders of Eaton Vance
Tax-Managed Small-Cap Growth Fund:
We have audited the accompanying statement of assets and liabilities of Eaton Vance Tax-Managed Small-Cap Growth Fund (formerly Eaton Vance Tax-Managed Small-Cap Growth Fund 1.1)(the "Fund") (one of the series of Eaton Vance Mutual Funds Trust), as of October 31, 2007, and the related statement of operations for the year then ended, the statements of changes in net assets for each of the two years in the period then ended, and the financial highlights for each of the five years in the period then ended. These financial statements and financial highlights are the responsibility of the Fund's management. Our responsibility is to express an opinion on these financial statements and financial highlights based on our audits.
We conducted our audits in accordance with standards of the Public Company Accounting Oversight Board (United States). Those standards require that we plan and perform the audit to obtain reasonable assurance about whether the financial statements and financial highlights are free of material misstatement. The Fund is not required to have, nor were we engaged to perform, an audit of its internal control over financial reporting. Our audits included consideration of internal control over financial reporting as a basis for designing audit procedures that are appropriate in the circumstances, but not for the purpose of expressing an opinion on the effectiveness of the Fund's internal control over financial reporting. Accordingly, we express no such opinion. An audit also includes examining, on a test basis, evidence supporting the amounts and disclosures in the financial statements, assessing the accounting principles used and sign ificant estimates made by management, as well as evaluating the overall financial statement presentation. We believe that our audits provide a reasonable basis for our opinion.
In our opinion, the financial statements and financial highlights referred to above present fairly, in all material respects, the financial position of Eaton Vance Tax-Managed Small-Cap Growth Fund as of October 31, 2007, the results of its operations for the year then ended, the changes in its net assets for each of the two years in the period then ended, and the financial highlights for each of the five years in the period then ended, in conformity with accounting principles generally accepted in the United States of America.
DELOITTE & TOUCHE LLP
Boston, Massachusetts
December 14, 2007
15
Tax-Managed Small-Cap Growth Portfolio as of October 31, 2007
PORTFOLIO OF INVESTMENTS
| Common Stocks — 98.6% | |
| Security | | Shares | | Value | |
| Aerospace & Defense — 4.8% | |
| AAR Corp.(1) | | | 85,590 | | | $ | 2,743,159 | | |
| Alliant Techsystems, Inc.(1) | | | 28,230 | | | | 3,116,310 | | |
| Ceradyne, Inc.(1) | | | 45,230 | | | | 3,094,184 | | |
| | | $ | 8,953,653 | | |
| Auto Components — 0.4% | |
| Noble International, Ltd. | | | 41,810 | | | $ | 780,593 | | |
| | | $ | 780,593 | | |
| Biotechnology — 1.8% | |
| Martek Biosciences Corp.(1) | | | 112,850 | | | $ | 3,447,567 | | |
| | | $ | 3,447,567 | | |
| Capital Markets — 1.5% | |
| Affiliated Managers Group, Inc.(1) | | | 21,790 | | | $ | 2,866,474 | | |
| | | $ | 2,866,474 | | |
| Chemicals — 5.8% | |
| International Flavors & Fragrances, Inc. | | | 57,230 | | | $ | 2,987,978 | | |
| Scotts Miracle-Gro Co., Class A | | | 31,920 | | | | 1,464,809 | | |
| Terra Industries, Inc.(1) | | | 176,550 | | | | 6,512,929 | | |
| | | $ | 10,965,716 | | |
| Commercial Services & Supplies — 2.4% | |
| Clean Harbors, Inc.(1) | | | 18,000 | | | $ | 886,140 | | |
| FTI Consulting, Inc.(1) | | | 68,170 | | | | 3,701,631 | | |
| | | $ | 4,587,771 | | |
| Communications Equipment — 1.6% | |
| Harris Stratex Networks, Inc., Class A(1) | | | 151,477 | | | $ | 2,896,240 | | |
| | | $ | 2,896,240 | | |
| Computer Peripherals — 1.8% | |
| Brocade Communications Systems, Inc.(1) | | | 309,040 | | | $ | 2,938,970 | | |
| Stratasys, Inc.(1) | | | 19,950 | | | | 519,298 | | |
| | | $ | 3,458,268 | | |
| Security | | Shares | | Value | |
| Construction & Engineering — 3.4% | |
| Foster Wheeler, Ltd.(1)(2) | | | 43,150 | | | $ | 6,396,988 | | |
| | | $ | 6,396,988 | | |
| Distributors — 1.2% | |
| LKQ Corp.(1) | | | 58,990 | | | $ | 2,274,654 | | |
| | | $ | 2,274,654 | | |
| Diversified Consumer Services — 1.1% | |
| DeVry, Inc. | | | 38,850 | | | $ | 2,124,707 | | |
| | | $ | 2,124,707 | | |
| Electric Utilities — 1.1% | |
| ITC Holdings Corp. | | | 34,536 | | | $ | 1,976,841 | | |
| | | $ | 1,976,841 | | |
| Electronic Equipment & Instruments — 4.0% | |
| Daktronics, Inc. | | | 92,470 | | | $ | 2,757,455 | | |
| FLIR Systems, Inc.(1) | | | 57,955 | | | | 4,021,497 | | |
| Zygo Corp.(1) | | | 65,270 | | | | 767,575 | | |
| | | $ | 7,546,527 | | |
| Energy Equipment & Services — 7.1% | |
| Dresser-Rand Group, Inc.(1) | | | 89,997 | | | $ | 3,482,884 | | |
| Hornbeck Offshore Services, Inc.(1) | | | 35,425 | | | | 1,385,118 | | |
| ION Geophysical Corp.(1) | | | 207,670 | | | | 3,146,201 | | |
| NATCO Group, Inc.(1) | | | 65,755 | | | | 3,505,399 | | |
| Willbros Group, Inc.(1)(2) | | | 45,081 | | | | 1,725,250 | | |
| | | $ | 13,244,852 | | |
| Health Care Equipment & Supplies — 9.3% | |
| Cooper Cos., Inc., (The) | | | 51,600 | | | $ | 2,167,200 | | |
| DJ Orthopedics, Inc.(1) | | | 46,800 | | | | 2,337,660 | | |
| IDEXX Laboratories, Inc.(1) | | | 14,900 | | | | 1,814,522 | | |
| Respironics, Inc.(1) | | | 58,950 | | | | 2,951,037 | | |
| Sirona Dental Systems, Inc.(1) | | | 74,730 | | | | 2,513,917 | | |
| West Pharmaceutical Services, Inc. | | | 62,900 | | | | 2,600,286 | | |
| Wright Medical Group, Inc.(1) | | | 116,140 | | | | 3,077,710 | | |
| | | $ | 17,462,332 | | |
See notes to financial statements
16
Tax-Managed Small-Cap Growth Portfolio as of October 31, 2007
PORTFOLIO OF INVESTMENTS CONT'D
| Security | | Shares | | Value | |
| Health Care Providers & Services — 1.8% | |
| MWI Veterinary Supply, Inc.(1) | | | 33,590 | | | $ | 1,402,383 | | |
| VCA Antech, Inc.(1) | | | 41,290 | | | | 1,901,405 | | |
| | | $ | 3,303,788 | | |
| Household Durables — 3.3% | |
| Jarden Corp.(1) | | | 90,000 | | | $ | 3,196,800 | | |
| Universal Electronics, Inc.(1) | | | 82,340 | | | | 2,972,474 | | |
| | | $ | 6,169,274 | | |
| Household Products — 1.4% | |
| Church & Dwight Co., Inc. | | | 53,420 | | | $ | 2,527,300 | | |
| | | $ | 2,527,300 | | |
| Insurance — 2.8% | |
| Philadelphia Consolidated Holding Corp.(1) | | | 69,110 | | | $ | 2,819,688 | | |
| Protective Life Corp. | | | 56,610 | | | | 2,426,871 | | |
| | | $ | 5,246,559 | | |
| Internet Software & Services — 1.0% | |
| Ariba, Inc.(1) | | | 144,870 | | | $ | 1,874,618 | | |
| | | $ | 1,874,618 | | |
| IT Services — 1.5% | |
| Euronet Worldwide, Inc.(1) | | | 88,530 | | | $ | 2,835,616 | | |
| | | $ | 2,835,616 | | |
| Life Sciences Tools & Services — 0.7% | |
| Bruker BioSciences Corp.(1) | | | 118,640 | | | $ | 1,227,924 | | |
| | | $ | 1,227,924 | | |
| Machinery — 4.6% | |
| Kadant, Inc.(1) | | | 91,940 | | | $ | 2,985,292 | | |
| Oshkosh Truck Corp. | | | 47,710 | | | | 2,585,882 | | |
| Titan International, Inc. | | | 103,300 | | | | 3,125,858 | | |
| | | $ | 8,697,032 | | |
| Media — 4.4% | |
| Arbitron, Inc. | | | 36,340 | | | $ | 1,839,531 | | |
| Central European Media Enterprises, Ltd.(1)(2) | | | 33,420 | | | | 3,834,945 | | |
| Courier Corp. | | | 70,110 | | | | 2,649,457 | | |
| | | $ | 8,323,933 | | |
| Security | | Shares | | Value | |
| Metals & Mining — 6.5% | |
| Aber Diamond Corp.(2) | | | 80,000 | | | $ | 3,498,842 | | |
| Cleveland-Cliffs, Inc. | | | 27,980 | | | | 2,676,287 | | |
| IAMGOLD Corp.(2) | | | 172,166 | | | | 1,509,896 | | |
| RTI International Metals, Inc.(1) | | | 12,390 | | | | 968,650 | | |
| Thompson Creek Metals Co., Inc.(1)(2) | | | 63,080 | | | | 1,659,021 | | |
| Yamana Gold, Inc.(2) | | | 122,746 | | | | 1,843,645 | | |
| | | $ | 12,156,341 | | |
| Oil, Gas & Consumable Fuels — 9.2% | |
| Denbury Resources, Inc.(1) | | | 88,600 | | | $ | 5,014,760 | | |
| Forest Oil Corp.(1) | | | 66,160 | | | | 3,214,714 | | |
| Petrohawk Energy Corp.(1) | | | 205,670 | | | | 3,804,895 | | |
| Quicksilver Resources, Inc.(1) | | | 30,995 | | | | 1,766,715 | | |
| Range Resources Corp. | | | 79,215 | | | | 3,559,130 | | |
| | | $ | 17,360,214 | | |
| Personal Products — 1.6% | |
| Herbalife, Ltd.(2) | | | 69,050 | | | $ | 3,044,415 | | |
| | | $ | 3,044,415 | | |
| Pharmaceuticals — 1.6% | |
| Adams Respiratory Therapeutics, Inc.(1) | | | 69,250 | | | $ | 3,042,845 | | |
| | | $ | 3,042,845 | | |
| Road & Rail — 1.8% | |
| Kansas City Southern(1) | | | 65,470 | | | $ | 2,533,034 | | |
| Landstar System, Inc. | | | 21,830 | | | | 918,825 | | |
| | | $ | 3,451,859 | | |
| Semiconductors & Semiconductor Equipment — 3.6% | |
| Advanced Energy Industries, Inc. | | | 173,040 | | | $ | 2,768,640 | | |
| Intersil Corp., Class A | | | 40,810 | | | | 1,238,175 | | |
| Verigy, Ltd.(1)(2) | | | 117,310 | | | | 2,696,957 | | |
| | | $ | 6,703,772 | | |
| Software — 4.3% | |
| Mentor Graphics Corp.(1) | | | 58,000 | | | $ | 929,160 | | |
| Parametric Technology Corp.(1) | | | 171,650 | | | | 3,278,515 | | |
| Sybase, Inc.(1) | | | 137,400 | | | | 3,929,640 | | |
| | | $ | 8,137,315 | | |
See notes to financial statements
17
Tax-Managed Small-Cap Growth Portfolio as of October 31, 2007
PORTFOLIO OF INVESTMENTS CONT'D
| Security | | Shares | | Value | |
| Trading Companies & Distributors — 1.2% | |
| GATX Corp. | | | 54,450 | | | $ | 2,230,817 | | |
| | | $ | 2,230,817 | | |
Total Common Stocks
(identified cost $134,850,003) | | | | | | $ | 185,316,805 | | |
| Special Warrants — 0.1% | |
| Security | | Shares | | Value | |
| Metals & Mining — 0.1% | |
| Western Exploration and Development, Ltd.(1)(2)(3)(4) | | | 600,000 | | | $ | 180,000 | | |
| | | $ | 180,000 | | |
Total Special Warrants
(identified cost $480,000) | | | | | | $ | 180,000 | | |
| Private Placements — 0.0% | |
| Security | | Shares | | Value | |
| Metals & Mining — 0.0% | |
| Nevada Pacific Mining Co.(1)(3)(4) | | | 80,000 | | | $ | 56,000 | | |
| | | $ | 56,000 | | |
Total Private Placements
(identified cost $80,000) | | | | | | $ | 56,000 | | |
| Short-Term Investments — 3.1% | |
| Description | | Interest
(000's omitted) | | Value | |
| Investment in Cash Management Portfolio, 4.83%(5) | | $ | 5,856 | | | $ | 5,855,953 | | |
Total Short-Term Investments
(identified cost $5,855,953) | | | | | | $ | 5,855,953 | | |
Total Investments — 101.8%
(identified cost $141,265,956) | | | | | | $ | 191,408,758 | | |
| Other Assets, Less Liabilities — (1.8)% | | | | | | $ | (3,370,246 | ) | |
| Net Assets — 100.0% | | | | | | $ | 188,038,512 | | |
(1) Non-income producing security.
(2) Foreign security.
(3) Restricted security.
(4) Security valued at fair value using methods determined in good faith by or at the direction of the Trustees of the Portfolio.
(5) Affiliated investment company available to Eaton Vance portfolios and funds which invests in high quality U.S. dollar denominated money market instruments. The rate shown is the annualized seven-day yield as of October 31, 2007.
| Country Concentration of Portfolio | |
| Country | | Percentage
of Net Assets | | Value | |
| United States | | | 87.8 | % | | $ | 165,018,800 | | |
| Bermuda | | | 5.5 | | | | 10,231,932 | | |
| Canada | | | 4.6 | | | | 8,691,404 | | |
| Cayman Islands | | | 1.6 | | | | 3,044,415 | | |
| Singapore | | | 1.4 | | | | 2,696,957 | | |
| Panama | | | 0.9 | | | | 1,725,250 | | |
| | | | 101.8 | % | | $ | 191,408,758 | | |
See notes to financial statements
18
Tax-Managed Small-Cap Growth Portfolio as of October 31, 2007
FINANCIAL STATEMENTS
Statement of Assets and Liabilities
As of October 31, 2007
| Assets | |
| Unaffiliated investments, at value (identified cost, $135,410,003) | | $ | 185,552,805 | | |
| Affiliated investment, at value (identified cost, $5,855,953) | | | 5,855,953 | | |
| Dividends receivable | | | 8,806 | | |
| Interest receivable from affiliated investment | | | 29,200 | | |
| Total assets | | $ | 191,446,764 | | |
| Liabilities | |
| Payable for investments purchased | | $ | 3,214,132 | | |
| Payable to affiliate for investment advisory fees | | | 93,261 | | |
| Payable to affiliate for Trustees' fees | | | 1,026 | | |
| Other accrued expenses | | | 99,833 | | |
| Total liabilities | | $ | 3,408,252 | | |
| Net Assets applicable to investors' interest in Portfolio | | $ | 188,038,512 | | |
| Sources of Net Assets | |
| Net proceeds from capital contributions and withdrawals | | $ | 137,895,710 | | |
| Net unrealized appreciation (computed on the basis of identified cost) | | | 50,142,802 | | |
| Total | | $ | 188,038,512 | | |
Statement of Operations
For the Year Ended
October 31, 2007
| Investment Income | |
| Dividends (net of foreign taxes, $13,629) | | $ | 613,464 | | |
| Interest | | | 5,432 | | |
| Interest income allocated from affiliated investment | | | 275,155 | | |
| Expenses allocated from affiliated investment | | | (25,845 | ) | |
| Total investment income | | $ | 868,206 | | |
| Expenses | |
| Investment adviser fee | | $ | 1,048,465 | | |
| Trustees' fees and expenses | | | 12,362 | | |
| Custodian fee | | | 119,539 | | |
| Legal and accounting services | | | 53,724 | | |
| Miscellaneous | | | 4,906 | | |
| Total expenses | | $ | 1,238,996 | | |
Deduct —
Reduction of custodian fee | | $ | 1 | | |
| Total expense reductions | | $ | 1 | | |
| Net expenses | | $ | 1,238,995 | | |
| Net investment loss | | $ | (370,789 | ) | |
| Realized and Unrealized Gain (Loss) | |
Net realized gain (loss) —
Investment transactions (identified cost basis) | | $ | 19,549,201 | | |
| Foreign currency transactions | | | (1,214 | ) | |
| Net realized gain | | $ | 19,547,987 | | |
Change in unrealized appreciation (depreciation) —
Investments (identified cost basis) | | $ | 25,306,878 | | |
| Net change in unrealized appreciation (depreciation) | | $ | 25,306,878 | | |
| Net realized and unrealized gain | | $ | 44,854,865 | | |
| Net increase in net assets from operations | | $ | 44,484,076 | | |
See notes to financial statements
19
Tax-Managed Small-Cap Growth Portfolio as of October 31, 2007
FINANCIAL STATEMENTS CONT'D
Statements of Changes in Net Assets
Increase (Decrease)
in Net Assets | | Year Ended
October 31, 2007 | | Year Ended
October 31, 2006 | |
From operations —
Net investment income (loss) | | $ | (370,789 | ) | | $ | 22,629 | | |
Net realized gain from investment
transactions and foreign
currency transactions | | | 19,547,987 | | | | 28,418,574 | | |
Net change in unrealized appreciation
(depreciation) of investments | | | 25,306,878 | | | | 3,443,053 | | |
| Net increase in net assets from operations | | $ | 44,484,076 | | | $ | 31,884,256 | | |
Capital transactions —
Contributions | | $ | 19,007,575 | | | $ | 46,024,279 | | |
| Withdrawals | | | (34,503,149 | ) | | | (71,979,536 | ) | |
Net decrease in net assets from
capital transactions | | $ | (15,495,574 | ) | | $ | (25,955,257 | ) | |
| Net increase in net assets | | $ | 28,988,502 | | | $ | 5,928,999 | | |
| Net Assets | |
| At beginning of year | | $ | 159,050,010 | | | $ | 153,121,011 | | |
| At end of year | | $ | 188,038,512 | | | $ | 159,050,010 | | |
See notes to financial statements
20
Tax-Managed Small-Cap Growth Portfolio as of October 31, 2007
FINANCIAL STATEMENTS CONT'D
Supplementary Data
| | | Year Ended October 31, | |
| | | 2007 | | 2006 | | 2005 | | 2004 | | 2003 | |
| Ratios/Supplemental Data | |
| Ratios (As a percentage of average daily net assets): | |
| Expenses before custodian fee reduction | | | 0.74 | % | | | 0.74 | %(1) | | | 0.74 | %(1) | | | 0.75 | % | | | 0.73 | % | |
| Expenses after custodian fee reduction | | | 0.74 | % | | | 0.74 | %(1) | | | 0.74 | %(1) | | | 0.75 | % | | | 0.73 | % | |
| Net investment income (loss) | | | (0.22 | )% | | | 0.01 | % | | | (0.34 | )% | | | (0.50 | )% | | | (0.53 | )% | |
| Portfolio Turnover | | | 78 | % | | | 99 | % | | | 223 | % | | | 282 | % | | | 248 | % | |
| Total Return | | | 29.67 | % | | | 22.33 | % | | | 9.52 | % | | | (1.05 | )%(2) | | | 27.24 | % | |
| Net assets, end of year (000's omitted) | | $ | 188,039 | | | $ | 159,050 | | | $ | 153,121 | | | $ | 180,777 | | | $ | 226,702 | | |
(1) The investment adviser waived a portion of its investment advisory fee (equal to less than 0.01% and 0.01% of average daily net assets for 2006 and 2005, respectively).
(2) The Portfolio's net increase from payments by affiliate and net gains (losses) realized on the disposal of investments purchased which did not meet the Portfolio's investment guidelines had no effect on total return for the year ended October 31, 2004.
See notes to financial statements
21
Tax-Managed Small-Cap Growth Portfolio as of October 31, 2007
NOTES TO FINANCIAL STATEMENTS
1 Significant Accounting Policies
Tax-Managed Small-Cap Growth Portfolio (the Portfolio) is registered under the Investment Company Act of 1940, as amended (the 1940 Act), as a diversified open-end management investment company. The Portfolio, which was organized as a trust under the laws of the State of New York on June 22, 1998, seeks to achieve long-term after-tax returns by investing in a diversified portfolio of equity securities of small-cap companies. The Declaration of Trust permits the Trustees to issue interests in the Portfolio. At October 31, 2007, the Eaton Vance Tax-Managed Small-Cap Growth Fund and the Eaton Vance Tax-Managed Equity Asset Allocation Fund held 71.0% and 28.9% interests in the Portfolio, respectively. The following is a summary of significant accounting policies followed by the Portfolio in the preparation of its financial statements. The policies are in conformity with accounting principles generally accepted in the United States o f America.
A Investment Valuation — Securities listed on a U.S. securities exchange generally are valued at the last sale price on the day of valuation or, if no sales took place on such date, at the mean between the closing bid and asked prices therefore on the exchange where such securities are principally traded. Equity securities listed on the NASDAQ Global or Global Select Market generally are valued at the NASDAQ official closing price. Unlisted or listed securities for which closing sales prices or closing quotations are not available are valued at the mean between the latest available bid and asked prices or, in the case of preferred equity securities that are not listed or traded in the over-the-counter market, by an independent pricing service. Exchange-traded options are valued at the last sale price for the day of valuation as quoted on the principal exchange or board of trade on which the options are traded or, in the absence of sales on such date, at the mean between the latest bid and asked prices therefore. Futures positions on securities and currencies generally are valued at closing settlement prices. Short-term debt securities with a remaining maturity of 60 days or less are valued at amortized cost. If short-term debt securities are acquired with a remaining maturity of more than 60 days, they will be valued by a pricing service. Other fixed income and debt securities, including listed securities and securities for which price quotations are available, will normally be valued on the basis of valuations furnished by a pricing service. Foreign securities and currencies are valued in U.S. dollars, based on foreign currency exchange rate quotations supplied by an independent quotation service. The daily valuation of exchange-traded foreign securities generally is determ ined as of the close of trading on the principal exchange on which such securities trade. Events occurring after the close of trading on foreign exchanges may result in adjustments to the valuation of foreign securities to more accurately reflect their fair value as of the close of regular trading on the New York Stock Exchange. When valuing foreign equity securities that meet certain criteria, the Trustees have approved the use of a fair value service that values such securities to reflect market trading that occurs after the close of the applicable foreign markets of comparable securities or other instruments that have a strong correlation to the fair-valued securities. Investments held by the Portfolio for which valuations or market quotations are unavailable are valued at fair value using methods determined in good faith by or at the direction of the Trustees of the Portfolio considering relevant factors, data and information includi ng the market value of freely tradable securities of the same class in the principal market on which such securities are normally traded.
The Portfolio may invest in Cash Management Portfolio (Cash Management), an affiliated investment company managed by Boston Management and Research (BMR), a subsidiary of Eaton Vance Management (EVM). Cash Management values its investment securities utilizing the amortized cost valuation technique permitted by Rule 2a-7 of the 1940 Act. This technique involves initially valuing a portfolio security at its cost and thereafter assuming a constant amortization to maturity of any discount or premium.
B Investment Transactions — Investment transactions are accounted for on a trade date basis. Realized gains and losses on securities sold are determined on the basis of identified cost.
C Income — Dividend income is recorded on the ex-dividend date for dividends received in cash and/or securities. However, if the ex-dividend date has passed, certain dividends from foreign securities are recorded as the Portfolio is informed of the ex-dividend date. Withholding taxes on foreign dividends and capital gains have been provided for in accordance with the Portfolio's understanding of the applicable countries' tax rules and rates. Interest income is recorded on the basis of interest accrued, adjusted for amortization of premium or accretion of discount.
D Federal Taxes — The Portfolio has elected to be treated as a partnership for federal tax purposes. No provision is made by the Portfolio for federal or state taxes on any taxable income of the Portfolio because each
22
Tax-Managed Small-Cap Growth Portfolio as of October 31, 2007
NOTES TO FINANCIAL STATEMENTS CONT'D
investor in the Portfolio is ultimately responsible for the payment of any taxes on its share of taxable income. Since at least one of the Portfolio's investors is a regulated investment company that invests all or substantially all of its assets in the Portfolio, the Portfolio normally must satisfy the applicable source of income and diversification requirements (under the Internal Revenue Code) in order for its investors to satisfy them. The Portfolio will allocate, at least annually among its investors, each investor's distributive share of the Portfolio's net investment income, net realized capital gains, and any other items of income, gain, loss, deduction or credit.
E Expense Reduction — State Street Bank and Trust Company (SSBT) serves as custodian of the Portfolio. Pursuant to the custodian agreement, SSBT receives a fee reduced by credits, which are determined based on the average daily cash balance the Portfolio maintains with SSBT. All credit balances, if any, used to reduce the Portfolio's custodian fees are reported as a reduction of expenses in the Statement of Operations.
F Foreign Currency Translation — Investment valuations, other assets, and liabilities initially expressed in foreign currencies are converted each business day into U.S. dollars based upon current exchange rates. Purchases and sales of foreign investment securities and income and expenses are converted into U.S. dollars based upon currency exchange rates prevailing on the respective dates of such transactions. Recognized gains or losses on investment transactions attributable to changes in foreign currency exchange rates are recorded for financial statement purposes as net realized gains and losses on investments. That portion of unrealized gains and losses on investments that results from fluctuation s in foreign currency exchange rates is not separately disclosed.
G Use of Estimates — The preparation of the financial statements in conformity with accounting principles generally accepted in the United States of America requires management to make estimates and assumptions that affect the reported amounts of assets and liabilities at the date of the financial statements and the reported amounts of income and expense during the reporting period. Actual results could differ from those estimates.
H Indemnifications — Under the Portfolio's organizational documents, its officers and Trustees may be indemnified against certain liabilities and expenses arising out of the performance of their duties to the Portfolio. Interestholders in the Portfolio are jointly and severally liable for the liabilities and obligations of the Portfolio in the event that the Portfolio fails to satisfy such liabilities and obligations; provided, however, that, to the extent assets are available in the Portfolio, the Portfolio may, under certain circumstances, indemnify interestholders from and against any claim or liability to which such holder may become subject by reason of being or having been an interestholder in t he Portfolio. Additionally, in the normal course of business, the Portfolio enters into agreements with service providers that may contain indemnification clauses. The Portfolio's maximum exposure under these arrangements is unknown as this would involve future claims that may be made against the Portfolio that have not yet occurred.
2 Investment Adviser Fee and Other Transactions with Affiliates
The investment adviser fee is earned by BMR as compensation for management and investment advisory services rendered to the Portfolio. Pursuant to the advisory agreement, BMR receives a monthly fee at the annual rate of 0.625% of the Portfolio's average daily net assets of the Portfolio up to $500 million and at reduced rates as daily net assets exceed that level. The portion of the advisory fee payable by Cash Management on the Portfolio's investment of cash therein is credited against the Portfolio's advisory fees. For the year ended October 31, 2007, the Portfolio's advisory fee totaled $1,073,415 of which $24,950 was allocated from Cash Management and $1,048,465 was paid or accrued directly by the Portfolio.
Except as to Trustees of the Portfolio who are not members of EVM's or BMR's organizations, officers and Trustees receive remuneration for their services to the Portfolio out of the investment adviser fee. Trustees of the Portfolio who are not affiliated with the investment adviser may elect to defer receipt of all or a percentage of their annual fees in accordance with the terms of the Trustees Deferred Compensation Plan. For the year ended October 31, 2007, no significant amounts have been deferred.
Certain officers and Trustees of the Portfolio are officers of the above organizations.
23
Tax-Managed Small-Cap Growth Portfolio as of October 31, 2007
NOTES TO FINANCIAL STATEMENTS CONT'D
3 Investment Transactions
Purchases and sales of investments, other than short-term obligations, aggregated $130,918,311 and $147,529,670, respectively, for the year ended October 31, 2007.
4 Federal Income Tax Basis of Unrealized Appreciation (Depreciation)
The cost and unrealized appreciation (depreciation) in value of the investments owned at October 31, 2007, as determined on a federal income tax basis, were as follows:
| Aggregate cost | | $ | 141,265,956 | | |
| Gross unrealized appreciation | | $ | 51,713,753 | | |
| Gross unrealized depreciation | | | (1,570,951 | ) | |
| Net unrealized appreciation | | $ | 50,142,802 | | |
5 Risk Associated with Foreign Investments
Investing in securities issued by companies whose principal business activities are outside the United States may involve significant risks not present in domestic investments. For example, there is generally less publicly available information about foreign companies, particularly those not subject to the disclosure and reporting requirements of the U.S. securities laws. Foreign issuers are generally not bound by uniform accounting, auditing, and financial reporting requirements and standards of practice comparable to those applicable to domestic issuers. Investments in foreign securities also involve the risk of possible adverse changes in investment or exchange control regulations, expropriation or confiscatory taxation, limitation on the removal of funds or other assets of the Portfolio, political or financial instability or diplomatic and other developments which could affect such investments. Foreign stock markets, while g rowing in volume and sophistication, are generally not as developed as those in the United States, and securities of some foreign issuers (particularly those located in developing countries) may be less liquid and more volatile than securities of comparable U.S. companies. In general, there is less overall governmental supervision and regulation of foreign securities markets, broker-dealers and issuers than in the United States.
6 Financial Instruments
The Portfolio may trade in financial instruments with off-balance sheet risk in the normal course of its investing activities to assist in managing exposure to various market risks. These financial instruments may include written options, forward foreign currency exchange contracts and financial futures contracts and may involve, to a varying degree, elements of risk in excess of the amounts recognized for financial statement purposes. The notional or contractual amounts of these instruments represent the investment the Portfolio has in particular classes of financial instruments and does not necessarily represent the amounts potentially subject to risk. The measurement of the risks associated with these instruments is meaningful only when all related and offsetting transactions are considered. The Portfolio did not have any open obligations under these fina ncial instruments at October 31, 2007.
7 Line of Credit
The Portfolio participates with other portfolios and funds managed by EVM and its affiliates in a $200 million unsecured line of credit agreement with a group of banks. Borrowings will be made by the Portfolio solely to facilitate the handling of unusual and/or unanticipated short-term cash requirements. Interest is charged to the Portfolio based on its borrowings at an amount above either the Eurodollar rate or Federal Funds rate. In addition, a fee computed at an annual rate of 0.07% on the daily unused portion of the line of credit is allocated among the participating portfolios and funds at the end of each quarter. The Portfolio did not have any significant borrowings or allocated fees during the year ended October 31, 2007.
8 Restricted Securities
At October 31, 2007, the Portfolio owned the following securities (representing 0.13% of net assets) which were restricted as to public resale and not registered under the Securities Act of 1933. The fair value is determined using methods determined in good faith by or at the direction of the Trustees.
| Description | | Date of
Acquisition | | Shares | | Cost | | Fair Value | |
| Private Placements | |
| Nevada Pacific Mining Co. | | 12/21/98 | | | 80,000 | | | $ | 80,000 | | | $ | 56,000 | | |
| | | $ | 80,000 | | | $ | 56,000 | | |
| Special Warrants | |
Western Exploration
and Development, Ltd. | | 12/21/98 | | | 600,000 | | | $ | 480,000 | | | $ | 180,000 | | |
| | | $ | 480,000 | | | $ | 180,000 | | |
24
Tax-Managed Small-Cap Growth Portfolio as of October 31, 2007
NOTES TO FINANCIAL STATEMENTS CONT'D
9 Recently Issued Accounting Pronouncements
In June 2006, the Financial Accounting Standards Board (FASB) issued FASB Interpretation No. 48 (FIN 48), "Accounting for Uncertainty in Income Taxes – an interpretation of FASB Statement No. 109". FIN 48 clarifies the accounting for uncertainty in income taxes recognized in accordance with FASB Statement No. 109, "Accounting for Income Taxes". This interpretation prescribes a recognition threshold and measurement attribute for the financial statement recognition and measurement of a tax position taken or expected to be taken in a tax return. It also provides guidance on de-recognition, classification, interest and penalties, accounting in interim periods, disclosure and transition. FIN 48 is effective on the last business day of the first required financial reporting period for fiscal years beginning after December 15, 2006. Management is currently evaluating the impact of applying the various provisions of FIN 48.
In September 2006, the FASB issued Statement of Financial Accounting Standards No. 157 (FAS 157), "Fair Value Measurements". FAS 157 defines fair value, establishes a framework for measuring fair value in accordance with generally accepted accounting principles and expands disclosure about fair value measurements. FAS 157 is effective for fiscal years beginning after November 15, 2007. Management is currently evaluating the impact the adoption of FAS 157 will have on the Portfolio's financial statement disclosures.
25
Tax-Managed Small-Cap Growth Portfolio as of October 31, 2007
REPORT OF INDEPENDENT REGISTERED PUBLIC ACCOUNTING FIRM
To the Trustees and Investors
of Tax-Managed Small-Cap Growth Portfolio:
We have audited the accompanying statement of assets and liabilities of Tax-Managed Small-Cap Growth Portfolio (the "Portfolio"), including the portfolio of investments, as of October 31, 2007, and the related statement of operations for the year then ended, the statements of changes in net assets for each of the two years in the period then ended, and the supplementary data for each of the five years in the period then ended. These financial statements and supplementary data are the responsibility of the Portfolio's management. Our responsibility is to express an opinion on these financial statements and supplementary data based on our audits.
We conducted our audits in accordance with standards of the Public Company Accounting Oversight Board (United States). Those standards require that we plan and perform the audit to obtain reasonable assurance about whether the financial statements and supplementary data are free of material misstatement. The Portfolio is not required to have, nor were we engaged to perform, an audit of its internal control over financial reporting. Our audits included consideration of internal control over financial reporting as a basis for designing audit procedures that are appropriate in the circumstances, but not for the purpose of expressing an opinion on the effectiveness of the Portfolio's internal control over financial reporting. Accordingly, we express no such opinion. An audit includes examining, on a test basis, evidence supporting the amounts and disclosures in the financial statements, assessing the accounting principles used and s ignificant estimates made by management, as well as evaluating the overall financial statement presentation. Our procedures included confirmation of securities owned as of October 31, 2007, by correspondence with the custodian and brokers; where replies were not received from brokers, we performed other auditing procedures. We believe that our audits provide a reasonable basis for our opinion.
In our opinion, the financial statements and supplementary data present fairly, in all material respects, the financial position of Tax-Managed Small-Cap Growth Portfolio as of October 31, 2007, the results of its operations for the year then ended, the changes in its net assets for each of the two years in the period then ended, and the supplementary data for each of the five years in the period then ended, in conformity with accounting principles generally accepted in the United States of America.
DELOITTE & TOUCHE LLP
Boston, Massachusetts
December 14, 2007
26
Eaton Vance Tax-Managed Small-Cap Growth Fund
BOARD OF TRUSTEES' ANNUAL APPROVAL OF THE INVESTMENT ADVISORY AGREEMENT
Overview of the Contract Review Process
The Investment Company Act of 1940, as amended (the "1940 Act"), provides, in substance, that each investment advisory agreement between a fund and its investment adviser will continue in effect from year to year only if its continuance is approved at least annually by the fund's board of trustees, including by a vote of a majority of the trustees who are not "interested persons" of the fund ("Independent Trustees"), cast in person at a meeting called for the purpose of considering such approval.
At a meeting of the Boards of Trustees (each a "Board") of the Eaton Vance group of mutual funds (the "Eaton Vance Funds") held on April 23, 2007, the Board, including a majority of the Independent Trustees, voted to approve continuation of existing advisory and sub-advisory agreements for the Eaton Vance Funds for an additional one-year period. In voting its approval, the Board relied upon the affirmative recommendation of the Special Committee of the Board, which is a committee comprised exclusively of Independent Trustees. Prior to making its recommendation, the Special Committee reviewed information furnished for a series of meetings of the Special Committee held in February, March and April 2007. Such information included, among other things, the following:
Information about Fees, Performance and Expenses
• An independent report comparing the advisory and related fees paid by each fund with fees paid by comparable funds;
• An independent report comparing each fund's total expense ratio and its components to comparable funds;
• An independent report comparing the investment performance of each fund to the investment performance of comparable funds over various time periods;
• Data regarding investment performance in comparison to relevant peer groups of funds and appropriate indices;
• Comparative information concerning fees charged by each adviser for managing other mutual funds and institutional accounts using investment strategies and techniques similar to those used in managing the fund;
• Profitability analyses for each adviser with respect to each fund;
Information about Portfolio Management
• Descriptions of the investment management services provided to each fund, including the investment strategies and processes employed;
• Information concerning the allocation of brokerage and the benefits received by each adviser as a result of brokerage allocation, including information concerning the acquisition of research through "soft dollar" benefits received in connection with the funds' brokerage, and the implementation of a soft dollar reimbursement program established with respect to the funds;
• Data relating to portfolio turnover rates of each fund;
• The procedures and processes used to determine the fair value of fund assets and actions taken to monitor and test the effectiveness of such procedures and processes;
Information about each Adviser
• Reports detailing the financial results and condition of each adviser;
• Descriptions of the qualifications, education and experience of the individual investment professionals whose responsibilities include portfolio management and investment research for the funds, and information relating to their compensation and responsibilities with respect to managing other mutual funds and investment accounts;
• Copies of the Codes of Ethics of each adviser and its affiliates, together with information relating to compliance with and the administration of such codes;
• Copies of or descriptions of each adviser's proxy voting policies and procedures;
• Information concerning the resources devoted to compliance efforts undertaken by each adviser and its affiliates on behalf of the funds (including descriptions of various compliance programs) and their record of compliance with investment policies and restrictions, including policies with respect to market-timing, late trading and selective portfolio disclosure, and with policies on personal securities transactions;
• Descriptions of the business continuity and disaster recovery plans of each adviser and its affiliates;
Other Relevant Information
• Information concerning the nature, cost and character of the administrative and other non-investment management services provided by Eaton Vance Management and its affiliates;
• Information concerning management of the relationship with the custodian, subcustodians and fund accountants by each adviser or the funds' administrator; and
• The terms of each advisory agreement.
27
Eaton Vance Tax-Managed Small-Cap Growth Fund
BOARD OF TRUSTEES' ANNUAL APPROVAL OF THE INVESTMENT ADVISORY AGREEMENT CONT'D
In addition to the information identified above, the Special Committee considered information provided from time to time by each adviser throughout the year at meetings of the Board and its committees. Over the course of the twelve-month period ended April 30, 2007, the Board met ten times and the Special Committee, the Audit Committee and the Governance Committee, each of which is a Committee comprised solely of Independent Trustees, met twelve, fourteen and eight times, respectively. At such meetings, the Trustees received, among other things, presentations by the portfolio managers and other investment professionals of each adviser relating to the investment performance of each fund and the investment strategies used in pursuing the fund's investment objective.
For funds that invest through one or more underlying portfolios, the Board considered similar information about the portfolio(s) when considering the approval of advisory agreements. In addition, in cases where the fund's investment adviser has engaged a sub-adviser, the Board considered similar information about the sub-adviser when considering the approval of any sub-advisory agreement.
The Special Committee was assisted throughout the contract review process by Goodwin Procter LLP, legal counsel for the Independent Trustees. The members of the Special Committee relied upon the advice of such counsel and their own business judgment in determining the material factors to be considered in evaluating each advisory and sub-advisory agreement and the weight to be given to each such factor. The conclusions reached with respect to each advisory and sub-advisory agreement were based on a comprehensive evaluation of all the information provided and not any single factor. Moreover, each member of the Special Committee may have placed varying emphasis on particular factors in reaching conclusions with respect to each advisory and sub-advisory agreement.
Results of the Process
Based on its consideration of the foregoing, and such other information as it deemed relevant, including the factors and conclusions described below, the Special Committee concluded that the continuance of the investment advisory agreement of the Tax-Managed Small-Cap Growth Portfolio (the "Portfolio"), the portfolio in which the Eaton Vance Tax-Managed Small-Cap Growth Fund (the "Fund") invests, with Boston Management and Research (the "Adviser"), including its fee structure, is in the interests of shareholders and, therefore, the Special Committee recommended to the Board approval of the agreement. The Board accepted the recommendation of the Special Committee as well as the factors considered and conclusions reached by the Special Committee with respect to the agreement. Accordingly, the Board, including a majority of the Independent Trustees, voted to approve continuation of the investment advisory agreement for the Portfoli o.
Nature, Extent and Quality of Services
In considering whether to approve the investment advisory agreement of the Portfolio, the Board evaluated the nature, extent and quality of services provided to the Portfolio by the Adviser.
The Board considered the Adviser's management capabilities and investment process with respect to the types of investments held by the Portfolio, including the education, experience and number of its investment professionals and other personnel who provide portfolio management, investment research, and similar services to the Portfolio. The Board specifically noted the Adviser's in-house equity research capabilities and experience in managing funds that seek to maximize after-tax returns. The Board also took into account the resources dedicated to portfolio management and other services, including the compensation paid to recruit and retain investment personnel, and the time and attention devoted to the Portfolio by senior management.
The Board reviewed the compliance programs of the Adviser and relevant affiliates thereof. Among other matters, the Board considered compliance and reporting matters relating to personal trading by investment personnel, selective disclosure of portfolio holdings, late trading, frequent trading, portfolio valuation, business continuity and the allocation of investment opportunities. The Board also evaluated the responses of the Adviser and its affiliates to requests from regulatory authorities such as the Securities and Exchange Commission and the National Association of Securities Dealers.
The Board considered shareholder and other administrative services provided or managed by Eaton Vance Management and its affiliates, including transfer agency and accounting services. The Board evaluated the benefits to shareholders of investing in a fund that is a part of a large family of funds, including the ability, in many cases, to exchange an investment among different funds without incurring additional sales charges.
After consideration of the foregoing factors, among others, the Board concluded that the nature, extent and quality of services provided by the Adviser, taken as a whole, are appropriate and consistent with the terms of the investment advisory agreement.
Fund Performance
The Board compared the Fund's investment performance to a relevant universe of similarly managed funds identified by an independent data provider and appropriate benchmark indices. The Board reviewed comparative performance data for the one-, three- and five-year
28
Eaton Vance Tax-Managed Small-Cap Growth Fund
BOARD OF TRUSTEES' ANNUAL APPROVAL OF THE INVESTMENT ADVISORY AGREEMENT CONT'D
periods ended September 30, 2006 for the Fund. The Board noted that actions were taken during 2006 to improve the performance of the Fund and concluded that such actions were effective.
Management Fees and Expenses
The Board reviewed contractual investment advisory fee rates payable, including any administrative fee rates, payable by the Portfolio and the Fund (referred to as "management fees"). As part of its review, the Board considered the management fees and the Fund's total expense ratio for the year ended September 30, 2006, as compared to a group of similarly managed funds selected by an independent data provider.
After reviewing the foregoing information, and in light of the nature, extent and quality of the services provided by the Adviser, the Board concluded that the management fees charged for advisory and related services and the Fund's total expense ratio are reasonable.
Profitability
The Board reviewed the level of profits realized by the Adviser and relevant affiliates thereof in providing investment advisory and administrative services to the Portfolio, the Fund and to all Eaton Vance Funds as a group. The Board considered the level of profits realized without regard to revenue sharing or other payments by the Adviser and its affiliates to third parties in respect of distribution services. The Board also considered other direct or indirect benefits received by the Adviser and its affiliates in connection with its relationship with the Portfolio and the Fund, including the benefits of research services that may be available to the Adviser as a result of securities transactions effected for the Portfolio and other advisory clients.
The Board concluded that, in light of the foregoing factors and the nature, extent and quality of the services rendered, the profits realized by the Adviser and its affiliates are reasonable.
Economies of Scale
In reviewing management fees and profitability, the Board also considered the extent to which the Adviser and its affiliates, on the one hand, and the Fund, on the other hand, can expect to realize benefits from economies of scale as the assets of the Fund and the Portfolio increase. The Board acknowledged the difficulty in accurately measuring the benefits resulting from the economies of scale with respect to the management of any specific fund or group of funds. The Board reviewed data summarizing the increases and decreases in the assets of the Fund and of all Eaton Vance Funds as a group over various time periods, and evaluated the extent to which the total expense ratio of the Fund and the profitability of the Adviser and its affiliates may have been affected by such increases or decreases. Based upon the foregoing, the Board concluded that the benefits from economies of scale are currently being shared equitably by the Adv iser and its affiliates and the Fund. The Board also concluded that, assuming reasonably foreseeable increases in the assets of the Portfolio, the structure of the Portfolio advisory fee, which includes breakpoints at several asset levels, can be expected to cause the Adviser and its affiliates and the Fund and the Portfolio to continue to share such benefits equitably.
29
Eaton Vance Tax-Managed Small-Cap Growth Fund
MANAGEMENT AND ORGANIZATION
Fund Management. The Trustees of Eaton Vance Mutual Funds Trust (the Trust) and Tax-Managed Small-Cap Growth Portfolio (the Portfolio) are responsible for the overall management and supervision of the Trust's and Portfolio's affairs. The Trustees and officers of the Trust and the Portfolio are listed below. Except as indicated, each individual has held the office shown or other offices in the same company for the last five years. Trustees and officers of the Trust and the Portfolio hold indefinite terms of office. The "noninterested Trustees" consist of those Trustees who are not "interested persons" of the Trust and the Portfolio, as that term is defined under the 1940 Act. The business address of each Trustee and officer is The Eaton Vance Building, 255 State Street, Boston, Massachusetts 02109. As used below, "EVC" refers to Eaton Vance Corp., "EV" refers to Eaton Vance, Inc., "EVM" refers to Eaton Vance Management, "BMR" refers to Boston Management and Research, "Parametric" refers to Parametric Portfolio Associates and "EVD" refers to Eaton Vance Distributors, Inc. EVC and EV are the corporate parent and trustee, respectively, of EVM and BMR. EVD is the Fund's principal underwriter, the Portfolio's placement agent and a wholly-owned subsidiary of EVM. Each officer affiliated with Eaton Vance may hold a position with other Eaton Vance affiliates that is comparable to his and her position with EVM listed below.
Name and
Date of Birth | | Position(s)
with the
Trust and the
Portfolio | | Term of
Office and
Length of
Service | | Principal Occupation(s)
During Past Five Years | | Number of Portfolios
in Fund Complex
Overseen By
Trustee(1) | | Other Directorships Held | |
| Interested Trustee | | | | | | | | | | | | | |
|
Thomas E. Faust Jr.
5/31/58 | | Trustee and President of the Trust | | Trustee since 2007 and
President of the Trust since 2002 | | Chairman, Chief Executive Officer and President of EVC, President of EV, Chief Executive Officer and President of EVM and BMR, and Director of EVD. Trustee and/or Officer of 176 registered investment companies and 5 private investment companies in the Eaton Vance Fund Complex. Mr. Faust is an interested person because of his positions with EVM, BMR, EVC and EV which are affiliates of the Trust and Portfolio. | | | 176 | | | Director of EVC | |
|
| Noninterested Trustee(s) | | | | | | | | | | | | | |
|
Benjamin C. Esty
1/2/63 | | Trustee | | Since 2005 | | Roy and Elizabeth Simmons Professor of Business Administration, Harvard University Graduate School of Business Administration (since 2003). Formerly, Associate Professor, Harvard University Graduate School of Business Administration (2000-2003). | | | 176 | | | None | |
|
Allen R. Freedman
4/3/40 | | Trustee | | Since 2007 | | Former Chairman and Chief Executive Officer of Assurant, Inc. (insurance provider) (1978-2000). Formerly, a Director of Loring Ward International (fund distributor) (2005-2007). | | | 175 | | �� | Director of Assurant, Inc. and Stonemor Partners L.P. (owner and operator of cemeteries) | |
|
William H. Park
9/19/47 | | Trustee | | Since 2003 | | Vice Chairman, Commercial Industrial Finance Corp. (specialty finance company) (since 2006). Formerly, President and Chief Executive Officer, Prizm Capital Management, LLC (investment management firm) (since 2002-2005). | | | 176 | | | None | |
|
Ronald A. Pearlman
7/10/40 | | Trustee | | Since 2003 | | Professor of Law, Georgetown University Law Center. | | | 176 | | | None | |
|
Norton H. Reamer
9/21/35 | | Trustee | | Trustee of the Trust
since 1986; of the Portfolio since 1998 | | President, Chief Executive Officer and a Director of Asset Management Finance Corp. (a specialty finance company serving the investment management industry) (since October 2003). President, Unicorn Corporation (an investment and financial advisory services company) (since September 2000). Formerly, Chairman and Chief Operating Officer, Hellman, Jordan Management Co., Inc. (an investment management company) (2000-2003). Formerly, Advisory Director of Berkshire Capital Corporation (investment banking firm) (2002-2003). | | | 176 | | | None | |
|
30
Eaton Vance Tax-Managed Small-Cap Growth Fund
MANAGEMENT AND ORGANIZATION CONT'D
Name and
Date of Birth | | Position(s)
with the
Trust and the
Portfolio | | Term of
Office and
Length of
Service | | Principal Occupation(s)
During Past Five Years | | Number of Portfolios
in Fund Complex
Overseen By
Trustee(1) | | Other Directorships Held | |
| Noninterested Trustee(s) (continued) | | | | | | | | | | | | | |
|
Heidi L. Steiger
7/8/53 | | Trustee | | Since 2007 | | President, Lowenhaupt Global Advisors, LLC (global wealth management firm) (since 2005); Formerly, President and Contributing Editor, Worth Magazine (2004); Formerly, Executive Vice President and Global Head of Private Asset Management (and various other positions), Neuberger Berman (investment firm) (1986-2004). | | | 173 | | | Director of Nuclear Electric Insurance Ltd. (nuclear insurance provider) and Aviva USA (insurance provider) | |
|
Lynn A. Stout
9/14/57 | | Trustee | | Since 1998 | | Paul Hastings Professor of Corporate and Securities Law, University of California at Los Angeles School of Law. | | | 176 | | | None | |
|
Ralph F. Verni
1/26/43 | | Chairman of the Board and Trustee | | Chairman of the
Board since 2007
and Trustee since 2005 | | Consultant and private investor. | | | 176 | | | None | |
|
| Principal Officers who are not Trustees | |
|
Name and
Date of Birth | | Position(s)
with the
Trust and the
Portfolio | | Term of
Office and
Length of
Service | | Principal Occupation(s)
During Past Five Years | |
William H. Ahern, Jr.
7/28/59 | | Vice President
of the Trust | | Since 1995 | | Vice President of EVM and BMR. Officer of 74 registered investment companies managed by EVM or BMR. | |
|
Cynthia J. Clemson
3/2/63 | | Vice President
of the Trust | | Since 2005 | | Vice President of EVM and BMR. Officer of 89 registered investment companies managed by EVM or BMR. | |
|
Charles B. Gaffney
12/4/72 | | Vice President of the Trust | | Since 2007 | | Vice President of EVM and BMR. Previously, Sector Portfolio Manager and Senior Equity Analyst of Brown Brothers Harriman (1997-2003). Officer of 29 registered investment companies managed by EVM or BMR. | |
|
Christine M. Johnston
11/9/72 | | Vice President
of the Trust | | Since 2007 | | Vice President of EVM and BMR. Officer of 34 registered investment companies managed by EVM or BMR. | |
|
Aamer Khan
6/7/60 | | Vice President
of the Trust | | Since 2005 | | Vice President of EVM and BMR. Officer of 32 registered investment companies managed by EVM or BMR. | |
|
Thomas H. Luster
4/8/62 | | Vice President
of the Trust | | Since 2006 | | Vice President of EVM and BMR. Officer of 48 registered investment companies managed by EVM or BMR. | |
|
Michael R. Mach
7/15/47 | | Vice President
of the Trust | | Since 1999 | | Vice President of EVM and BMR. Officer of 54 registered investment companies managed by EVM or BMR. | |
|
Robert B. MacIntosh
1/22/27 | | Vice President
of the Trust | | Since 1998 | | Vice President of EVM and BMR. Officer of 89 registered investment companies managed by EVM or BMR. | |
|
Duncan W. Richardson
10/26/57 | | Vice President of the Trust and President
of the Portfolio | | Vice President of the Trust
since 2001 and President of the Portfolio since 2002 | | Executive Vice President and Chief Equity Investment Officer of EVC, EVM and BMR. Officer 80 registered investment companies managed by EVM or BMR. | |
|
Walter A. Row, III
7/20/57 | | Vice President
of the Trust | | Since 2001 | | Director of Equity Research and a Vice President of EVM and BMR. Officer of 38 registered investment companies managed by EVM or BMR. | |
|
Judith A. Saryan
8/21/54 | | Vice President
of the Trust | | Since 2003 | | Vice President of EVM and BMR. Officer of 53 registered investment companies managed by EVM or BMR. | |
|
Susan Schiff
3/13/61 | | Vice President
of the Trust | | Since 2002 | | Vice President of EVM and BMR. Officer of 35 registered investment companies managed by EVM or BMR. | |
|
31
Eaton Vance Tax-Managed Small-Cap Growth Fund
MANAGEMENT AND ORGANIZATION CONT'D
| Principal Officers who are not Trustees (continued) | |
|
Name and
Date of Birth | | Position(s)
with the
Trust and the
Portfolio | | Term of
Office and
Length of
Service | | Principal Occupation(s)
During Past Five Years | |
Thomas Seto
9/27/62 | | Vice President
of the Trust | | Since 2007 | | Vice President and Director of Portfolio Management of Parametric. Officer of 30 registered investment companies managed by EVM or BMR. | |
|
David M. Stein
5/4/51 | | Vice President
of the Trust | | Since 2007 | | Managing Director and Chief Investment Officer of Parametric. Officer of 30 registered investment companies managed by EVM or BMR. | |
|
Nancy B. Tooke
10/25/46 | | Vice President
of the Portfolio | | Since 2006 | | Vice President of EVM and BMR since 2006. Previously, Senior Managing Director and small- and mid-cap core portfolio manager with ForstmannLeff Associates (2004-2006). Previously, Executive Vice President and portfolio manager with Schroder Investment management North America, Inc. (1994-2004). Officer of 3 registered investment companies managed by EVM or BMR. | |
|
Mark S. Venezia
5/23/49 | | Vice President
of the Trust | | Since 2007 | | Vice President of EVM and BMR. Officer of 35 registered investment companies managed by EVM or BMR. | |
|
Adam A. Weigold
3/22/75 | | Vice President
of the Trust | | Since 2007 | | Vice President of EVM and BMR. Officer of 70 registered investment companies managed by EVM or BMR. | |
|
Barbara E. Campbell
6/19/57 | | Treasurer of the Trust | | Since 2005 | | Vice President EVM and BMR. Officer of 176 registered investment companies managed by EVM or BMR. | |
|
Maureen A. Gemma
5/24/60 | | Secretary | | Since 2007 | | Deputy Chief Legal Officer and Vice President of EVM and BMR. Officer of 176 registered investment companies managed by EVM or BMR. | |
|
Michelle A. Green
8/25/69 | | Treasurer of
the Portfolio | | Since 2002 | | Vice President of EVM and BMR. Officer of 68 registered investment companies managed by EVM or BMR. | |
|
Paul M. O'Neil
7/11/53 | | Chief Compliance Officer | | Since 2004 | | Vice President of EVM and BMR. Officer of 176 registered investment companies managed by EVM or BMR. | |
|
(1) Includes both master feeder and feeder funds in a master-feeder structure.
The SAI for the Fund includes additional information about the Trustees and officers of the Fund and the Portfolio and can be obtained without charge by calling 1-800-225-6265.
32
Investment Adviser of Tax-Managed Small-Cap Growth Portfolio
Boston Management and Research
The Eaton Vance Building
255 State Street
Boston, MA 02109
Administrator of Eaton Vance Tax-Managed Small-Cap Growth Fund
Eaton Vance Management
The Eaton Vance Building
255 State Street
Boston, MA 02109
Principal Underwriter
Eaton Vance Distributors, Inc.
The Eaton Vance Building
255 State Street
Boston, MA 02109
(617) 482-8260
Custodian
State Street Bank and Trust Company
200 Clarendon Street
Boston, MA 02116
Transfer Agent
PFPC Inc.
Attn: Eaton Vance Funds
P.O. Box 9653
Providence, RI 02940-9653
(800) 262-1122
Independent Registered Public Accounting Firm
Deloitte & Touche LLP
200 Berkeley Street
Boston, MA 02116-5022
Eaton Vance Tax-Managed Small-Cap Growth Fund
The Eaton Vance Building
255 State Street
Boston, MA 02109
This report must be preceded or accompanied by a current prospectus. Before investing, investors should consider carefully the Fund's investment objective(s), risks, and charges and expenses. The Fund's current prospectus contains this and other information about the Fund and is available through your financial advisor. Please read the prospectus carefully before you invest or send money. For further information please call 1-800-225-6265.
130-12/07 MGSRC

Annual Report October 31, 2007


EATON VANCE
TAX-MANAGED
SMALL-CAP
VALUE
FUND
IMPORTANT NOTICES REGARDING PRIVACY,
DELIVERY OF SHAREHOLDER DOCUMENTS,
PORTFOLIO HOLDINGS AND PROXY VOTING
Privacy. The Eaton Vance organization is committed to ensuring your financial privacy. Each of the financial institutions identified below has in effect the following policy ("Privacy Policy") with respect to nonpublic personal information about its customers:
• Only such information received from you, through application forms or otherwise, and information about your Eaton Vance fund transactions will be collected. This may include information such as name, address, social security number, tax status, account balances and transactions.
• None of such information about you (or former customers) will be disclosed to anyone, except as permitted by law (which includes disclosure to employees necessary to service your account). In the normal course of servicing a customer's account, Eaton Vance may share information with unaffiliated third parties that perform various required services such as transfer agents, custodians and broker/dealers.
• Policies and procedures (including physical, electronic and procedural safeguards) are in place that are designed to protect the confidentiality of such information.
• We reserve the right to change our Privacy Policy at any time upon proper notification to you. Customers may want to review our Policy periodically for changes by accessing the link on our homepage: www.eatonvance.com.
Our pledge of privacy applies to the following entities within the Eaton Vance organization: the Eaton Vance Family of Funds, Eaton Vance Management, Eaton Vance Investment Counsel, Boston Management and Research, and Eaton Vance Distributors, Inc.
In addition, our Privacy Policy only applies to those Eaton Vance customers who are individuals and who have a direct relationship with us. If a customer's account (i.e. fund shares) is held in the name of a third-party financial adviser/broker-dealer, it is likely that only such adviser's privacy policies apply to the customer. This notice supersedes all previously issued privacy disclosures.
For more information about Eaton Vance's Privacy Policy, please call 1-800-262-1122.
Delivery of Shareholder Documents. The Securities and Exchange Commission (the "SEC") permits funds to deliver only one copy of shareholder documents, including prospectuses, proxy statements and shareholder reports, to fund investors with multiple accounts at the same residential or post office box address. This practice is often called "householding" and it helps eliminate duplicate mailings to shareholders.
Eaton Vance, or your financial adviser, may household the mailing of your documents indefinitely unless you instruct Eaton Vance, or your financial adviser, otherwise.
If you would prefer that your Eaton Vance documents not be householded, please contact Eaton Vance at 1-800-262-1122, or contact your financial adviser.
Your instructions that householding not apply to delivery of your Eaton Vance documents will be effective within 30 days of receipt by Eaton Vance or your financial adviser.
Portfolio Holdings. Each Eaton Vance Fund and its underlying Portfolio (if applicable) will file a schedule of its portfolio holdings on Form N-Q with the SEC for the first and third quarters of each fiscal year. The Form N-Q will be available on the Eaton Vance website www.eatonvance.com, by calling Eaton Vance at 1-800-262-1122 or in the EDGAR database on the SEC's website at www.sec.gov. Form N-Q may also be reviewed and copied at the SEC's public reference room in Washington, D.C. (call 1-800-732-0330 for information on the operation of the public reference room).
Proxy Voting. From time to time, funds are required to vote proxies related to the securities held by the funds. The Eaton Vance Funds or their underlying Portfolios (if applicable) vote proxies according to a set of policies and procedures approved by the Funds' and Portfolios' Boards. You may obtain a description of these policies and procedures and information on how the Funds or Portfolios voted proxies relating to Portfolio securities during the most recent 12 month period ended June 30, without charge, upon request, by calling 1-800-262-1122. This description is also available on the SEC's website at www.sec.gov.
Eaton Vance Tax-Managed Small-Cap Value Fund as of October 31, 2007
management’s discussion of fund performance

Gregory R. Greene, CFA,
Lead Portfolio Manager
The Fund
Performance for the Past Year
· For the year ended October 31, 2007, the had a total return of 12.30%. This return was the result of an increase in net asset value (NAV) per share to $16.05 on October 31, 2007, from $15.40 on October 31, 2006, and the distribution of $1.149 per share in capital gains.(1)
· The Fund’s Class B shares had a total return of 11.41% for the same period, the result of an increase in NAV per share to $15.33 from $14.87 and the distribution of $1.149 per share in capital gains.(1)
· The Fund’s Class C shares had a total return of 11.47% for the same period, the result of an increase in NAV per share to $15.35 from $14.88 and the distribution of $1.149 per share in capital gains.(1)
· For comparison, the Fund’s benchmark, the Russell 2000 Value Index – a broad-based, unmanaged market index of those Russell 2000 Index companies with lower price-to-book ratios and higher forecasted growth values – had a total return of 2.05% during the period. The SmallCap 600 Index – a broad-based, unmanged market index of small-capitalization stocks – had a total return of 11.55%. The Small Cap Value Funds Classification, had an average total return of 6.26%.(2)
See pages 3 and 4 for more performance information, including after-tax returns.
Management Discussion
· During the year ended October 31, 2007, U.S. stock markets moved higher amid a significant increase in volatility. In the first half of the period, investors were cautiously optimistic about the economy, inflation, interest rates, and corporate profits, although markets both in the U.S. and abroad saw sharp declines from late February through mid-March 2007. Markets recovered strongly through mid-July 2007, only to decline again more dramatically in late July and August 2007 due to fallout from the subprime mortgage crisis. The Federal Reserve Board (the “Fed”) responded to the subprime situation by lowering the Fed Funds Rate – a key short-term interest rate benchmark – to 4.50% by period’s end. This eased concerns about the economy and helped move markets higher through early October 2007, though another decline, caused in part by a spike in oil prices, occurred in the final weeks of the period. The value segment lagged growth stocks during the year.
· The Fund invests its assets in Tax-Managed Small-Cap Value Portfolio (the “Portfolio”), a separate registered investment company with the same objectives and investment policies as the Fund. Consumer discretionary stocks were among the Portfolio’s leading performers during the fiscal year ended October 31, 2007. Stock selection was especially important, as consumers were pinched by rising energy prices and falling real estate values. A maker of kitchen and home storage products fared well on the basis of growing sales in Asia and Eastern Europe. A manufacturer of auto components enjoyed strong revenue growth from its engine and drivetrain projects, benefiting from rising demand for fuel-efficient technologies. Specialty retailers also contributed to Portfolio performance, with food retailers deriving revenue growth from an expanded product mix.(3)
· The Portfolio’s overweighting in the consumer staples sector boosted performance during the fiscal year. Amid signs of a weakening U.S. economy, defensive stocks – including foods, personal care and household products – enjoyed stable earnings. In the materials sector, a maker of dispensing systems for cosmetics and pharmaceuticals products benefited from its exposure to foreign markets, with two-thirds of its revenues coming from Europe and Asia. Performance in the
Past performance is no guarantee of future results. Returns are historical and are calculated by determining the percentage change in net asset value or offering price (as applicable) with all distributions reinvested. Investment return and principal value will fluctuate so that shares, when redeemed, may be worth more or less than their original cost. Performance is for stated time period only; due to market volatility, the Fund’s current performance may be lower or higher than the quoted return. For performance as of the most recent month end, please refer to www.eatonvance. com.
(1) These returns do not include the 5.75% maximum sales charge for Class A shares or the applicable contingent deferred sales charge (CDSC) for Class B and Class C shares. If sales charges were deducted, the returns would be lower. Absent an allocation of certain expenses to the administrator of the Fund and the sub-adviser of the Portfolio, the returns would be lower.
(2) It is not possible to invest directly in an Index or a Lipper Classification. The Indices’ total returns do not reflect commissions or expenses that would have been incurred if an investor individually purchased or sold the securities represented in the Indices. The Lipper total return is the average total return, at net asset value, of the funds that are in the same Lipper Classification as the Fund.
(3) Sector weightings are subject to change due to active management.
Fund shares are not insured by the FDIC and are not deposits or other obligations of, or guaranteed by, any depository institution. Shares are subject to investment risks, including possible loss of principal invested.
1
technology sector was mixed during the year ended October 31, 2007. Stock selection in the semiconductor area was additive, with a producer of fixed-function semiconductors enjoying strong demand from Asian electronics manufacturers. Software was less successful, however, with a producer of enterprise software encountering softer demand.(1)
· Among the Portfolio’s weaker performers commercial bank stocks fared poorly during the fiscal year. In the midst of rising mortgage defaults, bank stock performance was impaired by higher provisions for loan losses. The industrial sector was another area that underperformed for the Portfolio. A construction and engineering company encountered lower revenues in the softer real estate climate. A national trucking company suffered a significant earnings decline during the fiscal year ended October 31, 2007, as the weaker economy brought a more difficult freight environment with lower tonnage from a year earlier.(1)
(1) Sector weightings are subject to change due to active management.
The views expressed throughout this report are those of the portfolio managers and are current only through the end of the period of the report as stated on the cover. These views are subject to change at any time based upon market or other conditions, and the investment adviser disclaims any responsibility to update such views. These views may not be relied on as investment advice and, because investment decisions for a fund are based on many factors, may not be relied on as an indication of trading intent on behalf of any Eaton Vance fund.
Common Stock Investments by Sector(2)
By net assets

(2) As a percentage of the Portfolio’s net assets as of 10/31/07. Portfolio information may not be representative of the Portfolio’s current or future investments and may change due to active management.
Top Ten Common Stock Holdings(3)
By net assets
AptarGroup, Inc. | | 3.7 | % |
Tupperware Brands Corp. | | 3.6 | |
Walter Industries, Inc. | | 3.2 | |
Owens & Minor, Inc. | | 3.2 | |
Oil States International, Inc. | | 3.2 | |
Piedmont Natural Gas Co., Inc. | | 3.2 | |
Church & Dwight, Co., Inc. | | 3.1 | |
BJ’s Wholesale Club, Inc. | | 3.1 | |
Chiquita Brands International, Inc. | | 3.0 | |
BorgWarner, Inc. | | 2.9 | |
(3) Top Ten Holdings represented 32.2% of Portfolio net assets as of 10/31/07. Holdings are subject to change due to active management.
2
Eaton Vance Tax-Managed Small-Cap Value Fund as of October 31, 2007
Fund Performance
The line graphs and table set forth below provide information about the Fund’s performance. The line graphs compare the performance of Class A, Class B and Class C of the Fund with that of the Russell 2000 Value Index, a broad-based, unmanaged market index of those Russell 2000 Index companies with lower price-to-book ratios and higher forecasted growth values, and the S&P SmallCap 600 Index, a broad-based, unmanaged market index of small-capitalization stocks. The Fund’s primary benchmark has been changed to the Russell 2000 Value Index because the stocks therein are more consistent with the investment style of the Fund. The lines on the graphs represent the total returns of a hypothetical investment of $10,000 in each of Class A, Class B and Class C, the Russell 2000 Value Index and the S&P SmallCap 600 Index. Class A total returns are presented at net asset value and maximum public offering price. The table includes the total returns of each Class of the Fund at net asset value and public offering price. The performance presented below does not reflect the deduction of taxes, if any, that a shareholder would pay on distributions or redemptions of Fund shares.
Fund Performance(1) As of 10/31/07 | | Class A | | Class B | | Class C | |
Share Class Symbols | | ESVAX | | ESVBX | | ESVCX | |
| | | | | | | |
Average Annual Total Returns (at net asset value) | | | | | | | |
One Year | | 12.30 | % | 11.41 | % | 11.47 | % |
Five Years | | 15.59 | % | 14.74 | % | 14.77 | % |
Life of Fund† | | 11.25 | % | 10.44 | % | 10.46 | % |
SEC Average Annual Total Returns (including sales charge or applicable CDSC) | | | | | | | |
One Year | | 5.84 | % | 6.41 | % | 10.47 | % |
Five Years | | 14.23 | % | 14.51 | % | 14.77 | % |
Life of Fund† | | 10.09 | % | 10.33 | % | 10.46 | % |
†Inception Dates: 3/4/02 for all Classes.
(1) Average annual total returns do not include the 5.75% maximum sales charge for Class A shares or the applicable contingent deferred sales charge(CDSC)for Class B and Class C shares. If sales charges were deducted, the returns would be lower. SEC average annual total returns for Class A reflect the maximum 5.75% sales charge. SEC returns for Class B shares reflect the applicable CDSC based on the following schedule:5% - 1st and 2nd years; 4% - 3rd year; 3% - 4th year; 2% - 5th year; 1% - 6th year. SEC returns for Class C reflect a 1% CDSC for the first year. Absent an allocation of certain expenses to the administrator of the Fund and the sub-adviser of the Portfolio, the returns would be lower.
Total Annual | | | | | | | |
Operating Expenses(2) | | Class A | | Class B | | Class C | |
Gross Expense Ratio | | 2.01 | % | 2.76 | % | 2.76 | % |
Net Expense Ratio | | 1.75 | % | 2.50 | % | 2.50 | % |
(2) Source: Prospectus dated 3/1/07.The Net Expense Ratio reflects a voluntary expense allocation to the Fund’s administrator and the sub-adviser of the Portfolio.Without these expense allocations, the performance would have been lower.
Past performance is no guarantee of future results. Returns are historical and are calculated by determining the percentage change in net asset value or offering price (as applicable) with all distributions reinvested. Investment return and principal value will fluctuate so that shares, when redeemed, may be worth more or less than their original cost. Performance is for stated time period only; due to market volatility, the Fund’s current performance may be lower or higher than the quoted return. For performance as of the most recent month end, please refer to www.eatonvance.com.
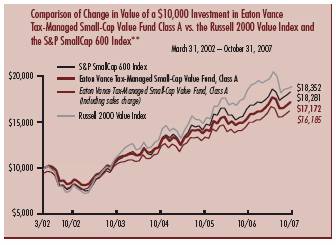
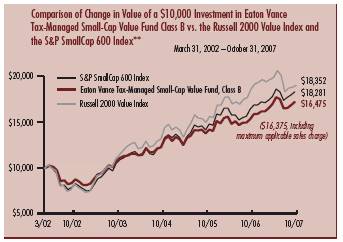
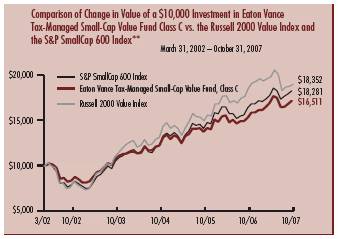
** Source: Thomson Financial. Investment operations commenced 3/4/02. It is not possible to invest directly in an Index. The Indices’ total returns do not reflect commissions or expenses that would have been incurred if an investor individually purchased or sold the securities represented in the Indices.
3
“Return Before Taxes” does not take into consideration shareholder taxes. It is most relevant to tax-free or tax-deferred shareholder accounts. “Return After Taxes on Distributions” reflects the impact of federal income taxes due on Fund distributions of dividends and capital gains. It is most relevant to taxpaying shareholders who continue to hold their shares. “Return After Taxes on Distributions and Sale of Fund Shares” also reflects the impact of taxes on capital gain or loss realized upon a sale of shares. It is most relevant to taxpaying shareholders who sell their shares.
Average Annual Total Returns
(For the periods ended October 31, 2007)
Returns at Net Asset Value (NAV) (Class A)
| | One Year | | Five Years | | Life of Fund | |
Return Before Taxes | | 12.30 | % | 15.59 | % | 11.25 | % |
Return After Taxes on Distributions | | 11.09 | % | 15.15 | % | 10.88 | % |
Return After Taxes on Distributions and Sale of Fund Shares | | 9.43 | % | 13.67 | % | 9.81 | % |
Returns at Public Offering Price (POP) (Class A)
| | One Year | | Five Years | | Life of Fund | |
Return Before Taxes | | 5.84 | % | 14.23 | % | 10.09 | % |
Return After Taxes on Distributions | | 4.70 | % | 13.80 | % | 9.72 | % |
Return After Taxes on Distributions and Sale of Fund Shares | | 5.15 | % | 12.44 | % | 8.78 | % |
Average Annual Total Returns
(For the periods ended October 31, 2007)
Returns at Net Asset Value (NAV) (Class C)
| | One Year | | Five Years | | Life of Fund | |
Return Before Taxes | | 11.47 | % | 14.77 | % | 10.46 | % |
Return After Taxes on Distributions | | 10.23 | % | 14.32 | % | 10.08 | % |
Return After Taxes on Distributions and Sale of Fund Shares | | 8.94 | % | 12.93 | % | 9.11 | % |
Returns at Public Offering Price (POP) (Class C)
| | One Year | | Five Years | | Life of Fund | |
Return Before Taxes | | 10.47 | % | 14.77 | % | 10.46 | % |
Return After Taxes on Distributions | | 9.23 | % | 14.32 | % | 10.08 | % |
Return After Taxes on Distributions and Sale of Fund Shares | | 8.29 | % | 12.93 | % | 9.11 | % |
Average Annual Total Returns
(For the periods ended October 31, 2007)
Returns at Net Asset Value (NAV) (Class B)
| | One Year | | Five Years | | Life of Fund | |
Return Before Taxes | | 11.41 | % | 14.74 | % | 10.44 | % |
Return After Taxes on Distributions | | 10.16 | % | 14.29 | % | 10.06 | % |
Return After Taxes on Distributions and Sale of Fund Shares | | 8.90 | % | 12.91 | % | 9.09 | % |
Returns at Public Offering Price (POP) (Class B)
| | One Year | | Five Years | | Life of Fund | |
Return Before Taxes | | 6.41 | % | 14.51 | % | 10.33 | % |
Return After Taxes on Distributions | | 5.16 | % | 14.05 | % | 9.94 | % |
Return After Taxes on Distributions and Sale of Fund Shares | | 5.65 | % | 12.70 | % | 8.99 | % |
Class A, Class B and Class C of the Fund commenced investment operations on 3/4/02. Returns at Public Offering Price (POP) reflect the deduction of the maximum initial sales charge and applicable CDSC, while Returns at Net Asset Value (NAV) do not. Absent an allocation of certain expenses to the administrator of the Fund and the sub-adviser of the Portfolio, the returns would be lower.
After-tax returns are calculated using certain assumptions. After-tax returns are calculated using the highest historical individual federal income tax rates and do not reflect the impact of state and local taxes. Actual after-tax returns depend on a shareholder’s tax situation and the actual characterization of distributions and may differ from those shown. After-tax returns are not relevant for shareholders who hold Fund shares in tax-deferred accounts or to shares held by non-taxable entities. Return After Taxes on Distributions for a period may be the same as Return Before Taxes for the same period because no taxable distributions were made during that period. Return After Taxes on Distributions and Sale of Fund Shares for a period may be greater than or equal to Return After Taxes on Distributions for the same period because of losses realized on the sale of Fund shares.
Past performance is no guarantee of future results. Returns are historical and are calculated by determining the percentage change in net asset value or offering price (as applicable) with all distributions reinvested. Investment return and principal value will fluctuate so that shares, when redeemed, may be worth more or less than their original cost. Performance is for the stated time period only; due to market volatility, the Fund’s current performance may be lower or higher than the quoted return. For performance as of the most recent month end, please refer to www.eatonvance.com.
4
Eaton Vance Tax-Managed Small-Cap Value Fund as of October 31, 2007
FUND EXPENSES
Example: As a shareholder of the Fund, you incur two types of costs: (1) transaction costs, including sales charges (loads) on purchases and redemption fees (if applicable); and (2) ongoing costs, including management fees; distribution or service fees; and other Fund expenses. This Example is intended to help you understand your ongoing costs (in dollars) of investing in the Fund and to compare these costs with the ongoing costs of investing in other mutual funds. The Example is based on an investment of $1,000 invested at the beginning of the period and held for the entire period (May 1, 2007 – October 31, 2007).
Actual Expenses: The first section of the table below provides information about actual account values and actual expenses. You may use the information in this section, together with the amount you invested, to estimate the expenses that you paid over the period. Simply divide your account value by $1,000 (for example, an $8,600 account value divided by $1,000 = 8.6), then multiply the result by the number in the first section under the heading entitled "Expenses Paid During Period" to estimate the expenses you paid on your account during this period.
Hypothetical Example for Comparison Purposes: The second section of the table below provides information about hypothetical account values and hypothetical expenses based on the actual Fund expense ratio and an assumed rate of return of 5% per year (before expenses), which is not the actual return of the Fund. The hypothetical account values and expenses may not be used to estimate the actual ending account balance or expenses you paid for the period. You may use this information to compare the ongoing costs of investing in your Fund and other funds. To do so, compare this 5% hypothetical example with the 5% hypothetical examples that appear in the shareholder reports of the other funds.
Please note that the expenses shown in the table are meant to highlight your ongoing costs only and do not reflect any transactional costs, such as sales charges (loads) or redemption fees (if applicable). Therefore, the second section of the table is useful in comparing ongoing costs only, and will not help you determine the relative total costs of owning different funds. In addition, if these transactional costs were included, your costs would have been higher.
Eaton Vance Tax-Managed Small-Cap Value Fund
| | | Beginning Account Value
(5/1/07) | | Ending Account Value
(10/31/07) | | Expenses Paid During Period*
(5/1/07 – 10/31/07) | |
| Actual | |
| Class A | | $ | 1,000.00 | | | $ | 1,013.30 | | | $ | 8.37 | ** | |
| Class B | | $ | 1,000.00 | | | $ | 1,009.20 | | | $ | 12.10 | ** | |
| Class C | | $ | 1,000.00 | | | $ | 1,009.90 | | | $ | 12.11 | ** | |
| Hypothetical | |
| (5% return per year before expenses) | |
| Class A | | $ | 1,000.00 | | | $ | 1,016.90 | | | $ | 8.39 | ** | |
| Class B | | $ | 1,000.00 | | | $ | 1,013.20 | | | $ | 12.13 | ** | |
| Class C | | $ | 1,000.00 | | | $ | 1,013.20 | | | $ | 12.13 | ** | |
* Expenses are equal to the Fund's annualized expense ratio of 1.65% for Class A shares, 2.39% for Class B shares, and 2.39% for Class C shares multiplied by the average account value over the period, multiplied by 184/365 (to reflect the one-half year period). The Example assumes that the $1,000 was invested at the net asset value per share determined at the close of business on April 30, 2007. The Example reflects the expenses of both the Fund and the Portfolio.
** Absent an allocation of certain expenses to the administrator of the Fund and sub-adviser of the Portfolio, expenses would be higher.
5
Eaton Vance Tax-Managed Small-Cap Value Fund as of October 31, 2007
FINANCIAL STATEMENTS
Statement of Assets and Liabilities
As of October 31, 2007
| Assets | |
Investment in Tax-Managed Small-Cap Value Portfolio, at value
(identified cost, $24,293,814) | | $ | 32,599,924 | | |
| Receivable for Fund shares sold | | | 32,186 | | |
| Receivable from affiliates | | | 101,889 | | |
| Total assets | | $ | 32,733,999 | | |
| Liabilities | |
| Payable for Fund shares redeemed | | $ | 134,062 | | |
| Payable to affiliate for distribution and service fees | | | 15,526 | | |
| Payable to affiliate for administration fee | | | 4,123 | | |
| Payable to affiliate for Trustees' fees | | | 117 | | |
| Other accrued expenses | | | 45,754 | | |
| Total liabilities | | $ | 199,582 | | |
| Net Assets | | $ | 32,534,417 | | |
| Sources of Net Assets | |
| Paid-in capital | | $ | 21,210,312 | | |
Accumulated undistributed net realized gain from Portfolio (computed on
the basis of identified cost) | | | 3,017,995 | | |
Net unrealized appreciation from Portfolio (computed on the basis of
identified cost) | | | 8,306,110 | | |
| Total | | $ | 32,534,417 | | |
| Class A Shares | |
| Net Assets | | $ | 18,977,702 | | |
| Shares Outstanding | | | 1,182,475 | | |
Net Asset Value and Redemption Price Per Share
(net assets ÷ shares of beneficial interest outstanding) | | $ | 16.05 | | |
Maximum Offering Price Per Share
(100 ÷ 94.25 of $16.05) | | $ | 17.03 | | |
| Class B Shares | |
| Net Assets | | $ | 6,412,131 | | |
| Shares Outstanding | | | 418,250 | | |
Net Asset Value and Offering Price Per Share*
(net assets ÷ shares of beneficial interest outstanding) | | $ | 15.33 | | |
| Class C Shares | |
| Net Assets | | $ | 7,144,584 | | |
| Shares Outstanding | | | 465,520 | | |
Net Asset Value and Offering Price Per Share*
(net assets ÷ shares of beneficial interest outstanding) | | $ | 15.35 | | |
| On sales of $50,000 or more, the offering price of Class A shares is reduced. | |
| * Redemption price per share is equal to the net asset value less any applicable contingent deferred sales charge. | |
Statement of Operations
For the Year Ended
October 31, 2007
| Investment Income | |
| Dividends allocated from Portfolio | | $ | 357,117 | | |
| Interest allocated from Portfolio | | | 67,346 | | |
| Expenses allocated from Portfolio | | | (364,700 | ) | |
| Net investment income from Portfolio | | $ | 59,763 | | |
| Expenses | |
| Administration fee | | $ | 48,151 | | |
| Trustees' fees and expenses | | | 246 | | |
Distribution and service fees
Class A | | | 43,526 | | |
| Class B | | | 69,116 | | |
| Class C | | | 77,785 | | |
| Registration fees | | | 47,513 | | |
| Transfer and dividend disbursing agent fees | | | 47,304 | | |
| Custodian fee | | | 18,938 | | |
| Legal and accounting services | | | 17,908 | | |
| Printing and postage | | | 14,691 | | |
| Miscellaneous | | | 5,232 | | |
| Total expenses | | $ | 390,410 | | |
Deduct —
Allocation of Fund expenses to affiliates | | $ | 101,889 | | |
| Total expense reductions | | $ | 101,889 | | |
| Net expenses | | $ | 288,521 | | |
| Net investment loss | | $ | (228,758 | ) | |
Realized and Unrealized
Gain (Loss) from Portfolio | |
Net realized gain (loss) —
Investment transactions (identified cost basis) | | $ | 3,075,285 | | |
| Net realized gain | | $ | 3,075,285 | | |
Change in unrealized appreciation (depreciation) —
Investments (identified cost basis) | | $ | 681,473 | | |
| Net change in unrealized appreciation (depreciation) | | $ | 681,473 | | |
| Net realized and unrealized gain | | $ | 3,756,758 | | |
| Net increase in net assets from operations | | $ | 3,528,000 | | |
See notes to financial statements
6
Eaton Vance Tax-Managed Small-Cap Value Fund as of October 31, 2007
FINANCIAL STATEMENTS CONT'D
Statements of Changes in Net Assets
Increase (Decrease)
in Net Assets | | Year Ended
October 31, 2007 | | Year Ended
October 31, 2006 | |
From operations —
Net investment loss | | $ | (228,758 | ) | | $ | (249,921 | ) | |
Net realized gain from
investment transactions | | | 3,075,285 | | | | 2,237,106 | | |
Net change in unrealized appreciation
(depreciation) of investments | | | 681,473 | | | | 1,093,600 | | |
| Net increase in net assets from operations | | $ | 3,528,000 | | | $ | 3,080,785 | | |
Distributions to shareholders —
From net realized gain
Class A | | $ | (1,148,098 | ) | | $ | (796,154 | ) | |
| Class B | | | (528,019 | ) | | | (431,201 | ) | |
| Class C | | | (594,019 | ) | | | (397,691 | ) | |
| Total distributions to shareholders | | $ | (2,270,136 | ) | | $ | (1,625,046 | ) | |
Transactions in shares of beneficial interest —
Proceeds from sale of shares
Class A | | $ | 3,953,402 | | | $ | 3,354,218 | | |
| Class B | | | 412,469 | | | | 734,067 | | |
| Class C | | | 1,118,200 | | | | 1,540,274 | | |
Net asset value of shares issued to
shareholders in payment of
distributions declared
Class A | | | 978,525 | | | | 656,068 | | |
| Class B | | | 401,815 | | | | 330,817 | | |
| Class C | | | 408,179 | | | | 285,407 | | |
Cost of shares redeemed
Class A | | | (2,960,442 | ) | | | (4,136,432 | ) | |
| Class B | | | (1,137,489 | ) | | | (1,432,137 | ) | |
| Class C | | | (2,430,665 | ) | | | (1,328,126 | ) | |
Net asset value of shares exchanged
Class A | | | 520,721 | | | | 723,254 | | |
| Class B | | | (520,721 | ) | | | (723,254 | ) | |
Net increase in net assets from
Fund share transactions | | $ | 743,994 | | | $ | 4,156 | | |
| Net increase in net assets | | $ | 2,001,858 | | | $ | 1,459,895 | | |
| Net Assets | |
| At beginning of year | | $ | 30,532,559 | | | $ | 29,072,664 | | |
| At end of year | | $ | 32,534,417 | | | $ | 30,532,559 | | |
See notes to financial statements
7
Eaton Vance Tax-Managed Small-Cap Value Fund as of October 31, 2007
FINANCIAL STATEMENTS CONT'D
Financial Highlights
| | | Class A | |
| | | Year Ended October 31, | |
| | | 2007 | | 2006 | | 2005 | | 2004 | | 2003 | |
| Net asset value — Beginning of year | | $ | 15.400 | | | $ | 14.640 | | | $ | 13.010 | | | $ | 11.420 | | | $ | 8.860 | | |
| Income (loss) from operations | |
| Net investment loss(1) | | $ | (0.058 | ) | | $ | (0.066 | ) | | $ | (0.087 | ) | | $ | (0.082 | ) | | $ | (0.061 | ) | |
| Net realized and unrealized gain | | | 1.857 | | | | 1.644 | | | | 1.717 | | | | 1.672 | | | | 2.621 | | |
| Total income from operations | | $ | 1.799 | | | $ | 1.578 | | | $ | 1.630 | | | $ | 1.590 | | | $ | 2.560 | | |
| Less distributions | |
| From net realized gain | | $ | (1.149 | ) | | $ | (0.818 | ) | | $ | — | | | $ | — | | | $ | — | | |
| Total distributions | | $ | (1.149 | ) | | $ | (0.818 | ) | | $ | — | | | $ | — | | | $ | — | | |
| Net asset value — End of year | | $ | 16.050 | | | $ | 15.400 | | | $ | 14.640 | | | $ | 13.010 | | | $ | 11.420 | | |
| Total Return(2) | | | 12.30 | % | | | 11.24 | % | | | 12.53 | % | | | 13.92 | % | | | 28.89 | % | |
| Ratios/Supplemental Data | |
| Net assets, end of year (000's omitted) | | $ | 18,978 | | | $ | 15,695 | | | $ | 14,303 | | | $ | 10,772 | | | $ | 7,509 | | |
| Ratios (As a percentage of average daily net assets): | |
| Expenses before custodian fee reduction(3)(4) | | | 1.69 | % | | | 1.75 | % | | | 1.75 | % | | | 1.75 | % | | | 1.75 | % | |
| Expenses after custodian fee reduction(3)(4) | | | 1.69 | % | | | 1.75 | % | | | 1.75 | % | | | 1.75 | % | | | 1.75 | % | |
| Net investment loss | | | (0.37 | )% | | | (0.44 | )% | | | (0.61 | )% | | | (0.67 | )% | | | (0.62 | )% | |
| Portfolio Turnover of the Portfolio | | | 80 | % | | | 49 | % | | | 24 | % | | | 12 | % | | | 21 | % | |
(1) Net investment loss per share was computed using average shares outstanding.
(2) Returns are historical and are calculated by determining the percentage change in net asset value with all distributions reinvested.
(3) Includes the Fund's share of the Portfolio's allocated expenses.
(4) The administrator subsidized certain operating expenses (equal to 0.32%, 0.26%, 0.28%, 0.35%, and 0.85% of average daily net assets for the fiscal years ended October 31, 2007, 2006, 2005, 2004 and 2003, respectively). A portion of the subsidy was borne by the sub-adviser of the Portfolio.
See notes to financial statements
8
Eaton Vance Tax-Managed Small-Cap Value Fund as of October 31, 2007
FINANCIAL STATEMENTS CONT'D
Financial Highlights
| | | Class B | |
| | | Year Ended October 31, | |
| | | 2007 | | 2006 | | 2005 | | 2004 | | 2003 | |
| Net asset value — Beginning of year | | $ | 14.870 | | | $ | 14.260 | | | $ | 12.770 | | | $ | 11.290 | | | $ | 8.820 | | |
| Income (loss) from operations | |
| Net investment loss(1) | | $ | (0.168 | ) | | $ | (0.174 | ) | | $ | (0.189 | ) | | $ | (0.171 | ) | | $ | (0.132 | ) | |
| Net realized and unrealized gain | | | 1.777 | | | | 1.602 | | | | 1.679 | | | | 1.651 | | | | 2.602 | | |
| Total income from operations | | $ | 1.609 | | | $ | 1.428 | | | $ | 1.490 | | | $ | 1.480 | | | $ | 2.470 | | |
| Less distributions | |
| From net realized gain | | $ | (1.149 | ) | | $ | (0.818 | ) | | $ | — | | | $ | — | | | $ | — | | |
| Total distributions | | $ | (1.149 | ) | | $ | (0.818 | ) | | $ | — | | | $ | — | | | $ | — | | |
| Net asset value — End of year | | $ | 15.330 | | | $ | 14.870 | | | $ | 14.260 | | | $ | 12.770 | | | $ | 11.290 | | |
| Total Return(2) | | | 11.41 | % | | | 10.45 | % | | | 11.67 | % | | | 13.11 | % | | | 28.00 | % | |
| Ratios/Supplemental Data | |
| Net assets, end of year (000's omitted) | | $ | 6,412 | | | $ | 7,033 | | | $ | 7,802 | | | $ | 7,784 | | | $ | 5,961 | | |
| Ratios (As a percentage of average daily net assets): | |
| Expenses before custodian fee reduction(3)(4) | | | 2.44 | % | | | 2.50 | % | | | 2.50 | % | | | 2.50 | % | | | 2.50 | % | |
| Expenses after custodian fee reduction(3)(4) | | | 2.44 | % | | | 2.50 | % | | | 2.50 | % | | | 2.50 | % | | | 2.50 | % | |
| Net investment loss | | | (1.12 | )% | | | (1.20 | )% | | | (1.36 | )% | | | (1.41 | )% | | | (1.36 | )% | |
| Portfolio Turnover of the Portfolio | | | 80 | % | | | 49 | % | | | 24 | % | | | 12 | % | | | 21 | % | |
(1) Net investment loss per share was computed using average shares outstanding.
(2) Returns are historical and are calculated by determining the percentage change in net asset value with all distributions reinvested.
(3) Includes the Fund's share of the Portfolio's allocated expenses.
(4) The administrator subsidized certain operating expenses (equal to 0.32%, 0.26%, 0.28%, 0.35%, and 0.85% of average daily net assets for the fiscal years ended October 31, 2007, 2006, 2005, 2004 and 2003, respectively). A portion of the subsidy was borne by the sub-adviser of the Portfolio.
See notes to financial statements
9
Eaton Vance Tax-Managed Small-Cap Value Fund as of October 31, 2007
FINANCIAL STATEMENTS CONT'D
Financial Highlights
| | | Class C | |
| | | Year Ended October 31, | |
| | | 2007 | | 2006 | | 2005 | | 2004 | | 2003 | |
| Net asset value — Beginning of year | | $ | 14.880 | | | $ | 14.270 | | | $ | 12.780 | | | $ | 11.290 | | | $ | 8.820 | | |
| Income (loss) from operations | |
| Net investment loss(1) | | $ | (0.169 | ) | | $ | (0.174 | ) | | $ | (0.189 | ) | | $ | (0.171 | ) | | $ | (0.131 | ) | |
| Net realized and unrealized gain | | | 1.788 | | | | 1.602 | | | | 1.679 | | | | 1.661 | | | | 2.601 | | |
| Total income from operations | | $ | 1.619 | | | $ | 1.428 | | | $ | 1.490 | | | $ | 1.490 | | | $ | 2.470 | | |
| Less distributions | |
| From net realized gain | | $ | (1.149 | ) | | $ | (0.818 | ) | | $ | — | | | $ | — | | | $ | — | | |
| Total distributions | | $ | (1.149 | ) | | $ | (0.818 | ) | | $ | — | | | $ | — | | | $ | — | | |
| Net asset value — End of year | | $ | 15.350 | | | $ | 14.880 | | | $ | 14.270 | | | $ | 12.780 | | | $ | 11.290 | | |
| Total Return(2) | | | 11.47 | % | | | 10.44 | % | | | 11.66 | % | | | 13.20 | % | | | 28.00 | % | |
| Ratios/Supplemental Data | |
| Net assets, end of year (000's omitted) | | $ | 7,145 | | | $ | 7,805 | | | $ | 6,968 | | | $ | 5,179 | | | $ | 3,870 | | |
| Ratios (As a percentage of average daily net assets): | |
| Expenses before custodian fee reduction(3)(4) | | | 2.44 | % | | | 2.50 | % | | | 2.50 | % | | | 2.50 | % | | | 2.50 | % | |
| Expenses after custodian fee reduction(3)(4) | | | 2.44 | % | | | 2.50 | % | | | 2.50 | % | | | 2.50 | % | | | 2.50 | % | |
| Net investment loss | | | (1.12 | )% | | | (1.19 | )% | | | (1.36 | )% | | | (1.42 | )% | | | (1.35 | )% | |
| Portfolio Turnover of the Portfolio | | | 80 | % | | | 49 | % | | | 24 | % | | | 12 | % | | | 21 | % | |
(1) Net investment loss per share was computed using average shares outstanding.
(2) Returns are historical and are calculated by determining the percentage change in net asset value with all distributions reinvested.
(3) Includes the Fund's share of the Portfolio's allocated expenses.
(4) The administrator subsidized certain operating expenses (equal to 0.32%, 0.26%, 0.28%, 0.35%, and 0.85% of average daily net assets for the fiscal years ended October 31, 2007, 2006, 2005, 2004 and 2003, respectively). A portion of the subsidy was borne by the sub-adviser of the Portfolio.
See notes to financial statements
10
Eaton Vance Tax-Managed Small-Cap Value Fund as of October 31, 2007
NOTES TO FINANCIAL STATEMENTS
1 Significant Accounting Policies
Eaton Vance Tax-Managed Small-Cap Value Fund (the Fund) is a diversified series of Eaton Vance Mutual Funds Trust (the Trust). The Trust is a Massachusetts business trust registered under the Investment Company Act of 1940, as amended (the 1940 Act), as an open-end management investment company. The Fund offers three classes of shares. Class A shares are generally sold subject to a sales charge imposed at time of purchase. Class B and Class C shares are sold at net asset value and are generally subject to a contingent deferred sales charge (see Note 6). Class B shares held for eight years will automatically convert to Class A shares. Each class represents a pro-rata interest in the Fund, but votes separately on class-specific matters and (as noted below) is subject to different expenses. Realized and unrealized gains and losses and net investment income and losses, other than class-specific expenses, are allocated daily to each class of shares based on the relative net assets of each class to the total net assets of the Fund. Each class of shares differs in its distribution plan and certain other class-specific expenses. The Fund invests all of its investable assets in interests of the Tax-Managed Small-Cap Value Portfolio (the Portfolio). The Portfolio is organized as a New York Trust, having the same investment objective and policies of the Fund. The value of the Fund's investment in the Portfolio reflects the Fund's proportionate interest in the net assets of the Portfolio (54.8% at October 31, 2007). The performance of the Fund is directly affected by the performance of the Portfolio. The financial statements of the Portfolio, including the portfolio of investments, are included elsewhere in this report and should be read in conjunction with the Fund's financial statements.
The following is a summary of significant accounting policies of the Fund. The policies are in conformity with accounting principles generally accepted in the United States of America.
A Investment Valuation — Valuation of securities by the Portfolio is discussed in Note 1A of the Portfolio's Notes to Financial Statements, which are included elsewhere in this report.
B Income — The Fund's net investment income or loss consists of the Fund's pro-rata share of the net investment income or loss of the Portfolio, less all actual and accrued expenses of the Fund.
C Federal Taxes — The Fund's policy is to comply with the provisions of the Internal Revenue Code applicable to regulated investment companies and to distribute to shareholders each year substantially all of its net investment income, and all or substantially all of its net realized capital gains. Accordingly, no provision for federal income or excise tax is necessary.
D Expenses — The majority of expenses of the Trust are directly identifiable to an individual fund. Expenses which are not readily identifiable to a specific fund are allocated taking into consideration, among other things, the nature and type of expense and the relative size of the funds.
E Expense Reduction — State Street Bank and Trust Company (SSBT) serves as custodian of the Fund. Pursuant to the custodian agreement, SSBT receives a fee reduced by credits, which are determined based on the average daily cash balance the Fund maintains with SSBT. All credit balances, if any, used to reduce the Fund's custodian fees are reported as a reduction of expenses in the Statement of Operations.
F Use of Estimates — The preparation of the financial statements in conformity with accounting principles generally accepted in the United States of America requires management to make estimates and assumptions that affect the reported amounts of assets and liabilities at the date of the financial statements and the reported amounts of income and expense during the reporting period. Actual results could differ from those estimates.
G Indemnifications — Under the Trust's organizational documents, its officers and Trustees may be indemnified against certain liabilities and expenses arising out of the performance of their duties to the Fund, and shareholders are indemnified against personal liability for obligations of the Trust. Additionally, in the normal course of business, the Fund enters into agreements with service providers that may contain indemnification clauses. The Fund's maximum exposure under these arrangements is unknown as this would involve future claims that may be made against the Fund that have not yet occurred.
H Other — Investment transactions are accounted for on a trade date basis. Dividends to shareholders are recorded on the ex-dividend date.
11
Eaton Vance Tax-Managed Small-Cap Value Fund as of October 31, 2007
NOTES TO FINANCIAL STATEMENTS CONT'D
2 Distributions to Shareholders
It is the present policy of the Fund to make at least one distribution annually (normally in December) of all or substantially all of its net investment income and at least one distribution annually of all or substantially all of its net realized capital gains (reduced by available capital loss carryforwards from prior years, if any). Distributions are declared separately for each class of shares. Shareholders may reinvest distributions in shares of the same class of the Fund at the net asset value as of the reinvestment date or, at the election of the shareholder, receive distributions in cash. The Fund distinguishes between distributions on a tax basis and a financial reporting basis. Accounting principles generally accepted in the United States of America require that only distributions in excess of tax basis earnings and profits be reported in the financial statements as a return of capital. Permanent differences between boo k and tax accounting relating to distributions are reclassified to paid-in capital.
The tax character of distributions paid for the years ended October 31, 2007 and October 31, 2006 was as follows:
| | | Year Ended October 31, | |
| | | 2007 | | 2006 | |
| Distributions declared from: | |
| Long-Term Capital Gains | | $ | 2,270,136 | | | $ | 1,625,046 | | |
During the year ended October 31, 2007, the following amounts were reclassified due to differences between book and tax accounting, primarily for expired net operating losses.
| Increase (decrease): | |
| Paid-in capital | | $ | (228,758 | ) | |
| Accumulated net investment loss | | $ | 228,758 | | |
These reclassifications had no effect on the net assets or net asset value per share of the Fund.
As of October 31, 2007, the components of distributable earnings (accumulated losses) and unrealized appreciation (depreciation) on a tax basis were as follows:
| Undistributed net realized gain | | $ | 3,050,520 | | |
| Unrealized appreciation (depreciation) | | $ | 8,273,585 | | |
The differences between components of distributable earnings (accumulated loss) on a tax basis and the amounts reflected in the Statement of Assets and Liabilities are primarily due to differences in book and tax policies for partnership allocations.
3 Shares of Beneficial Interest
The Fund's Declaration of Trust permits the Trustees to issue an unlimited number of full and fractional shares of beneficial interest (without par value). Such shares may be issued in a number of different series (such as the Fund) and classes. Transactions in Fund shares were as follows:
| | | Year Ended October 31, | |
| Class A | | 2007 | | 2006 | |
| Sales | | | 252,535 | | | | 222,934 | | |
Issued to shareholders electing to
receive payments of distributions
in Fund shares | | | 66,027 | | | | 46,072 | | |
| Redemptions | | | (188,524 | ) | | | (274,772 | ) | |
| Exchanges from Class B shares | | | 33,476 | | | | 48,007 | | |
| Net increase | | | 163,514 | | | | 42,241 | | |
| | | Year Ended October 31, | |
| Class B | | 2007 | | 2006 | |
| Sales | | | 27,844 | | | | 50,495 | | |
Issued to shareholders electing to
receive payments of distributions
in Fund shares | | | 28,198 | | | | 23,920 | | |
| Redemptions | | | (75,874 | ) | | | (98,844 | ) | |
| Exchanges to Class A shares | | | (34,916 | ) | | | (49,502 | ) | |
| Net decrease | | | (54,748 | ) | | | (73,931 | ) | |
| | | Year Ended October 31, | |
| Class C | | 2007 | | 2006 | |
| Sales | | | 74,710 | | | | 107,147 | | |
Issued to shareholders electing to
receive payments of distributions
in Fund shares | | | 28,624 | | | | 20,622 | | |
| Redemptions | | | (162,266 | ) | | | (91,520 | ) | |
| Net increase (decrease) | | | (58,932 | ) | | | 36,249 | | |
4 Transactions with Affiliates
The administration fee is earned by Eaton Vance Management (EVM) as compensation for managing and administering the business affairs of the Fund. Under the administration agreement, EVM earns a fee in the amount of 0.15% per annum of average daily net assets of the Fund. For the year ended October 31, 2007, the administration fee amounted to $48,151. Pursuant to an
12
Eaton Vance Tax-Managed Small-Cap Value Fund as of October 31, 2007
NOTES TO FINANCIAL STATEMENTS CONT'D
expense reimbursement agreement, EVM and Fox Asset Management LLC (Fox), a majority owned subsidiary of EVM and sub-adviser to the Portfolio, were allocated $25,472 and $76,417, respectively, of the Fund's operating expenses for the year ended October 31, 2007. Prior to April 23, 2007, this expense reimbursement agreement was voluntary and could be terminated at any time. Effective April 23, 2007, EVM and Fox have agreed to reimburse the Fund's expenses to the extent that the Total Annual Operating Expenses exceeded 1.65% for Class A shares and 2.40% for Class B and Class C shares. This expense reimbursement agreement will continue through April 30, 2010. The Portfolio has engaged Boston Management and Research (BMR), a subsidiary of EVM, to render investment advisory services. (See Note 2 of the Portfolio's Notes to Financial Statements which are included elsewhere in this report.) EVM serves as the sub-transfer agent of the Fu nd and receives from the transfer agent an aggregate fee based upon the actual expenses incurred by EVM in the performance of those services. During the year ended October 31, 2007, EVM received approximately $3,420 in sub-transfer agent fees.
Eaton Vance Distributors, Inc. (EVD), a subsidiary of EVM and the Fund's principal underwriter, received $8,666 as its portion of the sales charge on sales of Class A shares for the year ended October 31, 2007. EVD also received distribution and services fees from Class A, Class B and Class C shares (see Note 5) and contingent deferred sales charges (see Note 6).
Except for Trustees of the Fund and the Portfolio who are not members of EVM's or BMR's organizations, officers and Trustees receive remuneration for their services to the Fund out of the investment adviser fee earned by BMR. Trustees of the Fund that are not affiliated with EVM or BMR may elect to defer receipt of all or a percentage of their annual fees in accordance with the terms of the Trustees Deferred Compensation Plan. For the year ended October 31, 2007, no significant amounts have been deferred.
Certain officers and Trustees of the Fund and of the Portfolio are officers of the above organizations.
5 Distribution Plans
The Fund has in effect a distribution plan for Class A shares (Class A Plan) pursuant to Rule 12b-1 under the 1940 Act. The Class A Plan provides that the Fund will pay EVD a distribution and service fee of 0.25% per annum of its average daily net assets attributable to Class A shares for distribution services and facilities provided to the Fund by EVD, as well as for personal services and/or the maintenance of shareholder accounts. Distribution and service fees paid or accrued to EVD for the year ended October 31, 2007 amounted to $43,526 for Class A shares. The Fund also has in effect distribution plans for Class B shares (Class B Plan) and Class C shares (Class C Plan) pursuant to Rule 12b-1 under the 1940 Act. The Class B and Class C Plans require the Fund to pay EVD amounts equal to 0.75% per annum of the Fund's average daily net assets attributable to Class B and Class C shares for providing ongoing distribution services and facilities to the Fund. The Fund will automatically discontinue payments to EVD during any period in which there are no outstanding Uncovered Distribution Charges, which are equivalent to the sum of (i) 6.25% of the aggregate amount received by the Fund for the Class B and Class C shares sold, plus (ii) interest calculated by applying the rate of 1% over the prevailing prime rate to the outstanding balance of Uncovered Distribution Charges of EVD of each respective class, reduced by the aggregate amount of contingent deferred sales charges (see Note 6) and amounts theretofore paid or payable to EVD by each respective class. For the year ended October 31, 2007 the Fund paid or accrued $51,837 and $58,339 for Class B and Class C shares, respectively, to or payable to EVD, representing 0.75% of the average daily net assets of Class B and Class C shares. At October 31, 2007, the amount of Uncovered Distribution Charges of EVD calculated u nder the Plans was approximately $100,000 and $396,000 for Class B and Class C shares, respectively. The Class B and Class C Plans also authorize the Fund to make payments of service fees to EVD, investment dealers, and other persons in amounts not exceeding 0.25% per annum of the Fund's average daily net assets attributable to the Class B and Class C shares. Service fees paid or accrued are for personal services and/or the maintenance of shareholder accounts. They are separate and distinct from the sales commissions and distribution fees payable to EVD and, as such, are not subject to automatic discontinuance when there are no outstanding Uncovered Distribution Charges of EVD. Service fees paid or accrued for the year ended October 31, 2007 amounted to $17,279, and $19,446, for Class B and Class C shares, respectively.
6 Contingent Deferred Sales Charge
A contingent deferred sales charge (CDSC) generally is imposed on redemptions of Class B shares made within six years of purchase and on redemptions of Class C shares made within one year of purchase. Class A shares may be subject to a CDSC of up to 1% if redeemed within two years of purchase (depending upon the circumstances of purchase). Generally, the CDSC is based upon the lower of the net asset value at date of redemption or date of purchase. No charge is levied on shares acquired by
13
Eaton Vance Tax-Managed Small-Cap Value Fund as of October 31, 2007
NOTES TO FINANCIAL STATEMENTS CONT'D
reinvestment of dividends or capital gains distributions. The Class B CDSC is imposed at declining rates that begin at 5% in the case of redemptions in the first and second year after purchase, declining one percentage point each subsequent year. Class C shares are subject to a 1% CDSC if redeemed within one year of purchase. No CDSC is levied on shares which have been sold to EVM or its affiliates or to their respective employees or clients and may be waived under certain other limited conditions. CDSC received on Class B and Class C redemptions are paid to EVD to reduce the amount of Uncovered Distribution Charges calculated under the Fund's Class B and Class C Plans. CDSC received on Class B and Class C redemptions when no Uncovered Distribution Charges exist are credited to the Fund. The Fund was informed that EVD received approximately $5,000 and $1,000 of CDSC paid by shareholders for Class B and Class C shares, respective ly, for the year ended October 31, 2007. EVD did not receive any CDSC from shareholders of Class A shares for the year ended October 31, 2007.
7 Investment Transactions
Increases and decreases in the Fund's investment in the Portfolio aggregated $5,518,111 and $7,234,160 respectively, for the year ended October 31, 2007.
8 Recently Issued Accounting Pronouncements
In June 2006, the Financial Accounting Standards Board (FASB) issued FASB Interpretation No. 48 (FIN 48), "Accounting for Uncertainty in Income Taxes – an interpretation of FASB Statement No. 109". FIN 48 clarifies the accounting for uncertainty in income taxes recognized in accordance with FASB Statement No. 109, "Accounting for Income Taxes". This interpretation prescribes a recognition threshold and measurement attribute for the financial statement recognition and measurement of a tax position taken or expected to be taken in a tax return. It also provides guidance on de-recognition, classification, interest and penalties, accounting in interim periods, disclosure and transition. FIN 48 is effective on the last business day of the first required financial reporting period for fiscal years beginning after December 15, 2006. Management is currently evaluating the impact of applying the various provisions of FIN 48.
In September 2006, the FASB issued Statement of Financial Accounting Standards No. 157 (FAS 157), "Fair Value Measurements". FAS 157 defines fair value, establishes a framework for measuring fair value in accordance with generally accepted accounting principles and expands disclosure about fair value measurements. FAS 157 is effective for fiscal years beginning after November 15, 2007. Management is currently evaluating the impact the adoption of FAS 157 will have on the Fund's financial statement disclosures.
14
Eaton Vance Tax-Managed Small-Cap Value Fund as of October 31, 2007
REPORT OF INDEPENDENT REGISTERED PUBLIC ACCOUNTING FIRM
To the Trustees of Eaton Vance Mutual Funds Trust and Shareholders of Eaton Vance Tax-Managed Small-Cap Value Fund:
We have audited the accompanying statement of assets and liabilities of Eaton Vance Tax-Managed Small-Cap Value Fund (the Fund) (one of the series of Eaton Vance Mutual Funds Trust) as of October 31, 2007, the related statement of operations for the year then ended, the statements of changes in net assets for each of the two years in the period then ended and the financial highlights for each of the five years in the period then ended. These financial statements and financial highlights are the responsibility of the Fund's management. Our responsibility is to express an opinion on these financial statements and financial highlights based on our audits.
We conducted our audits in accordance with the standards of the Public Company Accounting Oversight Board (United States). Those standards require that we plan and perform the audit to obtain reasonable assurance about whether the financial statements and financial highlights are free of material misstatement. The Fund is not required to have, nor were we engaged to perform, an audit of its internal control over financial reporting. Our audits included consideration of internal control over financial reporting as a basis for designing audit procedures that are appropriate in the circumstances, but not for the purpose of expressing an opinion on the effectiveness of the Fund's internal control over financial reporting. Accordingly, we express no such opinion. An audit also includes examining, on a test basis, evidence supporting the amounts and disclosures in the financial statements, assessing the accounting principles used and significant estimates made by management, as well as evaluating the overall financial statement presentation. We believe that our audits provide a reasonable basis for our opinion.
In our opinion, such financial statements and financial highlights referred to above present fairly, in all material respects, the financial position of Eaton Vance Tax-Managed Small-Cap Value Fund as of October 31, 2007, the results of its operations for the year then ended, the changes in its net assets for each of the two years in the period then ended and the financial highlights for each of the five years in the period then ended, in conformity with accounting principles generally accepted in the United States of America.
DELOITTE & TOUCHE LLP
Boston, Massachusetts
December 14, 2007
15
Eaton Vance Tax-Managed Small-Cap Value Fund as of October 31, 2007
FEDERAL TAX INFORMATION (Unaudited)
The Form 1099-DIV you receive in January 2008 will show the tax status of all distributions paid to your account in calendar year 2007. Shareholders are advised to consult their own tax adviser with respect to the tax consequences of their investment in the Fund. As required by the Internal Revenue Code regulations, shareholders must be notified within 60 days of the Fund's fiscal year end regarding the status of long-term capital gains distributions.
Long-term Capital Gains Distributions — The Fund designates $2,270,136 as a long-term capital gain distribution.
16
Tax-Managed Small-Cap Value Portfolio as of October 31, 2007
PORTFOLIO OF INVESTMENTS
| Common Stocks — 92.4% | |
| Security | | Shares | | Value | |
| Auto Components — 2.9% | |
| BorgWarner, Inc. | | | 16,200 | | | $ | 1,712,502 | | |
| | | $ | 1,712,502 | | |
| Capital Markets — 2.6% | |
| OptionsXpress Holdings, Inc. | | | 53,100 | | | $ | 1,580,256 | | |
| | | $ | 1,580,256 | | |
| Chemicals — 2.0% | |
| RPM International, Inc. | | | 55,000 | | | $ | 1,178,650 | | |
| | | $ | 1,178,650 | | |
| Commercial Banks — 5.3% | |
| Boston Private Financial Holdings, Inc. | | | 30,300 | | | $ | 871,428 | | |
| Provident Bankshares Corp. | | | 40,000 | | | | 986,800 | | |
| UCBH Holdings, Inc. | | | 77,000 | | | | 1,314,390 | | |
| | | $ | 3,172,618 | | |
| Commercial Services & Supplies — 1.3% | |
| Pike Electric Corp.(1) | | | 39,700 | | | $ | 782,090 | | |
| | | $ | 782,090 | | |
| Construction & Engineering — 0.9% | |
| Granite Construction, Inc. | | | 12,000 | | | $ | 513,840 | | |
| | | $ | 513,840 | | |
| Containers & Packaging — 3.7% | |
| AptarGroup, Inc. | | | 49,000 | | | $ | 2,190,300 | | |
| | | $ | 2,190,300 | | |
| Electric Utilities — 2.1% | |
| Cleco Corp. | | | 48,300 | | | $ | 1,272,705 | | |
| | | $ | 1,272,705 | | |
| Electrical Equipment — 1.6% | |
| A.O. Smith Corp. | | | 25,000 | | | $ | 934,750 | | |
| | | $ | 934,750 | | |
| Security | | Shares | | Value | |
| Electronic Equipment & Instruments — 1.6% | |
| Technitrol, Inc. | | | 31,500 | | | $ | 926,415 | | |
| | | $ | 926,415 | | |
| Energy Equipment & Services — 6.7% | |
| Bristow Group, Inc.(1) | | | 28,700 | | | $ | 1,431,843 | | |
| Oil States International, Inc.(1) | | | 43,900 | | | | 1,896,041 | | |
| Parker Drilling Co.(1) | | | 76,000 | | | | 641,440 | | |
| | | $ | 3,969,324 | | |
| Food & Staples Retailing — 4.1% | |
| BJ's Wholesale Club, Inc.(1) | | | 50,600 | | | $ | 1,815,528 | | |
| Performance Food Group Co.(1) | | | 22,700 | | | | 612,673 | | |
| | | $ | 2,428,201 | | |
| Food Products — 3.0% | |
| Chiquita Brands International, Inc.(1) | | | 95,500 | | | $ | 1,790,625 | | |
| | | $ | 1,790,625 | | |
| Gas Utilities — 4.4% | |
| Piedmont Natural Gas Co., Inc. | | | 74,000 | | | $ | 1,889,220 | | |
| Questar Corp. | | | 12,400 | | | | 707,792 | | |
| | | $ | 2,597,012 | | |
| Health Care Equipment & Supplies — 4.2% | |
| PolyMedica Corp. | | | 25,600 | | | $ | 1,355,776 | | |
| West Pharmaceutical Services, Inc. | | | 28,200 | | | | 1,165,788 | | |
| | | $ | 2,521,564 | | |
| Health Care Providers & Services — 3.2% | |
| Owens & Minor, Inc. | | | 47,500 | | | $ | 1,925,650 | | |
| | | $ | 1,925,650 | | |
| Hotels, Restaurants & Leisure — 2.1% | |
| Applebee's International, Inc. | | | 28,500 | | | $ | 722,190 | | |
| CBRL Group, Inc. | | | 13,800 | | | | 550,620 | | |
| | | $ | 1,272,810 | | |
| Household Durables — 3.6% | |
| Tupperware Brands Corp. | | | 60,000 | | | $ | 2,166,000 | | |
| | | $ | 2,166,000 | | |
See notes to financial statements
17
Tax-Managed Small-Cap Value Portfolio as of October 31, 2007
PORTFOLIO OF INVESTMENTS CONT'D
| Security | | Shares | | Value | |
| Household Products — 3.1% | |
| Church & Dwight Co., Inc. | | | 39,000 | | | $ | 1,845,090 | | |
| | | $ | 1,845,090 | | |
| Industrial Conglomerates — 4.7% | |
| Teleflex, Inc. | | | 11,500 | | | $ | 841,915 | | |
| Walter Industries, Inc. | | | 63,100 | | | | 1,933,384 | | |
| | | $ | 2,775,299 | | |
| Insurance — 4.5% | |
| IPC Holdings Ltd. | | | 11,300 | | | $ | 337,983 | | |
| Protective Life Corp. | | | 35,500 | | | | 1,521,885 | | |
| Zenith National Insurance Corp. | | | 19,800 | | | | 795,564 | | |
| | | $ | 2,655,432 | | |
| IT Services — 2.1% | |
| Ness Technologies, Inc.(1) | | | 108,000 | | | $ | 1,263,600 | | |
| | | $ | 1,263,600 | | |
| Leisure Equipment & Products — 2.4% | |
| RC2 Corp.(1) | | | 47,600 | | | $ | 1,419,432 | | |
| | | $ | 1,419,432 | | |
| Machinery — 3.3% | |
| Albany International Corp., Class A | | | 15,700 | | | $ | 588,750 | | |
| CLARCOR, Inc. | | | 37,200 | | | | 1,356,312 | | |
| | | $ | 1,945,062 | | |
| Oil, Gas & Consumable Fuels — 3.0% | |
| Cimarex Energy Co. | | | 23,700 | | | $ | 960,087 | | |
| Penn Virginia Corp. | | | 17,000 | | | | 822,800 | | |
| | | $ | 1,782,887 | | |
| Personal Products — 2.0% | |
| Chattem, Inc.(1) | | | 16,000 | | | $ | 1,188,800 | | |
| | | $ | 1,188,800 | | |
| Road & Rail — 1.5% | |
| Arkansas Best Corp. | | | 32,500 | | | $ | 892,125 | | |
| | | $ | 892,125 | | |
| Security | | Shares | | Value | |
| Semiconductors & Semiconductor Equipment — 5.2% | |
| Diodes, Inc.(1) | | | 46,950 | | | $ | 1,552,167 | | |
| ON Semiconductor Corp.(1) | | | 153,300 | | | | 1,563,660 | | |
| | | $ | 3,115,827 | | |
| Software — 3.2% | |
| Epicor Software Corp.(1) | | | 90,000 | | | $ | 1,051,200 | | |
| Smith Micro Software, Inc.(1) | | | 56,700 | | | | 873,747 | | |
| | | $ | 1,924,947 | | |
| Textiles, Apparel & Luxury Goods — 2.1% | |
| Carter's, Inc.(1) | | | 55,500 | | | $ | 1,225,440 | | |
| | | $ | 1,225,440 | | |
Total Common Stocks
(identified cost $38,566,669) | | $ | 54,969,253 | | |
Total Investments — 92.4%
(identified cost $38,566,669) | | $ | 54,969,253 | | |
| Other Assets, Less Liabilities — 7.6% | | $ | 4,541,967 | | |
| Net Assets — 100.0% | | $ | 59,511,220 | | |
(1) Non-income producing security.
See notes to financial statements
18
Tax-Managed Small-Cap Value Portfolio as of October 31, 2007
FINANCIAL STATEMENTS
Statement of Assets and Liabilities
As of October 31, 2007
| Assets | |
| Investments, at value (identified cost, $38,566,669) | | $ | 54,969,253 | | |
| Cash | | | 4,383,191 | | |
| Receivable for investments sold | | | 6,554,079 | | |
| Dividends and interest receivable | | | 57,932 | | |
| Total assets | | $ | 65,964,455 | | |
| Liabilities | |
| Payable for investments purchased | | $ | 6,351,910 | | |
| Payable to affiliate for investment advisory fees | | | 49,169 | | |
| Payable to affiliate for Trustees' fees | | | 1,042 | | |
| Other accrued expenses | | | 51,114 | | |
| Total liabilities | | $ | 6,453,235 | | |
| Net Assets applicable to investors' interest in Portfolio | | $ | 59,511,220 | | |
| Sources of Net Assets | |
| Net proceeds from capital contributions and withdrawals | | $ | 43,108,636 | | |
| Net unrealized appreciation (computed on the basis of identified cost) | | | 16,402,584 | | |
| Total | | $ | 59,511,220 | | |
Statement of Operations
For the Year Ended
October 31, 2007
| Investment Income | |
| Dividends | | $ | 646,113 | | |
| Interest | | | 121,867 | | |
| Total investment income | | $ | 767,980 | | |
| Expenses | |
| Investment adviser fee | | $ | 580,712 | | |
| Trustees' fees and expenses | | | 7,312 | | |
| Custodian fee | | | 38,652 | | |
| Legal and accounting services | | | 30,680 | | |
| Miscellaneous | | | 2,609 | | |
| Total expenses | | $ | 659,965 | | |
Deduct —
Reduction of custodian fee | | $ | 1 | | |
| Total expense reductions | | $ | 1 | | |
| Net expenses | | $ | 659,964 | | |
| Net investment income | | $ | 108,016 | | |
| Realized and Unrealized Gain (Loss) | |
Net realized gain (loss) —
Investment transactions (identified cost basis) | | $ | 6,466,302 | | |
| Net realized gain | | $ | 6,466,302 | | |
Change in unrealized appreciation (depreciation) —
Investments (identified cost basis) | | $ | 321,816 | | |
| Net change in unrealized appreciation (depreciation) | | $ | 321,816 | | |
| Net realized and unrealized gain | | $ | 6,788,118 | | |
| Net increase in net assets from operations | | $ | 6,896,134 | | |
See notes to financial statements
19
Tax-Managed Small-Cap Value Portfolio as of October 31, 2007
FINANCIAL STATEMENTS CONT'D
Statements of Changes in Net Assets
Increase (Decrease)
in Net Assets | | Year Ended
October 31, 2007 | | Year Ended
October 31, 2006 | |
From operations —
Net investment income | | $ | 108,016 | | | $ | 88,774 | | |
Net realized gain from
investment transactions | | | 6,466,302 | | | | 4,818,587 | | |
Net change in unrealized appreciation
(depreciation) of investments | | | 321,816 | | | | 1,030,544 | | |
| Net increase in net assets from operations | | $ | 6,896,134 | | | $ | 5,937,905 | | |
Capital transactions —
Contributions | | $ | 5,518,111 | | | $ | 5,563,481 | | |
| Withdrawals | | | (7,234,160 | ) | | | (7,961,150 | ) | |
Net decrease in net assets from
capital transactions | | $ | (1,716,049 | ) | | $ | (2,397,669 | ) | |
| Net increase in net assets | | $ | 5,180,085 | | | $ | 3,540,236 | | |
| Net Assets | |
| At beginning of year | | $ | 54,331,135 | | | $ | 50,790,899 | | |
| At end of year | | $ | 59,511,220 | | | $ | 54,331,135 | | |
See notes to financial statements
20
Tax-Managed Small-Cap Value Portfolio as of October 31, 2007
FINANCIAL STATEMENTS CONT'D
Supplementary Data
| | | Year Ended October 31, | |
| | | 2007 | | 2006 | | 2005 | | 2004 | | 2003 | |
| Ratios/Supplemental Data | |
| Ratios (As a percentage of average daily net assets): | |
| Expenses before custodian fee reduction | | | 1.14 | % | | | 1.14 | % | | | 1.15 | % | | | 1.14 | % | | | 1.18 | % | |
| Expenses after custodian fee reduction | | | 1.14 | % | | | 1.14 | % | | | 1.15 | % | | | 1.14 | % | | | 1.18 | % | |
| Net investment income (loss) | | | 0.19 | % | | | 0.17 | % | | | (0.00 | )%(1) | | | (0.06 | )% | | | (0.04 | )% | |
| Portfolio Turnover | | | 80 | % | | | 49 | % | | | 24 | % | | | 12 | % | | | 21 | % | |
| Total Return | | | 12.92 | % | | | 11.91 | % | | | 13.20 | % | | | 14.62 | % | | | 29.62 | % | |
| Net assets, end of year (000's omitted) | | $ | 59,511 | | | $ | 54,331 | | | $ | 50,791 | | | $ | 53,226 | | | $ | 41,903 | | |
(1) Amounts to less than (0.01)%.
See notes to financial statements
21
Tax-Managed Small-Cap Value Portfolio as of October 31, 2007
NOTES TO FINANCIAL STATEMENTS
1 Significant Accounting Policies
Tax-Managed Small-Cap Value Portfolio (the Portfolio) is registered under the Investment Company Act of 1940, as amended (the 1940 Act), as a diversified open-end management investment company. The Portfolio, which was organized as a trust under the laws of the State of New York on December 10, 2001, seeks to achieve long-term after-tax returns by investing in a diversified portfolio of value stocks of small-cap companies. The Declaration of Trust permits the Trustees to issue interests in the Portfolio. At October 31, 2007, the Eaton Vance Tax-Managed Small-Cap Value Fund and the Eaton Vance Tax Managed Equity Asset Allocation Fund held 54.8% and 45.2% interests in the Portfolio, respectively. The following is a summary of significant accounting policies followed by the Portfolio in the preparation of its financial statements. The policies are in conformity with accounting principles generally accepted in the United States of A merica.
A Investment Valuation — Securities listed on a U.S. securities exchange generally are valued at the last sale price on the day of valuation or, if no sales took place on such date, at the mean between the closing bid and asked prices therefore on the exchange where such securities are principally traded. Equity securities listed on the NASDAQ Global or Global Select Market generally are valued at the official NASDAQ closing price. Unlisted or listed securities for which closing sales prices or closing quotations are not available are valued at the mean between the latest available bid and asked prices or, in the case of preferred equity securities that are not listed or traded in the over-the-counter market, by an independent pricing service. Exchange-traded options are valued at the last sale price for the day of valuation as quoted on the principal exchange or board of trade on which the options are traded or, in the absence of sales on such date, at the mean between the latest bid and asked prices therefore. Futures positions on securities and currencies generally are valued at closing settlement prices. Short-term debt securities with a remaining maturity of 60 days or less are valued at amortized cost. If short-term debt securities are acquired with a remaining maturity of more than 60 days, they will be valued by a pricing service. Other fixed income and debt securities, including listed securities and securities for which price quotations are available, will normally be valued on the basis of valuations furnished by a pricing service. Foreign securities and currencies are valued in U.S. dollars, based on foreign currency exchange rate quotations supplied by an independent quotation service. The d aily valuation of exchange traded foreign securities generally is determined as of the close of trading on the principal exchange on which such securities trade. Events occurring after the close of trading on foreign exchanges may result in adjustments to the valuation of foreign securities to more accurately reflect their fair value as of the close of regular trading on the New York Stock Exchange. When valuing foreign equity securities that meet certain criteria, the Trustees have approved the use of a fair value service that values such securities to reflect market trading that occurs after the close of the applicable foreign markets of comparable securities or other instruments that have a strong correlation to the fair valued securities. Investments held by the Portfolio for which valuations or market quotations are unavailable are valued at fair value using methods determined in good faith by or at the direction of the Trustees of the Portfolio considering relevant factors, data and information including the market value of freely tradable securities of the same class in the principal market on which such securities are normally traded.
B Investment Transactions — Investment transactions for financial statement purposes are accounted for on a trade date basis. Realized gains and losses on securities sold are determined on the basis of identified cost.
C Income — Dividend income is recorded on the ex-dividend date for dividends received in cash and/or securities. Interest income is recorded on the basis of interest accrued, adjusted for amortization of premium or accretion of discount.
D Federal Taxes — The Portfolio has elected to be treated as a partnership for federal tax purposes. No provision is made by the Portfolio for federal or state taxes on any taxable income of the Portfolio because each investor in the Portfolio is ultimately responsible for the payment of any taxes on its share of taxable income. Since at least one of the Portfolio's investors is a regulated investment company that invests all or substantially all of its assets in the Portfolio, the Portfolio normally must satisfy the applicable source of income and diversification requirements (under the Internal Revenue Code) in order for its investors to satisfy them. The Portfolio will allocate, at least annually among its investors, each investor's distributive share of the Portfolio' s net investment income, net realized capital gains and any other items of income, gain, loss, deduction or credit.
E Expense Reduction — State Street Bank and Trust Company (SSBT) serves as custodian of the Portfolio. Pursuant to the custodian agreement, SSBT receives a fee reduced by credits, which are determined based on the average daily cash balance the Portfolio maintains with
22
Tax-Managed Small-Cap Value Portfolio as of October 31, 2007
NOTES TO FINANCIAL STATEMENTS CONT'D
SSBT. All credit balances, if any, used to reduce the Portfolio's custodian fees are reported as a reduction of expenses in the Statement of Operations.
F Use of Estimates — The preparation of the financial statements in conformity with accounting principles generally accepted in the United States of America requires management to make estimates and assumptions that affect the reported amounts of assets and liabilities at the date of the financial statements and the reported amounts of income and expense during the reporting period. Actual results could differ from those estimates.
G Indemnifications — Under the Portfolio's organizational documents, its officers and Trustees may be indemnified against certain liabilities and expenses arising out of the performance of their duties to the Portfolio. Interestholders in the Portfolio are jointly and severally liable for the liabilities and obligations of the Portfolio in the event that the Portfolio fails to satisfy such liabilities and obligations; provided, however, that, to the extent assets are available in the Portfolio, the Portfolio may, under certain circumstances, indemnify interestholders from and against any claim or liability to which such holder may become subject by reason of being or having been an interestholder in t he Portfolio. Additionally, in the normal course of business, the Portfolio enters into agreements with service providers that may contain indemnification clauses. The Portfolio's maximum exposure under these arrangements is unknown as this would involve future claims that may be made against the Portfolio that have not yet occurred.
2 Investment Adviser Fee and Other Transactions with Affiliates
The investment adviser fee is earned by Boston Management and Research (BMR), a subsidiary of Eaton Vance Management (EVM), as compensation for management and investment advisory services rendered to the Portfolio. Pursuant to the investment advisory agreement, BMR receives a monthly fee in the annual rate of 1.00% of the Portfolio's average daily net assets up to $500 million and at reduced rates as daily net assets exceed that level. For the year ended October 31, 2007, the Portfolio's investment advisory fee totaled $580,712. Pursuant to a sub-advisory agreement, BMR has delegated the investment management of the Portfolio to Fox Asset Management LLC (Fox), a majority owned subsidiary of EVM and sub-adviser to the Portfolio. BMR pays Fox a monthly fee for sub-advisory services provided to the Portfolio of 0.75% per annum of the average daily net assets up to $500 million and at reduced rates as daily net assets exceed that level.
Except as to the Trustees of the Portfolio who are not members of EVM's or BMR's organizations, officers and Trustees receive remuneration for their services to the Portfolio out of such investment adviser fee and sub-adviser fees. Trustees of the Portfolio who are not affiliated with BMR may elect to defer receipt of all or a percentage of their annual fees in accordance with the terms of the Trustees Deferred Compensation Plan. For the year ended October 31, 2007, no significant amounts have been deferred.
Certain officers and Trustees of the Fund and of the Portfolio are officers of the above organizations.
3 Investment Transactions
Purchases and sales of investments, other than short-term obligations, aggregated $43,405,485 and $46,194,308, respectively, for the year ended October 31, 2007.
4 Federal Income Tax Basis of Unrealized Appreciation (Depreciation)
The cost and unrealized appreciation (depreciation) in value of the investments owned at October 31, 2007, as determined on a federal income tax basis, were as follows:
| Aggregate cost | | $ | 38,566,669 | | |
| Gross unrealized appreciation | | $ | 16,424,406 | | |
| Gross unrealized depreciation | | | (21,822 | ) | |
| Net unrealized appreciation | | $ | 16,402,584 | | |
5 Financial Instruments
The Portfolio may trade in financial instruments with off-balance sheet risk in the normal course of its investing activities to assist in managing exposure to various market risks. These financial instruments may include written options and financial futures contracts and may involve, to a varying degree, elements of risk in excess of the amounts recognized for financial statement purposes. The notional or contractual amounts of these instruments represent the investment the Portfolio has in particular classes of financial instruments and does not necessarily represent the amounts potentially subject to risk. The measurement of the risks associated with these instruments is meaningful only when all related and offsetting transactions are
23
Tax-Managed Small-Cap Value Portfolio as of October 31, 2007
NOTES TO FINANCIAL STATEMENTS CONT'D
considered. The Portfolio did not have any open obligations under these financial instruments at October 31, 2007.
6 Line of Credit
The Portfolio participates with other portfolios and funds managed by EVM and its affiliates in a $200 million unsecured line of credit agreement with a group of banks. Borrowings will be made by the Portfolio solely to facilitate the handling of unusual and/or unanticipated short-term cash requirements. Interest is charged to the Portfolio based on its borrowings at an amount above either the Eurodollar rate or Federal Funds rate. In addition, a fee computed at an annual rate of 0.07% on the daily unused portion of the line of credit is allocated among the participating portfolios and funds at the end of each quarter. The Portfolio did not have any significant borrowings or allocated fees during the year ended October 31, 2007.
7 Recently Issued Accounting Pronouncements
In June 2006, the Financial Accounting Standards Board (FASB) issued FASB Interpretation No. 48 (FIN 48), "Accounting for Uncertainty in Income Taxes – an interpretation of FASB Statement No. 109". FIN 48 clarifies the accounting for uncertainty in income taxes recognized in accordance with FASB Statement No. 109, "Accounting for Income Taxes". This interpretation prescribes a recognition threshold and measurement attribute for the financial statement recognition and measurement of a tax position taken or expected to be taken in a tax return. It also provides guidance on de-recognition, classification, interest and penalties, accounting in interim periods, disclosure and transition. FIN 48 is effective on the last business day of the first required financial reporting period for fiscal years beginning after December 15, 2006. Management is currently evaluating the impact of applying the various provisions of FIN 48.
In September 2006, the FASB issued Statement of Financial Accounting Standards No. 157 (FAS 157), "Fair Value Measurements". FAS 157 defines fair value, establishes a framework for measuring fair value in accordance with generally accepted accounting principles and expands disclosure about fair value measurements. FAS 157 is effective for fiscal years beginning after November 15, 2007. Management is currently evaluating the impact the adoption of FAS 157 will have on the Portfolio's financial statement disclosures.
24
Tax-Managed Small-Cap Value Portfolio as of October 31, 2007
REPORT OF INDEPENDENT REGISTERED PUBLIC ACCOUNTING FIRM
To the Trustees and Investors
of Tax-Managed Small-Cap Value Portfolio:
We have audited the accompanying statement of assets and liabilities of Tax-Managed Small-Cap Value Portfolio (the "Portfolio"), including the portfolio of investments, as of October 31, 2007, and the related statement of operations for the year then ended, the statements of changes in net assets for each of the two years in the period then ended, and the supplementary data for each of the five years in the period then ended. These financial statements and supplementary data are the responsibility of the Portfolio's management. Our responsibility is to express an opinion on these financial statements and supplementary data based on our audits.
We conducted our audits in accordance with standards of the Public Company Accounting Oversight Board (United States). Those standards require that we plan and perform the audit to obtain reasonable assurance about whether the financial statements and supplementary data are free of material misstatement. The Portfolio is not required to have, nor were we engaged to perform, an audit of its internal control over financial reporting. Our audits included consideration of internal control over financial reporting as a basis for designing audit procedures that are appropriate in the circumstances, but not for the purpose of expressing an opinion on the effectiveness of the Portfolio's internal control over financial reporting. Accordingly, we express no such opinion. An audit also includes examining, on a test basis, evidence supporting the amounts and disclosures in the financial statements, assessing the accounting principles used and signifying estimates made by management, as well as evaluating the overall financial statement presentation. Our procedures included confirmation of securities owned as of October 31, 2007 by correspondence with the custodian and brokers; where replies were not received from brokers, we performed other audit procedures. We believe that our audits provide a reasonable basis for our opinion.
In our opinion, the financial statements and supplementary data referred to above present fairly, in all material respects, the financial position of Tax-Managed Small-Cap Value Portfolio as of October 31, 2007, the results of its operations for the year then ended, the changes in its net assets for each of the two years in the period then ended, and the supplementary data for each of the five years in the period then ended, in conformity with accounting principles generally accepted in the United States of America.
DELOITTE & TOUCHE LLP
Boston, Massachusetts
December 14, 2007
25
Eaton Vance Tax-Managed Small-Cap Value Fund
BOARD OF TRUSTEES' ANNUAL APPROVAL OF THE INVESTMENT ADVISORY AGREEMENTS
Overview of the Contract Review Process
The Investment Company Act of 1940, as amended (the "1940 Act"), provides, in substance, that each investment advisory agreement between a fund and its investment adviser will continue in effect from year to year only if its continuance is approved at least annually by the fund's board of trustees, including by a vote of a majority of the trustees who are not "interested persons" of the fund ("Independent Trustees"), cast in person at a meeting called for the purpose of considering such approval.
At a meeting of the Boards of Trustees (each a "Board") of the Eaton Vance group of mutual funds (the "Eaton Vance Funds") held on April 23, 2007, the Board, including a majority of the Independent Trustees, voted to approve continuation of existing advisory and sub-advisory agreements for the Eaton Vance Funds for an additional one-year period. In voting its approval, the Board relied upon the affirmative recommendation of the Special Committee of the Board, which is a committee comprised exclusively of Independent Trustees. Prior to making its recommendation, the Special Committee reviewed information furnished for a series of meetings of the Special Committee held in February, March and April 2007. Such information included, among other things, the following:
Information about Fees, Performance and Expenses
• An independent report comparing the advisory and related fees paid by each fund with fees paid by comparable funds;
• An independent report comparing each fund's total expense ratio and its components to comparable funds;
• An independent report comparing the investment performance of each fund to the investment performance of comparable funds over various time periods;
• Data regarding investment performance in comparison to relevant peer groups of funds and appropriate indices;
• Comparative information concerning fees charged by each adviser for managing other mutual funds and institutional accounts using investment strategies and techniques similar to those used in managing the fund;
• Profitability analyses for each adviser with respect to each fund;
Information about Portfolio Management
• Descriptions of the investment management services provided to each fund, including the investment strategies and processes employed;
• Information concerning the allocation of brokerage and the benefits received by each adviser as a result of brokerage allocation, including information concerning the acquisition of research through "soft dollar" benefits received in connection with the funds' brokerage, and the implementation of a soft dollar reimbursement program established with respect to the funds;
• Data relating to portfolio turnover rates of each fund;
• The procedures and processes used to determine the fair value of fund assets and actions taken to monitor and test the effectiveness of such procedures and processes;
Information about each Adviser
• Reports detailing the financial results and condition of each adviser;
• Descriptions of the qualifications, education and experience of the individual investment professionals whose responsibilities include portfolio management and investment research for the funds, and information relating to their compensation and responsibilities with respect to managing other mutual funds and investment accounts;
• Copies of the Codes of Ethics of each adviser and its affiliates, together with information relating to compliance with and the administration of such codes;
• Copies of or descriptions of each adviser's proxy voting policies and procedures;
• Information concerning the resources devoted to compliance efforts undertaken by each adviser and its affiliates on behalf of the funds (including descriptions of various compliance programs) and their record of compliance with investment policies and restrictions, including policies with respect to market-timing, late trading and selective portfolio disclosure, and with policies on personal securities transactions;
• Descriptions of the business continuity and disaster recovery plans of each adviser and its affiliates;
Other Relevant Information
• Information concerning the nature, cost and character of the administrative and other non-investment management services provided by Eaton Vance Management and its affiliates;
• Information concerning management of the relationship with the custodian, subcustodians and fund accountants by each adviser or the funds' administrator; and
• The terms of each advisory agreement.
26
Eaton Vance Tax-Managed Small-Cap Value Fund
BOARD OF TRUSTEES' ANNUAL APPROVAL OF THE INVESTMENT ADVISORY AGREEMENTS CONT'D
In addition to the information identified above, the Special Committee considered information provided from time to time by each adviser throughout the year at meetings of the Board and its committees. Over the course of the twelve-month period ended April 30, 2007, the Board met ten times and the Special Committee, the Audit Committee and the Governance Committee, each of which is a Committee comprised solely of Independent Trustees, met twelve, fourteen and eight times, respectively. At such meetings, the Trustees received, among other things, presentations by the portfolio managers and other investment professionals of each adviser relating to the investment performance of each fund and the investment strategies used in pursuing the fund's investment objective.
For funds that invest through one or more underlying portfolios, the Board considered similar information about the portfolio(s) when considering the approval of advisory agreements. In addition, in cases where the fund's investment adviser has engaged a sub-adviser, the Board considered similar information about the sub-adviser when considering the approval of any sub-advisory agreement.
The Special Committee was assisted throughout the contract review process by Goodwin Procter LLP, legal counsel for the Independent Trustees. The members of the Special Committee relied upon the advice of such counsel and their own business judgment in determining the material factors to be considered in evaluating each advisory and sub-advisory agreement and the weight to be given to each such factor. The conclusions reached with respect to each advisory and sub-advisory agreement were based on a comprehensive evaluation of all the information provided and not any single factor. Moreover, each member of the Special Committee may have placed varying emphasis on particular factors in reaching conclusions with respect to each advisory and sub-advisory agreement.
Results of the Process
Based on its consideration of the foregoing, and such other information as it deemed relevant, including the factors and conclusions described below, the Special Committee concluded that the continuance of the investment advisory agreement of the Tax-Managed Small-Cap Value Portfolio (the "Portfolio"), the portfolio in which the Eaton Vance Tax-Managed Small-Cap Value Fund (the "Fund") invests, with Boston Management and Research (the "Adviser"), and the sub-advisory agreement with Fox Asset Management LLC (the "Sub-adviser"), including their fee structures, is in the interests of shareholders and, therefore, the Special Committee recommended to the Board approval of the respective agreements. The Board accepted the recommendation of the Special Committee as well as the factors considered and conclusions reached by the Special Committee with respect to the agreements. Accordingly, the Board, including a majority of the Independe nt Trustees, voted to approve continuation of the investment advisory agreement and the sub-advisory agreement for the Portfolio.
Nature, Extent and Quality of Services
In considering whether to approve the investment advisory agreement and sub-advisory agreements of the Portfolio, the Board evaluated the nature, extent and quality of services provided to the Portfolio by the Adviser and the Sub-adviser.
The Board considered the Adviser's and the Sub-adviser's management capabilities and investment process with respect to the types of investments held by the Portfolio, including the education, experience and number of its investment professionals and other personnel who provide portfolio management, investment research, and similar services to the Portfolio and whose responsibilities include supervising the Sub-adviser. The Board specifically noted the Adviser's in-house equity research capabilities. The Board also took into account the resources dedicated to portfolio management and other services, including the compensation paid to recruit and retain investment personnel, and the time and attention devoted to the Portfolio by senior management. With respect to the Sub-adviser, the Board took into account the resources available to the Sub-adviser in fulfilling its duties under the sub-advisory agreement and the Sub-adviser's e xperience in managing equity portfolios, as well as recent changes in personnel. The Board reviewed the compliance programs of the Adviser and relevant affiliates thereof, including the Sub-adviser. Among other matters, the Board considered compliance and reporting matters relating to personal trading by investment personnel, selective disclosure of portfolio holdings, late trading, frequent trading, portfolio valuation, business continuity and the allocation of investment opportunities. The Board also evaluated the responses of the Adviser and its affiliates to requests from regulatory authorities such as the Securities and Exchange Commission and the National Association of Securities Dealers.
The Board considered shareholder and other administrative services provided or managed by Eaton Vance Management and its affiliates, including transfer agency and accounting services. The Board evaluated the benefits to shareholders of investing in a fund that is a part of a large family of funds, including the ability, in many cases, to exchange an investment among different funds without incurring additional sales charges.
After consideration of the foregoing factors, among others, the Board concluded that the nature, extent and quality of services provided by the Adviser and Sub-adviser, taken as a whole, are appropriate and consistent with the terms of the investment advisory agreement and sub-advisory agreement, respectively.
27
Eaton Vance Tax-Managed Small-Cap Value Fund
BOARD OF TRUSTEES' ANNUAL APPROVAL OF THE INVESTMENT ADVISORY AGREEMENTS CONT'D
Fund Performance
The Board compared the Fund's investment performance to a relevant universe of similarly managed funds identified by an independent data provider and appropriate benchmark indices. The Board reviewed comparative performance data for the one- and three-year periods ended September 30, 2006 for the Fund. The Board noted that action continued to be taken to improve the performance of the Fund and concluded that it was appropriate to allow reasonable time to evaluate the effectiveness of this action.
Management Fees and Expenses
The Board reviewed contractual investment advisory fee rates, including any administrative fee rates, payable by the Portfolio and the Fund (referred to collectively as "management fees"). As part of its review, the Board considered the management fees, including administrative fees, and the Fund's total expense ratio for the year ended September 30, 2006, as compared to a group of similarly managed funds selected by an independent data provider. The Board considered the fact that the Adviser had waived fees and/or paid expenses for the Fund and had agreed to increase the amount of such waiver or expense payment to reduce further the Fund's expense ratios.
After reviewing the foregoing information, and in light of the nature, extent and quality of the services provided by the Adviser, the Board concluded that the management fees charged for advisory and related services and the Fund's total expense ratio are reasonable.
Profitability
The Board reviewed the level of profits realized by the Adviser and relevant affiliates thereof, including the Sub-adviser, in providing investment advisory and administrative services to the Portfolio, the Fund and all Eaton Vance Funds as a group. The Board considered the level of profits realized without regard to revenue sharing or other payments by the Adviser and its affiliates to third parties in respect of distribution services. The Board also considered other direct or indirect benefits received by the Adviser and its affiliates, including the Sub-adviser, in connection with its relationship with the Portfolio and the Fund, including the benefits of research services that may be available to the Adviser as a result of securities transactions effected for the Portfolio and other advisory clients.
The Board concluded that, in light of the foregoing factors and the nature, extent and quality of the services rendered, the profits realized by the Adviser and its affiliates, including the Sub-adviser, are reasonable.
Economies of Scale
In reviewing management fees and profitability, the Board also considered the extent to which the Adviser and its affiliates, including the Sub-adviser, on the one hand, and the Fund, on the other hand, can expect to realize benefits from economies of scale as the assets of the Fund and the Portfolio increase. The Board acknowledged the difficulty in accurately measuring the benefits resulting from the economies of scale with respect to the management of any specific fund or group of funds. The Board reviewed data summarizing the increases and decreases in the assets of the Fund and of all Eaton Vance Funds as a group over various time periods, and evaluated the extent to which the total expense ratio of the Fund and the profitability of the Adviser and its affiliates may have been affected by such increases or decreases. Based upon the foregoing, the Board concluded that the benefits from economies of scale are currently being shared equitably by the Adviser and its affiliates, including the Sub-adviser, and the Fund. The Board also concluded that, assuming reasonably foreseeable increases in the assets of the Portfolio, the structure of the Portfolio advisory fee, which includes breakpoints at several asset levels, can be expected to cause the Adviser and its affiliates, including the Sub-adviser, and the Fund and the Portfolio to continue to share such benefits equitably.
28
Eaton Vance Tax-Managed Small-Cap Value Fund
MANAGEMENT AND ORGANIZATION
Fund Management. The Trustees of Eaton Vance Mutual Funds Trust (the Trust) and Tax-Managed Small-Cap Value Portfolio (the Portfolio) are responsible for the overall management and supervision of the Trust's and Portfolio's affairs. The Trustees and officers of the Trust and the Portfolio are listed below. Except as indicated, each individual has held the office shown or other offices in the same company for the last five years. Trustees and officers of the Trust and the Portfolio hold indefinite terms of office. The "noninterested Trustees" consist of those Trustees who are not "interested persons" of the Trust and the Portfolio, as that term is defined under the 1940 Act. The business address of each Trustee and officer is The Eaton Vance Building, 255 State Street, Boston, Massachusetts 02109. As used below, "EVC" refers to Eaton Vance Corp., "EV" refers to Eaton Vance, Inc., "EVM" refers to Eaton Vance Management, "BMR" refers to Boston Management and Research, "EVD" refers to Eaton Vance Distributors, Inc. "Parametric" refers to Parametric Portfolio Associates and "Fox" refers to Fox Asset Management LLC. EVC and EV are the corporate parent and trustee, respectively, of EVM and BMR. EVD is the Fund's principal underwriter, the Portfolio's placement agent and a wholly-owned subsidiary of EVM. Each officer affiliated with Eaton Vance may hold a position with other Eaton Vance affiliates that is comparable to his or her position with EVM listed below.
Name and
Date of Birth | | Position(s)
with the
Trust and
the Portfolio | | Term of
Office and
Length of
Service | | Principal Occupation(s)
During Past Five Years | | Number of Portfolios
in Fund Complex
Overseen By
Trustee(1) | | Other Directorships Held | |
| Interested Trustee | | | | | | | | | | | | | |
|
Thomas E. Faust Jr.
5/31/58 | | Trustee and President of the Trust and Vice President of the Portfolio | | Trustee since 2007, President of the Trust since 2002 and Vice President of the Portfolio since 2001 | | Chairman, Chief Executive Officer and President of EVC, President of EV, Chief Executive Officer and President of EVM and BMR, and Director of EVD. Trustee and/or officer of 176 registered investment companies and 5 private investment companies in the Eaton Vance Fund Complex. Mr. Faust is an interested person because of his positions with EVM, BMR, EVC and EV, which are affiliates of the Trust and the Portfolios. | | | 176 | | | Director of EVC | |
|
| Noninterested Trustee(s) | | | | | | | | | | | | | |
|
Benjamin C. Esty
1/2/63 | | Trustee | | Since 2005 | | Roy and Elizabeth Simmons Professor of Business Administration, Harvard University Graduate School of Business Administration (since 2003). Formerly, Associate Professor, Harvard University Graduate School of Business Administration (2000-2003). | | | 176 | | | None | |
|
Allen R. Freedman
4/3/40 | | Trustee | | Since 2007 | | Former Chairman and Chief Executive Officer of Assurant, Inc. (insurance provider) (1978-2000). Formerly, a Director of Loring Ward International (fund distributor) (2005-2007). | | | 175 | | | Director of Assurant, Inc. and Stonemor Partners L.P. (owner and operator of cemeteries) | |
|
William H. Park
9/19/47 | | Trustee | | Since 2003 | | Vice Chairman, Commercial Industrial Finance Corp. (specialty finance company) (since 2006). Formerly, President and Chief Executive Officer, Prizm Capital Management, LLC (investment management firm) (2002-2005). | | | 176 | | | None | |
|
Ronald A. Pearlman
7/10/40 | | Trustee | | Since 2003 | | Professor of Law, Georgetown University Law Center. | | | 176 | | | None | |
|
Norton H. Reamer
9/21/35 | | Trustee | | Trustee of the Trust since 1986 and of the Portfolio since 2001 | | President, Chief Executive Officer and a Director of Asset Management Finance Corp. (a specialty finance company serving the investment management industry) (since October 2003). President, Unicorn Corporation (an investment and financial advisory services company) (since September 2000). Formerly, Chairman and Chief Operating Officer, Hellman, Jordan Management Co., Inc. (an investment management company) (2000-2003). Formerly, Advisory Director of Berkshire Capital Corporation (investment banking firm) (2002-2003). | | | 176 | | | None | |
|
29
Eaton Vance Tax-Managed Small-Cap Value Fund
MANAGEMENT AND ORGANIZATION CONT'D
Name and
Date of Birth | | Position(s)
with the
Trust and
the Portfolio | | Term of
Office and
Length of
Service | | Principal Occupation(s)
During Past Five Years | | Number of Portfolios
in Fund Complex
Overseen By
Trustee(1) | | Other Directorships Held | |
| Noninterested Trustee(s) (continued) | | | | | | | | | | | | | |
|
Heidi L. Steiger
7/8/53 | | Trustee | | Since 2007 | | President, Lowenhaupt Global Advisors, LLC (global wealth management firm) (since 2005); Formerly, President and Contributing Editor, Worth Magazine (2004); Formerly, Executive Vice President and Global Head of Private Asset Management (and various other positions), Neuberger Berman (investment firm) (1986-2004). | | | 173 | | | Director of Nuclear Electric Insurance Ltd. (nuclear insurance provider) and Aviva USA (insurance provider) | |
|
Lynn A. Stout
9/14/57 | | Trustee | | Trustee of the Trust since 1998 and of the Portfolio since 2001 | | Paul Hastings Professor of Corporate and Securities Law, University of California at Los Angeles School of Law. | | | 176 | | | None | |
|
Ralph F. Verni
1/26/43 | | Chairman of the Board and Trustee | | Chairman of the Board since 2007 and Trustee since 2005 | | Consultant and private investor. | | | 176 | | | None | |
|
| Principal Officers who are not Trustees | | | | | | | | | | | | | |
|
Name and
Date of Birth | | Position(s)
with the
Trust and
the Portfolio | | Term of
Office and
Length of
Service | | Principal Occupation(s)
During Past Five Years | |
| William H. Ahern, Jr. 7/28/59 | | Vice President of
the Trust | | Since 1995 | | Vice President of EVM and BMR. Officer of 74 registered investment companies managed by EVM or BMR. | |
|
| Cynthia J. Clemson 3/2/63 | | Vice President of
the Trust | | Since 2004 | | Vice President of EVM and BMR. Officer of 89 registered investment companies managed by EVM or BMR. | |
|
| Charles B. Gaffney 12/4/72 | | Vice President of
the Trust | | Since 2007 | | Vice President of EVM and BMR. Previously, Sector Portfolio Manager and Senior Equity Analyst of Brown Brothers Harriman (1997-2003). Officer of 29 registered investment companies managed by EVM or BMR. | |
|
| Gregory R. Greene 11/13/66 | | Vice President of
the Portfolio | | Since 2006 | | Managing Director of Fox. Officer of 16 registered investment companies managed by EVM or BMR. | |
|
| Christine M. Johnston 11/9/72 | | Vice President of
the Trust | | Since 2007 | | Vice President of EVM and BMR. Officer of 34 registered investment companies managed by EVM or BMR. | |
|
| Aamer Khan 6/7/60 | | Vice President of
the Trust | | Since 2005 | | Vice President of EVM and BMR. Officer of 32 registered investment companies managed by EVM or BMR. | |
|
| Thomas H. Luster 4/8/62 | | Vice President of
the Trust | | Since 2006 | | Vice President of EVM and BMR. Officer of 48 registered investment companies managed by EVM or BMR. | |
|
| Michael R. Mach 7/15/47 | | Vice President of
the Trust | | Since 1999 | | Vice President of EVM and BMR. Officer of 54 registered investment companies managed by EVM or BMR. | |
|
| Robert B. MacIntosh 1/22/57 | | Vice President of
the Trust | | Since 1998 | | Vice President of EVM and BMR. Officer of 89 registered investment companies managed by EVM or BMR. | |
|
| Robert J. Milmore 4/3/69 | | Vice President of
the Portfolio | | Since 2006 | | Assistant Vice President of Fox. Previously, Manager of International Treasury of Cendant Corporation (2001-2005). Officer of 16 registered investment companies managed by EVM or BMR. | |
|
| J. Bradley Ohlmuller 6/14/68 | | Vice President of
the Portfolio | | Since 2006 | | Principal of Fox and member of the Investment Committee since 2004. Previously, Vice President and research analyst at Goldman Sachs & Co. (2001-2004). | |
|
30
Eaton Vance Tax-Managed Small-Cap Value Fund
MANAGEMENT AND ORGANIZATION CONT'D
Name and
Date of Birth | | Position(s)
with the
Trust and
the Portfolio | | Term of
Office and
Length of
Service | | Principal Occupation(s)
During Past Five Years | |
| Principal Officers who are not Trustees (continued) | | | | | | | |
|
| Duncan W. Richardson 10/26/57 | | Vice President of the Trust and President of the Portfolio | | Vice President of the Trust since 2001 and President of the Portfolio since 2007 | | Executive Vice President and Chief Equity Investment Officer of EVC, EVM and BMR. Officer of 80 registered investment companies managed by EVM or BMR. | |
|
| Walter A. Row, III 7/20/57 | | Vice President of
the Trust | | Since 2001 | | Director of Equity Research and a Vice President of EVM and BMR. Officer of 38 registered investment companies managed by EVM or BMR. | |
|
| Judith A. Saryan 8/21/54 | | Vice President of
the Trust | | Since 2003 | | Vice President of EVM and BMR. Officer of 53 registered investment companies managed by EVM or BMR. | |
|
| Susan Schiff 3/13/61 | | Vice President of
the Trust | | Since 2002 | | Vice President of EVM and BMR. Officer of 35 registered investment companies managed by EVM or BMR. | |
|
| Thomas Seto 9/27/62 | | Vice President of
the Trust | | Since 2007 | | Vice President and Director of Portfolio Management of Parametric. Officer of 30 registered investment companies managed by EVM or BMR. | |
|
| David M. Stein 5/4/51 | | Vice President of
the Trust | | Since 2007 | | Managing Director and Chief Investment Officer of Parametric. Officer of 30 registered investment companies managed by EVM or BMR. | |
|
| Mark S. Venezia 5/23/49 | | Vice President of
the Trust | | Since 2007 | | Vice President of EVM and BMR. Officer of 35 registered investment companies managed by EVM or BMR. | |
|
| Adam A. Weigold 3/22/75 | | Vice President of
the Trust | | Since 2007 | | Vice President of EVM and BMR. Officer of 70 registered investment companies managed by EVM or BMR. | |
|
| Barbara E. Campbell 6/19/57 | | Treasurer of the Trust | | Since 2005 | | Vice President of EVM and BMR. Officer of 176 registered investment companies managed by EVM or BMR. | |
|
| Maureen A. Gemma 5/24/60 | | Secretary | | Since 2007 | | Deputy Chief Legal Officer and Vice President of EVM and BMR. Officer of 176 registered investment companies managed by EVM or BMR. | |
|
| Michelle A. Green 8/25/69 | | Treasurer of the Portfolio | | Since 2002 | | Vice President of EVM and BMR. Officer of 68 registered investment companies managed by EVM or BMR. | |
|
| Paul M. O'Neil 7/11/53 | | Chief Compliance Officer | | Since 2004 | | Vice President of EVM and BMR. Officer of 176 registered investment companies managed by EVM or BMR. | |
|
(1) Includes both master and feeder funds in a master-feeder structure.
The SAI for the Fund includes additional information about the Trustees and officers of the Fund and the Portfolio and can be obtained without charge by calling 1-800-225-6265.
31
This Page Intentionally Left Blank
Investment Adviser of Tax-Managed Small-Cap Value Portfolio
Boston Management and Research
The Eaton Vance Building
255 State Street
Boston, MA 02109
Sub-Adviser of Tax-Managed Small-Cap Value Portfolio
Fox Asset Management LLC
331 Newman Springs Road, Suite 122
Red Bank, NJ 07701
Administrator of Eaton Vance Tax-Managed Small-Cap Value Fund
Eaton Vance Management
The Eaton Vance Building
255 State Street
Boston, MA 02109
Principal Underwriter
Eaton Vance Distributors, Inc.
The Eaton Vance Building
255 State Street
Boston, MA 02109
(617) 482-8260
Custodian
State Street Bank and Trust Company
200 Clarendon Street
Boston, MA 02116
Transfer Agent
PFPC Inc.
Attn: Eaton Vance Funds
P.O. Box 9653
Providence, RI 02940-9653
(800) 262-1122
Independent Registered Public Accounting Firm
Deloitte & Touche LLP
200 Berkeley Street
Boston, MA 02116-5022
Eaton Vance Tax-Managed Small-Cap Value Fund
The Eaton Vance Building
255 State Street
Boston, MA 02109
This report must be preceded or accompanied by a current prospectus. Before investing, investors should consider carefully the Fund's investment objective(s), risks, and charges and expenses. The Fund's current prospectus contains this and other information about the Fund and is available through your financial advisor. Please read the prospectus carefully before you invest or send money. For further information please call 1-800-225-6265.
1300-12/07 TMSCVSRC

Annual Report October 31, 2007


EATON VANCE
TAX-MANAGED
VALUE
FUND
IMPORTANT NOTICES REGARDING PRIVACY,
DELIVERY OF SHAREHOLDER DOCUMENTS,
PORTFOLIO HOLDINGS AND PROXY VOTING
Privacy. The Eaton Vance organization is committed to ensuring your financial privacy. Each of the financial institutions identified below has in effect the following policy ("Privacy Policy") with respect to nonpublic personal information about its customers:
• Only such information received from you, through application forms or otherwise, and information about your Eaton Vance fund transactions will be collected. This may include information such as name, address, social security number, tax status, account balances and transactions.
• None of such information about you (or former customers) will be disclosed to anyone, except as permitted by law (which includes disclosure to employees necessary to service your account). In the normal course of servicing a customer's account, Eaton Vance may share information with unaffiliated third parties that perform various required services such as transfer agents, custodians and broker/dealers.
• Policies and procedures (including physical, electronic and procedural safeguards) are in place that are designed to protect the confidentiality of such information.
• We reserve the right to change our Privacy Policy at any time upon proper notification to you. Customers may want to review our Policy periodically for changes by accessing the link on our homepage: www.eatonvance.com.
Our pledge of privacy applies to the following entities within the Eaton Vance organization: the Eaton Vance Family of Funds, Eaton Vance Management, Eaton Vance Investment Counsel, Boston Management and Research, and Eaton Vance Distributors, Inc.
In addition, our Privacy Policy only applies to those Eaton Vance customers who are individuals and who have a direct relationship with us. If a customer's account (i.e., fund shares) is held in the name of a third-party financial adviser/broker-dealer, it is likely that only such adviser's privacy policies apply to the customer. This notice supersedes all previously issued privacy disclosures.
For more information about Eaton Vance's Privacy Policy, please call 1-800-262-1122.
Delivery of Shareholder Documents. The Securities and Exchange Commission (the "SEC") permits funds to deliver only one copy of shareholder documents, including prospectuses, proxy statements and shareholder reports, to fund investors with multiple accounts at the same residential or post office box address. This practice is often called "householding" and it helps eliminate duplicate mailings to shareholders.
Eaton Vance, or your financial adviser, may household the mailing of your documents indefinitely unless you instruct Eaton Vance, or your financial adviser, otherwise.
If you would prefer that your Eaton Vance documents not be householded, please contact Eaton Vance at 1-800-262-1122, or contact your financial adviser.
Your instructions that householding not apply to delivery of your Eaton Vance documents will be effective within 30 days of receipt by Eaton Vance or your financial adviser.
Portfolio Holdings. Each Eaton Vance Fund and its underlying Portfolio (if applicable) will file a schedule of its portfolio holdings on Form N-Q with the SEC for the first and third quarters of each fiscal year. The Form N-Q will be available on the Eaton Vance website www.eatonvance.com, by calling Eaton Vance at 1-800-262-1122 or in the EDGAR database on the SEC's website at www.sec.gov. Form N-Q may also be reviewed and copied at the SEC's public reference room in Washington, D.C. (call 1-800-732-0330 for information on the operation of the public reference room).
Proxy Voting. From time to time, funds are required to vote proxies related to the securities held by the funds. The Eaton Vance Funds or their underlying Portfolios (if applicable) vote proxies according to a set of policies and procedures approved by the Funds' and Portfolios' Boards. You may obtain a description of these policies and procedures and information on how the Funds or Portfolios voted proxies relating to portfolio securities during the most recent 12 month period ended June 30, without charge, upon request, by calling 1-800-262-1122. This description is also available on the SEC's website at www.sec.gov.
Eaton Vance Tax-Managed Value Fund as of October 31, 2007
MANAGEMENT’S DISCUSSION OF FUND PERFORMANCE

Michael R. Mach, CFA
Portfolio Manager
The Fund
Performance for the Past Year
· For the year ended October 31, 2007, the Fund’s Class A shares had a total return of 16.93%. This return was the result of an increase in net asset value (NAV) per share to $21.75 on October 31, 2007, from $18.77 on October 31, 2006, and the reinvestment of $0.177 per share in dividend income.(1)
· The Fund’s Class B shares had a total return of 16.07% for the same period, the result of an increase in NAV per share to $20.42 from $17.63, and the reinvestment of $0.039 per share in dividend income.(1)
· The Fund’s Class C shares had a total return of 16.10% for the same period, the result of an increase in NAV per share to $20.96 from $18.10, and the reinvestment of $0.049 per share in dividend income.(1)
· For comparison, the Fund’s primary benchmark, the Russell 1000 Value Index – a broad-based, unmanaged index of value stocks (the “Value Index”) – had a total return of 10.83% during the period. The S&P 500 Index, a broad-based unmanaged market index of common stocks, had a total return of 14.55% for the period. The Fund’s peer group, the Lipper Large-Cap Value Funds Classification, had an average total return of 12.21% for the same period.(2)
See pages 3 and 4 for more performance information, including after-tax returns.
Management Discussion
· For the year ended October 31, 2007, the Fund posted strong returns, outperforming both its primary benchmark index and its Lipper peer group.(2) The Fund currently invests its assets in a separate registered investment company, Tax-Managed Value Portfolio (the “Portfolio”), with the same objective and policies as the Fund.
· Major equity market indices posted strong returns for the 12-month period ended October 31, 2007, despite an increase in volatility to its highest level in nearly four years. Corporate earnings growth proved better-than-expected, and merger and buyout activity continued at a robust clip, fueling the equity markets. Later in the summer, however, a sub-prime mortgage crisis, coupled with rising food and commodity prices, led to investor fears of both a slowing economy and rising inflation. The Federal Reserve addressed the issues by lowering interest rates, which provided a boost to the equity markets. On average during the course of the fiscal year ended October 31, 2007, large-capitalization stocks generally outperformed small- and mid-cap stocks and growth-style investments remained ahead of their value counterparts.
· The Fund saw positive returns for the year ended October 31, 2007, in nine of the 10 economic sectors represented. Strong relative returns for the fiscal year were primarily due to the performance of individual stocks in the Portfolio. The sectors contributing the most to the relative outperformance versus the Value Index were financials (where an underweighting in this underperforming sector further added to returns) and information technology.Stock selection in materials, energy, and consumer staples was also additive to performance. Health care was the only sector in which the Fund recorded negative relative returns for the year, although the Portfolio’s holdings had positive absolute returns.(3)
· In these discussions, we believe that, along with more recent results, it is important to review longer-term performance. As of October 31, 2007, Eaton Vance Tax-Managed Value Fund, Class A, was ranked #56 out of 504 funds in the Lipper Large-Cap Value Funds Classification; for three years, #34 out of 427 funds; and for five years, #80 out of 356 funds. Rankings are based on percentage change in net asset value with all distributions reinvested and do not take sales charges into consideration. Past performance is no guarantee of future results. Source: Lipper, Inc.
(1) | These returns do not include the 5.75% maximum sales charge for Class A shares or the applicable contingent deferred sales charge (CDSC) for Class B and Class C shares. If sales charges were deducted, the returns would be lower. |
(2) | It is not possible to invest directly in an Index or a Lipper Classification. The Index’s total return does not reflect commissions or expenses that would have been incurred if an investor individually purchased or sold the securities represented in the Index. The Lipper total return is the average total return, at net asset value, of the funds that are in the same Lipper Classification as the Fund. |
(3) | Sector Weightings are subject to change due to active management. |
Past performance is no guarantee of future results. Returns are historical and are calculated by determining the percentage change in net asset value or offering price (as applicable) with all distributions reinvested. Investment return and principal value will fluctuate so that shares, when redeemed, may be worth more or less than their original cost. Performance is for stated time period only; due to market volatility, the Fund’s current performance may be lower or higher than the quoted return. For performance as of the most recent month end, please refer to www.eatonvance.com.
Fund shares are not insured by the FDIC and are not deposits or other obligations of, or guaranteed by, any depository institution. Shares are subject to investment risks, including possible loss of principal invested.
1
· In addition, it is important to consider the Fund’s taxmanaged strategy of balancing investment and tax considerations. The goal in managing a tax-managed fund is not to avoid taxes, but rather to maximize after-tax returns. Investment decisions are made from the perspective of long-term, tax-paying shareholders interested in the level of Fund pre-tax returns and how tax-efficiently fund returns are achieved. Throughout its history, the Fund has never made a capital gain distribution. Past performance is not a guarantee of future results. The Fund’s after-tax return information can be found on page 4 of this report.
· The Portfolio remains committed to its strategy of investing in companies that are considered to be attractive in their long-term investment prospects, are favorably priced in relation to their fundamental value, and which are likely to grow in value over time on an after-tax basis. The Portfolio’s researchdriven investment process and commitment to a longterm investment perspective are designed to help meet the Portfolio’s objective.
· As always, I wish to thank you, my fellow shareholders, for your continued confidence and participation in the Fund.
Common Stock Investments by Sector*
By net assets
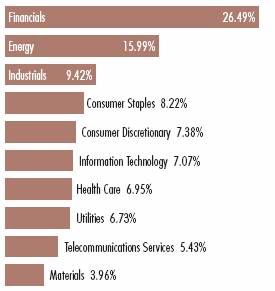
* | As a percentage of the Portfolio’s net assets as of October 31, 2007. Portfolio information may not be representative of the Portfolio’s current or future investments and may change due to active management. |
Top Ten Holdings*
By net assets
Conoco Phillips | | 2.51 | % |
Goldman Sachs, Inc. | | 2.44 | |
Exxon Mobil Corp. | | 2.42 | |
Hewlett-Packard Co. | | 2.38 | |
JP Morgan Chase & Co. | | 2.32 | |
Occidental Petroleum | | 2.27 | |
Exelon Corp. | | 2.18 | |
International Business Machines, Inc. | | 2.10 | |
Wyeth | | 2.08 | |
American International Group, Inc. | | 2.07 | |
** | Top Ten Holdings represented 22.77% of Portfolio net assets as of October 31, 2007. Holdings are subject to change due to active management. |
The views expressed throughout this report are those of the portfolio manager and are current only through the end of the period of the report as stated on the cover. These views are subject to change at any time based upon market or other conditions, and the investment adviser disclaims any responsibility to update such views. These views may not be relied on as investment advice and, because investment decisions for a fund are based on many factors, may not be relied on as an indication of trading intent on behalf of any Eaton Vance fund.
2
Eaton Vance Tax-Managed Value Fund as of October 31, 2007
FUND PERFORMANCE
The line graph and table set forth below provide information about the Fund’s performance. The line graph compares the performance of Class A of the Fund with that of the Russell 1000 Value Index, a broad-based, unmanaged index of value stocks, and the S&P 500 Index, a broad-based, unmanaged market index of common stocks. The lines on the graph represent the total returns of a hypothetical investment of $10,000 in each of Class A, the Russell 1000 Value Index, and the S&P 500 Index. Class A total returns are presented at net asset value and public offering price. The table includes the total returns of each Class of the Fund at net asset value and public offering price. The performance presented below does not reflect the deduction of taxes, if any, that a shareholder would pay on distributions or redemptions of Fund shares.
Performance(1) | | Class A | | Class B | | Class C | |
Symbol | | EATVX | | EBTVX | | ECTVX | |
Average Annual Total Returns (at net asset value) | | | | | | | |
One Year | | 16.93 | % | 16.07 | % | 16.10 | % |
Five Years | | 15.92 | | 15.05 | | 15.06 | |
Life of Fund† | | 10.92 | | 9.73 | | 10.12 | |
SEC Average Annual Total Returns (including sales charge or applicable CDSC) | | | | | | | |
One Year | | 10.18 | | 11.07 | | 15.10 | |
Five Years | | 14.55 | | 14.82 | | 15.06 | |
Life of Fund† | | 10.08 | | 9.73 | | 10.12 | |
†Inception Dates – Class A: 12/27/99; Class B: 1/18/00; Class C: 1/24/00
(1) | Average annual total returns do not include the 5.75% maximum sales charge for Class A shares or the applicable contingent deferred sales charge (CDSC) for Class B and Class C shares. If sales charges were deducted, the returns would be lower SEC average annual total returns for Class A reflect the maximum 5.75% sales charge. SEC returns for Class B shares reflect the applicable CDSC based on the following schedule: 5% - 1st and 2nd years; 4% - 3rd year; 3% - 4th year; 2% - 5th year; 1% - 6th year. SEC returns for Class C reflect a 1% CDSC for the first year. Absent an allocation of certain expenses to the administrator, the returns for certain periods would be lower. |
Total Annual
Operating Expenses(2) | | Class A | | Class B | | Class C | |
Expense Ratio | | 1.18 | % | 1.93 | % | 1.93 | % |
(2) | From the Fund’s prospectus dated 3/1/07. |
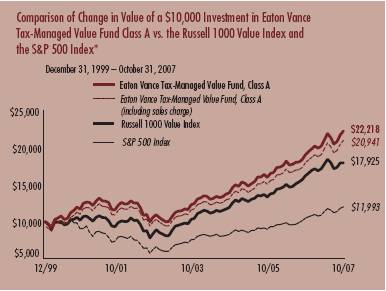
* Source: Thomson Financial. Class A of the Fund commenced investment operations on 12/27/99. A $10,000 hypothetical investment at net asset value in Class B shares on 1/18/00 and Class C shares on 1/24/00 would have been valued at $20,610 and $21,158 respectively, on October 31, 2007. It is not possible to invest directly in an Index. The Indexes’ total returns do not reflect commissions or expenses that would have been incurred if an investor individually purchased or sold the securities represented in an Index.
Past performance is no guarantee of future results. Returns are historical and are calculated by determining the percentage change in net asset value or offering price (as applicable) with all distributions reinvested. Investment return and principal value will fluctuate so that shares, when redeemed, may be worth more or less than their original cost. Performance is for stated time period only; due to market volatility, the Fund’s current performance may be lower or higher than the quoted return. For performance as of the most recent month end, please refer to www.eatonvance.com.
3
“Return Before Taxes” does not take into consideration shareholder taxes. It is most relevant to tax-free or tax-deferred shareholder accounts. “Return After Taxes on Distributions” reflects the impact of federal income taxes due on Fund distributions of dividends and capital gains. It is most relevant to taxpaying shareholders who continue to hold their shares. “Return After Taxes on Distributions and Sale of Fund Shares” also reflects the impact of taxes on capital gain or loss realized upon a sale of shares. It is most relevant to taxpaying shareholders who sell their shares.
Average Annual Total Returns
(For the periods ended October 31, 2007)
Returns at Net Asset Value (NAV) (Class A)
| | One Year | | Five Years | | Life of Fund | |
| | | | | | | |
Return Before Taxes | | 16.93 | % | 15.92 | % | 10.92 | % |
Return After Taxes on Distributions | | 16.77 | | 15.79 | | 10.84 | |
Return After Taxes on Distributions and Sale of Fund Shares | | 11.18 | | 14.01 | | 9.67 | |
Returns at Public Offering Price (POP) (Class A)
| | One Year | | Five Years | | Life of Fund | |
| | | | | | | |
Return Before Taxes | | 10.18 | % | 14.55 | % | 10.08 | % |
Return After Taxes on Distributions | | 10.03 | | 14.42 | | 10.01 | |
Return After Taxes on Distributions and Sale of Fund Shares | | 6.79 | | 12.77 | | 8.90 | |
Average Annual Total Returns
(For the periods ended October 31, 2007)
Returns at Net Asset Value (NAV) (Class C)
| | One Year | | Five Years | | Life of Fund | |
| | | | | | | |
Return Before Taxes | | 16.10 | % | 15.06 | % | 10.12 | % |
Return After Taxes on Distributions | | 16.06 | | 15.02 | | 10.10 | |
Return After Taxes on Distributions and Sale of Fund Shares | | 10.52 | | 13.24 | | 8.95 | |
Returns at Public Offering Price (POP) (Class C)
| | One Year | | Five Years | | Life of Fund | |
Return Before Taxes | | 15.10 | % | 15.06 | % | 10.12 | % |
Return After Taxes on Distributions | | 15.06 | | 15.02 | | 10.10 | |
Return After Taxes on Distributions and Sale of Fund Shares | | 9.87 | | 13.24 | | 8.95 | |
Average Annual Total Returns
(For the periods ended October 31, 2007)
Returns at Net Asset Value (NAV) (Class B)
| | One Year | | Five Years | | Life of Fund | |
| | | | | | | |
Return Before Taxes | | 16.07 | % | 15.05 | % | 9.73 | % |
Return After Taxes on Distributions | | 16.04 | | 15.01 | | 9.71 | |
Return After Taxes on Distributions and Sale of Fund Shares | | 10.49 | | 13.24 | | 8.59 | |
Returns at Public Offering Price (POP) (Class B)
| | One Year | | Five Years | | Life of Fund | |
| | | | | | | |
Return Before Taxes | | 11.07 | % | 14.82 | % | 9.73 | % |
Return After Taxes on Distributions | | 11.04 | | 14.78 | | 9.71 | |
Return After Taxes on Distributions and Sale of Fund Shares | | 7.24 | | 13.03 | | 8.59 | |
Class A, Class B and Class C of the Fund commenced investment operations on 12/27/99, 1/18/00 and 1/24/00, respectively. Returns at Public Offering Price (POP) reflect the deduction of the maximum initial sales charge and applicable CDSC, while Returns at Net Asset Value (NAV) do not. Absent an allocation of certain expenses to the administrator, the returns for certain periods would be lower.
After-tax returns are calculated using certain assumptions. After-tax returns are calculated using the highest historical individual federal income tax rates and do not reflect the impact of state and local taxes. Actual after-tax returns depend on a shareholder’s tax situation and the actual characterization of distributions and may differ from those shown. After-tax returns are not relevant to shareholders who hold shares in tax-deferred accounts or to shares held by non-taxable entities. Return After Taxes on Distributions for a period may be the same as Return Before Taxes for the same period because no taxable distributions were made during that period. Return After Taxes on Distributions and Sale of Fund Shares for a period may be greater than or equal to Return After Taxes on Distributions for the same period because of losses realized on the sale of Fund shares.
Past performance is no guarantee of future results. Returns are historical and are calculated by determining the percentage change in net asset value or offering price (as applicable) with all distributions reinvested. Investment return and principal value will fluctuate so that shares, when redeemed, may be worth more or less than their original cost. Performance is for the stated time period only; due to market volatility, the Fund’s current performance may be lower or higher than the quoted return. For performance as of the most recent month-end, please refer to www.eatonvance.com.
4
Eaton Vance Tax-Managed Value Fund as of October 31, 2007
FUND EXPENSES
Example: As a shareholder of the Fund, you incur two types of costs: (1) transaction costs, including sales charges (loads) on purchases and redemption fees (if applicable); and (2) ongoing costs, including management fees; distribution or service fees; and other Fund expenses. This Example is intended to help you understand your ongoing costs (in dollars) of investing in the Fund and to compare these costs with the ongoing costs of investing in other mutual funds. The Example is based on an investment of $1,000 invested at the beginning of the period and held for the entire period (May 1, 2007 – October 31, 2007).
Actual Expenses: The first section of the table below provides information about actual account values and actual expenses. You may use the information in this section, together with the amount you invested, to estimate the expenses that you paid over the period. Simply divide your account value by $1,000 (for example, an $8,600 account value divided by $1,000 = 8.6), then multiply the result by the number in the first section under the heading entitled "Expenses Paid During Period" to estimate the expenses you paid on your account during this period.
Hypothetical Example for Comparison Purposes: The second section of the table below provides information about hypothetical account values and hypothetical expenses based on the actual Fund expense ratio and an assumed rate of return of 5% per year (before expenses), which is not the actual return of the Fund. The hypothetical account values and expenses may not be used to estimate the actual ending account balance or expenses you paid for the period. You may use this information to compare the ongoing costs of investing in your Fund and other funds. To do so, compare this 5% hypothetical example with the 5% hypothetical examples that appear in the shareholder reports of the other funds.
Please note that the expenses shown in the table are meant to highlight your ongoing costs only and do not reflect any transactional costs, such as sales charges (loads) or redemption fees (if applicable). Therefore, the second section of the table is useful in comparing ongoing costs only, and will not help you determine the relative total costs of owning different funds. In addition, if these transactional costs were included, your costs would have been higher.
Eaton Vance Tax-Managed Value Fund
| | | Beginning Account Value
(5/1/07) | | Ending Account Value
(10/31/07) | | Expenses Paid During Period*
(5/1/07 – 10/31/07) | |
| Actual | |
| Class A | | $ | 1,000.00 | | | $ | 1,056.30 | | | $ | 5.96 | | |
| Class B | | $ | 1,000.00 | | | $ | 1,052.60 | | | $ | 9.83 | | |
| Class C | | $ | 1,000.00 | | | $ | 1,052.70 | | | $ | 9.83 | | |
| Hypothetical | |
| (5% return per year before expenses) | |
| Class A | | $ | 1,000.00 | | | $ | 1,019.40 | | | $ | 5.85 | | |
| Class B | | $ | 1,000.00 | | | $ | 1,015.60 | | | $ | 9.65 | | |
| Class C | | $ | 1,000.00 | | | $ | 1,015.60 | | | $ | 9.65 | | |
* Expenses are equal to the Fund's annualized expense ratio of 1.15% for Class A shares, 1.90% for Class B shares and 1.90% for Class C shares, multiplied by the average account value over the period, multiplied by 184/365 (to reflect the one-half year period). The Example assumes that the $1,000 was invested at the net asset value per share determined at the close of business on April 30, 2007. The Example reflects the expenses of both the Fund and the Portfolio.
5
Eaton Vance Tax-Managed Value Fund as of October 31, 2007
FINANCIAL STATEMENTS
Statement of Assets and Liabilities
As of October 31, 2007
| Assets | |
Investment in Tax-Managed Value Portfolio, at value
(identified cost, $793,647,497) | | $ | 1,334,414,243 | | |
| Receivable for Fund shares sold | | | 2,545,929 | | |
| Total assets | | $ | 1,336,960,172 | | |
| Liabilities | |
| Payable for Fund shares redeemed | | $ | 1,561,751 | | |
| Payable to affiliate for distribution and service fees | | | 655,704 | | |
| Payable to affiliate for administration fees | | | 167,325 | | |
| Payable to affiliate for Trustees' fees | | | 333 | | |
| Accrued expenses | | | 242,879 | | |
| Total liabilities | | $ | 2,627,992 | | |
| Net Assets | | $ | 1,334,332,180 | | |
| Sources of Net Assets | |
| Paid-in capital | | $ | 831,104,057 | | |
Accumulated net realized loss from Portfolio (computed on
the basis of identified cost) | | | (44,349,633 | ) | |
| Undistributed net investment income | | | 6,811,010 | | |
Net unrealized appreciation from Portfolio (computed on the basis of
identified cost) | | | 540,766,746 | | |
| Total | | $ | 1,334,332,180 | | |
| Class A Shares | |
| Net Assets | | $ | 737,940,442 | | |
| Shares Outstanding | | | 33,920,813 | | |
Net Asset Value and Redemption Price Per Share
(net assets ÷ shares of beneficial interest outstanding) | | $ | 21.75 | | |
Maximum Offering Price Per Share
(100 ÷ 94.25 of $21.75) | | $ | 23.08 | | |
| Class B Shares | |
| Net Assets | | $ | 248,127,054 | | |
| Shares Outstanding | | | 12,149,288 | | |
Net Asset Value and Offering Price Per Share*
(net assets ÷ shares of beneficial interest outstanding) | | $ | 20.42 | | |
| Class C Shares | |
| Net Assets | | $ | 348,264,684 | | |
| Shares Outstanding | | | 16,618,397 | | |
Net Asset Value and Offering Price Per Share*
(net assets ÷ shares of beneficial interest outstanding) | | $ | 20.96 | | |
| On sales of $50,000 or more, the offering price of Class A shares is reduced. | |
* Redemption price per share is equal to the net asset value less any applicable contingent deferred sales charge.
Statement of Operations
For the Year Ended
October 31, 2007
| Investment Income | |
| Dividends allocated from Portfolio (net of foreign taxes, $180,884) | | $ | 25,542,524 | | |
| Interest allocated from Portfolio | | | 1,295,653 | | |
| Security lending income allocated from Portfolio, net | | | 169,407 | | |
| Expenses allocated from Portfolio | | | (7,996,312 | ) | |
| Net investment income from Portfolio | | $ | 19,011,272 | | |
| Expenses | |
| Administration fee | | $ | 1,821,593 | | |
| Trustees' fees and expenses | | | 4,015 | | |
Distribution and service fees
Class A | | | 1,589,759 | | |
| Class B | | | 2,512,045 | | |
| Class C | | | 3,272,873 | | |
| Transfer and dividend disbursing agent fees | | | 902,339 | | |
| Printing and postage | | | 125,898 | | |
| Registration fees | | | 64,758 | | |
| Legal and accounting services | | | 60,975 | | |
| Custodian fee | | | 35,034 | | |
| Miscellaneous | | | 14,706 | | |
| Total expenses | | $ | 10,403,995 | | |
| Net investment income | | $ | 8,607,277 | | |
Realized and Unrealized
Gain (Loss) from Portfolio | |
Net realized gain (loss) —
Investment transactions | | $ | 9,566,896 | | |
| Foreign currency transactions | | | (1,621 | ) | |
| Net realized gain | | $ | 9,565,275 | | |
Change in unrealized appreciation (depreciation) —
Investments | | $ | 165,929,921 | | |
| Foreign currency | | | 19,213 | | |
| Net change in unrealized appreciation (depreciation) | | $ | 165,949,134 | | |
| Net realized and unrealized gain | | $ | 175,514,409 | | |
| Net increase in net assets from operations | | $ | 184,121,686 | | |
See notes to financial statements
6
Eaton Vance Tax-Managed Value Fund as of October 31, 2007
FINANCIAL STATEMENTS CONT'D
Statements of Changes in Net Assets
Increase (Decrease)
in Net Assets | | Year Ended
October 31, 2007 | | Year Ended
October 31, 2006 | |
From operations —
Net investment income | | $ | 8,607,277 | | | $ | 7,412,891 | | |
Net realized gain from investment
transactions and foreign currency | | | 9,565,275 | | | | 27,543,380 | | |
Net change in unrealized
appreciation (depreciation)
from investments and foreign currency | | | 165,949,134 | | | | 126,661,128 | | |
| Net increase in net assets from operations | | $ | 184,121,686 | | | $ | 161,617,399 | | |
Distributions to shareholders —
From net investment income
Class A | | $ | (5,102,992 | ) | | $ | (3,358,252 | ) | |
| Class B | | | (548,266 | ) | | | (487,483 | ) | |
| Class C | | | (808,982 | ) | | | (561,668 | ) | |
| Total distributions to shareholders | | $ | (6,460,240 | ) | | $ | (4,407,403 | ) | |
Transactions in shares of beneficial interest —
Proceeds from sale of shares
Class A | | $ | 184,489,045 | | | $ | 144,383,450 | | |
| Class B | | | 6,462,599 | | | | 12,703,645 | | |
| Class C | | | 35,076,780 | | | | 37,379,842 | | |
Net asset value of shares issued to
shareholders in payment of
distributions declared
Class A | | | 4,219,394 | | | | 2,773,537 | | |
| Class B | | | 409,092 | | | | 362,257 | | |
| Class C | | | 566,033 | | | | 390,508 | | |
Cost of shares redeemed
Class A | | | (85,219,600 | ) | | | (63,623,564 | ) | |
| Class B | | | (33,513,124 | ) | | | (33,373,795 | ) | |
| Class C | | | (32,395,726 | ) | | | (31,140,765 | ) | |
Net asset value of shares exchanged
Class A | | | 12,185,797 | | | | 9,424,654 | | |
| Class B | | | (12,185,797 | ) | | | (9,424,654 | ) | |
Net increase in net assets from
Fund share transactions | | $ | 80,094,493 | | | $ | 69,855,115 | | |
| Net increase in net assets | | $ | 257,755,939 | | | $ | 227,065,111 | | |
| Net Assets | |
| At beginning of year | | $ | 1,076,576,241 | | | $ | 849,511,130 | | |
| At end of year | | $ | 1,334,332,180 | | | $ | 1,076,576,241 | | |
Undistributed
net investment income
included in net assets | |
| At end of year | | $ | 6,811,010 | | | $ | 4,876,257 | | |
See notes to financial statements
7
Eaton Vance Tax-Managed Value Fund as of October 31, 2007
FINANCIAL STATEMENTS CONT'D
Financial Highlights
| | | Class A | |
| | | Year Ended October 31, | |
| | | 2007 | | 2006 | | 2005 | | 2004 | | 2003 | |
| Net asset value — Beginning of year | | $ | 18.770 | | | $ | 15.920 | | | $ | 13.950 | | | $ | 12.460 | | | $ | 10.770 | | |
| Income (loss) from operations | |
| Net investment income | | $ | 0.202 | | | $ | 0.189 | | | $ | 0.122 | | | $ | 0.135 | | | $ | 0.101 | | |
| Net realized and unrealized gain | | | 2.955 | | | | 2.805 | | | | 1.984 | | | | 1.471 | | | | 1.594 | | |
| Total income from operations | | $ | 3.157 | | | $ | 2.994 | | | $ | 2.106 | | | $ | 1.606 | | | $ | 1.695 | | |
| Less distributions | |
| From net investment income | | $ | (0.177 | ) | | $ | (0.144 | ) | | $ | (0.136 | ) | | $ | (0.116 | ) | | $ | (0.005 | ) | |
| Total distributions | | $ | (0.177 | ) | | $ | (0.144 | ) | | $ | (0.136 | ) | | $ | (0.116 | ) | | $ | (0.005 | ) | |
| Net asset value — End of year | | $ | 21.750 | | | $ | 18.770 | | | $ | 15.920 | | | $ | 13.950 | | | $ | 12.460 | | |
| Total Return(1) | | | 16.93 | % | | | 18.92 | % | | | 15.17 | % | | | 12.96 | % | | | 15.74 | % | |
| Ratios/Supplemental Data | |
| Net assets, end of year (000's omitted) | | $ | 737,940 | | | $ | 529,073 | | | $ | 363,527 | | | $ | 269,908 | | | $ | 211,918 | | |
| Ratios (As a percentage of average daily net assets): | |
| Expenses before custodian fee reduction(2) | | | 1.16 | % | | | 1.18 | % | | | 1.21 | % | | | 1.22 | % | | | 1.27 | % | |
| Expenses after custodian fee reduction(2) | | | 1.16 | % | | | 1.18 | % | | | 1.21 | % | | | 1.22 | % | | | 1.27 | % | |
| Net investment income | | | 1.06 | % | | | 1.16 | % | | | 0.86 | % | | | 1.03 | % | | | 0.91 | % | |
| Portfolio Turnover of the Portfolio | | | 14 | % | | | 26 | % | | | 40 | % | | | 44 | % | | | 76 | % | |
(1) Returns are historical and are calculated by determining the percentage change in net asset value with all distributions reinvested.
(2) Includes the Fund's share of the Portfolio's allocated expenses.
See notes to financial statements
8
Eaton Vance Tax-Managed Value Fund as of October 31, 2007
FINANCIAL STATEMENTS CONT'D
Financial Highlights
| | | Class B | |
| | | Year Ended October 31, | |
| | | 2007 | | 2006 | | 2005 | | 2004 | | 2003 | |
| Net asset value — Beginning of year | | $ | 17.630 | | | $ | 14.970 | | | $ | 13.130 | | | $ | 11.740 | | | $ | 10.220 | | |
| Income (loss) from operations | |
| Net investment income | | $ | 0.068 | | | $ | 0.073 | | | $ | 0.018 | | | $ | 0.035 | | | $ | 0.017 | | |
| Net realized and unrealized gain | | | 2.761 | | | | 2.618 | | | | 1.862 | | | | 1.384 | | | | 1.503 | | |
| Total income from operations | | $ | 2.829 | | | $ | 2.691 | | | $ | 1.880 | | | $ | 1.419 | | | $ | 1.520 | | |
| Less distributions | |
| From net investment income | | $ | (0.039 | ) | | $ | (0.031 | ) | | $ | (0.040 | ) | | $ | (0.029 | ) | | $ | — | | |
| Total distributions | | $ | (0.039 | ) | | $ | (0.031 | ) | | $ | (0.040 | ) | | $ | (0.029 | ) | | $ | — | | |
| Net asset value — End of year | | $ | 20.420 | | | $ | 17.630 | | | $ | 14.970 | | | $ | 13.130 | | | $ | 11.740 | | |
| Total Return(1) | | | 16.07 | % | | | 18.00 | % | | | 14.34 | % | | | 12.10 | % | | | 14.87 | % | |
| Ratios/Supplemental Data | |
| Net assets, end of year (000's omitted) | | $ | 248,127 | | | $ | 250,030 | | | $ | 239,392 | | | $ | 227,778 | | | $ | 203,665 | | |
| Ratios (As a percentage of average daily net assets): | |
| Expenses before custodian fee reduction(2) | | | 1.91 | % | | | 1.93 | % | | | 1.96 | % | | | 1.97 | % | | | 2.02 | % | |
| Expenses after custodian fee reduction(2) | | | 1.91 | % | | | 1.93 | % | | | 1.96 | % | | | 1.97 | % | | | 2.02 | % | |
| Net investment income | | | 0.33 | % | | | 0.44 | % | | | 0.13 | % | | | 0.29 | % | | | 0.16 | % | |
| Portfolio Turnover of the Portfolio | | | 14 | % | | | 26 | % | | | 40 | % | | | 44 | % | | | 76 | % | |
(1) Returns are historical and are calculated by determining the percentage change in net asset value with all distributions reinvested.
(2) Includes the Fund's share of the Portfolio's allocated expenses.
See notes to financial statements
9
Eaton Vance Tax-Managed Value Fund as of October 31, 2007
FINANCIAL STATEMENTS CONT'D
Financial Highlights
| | | Class C | |
| | | Year Ended October 31, | |
| | | 2007 | | 2006 | | 2005 | | 2004 | | 2003 | |
| Net asset value — Beginning of year | | $ | 18.100 | | | $ | 15.370 | | | $ | 13.470 | | | $ | 12.050 | | | $ | 10.490 | | |
| Income (loss) from operations | |
| Net investment income | | $ | 0.062 | | | $ | 0.071 | | | $ | 0.018 | | | $ | 0.038 | | | $ | 0.018 | | |
| Net realized and unrealized gain | | | 2.847 | | | | 2.694 | | | | 1.915 | | | | 1.412 | | | | 1.542 | | |
| Total income from operations | | $ | 2.909 | | | $ | 2.765 | | | $ | 1.933 | | | $ | 1.450 | | | $ | 1.560 | | |
| Less distributions | |
| From net investment income | | $ | (0.049 | ) | | $ | (0.035 | ) | | $ | (0.033 | ) | | $ | (0.030 | ) | | $ | — | | |
| Total distributions | | $ | (0.049 | ) | | $ | (0.035 | ) | | $ | (0.033 | ) | | $ | (0.030 | ) | | $ | — | | |
| Net asset value — End of year | | $ | 20.960 | | | $ | 18.100 | | | $ | 15.370 | | | $ | 13.470 | | | $ | 12.050 | | |
| Total Return(1) | | | 16.10 | % | | | 18.02 | % | | | 14.37 | % | | | 12.05 | % | | | 14.87 | % | |
| Ratios/Supplemental Data | |
| Net assets, end of year (000's omitted) | | $ | 348,265 | | | $ | 297,473 | | | $ | 246,593 | | | $ | 216,066 | | | $ | 197,385 | | |
| Ratios (As a percentage of average daily net assets): | |
| Expenses before custodian fee reduction(2) | | | 1.91 | % | | | 1.93 | % | | | 1.96 | % | | | 1.97 | % | | | 2.02 | % | |
| Expenses after custodian fee reduction(2) | | | 1.91 | % | | | 1.93 | % | | | 1.96 | % | | | 1.97 | % | | | 2.02 | % | |
| Net investment income | | | 0.32 | % | | | 0.43 | % | | | 0.12 | % | | | 0.29 | % | | | 0.16 | % | |
| Portfolio Turnover of the Portfolio | | | 14 | % | | | 26 | % | | | 40 | % | | | 44 | % | | | 76 | % | |
(1) Returns are historical and are calculated by determining the percentage change in net asset value with all distributions reinvested.
(2) Includes the Fund's share of the Portfolio's allocated expenses.
See notes to financial statements
10
Eaton Vance Tax-Managed Value Fund as of October 31, 2007
NOTES TO FINANCIAL STATEMENTS
1 Significant Accounting Policies
Eaton Vance Tax-Managed Value Fund (the Fund) is a diversified series of Eaton Vance Mutual Funds Trust (the Trust). The Trust is an entity of the type commonly known as a Massachusetts business trust and is registered under the Investment Company Act of 1940, as amended (the 1940 Act), as an open-end management investment company. The Fund offers three classes of shares. Class A shares are generally sold subject to a sales charge imposed at time of purchase. Class B and Class C shares are sold at net asset value and are generally subject to a contingent deferred sales charge (see Note 6). Class B shares held for eight years will automatically convert to Class A shares. Each class represents a pro rata interest in the Fund, but votes separately on class-specific matters and (as noted below) is subject to different expenses. Realized and unrealized gains and losses and net investment income, other than class-specific expenses, ar e allocated daily to each class of shares based on the relative net assets of each class to the total net assets of the Fund. Each class of shares differs in its distribution plan and certain other class-specific expenses. The Fund invests all of its investable assets in interests in the Tax-Managed Value Portfolio (the Portfolio), a New York Trust, having the same investment objective as the Fund. The value of the Fund's investment in the Portfolio reflects the Fund's proportionate interest in the net assets of the Portfolio (87.7% at October 31, 2007). The performance of the Fund is directly affected by the performance of the Portfolio. The financial statements of the Portfolio, including the Portfolio of Investments, are included elsewhere in this report and should be read in conjunction with the Fund's financial statements.
The following is a summary of significant accounting policies of the Fund. The policies are in conformity with accounting principles generally accepted in the United States of America.
A Investment Valuation — Valuation of securities by the Portfolio is discussed in Note 1A of the Portfolio's Notes to Financial Statements, which are included elsewhere in this report.
B Income — The Fund's net investment income or loss consists of the Fund's pro-rata share of the net investment income or loss of the Portfolio, less all actual and accrued expenses of the Fund.
C Federal Taxes — The Fund's policy is to comply with the provisions of the Internal Revenue Code applicable to regulated investment companies and to distribute to shareholders each year substantially all of its net investment income, and all or substantially all of its net realized capital gains. Accordingly, no provision for federal income or excise tax is necessary.
At October 31, 2007, the Fund, for federal income tax purposes, had a capital loss carryforward of $43,295,557, which will reduce the Fund's taxable income arising from future net realized gain on investments, if any, to the extent permitted by the Internal Revenue Code and thus will reduce the amount of distributions to shareholders which would otherwise be necessary to relieve the Fund of any liability for federal income or excise tax. Such capital loss carryover will expire on October 31, 2010. During the year ended October 31, 2007, capital loss carryforwards of $9,690,989 were utilized to offset net realized gains.
D Expenses — The majority of expenses of the Trust are directly identifiable to an individual fund. Expenses which are not readily identifiable to a specific fund are allocated taking into consideration, among other things, the nature and type of expense and the relative size of the funds.
E Other — Investment transactions are accounted for on a trade date basis. Dividends to shareholders are recorded on the ex-dividend date.
F Use of Estimates — The preparation of the financial statements in conformity with accounting principles generally accepted in the United States of America requires management to make estimates and assumptions that affect the reported amounts of assets and liabilities at the date of the financial statements and the reported amounts of income and expense during the reporting period. Actual results could differ from those estimates.
G Indemnifications — Under the Trust's organizational documents, its officers and Trustees may be indemnified against certain liabilities and expenses arising out of the performance of their duties to the Fund, and shareholders are indemnified against personal liability for obligations of the Trust. Additionally, in the normal course of business, the Fund enters into agreements with service providers that may contain indemnification clauses. The Fund's maximum exposure under these arrangements is unknown as this would involve future claims that may be made against the Fund that have not yet occurred.
H Expense Reduction — State Street Bank and Trust Company (SSBT) serves as custodian of the Fund. Pursuant to the custodian agreement, SSBT receives a fee reduced by credits, which are determined based on the average daily
11
Eaton Vance Tax-Managed Value Fund as of October 31, 2007
NOTES TO FINANCIAL STATEMENTS CONT'D
cash balance the Fund maintains with SSBT. All credit balances, if any, used to reduce the Fund's custodian fees are reported as a reduction of expenses in the Statement of Operations.
2 Distributions to Shareholders
It is the present policy of the Fund to make at least one distribution annually of all or substantially all of the net investment income allocated to the Fund by the Portfolio, less the Fund's direct and allocated expenses, and to distribute at least annually all or substantially all of its net realized capital gains allocated to the Fund by the Portfolio (reduced by available capital loss carryforwards from prior years, if any). Distributions are declared separately for each class of shares. Distributions are paid in the form of additional shares of the same class of the Fund or, at the election of the shareholder, in cash. Shareholders may reinvest distributions in additional shares of the same class of the Fund at the net asset value as of the ex-dividend date. The Fund distinguishes between distributions on a tax basis and a financial reporting basis. Accounting principles generally accepted in the United States of America r equire that only distributions in excess of tax basis earnings and profits be reported in the financial statements as a return of capital. Permanent differences between book and tax accounting relating to distributions are reclassified to paid-in capital.
The tax character of distributions paid for the years ended October 31, 2007 and October 31, 2006 was as follows:
| | | Year Ended October 31, | |
| | | 2007 | | 2006 | |
| Distributions declared from: | |
| Ordinary Income | | $ | 6,460,240 | | | $ | 4,407,403 | | |
During the year ended October 31, 2007, the following amounts were reclassified due to differences between book and tax accounting, primarily for foreign currency gain (loss).
| Increase (decrease): | |
| Paid-in capital | | $ | (2,165 | ) | |
| Accumulated net realized gain | | $ | 214,449 | | |
Accumulated undistributed net
investment income | | $ | (212,284 | ) | |
These reclassifications had no effect on the net assets or net asset value per share of the Fund.
As of October 31, 2007, the components of distributable earnings (accumulated losses) and unrealized appreciation (depreciation) on a tax basis were as follows:
| Undistributed income | | $ | 6,445,049 | | |
| Capital loss carryforward | | $ | (43,295,557 | ) | |
| Unrealized appreciation (depreciation) | | $ | 540,078,631 | | |
The differences between components of distributable earnings (accumulated losses) on a tax basis and the amounts reflected in the Statement of Assets and Liabilities are primarily due to wash sales and real estate investment trusts.
3 Shares of Beneficial Interest
The Fund's Declaration of Trust permits the Trustees to issue an unlimited number of full and fractional shares of beneficial interest (without par value). Such shares may be issued in a number of different series (such as the Fund) and classes. Transactions in Fund shares were as follows:
| | | Year Ended October 31, | |
| Class A | | 2007 | | 2006 | |
| Sales | | | 9,106,356 | | | | 8,295,338 | | |
Issued to shareholders electing to receive
payments of distributions in Fund shares | | | 217,382 | | | | 167,282 | | |
| Redemptions | | | (4,194,738 | ) | | | (3,642,704 | ) | |
| Exchange from Class B shares | | | 599,225 | | | | 542,412 | | |
| Net increase | | | 5,728,225 | | | | 5,362,328 | | |
| | | Year Ended October 31, | |
| Class B | | 2007 | | 2006 | |
| Sales | | | 340,581 | | | | 782,720 | | |
Issued to shareholders electing to receive
payments of distributions in Fund shares | | | 22,306 | | | | 23,103 | | |
| Redemptions | | | (1,760,747 | ) | | | (2,038,546 | ) | |
| Exchange to Class A shares | | | (636,294 | ) | | | (575,596 | ) | |
| Net decrease | | | (2,034,154 | ) | | | (1,808,319 | ) | |
| | | Year Ended October 31, | |
| Class C | | 2007 | | 2006 | |
| Sales | | | 1,804,499 | | | | 2,227,927 | | |
Issued to shareholders electing to receive
payments of distributions in Fund shares | | | 30,076 | | | | 24,270 | | |
| Redemptions | | | (1,654,125 | ) | | | (1,857,731 | ) | |
| Net increase | | | 180,450 | | | | 394,466 | | |
12
Eaton Vance Tax-Managed Value Fund as of October 31, 2007
NOTES TO FINANCIAL STATEMENTS CONT'D
4 Transactions with Affiliates
The administrative fee is earned by Eaton Vance Management (EVM) as compensation for managing and administering the business affairs of the Fund. Under the administration agreement, EVM earns a fee in the amount of 0.15% per annum of the average daily net assets of the Fund. For the year ended October 31, 2007, the administration fee amounted to $1,821,593. The Portfolio has engaged Boston Management and Research (BMR), a subsidiary of EVM, to render investment advisory services. See Note 2 of the Portfolio's Notes to Financial Statements which are included elsewhere in this report. EVM serves as the sub-transfer agent of the Fund and receives from the transfer agent an aggregate fee based upon the actual expenses incurred by EVM in the performance of those services. During the year ended October 31, 2007, EVM received $60,391 in sub-transfer agent fees. The Fund was informed that Eaton Vance Distributors, Inc. (EVD), a subsidia ry of EVM and the Fund's principal underwriter, received $158,634 as its portion of the sales charge on sales of Class A shares for the year ended October 31, 2007. EVD also received distribution and service fees from Class A, Class B, and Class C shares (see Note 5) and contingent deferred sales charges (see Note 6).
Except for Trustees of the Fund and Portfolio who are not members of EVM's or BMR's organizations, officers and Trustees receive remuneration for their services to the Fund out of the investment adviser and administrative fees earned by EVM and BMR. Certain officers and Trustees of the Fund and of the Portfolio are officers of the above organizations.
5 Distribution Plans
Class A has in effect a distribution plan pursuant to Rule 12b-1 under the 1940 Act (Class A Plan). The Class A Plan provides that the Fund will pay EVD a distribution and service fee of 0.25% per annum of the Fund's average daily net assets attributable to Class A shares for distribution services and facilities provided to the Fund by EVD, as well as for personal services and/or the maintenance of shareholder accounts. Distribution and service fees paid or accrued for the year ended October 31, 2007 amounted to $1,589,759 for Class A shares. The Fund also has in effect distribution plans for Class B shares (Class B Plan) and Class C shares (Class C Plan) pursuant to Rule 12b-1 under the 1940 Act (collectively, the Plans). The Class B and Class C Plans require the Fund to pay EVD amounts equal to 0.75% per annum of the Fund's average daily net assets attributable to Class B and Class C shares for providing ongoing distribution s ervices and facilities to the Fund. The Fund will automatically discontinue payments to EVD during any period in which there are no outstanding Uncovered Distribution Charges, which are equivalent to the sum of (i) 5% and 6.25% of the aggregate amount received by the Fund for the Class B and Class C shares sold, respectively, plus (ii) interest calculated by applying the rate of 1% over the prevailing prime rate to the outstanding balance of Uncovered Distribution Charges of EVD, of each respective class, reduced by the aggregate amount of contingent deferred sales charges (see Note 6) and amounts theretofore paid to EVD by each respective class. The Fund paid or accrued $1,884,034 and $2,454,655 for Class B and Class C shares, respectively, to or payable to EVD for the year ended October 31, 2007, representing 0.75% of the average daily net assets for Class B and Class C shares. At October 31, 2007, the amount of Uncovered Distribution Charges of EVD calculated under the Plans was approximately $1,372,000 and $22,607,000 for Class B and Class C shares, respectively. The Class B and Class C Plans also authorize the Fund to make payments of service fees to EVD, investment dealers and other persons in amounts not exceeding 0.25% per annum of the Fund's average daily net assets attributable to Class B and Class C shares. Service fees are paid for personal services and/or the maintenance of shareholder accounts. They are separate and distinct from the sales commissions and distribution fees payable by the Fund to EVD and as such, are not subject to automatic discontinuance when there are no outstanding Uncovered Distribution Charges to EVD. Service fees for the year ended October 31, 2007 amounted to $628,011, and $818,218, for Class B and Class C shares, respectively.
6 Contingent Deferred Sales Charge
A contingent deferred sales charge (CDSC) generally is imposed on redemptions of Class B shares made within six years of purchase and on redemptions of Class C shares made within one year of purchase. Class A shares may be subject to a CDSC up to 1% if redeemed within two years of purchase (depending upon the circumstances of purchase). Generally, the CDSC is based upon the lower of the net asset value at date of redemption or date of purchase. No charge is levied on shares acquired by reinvestment of dividends or capital gain distributions. The Class B CDSC is imposed at declining rates that begin at 5% in the case of redemptions in the first and second year after purchase, declining one percentage point each subsequent year. Class C shares are subject to a 1% CDSC if redeemed within one year of purchase. No CDSC is levied on shares which have been sold to EVM or its affiliates or to their respective employees or clients and ma y be waived under certain other limited conditions. CDSC are paid to EVD to reduce the amount of Uncovered Distribution Charges calculated under the Plans (see Note 5). CDSC received when no Uncovered Distribution Charges exist will be credited to the Fund. The Fund was informed that EVD received approximately $100, $163,000 and $18,000 of CDSC paid by shareholders of
13
Eaton Vance Tax-Managed Value Fund as of October 31, 2007
NOTES TO FINANCIAL STATEMENTS CONT'D
Class A, Class B and Class C shares, respectively, for the year ended October 31, 2007.
7 Investment Transactions
Increases and decreases in the Fund's investment in the Portfolio aggregated $225,376,992 and $164,858,308 respectively, for the year ended October 31, 2007.
8 Recently Issued Accounting Pronouncements
In June 2006, the Financial Accounting Standards Board (FASB) issued FASB Interpretation No. 48 (FIN 48), "Accounting for Uncertainty in Income Taxes – an interpretation of FASB Statement No. 109". FIN 48 clarifies the accounting for uncertainty in income taxes recognized in accordance with FASB Statement No. 109, "Accounting for Income Taxes". This interpretation prescribes a recognition threshold and measurement attribute for the financial statement recognition and measurement of a tax position taken or expected to be taken in a tax return. It also provides guidance on de-recognition, classification, interest and penalties, accounting in interim periods, disclosure and transition. FIN 48 is effective on the last business day of the first required financial reporting period for fiscal years beginning after December 15, 2006. Management is currently evaluating the impact of applying the various provisions of FIN 48.
In September 2006, the FASB issued Statement of Financial Accounting Standards No. 157 (FAS 157), "Fair Value Measurements". FAS 157 defines fair value, establishes a framework for measuring fair value in accordance with generally accepted accounting principles and expands disclosure about fair value measurements. FAS 157 is effective for fiscal years beginning after November 15, 2007. Management is currently evaluating the impact the adoption of FAS 157 will have on the Fund's financial statement disclosures.
14
Eaton Vance Tax-Managed Value Fund as of October 31, 2007
REPORT OF INDEPENDENT REGISTERED PUBLIC ACCOUNTING FIRM
To the Trustees of Eaton Vance Mutual Funds Trust and Shareholders
of Eaton Vance Tax-Managed Value Fund:
We have audited the accompanying statement of assets and liabilities of Eaton Vance Tax-Managed Value Fund (the "Fund") (one of the series of Eaton Vance Mutual Funds Trust) as of October 31, 2007, and the related statement of operations for the year then ended, the statements of changes in net assets for each of the two years in the period then ended, and the financial highlights for each of the five years in the period then ended. These financial statements and financial highlights are the responsibility of the Fund's management. Our responsibility is to express an opinion on these financial statements and financial highlights based on our audits.
We conducted our audits in accordance with the standards of the Public Company Accounting Oversight Board (United States). Those standards require that we plan and perform the audit to obtain reasonable assurance about whether the financial statements and financial highlights are free of material misstatement. The Fund is not required to have, nor were we engaged to perform, an audit of its internal control over financial reporting. Our audits included consideration of internal control over financial reporting as a basis for designing audit procedures that are appropriate in the circumstances, but not for the purpose of expressing an opinion on the effectiveness of the Fund's internal control over financial reporting. Accordingly, we express no such opinion. An audit also includes examining, on a test basis, evidence supporting the amounts and disclosures in the financial statements, assessing the accounting principles used and significant estimates made by management, as well as evaluating the overall financial statement presentation. We believe that our audits provide a reasonable basis for our opinion.
In our opinion, the financial statements and financial highlights referred to above present fairly, in all material respects, the financial position of Eaton Vance Tax-Managed Value Fund as of October 31, 2007, the results of its operations for the year then ended, the changes in its net assets for each of the two years in the period then ended, and the financial highlights for each of the five years in the period then ended, in conformity with accounting principles generally accepted in the United States of America.
DELOITTE & TOUCHE LLP
Boston, Massachusetts
December 14, 2007
15
Eaton Vance Tax-Managed Value Fund as of October 31, 2007
FEDERAL TAX INFORMATION (Unaudited)
The Form 1099-DIV you receive in January 2008 will show the tax status of all distributions paid to your account in calendar 2007. Shareholders are advised to consult their own tax adviser with respect to the tax consequences of their investment in the Fund. As required by the Internal Revenue Code regulations, shareholders must be notified within 60 days of the Fund's fiscal year end regarding the status of qualified dividend income for individuals, the dividends received deduction for corporations, and the foreign tax credit.
Qualified Dividend Income. The Fund designates approximately $23,744,556, or up to the maximum amount of such dividends allowable pursuant to the Internal Revenue Code, as qualified dividend income eligible for the reduced tax rate of 15%.
Dividends Received Deduction. Corporate shareholders are generally entitled to take the dividends received deduction on the portion of the Fund's dividend distribution that qualifies under tax law. For the Fund's fiscal 2007 ordinary income dividends, 100% qualifies for the corporate dividends received deduction.
16
Tax-Managed Value Portfolio as of October 31, 2007
PORTFOLIO OF INVESTMENTS
| Common Stocks — 97.6% | |
| Security | | Shares | | Value | |
| Aerospace & Defense — 3.6% | |
| General Dynamics Corp. | | | 250,000 | | | $ | 22,740,000 | | |
| Northrop Grumman Corp. | | | 200,000 | | | | 16,724,000 | | |
| United Technologies Corp. | | | 200,000 | | | | 15,318,000 | | |
| | | $ | 54,782,000 | | |
| Air Freight & Logistics — 0.5% | |
| FedEx Corp. | | | 75,000 | | | $ | 7,750,500 | | |
| | | $ | 7,750,500 | | |
| Auto Components — 0.9% | |
| BorgWarner, Inc. | | | 125,000 | | | $ | 13,213,750 | | |
| | | $ | 13,213,750 | | |
| Beverages — 1.3% | |
| Molson Coors Brewing Co., Class B | | | 350,000 | | | $ | 20,030,500 | | |
| | | $ | 20,030,500 | | |
| Capital Markets — 5.9% | |
| Bank of New York Mellon Corp. | | | 200,000 | | | $ | 9,770,000 | | |
| Franklin Resources, Inc. | | | 75,000 | | | | 9,726,000 | | |
| Goldman Sachs Group, Inc. | | | 150,000 | | | | 37,188,000 | | |
| Lehman Brothers Holdings, Inc. | | | 260,000 | | | | 16,468,400 | | |
| Merrill Lynch & Co., Inc. | | | 250,000 | | | | 16,505,000 | | |
| | | $ | 89,657,400 | | |
| Chemicals — 1.2% | |
| Air Products and Chemicals, Inc. | | | 190,000 | | | $ | 18,591,500 | | |
| | | $ | 18,591,500 | | |
| Commercial Banks — 4.3% | |
| Marshall & Ilsley Corp. | | | 125,000 | | | $ | 5,337,500 | | |
| TCF Financial Corp.(1) | | | 300,000 | | | | 6,831,000 | | |
| U.S. Bancorp | | | 200,000 | | | | 6,632,000 | | |
| Wachovia Corp. | | | 500,000 | | | | 22,865,000 | | |
| Wells Fargo & Co. | | | 700,000 | | | | 23,807,000 | | |
| | | $ | 65,472,500 | | |
| Security | | Shares | | Value | |
| Communications Equipment — 1.6% | |
| Nokia Oyj ADR | | | 625,000 | | | $ | 24,825,000 | | |
| | | $ | 24,825,000 | | |
| Computer Peripherals — 5.1% | |
| Hewlett-Packard Co. | | | 700,000 | | | $ | 36,176,000 | | |
| International Business Machines Corp. | | | 275,000 | | | | 31,933,000 | | |
| NCR Corp.(2) | | | 160,000 | | | | 4,414,400 | | |
| Teradata Corp.(2) | | | 160,000 | | | | 4,564,800 | | |
| | | $ | 77,088,200 | | |
| Diversified Financial Services — 5.8% | |
| Bank of America Corp. | | | 500,000 | | | $ | 24,140,000 | | |
| Citigroup, Inc. | | | 700,000 | | | | 29,330,000 | | |
| JPMorgan Chase & Co. | | | 750,000 | | | | 35,250,000 | | |
| | | $ | 88,720,000 | | |
| Diversified Telecommunication Services — 4.3% | |
| AT&T, Inc. | | | 750,000 | | | $ | 31,342,500 | | |
| Verizon Communications, Inc. | | | 650,000 | | | | 29,945,500 | | |
| Windstream Corp. | | | 258,481 | | | | 3,476,569 | | |
| | | $ | 64,764,569 | | |
| Electric Utilities — 5.2% | |
| Entergy Corp. | | | 200,000 | | | $ | 23,974,000 | | |
| Exelon Corp. | | | 400,000 | | | | 33,112,000 | | |
| FPL Group, Inc. | | | 325,000 | | | | 22,236,500 | | |
| | | $ | 79,322,500 | | |
| Energy Equipment & Services — 2.0% | |
| GlobalSantaFe Corp.(3) | | | 150,000 | | | $ | 12,154,500 | | |
| Transocean, Inc.(2)(3) | | | 150,000 | | | | 17,905,500 | | |
| | | $ | 30,060,000 | | |
| Food & Staples Retailing — 1.8% | |
| Kroger Co. | | | 400,000 | | | $ | 11,756,000 | | |
| Safeway, Inc. | | | 450,000 | | | | 15,300,000 | | |
| | | $ | 27,056,000 | | |
See notes to financial statements
17
Tax-Managed Value Portfolio as of October 31, 2007
PORTFOLIO OF INVESTMENTS CONT'D
| Security | | Shares | | Value | |
| Food Products — 2.4% | |
| Kraft Foods, Inc., Class A | | | 259,509 | | | $ | 8,670,196 | | |
| Nestle SA(3) | | | 60,000 | | | | 27,697,374 | | |
| | | $ | 36,367,570 | | |
| Health Care Providers & Services — 0.8% | |
| Aetna, Inc. | | | 225,000 | | | $ | 12,638,250 | | |
| | | $ | 12,638,250 | | |
| Hotels, Restaurants & Leisure — 1.4% | |
| McDonald's Corp. | | | 350,000 | | | $ | 20,895,000 | | |
| | | $ | 20,895,000 | | |
| Household Products — 0.9% | |
| Kimberly-Clark Corp. | | | 200,000 | | | $ | 14,178,000 | | |
| | | $ | 14,178,000 | | |
| Insurance — 8.0% | |
| Allstate Corp. | | | 100,000 | | | $ | 5,240,000 | | |
| American International Group, Inc. | | | 500,000 | | | | 31,560,000 | | |
| AON Corp. | | | 325,000 | | | | 14,729,000 | | |
| Chubb Corp. | | | 275,000 | | | | 14,671,250 | | |
| Hartford Financial Services Group, Inc. | | | 250,000 | | | | 24,257,500 | | |
| MetLife, Inc. | | | 100,000 | | | | 6,885,000 | | |
| Progressive Corp. | | | 200,000 | | | | 3,700,000 | | |
| Travelers Cos., Inc. | | | 400,000 | | | | 20,884,000 | | |
| | | $ | 121,926,750 | | |
| Machinery — 3.9% | |
| Caterpillar, Inc. | | | 250,000 | | | $ | 18,652,500 | | |
| Deere & Co. | | | 200,000 | | | | 30,980,000 | | |
| Eaton Corp. | | | 100,000 | | | | 9,258,000 | | |
| | | $ | 58,890,500 | | |
| Media — 2.7% | |
| Time Warner Inc. | | | 1,350,000 | | | $ | 24,651,000 | | |
| Walt Disney Co. | | | 450,000 | | | | 15,583,500 | | |
| | | $ | 40,234,500 | | |
| Security | | Shares | | Value | |
| Metals & Mining — 1.7% | |
| Alcoa, Inc. | | | 325,000 | | | $ | 12,866,750 | | |
| Freeport-McMoRan Copper & Gold, Inc., Class B | | | 115,000 | | | | 13,533,200 | | |
| | | $ | 26,399,950 | | |
| Multiline Retail — 1.8% | |
| J.C. Penney Company, Inc. | | | 300,000 | | | $ | 16,872,000 | | |
| Target Corp. | | | 175,000 | | | | 10,738,000 | | |
| | | $ | 27,610,000 | | |
| Multi-Utilities — 1.5% | |
| Dominion Resources Inc. | | | 250,000 | | | $ | 22,907,500 | | |
| | | $ | 22,907,500 | | |
| Oil, Gas & Consumable Fuels — 14.0% | |
| Apache Corp. | | | 200,000 | | | $ | 20,762,000 | | |
| Chevron Corp. | | | 300,000 | | | | 27,453,000 | | |
| ConocoPhillips | | | 450,000 | | | | 38,232,000 | | |
| Exxon Mobil Corp. | | | 400,000 | | | | 36,796,000 | | |
| Hess Corp. | | | 125,000 | | | | 8,951,250 | | |
| Marathon Oil Corp. | | | 200,000 | | | | 11,826,000 | | |
| Occidental Petroleum Corp. | | | 500,000 | | | | 34,525,000 | | |
| Peabody Energy Corp. | | | 300,000 | | | | 16,725,000 | | |
| Valero Energy Corp. | | | 250,000 | | | | 17,607,500 | | |
| | | $ | 212,877,750 | | |
| Paper and Forest Products — 1.0% | |
| Weyerhaeuser Co. | | | 200,000 | | | $ | 15,182,000 | | |
| | | $ | 15,182,000 | | |
| Pharmaceuticals — 6.1% | |
| Abbott Laboratories | | | 250,000 | | | $ | 13,655,000 | | |
| Johnson & Johnson | | | 300,000 | | | | 19,551,000 | | |
| Merck & Co., Inc. | | | 300,000 | | | | 17,478,000 | | |
| Novartis AG ADR | | | 200,000 | | | | 10,634,000 | | |
| Wyeth | | | 650,000 | | | | 31,609,500 | | |
| | | $ | 92,927,500 | | |
| Real Estate Investment Trusts (REITs) — 2.4% | |
| AMB Property Corp. | | | 110,000 | | | $ | 7,188,500 | | |
| AvalonBay Communities, Inc. | | | 100,000 | | | | 12,265,000 | | |
| General Growth Properties, Inc. | | | 100,000 | | | | 5,436,000 | | |
See notes to financial statements
18
Tax-Managed Value Portfolio as of October 31, 2007
PORTFOLIO OF INVESTMENTS CONT'D
| Security | | Shares | | Value | |
| Real Estate Investment Trusts (REITs) (continued) | |
| Host Hotels & Resorts, Inc.(1) | | | 275,000 | | | $ | 6,094,000 | | |
| Public Storage, Inc. | | | 75,000 | | | | 6,072,750 | | |
| | | $ | 37,056,250 | | |
| Road & Rail — 1.4% | |
| Burlington Northern Santa Fe Corp. | | | 250,000 | | | $ | 21,787,500 | | |
| | | $ | 21,787,500 | | |
| Semiconductors & Semiconductor Equipment — 0.4% | |
| Taiwan Semiconductor Manufacturing Co., Ltd. ADR | | | 517,569 | | | $ | 5,512,110 | | |
| | | $ | 5,512,110 | | |
| Specialty Retail — 0.7% | |
| TJX Companies, Inc. | | | 350,000 | | | $ | 10,125,500 | | |
| | | $ | 10,125,500 | | |
| Tobacco — 1.8% | |
| Altria Group, Inc. | | | 375,000 | | | $ | 27,348,750 | | |
| | | $ | 27,348,750 | | |
| Wireless Telecommunication Services — 1.2% | |
| Alltel Corp. | | | 250,000 | | | $ | 17,787,500 | | |
| | | $ | 17,787,500 | | |
Total Common Stocks
(identified cost $882,376,813) | | $ | 1,483,987,299 | | |
| Short-Term Investments — 3.8% | |
| Description | | Shares /
Interest
(000's omitted) | | Value | |
| Eaton Vance Cash Collateral Fund, LLC, 5.28%(4)(5) | | | 11,644 | | | $ | 11,644,249 | | |
| Investment in Cash Management Portfolio, 4.83%(5) | | | 46,743 | | | | 46,743,010 | | |
Total Short-Term Investments
(identified cost $58,387,259) | | $ | 58,387,259 | | |
Total Investments — 101.4%
(identified cost $940,764,072) | | | | $ | 1,542,374,558 | | |
| Other Assets, Less Liabilities — (1.4)% | | | | $ | (21,210,765 | ) | |
| Net Assets — 100.0% | | | | $ | 1,521,163,793 | | |
ADR - American Depository Receipt
(1) All or a portion of these securities were on loan at October 31, 2007.
(2) Non-income producing security.
(3) Foreign security.
(4) The amount invested in Eaton Vance Cash Collateral Fund, LLC represents cash collateral received for securities on loan at October 31, 2007. Other Assets, Less Liabilities includes an equal and offsetting liability of the Portfolio to repay collateral amounts upon the return of loaned securities.
(5) Affiliated investment company available to Eaton Vance portfolios and funds which invests in high quality U.S. dollar denominated money market instruments. The rate shown is the annualized seven-day yield as of October 31, 2007.
See notes to financial statements
19
Tax-Managed Value Portfolio as of October 31, 2007
FINANCIAL STATEMENTS
Statement of Assets and Liabilities
As of October 31, 2007
| Assets | |
Unaffiliated investments, at value including $10,968,032
of securities on loan (identified cost, $882,376,813) | | $ | 1,483,987,299 | | |
| Affiliated investments, at value (identified cost, $58,387,259) | | | 58,387,259 | | |
| Cash | | | 14,954 | | |
| Dividends and interest receivable | | | 1,936,575 | | |
| Interest receivable from affiliated investments | | | 154,817 | | |
| Tax reclaim receivable | | | 364,321 | | |
| Securities lending income receivable | | | 14,986 | | |
| Total assets | | $ | 1,544,860,211 | | |
| Liabilities | |
| Collateral for securities loaned | | $ | 11,644,249 | | |
| Payable for investments purchased | | | 11,073,600 | | |
| Payable to affiliate for investment advisory fees | | | 777,226 | | |
| Payable to affiliate for Trustees' fees | | | 2,502 | | |
| Accrued expenses | | | 198,841 | | |
| Total liabilities | | $ | 23,696,418 | | |
| Net Assets applicable to investors' interest in Portfolio | | $ | 1,521,163,793 | | |
| Sources of Net Assets | |
| Net proceeds from capital contributions and withdrawals | | $ | 919,525,401 | | |
| Net unrealized appreciation (computed on the basis of identified cost) | | | 601,638,392 | | |
| Total | | $ | 1,521,163,793 | | |
Statement of Operations
For the Year Ended
October 31, 2007
| Investment Income | |
| Dividends (net of foreign taxes, $202,511) | | $ | 28,673,077 | | |
| Interest | | | 37,619 | | |
| Interest income allocated from affiliated investments | | | 1,418,183 | | |
| Security lending income, net | | | 190,178 | | |
| Expenses allocated from affliated investments | | | (133,213 | ) | |
| Total investment income | | $ | 30,185,844 | | |
| Expenses | |
| Investment adviser fee | | $ | 8,430,891 | | |
| Trustees' fees and expenses | | | 30,247 | | |
| Custodian fee | | | 287,431 | | |
| Legal and accounting services | | | 73,620 | | |
| Miscellaneous | | | 25,054 | | |
| Total expenses | | $ | 8,847,243 | | |
| Net investment income | | $ | 21,338,601 | | |
| Realized and Unrealized Gain (Loss) | |
Net realized gain (loss) —
Investment transactions | | $ | 10,404,166 | | |
| Foreign currency transactions | | | (1,815 | ) | |
| Net realized gain | | $ | 10,402,351 | | |
Change in unrealized appreciation (depreciation) —
Investments | | $ | 187,543,067 | | |
| Foreign currency | | | 21,668 | | |
| Net change in unrealized appreciation (depreciation) | | $ | 187,564,735 | | |
| Net realized and unrealized gain | | $ | 197,967,086 | | |
| Net increase in net assets from operations | | $ | 219,305,687 | | |
See notes to financial statements
20
Tax-Managed Value Portfolio as of October 31, 2007
FINANCIAL STATEMENTS CONT'D
Statements of Changes in Net Assets
Increase (Decrease)
in Net Assets | | Year Ended
October 31, 2007 | | Year Ended
October 31, 2006 | |
From operations —
Net investment income | | $ | 21,338,601 | | | $ | 18,135,849 | | |
Net realized gain from investment
transactions and foreign currency | | | 10,402,351 | | | | 30,315,383 | | |
Net change in unrealized appreciation
(depreciation) from investments
and foreign currency | | | 187,564,735 | | | | 142,148,590 | | |
| Net increase in net assets from operations | | $ | 219,305,687 | | | $ | 190,599,822 | | |
Capital transactions —
Contributions | | $ | 253,731,971 | | | $ | 223,007,191 | | |
| Withdrawals | | | (164,869,742 | ) | | | (146,685,668 | ) | |
Net increase in net assets from
capital transactions | | $ | 88,862,229 | | | $ | 76,321,523 | | |
| Net increase in net assets | | $ | 308,167,916 | | | $ | 266,921,345 | | |
| Net Assets | |
| At beginning of year | | $ | 1,212,995,877 | | | $ | 946,074,532 | | |
| At end of year | | $ | 1,521,163,793 | | | $ | 1,212,995,877 | | |
See notes to financial statements
21
Tax-Managed Value Portfolio as of October 31, 2007
FINANCIAL STATEMENTS CONT'D
Supplementary Data
| | | Year Ended October 31, | |
| | | 2007 | | 2006 | | 2005 | | 2004 | | 2003 | |
| Ratios/Supplemental Data | |
| Ratios (As a percentage of average daily net assets): | |
| Expenses before custodian fee reduction(1) | | | 0.66 | % | | | 0.67 | % | | | 0.68 | % | | | 0.69 | % | | | 0.70 | % | |
| Expenses after custodian fee reduction(1) | | | 0.66 | % | | | 0.67 | % | | | 0.68 | % | | | 0.69 | % | | | 0.70 | % | |
| Net investment income | | | 1.56 | % | | | 1.67 | % | | | 1.40 | % | | | 1.57 | % | | | 1.47 | % | |
| Portfolio Turnover | | | 14 | % | | | 26 | % | | | 40 | % | | | 44 | % | | | 76 | % | |
| Total Return | | | 17.51 | % | | | 19.53 | % | | | 15.76 | % | | | 13.55 | % | | | 16.40 | % | |
| Net assets, end of year (000's omitted) | | $ | 1,521,164 | | | $ | 1,212,996 | | | $ | 946,075 | | | $ | 797,423 | | | $ | 673,412 | | |
(1) The investment adviser voluntarily waived a portion of its investment advisory fee (equal to an amount less than 0.005% of average net assets, for 2006 and 2005, respectively).
See notes to financial statements
22
Tax-Managed Value Portfolio as of October 31, 2007
NOTES TO FINANCIAL STATEMENTS
1 Significant Accounting Policies
Tax-Managed Value Portfolio (the Portfolio) is registered under the Investment Company Act of 1940, as amended (the 1940 Act), as a diversified open-end management investment company. The Portfolio, which was organized as a trust under the laws of the State of New York on February 13, 2001, seeks to achieve long-term after-tax returns by investing in a diversified portfolio of value stocks. The Declaration of Trust permits the Trustees to issue interests in the Portfolio. At October 31, 2007, Eaton Vance Tax-Managed Value Fund and Eaton Vance Tax-Managed Equity Asset Allocation Fund held approximately 87.7% and 12.2%, respectively, of the interest in the Portfolio. The following is a summary of significant accounting policies followed by the Portfolio in the preparation of its financial statements. The policies are in conformity with accounting principles generally accepted in the United States of America.
A Investment Valuation — Securities listed on a U.S. securities exchange generally are valued at the last sale price on the day of valuation or, if no sales took place on such date, at the mean between the closing bid and asked prices therefore on the exchange where such securities are principally traded. Equity securities listed on the NASDAQ Global or Global Select Market generally are valued at the official NASDAQ closing price. Unlisted or listed securities for which closing sales prices or closing quotations are not available are valued at the mean between the latest available bid and asked prices or, in the case of preferred equity securities that are not listed or traded in the over-the-counter market, by an independent pricing service. Exchange-traded options are valued at the last sale price for the day of valuation as quoted on the principal exchange or board of trade on which the options are traded or, in the absence of sales on such date, at the mean between the latest bid and asked prices therefore. Futures positions on securities and currencies generally are valued at closing settlement prices. Short-term debt securities with a remaining maturity of 60 days or less are valued at amortized cost. If short-term debt securities are acquired with a remaining maturity of more than 60 days, they will be valued by a pricing service. Other fixed income and debt securities, including listed securities and securities for which price quotations are available, will normally be valued on the basis of valuations furnished by a pricing service. Foreign securities and currencies are valued in U.S. dollars, based on foreign currency exchange rate quotations supplied by an independent quotation service. The d aily valuation of exchange-traded foreign securities generally is determined as of the close of trading on the principal exchange on which such securities trade. Events occurring after the close of trading on foreign exchanges may result in adjustments to the valuation of foreign securities to more accurately reflect their fair value as of the close of regular trading on the New York Stock Exchange. When valuing foreign equity securities that meet certain criteria, the Trustees have approved the use of a fair value service that values such securities to reflect market trading that occurs after the close of the applicable foreign markets of comparable securities or other instruments that have a strong correlation to the fair-valued securities. Investments held by the Portfolio for which valuations or market quotations are unavailable are valued at fair value using methods determined in good faith by or at the direction of the Trustees of the Portfolio considering relevant factors, data and information including the market value of freely tradable securities of the same class in the principal market on which such securities are normally traded.
The Portfolio may invest in Cash Management Portfolio (Cash Management) and Eaton Vance Cash Collateral Fund, LLC (Cash Collateral Fund), affiliated investment companies managed by Boston Management and Research (BMR), a subsidiary of Eaton Vance Management (EVM). Cash Management values its investment securities utilizing the amortized cost valuation technique permitted by Rule 2a-7 of the 1940 Act. This technique involves initially valuing a portfolio security at its cost and thereafter assuming a constant amortization to maturity of any discount or premium. Investments in Cash Collateral Fund are valued at the net asset value per share on the valuation date.
B Income — Dividend income is recorded on the ex-dividend date for dividends received in cash and/or securities. However, if the ex-dividend date has passed, certain dividends from foreign securities are recorded as the Portfolio is informed of the ex-dividend date. Withholding taxes on foreign dividends and capital gains have been provided for in accordance with the Portfolio's understanding of the applicable countries' tax rules and rates. Interest income is recorded on the basis of interest accrued, adjusted for amortization of premium or accretion of discount.
C Federal Taxes — The Portfolio has elected to be treated as a partnership for federal tax purposes. No provision is made by the Portfolio for federal or state taxes on any taxable income of the Portfolio because each investor in the Portfolio is ultimately responsible for the payment of any taxes on its share of taxable income. Since at least one of the Portfolio's investors is a regulated
23
Tax-Managed Value Portfolio as of October 31, 2007
NOTES TO FINANCIAL STATEMENTS CONT'D
investment company that invests all or substantially all of its assets in the Portfolio, the Portfolio normally must satisfy the applicable source of income and diversification requirements (under the Internal Revenue Code) in order for its investors to satisfy them. The Portfolio will allocate, at least annually among its investors, each investor's distributive share of the Portfolio's net investment income, net realized capital gains, and any other items of income, gain, loss, deduction or credit.
D Financial Futures Contract — The Portfolio may enter into financial futures contracts. The Portfolio's investment in financial futures contracts is designed for hedging against changes in interest rates or as a substitute for the purchase of securities. Upon entering into a financial futures contract, the Portfolio is required to deposit with the broker, either in cash or securities an amount equal to a certain percentage of the purchase price (initial margin). Subsequent payments, known as variation margin, are made or received by the Portfolio each business day, depending on the daily fluctuations in the value of the underlying security, and are recorded as unrealized gains or losses by the Portfolio. Gains (losses) are realized upon the expiration or closing of the f inancial futures contracts. Should market conditions change unexpectedly, the Portfolio may not achieve the anticipated benefits of the financial futures contracts and may realize a loss. In entering such contracts, the Portfolio bears the risk if the counterparties do not perform under the contracts' terms.
E Expense Reduction — State Street Bank and Trust Company (SSBT) serves as custodian of the Portfolio. Pursuant to the custodian agreement, SSBT receives a fee reduced by credits, which are determined based on the average daily cash balance the Portfolio maintains with SSBT. All credit balances, if any, used to reduce the Portfolio's custodian fees are reported as a reduction of expenses in the Statement of Operations.
F Use of Estimates — The preparation of the financial statements in conformity with accounting principles generally accepted in the United States of America requires management to make estimates and assumptions that affect the reported amounts of assets and liabilities at the date of the financial statements and the reported amounts of income and expense during the reporting period. Actual results could differ from those estimates.
G Indemnifications — Under the Portfolio's organizational documents, its officers and Trustees may be indemnified against certain liabilities and expenses arising out of the performance of their duties to the Portfolio. Interestholders in the Portfolio are jointly and severally liable for the liabilities and obligations of the Portfolio in the event that the Portfolio fails to satisfy such liabilities and obligations; provided, however, that, to the extent assets are available in the Portfolio, the Portfolio may, under certain circumstances, indemnify interestholders from and against any claim or liability to which such holder may become subject by reason of being or having been an interestholder in t he Portfolio. Additionally, in the normal course of business, the Portfolio enters into agreements with service providers that may contain indemnification clauses. The Portfolio's maximum exposure under these arrangements is unknown as this would involve future claims that may be made against the Portfolio that have not yet occurred.
H Other — Investment transactions are accounted for on the date the securities are purchased or sold. Realized gains and losses on securities sold are determined on the basis of identified cost.
2 Investment Adviser Fee and Other Transactions with Affiliates
The investment adviser fee is earned by BMR as compensation for management and investment advisory services rendered to the Portfolio. Pursuant to the advisory agreement, BMR receives a monthly fee at the annual rate of 0.65% of average net assets of $500 million but less than $1 billion, 0.600% of average net assets of $1 billion but less than $2 billion, 0.575% of average net assets of $2 billion but less than $5 billion, and 0.555% of average net assets of $5 billion and over. The portion of the advisory fee payable by Cash Management on the Portfolio's investment of cash therein is credited against the Portfolio's advisory fees. For the year ended October 31, 2007, the Portfolio's advisory fee totaled $8,559,466, of which $128,575 was allocated from Cash Management and $8,430,891 was paid or accrued directly by the Portfolio. For the year ended October 31, 2007, the Portfolio's advisory fee, including the portion allocated f rom Cash Management, was 0.627% of the Portfolio's average daily net assets.
Except as to the Trustees of the Portfolio who are not members of EVM's or BMR's organizations, officers and Trustees receive remuneration for their services to the Portfolio out of such investment adviser fee. Certain officers and Trustees of the Portfolio are officers of the above organizations. Trustees of the Portfolio who are not affiliated with the investment adviser may elect to defer receipt of all or a percentage of their annual fees in accordance with the terms of the Trustees Deferred Compensation Plan. For the year ended October 31, 2007, no significant amounts have been deferred.
24
Tax-Managed Value Portfolio as of October 31, 2007
NOTES TO FINANCIAL STATEMENTS CONT'D
3 Investment Transactions
Purchases and sales of investments, other than short-term obligations, aggregated $288,608,951 and $192,152,257, respectively, for the year ended October 31, 2007.
4 Securities Lending Agreement
The Portfolio has established a securities lending agreement with SSBT as securities lending agent in which the Portfolio lends portfolio securities to qualified borrowers in exchange for collateral consisting of either cash or U.S. government securities in an amount at least equal to the market value of the securities on loan. Cash collateral is invested in Cash Collateral Fund. The Portfolio earns interest on the amount invested in Cash Collateral Fund but it must pay the broker a loan rebate fee computed as a varying percentage of the collateral received. The loan rebate fee paid by the Portfolio amounted to $2,398,865 for the year ended October 31, 2007. At October 31, 2007, the value of the securities loaned and the value of the collateral amounted to $10,968,032 and $11,644,249, respectively. In the event of counterparty default, the Portfolio is subject to potential loss if it is delayed or prevented from exercising its r ight to dispose of the collateral. The Portfolio bears risk in the event that invested collateral is not sufficient to meet obligations due on loans.
5 Federal Income Tax Basis of Unrealized Appreciation (Depreciation)
The cost and unrealized appreciation (depreciation) in value of the investments owned at October 31, 2007, as computed on a federal income tax basis, were as follows:
| Aggregate Cost | | $ | 941,906,113 | | |
| Gross unrealized appreciation | | $ | 601,479,378 | | |
| Gross unrealized depreciation | | | (1,010,933 | ) | |
| Net unrealized appreciation | | $ | 600,468,445 | | |
6 Financial Instruments
The Portfolio may trade in financial instruments with off-balance sheet risk in the normal course of its investing activities to assist in managing exposure to various market risks. These financial instruments may include written options, forward foreign currency exchange contracts and financial futures contracts and may involve, to a varying degree, elements of risk in excess of the amounts recognized for financial statement purposes. The notional or contractual amounts of these instruments represent the investment the Portfolio has in particular classes of financial instruments and does not necessarily represent the amounts potentially subject to risk. The measurement of the risks associated with these instruments is meaningful only when all related and offsetting transactions are considered. The Portfolio did not have any open obligations under these fina ncial instruments at October 31, 2007.
7 Line of Credit
The Portfolio participates with other portfolios and funds managed by EVM and its affiliates in a $200 million unsecured line of credit agreement with a group of banks. Borrowings will be made by the Portfolio solely to facilitate the handling of unusual and/or unanticipated short-term cash requirements. Interest is charged to the Portfolio based on its borrowings at an amount above either the Eurodollar rate or Federal Funds rate. In addition, a fee computed at an annual rate of 0.07% on the daily unused portion of the line of credit is allocated among the participating portfolios and funds at the end of each quarter. The Portfolio did not have any significant borrowings or allocated fees during the year ended October 31, 2007.
8 Recently Issued Accounting Pronouncements
In June 2006, the Financial Accounting Standards Board (FASB) issued FASB Interpretation No. 48 (FIN 48), "Accounting for Uncertainty in Income Taxes – an interpretation of FASB Statement No. 109". FIN 48 clarifies the accounting for uncertainty in income taxes recognized in accordance with FASB Statement No. 109, "Accounting for Income Taxes". This interpretation prescribes a recognition threshold and measurement attribute for the financial statement recognition and measurement of a tax position taken or expected to be taken in a tax return. It also provides guidance on de-recognition, classification, interest and penalties, accounting in interim periods, disclosure and transition. FIN 48 is effective on the last business day of the first required financial reporting period for fiscal years beginning after December 15, 2006. Management is currently evaluating the impact of applying the various provisions of FIN 48.
In September 2006, the FASB issued Statement of Financial Accounting Standards No. 157 (FAS 157), "Fair Value Measurements". FAS 157 defines fair value, establishes a framework for measuring fair value in accordance with generally accepted accounting principles and expands disclosure about fair value measurements. FAS 157 is effective for fiscal years beginning after November 15, 2007. Management is currently evaluating the impact the adoption of FAS 157 will have on the Portfolio's financial statement disclosures.
25
Tax-Managed Value Portfolio as of October 31, 2007
REPORT OF INDEPENDENT REGISTERED PUBLIC ACCOUNTING FIRM
To the Trustees and Investors of
Tax-Managed Value Portfolio:
We have audited the accompanying statement of assets and liabilities of Tax-Managed Value Portfolio (the "Portfolio"), including the portfolio of investments, as of October 31, 2007, and the related statement of operations for the year then ended, the statements of changes in net assets for each of the two years in the period then ended, and the supplementary data for each of the five years in the period then ended. These financial statements and supplementary data are the responsibility of the Portfolio's management. Our responsibility is to express an opinion on these financial statements and supplementary data based on our audits.
We conducted our audits in accordance with the standards of the Public Company Accounting Oversight Board (United States). Those standards require that we plan and perform the audit to obtain reasonable assurance about whether the financial statements and supplementary data are free of material misstatement. The Portfolio is not required to have, nor were we engaged to perform, an audit of its internal control over financial reporting. Our audits included consideration of internal control over financial reporting as a basis for designing audit procedures that are appropriate in the circumstances, but not for the purpose of expressing an opinion on the effectiveness of the Portfolio's internal control over financial reporting. Accordingly, we express no such opinion. An audit also includes examining, on a test basis, evidence supporting the amounts and disclosures in the financial statements, assessing the accounting principles u sed and significant estimates made by management, as well as evaluating the overall financial statement presentation. Our procedures included confirmation of securities owned as of October 31, 2007, by correspondence with the custodian and brokers; where replies were not received from brokers, we performed other auditing procedures. We believe that our audits provide a reasonable basis for our opinion.
In our opinion, the financial statements and supplementary data referred to above present fairly, in all material respects, the financial position of Tax-Managed Value Portfolio as of October 31, 2007, the results of its operations for the year then ended, the changes in its net assets for each of the two years in the period then ended, and the supplementary data for each of the five years in the period then ended, in conformity with accounting principles generally accepted in the United States of America.
DELOITTE & TOUCHE LLP
Boston, Massachusetts
December 14, 2007
26
Eaton Vance Tax-Managed Value Fund
BOARD OF TRUSTEES' ANNUAL APPROVAL OF THE INVESTMENT ADVISORY AGREEMENT
Overview of the Contract Review Process
The Investment Company Act of 1940, as amended (the "1940 Act"), provides, in substance, that each investment advisory agreement between a fund and its investment adviser will continue in effect from year to year only if its continuance is approved at least annually by the fund's board of trustees, including by a vote of a majority of the trustees who are not "interested persons" of the fund ("Independent Trustees"), cast in person at a meeting called for the purpose of considering such approval.
At a meeting of the Boards of Trustees (each a "Board") of the Eaton Vance group of mutual funds (the "Eaton Vance Funds") held on April 23, 2007, the Board, including a majority of the Independent Trustees, voted to approve continuation of existing advisory and sub-advisory agreements for the Eaton Vance Funds for an additional one-year period. In voting its approval, the Board relied upon the affirmative recommendation of the Special Committee of the Board, which is a committee comprised exclusively of Independent Trustees. Prior to making its recommendation, the Special Committee reviewed information furnished for a series of meetings of the Special Committee held in February, March and April 2007. Such information included, among other things, the following:
Information about Fees, Performance and Expenses
• An independent report comparing the advisory and related fees paid by each fund with fees paid by comparable funds;
• An independent report comparing each fund's total expense ratio and its components to comparable funds;
• An independent report comparing the investment performance of each fund to the investment performance of comparable funds over various time periods;
• Data regarding investment performance in comparison to relevant peer groups of funds and appropriate indices;
• Comparative information concerning fees charged by each adviser for managing other mutual funds and institutional accounts using investment strategies and techniques similar to those used in managing the fund;
• Profitability analyses for each adviser with respect to each fund;
Information about Portfolio Management
• Descriptions of the investment management services provided to each fund, including the investment strategies and processes employed;
• Information concerning the allocation of brokerage and the benefits received by each adviser as a result of brokerage allocation, including information concerning the acquisition of research through "soft dollar" benefits received in connection with the funds' brokerage, and the implementation of a soft dollar reimbursement program established with respect to the funds;
• Data relating to portfolio turnover rates of each fund;
• The procedures and processes used to determine the fair value of fund assets and actions taken to monitor and test the effectiveness of such procedures and processes;
Information about each Adviser
• Reports detailing the financial results and condition of each adviser;
• Descriptions of the qualifications, education and experience of the individual investment professionals whose responsibilities include portfolio management and investment research for the funds, and information relating to their compensation and responsibilities with respect to managing other mutual funds and investment accounts;
• Copies of the Codes of Ethics of each adviser and its affiliates, together with information relating to compliance with and the administration of such codes;
• Copies of or descriptions of each adviser's proxy voting policies and procedures;
• Information concerning the resources devoted to compliance efforts undertaken by each adviser and its affiliates on behalf of the funds (including descriptions of various compliance programs) and their record of compliance with investment policies and restrictions, including policies with respect to market-timing, late trading and selective portfolio disclosure, and with policies on personal securities transactions;
• Descriptions of the business continuity and disaster recovery plans of each adviser and its affiliates;
Other Relevant Information
• Information concerning the nature, cost and character of the administrative and other non-investment management services provided by Eaton Vance Management and its affiliates;
• Information concerning management of the relationship with the custodian, subcustodians and fund accountants by each adviser or the funds' administrator; and
• The terms of each advisory agreement.
In addition to the information identified above, the Special Committee considered information provided from time to time by each adviser throughout the year at meetings of the Board and its committees. Over the course of the twelve-month period ended April 30, 2007, the
27
Eaton Vance Tax-Managed Value Fund
BOARD OF TRUSTEES' ANNUAL APPROVAL OF THE INVESTMENT ADVISORY AGREEMENT CONT'D
Board met ten times and the Special Committee, the Audit Committee and the Governance Committee, each of which is a Committee comprised solely of Independent Trustees, met twelve, fourteen and eight times, respectively. At such meetings, the Trustees received, among other things, presentations by the portfolio managers and other investment professionals of each adviser relating to the investment performance of each fund and the investment strategies used in pursuing the fund's investment objective.
For funds that invest through one or more underlying portfolios, the Board considered similar information about the portfolio(s) when considering the approval of advisory agreements. In addition, in cases where the fund's investment adviser has engaged a sub-adviser, the Board considered similar information about the sub-adviser when considering the approval of any sub-advisory agreement.
The Special Committee was assisted throughout the contract review process by Goodwin Procter LLP, legal counsel for the Independent Trustees. The members of the Special Committee relied upon the advice of such counsel and their own business judgment in determining the material factors to be considered in evaluating each advisory and sub-advisory agreement and the weight to be given to each such factor. The conclusions reached with respect to each advisory and sub-advisory agreement were based on a comprehensive evaluation of all the information provided and not any single factor. Moreover, each member of the Special Committee may have placed varying emphasis on particular factors in reaching conclusions with respect to each advisory and sub-advisory agreement.
Results of the Process
Based on its consideration of the foregoing, and such other information as it deemed relevant, including the factors and conclusions described below, the Special Committee concluded that the continuance of the investment advisory agreement of the Tax-Managed Value Portfolio (the "Portfolio"), the portfolio in which the Eaton Vance Tax-Managed Value Fund (the "Fund") invests, with Boston Management and Research (the "Adviser"), including its fee structure, is in the interests of shareholders and, therefore, the Special Committee recommended to the Board approval of the agreement. The Board accepted the recommendation of the Special Committee as well as the factors considered and conclusions reached by the Special Committee with respect to the agreements. Accordingly, the Board, including a majority of the Independent Trustees, voted to approve continuation of the investment advisory agreement for the Portfolio.
Nature, Extent and Quality of Services
In considering whether to approve the investment advisory agreement of the Portfolio, the Board evaluated the nature, extent and quality of services provided to the Portfolio by the Adviser.
The Board considered the Adviser's management capabilities and investment process with respect to the types of investments held by the Portfolio, including the education, experience and number of its investment professionals and other personnel who provide portfolio management, investment research, and similar services to the Portfolio. The Board specifically noted the Adviser's in-house equity research capabilities and experience managing funds that seek to maximize after-tax returns. The Board also took into account the resources dedicated to portfolio management and other services, including the compensation paid to recruit and retain investment personnel, and the time and attention devoted to the Portfolio by senior management.
The Board reviewed the compliance programs of the Adviser and relevant affiliates thereof. Among other matters, the Board considered compliance and reporting matters relating to personal trading by investment personnel, selective disclosure of portfolio holdings, late trading, frequent trading, portfolio valuation, business continuity and the allocation of investment opportunities. The Board also evaluated the responses of the Adviser and its affiliates to requests from regulatory authorities such as the Securities and Exchange Commission and the National Association of Securities Dealers.
The Board considered shareholder and other administrative services provided or managed by Eaton Vance Management and its affiliates, including transfer agency and accounting services. The Board evaluated the benefits to shareholders of investing in a fund that is a part of a large family of funds, including the ability, in many cases, to exchange an investment among different funds without incurring additional sales charges.
After consideration of the foregoing factors, among others, the Board concluded that the nature, extent and quality of services provided by the Adviser, taken as a whole, are appropriate and consistent with the terms of the investment advisory agreement.
Fund Performance
The Board compared the Fund's investment performance to a relevant universe of similarly managed funds identified by an independent data provider and appropriate benchmark indices. The Board reviewed comparative performance data for the one-, three- and five-year periods ended September 30, 2006 for the Fund. The Board concluded that the Fund's performance is satisfactory.
28
Eaton Vance Tax-Managed Value Fund
BOARD OF TRUSTEES' ANNUAL APPROVAL OF THE INVESTMENT ADVISORY AGREEMENT CONT'D
Management Fees and Expenses
The Board reviewed contractual investment advisory fee rates, including any administrative fee rates, payable by the Portfolio and the Fund (referred to collectively as "management fees"). As part of its review, the Board considered the management fees, including administrative fees, and the Fund's total expense ratio for the year ended September 30, 2006, as compared to a group of similarly managed funds selected by an independent data provider.
After reviewing the foregoing information, and in light of the nature, extent and quality of the services provided by the Adviser, the Board concluded that the management fees charged for advisory and related services and the Fund's total expense ratio are reasonable.
Profitability
The Board reviewed the level of profits realized by the Adviser and relevant affiliates thereof in providing investment advisory and administrative services to the Portfolio, the Fund and all Eaton Vance Funds as a group. The Board considered the level of profits realized without regard to revenue sharing or other payments by the Adviser and its affiliates to third parties in respect of distribution services. The Board also considered other direct or indirect benefits received by the Adviser and its affiliates in connection with its relationship with the Portfolio and the Fund, including the benefits of research services that may be available to the Adviser as a result of securities transactions effected for the Portfolio and other advisory clients.
The Board concluded that, in light of the foregoing factors and the nature, extent and quality of the services rendered, the profits realized by the Adviser and its affiliates are reasonable.
Economies of Scale
In reviewing management fees and profitability, the Board also considered the extent to which the Adviser and its affiliates, on the one hand, and the Fund, on the other hand, can expect to realize benefits from economies of scale as the assets of the Fund and the Portfolio increase. The Board acknowledged the difficulty in accurately measuring the benefits resulting from the economies of scale with respect to the management of any specific fund or group of funds. The Board reviewed data summarizing the increases and decreases in the assets of the Fund and of all Eaton Vance Funds as a group over various time periods, and evaluated the extent to which the total expense ratio of the Fund and the profitability of the Adviser and its affiliates may have been affected by such increases or decreases. Based upon the foregoing, the Board concluded that the benefits from economies of scale are currently being shared equitably by the Adv iser and its affiliates and the Fund. The Board also concluded that, assuming reasonably foreseeable increases in the assets of the Portfolio, the structure of the Portfolio advisory fee, which includes breakpoints at several asset levels, can be expected to cause the Adviser and its affiliates and the Fund and Portfolio to continue to share such benefits equitably.
29
Eaton Vance Tax-Managed Value Fund
MANAGEMENT AND ORGANIZATION
Fund Management. The Trustees of Eaton Vance Mutual Funds Trust (the Trust) and Tax-Managed Value Portfolio (the Portfolio) are responsible for the overall management and supervision of the Trust's and Portfolio's affairs. The Trustees and officers of the Trust and the Portfolio are listed below. Except as indicated, each individual has held the office shown or other offices in the same company for the last five years. Trustees and officers of the Trust and the Portfolio hold indefinite terms of office. The "noninterested Trustees" consist of those Trustees who are not "interested persons" of the Trust and the Portfolio, as that term is defined under the 1940 Act. The business address of each Trustee and officer is The Eaton Vance Building, 255 State Street, Boston, Massachusetts 02109. As used below, "EVC" refers to Eaton Vance Corp., "EV" refers to Eaton V ance, Inc., "EVM" refers to Eaton Vance Management, "BMR" refers to Boston Management and Research; "Parametric" refers to Parametric Portfolio Associates and "EVD" refers to Eaton Vance Distributors, Inc. EVC and EV are the corporate parent and trustee, respectively, of EVM and BMR. EVD is the Fund's principal underwriter, the Portfolio's placement agent and a wholly-owned subsidiary of EVM. Each officer affiliated with Eaton Vance may hold a position with other Eaton Vance affiliates that is comparable to his or her position with EVM listed below.
Name and
Date of Birth | | Position(s)
with the
Trust and
the Portfolio | | Term of
Office and
Length of
Service | | Principal Occupation(s)
During Past Five Years | | Number of Portfolios
in Fund Complex
Overseen By
Trustee(1) | | Other Directorships Held | |
| Interested Trustee | | | | | | | | | | | | | |
|
Thomas E. Faust Jr.
5/31/58 | | Trustee and President of
the Trust | | Trustee since 2007 and President of the Trust since 2002 | | Chairman, Chief Executive Officer and President of EVC, President of EV, Chief Executive Officer and President of EVM and BMR, and Director of EVD. Trustee and/or Officer of 176 registered investment companies and 5 private investment companies in the Eaton Vance Fund Complex. Mr. Faust is an interested person because of his position with EVM, BMR, EVC and EV which are affiliates of the Trust and Portfolio. | | | 176 | | | Director of EVC | |
|
| Noninterested Trustee(s) | | | | | | | | | | | | | |
|
Benjamin C. Esty
1/2/63 | | Trustee | | Since 2005 | | Roy and Elizabeth Simmons Professor of Business Administration, Harvard University Graduate School of Business Administration (since 2003). Formerly, Associate Professor, Harvard University Graduate School of Business Administration (2000-2003). | | | 176 | | | None | |
|
Allen R. Freedman
4/3/40 | | Trustee | | Since 2007 | | Former Chairman and Chief Executive Officer of Assurant, Inc. (insurance provider) (1978-2000). Formerly, a Director of Loring Ward International (fund distributor) (2005-2007). | | | 175 | | | Director of Assurant, Inc. and Stonemor Partners L.P. (owner and operator of cemeteries) | |
|
William H. Park
9/19/47 | | Trustee | | Since 2003 | | Vice Chairman, Commercial Industrial Finance Corp. (specialty finance company) (since 2006). Formerly, President and Chief Executive Officer, Prizm Capital Management, LLC (investment management firm) (since 2002-2005). | | | 176 | | | None | |
|
Ronald A. Pearlman
7/10/40 | | Trustee | | Since 2003 | | Professor of Law, Georgetown University Law Center. | | | 176 | | | None | |
|
Norton H. Reamer
9/21/35 | | Trustee | | Trustee of the Trust since 1986 and of the Portfolio since 2001 | | President, Chief Executive Officer and a Director of Asset Management Finance Corp. (a specialty finance company serving the investment management industry) (since October 2003). President, Unicorn Corporation (an investment and financial advisory services company) (since September 2000). Formerly, Chairman and Chief Operating Officer, Hellman, Jordan Management Co., Inc. (an investment management company) (2000-2003). Formerly, Advisory Director of Berkshire Capital Corporation (investment banking firm) (2002-2003). | | | 176 | | | None | |
|
30
Eaton Vance Tax-Managed Value Fund
MANAGEMENT AND ORGANIZATION CONT'D
Name and
Date of Birth | | Position(s)
with the
Trust and
the Portfolio | | Term of
Office and
Length of
Service | | Principal Occupation(s)
During Past Five Years | | Number of Portfolios
in Fund Complex
Overseen By
Trustee(1) | | Other Directorships Held | |
| Noninterested Trustee(s) (continued) | | | | | | | | | | | | | |
|
Heidi L. Steiger
7/8/53 | | Trustee | | Since 2007 | | President, Lowenhaupt Global Advisors, LLC (global wealth management firm) (since 2005); Formerly, President and Contributing Editor, Worth Magazine (2004); Formerly, Executive Vice President and Global Head of Private Asset Management (and various other positions), Neuberger Berman (investment firm) (1986-2004). | | | 173 | | | Director of Nuclear Electric Insurance Ltd. (nuclear insurance provider) and Aviva USA (insurance provider) | |
|
Lynn A. Stout
9/14/57 | | Trustee | | Trustee of the Trust since 1998 and of the Portfolio since 2001 | | Paul Hastings Professor of Corporate and Securities Law, University of California at Los Angeles School of Law. | | | 176 | | | None | |
|
Ralph F. Verni
1/26/43 | | Chairman of
the Board
and Trustee | | Chairman of the Board since 2007 and Trustee since 2005 | | Consultant and private investor. | | | 176 | | | None | |
|
| Principal Officers who are not Trustees | | | | | | | |
|
Name and
Date of Birth | | Position(s)
with the
Trust and
the Portfolio | | Term of
Office and
Length of
Service | | Principal Occupation(s)
During Past Five Years | |
| William H. Ahern, Jr. 7/28/59 | | Vice President of
the Trust | | Since 1995 | | Vice President of EVM and BMR. Officer of 74 registered investment companies managed by EVM or BMR. | |
|
| Cynthia J. Clemson 3/2/63 | | Vice President of
the Trust | | Since 2005 | | Vice President of EVM and BMR. Officer of 89 registered investment companies managed by EVM or BMR. | |
|
| Charles B. Gaffney 12/4/72 | | Vice President of
the Trust | | Since 2007 | | Vice President of EVM and BMR. Previously, Sector Portfolio Manager and Senior Equity Analyst of Brown Brothers Harriman (1997-2003). Officer of 29 registered investment companies managed by EVM or BMR. | |
|
| Christine M. Johnston 11/9/72 | | Vice President of
the Trust | | Since 2007 | | Vice President of EVM and BMR. Officer of 34 registered investment companies managed by EVM or BMR. | |
|
| Aamer Khan 6/7/60 | | Vice President of
the Trust | | Since 2005 | | Vice President of EVM and BMR. Officer of 32 registered investment companies managed by EVM or BMR. | |
|
| Thomas H. Luster 4/8/62 | | Vice President of
the Trust | | Since 2006 | | Vice President of EVM and BMR. Officer of 48 registered investment companies managed by EVM or BMR. | |
|
| Michael R. Mach 7/15/47 | | Vice President | | Vice President of the Trust since 1999 and of the Portfolio since 2001 | | Vice President of EVM and BMR. Officer of 54 registered investment companies managed by EVM or BMR. | |
|
| Robert B. MacIntosh 1/22/57 | | Vice President of
the Trust | | Since 1998 | | Vice President of EVM and BMR. Officer of 89 registered investment companies managed by EVM or BMR. | |
|
| Duncan W. Richardson 10/26/57 | | Vice President of the Trust; President of
the Portfolio | | Vice President of the Trust since 2001 and President of the Portfolio since 2002 | | Executive Vice President and Chief Equity Investment Officer of EVC, EVM and BMR. Officer of 80 registered investment companies managed by EVM or BMR. | |
|
| Walter A. Row, III 7/20/57 | | Vice President of
the Trust | | Since 2001 | | Director of Equity Research and a Vice President of EVM and BMR. Officer of 38 registered investment companies managed by EVM or BMR. | |
|
| Judith A. Saryan 8/21/54 | | Vice President of
the Trust | | Since 2003 | | Vice President of EVM and BMR. Officer of 53 registered investment companies managed by EVM or BMR. | |
|
| Susan Schiff 3/13/61 | | Vice President of
the Trust | | Since 2002 | | Vice President of EVM and BMR. Officer of 35 registered investment companies managed by EVM or BMR. | |
|
31
Eaton Vance Tax-Managed Value Fund
MANAGEMENT AND ORGANIZATION CONT'D
Name and
Date of Birth | | Position(s)
with the
Trust and
the Portfolio | | Term of
Office and
Length of
Service | | Principal Occupation(s)
During Past Five Years | |
| Principal Officers who are not Trustees (continued) | | | | | | | |
|
| Thomas Seto 9/27/62 | | Vice President of
the Trust | | Since 2007 | | Vice President and Director of Portfolio Management of Parametric. Officer of 30 registered investment companies managed by EVM or BMR. | |
|
| David M. Stein 5/4/51 | | Vice President of
the Trust | | Since 2007 | | Managing Director and Chief Investment Officer of Parametric. Officer of 30 registered investment companies managed by EVM or BMR. | |
|
| Mark S. Venezia 5/23/49 | | Vice President of
the Trust | | Since 2007 | | Vice President of EVM and BMR. Officer of 35 registered investment companies managed by EVM or BMR. | |
|
| Adam A. Weigold 3/22/75 | | Vice President of
the Trust | | Since 2007 | | Vice President of EVM and BMR. Officer of 70 registered investment companies managed by EVM or BMR. | |
|
| Barbara E. Campbell 6/19/57 | | Treasurer of the Trust | | Since 2005 | | Vice President of EVM and BMR. Officer of 176 registered investment companies managed by EVM or BMR. | |
|
| Kevin M. Connerty 4/20/64 | | Treasurer of
the Portfolio | | Since 2005 | | Vice President of EVM and BMR. Previously, Director and Vice President of PFPC Inc. (1999-2005). Officer of 98 registered investment companies managed by EVM or BMR. | |
|
| Maureen A. Gemma 5/24/60 | | Secretary | | Since 2007 | | Vice President and Deputy Chief Legal Officer of EVM and BMR. Officer of 176 registered investment companies managed by EVM or BMR. | |
|
| Paul M. O'Neil 7/11/53 | | Chief Compliance Officer | | Since 2004 | | Vice President of EVM and BMR. Officer of 176 registered investment companies managed by EVM or BMR. | |
|
(1) Includes both master and feeder funds in a master-feeder structure.
The SAI for the Fund includes additional information about the Trustees and officers of the Fund and the Portfolio and can be obtained without charge by calling 1-800-225-6265.
32
Investment Adviser of Tax-Managed Value Portfolio
Boston Management and Research
The Eaton Vance Building
255 State Street
Boston, MA 02109
Administrator of Eaton Vance Tax-Managed Value Fund
Eaton Vance Management
The Eaton Vance Building
255 State Street
Boston, MA 02109
Principal Underwriter
Eaton Vance Distributors, Inc.
The Eaton Vance Building
255 State Street
Boston, MA 02109
(617) 482-8260
Custodian
State Street Bank and Trust Company
200 Clarendon Street
Boston, MA 02116
Transfer Agent
PFPC Inc.
Attn: Eaton Vance Funds
P.O. Box 9653
Providence, RI 02940-9653
(800) 262-1122
Independent Registered Public Accounting Firm
Deloitte & Touche LLP
200 Berkeley Street
Boston, MA 02116-5022
Eaton Vance Tax-Managed Value Fund
The Eaton Vance Building
255 State Street
Boston, MA 02109
This report must be preceded or accompanied by a current prospectus. Before investing, investors should consider carefully the Fund's investment objective(s), risks, and charges and expenses. The Fund's current prospectus contains this and other information about the Fund and is available through your financial advisor. Please read the prospectus carefully before you invest or send money. For further information please call 1-800-225-6265.
501-12/07 TVSRC
Item 2. Code of Ethics
The registrant has adopted a code of ethics applicable to its Principal Executive Officer, Principal Financial Officer and Principal Accounting Officer. The registrant undertakes to provide a copy of such code of ethics to any person upon request, without charge, by calling 1-800-262-1122.
Item 3. Audit Committee Financial Expert
The registrant’s Board has designated William H. Park and Norton H. Reamer, each an independent trustee, as its audit committee financial experts. Mr. Park is a certified public accountant who is the Vice Chairman of Commercial Industrial Finance Corp (specialty finance company). Previously, he served as President and Chief Executive Officer of Prizm Capital Management, LLC (investment management firm) and as Executive Vice President and Chief Financial Officer of United Asset Management Corporation (“UAM”) (a holding company owning institutional investment management firms). Mr. Reamer is the President, Chief Executive Officer and a Director of Asset Management Finance Corp. (a specialty finance company serving the investment management industry) and is President of Unicorn Corporation (an investment and financial advisory services company). Formerly, Mr. Reamer was Chairman and Chief Operating Officer of Hellman, Jordan Management Co., Inc. (an investment management company) and Advisory Director of Berkshire Capital Corporation (an investment banking firm), Chairman of the Board of UAM and Chairman, President and Director of the UAM Funds (mutual funds).
Item 4. Principal Accountant Fees and Services
(a)-(d)
Eaton Vance Tax-Managed Small Cap Value Fund, Eaton Vance Tax-Managed Mid-Cap Core Fund, Eaton Vance Multi-Cap Opportunity Fund, Eaton Vance Tax-Managed Value Fund, Eaton Vance Tax-Managed International Equity Fund, Eaton Vance Tax-Managed Small-Cap Growth Fund, Eaton Vance Tax-Managed Equity Asset Allocation Fund, Eaton Vance High Income Fund, Eaton Vance Floating-Rate Fund, Eaton Vance Floating-Rate High Income Fund, Eaton Vance Strategic Income Fund, Eaton Vance Low Duration Fund, Eaton Vance Government Obligations Fund, Eaton Vance Diversified Income Fund, Eaton Vance Equity Research Fund ,Eaton Vance Tax-Managed Dividend Income Fund , Eaton Vance Dividend Income Fund, Eaton Vance International Equity Fund and Eaton Vance Structured Emerging Markets Fund, Eaton Vance Cash Management Fund, Eaton Vance Money Market Fund (the “Fund(s)”) are series of Eaton Vance Mutual Funds Trust (the “Trust”), a Massachusetts business trust, which, including the Funds, contains a total of 29 series (the “Series”). The Trust is registered under the Investment Company Act of 1940 as an open-end management investment company. This Form N-CSR relates to the Funds’ annual reports.
With the exception of Tax-Managed Dividend Income Fund, the following tables present the aggregate fees billed to each Fund for the Fund’s respective fiscal years ended October 31, 2006 and October 31, 2007 or for those Funds which have not completed two years of operations, for such fiscal periods as indicated on the following tables, by the Fund’s principal accountant for professional services rendered for the audit of the Fund’s annual financial statements and fees billed for other services rendered by the principal accountant during those periods. In 2006, Eaton Vance Tax-Managed Dividend Income Fund changed its fiscal year end from April 30 to October 31. In 2007, Eaton Vance Cash Management Fund and Eaton Vance Money Market Fund changed their fiscal year ends from December 31 to October 31. Accordingly the tables for this Fund show fee information for the fiscal year ended April 30, 2006, the period from May 1, 2006 to October 31, 2006, and the fiscal year ended October 31, 2007.
Eaton Vance Tax-Managed Small-Cap Value Fund
Fiscal Years Ended | | 10/31/06 | | 10/31/07 | |
| | | | | |
Audit Fees | | $ | 9,020 | | $ | 10,410 | |
| | | | | |
Audit-Related Fees(1) | | 0 | | 0 | |
| | | | | |
Tax Fees(2) | | 6,320 | | 6,541 | |
| | | | | |
All Other Fees(3) | | 0 | | 0 | |
| | | | | |
Total | | $ | 15,340 | | $ | 16,951 | |
Eaton Vance Tax-Managed Mid-Cap Core Fund
Fiscal Years Ended | | 10/31/06 | | 10/31/07 | |
| | | | | |
Audit Fees | | $ | 9,020 | | $ | 10,410 | |
| | | | | |
Audit-Related Fees(1) | | 0 | | 0 | |
| | | | | |
Tax Fees(2) | | 6,540 | | 6,769 | |
| | | | | |
All Other Fees(3) | | 0 | | 0 | |
| | | | | |
Total | | $ | 15,560 | | $ | 17,179 | |
Eaton Vance Tax-Managed Multi-Cap Opportunity Fund
Fiscal Years Ended | | 10/31/06 | | 10/31/07 | |
| | | | | |
Audit Fees | | $ | 11,230 | | $ | 12,620 | |
| | | | | |
Audit-Related Fees(1) | | 0 | | 0 | |
| | | | | |
Tax Fees(2) | | 6,320 | | 6,541 | |
| | | | | |
All Other Fees(3) | | 0 | | 0 | |
| | | | | |
Total | | $ | 17,550 | | $ | 19,161 | |
Eaton Vance Tax-Managed Value Fund
Fiscal Years Ended | | 10/31/06 | | 10/31/07 | |
| | | | | |
Audit Fees | | $ | 12,490 | | $ | 13,880 | |
| | | | | |
Audit-Related Fees(1) | | 0 | | 0 | |
| | | | | |
Tax Fees(2) | | 6,540 | | 6,769 | |
| | | | | |
All Other Fees(3) | | 0 | | 0 | |
| | | | | |
Total | | $ | 19,030 | | $ | 20,649 | |
Eaton Vance Tax-Managed International Equity Fund
Fiscal Years Ended | | 10/31/06 | | 10/31/07 | |
| | | | | |
Audit Fees | | $ | 11,230 | | $ | 13,880 | |
| | | | | |
Audit-Related Fees(1) | | 0 | | 0 | |
| | | | | |
Tax Fees(2) | | 6,430 | | 6,655 | |
| | | | | |
All Other Fees(3) | | 0 | | 0 | |
| | | | | |
Total | | $ | 17,660 | | $ | 20,535 | |
Eaton Vance Tax-Managed Small-Cap Growth Fund
Fiscal Years Ended | | 10/31/06 | | 10/31/07 | |
| | | | | |
Audit Fees | | $ | 15,490 | | $ | 16,880 | |
| | | | | |
Audit-Related Fees(1) | | 0 | | 0 | |
| | | | | |
Tax Fees(2) | | 6,540 | | 6,769 | |
| | | | | |
All Other Fees(3) | | 0 | | 0 | |
| | | | | |
Total | | $ | 22,030 | | $ | 23,649 | |
Eaton Vance Tax Managed Equity Asset Allocation Fund
Fiscal Years Ended | | 10/31/06 | | 10/31/07 | |
| | | | | |
Audit Fees | | $ | 48,590 | | $ | 51,880 | |
| | | | | |
Audit-Related Fees(1) | | 0 | | 0 | |
| | | | | |
Tax Fees(2) | | 17,440 | | 18,050 | |
| | | | | |
All Other Fees(3) | | 0 | | 0 | |
| | | | | |
Total | | $ | 66,030 | | $ | 69,930 | |
Eaton Vance High Income Fund
Fiscal Years Ended | | 10/31/06 | | 10/31/07 | |
| | | | | |
Audit Fees | | $ | 12,490 | | $ | 13,780 | |
| | | | | |
Audit-Related Fees(1) | | 0 | | 0 | |
| | | | | |
Tax Fees(2) | | 6,320 | | 6,541 | |
| | | | | |
All Other Fees(3) | | 0 | | 0 | |
| | | | | |
Total | | $ | 18,810 | | $ | 20,321 | |
Eaton Vance Floating-Rate Fund
Fiscal Years Ended | | 10/31/06 | | 10/31/07 | |
| | | | | |
Audit Fees | | $ | 12,490 | | $ | 13,530 | |
| | | | | |
Audit-Related Fees(1) | | 0 | | 0 | |
| | | | | |
Tax Fees(2) | | 6,540 | | 6,769 | |
| | | | | |
All Other Fees(3) | | 0 | | 0 | |
| | | | | |
Total | | $ | 19,030 | | $ | 20,299 | |
Eaton Vance Floating-Rate High Income Fund
Fiscal Years Ended | | 10/31/06 | | 10/31/07 | |
| | | | | |
Audit Fees | | $ | 12,490 | | $ | 13,530 | |
| | | | | |
Audit-Related Fees(1) | | 0 | | 0 | |
| | | | | |
Tax Fees(2) | | 6,540 | | 6,769 | |
| | | | | |
All Other Fees(3) | | 0 | | 0 | |
| | | | | |
Total | | $ | 19,030 | | $ | 20,299 | |
Eaton Vance Strategic Income Fund
Fiscal Years Ended | | 10/31/06 | | 10/31/07 | |
| | | | | |
Audit Fees | | $ | 34,300 | | $ | 30,000 | |
| | | | | |
Audit-Related Fees(1) | | 0 | | 0 | |
| | | | | |
Tax Fees(2) | | 20,325 | | 19,000 | |
| | | | | |
All Other Fees(3) | | 0 | | 0 | |
| | | | | |
Total | | $ | 54,625 | | $ | 49,000 | |
Eaton Vance Low Duration Fund
Fiscal Years Ended | | 10/31/06 | | 10/31/07 | |
| | | | | |
Audit Fees | | $ | 24,400 | | $ | 24,000 | |
| | | | | |
Audit-Related Fees(1) | | 0 | | 0 | |
| | | | | |
Tax Fees(2) | | 12,125 | | 12,000 | |
| | | | | |
All Other Fees(3) | | 0 | | 0 | |
| | | | | |
Total | | $ | 36,525 | | $ | 36,000 | |
Eaton Vance Government Obligations Fund
Fiscal Years Ended | | 10/31/06 | | 10/31/07 | |
| | | | | |
Audit Fees | | $ | 24,700 | | $ | 24,000 | |
| | | | | |
Audit-Related Fees(1) | | 0 | | 0 | |
| | | | | |
Tax Fees(2) | | 14,275 | | 11,000 | |
| | | | | |
All Other Fees(3) | | 0 | | 0 | |
| | | | | |
Total | | $ | 38,975 | | $ | 35,000 | |
Eaton Vance Diversified Income Fund
Fiscal Years Ended | | 10/31/06 | | 10/31/07 | |
| | | | | |
Audit Fees | | $ | 27,500 | | $ | 20,000 | |
| | | | | |
Audit-Related Fees(1) | | 0 | | 0 | |
| | | | | |
Tax Fees(2) | | 15,150 | | 15,000 | |
| | | | | |
All Other Fees(3) | | 0 | | 0 | |
| | | | | |
Total | | $ | 42,650 | | $ | 35,000 | |
Eaton Vance Equity Research Fund
Fiscal Years Ended | | 10/31/06 | | 10/31/07 | |
| | | | | |
Audit Fees | | $ | 25,300 | | $ | 25,000 | |
| | | | | |
Audit-Related Fees(1) | | 0 | | 0 | |
| | | | | |
Tax Fees(2) | | 9,675 | | 7,800 | |
| | | | | |
All Other Fees(3) | | 0 | | 0 | |
| | | | | |
Total | | $ | 34,975 | | $ | 32,800 | |
Eaton Vance Tax-Managed Dividend Income Fund
Fiscal Years Ended | | 10/31/06 | | 10/31/07 | |
| | | | | |
Audit Fees | | $ | 48,590 | | $ | 49,980 | |
| | | | | |
Audit-Related Fees(1) | | 0 | | 0 | |
| | | | | |
Tax Fees(2) | | 9,620 | | 9,957 | |
| | | | | |
All Other Fees(3) | | 0 | | 0 | |
| | | | | |
Total | | $ | 58,210 | | $ | 59,937 | |
Eaton Vance Dividend Income Fund
Fiscal Years Ended | | 10/31/06* | | 10/31/07 | |
| | | | | |
Audit Fees | | $ | 11,360 | | $ | 12,750 | |
| | | | | |
Audit-Related Fees(1) | | 0 | | 0 | |
| | | | | |
Tax Fees(2) | | 8,000 | | 8,280 | |
| | | | | |
All Other Fees(3) | | 0 | | 0 | |
| | | | | |
Total | | $ | 19,360 | | $ | 21,030 | |
* For the period from commencement of operations on November 30, 2005 to October 31, 2006
Eaton Vance International Equity Fund
Fiscal Years Ended | | 10/31/06* | | 10/31/07 | |
| | | | | |
Audit Fees | | $ | 11,360 | | $ | 12,750 | |
| | | | | |
Audit-Related Fees(1) | | 0 | | 0 | |
| | | | | |
Tax Fees(2) | | 8,000 | | 8,280 | |
| | | | | |
All Other Fees(3) | | 0 | | 0 | |
| | | | | |
Total | | $ | 19,360 | | $ | 21,030 | |
* For the period from commencement of operations on May 31, 2006 to October 31, 2006
Eaton Vance Structured Emerging Markets Fund
Fiscal Years Ended | | 10/31/06* | | 10/31/07 | |
| | | | | |
Audit Fees | | $ | 73,400 | | $ | 70,000 | |
| | | | | |
Audit-Related Fees(1) | | 0 | | 0 | |
| | | | | |
Tax Fees(2) | | 14,050 | | 11,000 | |
| | | | | |
All Other Fees(3) | | 0 | | 0 | |
| | | | | |
Total | | $ | 87,450 | | $ | 81,000 | |
Eaton Vance Cash Management Fund
Fiscal Years Ended | | 12/31/2005 | | 12/31/2006 | | 1/1/2007–10/31/2007 | |
| | | | | | | |
Audit Fees | | $ | 10,900 | | $ | 11,900 | | $ | 15,000 | |
| | | | | | | |
Audit-Related fees (1) | | 0 | | $ | 0 | | $ | 0 | |
| | | | | | | |
Tax Fees (2) | | $ | 5,550 | | $ | 5,875 | | $ | 5,800 | |
| | | | | | | |
All Other Fees (3) | | $ | 0 | | $ | 0 | | $ | 0 | |
| | | | | | | |
Total | | $ | 16,450 | | $ | 17,775 | | $ | 20,800 | |
Eaton Vance Money Market Fund
Fiscal Years Ended | | 12/31/2005 | | 12/31/2006 | | 1/1/2007–10/31/2007 | |
| | | | | | | |
Audit Fees | | $ | 10,900 | | $ | 11,900 | | $ | 15,000 | |
| | | | | | | |
Audit-Related fees (1) | | 0 | | 0 | | $ | 0 | |
| | | | | | | |
Tax Fees (2) | | $ | 5,525 | | $ | 5,875 | | $ | 5,800 | |
| | | | | | | |
All Other Fees (3) | | 0 | | 0 | | $ | 0 | |
| | | | | | | |
Total | | $ | 16,425 | | $ | 17,775 | | $ | 20,800 | |
(1) | | Audit-related fees consist of the aggregate fees billed for assurance and related services that are reasonably related to the performance of the audit of financial statements and are not reported under the category of audit fees. |
| | |
(2) | | Tax fees consist of the aggregate fees billed for professional services rendered by the principal accountant relating to tax compliance, tax advice, and tax planning and specifically include fees for tax return preparation. |
| | |
(3) | | All other fees consist of the aggregate fees billed for products and services provided by the principal accountant other than audit, audit-related, and tax services. |
The various Series comprising the Trust have differing fiscal year ends (October 31 or December 31). The following table presents the aggregate audit, audit-related, tax, and other fees billed to all of the Series in the Trust by each Series’ respective principal accountant for the last two fiscal years of each Series. For certain Series, Pricewaterhouse Coopers was the principal accountant for the fiscal years ended 2006. During the fiscal years ended 2007, Pricewaterhouse Coopers was replaced by D&T.
Fiscal Years | | 12/31/05 | | 10/31/06 | | 12/31/06 | | 10/31/07 | |
Ended | | PWC | | D&T | | PWC | | D&T | | PWC | | D&T | | PWC | | D&T | |
| | | | | | | | | | | | | | | | | |
Audit Fees | | $ | 74,200 | | $ | 22,670 | | $ | 0 | | $ | 43,070 | | $ | 74,200 | | $ | 22,670 | | $ | 0 | | $ | 43,070 | |
| | | | | | | | | | | | | | | | | |
Audit-Related Fees(1) | | 0 | | 0 | | 0 | | 0 | | 0 | | 0 | | 0 | | 0 | |
| | | | | | | | | | | | | | | | | |
Tax Fees(2) | | $ | 31,500 | | $ | 11,550 | | 0 | | $ | 19,290 | | $ | 31,500 | | $ | 11,550 | | 0 | | $ | 19,290 | |
| | | | | | | | | | | | | | | | | |
All Other Fees(3) | | 0 | | 0 | | 0 | | 0 | | 0 | | 0 | | 0 | | 0 | |
| | | | | | | | | | | | | | | | | |
Total | | $ | 105,700 | | $ | 34,220 | | $ | 0 | | $ | 62,360 | | $ | 105,700 | | $ | 34,220 | | $ | 0 | | $ | 62,360 | |
(1) | | Audit-related fees consist of the aggregate fees billed for assurance and related services that are reasonably related to the performance of the audit of financial statements and are not reported under the category of audit fees. |
| | |
(2) | | Tax fees consist of the aggregate fees billed for professional services rendered by the principal accountant relating to tax compliance, tax advice, and tax planning and specifically include fees for tax return preparation. |
| | |
(3) | | All other fees consist of the aggregate fees billed for products and services provided by the principal accountant other than audit, audit-related, and tax services. |
During the Funds’ fiscal years ended October 31, 2006 and October 31, 2007, $35,000 was billed for each such fiscal year by D&T, the principal accountant for certain funds, for work done in connection with its Rule 17Ad-13 examination of Eaton Vance Management’s assertion that it has maintained an effective internal control structure over the sub-transfer agent and registrar functions, such services being pre-approved in accordance with Rule 2-01(c) (7) (ii) of Regulation S-X.
(e)(1) The registrant’s audit committee has adopted policies and procedures relating to the pre-approval of services provided by the registrant’s principal accountant (the “Pre-Approval Policies”). The Pre-Approval Policies establish a framework intended to assist the audit committee in the proper discharge of its pre-approval responsibilities. As a general matter, the Pre-Approval Policies (i) specify certain types of audit, audit-related, tax, and other services determined to be pre-approved by the audit committee; and (ii) delineate specific procedures governing the mechanics of the pre-approval process, including the approval and monitoring of audit and non-audit service fees. Unless a service is specifically pre-approved under the Pre-Approval Policies, it must be separately pre-approved by the audit committee.
The Pre-Approval Policies and the types of audit and non-audit services pre-approved therein must be reviewed and ratified by the registrant’s audit committee at least annually. The registrant’s audit
committee maintains full responsibility for the appointment, compensation, and oversight of the work of the registrant’s principal accountant.
(e)(2) No services described in paragraphs (b)-(d) above were approved by the registrant’s audit committee pursuant to the “de minimis exception” set forth in Rule 2-01(c)(7)(i)(C) of Regulation S-X.
(f) Not applicable.
(g) The following table presents (i) the aggregate non-audit fees (i.e., fees for audit-related, tax, and other services) billed for services rendered to all of the Series in the Trust by each Series’s respective principal accountant for the last two fiscal years of each Series; and (ii) the aggregate non-audit fees (i.e., fees for audit-related, tax, and other services) billed to the Eaton Vance organization by each Series’ respective principal accountant for the last 2 fiscal years of each Series. For the fiscal years ended 2006, for certain Series, Pricewaterhouse Coopers was replaced by D&T.
Fiscal | | | | | | | | | | | | | | | | | |
Years | | 12/31/05 | | 10/31/06 | | 12/31/06 | | 10/31/07 | |
Ended | | PWC | | D&T | | PWC | | D&T | | PWC | | D&T | | PWC | | D&T | |
| | | | | | | | | | | | | | | | | |
Registrant(1) | | $ | 31,500 | | $ | 11,550 | | $ | 0 | | $ | 19,290 | | $ | 31,500 | | $ | 11,550 | | $ | 0 | | $ | 19,290 | |
| | | | | | | | | | | | | | | | | |
Eaton Vance(2) | | $ | 83,416 | | $ | 42,100 | | $ | 68,486 | | $ | 72,100 | | $ | 83,416 | | $ | 42,100 | | $ | 68,486 | | $ | 72,100 | |
(1) | | Includes all of the Series of the Trust. During the fiscal years reported above, certain of the Funds were “feeder” funds in a “master-feeder” fund structure or funds of funds. |
| | |
(2) | | Various subsidiaries of Eaton Vance Corp. act in either an investment advisory and/or service provider capacity with respect to the Series and/or their respective “master” funds (if applicable). |
(h) The registrant’s audit committee has considered whether the provision by the registrant’s principal accountant of non-audit services to the registrant’s investment adviser and any entity controlling, controlled by, or under common control with the adviser that provides ongoing services to the registrant that were not pre-approved pursuant to Rule 2-01(c)(7)(ii) of Regulation S-X is compatible with maintaining the principal accountant’s independence.
Item 5. Audit Committee of Listed registrants
Not required in this filing.
Item 6. Schedule of Investments
Please see schedule of investments contained in the Report to Stockholders included under Item 1 of this Form N-CSR.
Item 7. Disclosure of Proxy Voting Policies and Procedures for Closed-End Management Investment Companies
Not required in this filing.
Item 8. Portfolio Managers of Closed-End Management Investment Companies
Not required in this filing.
Item 9. Purchases of Equity Securities by Closed-End Management Investment Company and Affiliated Purchasers.
Not required in this filing.
Item 10. Submission of Matters to a Vote of Security Holders.
No Material Changes.
Item 11. Controls and Procedures
(a) It is the conclusion of the registrant’s principal executive officer and principal financial officer that the effectiveness of the registrant’s current disclosure controls and procedures (such disclosure controls and procedures having been evaluated within 90 days of the date of this filing) provide reasonable assurance that the information required to be disclosed by the registrant has been recorded, processed, summarized and reported within the time period specified in the Commission’s rules and forms and that the information required to be disclosed by the registrant has been accumulated and communicated to the registrant’s principal executive officer and principal financial officer in order to allow timely decisions regarding required disclosure.
(b) There have been no changes in the registrant’s internal controls over financial reporting during the second fiscal quarter of the period covered by this report that has materially affected, or is reasonably likely to materially affect, the registrant’s internal control over financial reporting.
Item 12. Exhibits
(a)(1) | | Registrant’s Code of Ethics – Not applicable (please see Item 2). |
(a)(2)(i) | | Treasurer’s Section 302 certification. |
(a)(2)(ii) | | President’s Section 302 certification. |
(b) | | Combined Section 906 certification. |
Signatures
Pursuant to the requirements of the Securities Exchange Act of 1934 and the Investment Company Act of 1940, the registrant has duly caused this report to be signed on its behalf by the undersigned, thereunto duly authorized. |
|
Eaton Vance Mutual Funds Trust |
|
|
By: | | /s/ Thomas E. Faust Jr. | |
| | Thomas E. Faust Jr. |
| | President |
| | |
| | |
Date: | | December 11, 2007 | |
| | | |
Pursuant to the requirements of the Securities Exchange Act of 1934 and the Investment Company Act of 1940, this report has been signed below by the following persons on behalf of the registrant and in the capacities and on the dates indicated. |
|
|
By: | | /s/ Barbara E. Campbell | |
| | Barbara E. Campbell |
| | Treasurer |
| | |
| | |
Date: | | December 11, 2007 | |
| | | |
| | | |
By: | | /s/ Thomas E. Faust Jr. | |
| | Thomas E. Faust Jr. |
| | President |
| | |
| | |
Date: | | December 11, 2007 | |