UNITED STATES
SECURITIES AND EXCHANGE COMMISSION
Washington, D.C. 20549
Form N-CSR
CERTIFIED SHAREHOLDER REPORT OF REGISTERED
MANAGEMENT INVESTMENT COMPANIES
Investment Company Act File Number: 811-04015
Eaton Vance Mutual Funds Trust
(Exact Name of registrant as Specified in Charter)
The Eaton Vance Building, 255 State Street, Boston, Massachusetts 02109
(Address of Principal Executive Offices)
Alan R. Dynner
The Eaton Vance Building, 255 State Street, Boston, Massachusetts 02109
(Name and Address of Agent for Services)
(617) 482-8260
(registrant’s Telephone Number)
December 31
Date of Fiscal Year End
December 31, 2006
Date of Reporting Period
Item 1. Reports to Stockholders

Annual Report December 31, 2006


EATON VANCE
COMBINED
MONEY
MARKET
FUNDS
Cash Management Fund
Money Market Fund
IMPORTANT NOTICES REGARDING PRIVACY,
DELIVERY OF SHAREHOLDER DOCUMENTS,
PORTFOLIO HOLDINGS, AND PROXY VOTING
Privacy. The Eaton Vance organization is committed to ensuring your financial privacy. Each of the financial institutions identified below has in effect the following policy ("Privacy Policy") with respect to nonpublic personal information about its customers:
• Only such information received from you, through application forms or otherwise, and information about your Eaton Vance fund transactions will be collected. This may include information such as name, address, social security number, tax status, account balances and transactions.
• None of such information about you (or former customers) will be disclosed to anyone, except as permitted by law (which includes disclosure to employees necessary to service your account). In the normal course of servicing a customer's account, Eaton Vance may share information with unaffiliated third parties that perform various required services such as transfer agents, custodians and broker/dealers.
• Policies and procedures (including physical, electronic and procedural safeguards) are in place that are designed to protect the confidentiality of such information.
• We reserve the right to change our Privacy Policy at any time upon proper notification to you. Customers may want to review our Policy periodically for changes by accessing the link on our homepage: www.eatonvance.com.
Our pledge of privacy applies to the following entities within the Eaton Vance organization: the Eaton Vance Family of Funds, Eaton Vance Management, Eaton Vance Investment Counsel, Boston Management and Research, and Eaton Vance Distributors, Inc.
In addition, our Privacy Policy only applies to those Eaton Vance customers who are individuals and who have a direct relationship with us. If a customer's account (i.e., fund shares) is held in the name of a third-party financial adviser/broker-dealer, it is likely that only such adviser's privacy policies apply to the customer. This notice supersedes all previously issued privacy disclosures.
For more information about Eaton Vance's Privacy Policy, please call 1-800-262-1122.
Delivery of Shareholder Documents. The Securities and Exchange Commission (the "SEC") permits funds to deliver only one copy of shareholder documents, including prospectuses, proxy statements and shareholder reports, to fund investors with multiple accounts at the same residential or post office box address. This practice is often called "householding" and it helps eliminate duplicate mailings to shareholders.
Eaton Vance, or your financial adviser, may household the mailing of your documents indefinitely unless you instruct Eaton Vance, or your financial adviser, otherwise.
If you would prefer that your Eaton Vance documents not be householded, please contact Eaton Vance at 1-800-262-1122, or contact your financial adviser.
Your instructions that householding not apply to delivery of your Eaton Vance documents will be effective within 30 days of receipt by Eaton Vance or your financial adviser.
Portfolio Holdings. Each Eaton Vance Fund and its underlying Portfolio (if applicable) will file a schedule of its portfolio holdings on Form N-Q with the SEC for the first and third quarters of each fiscal year. The Form N-Q will be available on the Eaton Vance website www.eatonvance.com, by calling Eaton Vance at 1-800-262-1122 or in the EDGAR database on the SEC's website at www.sec.gov. Form N-Q may also be reviewed and copied at the SEC's public reference room in Washington, D.C. (call 1-800-732-0330 for information on the operation of the public reference room).
Proxy Voting. From time to time, funds are required to vote proxies related to the securities held by the funds. The Eaton Vance Funds or their underlying Portfolios (if applicable) vote proxies according to a set of policies and procedures approved by the Funds' and Portfolios' Boards. You may obtain a description of these policies and procedures and information on how the Funds or Portfolios voted proxies relating to portfolio securities during the most recent 12 month period ended June 30, without charge, upon request, by calling 1-800-262-1122. This description is also available on the SEC's website at www.sec.gov.
Eaton Vance Money Market Funds as of December 31, 2006
MANAGEMENT’S DISCUSSION OF FUND PERFORMANCE

|
Elizabeth S. Kenyon, CFA |
Portfolio Manager |
Investment Environment
· During 2006, the U.S. economy grew at a solid pace, with low to moderate inflation. U.S. Gross Domestic Product (GDP), the primary indicator of growth, expanded at a robust 5.6% annualized rate in the first quarter of 2006, 2.6% in the second quarter, 2.0% in the third quarter and an estimated 3.5% in the fourth quarter. Unemployment moved lower to 4.5% in December 2006 from 4.9% a year earlier.
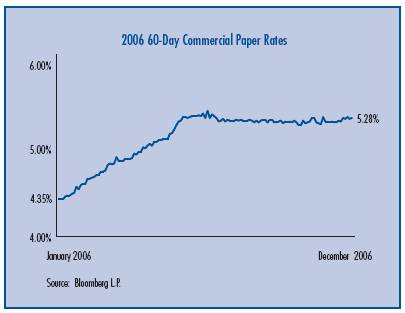
· At its June 2006 meeting, the Federal Reserve Board (the Fed) increased the Fed Funds target rate, a key short-term interest rate benchmark, by 25 basis points (0.25%). This was the Fed’s 17th consecutive increase since June 2004, and it brought the Fed Funds target rate to 5.25%. Since June 2006, the Fed has held short rates steady, awaiting further economic inputs to determine the future direction of interest rate moves.
· In past cycles, as the Fed has moved short-term interest rates higher, market forces have pushed intermediate and long-term bond yields higher as well. During the past year, however, yields on longer-term bonds did not rise as much as those on short-term bonds, creating an “inverted” yield curve, in which longer-term bond yields were lower than short-term bond yields at December 31, 2006 (the yield curve is a graphical depiction of bond yields across all maturities). This situation was beneficial for investors in shorter-maturity bonds.
The Cash Management Portfolio
· At December 31, 2006, Cash Management Portfolio — in which the Funds invest their assets — had 97.3% of its net assets invested in high-quality commercial paper, a highly liquid type of security in which money market funds commonly invest.(1) The Portfolio also invests in high-quality U.S. Government agency securities and other short-term investments such as bank time deposits.
· During the year ended December 31, 2006, shareholders of Eaton Vance Cash Management Fund and Eaton Vance Money Market Fund received $0.043 and $0.033 per share, respectively, in income dividends. Eaton Vance Cash Management Fund and Eaton Vance Money Market Fund had total returns of 4.40% and 3.32%, respectively, during the same period.(2)
· During the year, management maintained a relatively short weighted average maturity in the Portfolio to provide flexibility for interest rate increases, enabling it to reinvest more quickly and helping to increase each Fund’s income stream.
(1) An investment in one of the money market funds is neither insured nor guaranteed by the U.S. Government. Although the Funds seek to maintain a stable net asset value of $1.00 per share, it is possible to lose money by investing in a Fund.
(2) Past performance is no guarantee of future results. Returns are historical and are calculated by determining the percentage change in net asset value with all distributions reinvested. There is no sales charge.
Asset Allocation*
By net assets
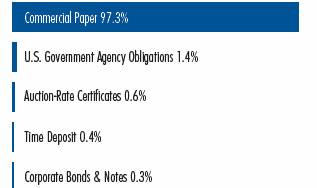
* Asset Allocation information may not be representative of the current or future investments and may change due to active management.
Fund shares are not insured by the FDIC and are not deposits or other obligations of, or guaranteed by, any depository institution. Shares are subject to investment risks, including possible loss of principal invested.
The views expressed in this report are those of the portfolio manager and are current only through the end of the period of the report as stated on the cover. These views are subject to change at any time based upon market or other conditions, and the investment adviser disclaims any responsibility to update such views. These views may not be relied on as investment advice and, because investment decisions for a fund are based on many factors, may not be relied on as an indication of trading intent on behalf of any Eaton Vance fund.
1
Eaton Vance Money Market Funds as of December 31, 2006
FUND EXPENSES
Example: As a shareholder of a Fund, you incur two types of costs: (1) transaction costs, including sales charges (loads) on purchases and redemption fees (if applicable); and (2) ongoing costs, including management fees; distribution or service fees; and other Fund expenses. This Example is intended to help you understand your ongoing costs (in dollars) of investing in a Fund and to compare these costs with the ongoing costs of investing in other mutual funds. The Example is based on an investment of $1,000 invested at the beginning of the period and held for the entire period (July 1, 2006 – December 31, 2006).
Actual Expenses: The first section of each table below provides information about actual account values and actual expenses. You may use the information in this section, together with the amount you invested, to estimate the expenses that you paid over the period. Simply divide your account value by $1,000 (for example, an $8,600 account value divided by $1,000 = 8.6), then multiply the result by the number in the first section under the heading entitled "Expenses Paid During Period" to estimate the expenses you paid on your account during this period.
Hypothetical Example for Comparison Purposes: The second section of each table below provides information about hypothetical account values and hypothetical expenses based on the actual Fund expense ratio and an assumed rate of return of 5% per year (before expenses), which is not the actual return of the Fund. The hypothetical account values and expenses may not be used to estimate the actual ending account balance or expenses you paid for the period. You may use this information to compare the ongoing costs of investing in your Fund and other funds. To do so, compare this 5% hypothetical example with the 5% hypothetical examples that appear in the shareholder reports of the other funds.
Please note that the expenses shown in the tables are meant to highlight your ongoing costs only and do not reflect any transactional costs, such as sales charges (loads) or redemption fees (if applicable). Therefore, the second section of each table is useful in comparing ongoing costs only, and will not help you determine the relative total costs of owning different funds. In addition, if these transactional costs were included, your costs would have been higher.
Eaton Vance Cash Management Fund
| | | Beginning Account Value
(7/1/06) | | Ending Account Value
(12/31/06) | | Expenses Paid During Period*
(7/1/06 – 12/31/06) | |
| Actual | | $ | 1,000.00 | | | $ | 1,023.60 | | | $ | 3.72 | | |
| Hypothetical | |
| (5% return per year before expenses) | | $ | 1,000.00 | | | $ | 1,021.50 | | | $ | 3.72 | | |
* Expenses are equal to the Fund's annualized expense ratio of 0.73% multiplied by the average account value over the period, multiplied by 184/365 (to reflect the one-half year period). The example assumes that the $1,000 was invested at the net asset value per share determined at the close of business on June 30, 2006. The example reflects the expenses of both the Fund and the Portfolio.
Eaton Vance Money Market Fund
| | | Beginning Account Value
(7/1/06) | | Ending Account Value
(12/31/06) | | Expenses Paid During Period*
(7/1/06 – 12/31/06) | |
| Actual | | $ | 1,000.00 | | | $ | 1,018.40 | | | $ | 8.90 | | |
| Hypothetical | |
| (5% return per year before expenses) | | $ | 1,000.00 | | | $ | 1,016.40 | | | $ | 8.89 | | |
* Expenses are equal to the Fund's annualized expense ratio of 1.75% multiplied by the average account value over the period, multiplied by 184/365 (to reflect the one-half year period). The example assumes that the $1,000 was invested at the net asset value per share determined at the close of business on June 30, 2006. The example reflects the expenses of both the Fund and the Portfolio.
2
Eaton Vance Money Market Funds as of December 31, 2006
FINANCIAL STATEMENTS
Statements of Assets and Liabilities
As of December 31, 2006
| | | Cash
Management Fund | | Money
Market Fund | |
| Assets | |
| Investments in Cash Management Portfolio, at value | | $ | 120,417,086 | | | $ | 42,439,987 | | |
| Receivable for Fund shares sold | | | 293,512 | | | | 48,549 | | |
| Total assets | | $ | 120,710,598 | | | $ | 42,488,536 | | |
| Liabilities | |
| Payable for Fund shares redeemed | | $ | 586,301 | | | $ | 275,944 | | |
| Dividends payable | | | 103,556 | | | | 26,490 | | |
| Payable to affiliate for Trustees' fees | | | 439 | | | | 42 | | |
| Payable to affiliate for distribution and service fees | | | — | | | | 42,058 | | |
| Accrued expenses | | | 37,348 | | | | 46,388 | | |
| Total liabilities | | $ | 727,644 | | | $ | 390,922 | | |
| Net Assets | | $ | 119,982,954 | | | $ | 42,097,614 | | |
| Sources of Net Assets | |
| Paid-in capital | | $ | 119,978,442 | | | $ | 42,097,712 | | |
| Accumulated net realized loss (computed on the basis of identified cost) | | | (307 | ) | | | (181 | ) | |
| Accumulated undistributed net investment income | | | 4,819 | | | | 83 | | |
| Total | | $ | 119,982,954 | | | $ | 42,097,614 | | |
| Shares of Beneficial Interest Outstanding | |
| | | | 119,983,098 | | | | 42,097,698 | | |
Net Asset Value, Offering Price and
Redemption Price Per Share | |
| (net assets ÷ shares of beneficial interest outstanding) | | $ | 1.00 | | | $ | 1.00 | | |
See notes to financial statements
3
Eaton Vance Money Market Funds as of December 31, 2006
FINANCIAL STATEMENTS CONT'D
Statements of Operations
For the Year Ended December 31, 2006
| | | Cash
Management Fund | | Money
Market Fund | |
| Investment Income | |
| Interest allocated from Portfolio | | $ | 4,370,009 | | | $ | 2,342,947 | | |
| Expenses allocated from Portfolio | | | (508,896 | ) | | | (272,196 | ) | |
| Total investment income from Portfolio | | $ | 3,861,113 | | | $ | 2,070,751 | | |
| Expenses | |
| Trustees' fees and expenses | | $ | 1,698 | | | $ | 539 | | |
| Distribution and service fees | | | — | | | | 404,131 | | |
| Legal and accounting services | | | 20,402 | | | | 20,076 | | |
| Printing and postage | | | 9,448 | | | | 9,854 | | |
| Custodian fee | | | 16,397 | | | | 11,154 | | |
| Transfer and dividend disbursing agent fees | | | 55,829 | | | | 66,893 | | |
| Registration fees | | | 30,736 | | | | 37,632 | | |
| Miscellaneous | | | 1,846 | | | | 3,135 | | |
| Total expenses | | $ | 136,356 | | | $ | 553,414 | | |
| Net investment income | | $ | 3,724,757 | | | $ | 1,517,337 | | |
| Realized and Unrealized Gain (Loss) from Portfolio | |
| Net realized gain (loss) — | |
| Investment transactions (identified cost basis) | | $ | (197 | ) | | $ | (113 | ) | |
| Increase from payments by affiliate | | | 35 | | | | 18 | | |
| Net loss realized on the disposal of investments which did not meet the Portfolio's investment guidelines | | | (35 | ) | | | (18 | ) | |
| Net realized loss | | $ | (197 | ) | | $ | (113 | ) | |
| Net increase in net assets from operations | | $ | 3,724,560 | | | $ | 1,517,224 | | |
See notes to financial statements
4
Eaton Vance Money Market Funds as of December 31, 2006
FINANCIAL STATEMENTS CONT'D
Statements of Changes in Net Assets
For the Year Ended December 31, 2006
| Increase (Decrease) in Net Assets | | Cash
Management Fund | | Money
Market Fund | |
| From operations — | |
| Net investment income | | $ | 3,724,757 | | | $ | 1,517,337 | | |
Net realized loss from investment transactions, payments by
affiliate and the disposal of investments which did not meet the
Portfolio's investment guidelines | | | (197 | ) | | | (113 | ) | |
| Net increase in net assets from operations | | $ | 3,724,560 | | | $ | 1,517,224 | | |
| Distributions to shareholders — | |
| From net investment income | | $ | (3,724,704 | ) | | $ | (1,517,308 | ) | |
| Total distributions to shareholders | | $ | (3,724,704 | ) | | $ | (1,517,308 | ) | |
| Transactions in shares of beneficial interest at Net Asset Value of $1.00 per share — | |
| Proceeds from sale of shares | | $ | 164,749,685 | | | $ | 41,881,817 | | |
| Net asset value of shares issued to shareholders in payment of distributions declared | | | 2,345,894 | | | | 1,198,865 | | |
| Cost of shares redeemed | | | (142,081,892 | ) | | | (49,322,436 | ) | |
| Net increase (decrease) in net assets from Fund share transactions | | $ | 25,013,687 | | | $ | (6,241,754 | ) | |
| Net increase (decrease) in net assets | | $ | 25,013,543 | | | $ | (6,241,838 | ) | |
| Net Assets | |
| At beginning of year | | $ | 94,969,411 | | | $ | 48,339,452 | | |
| At end of year | | $ | 119,982,954 | | | $ | 42,097,614 | | |
See notes to financial statements
5
Eaton Vance Money Market Funds as of December 31, 2006
FINANCIAL STATEMENTS CONT'D
Statements of Changes in Net Assets
For the Year Ended December 31, 2005
| Increase (Decrease) in Net Assets | | Cash
Management Fund | | Money
Market Fund | |
| From operations — | |
| Net investment income | | $ | 2,239,721 | | | $ | 788,564 | | |
Net realized loss from investment transactions, payment by
affiliate and the disposal of an investment which did not meet the
Portfolio's investment guidelines | | | (86 | ) | | | (54 | ) | |
| Net increase in net assets from operations | | $ | 2,239,635 | | | $ | 788,510 | | |
| Distributions to shareholders — | |
| From net investment income | | $ | (2,239,635 | ) | | $ | (788,510 | ) | |
| Total distributions to shareholders | | $ | (2,239,635 | ) | | $ | (788,510 | ) | |
| Transactions in shares of beneficial interest at Net Asset Value of $1.00 per share — | |
| Proceeds from sale of shares | | $ | 138,809,354 | | | $ | 43,940,101 | | |
| Net asset value of shares issued to shareholders in payment of distributions declared | | | 1,366,207 | | | | 637,780 | | |
| Cost of shares redeemed | | | (143,371,207 | ) | | | (64,123,257 | ) | |
| Net decrease in net assets from Fund share transactions | | $ | (3,195,646 | ) | | $ | (19,545,376 | ) | |
| Net decrease in net assets | | $ | (3,195,646 | ) | | $ | (19,545,376 | ) | |
| Net Assets | |
| At beginning of year | | $ | 98,165,057 | | | $ | 67,884,828 | | |
| At end of year | | $ | 94,969,411 | | | $ | 48,339,452 | | |
See notes to financial statements
6
Eaton Vance Money Market Funds as of December 31, 2006
FINANCIAL STATEMENTS CONT'D
Financial Highlights
| | | Cash Management Fund | |
| | | Year Ended December 31, | |
| | | 2006 | | 2005 | | 2004 | | 2003 | | 2002 | |
| Net asset value — Beginning of year | | $ | 1.000 | | | $ | 1.000 | | | $ | 1.000 | | | $ | 1.000 | | | $ | 1.000 | | |
| Income (loss) from operations | |
| Net investment income | | $ | 0.043 | | | $ | 0.024 | | | $ | 0.006 | | | $ | 0.005 | | | $ | 0.010 | | |
| Less distributions | |
| From net investment income | | $ | (0.043 | ) | | $ | (0.024 | ) | | $ | (0.006 | ) | | $ | (0.005 | ) | | $ | (0.010 | ) | |
| Total distributions | | $ | (0.043 | ) | | $ | (0.024 | ) | | $ | (0.006 | ) | | $ | (0.005 | ) | | $ | (0.010 | ) | |
| Net asset value — End of year | | $ | 1.000 | | | $ | 1.000 | | | $ | 1.000 | | | $ | 1.000 | | | $ | 1.000 | | |
| Total Return(1) | | | 4.40 | %(2) | | | 2.48 | %(2) | | | 0.60 | % | | | 0.48 | % | | | 1.02 | % | |
| Ratios/Supplemental Data | |
| Net assets, end of year (000's omitted) | | $ | 119,983 | | | $ | 94,969 | | | $ | 98,165 | | | $ | 101,364 | | | $ | 111,741 | | |
| Ratios (As a percentage of average daily net assets): | |
| Expenses before custodian fee reduction(3) | | | 0.75 | % | | | 0.80 | % | | | 0.79 | % | | | 0.68 | % | | | 0.79 | % | |
| Expenses after custodian fee reduction(3) | | | 0.75 | % | | | 0.80 | % | | | 0.79 | % | | | 0.68 | % | | | 0.79 | % | |
| Net investment income | | | 4.32 | % | | | 2.46 | % | | | 0.60 | % | | | 0.47 | % | | | 1.02 | % | |
(1) Returns are historical and are calculated by determining the percentage change in net asset value with all distributions reinvested. Total return is not computed on an annualized basis.
(2) During the years ended December 31, 2006 and December 31, 2005, the investment adviser reimbursed the Fund, through its investment in the Portfolio, for net losses realized on the disposal of investments which did not meet the Portfolio's investment guidelines. The reimbursement was less than $0.01 per share and had no effect on total return for the years ended December 31, 2006 and December 31, 2005.
(3) Includes the Fund's share of the Portfolio's allocated expenses.
See notes to financial statements
7
Eaton Vance Money Market Funds as of December 31, 2006
FINANCIAL STATEMENTS CONT'D
Financial Highlights
| | | Money Market Fund | |
| | | Year Ended December 31, | |
| | | 2006 | | 2005 | | 2004 | | 2003 | | 2002 | |
| Net asset value — Beginning of year | | $ | 1.000 | | | $ | 1.000 | | | $ | 1.000 | | | $ | 1.000 | | | $ | 1.000 | | |
| Income (loss) from operations | |
| Net investment income | | $ | 0.033 | | | $ | 0.014 | | | $ | 0.001 | | | $ | — | | | $ | 0.002 | | |
| Less distributions | |
| From net investment income | | $ | (0.033 | ) | | $ | (0.014 | ) | | $ | (0.001 | ) | | $ | — | | | $ | (0.002 | ) | |
| Total distributions | | $ | (0.033 | ) | | $ | (0.014 | ) | | $ | (0.001 | ) | | $ | — | | | $ | (0.002 | ) | |
| Net asset value — End of year | | $ | 1.000 | | | $ | 1.000 | | | $ | 1.000 | | | $ | 1.000 | | | $ | 1.000 | | |
| Total Return(1) | | | 3.32 | %(2) | | | 1.45 | %(2) | | | 0.05 | % | | | 0.00 | % | | | 0.19 | % | |
| Ratios/Supplemental Data | |
| Net assets, end of year (000's omitted) | | $ | 42,098 | | | $ | 48,339 | | | $ | 67,885 | | | $ | 100,241 | | | $ | 158,719 | | |
| Ratios (As a percentage of average daily net assets): | |
| Expenses before custodian fee reduction(3) | | | 1.80 | % | | | 1.82 | % | | | 1.31 | %(4) | | | 1.17 | %(4) | | | 1.61 | %(4) | |
| Expenses after custodian fee reduction(3) | | | 1.80 | % | | | 1.82 | % | | | 1.31 | %(4) | | | 1.17 | %(4) | | | 1.61 | %(4) | |
| Net investment income | | | 3.30 | % | | | 1.40 | % | | | 0.04 | % | | | 0.00 | % | | | 0.20 | % | |
(1) Returns are historical and are calculated by determining the percentage change in net asset value with all distributions reinvested. Total return is not computed on an annualized basis. Total return would have been lower had certain expenses not been reduced during the periods shown.
(2) During the years ended December 31, 2006 and December 31, 2005, the investment adviser reimbursed the Fund, through its investment in the Portfolio, for net losses realized on the disposal of investments which did not meet the Portfolio's investment guidelines. The reimbursement was less than $0.01 per share and had no effect on total return for the years ended December 31, 2006 and December 31, 2005.
(3) Includes the Fund's share of the Portfolio's allocated expenses.
(4) The principal underwriter voluntarily waived a portion of its distribution fee and the administrator subsidized certain operating expenses (equal to 0.40%, 0.49% and less than 0.01% of average daily net assets for 2004, 2003 and 2002, respectively).
See notes to financial statements
8
Eaton Vance Money Market Funds as of December 31, 2006
NOTES TO FINANCIAL STATEMENTS
1 Significant Accounting Policies
Eaton Vance Cash Management Fund (Cash Management Fund) and Eaton Vance Money Market Fund (Money Market Fund) (individually, the Fund, collectively the Funds) are each diversified series of Eaton Vance Mutual Funds Trust (the Trust). The Trust is an entity of the type commonly known as a Massachusetts business trust and is registered under the Investment Company Act of 1940, as amended, as an open-end management investment company. The Funds invest all of their investable assets in interests in the Cash Management Portfolio (the Portfolio), a New York Trust, having the same investment objective as the Funds. The value of each Fund's investment in the Portfolio reflects each Fund's proportionate interest in the net assets of the Portfolio (9.3% for Cash Management Fund and 3.3% for Money Market Fund at December 31, 2006). The performance of each Fund is directly affected by the performance of the Portfolio. The financial statemen ts of the Portfolio, including the portfolio of investments, are included elsewhere in this report and should be read in conjunction with each of the Fund's financial statements. The following is a summary of significant accounting policies consistently followed by the Funds in the preparation of their financial statements. The policies are in conformity with accounting principles generally accepted in the United States of America.
A Investment Valuation — Valuation of securities by the Portfolio is discussed in Note 1A of the Portfolio's Notes to Financial Statements, which are included elsewhere in this report.
B Income — The Fund's net investment income consists of the Fund's pro rata share of the net investment income of the Portfolio, less all actual and accrued expenses of each Fund.
C Federal Taxes — Each Fund's policy is to comply with the provisions of the Internal Revenue Code applicable to regulated investment companies and to distribute to shareholders, each year, substantially all of its net investment income and all or substantially all of its net realized capital gains. Accordingly, no provision for federal income or excise tax is necessary. At December 31, 2006, the Funds, for federal income tax purposes, had capital loss carryovers which will reduce taxable income arising from future net realized gain on investments, if any, to the extent permitted by the Internal Revenue Code, and thus will reduce the amount of distributions to shareholders which would otherwise be necessary to relieve the Funds of any liability for federal income or excis e tax. The amounts and expiration dates of the capital loss carryovers are as follows:
| Fund | | Amount | | Expires | |
| Cash Management | | $ | 5 | | | December 31, 2010 | |
|
| | | | 20 | | | December 31, 2011 | |
|
| | | | 85 | | | December 31, 2013 | |
|
| | | | 197 | | | December 31, 2014 | |
|
| Money Market | | | 10 | | | December 31, 2010 | |
|
| | | | 5 | | | December 31, 2011 | |
|
| | | | 53 | | | December 31, 2013 | |
|
| | | | 113 | | | December 31, 2014 | |
|
D Expenses — The majority of expenses of the Trust are directly identifiable to an individual fund. Expenses which are not readily identifiable to a specific fund are allocated taking into consideration, among other things, the nature and type of expense and the relative size of the funds.
E Expense Reduction — Investors Bank & Trust Company (IBT) serves as custodian to the Funds. Pursuant to the respective custodian agreements, IBT receives a fee reduced by credits which are determined based on the average daily cash balance each respective Fund maintains with IBT. All credit balances used to reduce the Funds' custodian fees are reported as a reduction of expenses in the Statement of Operations.
F Use of Estimates — The preparation of the financial statements in conformity with accounting principles generally accepted in the United States of America requires management to make estimates and assumptions that affect the reported amounts of assets and liabilities at the date of the financial statements and the reported amounts of income and expense during the reporting period. Actual results could differ from those estimates.
G Indemnifications — Under the Trust's organizational documents, its officers and Trustees may be indemnified against certain liabilities and expenses arising out of the performance of their duties to the Funds, and shareholders are indemnified against personal liability for obligations of the Trust. Additionally, in the normal course of business, the Funds enter into agreements with service providers that may contain indemnification clauses. The Funds' maximum exposure under these arrangements is unknown as this would involve future claims that may be made against the Funds that have not yet occurred.
Eaton Vance Money Market Funds as of December 31, 2006
NOTES TO FINANCIAL STATEMENTS CONT'D
H Other — Investment transactions are accounted for on a trade-date basis.
2 Distributions to Shareholders
The net investment income of each Fund is determined daily, and substantially all of the net investment income so determined is declared daily as a dividend to shareholders of record at the time of declaration. Distributions are paid monthly. Distributions are paid in the form of additional shares or, at the election of the shareholder, in cash.
The Funds distinguish between distributions on a tax basis and a financial reporting basis. Accounting principles generally accepted in the United States of America require that only distributions in excess of tax basis earnings and profits be reported in the financial statements as a return of capital. Permanent differences between book and tax accounting relating to distributions are reclassified to paid-in capital.
The tax character of distributions declared for the years ended December 31, 2006 and December 31, 2005 was as follows:
| Year Ended December 31, 2006 | | Cash
Management Fund | | Money
Market Fund | |
| Distributions declared from: | |
| Ordinary Income | | $ | 3,724,704 | | | $ | 1,517,308 | | |
| Year Ended December 31, 2005 | |
| Distributions declared from: | |
| Ordinary Income | | $ | 2,239,635 | | | $ | 788,510 | | |
As of December 31, 2006, the components of distributable earnings (accumulated losses) on a tax basis were as follows:
| | | Cash
Management Fund | | Money
Market Fund | |
| Undistributed income | | $ | 4,819 | | | $ | 83 | | |
| Capital loss carryforward | | | (307 | ) | | | (181 | ) | |
3 Shares of Beneficial Interest
The Funds' Declaration of Trust permits the Trustees to issue an unlimited number of full and fractional shares of beneficial interest (without par value).
4 Transactions with Affiliates
EVM serves as the administrator of the Funds, but receives no compensation. The Portfolio has engaged Boston Management and Research (BMR), a subsidiary of EVM, to render investment advisory services. See Note 2 of the Portfolio's Notes to Financial Statements which are included elsewhere in this report. EVM serves as the sub-transfer agent of the Funds and receives from the transfer agent an aggregate fee based upon the actual expenses incurred by EVM in the performance of those services. For the year ended December 31, 2006, EVM received $4,896 and $4,763 from Cash Management Fund and Money Market Fund, respectively, in sub-transfer agent fees. Except as to Trustees of the Funds and the Portfolio who are not members of EVM's or BMR's organization, officers and Trustees receive remuneration for their services to each Fund out of such investment adviser fee. Certain officers and Trustees of the Funds and of the Portfolio are off icers of the above organizations.
5 Distribution and Service Plans
The Money Market Fund (the Fund) has in effect a distribution plan (the Plan) pursuant to Rule 12b-1 under the Investment Company Act of 1940. The Plan requires the Fund to pay the Principal Underwriter, Eaton Vance Distributors, Inc. (EVD), daily amounts equal to 1/365 of 0.75% of the Fund's average daily net assets, for providing ongoing distribution services and facilities to the Fund. The Fund will automatically discontinue payments to EVD during any period in which there are no outstanding Uncovered Distribution Charges, which are equivalent to the sum of (i) 6.25% of the aggregate amount received by the Fund for shares sold plus (ii) interest calculated by applying the rate of 1% over the prevailing prime rate to the outstanding balance of Uncovered Distribution Charges of EVD reduced by the aggregate amount of contingent deferred sales charges (Note 6) and amounts theretofore paid to EVD. The Fund paid or accrued $344,564 to or payable to EVD for the year ended December 31, 2006, representing 0.75% of the Fund's average daily net assets. At December 31, 2006, the amount of Uncovered Distribution Charges of EVD calculated under the Plan was approximately $11,913,000. The Plan also authorizes the Fund to make payments of service fees to EVD, investment dealers and other persons in amounts not exceeding 0.25% annually of the Fund's average daily net assets. The Trustees approved service fee payments equal to 0.15% annually of the Fund's average daily net assets of shares outstanding for one year or more. Service fees are paid for personal services and/or the maintenance of shareholder accounts. They are separate and distinct from the sales commissions and
Eaton Vance Money Market Funds as of December 31, 2006
NOTES TO FINANCIAL STATEMENTS CONT'D
distribution fees and, as such, are not subject to automatic discontinuance when there are no outstanding Uncovered Distribution Charges of EVD. Service fees paid or accrued for the year ended December 31, 2006 amounted to $59,567.
Certain officers and Trustees of the Funds are officers of EVD.
6 Contingent Deferred Sales Charge (CDSC)
Shares of the Money Market Fund (other than those acquired as the result of an exchange from another Eaton Vance fund) generally are subject to a CDSC on redemptions of shares made within six years of purchase, at rates that begin at 5% in the case of redemptions in the first and second year after purchase, declining one percentage point each subsequent year. Shares of Money Market Fund and Cash Management Fund acquired as a result of an exchange from shares of another Eaton Vance Fund are subject to the original CDSC rate, if any, from the date of original purchase. Generally, the CDSC is based upon the lower of the net asset value at date of redemption or date of purchase. No charge is levied on shares acquired by reinvestment of dividends or capital gains distributions. No CDSC is levied on shares which have been sold to EVM or its affiliates or to their respective employees or clients and may be waived under certain other li mited conditions. CDSC assessed on Money Market Fund shares are paid to EVD to reduce the amount of Uncovered Distribution Charges calculated under the Fund's Distribution Plan. CDSC received from Money Market Fund shares when no Uncovered Distribution Charges exist will be credited to the Fund. EVD received approximately $10,000 and $222,000 of CDSC paid by shareholders of the Cash Management Fund and Money Market Fund, respectively, for the year ended December 31, 2006.
7 Investment Transactions
Increases and decreases in the Funds' investment in the Portfolio for the year ended December 31, 2006 were as follows:
| Cash Management Fund | |
| Increases | | $ | 164,626,975 | | |
| Decreases | | | 143,584,043 | | |
| Money Market Fund | |
| Increases | | $ | 41,933,279 | | |
| Decreases | | | 50,135,548 | | |
8 Recently Issued Accounting Pronouncements
In June 2006, the Financial Accounting Standards Board (FASB) issued FASB Interpretation No. 48, (FIN 48) "Accounting for Uncertainty in Income Taxes – an interpretation of FASB Statement No. 109". FIN 48 clarifies the accounting for uncertainty in income taxes recognized in accordance with FASB Statement No. 109, "Accounting for Income Taxes." This interpretation prescribes a recognition threshold and measurement attribute for the financial statement recognition and measurement of a tax position taken or expected to be taken in a tax return. It also provides guidance on de-recognition, classification, interest and penalties, accounting in interim periods, disclosure and transition. FIN 48 is effective during the first required financial reporting period for fiscal years beginning after December 15, 2006. Management is currently evaluating the impact of applying the various provisions of FIN 48.
In September 2006, the FASB issued Statement of Financial Accounting Standards No. 157, (FAS 157) "Fair Value Measurements". FAS 157 defines fair value, establishes a framework for measuring fair value in accordance with generally accepted accounting principles and expands disclosure about fair value measurements. FAS 157 is effective for fiscal years beginning after November 15, 2007. Management is currently evaluating the impact the adoption of FAS 157 will have on the Funds' financial statement disclosures.
Eaton Vance Money Market Funds as of December 31, 2006
REPORT OF INDEPENDENT REGISTERED PUBLIC ACCOUNTING FIRM
To the Trustees of Eaton Vance Mutual Funds Trust and Shareholders of Eaton Vance Cash Management Fund and Eaton Vance Money Market Fund:
In our opinion, the accompanying statements of assets and liabilities, and the related statements of operations and of changes in net assets and the financial highlights present fairly, in all material respects, the financial position of Eaton Vance Cash Management Fund and Eaton Vance Money Market Fund, each a series of Eaton Vance Mutual Funds Trust (the "Funds") at December 31, 2006, and the results of each of their operations, the changes in each of their net assets and the financial highlights for each of the periods presented, in conformity with accounting principles generally accepted in the United States of America. These financial statements and financial highlights (hereafter referred to as "financial statements") are the responsibility of the Funds' management; our responsibility is to express an opinion on these financial statements based on our audits. We conducted our audits of these financial statements in accorda nce with the standards of the Public Company Accounting Oversight Board (United States). Those standards require that we plan and perform the audit to obtain reasonable assurance about whether the financial statements are free of material misstatement. An audit includes examining, on a test basis, evidence supporting the amounts and disclosures in the financial statements, assessing the accounting principles used and significant estimates made by management, and evaluating the overall financial statement presentation. We believe that our audits provide a reasonable basis for our opinion.
PricewaterhouseCoopers LLP
Boston, Massachusetts
February 21, 2007
12
Eaton Vance Money Market Funds as of December 31, 2006
FEDERAL TAX INFORMATION (Unaudited)
The Form 1099-DIV you received in January 2007 showed the tax status of all distributions paid to your account in calendar 2006. Shareholders are advised to consult their own tax adviser with respect to the tax consequences of their investment in the Funds.
13
Cash Management Portfolio as of December 31, 2006
PORTFOLIO OF INVESTMENTS
| Commercial Paper — 97.3% | | | |
Principal Amount
(000's omitted) | |
Security | |
Value | |
| Automotive — 5.1% | | | |
| $ | 20,000 | | | American Honda Motor Corp., 5.26%, 1/25/07 | | $ | 19,929,867 | | |
| | 15,800 | | | American Honda Motor Corp., 5.26%, 3/19/07 | | | 15,622,241 | | |
| | 10,220 | | | American Honda Motor Corp., 5.31%, 1/26/07 | | | 10,182,314 | | |
| | 20,000 | | | Toyota Motor Credit Co., 5.26%, 1/4/07 | | | 19,991,233 | | |
| | | | | | | $ | 65,725,655 | | |
| Banks and Money Services — 64.0% | | | |
| $ | 15,000 | | | Abbey National North America, LLC, 5.27%, 1/8/07 | | $ | 14,984,629 | | |
| | 40,000 | | | Abbey National North America, LLC, 5.33%, 1/2/07 | | | 39,994,078 | | |
| | 2,650 | | | Barclays U.S. Funding, LLC, 5.25%, 1/12/07 | | | 2,645,749 | | |
| | 25,600 | | | Barclays U.S. Funding, LLC, 5.25%, 3/20/07 | | | 25,308,800 | | |
| | 17,660 | | | Barclays U.S. Funding, LLC, 5.27%, 3/14/07 | | | 17,473,864 | | |
| | 4,760 | | | Barton Capital Corp., LLC, 5.26%, 1/12/07(1) | | | 4,752,350 | | |
| | 50,000 | | | Barton Capital Corp., LLC, 5.26%, 1/16/07(1) | | | 49,890,417 | | |
| | 25,000 | | | BNP Paribas Finance, Inc., 5.25%, 2/14/07 | | | 24,839,583 | | |
| | 3,475 | | | CAFCO, LLC, 5.26%, 1/9/07(1) | | | 3,470,938 | | |
| | 40,000 | | | CAFCO, LLC, 5.27%, 1/5/07(1) | | | 39,976,578 | | |
| | 13,000 | | | CAFCO, LLC, 5.27%, 1/8/07(1) | | | 12,986,679 | | |
| | 50,000 | | | CIESCO, LLC, 5.26%, 1/16/07(1) | | | 49,890,417 | | |
| | 45,000 | | | Countrywide Financial Corp., 5.40%, 1/2/07 | | | 44,993,250 | | |
| | 20,000 | | | CRC Funding, LLC, 5.26%, 1/5/07(1) | | | 19,988,311 | | |
| | 25,000 | | | CRC Funding, LLC, 5.28%, 2/12/07(1) | | | 24,846,000 | | |
| | 46,360 | | | Fortis Funding, LLC, 5.28%, 1/2/07(1) | | | 46,353,201 | | |
| | 3,141 | | | ING (U.S.) Funding, LLC, 5.25%, 1/18/07 | | | 3,133,213 | | |
| | 9,800 | | | ING (U.S.) Funding, LLC, 5.26%, 2/8/07 | | | 9,745,588 | | |
| | 35,050 | | | ING (U.S.) Funding, LLC, 5.27%, 3/21/07 | | | 34,644,656 | | |
| | 12,986 | | | Kittyhawk Funding Corp., 5.33%, 1/3/07(1) | | | 12,982,155 | | |
| | 15,306 | | | Kittyhawk Funding Corp., 5.33%, 1/25/07(1) | | | 15,251,613 | | |
| | 6,308 | | | Kittyhawk Funding Corp., 5.34%, 1/3/07(1) | | | 6,306,129 | | |
| | 35,000 | | | Nestle Capital Corp., 5.25%, 1/9/07 | | | 34,959,167 | | |
| | 8,000 | | | Old Line Funding Corp., LLC, 5.27%, 1/10/07(1) | | | 7,989,460 | | |
| | 15,000 | | | Old Line Funding Corp., LLC, 5.28%, 1/4/07(1) | | | 14,993,400 | | |
| | 19,000 | | | Old Line Funding Corp., LLC, 5.33%, 1/11/07(1) | | | 18,971,869 | | |
| | 9,077 | | | Old Line Funding Corp., LLC, 5.35%, 1/5/07(1) | | | 9,071,604 | | |
| | 25,000 | | | Ranger Funding Co., LLC, 5.28%, 2/14/07(1) | | | 24,838,667 | | |
| | 23,963 | | | Ranger Funding Co., LLC, 5.29%, 1/3/07(1) | | | 23,955,958 | | |
| | 25,000 | | | Sheffield Receivables Corp., 5.29%, 1/12/07(1) | | | 24,959,590 | | |
| | 14,015 | | | Sheffield Receivables Corp., 5.30%, 1/24/07(1) | | | 13,967,544 | | |
| | 13,500 | | | Sheffield Receivables Corp., 5.33%, 1/10/07(1) | | | 13,482,011 | | |
| | 7,165 | | | Sheffield Receivables Corp., 5.35%, 1/2/07(1) | | | 7,163,935 | | |
| | 1,827 | | | Societe Generale N.A., 5.25%, 1/8/07 | | | 1,825,135 | | |
| | 1,000 | | | Societe Generale N.A., 5.25%, 2/16/07 | | | 993,291 | | |
Principal Amount
(000's omitted) | |
Security | |
Value | |
| Banks and Money Services (continued) | | | |
| $ | 22,000 | | | U.S. Central Federal Credit Union, 5.27%, 1/25/07 | | $ | 21,922,707 | | |
| | 3,600 | | | UBS Finance Delaware, LLC, 5.25%, 1/8/07 | | | 3,596,325 | | |
| | 25,000 | | | UBS Finance Delaware, LLC, 5.255%, 1/2/07 | | | 24,996,351 | | |
| | 9,500 | | | UBS Finance Delaware, LLC, 5.27%, 1/8/07 | | | 9,490,265 | | |
| | 13,200 | | | UBS Finance Delaware, LLC, 5.37%, 1/5/07 | | | 13,192,124 | | |
| | 8,000 | | | Yorktown Capital, LLC, 5.27%, 3/7/07(1) | | | 7,923,878 | | |
| | 3,679 | | | Yorktown Capital, LLC, 5.28%, 1/12/07(1) | | | 3,673,065 | | |
| | 13,900 | | | Yorktown Capital, LLC, 5.30%, 1/23/07(1) | | | 13,854,979 | | |
| | 26,232 | | | Yorktown Capital, LLC, 5.305%, 1/22/07(1) | | | 26,150,823 | | |
| | | | | | | $ | 826,430,346 | | |
| Electric Utilities — 6.3% | | | |
| $ | 12,450 | | | General Electric Capital Corp., 5.25%, 2/9/07 | | $ | 12,379,191 | | |
| | 45,000 | | | General Electric Capital Corp., 5.27%, 1/2/07 | | | 44,993,413 | | |
| | 13,150 | | | Southern Co., 5.30%, 1/30/07(1) | | | 13,093,857 | | |
| | 10,684 | | | Southern Co., 5.32%, 1/5/07(1) | | | 10,677,685 | | |
| | | | | | | $ | 81,144,146 | | |
| Household Products — 4.0% | | | |
| $ | 8,100 | | | Fortune Brands, Inc., 5.35%, 1/26/07(1) | | $ | 8,069,906 | | |
| | 2,460 | | | Fortune Brands, Inc., 5.35%, 2/7/07(1) | | | 2,446,473 | | |
| | 30,000 | | | Proctor & Gamble Co., 5.26%, 2/14/07 | | | 29,807,133 | | |
| | 11,000 | | | Proctor & Gamble Co., 5.27%, 2/14/07 | | | 10,929,148 | | |
| | | | | | | $ | 51,252,660 | | |
| Industrial Equipment — 0.8% | | | |
| $ | 10,000 | | | Ingersoll-Rand Co. Ltd., 5.37%, 1/10/07(1) | | $ | 9,986,575 | | |
| | | | | | | $ | 9,986,575 | | |
| Insurance — 9.7% | | | |
| $ | 41,000 | | | American General Finance Corp., 5.30%, 1/16/07(1) | | $ | 40,909,458 | | |
| | 18,000 | | | Metropolitan-Life Funding, Inc., 5.23%, 1/16/07 | | | 17,960,775 | | |
| | 25,000 | | | Metropolitan-Life Funding, Inc., 5.25%, 1/16/07 | | | 24,945,312 | | |
| | 17,234 | | | New York Life Capital Corp., 5.26%, 1/29/07(1) | | | 17,163,494 | | |
| | 25,000 | | | New York Life Capital Corp., 5.26%, 2/5/07(1) | | | 24,872,153 | | |
| | | | | | | $ | 125,851,192 | | |
| Metals-Industrial — 4.0% | | | |
| $ | 18,760 | | | Alcoa, Inc., 5.29%, 1/8/07 | | $ | 18,740,703 | | |
| | 12,800 | | | Alcoa, Inc., 5.31%, 1/4/07 | | | 12,794,336 | | |
| | 20,000 | | | Alcoa, Inc., 5.35%, 1/5/07 | | | 19,988,111 | | |
| | | | | | | $ | 51,523,150 | | |
See notes to financial statements
14
Cash Management Portfolio as of December 31, 2006
PORTFOLIO OF INVESTMENTS CONT'D
Principal Amount
(000's omitted) | |
Security | |
Value | |
| Retail-Food and Drug — 0.7% | | | |
| $ | 8,700 | | | CVS Corp., 5.35%, 1/2/07(1) | | $ | 8,698,707 | | |
| | | | | | | $ | 8,698,707 | | |
| Telecommunications — 2.7% | | | |
| $ | 25,000 | | | Motorola, Inc., 5.29%, 1/16/07 | | $ | 24,944,896 | | |
| | 10,335 | | | Motorola, Inc., 5.30%, 1/12/07 | | | 10,318,263 | | |
| | | | | | | $ | 35,263,159 | | |
| | Total Commercial Paper
(amortized cost $1,255,875,590) | | | | | $ | 1,255,875,590 | | |
| Corporate Bonds & Notes — 0.3% | | | |
Principal Amount
(000's omitted) | |
Security | |
Value | |
| Chemicals — 0.1% | | | |
| $ | 1,700 | | | Praxair, Inc., 6.625%, 10/15/07 | | $ | 1,740,089 | | |
| | | | | | | $ | 1,740,089 | | |
| Insurance — 0.2% | | | |
| $ | 2,550 | | | Ace Ltd., 6.00%, 4/1/07 | | $ | 2,591,034 | | |
| | | | | | | $ | 2,591,034 | | |
| | Total Corporate Bonds & Notes
(amortized cost $4,331,123) | | | | | $ | 4,331,123 | | |
| Auction-Rate Certificates — 0.6% | | | |
Principal Amount
(000's omitted) | |
Security | |
Value | |
| General Obligations — 0.6% | | | |
| $ | 8,000 | | | Miami, FL (MBIA), (Liq: Wachovia Bank),
5.28%, 12/1/25 | | $ | 8,000,000 | | |
| | | | | | | $ | 8,000,000 | | |
| | Total Auction-Rate Certificates
(amortized cost $8,000,000) | | | | | $ | 8,000,000 | | |
| U.S. Government Agency Obligations — 1.4% | | | |
Principal Amount
(000's omitted) | |
Security | |
Value | |
| $ | 2,000 | | | FHLB, 5.30%, 11/1/07 | | $ | 2,000,000 | | |
| | 16,000 | | | FHLMC, 5.35%, 11/21/07 | | | 16,000,000 | | |
| | Total U.S. Government Agency Obligations
(amortized cost, $18,000,000) | | | | | $ | 18,000,000 | | |
| Time Deposit — 0.4% | | | |
Principal Amount
(000's omitted) | |
Security | |
Value | |
| $ | 4,399 | | | Investors Bank and Trust Company Time Deposit,
5.31%, 1/2/07 | | $ | 4,399,000 | | |
| | Total Time Deposit
(amortized cost, $4,399,000) | | | | | $ | 4,399,000 | | |
| | Total Investments — 100.0%
(amortized cost $1,290,605,713)(2) | | | | | $ | 1,290,605,713 | | |
| | Other Assets, Less Liabilities — (0.0)% | | | | | $ | (382,286 | ) | |
| | Net Assets — 100.0% | | | | | $ | 1,290,223,427 | | |
FHLB - Federal Home Loan Bank
FHLMC - Federal Home Loan Mortgage Corporation (Freddie Mac)
Liq - Liquidity Provider
MBIA - Municipal Bond Insurance Association
Securities issued by Freddie Mac are not issued or insured by the U.S. Government.
(1) A security which has been issued under section 4(2) of the Securities Act of 1933 and is generally regarded as restricted and illiquid. This security may be resold in transactions exempt from registration or to the public if the security is registered. All such securities held have been deemed by the Portfolio's Trustees to be liquid and were purchased with the expectation that resale would not be necessary.
(2) Cost for federal income taxes is the same.
See notes to financial statements
15
Cash Management Portfolio as of December 31, 2006
FINANCIAL STATEMENTS
Statement of Assets and Liabilities
As of December 31, 2006
| Assets | |
| Investments, at amortized cost | | $ | 1,290,605,713 | | |
| Cash | | | 990 | | |
| Interest receivable | | | 152,400 | | |
| Total assets | | $ | 1,290,759,103 | | |
| Liabilities | |
| Payable to affiliate for investment advisory fees | | $ | 473,987 | | |
| Payable to affiliate for Trustees' fees | | | 2,180 | | |
| Accrued expenses | | | 59,509 | | |
| Total liabilities | | $ | 535,676 | | |
| Net Assets applicable to investors' interest in Portfolio | | $ | 1,290,223,427 | | |
| Sources of Net Assets | |
| Net proceeds from capital contributions and withdrawals | | $ | 1,290,223,427 | | |
| Total | | $ | 1,290,223,427 | | |
Statement of Operations
For the Year Ended
December 31, 2006
| Investment Income | |
| Interest | | $ | 14,388,824 | | |
| Total investment income | | $ | 14,388,824 | | |
| Expenses | |
| Investment adviser fee | | $ | 1,360,454 | | |
| Trustees' fees and expenses | | | 8,016 | | |
| Custodian fee | | | 85,116 | | |
| Legal and accounting services | | | 44,598 | | |
| Miscellaneous | | | 368 | | |
| Total expenses | | $ | 1,498,552 | | |
Deduct —
Reduction of custodian fee | | $ | 18 | | |
| Total expense reductions | | $ | 18 | | |
| Net expenses | | $ | 1,498,534 | | |
| Net investment income | | $ | 12,890,290 | | |
| Realized Gain (Loss) | |
Net realized gain (loss) —
Investment transactions (identified cost basis) | | $ | (2,730 | ) | |
| Increase from payments by affiliate | | | 53 | | |
Net loss realized on the disposal of investments which did not
meet the Portfolio's investment guidelines | | | (53 | ) | |
| Net realized loss | | $ | (2,730 | ) | |
| Net increase in net assets from operations | | $ | 12,887,560 | | |
See notes to financial statements
16
Cash Management Portfolio as of December 31, 2006
FINANCIAL STATEMENTS CONT'D
Statements of Changes in Net Assets
Increase (Decrease)
in Net Assets | | Year Ended
December 31, 2006 | | Year Ended
December 31, 2005 | |
| From operations — | |
| Net investment income | | $ | 12,890,290 | | | $ | 3,954,413 | | |
Net realized loss from investment
transactions, payments by affiliate
and the disposal of investments
which did not meet the Portfolio's
investment guidelines | | | (2,730 | ) | | | (141 | ) | |
| Net increase in net assets from operations | | $ | 12,887,560 | | | $ | 3,954,272 | | |
Capital transactions —
Contributions | | $ | 3,903,906,779 | | | $ | 184,089,048 | | |
| Withdrawals | | | (2,773,384,656 | ) | | | (210,117,271 | ) | |
Net increase (decrease) in net assets
from capital transactions | | $ | 1,130,522,123 | | | $ | (26,028,223 | ) | |
| Net increase (decrease) in net assets | | $ | 1,143,409,683 | | | $ | (22,073,951 | ) | |
| Net Assets | |
| At beginning of year | | $ | 146,813,744 | | | $ | 168,887,695 | | |
| At end of year | | $ | 1,290,223,427 | | | $ | 146,813,744 | | |
See notes to financial statements
17
Cash Management Portfolio as of December 31, 2006
FINANCIAL STATEMENTS CONT'D
Supplementary Data
| | | Year Ended December 31, | |
| | | 2006 | | 2005 | | 2004 | | 2003 | | 2002 | |
| Ratios/Supplemental Data | |
| Ratios (As a percentage of average daily net assets): | |
| Expenses before custodian fee reduction | | | 0.54 | % | | | 0.60 | % | | | 0.59 | % | | | 0.57 | % | | | 0.58 | % | |
| Expenses after custodian fee reduction | | | 0.54 | % | | | 0.60 | % | | | 0.59 | % | | | 0.57 | % | | | 0.58 | % | |
| Net investment income | | | 4.67 | % | | | 2.63 | % | | | 0.78 | % | | | 0.59 | % | | | 1.22 | % | |
| Total Return | | | 4.60 | %(1) | | | 2.67 | %(1) | | | 0.78 | % | | | 0.60 | % | | | 1.22 | % | |
(1) During the years ended December 31, 2006 and December 31, 2005, the investment adviser reimbursed the Portfolio for net losses realized on the disposal of investments which did not meet the Portfolio's investment guidelines. The reimbursement had no effect on total return for the years ended December 31, 2006 and December 31, 2005.
See notes to financial statements
18
Cash Management Portfolio as of December 31, 2006
NOTES TO FINANCIAL STATEMENTS
1 Significant Accounting Policies
Cash Management Portfolio (the Portfolio) is registered under the Investment Company Act of 1940, as amended, as a diversified, open-end management investment company. The Portfolio was organized as a trust under the laws of the State of New York on May 1, 1992. The Portfolio's objective is to provide as high a rate of income as may be consistent with preservation of capital and maintenance of liquidity. The Declaration of Trust permits the Trustees to issue interests in the Portfolio. At December 31, 2006, the Eaton Vance Cash Management Fund and the Eaton Vance Money Market Fund held interests of approximately 9.3% and 3.3%, respectively, in the Portfolio. In November 2006, the Portfolio was made available to other portfolios and funds managed by Boston Management and Research (BMR) and Eaton Vance Management (EVM) and its affiliates for short-term investment purposes. At December 31, 2006, other portfolios and funds managed b y BMR and EVM and its affiliates held interests totaling 87.4% of the Portfolio's net assets. At December 31, 2006, Large Cap Value Portfolio and Floating Rate Portfolio each held a greater than 10% interest in the Portfolio (10.9% and 10.7%, respectively). The following is a summary of significant accounting policies of the Portfolio. The policies are in conformity with accounting principles generally accepted in the United States of America.
A Security Valuation — The Portfolio values investment securities utilizing the amortized cost valuation technique permitted by Rule 2a-7 of the Investment Company Act of 1940, pursuant to which the Portfolio must comply with certain conditions. This technique involves initially valuing a portfolio security at its cost and thereafter assuming a constant amortization to maturity of any discount or premium.
B Income — Interest income is recorded on the basis of interest accrued, adjusted for amortization of premium or accretion of discount.
C Federal Taxes — The Portfolio has elected to be treated as a partnership for federal tax purposes. No provision is made by the Portfolio for federal or state taxes on any taxable income of the Portfolio because each investor in the Portfolio is ultimately responsible for the payment of any taxes on its share of taxable income. Since at least one of the Portfolio's investors is a regulated investment company that invests all or substantially all of its assets in the Portfolio, the Portfolio normally must satisfy the applicable source of income and diversification requirements (under the Internal Revenue Code) in order for its investors to satisfy them. The Portfolio will allocate, at least annually a mong its investors, each investor's distributive share of the Portfolio's net investment income, net realized capital gains, and any other items of income, gain, loss, deduction or credit.
D Expense Reduction — Investors Bank & Trust Company (IBT) serves as custodian to the Portfolio. Pursuant to the custodian agreement, IBT receives a fee reduced by credits which are determined based on the average daily cash balance the Portfolio maintains with IBT. All credit balances, if any, used to reduce the Portfolio's custodian fees are reported as a reduction of expenses in the Statement of Operations.
E Use of Estimates — The preparation of the financial statements in conformity with accounting principles generally accepted in the United States of America requires management to make estimates and assumptions that affect the reported amounts of assets and liabilities at the date of the financial statements and the reported amounts of income and expense during the reporting period. Actual results could differ from those estimates.
F Indemnifications — Under the Portfolio's organizational documents, its officers and Trustees may be indemnified against certain liabilities and expenses arising out of the performance of their duties to the Portfolio. Interestholders in the Portfolio are jointly and severally liable for the liabilities and obligations of the Portfolio in the event that the Portfolio fails to satisfy such liabilities and obligations; provided, however, that, to the extent assets are available in the Portfolio, the Portfolio may, under certain circumstances, indemnify interestholders from and against any claim or liability to which such holder may become subject by reason of being or having been an interestholder in the Portfolio. Additionally, in the normal course of business, the Portfo lio enters into agreements with service providers that may contain indemnification clauses. The Portfolio's maximum exposure under these arrangements is unknown as this would involve future claims that may be made against the Portfolio that have not yet occurred.
G Other — Investment transactions are accounted for on the date the securities are purchased or sold. Realized gains and losses on securities sold are determined on the basis of identified cost.
19
Cash Management Portfolio as of December 31, 2006
NOTES TO FINANCIAL STATEMENTS CONT'D
2 Investment Adviser Fee and Other Transactions with Affiliates
The investment adviser fee is earned by Boston Management and Research (BMR), a wholly-owned subsidiary of Eaton Vance Management (EVM), as compensation for management and investment advisory services rendered to the Portfolio. The fee is computed at the rate of 1/2 of 1% per annum of the Portfolio's average daily net assets and amounted to $1,360,454 for the year ended December 31, 2006. Except as to Trustees of the Portfolio who are not members of EVM's or BMR's organization, officers and Trustees receive remuneration for their services to the Portfolio out of such investment adviser fee.
BMR made voluntary reimbursements to the Portfolio totaling $53 to compensate the Portfolio for realized losses incurred from the sale of investment securities which did not meet the Portfolio's investment guidelines.
Certain officers and Trustees of the Portfolio are officers of the above organizations.
3 Line of Credit
The Portfolio participates with other portfolios and funds managed by BMR or EVM and its affiliates in a $150 million unsecured line of credit agreement with a group of banks. Borrowings will be made by the Portfolio solely to facilitate the handling of unusual and/or unanticipated short-term cash requirements. Interest is charged to each participating portfolio or fund based on its borrowings at an amount above either the Eurodollar rate or federal funds rate. In addition, a fee computed at an annual rate of 0.10% on the daily unused portion of the line of credit is allocated among the participating portfolios and funds at the end of each quarter. The Portfolio did not have any significant borrowings or allocated fees during the year ended December 31, 2006.
4 Investments
Purchases and sales (including maturities) of investments during the year ended December 31, 2006, exclusive of U.S. Government and agency securities, aggregated $8,539,997,844 and $7,426,455,552 respectively. Purchases and sales (including maturities) of U.S. Government and agency securities aggregated $18,000,000 and $1,521,075, respectively.
5 Recently Issued Accounting Pronouncements
In June 2006, the Financial Accounting Standards Board (FASB) issued FASB Interpretation No. 48, (FIN 48) "Accounting for Uncertainty in Income Taxes – an interpretation of FASB Statement No. 109". FIN 48 clarifies the accounting for uncertainty in income taxes recognized in accordance with FASB Statement No. 109, "Accounting for Income Taxes." This interpretation prescribes a recognition threshold and measurement attribute for the financial statement recognition and measurement of a tax position taken or expected to be taken in a tax return. It also provides guidance on de-recognition, classification, interest and penalties, accounting in interim periods, disclosure and transition. FIN 48 is effective during the first required financial reporting period for fiscal years beginning after December 15, 2006. Management is currently evaluating the impact of applying the various provisions of FIN 48.
In September 2006, the FASB issued Statement of Financial Accounting Standards No. 157, (FAS 157) "Fair Value Measurements". FAS 157 defines fair value, establishes a framework for measuring fair value in accordance with generally accepted accounting principles and expands disclosure about fair value measurements. FAS 157 is effective for fiscal years beginning after November 15, 2007. Management is currently evaluating the impact the adoption of FAS 157 will have on the Portfolio's financial statement disclosures.
20
Cash Management Portfolio as of December 31, 2006
REPORT OF INDEPENDENT REGISTERED PUBLIC ACCOUNTING FIRM
To the Trustees and Investors
of Cash Management Portfolio:
In our opinion, the accompanying statement of assets and liabilities, including the portfolio of investments, and the related statements of operations and of changes in net assets and the supplementary data present fairly, in all material respects, the financial position of Cash Management Portfolio (the "Portfolio") at December 31, 2006, and the results of its operations, the changes in its net assets and the supplementary data for each of the periods presented, in conformity with accounting principles generally accepted in the United States of America. These financial statements and supplementary data (hereafter referred to as "financial statements") are the responsibility of the Portfolio's management; our responsibility is to express an opinion on these financial statements based on our audits. We conducted our audits of these financial statements in accordance with the standards of the Public Company Accounting Oversight Bo ard (United States). Those standards require that we plan and perform the audit to obtain reasonable assurance about whether the financial statements are free of material misstatement. An audit includes examining, on a test basis, evidence supporting the amounts and disclosures in the financial statements, assessing the accounting principles used and significant estimates made by management, and evaluating the overall financial statement presentation. We believe that our audits, which included confirmation of securities at December 31, 2006 by correspondence with the custodian, provide a reasonable basis for our opinion.
PricewaterhouseCoopers LLP
Boston, Massachusetts
February 21, 2007
21
Eaton Vance Money Market Funds
BOARD OF TRUSTEES' ANNUAL APPROVAL OF THE INVESTMENT ADVISORY AGREEMENT
Overview of the Contract Review Process
The Investment Company Act of 1940, as amended (the "1940 Act"), provides, in substance, that each investment advisory agreement between a fund and its investment adviser will continue in effect from year to year only if its continuance is approved at least annually by the fund's board of trustees, including by a vote of a majority of the trustees who are not "interested persons" of the fund ("Independent Trustees") cast in person at a meeting called for the purpose of considering such approval.
At a meeting of the Boards of Trustees (each a "Board") of the Eaton Vance group of mutual funds (the "Eaton Vance Funds") held on March 27, 2006, the Board, including a majority of the Independent Trustees, voted to approve continuation of existing advisory and sub-advisory agreements for the Eaton Vance Funds for an additional one-year period. In voting its approval, the Board relied upon the affirmative recommendation of the Special Committee of the Board, which is a committee comprised exclusively of Independent Trustees. Prior to making its recommendation, the Special Committee reviewed information furnished for a series of meetings of the Special Committee held in February and March 2006. Such information included, among other things, the following:
Information about Fees, Performance and Expenses
• An independent report comparing the advisory and related fees paid by each fund with fees paid by comparable funds;
• An independent report comparing each fund's total expense ratio and its components to comparable funds;
• An independent report comparing the investment performance of each fund to the investment performance of comparable funds over various time periods;
• Data regarding investment performance in comparison to relevant peer groups of funds and appropriate indices;
• Comparative information concerning fees charged by each adviser for managing other mutual funds and institutional accounts using investment strategies and techniques similar to those used in managing the fund;
• Profitability analyses for each adviser with respect to each fund managed by it;
Information about Portfolio Management
• Descriptions of the investment management services provided to each fund, including the investment strategies and processes employed;
• Information concerning the allocation of brokerage and the benefits received by each adviser as a result of brokerage allocation, including information concerning the acquisition of research through "soft dollar" benefits received in connection with the funds' brokerage, and the implementation of a soft dollar reimbursement program established with respect to the funds;
• Data relating to portfolio turnover rates of each fund;
• The procedures and processes used to determine the fair value of fund assets and actions taken to monitor and test the effectiveness of such procedures and processes;
Information about each Adviser
• Reports detailing the financial results and condition of each adviser;
• Descriptions of the qualifications, education and experience of the individual investment professionals whose responsibilities include portfolio management and investment research for the funds, and information relating to their compensation and responsibilities with respect to managing other mutual funds and investment accounts;
• Copies of the Codes of Ethics of each adviser and its affiliates, together with information relating to compliance with and the administration of such codes;
• Information concerning the resources devoted to compliance efforts undertaken by each adviser and its affiliates on behalf of the funds (including descriptions of various compliance programs) and their record of compliance with investment policies and restrictions, including policies with respect to market-timing, late trading and selective portfolio disclosure, and with policies on personal securities transactions;
• Descriptions of the business continuity and disaster recovery plans of each adviser and its affiliates;
Other Relevant Information
• Information concerning the nature, cost and character of the administrative and other non-investment management services provided by Eaton Vance Management and its affiliates;
• Information concerning management of the relationship with the custodian, subcustodians and fund accountants by each adviser or the funds' administrator; and
• The terms of each advisory agreement.
In addition to the information identified above, the Special Committee considered information provided from time to time by each adviser throughout the year at meetings of the Board and its committees. Over the course of the twelve month period ended March 31,
22
Eaton Vance Money Market Funds
BOARD OF TRUSTEES' ANNUAL APPROVAL OF THE INVESTMENT ADVISORY AGREEMENT CONT'D
2006, the Board met nine times and the Special Committee, the Audit Committee and the Governance Committee, each of which is a Committee comprised solely of Independent Trustees, met eight, twelve and five times, respectively. At such meetings, the Trustees received, among other things, presentations by the portfolio managers and other investment professionals of each adviser relating to the investment performance of each fund and the investment strategies used in pursuing the fund's investment objective.
For funds that invest through one or more underlying portfolios, the Board considered similar information about the portfolio(s) when considering the approval of advisory agreements. In addition, in cases where the fund's investment adviser has engaged a sub-adviser, the Board considered similar information about the sub-adviser when considering the approval of any sub-advisory agreement.
The Special Committee was assisted throughout the contract review process by Goodwin Procter LLP, legal counsel for the Independent Trustees. The members of the Special Committee relied upon the advice of such counsel and their own business judgment in determining the material factors to be considered in evaluating each advisory and sub-advisory agreement and the weight to be given to each such factor. The conclusions reached with respect to each advisory and sub-advisory agreement were based on a comprehensive evaluation of all the information provided and not any single factor. Moreover, each member of the Special Committee may have placed varying emphasis on particular factors in reaching conclusions with respect to each advisory and sub-advisory agreement.
Results of the Process
Based on its consideration of the foregoing, and such other information as it deemed relevant, including the factors and conclusions described below, the Special Committee concluded that the continuance of the investment advisory agreement of the Cash Management Portfolio (the "Portfolio"), the portfolio in which the Eaton Vance Cash Management Fund and the Eaton Vance Money Market Fund (the "Funds") invest, with Boston Management and Research (the "Adviser"), including its fee structure, is in the interests of shareholders and, therefore, the Special Committee recommended to the Board approval of the agreement. The Board accepted the recommendation of the Special Committee as well as the factors considered and conclusions reached by the Special Committee with respect to the agreement. Accordingly, the Board, including a majority of the Independent Trustees, voted to approve continuation of the investment advisory agreement for the Portfolio.
Nature, Extent and Quality of Services
In considering whether to approve the investment advisory agreement of the Portfolio, the Board evaluated the nature, extent and quality of services provided to the Portfolio by the Adviser.
The Board considered the Adviser's management capabilities and investment process with respect to the types of investments held by the Portfolio, including the education, experience and number of its investment professionals and other personnel who provide portfolio management, investment research, and similar services to the Portfolio. The Board specifically noted the Adviser's experience in managing portfolios consisting of high quality money market instruments and short-term obligations. The Board also took into account the resources dedicated to portfolio management and other services, including the compensation paid to recruit and retain investment personnel, and the time and attention devoted to the Portfolio by senior management.
The Board reviewed the compliance programs of the Adviser and relevant affiliates thereof. Among other matters, the Board considered compliance and reporting matters relating to personal trading by investment personnel, selective disclosure of portfolio holdings, late trading, frequent trading, portfolio valuation, business continuity and the allocation of investment opportunities. The Board also evaluated the responses of the Adviser and its affiliates to requests from regulatory authorities such as the Securities and Exchange Commission and the National Association of Securities Dealers.
The Board considered shareholder and other administrative services provided or managed by Eaton Vance Management and its affiliates, including transfer agency and accounting services. The Board evaluated the benefits to shareholders of investing in a fund that is a part of a large family of funds, including the ability, in many cases, to exchange an investment among different funds without incurring additional sales charges. The Fund is maintained by the Adviser primarily as an administrative convenience for shareholders of other Eaton Vance Funds and is not actively marketed to the public as a stand-alone investment product.
After consideration of the foregoing factors, among others, the Board concluded that the nature, extent and quality of services provided by the Adviser, taken as a whole, are appropriate and consistent with the terms of the investment advisory agreement.
Fund Performance
The Board compared each Fund's investment performance to a relevant universe of similarly managed funds identified by an independent data provider and appropriate benchmark indices. The Board reviewed comparative performance data for the one-, three-, five- and ten-year periods ended September 30, 2005 for each Fund. The Board concluded that the performance of each Fund was satisfactory.
23
Eaton Vance Money Market Funds
BOARD OF TRUSTEES' ANNUAL APPROVAL OF THE INVESTMENT ADVISORY AGREEMENT CONT'D
Management Fees and Expenses
The Board reviewed contractual investment advisory fee rates payable by the Portfolio and the Fund (referred to as "management fees"). As part of its review, the Board considered the management fees and each Fund's total expense ratio for the year ended September 30, 2005, as compared to a group of similarly managed funds selected by an independent data provider.
After reviewing the foregoing information, and in light of the nature, extent and quality of the services provided by the Adviser, the Board concluded that the management fees charged for advisory and related services and each Fund's total expense ratio are reasonable.
Profitability
The Board reviewed the level of profits realized by the Adviser and relevant affiliates thereof in providing investment advisory and administrative services to the Portfolio, each Fund and to all Eaton Vance Funds as a group. The Board considered the level of profits realized without regard to revenue sharing or other payments by the Adviser and its affiliates to third parties in respect of distribution services. The Board also considered other direct or indirect benefits received by the Adviser and its affiliates in connection with its relationship with the Portfolio and the Fund, including the benefits of research services that may be available to the Adviser as a result of securities transactions effected for the Portfolio and other advisory clients.
The Board concluded that, in light of the foregoing factors and the nature, extent and quality of the services rendered, the profits realized by the Adviser and its affiliates are reasonable.
Economies of Scale
In reviewing management fees and profitability, the Board also considered the extent to which the Adviser and its affiliates, on the one hand, and the Funds, on the other hand, can expect to realize benefits from economies of scale as the assets of the Funds and the Portfolio increase. The Board acknowledged the difficulty in accurately measuring the benefits resulting from the economies of scale with respect to the management of any specific fund or group of funds. The Board reviewed data summarizing the increases and decreases in the assets of the Funds and of all Eaton Vance Funds as a group over various time periods, and evaluated the extent to which the total expense ratio of each Fund and the profitability of the Adviser and its affiliates may have been affected by such increases or decreases. Based upon the foregoing, the Board concluded that the benefits from economies of scale are currently being shared equitably by the Adviser and its affiliates and each Fund and that, assuming reasonably foreseeable increases in the assets of the Portfolio, the Adviser and its affiliates and the Funds can be expected to continue to share such benefits equitably.
24
Eaton Vance Money Market Funds
MANAGEMENT AND ORGANIZATION
Fund Management. The Trustees of Eaton Vance Mutual Funds Trust (the Trust) and Cash Management Portfolio (the Portfolio) are responsible for the overall management and supervision of the Trust's and Portfolio's affairs. The Trustees and officers of the Trust and the Portfolio are listed below. Except as indicated, each individual has held the office shown or other offices in the same company for the last five years. Trustees and officers of the Trust and the Portfolio hold indefinite terms of office. The "noninterested Trustees" consist of those Trustees who are not "interested persons" of the Trust and the Portfolio, as that term is defined under the 1940 Act. The business address of each Trustee and officer is The Eaton Vance Building, 255 State Street, Boston, Massachusetts 02109. As used below, "EVC" refers to Eaton Vance Corp., "EV" refers to Eaton Van ce, Inc., "EVM" refers to Eaton Vance Management, "BMR" refers to Boston Management and Research, "EVD" refers to Eaton Vance Distributors, Inc. and "Parametric" refers to Parametric Portfolio Associates. EVC and EV are the corporate parent and trustee, respectively, of EVM and BMR. EVD is the Fund's principal underwriter, the Portfolio's placement agent and a wholly-owned subsidiary of EVM. Each officer affiliated with Eaton Vance may hold a position with other Eaton Vance affiliates that is comparable to his or her position with EVM listed below.
Name and
Date of Birth | | Position(s)
with the
Trust and
the
Portfolio | | Term of
Office and
Length of
Service | | Principal Occupation(s)
During Past Five Years | | Number of Portfolios
in Fund Complex
Overseen By
Trustee (1) | | Other Directorships Held | |
| Interested Trustee | | | | | | | | | | | | | |
|
| James B. Hawkes 11/9/41 | | Trustee | | Trustee of the Trust since 1991 and of the Portfolio since 1993 | | Chairman and Chief Executive Officer of EVC, BMR, EVM and EV; Director of EV; Vice President and Director of EVD. Trustee and/or officer of 170 registered investment companies in the Eaton Vance Fund Complex. Mr. Hawkes is an interested person because of his positions with BMR, EVM, EVC and EV, which are affiliates of the Trust and Portfolio. | | | 170 | | | Director of EVC | |
|
| Noninterested Trustee(s) | | | | | | | | | | | | | |
|
| Benjamin C. Esty 1/2/63 | | Trustee | | Since 2005 | | Roy and Elizabeth Simmons Professor of Business Administration, Harvard University Graduate School of Business Administration (since 2003). Formerly, Associate Professor, Harvard University Graduate School of Business Administration (2000-2003). | | | 170 | | | None | |
|
| Samuel L. Hayes, III 2/23/35 | | Trustee and Chairman of the Board | | Trustee of the Trust since 1986; of the Portfolio since 1993 and Chairman of the Board since 2005 | | Jacob H. Schiff Professor of Investment Banking Emeritus, Harvard University Graduate School of Business Administration. Director of Yakima Products, Inc. (manufacturer of automotive accessories) (since 2001) and Director of Telect, Inc. (telecommunications services company). | | | 170 | | | Director of Tiffany & Co. (specialty retailer) | |
|
| William H. Park 9/19/47 | | Trustee | | Since 2003 | | Vice Chairman, Commercial Industrial Finance Corp. (specialty finance company) (since 2006). Formerly, President and Chief Executive Officer, Prizm Capital Management, LLC (investment management firm) (2002-2005). Formerly, Executive Vice President and Chief Financial Officer, United Asset Management Corporation (a holding company owning institutional investment management firms) (1982-2001). | | | 170 | | | None | |
|
| Ronald A. Pearlman 7/10/40 | | Trustee | | Since 2003 | | Professor of Law, Georgetown University Law Center. | | | 170 | | | None | |
|
| Norton H. Reamer 9/21/35 | | Trustee | | Trustee of the Trust since 1986 and of the Portfolio since 1993 | | President, Chief Executive Officer and a Director of Asset Management Finance Corp. (a specialty finance company serving the investment management industry) (since October 2003). President, Unicorn Corporation (an investment and financial advisory services company) (since September 2000). Formerly, Chairman and Chief Operating Officer, Hellman, Jordan Management Co., Inc. (an investment management company) (2000-2003). Formerly, Advisory Director of Berkshire Capital Corporation (investment banking firm) (2002-2003). | | | 170 | | | None | |
|
25
Eaton Vance Money Market Funds
MANAGEMENT AND ORGANIZATION CONT'D
Name and
Date of Birth | | Position(s)
with the
Trust and
the
Portfolio | | Term of
Office and
Length of
Service | | Principal Occupation(s)
During Past Five Years | | Number of Portfolios
in Fund Complex
Overseen By
Trustee (1) | | Other Directorships Held | |
| Noninterested Trustee(s) (continued) | | | | | | | | | | | |
|
| Lynn A. Stout 9/14/57 | | Trustee | | Since 1998 | | Professor of Law, University of California at Los Angeles School of Law. | | | 170 | | | None | |
|
| Ralph F. Verni 1/26/43 | | Trustee | | Since 2005 | | Consultant and private investor. | | | 170 | | | None | |
|
| Principal Officers who are not Trustees | | | | | | | | | | | |
|
Name and
Date of Birth | | Position(s)
with the
Trust and
the
Portfolio | | Term of
Office and
Length of
Service | | Principal Occupation(s)
During Past Five Years | |
| Thomas E. Faust Jr. 5/31/58 | | President of the Trust | | Since 2002 | | President of EVC, EVM, BMR and EV and Director of EVC. Chief Investment Officer of EVC, EVM and BMR. Officer of 71 registered investment companies and 5 private investment companies managed by EVM or BMR. | |
|
| William H. Ahern, Jr. 7/28/59 | | Vice President of the Trust | | Since 1995 | | Vice President of EVM and BMR. Officer of 71 registered investment companies managed by EVM or BMR. | |
|
| Cynthia J. Clemson 3/2/63 | | Vice President of the Trust | | Since 2005 | | Vice President of EVM and BMR. Officer of 86 registered investment companies managed by EVM or BMR. | |
|
| Elizabeth S. Kenyon 9/8/59 | | President of the Portfolio | | Since 2002(2) | | Vice President of EVM and BMR. Officer of 17 registered investment companies managed by EVM or BMR. | |
|
| Aamer Khan 6/7/60 | | Vice President of the Trust | | Since 2005 | | Vice President of EVM and BMR. Officer of 29 registered investment companies managed by EVM or BMR. | |
|
| Thomas H. Luster 4/8/62 | | Vice President | | Vice President of the Trust since 2006 and of the Portfolio since 2002 | | Vice President of EVM and BMR. Officer of 45 registered investment companies managed by EVM or BMR. | |
|
| Michael R. Mach 7/15/47 | | Vice President of the Trust | | Since 1999 | | Vice President of EVM and BMR. Officer of 51 registered investment companies managed by EVM or BMR. | |
|
| Robert B. MacIntosh 1/22/57 | | Vice President of the Trust | | Since 1998 | | Vice President of EVM and BMR. Officer of 86 registered investment companies managed by EVM or BMR. | |
|
| Cliff Quisenberry, Jr. 1/1/65 | | Vice President of the Trust | | Since 2006 | | Vice President and Director of Research and Product Development of Parametric. Officer of 30 registered investment companies managed by EVM or BMR. | |
|
| Duncan W. Richardson 10/26/57 | | Vice President of the Trust | | Since 2001 | | Executive Vice President and Chief Equity Investment Officer of EVC, EVM and BMR. Officer of 71 registered investment companies managed by EVM or BMR. | |
|
| Walter A. Row, III 7/20/57 | | Vice President of the Trust | | Since 2001 | | Director of Equity Research and a Vice President of EVM and BMR. Officer of 31 registered investment companies managed by EVM or BMR. | |
|
| Judith A. Saryan 8/21/54 | | Vice President of the Trust | | Since 2003 | | Vice President of EVM and BMR. Officer of 33 registered investment companies managed by EVM or BMR. | |
|
| Susan Schiff 3/13/61 | | Vice President of the Trust | | Since 2002 | | Vice President of EVM and BMR. Officer of 29 registered investment companies managed by EVM or BMR. | |
|
26
Eaton Vance Money Market Funds
MANAGEMENT AND ORGANIZATION CONT'D
| Principal Officers who are not Trustees (continued) | |
|
Name and
Date of Birth | | Position(s)
with the
Trust and
the
Portfolio | | Term of
Office and
Length of
Service | | Principal Occupation(s)
During Past Five Years | |
| Kristin S. Anagnost 6/12/65 | | Treasurer of the Portfolio | | Since 2002(2) | | Assistant Vice President of EVM and BMR. Officer of 95 registered investment companies managed by EVM or BMR. | |
|
| Barbara E. Campbell 6/19/57 | | Treasurer | | Since 2005(2) | | Vice President of EVM and BMR. Officer of 170 registered investment companies managed by EVM or BMR. | |
|
| Alan R. Dynner 10/10/40 | | Secretary | | Since 1997 | | Vice President, Secretary and Chief Legal Officer of BMR, EVM, EVD, EV and EVC. Officer of 170 registered investment companies managed by EVM or BMR. | |
|
| Paul M. O'Neil 7/11/53 | | Chief Compliance Officer | | Since 2004 | | Vice President of EVM and BMR. Officer of 170 registered investment companies managed by EVM or BMR. | |
|
(1) Includes both master and feeder funds in a master-feeder structure.
(2) Prior to 2002, Ms. Kenyon served as Vice President of the Portfolio since 2001 and Ms. Anagnost served as Assistant Treasurer of the Portfolio since 1998. Prior to 2005, Ms. Campbell served as Assistant Treasurer of the Trust since 1995.
The SAI for the Funds includes additional information about the Trustees and officers of the Funds and the Portfolio and can be obtained without charge on Eaton Vance's website at www.eatonvance.com or by calling 1-800-225-6265.
27
This Page Intentionally Left Blank
Portfolio Investment Adviser
Boston Management and Research
The Eaton Vance Building
255 State Street
Boston, MA 02109
Fund Administrator
Eaton Vance Management
The Eaton Vance Building
255 State Street
Boston, MA 02109
Principal Underwriter
Eaton Vance Distributors, Inc.
The Eaton Vance Building
255 State Street
Boston, MA 02109
(617) 482-8260
Custodian
Investors Bank & Trust Company
200 Clarendon Street
Boston, MA 02116
Transfer Agent
PFPC Inc.
Attn: Eaton Vance Funds
P.O. Box 9653
Providence, RI 02940-9653
(800) 262-1122
Independent Registered Public Accounting Firm
PricewaterhouseCoopers LLP
125 High Street
Boston, MA 02110
Eaton Vance Mutual Funds Trust
The Eaton Vance Building
255 State Street
Boston, MA 02109
This report must be preceded or accompanied by a current prospectus. Before investing, investors should consider carefully a Fund's investment objective(s), risks, and charges and expenses. The Funds' current prospectus contains this and other information about the Funds and is available through your financial advisor. Please read the prospectus carefully before you invest or send money. For further information please call 1-800-225-6265.
131-2/07 MMSRC

Annual Report December 31, 2006


EATON VANCE
AMT-FREE MUNICIPAL
BOND
FUND
IMPORTANT NOTICES REGARDING PRIVACY,
DELIVERY OF SHAREHOLDER DOCUMENTS,
PORTFOLIO HOLDINGS, AND PROXY VOTING
Privacy. The Eaton Vance organization is committed to ensuring your financial privacy. Each of the financial institutions identified below has in effect the following policy ("Privacy Policy") with respect to nonpublic personal information about its customers:
• Only such information received from you, through application forms or otherwise, and information about your Eaton Vance fund transactions will be collected. This may include information such as name, address, social security number, tax status, account balances and transactions.
• None of such information about you (or former customers) will be disclosed to anyone, except as permitted by law (which includes disclosure to employees necessary to service your account). In the normal course of servicing a customer's account, Eaton Vance may share information with unaffiliated third parties that perform various required services such as transfer agents, custodians and broker/dealers.
• Policies and procedures (including physical, electronic and procedural safeguards) are in place that are designed to protect the confidentiality of such information.
• We reserve the right to change our Privacy Policy at any time upon proper notification to you. Customers may want to review our Policy periodically for changes by accessing the link on our homepage: www.eatonvance.com.
Our pledge of privacy applies to the following entities within the Eaton Vance organization: the Eaton Vance Family of Funds, Eaton Vance Management, Eaton Vance Investment Counsel, Boston Management and Research, and Eaton Vance Distributors, Inc.
In addition, our Privacy Policy only applies to those Eaton Vance customers who are individuals and who have a direct relationship with us. If a customer's account (i.e., fund shares) is held in the name of a third-party financial adviser/broker-dealer, it is likely that only such adviser's privacy policies apply to the customer. This notice supersedes all previously issued privacy disclosures.
For more information about Eaton Vance's Privacy Policy, please call 1-800-262-1122.
Delivery of Shareholder Documents. The Securities and Exchange Commission (the "SEC") permits funds to deliver only one copy of shareholder documents, including prospectuses, proxy statements and shareholder reports, to fund investors with multiple accounts at the same residential or post office box address. This practice is often called "householding" and it helps eliminate duplicate mailings to shareholders.
Eaton Vance, or your financial adviser, may household the mailing of your documents indefinitely unless you instruct Eaton Vance, or your financial adviser, otherwise.
If you would prefer that your Eaton Vance documents not be householded, please contact Eaton Vance at 1-800-262-1122, or contact your financial adviser.
Your instructions that householding not apply to delivery of your Eaton Vance documents will be effective within 30 days of receipt by Eaton Vance or your financial adviser.
Portfolio Holdings. Each Eaton Vance Fund and its underlying Portfolio (if applicable) will file a schedule of its portfolio holdings on Form N-Q with the SEC for the first and third quarters of each fiscal year. The Form N-Q will be available on the Eaton Vance website www.eatonvance.com, by calling Eaton Vance at 1-800-262-1122 or in the EDGAR database on the SEC's website at www.sec.gov. Form N-Q may also be reviewed and copied at the SEC's public reference room in Washington, D.C. (call 1-800-732-0330 for information on the operation of the public reference room).
Proxy Voting. From time to time, funds are required to vote proxies related to the securities held by the funds. The Eaton Vance Funds or their underlying Portfolios (if applicable) vote proxies according to a set of policies and procedures approved by the Funds' and Portfolios' Boards. You may obtain a description of these policies and procedures and information on how the Funds or Portfolios voted proxies relating to portfolio securities during the most recent 12 month period ended June 30, without charge, upon request, by calling 1-800-262-1122. This description is also available on the SEC's website at www.sec.gov.
Eaton Vance AMT-Free Municipal Bond Fund as of December 31, 2006
MANAGEMENT’S DISCUSSION OF FUND PERFORMANCE
Portfolio Manager: Cynthia J. Clemson
Performance for the Year Ended December 31, 2006
· The Fund’s Class A shares had a total return of 8.16% for the year ended December 31, 2006.(1)This return was the result of an increase in net asset value (NAV) to $10.16 per share on December 31, 2006, from $9.80 on December 31, 2005, and the reinvestment of $0.422 in dividends.(2)
· The Fund’s Class B shares had a total return of 7.38% for the same period.(1)This return was the result of an increase in net asset value (NAV) to $10.10 per share on December 31, 2006, from $9.74 on December 31, 2005, and the reinvestment of $0.345 in dividends.(2)
· The Fund’s Class C shares had a total return of 6.33% for the period from the start of business on May 2, 2006 to December 31, 2006.(1)This return was the result of an increase in net asset value (NAV) to $10.10 per share on December 31, 2006, from $9.72 at the close of business on May 1, 2006, and the reinvestment of $0.229 in dividends.(2)
· The Fund’s Class I shares had a total return of 8.40% for the year ended December 31, 2006.(1)This return was the result of an increase in net asset value (NAV) to $11.10 per share on December 31, 2006, from $10.71 on December 31, 2005, and the reinvestment of $0.489 in dividends.(2)
Economic and Market Conditions
Fourth quarter preliminary economic growth rose to 3.5%, following the 2.0% growth rate achieved in the third quarter. With higher mortgage rates in the market, led largely by the persistent Federal Reserve (the “Fed”) tightening, the housing market continued to soften, with building permits and existing home sales leading the way. However, energy prices declined significantly in the quarter, somewhat offsetting the impact of a weakening housing market. The economy continued to create jobs over the period, with the unemployment rate standing at 4.5% as of December 31, 2006.
Inflation expectations moderated with the lower energy prices, although the core Consumer Price Index – measured on a year-over-year basis – has demonstrated a slow but steady rise. The Fed, which raised short-term rates 17 times since June 2004, is currently in a pausing mode, awaiting further economic inputs to determine the future direction of interest rate moves. At December 31, 2006, the Federal Funds rate stood at 5.25%.
Past performance is no guarantee of future results. Returns are historical and are calculated by determining the percentage change in net asset value or offering price (as applicable) with all distributions reinvested. Investment return and principal value will fluctuate so that shares, when sold, may be worth more or less than their original cost. Performance is for the stated time period only; due to market volatility, the Fund’s current performance may be lower or higher than the quoted return period. For performance as of the most recent month end, please refer to www.eatonvance.com
Fund shares are not insured by the Federal Deposit Insurance Corp. and are not deposits or other obligations of, or guaranteed by, any depository institution. Shares are subject to investment risks, including possible loss of principal invested.
Municipal market supply during the year ended December 31, 2006 was lower than it had been in the previous year. As a result, municipals have generally outperformed Treasury bonds for the year ended December 31, 2006, as demand has remained strong. At December 31, 2006, long-term AAA-rated, insured municipal bonds yielded 91% of U.S. Treasury bonds with similar maturities.†
For the year ended December 31, 2006, the Lehman Brothers Municipal Bond Index(3)(the “Index”), an unmanaged index of municipal bonds, posted a gain of 4.84%. For more information about the Fund’s performance and that of funds in the same Lipper Classification, (3) see the Performance Information and Portfolio Composition page that follows.
Management Discussion
The Fund invests primarily in bonds with stated maturities of 10 years or longer, as longer-maturity bonds historically have provided greater tax-exempt income for investors than shorter-maturity bonds. Given the flattening of the yield curve for other fixed-income securities over the past 18 months — with shorter-maturity yields rising more than longer-maturity yields — management felt that the long end of the municipal curve was a relatively attractive place to be positioned.
Because of the mixed economic backdrop of contained inflation expectations, a weakened housing market and continued growth in the labor market, Fund management continued to maintain a somewhat cautious outlook on interest rates. In this environment, Fund management continued to focus on finding relative value within the marketplace – in issuer names, coupons, maturities, sectors and jurisdictions. Relative value trading, which seeks to capitalize on undervalued securities, has enhanced the Fund’s returns during the period.
(1) These returns do not include the 4.75% maximum sales charge for the Fund’s Class A shares or the applicable contingent deferred sales charges (CDSC) for Class B and Class C shares. Class I shares have no sales charge. If sales charges were deducted, returns would be lower. (2) A portion of the Fund’s income may be subject to federal income and/or state and local tax. (3) It is not possible to invest directly in an Index or a Lipper Classification. The Index’s total return does not reflect the expenses that would have been incurred if an investor individually purchased or sold the securities represented in the Index. †Source: Bloomberg L.P. Yields are a compilation of a representative variety of general obligations and are not necessarily representative of the Fund’s yield.
On May 1, 2006, the Fund’s name was changed from Eaton Vance Municipal Bond Fund to Eaton Vance AMT-Free Municipal Bond Fund to reflect the fact that the Fund will not invest in an obligation if the interest on that obligation is subject to the federal alternative minimum tax.
The views expressed throughout this report are those of the portfolio manager and are current only through the end of the period of the report as stated on the cover. These views are subject to change at any time based upon market or other conditions, and the investment adviser disclaims any responsibility to update such views. These views may not be relied on as investment advice and, because investment decisions for a fund are based on many factors, may not be relied on as an indication of trading intent on behalf of any Eaton Vance fund.
1
Eaton Vance AMT-Free Municipal Bond Fund as of December 31, 2006
THE PERFORMANCE INFORMATION AND PORTFOLIO COMPOSITION
The line graph and table set forth below provide information about the Fund’s performance. The line graph compares the performance of Class I of the Fund with that of the Lehman Brothers Municipal Bond Index, a broad-based, unmanaged market index. The lines on the graph represent the total returns of a hypothetical investment of $10,000 in each of Class I and the Lehman Brothers Municipal Bond Index. The table includes the total returns of each Class of the Fund at net asset value and maximum public offering price. The performance presented below does not reflect the deduction of taxes, if any, that a shareholder would pay on Fund distributions or the redemption of Fund shares.
Performance(1) | | Class A | | Class B | | Class C | | Class I | |
Average Annual Total Returns (at net asset value) | | | | | | | | | |
One Year | | 8.16 | % | 7.38 | % | N.A. | | 8.40 | % |
Five Years | | 6.87 | | 6.12 | | N.A. | | 7.15 | |
Ten Years | | N.A. | | N.A. | | N.A. | | 6.69 | |
Life of Fund† | | 5.60 | | 4.75 | | 6.33 | %* | 7.27 | |
SEC Average Annual Total Returns (including sales charge or applicable CDSC) | | | | | | | | | |
One Year | | 3.01 | % | 2.38 | % | N.A. | | 8.40 | % |
Five Years | | 5.83 | | 5.81 | | N.A. | | 7.15 | |
Ten Years | | N.A. | | N.A. | | N.A. | | 6.69 | |
Life of Fund† | | 5.03 | | 4.75 | | 5.33 | %* | 7.27 | |
†Inception Dates – Class A: 1/6/98; Class B: 1/14/98; Class C: 5/2/06; Class I: 3/16/78
*Returns are cumulative since the inception of the share class.
Distribution rates/Yields | | Class A | | Class B | | Class C | | Class I | |
Distribution Rate (2) | | 4.13 | % | 3.40 | % | 3.40 | % | 4.38 | % |
Taxable-Equivalent Distribution Rate (2),(3) | | 6.35 | | 5.23 | | 5.23 | | 6.74 | |
SEC 30-day Yield (4) | | 3.51 | | 2.86 | | 2.80 | | 3.94 | |
Taxable-Equivalent SEC 30-day Yield (3),(4) | | 5.40 | | 4.40 | | 4.31 | | 6.06 | |
Index Performance(5) | | | | | |
Lehman Brothers Municipal Bond Index - Average Annual Total Returns | | | | | |
One Year | | 4.84 | % | | |
Five Years | | 5.53 | | | |
Ten Years | | 5.76 | | | |
Lipper averages(6) | | | | | |
Lipper General Municipal Debt Funds Classification - Average Annual Total Returns | | | | | |
One Year | | 4.47 | % | | |
Five Years | | 4.87 | | | |
Ten Years | | 4.90 | | | |
Past performance is no guarantee of future results. Returns are historical and are calculated by determining the percentage change in net asset value or offering price (as applicable) with all distributions reinvested. Investment return and principal value will fluctuate so that shares, when sold, may be worth more or less than their original cost. Performance is for the stated time period only; due to market volatility, the Fund’s current performance may be lower or higher than the quoted return. For performance as of the most recent month end, please refer to www.eatonvance.com
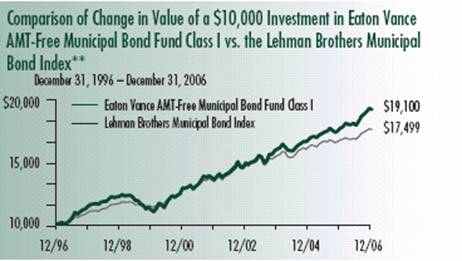
**Sources: Thomson Financial; Lipper, Inc. Class I of the Fund commenced operations on 3/16/78.
A $10,000 hypothetical investment at net asset value in Class A shares on 1/6/98 (commencement of operations), Class B shares on 1/14/98 (commencement of operations) and Class C on 5/2/06 (commencement of operations) would have been valued at $16,325, $15,150 and $10,633 ($10,533, including CDSC), respectively, on December 31, 2006; a $10,000 hypothetical investment in Class A at maximum offering price on 1/6/98 would have been valued at $15,548. It is not possible to invest directly in an Index. The Index’s total return does not reflect the expenses that would have been incurred if an investor individually purchased or sold the securities represented in the Index.
Rating Distribution *(7),(8)
By total investments
* The rating distribution presented above includes the ratings of securities held by special purpose vehicles in which the Fund holds a residual interest. See Note 1B to the Fund’s financial statements. Absent such securities, the Fund’s rating distribution at December 31, 2006 is as follows:
AAA | | 48.0 | % | BBB | | 6.3 | % | Non-Rated | | 12.7 | % |
AA | | 16.0 | % | BB | | 0.7 | % | | | | |
A | | 15.9 | % | B | | 0.4 | % | | | | |
(1) Average Annual Total Returns do not include the 4.75% maximum sales charge for Class A shares or the applicable contingent deferred sales charge (CDSC) for Class B and Class C shares. Class I shares are offered to certain investors at net asset value. If sales charges were included, returns would be lower. SEC Average Annual Total Returns for Class A reflect the maximum 4.75% sales charge. SEC returns for Class B shares reflect the applicable CDSC based on the following schedule: 5% - 1st and 2nd years; 4% - 3rd year; 3% - 4th year; 2% - 5th year; 1% - 6th year. SEC return for Class C shares reflects a 1% CDSC for the first year.
(2) The Fund’s distribution rate represents actual distributions paid to shareholders and is calculated by dividing the last distribution per share (annualized) by the net asset value.
(3) Taxable-equivalent figures assume a maximum 35.0% federal income tax rate. A lower tax rate would result in lower tax-equivalent figures.
(4) The Fund’s SEC yield is calculated by dividing the net investment income per share for the 30-day period by the offering price at the end of the period and annualizing the result
(5) It is not possible to invest directly in an Index. The Index’s total return does not reflect the expenses that would have been incurred if an investor individually purchased or sold the securities represented in the Index. Index performance is available as of month end only.
(6) The Lipper Averages are the average annual total returns, at net asset value, of the funds that are in the same Lipper Classification as the Fund. It is not possible to invest in a Lipper Classification. Lipper Classifications may include insured and uninsured funds, as well as leveraged and unleveraged funds. The Lipper General Municipal Debt Funds Classification contained 252, 222, and 140 funds for the 1-year, 5-year and 10-year time periods, respectively. Lipper Averages are available as of month end only.
(7) As of 12/31/06. Rating Distribution is determined by dividing the total market value of the issues by the total investments of the Fund.
(8) As of 12/31/06. Portfolio holdings information includes securities held by special purpose vehicles in which the Fund holds a residual interest. See Note 1B to the Fund’s financial statements. Portfolio information may not be representative of the Fund’s current or future investments and may change due to active management.
2
Eaton Vance AMT-Free Municipal Bond Fund as of December 31, 2006
FUND EXPENSES
Example: As a shareholder of the Fund, you incur two types of costs: (1) transaction costs, including sales charges (loads) on purchases and redemption fees (if applicable); and (2) ongoing costs, including management fees; distribution or service fees; and other Fund expenses. This Example is intended to help you understand your ongoing costs (in dollars) of investing in the Fund and to compare these costs with the ongoing costs of investing in other mutual funds. The Example is based on an investment of $1,000 invested at the beginning of the period and held for the entire period (July 1, 2006 – December 31, 2006).
Actual Expenses: The first section of the table below provides information about actual account values and actual expenses. You may use the information in this section, together with the amount you invested, to estimate the expenses that you paid over the period. Simply divide your account value by $1,000 (for example, an $8,600 account value divided by $1,000 = 8.6), then multiply the result by the number in the first section under the heading entitled "Expenses Paid During Period" to estimate the expenses you paid on your account during this period.
Hypothetical Example for Comparison Purposes: The second section of the table below provides information about hypothetical account values and hypothetical expenses based on the Fund's actual expense ratio and an assumed rate of return of 5% per year (before expenses), which is not the actual return of the Fund. The hypothetical account values and expenses may not be used to estimate the actual ending account balance or expenses you paid for the period. You may use this information to compare the ongoing costs of investing in your Fund and other funds. To do so, compare this 5% hypothetical example with the 5% hypothetical examples that appear in the shareholder reports of the other funds.
Please note that the expenses shown in the table are meant to highlight your ongoing costs only and do not reflect any transactional costs, such as sales charges (loads) or redemption fees (if applicable). Therefore, the second section of the table is useful in comparing ongoing costs only, and will not help you determine the relative total costs of owning different funds. In addition, if these transactional costs were included, your costs would have been higher.
Eaton Vance AMT-Free Municipal Bond Fund
| | | Beginning Account Value
(7/1/06) | | Ending Account Value
(12/31/06) | | Expenses Paid During Period*
(7/1/06 – 12/31/06) | |
| Actual | |
| Class A | | $ | 1,000.00 | | | $ | 1,069.60 | | | $ | 6.31 | | |
| Class B | | $ | 1,000.00 | | | $ | 1,066.00 | | | $ | 10.21 | | |
| Class C | | $ | 1,000.00 | | | $ | 1,066.00 | | | $ | 10.26 | | |
| Class I | | $ | 1,000.00 | | | $ | 1,070.70 | | | $ | 5.01 | | |
| Hypothetical | |
| (5% return per year before expenses) | |
| Class A | | $ | 1,000.00 | | | $ | 1,019.10 | | | $ | 6.16 | | |
| Class B | | $ | 1,000.00 | | | $ | 1,015.30 | | | $ | 9.96 | | |
| Class C | | $ | 1,000.00 | | | $ | 1,015.30 | | | $ | 10.01 | | |
| Class I | | $ | 1,000.00 | | | $ | 1,020.40 | | | $ | 4.89 | | |
* Expenses are equal to the Fund's annualized expense ratio of 1.21% for Class A shares, 1.96% for Class B shares, 1.97% for Class C shares, and 0.96% for Class I shares, multiplied by the average account value over the period, multiplied by 184/365 (to reflect the one-half year period). The example assumes that the $1,000 was invested at the asset value per share determined at the close of business on June 30, 2006.
3
Eaton Vance AMT-Free Municipal Bond Fund as of December 31, 2006
PORTFOLIO OF INVESTMENTS
| Tax-Exempt Investments — 110.6% | | | |
Principal Amount
(000's omitted) | |
Security | |
Value | |
| Education — 2.2% | | | |
| $ | 1,375 | | | Massachusetts Development Finance Agency,
(Boston University), 5.45%, 5/15/59 | | $ | 1,544,042 | | |
| | 2,500 | | | Massachusetts Health and Higher Educational Facilities
Authority, (Harvard University), 5.125%, 7/15/37 | | | 2,642,400 | | |
| | 1,750 | | | Ohio Higher Educational Facilities Authority,
(Oberlin College), Variable Rate, 5.77%, 10/1/29(1)(2) | | | 1,907,570 | | |
| | 6,000 | | | Vermont Educational and Health Buildings Financing Agency,
(Middlebury College), 5.00%, 10/31/46 | | | 6,324,840 | | |
| | | | | | | $ | 12,418,852 | | |
| Electric Utilities — 4.4% | | | |
| $ | 2,100 | | | Mississippi Business Finance Corp., (System Energy
Resources, Inc.), 5.90%, 5/1/22 | | $ | 2,100,273 | | |
| | 5,000 | | | North Carolina Municipal Power Agency No. 1,
(Catawba Electric), 5.50%, 1/1/14 | | | 5,387,200 | | |
| | 2,100 | | | Sabine River Authority, TX, (TXU Energy Co. LLC),
5.20%, 5/1/28 | | | 2,178,939 | | |
| | 9,000 | | | Salt River Project, AZ, Agricultural Improvements and
Power District, 5.00%, 1/1/31(3)(4) | | | 9,451,764 | | |
| | 2,000 | | | Sam Rayburn, TX, Municipal Power Agency,
6.00%, 10/1/21 | | | 2,124,960 | | |
| | 4,435 | | | San Antonio, TX, Electric and Natural Gas, 4.50%, 2/1/21 | | | 4,457,219 | | |
| | | | | | | $ | 25,700,355 | | |
| Escrowed / Prerefunded — 6.4% | | | |
| $ | 3,000 | | | Allegheny County, PA, Industrial Development Authority,
(Residential Resources, Inc.), Prerefunded to 9/1/11,
6.50%, 9/1/21 | | $ | 3,352,410 | | |
| | 1,500 | | | Capital Trust Agency, FL, (Seminole Tribe Convention),
Prerefunded to 10/1/12, 8.95%, 10/1/33(2) | | | 1,843,485 | | |
| | 14,000 | | | Dawson Ridge, CO, Metropolitan District #1,
Escrowed to Maturity, 0.00%, 10/1/22 | | | 7,095,760 | | |
| | 1,300 | | | Florida Capital Projects Finance Authority, Student Housing
Revenue, (Florida University), Prerefunded to
8/15/10, 7.75%, 8/15/20 | | | 1,473,940 | | |
| | 10,000 | | | Foothill/Eastern Transportation Corridor Agency, CA,
Escrowed to Maturity, 0.00%, 1/1/18 | | | 6,383,800 | | |
| | 1,180 | | | Grove City, PA, Area Hospital Authority, (Grove Manor),
Prerefunded to 8/15/08, 6.625%, 8/15/29 | | | 1,237,336 | | |
| | 1,000 | | | Maricopa County, AZ, Industrial Development Authority,
(Place Five and The Greenery), Escrowed to Maturity,
8.625%, 1/1/27 | | | 1,045,700 | | |
Principal Amount
(000's omitted) | |
Security | |
Value | |
| Escrowed / Prerefunded (continued) | | | |
| $ | 5,500 | | | Massachusetts Turnpike Authority, Escrowed to Maturity,
5.00%, 1/1/20(5) | | $ | 6,005,010 | | |
| | 434 | | | New York, NY, Prerefunded to 6/1/13, 5.25%,
6/1/28(3)(4) | | | 461,218 | | |
| | 2,500 | | | San Joaquin Hills Transportation Corridor Agency, CA,
Toll Road Bonds, Escrowed to Maturity, 0.00%, 1/1/14 | | | 1,919,175 | | |
| | 6,000 | | | Savannah, GA, Economic Development Authority,
Escrowed to Maturity, 0.00%, 12/1/21 | | | 3,161,520 | | |
| | 625 | | | Sullivan County, TN, Health, Education and Housing
Facility Board, (Wellmont Health System),
Prerefunded to 9/1/12, 6.25%, 9/1/22 | | | 704,244 | | |
| | 375 | | | Sullivan County, TN, Health, Education and Housing
Facility Board, (Wellmont Health System),
Prerefunded to 9/1/12, 6.25%, 9/1/22 | | | 422,546 | | |
| | 1,620 | | | Wisconsin Health and Educational Facilities Authority,
(Wisconsin Illinois Senior Housing),
Prerefunded to 8/1/09, 7.00%, 8/1/29 | | | 1,750,928 | | |
| | | | | | | $ | 36,857,072 | | |
| General Obligations — 8.0% | | | |
| $ | 5,900 | | | Baltimore County, MD, (Metropolitan District), 4.25%,
9/1/36 | | $ | 5,806,721 | | |
| | 2,600 | | | California, 5.25%, 4/1/30 | | | 2,740,530 | | |
| | 3,000 | | | California, 5.25%, 2/1/33 | | | 3,183,300 | | |
| | 2,380 | | | California, 5.50%, 11/1/33 | | | 2,609,527 | | |
| | 4,365 | | | Georgia, 1.00%, 3/1/26 | | | 2,474,431 | | |
| | 5,000 | | | Harlandale, TX, Independent School District, 4.75%,
8/15/40 | | | 5,106,350 | | |
| | 10,540 | | | New York, NY, 4.25%, 1/1/28(6) | | | 10,177,424 | | |
| | 5,405 | | | New York, NY, 5.00%, 6/1/30 | | | 5,685,790 | | |
| | 4,741 | | | New York, NY, 5.25%, 6/1/28(3)(4) | | | 5,042,136 | | |
| | 4,000 | | | South Carolina, 3.25%, 8/1/30 | | | 3,352,320 | | |
| | | | | | | $ | 46,178,529 | | |
| Health Care-Miscellaneous — 0.7% | | | |
| $ | 200 | | | Suffolk County, NY, Industrial Development Agency,
Civic Facility Revenue, (Alliance of Long Island Agencies),
7.50%, 9/1/15 | | $ | 215,508 | | |
| | 115 | | | Suffolk County, NY, Industrial Development Agency,
Civic Facility Revenue, (Alliance of Long Island Agencies),
7.50%, 9/1/15 | | | 123,917 | | |
| | 100 | | | Suffolk County, NY, Industrial Development Agency,
Civic Facility Revenue, (Alliance of Long Island Agencies),
7.50%, 9/1/15 | | | 107,754 | | |
| | 1,704 | | | Tax Revenue Exempt Securities Trust, Community
Health Provider, (Pooled Loan Program Various States
Trust Certificates), 5.50%, 12/1/36 | | | 1,819,446 | | |
See notes to financial statements
4
Eaton Vance AMT-Free Municipal Bond Fund as of December 31, 2006
PORTFOLIO OF INVESTMENTS CONT'D
Principal Amount
(000's omitted) | |
Security | |
Value | |
| Health Care-Miscellaneous (continued) | | | |
| $ | 1,431 | | | Tax Revenue Exempt Securities Trust, Community Health
Provider, (Pooled Loan Program Various States Trust
Certificates), 5.50%, 12/1/36 | | $ | 1,477,399 | | |
| | 424 | | | Tax Revenue Exempt Securities Trust, Community Health
Provider, (Pooled Loan Program Various States Trust
Certificates), 6.00%, 12/1/36 | | | 459,237 | | |
| | | | | | | $ | 4,203,261 | | |
| Hospital — 21.1% | | | |
| $ | 2,000 | | | Brevard County, FL, Health Facilities Authority,
(Health First, Inc.), 5.00%, 4/1/36 | | $ | 2,069,520 | | |
| | 5,600 | | | California Health Facilities Financing Authority,
(Cedars-Sinai Medical Center), 5.00%, 11/15/34 | | | 5,826,072 | | |
| | 2,500 | | | California Health Facilities Financing Authority,
(Kaiser Foundation Health Plan), 5.00%, 4/1/37 | | | 2,607,075 | | |
| | 1,800 | | | California Statewide Communities Development Authority,
(Huntington Memorial Hospital), 5.00%, 7/1/27 | | | 1,883,088 | | |
| | 2,000 | | | California Statewide Communities Development Authority,
(John Muir Health), 5.00%, 8/15/36 | | | 2,082,880 | | |
| | 3,080 | | | California Statewide Communities Development Authority,
(Kaiser Permanente), 5.00%, 3/1/41 | | | 3,200,366 | | |
| | 7,000 | | | California Statewide Communities Development Authority,
(Kaiser Permanente), 5.25%, 3/1/45 | | | 7,421,890 | | |
| | 500 | | | Camden County, NJ, Improvement Authority,
(Cooper Health System), 5.00%, 2/15/25 | | | 515,635 | | |
| | 1,080 | | | Camden County, NJ, Improvement Authority,
(Cooper Health System), 5.00%, 2/15/35 | | | 1,103,382 | | |
| | 1,000 | | | Camden County, NJ, Improvement Authority,
(Cooper Health System), 5.25%, 2/15/27 | | | 1,049,490 | | |
| | 980 | | | Chautauqua County, NY, Industrial Development Agency,
(Women's Christian Association), 6.40%, 11/15/29 | | | 1,028,784 | | |
| | 5,875 | | | Highlands County, FL, Health Facilities Authority,
(Adventist Health System), 5.00%, 11/15/35 | | | 6,072,987 | | |
| | 1,500 | | | Highlands County, FL, Health Facilities Authority,
(Adventist Health System), 5.375%, 11/15/35 | | | 1,648,890 | | |
| | 13,620 | | | Indiana Health and Educational Facilities Authority,
(Ascension Health), 5.00%, 11/15/36(3)(4) | | | 14,329,693 | | |
| | 1,060 | | | Indiana Health and Educational Facilities Authority,
(Clarian Health Partners), 4.75%, 2/15/34 | | | 1,068,151 | | |
| | 470 | | | Indiana Health and Educational Facilities Authority,
(Clarian Health Partners), 5.00%, 2/15/36 | | | 485,806 | | |
| | 1,000 | | | Indiana Health and Educational Facilities Authority,
(Clarian Health Partners), 5.00%, 2/15/39 | | | 1,031,900 | | |
| | 3,000 | | | Knox County, TN, Health, Educational and Housing
Facilities Board, (Covenant Health), 0.00%, 1/1/38 | | | 641,010 | | |
| | 10,410 | | | Knox County, TN, Health, Educational and Housing
Facilities Board, (Covenant Health), 0.00%, 1/1/42 | | | 1,802,908 | | |
| | 800 | | | Louisiana Public Facilities Authority, (Ochsner Clinic
Foundation Project), 5.50%, 5/15/32 | | | 849,408 | | |
Principal Amount
(000's omitted) | |
Security | |
Value | |
| Hospital (continued) | | | |
| $ | 4,150 | | | Maricopa County, AZ, Industrial Development Authority,
(Catholic Healthcare), 5.50%, 7/1/26 | | $ | 4,456,934 | | |
| | 2,725 | | | Maryland Health and Higher Educational Facilities Authority,
(King Farm Presbyterian Community), 5.00%, 1/1/17(6) | | | 2,728,079 | | |
| | 7,630 | | | Maryland Health and Higher Educational Facilities Authority,
(Peninsula Regional Medical Center), 5.00%, 7/1/36 | | | 8,027,904 | | |
| | 5,000 | | | Michigan Hospital Finance Authority, (Henry Ford Health
System), 5.00%, 11/15/38 | | | 5,195,350 | | |
| | 10,000 | | | Michigan Hospital Finance Authority, (McLaren Healthcare),
5.00%, 8/1/35 | | | 10,363,400 | | |
| | 3,000 | | | New Jersey Health Care Facilities Financing Authority,
(Trinitas Hospital), 7.50%, 7/1/30 | | | 3,330,510 | | |
| | 7,710 | | | New York Dormitory Authority, (Memorial Sloan-Kettering
Cancer Center), 4.75%, 7/1/28(3)(4) | | | 7,987,534 | | |
| | 1,575 | | | Oneida County, NY, Industrial Development Agency,
(St. Elizabeth Medical Center), 5.75%, 12/1/19 | | | 1,612,202 | | |
| | 265 | | | Prince George's County, MD, (Greater Southeast
Healthcare System), 6.20%, 1/1/08(7) | | | 7,791 | | |
| | 1,030 | | | Prince George's County, MD, (Greater Southeast Healthcare
System), 6.375%, 1/1/23(7) | | | 30,282 | | |
| | 2,270 | | | Rochester, MN, Health Care Facilities, (Mayo Clinic),
5.50%, 11/15/27(3)(4) | | | 2,343,389 | | |
| | 1,100 | | | San Benito, CA, Health Care District, 5.40%, 10/1/20 | | | 1,112,518 | | |
| | 1,375 | | | Tangipahoa Parish, LA, Hospital Service District No.1,
(North Oaks Medical Center), 5.00%, 2/1/30 | | | 1,416,896 | | |
| | 16,000 | | | Tulsa County, OK, Industrial Authority,
(St. Francis Health System), 5.00%, 12/15/36 | | | 16,721,280 | | |
| | | | | | | $ | 122,053,004 | | |
| Housing — 1.3% | | | |
| $ | 1,000 | | | Capital Trust Agency, FL, (Atlantic Housing Foundation),
5.30%, 7/1/35 | | $ | 1,020,650 | | |
| | 1,020 | | | Capital Trust Agency, FL, (Atlantic Housing Foundation),
5.35%, 7/1/40 | | | 1,038,697 | | |
| | 2,500 | | | Georgia Private Colleges and Universities Authority, Student
Housing Revenue, (Mercer Housing Corp.), 6.00%, 6/1/31 | | | 2,670,850 | | |
| | 1,265 | | | Lake Creek, CO, (Affordable Housing Corp.), 6.25%,
12/1/23 | | | 1,327,263 | | |
| | 1,085 | | | North Little Rock, AR, Residential Housing Facilities,
(Parkstone Place), 6.50%, 8/1/21 | | | 1,121,977 | | |
| | 285 | | | Texas Student Housing Corp., (University of Northern
Texas), 9.375%, 7/1/07(7) | | | 276,878 | | |
| | | | | | | $ | 7,456,315 | | |
| Industrial Development Revenue — 3.6% | | | |
| $ | 200 | | | Florence County, SC, (Stone Container), 7.375%, 2/1/07 | | $ | 200,330 | | |
| | 945 | | | Hardeman County, TN, (Correctional Facilities Corp.),
7.75%, 8/1/17 | | | 972,518 | | |
See notes to financial statements
5
Eaton Vance AMT-Free Municipal Bond Fund as of December 31, 2006
PORTFOLIO OF INVESTMENTS CONT'D
Principal Amount
(000's omitted) | |
Security | |
Value | |
| Industrial Development Revenue (continued) | | | |
| $ | 6,000 | | | Liberty, NY, Development Corp., (Goldman Sachs
Group, Inc.), 5.25%, 10/1/35 | | $ | 6,962,520 | | |
| | 6,495 | | | Liberty, NY, Development Corp., (Goldman Sachs
Group, Inc.), 5.25%, 10/1/35(3)(4) | | | 7,536,950 | | |
| | 2,500 | | | Nez Perce County, ID, Pollution Control, 7.00%, 12/1/14 | | | 2,835,725 | | |
| | 2,450 | | | Port Camas-Washougan, WA, (James River),
6.70%, 4/1/23 | | | 2,452,548 | | |
| | | | | | | $ | 20,960,591 | | |
| Insured-Education — 2.8% | | | |
| $ | 8,000 | | | Alabama State University, (XLCA), 4.625%, 8/1/36 | | $ | 8,030,480 | | |
| | 1,620 | | | Broward County, FL, Educational Facilities Authority,
(Nova Southeastern University), (AGC), 4.50%, 4/1/36 | | | 1,602,990 | | |
| | 3,130 | | | Pennsylvania Higher Educational Facilities Authority,
(Temple University), (MBIA), 4.50%, 4/1/36 | | | 3,133,318 | | |
| | 1,570 | | | University of California, (MBIA), 4.75%, 5/15/37 | | | 1,619,596 | | |
| | 1,750 | | | Virginia College Building Authority, (Washington and
Lee University), (MBIA), 5.25%, 1/1/31(8) | | | 2,051,123 | | |
| | | | | | | $ | 16,437,507 | | |
| Insured-Electric Utilities — 5.3% | | | |
| $ | 2,000 | | | Burlington, KS, Pollution Control Revenue, (Kansas Gas &
Electric Co.), (MBIA), 5.30%, 6/1/31 | | $ | 2,150,200 | | |
| | 5,190 | | | Energy Northwest, WA, Wind Project, (AMBAC),
4.50%, 7/1/30 | | | 5,112,254 | | |
| | 5,000 | | | Lakeland, FL, Energy System, (XLCA), 4.75%, 10/1/36 | | | 5,139,250 | | |
| | 2,865 | | | Ohio Municipal Electric Generation Agency, (MBIA),
0.00%, 2/15/29 | | | 1,086,551 | | |
| | 5,000 | | | Omaha, NE, Public Power District, (FGIC), 4.75%, 2/1/36 | | | 5,146,750 | | |
| | 11,760 | | | Springfield, MO, Public Utility, (FGIC), 4.50%, 8/1/36 | | | 11,730,953 | | |
| | | | | | | $ | 30,365,958 | | |
| Insured-Escrowed/Prerefunded — 1.6% | | | |
| $ | 3,449 | | | California, (AMBAC), Prerefunded to 10/1/10, 5.50%,
10/1/30(3)(4) | | $ | 3,683,416 | | |
| | 792 | | | California, (AMBAC), Prerefunded to 10/1/10, 5.50%,
10/1/30(3)(4) | | | 847,386 | | |
| | 259 | | | California, (AMBAC), Prerefunded to 10/1/10, 5.50%,
10/1/30(3)(4) | | | 277,178 | | |
| | 4,500 | | | New Jersey Turnpike Authority, (MBIA), Prerefunded to
1/1/10, 5.50%, 1/1/30(3)(4) | | | 4,738,215 | | |
| | | | | | | $ | 9,546,195 | | |
Principal Amount
(000's omitted) | |
Security | |
Value | |
| Insured-General Obligations — 8.4% | | | |
| $ | 2,250 | | | California, (AMBAC), 5.00%, 2/1/28(3)(4) | | $ | 2,545,965 | | |
| | 1,320 | | | California, (AMBAC), Variable Rate, 7.368%, 5/1/26(2)(9) | | | 1,588,435 | | |
| | 2,500 | | | California, (FGIC), 5.75%, 12/1/29(3)(4) | | | 2,642,035 | | |
| | 5,400 | | | Connecticut, (AMBAC), 5.25%, 6/1/19(3)(4) | | | 6,137,856 | | |
| | 5,000 | | | Frisco, TX, Independent School District, (FSA),
4.00%, 8/15/40 | | | 4,516,600 | | |
| | 2,500 | | | Georgia, (MBIA), 2.00%, 9/1/24 | | | 1,797,000 | | |
| | 6,685 | | | Harrisonburg, VA, (FSA), 4.25%, 2/1/33 | | | 6,514,867 | | |
| | 3,835 | | | McKay Landing Metropolitan District No. 2, CO, (AMBAC),
4.25%, 12/1/36 | | | 3,699,471 | | |
| | 2,340 | | | Merced, CA, Union High School District, (FGIC),
0.00%, 8/1/20 | | | 1,319,620 | | |
| | 1,865 | | | Montgomery County, TX, (Municipal Utility District No. 46
Waterworks and Sewer), (AMBAC), 4.00%, 3/1/30 | | | 1,735,383 | | |
| | 2,500 | | | North Las Vegas Wastewater Reclamation System, (MBIA),
4.25%, 10/1/33 | | | 2,405,075 | | |
| | 1,895 | | | Phoenix, AZ, (AMBAC), 3.00%, 7/1/28 | | | 1,530,800 | | |
| | 5,000 | | | St. Louis, MO, Board of Education, (FSA), 0.00%, 4/1/15 | | | 3,612,850 | | |
| | 4,360 | | | Texas, (Transportation Commission-Mobility Fund), (FGIC),
4.50%, 4/1/30 | | | 4,365,058 | | |
| | 3,955 | | | Texas, (Transportation Commission-Mobility Fund), (FGIC),
4.50%, 4/1/35 | | | 3,932,812 | | |
| | | | | | | $ | 48,343,827 | | |
| Insured-Hospital — 3.5% | | | |
| $ | 11,230 | | | Harrisonburg, VA, Industrial Development Authority,
(Rockingham Memorial Hospital), (AMBAC),
4.50%, 8/15/36 | | $ | 11,129,604 | | |
| | 3,780 | | | Maryland Health and Higher Educational Facilities Authority,
(Medlantic), (AMBAC), 5.25%, 8/15/38(3)(4) | | | 4,459,871 | | |
| | 2,400 | | | Maryland Health and Higher Educational Facilities Authority,
(Medlantic/Helix Issue), (FSA), 5.25%, 8/15/38(3)(4) | | | 2,831,664 | | |
| | 2,005 | | | Washington Health Care Facilities Authority,
(Providence Health Care), (FGIC), 4.50%, 10/1/35 | | | 1,974,644 | | |
| | | | | | | $ | 20,395,783 | | |
Insured-Lease Revenue / Certificates of
Participation — 1.2% | | | |
| $ | 10,000 | | | Anaheim, CA, Public Financing Authority Lease Revenue,
(FSA), 0.00%, 9/1/31 | | $ | 3,319,500 | | |
| | 2,145 | | | Jackson County, MO, Leasehold Revenue, (Truman Sports),
(AMBAC), 4.50%, 12/1/31 | | | 2,150,899 | | |
| | 2,500 | | | Saint Louis, MO, Industrial Development Authority,
(Convention Center Hotel), (AMBAC), 0.00%, 7/15/19 | | | 1,482,375 | | |
| | | | | | | $ | 6,952,774 | | |
See notes to financial statements
6
Eaton Vance AMT-Free Municipal Bond Fund as of December 31, 2006
PORTFOLIO OF INVESTMENTS CONT'D
Principal Amount
(000's omitted) | |
Security | |
Value | |
| Insured-Other Revenue — 3.3% | | | |
| $ | 3,000 | | | Golden State Tobacco Securitization Corp., CA, (FGIC),
5.00%, 6/1/35 | | $ | 3,169,770 | | |
| | 5,200 | | | Massachusetts Development Finance Agency, (WGBH
Educational Foundation), (AMBAC), 5.75%, 1/1/42 | | | 6,586,008 | | |
| | 5,000 | | | New York City Industrial Development Agency,
(Queens Baseball Stadium), (AMBAC), 4.75%, 1/1/42 | | | 5,146,500 | | |
| | 4,250 | | | New York City Industrial Development Agency,
(Yankee Stadium), (FGIC), 4.50%, 3/1/39 | | | 4,260,328 | | |
| | | | | | | $ | 19,162,606 | | |
| Insured-Special Tax Revenue — 3.7% | | | |
| $ | 6,000 | | | Ceres, CA, Redevelopment Agency, (Ceres Redevelopment
Project Area No. 1), (AMBAC), 4.00%, 11/1/31 | | $ | 5,566,500 | | |
| | 4,000 | | | Hamilton County, OH, Sales Tax, (AMBAC),
0.00%, 12/1/22 | | | 2,028,600 | | |
| | 8,165 | | | Louisiana Gas and Fuels Tax, (FSA), 4.75%, 5/1/39 | | | 8,378,351 | | |
| | 3,400 | | | New York Convention Center Development Corp.,
Hotel Occupancy Tax, (AMBAC), 4.75%, 11/15/45 | | | 3,485,510 | | |
| | 7,000 | | | Puerto Rico Infrastructure Financing Authority, (AMBAC),
0.00%, 7/1/34 | | | 2,070,530 | | |
| | | | | | | $ | 21,529,491 | | |
| Insured-Transportation — 8.0% | | | |
| $ | 4,905 | | | Alabama State Dock Authority, (MBIA),
4.50%, 10/1/36(8) | | $ | 4,860,953 | | |
| | 1,000 | | | Central, TX, Regional Mobility Authority, (FGIC),
5.00%, 1/1/45 | | | 1,040,460 | | |
| | 7,120 | | | E-470 Public Highway Authority, CO, (MBIA),
0.00%, 9/1/39 | | | 1,476,617 | | |
| | 7,295 | | | Harris County, Toll Road Senior Lien, (MBIA),
4.50%, 8/15/36 | | | 7,253,273 | | |
| | 12,000 | | | Hudson Yards Infrastructure Corp., NY, (MBIA),
4.50%, 2/15/47 | | | 11,977,320 | | |
| | 3,890 | | | Metropolitan Washington, DC, Airport Authority System,
(FGIC), 4.375%, 10/1/32 | | | 3,794,617 | | |
| | 1,930 | | | Ohio Turnpike Commission, (FGIC), 5.50%, 2/15/26 | | | 2,287,127 | | |
| | 1,500 | | | Puerto Rico Highway and Transportation Authority, (AGC),
5.00%, 7/1/40 | | | 1,581,135 | | |
| | 1,500 | | | Puerto Rico Highway and Transportation Authority, (AGC),
5.00%, 7/1/45 | | | 1,580,145 | | |
| | 2,600 | | | Regional Transportation Authority, IL, (MBIA),
4.50%, 7/1/35 | | | 2,585,518 | | |
| | 1,030 | | | South Jersey Transportation Authority, (FGIC),
4.50%, 11/1/35 | | | 1,034,800 | | |
| | 1,535 | | | Tampa-Hillsborough County, FL, Expressway Authority,
(AMBAC), 4.00%, 7/1/34 | | | 1,428,333 | | |
| | 10,000 | | | Texas Turnpike Authority, (Central Texas Turnpike System),
(AMBAC), 0.00%, 8/15/21 | | | 5,351,600 | | |
| | | | | | | $ | 46,251,898 | | |
Principal Amount
(000's omitted) | |
Security | |
Value | |
| Insured-Water and Sewer — 2.8% | | | |
| $ | 5,000 | | | Detroit, MI, Water Supply System, (FSA),
5.00%, 7/1/33(8) | | $ | 5,308,800 | | |
| | 1,100 | | | Fort Lauderdale, FL, Water and Sewer, (MBIA),
4.25%, 9/1/33 | | | 1,056,649 | | |
| | 2,940 | | | Marysville, OH, Wastewater Treatment System, (XLCA),
4.75%, 12/1/46 | | | 2,998,447 | | |
| | 3,510 | | | New York, NY, Environmental Facilities Corp., (MBIA),
4.25%, 6/15/27 | | | 3,469,740 | | |
| | 3,490 | | | San Francisco, CA, City and County Public Utilities
Commission, (FSA), 4.25%, 11/1/33 | | | 3,383,764 | | |
| | | | | | | $ | 16,217,400 | | |
| Insured-Water Revenue — 0.6% | | | |
| $ | 3,500 | | | Seattle, WA, Water System, (FSA), 4.50%, 2/1/37 | | $ | 3,485,580 | | |
| | | | | | | $ | 3,485,580 | | |
| Nursing Home — 0.9% | | | |
| $ | 770 | | | Clovis, NM, Industrial Development Revenue, (Retirement
Ranches, Inc.), 7.75%, 4/1/19(8) | | $ | 802,995 | | |
| | 1,075 | | | Massachusetts Industrial Finance Agency, (Age Institute of
Massachusetts), 8.05%, 11/1/25 | | | 1,095,339 | | |
| | 1,090 | | | Montgomery, PA, Industrial Development Authority,
(Advancement of Geriatric Health Care Institute),
8.375%, 7/1/23 | | | 1,091,766 | | |
| | 2,000 | | | Orange County, FL, Health Facilities Authority,
(Westminster Community Care), 6.60%, 4/1/24 | | | 2,082,540 | | |
| | | | | | | $ | 5,072,640 | | |
| Other Revenue — 6.2% | | | |
| $ | 1,000 | | | Barona, CA, (Band of Mission Indians), 8.25%, 1/1/20(2) | | $ | 1,042,110 | | |
| | 2,805 | | | California Statewide Communities Development Authority,
(East Valley Tourist Development Authority),
8.25%, 10/1/14(2) | | | 3,018,573 | | |
| | 1,220 | | | Central Falls, RI, Detention Facility Revenue,
7.25%, 7/15/35 | | | 1,374,001 | | |
| | 3,600 | | | Golden State Tobacco Securitization Corp., CA,
5.00%, 6/1/45 | | | 3,741,516 | | |
| | 10,000 | | | Golden State Tobacco Securitization Corp., CA,
5.50%, 6/1/33(3)(4) | | | 11,065,400 | | |
| | 1,000 | | | Mohegan Tribe Indians, CT, Gaming Authority,
(Public Improvements), 6.25%, 1/1/21(2) | | | 1,069,960 | | |
| | 2,300 | | | Northern Tobacco Securitization Corp., AK, 0.00%, 6/1/46 | | | 218,017 | | |
| | 6,080 | | | Northern Tobacco Securitization Corp., AK, 5.00%, 6/1/46 | | | 6,153,021 | | |
| | 943 | | | Santa Fe, NM, (Crow Hobbs), 8.50%, 9/1/16 | | | 982,536 | | |
| | 3,000 | | | Tobacco Settlement Financing Corp., NJ, 6.75%, 6/1/39(3)(4) | | | 3,439,500 | | |
| | 3,000 | | | Tobacco Settlement Financing Corp., VA,
5.625%, 6/1/37(3)(4) | | | 3,212,810 | | |
See notes to financial statements
7
Eaton Vance AMT-Free Municipal Bond Fund as of December 31, 2006
PORTFOLIO OF INVESTMENTS CONT'D
Principal Amount
(000's omitted) | |
Security | |
Value | |
| Other Revenue (continued) | | | |
| $ | 250 | | | Willacy County, TX, Local Government Corp.,
6.00%, 3/1/09 | | $ | 254,165 | | |
| | | | | | | $ | 35,571,609 | | |
| Senior Living / Life Care — 2.1% | | | |
| $ | 335 | | | Albuquerque, NM, Retirement Facilities, (La Vida Liena
Retirement Center), 5.75%, 12/15/28 | | $ | 346,440 | | |
| | 1,395 | | | Albuquerque, NM, Retirement Facilities, (La Vida Liena
Retirement Center), 6.60%, 12/15/28 | | | 1,454,790 | | |
| | 3,300 | | | Colorado Health Facilities Authority, (Covenant Retirement
Communities, Inc.), 5.00%, 12/1/35 | | | 3,365,571 | | |
| | 1,500 | | | Kansas City, MO, Industrial Development Authority,
(Kingswood United Methodist Manor), 5.875%, 11/15/29 | | | 1,507,875 | | |
| | 1,500 | | | New Jersey Economic Development Authority,
(Fellowship Village), 5.50%, 1/1/25 | | | 1,526,745 | | |
| | 1,500 | | | North Miami, FL, Health Care Facilities Authority,
(Imperial Club), 6.125%, 1/1/42(6) | | | 1,503,990 | | |
| | 1,440 | | | North Miami, FL, Health Care Facilities Authority,
(Imperial Club), 6.75%, 1/1/33(8) | | | 1,442,405 | | |
| | 980 | | | St. Paul, MN, Housing and Redevelopment, (Care Institute,
Inc. - Highland), 8.75%, 11/1/24(10) | | | 845,544 | | |
| | | | | | | $ | 11,993,360 | | |
| Special Tax Revenue — 4.4% | | | |
| $ | 2,500 | | | Baltimore, MD, (Clipper Mill), 6.25%, 9/1/33 | | $ | 2,728,200 | | |
| | 750 | | | Baltimore, MD, (Strathdale Manor), 7.00%, 7/1/33 | | | 841,643 | | |
| | 1,465 | | | Bell Mountain Ranch, CO, Metropolitan District,
6.625%, 11/15/25 | | | 1,558,848 | | |
| | 1,250 | | | Bridgeville, DE, (Heritage Shores Special
Development District), 5.45%, 7/1/35 | | | 1,263,975 | | |
| | 1,000 | | | Capistrano, CA, Unified School District, 6.00%, 9/1/33 | | | 1,059,840 | | |
| | 2,000 | | | Cleveland-Cuyahoga County, OH, Port Authority,
7.00%, 12/1/18 | | | 2,199,740 | | |
| | 1,500 | | | Frederick County, MD, Urbana Community Development
Authority, 6.625%, 7/1/25 | | | 1,542,420 | | |
| | 435 | | | Heritage Harbour, FL, South Community Development
District, Capital Improvements, 5.25%, 11/1/08 | | | 436,183 | | |
| | 640 | | | Jurupa, CA, Community Services District, (Community
Facilities District No. 16), 5.30%, 9/1/34 | | | 652,006 | | |
| | 1,420 | | | Lincoln, CA, Public Financing Authority, (Twelve Bridges),
6.20%, 9/2/25 | | | 1,491,653 | | |
| | 6,300 | | | New Jersey Economic Development Authority,
(Cigarette Tax), 5.75%, 6/15/34(3)(4) | | | 6,781,068 | | |
| | 1,200 | | | New York City, NY, Transitional Finance Authority,
4.75%, 11/1/23 | | | 1,234,032 | | |
| | 2,485 | | | River Hall Community Development District, FL,
(Capital Improvements), 5.45%, 5/1/36 | | | 2,514,000 | | |
Principal Amount
(000's omitted) | |
Security | |
Value | |
| Special Tax Revenue (continued) | | | |
| $ | 1,000 | | | Tiverton, RI, Obligation Tax Increment, (Mount Hope
Bay Village), 6.875%, 5/1/22 | | $ | 1,087,780 | | |
| | | | | | | $ | 25,391,388 | | |
| Transportation — 1.8% | | | |
| $ | 9,570 | | | Hudson Yards Infrastructure Corp., NY, 5.00%, 2/15/47 | | $ | 10,126,208 | | |
| | | | | | | $ | 10,126,208 | | |
| Water and Sewer — 1.1% | | | |
| $ | 3,075 | | | Massachusetts Water Resources Authority, 4.00%, 8/1/46 | | $ | 2,751,879 | | |
| | 3,750 | | | New York City Municipal Water Finance Authority,
4.75%, 6/15/38 | | | 3,863,775 | | |
| | | | | | | $ | 6,615,654 | | |
| Water Revenue — 5.2% | | | |
| $ | 16,200 | | | Metropolitan Water District of Southern California,
(Waterworks Revenue Authorization), 4.75%, 7/1/36(3)(4) | | $ | 16,847,271 | | |
| | 13,290 | | | New York State Environmental Facilities Corp., Clean Water,
(Municipal Water Finance), 4.50%, 6/15/36 | | | 13,305,018 | | |
| | | | | | | $ | 30,152,289 | | |
Total Tax-Exempt Investments — 110.6%
(identified cost $609,466,753) | | $ | 639,440,146 | | |
| Short-Term Investments — 1.2% | | | |
Principal Amount
(000's omitted) | |
Security | |
Value | |
| $ | 7,000 | | | Connecticut State Health and Educational Facilities Authority,
(Yale University), Variable Rate, 3.35%, 7/1/37 | | $ | 7,000,000 | | |
Total Short-Term Investments
(at amortized cost, $7,000,000) | | $ | 7,000,000 | | |
Total Investments — 111.8%
(identified cost $616,514,245) | | $ | 646,440,146 | | |
| Other Assets, Less Liabilities — (11.8)% | | $ | (68,400,095 | ) | |
| Net Assets — 100.0% | | $ | 578,040,051 | | |
AGC - Assured Guaranty Corp.
AMBAC - AMBAC Financial Group, Inc.
FGIC - Financial Guaranty Insurance Company
FSA - Financial Security Assurance, Inc.
MBIA - Municipal Bond Insurance Association
XLCA - XL Capital Assurance, Inc.
See notes to financial statements
8
Eaton Vance AMT-Free Municipal Bond Fund as of December 31, 2006
PORTFOLIO OF INVESTMENTS CONT'D
At December 31, 2006, the concentration of the Fund's investments in the various states, determined as a percentage of net assets, is as follows:
| California | | | 19.0 | % | |
| New York | | | 18.0 | % | |
| Others, representing less than 10% individually | | | 74.8 | % | |
The Fund invests primarily in debt securities issued by municipalities. The ability of the issuers of the debt securities to meet their obligations may be affected by economic developments in a specific industry or municipality. In order to reduce the risk associated with such economic developments, at December 31, 2006, 36.9% of total investments are backed by bond insurance of various financial institutions and financial guaranty assurance agencies. The aggregate percentage insured by an individual financial institution ranged from 0.7% to 12.1% of total investments.
(1) Security has been issued as an inverse floater bond. The stated interest rate represents the rate in effect at December 31, 2006.
(2) Security exempt from registration under Rule 144A of the Securities Act of 1933. These securities may be sold in transactions exempt from registration, normally to qualified institutional buyers. At December 31, 2006, the aggregate value of the securities is $10,470,133 or 1.8% of the Fund's net assets.
(3) Security valued at fair value using methods determined in good faith by or at the direction of the Trustees.
(4) Security represents the underlying municipal obligation of an inverse floating rate obligation held by the Fund.
(5) Security (or a portion thereof) has been segregated to cover margin requirements on open financial futures contracts.
(6) When-issued security.
(7) Defaulted bond.
(8) Security (or a portion thereof) has been segregated to cover when-issued securities.
(9) Security has been issued as a leveraged inverse floater bond. The stated interest rate represents the rate in effect at December 31, 2006.
(10) Security is in default with respect to principal payments.
See notes to financial statements
9
Eaton Vance AMT-Free Municipal Bond Fund as of December 31, 2006
FINANCIAL STATEMENTS
Statement of Assets and Liabilities
As of December 31, 2006
| Assets | |
| Investments, at value (identified cost, $616,514,245) | | $ | 646,440,146 | | |
| Cash | | | 3,367,860 | | |
| Receivable for investments sold | | | 50,316 | | |
| Receivable for Fund shares sold | | | 9,532,077 | | |
| Interest receivable | | | 7,065,439 | | |
| Receivable for daily variation margin on open financial futures contracts | | | 102,938 | | |
| Receivable for open interest rate swap contracts | | | 66,960 | | |
| Total assets | | $ | 666,625,736 | | |
| Liabilities | |
| Payable for floating rate notes issued | | $ | 71,730,000 | | |
| Payable for when-issued securities | | | 14,384,245 | | |
| Dividends payable | | | 779,469 | | |
| Interest expense and fees payable | | | 710,086 | | |
| Payable for Fund shares redeemed | | | 356,648 | | |
| Payable to affiliate for distribution and service fees | | | 294,090 | | |
| Payable to affiliate for investment advisory fees | | | 205,812 | | |
| Payable to affiliate for Trustees' fees | | | 4,381 | | |
| Accrued expenses | | | 120,954 | | |
| Total liabilities | | $ | 88,585,685 | | |
| Net assets | | $ | 578,040,051 | | |
| Sources of Net Assets | |
| Paid-in capital | | $ | 553,505,262 | | |
| Accumulated net realized loss (computed on the basis of identified cost) | | | (8,580,375 | ) | |
| Accumulated undistributed net investment income | | | 118,709 | | |
| Net unrealized appreciation (computed on the basis of identified cost) | | | 32,996,455 | | |
| Total | | $ | 578,040,051 | | |
| Class A Shares | |
| Net Assets | | $ | 407,852,185 | | |
| Shares Outstanding | | | 40,134,865 | | |
Net Asset Value and Redemption Price Per Share
(net assets ÷ shares of beneficial interest outstanding) | | $ | 10.16 | | |
Maximum Offering Price Per Share
(100 ÷ 95.25 of $10.16) | | $ | 10.67 | | |
| Class B Shares | |
| Net Assets | | $ | 46,013,177 | | |
| Shares Outstanding | | | 4,557,797 | | |
Net Asset Value, Offering Price and Redemption Price Per Share
(net assets ÷ shares of beneficial interest outstanding) | | $ | 10.10 | | |
| Class C Shares | |
| Net Assets | | $ | 7,709,313 | | |
| Shares Outstanding | | | 763,468 | | |
Net Asset Value, Offering Price and Redemption Price Per Share
(net assets ÷ shares of beneficial interest outstanding) | | $ | 10.10 | | |
| Class I Shares | |
| Net Assets | | $ | 116,465,376 | | |
| Shares Outstanding | | | 10,488,534 | | |
Net Asset Value, Offering Price and Redemption Price Per Share
(net assets ÷ shares of beneficial interest outstanding) | | $ | 11.10 | | |
| On sales of $25,000 or more, the offering price of Class A shares is reduced. | | | | | |
Statement of Operations
For the Year Ended
December 31, 2006
| Investment Income | |
| Interest | | $ | 22,843,500 | | |
| Total investment income | | $ | 22,843,500 | | |
| Expenses | |
| Investment adviser fee | | $ | 1,865,791 | | |
| Trustees' fees and expenses | | | 18,069 | | |
Distribution and service fees
Class A | | | 693,806 | | |
| Class B | | | 476,797 | | |
| Class C | | | 15,551 | | |
| Custodian fee | | | 187,484 | | |
| Transfer and dividend disbursing agent fees | | | 128,040 | | |
| Registration fees | | | 115,612 | | |
| Legal and accounting services | | | 67,582 | | |
| Printing and postage | | | 28,019 | | |
| Interest expense and fees | | | 1,630,716 | | |
| Miscellaneous | | | 75,692 | | |
| Total expenses | | $ | 5,303,159 | | |
Deduct —
Reduction of custodian fee | | $ | 83,103 | | |
| Total expense reductions | | $ | 83,103 | | |
| Net expenses | | $ | 5,220,056 | | |
| Net investment income | | $ | 17,623,444 | | |
| Realized and Unrealized Gain (Loss) | |
Net realized gain (loss) —
Investment transactions (identified cost basis) | | $ | 3,896,635 | | |
| Financial futures contracts | | | (1,544,089 | ) | |
| Net realized gain | | $ | 2,352,546 | | |
Change in unrealized appreciation (depreciation) —
Investments (identified cost basis) | | $ | 8,686,518 | | |
| Financial futures contracts | | | 4,375,461 | | |
| Interest rate swap contracts | | | 66,960 | | |
| Net change in unrealized appreciation (depreciation) | | $ | 13,128,939 | | |
| Net realized and unrealized gain | | $ | 15,481,485 | | |
| Net increase in net assets from operations | | $ | 33,104,929 | | |
See notes to financial statements
10
Eaton Vance AMT-Free Municipal Bond Fund as of December 31, 2006
FINANCIAL STATEMENTS CONT'D
Statements of Changes in Net Assets
Increase (Decrease)
in Net Assets | | Year Ended
December 31, 2006 | | Year Ended
December 31, 2005 | |
From operations —
Net investment income | | $ | 17,623,444 | | | $ | 12,727,841 | | |
Net realized gain (loss) from investment
transactions and financial futures contracts | | | 2,352,546 | | | | (4,676,965 | ) | |
Net change in unrealized appreciation
(depreciation) from investments,
financial futures contracts, and interest
rate swap contracts | | | 13,128,939 | | | | 5,327,853 | | |
| Net increase in net assets from operations | | $ | 33,104,929 | | | $ | 13,378,729 | | |
Distributions to shareholders —
From net investment income
Class A | | $ | (11,723,813 | ) | | $ | (7,252,577 | ) | |
| Class B | | | (1,672,393 | ) | | | (2,080,356 | ) | |
| Class C | | | (50,773 | ) | | | — | | |
| Class I | | | (3,867,812 | ) | | | (3,688,056 | ) | |
| Total distributions to shareholders | | $ | (17,314,791 | ) | | $ | (13,020,989 | ) | |
Transactions in shares of beneficial interest —
Proceeds from sale of shares
Class A | | $ | 231,445,151 | | | $ | 109,534,608 | | |
| Class B | | | 3,232,090 | | | | 4,488,209 | | |
| Class C | | | 7,748,969 | | | | — | | |
| Class I | | | 40,022,431 | | | | 12,369,122 | | |
Net asset value of shares issued to
shareholders in payment of
distributions declared
Class A | | | 6,979,700 | | | | 3,787,043 | | |
| Class B | | | 943,883 | | | | 1,200,327 | | |
| Class C | | | 39,592 | | | | — | | |
| Class I | | | 1,947,338 | | | | 2,070,122 | | |
Cost of shares redeemed
Class A | | | (39,856,814 | ) | | | (28,536,902 | ) | |
| Class B | | | (8,328,062 | ) | | | (9,497,835 | ) | |
| Class C | | | (152,270 | ) | | | — | | |
| Class I | | | (7,459,619 | ) | | | (7,359,191 | ) | |
Net asset value of shares exchanged
Class A | | | 1,293,787 | | | | 585,108 | | |
| Class B | | | (1,293,787 | ) | | | (585,108 | ) | |
Net increase in net assets from
Fund share transactions | | $ | 236,562,389 | | | $ | 88,055,503 | | |
| Net increase in net assets | | $ | 252,352,527 | | | $ | 88,413,243 | | |
| Net Assets | |
| At beginning of year | | $ | 325,687,524 | | | $ | 237,274,281 | | |
| At end of year | | $ | 578,040,051 | | | $ | 325,687,524 | | |
Accumulated
undistributed net
investment income
included in net assets | |
| At end of year | | $ | 118,709 | | | $ | — | | |
Statement of Cash Flows
| | | For the Year Ended
December 31, 2006 | |
| Cash flows from operating activities | |
| Net increase in net assets from operations | | $ | 33,104,929 | | |
Adjustments to reconcile net increase in net assets resulting from operations
to net cash used for operating activities: | |
| Investments purchased | | | (530,450,102 | ) | |
| Investments sold | | | 257,955,413 | | |
| Net amortization of premium (discount) | | | (2,020,018 | ) | |
| Interest receivable | | | (1,970,687 | ) | |
| Receivable for daily variation margin on open financial futures contracts | | | 104,312 | | |
| Receivable for open interest rate swap contracts | | | (66,960 | ) | |
| Payable to affiliate for Trustees' fees | | | 123 | | |
| Payable for when-issued securities | | | 14,384,245 | | |
| Payable to affiliate for investment advisory fees | | | 81,238 | | |
| Payable to affiliate for distribution and service fees | | | 112,306 | | |
| Interest expense and fees payable | | | 183,583 | | |
| Accrued expenses | | | 7,140 | | |
| Net change in realized and unrealized (gain) loss on investments | | | (12,583,153 | ) | |
| Net cash provided in operating activities | | $ | (241,157,631 | ) | |
| Cash flows from financing activities | |
| Demand note payable | | $ | (200,000 | ) | |
| Proceeds from shares sold | | | 273,510,340 | | |
| Shares redeemed | | | (55,867,119 | ) | |
| Cash distributions paid net of reinvestments | | | (7,160,285 | ) | |
| Proceeds from secured borrowings | | | 52,750,000 | | |
| Repayments of secured borrowings | | | (18,570,000 | ) | |
| Net cash provided by financing activities | | $ | 244,462,936 | | |
| Net increase in cash | | $ | 3,305,305 | | |
| Cash at beginning of period | | $ | 62,555 | | |
| Cash at end of period | | $ | 3,367,860 | | |
Supplemental Disclosure of
Cash Flow Information: | |
Noncash financing activities not included herein consists of reinvestment of
dividends and distributions of: | | $ | 9,910,513 | | |
See notes to financial statements
11
Eaton Vance AMT-Free Municipal Bond Fund as of December 31, 2006
FINANCIAL STATEMENTS CONT'D
Financial Highlights
| | | Class A | |
| | | Year Ended December 31, | |
| | | 2006(1) | | 2005(1)(2) | | 2004(1)(2) | | 2003(1)(2) | | 2002(1)(2) | |
| Net asset value — Beginning of year | | $ | 9.800 | | | $ | 9.780 | | | $ | 9.900 | | | $ | 9.720 | | | $ | 9.340 | | |
| Income (loss) from operations | |
| Net investment income | | $ | 0.427 | | | $ | 0.447 | | | $ | 0.515 | | | $ | 0.526 | | | $ | 0.522 | | |
| Net realized and unrealized gain (loss) | | | 0.355 | | | | 0.036 | | | | (0.081 | ) | | | 0.151 | | | | 0.347 | | |
| Total income from operations | | $ | 0.782 | | | $ | 0.483 | | | $ | 0.434 | | | $ | 0.677 | | | $ | 0.869 | | |
| Less distributions | |
| From net investment income | | $ | (0.422 | ) | | $ | (0.463 | ) | | $ | (0.554 | ) | | $ | (0.497 | ) | | $ | (0.489 | ) | |
| Total distributions | | $ | (0.422 | ) | | $ | (0.463 | ) | | $ | (0.554 | ) | | $ | (0.497 | ) | | $ | (0.489 | ) | |
| Net asset value — End of year | | $ | 10.160 | | | $ | 9.800 | | | $ | 9.780 | | | $ | 9.900 | | | $ | 9.720 | | |
| Total Return(3) | | | 8.16 | % | | | 5.04 | % | | | 4.56 | % | | | 7.17 | % | | | 9.51 | % | |
| Ratios/Supplemental Data | |
| Net assets, end of year (000's omitted) | | $ | 407,852 | | | $ | 197,189 | | | $ | 111,706 | | | $ | 102,526 | | | $ | 85,048 | | |
Ratios (As a percentage of average daily net assets):
Expenses excluding interest and fees | | | 0.85 | % | | | 0.89 | % | | | 0.92 | % | | | 0.89 | % | | | 0.91 | % | |
| Interest and fee expense(4) | | | 0.39 | % | | | 0.33 | % | | | 0.24 | % | | | 0.17 | % | | | 0.19 | % | |
| Total expenses | | | 1.24 | % | | | 1.22 | % | | | 1.16 | % | | | 1.06 | % | | | 1.10 | % | |
| Expenses after custodian fee reduction excluding interest and fees | | | 0.83 | % | | | 0.87 | % | | | 0.91 | % | | | 0.89 | % | | | 0.91 | % | |
| Net investment income | | | 4.29 | % | | | 4.56 | % | | | 5.29 | % | | | 5.42 | % | | | 5.47 | % | |
| Portfolio Turnover | | | 54 | % | | | 51 | % | | | 36 | % | | | 23 | % | | | 21 | % | |
(1) Net investment income per share was computed using average shares outstanding.
(2) As Restated — See Note 13.
(3) Returns are historical and are calculated using the percentage change in net asset value with all distributions reinvested. Total return is not computed on an annualized basis.
(4) Interest and fee expense relates to the liability for floating rate notes issued in conjunction with inverse floater securities transactions (see Note 1B).
See notes to financial statements
12
Eaton Vance AMT-Free Municipal Bond Fund as of December 31, 2006
FINANCIAL STATEMENTS CONT'D
Financial Highlights
| | | Class B | |
| | | Year Ended December 31, | |
| | | 2006(1) | | 2005(1)(2) | | 2004(1)(2) | | 2003(1)(2) | | 2002(1)(2) | |
| Net asset value — Beginning of year | | $ | 9.740 | | | $ | 9.710 | | | $ | 9.830 | | | $ | 9.660 | | | $ | 9.280 | | |
| Income (loss) from operations | |
| Net investment income | | $ | 0.355 | | | $ | 0.378 | | | $ | 0.439 | | | $ | 0.450 | | | $ | 0.447 | | |
| Net realized and unrealized gain (loss) | | | 0.350 | | | | 0.039 | | | | (0.081 | ) | | | 0.142 | | | | 0.348 | | |
| Total income from operations | | $ | 0.705 | | | $ | 0.417 | | | $ | 0.358 | | | $ | 0.592 | | | $ | 0.795 | | |
| Less distributions | |
| From net investment income | | $ | (0.345 | ) | | $ | (0.387 | ) | | $ | (0.478 | ) | | $ | (0.422 | ) | | $ | (0.415 | ) | |
| Total distributions | | $ | (0.345 | ) | | $ | (0.387 | ) | | $ | (0.478 | ) | | $ | (0.422 | ) | | $ | (0.415 | ) | |
| Net asset value — End of year | | $ | 10.10 | | | $ | 9.740 | | | $ | 9.710 | | | $ | 9.830 | | | $ | 9.660 | | |
| Total Return(3) | | | 7.38 | % | | | 4.37 | % | | | 3.97 | %(4) | | | 6.26 | % | | | 8.72 | % | |
| Ratios/Supplemental Data | |
| Net assets, end of year (000's omitted) | | $ | 46,013 | | | $ | 49,728 | | | $ | 54,016 | | | $ | 61,793 | | | $ | 57,347 | | |
Ratios (As a percentage of average daily net assets):
Expenses excluding interest and fees | | | 1.60 | % | | | 1.64 | % | | | 1.67 | % | | | 1.64 | % | | | 1.66 | % | |
| Interest and fee expense(5) | | | 0.39 | % | | | 0.33 | % | | | 0.24 | % | | | 0.17 | % | | | 0.19 | % | |
| Total expenses | | | 1.99 | % | | | 1.97 | % | | | 1.91 | % | | | 1.81 | % | | | 1.85 | % | |
| Expenses after custodian fee reduction excluding interest and fees | | | 1.58 | % | | | 1.62 | % | | | 1.66 | % | | | 1.64 | % | | | 1.66 | % | |
| Net investment income | | | 3.60 | % | | | 3.88 | % | | | 4.54 | % | | | 4.67 | % | | | 4.71 | % | |
| Portfolio Turnover | | | 54 | % | | | 51 | % | | | 36 | % | | | 23 | % | | | 21 | % | |
(1) Net investment income per share was computed using average shares outstanding.
(2) As Restated — See Note 13.
(3) Returns are historical and are calculated using the percentage change in net asset value with all distributions reinvested. Total return is not computed on an annualized basis.
(4) Total return reflects an increase of 0.21% due to a change in the timing of the reinvestment of distributions.
(5) Interest and fee expense relates to the liability for floating rate notes issued in conjunction with inverse floater securities transactions (see Note 1B).
See notes to financial statements
13
Eaton Vance AMT-Free Municipal Bond Fund as of December 31, 2006
FINANCIAL STATEMENTS CONT'D
Financial Highlights
| | | Class C | |
| | | Period Ended
December 31, 2006(1)(2) | |
| Net asset value — Beginning of period | | $ | 9.720 | | |
| Income (loss) from operations | |
| Net investment income | | $ | 0.218 | | |
| Net realized and unrealized gain | | | 0.391 | | |
| Total income from operations | | $ | 0.609 | | |
| Less distributions | |
| From net investment income | | $ | (0.229 | ) | |
| Total distributions | | $ | (0.229 | ) | |
| Net asset value — End of year | | $ | 10.100 | | |
| Total Return(3) | | | 6.33 | % | |
| Ratios/Supplemental Data | |
| Net assets, end of period (000's omitted) | | $ | 7,709 | | |
Ratios (As a percentage of average daily net assets):
Expenses excluding interest and fees | | | 1.59 | %(5) | |
| Interest and fee expense(4) | | | 0.39 | %(5) | |
| Total expenses | | | 1.98 | %(5) | |
| Expenses after custodian fee reduction excluding interest and fees | | | 1.57 | %(5) | |
| Net investment income | | | 3.25 | %(5) | |
| Portfolio Turnover | | | 54 | %(6) | |
(1) Net investment income per share was computed using average shares outstanding.
(2) For the period from the start of business on May 2, 2006, to December 31, 2006.
(3) Returns are historical and are calculated using the percentage change in net asset value with all distributions reinvested. Total return is not computed on an annualized basis.
(4) Interest and fee expense relates to the liability for floating rate notes issued in conjunction with inverse floater securities transactions (see Note 1B).
(5) Annualized.
(6) For the year ended December 31, 2006.
See notes to financial statements
14
Eaton Vance AMT-Free Municipal Bond Fund as of December 31, 2006
FINANCIAL STATEMENTS CONT'D
Financial Highlights
| | | Class I | |
| | | Year Ended December 31, | |
| | | 2006(1) | | 2005(1)(2) | | 2004(1)(2) | | 2003(1)(2) | | 2002(1)(2) | |
| Net asset value — Beginning of year | | $ | 10.710 | | | $ | 10.690 | | | $ | 10.810 | | | $ | 10.620 | | | $ | 10.200 | | |
| Income (loss) from operations | |
| Net investment income | | $ | 0.496 | | | $ | 0.521 | | | $ | 0.589 | | | $ | 0.602 | | | $ | 0.598 | | |
| Net realized and unrealized gain (loss) | | | 0.383 | | | | 0.032 | | | | (0.079 | ) | | | 0.159 | | | | 0.383 | | |
| Total income from operations | | $ | 0.879 | | | $ | 0.553 | | | $ | 0.510 | | | $ | 0.761 | | | $ | 0.981 | | |
| Less distributions | |
| From net investment income | | $ | (0.489 | ) | | $ | (0.533 | ) | | $ | (0.630 | ) | | $ | (0.571 | ) | | $ | (0.561 | ) | |
| Total distributions | | $ | (0.489 | ) | | $ | (0.533 | ) | | $ | (0.630 | ) | | $ | (0.571 | ) | | $ | (0.561 | ) | |
| Net asset value — End of year | | $ | 11.100 | | | $ | 10.710 | | | $ | 10.690 | | | $ | 10.810 | | | $ | 10.620 | | |
| Total Return(3) | | | 8.40 | % | | | 5.28 | % | | | 4.91 | % | | | 7.38 | % | | | 9.84 | % | |
| Ratios/Supplemental Data | |
| Net assets, end of year (000's omitted) | | $ | 116,465 | | | $ | 78,771 | | | $ | 71,552 | | | $ | 77,759 | | | $ | 82,600 | | |
Ratios (As a percentage of average daily net assets):
Expenses excluding interest and fees | | | 0.60 | % | | | 0.64 | % | | | 0.67 | % | | | 0.64 | % | | | 0.66 | % | |
| Interest and fee expense(4) | | | 0.39 | % | | | 0.33 | % | | | 0.24 | % | | | 0.17 | % | | | 0.19 | % | |
| Total expenses | | | 0.99 | % | | | 0.97 | % | | | 0.91 | % | | | 0.81 | % | | | 0.85 | % | |
| Expenses after custodian fee reduction excluding interest and fees | | | 0.58 | % | | | 0.62 | % | | | 0.66 | % | | | 0.64 | % | | | 0.66 | % | |
| Net investment income | | | 4.56 | % | | | 4.86 | % | | | 5.54 | % | | | 5.68 | % | | | 5.73 | % | |
| Portfolio Turnover | | | 54 | % | | | 51 | % | | | 36 | % | | | 23 | % | | | 21 | % | |
(1) Net investment income per share was computed using average shares outstanding.
(2) As Restated — See Note 13.
(3) Returns are historical and are calculated using the percentage change in net asset value with all distributions reinvested. Total return is not computed on an annualized bases.
(4) Interest and fee expense relates to the liability for floating rate notes issued in conjunction with inverse floater securities transactions (see Note 1B).
See notes to financial statements
15
Eaton Vance AMT-Free Municipal Bond Fund as of December 31, 2006
NOTES TO FINANCIAL STATEMENTS
1 Significant Accounting Policies
Eaton Vance AMT-Free Municipal Bond Fund (formerly Eaton Vance Municipal Bond Fund) (the Fund) is a diversified series of Eaton Vance Mutual Funds Trust (the Trust). The Trust is an entity of the type commonly known as a Massachusetts business trust and is registered under the Investment Company Act of 1940, as amended, as an open-end management investment company. The Fund seeks to provide current income exempt from regular federal income tax. The Fund primarily invests in investment grade municipal obligations (those rated BBB, Baa or higher), but may also invest in lower rated obligations. The Fund offers four classes of shares. Class A shares are generally sold subject to a sales charge imposed at time of purchase. Class B and Class C shares are sold at net asset value and are subject to a contingent deferred sales charge (see Note 6). The Trustees have adopted a conversion feature pursuant to which Class B shares of the Fun d automatically convert to Class A shares eight years after their purchase as described in the Fund's prospectus. Class I shares generally are sold at net asset value. Each class represents a pro rata interest in the Fund, but votes separately on class-specific matters and (as noted below) is subject to different expenses. Realized and unrealized gains and losses are allocated daily to each class of shares based on the relative net assets of each class to the total net assets of the Fund. Net investment income, other than class specific expenses, is allocated daily to each class of shares based upon the ratio of the value of each class' paid shares to the total value of all paid shares. Each class of shares differs in its distribution plan and certain other class specific expenses. The following is a summary of significant accounting policies consistently followed by the Fund in the preparation of its financial statements. The policies are in conformity with accounting principles generally accepted in the Un ited States of America.
A Investment Valuation — Municipal bonds and taxable obligations, if any, are normally valued on the basis of valuations furnished by a pricing service. Financial futures contracts and options on financial futures contracts listed on commodity exchanges are valued at closing settlement prices. Over-the-counter options on financial futures contracts are normally valued at the mean between the latest bid and asked prices. Interest rate swaps are normally valued on the basis of valuations furnished by a pricing service. Short-term obligations, maturing in sixty days or less, are valued at amortized cost, which approximates value. Investments for which valuations or market quotations are unavailable, and investments for which the price of the security is not believed to represent its fair market value, are valued at fair value using methods determined in good faith by or at the direction of the Trustees.
B Floating Rate Notes Issues in Conjunction with Securities Held — The Fund sells a fixed-rate bond to a broker for cash. At the same time the Fund buys a residual interest in a Special Purpose Vehicle (which is generally organized as a trust) ("SPV") assets and cash flows set up by the broker, often referred to as an inverse floating rate obligation ("Inverse Floater"). The broker deposits a fixed-rate bond into the trust with the same CUSIP number as the fixed-rate bond sold to the broker by the Fund, and which may have been, but is not required to be, the fixed-rate bond purchased from the Fund, (the "Fixed-Rate Bond"). The SPV also issues floating rate notes ("Floating Rate Notes") which are sold to third-parties. The Fund may enter into shortfall and forbearance agre ements with the broker by which a Fund agrees to reimburse the broker, in certain circumstances, for the difference between the liquidation value of the Fixed-Rate Bond held by the SPV and the liquidation value of the Floating-Rate Notes, as well as any shortfalls in interest cash flows. The Inverse Floater held by the Fund gives the Fund the right (1) to cause the holders of the Floating Rate Notes to tender their notes at par, and (2) to have the broker transfer the Fixed-Rate Bond held by the SPV to the Fund, thereby collapsing the SPV. Pursuant to Financial Accounting Standards Board ("FASB") Statement No. 140, "Accounting for Transfers and Servicing of Financial Assets and Extinguishment of Liabilities" ("FAS 140"), the Fund accounts for the transaction described above as a secured borrowing by including the Fixed-Rate Bond in its Portfolio of Investments, and accounts for the Floating Rate Notes as a liability under the caption "payable for floating rate notes issued" in the Fund's "Statement of Assets and Liabilities". The Floating Rate Notes have interest rates that generally reset weekly and their holders have the option to tender their notes to the broker for redemption at par at each reset date. At December 31, 2006, the Floating Rate Notes outstanding and the collateral for Floating Rate Notes outstanding were $71,730,000 and $116,662,319, respectively. The range of interest rates on the Floating Rate Notes outstanding at December 31, 2006 was 3.90% to 4.31%.
The Fund's investment policies and restrictions expressly permit investments in inverse floating rate securities. The Fund's investment policies do not allow the Fund to borrow money for purposes of making investments. Management believes that the Fund's restrictions on borrowings do not apply to the secured borrowings deemed to have occurred for accounting purposes
16
Eaton Vance AMT-Free Municipal Bond Fund as of December 31, 2006
NOTES TO FINANCIAL STATEMENTS CONT'D
pursuant to FAS 140, which is distinct from legal borrowing of the Fund to which the restrictions apply. Inverse Floaters held by the Fund are securities exempt from registration under Rules 144A of the Securities Act of 1933.
C Income — Interest income is recorded on the basis of interest accrued, adjusted for amortization of premium or accretion of discount.
D Interest Expense — Interest expense relates to the Fund's liability with respect to floating rate notes held by third parties in conjunction with inverse floater securities transactions. Interest expense is recorded as incurred.
E Federal Taxes — The Fund's policy is to comply with the provisions of the Internal Revenue Code applicable to regulated investment companies and to distribute to shareholders each year all of its taxable and tax-exempt income, including any net realized capital gain on investments. Accordingly, no provision for federal income or excise tax is necessary. Dividends paid by the Fund from net interest on tax-exempt municipal bonds are not includable by shareholders as gross income for federal income tax purposes because the Fund intends to meet certain requirements of the Internal Revenue Code applicable to regulated investment companies which will enable the Fund to pay exempt-interest dividends. At De cember 31, 2006, the Fund, for federal income tax purposes, had a capital loss carryover of $5,703,122 which will reduce the taxable income arising from future net realized gains on investments, if any, to the extent permitted by the Internal Revenue Code, and thus will reduce the amount of distributions to shareholders which would otherwise be necessary to relieve the Fund of any liability for federal income or excise tax. The capital loss carryover expires on December 31, 2012 ($4,273,717), and December 31, 2013 ($1,429,405).
F Financial Futures Contracts — Upon the entering of a financial futures contract, the Fund is required to deposit (initial margin) either in cash or securities an amount equal to a certain percentage of the purchase price indicated in the financial futures contract. Subsequent payments are made or received by the Fund (margin maintenance) each day, dependent on the daily fluctuations in the value of the underlying security, and are recorded for book purposes as unrealized gains or losses by the Fund. The Fund's investment in financial futures contracts is designed for both hedging against anticipated future changes in interest rates and investment purposes. Should interest rates move unexpectedly, the Fund may not achieve the anticipated benefits of the financial futures contracts and may realize a loss.
G Put Options on Financial Futures Contracts — Upon the purchase of a put option on a financial futures contract by the Fund, the premium paid is recorded as an investment, the value of which is marked-to-market daily. When a purchased option expires, the Fund will realize a loss in the amount of the cost of the option. When the Fund enters into a closing sale transaction, the Fund will realize a gain or loss depending on whether the sales proceeds from the closing sale transaction are greater or less than the cost of the option. When the Fund exercises a put option, settlement is made in cash. The risk associated with purchasing options is limited to the premium originally paid.
H When-issued and Delayed Delivery Transactions — The Fund may engage in when-issued and delayed delivery transactions. The Fund records when-issued securities on trade date and maintains security positions such that sufficient liquid assets will be available to make payments for the securities purchased. Securities purchased on a when-issued or delayed delivery basis are marked-to-market daily and begin earning interest on settlement date.
I Interest Rate Swaps — The Fund may enter into interest rate swap agreements to enhance return, to hedge against fluctuations in securities prices or interest rates, or as substitution for the purchase and sale of securities. Pursuant to these agreements, the Fund makes bi-annual payments at a fixed interest rate. In exchange, the Fund receives payments based on the interest rate of a benchmark industry index. During the term of the outstanding swap agreement, changes in the underlying value of the swap are recorded as unrealized gains and losses. The value of the swap is determined by changes in the relationship between two rates of interest. The Fund is exposed to credit loss in the event of non-pe rformance by the swap counterparty. However, the Fund does not anticipate non-performance by the counterparty. Risk may also arise from the unanticipated movements in value of interest rates.
J Legal Fees — Legal fees and other related expenses incurred as part of negotiations of the terms and requirements of capital infusions, or that are expected to result in the restructuring of or a plan of reorganization for an investment are recorded as realized losses. Ongoing expenditures to protect or enhance an investment are treated as operating expenses.
17
Eaton Vance AMT-Free Municipal Bond Fund as of December 31, 2006
NOTES TO FINANCIAL STATEMENTS CONT'D
K Expenses — The majority of expenses of the Trust are directly identifiable to an individual fund. Expenses which are not readily identifiable to a specific fund are allocated taking into consideration, among other things, the nature and type of expense and the relative size of the funds.
L Expense Reduction — Investors Bank & Trust Company (IBT) serves as custodian of the Fund. Pursuant to the custodian agreement, IBT receives a fee reduced by credits which are determined based on the average daily cash balance the Fund maintains with IBT. All credit balances used to reduce the Fund's custodian fees are reported as a reduction of expenses in the Statement of Operations.
M Use of Estimates — The preparation of the financial statements in conformity with accounting principles generally accepted in the United States of America requires management to make estimates and assumptions that affect the reported amounts of assets and liabilities at the date of the financial statements and the reported amounts of income and expense during the reporting period. Actual results could differ from those estimates.
N Indemnifications— Under the Trust's organizational documents, its officers and Trustees may be indemnified against certain liabilities and expenses arising out of the performance of their duties to the Fund and shareholders are indemnified against personal liability for obligations of the Trust. Additionally, in the normal course of business, the Fund enters into agreements with service providers that may contain indemnification clauses. The Fund's maximum exposure under these arrangements is unknown as this would involve future claims that may be made against the Fund that have not yet occurred.
O Other — Investment transactions are accounted for on the date the securities are purchased or sold. Realized gains and losses on securities sold are determined on the basis of identified cost.
2 Distributions to Shareholders
The net income of the Fund is determined daily and substantially all of the net income so determined is declared as a dividend to shareholders of record at the time of declaration. Distributions are declared separately for each class of shares. Distributions are paid monthly. Distributions of realized capital gains, if any, are made at least annually. Shareholders may reinvest income and capital gain distributions in additional shares of the same class of the Fund at the net asset value as of the reinvestment date. Distributions are paid in the form of additional shares of the same class or, at the election of the shareholder, in cash.
The Fund distinguishes between distributions on a tax basis and a financial reporting basis. Accounting principles generally accepted in the United States of America require that only distributions in excess of tax basis earnings and profits be reported in the financial statements as a return of capital. Permanent differences between book and tax accounting relating to distributions are reclassified to paid-in capital.
The tax character of distributions paid for the years ended December 31, 2006 and December 31, 2005 was as follows:
| | | Year Ended December 31, | |
| | | 2006 | | 2005 | |
| Distributions declared from: | |
| Tax-exempt income | | $ | 17,314,739 | | | $ | 12,945,284 | | |
| Ordinary Income | | $ | 52 | | | $ | 75,705 | | |
As of December 31, 2006, the components of distributable earnings (accumulated losses) on a tax basis were as follows:
| Undistributed income | | $ | 118,708 | | |
| Capital loss carryforward | | $ | (5,703,122 | ) | |
| Unrealized gain | | $ | 33,122,796 | | |
| Other temporary differences | | $ | (3,003,595 | ) | |
3 Shares of Beneficial Interest
The Fund's Declaration of Trust permits the Trustees to issue an unlimited number of full and fractional shares of beneficial interest (without par value). Transactions in shares were as follows:
| | | Year Ended December 31, | |
| Class A | | 2006 | | 2005 | |
| Sales | | | 23,196,432 | | | | 11,166,874 | | |
Issued to shareholders electing
to receive payments of
distributions in Fund shares | | | 699,288 | | | | 386,084 | | |
| Redemptions | | | (4,012,314 | ) | | | (2,913,963 | ) | |
| Exchange from Class B shares | | | 130,883 | | | | 59,562 | | |
| Net increase | | | 20,014,289 | | | | 8,698,557 | | |
18
Eaton Vance AMT-Free Municipal Bond Fund as of December 31, 2006
NOTES TO FINANCIAL STATEMENTS CONT'D
| | | Year Ended December 31, | |
| Class B | | 2006 | | 2005 | |
| Sales | | | 328,680 | | | | 460,904 | | |
Issued to shareholders electing
to receive payments of
distributions in Fund shares | | | 95,578 | | | | 123,145 | | |
| Redemptions | | | (842,842 | ) | | | (976,202 | ) | |
| Exchange to Class A shares | | | (131,692 | ) | | | (59,950 | ) | |
| Net decrease | | | (550,276 | ) | | | (452,103 | ) | |
| | | Year Ended December 31, | |
| Class C | | 2006(1) | | 2005 | |
| Sales | | | 774,792 | | | | — | | |
Issued to shareholders electing
to receive payments of
distributions in Fund shares | | | 3,928 | | | | — | | |
| Redemptions | | | (15,252 | ) | | | — | | |
| Net increase | | | 763,468 | | | | — | | |
| | | Year Ended December 31, | |
| Class I | | 2006 | | 2005 | |
| Sales | | | 3,641,074 | | | | 1,154,396 | | |
Issued to shareholders electing
to receive payments of
distributions in Fund shares | | | 179,131 | | | | 193,085 | | |
| Redemptions | | | (687,387 | ) | | | (687,176 | ) | |
| Net increase | | | 3,132,818 | | | | 660,305 | | |
(1) Class C shares commenced operations on May 2, 2006.
4 Investment Adviser Fee and Other Transactions with Affiliates
The investment adviser fee, computed at the monthly rate of 0.025% (0.300% per annum) of the average daily net assets and 3.00% of gross income (excluding net realized gains on sales of securities) up to $500 million and at reduced rates as daily net assets exceed that level, was earned by Eaton Vance Management (EVM), as compensation for management and investment advisory services rendered to the Fund. For the year ended December 31, 2006, the fee was equivalent to 0.45% of the Fund's average daily net assets for such period and amounted to $1,865,791. Except as to Trustees of the Fund who are not members of EVM's organization, officers and Trustees receive remuneration for their services to the Fund out of such investment adviser fee. EVM serves as the sub-transfer agent of the Fund and receives from the transfer agent an aggregate fee based upon the actua l expenses incurred by EVM in the performance of those activities. For the year ended December 31, 2006, EVM received $9,293 in sub-transfer agent fees. The Fund was informed that Eaton Vance Distributors, Inc. (EVD), a subsidiary of EVM and the Fund's principal underwriter, received $59,365 and $353 from the Fund as its portion of the sales charge on sales of Class A and Class I shares, respectively, for the year ended December 31, 2006. EVD also receives distribution and service fees from Class A, Class B and Class C shares (see Note 5).
Trustees of the Fund that are not affiliated with the Investment Adviser may elect to defer receipt of all or a percentage of their annual fees in accordance with the terms of the Trustees Deferred Compensation Plan. For the year ended December 31, 2006, no significant amounts have been deferred.
Certain officers and Trustees of the Fund are officers of the above organizations.
5 Distribution Plans
Class A has in effect a distribution plan (Class A Plan) pursuant to Rule 12b-1 of the Investment Company Act of 1940 (1940 Act). The Class A Plan provides that the Fund will pay EVD a distribution and service fee of 0.25% of the Fund's average daily net assets attributable to Class A shares for each fiscal year for distribution services and facilities provided to the Fund by EVD, as well as for personal services and/or the maintenance of shareholder accounts. Distribution and service fees paid or accrued for the year ended December 31, 2006 amounted to $693,806 for Class A shares. The Fund also has in effect distribution plans for Class B shares (Class B Plan) and Class C shares (Class C Plan) pursuant to Rule 12b-1 under the 1940 Act. The Class B and Class C Plans require the Fund to pay EVD amounts equal to 1/365 of 0.75% of the Fund's average daily net assets attributable to Class B and Class C shares for providing ongoing d istribution services and facilities to the Fund. The Fund will automatically discontinue payments to EVD during any period in which there are no outstanding Uncovered Distribution Charges, which are equivalent to the sum of (i) 5% and 6.25% of the aggregate amount received by the Fund for the Class B and Class C shares sold, respectively, plus (ii) interest calculated by applying the rate of 1% over the prevailing prime rate to the outstanding balance of Uncovered Distribution Charges of EVD of each respective class, reduced by the aggregate amount of contingent deferred sales charges (see Note 6) and daily amounts theretofore paid to EVD by each respective class. The Fund paid or accrued $357,598 and $11,689 for Class B and Class C
19
Eaton Vance AMT-Free Municipal Bond Fund as of December 31, 2006
NOTES TO FINANCIAL STATEMENTS CONT'D
shares, respectively, to or payable to EVD for the year ended December 31, 2006, representing 0.75% of the average daily net assets for Class B and Class C shares. At December 31, 2006, the amount of Uncovered Distribution Charges of EVD calculated under the Plans was approximately $1,268,000 and $442,000 for Class B and Class C shares, respectively. The Class B and Class C Plans also authorize the Fund to make payments of service fees to EVD, investment dealers and other persons in amounts not exceeding 0.25% annually of the average daily net assets attributable to that Class. Service fees are paid for personal services and/or the maintenance of shareholder accounts. They are separate and distinct from the Class B and Class C sales commissions and distribution fees and, as such, are not subject to automatic discontinuance when there are no outstanding Uncovered Distribution Charges to EVD. Service fees paid or accrued for the y ear ended December 31, 2006 amounted to $119,199 and $3,862 for Class B and Class C shares, respectively.
6 Contingent Deferred Sales Charge
A contingent deferred sales charge (CDSC) generally is imposed on redemptions of Class B shares made within six years of purchase and on redemptions of Class C shares made within one year of purchase. Class A shares may be subject to a 1% CDSC if redeemed within 18 months of purchase (depending on the circumstances of purchase) or a 1% or 0.50% CDSC if redeemed within one year or two years, respectively, on purchases through the Eaton Vance Supplemental Retirement Account. Generally, the CDSC is based upon the lower of the net asset value at date of redemption or date of purchase. No charge is levied on shares acquired by reinvestment of dividends or capital gain distributions. The Class B CDSC is imposed at declining rates that begin at 5% in the first and second year after purchase, declining one percentage point each subsequent year. Class C shares are subject to a 1% CDSC if redeemed within one year of purchase. No CDSC is l evied on shares which have been sold to EVM or its affiliates or to their respective employees or clients and may be waived under certain other limited conditions. CDSC charges are paid to EVD to reduce the amount of Uncovered Distribution Charges calculated under the Class B and Class C Plans, respectively (see Note 5). CDSC charges received when no Uncovered Distribution Charges exist will be credited to the Fund. EVD received approximately $31,000, $106,000 and $200 of CDSC paid by Class A, Class B and Class C shareholders, respectively, for the year ended December 31, 2006.
7 Purchases and Sales of Investments
Purchases and sales of investments, other than U.S. Government securities and short-term obligations, aggregated $530,403,576 and $257,922,163 respectively.
8 Line of Credit
The Fund participates with other portfolios and funds managed by EVM and affiliates in a $150 million unsecured line of credit with a group of banks. Borrowings will be made by the Fund solely to facilitate the handling of unusual and/or unanticipated short-term cash requirements. Interest is charged to each participating portfolio or fund based on its borrowings at an amount above either the Eurodollar rate or federal funds rate. In addition, a fee computed at an annual rate of 0.10% on the daily unused portion of the line of credit is allocated among the participating portfolios and funds at the end of each quarter. The Fund did not have any significant borrowings or allocated fees during the year ended December 31, 2006.
9 Federal Income Tax Basis of Unrealized Appreciation (Depreciation)
The cost and unrealized appreciation (depreciation) of investments of the Fund at December 31, 2006, as determined on a federal income tax basis, were as follows:
| Aggregate cost | | $ | 544,657,904 | | |
| Gross unrealized appreciation | | $ | 31,446,470 | | |
| Gross unrealized depreciation | | | (1,394,228 | ) | |
| Net unrealized appreciation | | $ | 30,052,242 | | |
10 Financial Instruments
The Fund regularly trades in financial instruments with off-balance sheet risk in the normal course of its investing activities to assist in managing exposure to various market risks. These financial instruments include futures contracts and interest rate swap contracts and may involve, to a varying degree, elements of risk in excess of the amounts recognized for financial statement purposes. The notional or contractual amounts of these instruments represent the investment the Fund has in particular classes of financial instruments and does not necessarily represent the amounts potentially subject to risk. The measurement of the risks associated with these instruments is meaningful only when all related and offsetting transactions are considered.
20
Eaton Vance AMT-Free Municipal Bond Fund as of December 31, 2006
NOTES TO FINANCIAL STATEMENTS CONT'D
A summary of obligations under these financial instruments at December 31, 2006, is as follows:
| Futures Contracts | |
Expiration
Date(s) | | Contracts | | Position | | Aggregate
Cost | | Value | | Net
Unrealized
Appreciation | |
| | 3/07 | | | 1,098 U.S
Treasury Bond | | Short | | $ | (125,361,969 | ) | | $ | (122,358,375 | ) | | $ | 3,003,594 | | |
At December 31, 2006, the Fund had entered into an interest rate swap agreement with Citibank, N.A. whereby the Fund makes bi-annual payments at a fixed rate equal to 3.925% on the notional amount of $12,650,000. In exchange, the Fund receives bi-annual payments at a rate equal to the USD-BMA Municipal Swap Index on the same notional amount. The effective date of the interest rate swap is August 16, 2007. The value of the contract, which terminates August 16, 2027, is recorded as a receivable for open swap contracts of $22,078.
At December 31, 2006, the Fund had entered into an interest rate swap agreement with Merrill Lynch Capital Services, Inc. whereby the Fund makes bi-annual payments at a fixed rate equal to 4.006% on the notional amount. In exchange, the Fund receives bi-annual payments at a rate equal to the USD-BMA Municipal Swap Index on the notional amount of $12,650,000. The effective date of the interest rate swap is August 7, 2007. The value of the contract, which terminates August 7, 2037, is recorded as a receivable for open swap contracts of $44,882.
At December 31, 2006, the Fund had sufficient cash and/or securities to cover margin requirements on open future contracts and swap contracts.
11 Name Change
Effective May 1, 2006, Eaton Vance Municipal Bond Fund changed its name to Eaton Vance AMT-Free Municipal Bond Fund.
12 Recently Issued Accounting Pronouncements
In June 2006, FASB issued FASB Interpretation No. 48, ("FIN 48") "Accounting for Uncertainty in Income Taxes – an interpretation of FASB Statement No. 109". FIN 48 clarifies the accounting for uncertainty in income taxes recognized in accordance with FASB Statement No. 109, "Accounting for Income Taxes." This interpretation prescribes a recognition threshold and measurement attribute for the financial statement recognition and measurement of a tax position taken or expected to be taken in a tax return. It also provides guidance on de-recognition, classification, interest and penalties, accounting in interim periods, disclosure and transition. FIN 48 is effective during the first required financial reporting period for fiscal years beginning after December 15, 2006. Management is currently evaluating the impact of applying the various provisions of FIN 4 8.
In September 2006, the FASB issued Statement of Financial Accounting Standards No. 157, ("FAS 157") "Fair Value Measurements". FAS 157 defines fair value, establishes a framework for measuring fair value in accordance with generally accepted accounting principles and expands disclosure about fair value measurements. FAS 157 is effective for fiscal years beginning after November 15, 2007. Management is currently evaluating the impact the adoption of FAS 157 will have on the Fund's financial statement disclosures.
13 Restatement Information
Subsequent to the issuance of its December 31, 2005 financial statements, the Fund determined that the criteria for sale accounting in FAS 140 had not been met for certain transfers of municipal bonds during the fiscal years ended December 31, 2005, 2004, 2003 and 2002 and that the transfers should have been accounted for as secured borrowings rather than as sales. Accordingly, the Fund has restated the financial highlights for each of the four years in the periods ended December 31, 2005, 2004, 2003 and 2002, to give effect to recording the transfers of the municipal bonds as secured borrowings, including recording interest on the bonds as interest income and interest on the secured borrowings as interest expense in the Statement of Operations.
| | | 2005 | | 2004 | | 2003 | | 2002 | |
| | | Previously
Reported | | Restated | | Previously
Reported | | Restated | | Previously
Reported | | Restated | | Previously
Reported | | Restated | |
| Class A | |
| Expense Ratios: | |
| Total expenses | | | 0.89 | % | | | 1.22 | % | | | 0.92 | % | | | 1.16 | % | | | 0.89 | % | | | 1.06 | % | | | 0.91 | % | | | 1.10 | % | |
| Portfolio Turnover | | | | | | | | | | | | | | | | | | | 34 | % | | | 23 | % | | | | | | | | | |
| Class B | |
| Expense Ratios: | |
| Total expenses | | | 1.64 | % | | | 1.97 | % | | | 1.67 | % | | | 1.91 | % | | | 1.64 | % | | | 1.81 | % | | | 1.66 | % | | | 1.85 | % | |
| Portfolio Turnover | | | | | | | | | | | | | | | | | | | 34 | % | | | 23 | % | | | | | | | | | |
| Class I | |
| Expense Ratios: | |
| Total expenses | | | 0.64 | % | | | 0.97 | % | | | 0.67 | % | | | 0.91 | % | | | 0.64 | % | | | 0.81 | % | | | 0.66 | % | | | 0.85 | % | |
| Portfolio Turnover | | | | | | | | | | | | | | | | | | | 34 | % | | | 23 | % | | | | | | | | | |
21
Eaton Vance AMT-Free Municipal Bond Fund as of December 31, 2006
NOTES TO FINANCIAL STATEMENTS CONT'D
While the Statements of Assets and Liabilities as of December 31, 2005, 2004, 2003 and 2002 (not presented herein) have not been reissued to give effect to the restatement, the principal effects of the restatement would be to increase investments and payable for floating rate notes issued by corresponding amounts at each year end, with no effect on previously reported net assets. The Statements of Operations for the years ended December 31, 2005, 2004, 2003 and 2002 (not presented herein) have not been reissued to give effect to the restatement, but the principal effects of the restatement would be to increase interest income and interest expense and fees by corresponding amounts each year, with no effect on the previously reported net increase in net assets resulting from operations.
22
Eaton Vance AMT-Free Municipal Bond Fund as of December 31, 2006
REPORT OF INDEPENDENT REGISTERED PUBLIC ACCOUNTING FIRM
To the Trustees of the Eaton Vance Mutual Funds Trust and Shareholders of Eaton Vance AMT-Free Municipal Bond Fund:
We have audited the accompanying statement of assets and liabilities of Eaton Vance AMT-Free Municipal Bond Fund (the Fund) (one of the series of Eaton Vance Mutual Funds Trust) (formerly Eaton Vance Municipal Bond Fund), including the portfolio of investments, as of December 31, 2006, and the related statements of operations and cash flows for the year then ended, the statements of changes in net assets for each of the two years in the period then ended and the financial highlights for each of the five years in the period then ended. These financial statements and financial highlights are the responsibility of the Fund's management. Our responsibility is to express an opinion on these financial statements and financial highlights based on our audits.
We conducted our audits in accordance with the standards of the Public Company Accounting Oversight Board (United States). Those standards require that we plan and perform the audits to obtain reasonable assurance about whether the financial statements and financial highlights are free of material misstatement. The Fund is not required to have, nor were we engaged to perform, an audit of its internal control over financial reporting. Our audits included consideration of internal control over financial reporting as a basis for designing audit procedures that are appropriate in the circumstances, but not for the purpose of expressing an opinion on the effectiveness of the Fund's internal control over financial reporting. Accordingly, we express no such opinion. An audit also includes examining, on a test basis, evidence supporting the amounts and disclosures in the financial statements, assessing the accounting principles used and significant estimates made by management, as well as evaluating the overall financial statement presentation. Our procedures included confirmation of securities owned at December 31, 2006, by correspondence with the custodian and brokers; where replies were not received from brokers, we performed other auditing procedures. We believe that our audits provide a reasonable basis for our opinion.
In our opinion, the financial statements and financial highlights referred to above present fairly, in all material respects, the financial position of Eaton Vance AMT-Free Municipal Bond Fund as of December 31, 2006, the results of its operations and its cash flows for the year then ended, the changes in its net assets for each of the two years in the period then ended, and the financial highlights for each of the five years in the period then ended, in conformity with accounting principles generally accepted in the United States of America.
As discussed in Note 13 to the financial statements, the financial highlights for the years ended December 31, 2005, 2004, 2003, and 2002 have been restated.
DELOITTE & TOUCHE LLP
Boston, Massachusetts
February 16, 2007
23
Eaton Vance AMT-Free Municipal Bond Fund as of December 31, 2006
FEDERAL TAX INFORMATION (Unaudited)
The Form 1099-DIV you received in January 2007 showed the tax status of all distributions paid to your account in calendar 2006. Shareholders are advised to consult their own tax adviser with respect to the tax consequences of their investment in the Fund. As required by the Internal Revenue Code regulations, shareholders must be notified within 60 days of the Fund's fiscal year end regarding exempt-interest dividends.
Exempt-Interest Dividends. The Fund designates 100.0% of dividends from net investment income as an exempt-interest dividend.
24
Eaton Vance AMT-Free Municipal Bond Fund
BOARD OF TRUSTEES' ANNUAL APPROVAL OF THE INVESTMENT ADVISORY AGREEMENT
Overview of the Contract Review Process
The Investment Company Act of 1940, as amended (the "1940 Act"), provides, in substance, that each investment advisory agreement between a fund and its investment adviser will continue in effect from year to year only if its continuance is approved at least annually by the fund's board of trustees, including by a vote of a majority of the trustees who are not "interested persons" of the fund ("Independent Trustees") cast in person at a meeting called for the purpose of considering such approval.
At a meeting of the Boards of Trustees (each a "Board") of the Eaton Vance group of mutual funds (the "Eaton Vance Funds") held on March 27, 2006, the Board, including a majority of the Independent Trustees, voted to approve continuation of existing advisory and sub-advisory agreements for the Eaton Vance Funds for an additional one-year period. In voting its approval, the Board relied upon the affirmative recommendation of the Special Committee of the Board, which is a committee comprised exclusively of Independent Trustees. Prior to making its recommendation, the Special Committee reviewed information furnished for a series of meetings of the Special Committee held in February and March 2006. Such information included, among other things, the following:
Information about Fees, Performance and Expenses
• An independent report comparing the advisory and related fees paid by each fund with fees paid by comparable funds;
• An independent report comparing each fund's total expense ratio and its components to comparable funds;
• An independent report comparing the investment performance of each fund to the investment performance of comparable funds over various time periods;
• Data regarding investment performance in comparison to relevant peer groups of funds and appropriate indices;
• Comparative information concerning fees charged by each adviser for managing other mutual funds and institutional accounts using investment strategies and techniques similar to those used in managing the fund;
• Profitability analyses for each adviser with respect to each fund managed by it;
Information about Portfolio Management
• Descriptions of the investment management services provided to each fund, including the investment strategies and processes employed;
• Information concerning the allocation of brokerage and the benefits received by each adviser as a result of brokerage allocation, including information concerning the acquisition of research through "soft dollar" benefits received in connection with the funds' brokerage, and the implementation of a soft dollar reimbursement program established with respect to the funds;
• Data relating to portfolio turnover rates of each fund;
• The procedures and processes used to determine the fair value of fund assets and actions taken to monitor and test the effectiveness of such procedures and processes;
Information about each Adviser
• Reports detailing the financial results and condition of each adviser;
• Descriptions of the qualifications, education and experience of the individual investment professionals whose responsibilities include portfolio management and investment research for the funds, and information relating to their compensation and responsibilities with respect to managing other mutual funds and investment accounts;
• Copies of the Codes of Ethics of each adviser and its affiliates, together with information relating to compliance with and the administration of such codes;
• Information concerning the resources devoted to compliance efforts undertaken by each adviser and its affiliates on behalf of the funds (including descriptions of various compliance programs) and their record of compliance with investment policies and restrictions, including policies with respect to market-timing, late trading and selective portfolio disclosure, and with policies on personal securities transactions;
• Descriptions of the business continuity and disaster recovery plans of each adviser and its affiliates;
Other Relevant Information
• Information concerning the nature, cost and character of the administrative and other non-investment management services provided by Eaton Vance Management and its affiliates;
• Information concerning management of the relationship with the custodian, subcustodians and fund accountants by each adviser or the funds' administrator; and
• The terms of each advisory agreement.
25
Eaton Vance AMT-Free Municipal Bond Fund
BOARD OF TRUSTEES' ANNUAL APPROVAL OF THE INVESTMENT ADVISORY AGREEMENT CONT'D
In addition to the information identified above, the Special Committee considered information provided from time to time by each adviser throughout the year at meetings of the Board and its committees. Over the course of the twelve month period ended March 31, 2006, the Board met nine times and the Special Committee, the Audit Committee and the Governance Committee, each of which is a Committee comprised solely of Independent Trustees, met eight, twelve and five times, respectively. At such meetings, the Trustees received, among other things, presentations by the portfolio managers and other investment professionals of each adviser relating to the investment performance of each fund and the investment strategies used in pursuing the fund's investment objective.
For funds that invest through one or more underlying portfolios, the Board considered similar information about the portfolio(s) when considering the approval of advisory agreements. In addition, in cases where the fund's investment adviser has engaged a sub-adviser, the Board considered similar information about the sub-adviser when considering the approval of any sub-advisory agreement.
The Special Committee was assisted throughout the contract review process by Goodwin Procter LLP, legal counsel for the Independent Trustees. The members of the Special Committee relied upon the advice of such counsel and their own business judgment in determining the material factors to be considered in evaluating each advisory and sub-advisory agreement and the weight to be given to each such factor. The conclusions reached with respect to each advisory and sub-advisory agreement were based on a comprehensive evaluation of all the information provided and not any single factor. Moreover, each member of the Special Committee may have placed varying emphasis on particular factors in reaching conclusions with respect to each advisory and sub-advisory agreement.
Results of the Process
Based on its consideration of the foregoing, and such other information as it deemed relevant, including the factors and conclusions described below, the Special Committee concluded that the continuance of the investment advisory agreement of the Eaton Vance AMT-Free Municipal Bond Fund, formerly known as the Eaton Vance Municipal Bond Fund (the "Fund"), with Eaton Vance Management (the "Adviser"), including its fee structure, is in the interests of shareholders and, therefore, the Special Committee recommended to the Board approval of the agreement. The Board accepted the recommendation of the Special Committee as well as the factors considered and conclusions reached by the Special Committee with respect to the agreement. Accordingly, the Board, including a majority of the Independent Trustees, voted to approve continuation of the advisory agreement for the Fund.
Nature, Extent and Quality of Services
In considering whether to approve the investment advisory agreement of the Fund, the Board evaluated the nature, extent and quality of services provided to the Fund by the Adviser.
The Board considered the Adviser's management capabilities and investment process with respect to the types of investments held by the Fund, including the education, experience and number of its investment professionals and other personnel who provide portfolio management, investment research, and similar services to the Fund, including recent changes in such personnel. In particular, the Board evaluated the abilities and experience of such investment personnel in analyzing factors such as credit risk and tax efficiency. The Board noted the experience of the Adviser's 30-person municipal bond team, which includes seven portfolio managers and nine credit specialists. The Board also took into account the resources dedicated to portfolio management and other services, including the compensation paid to recruit and retain investment personnel, and the time and attention devoted to each Fund in the complex by senior management.
The Board reviewed the compliance programs of the Adviser and relevant affiliates thereof. Among other matters, the Board considered compliance and reporting matters relating to personal trading by investment personnel, selective disclosure of portfolio holdings, late trading, frequent trading, portfolio valuation, business continuity and the allocation of investment opportunities. The Board also evaluated the responses of the Adviser and its affiliates to requests from regulatory authorities such as the Securities and Exchange Commission and the National Association of Securities Dealers.
The Board considered shareholder and other administrative services provided or managed by Eaton Vance Management and its affiliates, including transfer agency and accounting services. The Board evaluated the benefits to shareholders of investing in a fund that is a part of a large family of funds, including the ability, in many cases, to exchange an investment among different funds without incurring additional sales charges.
After consideration of the foregoing factors, among others, the Board concluded that the nature, extent and quality of services provided by the Adviser, taken as a whole, are appropriate and consistent with the terms of the investment advisory agreement.
26
Eaton Vance AMT-Free Municipal Bond Fund
BOARD OF TRUSTEES' ANNUAL APPROVAL OF THE INVESTMENT ADVISORY AGREEMENT CONT'D
Fund Performance
The Board compared the Fund's investment performance to a relevant universe of similarly managed funds identified by an independent data provider and appropriate benchmark indices. The Board reviewed comparative performance data for the one-, three- and five-year periods ended September 30, 2005 for the Fund. The Board concluded that the performance of the Fund is satisfactory.
Management Fees and Expenses
The Board reviewed contractual investment advisory fee rates payable by the Fund (referred to as "management fees"). As part of its review, the Board considered the management fees and the Fund's total expense ratio for the one-year period ended September 30, 2005, as compared to a group of similarly managed funds selected by an independent data provider.
After reviewing the foregoing information, and in light of the nature, extent and quality of the services provided by the Adviser, the Board concluded that the management fees charged for advisory and related services and the Fund's total expense ratio are reasonable.
Profitability
The Board reviewed the level of profits realized by the Adviser and relevant affiliates thereof in providing investment advisory and administrative services to the Fund and to all Eaton Vance Funds as a group. The Board considered the level of profits realized without regard to revenue sharing or other payments by the Adviser and its affiliates to third parties in respect of distribution services. The Board also considered other direct or indirect benefits received by the Adviser and its affiliates in connection with its relationship with the Fund.
The Board concluded that, in light of the foregoing factors and the nature, extent and quality of the services rendered, the profits realized by the Adviser and its affiliates are reasonable.
Economies of Scale
In reviewing management fees and profitability, the Board also considered the extent to which the Adviser and its affiliates, on the one hand, and the Fund, on the other hand, can expect to realize benefits from economies of scale as the assets of the Fund increase. The Board acknowledged the difficulty in accurately measuring the benefits resulting from the economies of scale with respect to the management of any specific fund or group of funds. The Board reviewed data summarizing the increases and decreases in the assets of the Fund and of all Eaton Vance Funds as a group over various time periods, and evaluated the extent to which the total expense ratio of the Fund and the Adviser's profitability may have been affected by such increases or decreases. Based upon the foregoing, the Board concluded that the benefits from economies of scale are currently being shared equitably by the Adviser and the Fund. The Board also conclude d that, the structure of the advisory fee, which includes breakpoints at several asset levels, can be expected to cause the Adviser and its affiliates and the Fund to continue to share such benefits equitably.
27
Eaton Vance AMT-Free Municipal Bond Fund
MANAGEMENT AND ORGANIZATION
Fund Management. The Trustees of Eaton Vance Mutual Funds Trust (the Trust) are responsible for the overall management and supervision of the Trust's affairs. The Trustees and officers of the Trust are listed below. Except as indicated, each individual has held the office shown or other offices in the same company for the last five years. Trustees and officers of the Trust hold indefinite terms of office. The "noninterested Trustees" consist of those Trustees who are not "interested persons" of the Trust, as that term is defined under the 1940 Act. The business address of each Trustee and officer is The Eaton Vance Building, 255 State Street, Boston, Massachusetts 02109. As used below, "EVC" refers to Eaton Vance Corp., "EV" refers to Eaton Vance, Inc., "EVM" refers to Eaton Vance Management, "BMR" refers to Boston Management and Research,"EVD" refers to Eat on Vance Distributors, Inc. and "Parametric" refers to Parametric Portfolio Associates. EVC and EV are the corporate parent and trustee, respectively, of EVM and BMR. EVD is the Fund's principal underwriter and a wholly-owned subsidiary of EVM. Each officer affiliated with Eaton Vance may hold a position with other Eaton Vance affiliates that is comparable to his or her position with EVM listed below.
Name and
Date of Birth | | Position(s)
with the
Trust | | Term of
Office and
Length of
Service | | Principal Occupation(s)
During Past Five Years | | Number of Portfolios
in Fund Complex
Overseen By
Trustee(1) | | Other Directorships Held | |
| Interested Trustee | | | | | | | | | | | | | |
|
James B. Hawkes
11/9/41 | | Trustee | | Since 1991 | | Chairman and Chief Executive Officer of EVC, BMR, EVM and EV; Director of EV; Vice President and Director of EVD. Trustee and/or officer of 170 registered investment companies in the Eaton Vance Fund Complex. Mr. Hawkes is an interested person because of his positions with BMR, EVM, EVC and EV, which are affiliates of the Trust. | | | 170 | | | Director of EVC | |
|
| Noninterested Trustee(s) | | | | | | | | | | | | | |
|
Benjamin C. Esty
1/2/63 | | Trustee | | Since 2005 | | Roy and Elizabeth Simmons Professor of Business Administration, Harvard University Graduate School of Business Administration (since 2003). Formerly, Associate Professor, Harvard University Graduate School of Business Administration (2000-2003). | | | 170 | | | None | |
|
Samuel L. Hayes, III
2/23/35 | | Trustee and Chairman of the Board | | Trustee since 1986 and Chairman of the Board since 2005 | | Jacob H. Schiff Professor of Investment Banking Emeritus, Harvard University Graduate School of Business Administration. Director of Yakima Products, Inc. (manufacturer of automotive accessories) (since 2001) and Director of Telect, Inc. (telecommunications services company). | | | 170 | | | Director of Tiffany & Co. (specialty retailer) | |
|
William H. Park
9/19/47 | | Trustee | | Since 2003 | | Vice Chairman, Commercial Industrial Finance Corp. (specialty finance company) (since 2006). Formerly, President and Chief Executive Officer, Prizm Capital Management, LLC (investment management firm) (2002-2005). Formerly, Executive Vice President and Chief Financial Officer, United Asset Management Corporation (a holding company owning institutional investment management firms) (1982-2001). | | | 170 | | | None | |
|
Ronald A. Pearlman
7/10/40 | | Trustee | | Since 2003 | | Professor of Law, Georgetown University Law Center. | | | 170 | | | None | |
|
Norton H. Reamer
9/21/35 | | Trustee | �� | Since 1986 | | President, Chief Executive Officer and a Director of Asset Management Finance Corp. (a specialty finance company serving the investment management industry) (since October 2003). President, Unicorn Corporation (an investment and financial advisory services company) (since September 2000). Formerly, Chairman and Chief Operating Officer, Hellman, Jordan Management Co., Inc. (an investment management company) (2000-2003). Formerly, Advisory Director of Berkshire Capital Corporation (investment banking firm) (2002-2003). | | | 170 | | | None | |
|
28
Eaton Vance AMT-Free Municipal Bond Fund
MANAGEMENT AND ORGANIZATION CONT'D
Name and
Date of Birth | | Position(s)
with the
Trust | | Term of
Office and
Length of
Service | | Principal Occupation(s)
During Past Five Years | | Number of Portfolios
in Fund Complex
Overseen By
Trustee(1) | | Other Directorships Held | |
| Noninterested Trustee(s) (continued) | | | | | | | | | | | |
|
Lynn A. Stout
9/14/57 | | Trustee | | Since 1998 | | Professor of Law, University of California at Los Angeles School of Law. | | | 170 | | | None | |
|
Ralph F. Verni
1/26/43 | | Trustee | | Since 2005 | | Consultant and private investor. | | | 170 | | | None | |
|
| Principal Officers who are not Trustees | | | | | | | |
|
Name and
Date of Birth | | Position(s)
with the
Trust | | Term of
Office and
Length of
Service | | Principal Occupation(s)
During Past Five Years | |
Thomas E. Faust Jr.
5/31/58 | | President | | Since 2002 | | President of EVC, EVM, BMR and EV and Director of EVC. Chief Investment Officer of EVC, EVM and BMR. Officer of 71 registered investment companies and 5 private investment companies managed by EVM or BMR. | |
|
William H. Ahern, Jr.
7/28/59 | | Vice President | | Since 1995 | | Vice President of EVM and BMR. Officer of 71 registered investment companies managed by EVM or BMR. | |
|
Cynthia J. Clemson
3/2/63 | | Vice President | | Since 2005 | | Vice President of EVM and BMR. Officer of 86 registered investment companies managed by EVM or BMR. | |
|
Aamer Khan
6/7/60 | | Vice President | | Since 2005 | | Vice President of EVM and BMR. Officer of 29 registered investment companies managed by EVM or BMR. | |
|
Thomas H. Luster
4/8/62 | | Vice President | | Since 2006 | | Vice President of EVM and BMR. Officer of 45 registered investment companies managed by EVM or BMR. | |
|
Michael R. Mach
7/15/47 | | Vice President | | Since 1999 | | Vice President of EVM and BMR. Officer of 51 registered investment companies managed by EVM or BMR. | |
|
Robert B. MacIntosh
1/22/57 | | Vice President | | Since 1998 | | Vice President of EVM and BMR. Officer of 86 registered investment companies managed by EVM or BMR. | |
|
Cliff Quisenberry, Jr.
1/1/65 | | Vice President | | Since 2006 | | Vice President and Director of Research and Product Development of Parametric. Officer of 30 registered investment companies managed by EVM or BMR. | |
|
Duncan W. Richardson
10/26/57 | | Vice President | | Since 2001 | | Executive Vice President and Chief Equity Investment Officer of EVC, EVM and BMR. Officer of 71 registered investment companies managed by EVM or BMR. | |
|
Walter A. Row, III
7/20/57 | | Vice President | | Since 2001 | | Director of Equity Research and a Vice President of EVM and BMR. Officer of 33 registered investment companies managed by EVM or BMR. | |
|
Judith A. Saryan
8/21/54 | | Vice President | | Since 2003 | | Vice President of EVM and BMR. Officer of 50 registered investment companies managed by EVM or BMR. | |
|
Susan Schiff
3/13/61 | | Vice President | | Since 2002 | | Vice President of EVM and BMR. Officer of 30 registered investment companies managed by EVM or BMR. | |
|
Barbara E. Campbell
6/19/57 | | Treasurer | | Since 2005(2) | | Vice President of EVM and BMR. Officer of 170 registered investment companies managed by EVM or BMR. | |
|
Alan R. Dynner
10/10/40 | | Secretary | | Since 1997 | | Vice President, Secretary and Chief Legal Officer of BMR, EVM, EVD, EV and EVC. Officer of 170 registered investment companies managed by EVM or BMR. | |
|
Paul M. O'Neil
7/11/53 | | Chief Compliance Officer | | Since 2004 | | Vice President of EVM and BMR. Officer of 170 registered investment companies managed by EVM or BMR. | |
|
(1) Includes both master and feeder funds in a master-feeder structure.
(2) Prior to 2005, Ms. Campbell served as Assistant Treasurer of the Trust since 1995.
The SAI for the Fund includes additional information about the Trustees and officers of the Fund can be obtained without charge on Eaton Vance's website at www.eatonvance.com or by calling 1-800-225-6265.
29
Investment Adviser
Eaton Vance Management
The Eaton Vance Building
255 State Street
Boston, MA 02109
Principal Underwriter
Eaton Vance Distributors, Inc.
The Eaton Vance Building
255 State Street
Boston, MA 02109
(617) 482-8260
Custodian
Investors Bank & Trust Company
200 Clarendon Street
Boston, MA 02116
Transfer Agent
PFPC Inc.
Attn: Eaton Vance Funds
P.O. Box 9653
Providence, RI 02940-9653
(800) 262-1122
Independent Registered Public Accounting Firm
Deloitte & Touche LLP
200 Berkeley Street
Boston, MA 02116-5022
Eaton Vance AMT-Free Municipal Bond Fund
The Eaton Vance Building
255 State Street
Boston, MA 02109
This report must be preceded or accompanied by a current prospectus. Before investing, investors should consider carefully the Fund's investment objective(s), risks, and charges and expenses. The Fund's current prospectus contains this and other information about the Fund and is available through your financial advisor. Please read the prospectus carefully before you invest or send money. For further information please call 1-800-225-6265.
279-2/07 MBSRC

Annual Report December 31, 2006


EATON VANCE
TAX FREE
RESERVES
IMPORTANT NOTICES REGARDING PRIVACY,
DELIVERY OF SHAREHOLDER DOCUMENTS,
PORTFOLIO HOLDINGS, AND PROXY VOTING
Privacy. The Eaton Vance organization is committed to ensuring your financial privacy. Each of the financial institutions identified below has in effect the following policy ("Privacy Policy") with respect to nonpublic personal information about its customers:
• Only such information received from you, through application forms or otherwise, and information about your Eaton Vance fund transactions will be collected. This may include information such as name, address, social security number, tax status, account balances and transactions.
• None of such information about you (or former customers) will be disclosed to anyone, except as permitted by law (which includes disclosure to employees necessary to service your account). In the normal course of servicing a customer's account, Eaton Vance may share information with unaffiliated third parties that perform various required services such as transfer agents, custodians and broker/dealers.
• Policies and procedures (including physical, electronic and procedural safeguards) are in place that are designed to protect the confidentiality of such information.
• We reserve the right to change our Privacy Policy at any time upon proper notification to you. Customers may want to review our Policy periodically for changes by accessing the link on our homepage: www.eatonvance.com.
Our pledge of privacy applies to the following entities within the Eaton Vance organization: the Eaton Vance Family of Funds, Eaton Vance Management, Eaton Vance Investment Counsel, Boston Management and Research, and Eaton Vance Distributors, Inc.
In addition, our Privacy Policy only applies to those Eaton Vance customers who are individuals and who have a direct relationship with us. If a customer's account (i.e., fund shares) is held in the name of a third-party financial adviser/broker-dealer, it is likely that only such adviser's privacy policies apply to the customer. This notice supersedes all previously issued privacy disclosures.
For more information about Eaton Vance's Privacy Policy, please call 1-800-262-1122.
Delivery of Shareholder Documents. The Securities and Exchange Commission (the "SEC") permits funds to deliver only one copy of shareholder documents, including prospectuses, proxy statements and shareholder reports, to fund investors with multiple accounts at the same residential or post office box address. This practice is often called "householding" and it helps eliminate duplicate mailings to shareholders.
Eaton Vance, or your financial adviser, may household the mailing of your documents indefinitely unless you instruct Eaton Vance, or your financial adviser, otherwise.
If you would prefer that your Eaton Vance documents not be householded, please contact Eaton Vance at 1-800-262-1122, or contact your financial adviser.
Your instructions that householding not apply to delivery of your Eaton Vance documents will be effective within 30 days of receipt by Eaton Vance or your financial adviser.
Portfolio Holdings. Each Eaton Vance Fund and its underlying Portfolio (if applicable) will file a schedule of its portfolio holdings on Form N-Q with the SEC for the first and third quarters of each fiscal year. The Form N-Q will be available on the Eaton Vance website www.eatonvance.com, by calling Eaton Vance at 1-800-262-1122 or in the EDGAR database on the SEC's website at www.sec.gov. Form N-Q may also be reviewed and copied at the SEC's public reference room in Washington, D.C. (call 1-800-732-0330 for information on the operation of the public reference room).
Proxy Voting. From time to time, funds are required to vote proxies related to the securities held by the funds. The Eaton Vance Funds or their underlying Portfolios (if applicable) vote proxies according to a set of policies and procedures approved by the Funds' and Portfolios' Boards. You may obtain a description of these policies and procedures and information on how the Funds or Portfolios voted proxies relating to portfolio securities during the most recent 12 month period ended June 30, without charge, upon request, by calling 1-800-262-1122. This description is also available on the SEC's website at www.sec.gov.
Eaton Vance Tax Free Reserves as of December 31, 2006
MANAGEMENT’S DISCUSSION OF FUND PERFORMANCE

|
William H. Ahern, CFA |
Portfolio Manager |
Investment Environment
· During 2006, the U.S. economy grew at a solid pace, with low to moderate inflation. U.S. Gross Domestic Product (GDP), the primary indicator of growth, expanded at a robust 5.6% annualized rate in the first quarter of 2006, 2.6% in the second quarter, 2.0% in the third quarter and an estimated 3.5% in the fourth quarter. Unemployment moved lower to 4.5% in December 2006 from 4.9% a year earlier.
· At its June 2006 meeting, the Federal Reserve Board (the Fed) increased the Fed Funds target rate, a key short-term interest rate benchmark, by 25 basis points (0.25%). This was the Fed’s 17th consecutive increase since June 2004, and it brought the Fed Funds target rate to 5.25%. Since June 2006, the Fed has held short rates steady, awaiting further economic inputs to determine the future direction of interest rate moves.
· In past cycles, as the Fed has moved short-term interest rates higher, market forces have pushed intermediate and long-term bond yields higher as well. During the past year, yields on intermediate and long-term municipal bonds have actually fallen while short rates have risen. Unlike the treasury yield curve, however, short-term municipal yields remained lower than intermediate and long-term municipal yields at December 31, 2006.
The Fund
· During the year ended December 31, 2006, shareholders of Eaton Vance Tax Free Reserves received $0.027 per share in dividends.(1) The Fund’s total return for the same period was 2.71%.(2)
· During the year, management continued to maintain a relatively short weighted average maturity in the Fund to provide flexibility for interest rate increases, enabling it to reinvest more quickly and helping to increase the Fund’s income stream.
· Eaton Vance Tax Free Reserves invests principally in dollar-denominated, high-quality fixed-income securities, including bonds, notes and commercial paper, the interest from which is exempt from regular federal income tax.(1)
· The Fund seeks to invest in short-term obligations that have been rated in one of the two highest short-term ratings categories by at least two nationally recognized rating services.
· Taxes are always a concern for investors who wish to maximize their after-tax returns. A money market mutual fund investing in high-quality investments, exempt from regular federal income tax,(1) can be a sensible way to earn income, while seeking to preserve capital and maintain liquidity.(3)
(1) A portion of the Fund’s income may be subject to federal income and/or alternative minimum tax. Income may be subject to state income tax.
(2) Past performance is no guarantee of future results. Returns are historical and are calculated by determining the percentage change in net asset value (if any) with all distributions reinvested. There is no sales charge. Absent an expense waiver by the investment adviser, the return would be lower.
(3) An investment in the Fund is neither insured nor guaranteed by the U.S. Government. Although the Fund seeks to maintain a stable net asset value of $1.00 per share, it is possible to lose money by investing in the Fund. The Fund has no sales charge.
Asset Allocation*
By net assets
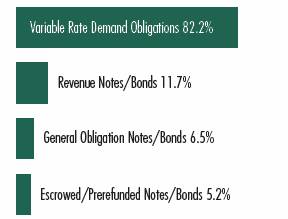
* Asset allocation information may not be representative of the Fund’s current or future investments and may change due to active management.
Fund shares are not insured by the FDIC and are not deposits or other obligations of, or guaranteed by, any depository institution. Shares are subject to investment risks, including possible loss of principal invested.
The views expressed in this report are those of the portfolio manager and are current only through the end of the period of the report as stated on the cover. These views are subject to change at any time based upon market or other conditions, and the investment adviser disclaims any responsibility to update such views. These views may not be relied on as investment advice and, because investment decisions for a fund are based on many factors, may not be relied on as an indication of trading intent on behalf of any Eaton Vance fund.
1
Eaton Vance Tax Free Reserves as of December 31, 2006
FUND EXPENSES
Example: As a shareholder of the Fund, you incur two types of costs: (1) transaction costs, including sales charges (loads) on purchases and redemption fees (if applicable); and (2) ongoing costs, including management fees; distribution or service fees; and other Fund expenses. This Example is intended to help you understand your ongoing costs (in dollars) of investing in the Fund and to compare these costs with the ongoing costs of investing in other mutual funds. The Example is based on an investment of $1,000 invested at the beginning of the period and held for the entire period (July 1, 2006 – December 31, 2006).
Actual Expenses: The first section of the table below provides information about actual account values and actual expenses. You may use the information in this section, together with the amount you invested, to estimate the expenses that you paid over the period. Simply divide your account value by $1,000 (for example, an $8,600 account value divided by $1,000 = 8.6), then multiply the result by the number in the first section under the heading entitled "Expenses Paid During Period" to estimate the expenses you paid on your account during this period.
Hypothetical Example for Comparison Purposes: The second section of the table below provides information about hypothetical account values and hypothetical expenses based on the Fund's actual expense ratio and an assumed rate of return of 5% per year (before expenses), which is not the actual return of the Fund. The hypothetical account values and expenses may not be used to estimate the actual ending account balance or expenses you paid for the period. You may use this information to compare the ongoing costs of investing in your Fund and other funds. To do so, compare this 5% hypothetical example with the 5% hypothetical examples that appear in the shareholder reports of the other funds.
Please note that the expenses shown in the table are meant to highlight your ongoing costs only and do not reflect any transactional costs, such as sales charges (loads) or redemption fees (if applicable). Therefore, the second section of the table is useful in comparing ongoing costs only, and will not help you determine the relative total costs of owning different funds. In addition, if these transactional costs were included, your costs would have been higher.
Eaton Vance Tax Free Reserves
| | | Beginning Account Value
(7/1/06) | | Ending Account Value
(12/31/06) | | Expenses Paid During Period*
(7/1/06 – 12/31/06) | |
| Actual | | $ | 1,000.00 | | | $ | 1,014.40 | | | $ | 3.25 | ** | |
| Hypothetical | |
| (5% return per year before expenses) | | $ | 1,000.00 | | | $ | 1,022.00 | | | $ | 3.26 | ** | |
* Expenses are equal to the Fund's annualized expense ratio of 0.64% multiplied by the average account value over the period, multiplied by 184/365 (to reflect the one-half year period). The example assumes that the $1,000 was invested at the net asset value per share determined at the close of business on June 30, 2006.
** Absent an expense waiver by the investment adviser, expenses would be higher.
2
Eaton Vance Tax Free Reserves as of December 31, 2006
PORTFOLIO OF INVESTMENTS
| Tax-Exempt Investments — 105.6% | | | |
Principal Amount
(000's omitted) | |
Security | | Value | |
| Escrowed / Prerefunded Notes / Bonds — 5.2% | | | |
| $ | 2,000 | | | Jefferson County, AL, Sewer Revenue, (XLCA), (SPA: State
Street B&T Co.), Prerefunded to 2/1/07, 5.75%, 2/1/07 | | $ | 2,011,137 | | |
| | | | | | | $ | 2,011,137 | | |
| General Obligation Notes / Bonds — 6.5% | | | |
| $ | 1,000 | | | Bay Village, OH, 4.50%, 7/20/07 | | $ | 1,004,794 | | |
| | 1,500 | | | Texas, Tax and Revenue Anticipation, 4.50%, 8/31/07 | | | 1,509,120 | | |
| | | | | | | $ | 2,513,914 | | |
| Revenue Notes / Bonds — 11.7% | | | |
| $ | 500 | | | Illinois Educational Facility Authority, (University of Chicago),
3.10%, 7/1/07 | | $ | 498,417 | | |
| | 2,000 | | | Metropolitan Government of Nashville and Davidson County,
TN, Health and Educational Facilities Revenue, (Ascension
Health Credit Group), 3.40%, 1/3/07 | | | 1,999,965 | | |
| | 1,000 | | | Milwaukee, WI, School Revenue, 4.50%, 8/30/07 | | | 1,005,989 | | |
| | 1,000 | | | University of Texas, 5.00%, 8/15/07 | | | 1,009,054 | | |
| | | | | | | $ | 4,513,425 | | |
| Variable Rate Demand Obligations — 82.2% | | | |
| $ | 500 | | | Chesapeake Bay Bridge and Tunnel Commission, VA,
District Revenue, (MBIA), (SPA: Wachovia Bank N.A.),
3.95%, 7/1/25 | | $ | 500,000 | | |
| | 1,000 | | | Cleveland-Cuyahoga County, OH, Port Authority Cultural
Facility, (Playhouse Square Foundation), (LOC: Fifth Third
Bank), 3.92%, 11/15/34 | | | 1,000,000 | | |
| | 1,145 | | | Colorado Educational and Cultural Facility Authority,
(YMCA Metropolitan Denver), (LOC: Wells Fargo Bank N.A.),
3.91%, 7/1/18 | | | 1,145,000 | | |
| | 1,400 | | | Connecticut Health and Educational Facility Authority, (Bradley
Health Care), (LOC: Bank of America), 3.87%, 7/1/29 | | | 1,400,000 | | |
| | 1,850 | | | Connecticut Health and Educational Facility Authority,
(Yale University), 3.90%, 7/1/36 | | | 1,850,000 | | |
| | 200 | | | Delaware Valley, PA, Regional Finance Authority, Series A,
(LOC: National Australia Bank), 3.91%, 12/1/17 | | | 200,000 | | |
| | 700 | | | Delaware Valley, PA, Regional Finance Authority, Series A,
(LOC: National Australia Bank), 3.91%, 12/1/20 | | | 700,000 | | |
| | 600 | | | Delaware Valley, PA, Regional Finance Authority, Series C,
(LOC: National Australia Bank), 3.91%, 12/1/20 | | | 600,000 | | |
| | 500 | | | Farmington, NM, Pollution Control Revenue, Series C, AMT,
(Arizona Public Service Co.), (LOC: Barclays Bank PLC),
3.91%, 9/1/24 | | | 500,000 | | |
| | 1,000 | | | Fulco, GA, Hospital Authority, (Piedmont Hospital),
(LOC: SunTrust Bank), 3.91%, 3/1/24 | | | 1,000,000 | | |
Principal Amount
(000's omitted) | |
Security | | Value | |
| Variable Rate Demand Obligations (continued) | | | |
| $ | 400 | | | Galveston, TX, Industrial Development Corp., AMT,
(Mitchell Industries), (LOC: JP Morgan Chase Bank),
4.10%, 9/1/13 | | $ | 400,000 | | |
| | 1,245 | | | Illinois, (FSA), (SPA: Wachovia Bank N.A.),
3.95%, 12/1/24 | | | 1,245,000 | | |
| | 1,600 | | | Illinois Development Finance Authority, (Chicago Symphony
Orchestra), (LOC: Northern Trust Co.), 3.90%, 12/1/28 | | | 1,600,000 | | |
| | 1,000 | | | Illinois Development Finance Authority, Series C, (Provena
Health), (MBIA), (SPA: Bank One N.A.), 3.89%, 5/1/28 | | | 1,000,000 | | |
| | 1,500 | | | Illinois Finance Authority Industrial Development Revenue,
(Barton Manufacturing, Inc.), AMT, (LOC: National City Bank),
4.03%, 11/1/18 | | | 1,500,000 | | |
| | 1,000 | | | Illinois Finance Authority, (Northwestern University),
3.93%, 12/1/34 | | | 1,000,000 | | |
| | 600 | | | Indiana Municipal Power Agency and Power Supply System
Revenue, Series A, (LOC: Dexia Credit Local),
3.91%, 1/1/18 | | | 600,000 | | |
| | 1,000 | | | Jefferson County, AL, Sewer Revenue, (XLCA), (SPA: State
Street B&T Co.), 3.92%, 2/1/42 | | | 1,000,000 | | |
| | 1,750 | | | King County, WA, Sewer Revenue, (LOC: Helaba),
4.00%, 1/1/32 | | | 1,750,000 | | |
| | 895 | | | Lake Elsinore, CA, Recreation Authority Revenue, (Public
Facilities), (LOC: Union Bank of CA), 3.84%, 2/1/32 | | | 895,000 | | |
| | 425 | | | Metropolitan Government of Nashville and Davidson County,
TN, Industrial Development Revenue, (Dixie Graphics, Inc.),
(LOC: SunTrust Bank), 3.92%, 5/1/09 | | | 425,000 | | |
| | 700 | | | Missouri Health and Educational Facility Authority Revenue,
(Washington University), (SPA: JP Morgan Chase Bank),
3.97%, 9/1/30 | | | 700,000 | | |
| | 1,000 | | | Montgomery, AL, Industrial Development Board Pollution
Control and Solid Waste Disposal, (General Electric Co.),
3.91%, 5/1/21 | | | 1,000,000 | | |
| | 1,000 | | | North Carolina Capital Facility Finance Agency, (Wake Forest
University), 3.89%, 1/1/18 | | | 1,000,000 | | |
| | 400 | | | Ohio Higher Educational Facility Commission, (John Carroll
University), (LOC: Allied Irish Bank PLC), 3.92%, 11/15/31 | | | 400,000 | | |
| | 900 | | | Pasadena, TX, School District, (SPA: Bank of America N.A.),
(PSF Guaranteed), 3.92%, 8/15/26 | | | 900,000 | | |
| | 500 | | | Pennsylvania Turnpike Commission, (Oil Franchise), (AMBAC),
(Liq: Citigroup Financial), 3.76%, 12/1/15 | | | 500,000 | | |
| | 955 | | | Pennsylvania Turnpike Commission, (Oil Franchise), (AMBAC),
(Liq: Citigroup Financial), 3.76%, 12/15/15 | | | 955,000 | | |
| | 1,400 | | | Private Colleges and Universities Authority, GA, (Emory
University), 3.87%, 9/1/35 | | | 1,400,000 | | |
| | 1,300 | | | South Barrington, IL, (Cook County), (LOC: Harris Trust &
Savings Bank), 4.15%, 12/1/27 | | | 1,300,000 | | |
| | 1,000 | | | Travis County, TX, Housing Finance Corp., (Multi-Family
Housing), (Travis Apartments), (Liq: FNMA),
3.90%, 2/15/34 | | | 1,000,000 | | |
See notes to financial statements
3
Eaton Vance Tax Free Reserves as of December 31, 2006
PORTFOLIO OF INVESTMENTS CONT'D
Principal Amount
(000's omitted) | |
Security | | Value | |
| Variable Rate Demand Obligations (continued) | |
| $ | 1,300 | | | University of Pittsburgh of the Commonwealth System of
Higher Education, PA, (University of PA), (SPA: DEPFA
Bank PLC), 3.95%, 9/15/24 | | $ | 1,300,000 | | |
| | 860 | | | West Memphis, AR, Public Facility Board, AMT,
(West Memphis Meadow 98 Apts.), (Liq: FHLMC),
3.97%, 12/1/34 | | | 860,000 | | |
| | | | | $ | 31,625,000 | | |
Total Tax-Exempt Investments — 105.6%
(identified cost $40,663,476)(1) | | | | $ | 40,663,476 | | |
| Other Assets, Less Liabilities — (5.6)% | | | | $ | (2,166,952 | ) | |
| Net Assets — 100.0% | | | | $ | 38,496,524 | | |
AMBAC - AMBAC Financial Group, Inc.
AMT - Interest earned from these securities may be considered a tax preference item for purposes of the Federal Alternative Minimum Tax.
FHLMC - Federal Home Loan Mortgage Corporation (Freddie Mac)
FNMA - Federal National Mortgage Association (Fannie Mae)
FSA - Financial Security Assurance, Inc.
LOC - Letter of Credit
Liq - Liquidity Provider
MBIA - Municipal Bond Insurance Association
PSF - Permanent School Fund
SPA - Standby Bond Purchase Agreement
XLCA - XL Capital Assurance, Inc.
The stated interest rate on variable rate demand obligations represents the rate in effect at December 31, 2006.
At December 31, 2006, the concentration of the Fund's investments in the various states, determined as a percentage of net assets, is as follows:
| Alabama | | | 10.4 | % | |
| Illinois | | | 21.2 | % | |
| Pennsylvania | | | 11.1 | % | |
| Texas | | | 12.5 | % | |
| Others, representing less than 10% individually | | | 50.4 | % | |
At December 31, 2006, the concentration of the Fund's investments in the various industries, determined as a percentage of net assets, is as follows:
| Education | | | 23.8 | % | |
| Other Revenue | | | 16.2 | % | |
| General Obligation | | | 15.5 | % | |
| Healthcare | | | 14.0 | % | |
| Others, representing less than 10% individually | | | 36.1 | % | |
(1) Cost for federal income taxes is the same.
See notes to financial statements
4
Eaton Vance Tax Free Reserves as of December 31, 2006
FINANCIAL STATEMENTS
Statement of Assets and Liabilities
As of December 31, 2006
| Assets | |
| Investments, at amortized cost | | $ | 40,663,476 | | |
| Cash | | | 936,529 | | |
| Receivable for Fund shares sold | | | 4,652 | | |
| Interest receivable | | | 251,356 | | |
| Total assets | | $ | 41,856,013 | | |
| Liabilities | |
| Payable for Fund shares redeemed | | $ | 3,231,006 | | |
| Dividends payable | | | 74,216 | | |
| Payable to affiliate for investment advisory fees | | | 10,379 | | |
| Payable to affiliate for Trustees' fees | | | 426 | | |
| Accrued expenses | | | 43,462 | | |
| Total liabilities | | $ | 3,359,489 | | |
| Net Assets for 38,514,527 shares of beneficial interest outstanding | | $ | 38,496,524 | | |
| Sources of Net Assets | |
| Paid-in capital | | $ | 38,496,980 | | |
| Accumulated net realized loss (computed on the basis of identified cost) | | | (456 | ) | |
| Total | | $ | 38,496,524 | | |
| Shares of Beneficial Interest Outstanding | |
| | | | 38,514,527 | | |
Net Asset Value, Offering Price and
Redemption Price Per Share | |
| ($38,496,524 ÷ 38,514,527 shares of beneficial interest outstanding) | | $ | 1.00 | | |
Statement of Operations
For the Year Ended
December 31, 2006
| Investment Income | |
| Interest | | $ | 1,311,083 | | |
| Total investment income | | $ | 1,311,083 | | |
| Expenses | |
| Investment adviser fee | | $ | 194,871 | | |
| Trustees' fees and expenses | | | 1,681 | | |
| Custodian fee | | | 42,878 | | |
| Legal and accounting services | | | 34,077 | | |
| Registration fees | | | 20,763 | | |
| Printing and postage | | | 8,901 | | |
| Transfer and dividend disbursing agent fees | | | 4,740 | | |
| Miscellaneous | | | 5,011 | | |
| Total expenses | | $ | 312,922 | | |
Deduct —
Reduction of custodian fee | | $ | 32,177 | | |
| Reduction of investment adviser fee | | | 13,902 | | |
| Total expense reductions | | $ | 46,079 | | |
| Net expenses | | $ | 266,843 | | |
| Net investment income | | $ | 1,044,240 | | |
| Realized Gain (Loss) | |
Net realized gain (loss) —
Investment transactions (identified cost basis) | | $ | (220 | ) | |
| Net realized loss | | $ | (220 | ) | |
| Net increase in net assets from operations | | $ | 1,044,020 | | |
See notes to financial statements
5
Eaton Vance Tax Free Reserves as of December 31, 2006
FINANCIAL STATEMENTS CONT'D
Statements of Changes in Net Assets
Increase (Decrease)
in Net Assets | | Year Ended
December 31, 2006 | | Year Ended
December 31, 2005 | |
From operations —
Net investment income | | $ | 1,044,240 | | | $ | 570,826 | | |
Net realized loss from
investment transactions | | | (220 | ) | | | — | | |
| Net increase in net assets from operations | | $ | 1,044,020 | | | $ | 570,826 | | |
Distributions to shareholders —
From net investment income | | $ | (1,044,240 | ) | | $ | (570,826 | ) | |
| Total distributions to shareholders | | $ | (1,044,240 | ) | | $ | (570,826 | ) | |
Transactions in shares of beneficial interest
Net asset of $1.00 per share —
Proceeds from sale of shares | | $ | 74,804,202 | | | $ | 77,348,986 | | |
Net asset value of shares issued to
shareholders in payment of
distributions declared | | | 232,085 | | | | 154,803 | | |
| Cost of shares redeemed | | | (70,597,404 | ) | | | (69,039,589 | ) | |
Net increase in net assets from Fund
share transactions | | $ | 4,438,883 | | | $ | 8,464,200 | | |
| Net increase in net assets | | $ | 4,438,663 | | | $ | 8,464,200 | | |
| Net Assets | |
| At beginning of year | | $ | 34,057,861 | | | $ | 25,593,661 | | |
| At end of year | | $ | 38,496,524 | | | $ | 34,057,861 | | |
See notes to financial statements
6
Eaton Vance Tax Free Reserves as of December 31, 2006
FINANCIAL STATEMENTS CONT'D
Financial Highlights
| | | Year Ended December 31, | |
| | | 2006 | | 2005 | | 2004 | | 2003 | | 2002 | |
| Net asset value — Beginning of year | | $ | 1.000 | | | $ | 1.000 | | | $ | 1.000 | | | $ | 1.000 | | | $ | 1.000 | | |
| Income (loss) from operations | |
| Net investment income | | $ | 0.027 | | | $ | 0.017 | | | $ | 0.005 | | | $ | 0.004 | | | $ | 0.008 | | |
| Less distributions | |
| From net investment income | | $ | (0.027 | ) | | $ | (0.017 | ) | | $ | (0.005 | ) | | $ | (0.004 | ) | | $ | (0.008 | ) | |
| Total distributions | | $ | (0.027 | ) | | $ | (0.017 | ) | | $ | (0.005 | ) | | $ | (0.004 | ) | | $ | (0.008 | ) | |
| Net asset value — End of year | | $ | 1.000 | | | $ | 1.000 | | | $ | 1.000 | | | $ | 1.000 | | | $ | 1.000 | | |
| Total Return(1) | | | 2.71 | % | | | 1.67 | % | | | 0.51 | % | | | 0.44 | % | | | 0.81 | % | |
| Ratios/Supplemental Data | |
| Net assets, end of year (000's omitted) | | $ | 38,497 | | | $ | 34,058 | | | $ | 25,594 | | | $ | 29,519 | | | $ | 29,265 | | |
| Ratios (As a percentage of average daily net assets): | |
| Net expenses before custodian fee reduction | | | 0.77 | %(2) | | | 0.82 | %(2) | | | 0.83 | %(2) | | | 0.77 | %(2) | | | 0.85 | % | |
| Net expenses after custodian fee reduction | | | 0.69 | %(2) | | | 0.71 | %(2) | | | 0.73 | %(2) | | | 0.67 | %(2) | | | 0.74 | % | |
| Net investment income | | | 2.68 | % | | | 1.69 | % | | | 0.50 | % | | | 0.43 | % | | | 0.81 | % | |
(1) Returns are historical and are calculated by determining the percentage change in net asset value with all distributions reinvested. Total return is not computed on an annualized basis. Total return would have been lower had certain expenses not been reduced during the periods shown.
(2) The investment adviser voluntarily waived a portion of its investment advisory fee (equal to 0.04%, 0.03%, less than 0.01% and 0.01% of average daily net assets for 2006, 2005, 2004 and 2003, respectively).
See notes to financial statements
7
Eaton Vance Tax Free Reserves as of December 31, 2006
NOTES TO FINANCIAL STATEMENTS
1 Significant Accounting Policies
Eaton Vance Tax Free Reserves (the Fund) is a series of Eaton Vance Mutual Funds Trust (the Trust). The Trust is an entity of the type known as a Massachusetts business trust and is registered under the Investment Company Act of 1940 (the 1940 Act), as amended, as an open-end management investment company. The Fund's investment objective is to provide as high a rate of income exempt from regular federal income tax as may be consistent with preservation of capital and maintenance of liquidity. The following is a summary of significant accounting policies consistently followed by the Fund in the preparation of its financial statements. The policies are in conformity with accounting principles generally accepted in the United States of America.
A Security Valuation — The Fund values investment securities utilizing the amortized cost valuation technique permitted by Rule 2a-7 of the Investment Company Act of 1940, pursuant to which the Fund must comply with certain conditions. This technique involves initially valuing a portfolio security at its cost and thereafter assuming a constant amortization to maturity of any discount or premium.
B Interest Income — Interest income is recorded on the basis of interest accrued, adjusted for amortization of premium or accretion of any discount.
C Federal Taxes — The Fund's policy is to comply with the provisions of the Internal Revenue Code (the Code) applicable to regulated investment companies and to distribute to shareholders each year all of its taxable, if any, and tax-exempt income, including any net realized gain on investments. Accordingly, no provision for federal income or excise tax is necessary. At December 31, 2006, the Fund, for federal income tax purposes, had a capital loss carryover of $456, which will reduce the Fund's taxable income arising from future net realized gain on investments, if any, to the extent permitted by the Code, and thus will reduce the amount of the distributions to shareholders which would otherwise be necessary to relieve the Fund of any liability for federal income tax. Such capital loss carryover will expire on December 31, 2011 ($109), December 31, 2012 ($127) and December 31, 2014 ($220). Dividends paid by the Fund from net interest earned on tax-exempt municipal bonds are not includable by shareholders as gross income for federal income tax purposes because the Fund intends to meet certain requirements of the Code applicable to regulated investment companies which will enable the Fund to pay exempt-interest dividends. The portion of such interest, if any, earned on private activity bonds issued after August 7, 1986 may be considered a tax preference item for shareholders.
D Other — Investment transactions are accounted for on the date the securities are purchased or sold. Realized gains and losses on securities sold are determined on the basis of identified cost. Dividends to shareholders are recorded on the ex-dividend date.
E Expense Reduction — Investors Bank & Trust Company (IBT) serves as custodian of the Fund. Pursuant to the custodian agreement, IBT receives a fee reduced by credits which are determined based on the average daily cash balance the Fund maintains with IBT. All credit balances used to reduce the Fund's custodian fees are reported as a reduction of expenses in the Statements of Operations.
F Expenses — The majority of expenses of the Trust are directly identifiable to an individual fund. Expenses which are not readily identifiable to a specific fund are allocated taking into consideration, among other things, the nature and type of expense and the relative size of the funds.
G Use of Estimates — The preparation of the financial statements in conformity with accounting principles generally accepted in the United States of America requires management to make estimates and assumptions that affect the reported amounts of assets and liabilities at the date of the financial statements and the reported amounts of income and expense during the reporting period. Actual results could differ from those estimates.
H Indemnifications — Under the Trust's organizational documents, its officers and Trustees may be indemnified against certain liabilities and expenses arising out of the performance of their duties to the Fund and shareholders are indemnified against personal liability for obligations of the Trust. Additionally, in the normal course of business, the Fund enters into agreements with service providers that may contain indemnification clauses. The Fund's maximum exposure under these arrangements is unknown as this would involve future claims that may be made against the Fund that have not yet occurred.
2 Distributions to Shareholders
The net investment income of the Fund is determined daily, and substantially all of the net investment income so determined is declared as a dividend to shareholders of record at the time of declaration. Such dividends are paid monthly. Distributions are paid in the form of additional
8
Eaton Vance Tax Free Reserves as of December 31, 2006
NOTES TO FINANCIAL STATEMENTS CONT'D
shares of the Fund, or, at the election of the shareholder, in cash. The Fund distinguishes between distributions on a tax basis and a financial reporting basis. Accounting principles generally accepted in the United States of America require that only distributions in excess of tax basis earnings and profits be reported in the financial statements as a return of capital. Permanent differences between book and tax accounting relating to distributions are reclassified to paid-in capital.
The tax character of the distributions declared for the years ended December 31, 2006 and December 31, 2005 was as follows:
| | | Year Ended
12/31/06 | | Year Ended
12/31/05 | |
| Distributions declared from: | |
| Tax-exempt income | | $ | 1,041,315 | | | $ | 569,146 | | |
| Ordinary income | | $ | 2,925 | | | $ | 1,680 | | |
As of December 31, 2006, the components of distributable earnings (accumulated losses) on a tax basis were as follows:
| Capital loss carryforward | | $ | (456 | ) | |
3 Investment Adviser Fee and Other Transactions with Affiliates
The investment adviser fee is earned by Eaton Vance Management (EVM) as compensation for management, investment advisory, and other services rendered to the Fund and is computed at the monthly rate of 1/24 of 1% (0.50% annually) of the Fund's average daily net assets. For the year ended December 31, 2006, the fee amounted to $194,871. Pursuant to a voluntary fee waiver, EVM waived $13,902 of its investment adviser fee for the year ended December 31, 2006. Except as to Trustees of the Fund who are not members of EVM's organization, officers and Trustees receive remuneration for their services to the Fund out of such investment adviser fee. EVM serves as the sub-transfer agent of the Fund and receives from the transfer agent an aggregate fee based upon the actual expenses incurred by EVM in the performance of those services. For the year ended December 31, 2006, EVM received $387 in sub-transfer agent fees. Certain officers and Tr ustees of the Fund are officers of the above organization.
4 Shares of Beneficial Interest
The Declaration of Trust permits the Trustees to issue an unlimited number of full and fractional shares of beneficial interest (without par value).
5 Line of Credit
The Fund participates with other portfolios and funds managed by EVM and its affiliates in a $150 million unsecured line of credit agreement with a group of banks. Borrowings will be made by the Fund solely to facilitate the handling of unusual and/or unanticipated short-term cash requirements. Interest is charged to each participating portfolio or fund based on its borrowings at an amount above the Eurodollar rate or Federal Funds rate. In addition, a fee computed at an annual rate of 0.10% on the daily unused portion of the line of credit is allocated among the participating portfolios and funds at the end of each quarter. The Fund did not have any significant borrowings or allocated fees during the year ended December 31, 2006.
6 Purchases and Sales of Investments
The Fund invests primarily in debt securities issued by municipalities. The ability of the issuers of the debt securities held by the Fund to meet their obligations may be affected by economic developments in a specific industry or municipality. Purchases and sales (including maturities) of investments aggregated $75,817,975 and $69,726,625, respectively, for year ended December 31, 2006.
7 Recently Issued Accounting Pronouncements
In June 2006, the Financial Accounting Standards Board ("FASB") issued FASB Interpretation No. 48, ("FIN 48") "Accounting for Uncertainty in Income Taxes – an interpretation of FASB Statement No. 109". FIN 48 clarifies the accounting for uncertainty in income taxes recognized in accordance with FASB Statement No. 109, "Accounting for Income Taxes." This interpretation prescribes a recognition threshold and measurement attribute for the financial statement recognition and measurement of a tax position taken or expected to be taken in a tax return. It also provides guidance on de-recognition, classification, interest and penalties, accounting in interim periods, disclosure and transition. FIN 48 is effective during the first required financial reporting period for fiscal years beginning after December 15, 2006. Management is currently evaluating the impact of applying the various provisions of FIN 48.
In September 2006, the FASB issued Statement of Financial Accounting Standards No. 157, ("FAS 157") "Fair Value Measurements". FAS 157 defines fair value, establishes a framework for measuring fair value in accordance with generally accepted accounting principles and expands disclosure about fair value measurements. FAS 157 is effective for fiscal years beginning after November 15,
9
Eaton Vance Tax Free Reserves as of December 31, 2006
NOTES TO FINANCIAL STATEMENTS CONT'D
2007. Management is currently evaluating the impact the adoption of FAS 157 will have on the Fund's financial statement disclosures.
10
Eaton Vance Tax Free Reserves as of December 31, 2006
REPORT OF INDEPENDENT REGISTERED PUBLIC ACCOUNTING FIRM
To the Trustees and Shareholders
of Eaton Vance Tax Free Reserves:
In our opinion, the accompanying statement of assets and liabilities, including the portfolio of investments, and the related statements of operations and of changes in net assets and the financial highlights present fairly, in all material respects, the financial position of Eaton Vance Tax Free Reserves, a series of Eaton Vance Mutual Funds Trust, (the "Fund") at December 31, 2006, and the results of its operations, the changes in its net assets and the financial highlights for each of the periods indicated, in conformity with accounting principles generally accepted in the United States of America. These financial statements and financial highlights (hereafter referred to as "financial statements") are the responsibility of the Fund's management; our responsibility is to express an opinion on these financial statements based on our audits. We conducted our audits of these financial statements in accordance with the standards of the Public Company Accounting Oversight Board (United States). Those standards require that we plan and perform the audit to obtain reasonable assurance about whether the financial statements are free of material misstatement. An audit includes examining, on a test basis, evidence supporting the amounts and disclosures in the financial statements, assessing the accounting principles used and significant estimates made by management, and evaluating the overall financial statement presentation. We believe that our audits, which included confirmation of securities at December 31, 2006 by correspondence with the custodian, provide a reasonable basis for our opinion.
PricewaterhouseCoopers LLP
Boston, Massachusetts
February 20, 2007
11
Eaton Vance Tax Free Reserves as of December 31, 2006
FEDERAL TAX INFORMATION (Unaudited)
The Form 1099-DIV you received in January 2007 showed the tax status of all distributions paid to your account in calendar 2006. Shareholders are advised to consult their own tax adviser with respect to the tax consequences of their investment in the Fund. As required by the Internal Revenue Code regulations, shareholders must be notified within 60 days of the Fund's fiscal year end regarding exempt-interest dividends.
Exempt-Interest Dividends — The Fund designates 99.72% of dividends from net investment income as an exempt-interest dividend.
12
Eaton Vance Tax Free Reserves
BOARD OF TRUSTEES' ANNUAL APPROVAL OF THE INVESTMENT ADVISORY AGREEMENT
Overview of the Contract Review Process
The Investment Company Act of 1940, as amended (the "1940 Act"), provides, in substance, that each investment advisory agreement between a fund and its investment adviser will continue in effect from year to year only if its continuance is approved at least annually by the fund's board of trustees, including by a vote of a majority of the trustees who are not "interested persons" of the fund ("Independent Trustees") cast in person at a meeting called for the purpose of considering such approval.
At a meeting of the Boards of Trustees (each a "Board") of the Eaton Vance group of mutual funds (the "Eaton Vance Funds") held on March 27, 2006, the Board, including a majority of the Independent Trustees, voted to approve continuation of existing advisory and sub-advisory agreements for the Eaton Vance Funds for an additional one-year period. In voting its approval, the Board relied upon the affirmative recommendation of the Special Committee of the Board, which is a committee comprised exclusively of Independent Trustees. Prior to making its recommendation, the Special Committee reviewed information furnished for a series of meetings of the Special Committee held in February and March 2006. Such information included, among other things, the following:
Information about Fees, Performance and Expenses
• An independent report comparing the advisory and related fees paid by each fund with fees paid by comparable funds;
• An independent report comparing each fund's total expense ratio and its components to comparable funds;
• An independent report comparing the investment performance of each fund to the investment performance of comparable funds over various time periods;
• Data regarding investment performance in comparison to relevant peer groups of funds and appropriate indices;
• Comparative information concerning fees charged by each adviser for managing other mutual funds and institutional accounts using investment strategies and techniques similar to those used in managing the fund;
• Profitability analyses for each adviser with respect to each fund managed by it;
Information about Portfolio Management
• Descriptions of the investment management services provided to each fund, including the investment strategies and processes employed;
• Information concerning the allocation of brokerage and the benefits received by each adviser as a result of brokerage allocation, including information concerning the acquisition of research through "soft dollar" benefits received in connection with the funds' brokerage, and the implementation of a soft dollar reimbursement program established with respect to the funds;
• Data relating to portfolio turnover rates of each fund;
• The procedures and processes used to determine the fair value of fund assets and actions taken to monitor and test the effectiveness of such procedures and processes;
Information about each Adviser
• Reports detailing the financial results and condition of each adviser;
• Descriptions of the qualifications, education and experience of the individual investment professionals whose responsibilities include portfolio management and investment research for the funds, and information relating to their compensation and responsibilities with respect to managing other mutual funds and investment accounts;
• Copies of the Codes of Ethics of each adviser and its affiliates, together with information relating to compliance with and the administration of such codes;
• Information concerning the resources devoted to compliance efforts undertaken by each adviser and its affiliates on behalf of the funds (including descriptions of various compliance programs) and their record of compliance with investment policies and restrictions, including policies with respect to market-timing, late trading and selective portfolio disclosure, and with policies on personal securities transactions;
• Descriptions of the business continuity and disaster recovery plans of each adviser and its affiliates;
Other Relevant Information
• Information concerning the nature, cost and character of the administrative and other non-investment management services provided by Eaton Vance Management and its affiliates;
• Information concerning management of the relationship with the custodian, subcustodians and fund accountants by each adviser or the funds' administrator; and
• The terms of each advisory agreement.
In addition to the information identified above, the Special Committee considered information provided from time to time by each adviser throughout the year at meetings of the Board and its committees. Over the course of the twelve month period ended March 31, 2006, the
13
Eaton Vance Tax Free Reserves
BOARD OF TRUSTEES' ANNUAL APPROVAL OF THE INVESTMENT ADVISORY AGREEMENT CONT'D
Board met nine times and the Special Committee, the Audit Committee and the Governance Committee, each of which is a Committee comprised solely of Independent Trustees, met eight, twelve and five times, respectively. At such meetings, the Trustees received, among other things, presentations by the portfolio managers and other investment professionals of each adviser relating to the investment performance of each fund and the investment strategies used in pursuing the fund's investment objective.
For funds that invest through one or more underlying portfolios, the Board considered similar information about the portfolio(s) when considering the approval of advisory agreements. In addition, in cases where the fund's investment adviser has engaged a sub-adviser, the Board considered similar information about the sub-adviser when considering the approval of any sub-advisory agreement.
The Special Committee was assisted throughout the contract review process by Goodwin Procter LLP, legal counsel for the Independent Trustees. The members of the Special Committee relied upon the advice of such counsel and their own business judgment in determining the material factors to be considered in evaluating each advisory and sub-advisory agreement and the weight to be given to each such factor. The conclusions reached with respect to each advisory and sub-advisory agreement were based on a comprehensive evaluation of all the information provided and not any single factor. Moreover, each member of the Special Committee may have placed varying emphasis on particular factors in reaching conclusions with respect to each advisory and sub-advisory agreement.
Results of the Process
Based on its consideration of the foregoing, and such other information as it deemed relevant, including the factors and conclusions described below, the Special Committee concluded that the continuance of the investment advisory agreement of Eaton Vance Tax Free Reserves (the "Fund") with Eaton Vance Management (the "Adviser"), including its fee structure, is in the interests of shareholders and, therefore, the Special Committee recommended to the Board approval of the agreement. The Board accepted the recommendation of the Special Committee as well as the factors considered and conclusions reached by the Special Committee with respect to the agreement. Accordingly, the Board, including a majority of the Independent Trustees, voted to approve continuation of the advisory agreement for the Fund.
Nature, Extent and Quality of Services
In considering whether to approve the investment advisory agreement of the Fund, the Board evaluated the nature, extent and quality of services provided to the Fund by the Adviser.
The Board considered the Adviser's management capabilities and investment process with respect to the types of investments held by the Fund, including the education, experience and number of its investment professionals and other personnel who provide portfolio management, investment research, and similar services to the Fund. The Board considered the Adviser's experience in managing portfolios consisting of high quality money market instruments and short-term obligations. The Board also took into account the resources dedicated to portfolio management and other services, including the compensation paid to recruit and retain investment personnel, and the time and attention devoted to each Fund in the complex by senior management.
The Board reviewed the compliance programs of the Adviser and relevant affiliates thereof. Among other matters, the Board considered compliance and reporting matters relating to personal trading by investment personnel, selective disclosure of portfolio holdings, late trading, frequent trading, portfolio valuation, business continuity and the allocation of investment opportunities. The Board also evaluated the responses of the Adviser and its affiliates to requests from regulatory authorities such as the Securities and Exchange Commission and the National Association of Securities Dealers.
The Board considered shareholder and other administrative services provided or managed by Eaton Vance Management and its affiliates, including transfer agency and accounting services. The Board evaluated the benefits to shareholders of investing in a fund that is a part of a large family of funds, including the ability, in many cases, to exchange an investment among different funds without incurring additional sales charges.
After consideration of the foregoing factors, among others, the Board concluded that the nature, extent and quality of services provided by the Adviser, taken as a whole, are appropriate and consistent with the terms of the investment advisory agreement.
Fund Performance
The Board compared the Fund's investment performance to a relevant universe of similarly managed funds identified by an independent data provider and appropriate benchmark indices. The Board reviewed comparative performance data for the one-, three, five- and ten-year periods ended September 30, 2005 for the Fund. The Board noted that the Fund's performance relative to its peers is affected by the Fund's emphasis on quality and its lower proportion of securities which produce income subject to alternative minimum tax ("AMT Securities"). AMT Securities generally have higher yields than securities which produce income not subject to
14
Eaton Vance Tax Free Reserves
BOARD OF TRUSTEES' ANNUAL APPROVAL OF THE INVESTMENT ADVISORY AGREEMENT CONT'D
alternative minimum tax. On the basis of the foregoing and other relevant information, the Board concluded that the performance of the Fund is satisfactory.
Management Fees and Expenses
The Board reviewed contractual investment advisory fee rates payable by the Fund (referred to as "management fees"). As part of its review, the Board considered the management fees and the Fund's total expense ratio for the one-year period ended September 30, 2005, as compared to a group of similarly managed funds selected by an independent data provider.
After reviewing the foregoing information, and in light of the nature, extent and quality of the services provided by the Adviser, the Board concluded that the management fees charged for advisory and related services and the Fund's total expense ratio are reasonable.
Profitability
The Board reviewed the level of profits realized by the Adviser and relevant affiliates thereof in providing investment advisory and administrative services to the Fund and to all Eaton Vance Funds as a group. The Board considered the level of profits realized without regard to revenue sharing or other payments by the Adviser and its affiliates to third parties in respect of distribution services. The Board also considered other direct or indirect benefits received by the Adviser in connection with its relationship with the Fund.
The Board concluded that, in light of the foregoing factors and the nature, extent and quality of the services rendered, the profits realized by the Adviser and its affiliates are reasonable.
Economies of Scale
In reviewing management fees and profitability, the Board also considered the extent to which the Adviser and its affiliates, on the one hand, and the Fund, on the other hand, can expect to realize benefits from economies of scale as the assets of the Fund increase. The Board acknowledged the difficulty in accurately measuring the benefits resulting from the economies of scale with respect to the management of any specific fund or group of funds. The Board reviewed data summarizing the increases and decreases in the assets of the Fund and of all Eaton Vance Funds as a group over various time periods, and evaluated the extent to which the total expense ratio of the Fund and the Adviser's profitability may have been affected by such increases or decreases. Based upon the foregoing, the Board concluded that the benefits from economies of scale are currently being shared equitably by the Adviser and the Fund. The Board also conclude d that, assuming reasonably foreseeable increases in the assets of the Fund, the Adviser and its affiliates and the Fund can be expected to continue to share such benefits equitably.
15
Eaton Vance Tax Free Reserves
MANAGEMENT AND ORGANIZATION
Fund Management. The Trustees of Eaton Vance Mutual Funds Trust (the Trust) are responsible for the overall management and supervision of the Trust's affairs. The Trustees and officers of the Trust are listed below. Except as indicated, each individual has held the office shown or other offices in the same company for the last five years. Trustees and officers of the Trust hold indefinite terms of office. The "noninterested Trustees" consist of those Trustees who are not "interested persons" of the Trust, as that term is defined under the 1940 Act. The business address of each Trustee and officer is The Eaton Vance Building, 255 State Street, Boston, Massachusetts 02109. As used below, "EVC" refers to Eaton Vance Corporation, "EV" refers to Eaton Vance, Inc., "EVM" refers to Eaton Vance Management, "BMR" refers to Boston Management and Research, "EVD" refers to Eaton Vance Distributors, Inc. and "Parametric" refers to Parametric Portfolio Associates. EVC and EV are the corporate parent and trustee, respectively, of EVM and BMR. EVD is the Fund's principal underwriter and a wholly-owned subsidiary of EVM. Each officer affiliated with Eaton Vance may hold a position with other Eaton Vance affiliates that is comparable to his or her position with EVM listed below.
Name and
Date of Birth | | Position(s)
with the
Trust | | Term of
Office and
Length of
Service | | Principal Occupation(s)
During Past Five Years | | Number of Portfolios
in Fund Complex
Overseen By
Trustee(1) | | Other Directorships Held | |
| Interested Trustee | | | | | | | | | | | | | |
|
| James B. Hawkes 11/9/41 | | Trustee | | Since 1991 | | Chairman and Chief Executive Officer of EVC, BMR, EVM and EV; Director of EV; Vice President and Director of EVD. Trustee and/or officer of 170 registered investment companies in the Eaton Vance Fund Complex. Mr. Hawkes is an interested person because of his positions with BMR, EVM, EVC and EV, which are affiliates of the Trust. | | | 170 | | | Director of EVC | |
|
| Noninterested Trustee(s) | | | | | | | | | | | | | |
|
| Benjamin C. Esty 1/2/63 | | Trustee | | Since 2005 | | Roy and Elizabeth Simmons Professor of Business Administration, Harvard University Graduate School of Business Administration (since 2003). Formerly, Associate Professor, Harvard University Graduate School of Business Administration (2000-2003). | | | 170 | | | None | |
|
| Samuel L. Hayes, III 2/23/35 | | Trustee and Chairman of the Board | | Trustee since 1986 and Chairman of the Board since 2005 | | Jacob H. Schiff Professor of Investment Banking Emeritus, Harvard University Graduate School of Business Administration. Director of Yakima Products, Inc. (manufacturer of automotive accessories) (since 2001) and Director of Telect, Inc. (telecommunications services company). | | | 170 | | | Director of Tiffany & Co. (specialty retailer) | |
|
| William H. Park 9/19/47 | | Trustee | | Since 2003 | | Vice Chairman, Commercial Industrial Finance Corp. (specialty finance company) (since 2006). Formerly, President and Chief Executive Officer, Prizm Capital Management, LLC (investment management firm) (2002-2005). Formerly, Executive Vice President and Chief Financial Officer, United Asset Management Corporation (a holding company owning institutional investment management firms) (1982-2001). | | | 170 | | | None | |
|
| Ronald A. Pearlman 7/10/40 | | Trustee | | Since 2003 | | Professor of Law, Georgetown University Law Center. | | | 170 | | | None | |
|
| Norton H. Reamer 9/21/35 | | Trustee | | Since 1986 | | President, Chief Executive Officer and a Director of Asset Management Finance Corp. (a specialty finance company serving the investment management industry) (since October 2003). President, Unicorn Corporation (an investment and financial advisory services company) (since September 2000). Formerly, Chairman and Chief Operating Officer, Hellman, Jordan Management Co., Inc. (an investment management company) (2000-2003). Formerly, Advisory Director of Berkshire Capital Corporation (investment banking firm) (2002-2003). | | | 170 | | | None | |
|
16
Eaton Vance Tax Free Reserves
MANAGEMENT AND ORGANIZATION CONT'D
Name and
Date of Birth | | Position(s)
with the
Trust | | Term of
Office and
Length of
Service | | Principal Occupation(s)
During Past Five Years | | Number of Portfolios
in Fund Complex
Overseen By
Trustee(1) | | Other Directorships Held | |
| Noninterested Trustee(s) (continued) | | | | | | | | | | | |
|
| Lynn A. Stout 9/14/57 | | Trustee | | Since 1998 | | Professor of Law, University of California at Los Angeles School of Law. | | | 170 | | | None | |
|
| Ralph F. Verni 1/26/43 | | Trustee | | Since 2005 | | Consultant and private investor. | | | 170 | | | None | |
|
| Principal Officers who are not Trustees | | | | | | | |
|
Name and
Date of Birth | | Position(s)
with the
Trust | | Term of
Office and
Length of
Service | | Principal Occupation(s)
During Past Five Years | |
| Thomas E. Faust Jr. 5/31/58 | | President | | Since 2002 | | President of EVC, EVM, BMR and EV and Director of EVC. Chief Investment Officer of EVC, EVM and BMR. Officer of 71 registered investment companies and 5 private investment companies managed by EVM or BMR. | |
|
| William H. Ahern, Jr. 7/28/59 | | Vice President | | Since 1995 | | Vice President of EVM and BMR. Officer of 71 registered investment companies managed by EVM or BMR. | |
|
| Cynthia J. Clemson 3/2/63 | | Vice President | | Since 2005 | | Vice President of EVM and BMR. Officer of 86 registered investment companies managed by EVM or BMR. | |
|
| Aamer Khan 6/7/60 | | Vice President | | Since 2005 | | Vice President of EVM and BMR. Officer of 29 registered investment companies managed by EVM or BMR. | |
|
| Thomas H. Luster 4/8/62 | | Vice President | | Since 2006 | | Vice President of EVM and BMR. Officer of 45 registered investment companies managed by EVM or BMR. | |
|
| Michael R. Mach 7/15/47 | | Vice President | | Since 1999 | | Vice President of EVM and BMR. Officer of 51 registered investment companies managed by EVM or BMR. | |
|
| Robert B. MacIntosh 1/22/57 | | Vice President | | Since 1998 | | Vice President of EVM and BMR. Officer of 86 registered investment companies managed by EVM or BMR. | |
|
| Cliff Quisenberry, Jr. 1/1/65 | | Vice President | | Since 2006 | | Vice President and Director of Research and Product Development of Parametric. Officer of 30 registered investment companies managed by EVM or BMR. | |
|
| Duncan W. Richardson 10/26/57 | | Vice President | | Since 2001 | | Executive Vice President and Chief Equity Investment Officer of EVC, EVM and BMR. Officer of 71 registered investment companies managed by EVM or BMR. | |
|
| Walter A. Row, III 7/20/57 | | Vice President | | Since 2001 | | Director of Equity Research and a Vice President of EVM and BMR. Officer of 33 registered investment companies managed by EVM or BMR. | |
|
| Judith A. Saryan 8/21/54 | | Vice President | | Since 2003 | | Vice President of EVM and BMR. Officer of 50 registered investment companies managed by EVM or BMR. | |
|
| Susan Schiff 3/13/61 | | Vice President | | Since 2002 | | Vice President of EVM and BMR. Officer of 30 registered investment companies managed by EVM or BMR. | |
|
| Barbara E. Campbell 6/19/57 | | Treasurer | | Since 2005(2) | | Vice President of EVM and BMR. Officer of 170 registered investment companies managed by EVM or BMR. | |
|
| Alan R. Dynner 10/10/40 | | Secretary | | Since 1997 | | Vice President, Secretary and Chief Legal Officer of BMR, EVM, EVD, EV and EVC. Officer of 170 registered investment companies managed by EVM or BMR. | |
|
17
Eaton Vance Tax Free Reserves
MANAGEMENT AND ORGANIZATION CONT'D
| Principal Officers who are not Trustees (continued) | | | | | | | |
|
Name and
Date of Birth | | Position(s)
with the
Trust | | Term of
Office and
Length of
Service | | Principal Occupation(s)
During Past Five Years | |
| Paul M. O'Neil 7/11/53 | | Chief Compliance Officer | | Since 2004 | | Vice President of EVM and BMR. Officer of 170 registered investment companies managed by EVM or BMR. | |
|
(1) Includes both master and feeder funds in a master-feeder structure.
(2) Prior to 2005, Ms. Campbell served as Assistant Treasurer of the Trust since 1995.
The SAI for the Fund includes additional information about the Trustees and officers of the Fund and can be obtained without charge on Eaton Vance's website at www.eatonvance.com or by calling 1-800-225-6265.
18
This Page Intentionally Left Blank
This Page Intentionally Left Blank
Investment Adviser
Eaton Vance Management
The Eaton Vance Building
255 State Street
Boston, MA 02109
Principal Underwriter
Eaton Vance Distributors, Inc.
The Eaton Vance Building
255 State Street
Boston, MA 02109
(617) 482-8260
Custodian
Investors Bank & Trust Company
200 Clarendon Street
Boston, MA 02116
Transfer Agent
PFPC Inc.
Attn: Eaton Vance Funds
P.O. Box 9653
Providence, RI 02940-9653
(800) 262-1122
Independent Registered Public Accounting Firm
PricewaterhouseCoopers LLP
125 High Street
Boston, MA 02110
Eaton Vance Tax Free Reserves
The Eaton Vance Building
255 State Street
Boston, MA 02109
This report must be preceded or accompanied by a current prospectus. Before investing, investors should consider carefully the Fund's investment objective(s), risks, and charges and expenses. The Fund's current prospectus contains this and other information about the Fund and is available through your financial advisor. Please read the prospectus carefully before you invest or send money. For further information please call 1-800-225-6265.
277-2/07 TRSRC

Annual Report December 31, 2006


EATON VANCE
TAX-MANAGED
GROWTH
FUND
1.1
IMPORTANT NOTICES REGARDING PRIVACY,
DELIVERY OF SHAREHOLDER DOCUMENTS,
PORTFOLIO HOLDINGS, AND PROXY VOTING
Privacy. The Eaton Vance organization is committed to ensuring your financial privacy. Each of the financial institutions identified below has in effect the following policy ("Privacy Policy") with respect to nonpublic personal information about its customers:
• Only such information received from you, through application forms or otherwise, and information about your Eaton Vance fund transactions will be collected. This may include information such as name, address, social security number, tax status, account balances and transactions.
• None of such information about you (or former customers) will be disclosed to anyone, except as permitted by law (which includes disclosure to employees necessary to service your account). In the normal course of servicing a customer's account, Eaton Vance may share information with unaffiliated third parties that perform various required services such as transfer agents, custodians and broker/dealers.
• Policies and procedures (including physical, electronic and procedural safeguards) are in place that are designed to protect the confidentiality of such information.
• We reserve the right to change our Privacy Policy at any time upon proper notification to you. Customers may want to review our Policy periodically for changes by accessing the link on our homepage: www.eatonvance.com.
Our pledge of privacy applies to the following entities within the Eaton Vance organization: the Eaton Vance Family of Funds, Eaton Vance Management, Eaton Vance Investment Counsel, Boston Management and Research, and Eaton Vance Distributors, Inc.
In addition, our Privacy Policy only applies to those Eaton Vance customers who are individuals and who have a direct relationship with us. If a customer's account (i.e., fund shares) is held in the name of a third-party financial adviser/broker-dealer, it is likely that only such adviser's privacy policies apply to the customer. This notice supersedes all previously issued privacy disclosures.
For more information about Eaton Vance's Privacy Policy, please call 1-800-262-1122.
Delivery of Shareholder Documents. The Securities and Exchange Commission (the "SEC") permits funds to deliver only one copy of shareholder documents, including prospectuses, proxy statements and shareholder reports, to fund investors with multiple accounts at the same residential or post office box address. This practice is often called "householding" and it helps eliminate duplicate mailings to shareholders.
Eaton Vance, or your financial adviser, may household the mailing of your documents indefinitely unless you instruct Eaton Vance, or your financial adviser, otherwise.
If you would prefer that your Eaton Vance documents not be householded, please contact Eaton Vance at 1-800-262-1122, or contact your financial adviser.
Your instructions that householding not apply to delivery of your Eaton Vance documents will be effective within 30 days of receipt by Eaton Vance or your financial adviser.
Portfolio Holdings. Each Eaton Vance Fund and its underlying Portfolio (if applicable) will file a schedule of its portfolio holdings on Form N-Q with the SEC for the first and third quarters of each fiscal year. The Form N-Q will be available on the Eaton Vance website www.eatonvance.com, by calling Eaton Vance at 1-800-262-1122 or in the EDGAR database on the SEC's website at www.sec.gov. Form N-Q may also be reviewed and copied at the SEC's public reference room in Washington, D.C. (call 1-800-732-0330 for information on the operation of the public reference room).
Proxy Voting. From time to time, funds are required to vote proxies related to the securities held by the funds. The Eaton Vance Funds or their underlying Portfolios (if applicable) vote proxies according to a set of policies and procedures approved by the Funds' and Portfolios' Boards. You may obtain a description of these policies and procedures and information on how the Funds or Portfolios voted proxies relating to portfolio securities during the most recent 12 month period ended June 30, without charge, upon request, by calling 1-800-262-1122. This description is also available on the SEC's website at www.sec.gov.
Eaton Vance Tax-Managed Growth Fund 1.1 as of December 31, 2006
Management’s discussion of fund performance

Lewis R. Piantedosi
Co-Portfolio Manager

Duncan W. Richardson, CFA
Co-Portfolio Manager
The Fund
Performance for the Past Year
· For the year ended December 31, 2006, Eaton Vance Tax-Managed Growth Fund 1.1 (the Fund) Class A shares had a total return of 13.28%. This return was the result of an increase in net asset value (NAV) per share to $26.13 on December 31, 2006, from $23.31 on December 31, 2005, and the reinvestment of $0.277 per share in dividend income.(1)
· The Fund’s Class B shares had a total return of 12.43% during the same period, the result of an increase in NAV per share to $24.92 on December 31, 2006, from $22.17 on December 31, 2005, and the reinvestment of $0.005 per share in dividend income.(1)
· The Fund’s Class C shares had a total return of 12.41% during the same period, the result of an increase in NAV per share to $23.78 on December 31, 2006, from $21.24 on December 31, 2005, and the reinvestment of $0.096 per share in dividend income.(1)
· The Fund’s Class I shares had a total return of 13.51% during the same period, the result of an increase in NAV per share to $24.63 on December 31, 2006, from $21.99 on December 31, 2005, and the reinvestment of $0.332 per share in dividend income.(1)
· The Fund’s Class S shares had a total return of 13.37% during the same period, the result of an increase in NAV per share to $26.33 on December 31, 2006, from $23.47 on December 31, 2005, and the reinvestment of $0.280 per share in dividend income.(1)
· For comparison, the S&P 500 Index – a broad based, unmanaged market index commonly used as a measure of overall U.S. stock market performance – had a total return of 15.78% for the same period. The Lipper Large-Cap Core Classification had a total return of 13.53% for the same period.(2)
See pages 3 and 4 for more performance information, including after-tax returns.
Management Discussion
· The year ended December 31, 2006 marked another impressive year for equities as broad U.S. markets locked in a fourth consecutive annual gain. Helping fuel the rally were easing inflation and housing concerns, as well as declining oil prices and a continued pause in interest rate increases. Record levels of mergers and private equity activity further supported higher stock prices during the year, as did better than expected earnings and profit results. Price gains for the year were broad-based, but of particular note were the double digit gains realized by the blue chip Dow Industrial Average and the S&P 500 Index.
· For the year ended December 31, 2006, each of the 10 major sectors included in the S&P 500 Index registered positive returns. Telecommunications, energy and utilities were top performing S&P 500 Index sectors during the year, while the health care and information technology sectors had the weakest performance. Market leading industries of 2006 included diversified telecommunications, real estate investment trusts and investment bank and brokerage. In contrast, internet and catalog retailers, biotechnology and educational service industries realized weaker returns for the year. During the course of the year, on average, small-cap stocks outperformed large-cap stocks and the value investment style continued to lead growth.
(1) These returns do not include the 5.75% maximum sales charge for Class A shares or the applicable contingent deferred sales charge (CDSC) for Class B and Class C shares. If sales charges were deducted, the returns would be lower. Class I and Class S shares are offered to certain investors at net asset value.
(2) It is not possible to invest directly in an Index or a Lipper Classification. The Index’s total return does not reflect commissions or expenses that would have been incurred if an investor individually purchased or sold the securities represented in the Index. The Lipper Classification return shown is the average total return, at net asset value, of the funds that are in the same Lipper Classification as the Fund.
Fund shares are not insured by the FDIC and are not deposits or other obligations of, or guaranteed by, any depository institution. Shares are subject to investment risks, including possible loss of principal invested.
Past performance is no guarantee of future results. Returns are historical and are calculated by determining the percentage change in net asset value or offering price (as applicable) with all distributions reinvested. Investment return and principal value will fluctuate so that shares, when redeemed, may be worth more or less than their original cost. Performance is for the stated time period only; due to market volatility, the Fund’s current performance may be lower or higher than the quoted return. For performance as of the most recent month-end, please refer to www.eatonvance.com.
1
· The Fund invests its assets in Tax-Managed Growth Portfolio (the Portfolio), a separate registered investment company with the same objective and investment policies as the Fund. The Portfolio in turn invests primarily in common stocks of established growth companies. The Fund underperformed its benchmark due in part to differences in sector allocation and stock selection in the Portfolio versus the S&P 500 Index.
· During the year ended December 31, 2006, the Portfolio remained overweight in the industrials, consumer staples and consumer discretionary sectors, while continuing to underweight the technology, telecommunications and utilities sectors. The Portfolio benefited from its emphasis of the strong performing energy and consumer discretionary sectors and relatively stronger investment selection within commercial banks and metals and mining versus the S&P 500 Index. The Portfolio’s underweight of the technology sector was also helpful, particularly within the semiconductor and internet software industries, as stocks in those sectors experienced significant declines over the course of the year.
· During the year ended December 31, 2006, the Portfolio’s de-emphasis of high dividend yielding stocks, such as those in the utilities and telecommunications sectors, hurt performance, as did the weak performance of certain Portfolio holdings in the health care and consumer staples sectors. Despite positive performance from holdings in the air freight and machinery stocks industries, the Portfolio’s overweight of the lagging industrials sector negatively impacted returns.
Ten Largest Holdings*
By net assets
Exxon Mobil Corp. | | 2.64 | % |
General Electric Co. | | 2.37 | % |
Procter & Gamble Co. | | 2.34 | % |
American International Group | | 2.22 | % |
Conoco Phillips | | 2.17 | % |
Pepsico Inc. | | 1.90 | % |
BPPLC Spons ADR | | 1.68 | % |
Deere & Co. | | 1.55 | % |
Amgen Inc. | | 1.47 | % |
Danaher Corp. | | 1.44 | % |
Common Stock Investments by Sector**
By net assets
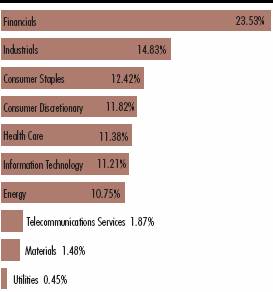
* Ten Largest Holdings represented 19.78% of Portfolio net assets as of December 31, 2006. Holdings are subject to change due to active management.
** As a percentage of the Portfolio’s net assets as of December 31, 2006. Portfolio information may not be representative of current or future investments and may change due to active management.
The views expressed throughout this report are those of the portfolio managers and are current only through the end of the period of the report as stated on the cover. These views are subject to change at any time based upon market or other conditions, and the investment adviser disclaims any responsibility to update such views. These views may not be relied on as investment advice and, because investment decisions for a fund are based on many factors, may not be relied on as an indication of trading intent on behalf of any Eaton Vance fund.
2
Eaton Vance Tax-Managed Growth Fund 1.1 as of December 31, 2006
FUND PERFORMANCE
The line graphs and table set forth below provide information about the Fund’s performance. The line graphs compare the performance of Class A and Class B of the Fund with that of the S&P 500 Index, a broad-based, unmanaged market index commonly used as a measure of U.S. stock market performance. The lines on the graphs represent the total returns of a hypothetical investment of $10,000 in each of Class A, Class B, and the S&P 500 Index. Class A total returns are presented at net asset value and maximum public offering price. The table includes the total returns of each Class of the Fund at net asset value and public offering price. The performance presented below does not reflect the deduction of taxes, if any, that a shareholder would pay on distributions or redemptions of Fund shares.
Performance* | | Class A | | Class B | | Class C | | Class I | | Class S | |
Average Annual Total Returns (at net asset value) | | | | | | | | | | | |
One Year | | 13.28 | % | 12.43 | % | 12.41 | % | 13.51 | % | 13.37 | % |
Five Years | | 5.02 | % | 4.24 | % | 4.24 | % | 5.28 | % | 5.16 | % |
Ten Years | | 8.68 | % | 7.85 | % | 7.79 | % | N.A. | | N.A. | |
Life of Fund† | | 9.69 | % | 8.87 | % | 8.75 | % | 3.48 | % | 3.44 | % |
SEC Average Annual Total Returns (including sales charge at applicable CDSC) | | | | | | | | | | | |
One Year | | 6.78 | % | 7.43 | % | 11.41 | % | 13.51 | % | 13.37 | % |
Five Years | | 3.78 | % | 3.89 | % | 4.24 | % | 5.28 | % | 5.16 | % |
Ten Years | | 8.04 | % | 7.85 | % | 7.79 | % | N.A. | | N.A. | |
Life of Fund† | | 9.08 | % | 8.87 | % | 8.75 | % | 3.48 | % | 3.44 | % |
† Inception Dates – Class A and Class B: 3/28/96; Class C: 8/2/96; Class I: 7/2/99; Class S: 5/14/99
* Average annual total returns do not include the 5.75% maximum sales charge for Class A shares or the applicable contingent deferred sales charge (CDSC) for Class B and Class C shares. If sales charges were deducted, returns would be lower. SEC average annual total returns for Class A reflect the maximum 5.75% sales charge. SEC returns for Class B reflect the applicable CDSC based on the following schedule: 5% - 1st and 2nd years; 4% - 3rd year; 3% - 4th year; 2% - 5th year; 1% - 6th year. SEC 1-year return for Class C reflects a 1% CDSC. Class I and Class S shares are offered to certain investors at net asset value.
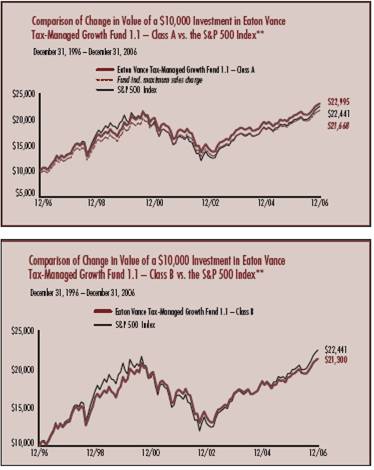
** Source: Thomson Financial. Class A and Class B of the Fund commenced investment operations on 3/28/96. A $10,000 hypothetical investment at net asset value in Class C shares on 12/31/96, Class I shares on 7/2/99, and Class S shares on 5/14/99 would have been valued at $21,175, $12,921, and $12,952 respectively, on December 31, 2006. It is not possible to invest directly in an Index. The Index’s total returns do not reflect commissions or expenses that would have been incurred if an investor individually purchased or sold the securities represented in the Index.
Past performance is no guarantee of future results. Returns are historical and are calculated by determining the percentage change in net asset value or offering price (as applicable) with all distributions reinvested. Investment return and principal value will fluctuate so that shares, when redeemed, may be worth more or less than their original cost. Performance is for the stated time period only; due to market volatility, the Fund’s current performance may be lower or higher than the quoted return. For performance as of the most recent month-end, please refer to www.eatonvance.com.
3
“Return Before Taxes” does not take into consideration shareholder taxes. It is most relevant to tax-free or tax-deferred shareholder accounts. “Return After Taxes on Distributions” reflects the impact of federal income taxes due on Fund distributions of dividends and capital gains. It is most relevant to taxpaying shareholders who continue to hold their shares. “Return After Taxes on Distributions and Sale of Fund Shares” also reflects the impact of taxes on capital gain or loss realized upon a sale of shares. It is most relevant to taxpaying shareholders who sell their shares.
Average Annual Total Returns
(For the periods ended December 31, 2006)
Returns at Net Asset Value (NAV) (Class A)
| | One Year | | Five Years | | Life of Fund | |
Return Before Taxes | | 13.28 | % | 5.02 | % | 9.69 | % |
Return After Taxes on Distributions | | 13.10 | % | 4.92 | % | 9.63 | % |
Return After Taxes on Distributions and Sale of Fund Shares | | 8.87 | % | 4.32 | % | 8.66 | % |
Returns at Public Offering Price (POP) (Class A)
| | One Year | | Five Years | | Life of Fund | |
Return Before Taxes | | 6.78 | % | 3.78 | % | 9.08 | % |
Return After Taxes on Distributions | | 6.61 | % | 3.68 | % | 9.02 | % |
Return After Taxes on Distributions and Sale of Fund Shares | | 4.63 | % | 3.24 | % | 8.11 | % |
Average Annual Total Returns
(For the periods ended December 31, 2006)
Returns at Net Asset Value (NAV) (Class C)
| | One Year | | Five Years | | Life of fund | |
Return Before Taxes | | 12.41 | % | 4.24 | % | 8.75 | % |
Return After Taxes on Distributions | | 12.34 | % | 4.22 | % | 8.74 | % |
Return After Taxes on Distributions and Sale of Fund Shares | | 8.15 | % | 3.64 | % | 7.80 | % |
Returns at Public Offering Price (POP) (Class C)
| | One Year | | Five Years | | Life of Fund | |
Return Before Taxes | | 11.41 | % | 4.24 | % | 8.75 | % |
Return After Taxes on Distributions | | 11.34 | % | 4.22 | % | 8.74 | % |
Return After Taxes on Distributions and Sale of Fund Shares | | 7.50 | % | 3.64 | % | 7.80 | % |
Class A and Class B of the Fund commenced investment operations on 3/28/96, Class C commenced operations on 8/2/96, Class I commenced operations on 7/2/99, and Class S commenced operations on 5/14/99. Returns at Public Offering Price (POP) reflect the deduction of the maximum initial sales charge or applicable CDSC, while Returns at Net Asset Value (NAV) do not.
After-tax returns are calculated using the highest historical individual federal income tax rate and do not reflect the impact of state and local taxes. Actual after-tax returns depend on a shareholder’s tax situation and may differ from those shown. After-tax returns are not relevant for shareholders who hold shares in tax-deferred accounts or to shares held by non-taxable entities. Return After Taxes on Distributions for a period may be the same as Return Before Taxes for that period because no distributions were paid during that period or because the taxable portion of distributions made during the period was insignificant. Also, Return After Taxes on Distributions and Sale of Fund Shares for a period may be greater than Return After Taxes on Distributions for the same period because of realized losses on the sale of Fund shares.
Average Annual Total Returns
(For the periods ended December 31, 2006)
Returns at Net Asset Value (NAV) (Class B)
| | One Year | | Five Years | | Life of Fund | |
Return Before Taxes | | 12.43 | % | 4.24 | % | 8.87 | % |
Return After Taxes on Distributions | | 12.42 | % | 4.23 | % | 8.86 | % |
Return After Taxes on Distributions and Sale of Fund Shares | | 8.08 | % | 3.64 | % | 7.92 | % |
Returns at Public Offering Price (POP) (Class B)
| | One Year | | Five Years | | Life of Fund | |
Return Before Taxes | | 7.43 | % | 3.89 | % | 8.87 | % |
Return After Taxes on Distributions | | 7.42 | % | 3.89 | % | 8.86 | % |
Return After Taxes on Distributions and Sale of Fund Shares | | 4.83 | % | 3.35 | % | 7.92 | % |
Average Annual Total Returns
(For the periods ended December 31, 2006)
Returns at Net Asset Value (NAV) (Class I)
| | One Year | | Five Years | | Life of Fund | |
Return Before Taxes | | 13.51 | % | 5.28 | % | 3.48 | % |
Return After Taxes on Distributions | | 13.28 | % | 5.12 | % | 3.37 | % |
Return After Taxes on Distributions and Sale of Fund Shares | | 9.08 | % | 4.54 | % | 2.99 | % |
Average Annual Total Returns
(For the periods ended December 31, 2006)
Returns at Net Asset Value (NAV) (Class S)
| | One Year | | Five Years | | Life of Fund | |
Return Before Taxes | | 13.37 | % | 5.16 | % | 3.71 | % |
Return After Taxes on Distributions | | 12.96 | % | 5.01 | % | 3.61 | % |
Return After Taxes on Distributions and Sale of Fund Shares | | 8.69 | % | 4.39 | % | 3.17 | % |
Past performance is no guarantee of future results. Returns are historical and are calculated by determining the percentage change in net asset value or offering price (as applicable) with all distributions reinvested. Investment return and principal value will fluctuate so that shares, when redeemed, may be worth more or less than their original cost. Performance is for the stated time period only; due to market volatility, the Fund’s current performance may be lower or higher than the quoted return. For performance as of the most recent month-end, please refer to www.eatonvance.com.
4
Eaton Vance Tax-Managed Growth Fund 1.1 as of December 31, 2006
FUND EXPENSES
Example: As a shareholder of the Fund, you incur two types of costs: (1) transaction costs, including sales charges (loads) on purchases and redemption fees (if applicable); and (2) ongoing costs, including management fees; distribution or service fees; and other Fund expenses. This Example is intended to help you understand your ongoing costs (in dollars) of investing in the Fund and to compare these costs with the ongoing costs of investing in other mutual funds. The Example is based on an investment of $1,000 invested at the beginning of the period and held for the entire period (July 1, 2006 – December 31, 2006).
Actual Expenses: The first section of the table below provides information about actual account values and actual expenses. You may use the information in this section, together with the amount you invested, to estimate the expenses that you paid over the period. Simply divide your account value by $1,000 (for example, an $8,600 account value divided by $1,000 = 8.6), then multiply the result by the number in the first section under the heading entitled "Expenses Paid During Period" to estimate the expenses you paid on your account during this period.
Hypothetical Example for Comparison Purposes: The second section of the table below provides information about hypothetical account values and hypothetical expenses based on the actual Fund expense ratio and an assumed rate of return of 5% per year (before expenses), which is not the actual return of the Fund. The hypothetical account values and expenses may not be used to estimate the actual ending account balance or expenses you paid for the period. You may use this information to compare the ongoing costs of investing in your Fund and other funds. To do so, compare this 5% hypothetical example with the 5% hypothetical examples that appear in the shareholder reports of the other funds.
Please note that the expenses shown in the table are meant to highlight your ongoing costs only and do not reflect any transactional costs, such as sales charges (loads) or redemption fees (if applicable). Therefore, the second section of the table is useful in comparing ongoing costs only, and will not help you determine the relative total costs of owning different funds. In addition, if these transactional costs were included, your costs would have been higher.
Eaton Vance Tax-Managed Growth Fund 1.1
| | | Beginning Account Value
(7/1/06) | | Ending Account Value
(12/31/06) | | Expenses Paid During Period*
(7/1/06 – 12/31/06) | |
| Actual | |
| Class A | | $ | 1,000.00 | | | $ | 1,102.10 | | | $ | 4.34 | | |
| Class B | | $ | 1,000.00 | | | $ | 1,098.00 | | | $ | 8.30 | | |
| Class C | | $ | 1,000.00 | | | $ | 1,098.20 | | | $ | 8.30 | | |
| Class I | | $ | 1,000.00 | | | $ | 1,103.50 | | | $ | 2.97 | | |
| Class S | | $ | 1,000.00 | | | $ | 1,102.30 | | | $ | 3.87 | | |
| Hypothetical | |
| (5% return per year before expenses) | |
| Class A | | $ | 1,000.00 | | | $ | 1,021.10 | | | $ | 4.18 | | |
| Class B | | $ | 1,000.00 | | | $ | 1,017.30 | | | $ | 7.98 | | |
| Class C | | $ | 1,000.00 | | | $ | 1,017.30 | | | $ | 7.98 | | |
| Class I | | $ | 1,000.00 | | | $ | 1,022.40 | | | $ | 2.85 | | |
| Class S | | $ | 1,000.00 | | | $ | 1,021.50 | | | $ | 3.72 | | |
* Expenses are equal to the Fund's annualized expense ratio of 0.82% for Class A shares, 1.57% for Class B shares, 1.57% for Class C shares, 0.56% for Class I shares, and 0.73% for Class S shares multiplied by the average account value over the period, multiplied by 184/365 (to reflect the one-half year period). The Example assumes that the $1,000 was invested at the net asset value per share determined at the close of business on June 30, 2006. The Example reflects the expenses of both the Fund and the Portfolio.
5
Eaton Vance Tax-Managed Growth Fund 1.1 as of December 31, 2006
FINANCIAL STATEMENTS
Statement of Assets and Liabilities
As of December 31, 2006
| Assets | |
Investment in Tax-Managed Growth Portfolio, at value
(identified cost, $1,571,349,685) | | $ | 2,950,659,937 | | |
| Receivable for Fund shares sold | | | 3,348,348 | | |
| Total assets | | $ | 2,954,008,285 | | |
| Liabilities | |
| Payable for Fund shares redeemed | | $ | 4,484,941 | | |
| Payable to affiliate for distribution and service fees | | | 2,503,975 | | |
| Payable to affiliate for Trustees' fees | | | 1,168 | | |
| Other accrued expenses | | | 735,355 | | |
| Total liabilities | | $ | 7,725,439 | | |
| Net Assets | | $ | 2,946,282,846 | | |
| Sources of Net Assets | |
| Paid-in capital | | $ | 2,282,220,205 | | |
Accumulated net realized loss from Portfolio (computed on
the basis of identified cost) | | | (715,263,731 | ) | |
| Accumulated undistributed net investment income | | | 16,120 | | |
Net unrealized appreciation from Portfolio (computed on the basis of
identified cost) | | | 1,379,310,252 | | |
| Total | | $ | 2,946,282,846 | | |
| Class A Shares | |
| Net Assets | | $ | 1,491,828,461 | | |
| Shares Outstanding | | | 57,099,065 | | |
Net Asset Value and Redemption Price Per Share
(net assets ÷ shares of beneficial interest outstanding) | | $ | 26.13 | | |
Maximum Offering Price Per Share
(100 ÷ 94.25 of $26.13) | | $ | 27.72 | | |
| Class B Shares | |
| Net Assets | | $ | 805,778,283 | | |
| Shares Outstanding | | | 32,334,113 | | |
Net Asset Value, Offering Price and Redemption Price Per Share
(net assets ÷ shares of beneficial interest outstanding) | | $ | 24.92 | | |
| Class C Shares | |
| Net Assets | | $ | 597,398,532 | | |
| Shares Outstanding | | | 25,126,418 | | |
Net Asset Value, Offering Price and Redemption Price Per Share
(net assets ÷ shares of beneficial interest outstanding) | | $ | 23.78 | | |
| Class I Shares | |
| Net Assets | | $ | 18,150,192 | | |
| Shares Outstanding | | | 736,823 | | |
Net Asset Value, Offering Price and Redemption Price Per Share
(net assets ÷ shares of beneficial interest outstanding) | | $ | 24.63 | | |
| Class S Shares | |
| Net Assets | | $ | 33,127,378 | | |
| Shares Outstanding | | | 1,257,932 | | |
Net Asset Value, Offering Price and Redemption Price Per Share
(net assets ÷ shares of beneficial interest outstanding) | | $ | 26.33 | | |
| On sales of $50,000 or more, the offering price of Class A shares is reduced. | |
Statement of Operations
For the Year Ended
December 31, 2006
| Investment Income | |
| Dividends allocated from Portfolio (net of foreign taxes, $744,954) | | $ | 54,458,124 | | |
| Interest allocated from Portfolio | | | 413,296 | | |
| Security lending income allocated from Portfolio, net | | | 69,586 | | |
| Expenses allocated from Portfolio | | | (13,326,369 | ) | |
| Net investment income from Portfolio | | $ | 41,614,637 | | |
| Expenses | |
| Trustees' fees and expenses | | $ | 2,594 | | |
Distribution and service fees
Class A | | | 3,192,567 | | |
| Class B | | | 10,716,839 | | |
| Class C | | | 6,022,281 | | |
| Class S | | | 64,189 | | |
| Transfer and dividend disbursing agent fees | | | 2,314,854 | | |
| Printing and postage | | | 315,232 | | |
| Legal and accounting services | | | 167,009 | | |
| Registration fees | | | 80,390 | | |
| Custodian fee | | | 35,656 | | |
| Miscellaneous | | | 166,750 | | |
| Total expenses | | $ | 23,078,361 | | |
| Net investment income | | $ | 18,536,276 | | |
Realized and Unrealized
Gain (Loss) from Portfolio | |
| Net realized gain (loss) — | |
| Investment transactions (identified cost basis) | | $ | 103,722,978 | | |
| Foreign currency transactions | | | (3,629 | ) | |
| Net realized gain | | $ | 103,719,349 | | |
| Change in unrealized appreciation (depreciation) — | |
| Investments (identified cost basis) | | $ | 234,578,541 | | |
| Foreign currency | | | 16,456 | | |
| Net change in unrealized appreciation (depreciation) | | $ | 234,594,997 | | |
| Net realized and unrealized gain | | $ | 338,314,346 | | |
| Net increase in net assets from operations | | $ | 356,850,622 | | |
See notes to financial statements
6
Eaton Vance Tax-Managed Growth Fund 1.1 as of December 31, 2006
FINANCIAL STATEMENTS CONT'D
Statements of Changes in Net Assets
Increase (Decrease)
in Net Assets | | Year Ended
December 31, 2006 | | Year Ended
December 31, 2005* | |
From operations —
Net investment income | | $ | 18,536,276 | | | $ | 11,989,863 | | |
Net realized gain from investment
transactions, securities sold short
and foreign currency transactions | | | 103,719,349 | | | | 5,767,762 | | |
Net change in unrealized appreciation
(depreciation) of investments,
securities sold short and
foreign currency | | | 234,594,997 | | | | 92,989,912 | | |
| Net increase in net assets from operations | | $ | 356,850,622 | | | $ | 110,747,537 | | |
Distributions to shareholders —
From net investment income
Class A | | $ | (15,659,924 | ) | | $ | (9,808,986 | ) | |
| Class B | | | (165,052 | ) | | | (364,224 | ) | |
| Class C | | | (2,392,217 | ) | | | (1,187,211 | ) | |
| Class I | | | (98,814 | ) | | | (7,699 | ) | |
| Class S | | | (352,101 | ) | | | (304,421 | ) | |
| From tax return of capital | |
| Class A | | | (16,911 | ) | | | — | | |
| Class B | | | (178 | ) | | | — | | |
| Class C | | | (2,584 | ) | | | — | | |
| Class I | | | (94 | ) | | | — | | |
| Class S | | | (384 | ) | | | — | | |
| Total distributions to shareholders | | $ | (18,688,259 | ) | | $ | (11,672,541 | ) | |
Transactions in shares of beneficial interest —
Proceeds from sale of shares
Class A | | $ | 13,542,210 | | | $ | 14,148,781 | | |
| Class B | | | 5,549,199 | | | | 10,791,658 | | |
| Class C | | | 7,652,697 | | | | 10,646,632 | | |
| Class I | | | 35,440,866 | | | | 43,057 | | |
Net asset value of shares issued to
shareholders in payment of
distributions declared
Class A | | | 12,497,715 | | | | 8,026,244 | | |
| Class B | | | 133,002 | | | | 289,604 | | |
| Class C | | | 1,743,629 | | | | 865,142 | | |
| Class I | | | 4,691 | | | | 3,332 | | |
| Class S | | | 22,542 | | | | 31,060 | | |
Cost of shares redeemed
Class A | | | (238,710,883 | ) | | | (226,726,612 | ) | |
| Class B | | | (268,213,651 | ) | | | (394,301,040 | ) | |
| Class C | | | (114,102,088 | ) | | | (141,044,527 | ) | |
| Class I | | | (17,953,607 | ) | | | (128,004 | ) | |
| Class S | | | (3,584,247 | ) | | | (2,321,325 | ) | |
Net asset value of shares exchanged
Class A | | | 457,286,708 | | | | 243,804,384 | | |
| Class B | | | (457,286,708 | ) | | | (243,804,384 | ) | |
Net decrease in net assets from
Fund share transactions | | $ | (565,977,925 | ) | | $ | (719,675,998 | ) | |
| Net decrease in net assets | | $ | (227,815,562 | ) | | $ | (620,601,002 | ) | |
| Net Assets | | Year Ended
December 31, 2006 | | Year Ended
December 31, 2005* | |
| At beginning of year | | $ | 3,174,098,408 | | | $ | 3,794,699,410 | | |
| At end of year | | $ | 2,946,282,846 | | | $ | 3,174,098,408 | | |
Accumulated undistributed
net investment income
included in net assets | |
| At end of year | | $ | 16,120 | | | $ | 278,508 | | |
* Amounts were reclassified for the year ended December 31, 2005 resulting in an increase in net realized gain (loss) and a decrease in net change in unrealized appreciation (depreciation) of $174,223,923. This amount was reclassified due to the correction of the allocation of realized gain (loss). These changes had no effect on the Fund's net asset value, net assets, net investment income, net increase in net assets from operations, financial highlights or total return.
See notes to financial statements
7
Eaton Vance Tax-Managed Growth Fund 1.1 as of December 31, 2006
FINANCIAL STATEMENTS CONT'D
Financial Highlights
| | | Class A | |
| | | Year Ended December 31, | |
| | | 2006 | | 2005 | | 2004 | | 2003 | | 2002 | |
| Net asset value — Beginning of year | | $ | 23.310 | | | $ | 22.550 | | | $ | 20.800 | | | $ | 16.920 | | | $ | 21.100 | | |
| Income (loss) from operations | |
| Net investment income(1) | | $ | 0.258 | | | $ | 0.197 | | | $ | 0.175 | | | $ | 0.120 | | | $ | 0.091 | | |
| Net realized and unrealized gain (loss) | | | 2.839 | | | | 0.772 | | | | 1.757 | | | | 3.836 | | | | (4.271 | ) | |
| Total income (loss) from operations | | $ | 3.097 | | | $ | 0.969 | | | $ | 1.932 | | | $ | 3.956 | | | $ | (4.180 | ) | |
| Less distributions | |
| From net investment income | | $ | (0.277 | ) | | $ | (0.209 | ) | | $ | (0.182 | ) | | $ | (0.076 | ) | | $ | — | | |
| From tax return of capital | | | 0.000 | (2) | | | — | | | | — | | | | — | | | | — | | |
| Total distributions | | $ | (0.277 | ) | | $ | (0.209 | ) | | $ | (0.182 | ) | | $ | (0.076 | ) | | $ | — | | |
| Net asset value — End of year | | $ | 26.130 | | | $ | 23.310 | | | $ | 22.550 | | | $ | 20.800 | | | $ | 16.920 | | |
| Total Return(3) | | | 13.28 | % | | | 4.29 | % | | | 9.30 | % | | | 23.39 | % | | | (19.81 | )% | |
| Ratios/Supplemental Data | |
| Net assets, end of year (000's omitted) | | $ | 1,491,828 | | | $ | 1,097,719 | | | $ | 1,024,002 | | | $ | 982,531 | | | $ | 958,625 | | |
| Ratios (As a percentage of average daily net assets): | |
| Expenses before custodian fee reduction(4) | | | 0.80 | % | | | 0.83 | %(6) | | | 0.80 | %(6) | | | 0.85 | % | | | 0.81 | % | |
| Expenses after custodian fee reduction(4) | | | 0.80 | % | | | 0.83 | %(6) | | | 0.80 | %(6) | | | 0.85 | % | | | 0.81 | % | |
| Net investment income | | | 1.05 | % | | | 0.87 | %(6) | | | 0.82 | %(6) | | | 0.66 | % | | | 0.48 | % | |
| Portfolio Turnover of the Portfolio(5) | | | 1 | % | | | 0 | %(7) | | | 3 | % | | | 15 | % | | | 23 | % | |
(1) Net investment income per share was computed using average shares outstanding.
(2) Less than $0.001 per share.
(3) Returns are historical and are calculated by determining the percentage change in net asset value with all distributions reinvested.
(4) Includes the Fund's share of the Portfolio's allocated expenses.
(5) Excludes the value of the portfolio securities contributed or distributed as a result of in-kind shareholder transactions. The total turnover rate of the Portfolio including in-kind contributions and distributions of securities was 7%, 6%, 10%, 21%, and 30% for 2006, 2005, 2004, 2003, and 2002, respectively.
(6) The investment adviser waived a portion of its investment advisory fee (equal to less than 0.01% and 0.01% of average daily net assets for 2005 and 2004, respectively).
(7) Amounts to less than 1%.
See notes to financial statements
8
Eaton Vance Tax-Managed Growth Fund 1.1 as of December 31, 2006
FINANCIAL STATEMENTS CONT'D
Financial Highlights
| | | Class B | |
| | | Year Ended December 31, | |
| | | 2006 | | 2005 | | 2004 | | 2003 | | 2002 | |
| Net asset value — Beginning of year | | $ | 22.170 | | | $ | 21.430 | | | $ | 19.760 | | | $ | 16.130 | | | $ | 20.270 | | |
| Income (loss) from operations | |
| Net investment income (loss)(1) | | $ | 0.065 | | | $ | 0.025 | | | $ | 0.012 | | | $ | (0.016 | ) | | $ | (0.048 | ) | |
| Net realized and unrealized gain (loss) | | | 2.690 | | | | 0.721 | | | | 1.667 | | | | 3.646 | | | | (4.092 | ) | |
| Total income (loss) from operations | | $ | 2.755 | | | $ | 0.746 | | | $ | 1.679 | | | $ | 3.630 | | | $ | (4.140 | ) | |
| Less distributions | |
| From net investment income | | $ | (0.005 | ) | | $ | (0.006 | ) | | $ | (0.009 | ) | | $ | — | | | $ | — | | |
| From tax return of capital | | | 0.000 | (2) | | | — | | | | — | | | | — | | | | — | | |
| Total distributions | | $ | (0.005 | ) | | $ | (0.006 | ) | | $ | (0.009 | ) | | $ | — | | | $ | — | | |
| Net asset value — End of year | | $ | 24.920 | | | $ | 22.170 | | | $ | 21.430 | | | $ | 19.760 | | | $ | 16.130 | | |
| Total Return(3) | | | 12.43 | % | | | 3.48 | % | | | 8.50 | % | | | 22.50 | % | | | (20.42 | )% | |
| Ratios/Supplemental Data | |
| Net assets, end of year (000's omitted) | | $ | 805,778 | | | $ | 1,408,499 | | | $ | 1,991,318 | | | $ | 2,321,779 | | | $ | 2,217,673 | | |
| Ratios (As a percentage of average daily net assets): | |
| Expenses before custodian fee reduction(4) | | | 1.55 | % | | | 1.58 | %(6) | | | 1.55 | %(6) | | | 1.60 | % | | | 1.56 | % | |
| Expenses after custodian fee reduction(4) | | | 1.55 | % | | | 1.58 | %(6) | | | 1.55 | %(6) | | | 1.60 | % | | | 1.56 | % | |
| Net investment income (loss) | | | 0.28 | % | | | 0.12 | %(6) | | | 0.06 | %(6) | | | (0.09 | )% | | | (0.27 | )% | |
| Portfolio Turnover of the Portfolio(5) | | | 1 | % | | | 0 | %(7) | | | 3 | % | | | 15 | % | | | 23 | % | |
(1) Net investment income (loss) per share was computed using average shares outstanding.
(2) Less than $0.001 per share.
(3) Returns are historical and are calculated by determining the percentage change in net asset value with all distributions reinvested.
(4) Includes the Fund's share of the Portfolio's allocated expenses.
(5) Excludes the value of the portfolio securities contributed or distributed as a result of in-kind shareholder transactions. The total turnover rate of the Portfolio including in-kind contributions and distributions of securities was 7%, 6%, 10%, 21%, and 30% for 2006, 2005, 2004, 2003, and 2002, respectively.
(6) The investment adviser waived a portion of its investment advisory fee (equal to less than 0.01% and 0.01% of average daily net assets for 2005 and 2004, respectively).
(7) Amounts to less than 1%.
See notes to financial statements
9
Eaton Vance Tax-Managed Growth Fund 1.1 as of December 31, 2006
FINANCIAL STATEMENTS CONT'D
Financial Highlights
| | | Class C | |
| | | Year Ended December 31, | |
| | | 2006 | | 2005 | | 2004 | | 2003 | | 2002 | |
| Net asset value — Beginning of year | | $ | 21.240 | | | $ | 20.560 | | | $ | 18.970 | | | $ | 15.490 | | | $ | 19.460 | | |
| Income (loss) from operations | |
| Net investment income (loss)(1) | | $ | 0.065 | | | $ | 0.024 | | | $ | 0.013 | | | $ | (0.015 | ) | | $ | (0.046 | ) | |
| Net realized and unrealized gain (loss) | | | 2.571 | | | | 0.696 | | | | 1.602 | | | | 3.495 | | | | (3.924 | ) | |
| Total income (loss) from operations | | $ | 2.636 | | | $ | 0.720 | | | $ | 1.615 | | | $ | 3.480 | | | $ | (3.970 | ) | |
| Less distributions | |
| From net investment income | | $ | (0.096 | ) | | $ | (0.040 | ) | | $ | (0.025 | ) | | $ | — | | | $ | — | | |
| From tax return of capital | | | 0.000 | (2) | | | — | | | | — | | | | — | | | | — | | |
| Total distributions | | $ | (0.096 | ) | | $ | (0.040 | ) | | $ | (0.025 | ) | | $ | — | | | $ | — | | |
| Net asset value — End of year | | $ | 23.780 | | | $ | 21.240 | | | $ | 20.560 | | | $ | 18.970 | | | $ | 15.490 | | |
| Total Return(3) | | | 12.41 | % | | | 3.50 | % | | | 8.52 | % | | | 22.47 | % | | | (20.40 | )% | |
| Ratios/Supplemental Data | |
| Net assets, end of year (000's omitted) | | $ | 597,399 | | | $ | 634,290 | | | $ | 744,512 | | | $ | 818,715 | | | $ | 787,374 | | |
| Ratios (As a percentage of average daily net assets): | |
| Expenses before custodian fee reduction(4) | | | 1.55 | % | | | 1.58 | %(6) | | | 1.55 | %(6) | | | 1.60 | % | | | 1.56 | % | |
| Expenses after custodian fee reduction(4) | | | 1.55 | % | | | 1.58 | %(6) | | | 1.55 | %(6) | | | 1.60 | % | | | 1.56 | % | |
| Net investment income (loss) | | | 0.29 | % | | | 0.12 | %(6) | | | 0.07 | %(6) | | | (0.09 | )% | | | (0.27 | )% | |
| Portfolio Turnover of the Portfolio(5) | | | 1 | % | | | 0 | %(7) | | | 3 | % | | | 15 | % | | | 23 | % | |
(1) Net investment income (loss) per share was computed using average shares outstanding.
(2) Less than $0.001 per share.
(3) Returns are historical and are calculated by determining the percentage change in net asset value with all distributions reinvested.
(4) Includes the Fund's share of the Portfolio's allocated expenses.
(5) Excludes the value of the portfolio securities contributed or distributed as a result of in-kind shareholder transactions. The total turnover rate of the Portfolio including in-kind contributions and distributions of securities was 7%, 6%, 10%, 21%, and 30% for 2006, 2005, 2004, 2003, and 2002, respectively.
(6) The investment adviser waived a portion of its investment advisory fee (equal to less than 0.01% and 0.01% of average daily net assets for 2005 and 2004, respectively).
(7) Amounts to less than 1%.
See notes to financial statements
10
Eaton Vance Tax-Managed Growth Fund 1.1 as of December 31, 2006
FINANCIAL STATEMENTS CONT'D
Financial Highlights
| | | Class I | |
| | | Year Ended December 31, | |
| | | 2006 | | 2005(1) | | 2004(1) | | 2003(1) | | 2002(1) | |
| Net asset value — Beginning of year | | $ | 21.990 | | | $ | 21.290 | | | $ | 19.860 | | | $ | 16.130 | | | $ | 20.060 | | |
| Income (loss) from operations | |
| Net investment income(2) | | $ | 0.240 | | | $ | 0.238 | | | $ | 0.219 | | | $ | 0.159 | | | $ | 0.133 | | |
| Net realized and unrealized gain (loss) | | | 2.732 | | | | 0.726 | | | | 1.685 | | | | 3.665 | | | | (4.063 | ) | |
| Total income (loss) from operations | | $ | 2.972 | | | $ | 0.964 | | | $ | 1.904 | | | $ | 3.824 | | | $ | (3.930 | ) | |
| Less distributions | |
| From net investment income | | $ | (0.332 | ) | | $ | (0.264 | ) | | $ | (0.474 | ) | | $ | (0.094 | ) | | $ | — | | |
| From tax return of capital | | | 0.000 | (3) | | | — | | | | — | | | | — | | | | — | | |
| Total distributions | | $ | (0.332 | ) | | $ | (0.264 | ) | | $ | (0.474 | ) | | $ | (0.094 | ) | | $ | — | | |
| Net asset value — End of year | | $ | 24.630 | | | $ | 21.990 | | | $ | 21.290 | | | $ | 19.860 | | | $ | 16.130 | | |
| Total Return(4) | | | 13.51 | % | | | 4.52 | % | | | 9.58 | % | | | 23.76 | % | | | (19.62 | )% | |
| Ratios/Supplemental Data | |
| Net assets, end of year (000's omitted) | | $ | 18,150 | | | $ | 644 | | | $ | 709 | | | $ | 679 | | | $ | 575 | | |
| Ratios (As a percentage of average daily net assets): | |
| Expenses before custodian fee reduction(5) | | | 0.55 | % | | | 0.58 | %(7) | | | 0.55 | %(7) | | | 0.60 | % | | | 0.56 | % | |
| Expenses after custodian fee reduction(5) | | | 0.55 | % | | | 0.58 | %(7) | | | 0.55 | %(7) | | | 0.60 | % | | | 0.56 | % | |
| Net investment income | | | 1.00 | % | | | 1.12 | %(7) | | | 1.08 | %(7) | | | 0.91 | % | | | 0.75 | % | |
| Portfolio Turnover of the Portfolio(6) | | | 1 | % | | | 0 | %(8) | | | 3 | % | | | 15 | % | | | 23 | % | |
(1) Per share data have been restated to reflect the effects of a 1-for-0.4979060 reverse stock split effective on November 11, 2005.
(2) Net investment income per share was computed using average shares outstanding.
(3) Less than $0.001 per share.
(4) Returns are historical and are calculated by determining the percentage change in net asset value with all distributions reinvested.
(5) Includes the Fund's share of the Portfolio's allocated expenses.
(6) Excludes the value of the portfolio securities contributed or distributed as a result of in-kind shareholder transactions. The total turnover rate of the Portfolio including in-kind contributions and distributions of securities was 7%, 6%, 10%, 21%, and 30% for 2006, 2005, 2004, 2003, and 2002, respectively.
(7) The investment adviser waived a portion of its investment advisory fee (equal to less than 0.01% and 0.01% of average daily net assets for 2005 and 2004, respectively).
(8) Amounts to less than 1%.
See notes to financial statements
11
Eaton Vance Tax-Managed Growth Fund 1.1 as of December 31, 2006
FINANCIAL STATEMENTS CONT'D
Financial Highlights
| | | Class S | |
| | | Year Ended December 31, | |
| | | 2006 | | 2005 | | 2004 | | 2003 | | 2002 | |
| Net asset value — Beginning of year | | $ | 23.470 | | | $ | 22.680 | | | $ | 20.880 | | | $ | 16.970 | | | $ | 21.150 | | |
| Income (loss) from operations | |
| Net investment income(1) | | $ | 0.288 | | | $ | 0.235 | | | $ | 0.211 | | | $ | 0.144 | | | $ | 0.111 | | |
| Net realized and unrealized gain (loss) | | | 2.852 | | | | 0.772 | | | | 1.779 | | | | 3.857 | | | | (4.291 | ) | |
| Total income (loss) from operations | | $ | 3.140 | | | $ | 1.007 | | | $ | 1.990 | | | $ | 4.001 | | | $ | (4.180 | ) | |
| Less distributions | |
| From net investment income | | $ | (0.280 | ) | | $ | (0.217 | ) | | $ | (0.190 | ) | | $ | (0.091 | ) | | $ | — | | |
| From tax return of capital | | | 0.000 | (2) | | | — | | | | — | | | | — | | | | — | | |
| Total distributions | | $ | (0.280 | ) | | $ | (0.217 | ) | | $ | (0.190 | ) | | $ | (0.091 | ) | | $ | — | | |
| Net asset value — End of year | | $ | 26.330 | | | $ | 23.470 | | | $ | 22.680 | | | $ | 20.880 | | | $ | 16.970 | | |
| Total Return(3) | | | 13.37 | % | | | 4.43 | % | | | 9.54 | % | | | 23.58 | % | | | (19.76 | )% | |
| Ratios/Supplemental Data | |
| Net assets, end of year (000's omitted) | | $ | 33,127 | | | $ | 32,946 | | | $ | 34,158 | | | $ | 35,292 | | | $ | 34,713 | | |
| Ratios (As a percentage of average daily net assets): | |
| Expenses before custodian fee reduction(4) | | | 0.68 | % | | | 0.66 | %(6) | | | 0.64 | %(6) | | | 0.71 | % | | | 0.71 | % | |
| Expenses after custodian fee reduction(4) | | | 0.68 | % | | | 0.66 | %(6) | | | 0.64 | %(6) | | | 0.71 | % | | | 0.71 | % | |
| Net investment income | | | 1.17 | % | | | 1.04 | %(6) | | | 0.99 | %(6) | | | 0.79 | % | | | 0.59 | % | |
| Portfolio Turnover of the Portfolio(5) | | | 1 | % | | | 0 | %(7) | | | 3 | % | | | 15 | % | | | 23 | % | |
(1) Net investment income per share was computed using average shares outstanding.
(2) Less than $0.001 per share.
(3) Returns are historical and are calculated by determining the percentage change in net asset value with all distributions reinvested.
(4) Includes the Fund's share of the Portfolio's allocated expenses.
(5) Excludes the value of the portfolio securities contributed or distributed as a result of in-kind shareholder transactions. The total turnover rate of the Portfolio including in-kind contributions and distributions of securities was 7%, 6%, 10%, 21%, and 30% for 2006, 2005, 2004, 2003, and 2002, respectively.
(6) The investment adviser waived a portion of its investment advisory fee (equal to less than 0.01% and 0.01% of average daily net assets for 2005 and 2004, respectively).
(7) Amounts to less than 1%.
See notes to financial statements
12
Eaton Vance Tax-Managed Growth Fund 1.1 as of December 31, 2006
NOTES TO FINANCIAL STATEMENTS
1 Significant Accounting Policies
Eaton Vance Tax-Managed Growth Fund 1.1 (the Fund) is a diversified series of Eaton Vance Mutual Funds Trust (the Trust). The Trust is an entity of the type commonly known as a Massachusetts business trust and is registered under the Investment Company Act of 1940, as amended, as an open-end management investment company. The Fund has five classes of shares. Class A shares are generally sold subject to a sales charge imposed at the time of purchase. Class B and Class C shares are sold at net asset value and are subject to a contingent deferred sales charge (see Note 6). Class I shares are sold at net asset value and are not subject to a sales charge. Class S shares were issued in connection with the acquisition of a private investment company and are exempt from registration under the Securities Act of 1933. The Trustees have adopted a conversion feature pursuant to which Class B shares of the Fund automatically convert to Class A shares eight years after their purchase as described in the Fund's prospectus. Each class represents a pro rata interest in the Fund, but votes separately on class-specific matters and (as noted below) is subject to different expenses. Realized and unrealized gains and losses and net investment income, other than class-specific expenses, are allocated daily to each class of shares based on the relative net assets of each class to the total net assets of the Fund. Each class of shares differs in its distribution plan and certain other class-specific expenses. The Fund invests all of its investable assets in interests of Tax-Managed Growth Portfolio (the Portfolio), a New York trust, having the same investment objective as the Fund. The value of the Fund's investment in the Portfolio reflects the Fund's proportionate interest in the net assets of the Portfolio (14.5% at December 31, 2006). The performance of the Fund is directly affected by the performance of the Portfolio. The financial statements of the P ortfolio, including the Portfolio of Investments, are included elsewhere in this report and should be read in conjunction with the Fund's financial statements.
The following is a summary of significant accounting policies consistently followed by the Fund in the preparation of its financial statements. The policies are in conformity with accounting principles generally accepted in the United States of America.
A Investment Valuation — Valuation of securities by the Portfolio is discussed in Note 1A of the Portfolio's Notes to Financial Statements, which are included elsewhere in this report.
B Income — The Fund's net investment income or loss consists of the Fund's pro rata share of the net investment income or loss of the Portfolio, less all actual and accrued expenses of the Fund.
C Expenses — The majority of expenses of the Trust are directly identifiable to an individual fund. Expenses which are not readily identifiable to a specific fund are allocated taking into consideration, among other things, the nature and type of expense and the relative size of the funds.
D Federal Taxes — The Fund's policy is to comply with the provisions of the Internal Revenue Code applicable to regulated investment companies and to distribute to shareholders, each year, substantially all of its net investment income and all or substantially all of its net realized capital gains. Accordingly, no provision for federal income or excise tax is necessary. At December 31, 2006, the Fund, for federal income tax purposes, had a capital loss carryover of $150,033,109 which will reduce taxable income arising from future net realized gains on investments, if any, to the extent permitted by the Internal Revenue Code, and thus will reduce the amount of distributions to shareholders which would otherwise be necessary to relieve the Fund of any liability for federal income or excise tax. Such capital loss carryover will expire on December 31, 2009 ($50,444,437) and December 31, 2010 ($99,588,672).
At December 31, 2006, net losses of $1,047 attributable to currency transactions incurred after October 31, 2006 are treated as arising on the first day of the Fund's taxable year ending December 31, 2007.
E Expense Reduction — Investors Bank & Trust Company (IBT) serves as custodian of the Fund. Pursuant to the custodian agreement, IBT receives a fee reduced by credits which are determined based on the average daily cash balance the Fund maintains with IBT. All credit balances used to reduce the Fund's custodian fees are reported as a reduction of expenses in the Statement of Operations. For the year ended December 31, 2006, there were no credit balances used to reduce the Fund's custodian fee.
F Other — Investment transactions are accounted for on the date the securities are purchased or sold. Dividends to shareholders are recorded on the ex-dividend date.
G Indemnifications — Under the Trust's organizational documents, its officers and Trustees may be
13
Eaton Vance Tax-Managed Growth Fund 1.1 as of December 31, 2006
NOTES TO FINANCIAL STATEMENTS CONT'D
indemnified against certain liabilities and expenses arising out of the performance of their duties to the Fund, and shareholders are indemnified against personal liability for the obligations of the Trust. Additionally, in the normal course of business, the Fund enters into agreements with service providers that may contain indemnification clauses. The Fund's maximum exposure under these arrangements is unknown as this would involve future claims that may be made against the Fund that have not yet occurred.
H Use of Estimates — The preparation of the financial statements in conformity with accounting principles generally accepted in the United States of America requires management to make estimates and assumptions that affect the reported amounts of assets and liabilities at the date of the financial statements and the reported amounts of income and expense during the reporting period. Actual results could differ from those estimates.
2 Distributions to Shareholders
The Fund's policy is to distribute annually (normally in December) substantially all of the net investment income allocated to the Fund by the Portfolio (less the Fund's direct expenses) and to distribute annually all or substantially all of its net realized capital gains (reduced by any available capital loss carryforwards from prior years) allocated by the Portfolio to the Fund, if any. Distributions are paid in the form of additional shares of the Fund or, at the election of the shareholder, in cash. Shareholders may reinvest all distributions in additional shares of the Fund at net asset value as of the close of business on the ex-dividend date. The Fund distinguishes between distributions on a tax basis and a financial reporting basis. Accounting principles generally accepted in the United States of America require that only distributions in excess of tax basis earnings and profits be reported in the financial statements as a return of capital. Permanent differences between book and tax accounting relating to distributions are reclassified to paid-in capital.
The tax character of distributions paid for the years ended December 31, 2006 and December 31, 2005 were as follows:
| | | Year Ended December 31, | |
| | | 2006 | | 2005 | |
| Distributions declared from: | |
| Ordinary income | | $ | 18,668,108 | | | $ | 11,672,541 | | |
| Return of capital | | $ | 20,151 | | | $ | — | | |
During the year ended December 31, 2006, accumulated paid-in capital was increased by $125,112,696, accumulated undistributed net investment income was decreased by $130,556, and accumulated net realized gain was decreased by $124,982,140 primarily due to differences between book and tax accounting treatment of foreign currency gain (loss) and redemptions in-kind. Additionally, amounts were reclassified resulting in an increase in accumulated paid-in capital and a decrease in accumulated net realized gains of $1,020,534,689 due to the correction of the allocation of realized gain (loss). These changes had no effect on the Fund's net assets or net asset value per share.
As of December 31, 2006, the components of distributable earnings (accumulated losses) on a tax basis were as follows:
| Capital loss carryforwards | | $ | (150,033,109 | ) | |
| Unrealized appreciation | | $ | 814,096,797 | | |
| Other temporary differences | | $ | (1,047 | ) | |
3 Shares of Beneficial Interest
The Fund's Declaration of Trust permits the Trustees to issue an unlimited number of full and fractional shares of beneficial interest (without par value). Such shares may be issued in a number of different series (such as the Fund) and classes. Sales and redemptions of Class I shares include shares purchased and redeemed in connection with the ReFlow liquidity program, a program designed to provide an alternative liquidity source for mutual funds experiencing net redemptions of their shares. Transactions in Fund shares were as follows:
| | | Year Ended December 31, | |
| Class A | | 2006 | | 2005 | |
| Sales | | | 546,820 | | | | 629,109 | | |
Issued to shareholders electing to
receive payments of distributions
in Fund shares | | | 475,741 | | | | 340,818 | | |
| Redemptions | | | (9,781,579 | ) | | | (10,066,758 | ) | |
| Exchange from Class B shares | | | 18,770,325 | | | | 10,784,321 | | |
| Net increase | | | 10,011,307 | | | | 1,687,490 | | |
| | | Year Ended December 31, | |
| Class B | | 2006 | | 2005 | |
| Sales | | | 239,506 | | | | 506,635 | | |
Issued to shareholders electing to
receive payments of distributions
in Fund shares | | | 5,307 | | | | 12,923 | | |
| Redemptions | | | (11,627,932 | ) | | | (18,508,312 | ) | |
| Exchange to Class A shares | | | (19,802,748 | ) | | | (11,397,988 | ) | |
| Net decrease | | | (31,185,867 | ) | | | (29,386,742 | ) | |
14
Eaton Vance Tax-Managed Growth Fund 1.1 as of December 31, 2006
NOTES TO FINANCIAL STATEMENTS CONT'D
| | | Year Ended December 31, | |
| Class C | | 2006 | | 2005 | |
| Sales | | | 343,963 | | | | 521,903 | | |
Issued to shareholders electing to
receive payments of distributions
in Fund shares | | | 72,925 | | | | 40,314 | | |
| Redemptions | | | (5,159,742 | ) | | | (6,907,268 | ) | |
| Net decrease | | | (4,742,854 | ) | | | (6,345,051 | ) | |
| | | Year Ended December 31, | |
| Class I | | 2006 | | 2005(1) | |
| Sales | | | 1,425,008 | | | | 2,036 | | |
Issued to shareholders electing to
receive payments of distributions
in Fund shares | | | 189 | | | | 150 | | |
| Redemptions | | | (717,685 | ) | | | (6,190 | ) | |
| Net increase (decrease) | | | 707,512 | | | | (4,004 | ) | |
| | | Year Ended December 31, | |
| Class S | | 2006 | | 2005 | |
Issued to shareholders electing to
receive payments of distributions
in Fund shares | | | 851 | | | | 1,310 | | |
| Redemptions | | | (146,738 | ) | | | (103,772 | ) | |
| Net decrease | | | (145,887 | ) | | | (102,462 | ) | |
(1) Transactions have been restated to reflect the effects of a 1-for-0.4979060 reverse stock split effective on November 11, 2005.
4 Transactions with Affiliates
Eaton Vance Management (EVM) serves as the administrator of the Fund, but receives no compensation. The Portfolio has engaged Boston Management and Research (BMR), a subsidiary of EVM, to render investment advisory services. See Note 2 of the Portfolio's Notes to Financial Statements which are included elsewhere in this report. EVM serves as the sub-transfer agent of the Fund and receives an aggregate fee based on actual expenses incurred by EVM for the performance of these services. For the year ended December 31, 2006, EVM received $191,713 in sub-transfer agent fees.
Except for Trustees of the Fund and the Portfolio who are not members of EVM's or BMR's organization, officers and Trustees receive remuneration for their services to the Fund out of the investment adviser fee earned by BMR. Trustees of the Fund who are not affiliated with EVM or BMR may elect to defer receipt of all or a percentage of their annual fees in accordance with the terms of the Trustees Deferred Compensation Plan. For the year ended December 31, 2006, no significant amounts have been deferred.
Eaton Vance Distributors, Inc. (EVD), a subsidiary of EVM and the Fund's principal underwriter, received $47,160 as its portion of the sales charge on sales of Class A shares for the year ended December 31, 2006.
Certain officers and Trustees of the Fund and the Portfolio are officers of the above organizations.
5 Distribution Plans
Class A has in effect a distribution plan pursuant to Rule 12b-1 (Class A Plan) under the Investment Company Act of 1940 (the 1940 Act). The Class A Plan provides that the Fund will pay EVD a distribution and service fee of 0.25% of the Fund's average daily net assets attributable to Class A shares for each fiscal year for distribution services and facilities provided to the Fund by EVD, as well as for personal services and/or the maintenance of shareholder accounts. Distribution and service fees paid or accrued for the year ended December 31, 2006 amounted to $3,192,567 for Class A shares. The Fund also has in effect distribution plans for Class B shares (Class B Plan) and Class C shares (Class C Plan) pursuant to Rule 12b-1 under the 1940 Act. The Class B and Class C Plans require the Fund to pay EVD amounts equal to 1/365 of 0.75% of the Fund's average daily net assets attributable to Class B and Class C shares for providing ongoing distribution services and facilities to the Fund. The Fund will automatically discontinue payments to EVD during any period in which there are no outstanding Uncovered Distribution Charges, which are equivalent to the sum of (i) 5% and 6.25% of the aggregate amount received by the Fund for the Class B and Class C shares sold, respectively, plus (ii) interest calculated by applying the rate of 1% over the prevailing prime rate to the outstanding balance of Uncovered Distribution Charges of EVD of each respective class, reduced by the aggregate amount of contingent deferred sales charges (see Note 6) and daily amounts theretofore paid to EVD by each respective class. Distribution fees paid or accrued for the year ended December 31, 2006 amounted to $8,037,629 and $4,516,711 for Class B and Class C shares, respectively. At December 31, 2006, the amount of Uncovered Distribution Charges of EVD calculated under the Plans was approximately $36,335,000 and
15
Eaton Vance Tax-Managed Growth Fund 1.1 as of December 31, 2006
NOTES TO FINANCIAL STATEMENTS CONT'D
$91,402,000 for Class B and Class C shares, respectively. The Class B and Class C Plans also authorize the Fund to make payments of service fees to EVD, investment dealers and other persons in amounts not exceeding 0.25% annually of the average daily net assets attributable to that Class. Service fees are paid for personal services and/or the maintenance of shareholder accounts. They are separate and distinct from the Class B and Class C sales commissions and distribution fees and, as such, are not subject to automatic discontinuance when there are no outstanding Uncovered Distribution Charges to EVD. Service fees paid or accrued for the year ended December 31, 2006 amounted to $2,679,210 and $1,505,570 for Class B and Class C shares, respectively.
Pursuant to a servicing agreement, the Fund makes service fee payments in the amount of 0.20% of the Fund's average daily net assets attributable to Class S shares to EVD, one half of which is paid to a subagent. Service fees paid or accrued for the year ended December 31, 2006 amounted to $64,189 for Class S shares.
6 Contingent Deferred Sales Charge
A contingent deferred sales charge (CDSC) generally is imposed on any redemption of Class B shares made within six years of purchase and on any redemption of Class C shares made within one year of purchase. Class A shares may be subject to a 1% CDSC if redeemed within eighteen months of purchase (depending on the circumstances of purchase). Generally, the CDSC is based upon the lower of the net asset value at date of redemption or date of purchase. No charge is levied on shares acquired by reinvestment of dividends or capital gains distributions. The Class B CDSC is imposed at declining rates that begin at 5% in the case of redemptions in the first and second year after purchase, declining one percentage point each subsequent year. Class C shares will be subject to a 1% CDSC if redeemed within one year of purchase.
No CDSC is levied on shares which have been sold to EVM, its affiliates or to their respective employees or clients and may be waived under certain other limited conditions. CDSC pertaining to Class B and Class C shares are paid to EVD to reduce the amount of Uncovered Distribution Charges calculated under the Plans (see Note 5). CDSC assessed on Class B and Class C shares when no Uncovered Distribution Charges exist for the respective class will be credited to the Fund. EVD received approximately $5,000, $947,000 and $13,000 of CDSC paid by shareholders for Class A, Class B and Class C shares, respectively, for the year ended December 31, 2006.
7 Investment Transactions
Increases and decreases in the Fund's investment in the Portfolio aggregated $59,069,539 and $671,746,461, respectively, for the year ended December 31, 2006. Decreases in the Fund's investment in the Portfolio include the distribution of common stock as the result of redemptions in-kind of $16,660,923 for the year ended December 31, 2006.
8 Recently Issued Accounting Pronouncements
In June 2006, the Financial Accounting Standards Board (FASB) issued FASB Interpretation No. 48, (FIN 48) "Accounting for Uncertainty in Income Taxes – an interpretation of FASB Statement No. 109". FIN 48 clarifies the accounting for uncertainty in income taxes recognized in accordance with FASB Statement No. 109, "Accounting for Income Taxes." This interpretation prescribes a recognition threshold and measurement attribute for the financial statement recognition and measurement of a tax position taken or expected to be taken in a tax return. It also provides guidance on de-recognition, classification, interest and penalties, accounting in interim periods, disclosure and transition. FIN 48 is effective during the first required financial reporting period for fiscal years beginning after December 15, 2006. Management is currently evaluating the impact of applying the various provisions of FIN 48.
In September 2006, FASB issued Statement of Financial Accounting Standards No. 157, (FAS 157) "Fair Value Measurements". FAS 157 defines fair value, establishes a framework for measuring fair value in accordance with generally accepted accounting principles and expands disclosure about fair value measurements. FAS 157 is effective for fiscal years beginning after November 15, 2007. Management is currently evaluating the impact the adoption of FAS 157 will have on the Fund's financial statement disclosures.
16
Eaton Vance Tax-Managed Growth Fund 1.1 as of December 31, 2006
REPORT OF INDEPENDENT REGISTERED PUBLIC ACCOUNTING FIRM
To the Trustees of Eaton Vance Mutual Funds Trust and Shareholders of Eaton Vance Tax-Managed Growth Fund 1.1:
We have audited the accompanying statement of assets and liabilities of Eaton Vance Tax-Managed Growth Fund 1.1 (the Fund) (one of the series of Eaton Vance Mutual Funds Trust) as of December 31, 2006, and the related statement of operations for the year then ended, the statements of changes in net assets for each of the two years in the period then ended, and the financial highlights for each of the five years in the period then ended. These financial statements and financial highlights are the responsibility of the Fund's management. Our responsibility is to express an opinion on these financial statements and financial highlights based on our audits.
We conducted our audits in accordance with the standards of the Public Company Accounting Oversight Board (United States). Those standards require that we plan and perform the audit to obtain reasonable assurance about whether the financial statements are free of material misstatement. The Fund is not required to have, nor were we engaged to perform, an audit of its internal control over financial reporting. Our audits included consideration of internal control over financial reporting as a basis for designing audit procedures that are appropriate in the circumstances, but not for the purpose of expressing an opinion on the effectiveness of the Fund's internal control over financial reporting. Accordingly, we express no such opinion. An audit also includes examining, on a test basis, evidence supporting the amounts and disclosures in the financial statements, assessing the accounting principles used and significant estimates mad e by management, as well as evaluating the overall financial statement presentation. We believe that our audits provide a reasonable basis for our opinion.
In our opinion, such financial statements and financial highlights referred to above present fairly, in all material respects, the financial position of Eaton Vance Tax-Managed Growth Fund 1.1 as of December 31, 2006, the results of its operations for the year then ended, the changes in its net assets for each of the two years in the period then ended, and the financial highlights for each of the five years in the period then ended, in conformity with accounting principles generally accepted in the United States of America.
DELOITTE & TOUCHE LLP
Boston, Massachusetts
February 20, 2007
17
Eaton Vance Tax-Managed Growth Fund 1.1 as of December 31, 2006
FEDERAL TAX INFORMATION (Unaudited)
The Form 1099-DIV you received in January 2007 showed the tax status of all distributions paid to your account in calendar 2006. Shareholders are advised to consult their own tax adviser with respect to the tax consequences of their investment in the Fund. As required by the Internal Revenue Code regulations, shareholders must be notified within 60 days of the Fund's fiscal year end regarding the status of qualified dividend income for individuals and the dividends received deduction for corporations.
Qualified Dividend Income. The Fund designates $43,461,161 or up to the maximum amount of such dividends allowable pursuant to the Internal Revenue Code, as qualified dividend income eligible for the reduced tax rate of 15%.
Dividends Received Deduction. Corporate shareholders are generally entitled to take the dividends received deduction on the portion of the Fund's dividend distribution that qualified under tax law. For the Fund's fiscal 2006 ordinary income dividends, 100% qualified for the corporate dividends received deduction.
18
Tax-Managed Growth Portfolio as of December 31, 2006
PORTFOLIO OF INVESTMENTS
| Common Stocks — 99.7% | |
| Security | | Shares | | Value | |
| Aerospace & Defense — 3.3% | |
| Boeing Company (The) | | | 948,774 | | | $ | 84,289,082 | | |
| General Dynamics Corp. | | | 1,470,000 | | | | 109,294,500 | | |
| Honeywell International, Inc. | | | 293,060 | | | | 13,258,034 | | |
| Northrop Grumman Corp. | | | 3,106,377 | | | | 210,301,723 | | |
| Raytheon Co. | | | 350,050 | | | | 18,482,640 | | |
| Rockwell Collins, Inc. | | | 129,632 | | | | 8,204,409 | | |
| United Technologies Corp. | | | 3,693,938 | | | | 230,945,004 | | |
| | | $ | 674,775,392 | | |
| Air Freight & Logistics — 2.7% | |
| C.H. Robinson Worldwide, Inc. | | | 2,078,589 | | | $ | 84,993,504 | | |
| FedEx Corp. | | | 2,219,776 | | | | 241,112,069 | | |
| United Parcel Service, Inc., Class B | | | 2,979,416 | | | | 223,396,612 | | |
| | | $ | 549,502,185 | | |
| Airlines — 0.0% | |
| Southwest Airlines Co. | | | 386,112 | | | $ | 5,915,236 | | |
| | | $ | 5,915,236 | | |
| Auto Components — 0.1% | |
| BorgWarner, Inc. | | | 95,849 | | | $ | 5,657,008 | | |
| Delphi Corp.(1) | | | 5,361 | | | | 20,479 | | |
| Johnson Controls, Inc. | | | 213,523 | | | | 18,345,896 | | |
| Visteon Corp.(1) | | | 4,426 | | | | 37,532 | | |
| | | $ | 24,060,915 | | |
| Automobiles — 0.1% | |
| DaimlerChrysler AG(2) | | | 24,284 | | | $ | 1,491,280 | | |
| Ford Motor Co. | | | 83,266 | | | | 625,328 | | |
| General Motors Corp. | | | 33,939 | | | | 1,042,606 | | |
| Harley-Davidson, Inc. | | | 141,140 | | | | 9,946,136 | | |
| | | $ | 13,105,350 | | |
| Beverages — 4.5% | |
| Anheuser-Busch Companies, Inc. | | | 4,881,907 | | | $ | 240,189,824 | | |
| Brown-Forman Corp., Class A | | | 479,732 | | | | 32,348,329 | | |
| Brown-Forman Corp., Class B | | | 45,820 | | | | 3,035,117 | | |
| Coca Cola Co. (The) | | | 4,721,933 | | | | 227,833,267 | | |
| Coca-Cola Enterprises, Inc. | | | 1,606,930 | | | | 32,813,511 | | |
| PepsiCo, Inc. | | | 6,177,920 | | | | 386,428,896 | | |
| | | $ | 922,648,944 | | |
| Security | | Shares | | Value | |
| Biotechnology — 1.7% | |
| Amgen, Inc.(1) | | | 4,383,782 | | | $ | 299,456,148 | | |
| Biogen Idec, Inc.(1) | | | 211,200 | | | | 10,388,928 | | |
| Celera Group(1) | | | 8,870 | | | | 124,091 | | |
| Genzyme Corp.(1) | | | 501,099 | | | | 30,857,676 | | |
| Gilead Sciences, Inc.(1) | | | 115,482 | | | | 7,498,246 | | |
| Vertex Pharmaceuticals, Inc.(1) | | | 13,000 | | | | 486,460 | | |
| | | $ | 348,811,549 | | |
| Building Products — 0.7% | |
| American Standard Companies, Inc. | | | 868,699 | | | $ | 39,829,849 | | |
| Masco Corp. | | | 3,420,182 | | | | 102,160,836 | | |
| | | $ | 141,990,685 | | |
| Capital Markets — 5.4% | |
| Affiliated Managers Group, Inc.(1) | | | 20,520 | | | $ | 2,157,268 | | |
| Ameriprise Financial, Inc. | | | 67,969 | | | | 3,704,311 | | |
| Bank of New York Co., Inc. | | | 426,888 | | | | 16,806,581 | | |
| Bear Stearns Companies, Inc. | | | 95,736 | | | | 15,583,906 | | |
| Charles Schwab Corp. (The) | | | 847,738 | | | | 16,395,253 | | |
| Credit Suisse Group(2) | | | 155,136 | | | | 10,796,273 | | |
| Federated Investors, Inc., Class B | | | 1,599,819 | | | | 54,041,886 | | |
| Franklin Resources, Inc. | | | 797,053 | | | | 87,811,329 | | |
| Goldman Sachs Group, Inc. | | | 1,115,548 | | | | 222,384,494 | | |
| Investors Financial Services Corp. | | | 450,386 | | | | 19,217,971 | | |
| Knight Capital Group, Inc., Class A(1) | | | 1,750,000 | | | | 33,547,500 | | |
| Legg Mason, Inc. | | | 46,784 | | | | 4,446,819 | | |
| Lehman Brothers Holdings, Inc. | | | 192,474 | | | | 15,036,069 | | |
| Mellon Financial Corp. | | | 321,392 | | | | 13,546,673 | | |
| Merrill Lynch & Co., Inc. | | | 2,472,803 | | | | 230,217,959 | | |
| Morgan Stanley | | | 3,053,604 | | | | 248,654,974 | | |
| Northern Trust Corp. | | | 725,484 | | | | 44,029,624 | | |
| Nuveen Investments, Class A | | | 110,000 | | | | 5,706,800 | | |
| Piper Jaffray Cos., Inc.(1) | | | 27,517 | | | | 1,792,733 | | |
| Raymond James Financial, Inc. | | | 221,005 | | | | 6,698,662 | | |
| State Street Corp. | | | 146,764 | | | | 9,897,764 | | |
| T. Rowe Price Group, Inc. | | | 341,862 | | | | 14,963,300 | | |
| UBS AG(2) | | | 192,683 | | | | 11,624,565 | | |
| Waddell & Reed Financial, Inc., Class A | | | 273,635 | | | | 7,486,654 | | |
| | | $ | 1,096,549,368 | | |
See notes to financial statements
19
Tax-Managed Growth Portfolio as of December 31, 2006
PORTFOLIO OF INVESTMENTS CONT'D
| Security | | Shares | | Value | |
| Chemicals — 0.8% | |
| Arch Chemicals, Inc. | | | 4,950 | | | $ | 164,885 | | |
| Arkema (ADR)(1) | | | 20,000 | | | | 1,026,702 | | |
| Ashland, Inc. | | | 46,969 | | | | 3,249,315 | | |
| Dow Chemical Co. (The) | | | 250,250 | | | | 9,994,985 | | |
| E.I. du Pont de Nemours and Co. | | | 1,031,498 | | | | 50,244,268 | | |
| Ecolab, Inc. | | | 407,411 | | | | 18,414,977 | | |
| MacDermid, Inc. | | | 41,355 | | | | 1,410,206 | | |
| Monsanto Co. | | | 39,066 | | | | 2,052,137 | | |
| Olin Corp. | | | 9,900 | | | | 163,548 | | |
| PPG Industries, Inc. | | | 27,142 | | | | 1,742,788 | | |
| Rohm and Haas Co. | | | 2,601 | | | | 132,963 | | |
| Sigma-Aldrich Corp. | | | 630,897 | | | | 49,033,315 | | |
| Tronox, Inc., Class B | | | 37,854 | | | | 597,715 | | |
| Valspar Corp. (The) | | | 1,219,107 | | | | 33,696,117 | | |
| | | $ | 171,923,921 | | |
| Commercial Banks — 7.8% | |
| Associated Banc-Corp. | | | 991,726 | | | $ | 34,591,403 | | |
| Bank of Hawaii Corp. | | | 69,735 | | | | 3,762,203 | | |
| Bank of Montreal(2) | | | 255,949 | | | | 15,149,621 | | |
| BB&T Corp. | | | 1,867,960 | | | | 82,059,483 | | |
| City National Corp. | | | 184,221 | | | | 13,116,535 | | |
| Colonial BancGroup, Inc. (The) | | | 52,095 | | | | 1,340,925 | | |
| Comerica, Inc. | | | 466,015 | | | | 27,345,760 | | |
| Commerce Bancshares, Inc. | | | 171,056 | | | | 8,280,821 | | |
| Compass Bancshares, Inc. | | | 54,254 | | | | 3,236,251 | | |
| Fifth Third Bancorp | | | 2,711,753 | | | | 110,992,050 | | |
| First Citizens BancShares, Inc., Class A | | | 22,480 | | | | 4,555,347 | | |
| First Horizon National Corp. | | | 148,868 | | | | 6,219,705 | | |
| First Midwest Bancorp, Inc. | | | 523,358 | | | | 20,243,487 | | |
| HSBC Holdings PLC (Hungary) (ADR) | | | 220,592 | | | | 4,037,864 | | |
| HSBC Holdings PLC (UK) (ADR) | | | 580,708 | | | | 53,221,888 | | |
| Huntington Bancshares, Inc. | | | 583,001 | | | | 13,846,274 | | |
| KeyCorp | | | 663,862 | | | | 25,246,672 | | |
| M&T Bank Corp. | | | 81,234 | | | | 9,923,545 | | |
| Marshall & Ilsley Corp. | | | 663,221 | | | | 31,907,562 | | |
| National City Corp. | | | 1,511,282 | | | | 55,252,470 | | |
| PNC Financial Services Group, Inc. | | | 166,675 | | | | 12,340,617 | | |
| Popular, Inc.(2) | | | 1,432 | | | | 25,704 | | |
| Regions Financial Corp. | | | 2,294,230 | | | | 85,804,202 | | |
| Royal Bank of Canada(2) | | | 574,109 | | | | 27,356,294 | | |
| Societe Generale(2) | | | 1,606,685 | | | | 271,515,830 | | |
| SunTrust Banks, Inc. | | | 1,252,412 | | | | 105,766,193 | | |
| Security | | Shares | | Value | |
| Commercial Banks (continued) | |
| Synovus Financial Corp. | | | 1,065,458 | | | $ | 32,848,070 | | |
| Toronto-Dominion Bank (The)(2) | | | 17,915 | | | | 1,072,571 | | |
| Trustmark Corp. | | | 205,425 | | | | 6,719,452 | | |
| U.S. Bancorp | | | 4,831,496 | | | | 174,851,840 | | |
| Valley National Bancorp. | | | 109,831 | | | | 2,911,620 | | |
| Wachovia Corp. | | | 2,539,881 | | | | 144,646,223 | | |
| Wells Fargo & Co. | | | 4,253,936 | | | | 151,269,964 | | |
| Westamerica Bancorporation | | | 258,826 | | | | 13,104,360 | | |
| Whitney Holding Corp. | | | 117,128 | | | | 3,820,715 | | |
| Zions Bancorporation | | | 454,096 | | | | 37,435,674 | | |
| | | $ | 1,595,819,195 | | |
| Commercial Services & Supplies — 0.8% | |
| Acco Brands Corp.(1) | | | 15,490 | | | $ | 410,020 | | |
| Allied Waste Industries, Inc.(1) | | | 1,240,437 | | | | 15,244,971 | | |
| Avery Dennison Corp. | | | 65,769 | | | | 4,467,688 | | |
| Cintas Corp. | | | 1,251,060 | | | | 49,679,593 | | |
| Donnelley (R.R.) & Sons Co. | | | 60,262 | | | | 2,141,711 | | |
| Herman Miller, Inc. | | | 541,800 | | | | 19,699,848 | | |
| HNI Corp. | | | 765,839 | | | | 34,010,910 | | |
| Hudson Highland Group, Inc.(1) | | | 5,226 | | | | 87,170 | | |
| Manpower, Inc. | | | 706 | | | | 52,901 | | |
| Monster Worldwide, Inc.(1) | | | 39,395 | | | | 1,837,383 | | |
| PHH Corp.(1) | | | 27,409 | | | | 791,298 | | |
| Pitney Bowes, Inc. | | | 31,857 | | | | 1,471,475 | | |
| School Specialty, Inc.(1) | | | 12,603 | | | | 472,486 | | |
| Waste Management, Inc. | | | 671,011 | | | | 24,673,074 | | |
| | | $ | 155,040,528 | | |
| Communications Equipment — 1.6% | |
| 3Com Corp.(1) | | | 472,985 | | | $ | 1,943,968 | | |
| ADC Telecommunications, Inc.(1) | | | 21,341 | | | | 310,084 | | |
| Alcatel SA (ADR) | | | 89,240 | | | | 1,268,993 | | |
| Avaya, Inc.(1) | | | 20,404 | | | | 285,248 | | |
| Cisco Systems, Inc.(1) | | | 6,198,467 | | | | 169,404,103 | | |
| Comverse Technology, Inc.(1) | | | 165,755 | | | | 3,499,088 | | |
| Corning, Inc.(1) | | | 3,671,953 | | | | 68,702,241 | | |
| Dycom Industries, Inc.(1) | | | 61,019 | | | | 1,288,721 | | |
| Juniper Networks, Inc.(1) | | | 35,691 | | | | 675,988 | | |
| Motorola, Inc. | | | 1,266,823 | | | | 26,045,881 | | |
| Nokia Oyj (ADR) | | | 2,042,478 | | | | 41,503,153 | | |
| Nortel Networks Corp.(1)(2) | | | 72,544 | | | | 1,939,101 | | |
See notes to financial statements
20
Tax-Managed Growth Portfolio as of December 31, 2006
PORTFOLIO OF INVESTMENTS CONT'D
| Security | | Shares | | Value | |
| Communications Equipment (continued) | |
| QUALCOMM, Inc. | | | 347,456 | | | $ | 13,130,362 | | |
| Riverstone Networks, Inc.(3) | | | 28,706 | | | | 0 | | |
| Tellabs, Inc.(1) | | | 32,678 | | | | 335,276 | | |
| | | $ | 330,332,207 | | |
| Computer Peripherals — 2.3% | |
| Dell, Inc.(1) | | | 4,406,741 | | | $ | 110,565,132 | | |
| EMC Corp.(1) | | | 1,747,812 | | | | 23,071,118 | | |
| Gateway, Inc.(1) | | | 65,556 | | | | 131,768 | | |
| Hewlett-Packard Co. | | | 887,799 | | | | 36,568,441 | | |
| International Business Machines Corp. | | | 1,575,883 | | | | 153,097,033 | | |
| Lexmark International, Inc., Class A(1) | | | 1,714,509 | | | | 125,502,059 | | |
| McDATA Corp., Class A(1) | | | 7,666 | | | | 42,546 | | |
| Network Appliance, Inc.(1) | | | 364,967 | | | | 14,335,904 | | |
| Palm, Inc.(1) | | | 68,379 | | | | 963,460 | | |
| Sun Microsystems, Inc.(1) | | | 319,180 | | | | 1,729,956 | | |
| | | $ | 466,007,417 | | |
| Construction & Engineering — 0.1% | |
| Jacobs Engineering Group, Inc.(1) | | | 157,319 | | | $ | 12,827,791 | | |
| | | $ | 12,827,791 | | |
| Construction Materials — 0.1% | |
| CRH PLC(2) | | | 207,894 | | | $ | 8,634,999 | | |
| Vulcan Materials Co. | | | 206,614 | | | | 18,568,400 | | |
| | | $ | 27,203,399 | | |
| Consumer Finance — 1.0% | |
| American Express Co. | | | 618,260 | | | $ | 37,509,834 | | |
| Capital One Financial Corp. | | | 1,705,714 | | | | 131,032,949 | | |
| SLM Corp. | | | 916,399 | | | | 44,692,779 | | |
| | | $ | 213,235,562 | | |
| Containers & Packaging — 0.1% | |
| Bemis Co., Inc. | | | 295,186 | | | $ | 10,030,420 | | |
| Sealed Air Corp. | | | 21,264 | | | | 1,380,459 | | |
| Sonoco Products Co. | | | 128,617 | | | | 4,895,163 | | |
| Temple-Inland, Inc. | | | 115,924 | | | | 5,335,982 | | |
| | | $ | 21,642,024 | | |
| Distributors — 0.0% | |
| Genuine Parts Co. | | | 190,459 | | | $ | 9,033,470 | | |
| | | $ | 9,033,470 | | |
| Security | | Shares | | Value | |
| Diversified Consumer Services — 0.3% | |
| Apollo Group, Inc., Class A(1) | | | 31,893 | | | $ | 1,242,870 | | |
| H&R Block, Inc. | | | 1,599,312 | | | | 36,848,148 | | |
| Laureate Education, Inc.(1) | | | 302,518 | | | | 14,711,450 | | |
| ServiceMaster Co. (The) | | | 1,156,537 | | | | 15,162,200 | | |
| | | $ | 67,964,668 | | |
| Diversified Financial Services — 3.1% | |
| Bank of America Corp. | | | 4,074,755 | | | $ | 217,551,169 | | |
| Citigroup, Inc. | | | 4,486,846 | | | | 249,917,322 | | |
| ING Groep N.V. (ADR) | | | 257,281 | | | | 11,364,102 | | |
| JPMorgan Chase & Co. | | | 2,748,807 | | | | 132,767,378 | | |
| Moody's Corp. | | | 309,906 | | | | 21,402,108 | | |
| | | $ | 633,002,079 | | |
| Diversified Telecommunication Services — 1.4% | |
| AT&T, Inc. | | | 1,201,387 | | | $ | 42,949,585 | | |
| BCE, Inc.(2) | | | 2,653,500 | | | | 71,644,500 | | |
| Bell Aliant Regional Communications, Inc.(1)(2)(3)(5) | | | 210,251 | | | | 4,870,986 | | |
| BellSouth Corp. | | | 165,981 | | | | 7,819,365 | | |
| Cincinnati Bell, Inc.(1) | | | 169,013 | | | | 772,389 | | |
| Citizens Communications Co. | | | 6,949 | | | | 99,857 | | |
| Deutsche Telekom AG (ADR) | | | 1,843,732 | | | | 33,555,922 | | |
| Embarq Corp. | | | 16,420 | | | | 863,035 | | |
| McLeod USA, Inc., Class A(1)(3) | | | 947 | | | | 0 | | |
| Qwest Communications International, Inc.(1) | | | 38,011 | | | | 318,152 | | |
| RSL Communications, Ltd., Class A(1)(2)(3) | | | 247,161 | | | | 0 | | |
| Telefonos de Mexico SA de CV (ADR) | | | 2,883,026 | | | | 81,416,654 | | |
| Verizon Communications, Inc. | | | 462,191 | | | | 17,211,993 | | |
| Windstream Corp. | | | 1,105,386 | | | | 15,718,589 | | |
| | | $ | 277,241,027 | | |
| Electric Utilities — 0.4% | |
| American Electric Power Co., Inc. | | | 960 | | | $ | 40,877 | | |
| Duke Energy Corp. | | | 417,250 | | | | 13,856,873 | | |
| Exelon Corp. | | | 1,003,134 | | | | 62,083,963 | | |
| Southern Co. (The) | | | 65,985 | | | | 2,432,207 | | |
| | | $ | 78,413,920 | | |
| Electrical Equipment — 0.6% | |
| American Power Conversion Corp. | | | 15,654 | | | $ | 478,856 | | |
| Emerson Electric Co. | | | 2,533,434 | | | | 111,648,436 | | |
| Rockwell Automation, Inc. | | | 160,084 | | | | 9,777,931 | | |
| Roper Industries, Inc. | | | 46,244 | | | | 2,323,299 | | |
| Thomas & Betts Corp.(1) | | | 106,648 | | | | 5,042,317 | | |
| | | $ | 129,270,839 | | |
See notes to financial statements
21
Tax-Managed Growth Portfolio as of December 31, 2006
PORTFOLIO OF INVESTMENTS CONT'D
| Security | | Shares | | Value | |
| Electronic Equipment & Instruments — 0.4% | |
| Agilent Technologies, Inc.(1) | | | 451,772 | | | $ | 15,744,254 | | |
| Arrow Electronics, Inc.(1) | | | 8,750 | | | | 276,063 | | |
| Flextronics International, Ltd.(1)(2) | | | 441,607 | | | | 5,069,648 | | |
| Jabil Circuit, Inc. | | | 2,082,013 | | | | 51,113,419 | | |
| National Instruments Corp. | | | 278,794 | | | | 7,594,349 | | |
| Plexus Corp.(1) | | | 146,273 | | | | 3,492,999 | | |
| Sanmina-SCI Corp.(1) | | | 540,602 | | | | 1,865,077 | | |
| Solectron Corp.(1) | | | 1,670,613 | | | | 5,379,374 | | |
| | | $ | 90,535,183 | | |
| Energy Equipment & Services — 0.7% | |
| Baker Hughes, Inc. | | | 194,687 | | | $ | 14,535,331 | | |
| GlobalSantaFe Corp.(2) | | | 20,000 | | | | 1,175,600 | | |
| Grant Prideco, Inc.(1) | | | 11,694 | | | | 465,070 | | |
| Halliburton Co. | | | 1,251,578 | | | | 38,861,497 | | |
| Schlumberger, Ltd.(2) | | | 1,178,674 | | | | 74,445,050 | | |
| Smith International, Inc. | | | 120,165 | | | | 4,935,177 | | |
| Transocean, Inc.(1)(2) | | | 103,602 | | | | 8,380,366 | | |
| | | $ | 142,798,091 | | |
| Food & Staples Retailing — 1.8% | |
| Casey's General Stores, Inc. | | | 12,551 | | | $ | 295,576 | | |
| Costco Wholesale Corp. | | | 928,292 | | | | 49,078,798 | | |
| CVS Corp. | | | 365,636 | | | | 11,301,809 | | |
| Kroger Co. (The) | | | 1,344,295 | | | | 31,012,886 | | |
| Safeway, Inc. | | | 1,135,280 | | | | 39,235,277 | | |
| SUPERVALU, Inc. | | | 98,710 | | | | 3,528,883 | | |
| Sysco Corp. | | | 2,229,368 | | | | 81,951,568 | | |
| Walgreen Co. | | | 1,063,420 | | | | 48,800,344 | | |
| Wal-Mart Stores, Inc. | | | 2,141,995 | | | | 98,917,329 | | |
| | | $ | 364,122,470 | | |
| Food Products — 2.5% | |
| Archer-Daniels-Midland Co. | | | 1,376,641 | | | $ | 43,997,446 | | |
| Campbell Soup Co. | | | 1,295,515 | | | | 50,382,578 | | |
| ConAgra Foods, Inc. | | | 954,451 | | | | 25,770,177 | | |
| Dean Foods Co.(1) | | | 286,449 | | | | 12,111,064 | | |
| Del Monte Foods Co. | | | 99,492 | | | | 1,097,397 | | |
| General Mills, Inc. | | | 151,524 | | | | 8,727,782 | | |
| H.J. Heinz Co. | | | 292,513 | | | | 13,166,010 | | |
| Hershey Co. (The) | | | 497,578 | | | | 24,779,384 | | |
| J.M. Smucker Co. (The) | | | 7,152 | | | | 346,657 | | |
| Security | | Shares | | Value | |
| Food Products (continued) | |
| Kellogg Co. | | | 54,076 | | | $ | 2,707,045 | | |
| Kraft Foods, Inc. | | | 465 | | | | 16,601 | | |
| Nestle SA(2) | | | 275,000 | | | | 97,368,672 | | |
| Sara Lee Corp. | | | 4,504,598 | | | | 76,713,304 | | |
| Smithfield Foods, Inc.(1) | | | 3,650,830 | | | | 93,680,298 | | |
| TreeHouse Foods, Inc.(1) | | | 64,797 | | | | 2,021,666 | | |
| Tyson Foods, Inc., Class A | | | 265,272 | | | | 4,363,724 | | |
| William Wrigley Jr. Co. | | | 996,034 | | | | 51,514,878 | | |
| | | $ | 508,764,683 | | |
| Gas Utilities — 0.0% | |
| National Fuel Gas Co. | | | 4,000 | | | $ | 154,160 | | |
| | | $ | 154,160 | | |
| Health Care Equipment & Supplies — 1.0% | |
| Advanced Medical Optics, Inc.(1) | | | 9,834 | | | $ | 346,157 | | |
| Baxter International, Inc. | | | 241,562 | | | | 11,206,061 | | |
| Becton, Dickinson and Co. | | | 63,708 | | | | 4,469,116 | | |
| Biomet, Inc. | | | 419,890 | | | | 17,328,860 | | |
| Boston Scientific Corp.(1) | | | 1,138,837 | | | | 19,565,220 | | |
| DENTSPLY International, Inc. | | | 7,701 | | | | 229,875 | | |
| Edwards Lifesciences Corp.(1) | | | 3,070 | | | | 144,413 | | |
| Hillenbrand Industries, Inc. | | | 188,606 | | | | 10,737,340 | | |
| Hospira, Inc.(1) | | | 114,611 | | | | 3,848,637 | | |
| Medtronic, Inc. | | | 1,886,733 | | | | 100,959,083 | | |
| Medtronic, Inc.(3)(4) | | | 7,500 | | | | 401,074 | | |
| St. Jude Medical, Inc.(1) | | | 84,585 | | | | 3,092,428 | | |
| Stryker Corp. | | | 151,918 | | | | 8,372,201 | | |
| Zimmer Holdings, Inc.(1) | | | 302,863 | | | | 23,738,402 | | |
| | | $ | 204,438,867 | | |
| Health Care Providers & Services — 1.9% | |
| AmerisourceBergen Corp. | | | 369,925 | | | $ | 16,631,828 | | |
| Cardinal Health, Inc. | | | 2,189,814 | | | | 141,089,716 | | |
| Caremark Rx, Inc. | | | 1,087,504 | | | | 62,107,353 | | |
| CIGNA Corp. | | | 15,036 | | | | 1,978,287 | | |
| Express Scripts, Inc.(1) | | | 74,800 | | | | 5,355,680 | | |
| Health Management Associates, Inc., Class A | | | 124,425 | | | | 2,626,612 | | |
| Henry Schein, Inc.(1) | | | 1,143,408 | | | | 56,004,124 | | |
| McKesson Corp. | | | 2,631 | | | | 133,392 | | |
| Medco Health Solutions, Inc.(1) | | | 174,081 | | | | 9,302,889 | | |
| Sunrise Senior Living, Inc.(1) | | | 8,000 | | | | 245,760 | | |
See notes to financial statements
22
Tax-Managed Growth Portfolio as of December 31, 2006
PORTFOLIO OF INVESTMENTS CONT'D
| Security | | Shares | | Value | |
| Health Care Providers & Services (continued) | |
| Tenet Healthcare Corp.(1) | | | 3,478 | | | $ | 24,242 | | |
| Unitedhealth Group | | | 453,594 | | | | 24,371,606 | | |
| WellPoint, Inc.(1) | | | 834,692 | | | | 65,681,913 | | |
| | | $ | 385,553,402 | | |
| Health Care Technology — 0.0% | |
| IMS Health, Inc. | | | 120,055 | | | $ | 3,299,111 | | |
| | | $ | 3,299,111 | | |
| Hotels, Restaurants & Leisure — 1.5% | |
| Bob Evans Farms, Inc. | | | 49,985 | | | $ | 1,710,487 | | |
| Brinker International, Inc. | | | 185,881 | | | | 5,606,171 | | |
| Carnival Corp.(2) | | | 550,082 | | | | 26,981,522 | | |
| Darden Restaurants, Inc. | | | 184,714 | | | | 7,419,961 | | |
| Gaylord Entertainment Co.(1) | | | 428,482 | | | | 21,822,588 | | |
| International Game Technology | | | 409,904 | | | | 18,937,565 | | |
| International Speedway Corp., Class A | | | 118,344 | | | | 6,040,278 | | |
| Jack in the Box, Inc.(1) | | | 74,400 | | | | 4,541,376 | | |
| Marriott International, Inc., Class A | | | 395,881 | | | | 18,891,441 | | |
| McDonald's Corp. | | | 915,891 | | | | 40,601,448 | | |
| MGM MIRAGE(1) | | | 188,890 | | | | 10,832,842 | | |
| OSI Restaurant Partners, Inc. | | | 1,034,548 | | | | 40,554,282 | | |
| Papa John's International, Inc.(1) | | | 157,179 | | | | 4,559,763 | | |
| Sonic Corp.(1) | | | 43,809 | | | | 1,049,226 | | |
| Starbucks Corp.(1) | | | 2,254,271 | | | | 79,846,279 | | |
| Wyndham Worldwide Corp.(1) | | | 128,223 | | | | 4,105,700 | | |
| Yum! Brands, Inc. | | | 247,333 | | | | 14,543,180 | | |
| | | $ | 308,044,109 | | |
| Household Durables — 0.4% | |
| Blyth, Inc. | | | 583,297 | | | $ | 12,103,413 | | |
| D.R. Horton, Inc. | | | 637,557 | | | | 16,888,885 | | |
| Fortune Brands, Inc. | | | 115,429 | | | | 9,856,482 | | |
| Leggett & Platt, Inc. | | | 1,794,941 | | | | 42,899,090 | | |
| Newell Rubbermaid, Inc. | | | 291,589 | | | | 8,441,502 | | |
| | | $ | 90,189,372 | | |
| Household Products — 3.1% | |
| Clorox Co. (The) | | | 14,873 | | | $ | 954,103 | | |
| Colgate-Palmolive Co. | | | 702,684 | | | | 45,843,104 | | |
| Energizer Holdings, Inc.(1) | | | 168,981 | | | | 11,995,961 | | |
| Kimberly-Clark Corp. | | | 1,398,706 | | | | 95,042,073 | | |
| Procter & Gamble Co. (The) | | | 7,412,101 | | | | 476,375,731 | | |
| | | $ | 630,210,972 | | |
| Security | | Shares | | Value | |
Independent Power Producers &
Energy Traders — 0.1% | |
| AES Corp. (The)(1) | | | 40,339 | | | $ | 889,072 | | |
| Dynegy, Inc., Class A(1) | | | 22,688 | | | | 164,261 | | |
| TXU Corp. | | | 196,092 | | | | 10,630,147 | | |
| | | $ | 11,683,480 | | |
| Industrial Conglomerates — 2.9% | |
| 3M Co. | | | 911,246 | | | $ | 71,013,401 | | |
| General Electric Co. | | | 12,987,699 | | | | 483,272,280 | | |
| Teleflex, Inc. | | | 14,497 | | | | 935,926 | | |
| Textron, Inc. | | | 12,838 | | | | 1,203,819 | | |
| Tyco International, Ltd.(2) | | | 1,125,841 | | | | 34,225,566 | | |
| | | $ | 590,650,992 | | |
| Insurance — 5.8% | |
| Aegon, N.V. (ADR) | | | 5,182,849 | | | $ | 98,214,989 | | |
| AFLAC, Inc. | | | 2,198,053 | | | | 101,110,438 | | |
| Allstate Corp. (The) | | | 191,646 | | | | 12,478,071 | | |
| American International Group, Inc. | | | 6,322,481 | | | | 453,068,988 | | |
| AON Corp. | | | 517,325 | | | | 18,282,266 | | |
| Arthur J. Gallagher & Co. | | | 557,196 | | | | 16,465,142 | | |
| Berkshire Hathaway, Inc., Class A(1) | | | 641 | | | | 70,503,590 | | |
| Berkshire Hathaway, Inc., Class B(1) | | | 40,436 | | | | 148,238,376 | | |
| Chubb Corp. (The) | | | 30,869 | | | | 1,633,279 | | |
| Commerce Group, Inc. (The) | | | 84,309 | | | | 2,508,193 | | |
| Hartford Financial Services Group, Inc. (The) | | | 45,700 | | | | 4,264,267 | | |
| Lincoln National Corp. | | | 224,854 | | | | 14,930,306 | | |
| Manulife Financial Corp.(2) | | | 210,896 | | | | 7,126,176 | | |
| Marsh & McLennan Cos., Inc. | | | 478,800 | | | | 14,680,008 | | |
| MetLife, Inc. | | | 803,028 | | | | 47,386,682 | | |
| Old Republic International Corp. | | | 300,685 | | | | 6,999,947 | | |
| Principal Financial Group, Inc. | | | 113,328 | | | | 6,652,354 | | |
| Progressive Corp. (The) | | | 3,784,948 | | | | 91,671,441 | | |
| SAFECO Corp. | | | 161,000 | | | | 10,070,550 | | |
| St. Paul Travelers Cos., Inc. (The) | | | 349,428 | | | | 18,760,789 | | |
| Torchmark Corp. | | | 318,929 | | | | 20,334,913 | | |
| UnumProvident Corp. | | | 53,710 | | | | 1,116,094 | | |
| XL Capital Ltd., Class A(2) | | | 187,100 | | | | 13,474,942 | | |
| | | $ | 1,179,971,801 | | |
See notes to financial statements
23
Tax-Managed Growth Portfolio as of December 31, 2006
PORTFOLIO OF INVESTMENTS CONT'D
| Security | | Shares | | Value | |
| Internet & Catalog Retail — 0.2% | |
| Amazon.com, Inc.(1) | | | 42,476 | | | $ | 1,676,103 | | |
| Expedia, Inc.(1) | | | 403,096 | | | | 8,456,954 | | |
| IAC/InterActiveCorp(1) | | | 429,832 | | | | 15,972,557 | | |
| Liberty Media Corp. - Interactive(1) | | | 275,760 | | | | 5,948,143 | | |
| | | $ | 32,053,757 | | |
| Internet Software & Services — 0.4% | |
| eBay, Inc.(1) | | | 1,257,244 | | | $ | 37,805,327 | | |
| Google, Inc., Class A(1) | | | 91,634 | | | | 42,195,624 | | |
| | | $ | 80,000,951 | | |
| IT Services — 2.5% | |
| Accenture Ltd., Class A(2) | | | 2,739,520 | | | $ | 101,170,474 | | |
| Acxiom Corp. | | | 455,893 | | | | 11,693,655 | | |
| Affiliated Computer Services, Inc.(1) | | | 183,730 | | | | 8,973,373 | | |
| Automatic Data Processing, Inc. | | | 1,491,647 | | | | 73,463,615 | | |
| BISYS Group, Inc. (The)(1) | | | 65,000 | | | | 839,150 | | |
| Computer Sciences Corp.(1) | | | 226,702 | | | | 12,099,086 | | |
| DST Systems, Inc.(1) | | | 72,199 | | | | 4,521,823 | | |
| Electronic Data Systems Corp. | | | 1,252 | | | | 34,493 | | |
| Fidelity National Information Services, Inc. | | | 42,862 | | | | 1,718,338 | | |
| First Data Corp. | | | 3,488,152 | | | | 89,017,639 | | |
| Fiserv, Inc.(1) | | | 832,355 | | | | 43,632,049 | | |
| Gartner, Inc., Class A(1) | | | 30,576 | | | | 605,099 | | |
| Paychex, Inc. | | | 1,623,499 | | | | 64,193,150 | | |
| Perot Systems Corp.(1) | | | 649,037 | | | | 10,637,716 | | |
| Safeguard Scientifics, Inc.(1) | | | 26,579 | | | | 64,321 | | |
| Western Union Co. | | | 3,488,152 | | | | 78,204,368 | | |
| | | $ | 500,868,349 | | |
| Leisure Equipment & Products — 0.0% | |
| Eastman Kodak Co. | | | 90,761 | | | $ | 2,341,634 | | |
| Mattel, Inc. | | | 30,514 | | | | 691,447 | | |
| | | $ | 3,033,081 | | |
| Life Sciences Tools & Services — 0.2% | |
| Dionex Corp.(1) | | | 37,300 | | | $ | 2,115,283 | | |
| Invitrogen Corp.(1) | | | 429,910 | | | | 24,328,607 | | |
| PerkinElmer, Inc. | | | 254,526 | | | | 5,658,113 | | |
| Waters Corp.(1) | | | 97,439 | | | | 4,771,588 | | |
| | | $ | 36,873,591 | | |
| Security | | Shares | | Value | |
| Machinery — 3.6% | |
| Caterpillar, Inc. | | | 185,437 | | | $ | 11,372,851 | | |
| Danaher Corp. | | | 4,060,343 | | | | 294,131,247 | | |
| Deere & Co. | | | 3,312,500 | | | | 314,919,375 | | |
| Donaldson Co., Inc. | | | 77,792 | | | | 2,700,160 | | |
| Dover Corp. | | | 532,425 | | | | 26,099,474 | | |
| Illinois Tool Works, Inc. | | | 1,656,572 | | | | 76,517,061 | | |
| ITT Industries, Inc. | | | 8,428 | | | | 478,879 | | |
| Nordson Corp. | | | 72,383 | | | | 3,606,845 | | |
| Parker Hannifin Corp. | | | 35,571 | | | | 2,734,698 | | |
| | | $ | 732,560,590 | | |
| Media — 4.9% | |
| ADVO, Inc. | | | 750,000 | | | $ | 24,450,000 | | |
| Belo Corp., Class A | | | 330,817 | | | | 6,080,416 | | |
| Cablevision Systems Corp., Class A | | | 4 | | | | 114 | | |
| Catalina Marketing Corp. | | | 79,803 | | | | 2,194,583 | | |
| CBS Corp., Class A | | | 14,887 | | | | 464,772 | | |
| CBS Corp., Class B | | | 556,629 | | | | 17,355,692 | | |
| Clear Channel Communications, Inc. | | | 129,887 | | | | 4,616,184 | | |
| Comcast Corp., Class A(1) | | | 1,895,538 | | | | 80,238,124 | | |
| Comcast Corp., Class A Special(1) | | | 2,367,010 | | | | 99,130,379 | | |
| Discovery Holding Co., Class A(1) | | | 102,540 | | | | 1,649,869 | | |
| E.W. Scripps Co. (The), Class A | | | 51,066 | | | | 2,550,236 | | |
| EchoStar Communications Corp., Class A(1) | | | 35,150 | | | | 1,336,755 | | |
| Entercom Communications Corp. | | | 220,000 | | | | 6,199,600 | | |
| Gannett Co., Inc. | | | 423,389 | | | | 25,598,099 | | |
| Havas SA (ADR) | | | 3,142,938 | | | | 17,367,670 | | |
| Idearc, Inc.(1) | | | 23,103 | | | | 661,901 | | |
| Interpublic Group of Companies, Inc., (The)(1) | | | 932,692 | | | | 11,416,150 | | |
| Lamar Advertising Co.(1) | | | 241,409 | | | | 15,785,735 | | |
| Liberty Global, Inc., Class A(1) | | | 46,731 | | | | 1,362,209 | | |
| Liberty Global, Inc., Class C(1) | | | 48,416 | | | | 1,355,648 | | |
| Liberty Media Holding Corp.-Capital, Series A(1) | | | 55,152 | | | | 5,403,793 | | |
| Liberty Media Holding Corp.-Capital, Series B(1) | | | 526 | | | | 51,614 | | |
| Live Nation, Inc.(1) | | | 16,410 | | | | 367,584 | | |
| McClatchy Co., (The), Class A | | | 9,394 | | | | 406,760 | | |
| McGraw-Hill Companies, Inc., (The) | | | 482,884 | | | | 32,845,770 | | |
| New York Times Co. (The), Class A | | | 300,468 | | | | 7,319,400 | | |
| News Corp., Class A | | | 187,934 | | | | 4,036,822 | | |
| Omnicom Group, Inc. | | | 2,410,418 | | | | 251,985,098 | | |
| Publicis Groupe(1) | | | 329,132 | | | | 13,849,518 | | |
| Time Warner, Inc. | | | 4,059,654 | | | | 88,419,264 | | |
| Tribune Co. | | | 1,694,658 | | | | 52,161,573 | | |
See notes to financial statements
24
Tax-Managed Growth Portfolio as of December 31, 2006
PORTFOLIO OF INVESTMENTS CONT'D
| Security | | Shares | | Value | |
| Media (continued) | |
| Univision Communications, Inc., Class A(1) | | | 27,009 | | | $ | 956,659 | | |
| Viacom, Inc., Class A(1) | | | 13,791 | | | | 565,569 | | |
| Viacom, Inc., Class B(1) | | | 524,573 | | | | 21,523,230 | | |
| Vivendi SA (ADR) | | | 174,913 | | | | 6,815,149 | | |
| Walt Disney Co. (The) | | | 4,955,298 | | | | 169,818,062 | | |
| Washington Post Co. (The), Class B | | | 16,470 | | | | 12,280,032 | | |
| WPP Group PLC(2) | | | 139,450 | | | | 1,881,113 | | |
| WPP Group PLC (ADR) | | | 256,051 | | | | 17,344,895 | | |
| | | $ | 1,007,846,041 | | |
| Metals & Mining — 0.3% | |
| Alcoa, Inc. | | | 85,947 | | | $ | 2,579,269 | | |
| Nucor Corp. | | | 741,928 | | | | 40,553,784 | | |
| Phelps Dodge Corp. | | | 29,724 | | | | 3,558,557 | | |
| Steel Dynamics, Inc. | | | 623,600 | | | | 20,235,820 | | |
| | | $ | 66,927,430 | | |
| Multiline Retail — 1.6% | |
| 99 Cents Only Stores(1) | | | 807,619 | | | $ | 9,828,723 | | |
| Dollar General Corp. | | | 52,668 | | | | 845,848 | | |
| Dollar Tree Stores, Inc.(1) | | | 646,996 | | | | 19,474,580 | | |
| Family Dollar Stores, Inc. | | | 2,249,176 | | | | 65,968,332 | | |
| Federated Department Stores, Inc. | | | 231,607 | | | | 8,831,175 | | |
| J.C. Penney Company, Inc. | | | 130,349 | | | | 10,083,799 | | |
| Nordstrom, Inc. | | | 131,384 | | | | 6,482,487 | | |
| Sears Holdings Corp.(1) | | | 4,563 | | | | 766,265 | | |
| Target Corp. | | | 3,504,497 | | | | 199,931,554 | | |
| | | $ | 322,212,763 | | |
| Multi-Utilities — 0.0% | |
| Ameren Corp. | | | 5,000 | | | $ | 268,650 | | |
| Dominion Resources, Inc. | | | 3,249 | | | | 272,396 | | |
| PG&E Corp. | | | 3,000 | | | | 141,990 | | |
| TECO Energy, Inc. | | | 20,354 | | | | 350,699 | | |
| Wisconsin Energy Corp. | | | 9,576 | | | | 454,477 | | |
| | | $ | 1,488,212 | | |
| Office Electronics — 0.0% | |
| Xerox Corp.(1) | | | 22,878 | | | $ | 387,782 | | |
| Zebra Technologies Corp., Class A(1) | | | 13,500 | | | | 469,665 | | |
| | | $ | 857,447 | | |
| Security | | Shares | | Value | |
| Oil, Gas & Consumable Fuels — 10.1% | |
| Anadarko Petroleum Corp. | | | 5,118,262 | | | $ | 222,746,762 | | |
| Apache Corp. | | | 2,145,450 | | | | 142,693,880 | | |
| BP PLC (ADR) | | | 5,110,159 | | | | 342,891,669 | | |
| Chevron Corp. | | | 545,679 | | | | 40,123,777 | | |
| ConocoPhillips | | | 6,155,436 | | | | 442,883,620 | | |
| Devon Energy Corp. | | | 818,602 | | | | 54,911,822 | | |
| El Paso Corp. | | | 97,665 | | | | 1,492,321 | | |
| Exxon Mobil Corp. | | | 7,018,803 | | | | 537,850,874 | | |
| Hess Corp. | | | 56,192 | | | | 2,785,437 | | |
| Kinder Morgan, Inc. | | | 1,762,113 | | | | 186,343,450 | | |
| Marathon Oil Corp. | | | 19,294 | | | | 1,784,695 | | |
| Murphy Oil Corp. | | | 39,036 | | | | 1,984,981 | | |
| Newfield Exploration Co.(1) | | | 30,851 | | | | 1,417,603 | | |
| Royal Dutch Shell PLC (ADR) | | | 116,941 | | | | 8,278,253 | | |
| Total SA (ADR) | | | 762,250 | | | | 54,821,020 | | |
| Valero Energy Corp. | | | 11,481 | | | | 587,368 | | |
| Williams Cos., Inc. (The) | | | 223,515 | | | | 5,838,212 | | |
| | | $ | 2,049,435,744 | | |
| Paper and Forest Products — 0.1% | |
| International Paper Co. | | | 150,301 | | | $ | 5,125,264 | | |
| MeadWestvaco Corp. | | | 45,590 | | | | 1,370,435 | | |
| Neenah Paper, Inc. | | | 33,028 | | | | 1,166,549 | | |
| Weyerhaeuser Co. | | | 85,020 | | | | 6,006,663 | | |
| | | $ | 13,668,911 | | |
| Personal Products — 0.3% | |
| Avon Products, Inc. | | | 173,400 | | | $ | 5,729,136 | | |
| Estee Lauder Cos., Inc., (The) Class A | | | 1,160,940 | | | | 47,389,571 | | |
| | | $ | 53,118,707 | | |
| Pharmaceuticals — 6.6% | |
| Abbott Laboratories | | | 3,244,908 | | | $ | 158,059,469 | | |
| Allergan, Inc. | | | 138,300 | | | | 16,560,042 | | |
| Bristol-Myers Squibb Co. | | | 4,735,992 | | | | 124,651,309 | | |
| Eli Lilly & Co. | | | 3,934,161 | | | | 204,969,788 | | |
| Forest Laboratories, Inc.(1) | | | 56,729 | | | | 2,870,487 | | |
| GlaxoSmithKline PLC (ADR) | | | 419,815 | | | | 22,149,439 | | |
| Johnson & Johnson | | | 3,883,957 | | | | 256,418,841 | | |
| King Pharmaceuticals, Inc.(1) | | | 152,305 | | | | 2,424,696 | | |
| Merck & Co., Inc. | | | 2,720,051 | | | | 118,594,224 | | |
| Mylan Laboratories, Inc. | | | 27,992 | | | | 558,720 | | |
See notes to financial statements
25
Tax-Managed Growth Portfolio as of December 31, 2006
PORTFOLIO OF INVESTMENTS CONT'D
| Security | | Shares | | Value | |
| Pharmaceuticals (continued) | |
| Novo Nordisk A/S (ADR) | | | 269,510 | | | $ | 22,539,121 | | |
| Pfizer, Inc. | | | 9,928,570 | | | | 257,149,963 | | |
| Schering-Plough Corp. | | | 1,739,845 | | | | 41,129,936 | | |
| Sepracor, Inc.(1) | | | 4,000 | | | | 246,320 | | |
| Shering AG (ADR) | | | 25,000 | | | | 3,334,543 | | |
| Teva Pharmaceutical Industries, Ltd. (ADR) | | | 1,676,190 | | | | 52,095,985 | | |
| Watson Pharmaceuticals, Inc.(1) | | | 562,702 | | | | 14,647,133 | | |
| Wyeth | | | 828,310 | | | | 42,177,545 | | |
| | | $ | 1,340,577,561 | | |
| Real Estate Investment Trusts (REITs) — 0.0% | |
| ProLogis | | | 104,563 | | | $ | 6,354,294 | | |
| | | $ | 6,354,294 | | |
| Real Estate Management & Development — 0.0% | |
| Forest City Enterprises, Inc., Class A | | | 58,779 | | | $ | 3,432,694 | | |
| Realogy Corp.(1) | | | 160,279 | | | | 4,859,659 | | |
| | | $ | 8,292,353 | | |
| Road & Rail — 0.1% | |
| Avis Budget Group, Inc. | | | 64,111 | | | $ | 1,390,568 | | |
| Burlington Northern Santa Fe Corp. | | | 192,210 | | | | 14,187,020 | | |
| CSX Corp. | | | 76,268 | | | | 2,625,907 | | |
| Heartland Express, Inc. | | | 1 | | | | 15 | | |
| Kansas City Southern(1) | | | 6,815 | | | | 197,499 | | |
| Norfolk Southern Corp. | | | 3,990 | | | | 200,657 | | |
| Union Pacific Corp. | | | 14,580 | | | | 1,341,652 | | |
| | | $ | 19,943,318 | | |
| Semiconductors & Semiconductor Equipment — 1.9% | |
| Agere Systems, Inc.(1) | | | 7,696 | | | $ | 147,532 | | |
| Analog Devices, Inc. | | | 600,378 | | | | 19,734,425 | | |
| Applied Materials, Inc. | | | 1,094,431 | | | | 20,192,252 | | |
| Broadcom Corp., Class A(1) | | | 911,708 | | | | 29,457,286 | | |
| Cypress Semiconductor Corp.(1) | | | 52,742 | | | | 889,758 | | |
| Intel Corp. | | | 11,168,974 | | | | 226,171,724 | | |
| KLA-Tencor Corp. | | | 148,373 | | | | 7,381,557 | | |
| Linear Technology Corp. | | | 395,760 | | | | 11,999,443 | | |
| LSI Logic Corp.(1) | | | 132,810 | | | | 1,195,290 | | |
| Maxim Integrated Products, Inc. | | | 263,099 | | | | 8,056,091 | | |
| Skyworks Solutions, Inc.(1) | | | 98,685 | | | | 698,690 | | |
| Teradyne, Inc.(1) | | | 7,248 | | | | 108,430 | | |
| Security | | Shares | | Value | |
Semiconductors & Semiconductor
Equipment (continued) | |
| Texas Instruments, Inc. | | | 2,086,420 | | | $ | 60,088,896 | | |
| Verigy, Ltd.(1)(2) | | | 29,129 | | | | 517,040 | | |
| Xilinx, Inc. | | | 23,033 | | | | 548,416 | | |
| | | $ | 387,186,830 | | |
| Software — 2.0% | |
| Adobe Systems, Inc.(1) | | | 489,938 | | | $ | 20,146,251 | | |
| CA, Inc. | | | 39,583 | | | | 896,555 | | |
| Cadence Design Systems, Inc.(1) | | | 269,092 | | | | 4,819,438 | | |
| Compuware Corp.(1) | | | 150,944 | | | | 1,257,364 | | |
| Electronic Arts, Inc.(1) | | | 21,405 | | | | 1,077,956 | | |
| Fair Isaac Corp. | | | 236,946 | | | | 9,631,855 | | |
| Intuit, Inc.(1) | | | 997,878 | | | | 30,445,258 | | |
| Jack Henry & Associates, Inc. | | | 201,006 | | | | 4,301,528 | | |
| Microsoft Corp. | | | 6,910,072 | | | | 206,334,750 | | |
| Oracle Corp.(1) | | | 4,797,138 | | | | 82,222,945 | | |
| SAP AG (ADR) | | | 615,900 | | | | 32,704,290 | | |
| Symantec Corp.(1) | | | 197,186 | | | | 4,111,328 | | |
| Wind River Systems, Inc.(1) | | | 59,479 | | | | 609,660 | | |
| | | $ | 398,559,178 | | |
| Specialty Retail — 1.8% | |
| Abercrombie & Fitch Co., Class A | | | 5,929 | | | $ | 412,836 | | |
| AutoNation, Inc.(1) | | | 890,018 | | | | 18,975,184 | | |
| Best Buy Co., Inc. | | | 170,415 | | | | 8,382,714 | | |
| CarMax, Inc.(1) | | | 61,533 | | | | 3,300,015 | | |
| Circuit City Stores, Inc. | | | 104,507 | | | | 1,983,543 | | |
| Gap, Inc. (The) | | | 540,888 | | | | 10,547,316 | | |
| Home Depot, Inc. | | | 4,483,290 | | | | 180,048,926 | | |
| Limited Brands, Inc. | | | 603,584 | | | | 17,467,721 | | |
| Lowe's Companies, Inc. | | | 1,785,216 | | | | 55,609,478 | | |
| Office Depot, Inc.(1) | | | 79,998 | | | | 3,053,524 | | |
| Payless ShoeSource, Inc.(1) | | | 23,100 | | | | 758,142 | | |
| Pep Boys (The) - Manny, Moe & Jack | | | 62,500 | | | | 928,750 | | |
| RadioShack Corp. | | | 502,318 | | | | 8,428,896 | | |
| Sherwin-Williams Co. (The) | | | 35,899 | | | | 2,282,458 | | |
| Staples, Inc. | | | 275,430 | | | | 7,353,981 | | |
| TJX Companies, Inc. (The) | | | 1,716,834 | | | | 48,895,432 | | |
| Tween Brands, Inc.(1) | | | 8,057 | | | | 321,716 | | |
| | | $ | 368,750,632 | | |
See notes to financial statements
26
Tax-Managed Growth Portfolio as of December 31, 2006
PORTFOLIO OF INVESTMENTS CONT'D
| Security | | Shares | | Value | |
Textiles, Apparel & Luxury
Goods — 1.0% | |
| Coach, Inc.(1) | | | 735,936 | | | $ | 31,615,811 | | |
| Hanesbrands, Inc.(1) | | | 563,704 | | | | 13,314,689 | | |
| NIKE, Inc., Class B | | | 1,529,222 | | | | 151,438,855 | | |
| | | $ | 196,369,355 | | |
| Thrifts & Mortgage Finance — 0.3% | |
| Fannie Mae | | | 335,606 | | | $ | 19,931,640 | | |
| Freddie Mac | | | 146,695 | | | | 9,960,591 | | |
| MGIC Investment Corp. | | | 95,045 | | | | 5,944,114 | | |
| Washington Mutual, Inc. | | | 625,699 | | | | 28,463,048 | | |
| | | $ | 64,299,393 | | |
| Tobacco — 0.3% | |
| Altria Group, Inc. | | | 621,907 | | | $ | 53,372,059 | | |
| | | $ | 53,372,059 | | |
| Trading Companies & Distributors — 0.0% | |
| United Rentals, Inc.(1) | | | 391,179 | | | $ | 9,947,682 | | |
| | | $ | 9,947,682 | | |
| Wireless Telecommunication Services — 0.5% | |
| Alltel Corp. | | | 1,421,969 | | | $ | 86,000,685 | | |
| Sprint Nextel Corp. | | | 344,624 | | | | 6,509,947 | | |
| Telephone & Data Systems, Inc., Special Shares | | | 25,844 | | | | 1,281,862 | | |
| Telephone and Data Systems, Inc. | | | 25,844 | | | | 1,404,105 | | |
| Vodafone Group PLC (ADR) | | | 299,500 | | | | 8,320,110 | | |
| | | $ | 103,516,709 | | |
Total Common Stocks
(identified cost $13,972,240,872) | | | | | | $ | 20,334,849,302 | | |
| Convertible Preferred Stocks — 0.0% | |
| Security | | Shares | | Value | |
Independent Power Producers & Energy
Traders — 0.0% | |
| Enron Corp.(1)(3) | | | 11,050 | | | $ | 0 | | |
| | | $ | 0 | | |
Total Convertible Preferred Stocks
(identified cost $16,626,069) | | | | | | $ | 0 | | |
| Other Issues — 0.0% | |
| Security | | Shares | | Value | |
| Commercial Banks — 0.0% | |
Wachovia Corp. (Dividend Equalization
Preferred Shares)(1) | | | 166,518 | | | $ | 416 | | |
| | | $ | 416 | | |
| Software — 0.0% | |
| Seagate Technology, Inc. (Tax Refund Rights)(1)(3) | | | 197,392 | | | $ | 0 | | |
| | | $ | 0 | | |
Total Other Issues
(identified cost $39,407) | | | | | | $ | 416 | | |
| Warrants — 0.0% | |
| Security | | Shares | | Value | |
| Communications Equipment — 0.0% | |
| Lucent Technologies, Inc.(1) | | | 18,106 | | | $ | 5,613 | | |
| | | $ | 5,613 | | |
Total Warrants
(identified cost $0) | | | | | | $ | 5,613 | | |
See notes to financial statements
27
Tax-Managed Growth Portfolio as of December 31, 2006
PORTFOLIO OF INVESTMENTS CONT'D
| Affiliated Investments — 0.1% | |
| Description | | Interest
(000's omitted) | | Value | |
| Investment in Cash Management Portfolio, 4.87%(6) | | $ | 21,137 | | | $ | 21,136,709 | | |
Total Affiliated Investments
(at amortized cost, $21,136,709) | | | | $ | 21,136,709 | | |
Total Investments — 99.8%
(identified cost $14,010,043,057) | | | | $ | 20,355,992,040 | | |
| Other Assets, Less Liabilities — 0.2% | | | | $ | 31,300,207 | | |
| Net Assets — 100.0% | | | | $ | 20,387,292,247 | | |
ADR - American Depository Receipt
(1) Non-income producing security.
(2) Foreign security.
(3) Security valued at fair value using methods determined in good faith by or at the direction of the Trustees.
(4) Security subject to restrictions on resale (see Note 7).
(5) Security exempt from registration under Rule 144A of the Securities Act of 1933. These securities may be sold in transactions exempt from registration, normally to qualified institutional buyers. At December 31, 2006, the aggregate value of the securities is $4,870,986 or 0.02% of the Portfolio's net assets.
(6) Affiliated investment investing in high quality, U.S. Dollar denominated money market instruments, and that is available to Eaton Vance portfolios and funds. The rate shown is the annualized seven-day yield as of December 31, 2006.
See notes to financial statements
28
Tax-Managed Growth Portfolio as of December 31, 2006
FINANCIAL STATEMENTS
Statement of Assets and Liabilities
As of December 31, 2006
| Assets | |
| Unaffiliated Investments, at value (identified cost, $13,988,906,348) | | $ | 20,334,855,331 | | |
| Affiliated Investments, at value (amortized cost, $21,136,709) | | | 21,136,709 | | |
| Cash | | | 2,010 | | |
| Receivable for investments sold | | | 9,565,416 | | |
| Dividends and interest receivable | | | 28,247,780 | | |
| Tax reclaim receivable | | | 1,478,224 | | |
| Total assets | | $ | 20,395,285,470 | | |
| Liabilities | |
| Payable to affiliate for investment adviser fee | | $ | 7,278,009 | | |
| Payable to affiliate for Trustees' fees | | | 9,161 | | |
| Other accrued expenses | | | 706,053 | | |
| Total liabilities | | $ | 7,993,223 | | |
| Net Assets applicable to investors' interest in Portfolio | | $ | 20,387,292,247 | | |
| Sources of Net Assets | |
| Net proceeds from capital contributions and withdrawals | | $ | 14,041,287,771 | | |
| Net unrealized appreciation (computed on the basis of identified cost) | | | 6,346,004,476 | | |
| Total | | $ | 20,387,292,247 | | |
Statement of Operations
For the Year Ended
December 31, 2006
| Investment Income | |
| Dividends (net of foreign taxes, $5,508,449) | | $ | 352,655,089 | | |
| Interest | | | 2,633,384 | | |
| Security lending income, net | | | 450,588 | | |
| Interest income allocated from affiliated investment | | | 85,831 | | |
| Expense allocated from affiliated investment | | | (7,961 | ) | |
| Total investment income | | $ | 355,816,931 | | |
| Expenses | |
| Investment adviser fee | | $ | 83,323,602 | | |
| Trustees' fees and expenses | | | 28,217 | | |
| Custodian fee | | | 2,217,430 | | |
| Legal and accounting services | | | 92,496 | | |
| Miscellaneous | | | 628,068 | | |
| Total expenses | | $ | 86,289,813 | | |
Deduct —
Reduction of custodian fee | | $ | 99 | | |
| Total expense reductions | | $ | 99 | | |
| Net expenses | | $ | 86,289,714 | | |
| Net investment income | | $ | 269,527,217 | | |
| Realized and Unrealized Gain (Loss) | |
Net realized gain (loss) —
Investment transactions (identified cost basis) | | $ | 644,762,039 | | |
| Foreign currency transactions | | | (23,541 | ) | |
| Net realized gain | | $ | 644,738,498 | | |
Change in unrealized appreciation (depreciation) —
Investments (identified cost basis) | | $ | 1,577,869,222 | | |
| Foreign currency | | | 101,821 | | |
| Net change in unrealized appreciation (depreciation) | | $ | 1,577,971,043 | | |
| Net realized and unrealized gain | | $ | 2,222,709,541 | | |
| Net increase in net assets from operations | | $ | 2,492,236,758 | | |
See notes to financial statements
29
Tax-Managed Growth Portfolio as of December 31, 2006
FINANCIAL STATEMENTS CONT'D
Statements of Changes in Net Assets
Increase (Decrease)
in Net Assets | | Year Ended
December 31, 2006 | | Year Ended
December 31, 2005 | |
From operations —
Net investment income | | $ | 269,527,217 | | | $ | 232,904,646 | | |
Net realized gain from investment
transactions, securities sold short and
foreign currency transactions | | | 644,738,498 | | | | 70,889,149 | | |
Net change in unrealized appreciation
(depreciation) of investments, securities
sold short and foreign currency | | | 1,577,971,043 | | | | 551,019,603 | | |
| Net increase in net assets from operations | | $ | 2,492,236,758 | | | $ | 854,813,398 | | |
Capital transactions —
Contributions | | $ | 1,447,009,081 | | | $ | 1,237,495,815 | | |
| Withdrawals | | | (2,584,560,445 | ) | | | (2,200,844,762 | ) | |
Net decrease in net assets
from capital transactions | | $ | (1,137,551,364 | ) | | $ | (963,348,947 | ) | |
| Net increase (decrease) in net assets | | $ | 1,354,685,394 | | | $ | (108,535,549 | ) | |
| Net Assets | |
| At beginning of year | | $ | 19,032,606,853 | | | $ | 19,141,142,402 | | |
| At end of year | | $ | 20,387,292,247 | | | $ | 19,032,606,853 | | |
See notes to financial statements
30
Tax-Managed Growth Portfolio as of December 31, 2006
FINANCIAL STATEMENTS CONT'D
Supplementary Data
| | | Year Ended December 31, | |
| | | 2006 | | 2005 | | 2004 | | 2003 | | 2002 | |
| Ratios/Supplemental Data | |
| Ratios (As a percentage of average daily net assets): | |
| Expenses before custodian fee reduction | | | 0.45 | % | | | 0.45 | %(2) | | | 0.45 | %(2) | | | 0.45 | % | | | 0.45 | % | |
| Expenses after custodian fee reduction | | | 0.45 | % | | | 0.45 | %(2) | | | 0.45 | %(2) | | | 0.45 | % | | | 0.45 | % | |
| Net investment income | | | 1.39 | % | | | 1.25 | %(2) | | | 1.18 | %(2) | | | 1.05 | % | | | 0.85 | % | |
| Portfolio Turnover(1) | | | 1 | % | | | 0 | %(3) | | | 3 | % | | | 15 | % | | | 23 | % | |
| Total Return | | | 13.69 | % | | | 4.70 | % | | | 9.67 | % | | | 23.88 | % | | | (19.52 | )% | |
| Net assets, end of year (000's omitted) | | $ | 20,387,292 | | | $ | 19,032,607 | | | $ | 19,141,142 | | | $ | 17,609,589 | | | $ | 14,571,522 | | |
(1) Excludes the value of the portfolio securities contributed or distributed as a result of in-kind shareholder transactions. The total turnover rate of the Portfolio including in-kind contributions and distributions was 7%, 6%, 10%, 21%, and 30% for 2006, 2005, 2004, 2003, and 2002, respectively.
(2) The investment adviser waived a portion of its investment advisory fee (equal to less than 0.01% and 0.01% of average daily net assets for 2005 and 2004, respectively).
(3) Amounts to less than 1%.
See notes to financial statements
31
Tax-Managed Growth Portfolio as of December 31, 2006
NOTES TO FINANCIAL STATEMENTS
1 Significant Accounting Policies
Tax-Managed Growth Portfolio (the Portfolio) is registered under the Investment Company Act of 1940 (the 1940 Act), as amended, as a diversified, open-end management investment company. The Portfolio, which was organized as a trust under the laws of the State of New York on December 1, 1995, seeks to achieve long-term, after-tax returns for its interestholders through investing in a diversified portfolio of equity securities. The Declaration of Trust permits the Trustees to issue interests in the Portfolio. The following is a summary of significant accounting policies consistently followed by the Portfolio in the preparation of its financial statements. The policies are in conformity with accounting principles generally accepted in the United States of America.
A Investment Valuations — Securities listed on a U.S. securities exchange generally are valued at the last sale price on the day of valuation or, if no sales took place on such date, at the mean between the closing bid and asked prices therefore on the exchange where such securities are principally traded. Equity securities listed on the NASDAQ Global Market generally are valued at the official NASDAQ closing price. Unlisted or listed securities for which closing sales prices or closing quotations are not available are valued at the mean between the latest available bid and asked prices or, in the case of preferred equity securities that are not listed or traded in the over-the-counter market, by an i ndependent pricing service. Exchange-traded options are valued at the last sale price for the day of valuation as quoted on the principal exchange or board of trade on which the options are traded or, in the absence of sales on such date, at the mean between the latest bid and asked prices therefore. Futures positions on securities and currencies generally are valued at closing settlement prices. Short-term debt securities with a remaining maturity of 60 days or less are valued at amortized cost. If short-term debt securities are acquired with a remaining maturity of more than 60 days, they will be valued by a pricing service. Other fixed income and debt securities, including listed securities and securities for which price quotations are available, will normally be valued on the basis of valuations furnished by a pricing service. Foreign securities and currencies are valued in U.S. dollars, based on foreign currency exchange rate quotations supplied by an independent quotation service. The daily valuation o f exchange-traded foreign securities generally is determined as of the close of trading on the principal exchange on which such securities trade. Events occurring after the close of trading on foreign exchanges may result in adjustments to the valuation of foreign securities to more accurately reflect their fair value as of the close of regular trading on the New York Stock Exchange. When valuing foreign equity securities that meet certain criteria, the Trustees have approved the use of a fair value service that values such securities to reflect market trading that occurs after the close of the applicable foreign markets of comparable securities or other instruments that have a strong correlation to the fair-valued securities. Investments held by the Portfolio for which valuations or market quotations are unavailable are valued at fair value using methods determined in good faith by or at the direction of the Trustees of the Portfolio co nsidering relevant factors, data and information including the market value of freely tradable securities of the same class in the principal market on which such securities are normally traded.
The Portfolio may invest in Cash Management Portfolio (Cash Management) and Cash Collateral Fund, LLC (Cash Collateral), both are affiliated investment companies managed by Boston Management and Research (BMR) and Eaton Vance Management (EVM), respectively. Cash Management values its investment securities utilizing the amortized cost valuation technique permitted by Rule 2a-7 of the 1940 Act. This technique involves initially valuing a portfolio security as its cost and thereafter assuming a constant amortization to maturity of any discount or premium. Investments in Cash Collateral are valued at the net asset value per share on the valuation date.
B Federal Taxes — The Portfolio has elected to be treated as a partnership for federal tax purposes. No provision is made by the Portfolio for federal or state taxes on any taxable income of the Portfolio because each investor in the Portfolio is ultimately responsible for the payment of any taxes on its share of taxable income. Since at least one of the Portfolio's investors is a regulated investment company that invests all or substantially all of its assets in the Portfolio, the Portfolio normally must satisfy the applicable source of income and diversification requirements (under the Internal Revenue Code) in order for its investors to satisfy them. The Portfolio will allocate, at least annually a mong its investors, each investor's distributive share of the Portfolio's net investment income, net realized capital gains, and any other items of income, gain, loss, deduction or credit.
C Futures Contracts — Upon the entering of a financial futures contract, the Portfolio is required to deposit either in cash or securities an amount (initial margin) equal to a certain percentage of the purchase price indicated in the financial futures contract. Subsequent payments are made or received by the Portfolio (margin maintenance) each day, dependent on daily fluctuations in
32
Tax-Managed Growth Portfolio as of December 31, 2006
NOTES TO FINANCIAL STATEMENTS CONT'D
the value of the underlying security, and are recorded for book purposes as unrealized gains or losses by the Portfolio. The Portfolio's investment in financial futures contracts is designed to hedge against anticipated future changes in the price of current or anticipated portfolio positions. Should prices move unexpectedly, the Portfolio may not achieve the anticipated benefits of the financial futures contracts and may realize a loss.
D Put Options — Upon the purchase of a put option by the Portfolio, the premium paid is recorded as an investment, the value of which is marked-to-market daily. When a purchased option expires, the Portfolio will realize a loss in the amount of the cost of the option. When the Portfolio enters into a closing sale transaction, the Portfolio will realize a gain or loss depending on whether the sales proceeds from the closing sale transaction are greater or less than the cost of the option. When the Portfolio exercises a put option, settlement is made in cash. The risk associated with purchasing options is limited to the premium originally paid.
E Securities Sold Short — The Portfolio may sell individual securities short if it owns at least an equal amount of the security sold short or has at the time of the sale a right to obtain securities equivalent in kind and amount to the securities sold short provided that, if such right is conditional, the sale is made upon the same conditions (a covered short sale). The Portfolio may sell short securities representing an index or basket of securities whose constituents the Portfolio holds in whole or in part. A short sale of an index or basket of securities will be a covered short sale if the underlying index or basket of securities is the same or substantially identical to securities held by the Por tfolio. Upon executing the transaction, the Portfolio records the proceeds as deposits with brokers in the Statement of Assets and Liabilities and establishes an offsetting payable for securities sold short for the securities due on settlement. The proceeds are retained by the broker as collateral for the short position. The liability is marked-to-market and the Portfolio is required to pay the lending broker any dividend or interest income earned while the short position is open. The seller of a short position generally realizes a profit on the transaction if the price it receives on the short sale exceeds the cost of closing out the position by purchasing securities in the market, but generally realizes a loss if the cost of closing out the short position exceeds the proceeds of the short sale. The exposure to loss on covered short sales (to the extent the value of the security sold short rises instead of falls) is offset by the increase in the value of the underlying security or securities retained. The p rofit or loss on a covered short sale is also affected by the borrowing cost of any securities borrowed in connection with the short sale (which will vary with market conditions) and use of the proceeds of the short sale. The Portfolio expects normally to close covered short sales against-the-box by delivering newly acquired stocks. Exposure to loss on an index or basket of securities sold short will not be offset by gains on other securities holdings to the extent that the constituent securities of the index or a basket of securities sold short are not held by the Portfolio. Such losses may be substantial.
F Foreign Currency Translation — Investment valuations, other assets, and liabilities initially expressed in foreign currencies are converted each business day into U.S. dollars based upon current exchange rates. Purchases and sales of foreign investment securities and income and expenses are converted into U.S. dollars based upon currency exchange rates prevailing on the respective dates of such transactions. Recognized gains or losses on investment transactions attributable to changes in foreign currency exchange rates are recorded for financial statement purposes as net realized gains and losses on investments. That portion of unrealized gains and losses on investments that results from fluctuation s in foreign currency exchange rates is not separately disclosed.
G Indemnifications — Under the Portfolio's organizational documents, its officers and Trustees may be indemnified against certain liabilities and expenses arising out of the performance of their duties to the Portfolio. Interestholders in the Portfolio are jointly and severally liable for the liabilities and obligations of the Portfolio in the event that the Portfolio fails to satisfy such liabilities and obligations; provided, however, that, to the extent assets are available in the Portfolio, the Portfolio may, under certain circumstances, indemnify interestholders from and against any claim or liability to which such holder may become subject by reason of being or having been an interestholder in t he Portfolio. Additionally, in the normal course of business, the Portfolio enters into agreements with service providers that may contain indemnification clauses. The Portfolio's maximum exposure under these arrangements is unknown as this would involve future claims that may be made against the Portfolio that have not yet occurred.
H Other — Investment transactions are accounted for on the date the securities are purchased or sold. Realized gains and losses on securities sold are determined on the basis of identified cost. Dividend income is recorded on the ex-dividend date. However, if the ex-dividend date has
33
Tax-Managed Growth Portfolio as of December 31, 2006
NOTES TO FINANCIAL STATEMENTS CONT'D
passed, certain dividends from foreign securities are recorded as the Portfolio is informed of the ex-dividend date. Interest income is recorded on the accrual basis.
I Expense Reduction — Investors Bank & Trust Company (IBT) serves as custodian to the Portfolio. Pursuant to the custodian agreement, IBT receives a fee reduced by credits which are determined based on the average daily cash balance the Portfolio maintains with IBT. All credit balances used to reduce the Portfolio's custodian fees are reported as a reduction of expenses in the Statement of Operations. For the year ended December 31, 2006, there were $99 in credit balances used to reduce the Portfolio's custodian fee.
J Use of Estimates — The preparation of the financial statements in conformity with accounting principles generally accepted in the United States of America requires management to make estimates and assumptions that affect the reported amounts of assets and liabilities at the date of the financial statements and the reported amounts of income and expense during the reporting period. Actual results could differ from those estimates.
2 Investment Adviser Fee and Other Transactions with Affiliates
The investment adviser fee is earned by BMR, a wholly-owned subsidiary of EVM, as compensation for management and investment advisory services rendered to the Portfolio. Under the advisory agreement, BMR receives a monthly advisory fee of 5/96 of 1% (0.625% annually) of the average daily net assets of the Portfolio up to $500,000,000, and at reduced rates as daily net assets exceed that level. Certain of the advisory fee rate reductions are pursuant to an agreement between the Portfolio's Board of Trustees and BMR. Those reductions may not be changed without Trustee and interestholder approval. In addition, the investment adviser fee payable by the Portfolio is reduced by the Portfolio's allocable portion of the advisory fee paid by Cash Management, an affiliated investment company managed by BMR. The Portfolio's allocated portion of the advisory fee paid by Cash Management totaled $7,775 and the advisory fee incurred directly b y the Portfolio amounted to $83,323,602 for the year ended December 31, 2006. For the year ended December 31, 2006, the effective annual rate of investment advisory fees paid or accrued on a direct and indirect basis by the Portfolio, based on average net assets, was 0.43%.
Except for Trustees of the Portfolio who are not members of EVM's or BMR's organization, officers and Trustees receive remuneration for their services to the Portfolio out of such investment adviser fee. Trustees of the Portfolio that are not affiliated with the investment adviser may elect to defer receipt of all or a percentage of their annual fees in accordance with the terms of the Trustees Deferred Compensation Plan. For the year ended December 31, 2006, no significant amounts have been deferred.
Certain officers and Trustees of the Portfolio are officers of the above organizations.
3 Investment Transactions
For the year ended December 31, 2006, purchases and sales of investments, other than short-term obligations, aggregated $112,574,873 and $621,537,755, respectively. In addition, investments having an aggregate market value of $1,585,969,823 at dates of withdrawal were distributed in payment for capital withdrawals and investors contributed securities with a value of $1,240,104,202, during the year ended December 31, 2006.
4 Federal Income Tax Basis of Unrealized Appreciation (Depreciation)
The cost and unrealized appreciation (depreciation) in value of the investments owned at December 31, 2006 as computed on a federal income tax basis, were as follows:
| Aggregate cost | | $ | 4,054,619,301 | | |
| Gross unrealized appreciation | | $ | 26,261,456,216 | | |
| Gross unrealized depreciation | | | (9,960,083,477 | ) | |
| Net unrealized appreciation | | $ | 16,301,372,739 | | |
Unrealized appreciation on foreign currency is $55,493.
5 Financial Instruments
The Portfolio may trade in financial instruments with off-balance sheet risk in the normal course of its investing activities to assist in managing exposure to various market risks. These financial instruments include written options, forward foreign currency exchange contracts and financial futures contracts and may involve, to a varying degree, elements of risk in excess of the amounts recognized for financial statement purposes.
The notional or contractual amounts of these instruments represent the investment the Portfolio has in particular classes of financial instruments and does not necessarily represent the amounts potentially subject to risk. The measurement of the risks associated with these instruments
34
Tax-Managed Growth Portfolio as of December 31, 2006
NOTES TO FINANCIAL STATEMENTS CONT'D
is meaningful only when all related and offsetting transactions are considered. The Portfolio did not have any open obligations under these financial instruments at December 31, 2006.
6 Line of Credit
The Portfolio participates with other portfolios and funds managed by BMR and EVM and its affiliates in a $150 million unsecured line of credit agreement with a group of banks. Borrowings will be made by the Portfolio solely to facilitate the handling of unusual and/or unanticipated short-term cash requirements. Interest is charged to each participating portfolio or fund based on its borrowings at an amount above either the Eurodollar rate or Federal Funds rate. In addition, a fee computed at an annual rate of 0.10% on the daily unused portion of the line of credit is allocated among the participating portfolios and funds at the end of each quarter. The Portfolio did not have any significant borrowings or allocated fees during the year ended December 31, 2006.
7 Restricted Securities
At December 31, 2006, the Portfolio owned the following securities (representing less than 0.01% of net assets) which were restricted as to public resale and not registered under the Securities Act of 1933. The securities are valued at fair value using methods determined in good faith by or at the direction of the Trustees.
| Common Stocks | | Date of
Acquisition | | Eligible
for Resale | | Shares | | Cost | | Fair Value | |
| Medtronic, Inc. | | | 5/18/06 | | | | 5/19/07 | | | | 7,500 | | | $ | 368,372 | | | $ | 401,074 | | |
| | | | | | | | | | | | | | | $ | 368,372 | | | $ | 401,074 | | |
8 Securities Lending Agreement
The Portfolio has established a securities lending agreement with a securities lending agent, IBT, in which the Portfolio lends portfolio securities to qualified borrowers in exchange for collateral consisting of either cash or U.S. government securities in an amount at least equal to the market value of the securities on loan. Cash collateral is invested in Cash Collateral which invests in high quality money market instruments. The Portfolio earns interest on the amount invested in Cash Collateral but it must pay the broker a loan rebate fee computed as a varying percentage of the collateral received. The loan rebate fee paid by the Portfolio amounted to $2,160,185 for the year ended December 31, 2006. In the event of counterparty default, the Portfolio is subject to potential loss if it is delayed or prevented from exercising its right to dispose of the co llateral. The Portfolio bears risk in the event that invested collateral is not sufficient to meet obligations due on loans. The Portfolio did not have any securities on loan at December 31, 2006.
9 Recently Issued Accounting Pronouncements
In June 2006, the Financial Accounting Standards Board (FASB) issued FASB Interpretation No. 48, (FIN 48) "Accounting for Uncertainty in Income Taxes – an interpretation of FASB Statement No. 109". FIN 48 clarifies the accounting for uncertainty in income taxes recognized in accordance with FASB Statement No. 109, "Accounting for Income Taxes." This interpretation prescribes a recognition threshold and measurement attribute for the financial statement recognition and measurement of a tax position taken or expected to be taken in a tax return. It also provides guidance on de-recognition, classification, interest and penalties, accounting in interim periods, disclosure and transition. FIN 48 is effective during the first required financial reporting period for fiscal years beginning after December 15, 2006. Management is currently evaluating the impact of applying the various provisions of FIN 48.
In September 2006, the FASB issued Statement of Financial Accounting Standards No. 157, (FAS 157) "Fair Value Measurements". FAS 157 defines fair value, establishes a framework for measuring fair value in accordance with generally accepted accounting principles and expands disclosure about fair value measurements. FAS 157 is effective for fiscal years beginning after November 15, 2007. Management is currently evaluating the impact the adoption of FAS 157 will have on the Portfolio's financial statement disclosures.
35
Tax-Managed Growth Portfolio as of December 31, 2006
REPORT OF INDEPENDENT REGISTERED PUBLIC ACCOUNTING FIRM
To the Trustees and Investors of
Tax-Managed Growth Portfolio:
We have audited the accompanying statement of assets and liabilities of Tax-Managed Growth Portfolio (the Portfolio), including the portfolio of investments, as of December 31, 2006, and the related statement of operations for the year then ended, the statements of changes in net assets for each of the two years in the period then ended, and the supplementary data for each of the five years in the period then ended. These financial statements and supplementary data are the responsibility of the Portfolio's management. Our responsibility is to express an opinion on these financial statements and supplementary data based on our audits.
We conducted our audits in accordance with the standards of the Public Company Accounting Oversight Board (United States). Those standards require that we plan and perform the audit to obtain reasonable assurance about whether the financial statements and supplementary data are free of material misstatement. The Portfolio is not required to have, nor were we engaged to perform, an audit of its internal control over financial reporting. Our audits included consideration of internal control over financial reporting as a basis for designing audit procedures that are appropriate in the circumstances, but not for the purpose of expressing an opinion on the effectiveness of the Portfolio's internal control over financial reporting. Accordingly, we express no such opinion. An audit also includes examining, on a test basis, evidence supporting the amounts and disclosures in the financial statements, assessing the accounting principles u sed and significant estimates made by management, as well as evaluating the overall financial statement presentation. Our procedures included confirmation of securities owned as of December 31, 2006 by correspondence with the custodian and brokers; where replies were not received from brokers, we performed other auditing procedures. We believe that our audits provide a reasonable basis for our opinion.
In our opinion, such financial statements and supplementary data referred to above present fairly, in all material respects, the financial position of Tax-Managed Growth Portfolio as of December 31, 2006, the results of its operations for the year then ended, the changes in its net assets for each of the two years in the period then ended, and the supplementary data for each of the five years in the period then ended, in conformity with accounting principles generally accepted in the United States of America.
DELOITTE & TOUCHE LLP
Boston, Massachusetts
February 20, 2007
36
Eaton Vance Tax-Managed Growth Fund 1.1
BOARD OF TRUSTEES' ANNUAL APPROVAL OF THE INVESTMENT ADVISORY AGREEMENT
Overview of the Contract Review Process
The Investment Company Act of 1940, as amended (the "1940 Act"), provides, in substance, that each investment advisory agreement between a fund and its investment adviser will continue in effect from year to year only if its continuance is approved at least annually by the fund's board of trustees, including by a vote of a majority of the trustees who are not "interested persons" of the fund ("Independent Trustees") cast in person at a meeting called for the purpose of considering such approval.
At a meeting of the Boards of Trustees (each a "Board") of the Eaton Vance group of mutual funds (the "Eaton Vance Funds") held on March 27, 2006, the Board, including a majority of the Independent Trustees, voted to approve continuation of existing advisory and sub-advisory agreements for the Eaton Vance Funds for an additional one-year period. In voting its approval, the Board relied upon the affirmative recommendation of the Special Committee of the Board, which is a committee comprised exclusively of Independent Trustees. Prior to making its recommendation, the Special Committee reviewed information furnished for a series of meetings of the Special Committee held in February and March 2006. Such information included, among other things, the following:
Information about Fees, Performance and Expenses
• An independent report comparing the advisory and related fees paid by each fund with fees paid by comparable funds;
• An independent report comparing each fund's total expense ratio and its components to comparable funds;
• An independent report comparing the investment performance of each fund to the investment performance of comparable funds over various time periods;
• Data regarding investment performance in comparison to relevant peer groups of funds and appropriate indices;
• Comparative information concerning fees charged by each adviser for managing other mutual funds and institutional accounts using investment strategies and techniques similar to those used in managing the fund;
• Profitability analyses for each adviser with respect to each fund managed by it;
Information about Portfolio Management
• Descriptions of the investment management services provided to each fund, including the investment strategies and processes employed;
• Information concerning the allocation of brokerage and the benefits received by each adviser as a result of brokerage allocation, including information concerning the acquisition of research through "soft dollar" benefits received in connection with the funds' brokerage, and the implementation of a soft dollar reimbursement program established with respect to the funds;
• Data relating to portfolio turnover rates of each fund;
• The procedures and processes used to determine the fair value of fund assets and actions taken to monitor and test the effectiveness of such procedures and processes;
Information about each Adviser
• Reports detailing the financial results and condition of each adviser;
• Descriptions of the qualifications, education and experience of the individual investment professionals whose responsibilities include portfolio management and investment research for the funds, and information relating to their compensation and responsibilities with respect to managing other mutual funds and investment accounts;
• Copies of the Codes of Ethics of each adviser and its affiliates, together with information relating to compliance with and the administration of such codes;
• Information concerning the resources devoted to compliance efforts undertaken by each adviser and its affiliates on behalf of the funds (including descriptions of various compliance programs) and their record of compliance with investment policies and restrictions, including policies with respect to market-timing, late trading and selective portfolio disclosure, and with policies on personal securities transactions;
• Descriptions of the business continuity and disaster recovery plans of each adviser and its affiliates;
Other Relevant Information
• Information concerning the nature, cost and character of the administrative and other non-investment management services provided by Eaton Vance Management and its affiliates;
• Information concerning management of the relationship with the custodian, subcustodians and fund accountants by each adviser or the funds' administrator; and
• The terms of each advisory agreement.
In addition to the information identified above, the Special Committee considered information provided from time to time by each adviser throughout the year at meetings of the Board and its committees. Over the course of the twelve month period ended March 31,
37
Eaton Vance Tax-Managed Growth Fund 1.1
BOARD OF TRUSTEES' ANNUAL APPROVAL OF THE INVESTMENT ADVISORY AGREEMENT CONT'D
2006, the Board met nine times and the Special Committee, the Audit Committee and the Governance Committee, each of which is a Committee comprised solely of Independent Trustees, met eight, twelve and five times, respectively. At such meetings, the Trustees received, among other things, presentations by the portfolio managers and other investment professionals of each adviser relating to the investment performance of each fund and the investment strategies used in pursuing the fund's investment objective.
For funds that invest through one or more underlying portfolios, the Board considered similar information about the portfolio(s) when considering the approval of advisory agreements. In addition, in cases where the fund's investment adviser has engaged a sub-adviser, the Board considered similar information about the sub-adviser when considering the approval of any sub-advisory agreement.
The Special Committee was assisted throughout the contract review process by Goodwin Procter LLP, legal counsel for the Independent Trustees. The members of the Special Committee relied upon the advice of such counsel and their own business judgment in determining the material factors to be considered in evaluating each advisory and sub-advisory agreement and the weight to be given to each such factor. The conclusions reached with respect to each advisory and sub-advisory agreement were based on a comprehensive evaluation of all the information provided and not any single factor. Moreover, each member of the Special Committee may have placed varying emphasis on particular factors in reaching conclusions with respect to each advisory and sub-advisory agreement.
Results of the Process
Based on its consideration of the foregoing, and such other information as it deemed relevant, including the factors and conclusions described below, the Special Committee concluded that the continuance of the investment advisory agreement of the Tax-Managed Growth Portfolio (the "Portfolio"), the portfolio in which the Eaton Vance Tax-Managed Growth Fund 1.1 (the "Fund") invests, with Boston Management and Research (the "Adviser"), including its fee structure, is in the interests of shareholders and, therefore, the Special Committee recommended to the Board approval of the agreement. The Board accepted the recommendation of the Special Committee as well as the factors considered and conclusions reached by the Special Committee with respect to the agreement. Accordingly, the Board, including a majority of the Independent Trustees, voted to approve continuation of the investment advisory agreement for the Portfolio.
Nature, Extent and Quality of Services
In considering whether to approve the investment advisory agreement of the Portfolio, the Board evaluated the nature, extent and quality of services provided to the Portfolio by the Adviser.
The Board considered the Adviser's management capabilities and investment process with respect to the types of investments held by the Portfolio, including the education, experience and number of its investment professionals and other personnel who provide portfolio management, investment research, and similar services to the Portfolio. The Board specifically noted the Adviser's in-house equity research capabilities and experience in managing funds that seek to maximize after-tax returns. The Board also took into account the resources dedicated to portfolio management and other services, including the compensation paid to recruit and retain investment personnel, and the time and attention devoted to each Portfolio in the complex by senior management.
The Board reviewed the compliance programs of the Adviser and relevant affiliates thereof. Among other matters, the Board considered compliance and reporting matters relating to personal trading by investment personnel, selective disclosure of portfolio holdings, late trading, frequent trading, portfolio valuation, business continuity and the allocation of investment opportunities. The Board also evaluated the responses of the Adviser and its affiliates to requests from regulatory authorities such as the Securities and Exchange Commission and the National Association of Securities Dealers.
The Board considered shareholder and other administrative services provided or managed by Eaton Vance Management and its affiliates, including transfer agency and accounting services. The Board evaluated the benefits to shareholders of investing in a fund that is a part of a large family of funds, including the ability, in many cases, to exchange an investment among different funds without incurring additional sales charges.
After consideration of the foregoing factors, among others, the Board concluded that the nature, extent and quality of services provided by the Adviser, taken as a whole, are appropriate and consistent with the terms of the investment advisory agreement.
Fund Performance
The Board compared the Fund's investment performance to a relevant universe of similarly managed funds identified by an independent data provider and appropriate benchmark indices. The Board reviewed comparative performance data for the one-, three- and five-year periods ended September 30, 2005 for the Fund. The Board noted the excellent long-term performance record of the underlying Portfolio. The Board noted that, unlike many other funds in its peer group, the Fund is managed by the Adviser with an emphasis on growth-oriented
38
Eaton Vance Tax-Managed Growth Fund 1.1
BOARD OF TRUSTEES' ANNUAL APPROVAL OF THE INVESTMENT ADVISORY AGREEMENT CONT'D
stocks, while value-oriented stocks have generally outperformed growth-oriented stocks in recent years. These differences have adversely affected the Fund's performance in recent years, relative to its peers. The Board concluded that the Fund's performance is satisfactory.
Management Fees and Expenses
The Board reviewed contractual investment advisory fee rates payable by the Portfolio and the Fund (referred to as "management fees"). As part of its review, the Board considered the management fees and the Fund's total expense ratio for the one-year period ended September 30, 2005, as compared to a group of similarly managed funds selected by an independent data provider.
After reviewing the foregoing information, and in light of the nature, extent and quality of the services provided by the Adviser, the Board concluded that the management fees charged for advisory and related services and the Fund's total expense ratio are reasonable.
Profitability
The Board reviewed the level of profits realized by the Adviser and relevant affiliates thereof in providing investment advisory and administrative services to the Portfolio, the Fund and to all Eaton Vance Funds as a group. The Board considered the level of profits realized without regard to revenue sharing or other payments by the Adviser and its affiliates to third parties in respect of distribution services. The Board also considered other direct or indirect benefits received by the Adviser and its affiliates in connection with its relationship with the Portfolio and the Fund, including the benefits of research services that may be available to the Adviser as a result of securities transactions effected for the Portfolio and other advisory clients.
The Board concluded that, in light of the foregoing factors and the nature, extent and quality of the services rendered, the profits realized by the Adviser and its affiliates are reasonable.
Economies of Scale
In reviewing management fees and profitability, the Board also considered the extent to which the Adviser and its affiliates, on the one hand, and the Fund, on the other hand, can expect to realize benefits from economies of scale as the assets of the Fund and the Portfolio increase. The Board acknowledged the difficulty in accurately measuring the benefits resulting from the economies of scale with respect to the management of any specific fund or group of funds. The Board reviewed data summarizing the increases and decreases in the assets of the Fund and of all Eaton Vance Funds as a group over various time periods, and evaluated the extent to which the total expense ratio of the Fund and the profitability of the Adviser and its affiliates may have been affected by such increases or decreases. The Board noted that, at its request, the Adviser had agreed to add a breakpoint with respect to assets that exceed $20 billion. Based upon the foregoing, the Board concluded that the benefits from economies of scale are currently being shared equitably by the Adviser and its affiliates and the Fund. The Board also concluded that, assuming reasonably foreseeable increases in the assets of the Portfolio, the structure of the advisory fee, which includes breakpoints at several asset levels, can be expected to cause the Adviser and its affiliates and the Fund to continue to share such benefits equitably.
39
Eaton Vance Tax-Managed Growth Fund 1.1
MANAGEMENT AND ORGANIZATION
Fund Management. The Trustees of Eaton Vance Mutual Funds Trust (the Trust) and Tax-Managed Growth Portfolio (the Portfolio) are responsible for the overall management and supervision of the Trust's and Portfolio's affairs. The Trustees and officers of the Trust and the Portfolio are listed below. Except as indicated, each individual has held the office shown or other offices in the same company for the last five years. Trustees and officers of the Trust and the Portfolio hold indefinite terms of office. The "noninterested Trustees" consist of those Trustees who are not "interested persons" of the Trust and the Portfolio, as that term is defined under the 1940 Act. The business address of each Trustee and officer is The Eaton Vance Building, 255 State Street, Boston, Massachusetts 02109. As used below, "EVC" refers to Eaton Vance Corp., "EV" refers to Eaton Vance, Inc., "EVM" refers to Eaton Vance Management, "BMR" refers to Boston Management and Research, "EVD" refers to Eaton Vance Distributors, Inc. and "Parametric" refers to Parametric Portfolio Associates. EVC and EV are the corporate parent and trustee, respectively, of EVM and BMR. EVD is the Fund's principal underwriter, the Portfolio's placement agent and a wholly-owned subsidiary of EVM. Each officer affiliated with Eaton Vance may hold a position with other Eaton Vance affiliates that is comparable to his or her position with EVM listed below.
Name and
Date of Birth | | Position(s)
with the
Trust and the
Portfolio | | Term of
Office and
Length of
Service | | Principal Occupation(s)
During Past Five Years | | Number of Portfolios
in Fund Complex
Overseen By
Trustee(1) | | Other Directorships Held | |
| Interested Trustee | | | | | | | | | | | | | |
|
| James B. Hawkes 11/9/41 | | Trustee | | Trustee of the Trust since 1991 and of the Portfolio since 1997 | | Chairman and Chief Executive Officer of EVC, BMR, EVM and EV; Director of EV; Vice President and Director of EVD. Trustee and/or officer of 170 registered investment companies in the Eaton Vance Fund Complex. Mr. Hawkes is an interested person because of his positions with BMR, EVM, EVC and EV, which are affiliates of the Trust and Portfolio. | | | 170 | | | Director of EVC | |
|
| Noninterested Trustee(s) | | | | | | | | | | | | | |
|
| Benjamin C. Esty 1/2/63 | | Trustee | | Since 2005 | | Roy and Elizabeth Simmons Professor of Business Administration, Harvard University Graduate School of Business Administration (since 2003). Formerly, Associate Professor, Harvard University Graduate School of Business Administration (2000-2003). | | | 170 | | | None | |
|
| Samuel L. Hayes, III 2/23/35 | | Trustee and Chairman of the Board | | Trustee of the Trust since 1986; of the Portfolio since 1995 and Chairman of the Board since 2005 | | Jacob H. Schiff Professor of Investment Banking Emeritus, Harvard University Graduate School of Business Administration. Director of Yakima Products, Inc. (manufacturer of automotive accessories) (since 2001) and Director of Telect, Inc. (telecommunications services company). | | | 170 | | | Director of Tiffany & Co. (specialty retailer) | |
|
| William H. Park 9/19/47 | | Trustee | | Since 2003 | | Vice Chairman, Commercial Industrial Finance Corp. (specialty finance company) (since 2006). Formerly, President and Chief Executive Officer, Prizm Capital Management, LLC (investment management firm) (2002-2005). Formerly, Executive Vice President and Chief Financial Officer, United Asset Management Corporation (a holding company owning institutional investment management firms) (1982-2001). | | | 170 | | | None | |
|
| Ronald A. Pearlman 7/10/40 | | Trustee | | Since 2003 | | Professor of Law, Georgetown University Law Center. | | | 170 | | | None | |
|
| Norton H. Reamer 9/21/35 | | Trustee | | Trustee of the Trust since 1986 and of the Portfolio since 1995 | | President, Chief Executive Officer and a Director of Asset Management Finance Corp. (a specialty finance company serving the investment management industry) (since October 2003). President, Unicorn Corporation (an investment and financial advisory services company) (since September 2000). Formerly, Chairman and Chief Operating Officer, Hellman, Jordan Management Co., Inc. (an investment management company) (2000-2003). Formerly, Advisory Director of Berkshire Capital Corporation (investment banking firm) (2002-2003). | | | 170 | | | None | |
|
40
Eaton Vance Tax-Managed Growth Fund 1.1
MANAGEMENT AND ORGANIZATION CONT'D
Name and
Date of Birth | | Position(s)
with the
Trust and the
Portfolio | | Term of
Office and
Length of
Service | | Principal Occupation(s)
During Past Five Years | | Number of Portfolios
in Fund Complex
Overseen By
Trustee(1) | | Other Directorships Held | |
| Noninterested Trustee(s) (continued) | | | | | | | | | | | |
|
| Lynn A. Stout 9/14/57 | | Trustee | | Trustee of the Trust since 1998 and of the Portfolio since 2003 | | Professor of Law, University of California at Los Angeles School of Law. | | | 170 | | | None | |
|
| Ralph F. Verni 1/26/43 | | Trustee | | Since 2005 | | Consultant and private investor. | | | 170 | | | None | |
|
| Principal Officers who are not Trustees | | | | | | | | | | | |
|
Name and
Date of Birth | | Position(s)
with the
Trust and the
Portfolio | | Term of
Office and
Length of
Service | | Principal Occupation(s)
During Past Five Years | |
| Thomas E. Faust Jr. 5/31/58 | | President of the Trust and Vice President of the Portfolio | | Since 2002 | | President of EVC, EVM, BMR and EV and Director of EVC. Chief Investment Officer of EVC, EVM and BMR. Officer of 71 registered investment companies and 5 private investment companies managed by EVM or BMR. | |
|
| William H. Ahern, Jr. 7/28/59 | | Vice President of the Trust | | Since 1995 | | Vice President of EVM and BMR. Officer of 71 registered investment companies managed by EVM or BMR. | |
|
| Cynthia J. Clemson 3/2/63 | | Vice President of the Trust | | Since 2005 | | Vice President of EVM and BMR. Officer of 86 registered investment companies managed by EVM or BMR. | |
|
| Aamer Khan 6/7/60 | | Vice President of the Trust | | Since 2005 | | Vice President of EVM and BMR. Officer of 29 register investment companies managed by EVM or BMR. | |
|
| Thomas H. Luster 4/8/62 | | Vice President of the Trust | | Since 2006 | | Vice President of EVM and BMR. Officer of 45 registered investment companies managed by EVM or BMR. | |
|
| Michael R. Mach 7/15/47 | | Vice President of the Trust | | Since 1999 | | Vice President of EVM and BMR. Officer of 51 registered investment companies managed by EVM or BMR. | |
|
| Robert B. MacIntosh 1/22/57 | | Vice President of the Trust | | Since 1998 | | Vice President of EVM and BMR. Officer of 86 registered investment companies managed by EVM or BMR. | |
|
| Lewis R. Piantedosi 8/10/65 | | Vice President of the Portfolio | | Since 2006 | | Vice President of EVM and BMR. Officer of 5 registered investment companies managed by EVM or BMR. | |
|
| Cliff Quisenberry, Jr. 1/1/65 | | Vice President of the Trust | | Since 2006 | | Vice President and Director of Research and Product Development of Parametric. Officer of 30 registered investment companies managed by EVM or BMR. | |
|
| Duncan W. Richardson 10/26/57 | | Vice President of the Trust and President of the Portfolio | | Vice President of the Trust since 2001 and President of the Portfolio since 2002(2) | | Executive Vice President and Chief Equity Investment Officer of EVC, EVM and BMR. Officer of 71 registered investment companies managed by EVM or BMR. | |
|
| Walter A. Row, III 7/20/57 | | Vice President of the Trust | | Since 2001 | | Director of Equity Research and a Vice President of EVM and BMR. Officer of 33 registered investment companies managed by EVM or BMR. | |
|
| Judith A. Saryan 8/21/54 | | Vice President of the Trust | | Since 2003 | | Vice President of EVM and BMR. Officer of 50 registered investment companies managed by EVM or BMR. | |
|
| Susan Schiff 3/13/61 | | Vice President of the Trust | | Since 2002 | | Vice President of EVM and BMR. Officer of 30 registered investment companies managed by EVM or BMR. | |
|
| Barbara E. Campbell 6/19/57 | | Treasurer of the Trust | | Since 2005(2) | | Vice President of EVM and BMR. Officer of 170 registered investment companies managed by EVM or BMR. | |
|
| Alan R. Dynner 10/10/40 | | Secretary | | Since 1997 | | Vice President, Secretary and Chief Legal Officer of BMR, EVM, EVD, EV and EVC. Officer of 170 registered investment companies managed by EVM or BMR. | |
|
41
Eaton Vance Tax-Managed Growth Fund 1.1
MANAGEMENT AND ORGANIZATION CONT'D
Name and
Date of Birth | | Position(s)
with the
Trust and the
Portfolio | | Term of
Office and
Length of
Service | | Principal Occupation(s)
During Past Five Years | |
| Principal Officers who are not Trustees (continued) | | | | | | | |
|
| Michelle A. Green 8/25/69 | | Treasurer of the Portfolio | | Since 2002(2) | | Vice President of EVM and BMR. Officer of 63 registered investment companies managed by EVM or BMR. | |
|
| Paul M. O'Neil 7/11/53 | | Chief Compliance Officer | | Since 2004 | | Vice President of EVM and BMR. Officer of 170 registered investment companies managed by EVM or BMR. | |
|
(1) Includes both master and feeder funds in a master-feeder structure.
(2) Prior to 2002, Ms. Green served as Assistant Treasurer of the Portfolio since 1998 and Mr. Richardson served as Vice President of the Portfolio since 1995. Prior to 2005, Ms. Campbell served as Assistant Treasurer of the Trust since 1995.
The SAI for the Fund includes additional information about the Trustees and officers of the Fund and the Portfolio and can be obtained without charge at Eaton Vance's website at www.eatonvance.com or by calling 1-800-225-6265.
42
This Page Intentionally Left Blank
This Page Intentionally Left Blank
Investment Adviser of Tax-Managed Growth Portfolio
Boston Management and Research
The Eaton Vance Building
255 State Street
Boston, MA 02109
Administrator of Eaton Vance Tax-Managed Growth Fund 1.1
Eaton Vance Management
The Eaton Vance Building
255 State Street
Boston, MA 02109
Principal Underwriter
Eaton Vance Distributors, Inc.
The Eaton Vance Building
255 State Street
Boston, MA 02109
(617) 482-8260
Custodian
Investors Bank & Trust Company
200 Clarendon Street
Boston, MA 02116
Transfer Agent
PFPC Inc.
Attn: Eaton Vance Funds
P.O. Box 9653
Providence, RI 02940-9653
(800) 262-1122
Independent Registered Public Accounting Firm
Deloitte & Touche LLP
200 Berkeley Street
Boston, MA 02116-5022
Eaton Vance Tax-Managed Growth Fund 1.1
The Eaton Vance Building
255 State Street
Boston, MA 02109
This report must be preceded or accompanied by a current prospectus. Before investing, investors should consider carefully the Fund's investment objective(s), risks, and charges and expenses. The Fund's current prospectus contains this and other information about the Fund and is available through your financial advisor. Please read the prospectus carefully before you invest or send money. For further information please call 1-800-225-6265.
1096-2/07 TGSRC1.1

Annual Report December 31, 2006


EATON VANCE
TAX-MANAGED
GROWTH
FUND
1.2
IMPORTANT NOTICES REGARDING PRIVACY,
DELIVERY OF SHAREHOLDER DOCUMENTS,
PORTFOLIO HOLDINGS, AND PROXY VOTING
Privacy. The Eaton Vance organization is committed to ensuring your financial privacy. Each of the financial institutions identified below has in effect the following policy ("Privacy Policy") with respect to nonpublic personal information about its customers:
• Only such information received from you, through application forms or otherwise, and information about your Eaton Vance fund transactions will be collected. This may include information such as name, address, social security number, tax status, account balances and transactions.
• None of such information about you (or former customers) will be disclosed to anyone, except as permitted by law (which includes disclosure to employees necessary to service your account). In the normal course of servicing a customer's account, Eaton Vance may share information with unaffiliated third parties that perform various required services such as transfer agents, custodians and broker/dealers.
• Policies and procedures (including physical, electronic and procedural safeguards) are in place that are designed to protect the confidentiality of such information.
• We reserve the right to change our Privacy Policy at any time upon proper notification to you. Customers may want to review our Policy periodically for changes by accessing the link on our homepage: www.eatonvance.com.
Our pledge of privacy applies to the following entities within the Eaton Vance organization: the Eaton Vance Family of Funds, Eaton Vance Management, Eaton Vance Investment Counsel, Boston Management and Research, and Eaton Vance Distributors, Inc.
In addition, our Privacy Policy only applies to those Eaton Vance customers who are individuals and who have a direct relationship with us. If a customer's account (i.e., fund shares) is held in the name of a third-party financial adviser/broker-dealer, it is likely that only such adviser's privacy policies apply to the customer. This notice supersedes all previously issued privacy disclosures.
For more information about Eaton Vance's Privacy Policy, please call 1-800-262-1122.
Delivery of Shareholder Documents. The Securities and Exchange Commission (the "SEC") permits funds to deliver only one copy of shareholder documents, including prospectuses, proxy statements and shareholder reports, to fund investors with multiple accounts at the same residential or post office box address. This practice is often called "householding" and it helps eliminate duplicate mailings to shareholders.
Eaton Vance, or your financial adviser, may household the mailing of your documents indefinitely unless you instruct Eaton Vance, or your financial adviser, otherwise.
If you would prefer that your Eaton Vance documents not be householded, please contact Eaton Vance at 1-800-262-1122, or contact your financial adviser.
Your instructions that householding not apply to delivery of your Eaton Vance documents will be effective within 30 days of receipt by Eaton Vance or your financial adviser.
Portfolio Holdings. Each Eaton Vance Fund and its underlying Portfolio (if applicable) will file a schedule of its portfolio holdings on Form N-Q with the SEC for the first and third quarters of each fiscal year. The Form N-Q will be available on the Eaton Vance website www.eatonvance.com, by calling Eaton Vance at 1-800-262-1122 or in the EDGAR database on the SEC's website at www.sec.gov. Form N-Q may also be reviewed and copied at the SEC's public reference room in Washington, D.C. (call 1-800-732-0330 for information on the operation of the public reference room).
Proxy Voting. From time to time, funds are required to vote proxies related to the securities held by the funds. The Eaton Vance Funds or their underlying Portfolios (if applicable) vote proxies according to a set of policies and procedures approved by the Funds' and Portfolios' Boards. You may obtain a description of these policies and procedures and information on how the Funds or Portfolios voted proxies relating to portfolio securities during the most recent 12 month period ended June 30, without charge, upon request, by calling 1-800-262-1122. This description is also available on the SEC's website at www.sec.gov.
Eaton Vance Tax-Managed Growth Fund 1.2 as of December 31, 2006
management’s discussion of fund performance

Lewis R. Piantedosi
Co-Portfolio Manager

Duncan W. Richardson, CFA
Co-Portfolio Manager
The Fund
Performance for the Past Year
· For the year ended December 31, 2006, Eaton Vance Tax-Managed Growth Fund 1.2 (the Fund) Class A shares had a total return of 13.07%. This return was the result of an increase in net asset value (NAV) per share to $11.77 on December 31, 2006, from $10.50 on December 31, 2005, and the reinvestment of $0.103 per share in dividends.(1)
· The Fund’s Class B shares had a total return of 12.17% during the same period, the result of an increase in NAV per share to $11.46 on December 31, 2006, from $10.23 on December 31, 2005, and the reinvestment of $0.015 per share in dividends.(1)
· The Fund’s Class C shares had a total return of 12.32% during the same period, the result of an increase in NAV per share to $11.47 on December 31, 2006, from $10.23 on December 31, 2005, and the reinvestment of $0.020 per share in dividends.(1)
· The Fund’s Class I shares had a total return of 13.41% during the same period, the result of an increase in NAV per share to $11.79 on December 31, 2006, from $10.51 on December 31, 2005, and the reinvestment of $0.131 per share in dividends.(1)
· For comparison, the S&P 500 Index – a broad-based, unmanaged market index commonly used as a measure of overall U.S. stock market performance – had a total return of 15.78% for the same period. The Lipper Large-Cap Core Classification had a total return of 13.53% for the same period.(2)
See pages 3 and 4 for more performance information, including after-tax returns.
Management Discussion
· The year ended December 31, 2006 marked another impressive year for equities as broad U.S. markets locked in a fourth consecutive annual gain. Helping fuel the rally were easing inflation and housing concerns, as well as declining oil prices and a continued pause in interest rate increases. Record levels of mergers and private equity activity further supported higher stock prices during the year, as did better than expected earnings and profit results. Price gains for the year were broad-based, but of particular note were the double digit gains realized by the blue chip Dow Industrial Average and the S&P 500 Index.
· For the year ended December 31, 2006, each of the 10 major sectors included in the S&P 500 Index registered positive returns. Telecommunications, energy and utilities were top performing S&P 500 Index sectors during the year, while the health care and information technology sectors had the weakest performance. Market leading industries of 2006 included diversified telecommunications, real estate investment trusts and investment bank and brokerage. In contrast, internet and catalog retailers, biotechnology and educational service industries realized weaker returns for the year. During the course of the year, on average, small-cap stocks outperformed large-cap stocks and the value investment style continued to lead growth.
· The Fund invests its assets in Tax-Managed Growth Portfolio (the Portfolio), a separate registered investment company with the same objective and investment policies as the Fund. The Portfolio in turn invests primarily in common stocks of established growth companies. The Fund underperformed its benchmark due in part to differences in sector allocation and stock selection in the Portfolio versus the S&P 500 Index.
(1) These returns do not include the 5.75% maximum sales charge for Class A shares or the applicable contingent deferred sales charge (CDSC) for Class B and Class C shares. If sales charges were deducted, the returns would be lower. Class I shares are offered to certain investors at net asset value.
(2) It is not possible to invest directly in an Index or a Lipper Classification. The Index’s total return does not reflect commissions or expenses that would have been incurred if an investor individually purchased or sold the securities represented in the Index. The Lipper Classification return shown is the average total return, at net asset value, of the funds that are in the same Lipper Classification as the Fund.
Fund shares are not insured by the FDIC and are not deposits or other obligations of, or guaranteed by, any depository institution. Shares are subject to investment risks, including possible loss of principal invested.
Past performance is no guarantee of future results. Returns are historical and are calculated by determining the percentage change in net asset value or offering price (as applicable) with all distributions reinvested. Investment return and principal value will fluctuate so that shares, when redeemed, may be worth more or less than their original cost. Performance is for the stated time period only; due to market volatility, the Fund’s current performance may be lower or higher than the quoted return. For performance as of the most recent month-end, please refer to www.eatonvance.com.
1
· During the year ended December 31, 2006, the Portfolio remained overweight in the industrials, consumer staples and consumer discretionary sectors, while continuing to underweight the technology, telecommunications and utilities sectors. The Portfolio benefited from its emphasis of the strong performing energy and consumer discretionary sectors and relatively stronger investment selection within commercial banks and metals and mining versus the S&P 500 Index. The Portfolio’s underweight of the technology sector was also helpful, particularly within the semi-conductor and internet software industries, as stocks in those sectors experienced significant declines over the course of the year.
· During the year ended December 31, 2006, the Portfolio’s de-emphasis of high dividend yielding stocks, such as those in the utilities and telecommunications sectors, hurt performance, as did the weak performance of certain Portfolio holdings in the health care and consumer staples sectors. Despite positive performance from holdings in the air freight and machinery stocks industries, the Portfolio’s overweight of the lagging industrials sector negatively impacted returns.
Ten Largest Holdings*
By net assets
Exxon Mobil Corp. | | 2.64 | % |
General Electric Co. | | 2.37 | % |
Procter & Gamble Co. | | 2.34 | % |
American International Group | | 2.22 | % |
ConocoPhillips | | 2.17 | % |
Pepsico Inc. | | 1.90 | % |
BP PLC Spons ADR | | 1.68 | % |
Deere & Co. | | 1.55 | % |
Amgen Inc. | | 1.47 | % |
Danaher Corp. | | 1.44 | % |
Common Stock Investments by Sector**
By net assets
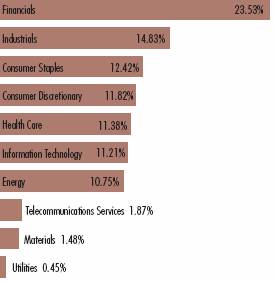
* Ten Largest Holdings represented 19.78% of Portfolio net assets as of December 31, 2006. Holdings are subject to change due to active management.
** As a percentage of the Portfolio’s net assets as of December 31, 2006. Portfolio information may not be representative of current or future investments and may change due to active management.
The views expressed throughout this report are those of the portfolio managers and are current only through the end of the period of the report as stated on the cover. These views are subject to change at any time based upon market or other conditions, and the investment adviser disclaims any responsibility to update such views. These views may not be relied on as investment advice and, because investment decisions for a fund are based on many factors, may not be relied on as an indication of trading intent on behalf of any Eaton Vance fund.
2
Eaton Vance Tax-Managed Growth Fund 1.2 as of December 31, 2006
fund performance
The line graphs and table set forth below provide information about the Fund’s performance. The line graphs compare the performance of each class of the Fund with that of the S&P 500 Index, a broad-based, unmanaged market index commonly used as a measure of U.S. stock market performance. The lines on the graphs represent the total returns of a hypothetical investment of $10,000 in each of Class A, Class B, Class C, Class I and the S&P 500 Index. Class A total returns are presented at net asset value and maximum public offering price. The table includes the total returns of each Class of the Fund at net asset value and public offering price. The performance presented below does not reflect the deduction of taxes, if any, that a shareholder would pay on distributions or redemptions of Fund shares.
† Inception Dates – Class A, Class B, Class C, and Class I: 2/28/01
* Average annual total returns do not include the 5.75% maximum sales charge for Class A shares or the applicable contingent deferred sales charge (CDSC) for Class B and Class C shares. If sales charges were deducted, the returns would be lower. SEC average annual total returns for Class A reflect the maximum 5.75% sales charge. SEC returns for Class B reflect the applicable CDSC based on the following schedule: 5% - 1st and 2nd years; 4% - 3rd year; 3% - 4th year; 2% - 5th year; 1% - 6th year. SEC returns for Class C reflect a 1% CDSC for the first year. Class I shares are sold at net asset value and do not have a sales charge.
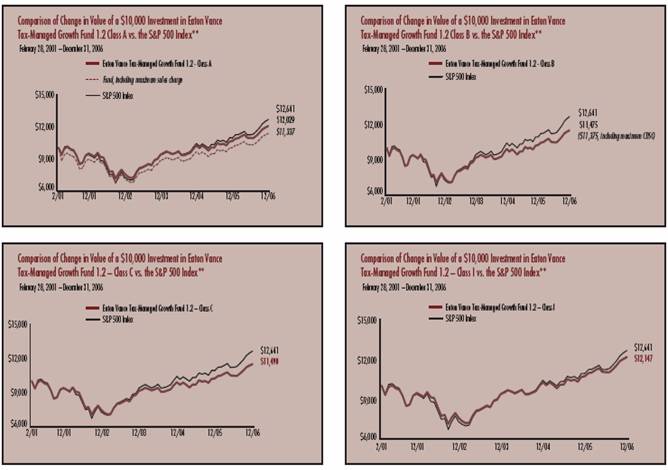
** Source: Thomson Financial. Class A, Class B, Class C and Class I of the Fund commenced investment operations on 2/28/01. It is not possible to invest directly in an Index. The Index’s total returns do not reflect any commissions or expenses that would have been incurred if an investor individually purchased or sold the securities represented in the Index.
Past performance is no guarantee of future results. Returns are historical and are calculated by determining the percentage change in net asset value or offering price (as applicable) with all distributions reinvested. Investment return and principal value will fluctuate so that shares, when redeemed, may be worth more or less than their original cost. Performance is for the stated time period only; due to market volatility, the Fund’s current performance may be lower or higher than the quoted return. For performance as of the most recent month-end, please refer to www.eatonvance.com.
3
“Return Before Taxes” does not take into consideration shareholder taxes. It is most relevant to tax-free or tax-deferred shareholder accounts. “Return After Taxes on Distributions” reflects the impact of federal income taxes due on Fund distributions of dividends and capital gains. It is most relevant to taxpaying shareholders who continue to hold their shares. “Return After Taxes on Distributions and Sale of Fund Shares” also reflects the impact of taxes on capital gain or loss realized upon a sale of shares. It is most relevant to taxpaying shareholders who sell their shares.
Average Annual Total Returns
(For the periods ended December 31, 2006)
Returns at Net Asset Value (NAV) (Class A)
| | One Year | | Life of Fund | |
Return Before Taxes | | 13.07 | % | 3.21 | % |
Return After Taxes on Distributions | | 12.92 | % | 3.16 | % |
Return After Taxes on Distributions and Sale of Fund Shares | | 8.69 | % | 2.76 | % |
Returns at Public Offering Price (POP) (Class A)
| | One Year | | Life of Fund | |
Return Before Taxes | | 6.57 | % | 2.17 | % |
Return After Taxes on Distributions | | 6.44 | % | 2.12 | % |
Return After Taxes on Distributions and Sale of Fund Shares | | 4.46 | % | 1.86 | % |
Average Annual Total Returns
(For the periods ended December 31, 2006)
Returns at Net Asset Value (NAV) (Class C)
| | One Year | | Life of Fund | |
Return Before Taxes | | 12.32 | % | 2.41 | % |
Return After Taxes on Distributions | | 12.29 | % | 2.40 | % |
Return After Taxes on Distributions and Sale of Fund Shares | | 8.05 | % | 2.06 | % |
Returns at Public Offering Price (POP) (Class C)
| | One Year | | Life of Fund | |
Return Before Taxes | | 11.32 | % | 2.41 | % |
Return After Taxes on Distributions | | 11.29 | % | 2.40 | % |
Return After Taxes on Distributions and Sale of Fund Shares | | 7.40 | % | 2.06 | % |
Average Annual Total Returns
(For the periods ended December 31, 2006)
Returns at Net Asset Value (NAV) (Class B)
| | One Year | | Life of Fund | |
Return Before Taxes | | 12.17 | % | 2.38 | % |
Return After Taxes on Distributions | | 12.15 | % | 2.38 | % |
Return After Taxes on Distributions and Sale of Fund Shares | | 7.94 | % | 2.04 | % |
Returns at Public Offering Price (POP) (Class B)
| | One Year | | Life of Fund | |
Return Before Taxes | | 7.17 | % | 2.23 | % |
Return After Taxes on Distributions | | 7.15 | % | 2.23 | % |
Return After Taxes on Distributions and Sale of Fund Shares | | 4.69 | % | 1.91 | % |
Average Annual Total Returns
(For the periods ended December 31, 2006)
Returns at Net Asset Value (NAV) (Class I)
| | One Year | | Life of Fund | |
Return Before Taxes | | 13.41 | % | 3.39 | % |
Return After Taxes on Distributions | | 13.23 | % | 3.31 | % |
Return After Taxes on Distributions and Sale of Fund Shares | | 8.97 | % | 2.91 | % |
Class A, Class B, Class C, and Class I of the Fund commenced operations on 2/28/01. Returns at Public Offering Price (POP) reflect the deduction of the maximum initial sales charge and applicable CDSC, while Returns at Net Asset Value (NAV) do not.
After-tax returns are calculated using the highest historical individual federal income tax rate and do not reflect the impact of state and local taxes. Actual after-tax returns depend on a shareholder’s tax situation and may differ from those shown. After-tax returns are not relevant for shareholders who hold Fund shares in tax-deferred accounts or to shares held by non-taxable entities. Return After Taxes on Distributions for a period may be the same as Return Before Taxes for that period because no distributions were paid during that period, or because the taxable portion of distributions made during the period was insignificant. Also, Return After Taxes on Distributions and Sale of Fund Shares for a period may be greater than Return After Taxes on Distributions for the same period because of realized losses on the sale of Fund shares.
Past performance is no guarantee of future results. Returns are historical and are calculated by determining the percentage change in net asset value or offering price (as applicable) with all distributions reinvested. Investment return and principal value will fluctuate so that shares, when redeemed, may be worth more or less than their original cost. Performance is for the stated time period only; due to market volatility, the Fund’s current performance may be lower or higher than the quoted return. For performance as of the most recent month end, please refer to www.eatonvance.com.
4
Eaton Vance Tax-Managed Growth Fund 1.2 as of December 31, 2006
FUND EXPENSES
Example: As a shareholder of the Fund, you incur two types of costs: (1) transaction costs, including sales charges (loads) on purchases and redemption fees (if applicable); and (2) ongoing costs, including management fees; distribution or service fees; and other Fund expenses. This Example is intended to help you understand your ongoing costs (in dollars) of investing in the Fund and to compare these costs with the ongoing costs of investing in other mutual funds. The Example is based on an investment of $1,000 invested at the beginning of the period and held for the entire period (July 1, 2006 – December 31, 2006).
Actual Expenses: The first section of the table below provides information about actual account values and actual expenses. You may use the information in this section, together with the amount you invested, to estimate the expenses that you paid over the period. Simply divide your account value by $1,000 (for example, an $8,600 account value divided by $1,000 = 8.6), then multiply the result by the number in the first section under the heading entitled "Expenses Paid During Period" to estimate the expenses you paid on your account during this period.
Hypothetical Example for Comparison Purposes: The second section of the table below provides information about hypothetical account values and hypothetical expenses based on the actual Fund expense ratio and an assumed rate of return of 5% per year (before expenses), which is not the actual return of the Fund. The hypothetical account values and expenses may not be used to estimate the actual ending account balance or expenses you paid for the period. You may use this information to compare the ongoing costs of investing in your Fund and other funds. To do so, compare this 5% hypothetical example with the 5% hypothetical examples that appear in the shareholder reports of the other funds.
Please note that the expenses shown in the table are meant to highlight your ongoing costs only and do not reflect any transactional costs, such as sales charges (loads) or redemption fees (if applicable). Therefore, the second section of the table is useful in comparing ongoing costs only, and will not help you determine the relative total costs of owning different funds. In addition, if these transactional costs were included, your costs would have been higher.
Eaton Vance Tax-Managed Growth Fund 1.2
| | | Beginning Account Value
(7/1/06) | | Ending Account Value
(12/31/06) | | Expenses Paid During Period*
(7/1/06 - 12/31/06) | |
| Actual | |
| Class A | | $ | 1,000.00 | | | $ | 1,101.30 | | | $ | 5.14 | | |
| Class B | | $ | 1,000.00 | | | $ | 1,097.00 | | | $ | 9.09 | | |
| Class C | | $ | 1,000.00 | | | $ | 1,097.40 | | | $ | 9.09 | | |
| Class I | | $ | 1,000.00 | | | $ | 1,102.70 | | | $ | 3.82 | | |
| Hypothetical | |
| (5% return per year before expenses) | |
| Class A | | $ | 1,000.00 | | | $ | 1,020.30 | | | $ | 4.94 | | |
| Class B | | $ | 1,000.00 | | | $ | 1,016.50 | | | $ | 8.74 | | |
| Class C | | $ | 1,000.00 | | | $ | 1,016.50 | | | $ | 8.74 | | |
| Class I | | $ | 1,000.00 | | | $ | 1,021.60 | | | $ | 3.67 | | |
* Expenses are equal to the Fund's annualized expense ratio of 0.97% of Class A shares, 1.72% for Class B shares, 1.72% for Class C shares, and 0.72% for Class I shares multiplied by the average account value over the period, multiplied by 184/365 (to reflect the one-half year period). The Example assumes that the $1,000 was invested at the net asset value per share determined at the close of business on June 30, 2006. The Example reflects the expenses of both the Fund and the Portfolio.
5
Eaton Vance Tax-Managed Growth Fund 1.2 as of December 31, 2006
FINANCIAL STATEMENTS
Statement of Assets and Liabilities
As of December 31, 2006
| Assets | |
Investment in Tax-Managed Growth Portfolio,
at value (identified cost, $964,477,526) | | $ | 1,353,877,657 | | |
| Receivable for Fund shares sold | | | 1,684,191 | | |
| Total assets | | $ | 1,355,561,848 | | |
| Liabilities | |
| Payable for Fund shares redeemed | | $ | 1,788,662 | | |
| Payable to affiliate for distribution and service fees | | | 1,124,173 | | |
| Payable to affiliate for administration fee | | | 172,024 | | |
| Payable to affiliate for Trustees' fees | | | 1,776 | | |
| Other accrued expenses | | | 386,053 | | |
| Total liabilities | | $ | 3,472,688 | | |
| Net Assets | | $ | 1,352,089,160 | | |
| Sources of Net Assets | |
| Paid-in capital | | $ | 1,081,001,185 | | |
Accumulated net realized loss from Portfolio
(computed on the basis of identified cost) | | | (118,320,392 | ) | |
| Accumulated undistributed net investment income | | | 8,236 | | |
Net unrealized appreciation from Portfolio
(computed on the basis of identified cost) | | | 389,400,131 | | |
| Total | | $ | 1,352,089,160 | | |
| Class A Shares | |
| Net Assets | | $ | 661,149,440 | | |
| Shares Outstanding | | | 56,192,045 | | |
Net Asset Value and Redemption Price Per Share
(net assets ÷ shares of beneficial interest outstanding) | | $ | 11.77 | | |
Maximum Offering Price Per Share
(100 ÷ 94.25 of $11.77) | | $ | 12.49 | | |
| Class B Shares | |
| Net Assets | | $ | 327,224,177 | | |
| Shares Outstanding | | | 28,545,441 | | |
Net Asset Value, Offering Price and Redemption Price Per Share
(net assets ÷ shares of beneficial interest outstanding) | | $ | 11.46 | | |
| Class C Shares | |
| Net Assets | | $ | 351,953,714 | | |
| Shares Outstanding | | | 30,696,122 | | |
Net Asset Value, Offering Price and Redemption Price Per Share
(net assets ÷ shares of beneficial interest outstanding) | | $ | 11.47 | | |
| Class I Shares | |
| Net Assets | | $ | 11,761,829 | | |
| Shares Outstanding | | | 997,704 | | |
Net Asset Value, Offering Price and Redemption Price Per Share
(net assets ÷ shares of beneficial interest outstanding) | | $ | 11.79 | | |
| On sales of $50,000 or more, the offering price of Class A shares is reduced. | |
Statement of Operations
For the Year Ended
December 31, 2006
| Investment Income | |
| Dividends allocated from Portfolio (net of foreign taxes, $325,936) | | $ | 24,011,404 | | |
| Interest allocated from Portfolio | | | 180,912 | | |
| Security lending income allocated from Portfolio, net | | | 30,680 | | |
| Expenses allocated from Portfolio | | | (5,869,587 | ) | |
| Net investment income from Portfolio | | $ | 18,353,409 | | |
| Expenses | |
| Administration fee | | $ | 1,972,183 | | |
| Trustees' fees and expenses | | | 3,735 | | |
| Distribution and service fees | |
| Class A | | | 1,575,781 | | |
| Class B | | | 3,337,853 | | |
| Class C | | | 3,431,159 | | |
| Transfer and dividend disbursing agent fees | | | 966,620 | | |
| Printing and postage | | | 152,940 | | |
| Legal and accounting services | | | 63,736 | | |
| Registration fees | | | 48,924 | | |
| Custodian fee | | | 35,781 | | |
| Miscellaneous | | | 57,366 | | |
| Total expenses | | $ | 11,646,078 | | |
| Net investment income | | $ | 6,707,331 | | |
Realized and Unrealized
Gain (Loss) from Portfolio | |
Net realized gain (loss) —
Investment transactions (identified cost basis) | | $ | 45,815,863 | | |
| Foreign currency transactions | | | (1,594 | ) | |
| Net realized gain | | $ | 45,814,269 | | |
Change in unrealized appreciation (depreciation) —
Investments (identified cost basis) | | $ | 104,351,789 | | |
| Foreign currency | | | 7,080 | | |
| Net change in unrealized appreciation (depreciation) | | $ | 104,358,869 | | |
| Net realized and unrealized gain | | $ | 150,173,138 | | |
| Net increase in net assets from operations | | $ | 156,880,469 | | |
See notes to financial statements
6
Eaton Vance Tax-Managed Growth Fund 1.2 as of December 31, 2006
FINANCIAL STATEMENTS CONT'D
Statements of Changes in Net Assets
Increase (Decrease)
in Net Assets | | Year Ended
December 31, 2006 | | Year Ended
December 31, 2005* | |
From operations —
Net investment income | | $ | 6,707,331 | | | $ | 4,486,251 | | |
Net realized gain from investment
transactions, securities sold short
and foreign currency transactions | | | 45,814,269 | | | | 7,696,413 | | |
Net change in unrealized appreciation
(depreciation) of investments,
securities sold short and
foreign currency | | | 104,358,869 | | | | 36,705,773 | | |
| Net increase in net assets from operations | | $ | 156,880,469 | | | $ | 48,888,437 | | |
Distributions to shareholders —
From net investment income
Class A | | $ | (5,734,627 | ) | | $ | (4,179,909 | ) | |
| Class B | | | (436,872 | ) | | | — | | |
| Class C | | | (622,358 | ) | | | — | | |
| Class I | | | (92,002 | ) | | | (74,216 | ) | |
| Total distributions to shareholders | | $ | (6,885,859 | ) | | $ | (4,254,125 | ) | |
Transactions in shares of beneficial interest —
Proceeds from sale of shares
Class A | | $ | 80,178,914 | | | $ | 118,817,572 | | |
| Class B | | | 7,395,494 | | | | 15,972,605 | | |
| Class C | | | 26,573,897 | | | | 40,660,194 | | |
| Class I | | | 8,173,547 | | | | 2,023,194 | | |
Net asset value of shares issued to
shareholders in payment of
distributions declared
Class A | | | 4,440,912 | | | | 3,261,058 | | |
| Class B | | | 352,225 | | | | — | | |
| Class C | | | 441,549 | | | | — | | |
| Class I | | | 42,840 | | | | 39,945 | | |
Cost of shares redeemed
Class A | | | (138,073,285 | ) | | | (178,788,632 | ) | |
| Class B | | | (64,758,009 | ) | | | (65,134,733 | ) | |
| Class C | | | (63,519,054 | ) | | | (68,672,171 | ) | |
| Class I | | | (5,436,247 | ) | | | (3,150,095 | ) | |
Net asset value of shares exchanged
Class A | | | 4,360,983 | | | | 1,900,249 | | |
| Class B | | | (4,360,983 | ) | | | (1,900,249 | ) | |
Net decrease in net assets from
Fund share transactions | | $ | (144,187,217 | ) | | $ | (134,971,063 | ) | |
| Net increase (decrease) in net assets | | $ | 5,807,393 | | | $ | (90,336,751 | ) | |
| Net Assets | | Year Ended
December 31, 2006 | | Year Ended
December 31, 2005* | |
| At beginning of year | | $ | 1,346,281,767 | | | $ | 1,436,618,518 | | |
| At end of year | | $ | 1,352,089,160 | | | $ | 1,346,281,767 | | |
Accumulated undistributed
net investment income
included in net assets | |
| At end of year | | $ | 8,236 | | | $ | 232,417 | | |
* Amounts were reclassified for the year ended December 31, 2005 resulting in an increase in net realized gain (loss) and a decrease in net change in unrealized appreciation (depreciation) of $66,046,412. This amount was reclassified due to the correction of the allocation of realized gain (loss). These changes had no effect on the Fund's net asset value, net assets, net investment income, net increase in net assets from operations, financial highlights or total return.
See notes to financial statements
7
Eaton Vance Tax-Managed Growth Fund 1.2 as of December 31, 2006
FINANCIAL STATEMENTS CONT'D
Financial Highlights
| | | Class A | |
| | | Year Ended December 31, | |
| | | 2006 | | 2005 | | 2004 | | 2003 | | 2002 | |
| Net asset value — Beginning of year | | $ | 10.500 | | | $ | 10.150 | | | $ | 9.350 | | | $ | 7.600 | | | $ | 9.480 | | |
| Income (loss) from operations | |
| Net investment income(1) | | $ | 0.099 | | | $ | 0.072 | | | $ | 0.063 | | | $ | 0.040 | | | $ | 0.027 | | |
| Net realized and unrealized gain (loss) | | | 1.274 | | | | 0.347 | | | | 0.789 | | | | 1.723 | | | | (1.907 | ) | |
| Total income (loss) from operations | | $ | 1.373 | | | $ | 0.419 | | | $ | 0.852 | | | $ | 1.763 | | | $ | (1.880 | ) | |
| Less distributions | |
| From net investment income | | $ | (0.103 | ) | | $ | (0.069 | ) | | $ | (0.052 | ) | | $ | (0.013 | ) | | $ | — | | |
| Total distributions | | $ | (0.103 | ) | | $ | (0.069 | ) | | $ | (0.052 | ) | | $ | (0.013 | ) | | $ | — | | |
| Net asset value — End of period | | $ | 11.770 | | | $ | 10.500 | | | $ | 10.150 | | | $ | 9.350 | | | $ | 7.600 | | |
| Total Return(2) | | | 13.07 | % | | | 4.12 | % | | | 9.12 | % | | | 23.20 | % | | | (19.83 | )% | |
| Ratios/Supplemental Data | |
| Net assets, end of year (000's omitted) | | $ | 661,149 | | | $ | 637,731 | | | $ | 670,319 | | | $ | 583,971 | | | $ | 379,172 | | |
| Ratios (As a percentage of average daily net assets): | |
| Expenses before custodian fee reduction(3) | | | 0.95 | % | | | 0.99 | %(5) | | | 0.97 | %(5) | | | 1.01 | % | | | 1.01 | % | |
| Expenses after custodian fee reduction(3) | | | 0.95 | % | | | 0.99 | %(5) | | | 0.97 | %(5) | | | 1.01 | % | | | 1.01 | % | |
| Net investment income | | | 0.90 | % | | | 0.71 | %(5) | | | 0.66 | %(5) | | | 0.49 | % | | | 0.32 | % | |
| Portfolio Turnover of the Portfolio(4) | | | 1 | % | | | 0 | %(6) | | | 3 | % | | | 15 | % | | | 23 | % | |
(1) Net investment income per share was computed using average shares outstanding.
(2) Returns are historical and are calculated by determining the percentage change in net asset value with all distributions reinvested.
(3) Includes the Fund's share of the Portfolio's allocated expenses.
(4) Excludes the value of the portfolio securities contributed or distributed as a result of in-kind shareholder transactions. The total turnover rate of the Portfolio including contributions and distributions of in-kind securities was 7%, 6%, 10%, 21%, and 30%, for 2006, 2005, 2004, 2003, and 2002, respectively.
(5) The investment adviser waived a portion of its investment advisory fee (equal to less than 0.01% of average daily net assets for 2005 and 2004, respectively).
(6) Amounts to less than 1%.
See notes to financial statements
8
Eaton Vance Tax-Managed Growth Fund 1.2 as of December 31, 2006
FINANCIAL STATEMENTS CONT'D
Financial Highlights
| | | Class B | |
| | | Year Ended December 31, | |
| | | 2006 | | 2005 | | 2004 | | 2003 | | 2002 | |
| Net asset value — Beginning of year | | $ | 10.230 | | | $ | 9.900 | | | $ | 9.140 | | | $ | 7.470 | | | $ | 9.400 | | |
| Income (loss) from operations | |
| Net investment income (loss)(1) | | $ | 0.015 | | | $ | (0.004 | ) | | $ | (0.008 | ) | | $ | (0.021 | ) | | $ | (0.037 | ) | |
| Net realized and unrealized gain (loss) | | | 1.230 | | | | 0.334 | | | | 0.768 | | | | 1.691 | | | | (1.893 | ) | |
| Total income (loss) from operations | | $ | 1.245 | | | $ | 0.330 | | | $ | 0.760 | | | $ | 1.670 | | | $ | (1.930 | ) | |
| Less distributions | |
| From net investment income | | $ | (0.015 | ) | | $ | — | | | $ | — | | | $ | — | | | $ | — | | |
| Total distributions | | $ | (0.015 | ) | | $ | — | | | $ | — | | | $ | — | | | $ | — | | |
| Net asset value — End of period | | $ | 11.460 | | | $ | 10.230 | | | $ | 9.900 | | | $ | 9.140 | | | $ | 7.470 | | |
| Total Return(2) | | | 12.17 | % | | | 3.33 | % | | | 8.32 | % | | | 22.36 | % | | | (20.53 | )% | |
| Ratios/Supplemental Data | |
| Net assets, end of year (000's omitted) | | $ | 327,224 | | | $ | 350,939 | | | $ | 391,010 | | | $ | 344,432 | | | $ | 255,721 | | |
| Ratios (As a percentage of average daily net assets): | |
| Expenses before custodian fee reduction(3) | | | 1.70 | % | | | 1.74 | %(5) | | | 1.72 | %(5) | | | 1.77 | % | | | 1.76 | % | |
| Expenses after custodian fee reduction(3) | | | 1.70 | % | | | 1.74 | %(5) | | | 1.72 | %(5) | | | 1.77 | % | | | 1.76 | % | |
| Net investment income (loss) | | | 0.14 | % | | | (0.04 | )%(5) | | | (0.09 | )%(5) | | | (0.26 | )% | | | (0.44 | )% | |
| Portfolio Turnover of the Portfolio(4) | | | 1 | % | | | 0 | %(6) | | | 3 | % | | | 15 | % | | | 23 | % | |
(1) Net investment income (loss) per share was computed using average shares outstanding.
(2) Returns are historical and are calculated by determining the percentage change in net asset value with all distributions reinvested.
(3) Includes the Fund's share of the Portfolio's allocated expenses.
(4) Excludes the value of the portfolio securities contributed or distributed as a result of in-kind shareholder transactions. The total turnover rate of the Portfolio including contributions and distributions of in-kind securities was 7%, 6%, 10%, 21%, and 30%, for 2006, 2005, 2004, 2003, and 2002, respectively.
(5) The investment adviser waived a portion of its investment advisory fee (equal to less than 0.01% of average daily net assets for 2005 and 2004, respectively).
(6) Amounts to less than 1%.
See notes to financial statements
9
Eaton Vance Tax-Managed Growth Fund 1.2 as of December 31, 2006
FINANCIAL STATEMENTS CONT'D
Financial Highlights
| | | Class C | |
| | | Year Ended December 31, | |
| | | 2006 | | 2005 | | 2004 | | 2003 | | 2002 | |
| Net asset value — Beginning of year | | $ | 10.230 | | | $ | 9.900 | | | $ | 9.150 | | | $ | 7.480 | | | $ | 9.400 | | |
| Income (loss) from operations | |
| Net investment income (loss)(1) | | $ | 0.016 | | | $ | (0.004 | ) | | $ | (0.008 | ) | | $ | (0.020 | ) | | $ | (0.036 | ) | |
| Net realized and unrealized gain (loss) | | | 1.244 | | | | 0.334 | | | | 0.758 | | | | 1.690 | | | | (1.884 | ) | |
| Total income (loss) from operations | | $ | 1.260 | | | $ | 0.330 | | | $ | 0.750 | | | $ | 1.670 | | | $ | (1.920 | ) | |
| Less distributions | |
| From net investment income | | $ | (0.020 | ) | | $ | — | | | $ | — | | | $ | — | | | $ | — | | |
| Total distributions | | $ | (0.020 | ) | | $ | — | | | $ | — | | | $ | — | | | $ | — | | |
| Net asset value — End of period | | $ | 11.470 | | | $ | 10.230 | | | $ | 9.900 | | | $ | 9.150 | | | $ | 7.480 | | |
| Total Return(2) | | | 12.32 | % | | | 3.33 | % | | | 8.20 | % | | | 22.33 | % | | | (20.43 | )% | |
| Ratios/Supplemental Data | |
| Net assets, end of year (000's omitted) | | $ | 351,954 | | | $ | 349,504 | | | $ | 366,421 | | | $ | 333,398 | | | $ | 243,633 | | |
| Ratios (As a percentage of average daily net assets): | |
| Expenses before custodian fee reduction(3) | | | 1.70 | % | | | 1.74 | %(5) | | | 1.72 | %(5) | | | 1.76 | % | | | 1.76 | % | |
| Expenses after custodian fee reduction(3) | | | 1.70 | % | | | 1.74 | %(5) | | | 1.72 | %(5) | | | 1.76 | % | | | 1.76 | % | |
| Net investment income (loss) | | | 0.15 | % | | | (0.04 | )%(5) | | | (0.09 | )%(5) | | | (0.25 | )% | | | (0.44 | )% | |
| Portfolio Turnover of the Portfolio(4) | | | 1 | % | | | 0 | %(6) | | | 3 | % | | | 15 | % | | | 23 | % | |
(1) Net investment income (loss) per share was computed using average shares outstanding.
(2) Returns are historical and are calculated by determining the percentage change in net asset value with all distributions reinvested.
(3) Includes the Fund's share of the Portfolio's allocated expenses.
(4) Excludes the value of the portfolio securities contributed or distributed as a result of in-kind shareholder transactions. The total turnover rate of the Portfolio including contributions and distributions of in-kind securities was 7%, 6%, 10%, 21%, and 30%, for 2006, 2005, 2004, 2003, and 2002, respectively.
(5) The investment adviser waived a portion of its investment advisory fee (equal to less than 0.01% of average daily net assets for 2005 and 2004, respectively).
(6) Amounts to less than 1%.
See notes to financial statements
10
Eaton Vance Tax-Managed Growth Fund 1.2 as of December 31, 2006
FINANCIAL STATEMENTS CONT'D
Financial Highlights
| | | Class I | |
| | | Year Ended December 31, | |
| | | 2006 | | 2005 | | 2004 | | 2003 | | 2002 | |
| Net asset value — Beginning of year | | $ | 10.510 | | | $ | 10.160 | | | $ | 9.360 | | | $ | 7.600 | | | $ | 9.460 | | |
| Income (loss) from operations | |
| Net investment income(1) | | $ | 0.126 | | | $ | 0.098 | | | $ | 0.090 | | | $ | 0.060 | | | $ | 0.052 | | |
| Net realized and unrealized gain (loss) | | | 1.285 | | | | 0.348 | | | | 0.785 | | | | 1.723 | | | | (1.912 | ) | |
| Total income (loss) from operations | | $ | 1.411 | | | $ | 0.446 | | | $ | 0.875 | | | $ | 1.783 | | | $ | (1.860 | ) | |
| Less distributions | |
| From net investment income | | $ | (0.131 | ) | | $ | (0.096 | ) | | $ | (0.075 | ) | | $ | (0.023 | ) | | $ | — | | |
| Total distributions | | $ | (0.131 | ) | | $ | (0.096 | ) | | $ | (0.075 | ) | | $ | (0.023 | ) | | $ | — | | |
| Net asset value — End of period | | $ | 11.790 | | | $ | 10.510 | | | $ | 10.160 | | | $ | 9.360 | | | $ | 7.600 | | |
| Total Return(2) | | | 13.41 | % | | | 4.38 | % | | | 9.35 | % | | | 23.46 | % | | | (19.66 | )% | |
| Ratios/Supplemental Data | |
| Net assets, end of year (000's omitted) | | $ | 11,762 | | | $ | 8,107 | | | $ | 8,868 | | | $ | 5,664 | | | $ | 3,604 | | |
| Ratios (As a percentage of average daily net assets): | |
| Expenses before custodian fee reduction(3) | | | 0.70 | % | | | 0.74 | %(5) | | | 0.72 | %(5) | | | 0.77 | % | | | 0.74 | % | |
| Expenses after custodian fee reduction(3) | | | 0.70 | % | | | 0.74 | %(5) | | | 0.72 | %(5) | | | 0.77 | % | | | 0.74 | % | |
| Net investment income | | | 1.13 | % | | | 0.96 | %(5) | | | 0.94 | %(5) | | | 0.74 | % | | | 0.64 | % | |
| Portfolio Turnover of the Portfolio(4) | | | 1 | % | | | 0 | %(6) | | | 3 | % | | | 15 | % | | | 23 | % | |
(1) Net investment income per share was computed using average shares outstanding.
(2) Returns are historical and are calculated by determining the percentage change in net asset value with all distributions reinvested.
(3) Includes the Fund's share of the Portfolio's allocated expenses.
(4) Excludes the value of the portfolio securities contributed or distributed as a result of in-kind shareholder transactions. The total turnover rate of the Portfolio including contributions and distributions of in-kind securities was 7%, 6%, 10%, 21%, and 30%, for 2006, 2005, 2004, 2003, and 2002, respectively.
(5) The investment adviser waived a portion of its investment advisory fee (equal to less than 0.01% of average daily net assets for 2005 and 2004, respectively).
(6) Amounts to less than 1%.
See notes to financial statements
11
Eaton Vance Tax-Managed Growth Fund 1.2 as of December 31, 2006
NOTES TO FINANCIAL STATEMENTS
1 Significant Accounting Policies
Eaton Vance Tax-Managed Growth Fund 1.2 (the Fund) is a diversified series of Eaton Vance Mutual Funds Trust (the Trust). The Trust is an entity of the type commonly known as a Massachusetts business trust and is registered under the Investment Company Act of 1940, as amended, as an open-end management investment company. The Fund has four classes of shares. Class A shares are generally sold subject to a sales charge imposed at the time of purchase. Class B and Class C shares are sold at net asset value and are subject to a contingent deferred sales charge (see Note 6). Class I shares are sold at net asset value and are not subject to a sales charge. Class B shares held for eight years will automatically convert to Class A shares. Each class represents a pro rata interest in the Fund, but votes separately on class-specific matters and (as noted below) is subject to different expenses. Realized and unrealized gains and losses and net investment income and losses, other than class-specific expenses, are allocated daily to each class of shares based on the relative net assets of each class to the total net assets of the Fund. Each class of shares differs in its distribution plan and certain other class-specific expenses. The Fund invests all of its investable assets in interests of Tax-Managed Growth Portfolio (the Portfolio), a New York trust, having the same investment objective as the Fund. The value of the Fund's investment in the Portfolio reflects the Fund's proportionate interest in the net assets of the Portfolio (6.6% at December 31, 2006). The performance of the Fund is directly affected by the performance of the Portfolio. The financial statements of the Portfolio, including the Portfolio of Investments, are included elsewhere in this report and should be read in conjunction with the Fund's financial statements.
The following is a summary of significant accounting policies consistently followed by the Fund in the preparation of its financial statements. The policies are in conformity with accounting principles generally accepted in the United States of America.
A Investment Valuation — Valuation of securities by the Portfolio is discussed in Note 1A of the Portfolio's Notes to Financial Statements, which are included elsewhere in this report.
B Income — The Fund's net investment income or loss consists of the Fund's pro rata share of the net investment income or loss of the Portfolio, less all actual and accrued expenses of the Fund.
C Expenses — The majority of expenses of the Trust are directly identifiable to an individual fund. Expenses which are not readily identifiable to a specific fund are allocated taking into consideration, among other things, the nature and type of expense and the relative size of the funds.
D Federal Taxes — The Fund's policy is to comply with the provisions of the Internal Revenue Code applicable to regulated investment companies and to distribute to shareholders, each year, substantially all of its net investment income and all or substantially all of its net realized capital gains. Accordingly, no provision for federal income or excise tax is necessary. At December 31, 2006, the Fund, for federal income tax purposes, had a capital loss carryover of $44,360,728 which will reduce the taxable income arising from future net realized gain on investments, if any, to the extent permitted by the Internal Revenue Code and thus will reduce the amount of distributions to shareholders which would otherwise be necessary to relieve the Fund of any liability for federal income or excise tax. Such loss carryover will expire on December 31, 2010 ($22,271,630), December 31, 2011 ($20,145,448) and December 31, 2013 ($1,943,650).
At December 31, 2006, net losses of $478 attributable to currency transactions incurred after October 31, 2006 are treated as arising on the first day of the Fund's taxable year ending December 31, 2007.
E Expense Reduction — Investors Bank & Trust Company (IBT) serves as custodian of the Fund. Pursuant to the custodian agreement, IBT receives a fee reduced by credits which are determined based on the average daily cash balance the Fund maintains with IBT. All credit balances, if any, used to reduce the Fund's custodian fees are reported as a reduction of expenses in the Statement of Operations. For the year ended December 31, 2006, there were no credit balances used to reduce the Fund's custodian fee.
F Indemnifications — Under the Trust's organizational documents, its officers and Trustees may be indemnified against certain liabilities and expenses arising out of the performance of their duties to the Fund, and shareholders are indemnified against personal liability for the obligations of the Trust. Additionally, in the normal course of business, the Fund enters into agreements with service providers that may contain indemnification clauses. The Fund's maximum exposure under these arrangements is unknown as this would involve future claims that may be made against the Fund that have not yet occurred.
12
Eaton Vance Tax-Managed Growth Fund 1.2 as of December 31, 2006
NOTES TO FINANCIAL STATEMENTS CONT'D
G Other — Investment transactions are accounted for on the date the securities are purchased or sold. Dividends to shareholders are recorded on the ex-dividend date.
H Use of Estimates — The preparation of the financial statements in conformity with accounting principles generally accepted in the United States of America requires management to make estimates and assumptions that affect the reported amounts of assets and liabilities at the date of the financial statements and the reported amounts of income and expense during the reporting period. Actual results could differ from those estimates.
2 Distributions to Shareholders
The Fund's policy is to distribute annually (normally in December) substantially all of the net investment income allocated to the Fund by the Portfolio (less the Fund's direct expenses) and to distribute annually all or substantially all of its net realized capital gains (reduced by any available capital loss carryforwards from prior years) allocated by the Portfolio to the Fund, if any. Distributions are paid in the form of additional shares of the Fund or, at the election of the shareholder, in cash. Shareholders may reinvest all distributions in additional shares of the Fund at net asset value as of the close of business on the ex-dividend date. The Fund distinguishes between distributions on a tax basis and a financial reporting basis. Accounting principles generally accepted in the United States of America require that only distributions in excess of tax basis earnings and profits be reported in the financial statements as a return of capital. Permanent differences between book and tax accounting relating to distributions are reclassified to paid-in capital.
The tax character of distributions paid for the years ended December 31, 2006 and December 31, 2005 were as follows:
| | | Year Ended December 31, | |
| | | 2006 | | 2005 | |
| Distributions declared from: | |
| Ordinary income | | $ | 6,885,859 | | | $ | 4,254,125 | | |
During the year ended December 31, 2006, accumulated paid-in capital was increased by $31,661,301, accumulated undistributed net investment income was decreased by $45,653, and accumulated net realized gain was decreased by $31,615,648 primarily due to differences between book and tax accounting treatment of foreign currency gain (loss) and redemptions in-kind. Additionally, amounts were reclassified resulting in an increase in accumulated paid-in capital and a decrease in accumulated net realized gains of $215,138,114 due to the correction of the allocation of realized gain (loss). These changes had no effect on the Fund's net assets or the net asset value per share.
As of December 31, 2006, the components of distributable earnings (accumulated losses) on a tax basis were as follows:
| Capital loss carryforwards | | $ | (44,360,728 | ) | |
| Unrealized appreciation | | $ | 315,447,579 | | |
| Accumulated undistributed net investment income | | $ | 1,602 | | |
| Other temporary difference | | $ | (478 | ) | |
3 Shares of Beneficial Interest
The Fund's Declaration of Trust permits the Trustees to issue an unlimited number of full and fractional shares of beneficial interest (without par value). Such shares may be issued in a number of different series (such as the Fund) and classes. Sales and redemptions of Class I shares include shares purchased and redeemed in connection with the ReFlow liquidity program, a program designed to provide an alternative liquidity source for mutual funds experiencing net redemptions of their shares. Transactions in Fund shares were as follows:
| | | Year Ended December 31, | |
| Class A | | 2006 | | 2005 | |
| Sales | | | 7,266,817 | | | | 11,779,598 | | |
Issued to shareholders electing to receive
payments of distributions in Fund shares | | | 375,396 | | | | 307,647 | | |
| Redemptions | | | (12,612,657 | ) | | | (17,573,969 | ) | |
| Exchange from Class B shares | | | 398,751 | | | | 186,238 | | |
| Net decrease | | | (4,571,693 | ) | | | (5,300,486 | ) | |
| | | Year Ended December 31, | |
| Class B | | 2006 | | 2005 | |
| Sales | | | 692,767 | | | | 1,627,173 | | |
Issued to shareholders electing to receive
payments of distributions in Fund shares | | | 30,549 | | | | — | | |
| Redemptions | | | (6,081,591 | ) | | | (6,628,516 | ) | |
| Exchange to Class A shares | | | (410,646 | ) | | | (191,685 | ) | |
| Net decrease | | | (5,768,921 | ) | | | (5,193,028 | ) | |
13
Eaton Vance Tax-Managed Growth Fund 1.2 as of December 31, 2006
NOTES TO FINANCIAL STATEMENTS CONT'D
| | | Year Ended December 31, | |
| Class C | | 2006 | | 2005 | |
| Sales | | | 2,478,097 | | | | 4,134,333 | | |
Issued to shareholders electing to receive
payments of distributions in Fund shares | | | 38,296 | | | | — | | |
| Redemptions | | | (5,971,984 | ) | | | (6,980,438 | ) | |
| Net decrease | | | (3,455,591 | ) | | | (2,846,105 | ) | |
| | | Year Ended December 31, | |
| Class I | | 2006 | | 2005 | |
| Sales | | | 696,029 | | | | 201,381 | | |
Issued to shareholders electing to receive
payments of distributions in Fund shares | | | 3,612 | | | | 3,761 | | |
| Redemptions | | | (473,049 | ) | | | (306,528 | ) | |
| Net increase (decrease) | | | 226,592 | | | | (101,386 | ) | |
4 Transactions with Affiliates
The administration fee is earned by Eaton Vance Management (EVM) as compensation for managing and administering the business affairs of the Fund. Under the administration agreement, EVM earns a fee in the amount of 0.15% per annum of average daily net assets of the Fund. For the year ended December 31, 2006, the administration fee amounted to $1,972,183. The Portfolio has engaged Boston Management and Research (BMR), a subsidiary of EVM, to render investment advisory services. See Note 2 of the Portfolio's Notes to Financial Statements which are included elsewhere in this report. EVM serves as the sub-transfer agent of the Fund and receives an aggregate fee based upon the actual expenses incurred by EVM in the performance of those services. For the year ended December 31, 2006, EVM received $82,178 in sub-transfer agent fees.
Except for Trustees of the Fund and the Portfolio who are not members of EVM's or BMR's organization, officers and Trustees receive remuneration for their services to the Fund out of the investment adviser fee, earned by BMR. Trustees of the Fund who are not affiliated with EVM or BMR may elect to defer receipt of all or a percentage of their annual fees in accordance with the terms of the Trustees' Deferred Compensation Plan. For the year ended December 31, 2006, no significant amounts have been deferred.
Eaton Vance Distributors, Inc. (EVD), a subsidiary of EVM and the Fund's principal underwriter, received $152,455 as its portion of the sales charge on sales of Class A shares for year ended December 31, 2006.
Certain officers and Trustees of the Fund and the Portfolio are officers of the above organizations.
5 Distribution Plans
Class A has in effect a distribution plan pursuant to Rule 12b-1 (Class A Plan) under the Investment Company Act of 1940 (the 1940 Act). The Class A Plan provides that the Fund will pay EVD a distribution and service fee of 0.25% of the Fund's average daily net assets attributable to Class A shares for each fiscal year for distribution services and facilities provided to the Fund by EVD, as well as for personal services and/or the maintenance of shareholder accounts. Distribution and service fees paid or accrued for the year ended December 31, 2006 amounted to $1,575,781 for Class A shares. The Fund also has in effect distribution plans for Class B shares (Class B Plan) and Class C shares (Class C Plan) pursuant to Rule 12b-1 under the 1940 Act. The Class B and Class C Plans require the Fund to pay EVD amounts equal to 1/365 of 0.75% of the Fund's average daily net assets attributable to Class B and Class C shares for providing ongoing distribution services and facilities to the Fund. The Fund will automatically discontinue payments to EVD during any period in which there are no outstanding Uncovered Distribution Charges, which are equivalent to the sum of (i) 6.25% of the aggregate amount received by the Fund for the Class B and Class C shares sold, respectively, plus (ii) interest calculated by applying the rate of 1% over the prevailing prime rate to the outstanding balance of Uncovered Distribution Charges of EVD of each respective class, reduced by the aggregate amount of contingent deferred sales charges (see Note 6) and daily amounts theretofore paid to EVD by each respective class. Distribution fees paid or accrued for the year ended December 31, 2006 amounted to $2,503,390 and $2,573,369 for Class B and Class C shares, respectively. At December 31, 2006, the amount of Uncovered Distribution Charges of EVD calculated under the Plans was approximately $15,778,000 and $27,896,000 for Class B and Class C shares, respectively. The Class B and Class C Plans also authorize the Fund to make payments of service fees to EVD, investment dealers and other persons in amounts not exceeding 0.25% of the average daily net assets attributable to that Class. Service fees are paid for personal services and/or the maintenance of shareholder accounts. They are separate and distinct from the Class B and Class C sales commissions and distribution fees and, as such, are not subject to automatic discontinuance when there are no outstanding Uncovered Distribution Charges to EVD. Service fees paid or accrued for the year ended December 31, 2006 amounted to $834,463 and $857,790 for Class B and Class C shares, respectively.
14
Eaton Vance Tax-Managed Growth Fund 1.2 as of December 31, 2006
NOTES TO FINANCIAL STATEMENTS CONT'D
6 Contingent Deferred Sales Charge
A contingent deferred sales charge (CDSC) generally is imposed on any redemption of Class B shares made within six years of purchase and on redemptions of Class C shares made within one year of purchase. Class A shares may be subject to a CDSC up to 1% if redeemed within two years of purchase (depending upon the circumstances of the purchase). Generally, the CDSC is based upon the lower of the net asset value at date of redemption or date of purchase. No charge is levied on shares acquired by reinvestment of dividends or capital gains distributions. The Class B CDSC is imposed at declining rates that begin at 5% in the case of redemptions in the first and second year after purchase, declining one percentage point each subsequent year. Class C shares will be subject to a 1% CDSC if redeemed within one year of purchase.
No CDSC is levied on shares which have been sold to EVM or its affiliates or to their respective employees or clients and may be waived under certain other limited conditions. CDSC pertaining to Class B and Class C shares are paid to EVD to reduce the amount of Uncovered Distribution Charges calculated under the Plans (see Note 5). CDSC assessed on Class B and Class C shares when no Uncovered Distribution Charges exist for the respective class will be credited to the Fund. EVD received approximately $4,000, $929,000 and $22,000 of CDSC paid by shareholders for Class A, Class B and Class C shares, respectively, for the year ended December 31, 2006.
7 Investment Transactions
Increases and decreases in the Fund's investment in the Portfolio aggregated $122,444,180 and $285,649,336, respectively, for the year ended December 31, 2006. Decreases in the Fund's investment in the Portfolio include the distribution of common stock as the result of redemptions in-kind of $2,735,294 for the year ended December 31, 2006.
8 Recently Issued Accounting Pronouncements
In June 2006, the Financial Accounting Standards Board (FASB) issued FASB Interpretation No. 48, (FIN 48) "Accounting for Uncertainty in Income Taxes – an interpretation of FASB Statement No. 109". FIN 48 clarifies the accounting for uncertainty in income taxes recognized in accordance with FASB Statement No. 109, "Accounting for Income Taxes." This interpretation prescribes a recognition threshold and measurement attribute for the financial statement recognition and measurement of a tax position taken or expected to be taken in a tax return. It also provides guidance on de-recognition, classification, interest and penalties, accounting in interim periods, disclosure and transition. FIN 48 is effective during the first required financial reporting period for fiscal years beginning after December 15, 2006. Management is currently evaluating the impact of applying the various provisions of FIN 48.
In September 2006, FASB issued Statement of Financial Accounting Standards No. 157, (FAS 157) "Fair Value Measurements". FAS 157 defines fair value, establishes a framework for measuring fair value in accordance with generally accepted accounting principles and expands disclosure about fair value measurements. FAS 157 is effective for fiscal years beginning after November 15, 2007. Management is currently evaluating the impact the adoption of FAS 157 will have on the Fund's financial statement disclosures.
15
Eaton Vance Tax-Managed Growth Fund 1.2 as of December 31, 2006
REPORT OF INDEPENDENT REGISTERED PUBLIC ACCOUNTING FIRM
To the Trustees of Eaton Vance Mutual Funds Trust and Shareholders of Eaton Vance Tax-Managed Growth Fund 1.2:
We have audited the accompanying statement of assets and liabilities of Eaton Vance Tax-Managed Growth Fund 1.2 (the Fund) (one of the series of Eaton Vance Mutual Funds Trust) as of December 31, 2006, and the related statement of operations for the year then ended, the statements of changes in net assets for each of the two years in the period then ended, and the financial highlights for each of the five years in the period then ended. These financial statements and financial highlights are the responsibility of the Fund's management. Our responsibility is to express an opinion on these financial statements and financial highlights based on our audits.
We conducted our audits in accordance with the standards of the Public Company Accounting Oversight Board (United States). Those standards require that we plan and perform the audit to obtain reasonable assurance about whether the financial statements are free of material misstatement. The Fund is not required to have, nor were we engaged to perform, an audit of its internal control over financial reporting. Our audits included consideration of internal control over financial reporting as a basis for designing audit procedures that are appropriate in the circumstances, but not for the purpose of expressing an opinion on the effectiveness of the Fund's internal control over financial reporting. Accordingly, we express no such opinion. An audit also includes examining, on a test basis, evidence supporting the amounts and disclosures in the financial statements, assessing the accounting principles used and significant estimates mad e by management, as well as evaluating the overall financial statement presentation. We believe that our audits provide a reasonable basis for our opinion.
In our opinion, such financial statements and financial highlights referred to above present fairly, in all material respects, the financial position of Eaton Vance Tax-Managed Growth Fund 1.2 as of December 31, 2006, the results of its operations for the year then ended, the changes in its net assets for each of the two years in the period then ended, and the financial highlights for each of the five years in the period then ended, in conformity with accounting principles generally accepted in the United States of America.
DELOITTE & TOUCHE LLP
Boston, Massachusetts
February 20, 2007
16
Eaton Vance Tax-Managed Growth Fund 1.2 as of December 31, 2006
FEDERAL TAX INFORMATION (Unaudited)
The Form 1099-DIV you received in January 2007 showed the tax status of all distributions paid to your account in calendar 2006. Shareholders are advised to consult their own tax adviser with respect to the tax consequences of their investment in the Fund. As required by the Internal Revenue Code regulations, shareholders must be notified within 60 days of the Fund's fiscal year end regarding the status of qualified dividend income for individuals and the dividends received deduction for corporations.
Qualified Dividend Income. The Fund designates $19,103,000 or up to the maximum amount of such dividends allowable pursuant to the Internal Revenue Code, as qualified dividend income eligible for the reduced tax rate of 15%.
Dividends Received Deduction. Corporate shareholders are generally entitled to take the dividends received deduction on the portion of the Fund's dividend distribution that qualified under tax law. For the Fund's fiscal 2006 ordinary income dividends, 100% qualified for the corporate dividends received deduction.
17
Tax-Managed Growth Portfolio as of December 31, 2006
PORTFOLIO OF INVESTMENTS
| Common Stocks — 99.7% | |
| Security | | Shares | | Value | |
| Aerospace & Defense — 3.3% | |
| Boeing Company (The) | | | 948,774 | | | $ | 84,289,082 | | |
| General Dynamics Corp. | | | 1,470,000 | | | | 109,294,500 | | |
| Honeywell International, Inc. | | | 293,060 | | | | 13,258,034 | | |
| Northrop Grumman Corp. | | | 3,106,377 | | | | 210,301,723 | | |
| Raytheon Co. | | | 350,050 | | | | 18,482,640 | | |
| Rockwell Collins, Inc. | | | 129,632 | | | | 8,204,409 | | |
| United Technologies Corp. | | | 3,693,938 | | | | 230,945,004 | | |
| | | $ | 674,775,392 | | |
| Air Freight & Logistics — 2.7% | |
| C.H. Robinson Worldwide, Inc. | | | 2,078,589 | | | $ | 84,993,504 | | |
| FedEx Corp. | | | 2,219,776 | | | | 241,112,069 | | |
| United Parcel Service, Inc., Class B | | | 2,979,416 | | | | 223,396,612 | | |
| | | $ | 549,502,185 | | |
| Airlines — 0.0% | |
| Southwest Airlines Co. | | | 386,112 | | | $ | 5,915,236 | | |
| | | $ | 5,915,236 | | |
| Auto Components — 0.1% | |
| BorgWarner, Inc. | | | 95,849 | | | $ | 5,657,008 | | |
| Delphi Corp.(1) | | | 5,361 | | | | 20,479 | | |
| Johnson Controls, Inc. | | | 213,523 | | | | 18,345,896 | | |
| Visteon Corp.(1) | | | 4,426 | | | | 37,532 | | |
| | | $ | 24,060,915 | | |
| Automobiles — 0.1% | |
| DaimlerChrysler AG(2) | | | 24,284 | | | $ | 1,491,280 | | |
| Ford Motor Co. | | | 83,266 | | | | 625,328 | | |
| General Motors Corp. | | | 33,939 | | | | 1,042,606 | | |
| Harley-Davidson, Inc. | | | 141,140 | | | | 9,946,136 | | |
| | | $ | 13,105,350 | | |
| Beverages — 4.5% | |
| Anheuser-Busch Companies, Inc. | | | 4,881,907 | | | $ | 240,189,824 | | |
| Brown-Forman Corp., Class A | | | 479,732 | | | | 32,348,329 | | |
| Brown-Forman Corp., Class B | | | 45,820 | | | | 3,035,117 | | |
| Coca Cola Co. (The) | | | 4,721,933 | | | | 227,833,267 | | |
| Coca-Cola Enterprises, Inc. | | | 1,606,930 | | | | 32,813,511 | | |
| PepsiCo, Inc. | | | 6,177,920 | | | | 386,428,896 | | |
| | | $ | 922,648,944 | | |
| Security | | Shares | | Value | |
| Biotechnology — 1.7% | |
| Amgen, Inc.(1) | | | 4,383,782 | | | $ | 299,456,148 | | |
| Biogen Idec, Inc.(1) | | | 211,200 | | | | 10,388,928 | | |
| Celera Group(1) | | | 8,870 | | | | 124,091 | | |
| Genzyme Corp.(1) | | | 501,099 | | | | 30,857,676 | | |
| Gilead Sciences, Inc.(1) | | | 115,482 | | | | 7,498,246 | | |
| Vertex Pharmaceuticals, Inc.(1) | | | 13,000 | | | | 486,460 | | |
| | | $ | 348,811,549 | | |
| Building Products — 0.7% | |
| American Standard Companies, Inc. | | | 868,699 | | | $ | 39,829,849 | | |
| Masco Corp. | | | 3,420,182 | | | | 102,160,836 | | |
| | | $ | 141,990,685 | | |
| Capital Markets — 5.4% | |
| Affiliated Managers Group, Inc.(1) | | | 20,520 | | | $ | 2,157,268 | | |
| Ameriprise Financial, Inc. | | | 67,969 | | | | 3,704,311 | | |
| Bank of New York Co., Inc. | | | 426,888 | | | | 16,806,581 | | |
| Bear Stearns Companies, Inc. | | | 95,736 | | | | 15,583,906 | | |
| Charles Schwab Corp. (The) | | | 847,738 | | | | 16,395,253 | | |
| Credit Suisse Group(2) | | | 155,136 | | | | 10,796,273 | | |
| Federated Investors, Inc., Class B | | | 1,599,819 | | | | 54,041,886 | | |
| Franklin Resources, Inc. | | | 797,053 | | | | 87,811,329 | | |
| Goldman Sachs Group, Inc. | | | 1,115,548 | | | | 222,384,494 | | |
| Investors Financial Services Corp. | | | 450,386 | | | | 19,217,971 | | |
| Knight Capital Group, Inc., Class A(1) | | | 1,750,000 | | | | 33,547,500 | | |
| Legg Mason, Inc. | | | 46,784 | | | | 4,446,819 | | |
| Lehman Brothers Holdings, Inc. | | | 192,474 | | | | 15,036,069 | | |
| Mellon Financial Corp. | | | 321,392 | | | | 13,546,673 | | |
| Merrill Lynch & Co., Inc. | | | 2,472,803 | | | | 230,217,959 | | |
| Morgan Stanley | | | 3,053,604 | | | | 248,654,974 | | |
| Northern Trust Corp. | | | 725,484 | | | | 44,029,624 | | |
| Nuveen Investments, Class A | | | 110,000 | | | | 5,706,800 | | |
| Piper Jaffray Cos., Inc.(1) | | | 27,517 | | | | 1,792,733 | | |
| Raymond James Financial, Inc. | | | 221,005 | | | | 6,698,662 | | |
| State Street Corp. | | | 146,764 | | | | 9,897,764 | | |
| T. Rowe Price Group, Inc. | | | 341,862 | | | | 14,963,300 | | |
| UBS AG(2) | | | 192,683 | | | | 11,624,565 | | |
| Waddell & Reed Financial, Inc., Class A | | | 273,635 | | | | 7,486,654 | | |
| | | $ | 1,096,549,368 | | |
See notes to financial statements
18
Tax-Managed Growth Portfolio as of December 31, 2006
PORTFOLIO OF INVESTMENTS CONT'D
| Security | | Shares | | Value | |
| Chemicals — 0.8% | |
| Arch Chemicals, Inc. | | | 4,950 | | | $ | 164,885 | | |
| Arkema (ADR)(1) | | | 20,000 | | | | 1,026,702 | | |
| Ashland, Inc. | | | 46,969 | | | | 3,249,315 | | |
| Dow Chemical Co. (The) | | | 250,250 | | | | 9,994,985 | | |
| E.I. du Pont de Nemours and Co. | | | 1,031,498 | | | | 50,244,268 | | |
| Ecolab, Inc. | | | 407,411 | | | | 18,414,977 | | |
| MacDermid, Inc. | | | 41,355 | | | | 1,410,206 | | |
| Monsanto Co. | | | 39,066 | | | | 2,052,137 | | |
| Olin Corp. | | | 9,900 | | | | 163,548 | | |
| PPG Industries, Inc. | | | 27,142 | | | | 1,742,788 | | |
| Rohm and Haas Co. | | | 2,601 | | | | 132,963 | | |
| Sigma-Aldrich Corp. | | | 630,897 | | | | 49,033,315 | | |
| Tronox, Inc., Class B | | | 37,854 | | | | 597,715 | | |
| Valspar Corp. (The) | | | 1,219,107 | | | | 33,696,117 | | |
| | | $ | 171,923,921 | | |
| Commercial Banks — 7.8% | |
| Associated Banc-Corp. | | | 991,726 | | | $ | 34,591,403 | | |
| Bank of Hawaii Corp. | | | 69,735 | | | | 3,762,203 | | |
| Bank of Montreal(2) | | | 255,949 | | | | 15,149,621 | | |
| BB&T Corp. | | | 1,867,960 | | | | 82,059,483 | | |
| City National Corp. | | | 184,221 | | | | 13,116,535 | | |
| Colonial BancGroup, Inc. (The) | | | 52,095 | | | | 1,340,925 | | |
| Comerica, Inc. | | | 466,015 | | | | 27,345,760 | | |
| Commerce Bancshares, Inc. | | | 171,056 | | | | 8,280,821 | | |
| Compass Bancshares, Inc. | | | 54,254 | | | | 3,236,251 | | |
| Fifth Third Bancorp | | | 2,711,753 | | | | 110,992,050 | | |
| First Citizens BancShares, Inc., Class A | | | 22,480 | | | | 4,555,347 | | |
| First Horizon National Corp. | | | 148,868 | | | | 6,219,705 | | |
| First Midwest Bancorp, Inc. | | | 523,358 | | | | 20,243,487 | | |
| HSBC Holdings PLC (Hungary) (ADR) | | | 220,592 | | | | 4,037,864 | | |
| HSBC Holdings PLC (UK) (ADR) | | | 580,708 | | | | 53,221,888 | | |
| Huntington Bancshares, Inc. | | | 583,001 | | | | 13,846,274 | | |
| KeyCorp | | | 663,862 | | | | 25,246,672 | | |
| M&T Bank Corp. | | | 81,234 | | | | 9,923,545 | | |
| Marshall & Ilsley Corp. | | | 663,221 | | | | 31,907,562 | | |
| National City Corp. | | | 1,511,282 | | | | 55,252,470 | | |
| PNC Financial Services Group, Inc. | | | 166,675 | | | | 12,340,617 | | |
| Popular, Inc.(2) | | | 1,432 | | | | 25,704 | | |
| Regions Financial Corp. | | | 2,294,230 | | | | 85,804,202 | | |
| Royal Bank of Canada(2) | | | 574,109 | | | | 27,356,294 | | |
| Societe Generale(2) | | | 1,606,685 | | | | 271,515,830 | | |
| SunTrust Banks, Inc. | | | 1,252,412 | | | | 105,766,193 | | |
| Security | | Shares | | Value | |
| Commercial Banks (continued) | |
| Synovus Financial Corp. | | | 1,065,458 | | | $ | 32,848,070 | | |
| Toronto-Dominion Bank (The)(2) | | | 17,915 | | | | 1,072,571 | | |
| Trustmark Corp. | | | 205,425 | | | | 6,719,452 | | |
| U.S. Bancorp | | | 4,831,496 | | | | 174,851,840 | | |
| Valley National Bancorp. | | | 109,831 | | | | 2,911,620 | | |
| Wachovia Corp. | | | 2,539,881 | | | | 144,646,223 | | |
| Wells Fargo & Co. | | | 4,253,936 | | | | 151,269,964 | | |
| Westamerica Bancorporation | | | 258,826 | | | | 13,104,360 | | |
| Whitney Holding Corp. | | | 117,128 | | | | 3,820,715 | | |
| Zions Bancorporation | | | 454,096 | | | | 37,435,674 | | |
| | | $ | 1,595,819,195 | | |
| Commercial Services & Supplies — 0.8% | |
| Acco Brands Corp.(1) | | | 15,490 | | | $ | 410,020 | | |
| Allied Waste Industries, Inc.(1) | | | 1,240,437 | | | | 15,244,971 | | |
| Avery Dennison Corp. | | | 65,769 | | | | 4,467,688 | | |
| Cintas Corp. | | | 1,251,060 | | | | 49,679,593 | | |
| Donnelley (R.R.) & Sons Co. | | | 60,262 | | | | 2,141,711 | | |
| Herman Miller, Inc. | | | 541,800 | | | | 19,699,848 | | |
| HNI Corp. | | | 765,839 | | | | 34,010,910 | | |
| Hudson Highland Group, Inc.(1) | | | 5,226 | | | | 87,170 | | |
| Manpower, Inc. | | | 706 | | | | 52,901 | | |
| Monster Worldwide, Inc.(1) | | | 39,395 | | | | 1,837,383 | | |
| PHH Corp.(1) | | | 27,409 | | | | 791,298 | | |
| Pitney Bowes, Inc. | | | 31,857 | | | | 1,471,475 | | |
| School Specialty, Inc.(1) | | | 12,603 | | | | 472,486 | | |
| Waste Management, Inc. | | | 671,011 | | | | 24,673,074 | | |
| | | $ | 155,040,528 | | |
| Communications Equipment — 1.6% | |
| 3Com Corp.(1) | | | 472,985 | | | $ | 1,943,968 | | |
| ADC Telecommunications, Inc.(1) | | | 21,341 | | | | 310,084 | | |
| Alcatel SA (ADR) | | | 89,240 | | | | 1,268,993 | | |
| Avaya, Inc.(1) | | | 20,404 | | | | 285,248 | | |
| Cisco Systems, Inc.(1) | | | 6,198,467 | | | | 169,404,103 | | |
| Comverse Technology, Inc.(1) | | | 165,755 | | | | 3,499,088 | | |
| Corning, Inc.(1) | | | 3,671,953 | | | | 68,702,241 | | |
| Dycom Industries, Inc.(1) | | | 61,019 | | | | 1,288,721 | | |
| Juniper Networks, Inc.(1) | | | 35,691 | | | | 675,988 | | |
| Motorola, Inc. | | | 1,266,823 | | | | 26,045,881 | | |
| Nokia Oyj (ADR) | | | 2,042,478 | | | | 41,503,153 | | |
| Nortel Networks Corp.(1)(2) | | | 72,544 | | | | 1,939,101 | | |
See notes to financial statements
19
Tax-Managed Growth Portfolio as of December 31, 2006
PORTFOLIO OF INVESTMENTS CONT'D
| Security | | Shares | | Value | |
| Communications Equipment (continued) | |
| QUALCOMM, Inc. | | | 347,456 | | | $ | 13,130,362 | | |
| Riverstone Networks, Inc.(3) | | | 28,706 | | | | 0 | | |
| Tellabs, Inc.(1) | | | 32,678 | | | | 335,276 | | |
| | | $ | 330,332,207 | | |
| Computer Peripherals — 2.3% | |
| Dell, Inc.(1) | | | 4,406,741 | | | $ | 110,565,132 | | |
| EMC Corp.(1) | | | 1,747,812 | | | | 23,071,118 | | |
| Gateway, Inc.(1) | | | 65,556 | | | | 131,768 | | |
| Hewlett-Packard Co. | | | 887,799 | | | | 36,568,441 | | |
| International Business Machines Corp. | | | 1,575,883 | | | | 153,097,033 | | |
| Lexmark International, Inc., Class A(1) | | | 1,714,509 | | | | 125,502,059 | | |
| McDATA Corp., Class A(1) | | | 7,666 | | | | 42,546 | | |
| Network Appliance, Inc.(1) | | | 364,967 | | | | 14,335,904 | | |
| Palm, Inc.(1) | | | 68,379 | | | | 963,460 | | |
| Sun Microsystems, Inc.(1) | | | 319,180 | | | | 1,729,956 | | |
| | | $ | 466,007,417 | | |
| Construction & Engineering — 0.1% | |
| Jacobs Engineering Group, Inc.(1) | | | 157,319 | | | $ | 12,827,791 | | |
| | | $ | 12,827,791 | | |
| Construction Materials — 0.1% | |
| CRH PLC(2) | | | 207,894 | | | $ | 8,634,999 | | |
| Vulcan Materials Co. | | | 206,614 | | | | 18,568,400 | | |
| | | $ | 27,203,399 | | |
| Consumer Finance — 1.0% | |
| American Express Co. | | | 618,260 | | | $ | 37,509,834 | | |
| Capital One Financial Corp. | | | 1,705,714 | | | | 131,032,949 | | |
| SLM Corp. | | | 916,399 | | | | 44,692,779 | | |
| | | $ | 213,235,562 | | |
| Containers & Packaging — 0.1% | |
| Bemis Co., Inc. | | | 295,186 | | | $ | 10,030,420 | | |
| Sealed Air Corp. | | | 21,264 | | | | 1,380,459 | | |
| Sonoco Products Co. | | | 128,617 | | | | 4,895,163 | | |
| Temple-Inland, Inc. | | | 115,924 | | | | 5,335,982 | | |
| | | $ | 21,642,024 | | |
| Distributors — 0.0% | |
| Genuine Parts Co. | | | 190,459 | | | $ | 9,033,470 | | |
| | | $ | 9,033,470 | | |
| Security | | Shares | | Value | |
| Diversified Consumer Services — 0.3% | |
| Apollo Group, Inc., Class A(1) | | | 31,893 | | | $ | 1,242,870 | | |
| H&R Block, Inc. | | | 1,599,312 | | | | 36,848,148 | | |
| Laureate Education, Inc.(1) | | | 302,518 | | | | 14,711,450 | | |
| ServiceMaster Co. (The) | | | 1,156,537 | | | | 15,162,200 | | |
| | | $ | 67,964,668 | | |
| Diversified Financial Services — 3.1% | |
| Bank of America Corp. | | | 4,074,755 | | | $ | 217,551,169 | | |
| Citigroup, Inc. | | | 4,486,846 | | | | 249,917,322 | | |
| ING Groep N.V. (ADR) | | | 257,281 | | | | 11,364,102 | | |
| JPMorgan Chase & Co. | | | 2,748,807 | | | | 132,767,378 | | |
| Moody's Corp. | | | 309,906 | | | | 21,402,108 | | |
| | | $ | 633,002,079 | | |
| Diversified Telecommunication Services — 1.4% | |
| AT&T, Inc. | | | 1,201,387 | | | $ | 42,949,585 | | |
| BCE, Inc.(2) | | | 2,653,500 | | | | 71,644,500 | | |
| Bell Aliant Regional Communications, Inc.(1)(2)(3)(5) | | | 210,251 | | | | 4,870,986 | | |
| BellSouth Corp. | | | 165,981 | | | | 7,819,365 | | |
| Cincinnati Bell, Inc.(1) | | | 169,013 | | | | 772,389 | | |
| Citizens Communications Co. | | | 6,949 | | | | 99,857 | | |
| Deutsche Telekom AG (ADR) | | | 1,843,732 | | | | 33,555,922 | | |
| Embarq Corp. | | | 16,420 | | | | 863,035 | | |
| McLeod USA, Inc., Class A(1)(3) | | | 947 | | | | 0 | | |
| Qwest Communications International, Inc.(1) | | | 38,011 | | | | 318,152 | | |
| RSL Communications, Ltd., Class A(1)(2)(3) | | | 247,161 | | | | 0 | | |
| Telefonos de Mexico SA de CV (ADR) | | | 2,883,026 | | | | 81,416,654 | | |
| Verizon Communications, Inc. | | | 462,191 | | | | 17,211,993 | | |
| Windstream Corp. | | | 1,105,386 | | | | 15,718,589 | | |
| | | $ | 277,241,027 | | |
| Electric Utilities — 0.4% | |
| American Electric Power Co., Inc. | | | 960 | | | $ | 40,877 | | |
| Duke Energy Corp. | | | 417,250 | | | | 13,856,873 | | |
| Exelon Corp. | | | 1,003,134 | | | | 62,083,963 | | |
| Southern Co. (The) | | | 65,985 | | | | 2,432,207 | | |
| | | $ | 78,413,920 | | |
| Electrical Equipment — 0.6% | |
| American Power Conversion Corp. | | | 15,654 | | | $ | 478,856 | | |
| Emerson Electric Co. | | | 2,533,434 | | | | 111,648,436 | | |
| Rockwell Automation, Inc. | | | 160,084 | | | | 9,777,931 | | |
| Roper Industries, Inc. | | | 46,244 | | | | 2,323,299 | | |
| Thomas & Betts Corp.(1) | | | 106,648 | | | | 5,042,317 | | |
| | | $ | 129,270,839 | | |
See notes to financial statements
20
Tax-Managed Growth Portfolio as of December 31, 2006
PORTFOLIO OF INVESTMENTS CONT'D
| Security | | Shares | | Value | |
| Electronic Equipment & Instruments — 0.4% | |
| Agilent Technologies, Inc.(1) | | | 451,772 | | | $ | 15,744,254 | | |
| Arrow Electronics, Inc.(1) | | | 8,750 | | | | 276,063 | | |
| Flextronics International, Ltd.(1)(2) | | | 441,607 | | | | 5,069,648 | | |
| Jabil Circuit, Inc. | | | 2,082,013 | | | | 51,113,419 | | |
| National Instruments Corp. | | | 278,794 | | | | 7,594,349 | | |
| Plexus Corp.(1) | | | 146,273 | | | | 3,492,999 | | |
| Sanmina-SCI Corp.(1) | | | 540,602 | | | | 1,865,077 | | |
| Solectron Corp.(1) | | | 1,670,613 | | | | 5,379,374 | | |
| | | $ | 90,535,183 | | |
| Energy Equipment & Services — 0.7% | |
| Baker Hughes, Inc. | | | 194,687 | | | $ | 14,535,331 | | |
| GlobalSantaFe Corp.(2) | | | 20,000 | | | | 1,175,600 | | |
| Grant Prideco, Inc.(1) | | | 11,694 | | | | 465,070 | | |
| Halliburton Co. | | | 1,251,578 | | | | 38,861,497 | | |
| Schlumberger, Ltd.(2) | | | 1,178,674 | | | | 74,445,050 | | |
| Smith International, Inc. | | | 120,165 | | | | 4,935,177 | | |
| Transocean, Inc.(1)(2) | | | 103,602 | | | | 8,380,366 | | |
| | | $ | 142,798,091 | | |
| Food & Staples Retailing — 1.8% | |
| Casey's General Stores, Inc. | | | 12,551 | | | $ | 295,576 | | |
| Costco Wholesale Corp. | | | 928,292 | | | | 49,078,798 | | |
| CVS Corp. | | | 365,636 | | | | 11,301,809 | | |
| Kroger Co. (The) | | | 1,344,295 | | | | 31,012,886 | | |
| Safeway, Inc. | | | 1,135,280 | | | | 39,235,277 | | |
| SUPERVALU, Inc. | | | 98,710 | | | | 3,528,883 | | |
| Sysco Corp. | | | 2,229,368 | | | | 81,951,568 | | |
| Walgreen Co. | | | 1,063,420 | | | | 48,800,344 | | |
| Wal-Mart Stores, Inc. | | | 2,141,995 | | | | 98,917,329 | | |
| | | $ | 364,122,470 | | |
| Food Products — 2.5% | |
| Archer-Daniels-Midland Co. | | | 1,376,641 | | | $ | 43,997,446 | | |
| Campbell Soup Co. | | | 1,295,515 | | | | 50,382,578 | | |
| ConAgra Foods, Inc. | | | 954,451 | | | | 25,770,177 | | |
| Dean Foods Co.(1) | | | 286,449 | | | | 12,111,064 | | |
| Del Monte Foods Co. | | | 99,492 | | | | 1,097,397 | | |
| General Mills, Inc. | | | 151,524 | | | | 8,727,782 | | |
| H.J. Heinz Co. | | | 292,513 | | | | 13,166,010 | | |
| Hershey Co. (The) | | | 497,578 | | | | 24,779,384 | | |
| J.M. Smucker Co. (The) | | | 7,152 | | | | 346,657 | | |
| Security | | Shares | | Value | |
| Food Products (continued) | |
| Kellogg Co. | | | 54,076 | | | $ | 2,707,045 | | |
| Kraft Foods, Inc. | | | 465 | | | | 16,601 | | |
| Nestle SA(2) | | | 275,000 | | | | 97,368,672 | | |
| Sara Lee Corp. | | | 4,504,598 | | | | 76,713,304 | | |
| Smithfield Foods, Inc.(1) | | | 3,650,830 | | | | 93,680,298 | | |
| TreeHouse Foods, Inc.(1) | | | 64,797 | | | | 2,021,666 | | |
| Tyson Foods, Inc., Class A | | | 265,272 | | | | 4,363,724 | | |
| William Wrigley Jr. Co. | | | 996,034 | | | | 51,514,878 | | |
| | | $ | 508,764,683 | | |
| Gas Utilities — 0.0% | |
| National Fuel Gas Co. | | | 4,000 | | | $ | 154,160 | | |
| | | $ | 154,160 | | |
| Health Care Equipment & Supplies — 1.0% | |
| Advanced Medical Optics, Inc.(1) | | | 9,834 | | | $ | 346,157 | | |
| Baxter International, Inc. | | | 241,562 | | | | 11,206,061 | | |
| Becton, Dickinson and Co. | | | 63,708 | | | | 4,469,116 | | |
| Biomet, Inc. | | | 419,890 | | | | 17,328,860 | | |
| Boston Scientific Corp.(1) | | | 1,138,837 | | | | 19,565,220 | | |
| DENTSPLY International, Inc. | | | 7,701 | | | | 229,875 | | |
| Edwards Lifesciences Corp.(1) | | | 3,070 | | | | 144,413 | | |
| Hillenbrand Industries, Inc. | | | 188,606 | | | | 10,737,340 | | |
| Hospira, Inc.(1) | | | 114,611 | | | | 3,848,637 | | |
| Medtronic, Inc. | | | 1,886,733 | | | | 100,959,083 | | |
| Medtronic, Inc.(3)(4) | | | 7,500 | | | | 401,074 | | |
| St. Jude Medical, Inc.(1) | | | 84,585 | | | | 3,092,428 | | |
| Stryker Corp. | | | 151,918 | | | | 8,372,201 | | |
| Zimmer Holdings, Inc.(1) | | | 302,863 | | | | 23,738,402 | | |
| | | $ | 204,438,867 | | |
| Health Care Providers & Services — 1.9% | |
| AmerisourceBergen Corp. | | | 369,925 | | | $ | 16,631,828 | | |
| Cardinal Health, Inc. | | | 2,189,814 | | | | 141,089,716 | | |
| Caremark Rx, Inc. | | | 1,087,504 | | | | 62,107,353 | | |
| CIGNA Corp. | | | 15,036 | | | | 1,978,287 | | |
| Express Scripts, Inc.(1) | | | 74,800 | | | | 5,355,680 | | |
| Health Management Associates, Inc., Class A | | | 124,425 | | | | 2,626,612 | | |
| Henry Schein, Inc.(1) | | | 1,143,408 | | | | 56,004,124 | | |
| McKesson Corp. | | | 2,631 | | | | 133,392 | | |
| Medco Health Solutions, Inc.(1) | | | 174,081 | | | | 9,302,889 | | |
| Sunrise Senior Living, Inc.(1) | | | 8,000 | | | | 245,760 | | |
See notes to financial statements
21
Tax-Managed Growth Portfolio as of December 31, 2006
PORTFOLIO OF INVESTMENTS CONT'D
| Security | | Shares | | Value | |
| Health Care Providers & Services (continued) | |
| Tenet Healthcare Corp.(1) | | | 3,478 | | | $ | 24,242 | | |
| Unitedhealth Group | | | 453,594 | | | | 24,371,606 | | |
| WellPoint, Inc.(1) | | | 834,692 | | | | 65,681,913 | | |
| | | $ | 385,553,402 | | |
| Health Care Technology — 0.0% | |
| IMS Health, Inc. | | | 120,055 | | | $ | 3,299,111 | | |
| | | $ | 3,299,111 | | |
| Hotels, Restaurants & Leisure — 1.5% | |
| Bob Evans Farms, Inc. | | | 49,985 | | | $ | 1,710,487 | | |
| Brinker International, Inc. | | | 185,881 | | | | 5,606,171 | | |
| Carnival Corp.(2) | | | 550,082 | | | | 26,981,522 | | |
| Darden Restaurants, Inc. | | | 184,714 | | | | 7,419,961 | | |
| Gaylord Entertainment Co.(1) | | | 428,482 | | | | 21,822,588 | | |
| International Game Technology | | | 409,904 | | | | 18,937,565 | | |
| International Speedway Corp., Class A | | | 118,344 | | | | 6,040,278 | | |
| Jack in the Box, Inc.(1) | | | 74,400 | | | | 4,541,376 | | |
| Marriott International, Inc., Class A | | | 395,881 | | | | 18,891,441 | | |
| McDonald's Corp. | | | 915,891 | | | | 40,601,448 | | |
| MGM MIRAGE(1) | | | 188,890 | | | | 10,832,842 | | |
| OSI Restaurant Partners, Inc. | | | 1,034,548 | | | | 40,554,282 | | |
| Papa John's International, Inc.(1) | | | 157,179 | | | | 4,559,763 | | |
| Sonic Corp.(1) | | | 43,809 | | | | 1,049,226 | | |
| Starbucks Corp.(1) | | | 2,254,271 | | | | 79,846,279 | | |
| Wyndham Worldwide Corp.(1) | | | 128,223 | | | | 4,105,700 | | |
| Yum! Brands, Inc. | | | 247,333 | | | | 14,543,180 | | |
| | | $ | 308,044,109 | | |
| Household Durables — 0.4% | |
| Blyth, Inc. | | | 583,297 | | | $ | 12,103,413 | | |
| D.R. Horton, Inc. | | | 637,557 | | | | 16,888,885 | | |
| Fortune Brands, Inc. | | | 115,429 | | | | 9,856,482 | | |
| Leggett & Platt, Inc. | | | 1,794,941 | | | | 42,899,090 | | |
| Newell Rubbermaid, Inc. | | | 291,589 | | | | 8,441,502 | | |
| | | $ | 90,189,372 | | |
| Household Products — 3.1% | |
| Clorox Co. (The) | | | 14,873 | | | $ | 954,103 | | |
| Colgate-Palmolive Co. | | | 702,684 | | | | 45,843,104 | | |
| Energizer Holdings, Inc.(1) | | | 168,981 | | | | 11,995,961 | | |
| Kimberly-Clark Corp. | | | 1,398,706 | | | | 95,042,073 | | |
| Procter & Gamble Co. (The) | | | 7,412,101 | | | | 476,375,731 | | |
| | | $ | 630,210,972 | | |
| Security | | Shares | | Value | |
Independent Power Producers &
Energy Traders — 0.1% | |
| AES Corp. (The)(1) | | | 40,339 | | | $ | 889,072 | | |
| Dynegy, Inc., Class A(1) | | | 22,688 | | | | 164,261 | | |
| TXU Corp. | | | 196,092 | | | | 10,630,147 | | |
| | | $ | 11,683,480 | | |
| Industrial Conglomerates — 2.9% | |
| 3M Co. | | | 911,246 | | | $ | 71,013,401 | | |
| General Electric Co. | | | 12,987,699 | | | | 483,272,280 | | |
| Teleflex, Inc. | | | 14,497 | | | | 935,926 | | |
| Textron, Inc. | | | 12,838 | | | | 1,203,819 | | |
| Tyco International, Ltd.(2) | | | 1,125,841 | | | | 34,225,566 | | |
| | | $ | 590,650,992 | | |
| Insurance — 5.8% | |
| Aegon, N.V. (ADR) | | | 5,182,849 | | | $ | 98,214,989 | | |
| AFLAC, Inc. | | | 2,198,053 | | | | 101,110,438 | | |
| Allstate Corp. (The) | | | 191,646 | | | | 12,478,071 | | |
| American International Group, Inc. | | | 6,322,481 | | | | 453,068,988 | | |
| AON Corp. | | | 517,325 | | | | 18,282,266 | | |
| Arthur J. Gallagher & Co. | | | 557,196 | | | | 16,465,142 | | |
| Berkshire Hathaway, Inc., Class A(1) | | | 641 | | | | 70,503,590 | | |
| Berkshire Hathaway, Inc., Class B(1) | | | 40,436 | | | | 148,238,376 | | |
| Chubb Corp. (The) | | | 30,869 | | | | 1,633,279 | | |
| Commerce Group, Inc. (The) | | | 84,309 | | | | 2,508,193 | | |
| Hartford Financial Services Group, Inc. (The) | | | 45,700 | | | | 4,264,267 | | |
| Lincoln National Corp. | | | 224,854 | | | | 14,930,306 | | |
| Manulife Financial Corp.(2) | | | 210,896 | | | | 7,126,176 | | |
| Marsh & McLennan Cos., Inc. | | | 478,800 | | | | 14,680,008 | | |
| MetLife, Inc. | | | 803,028 | | | | 47,386,682 | | |
| Old Republic International Corp. | | | 300,685 | | | | 6,999,947 | | |
| Principal Financial Group, Inc. | | | 113,328 | | | | 6,652,354 | | |
| Progressive Corp. (The) | | | 3,784,948 | | | | 91,671,441 | | |
| SAFECO Corp. | | | 161,000 | | | | 10,070,550 | | |
| St. Paul Travelers Cos., Inc. (The) | | | 349,428 | | | | 18,760,789 | | |
| Torchmark Corp. | | | 318,929 | | | | 20,334,913 | | |
| UnumProvident Corp. | | | 53,710 | | | | 1,116,094 | | |
| XL Capital Ltd., Class A(2) | | | 187,100 | | | | 13,474,942 | | |
| | | $ | 1,179,971,801 | | |
See notes to financial statements
22
Tax-Managed Growth Portfolio as of December 31, 2006
PORTFOLIO OF INVESTMENTS CONT'D
| Security | | Shares | | Value | |
| Internet & Catalog Retail — 0.2% | |
| Amazon.com, Inc.(1) | | | 42,476 | | | $ | 1,676,103 | | |
| Expedia, Inc.(1) | | | 403,096 | | | | 8,456,954 | | |
| IAC/InterActiveCorp(1) | | | 429,832 | | | | 15,972,557 | | |
| Liberty Media Corp. - Interactive(1) | | | 275,760 | | | | 5,948,143 | | |
| | | $ | 32,053,757 | | |
| Internet Software & Services — 0.4% | |
| eBay, Inc.(1) | | | 1,257,244 | | | $ | 37,805,327 | | |
| Google, Inc., Class A(1) | | | 91,634 | | | | 42,195,624 | | |
| | | $ | 80,000,951 | | |
| IT Services — 2.5% | |
| Accenture Ltd., Class A(2) | | | 2,739,520 | | | $ | 101,170,474 | | |
| Acxiom Corp. | | | 455,893 | | | | 11,693,655 | | |
| Affiliated Computer Services, Inc.(1) | | | 183,730 | | | | 8,973,373 | | |
| Automatic Data Processing, Inc. | | | 1,491,647 | | | | 73,463,615 | | |
| BISYS Group, Inc. (The)(1) | | | 65,000 | | | | 839,150 | | |
| Computer Sciences Corp.(1) | | | 226,702 | | | | 12,099,086 | | |
| DST Systems, Inc.(1) | | | 72,199 | | | | 4,521,823 | | |
| Electronic Data Systems Corp. | | | 1,252 | | | | 34,493 | | |
| Fidelity National Information Services, Inc. | | | 42,862 | | | | 1,718,338 | | |
| First Data Corp. | | | 3,488,152 | | | | 89,017,639 | | |
| Fiserv, Inc.(1) | | | 832,355 | | | | 43,632,049 | | |
| Gartner, Inc., Class A(1) | | | 30,576 | | | | 605,099 | | |
| Paychex, Inc. | | | 1,623,499 | | | | 64,193,150 | | |
| Perot Systems Corp.(1) | | | 649,037 | | | | 10,637,716 | | |
| Safeguard Scientifics, Inc.(1) | | | 26,579 | | | | 64,321 | | |
| Western Union Co. | | | 3,488,152 | | | | 78,204,368 | | |
| | | $ | 500,868,349 | | |
| Leisure Equipment & Products — 0.0% | |
| Eastman Kodak Co. | | | 90,761 | | | $ | 2,341,634 | | |
| Mattel, Inc. | | | 30,514 | | | | 691,447 | | |
| | | $ | 3,033,081 | | |
| Life Sciences Tools & Services — 0.2% | |
| Dionex Corp.(1) | | | 37,300 | | | $ | 2,115,283 | | |
| Invitrogen Corp.(1) | | | 429,910 | | | | 24,328,607 | | |
| PerkinElmer, Inc. | | | 254,526 | | | | 5,658,113 | | |
| Waters Corp.(1) | | | 97,439 | | | | 4,771,588 | | |
| | | $ | 36,873,591 | | |
| Security | | Shares | | Value | |
| Machinery — 3.6% | |
| Caterpillar, Inc. | | | 185,437 | | | $ | 11,372,851 | | |
| Danaher Corp. | | | 4,060,343 | | | | 294,131,247 | | |
| Deere & Co. | | | 3,312,500 | | | | 314,919,375 | | |
| Donaldson Co., Inc. | | | 77,792 | | | | 2,700,160 | | |
| Dover Corp. | | | 532,425 | | | | 26,099,474 | | |
| Illinois Tool Works, Inc. | | | 1,656,572 | | | | 76,517,061 | | |
| ITT Industries, Inc. | | | 8,428 | | | | 478,879 | | |
| Nordson Corp. | | | 72,383 | | | | 3,606,845 | | |
| Parker Hannifin Corp. | | | 35,571 | | | | 2,734,698 | | |
| | | $ | 732,560,590 | | |
| Media — 4.9% | |
| ADVO, Inc. | | | 750,000 | | | $ | 24,450,000 | | |
| Belo Corp., Class A | | | 330,817 | | | | 6,080,416 | | |
| Cablevision Systems Corp., Class A | | | 4 | | | | 114 | | |
| Catalina Marketing Corp. | | | 79,803 | | | | 2,194,583 | | |
| CBS Corp., Class A | | | 14,887 | | | | 464,772 | | |
| CBS Corp., Class B | | | 556,629 | | | | 17,355,692 | | |
| Clear Channel Communications, Inc. | | | 129,887 | | | | 4,616,184 | | |
| Comcast Corp., Class A(1) | | | 1,895,538 | | | | 80,238,124 | | |
| Comcast Corp., Class A Special(1) | | | 2,367,010 | | | | 99,130,379 | | |
| Discovery Holding Co., Class A(1) | | | 102,540 | | | | 1,649,869 | | |
| E.W. Scripps Co. (The), Class A | | | 51,066 | | | | 2,550,236 | | |
| EchoStar Communications Corp., Class A(1) | | | 35,150 | | | | 1,336,755 | | |
| Entercom Communications Corp. | | | 220,000 | | | | 6,199,600 | | |
| Gannett Co., Inc. | | | 423,389 | | | | 25,598,099 | | |
| Havas SA (ADR) | | | 3,142,938 | | | | 17,367,670 | | |
| Idearc, Inc.(1) | | | 23,103 | | | | 661,901 | | |
| Interpublic Group of Companies, Inc., (The)(1) | | | 932,692 | | | | 11,416,150 | | |
| Lamar Advertising Co.(1) | | | 241,409 | | | | 15,785,735 | | |
| Liberty Global, Inc., Class A(1) | | | 46,731 | | | | 1,362,209 | | |
| Liberty Global, Inc., Class C(1) | | | 48,416 | | | | 1,355,648 | | |
| Liberty Media Holding Corp.-Capital, Series A(1) | | | 55,152 | | | | 5,403,793 | | |
| Liberty Media Holding Corp.-Capital, Series B(1) | | | 526 | | | | 51,614 | | |
| Live Nation, Inc.(1) | | | 16,410 | | | | 367,584 | | |
| McClatchy Co., (The), Class A | | | 9,394 | | | | 406,760 | | |
| McGraw-Hill Companies, Inc., (The) | | | 482,884 | | | | 32,845,770 | | |
| New York Times Co. (The), Class A | | | 300,468 | | | | 7,319,400 | | |
| News Corp., Class A | | | 187,934 | | | | 4,036,822 | | |
| Omnicom Group, Inc. | | | 2,410,418 | | | | 251,985,098 | | |
| Publicis Groupe(1) | | | 329,132 | | | | 13,849,518 | | |
| Time Warner, Inc. | | | 4,059,654 | | | | 88,419,264 | | |
| Tribune Co. | | | 1,694,658 | | | | 52,161,573 | | |
See notes to financial statements
23
Tax-Managed Growth Portfolio as of December 31, 2006
PORTFOLIO OF INVESTMENTS CONT'D
| Security | | Shares | | Value | |
| Media (continued) | |
| Univision Communications, Inc., Class A(1) | | | 27,009 | | | $ | 956,659 | | |
| Viacom, Inc., Class A(1) | | | 13,791 | | | | 565,569 | | |
| Viacom, Inc., Class B(1) | | | 524,573 | | | | 21,523,230 | | |
| Vivendi SA (ADR) | | | 174,913 | | | | 6,815,149 | | |
| Walt Disney Co. (The) | | | 4,955,298 | | | | 169,818,062 | | |
| Washington Post Co. (The), Class B | | | 16,470 | | | | 12,280,032 | | |
| WPP Group PLC(2) | | | 139,450 | | | | 1,881,113 | | |
| WPP Group PLC (ADR) | | | 256,051 | | | | 17,344,895 | | |
| | | $ | 1,007,846,041 | | |
| Metals & Mining — 0.3% | |
| Alcoa, Inc. | | | 85,947 | | | $ | 2,579,269 | | |
| Nucor Corp. | | | 741,928 | | | | 40,553,784 | | |
| Phelps Dodge Corp. | | | 29,724 | | | | 3,558,557 | | |
| Steel Dynamics, Inc. | | | 623,600 | | | | 20,235,820 | | |
| | | $ | 66,927,430 | | |
| Multiline Retail — 1.6% | |
| 99 Cents Only Stores(1) | | | 807,619 | | | $ | 9,828,723 | | |
| Dollar General Corp. | | | 52,668 | | | | 845,848 | | |
| Dollar Tree Stores, Inc.(1) | | | 646,996 | | | | 19,474,580 | | |
| Family Dollar Stores, Inc. | | | 2,249,176 | | | | 65,968,332 | | |
| Federated Department Stores, Inc. | | | 231,607 | | | | 8,831,175 | | |
| J.C. Penney Company, Inc. | | | 130,349 | | | | 10,083,799 | | |
| Nordstrom, Inc. | | | 131,384 | | | | 6,482,487 | | |
| Sears Holdings Corp.(1) | | | 4,563 | | | | 766,265 | | |
| Target Corp. | | | 3,504,497 | | | | 199,931,554 | | |
| | | $ | 322,212,763 | | |
| Multi-Utilities — 0.0% | |
| Ameren Corp. | | | 5,000 | | | $ | 268,650 | | |
| Dominion Resources, Inc. | | | 3,249 | | | | 272,396 | | |
| PG&E Corp. | | | 3,000 | | | | 141,990 | | |
| TECO Energy, Inc. | | | 20,354 | | | | 350,699 | | |
| Wisconsin Energy Corp. | | | 9,576 | | | | 454,477 | | |
| | | $ | 1,488,212 | | |
| Office Electronics — 0.0% | |
| Xerox Corp.(1) | | | 22,878 | | | $ | 387,782 | | |
| Zebra Technologies Corp., Class A(1) | | | 13,500 | | | | 469,665 | | |
| | | $ | 857,447 | | |
| Security | | Shares | | Value | |
| Oil, Gas & Consumable Fuels — 10.1% | |
| Anadarko Petroleum Corp. | | | 5,118,262 | | | $ | 222,746,762 | | |
| Apache Corp. | | | 2,145,450 | | | | 142,693,880 | | |
| BP PLC (ADR) | | | 5,110,159 | | | | 342,891,669 | | |
| Chevron Corp. | | | 545,679 | | | | 40,123,777 | | |
| ConocoPhillips | | | 6,155,436 | | | | 442,883,620 | | |
| Devon Energy Corp. | | | 818,602 | | | | 54,911,822 | | |
| El Paso Corp. | | | 97,665 | | | | 1,492,321 | | |
| Exxon Mobil Corp. | | | 7,018,803 | | | | 537,850,874 | | |
| Hess Corp. | | | 56,192 | | | | 2,785,437 | | |
| Kinder Morgan, Inc. | | | 1,762,113 | | | | 186,343,450 | | |
| Marathon Oil Corp. | | | 19,294 | | | | 1,784,695 | | |
| Murphy Oil Corp. | | | 39,036 | | | | 1,984,981 | | |
| Newfield Exploration Co.(1) | | | 30,851 | | | | 1,417,603 | | |
| Royal Dutch Shell PLC (ADR) | | | 116,941 | | | | 8,278,253 | | |
| Total SA (ADR) | | | 762,250 | | | | 54,821,020 | | |
| Valero Energy Corp. | | | 11,481 | | | | 587,368 | | |
| Williams Cos., Inc. (The) | | | 223,515 | | | | 5,838,212 | | |
| | | $ | 2,049,435,744 | | |
| Paper and Forest Products — 0.1% | |
| International Paper Co. | | | 150,301 | | | $ | 5,125,264 | | |
| MeadWestvaco Corp. | | | 45,590 | | | | 1,370,435 | | |
| Neenah Paper, Inc. | | | 33,028 | | | | 1,166,549 | | |
| Weyerhaeuser Co. | | | 85,020 | | | | 6,006,663 | | |
| | | $ | 13,668,911 | | |
| Personal Products — 0.3% | |
| Avon Products, Inc. | | | 173,400 | | | $ | 5,729,136 | | |
| Estee Lauder Cos., Inc., (The) Class A | | | 1,160,940 | | | | 47,389,571 | | |
| | | $ | 53,118,707 | | |
| Pharmaceuticals — 6.6% | |
| Abbott Laboratories | | | 3,244,908 | | | $ | 158,059,469 | | |
| Allergan, Inc. | | | 138,300 | | | | 16,560,042 | | |
| Bristol-Myers Squibb Co. | | | 4,735,992 | | | | 124,651,309 | | |
| Eli Lilly & Co. | | | 3,934,161 | | | | 204,969,788 | | |
| Forest Laboratories, Inc.(1) | | | 56,729 | | | | 2,870,487 | | |
| GlaxoSmithKline PLC (ADR) | | | 419,815 | | | | 22,149,439 | | |
| Johnson & Johnson | | | 3,883,957 | | | | 256,418,841 | | |
| King Pharmaceuticals, Inc.(1) | | | 152,305 | | | | 2,424,696 | | |
| Merck & Co., Inc. | | | 2,720,051 | | | | 118,594,224 | | |
| Mylan Laboratories, Inc. | | | 27,992 | | | | 558,720 | | |
See notes to financial statements
24
Tax-Managed Growth Portfolio as of December 31, 2006
PORTFOLIO OF INVESTMENTS CONT'D
| Security | | Shares | | Value | |
| Pharmaceuticals (continued) | |
| Novo Nordisk A/S (ADR) | | | 269,510 | | | $ | 22,539,121 | | |
| Pfizer, Inc. | | | 9,928,570 | | | | 257,149,963 | | |
| Schering-Plough Corp. | | | 1,739,845 | | | | 41,129,936 | | |
| Sepracor, Inc.(1) | | | 4,000 | | | | 246,320 | | |
| Shering AG (ADR) | | | 25,000 | | | | 3,334,543 | | |
| Teva Pharmaceutical Industries, Ltd. (ADR) | | | 1,676,190 | | | | 52,095,985 | | |
| Watson Pharmaceuticals, Inc.(1) | | | 562,702 | | | | 14,647,133 | | |
| Wyeth | | | 828,310 | | | | 42,177,545 | | |
| | | $ | 1,340,577,561 | | |
| Real Estate Investment Trusts (REITs) — 0.0% | |
| ProLogis | | | 104,563 | | | $ | 6,354,294 | | |
| | | $ | 6,354,294 | | |
| Real Estate Management & Development — 0.0% | |
| Forest City Enterprises, Inc., Class A | | | 58,779 | | | $ | 3,432,694 | | |
| Realogy Corp.(1) | | | 160,279 | | | | 4,859,659 | | |
| | | $ | 8,292,353 | | |
| Road & Rail — 0.1% | |
| Avis Budget Group, Inc. | | | 64,111 | | | $ | 1,390,568 | | |
| Burlington Northern Santa Fe Corp. | | | 192,210 | | | | 14,187,020 | | |
| CSX Corp. | | | 76,268 | | | | 2,625,907 | | |
| Heartland Express, Inc. | | | 1 | | | | 15 | | |
| Kansas City Southern(1) | | | 6,815 | | | | 197,499 | | |
| Norfolk Southern Corp. | | | 3,990 | | | | 200,657 | | |
| Union Pacific Corp. | | | 14,580 | | | | 1,341,652 | | |
| | | $ | 19,943,318 | | |
| Semiconductors & Semiconductor Equipment — 1.9% | |
| Agere Systems, Inc.(1) | | | 7,696 | | | $ | 147,532 | | |
| Analog Devices, Inc. | | | 600,378 | | | | 19,734,425 | | |
| Applied Materials, Inc. | | | 1,094,431 | | | | 20,192,252 | | |
| Broadcom Corp., Class A(1) | | | 911,708 | | | | 29,457,286 | | |
| Cypress Semiconductor Corp.(1) | | | 52,742 | | | | 889,758 | | |
| Intel Corp. | | | 11,168,974 | | | | 226,171,724 | | |
| KLA-Tencor Corp. | | | 148,373 | | | | 7,381,557 | | |
| Linear Technology Corp. | | | 395,760 | | | | 11,999,443 | | |
| LSI Logic Corp.(1) | | | 132,810 | | | | 1,195,290 | | |
| Maxim Integrated Products, Inc. | | | 263,099 | | | | 8,056,091 | | |
| Skyworks Solutions, Inc.(1) | | | 98,685 | | | | 698,690 | | |
| Teradyne, Inc.(1) | | | 7,248 | | | | 108,430 | | |
| Security | | Shares | | Value | |
Semiconductors & Semiconductor
Equipment (continued) | |
| Texas Instruments, Inc. | | | 2,086,420 | | | $ | 60,088,896 | | |
| Verigy, Ltd.(1)(2) | | | 29,129 | | | | 517,040 | | |
| Xilinx, Inc. | | | 23,033 | | | | 548,416 | | |
| | | $ | 387,186,830 | | |
| Software — 2.0% | |
| Adobe Systems, Inc.(1) | | | 489,938 | | | $ | 20,146,251 | | |
| CA, Inc. | | | 39,583 | | | | 896,555 | | |
| Cadence Design Systems, Inc.(1) | | | 269,092 | | | | 4,819,438 | | |
| Compuware Corp.(1) | | | 150,944 | | | | 1,257,364 | | |
| Electronic Arts, Inc.(1) | | | 21,405 | | | | 1,077,956 | | |
| Fair Isaac Corp. | | | 236,946 | | | | 9,631,855 | | |
| Intuit, Inc.(1) | | | 997,878 | | | | 30,445,258 | | |
| Jack Henry & Associates, Inc. | | | 201,006 | | | | 4,301,528 | | |
| Microsoft Corp. | | | 6,910,072 | | | | 206,334,750 | | |
| Oracle Corp.(1) | | | 4,797,138 | | | | 82,222,945 | | |
| SAP AG (ADR) | | | 615,900 | | | | 32,704,290 | | |
| Symantec Corp.(1) | | | 197,186 | | | | 4,111,328 | | |
| Wind River Systems, Inc.(1) | | | 59,479 | | | | 609,660 | | |
| | | $ | 398,559,178 | | |
| Specialty Retail — 1.8% | |
| Abercrombie & Fitch Co., Class A | | | 5,929 | | | $ | 412,836 | | |
| AutoNation, Inc.(1) | | | 890,018 | | | | 18,975,184 | | |
| Best Buy Co., Inc. | | | 170,415 | | | | 8,382,714 | | |
| CarMax, Inc.(1) | | | 61,533 | | | | 3,300,015 | | |
| Circuit City Stores, Inc. | | | 104,507 | | | | 1,983,543 | | |
| Gap, Inc. (The) | | | 540,888 | | | | 10,547,316 | | |
| Home Depot, Inc. | | | 4,483,290 | | | | 180,048,926 | | |
| Limited Brands, Inc. | | | 603,584 | | | | 17,467,721 | | |
| Lowe's Companies, Inc. | | | 1,785,216 | | | | 55,609,478 | | |
| Office Depot, Inc.(1) | | | 79,998 | | | | 3,053,524 | | |
| Payless ShoeSource, Inc.(1) | | | 23,100 | | | | 758,142 | | |
| Pep Boys (The) - Manny, Moe & Jack | | | 62,500 | | | | 928,750 | | |
| RadioShack Corp. | | | 502,318 | | | | 8,428,896 | | |
| Sherwin-Williams Co. (The) | | | 35,899 | | | | 2,282,458 | | |
| Staples, Inc. | | | 275,430 | | | | 7,353,981 | | |
| TJX Companies, Inc. (The) | | | 1,716,834 | | | | 48,895,432 | | |
| Tween Brands, Inc.(1) | | | 8,057 | | | | 321,716 | | |
| | | $ | 368,750,632 | | |
See notes to financial statements
25
Tax-Managed Growth Portfolio as of December 31, 2006
PORTFOLIO OF INVESTMENTS CONT'D
| Security | | Shares | | Value | |
Textiles, Apparel & Luxury
Goods — 1.0% | |
| Coach, Inc.(1) | | | 735,936 | | | $ | 31,615,811 | | |
| Hanesbrands, Inc.(1) | | | 563,704 | | | | 13,314,689 | | |
| NIKE, Inc., Class B | | | 1,529,222 | | | | 151,438,855 | | |
| | | $ | 196,369,355 | | |
| Thrifts & Mortgage Finance — 0.3% | |
| Fannie Mae | | | 335,606 | | | $ | 19,931,640 | | |
| Freddie Mac | | | 146,695 | | | | 9,960,591 | | |
| MGIC Investment Corp. | | | 95,045 | | | | 5,944,114 | | |
| Washington Mutual, Inc. | | | 625,699 | | | | 28,463,048 | | |
| | | $ | 64,299,393 | | |
| Tobacco — 0.3% | |
| Altria Group, Inc. | | | 621,907 | | | $ | 53,372,059 | | |
| | | $ | 53,372,059 | | |
| Trading Companies & Distributors — 0.0% | |
| United Rentals, Inc.(1) | | | 391,179 | | | $ | 9,947,682 | | |
| | | $ | 9,947,682 | | |
| Wireless Telecommunication Services — 0.5% | |
| Alltel Corp. | | | 1,421,969 | | | $ | 86,000,685 | | |
| Sprint Nextel Corp. | | | 344,624 | | | | 6,509,947 | | |
| Telephone & Data Systems, Inc., Special Shares | | | 25,844 | | | | 1,281,862 | | |
| Telephone and Data Systems, Inc. | | | 25,844 | | | | 1,404,105 | | |
| Vodafone Group PLC (ADR) | | | 299,500 | | | | 8,320,110 | | |
| | | $ | 103,516,709 | | |
Total Common Stocks
(identified cost $13,972,240,872) | | | | | | $ | 20,334,849,302 | | |
| Convertible Preferred Stocks — 0.0% | |
| Security | | Shares | | Value | |
Independent Power Producers & Energy
Traders — 0.0% | |
| Enron Corp.(1)(3) | | | 11,050 | | | $ | 0 | | |
| | | $ | 0 | | |
Total Convertible Preferred Stocks
(identified cost $16,626,069) | | | | | | $ | 0 | | |
| Other Issues — 0.0% | |
| Security | | Shares | | Value | |
| Commercial Banks — 0.0% | |
Wachovia Corp. (Dividend Equalization
Preferred Shares)(1) | | | 166,518 | | | $ | 416 | | |
| | | $ | 416 | | |
| Software — 0.0% | |
| Seagate Technology, Inc. (Tax Refund Rights)(1)(3) | | | 197,392 | | | $ | 0 | | |
| | | $ | 0 | | |
Total Other Issues
(identified cost $39,407) | | | | | | $ | 416 | | |
| Warrants — 0.0% | |
| Security | | Shares | | Value | |
| Communications Equipment — 0.0% | |
| Lucent Technologies, Inc.(1) | | | 18,106 | | | $ | 5,613 | | |
| | | $ | 5,613 | | |
Total Warrants
(identified cost $0) | | | | | | $ | 5,613 | | |
See notes to financial statements
26
Tax-Managed Growth Portfolio as of December 31, 2006
PORTFOLIO OF INVESTMENTS CONT'D
| Affiliated Investments — 0.1% | |
| Description | | Interest
(000's omitted) | | Value | |
| Investment in Cash Management Portfolio, 4.87%(6) | | $ | 21,137 | | | $ | 21,136,709 | | |
Total Affiliated Investments
(at amortized cost, $21,136,709) | | | | $ | 21,136,709 | | |
Total Investments — 99.8%
(identified cost $14,010,043,057) | | | | $ | 20,355,992,040 | | |
| Other Assets, Less Liabilities — 0.2% | | | | $ | 31,300,207 | | |
| Net Assets — 100.0% | | | | $ | 20,387,292,247 | | |
ADR - American Depository Receipt
(1) Non-income producing security.
(2) Foreign security.
(3) Security valued at fair value using methods determined in good faith by or at the direction of the Trustees.
(4) Security subject to restrictions on resale (see Note 7).
(5) Security exempt from registration under Rule 144A of the Securities Act of 1933. These securities may be sold in transactions exempt from registration, normally to qualified institutional buyers. At December 31, 2006, the aggregate value of the securities is $4,870,986 or 0.02% of the Portfolio's net assets.
(6) Affiliated investment investing in high quality, U.S. Dollar denominated money market instruments, and that is available to Eaton Vance portfolios and funds. The rate shown is the annualized seven-day yield as of December 31, 2006.
See notes to financial statements
27
Tax-Managed Growth Portfolio as of December 31, 2006
FINANCIAL STATEMENTS
Statement of Assets and Liabilities
As of December 31, 2006
| Assets | |
| Unaffiliated Investments, at value (identified cost, $13,988,906,348) | | $ | 20,334,855,331 | | |
| Affiliated Investments, at value (amortized cost, $21,136,709) | | | 21,136,709 | | |
| Cash | | | 2,010 | | |
| Receivable for investments sold | | | 9,565,416 | | |
| Dividends and interest receivable | | | 28,247,780 | | |
| Tax reclaim receivable | | | 1,478,224 | | |
| Total assets | | $ | 20,395,285,470 | | |
| Liabilities | |
| Payable to affiliate for investment adviser fee | | $ | 7,278,009 | | |
| Payable to affiliate for Trustees' fees | | | 9,161 | | |
| Other accrued expenses | | | 706,053 | | |
| Total liabilities | | $ | 7,993,223 | | |
| Net Assets applicable to investors' interest in Portfolio | | $ | 20,387,292,247 | | |
| Sources of Net Assets | |
| Net proceeds from capital contributions and withdrawals | | $ | 14,041,287,771 | | |
| Net unrealized appreciation (computed on the basis of identified cost) | | | 6,346,004,476 | | |
| Total | | $ | 20,387,292,247 | | |
Statement of Operations
For the Year Ended
December 31, 2006
| Investment Income | |
| Dividends (net of foreign taxes, $5,508,449) | | $ | 352,655,089 | | |
| Interest | | | 2,633,384 | | |
| Security lending income, net | | | 450,588 | | |
| Interest income allocated from affiliated investment | | | 85,831 | | |
| Expense allocated from affiliated investment | | | (7,961 | ) | |
| Total investment income | | $ | 355,816,931 | | |
| Expenses | |
| Investment adviser fee | | $ | 83,323,602 | | |
| Trustees' fees and expenses | | | 28,217 | | |
| Custodian fee | | | 2,217,430 | | |
| Legal and accounting services | | | 92,496 | | |
| Miscellaneous | | | 628,068 | | |
| Total expenses | | $ | 86,289,813 | | |
Deduct —
Reduction of custodian fee | | $ | 99 | | |
| Total expense reductions | | $ | 99 | | |
| Net expenses | | $ | 86,289,714 | | |
| Net investment income | | $ | 269,527,217 | | |
| Realized and Unrealized Gain (Loss) | |
Net realized gain (loss) —
Investment transactions (identified cost basis) | | $ | 644,762,039 | | |
| Foreign currency transactions | | | (23,541 | ) | |
| Net realized gain | | $ | 644,738,498 | | |
Change in unrealized appreciation (depreciation) —
Investments (identified cost basis) | | $ | 1,577,869,222 | | |
| Foreign currency | | | 101,821 | | |
| Net change in unrealized appreciation (depreciation) | | $ | 1,577,971,043 | | |
| Net realized and unrealized gain | | $ | 2,222,709,541 | | |
| Net increase in net assets from operations | | $ | 2,492,236,758 | | |
See notes to financial statements
28
Tax-Managed Growth Portfolio as of December 31, 2006
FINANCIAL STATEMENTS CONT'D
Statements of Changes in Net Assets
Increase (Decrease)
in Net Assets | | Year Ended
December 31, 2006 | | Year Ended
December 31, 2005 | |
From operations —
Net investment income | | $ | 269,527,217 | | | $ | 232,904,646 | | |
Net realized gain from investment
transactions, securities sold short and
foreign currency transactions | | | 644,738,498 | | | | 70,889,149 | | |
Net change in unrealized appreciation
(depreciation) of investments, securities
sold short and foreign currency | | | 1,577,971,043 | | | | 551,019,603 | | |
| Net increase in net assets from operations | | $ | 2,492,236,758 | | | $ | 854,813,398 | | |
Capital transactions —
Contributions | | $ | 1,447,009,081 | | | $ | 1,237,495,815 | | |
| Withdrawals | | | (2,584,560,445 | ) | | | (2,200,844,762 | ) | |
Net decrease in net assets
from capital transactions | | $ | (1,137,551,364 | ) | | $ | (963,348,947 | ) | |
| Net increase (decrease) in net assets | | $ | 1,354,685,394 | | | $ | (108,535,549 | ) | |
| Net Assets | |
| At beginning of year | | $ | 19,032,606,853 | | | $ | 19,141,142,402 | | |
| At end of year | | $ | 20,387,292,247 | | | $ | 19,032,606,853 | | |
See notes to financial statements
29
Tax-Managed Growth Portfolio as of December 31, 2006
FINANCIAL STATEMENTS CONT'D
Supplementary Data
| | | Year Ended December 31, | |
| | | 2006 | | 2005 | | 2004 | | 2003 | | 2002 | |
| Ratios/Supplemental Data | |
| Ratios (As a percentage of average daily net assets): | |
| Expenses before custodian fee reduction | | | 0.45 | % | | | 0.45 | %(2) | | | 0.45 | %(2) | | | 0.45 | % | | | 0.45 | % | |
| Expenses after custodian fee reduction | | | 0.45 | % | | | 0.45 | %(2) | | | 0.45 | %(2) | | | 0.45 | % | | | 0.45 | % | |
| Net investment income | | | 1.39 | % | | | 1.25 | %(2) | | | 1.18 | %(2) | | | 1.05 | % | | | 0.85 | % | |
| Portfolio Turnover(1) | | | 1 | % | | | 0 | %(3) | | | 3 | % | | | 15 | % | | | 23 | % | |
| Total Return | | | 13.69 | % | | | 4.70 | % | | | 9.67 | % | | | 23.88 | % | | | (19.52 | )% | |
| Net assets, end of year (000's omitted) | | $ | 20,387,292 | | | $ | 19,032,607 | | | $ | 19,141,142 | | | $ | 17,609,589 | | | $ | 14,571,522 | | |
(1) Excludes the value of the portfolio securities contributed or distributed as a result of in-kind shareholder transactions. The total turnover rate of the Portfolio including in-kind contributions and distributions was 7%, 6%, 10%, 21%, and 30% for 2006, 2005, 2004, 2003, and 2002, respectively.
(2) The investment adviser waived a portion of its investment advisory fee (equal to less than 0.01% and 0.01% of average daily net assets for 2005 and 2004, respectively).
(3) Amounts to less than 1%.
See notes to financial statements
30
Tax-Managed Growth Portfolio as of December 31, 2006
NOTES TO FINANCIAL STATEMENTS
1 Significant Accounting Policies
Tax-Managed Growth Portfolio (the Portfolio) is registered under the Investment Company Act of 1940 (the 1940 Act), as amended, as a diversified, open-end management investment company. The Portfolio, which was organized as a trust under the laws of the State of New York on December 1, 1995, seeks to achieve long-term, after-tax returns for its interestholders through investing in a diversified portfolio of equity securities. The Declaration of Trust permits the Trustees to issue interests in the Portfolio. The following is a summary of significant accounting policies consistently followed by the Portfolio in the preparation of its financial statements. The policies are in conformity with accounting principles generally accepted in the United States of America.
A Investment Valuations — Securities listed on a U.S. securities exchange generally are valued at the last sale price on the day of valuation or, if no sales took place on such date, at the mean between the closing bid and asked prices therefore on the exchange where such securities are principally traded. Equity securities listed on the NASDAQ Global Market generally are valued at the official NASDAQ closing price. Unlisted or listed securities for which closing sales prices or closing quotations are not available are valued at the mean between the latest available bid and asked prices or, in the case of preferred equity securities that are not listed or traded in the over-the-counter market, by an i ndependent pricing service. Exchange-traded options are valued at the last sale price for the day of valuation as quoted on the principal exchange or board of trade on which the options are traded or, in the absence of sales on such date, at the mean between the latest bid and asked prices therefore. Futures positions on securities and currencies generally are valued at closing settlement prices. Short-term debt securities with a remaining maturity of 60 days or less are valued at amortized cost. If short-term debt securities are acquired with a remaining maturity of more than 60 days, they will be valued by a pricing service. Other fixed income and debt securities, including listed securities and securities for which price quotations are available, will normally be valued on the basis of valuations furnished by a pricing service. Foreign securities and currencies are valued in U.S. dollars, based on foreign currency exchange rate quotations supplied by an independent quotation service. The daily valuation o f exchange-traded foreign securities generally is determined as of the close of trading on the principal exchange on which such securities trade. Events occurring after the close of trading on foreign exchanges may result in adjustments to the valuation of foreign securities to more accurately reflect their fair value as of the close of regular trading on the New York Stock Exchange. When valuing foreign equity securities that meet certain criteria, the Trustees have approved the use of a fair value service that values such securities to reflect market trading that occurs after the close of the applicable foreign markets of comparable securities or other instruments that have a strong correlation to the fair-valued securities. Investments held by the Portfolio for which valuations or market quotations are unavailable are valued at fair value using methods determined in good faith by or at the direction of the Trustees of the Portfolio co nsidering relevant factors, data and information including the market value of freely tradable securities of the same class in the principal market on which such securities are normally traded.
The Portfolio may invest in Cash Management Portfolio (Cash Management) and Cash Collateral Fund, LLC (Cash Collateral), both are affiliated investment companies managed by Boston Management and Research (BMR) and Eaton Vance Management (EVM), respectively. Cash Management values its investment securities utilizing the amortized cost valuation technique permitted by Rule 2a-7 of the 1940 Act. This technique involves initially valuing a portfolio security at its cost and thereafter assuming a constant amortization to maturity of any discount or premium. Investments in Cash Collateral are valued at the net asset value per share on the valuation date.
B Federal Taxes — The Portfolio has elected to be treated as a partnership for federal tax purposes. No provision is made by the Portfolio for federal or state taxes on any taxable income of the Portfolio because each investor in the Portfolio is ultimately responsible for the payment of any taxes on its share of taxable income. Since at least one of the Portfolio's investors is a regulated investment company that invests all or substantially all of its assets in the Portfolio, the Portfolio normally must satisfy the applicable source of income and diversification requirements (under the Internal Revenue Code) in order for its investors to satisfy them. The Portfolio will allocate, at least annually a mong its investors, each investor's distributive share of the Portfolio's net investment income, net realized capital gains, and any other items of income, gain, loss, deduction or credit.
C Futures Contracts — Upon the entering of a financial futures contract, the Portfolio is required to deposit either in cash or securities an amount (initial margin) equal to a certain percentage of the purchase price indicated in the financial futures contract. Subsequent payments are made or received by the Portfolio (margin maintenance) each day, dependent on daily fluctuations in
31
Tax-Managed Growth Portfolio as of December 31, 2006
NOTES TO FINANCIAL STATEMENTS CONT'D
the value of the underlying security, and are recorded for book purposes as unrealized gains or losses by the Portfolio. The Portfolio's investment in financial futures contracts is designed to hedge against anticipated future changes in the price of current or anticipated portfolio positions. Should prices move unexpectedly, the Portfolio may not achieve the anticipated benefits of the financial futures contracts and may realize a loss.
D Put Options — Upon the purchase of a put option by the Portfolio, the premium paid is recorded as an investment, the value of which is marked-to-market daily. When a purchased option expires, the Portfolio will realize a loss in the amount of the cost of the option. When the Portfolio enters into a closing sale transaction, the Portfolio will realize a gain or loss depending on whether the sales proceeds from the closing sale transaction are greater or less than the cost of the option. When the Portfolio exercises a put option, settlement is made in cash. The risk associated with purchasing options is limited to the premium originally paid.
E Securities Sold Short — The Portfolio may sell individual securities short if it owns at least an equal amount of the security sold short or has at the time of the sale a right to obtain securities equivalent in kind and amount to the securities sold short provided that, if such right is conditional, the sale is made upon the same conditions (a covered short sale). The Portfolio may sell short securities representing an index or basket of securities whose constituents the Portfolio holds in whole or in part. A short sale of an index or basket of securities will be a covered short sale if the underlying index or basket of securities is the same or substantially identical to securities held by the Por tfolio. Upon executing the transaction, the Portfolio records the proceeds as deposits with brokers in the Statement of Assets and Liabilities and establishes an offsetting payable for securities sold short for the securities due on settlement. The proceeds are retained by the broker as collateral for the short position. The liability is marked-to-market and the Portfolio is required to pay the lending broker any dividend or interest income earned while the short position is open. The seller of a short position generally realizes a profit on the transaction if the price it receives on the short sale exceeds the cost of closing out the position by purchasing securities in the market, but generally realizes a loss if the cost of closing out the short position exceeds the proceeds of the short sale. The exposure to loss on covered short sales (to the extent the value of the security sold short rises instead of falls) is offset by the increase in the value of the underlying security or securities retained. The p rofit or loss on a covered short sale is also affected by the borrowing cost of any securities borrowed in connection with the short sale (which will vary with market conditions) and use of the proceeds of the short sale. The Portfolio expects normally to close covered short sales against-the-box by delivering newly acquired stocks. Exposure to loss on an index or basket of securities sold short will not be offset by gains on other securities holdings to the extent that the constituent securities of the index or a basket of securities sold short are not held by the Portfolio. Such losses may be substantial.
F Foreign Currency Translation — Investment valuations, other assets, and liabilities initially expressed in foreign currencies are converted each business day into U.S. dollars based upon current exchange rates. Purchases and sales of foreign investment securities and income and expenses are converted into U.S. dollars based upon currency exchange rates prevailing on the respective dates of such transactions. Recognized gains or losses on investment transactions attributable to changes in foreign currency exchange rates are recorded for financial statement purposes as net realized gains and losses on investments. That portion of unrealized gains and losses on investments that results from fluctuation s in foreign currency exchange rates is not separately disclosed.
G Indemnifications — Under the Portfolio's organizational documents, its officers and Trustees may be indemnified against certain liabilities and expenses arising out of the performance of their duties to the Portfolio. Interestholders in the Portfolio are jointly and severally liable for the liabilities and obligations of the Portfolio in the event that the Portfolio fails to satisfy such liabilities and obligations; provided, however, that, to the extent assets are available in the Portfolio, the Portfolio may, under certain circumstances, indemnify interestholders from and against any claim or liability to which such holder may become subject by reason of being or having been an interestholder in t he Portfolio. Additionally, in the normal course of business, the Portfolio enters into agreements with service providers that may contain indemnification clauses. The Portfolio's maximum exposure under these arrangements is unknown as this would involve future claims that may be made against the Portfolio that have not yet occurred.
H Other — Investment transactions are accounted for on the date the securities are purchased or sold. Realized gains and losses on securities sold are determined on the basis of identified cost. Dividend income is recorded on the ex-dividend date. However, if the ex-dividend date has
32
Tax-Managed Growth Portfolio as of December 31, 2006
NOTES TO FINANCIAL STATEMENTS CONT'D
passed, certain dividends from foreign securities are recorded as the Portfolio is informed of the ex-dividend date. Interest income is recorded on the accrual basis.
I Expense Reduction — Investors Bank & Trust Company (IBT) serves as custodian to the Portfolio. Pursuant to the custodian agreement, IBT receives a fee reduced by credits which are determined based on the average daily cash balance the Portfolio maintains with IBT. All credit balances used to reduce the Portfolio's custodian fees are reported as a reduction of expenses in the Statement of Operations. For the year ended December 31, 2006, there were $99 in credit balances used to reduce the Portfolio's custodian fee.
J Use of Estimates — The preparation of the financial statements in conformity with accounting principles generally accepted in the United States of America requires management to make estimates and assumptions that affect the reported amounts of assets and liabilities at the date of the financial statements and the reported amounts of income and expense during the reporting period. Actual results could differ from those estimates.
2 Investment Adviser Fee and Other Transactions with Affiliates
The investment adviser fee is earned by BMR, a wholly-owned subsidiary of EVM, as compensation for management and investment advisory services rendered to the Portfolio. Under the advisory agreement, BMR receives a monthly advisory fee of 5/96 of 1% (0.625% annually) of the average daily net assets of the Portfolio up to $500,000,000, and at reduced rates as daily net assets exceed that level. Certain of the advisory fee rate reductions are pursuant to an agreement between the Portfolio's Board of Trustees and BMR. Those reductions may not be changed without Trustee and interestholder approval. In addition, the investment adviser fee payable by the Portfolio is reduced by the Portfolio's allocable portion of the advisory fee paid by Cash Management, an affiliated investment company managed by BMR. The Portfolio's allocated portion of the advisory fee paid by Cash Management totaled $7,775 and the advisory fee incurred directly b y the Portfolio amounted to $83,323,602 for the year ended December 31, 2006. For the year ended December 31, 2006, the effective annual rate of investment advisory fees paid or accrued on a direct and indirect basis by the Portfolio, based on average net assets, was 0.43%.
Except for Trustees of the Portfolio who are not members of EVM's or BMR's organization, officers and Trustees receive remuneration for their services to the Portfolio out of such investment adviser fee. Trustees of the Portfolio that are not affiliated with the investment adviser may elect to defer receipt of all or a percentage of their annual fees in accordance with the terms of the Trustees Deferred Compensation Plan. For the year ended December 31, 2006, no significant amounts have been deferred.
Certain officers and Trustees of the Portfolio are officers of the above organizations.
3 Investment Transactions
For the year ended December 31, 2006, purchases and sales of investments, other than short-term obligations, aggregated $112,574,873 and $621,537,755, respectively. In addition, investments having an aggregate market value of $1,585,969,823 at dates of withdrawal were distributed in payment for capital withdrawals and investors contributed securities with a value of $1,240,104,202, during the year ended December 31, 2006.
4 Federal Income Tax Basis of Unrealized Appreciation (Depreciation)
The cost and unrealized appreciation (depreciation) in value of the investments owned at December 31, 2006 as computed on a federal income tax basis, were as follows:
| Aggregate cost | | $ | 4,054,619,301 | | |
| Gross unrealized appreciation | | $ | 26,261,456,216 | | |
| Gross unrealized depreciation | | | (9,960,083,477 | ) | |
| Net unrealized appreciation | | $ | 16,301,372,739 | | |
Unrealized appreciation on foreign currency is $55,493.
5 Financial Instruments
The Portfolio may trade in financial instruments with off-balance sheet risk in the normal course of its investing activities to assist in managing exposure to various market risks. These financial instruments include written options, forward foreign currency exchange contracts and financial futures contracts and may involve, to a varying degree, elements of risk in excess of the amounts recognized for financial statement purposes.
The notional or contractual amounts of these instruments represent the investment the Portfolio has in particular classes of financial instruments and does not necessarily represent the amounts potentially subject to risk. The measurement of the risks associated with these instruments
33
Tax-Managed Growth Portfolio as of December 31, 2006
NOTES TO FINANCIAL STATEMENTS CONT'D
is meaningful only when all related and offsetting transactions are considered. The Portfolio did not have any open obligations under these financial instruments at December 31, 2006.
6 Line of Credit
The Portfolio participates with other portfolios and funds managed by BMR and EVM and its affiliates in a $150 million unsecured line of credit agreement with a group of banks. Borrowings will be made by the Portfolio solely to facilitate the handling of unusual and/or unanticipated short-term cash requirements. Interest is charged to each participating portfolio or fund based on its borrowings at an amount above either the Eurodollar rate or Federal Funds rate. In addition, a fee computed at an annual rate of 0.10% on the daily unused portion of the line of credit is allocated among the participating portfolios and funds at the end of each quarter. The Portfolio did not have any significant borrowings or allocated fees during the year ended December 31, 2006.
7 Restricted Securities
At December 31, 2006, the Portfolio owned the following securities (representing less than 0.01% of net assets) which were restricted as to public resale and not registered under the Securities Act of 1933. The securities are valued at fair value using methods determined in good faith by or at the direction of the Trustees.
| Common Stocks | | Date of
Acquisition | | Eligible
for Resale | | Shares | | Cost | | Fair Value | |
| Medtronic, Inc. | | | 5/18/06 | | | | 5/19/07 | | | | 7,500 | | | $ | 368,372 | | | $ | 401,074 | | |
| | | | | | | | | | | | | | | $ | 368,372 | | | $ | 401,074 | | |
8 Securities Lending Agreement
The Portfolio has established a securities lending agreement with a securities lending agent, IBT, in which the Portfolio lends portfolio securities to qualified borrowers in exchange for collateral consisting of either cash or U.S. government securities in an amount at least equal to the market value of the securities on loan. Cash collateral is invested in Cash Collateral which invests in high quality money market instruments. The Portfolio earns interest on the amount invested in Cash Collateral but it must pay the broker a loan rebate fee computed as a varying percentage of the collateral received. The loan rebate fee paid by the Portfolio amounted to $2,160,185 for the year ended December 31, 2006. In the event of counterparty default, the Portfolio is subject to potential loss if it is delayed or prevented from exercising its right to dispose of the co llateral. The Portfolio bears risk in the event that invested collateral is not sufficient to meet obligations due on loans. The Portfolio did not have any securities on loan at December 31, 2006.
9 Recently Issued Accounting Pronouncements
In June 2006, the Financial Accounting Standards Board (FASB) issued FASB Interpretation No. 48, (FIN 48) "Accounting for Uncertainty in Income Taxes – an interpretation of FASB Statement No. 109". FIN 48 clarifies the accounting for uncertainty in income taxes recognized in accordance with FASB Statement No. 109, "Accounting for Income Taxes." This interpretation prescribes a recognition threshold and measurement attribute for the financial statement recognition and measurement of a tax position taken or expected to be taken in a tax return. It also provides guidance on de-recognition, classification, interest and penalties, accounting in interim periods, disclosure and transition. FIN 48 is effective during the first required financial reporting period for fiscal years beginning after December 15, 2006. Management is currently evaluating the impact of applying the various provisions of FIN 48.
In September 2006, the FASB issued Statement of Financial Accounting Standards No. 157, (FAS 157) "Fair Value Measurements". FAS 157 defines fair value, establishes a framework for measuring fair value in accordance with generally accepted accounting principles and expands disclosure about fair value measurements. FAS 157 is effective for fiscal years beginning after November 15, 2007. Management is currently evaluating the impact the adoption of FAS 157 will have on the Portfolio's financial statement disclosures.
Tax-Managed Growth Portfolio as of December 31, 2006
REPORT OF INDEPENDENT REGISTERED PUBLIC ACCOUNTING FIRM
To the Trustees and Investors of
Tax-Managed Growth Portfolio:
We have audited the accompanying statement of assets and liabilities of Tax-Managed Growth Portfolio (the Portfolio), including the portfolio of investments, as of December 31, 2006, and the related statement of operations for the year then ended, the statements of changes in net assets for each of the two years in the period then ended, and the supplementary data for each of the five years in the period then ended. These financial statements and supplementary data are the responsibility of the Portfolio's management. Our responsibility is to express an opinion on these financial statements and supplementary data based on our audits.
We conducted our audits in accordance with the standards of the Public Company Accounting Oversight Board (United States). Those standards require that we plan and perform the audit to obtain reasonable assurance about whether the financial statements and supplementary data are free of material misstatement. The Portfolio is not required to have, nor were we engaged to perform, an audit of its internal control over financial reporting. Our audits included consideration of internal control over financial reporting as a basis for designing audit procedures that are appropriate in the circumstances, but not for the purpose of expressing an opinion on the effectiveness of the Portfolio's internal control over financial reporting. Accordingly, we express no such opinion. An audit also includes examining, on a test basis, evidence supporting the amounts and disclosures in the financial statements, assessing the accounting principles u sed and significant estimates made by management, as well as evaluating the overall financial statement presentation. Our procedures included confirmation of securities owned as of December 31, 2006 by correspondence with the custodian and brokers; where replies were not received from brokers, we performed other auditing procedures. We believe that our audits provide a reasonable basis for our opinion.
In our opinion, such financial statements and supplementary data referred to above present fairly, in all material respects, the financial position of Tax-Managed Growth Portfolio as of December 31, 2006, the results of its operations for the year then ended, the changes in its net assets for each of the two years in the period then ended, and the supplementary data for each of the five years in the period then ended, in conformity with accounting principles generally accepted in the United States of America.
DELOITTE & TOUCHE LLP
Boston, Massachusetts
February 20, 2007
35
Eaton Vance Tax-Managed Growth Fund 1.2
BOARD OF TRUSTEES' ANNUAL APPROVAL OF THE INVESTMENT ADVISORY AGREEMENT
Overview of the Contract Review Process
The Investment Company Act of 1940, as amended (the "1940 Act"), provides, in substance, that each investment advisory agreement between a fund and its investment adviser will continue in effect from year to year only if its continuance is approved at least annually by the fund's board of trustees, including by a vote of a majority of the trustees who are not "interested persons" of the fund ("Independent Trustees") cast in person at a meeting called for the purpose of considering such approval.
At a meeting of the Boards of Trustees (each a "Board") of the Eaton Vance group of mutual funds (the "Eaton Vance Funds") held on March 27, 2006, the Board, including a majority of the Independent Trustees, voted to approve continuation of existing advisory and sub-advisory agreements for the Eaton Vance Funds for an additional one-year period. In voting its approval, the Board relied upon the affirmative recommendation of the Special Committee of the Board, which is a committee comprised exclusively of Independent Trustees. Prior to making its recommendation, the Special Committee reviewed information furnished for a series of meetings of the Special Committee held in February and March 2006. Such information included, among other things, the following:
Information about Fees, Performance and Expenses
• An independent report comparing the advisory and related fees paid by each fund with fees paid by comparable funds;
• An independent report comparing each fund's total expense ratio and its components to comparable funds;
• An independent report comparing the investment performance of each fund to the investment performance of comparable funds over various time periods;
• Data regarding investment performance in comparison to relevant peer groups of funds and appropriate indices;
• Comparative information concerning fees charged by each adviser for managing other mutual funds and institutional accounts using investment strategies and techniques similar to those used in managing the fund;
• Profitability analyses for each adviser with respect to each fund managed by it;
Information about Portfolio Management
• Descriptions of the investment management services provided to each fund, including the investment strategies and processes employed;
• Information concerning the allocation of brokerage and the benefits received by each adviser as a result of brokerage allocation, including information concerning the acquisition of research through "soft dollar" benefits received in connection with the funds' brokerage, and the implementation of a soft dollar reimbursement program established with respect to the funds;
• Data relating to portfolio turnover rates of each fund;
• The procedures and processes used to determine the fair value of fund assets and actions taken to monitor and test the effectiveness of such procedures and processes;
Information about each Adviser
• Reports detailing the financial results and condition of each adviser;
• Descriptions of the qualifications, education and experience of the individual investment professionals whose responsibilities include portfolio management and investment research for the funds, and information relating to their compensation and responsibilities with respect to managing other mutual funds and investment accounts;
• Copies of the Codes of Ethics of each adviser and its affiliates, together with information relating to compliance with and the administration of such codes;
• Information concerning the resources devoted to compliance efforts undertaken by each adviser and its affiliates on behalf of the funds (including descriptions of various compliance programs) and their record of compliance with investment policies and restrictions, including policies with respect to market-timing, late trading and selective portfolio disclosure, and with policies on personal securities transactions;
• Descriptions of the business continuity and disaster recovery plans of each adviser and its affiliates;
Other Relevant Information
• Information concerning the nature, cost and character of the administrative and other non-investment management services provided by Eaton Vance Management and its affiliates;
• Information concerning management of the relationship with the custodian, subcustodians and fund accountants by each adviser or the funds' administrator; and
• The terms of each advisory agreement.
In addition to the information identified above, the Special Committee considered information provided from time to time by each adviser throughout the year at meetings of the Board and its committees. Over the course of the twelve month period ended March 31, 2006, the Board met nine times and the Special Committee, the Audit Committee and the Governance Committee, each of which is a Committee
36
Eaton Vance Tax-Managed Growth Fund 1.2
BOARD OF TRUSTEES' ANNUAL APPROVAL OF THE INVESTMENT ADVISORY AGREEMENT CONT'D
comprised solely of Independent Trustees, met eight, twelve and five times, respectively. At such meetings, the Trustees received, among other things, presentations by the portfolio managers and other investment professionals of each adviser relating to the investment performance of each fund and the investment strategies used in pursuing the fund's investment objective.
For funds that invest through one or more underlying portfolios, the Board considered similar information about the portfolio(s) when considering the approval of advisory agreements. In addition, in cases where the fund's investment adviser has engaged a sub-adviser, the Board considered similar information about the sub-adviser when considering the approval of any sub-advisory agreement.
The Special Committee was assisted throughout the contract review process by Goodwin Procter LLP, legal counsel for the Independent Trustees. The members of the Special Committee relied upon the advice of such counsel and their own business judgment in determining the material factors to be considered in evaluating each advisory and sub-advisory agreement and the weight to be given to each such factor. The conclusions reached with respect to each advisory and sub-advisory agreement were based on a comprehensive evaluation of all the information provided and not any single factor. Moreover, each member of the Special Committee may have placed varying emphasis on particular factors in reaching conclusions with respect to each advisory and sub-advisory agreement.
Results of the Process
Based on its consideration of the foregoing, and such other information as it deemed relevant, including the factors and conclusions described below, the Special Committee concluded that the continuance of the investment advisory agreement of the Tax-Managed Growth Portfolio (the "Portfolio"), the portfolio in which the Eaton Vance Tax-Managed Growth Fund 1.2 (the "Fund") invests, with Boston Management and Research (the "Adviser"), including its fee structure, is in the interests of shareholders and, therefore, the Special Committee recommended to the Board approval of the agreement. The Board accepted the recommendation of the Special Committee as well as the factors considered and conclusions reached by the Special Committee with respect to the agreement. Accordingly, the Board, including a majority of the Independent Trustees, voted to approve continuation of the investment advisory agreement for the Portfolio.
Nature, Extent and Quality of Services
In considering whether to approve the investment advisory agreement of the Portfolio, the Board evaluated the nature, extent and quality of services provided to the Portfolio by the Adviser.
The Board considered the Adviser's management capabilities and investment process with respect to the types of investments held by the Portfolio, including the education, experience and number of its investment professionals and other personnel who provide portfolio management, investment research, and similar services to the Portfolio. The Board specifically noted the Adviser's in-house equity research capabilities and experience in managing funds that seek to maximize after-tax returns. The Board also took into account the resources dedicated to portfolio management and other services, including the compensation paid to recruit and retain investment personnel, and the time and attention devoted to each Portfolio in the complex by senior management.
The Board reviewed the compliance programs of the Adviser and relevant affiliates thereof. Among other matters, the Board considered compliance and reporting matters relating to personal trading by investment personnel, selective disclosure of portfolio holdings, late trading, frequent trading, portfolio valuation, business continuity and the allocation of investment opportunities. The Board also evaluated the responses of the Adviser and its affiliates to requests from regulatory authorities such as the Securities and Exchange Commission and the National Association of Securities Dealers.
The Board considered shareholder and other administrative services provided or managed by Eaton Vance Management and its affiliates, including transfer agency and accounting services. The Board evaluated the benefits to shareholders of investing in a fund that is a part of a large family of funds, including the ability, in many cases, to exchange an investment among different funds without incurring additional sales charges.
After consideration of the foregoing factors, among others, the Board concluded that the nature, extent and quality of services provided by the Adviser, taken as a whole, are appropriate and consistent with the terms of the investment advisory agreement.
Fund Performance
The Board compared the Fund's investment performance to a relevant universe of similarly managed funds identified by an independent data provider and appropriate benchmark indices. The Board reviewed comparative performance data for the one- and three-year periods ended September 30, 2005 for the Fund. The Board noted the excellent long-term performance record of the underlying Portfolio. The Board noted that, unlike many other funds in its peer group, the Fund is managed by the Adviser with an emphasis on growth-oriented stocks, while value-oriented stocks have generally outperformed growth-oriented stocks in recent years.
37
Eaton Vance Tax-Managed Growth Fund 1.2
BOARD OF TRUSTEES' ANNUAL APPROVAL OF THE INVESTMENT ADVISORY AGREEMENT CONT'D
These differences have adversely affected the Fund's performance in recent years, relative to its peers. The Board concluded that the Fund's performance is satisfactory.
Management Fees and Expenses
The Board reviewed contractual investment advisory fee rates, including administrative fees, payable by the Portfolio and the Fund (referred to collectively as "management fees"). As part of its review, the Board considered the management fees and the Fund's total expense ratio for the one-year period ended September 30, 2005, as compared to a group of similarly managed funds selected by an independent data provider.
After reviewing the foregoing information, and in light of the nature, extent and quality of the services provided by the Adviser, the Board concluded that the management fees charged for advisory and related services and the Fund's total expense ratio are reasonable.
Profitability
The Board reviewed the level of profits realized by the Adviser and relevant affiliates thereof in providing investment advisory and administrative services to the Portfolio, the Fund and to all Eaton Vance Funds as a group. The Board considered the level of profits realized without regard to revenue sharing or other payments by the Adviser and its affiliates to third parties in respect of distribution services. The Board also considered other direct or indirect benefits received by the Adviser and its affiliates in connection with its relationship with the Portfolio and the Fund, including the benefits of research services that may be available to the Adviser as a result of securities transactions effected for the Portfolio and other advisory clients.
The Board concluded that, in light of the foregoing factors and the nature, extent and quality of the services rendered, the profits realized by the Adviser and its affiliates are reasonable.
Economies of Scale
In reviewing management fees and profitability, the Board also considered the extent to which the Adviser and its affiliates, on the one hand, and the Fund, on the other hand, can expect to realize benefits from economies of scale as the assets of the Fund and the Portfolio increase. The Board acknowledged the difficulty in accurately measuring the benefits resulting from the economies of scale with respect to the management of any specific fund or group of funds. The Board reviewed data summarizing the increases and decreases in the assets of the Fund and of all Eaton Vance Funds as a group over various time periods, and evaluated the extent to which the total expense ratio of the Fund and the profitability of the Adviser and its affiliates may have been affected by such increases or decreases. The Board noted that, at its request, the Adviser had agreed to add a breakpoint with respect to assets that exceed $20 billion. Based upon the foregoing, the Board concluded that the benefits from economies of scale are currently being shared equitably by the Adviser and its affiliates and the Fund. The Board also concluded that, assuming reasonably foreseeable increases in the assets of the Portfolio, the structure of the advisory fee, which includes breakpoints at several asset levels, can be expected to cause the Adviser and its affiliates and the Fund to continue to share such benefits equitably.
38
Eaton Vance Tax-Managed Growth Fund 1.2
MANAGEMENT AND ORGANIZATION
Fund Management. The Trustees of Eaton Vance Mutual Funds Trust (the Trust) and Tax-Managed Growth Portfolio (the Portfolio) are responsible for the overall management and supervision of the Trust's and Portfolio's affairs. The Trustees and officers of the Trust and the Portfolio are listed below. Except as indicated, each individual has held the office shown or other offices in the same company for the last five years. Trustees and officers of the Trust and the Portfolio hold indefinite terms of office. The "noninterested Trustees" consist of those Trustees who are not "interested persons" of the Trust and the Portfolio, as that term is defined under the 1940 Act. The business address of each Trustee and officer is The Eaton Vance Building, 255 State Street, Boston, Massachusetts 02109. As used below, "EVC" refers to Eaton Vance Corp., "EV" refers to Eaton Vance, Inc., "EVM" refers to Eaton Vance Management, "BMR" refers to Boston Management and Research, "EVD" refers to Eaton Vance Distributors, Inc. and "Parametric" refers to Parametric Portfolio Associates. EVC and EV are the corporate parent and trustee, respectively, of EVM and BMR. EVD is the Fund's principal underwriter, the Portfolio's placement agent and a wholly-owned subsidiary of EVM. Each officer affiliated with Eaton Vance may hold a position with other Eaton Vance affiliates that is comparable to his or her position with EVM listed below.
Name and
Date of Birth | | Position(s)
with the
Trust and the
Portfolio | | Term of
Office and
Length of
Service | | Principal Occupation(s)
During Past Five Years | | Number of Portfolios
in Fund Complex
Overseen By
Trustee(1) | | Other Directorships Held | |
| Interested Trustee | | | | | | | | | | | | | |
|
| James B. Hawkes 11/9/41 | | Trustee | | Trustee of the Trust since 1991 and of the Portfolio since 1997 | | Chairman and Chief Executive Officer of EVC, BMR, EVM and EV; Director of EV; Vice President and Director of EVD. Trustee and/or officer of 170 registered investment companies in the Eaton Vance Fund Complex. Mr. Hawkes is an interested person because of his positions with BMR, EVM, EVC and EV, which are affiliates of the Trust and Portfolio. | | | 170 | | | Director of EVC | |
|
| Noninterested Trustee(s) | | | | | | | | | | | | | |
|
| Benjamin C. Esty 1/2/63 | | Trustee | | Since 2005 | | Roy and Elizabeth Simmons Professor of Business Administration, Harvard University Graduate School of Business Administration (since 2003). Formerly, Associate Professor, Harvard University Graduate School of Business Administration (2000-2003). | | | 170 | | | None | |
|
| Samuel L. Hayes, III 2/23/35 | | Trustee and Chairman of the Board | | Trustee of the Trust since 1986; of the Portfolio since 1995 and Chairman of the Board since 2005 | | Jacob H. Schiff Professor of Investment Banking Emeritus, Harvard University Graduate School of Business Administration. Director of Yakima Products, Inc. (manufacturer of automotive accessories) (since 2001) and Director of Telect, Inc. (telecommunications services company). | | | 170 | | | Director of Tiffany & Co.
(specialty retailer) | |
|
| William H. Park 9/19/47 | | Trustee | | Since 2003 | | Vice Chairman, Commercial Industrial Finance Corp. (specialty finance company) (since 2006). Formerly, President and Chief Executive Officer, Prizm Capital Management, LLC (investment management firm) (2002-2005). Formerly, Executive Vice President and Chief Financial Officer, United Asset Management Corporation (a holding company owning institutional investment management firms) (1982-2001). | | | 170 | | | None | |
|
| Ronald A. Pearlman 7/10/40 | | Trustee | | Since 2003 | | Professor of Law, Georgetown University Law Center. | | | 170 | | | None | |
|
| Norton H. Reamer 9/21/35 | | Trustee | | Trustee of the Trust since 1986 and of the Portfolio since 1995 | | President, Chief Executive Officer and a Director of Asset Management Finance Corp. (a specialty finance company serving the investment management industry) (since October 2003). President, Unicorn Corporation (an investment and financial advisory services company) (since September 2000). Formerly, Chairman and Chief Operating Officer, Hellman, Jordan Management Co., Inc. (an investment management company) (2000-2003). Formerly, Advisory Director of Berkshire Capital Corporation (investment banking firm) (2002-2003). | | | 170 | | | None | |
|
39
Eaton Vance Tax-Managed Growth Fund 1.2
MANAGEMENT AND ORGANIZATION CONT'D
Name and
Date of Birth | | Position(s)
with the
Trust and the
Portfolio | | Term of
Office and
Length of
Service | | Principal Occupation(s)
During Past Five Years | | Number of Portfolios
in Fund Complex
Overseen By
Trustee(1) | | Other Directorships Held | |
| Noninterested Trustee(s) (continued) | | | | | | | | | | | |
|
| Lynn A. Stout 9/14/57 | | Trustee | | Trustee of the Trust since 1998 and of the Portfolio since 2003 | | Professor of Law, University of California at Los Angeles School of Law. | | | 170 | | | None | |
|
| Ralph F. Verni 1/26/43 | | Trustee | | Since 2005 | | Consultant and private investor. | | | 170 | | | None | |
|
| Principal Officers who are not Trustees | | | | | | | | | | | |
|
Name and
Date of Birth | | Position(s)
with the
Trust and the
Portfolio | | Term of
Office and
Length of
Service | | Principal Occupation(s)
During Past Five Years | |
| Thomas E. Faust Jr. 5/31/58 | | President of the Trust and Vice President of the Portfolio | | Since 2002 | | President of EVC, EVM, BMR and EV and Director of EVC. Chief Investment Officer of EVC, EVM and BMR. Officer of 71 registered investment companies and 5 private investment companies managed by EVM or BMR. | |
|
| William H. Ahern, Jr. 7/28/59 | | Vice President
of the Trust | | Since 1995 | | Vice President of EVM and BMR. Officer of 71 registered investment companies managed by EVM or BMR. | |
|
| Cynthia J. Clemson 3/2/63 | | Vice President
of the Trust | | Since 2005 | | Vice President of EVM and BMR. Officer of 86 registered investment companies managed by EVM or BMR. | |
|
| Aamer Khan 6/7/60 | | Vice President
of the Trust | | Since 2005 | | Vice President of EVM and BMR. Officer of 29 registered investment companies managed by EVM or BMR. | |
|
| Thomas H. Luster 4/8/62 | | Vice President
of the Trust | | Since 2006 | | Vice President of EVM and BMR. Officer of 45 registered investment companies managed by EVM or BMR. | |
|
| Michael R. Mach 7/15/47 | | Vice President
of the Trust | | Since 1999 | | Vice President of EVM and BMR. Officer of 51 registered investment companies managed by EVM or BMR. | |
|
| Robert B. MacIntosh 1/22/57 | | Vice President
of the Trust | | Since 1998 | | Vice President of EVM and BMR. Officer of 86 registered investment companies managed by EVM or BMR. | |
|
| Lewis R. Piantedosi 8/10/65 | | Vice President
of the Portfolio | | Since 2006 | | Vice President of EVM and BMR. Officer of 5 registered investment companies managed by EVM or BMR. | |
|
| Cliff Quisenberry, Jr. 1/1/65 | | Vice President
of the Trust | | Since 2006 | | Vice President and Director of Research and Product Development of Parametric. Officer of 30 registered investment companies managed by EVM or BMR. | |
|
| Duncan W. Richardson 10/26/57 | | Vice President of the Trust and President of the Portfolio | | Vice President of the Trust since 2001 and President of the Portfolio since 2002(2) | | Executive Vice President and Chief Equity Investment Officer of EVC, EVM and BMR. Officer of 71 registered investment companies managed by EVM or BMR. | |
|
| Walter A. Row, III 7/20/57 | | Vice President
of the Trust | | Since 2001 | | Director of Equity Research and a Vice President of EVM and BMR. Officer of 33 registered investment companies managed by EVM or BMR. | |
|
| Judith A. Saryan 8/21/54 | | Vice President
of the Trust | | Since 2003 | | Vice President of EVM and BMR. Officer of 50 registered investment companies managed by EVM or BMR. | |
|
| Susan Schiff 3/13/61 | | Vice President
of the Trust | | Since 2002 | | Vice President of EVM and BMR. Officer of 30 registered investment companies managed by EVM or BMR. | |
|
| Barbara E. Campbell 6/19/57 | | Treasurer of the Trust | | Since 2005(2) | | Vice President of EVM and BMR. Officer of 170 registered investment companies managed by EVM or BMR. | |
|
| Alan R. Dynner 10/10/40 | | Secretary | | Since 1997 | | Vice President, Secretary and Chief Legal Officer of BMR, EVM, EVD, EV and EVC. Officer of 170 registered investment companies managed by EVM or BMR. | |
|
40
Eaton Vance Tax-Managed Growth Fund 1.2
MANAGEMENT AND ORGANIZATION CONT'D
| Principal Officers who are not Trustees (continued) | |
|
Name and
Date of Birth | | Position(s)
with the
Trust and the
Portfolio | | Term of
Office and
Length of
Service | | Principal Occupation(s)
During Past Five Years | |
| Michelle A. Green 8/25/69 | | Treasurer of
the Portfolio | | Since 2002(2) | | Vice President of EVM and BMR. Officer of 63 registered investment companies managed by EVM or BMR. | |
|
| Paul M. O'Neil 7/11/53 | | Chief Compliance Officer | | Since 2004 | | Vice President of EVM and BMR. Officer of 170 registered investment companies managed by EVM or BMR. | |
|
(1) Includes both master and feeder funds in a master-feeder structure.
(2) Prior to 2002, Ms. Green served as Assistant Treasurer of the Portfolio since 1998 and Mr. Richardson served as Vice President of the Portfolio since 1995. Prior to 2005, Ms. Campbell served as Assistant Treasurer of the Trust since 1995.
The SAI for the Fund includes additional information about the Trustees and officers of the Fund and the Portfolio and can be obtained without charge on Eaton Vance's website at www.eatonvance.com or by calling 1-800-225-6265.
41
This Page Intentionally Left Blank
This Page Intentionally Left Blank
This Page Intentionally Left Blank
Investment Adviser of Tax-Managed Growth Portfolio
Boston Management and Research
The Eaton Vance Building
255 State Street
Boston, MA 02109
Administrator of Eaton Vance Tax-Managed Growth Fund 1.2
Eaton Vance Management
The Eaton Vance Building
255 State Street
Boston, MA 02109
Principal Underwriter
Eaton Vance Distributors, Inc.
The Eaton Vance Building
255 State Street
Boston, MA 02109
(617) 482-8260
Custodian
Investors Bank & Trust Company
200 Clarendon Street
Boston, MA 02116
Transfer Agent
PFPC Inc.
Attn: Eaton Vance Funds
P.O. Box 9653
Providence, RI 02940-9653
(800) 262-1122
Independent Registered Public Accounting Firm
Deloitte & Touche LLP
200 Berkeley Street
Boston, MA 02116-5022
Eaton Vance Tax-Managed Growth Fund 1.2
The Eaton Vance Building
255 State Street
Boston, MA 02109
This report must be preceded or accompanied by a current prospectus. Before investing, investors should consider carefully the Fund's investment objective(s), risks, and charges and expenses. The Fund's current prospectus contains this and other information about the Fund and is available through your financial advisor. Please read the prospectus carefully before you invest or send money. For further information please call 1-800-225-6265.
1088-2/07 TGSRC1.2
Item 2. Code of Ethics
The registrant has adopted a code of ethics applicable to its Principal Executive Officer, Principal Financial Officer and Principal Accounting Officer. The registrant undertakes to provide a copy of such code of ethics to any person upon request, without charge, by calling 1-800-262-1122.
Item 3. Audit Committee Financial Expert
The registrant’s Board has designated William H. Park, Samuel L. Hayes, III and Norton H. Reamer, each an independent trustee, as its audit committee financial experts. Mr. Park is a certified public accountant who is the Vice Chairman of Commercial Industrial Finance Corp (specialty finance company). Previously, he served as President and Chief Executive Officer of Prizm Capital Management, LLC (investment management firm) and as Executive Vice President and Chief Financial Officer of United Asset Management Corporation (“UAM”) (a holding company owning institutional investment management firms). Mr. Hayes is the Jacob H. Schiff Professor of Investment Banking Emeritus of the Harvard University Graduate School of Business Administration. Mr. Reamer is the President, Chief Executive Officer and a Director of Asset Management Finance Corp. (a specialty finance company serving the investment management industry) and is President of Unicorn Corporation (an investment and financial advisory services company). Formerly, Mr. Reamer was Chairman and Chief Operating Officer of Hellman, Jordan Management Co., Inc. (an investment management company) and Advisory Director of Berkshire Capital Corporation (an investment banking firm), Chairman of the Board of UAM and Chairman, President and Director of the UAM Funds (mutual funds).
Item 4. Principal Accountant Fees and Services
(a)-(d)
Eaton Vance Cash Management Fund, Eaton Vance Money Market Fund, Eaton Vance Tax Free Reserves, Eaton Vance AMT-Free Municipal Bond Fund, Eaton Vance Tax-Managed Growth Fund 1.1 and Eaton Vance Tax-Managed Growth Fund 1.2 (the “Fund(s)”) are series of Eaton Vance Mutual Funds Trust (the “Trust”), a Massachusetts business trust, which, including the Funds, contains a total of 25 series (the “Series”). The Trust is registered under the Investment Company Act of 1940 as an open-end management investment company. This Form N-CSR relates to the Funds’ annual reports.
The following tables present the aggregate fees billed to each Fund for the Fund’s respective fiscal years ended December 31, 2005 and December 31, 2006 by the Fund’s principal accountant for professional services rendered for the audit of the Fund’s annual financial statements and fees billed for other services rendered by the principal accountant during those periods.
Eaton Vance Cash Management Fund
Fiscal Years Ended | | 12/31/05 | | 12/31/06 | |
| | | | | |
Audit Fees | | $ | 10,900 | | $ | 11,900 | |
| | | | | |
Audit-Related Fees(1) | | 0 | | 0 | |
| | | | | |
Tax Fees(2) | | $ | 5,550 | | $ | 5,875 | |
| | | | | |
All Other Fees(3) | | 0 | | 0 | |
| | | | | |
Total | | $ | 16,450 | | $ | 17,775 | |
Eaton Vance Money Market Fund
Fiscal��Years Ended | | 12/31/05 | | 12/31/06 | |
| | | | | |
Audit Fees | | $ | 10,900 | | $ | 11,900 | |
| | | | | |
Audit-Related Fees(1) | | 0 | | 0 | |
| | | | | |
Tax Fees(2) | | $ | 5,525 | | $ | 5,875 | |
| | | | | |
All Other Fees(3) | | 0 | | 0 | |
| | | | | |
Total | | $ | 16,425 | | $ | 17,775 | |
Eaton Vance Tax Free Reserves Fund
Fiscal Years Ended | | 12/31/05 | | 12/31/06 | |
| | | | | |
Audit Fees | | $ | 24,100 | | $ | 26,400 | |
| | | | | |
Audit-Related Fees(1) | | 0 | | 0 | |
| | | | | |
Tax Fees(2) | | $ | 5,525 | | $ | 5,850 | |
| | | | | |
All Other Fees(3) | | 0 | | 0 | |
| | | | | |
Total | | $ | 29,625 | | $ | 32,250 | |
Eaton Vance AMT-Free Municipal Bond Fund
Fiscal Years Ended | | 12/31/05 | | 12/31/06 | |
| | | | | |
Audit Fees | | $ | 46,775 | | $ | 49,390 | |
| | | | | |
Audit-Related Fees(1) | | 0 | | 0 | |
| | | | | |
Tax Fees(2) | | $ | 5,880 | | $ | 6,100 | |
| | | | | |
All Other Fees(3) | | 0 | | 0 | |
| | | | | |
Total | | $ | 52,655 | | $ | 55,490 | |
Eaton Vance Tax-Managed Managed Growth Fund 1.1
Fiscal Years Ended | | 12/31/05 | | 12/31/06 | |
| | | | | |
Audit Fees | | $ | 12,055 | | $ | 12,490 | |
| | | | | |
Audit-Related Fees(1) | | 0 | | 0 | |
| | | | | |
Tax Fees(2) | | $ | 5,565 | | $ | 5,775 | |
| | | | | |
All Other Fees(3) | | 0 | | 0 | |
| | | | | |
Total | | $ | 17,620 | | $ | 18,265 | |
Eaton Vance Tax-Managed Managed Growth Fund 1.2
Fiscal Years Ended | | 12/31/05 | | 12/31/06 | |
| | | | | |
Audit Fees | | $ | 12,055 | | $ | 12,490 | |
| | | | | |
Audit-Related Fees(1) | | 0 | | 0 | |
| | | | | |
Tax Fees(2) | | $ | 5,565 | | $ | 5,775 | |
| | | | | |
All Other Fees(3) | | 0 | | 0 | |
| | | | | |
Total | | $ | 17,620 | | $ | 18,265 | |
(1) Audit-related fees consist of the aggregate fees billed for assurance and related services that are reasonably related to the performance of the audit of financial statements and are not reported under the category of audit fees.
(2) Tax fees consist of the aggregate fees billed for professional services rendered by the principal accountant relating to tax compliance, tax advice, and tax planning and specifically include fees for tax return preparation.
(3) All other fees consist of the aggregate fees billed for products and services provided by the principal accountant other than audit, audit-related, and tax services.
The various Series comprising the Trust have differing fiscal year ends (October 31 or December 31). In addition, the Series differ as to principal accountant; i.e., certain Series have PricewaterhouseCoopers LLP (“PWC) as a principal accountant and other Series have Deloitte & Touche LLP (“D&T”) as a principal accountant. The following table presents the aggregate audit, audit-related, tax, and other fees billed to all of the Series in the Trust by each Series’ respective principal accountant for the last two fiscal years of each Series.
Fiscal Years Ended | | 10/31/05 | | 12/31/05 | | 10/31/06 | | 12/31/06 | |
| | PWC | | D&T | | PWC | | D&T | | PWC | | D&T | | PWC | | D&T | |
| | | | | | | | | | | | | | | | | |
Audit Fees | | $ | 0 | | $ | 37,220 | | $ | 91,800 | | $ | 70,885 | | $ | 0 | | $ | 43,070 | | $ | 50,200 | | $ | 68,370 | |
| | | | | | | | | | | | | | | | | |
Audit-Related Fees(1) | | $ | 0 | | $ | 0 | | $ | 0 | | $ | 0 | | $ | 0 | | $ | 0 | | $ | 0 | | $ | 0 | |
| | | | | | | | | | | | | | | | | |
Tax Fees(2) | | $ | 0 | | $ | 18,585 | | $ | 16,600 | | $ | 17,010 | | $ | 0 | | $ | 19,290 | | $ | 17,600 | | $ | 17,650 | |
| | | | | | | | | | | | | | | | | |
All Other Fees(3) | | $ | 0 | | 0 | | $ | 0 | | 0 | | $ | 0 | | $ | 0 | | $ | 0 | | $ | 0 | |
| | | | | | | | | | | | | | | | | |
Total | | $ | 0 | | $ | 55,805 | | $ | 108,400 | | $ | 87,895 | | $ | 0 | | $ | 62,360 | | $ | 67,800 | | $ | 86,020 | |
(1) Audit-related fees consist of the aggregate fees billed for assurance and related services that are reasonably related to the performance of the audit of financial statements and are not reported under the category of audit fees.
(2) Tax fees consist of the aggregate fees billed for professional services rendered by the principal accountant relating to tax compliance, tax advice, and tax planning and specifically include fees for tax return preparation.
(3) All other fees consist of the aggregate fees billed for products and services provided by the principal accountant other than audit, audit-related, and tax services.
During the Funds’ fiscal years ended December 31, 2005 and December 31, 2006, $35,000 was billed for each such fiscal year by D&T, the principal accountant for the Funds, for work done in connection with its Rule 17Ad-13 examination of Eaton Vance Management’s assertion that it has maintained an effective internal control structure over the sub-transfer agent and registrar functions, such services being pre-approved in accordance with Rule 2-01(c) (7) (ii) of Regulation S-X.
(e)(1) The registrant’s audit committee has adopted policies and procedures relating to the pre-approval of services provided by the registrant’s principal accountant (the “Pre-Approval Policies”). The Pre-Approval Policies establish a framework intended to assist the audit committee in the proper discharge of its pre-approval responsibilities. As a general matter, the Pre-Approval Policies (i) specify certain types of audit, audit-related, tax, and other services determined to be pre-approved by the audit committee; and (ii) delineate specific procedures governing the mechanics of the pre-approval process, including the approval and monitoring of audit and non-audit service fees. Unless a service is specifically pre-approved under the Pre-Approval Policies, it must be separately pre-approved by the audit committee.
The Pre-Approval Policies and the types of audit and non-audit services pre-approved therein must be reviewed and ratified by the registrant’s audit committee at least annually. The registrant’s audit committee maintains full responsibility for the appointment, compensation, and oversight of the work of the registrant’s principal accountant.
(e)(2) No services described in paragraphs (b)-(d) above were approved by the registrant’s audit committee pursuant to the “de minimis exception” set forth in Rule 2-01(c)(7)(i)(C) of Regulation S-X.
(f) Not applicable.
(g) The following table presents (i) the aggregate non-audit fees (i.e., fees for audit-related, tax, and other services) billed for services rendered to all of the Series in the Trust by each Series’s respective principal accountant for the last two fiscal years of each Series; and (ii) the aggregate non-audit fees (i.e., fees for audit-related, tax, and other services) billed to the Eaton Vance organization by each Series’ respective principal accountant for the last 2 fiscal years of each Series.
Fiscal Years Ended | | 10/31/05 | | 12/31/05 | | 10/31/06 | | 12/31/06 | |
| | PWC | | D&T | | PWC | | D&T | | PWC | | D&T | | PWC | | D&T | |
| | | | | | | | | | | | | | | | | |
Registrant(1) | | $ | 0 | | $ | 18,585 | | $ | 16,600 | | $ | 17,010 | | $ | 0 | | $ | 19,290 | | $ | 17,600 | | $ | 17,650 | |
| | | | | | | | | | | | | | | | | |
Eaton Vance(2) | | $ | 33,235 | | $ | 223,443 | | $ | 61,422 | | $ | 179,500 | | $ | 68,486 | | $ | 72,100 | | $ | 100,698 | | $ | 69,600 | |
| | | | | | | | | | | | | | | | | |
(1) Includes all of the Series of the Trust.
(2) During the fiscal years reported above, certain of the Funds were “feeder” funds in a “master-feeder” fund structure or funds of funds. Various subsidiaries of Eaton Vance Corp. act in either an investment advisory and/or service provider capacity with respect to the Series and/or their respective “master” funds (if applicable).
(h) The registrant’s audit committee has considered whether the provision by the registrant’s principal accountant of non-audit services to the registrant’s investment adviser and any entity controlling, controlled by, or under common control with the adviser that provides ongoing services to the registrant that were not pre-approved pursuant to Rule 2-01(c)(7)(ii) of Regulation S-X is compatible with maintaining the principal accountant’s independence.
Item 5. Audit Committee of Listed registrants
Not required in this filing.
Item 6. Schedule of Investments
Please see schedule of investments contained in the Report to Stockholders included under Item 1 of this Form N-CSR.
Item 7. Disclosure of Proxy Voting Policies and Procedures for Closed-End Management Investment Companies
Not required in this filing.
Item 8. Portfolio Managers of Closed-End Management Investment Companies
Not required in this filing.
Item 9. Purchases of Equity Securities by Closed-End Management Investment Company and Affiliated Purchasers.
Not required in this filing.
Item 10. Submission of Matters to a Vote of Security Holders.
No Material Changes.
Item 11. Controls and Procedures
(a) It is the conclusion of the registrant’s principal executive officer and principal financial officer that the effectiveness of the registrant’s current disclosure controls and procedures (such disclosure controls and procedures having been evaluated within 90 days of the date of this filing) provide reasonable assurance that the information required to be disclosed by the registrant has been recorded, processed, summarized and reported within the time period specified in the Commission’s rules and forms and that the information required to be disclosed by the registrant has been accumulated and communicated to the registrant’s principal executive officer and principal financial officer in order to allow timely decisions regarding required disclosure.
(b) There have been no changes in the registrant’s internal controls over financial reporting during the second fiscal quarter of the period covered by this report that has materially affected, or is reasonably likely to materially affect, the registrant’s internal control over financial reporting.
Item 12. Exhibits
(a)(1) | | Registrant’s Code of Ethics — Not applicable (please see Item 2). |
(a)(2)(i) | | Treasurer’s Section 302 certification. |
(a)(2)(ii) | | President’s Section 302 certification. |
(b) | | Combined Section 906 certification. |
Signatures
Pursuant to the requirements of the Securities Exchange Act of 1934 and the Investment Company Act of 1940, the registrant has duly caused this report to be signed on its behalf by the undersigned, thereunto duly authorized.
Eaton Vance Mutual Funds Trust
By: | | /s/ Thomas E. Faust, Jr. |
| | Thomas E. Faust, Jr. |
| | President |
Date: | | February 16, 2007 |
Pursuant to the requirements of the Securities Exchange Act of 1934 and the Investment Company Act of 1940, this report has been signed below by the following persons on behalf of the registrant and in the capacities and on the dates indicated.
By: | | /s/ Barbara E. Campbell |
| | Barbara E. Campbell |
| | Treasurer |
Date: | | February 16, 2007 |
By: | | /s/ Thomas E. Faust, Jr. |
| | Thomas E. Faust, Jr. |
| | President |
Date: | | February 16, 2007 |