UNITED STATES
SECURITIES AND EXCHANGE COMMISSION
Washington, D.C. 20549
Form N-CSR
CERTIFIED SHAREHOLDER REPORT OF REGISTERED
MANAGEMENT INVESTMENT COMPANIES
Investment Company Act File Number: 811-04015
Eaton Vance Mutual Funds Trust
(Exact Name of Registrant as Specified in Charter)
Two International Place, Boston, Massachusetts 02110
(Address of Principal Executive Offices)
Deidre E. Walsh
Two International Place, Boston, Massachusetts 02110
(Name and Address of Agent for Services)
(617) 482-8260
(Registrant’s Telephone Number)
September 30
Date of Fiscal Year End
September 30, 2023
Date of Reporting Period
Item 1. Reports to Stockholders
Eaton Vance
Total Return Bond Fund
Annual Report
September 30, 2023
Commodity Futures Trading Commission Registration. The Commodity Futures Trading Commission (“CFTC”) has adopted regulations that subject registered investment companies and advisers to regulation by the CFTC if a fund invests more than a prescribed level of its assets in certain CFTC-regulated instruments (including futures, certain options and swap agreements) or markets itself as providing investment exposure to such instruments. The investment adviser has claimed an exclusion from the definition of “commodity pool operator” under the Commodity Exchange Act with respect to its management of the Fund. Accordingly, neither the Fund nor the adviser with respect to the operation of the Fund is subject to CFTC regulation. Because of its management of other strategies, the Fund's adviser is registered with the CFTC as a commodity pool operator. The adviser is also registered as a commodity trading advisor.
Fund shares are not insured by the FDIC and are not deposits or other obligations of, or guaranteed by, any depository institution. Shares are subject to investment risks, including possible loss of principal invested.
This report must be preceded or accompanied by a current summary prospectus or prospectus. Before investing, investors should consider carefully the investment objective, risks, and charges and expenses of a mutual fund. This and other important information is contained in the summary prospectus and prospectus, which can be obtained from a financial intermediary. Prospective investors should read the prospectus carefully before investing. For further information, please call 1-800-262-1122.
Annual Report September 30, 2023
Eaton Vance
Total Return Bond Fund
Eaton Vance
Total Return Bond Fund
September 30, 2023
Management’s Discussion of Fund Performance†
Economic and Market Conditions
For fixed-income investors, the dominant event during the 12-month period ended September 30, 2023, was the series of U.S. Federal Reserve (Fed) interest rate hikes -- six during the period, and 11 in total -- that brought the federal funds rate to its highest level in 22 years.
But while the Fed’s campaign to tamp down inflation led to negative performance for government bonds, corporate bond returns were strongly positive during the period -- buoyed in part by the very factors that were fueling inflation: record low unemployment, strong job creation, and robust consumer spending.
By the summer of 2023, a majority of economists and market observers seemed to be coming around to the view that Jerome Powell’s Fed might be able to accomplish what had seldom, if ever, been done before: raise rates significantly to lower inflation and still bring the economy in for a soft landing without a recession.
One cloud that hung over fixed-income markets during the period, however, was fear that even after it finished raising rates, the Fed would leave rates higher for longer than investors had previously anticipated. During the final two months of the period -- and especially after the Fed’s September 2023 meeting -- longer-term interest rates rose dramatically, as investor expectations of how high rates would go -- and how long they would stay there -- seemed to get higher and longer.
Against the backdrop of the Fed’s aggressive monetary tightening campaign, U.S. Treasurys were the worst-performing major fixed-income asset class during the 12-month period, with the Bloomberg U.S. Treasury Index returning -0.81%.
In contrast, the strong U.S. economy and increasing confidence in a soft-landing scenario served as tailwinds for investment-grade corporate bonds. Even in a rising-rate environment, the Bloomberg U.S. Corporate Bond Index returned 3.65% during the period.
High yield bonds were the standout performer among major fixed-income asset classes, with the Bloomberg U.S. Corporate High Yield Index returning 10.28% during the period. With a strong U.S. economy helping keep bond defaults low, and a recession looking increasingly remote, investors gravitated toward riskier investments with greater yields.
Asset-backed securities -- including bonds backed by automobile and consumer loans -- benefited from strong consumer balance sheets and spending during the period, with the Bloomberg U.S. Asset-Backed Securities Index returning 2.81%.
Mortgage-backed securities (MBS), however, were dogged by two technical factors that depressed prices, causing the Bloomberg U.S. Mortgage-Backed Securities Index to return -0.17% during the period. As the Fed lowered its balance sheet, it sold off much of its MBS holdings. And several regional banks that had been significant buyers of MBS were forced by the banking crisis of March 2023 to liquidate their assets. The resulting release of a significant amount of MBS into the market led prices to fall and the asset class to deliver negative returns.
Fund Performance
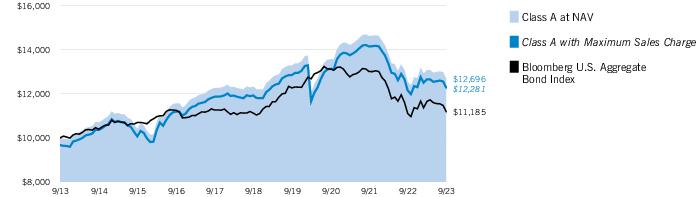
For the 12-month period ended September 30, 2023, Eaton Vance Total Return Bond Fund (the Fund) returned 1.03% for Class A shares at net asset value (NAV), outperforming its benchmark, the Bloomberg U.S. Aggregate Bond Index (the Index), which returned 0.64%.
During a period marked by a significant rise in interest rates, the Fund’s overweight position in the short end of the yield curve -- where duration, or sensitivity to interest rate changes, was lower -- and underweight position in the long end of the curve -- where duration was higher -- contributed to Fund performance versus the Index. The benefit of this duration strategy was especially pronounced during the final two months of the period, when the yield curve steepened as long-term rates rose dramatically.
The Fund’s overweight allocation to asset-backed securities (ABS) also contributed to Fund returns relative to the Index, as ABS generally outperformed the Index. Within the asset class, security selections -- including data-center bonds buoyed by enthusiasm for artificial intelligence-related investments -- helped Index-relative performance during the period.
The Fund’s out-of-Index allocation to high yield bonds, which outperformed most other areas of the fixed-income market during the period, contributed to relative performance as well.
An overweight allocation to investment-grade corporate bonds, which outperformed the Index, also helped returns versus the Index. Within the asset class, the Fund’s overweight positions in higher credit-quality financial services firms benefited Index-relative returns. Higher quality companies were largely unaffected by the regional banking crisis of March 2023, and financial services firms were able to adjust to inflationary pressures faster than industrial firms within the asset class.
See Endnotes and Additional Disclosures in this report.
Past performance is no guarantee of future results. Returns are historical and are calculated by determining the percentage change in net asset value (NAV) or offering price (as applicable) with all distributions reinvested. Furthermore, returns do not reflect the deduction of taxes that shareholders may have to pay on Fund distributions or upon the redemption of Fund shares. Investment return and principal value will fluctuate so that shares, when redeemed, may be worth more or less than their original cost. Performance for periods less than or equal to one year is cumulative. Performance is for the stated time period only; due to market volatility, current Fund performance may be lower or higher than the quoted return. For performance as of the most recent month-end, please refer to eatonvance.com.
Eaton Vance
Total Return Bond Fund
September 30, 2023
Management’s Discussion of Fund Performance† — continued
In addition, the Fund’s out-of-Index allocation to non-agency mortgage-backed securities (MBS) -- which were largely unaffected by the technical factors that caused agency MBS within the Index to deliver negative returns -- contributed to Index-relative performance. The Fund’s non-agency MBS holdings consisted mainly of low-interest mortgages originated in 2018-2020 that had built up significant equity. Those securities performed strongly during the period.
In contrast, the Fund’s overweight allocation to non-agency commercial mortgage-backed securities (CMBS) was the largest detractor from Fund performance versus the Index during the period. The ongoing weakness in commercial real estate, in the wake of pandemic-related changes to the work environment, was exacerbated during the period by rising interest rates and the banking crisis of March 2023.
The Fund’s use of derivatives, which are not represented within the Index, also detracted from returns relative to the Index. The Fund uses derivatives primarily for duration management, by investing in U.S. Treasury futures and options on Treasury futures.
Security selections within the Fund’s U.S. Treasury holdings dragged on Index-relative performance during the period as well.
See Endnotes and Additional Disclosures in this report.
Past performance is no guarantee of future results. Returns are historical and are calculated by determining the percentage change in net asset value (NAV) or offering price (as applicable) with all distributions reinvested. Furthermore, returns do not reflect the deduction of taxes that shareholders may have to pay on Fund distributions or upon the redemption of Fund shares. Investment return and principal value will fluctuate so that shares, when redeemed, may be worth more or less than their original cost. Performance for periods less than or equal to one year is cumulative. Performance is for the stated time period only; due to market volatility, current Fund performance may be lower or higher than the quoted return. For performance as of the most recent month-end, please refer to eatonvance.com.
Eaton Vance
Total Return Bond Fund
September 30, 2023
Performance
Portfolio Manager(s) Vishal Khanduja, CFA and Brian Ellis, CFA
| % Average Annual Total Returns1,2 | Class
Inception Date | Performance
Inception Date | One Year | Five Years | Ten Years |
| Class A at NAV | 11/17/2009 | 11/17/2009 | 1.03% | 0.59% | 2.41% |
| Class A with 3.25% Maximum Sales Charge | — | — | (2.22) | (0.08) | 2.07 |
| Class C at NAV | 11/17/2009 | 11/17/2009 | 0.17 | (0.17) | 1.80 |
| Class C with 1% Maximum Deferred Sales Charge | — | — | (0.79) | (0.17) | 1.80 |
| Class I at NAV | 11/17/2009 | 11/17/2009 | 1.28 | 0.84 | 2.66 |
| Class R6 at NAV | 06/30/2023 | 11/17/2009 | 1.29 | 0.84 | 2.66 |
|
| Bloomberg U.S. Aggregate Bond Index | — | — | 0.64% | 0.10% | 1.13% |
| % Total Annual Operating Expense Ratios3 | Class A | Class C | Class I | Class R6 |
| Gross | 0.86% | 1.61% | 0.61% | 0.55% |
| Net | 0.74 | 1.49 | 0.49 | 0.43 |
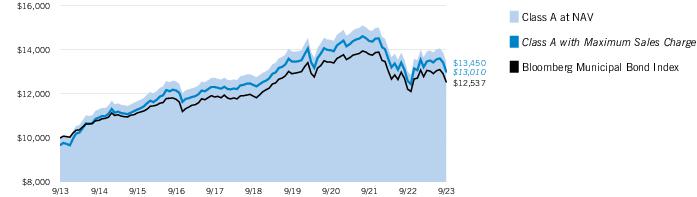
Growth of $10,000
This graph shows the change in value of a hypothetical investment of $10,000 in Class A of the Fund for the period indicated. For comparison, the same investment is shown in the indicated index.
| Growth of Investment | Amount Invested | Period Beginning | At NAV | With Maximum Sales Charge |
| Class C | $10,000 | 09/30/2013 | $11,951 | N.A. |
| Class I, at minimum investment | $1,000,000 | 09/30/2013 | $1,300,428 | N.A. |
| Class R6, at minimum investment | $5,000,000 | 09/30/2013 | $6,503,148 | N.A. |
See Endnotes and Additional Disclosures in this report.
Past performance is no guarantee of future results. Returns are historical and are calculated by determining the percentage change in net asset value (NAV) or offering price (as applicable) with all distributions reinvested. Furthermore, returns do not reflect the deduction of taxes that shareholders may have to pay on Fund distributions or upon the redemption of Fund shares. Investment return and principal value will fluctuate so that shares, when redeemed, may be worth more or less than their original cost. Performance for periods less than or equal to one year is cumulative. Performance is for the stated time period only; due to market volatility, current Fund performance may be lower or higher than the quoted return. For performance as of the most recent month-end, please refer to eatonvance.com.
Eaton Vance
Total Return Bond Fund
September 30, 2023
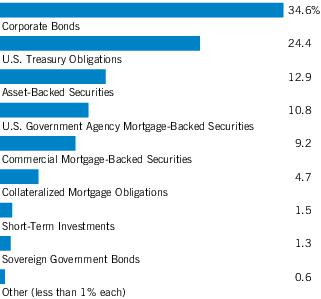
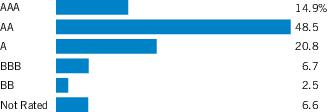
| Asset Allocation (% of total investments) |
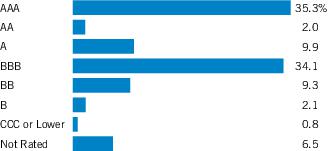
| Credit Quality (% of bond holdings)1 |
Footnotes:
| 1 | For purposes of the Fund’s rating restrictions, ratings are based on Moody’s Investors Service, Inc. (“Moody’s”), S&P Global Ratings (“S&P”) or Fitch Ratings (“Fitch”), or Kroll for securitized debt instruments only (such as asset-backed securities and mortgage-backed securities) as applicable. If securities are rated differently by the ratings agencies, the highest rating is applied. Ratings, which are subject to change, apply to the creditworthiness of the issuers of the underlying securities and not to the Fund or its shares. Credit ratings measure the quality of a bond based on the issuer’s creditworthiness, with ratings ranging from AAA, being the highest, to D, being the lowest based on S&P’s measures. Ratings of BBB or higher by S&P, Fitch or Kroll (Baa or higher by Moody’s) are considered to be investment-grade quality. Credit ratings are based largely on the ratings agency’s analysis at the time of rating. The rating assigned to any particular security is not necessarily a reflection of the issuer’s current financial condition and does not necessarily reflect its assessment of the volatility of a security’s market value or of the liquidity of an investment in the security. Holdings designated as “Not Rated” (if any) are not rated by the national ratings agencies stated above. |
Eaton Vance
Total Return Bond Fund
September 30, 2023
Endnotes and Additional Disclosures
| † | The views expressed in this report are those of the portfolio manager(s) and are current only through the date stated at the top of this page. These views are subject to change at any time based upon market or other conditions, and Eaton Vance and the Fund(s) disclaim any responsibility to update such views. These views may not be relied upon as investment advice and, because investment decisions are based on many factors, may not be relied upon as an indication of trading intent on behalf of any Eaton Vance fund. This commentary may contain statements that are not historical facts, referred to as “forward-looking statements.” The Fund’s actual future results may differ significantly from those stated in any forward-looking statement, depending on factors such as changes in securities or financial markets or general economic conditions, the volume of sales and purchases of Fund shares, the continuation of investment advisory, administrative and service contracts, and other risks discussed from time to time in the Fund’s filings with the Securities and Exchange Commission. |
| | |
| 1 | Bloomberg U.S. Aggregate Bond Index is an unmanaged index of domestic investment-grade bonds, including corporate, government and mortgage-backed securities. Unless otherwise stated, index returns do not reflect the effect of any applicable sales charges, commissions, expenses, taxes or leverage, as applicable. It is not possible to invest directly in an index. |
| 2 | Total Returns at NAV do not include applicable sales charges. If sales charges were deducted, the returns would be lower. Total Returns shown with maximum sales charge reflect the stated maximum sales charge. Unless otherwise stated, performance does not reflect the deduction of taxes on Fund distributions or redemptions of Fund shares.Effective November 5, 2020, Class C shares automatically convert to Class A shares eight years after purchase. The average annual total returns listed for Class C reflect conversion to Class A shares after eight years. Prior to November 5, 2020, Class C shares automatically converted to Class A shares ten years after purchase.Performance prior to the inception date of a class may be linked to the performance of an older class of the Fund. This linked performance is adjusted for any applicable sales charge, but is not adjusted for class expense differences. If adjusted for such differences, the performance would be different. The performance of Class R6 is linked to Class I. Performance presented in the Financial Highlights included in the financial statements is not linked.Effective May 1, 2015, the Fund changed its investment objective and policies. Prior to May 1, 2015, the Fund invested primarily in Build America Bonds. Performance prior to May 1, 2015 reflects the Fund’s performance under its former investment objective and policies. |
| 3 | Source: Fund prospectus. Net expense ratios reflect a contractual expense reimbursement that continues through 2/1/25. The expense ratios for the current reporting period can be found in the Financial Highlights section of this report. Performance reflects expenses waived and/or reimbursed, if applicable. Without such waivers and/or reimbursements, performance would have been lower. |
| | Fund profile subject to change due to active management. |
| | Additional Information |
| | Bloomberg U.S. Treasury Index measures the performance of U.S. Treasuries with a maturity of one year or more. Bloomberg U.S. Corporate Bond Index measures the performance of investment-grade U.S. corporate securities with a maturity of one year or more. Bloomberg U.S. Corporate High Yield Index measures USD-denominated, non-investment grade corporate securities. Bloomberg U.S. Mortgage-Backed Securities Index measures agency mortgage-backed pass-through securities issued by Ginnie Mae (GNMA), Fannie Mae (FNMA), and Freddie Mac (FHLMC). Bloomberg U.S. Asset-Backed Securities Index tracks the performance of U.S. dollar denominated investment grade, fixed rate asset-backed securities publicly issued in the U.S. domestic market. |
| | Duration is a measure of the expected change in price of a bond — in percentage terms — given a one percent change in interest rates, all else being constant. Securities with lower durations tend to be less sensitive to interest rate changes. |
| | Yield curve is a graphical representation of the yields offered by bonds of various maturities. The yield curve flattens when long-term interest rates fall and/or short-term interest rates increase, and the yield curve steepens when long-term interest rates increase and/or short-term interest rates fall. |
Eaton Vance
Total Return Bond Fund
September 30, 2023
Example
As a Fund shareholder, you incur two types of costs: (1) transaction costs, including sales charges (loads) on purchases; and (2) ongoing costs, including management fees; distribution and/or service fees; and other Fund expenses. This Example is intended to help you understand your ongoing costs (in dollars) of Fund investing and to compare these costs with the ongoing costs of investing in other mutual funds. The actual expense Example is based on an investment of $1,000 invested at the beginning of the period and held for the entire period (April 1, 2023 to September 30, 2023) for Class A, Class C and Class I and (June 30, 2023 to September 30, 2023) for Class R6. The hypothetical expense Example is based on an investment of $1,000 invested for the one-half year period (April 1, 2023 to September 30, 2023).
Actual Expenses
The first section of the table below provides information about actual account values and actual expenses. You may use the information in this section, together with the amount you invested, to estimate the expenses that you paid over the period. Simply divide your account value by $1,000 (for example, an $8,600 account value divided by $1,000 = 8.6), then multiply the result by the number in the first section under the heading entitled “Expenses Paid During Period” to estimate the expenses you paid on your account during this period.
Hypothetical Example for Comparison Purposes
The second section of the table below provides information about hypothetical account values and hypothetical expenses based on the actual Fund expense ratio and an assumed rate of return of 5% per year (before expenses), which is not the actual Fund return. The hypothetical account values and expenses may not be used to estimate the actual ending account balance or expenses you paid for the period. You may use this information to compare the ongoing costs of investing in your Fund and other funds. To do so, compare this 5% hypothetical example with the 5% hypothetical examples that appear in the shareholder reports of the other funds.
Please note that the expenses shown in the table are meant to highlight your ongoing costs only and do not reflect any transactional costs, such as sales charges (loads). Therefore, the second section of the table is useful in comparing ongoing costs only, and will not help you determine the relative total costs of owning different funds. In addition, if these transactional costs were included, your costs would be higher.
| | Beginning
Account Value
(4/1/23) | Ending
Account Value
(9/30/23) | Expenses Paid
During Period
(4/1/23 – 9/30/23) | Annualized
Expense
Ratio |
| Actual* | | | | |
| Class A | $1,000.00 | $ 970.50 | $3.66** | 0.74% |
| Class C | $1,000.00 | $ 965.80 | $7.34** | 1.49% |
| Class I | $1,000.00 | $ 971.60 | $2.42** | 0.49% |
| Class R6 | $1,000.00 | $ 977.70 | $1.08** | 0.43% |
| |
| Hypothetical *** | | | | |
| (5% return per year before expenses) | | | | |
| Class A | $1,000.00 | $1,021.36 | $3.75** | 0.74% |
| Class C | $1,000.00 | $1,017.60 | $7.54** | 1.49% |
| Class I | $1,000.00 | $1,022.61 | $2.48** | 0.49% |
| Class R6 | $1,000.00 | $1,022.91 | $2.18** | 0.43% |
| * | Class R6 had not commenced operations on April 1, 2023. Actual expenses are equal to the Fund’s annualized expense ratio for the indicated Class, multiplied by the average account value over the period, multiplied by 183/365 (to reflect the one-half year period); 93/365 for Class R6 (to reflect the period from the commencement of operations on June 30, 2023 to September 30, 2023). The Example assumes that the $1,000 was invested at the net asset value per share determined at the close of business on March 31, 2023 (June 30, 2023 for Class R6). |
| ** | Absent an allocation of certain expenses to affiliate(s), expenses would be higher. |
| *** | Hypothetical expenses are equal to the Fund’s annualized expense ratio for the indicated Class, multiplied by the average account value over the period, multiplied by 183/365 (to reflect the one-half year period). The Example assumes that the $1,000 was invested at the net asset value per share determined at the close of business on March 31, 2023 (June 30, 2023 for Class R6). |
Eaton Vance
Total Return Bond Fund
September 30, 2023
| Asset-Backed Securities — 14.2% |
| Security | Principal
Amount
(000's omitted) | Value |
| Aaset Trust, Series 2019-2, Class B, 4.458%, 10/16/39(1) | $ | 3,084 | $ 1,306,512 |
| ACHV ABS Trust: | | | |
| Series 2023-1PL, Class B, 6.80%, 3/18/30(1) | | 3,200 | 3,199,535 |
| Series 2023-3PL, Class B, 7.17%, 8/19/30(1) | | 2,750 | 2,763,712 |
| Avant Credit Card Master Trust, Series 2021-1A, Class A, 1.37%, 4/15/27(1) | | 1,450 | 1,347,375 |
| Avant Loans Funding Trust, Series 2021-REV1, Class D, 4.30%, 7/15/30(1) | | 5,213 | 4,737,920 |
| Business Jet Securities, LLC, Series 2020-1A, Class A, 2.981%, 11/15/35(1) | | 323 | 302,703 |
| Coinstar Funding, LLC, Series 2017-1A, Class A2, 5.216%, 4/25/47(1) | | 3,193 | 2,670,418 |
| Cologix Canadian Issuer L.P., Series 2022-1CAN, Class C, 7.74%, 1/25/52(1)(2) | | 2,800 | 1,842,238 |
| Cologix Data Centers US Issuer, LLC: | | | |
| Series 2021-1A, Class B, 3.79%, 12/26/51(1) | | 4,300 | 3,735,944 |
| Series 2021-1A, Class C, 5.99%, 12/26/51(1) | | 2,900 | 2,379,202 |
| Conn's Receivables Funding, LLC: | | | |
| Series 2021-A, Class C, 4.59%, 5/15/26(1) | | 4,758 | 4,747,413 |
| Series 2022-A, Class B, 9.52%, 12/15/26(1) | | 1,516 | 1,522,895 |
| Series 2022-A, Class C, 0.00%, 12/15/26(1) | | 3,700 | 3,159,937 |
| Series 2023-A, Class B, 10.00%, 1/17/28(1) | | 3,167 | 3,177,035 |
| Diamond Infrastructure Funding, LLC, Series 2021-1A, Class C, 3.475%, 4/15/49(1) | | 992 | 863,340 |
| Diamond Issuer, Series 2021-1A, Class B, 2.701%, 11/20/51(1) | | 1,000 | 818,825 |
| Driven Brands Funding, LLC: | | | |
| Series 2018-1A, Class A2, 4.739%, 4/20/48(1) | | 2,568 | 2,480,239 |
| Series 2019-1A, Class A2, 4.641%, 4/20/49(1) | | 1,922 | 1,817,782 |
| Series 2019-2A, Class A2, 3.981%, 10/20/49(1) | | 4,129 | 3,779,524 |
| ExteNet, LLC: | | | |
| Series 2019-1A, Class A2, 3.204%, 7/25/49(1) | | 2,475 | 2,380,200 |
| Series 2019-1A, Class B, 4.14%, 7/25/49(1) | | 3,502 | 3,361,879 |
| Series 2019-1A, Class C, 5.219%, 7/25/49(1) | | 3,040 | 2,886,842 |
| Falcon Aerospace, Ltd.: | | | |
| Series 2019-1, Class A, 3.597%, 9/15/39(1) | | 1,656 | 1,506,648 |
| Series 2019-1, Class B, 4.791%, 9/15/39(1) | | 4,067 | 3,099,908 |
| Series 2019-1, Class C, 6.656%, 9/15/39(1) | | 3,191 | 942,410 |
| FMC GMSR Issuer Trust: | | | |
| Series 2021-GT1, Class A, 3.62%, 7/25/26(1)(3) | | 2,285 | 1,879,117 |
| Series 2021-GT2, Class A, 3.85%, 10/25/26(1)(3) | | 1,690 | 1,390,980 |
| Series 2022-GT2, Class A, 7.90%, 7/25/27(1) | | 2,197 | 2,167,623 |
| GAIA Aviation, Ltd., Series 2019-1, Class A, 3.967%, 12/15/44(1)(4) | | 672 | 606,252 |
| Security | Principal
Amount
(000's omitted) | Value |
| Hertz Vehicle Financing, LLC, Series 2021-1A, Class D, 3.98%, 12/26/25(1) | $ | 5,000 | $ 4,739,320 |
| Horizon Aircraft Finance II, Ltd., Series 2019-1, Class A, 3.721%, 7/15/39(1) | | 1,732 | 1,507,202 |
| JPMorgan Chase Bank NA: | | | |
| Series 2021-3, Class D, 1.009%, 2/26/29(1) | | 394 | 374,862 |
| Series 2021-3, Class E, 2.102%, 2/26/29(1) | | 231 | 219,961 |
| Lunar Aircraft, Ltd.: | | | |
| Series 2020-1A, Class B, 4.335%, 2/15/45(1) | | 544 | 388,689 |
| Series 2020-1A, Class C, 6.413%, 2/15/45(1) | | 314 | 71,447 |
| Lunar Structured Aircraft Portfolio Notes, Series 2021-1, Class A, 2.636%, 10/15/46(1) | | 6,198 | 5,324,261 |
| Mosaic Solar Loan Trust, Series 2019-2A, Class B, 3.28%, 9/20/40(1) | | 1,612 | 1,393,193 |
| MVW, LLC, Series 2020-1A, Class A, 1.74%, 10/20/37(1) | | 183 | 169,009 |
| Neighborly Issuer, LLC, Series 2021-1A, Class A2, 3.584%, 4/30/51(1) | | 2,449 | 2,051,263 |
| NRZ Excess Spread-Collateralized Notes: | | | |
| Series 2021-FHT1, Class A, 3.104%, 7/25/26(1) | | 357 | 319,062 |
| Series 2021-GNT1, Class A, 3.474%, 11/25/26(1) | | 3,478 | 3,137,104 |
| Octane Receivables Trust, Series 2022-1, Class A2, 4.18%, 3/20/28(1) | | 1,206 | 1,188,196 |
| Oportun Issuance Trust, Series 2021-B, Class C, 3.65%, 5/8/31(1) | | 496 | 455,598 |
| Pagaya AI Debt Selection Trust: | | | |
| Series 2021-2, 3.00%, 1/25/29(1) | | 575 | 555,593 |
| Series 2021-3, Class C, 3.27%, 5/15/29(1) | | 2,900 | 2,511,397 |
| Series 2021-5, Class C, 3.93%, 8/15/29(1) | | 4,319 | 3,769,731 |
| Pagaya AI Technology In Housing Trust, Series 2023-1, Class F, 3.60%, 10/25/40(1)(5) | | 1,323 | 830,962 |
| Planet Fitness Master Issuer, LLC, Series 2019-1A, Class A2, 3.858%, 12/5/49(1) | | 2,349 | 1,964,303 |
| PMT Issuer Trust - FMSR: | | | |
| Series 2021-FT1, Class A, 8.434%, (1 mo. SOFR + 3.00%), 3/25/26(1)(6) | | 390 | 380,815 |
| Series 2022-FT1, Class A, 9.505%, (30-day average SOFR + 4.19%), 6/25/27(1)(6) | | 3,500 | 3,505,641 |
| Prosper Marketplace Issuance Trust, Series 2023-1A, Class A, 7.06%, 7/16/29(1) | | 3,250 | 3,252,750 |
| Raptor Aircraft Finance I, LLC, Series 2019-1, Class A, 4.213%, 8/23/44(1) | | 1,311 | 1,051,244 |
| Retained Vantage Data Centers Issuer, LLC: | | | |
| Series 2023-1A, Class A2B, 5.25%, 9/15/48(1) | | 4,877 | 3,191,621 |
| Series 2023-1A, Class B, 5.75%, 9/15/48(1) | | 4,890 | 4,360,364 |
| ServiceMaster Funding, LLC: | | | |
| Series 2020-1, Class A2I, 2.841%, 1/30/51(1) | | 637 | 540,158 |
| Series 2020-1, Class A2II, 3.337%, 1/30/51(1) | | 745 | 587,403 |
8
See Notes to Financial Statements.
Eaton Vance
Total Return Bond Fund
September 30, 2023
Portfolio of Investments — continued
| Security | Principal
Amount
(000's omitted) | Value |
| SERVPRO Master Issuer, LLC, Series 2019-1A, Class A2, 3.882%, 10/25/49(1) | $ | 4,697 | $ 4,306,393 |
| Sonic Capital, LLC, Series 2020-1A, Class A2I, 3.845%, 1/20/50(1) | | 3,793 | 3,448,856 |
| Stack Infrastructure Issuer, LLC: | | | |
| Series 2019-2A, Class A2, 3.08%, 10/25/44(1) | | 1,135 | 1,088,567 |
| Series 2020-1A, Class A2, 1.893%, 8/25/45(1) | | 1,096 | 995,824 |
| STAR Trust: | | | |
| Series 2021-SFR1, Class G, 8.648%, (1 mo. SOFR + 3.31%), 4/17/38(1)(6) | | 2,494 | 2,407,635 |
| Series 2021-SFR1, Class H, 9.898%, (1 mo. SOFR + 4.56%), 4/17/38(1)(6) | | 1,600 | 1,565,515 |
| Sunnova Helios II Issuer, LLC: | | | |
| Series 2019-AA, Class C, 5.32%, 6/20/46(1) | | 989 | 750,675 |
| Series 2021-A, Class B, 3.15%, 2/20/48(1) | | 2,864 | 2,235,176 |
| Series 2021-B, Class B, 2.01%, 7/20/48(1) | | 2,313 | 1,863,953 |
| Sunnova Helios X Issuer, LLC, Series 2022-C, Class B, 5.60%, 11/22/49(1) | | 3,699 | 3,460,763 |
| Sunnova Sol Issuer, LLC, Series 2020-1A, Class B, 5.54%, 2/1/55(1) | | 8,418 | 7,012,904 |
| Theorem Funding Trust, Series 2021-1A, Class B, 1.84%, 12/15/27(1) | | 2,253 | 2,213,767 |
| Vantage Data Centers Issuer, LLC: | | | |
| Series 2020-2A, Class A2, 1.992%, 9/15/45(1) | | 3,088 | 2,586,750 |
| Series 2021-1A, Class A2, 2.165%, 10/15/46(1) | | 3,858 | 3,381,266 |
| Willis Engine Structured Trust V: | | | |
| Series 2020-A, Class B, 4.212%, 3/15/45(1) | | 1,471 | 1,188,006 |
| Series 2020-A, Class C, 6.657%, 3/15/45(1) | | 505 | 364,193 |
Total Asset-Backed Securities
(identified cost $168,613,065) | | | $ 153,585,800 |
| Collateralized Mortgage Obligations — 5.2% |
| Security | Principal
Amount
(000's omitted) | Value |
| Bellemeade Re, Ltd., Series 2021-2A, Class M1A, 6.515%, (30-day average SOFR + 1.20%), 6/25/31(1)(6) | $ | 1,161 | $ 1,161,594 |
| Cascade Funding Mortgage Trust, Series 2022-HB10, Class M2, 3.25%, 11/25/35(1)(3) | | 2,000 | 1,760,968 |
| Cascade MH Asset Trust, Series 2022-MH1, Class A, 4.25% to 7/25/27, 8/25/54(1)(4) | | 2,041 | 1,794,916 |
| CFMT, LLC, Series 2023-HB11, Class M2, 4.00%, 2/25/37(1)(3) | | 2,500 | 2,147,641 |
| Eagle Re, Ltd., Series 2021-2, Class M1B, 7.365%, (30-day average SOFR + 2.05%), 4/25/34(1)(6) | | 1,500 | 1,506,288 |
| Federal Home Loan Mortgage Corp., Series 5324, Class MZ, 6.00%, 7/25/53 | | 233 | 216,510 |
| Security | Principal
Amount
(000's omitted) | Value |
| Federal Home Loan Mortgage Corp. Structured Agency Credit Risk Debt Notes: | | | |
| Series 2019-DNA4, Class M2, 7.379%, (30-day average SOFR + 2.064%), 10/25/49(1)(6) | $ | 53 | $ 53,391 |
| Series 2019-HQA3, Class B1, 8.429%, (30-day average SOFR + 3.11%), 9/25/49(1)(6) | | 1,395 | 1,458,494 |
| Series 2019-HQA4, Class B1, 8.379%, (30-day average SOFR + 3.06%), 11/25/49(1)(6) | | 941 | 969,838 |
| Series 2020-HQA2, Class B1, 9.529%, (30-day average SOFR + 4.21%), 3/25/50(1)(6) | | 1,878 | 2,047,995 |
| Series 2021-DNA2, Class B1, 8.715%, (30-day average SOFR + 3.40%), 8/25/33(1)(6) | | 2,165 | 2,225,053 |
| Federal National Mortgage Association Connecticut Avenue Securities: | | | |
| Series 2019-R01, Class 2B1, 9.779%, (30-day average SOFR + 4.46%), 7/25/31(1)(6) | | 1,390 | 1,481,037 |
| Series 2019-R02, Class 1B1, 9.579%, (30-day average SOFR + 4.26%), 8/25/31(1)(6) | | 552 | 582,185 |
| Series 2019-R03, Class 1B1, 9.529%, (30-day average SOFR + 4.21%), 9/25/31(1)(6) | | 1,125 | 1,187,374 |
| Series 2019-R06, Class 2B1, 9.179%, (30-day average SOFR + 3.864%), 9/25/39(1)(6) | | 5,455 | 5,603,111 |
| Series 2019-R07, Class 1B1, 8.829%, (30-day average SOFR + 3.51%), 10/25/39(1)(6) | | 3,081 | 3,149,955 |
| Series 2020-R02, Class 2B1, 8.429%, (30-day average SOFR + 3.11%), 1/25/40(1)(6) | | 1,612 | 1,629,316 |
| Series 2021-R01, Class 1B2, 11.315%, (30-day average SOFR + 6.00%), 10/25/41(1)(6) | | 1,995 | 2,029,032 |
| Series 2021-R02, Class 2B1, 8.615%, (30-day average SOFR + 3.30%), 11/25/41(1)(6) | | 584 | 588,212 |
| Finance of America HECM Buyout, Series 2022-HB2, Class M5, 6.00%, 8/1/32(1)(3) | | 1,000 | 594,148 |
| Government National Mortgage Association: | | | |
| Series 2023-84, Class DL, 6.00%, 6/20/53 | | 1,002 | 979,072 |
| Series 2023-84, Class MW, 6.00%, 6/20/53 | | 1,051 | 1,027,055 |
| Series 2023-98, Class BW, 6.00%, 7/20/53 | | 1,190 | 1,164,210 |
| Series 2023-99, Class AL, 6.00%, 7/20/53 | | 1,190 | 1,163,902 |
| Series 2023-102, Class SG, 2.742%, (22.55% - 30-day average SOFR x 3.727), 7/20/53(7) | | 1,792 | 1,628,323 |
| Series 2023-116, Class CY, 6.00%, 8/20/53 | | 2,770 | 2,709,223 |
| Series 2023-133, Class S, 5.66%, (21.60% - 30-day average SOFR x 3.00), 9/20/53(7) | | 3,845 | 3,713,868 |
| JP Morgan Mortgage Trust, Series 2023-HE2, Class A1, 7.016%, (30-day average SOFR + 1.70%), 3/25/54(1)(6) | | 4,443 | 4,443,000 |
| LHOME Mortgage Trust: | | | |
| Series 2023-RTL2, Class A1, 8.00% to 1/25/26, 6/25/28(1)(4) | | 1,550 | 1,549,640 |
| Series 2023-RTL3, Class A1, 8.00%, 8/25/28(1)(3) | | 1,624 | 1,624,281 |
9
See Notes to Financial Statements.
Eaton Vance
Total Return Bond Fund
September 30, 2023
Portfolio of Investments — continued
| Security | Principal
Amount
(000's omitted) | Value |
| MFRA Trust, Series 2023-NQM1, Class A2, 5.75% to 1/25/26, 11/25/67(1)(4) | $ | 1,517 | $ 1,465,671 |
| Oaktown Re VI, Ltd., Series 2021-1A, Class M1B, 7.365%, (30-day average SOFR + 2.05%), 10/25/33(1)(6) | | 697 | 698,290 |
| PNMAC GMSR Issuer Trust: | | | |
| Series 2018-GT1, Class A, 9.284%, (1 mo. SOFR + 3.85%), 2/25/25(1)(6) | | 775 | 774,923 |
| Series 2018-GT2, Class A, 8.084%, (1 mo. SOFR + 2.65%), 8/25/25(1)(6) | | 445 | 445,017 |
| RMF Buyout Issuance Trust, Series 2020-HB1, Class M5, 6.00%, 10/25/50(1) | | 1,180 | 773,260 |
Total Collateralized Mortgage Obligations
(identified cost $56,280,766) | | | $ 56,346,793 |
| Commercial Mortgage-Backed Securities — 10.1% |
| Security | Principal
Amount
(000's omitted) | Value |
| BAMLL Commercial Mortgage Securities Trust: | | | |
| Series 2019-BPR, Class ENM, 3.843%, 11/5/32(1)(3) | $ | 7,255 | $ 2,400,166 |
| Series 2019-BPR, Class FNM, 3.843%, 11/5/32(1)(3) | | 7,215 | 1,597,190 |
| BBCMS Mortgage Trust, Series 2017-C1, Class D, 3.709%, 2/15/50(1)(3) | | 3,500 | 2,320,186 |
| BX Commercial Mortgage Trust: | | | |
| Series 2021-VOLT, Class C, 6.547%, (1 mo. SOFR + 1.214%), 9/15/36(1)(6) | | 6,379 | 6,139,731 |
| Series 2021-VOLT, Class D, 7.097%, (1 mo. SOFR + 1.764%), 9/15/36(1)(6) | | 474 | 453,429 |
| CFCRE Commercial Mortgage Trust: | | | |
| Series 2016-C3, Class D, 3.052%, 1/10/48(1)(3) | | 1,500 | 1,148,250 |
| Series 2016-C7, Class D, 4.514%, 12/10/54(1)(3) | | 1,725 | 1,191,847 |
| COMM Mortgage Trust: | | | |
| Series 2013-CR11, Class D, 4.828%, 8/10/50(1)(3) | | 3,603 | 3,230,765 |
| Series 2013-CR13, Class C, 4.95%, 11/10/46(3) | | 1,000 | 902,936 |
| Series 2015-CR22, Class D, 4.203%, 3/10/48(1)(3) | | 2,324 | 1,832,328 |
| CSMC Trust: | | | |
| Series 2016-NXSR, Class D, 4.574%, 12/15/49(1)(3) | | 2,000 | 1,269,422 |
| Series 2020-TMIC, Class A, 8.948%, (1 mo. SOFR + 3.614%), 12/15/35(1)(6) | | 4,240 | 4,236,992 |
| Series 2021-4SZN, Class A, 9.30%, (1 mo. SOFR + 3.967%), 11/15/23(1)(6) | | 5,344 | 5,183,418 |
| Series 2021-BPNY, Class A, 9.162%, (1 mo. SOFR + 3.83%), 8/15/26(1)(6) | | 3,917 | 3,441,362 |
| Series 2021-WEHO, Class A, 9.417%, (1 mo. SOFR + 4.083%), 4/15/26(1)(6) | | 396 | 387,760 |
| Series 2022-CNTR, Class A, 9.277%, (1 mo. SOFR + 3.944%), 1/15/24(1)(6) | | 3,745 | 3,218,497 |
| Series 2022-NWPT, Class A, 8.475%, (1 mo. SOFR + 3.143%), 9/9/24(1)(6) | | 3,163 | 3,196,616 |
| Security | Principal
Amount
(000's omitted) | Value |
| Extended Stay America Trust: | | | |
| Series 2021-ESH, Class C, 7.147%, (1 mo. SOFR + 1.814%), 7/15/38(1)(6) | $ | 3,019 | $ 2,978,029 |
| Series 2021-ESH, Class D, 7.697%, (1 mo. SOFR + 2.36%), 7/15/38(1)(6) | | 1,844 | 1,817,151 |
| Federal National Mortgage Association Multifamily Connecticut Avenue Securities Trust: | | | |
| Series 2019-01, Class M10, 8.679%, (30-day average SOFR + 3.364%), 10/25/49(1)(6) | | 2,813 | 2,751,254 |
| Series 2020-01, Class M10, 9.179%, (30-day average SOFR + 3.864%), 3/25/50(1)(6) | | 7,229 | 7,069,758 |
| JPMBB Commercial Mortgage Securities Trust: | | | |
| Series 2014-C22, Class D, 4.70%, 9/15/47(1)(3) | | 1,980 | 1,338,654 |
| Series 2014-C25, Class D, 4.081%, 11/15/47(1)(3) | | 3,575 | 1,514,390 |
| Series 2015-C29, Class D, 3.827%, 5/15/48(3) | | 500 | 327,970 |
| JPMorgan Chase Commercial Mortgage Securities Trust: | | | |
| Series 2013-C16, Class D, 5.10%, 12/15/46(1)(3) | | 1,500 | 1,293,373 |
| Series 2014-DSTY, Class B, 3.771%, 6/10/27(1) | | 1,384 | 202,721 |
| Med Trust: | | | |
| Series 2021-MDLN, Class E, 8.597%, (1 mo. SOFR + 3.26%), 11/15/38(1)(6) | | 4,150 | 3,956,130 |
| Series 2021-MDLN, Class F, 9.447%, (1 mo. SOFR + 4.11%), 11/15/38(1)(6) | | 3,200 | 3,041,932 |
| Morgan Stanley Bank of America Merrill Lynch Trust: | | | |
| Series 2016-C29, Class C, 4.878%, 5/15/49(3)(8) | | 4,199 | 3,633,419 |
| Series 2016-C29, Class D, 3.00%, 5/15/49(1)(8) | | 3,048 | 2,189,292 |
| Series 2016-C32, Class D, 3.396%, 12/15/49(1)(3)(8) | | 5,000 | 3,303,944 |
| Morgan Stanley Capital I Trust: | | | |
| Series 2019-BPR, Class B, 8.022%, (1 mo. SOFR + 2.69%), 5/15/36(1)(6)(8) | | 3,960 | 3,787,158 |
| Series 2019-BPR, Class C, 8.972%, (1 mo. SOFR + 3.642%), 5/15/36(1)(6)(8) | | 2,219 | 2,100,512 |
| Natixis Commercial Mortgage Securities Trust, Series 2018-FL1, Class C, 7.647%, (1 mo. SOFR + 2.314%), 6/15/35(1)(6) | | 3,219 | 1,479,171 |
| Taubman Centers Commercial Mortgage Trust, Series 2022-DPM, Class A, 7.518%, (1 mo. SOFR + 2.19%), 5/15/37(1)(6) | | 2,000 | 1,955,600 |
| UBS-Barclays Commercial Mortgage Trust, Series 2013-C6, Class D, 4.103%, 4/10/46(1)(3) | | 1,982 | 1,643,334 |
| VMC Finance, LLC, Series 2021-HT1, Class B, 9.945%, (1 mo. SOFR + 4.614%), 1/18/37(1)(6) | | 8,477 | 8,040,665 |
| Wells Fargo Commercial Mortgage Trust: | | | |
| Series 2015-C31, Class D, 3.852%, 11/15/48 | | 5,598 | 4,238,079 |
| Series 2015-NXS1, Class C, 3.848%, 5/15/48(3) | | 1,000 | 877,287 |
| Series 2016-C35, Class D, 3.142%, 7/15/48(1) | | 2,150 | 1,529,444 |
| Series 2016-C36, Class D, 2.942%, 11/15/59(1) | | 6,000 | 3,476,594 |
10
See Notes to Financial Statements.
Eaton Vance
Total Return Bond Fund
September 30, 2023
Portfolio of Investments — continued
| Security | Principal
Amount
(000's omitted) | Value |
| WF-RBS Commercial Mortgage Trust: | | | |
| Series 2013-UBS1, Class D, 5.206%, 3/15/46(1)(3) | $ | 350 | $ 339,546 |
| Series 2014-C24, Class D, 3.692%, 11/15/47(1) | | 4,150 | 2,478,465 |
Total Commercial Mortgage-Backed Securities
(identified cost $130,429,427) | | | $ 109,514,767 |
| Security | Principal
Amount
(000's omitted) | Value |
| Aerospace & Defense — 0.0%(9) |
| Spirit Airlines, Inc., 1.00%, 5/15/26 | $ | 200 | $ 167,300 |
| | | | $ 167,300 |
| Biotechnology — 0.0%(9) |
| BioMarin Pharmaceutical, Inc., 0.599%, 8/1/24 | $ | 175 | $ 170,188 |
| | | | $ 170,188 |
| Commercial Services — 0.0%(9) |
| Block, Inc., 0.125%, 3/1/25 | $ | 170 | $ 158,610 |
| | | | $ 158,610 |
| Computers — 0.0%(9) |
| Rapid7, Inc., 0.25%, 3/15/27 | $ | 175 | $ 149,953 |
| | | | $ 149,953 |
| Diversified Financial Services — 0.1% |
| Ares Capital Corp., 4.625%, 3/1/24 | $ | 250 | $ 254,844 |
| Ford Motor Co., 0.00%, 3/15/26 | | 200 | 197,500 |
| | | | $ 452,344 |
| Electric Utilities — 0.0%(9) |
| NRG Energy, Inc., 2.75%, 6/1/48 | $ | 200 | $ 212,600 |
| | | | $ 212,600 |
| Leisure Time — 0.0%(9) |
| NCL Corp., Ltd., 1.125%, 2/15/27 | $ | 200 | $ 166,500 |
| | | | $ 166,500 |
| Oil and Gas — 0.0%(9) |
| NextEra Energy Partners, L.P., 2.50%, 6/15/26(1) | $ | 200 | $ 170,600 |
| | | | $ 170,600 |
| Security | Principal
Amount
(000's omitted) | Value |
| Pharmaceuticals — 0.0%(9) |
| Dexcom, Inc., 0.25%, 11/15/25 | $ | 175 | $ 165,812 |
| Jazz Investments I, Ltd., 2.00%, 6/15/26 | | 200 | 204,625 |
| | | | $ 370,437 |
| Software — 0.1% |
| Akamai Technologies, Inc., 1.125%, 2/15/29(1) | $ | 200 | $ 202,700 |
| Bill Holdings, Inc., 0.00%, 12/1/25 | | 175 | 176,750 |
| Tyler Technologies, Inc., 0.25%, 3/15/26 | | 175 | 169,837 |
| | | | $ 549,287 |
Total Convertible Bonds
(identified cost $2,665,769) | | | $ 2,567,819 |
| Security | Principal
Amount
(000's omitted) | Value |
| Aerospace & Defense — 0.3% |
| Delta Air Lines, Inc./SkyMiles IP, Ltd., 4.75%, 10/20/28(1) | $ | 3,106 | $ 2,952,912 |
| | | | $ 2,952,912 |
| Agriculture — 0.3% |
| BAT Capital Corp., 6.421%, 8/2/33 | $ | 3,273 | $ 3,183,881 |
| | | | $ 3,183,881 |
| Auto Manufacturers — 1.1% |
| General Motors Financial Co., Inc.: | | | |
| 5.80%, 6/23/28 | $ | 2,280 | $ 2,228,664 |
| 5.85%, 4/6/30 | | 5,704 | 5,467,343 |
| Hyundai Capital America, 5.70%, 6/26/30(1) | | 4,761 | 4,583,393 |
| | | | $ 12,279,400 |
| Banks — 10.9% |
| ABN AMRO Bank NV, 6.339% to 9/18/26, 9/18/27(1)(10) | $ | 2,300 | $ 2,295,234 |
| African Export-Import Bank (The), 3.994%, 9/21/29(11) | | 2,200 | 1,809,632 |
| AIB Group PLC, 6.608% to 9/13/28, 9/13/29(1)(10) | | 2,829 | 2,819,075 |
| Banco Mercantil del Norte S.A./Grand Cayman, 7.50% to 6/27/29(1)(10)(12) | | 745 | 664,074 |
| Banco Santander S.A.: | | | |
| 4.175% to 3/24/27, 3/24/28(10) | | 400 | 369,525 |
| 6.921%, 8/8/33 | | 5,400 | 5,167,083 |
11
See Notes to Financial Statements.
Eaton Vance
Total Return Bond Fund
September 30, 2023
Portfolio of Investments — continued
| Security | Principal
Amount
(000's omitted) | Value |
| Banks (continued) |
| Bank Hapoalim BM, 3.255% to 10/21/26, 1/21/32(1)(10)(11) | $ | 2,600 | $ 2,226,234 |
| Bank Leumi Le-Israel BM, 7.129% to 4/18/28, 7/18/33(1)(10)(11) | | 2,360 | 2,321,678 |
| Bank of America Corp.: | | | |
| 3.846% to 3/8/32, 3/8/37(10) | | 3,300 | 2,686,568 |
| 5.872% to 9/15/33, 9/15/34(10) | | 5,327 | 5,186,918 |
| Barclays PLC: | | | |
| 4.375%, 9/11/24 | | 3,500 | 3,430,550 |
| 6.496% to 9/13/26, 9/13/27(10) | | 5,396 | 5,383,853 |
| BBVA Bancomer S.A., 8.45% to 6/29/33, 6/29/38(1)(10) | | 2,261 | 2,230,158 |
| BBVA Bancomer S.A./Texas, 5.125% to 1/18/28, 1/18/33(1)(10) | | 2,270 | 1,956,308 |
| BNP Paribas S.A., 8.50%(1)(10)(12) | | 5,510 | 5,404,333 |
| BPCE S.A., 3.648% to 1/14/32, 1/14/37(1)(10) | | 1,518 | 1,169,658 |
| CaixaBank S.A., 6.208% to 1/18/28, 1/18/29(1)(10) | | 3,962 | 3,879,098 |
| Danske Bank A/S, 5.375%, 1/12/24(1) | | 5,212 | 5,191,567 |
| Fifth Third Bancorp, 6.339% to 7/27/28, 7/27/29(10) | | 3,113 | 3,076,888 |
| HSBC Holdings PLC: | | | |
| 6.161% to 3/9/28, 3/9/29(10) | | 2,144 | 2,123,589 |
| 7.39% to 11/3/27, 11/3/28(10) | | 3,399 | 3,517,700 |
| Intesa Sanpaolo SpA: | | | |
| 7.778% to 6/20/53, 6/20/54(1)(10) | | 2,500 | 2,256,702 |
| 8.248% to 11/21/32, 11/21/33(1)(10) | | 3,183 | 3,210,669 |
| KeyBank N.A.: | | | |
| 4.15%, 8/8/25 | | 3,055 | 2,878,193 |
| 5.85%, 11/15/27 | | 1,690 | 1,608,171 |
| KeyCorp, 4.789% to 6/1/32, 6/1/33(10) | | 750 | 625,609 |
| Macquarie Bank, Ltd., 6.798%, 1/18/33(1) | | 2,408 | 2,365,255 |
| Macquarie Group, Ltd., 2.871% to 1/14/32, 1/14/33(1)(10) | | 3,071 | 2,323,790 |
| PNC Financial Services Group, Inc.: | | | |
| 5.068% to 1/24/33, 1/24/34(10) | | 3,000 | 2,722,517 |
| 6.25% to 3/15/30(10)(12) | | 5,734 | 4,929,604 |
| Societe Generale S.A.: | | | |
| 6.221% to 6/15/32, 6/15/33(1)(10) | | 2,600 | 2,357,788 |
| 9.375% to 11/22/27(1)(10)(12) | | 2,389 | 2,346,873 |
| Synchrony Bank: | | | |
| 5.40%, 8/22/25 | | 1,200 | 1,157,045 |
| 5.625%, 8/23/27 | | 1,002 | 935,850 |
| Synchrony Financial, 4.875%, 6/13/25 | | 563 | 539,991 |
| Synovus Bank/Columbus, GA, 5.625%, 2/15/28 | | 4,405 | 3,993,966 |
| Texas Capital Bancshares, Inc., 4.00% to 5/6/26, 5/6/31(10) | | 3,393 | 2,817,778 |
| Toronto-Dominion Bank (The), 8.125% to 10/31/27, 10/31/82(10) | | 4,577 | 4,564,889 |
| Security | Principal
Amount
(000's omitted) | Value |
| Banks (continued) |
| Truist Financial Corp., 5.867% to 6/8/33, 6/8/34(10) | $ | 9,760 | $ 9,193,220 |
| U.S. Bancorp, 5.836% to 6/10/33, 6/12/34(10) | | 2,463 | 2,324,891 |
| UBS Group AG, 4.375% to 2/10/31(1)(10)(12) | | 3,315 | 2,383,231 |
| | | | $ 118,445,755 |
| Building Materials — 0.3% |
| Cemex SAB de CV, 9.125% to 3/14/28(1)(10)(12) | $ | 2,796 | $ 2,914,145 |
| | | | $ 2,914,145 |
| Chemicals — 1.2% |
| Celanese US Holdings, LLC: | | | |
| 6.35%, 11/15/28 | $ | 3,776 | $ 3,730,483 |
| 6.55%, 11/15/30 | | 1,485 | 1,454,013 |
| 6.70%, 11/15/33 | | 3,258 | 3,173,775 |
| Sasol Financing USA, LLC, 8.75%, 5/3/29(1) | | 5,000 | 4,812,354 |
| | | | $ 13,170,625 |
| Commercial Services — 0.7% |
| Ashtead Capital, Inc.: | | | |
| 4.25%, 11/1/29(1) | $ | 2,785 | $ 2,468,143 |
| 5.95%, 10/15/33(1) | | 3,750 | 3,564,020 |
| Western Union Co. (The), 6.20%, 11/17/36 | | 2,075 | 2,025,356 |
| | | | $ 8,057,519 |
| Computers — 1.2% |
| Kyndryl Holdings, Inc.: | | | |
| 2.70%, 10/15/28 | $ | 4,800 | $ 3,948,986 |
| 3.15%, 10/15/31 | | 6,646 | 5,038,729 |
| Seagate HDD Cayman: | | | |
| 5.75%, 12/1/34 | | 2,589 | 2,189,352 |
| 9.625%, 12/1/32(1) | | 1,901 | 2,050,223 |
| | | | $ 13,227,290 |
| Consumer Products — 0.1% |
| Natura Cosmeticos S.A., 4.125%, 5/3/28(1) | $ | 1,042 | $ 895,816 |
| | | | $ 895,816 |
| Diversified Financial Services — 4.0% |
| Ally Financial, Inc.: | | | |
| 3.875%, 5/21/24 | $ | 3,500 | $ 3,435,547 |
| 8.00%, 11/1/31 | | 5,825 | 5,886,160 |
| Alpha Holding S.A. de CV, 9.00%, 2/10/25(1)(13) | | 2,946 | 44,191 |
| American AgCredit Corp., Series A, 5.25% to 6/15/26(1)(10)(12) | | 1,431 | 1,314,731 |
12
See Notes to Financial Statements.
Eaton Vance
Total Return Bond Fund
September 30, 2023
Portfolio of Investments — continued
| Security | Principal
Amount
(000's omitted) | Value |
| Diversified Financial Services (continued) |
| Aviation Capital Group, LLC: | | | |
| 6.25%, 4/15/28(1) | $ | 2,518 | $ 2,464,727 |
| 6.375%, 7/15/30(1) | | 4,930 | 4,778,307 |
| Brookfield Finance, Inc., 4.70%, 9/20/47 | | 3,240 | 2,527,590 |
| CI Financial Corp.: | | | |
| 3.20%, 12/17/30 | | 3,912 | 2,970,290 |
| 4.10%, 6/15/51 | | 4,504 | 2,610,982 |
| Inversiones La Construccion S.A., 4.75%, 2/7/32(11) | | 2,250 | 1,756,980 |
| Jefferies Financial Group, Inc., 5.875%, 7/21/28 | | 4,453 | 4,360,551 |
| OneMain Finance Corp.: | | | |
| 3.50%, 1/15/27 | | 1,700 | 1,457,334 |
| 5.375%, 11/15/29 | | 2,696 | 2,261,135 |
| Rocket Mortgage, LLC/Rocket Mortgage Co.-Issuer, Inc., 3.875%, 3/1/31(1) | | 2,900 | 2,316,187 |
| UniCredit SpA, 5.861% to 6/19/27, 6/19/32(1)(10) | | 5,038 | 4,588,030 |
| | | | $ 42,772,742 |
| Electric Utilities — 0.6% |
| Cometa Energia S.A. de CV, 6.375%, 4/24/35(11) | $ | 1,929 | $ 1,798,510 |
| Edison International, Series B, 5.00% to 12/15/26(10)(12) | | 2,996 | 2,568,097 |
| Minejesa Capital BV, 4.625%, 8/10/30(11) | | 2,100 | 1,873,725 |
| | | | $ 6,240,332 |
| Electrical and Electronic Equipment — 0.4% |
| Jabil, Inc., 3.00%, 1/15/31 | $ | 1,468 | $ 1,190,692 |
| Vontier Corp., 2.95%, 4/1/31 | | 3,671 | 2,835,268 |
| | | | $ 4,025,960 |
| Entertainment — 0.1% |
| WarnerMedia Holdings, Inc., 5.391%, 3/15/62 | $ | 1,825 | $ 1,349,139 |
| | | | $ 1,349,139 |
| Foods — 0.4% |
| Smithfield Foods, Inc., 5.20%, 4/1/29(1) | $ | 4,300 | $ 3,932,301 |
| | | | $ 3,932,301 |
| Health Care — 1.3% |
| Centene Corp.: | | | |
| 2.50%, 3/1/31 | $ | 3,824 | $ 2,942,142 |
| 3.375%, 2/15/30 | | 990 | 826,855 |
| HCA, Inc.: | | | |
| 3.50%, 7/15/51 | | 2,996 | 1,873,494 |
| 5.00%, 3/15/24 | | 5,000 | 4,975,141 |
| Security | Principal
Amount
(000's omitted) | Value |
| Health Care (continued) |
| HCA, Inc.: (continued) | | | |
| 5.25%, 6/15/49 | $ | 3,700 | $ 3,044,289 |
| | | | $ 13,661,921 |
| Insurance — 3.2% |
| American National Group, Inc., 6.144%, 6/13/32(1) | $ | 3,300 | $ 2,989,375 |
| ASR Nederland N.V., 7.00% to 9/7/33, 12/7/43(10)(11) | | 2,860 | 3,113,385 |
| Athene Global Funding, 2.646%, 10/4/31(1) | | 5,300 | 3,932,292 |
| F&G Annuities & Life, Inc., 7.40%, 1/13/28 | | 9,102 | 9,093,415 |
| Global Atlantic Fin Co.: | | | |
| 3.125%, 6/15/31(1) | | 4,532 | 3,234,757 |
| 7.95%, 6/15/33(1) | | 2,200 | 2,116,383 |
| Hanwha Life Insurance Co., Ltd., 3.379% to 2/4/27, 2/4/32(10)(11) | | 2,100 | 1,865,626 |
| Liberty Mutual Group, Inc., 4.125% to 9/15/26, 12/15/51(1)(10) | | 3,769 | 3,104,770 |
| Radian Group, Inc., 4.875%, 3/15/27 | | 2,508 | 2,346,083 |
| Stewart Information Services Corp., 3.60%, 11/15/31 | | 4,244 | 3,126,676 |
| | | | $ 34,922,762 |
| Leisure Time — 0.8% |
| Brunswick Corp., 5.10%, 4/1/52 | $ | 6,491 | $ 4,476,324 |
| NCL Corp., Ltd., 5.875%, 3/15/26(1) | | 2,550 | 2,357,228 |
| Viking Cruises, Ltd., 5.875%, 9/15/27(1) | | 2,525 | 2,307,168 |
| | | | $ 9,140,720 |
| Media — 0.3% |
| CCO Holdings, LLC/CCO Holdings Capital Corp., 5.125%, 5/1/27(1) | $ | 3,275 | $ 3,054,793 |
| | | | $ 3,054,793 |
| Oil and Gas — 1.9% |
| Enviva Partners, L.P./Enviva Partners Finance Corp., 6.50%, 1/15/26(1) | $ | 3,339 | $ 2,726,527 |
| Hunt Oil Co. of Peru, LLC Sucursal Del Peru, 8.55%, 9/18/33(1) | | 1,170 | 1,182,542 |
| National Fuel Gas Co., 2.95%, 3/1/31 | | 5,065 | 3,988,198 |
| Neptune Energy Bondco PLC, 6.625%, 5/15/25(1) | | 1,315 | 1,303,823 |
| Occidental Petroleum Corp., 7.50%, 5/1/31 | | 3,000 | 3,187,105 |
| Petroleos Mexicanos: | | | |
| 6.50%, 3/13/27 | | 2,450 | 2,162,148 |
| 10.00%, 2/7/33(1) | | 2,912 | 2,594,973 |
| Var Energi ASA, 7.50%, 1/15/28(1) | | 3,000 | 3,083,647 |
| | | | $ 20,228,963 |
13
See Notes to Financial Statements.
Eaton Vance
Total Return Bond Fund
September 30, 2023
Portfolio of Investments — continued
| Security | Principal
Amount
(000's omitted) | Value |
| Pipelines — 1.2% |
| Enbridge, Inc., 8.25% to 10/15/28, 1/15/84(10) | $ | 5,500 | $ 5,398,016 |
| Midwest Connector Capital Co., LLC, 4.625%, 4/1/29(1) | | 4,344 | 3,973,238 |
| ONEOK, Inc., 6.05%, 9/1/33 | | 3,685 | 3,622,425 |
| | | | $ 12,993,679 |
| Real Estate Investment Trusts (REITs) — 3.6% |
| American Assets Trust, L.P., 3.375%, 2/1/31 | $ | 3,290 | $ 2,467,085 |
| CBRE Services, Inc., 5.95%, 8/15/34 | | 3,725 | 3,517,949 |
| Corporate Office Properties, L.P., 2.90%, 12/1/33 | | 3,331 | 2,339,926 |
| EPR Properties: | | | |
| 3.60%, 11/15/31 | | 1,200 | 890,638 |
| 3.75%, 8/15/29 | | 2,672 | 2,148,972 |
| 4.95%, 4/15/28 | | 3,444 | 3,054,829 |
| HAT Holdings I, LLC/HAT Holdings II, LLC: | | | |
| 3.75%, 9/15/30(1) | | 5,251 | 4,024,915 |
| 6.00%, 4/15/25(1) | | 1,600 | 1,558,622 |
| Iron Mountain, Inc., 4.50%, 2/15/31(1) | | 2,633 | 2,168,535 |
| Newmark Group, Inc., 6.125%, 11/15/23 | | 5,419 | 5,414,150 |
| Sun Communities Operating, L.P.: | | | |
| 4.20%, 4/15/32 | | 1,865 | 1,592,573 |
| 5.70%, 1/15/33 | | 1,632 | 1,545,395 |
| VICI Properties, L.P./VICI Note Co., Inc.: | | | |
| 5.625%, 5/1/24(1) | | 3,000 | 2,983,624 |
| 5.75%, 2/1/27(1) | | 5,908 | 5,725,193 |
| | | | $ 39,432,406 |
| Retail — 1.1% |
| Bath & Body Works, Inc., 6.875%, 11/1/35 | $ | 2,845 | $ 2,544,094 |
| Dick's Sporting Goods, Inc., 4.10%, 1/15/52 | | 7,104 | 4,319,894 |
| Lithia Motors, Inc., 4.375%, 1/15/31(1) | | 2,811 | 2,328,343 |
| Macy's Retail Holdings, LLC, 5.875%, 4/1/29(1) | | 2,778 | 2,435,042 |
| | | | $ 11,627,373 |
| Semiconductors — 0.3% |
| Foundry JV Holdco, LLC, 5.875%, 1/25/34(1) | $ | 3,873 | $ 3,703,898 |
| | | | $ 3,703,898 |
| Software — 1.2% |
| Concentrix Corp.: | | | |
| 6.60%, 8/2/28 | $ | 8,433 | $ 8,142,797 |
| 6.85%, 8/2/33 | | 4,820 | 4,456,616 |
| | | | $ 12,599,413 |
| Security | Principal
Amount
(000's omitted) | Value |
| Technology — 0.3% |
| CDW, LLC/CDW Finance Corp., 3.276%, 12/1/28 | $ | 3,087 | $ 2,666,171 |
| | | | $ 2,666,171 |
| Telecommunications — 1.1% |
| Nokia Oyj, 4.375%, 6/12/27 | $ | 1,110 | $ 1,028,831 |
| Rogers Communications, Inc., 4.55%, 3/15/52 | | 2,456 | 1,793,342 |
| SES Global Americas Holdings GP, 5.30%, 3/25/44(1) | | 1,360 | 917,112 |
| SES S.A., 5.30%, 4/4/43(1) | | 810 | 546,197 |
| Sprint, LLC, 7.125%, 6/15/24 | | 7,960 | 8,015,306 |
| | | | $ 12,300,788 |
| Transportation — 0.2% |
| Penske Truck Leasing Co., L.P./PTL Finance Corp., 6.20%, 6/15/30(1) | $ | 2,330 | $ 2,298,024 |
| | | | $ 2,298,024 |
Total Corporate Bonds
(identified cost $443,068,722) | | | $ 412,078,728 |
| Security | Shares | Value |
| Real Estate Management & Development — 0.3% |
| Brookfield Property Partners, L.P.: | | | |
| Series A, 5.75% | | 187,034 | $ 2,382,813 |
| Series A2, 6.375% | | 74,772 | 1,009,422 |
| | | | $ 3,392,235 |
| Wireless Telecommunication Services — 0.2% |
| United States Cellular Corp., 5.50% | | 107,100 | $ 1,762,866 |
| | | | $ 1,762,866 |
Total Preferred Stocks
(identified cost $9,222,650) | | | $ 5,155,101 |
| Sovereign Government Bonds — 1.5% |
| Security | Principal
Amount
(000's omitted) | Value |
| Mexico — 0.9% |
| Mexican Udibonos, 4.00%, 11/30/28 | MXN | 82,585 | $ 4,454,855 |
| Mexico Bonos, 8.00%, 9/5/24 | MXN | 85,000 | 4,734,664 |
| | | | $ 9,189,519 |
14
See Notes to Financial Statements.
Eaton Vance
Total Return Bond Fund
September 30, 2023
Portfolio of Investments — continued
| Security | Principal
Amount
(000's omitted) | Value |
| South Africa — 0.2% |
| Republic of South Africa, 5.875%, 4/20/32 | USD | 3,118 | $ 2,659,966 |
| | | | $ 2,659,966 |
| Uruguay — 0.4% |
| Uruguay Government International Bond, 9.75%, 7/20/33 | UYU | 148,900 | $ 3,906,188 |
| | | | $ 3,906,188 |
Total Sovereign Government Bonds
(identified cost $15,972,207) | | | $ 15,755,673 |
| U.S. Government Agency Mortgage-Backed Securities — 11.9% |
| Security | Principal
Amount
(000's omitted) | Value |
| Federal National Mortgage Association: | | | |
| 2.00%, 4/1/51 | $ | 1,078 | $ 834,328 |
| 4.00%, 30-Year, TBA(14) | | 8,514 | 7,585,439 |
| 4.50%, 30-Year, TBA(14) | | 18,576 | 17,064,515 |
| 5.00%, 30-Year, TBA(14) | | 56,420 | 53,257,428 |
| 5.50%, 30-Year, TBA(14) | | 44,455 | 42,982,450 |
| 6.00%, 30-Year, TBA(14) | | 7,500 | 7,405,367 |
Total U.S. Government Agency Mortgage-Backed Securities
(identified cost $131,648,056) | | $ 129,129,527 |
| U.S. Treasury Obligations — 26.8% |
| Security | Principal
Amount
(000's omitted) | Value |
| U.S. Treasury Bond: | | | |
| 2.375%,2/15/42 | $ | 72,222 | $ 49,944,616 |
| 2.875%,5/15/43 | | 18,118 | 13,429,614 |
| 2.875%,5/15/52 | | 5,503 | 3,903,046 |
| 3.625%,2/15/53 | | 8,233 | 6,810,878 |
| 3.625%,5/15/53 | | 23,536 | 19,492,589 |
| 3.875%,2/15/43 | | 4,455 | 3,877,938 |
| 3.875%,5/15/43 | | 1,600 | 1,391,250 |
| 4.00%,11/15/52 | | 6,082 | 5,392,073 |
| U.S. Treasury Floating Rate Notes, 5.572%, (3 mo. USTMMR + 0.169%), 4/30/25(6) | | 5,000 | 5,002,515 |
| U.S. Treasury Note: | | | |
| 1.25%,6/30/28 | | 5,600 | 4,796,312 |
| 3.25%,8/31/24 | | 42,180 | 41,343,167 |
| 3.50%,1/31/28 | | 7,543 | 7,199,735 |
| Security | Principal
Amount
(000's omitted) | Value |
| U.S. Treasury Note: (continued) | | | |
| 3.50%,4/30/28 | $ | 12,455 | $ 11,872,631 |
| 3.50%,4/30/30 | | 6,961 | 6,515,877 |
| 3.625%,3/31/28 | | 5,750 | 5,513,262 |
| 3.625%,5/31/28 | | 8,900 | 8,531,137 |
| 3.625%,3/31/30 | | 2,822 | 2,662,270 |
| 3.75%,5/31/30 | | 7,505 | 7,126,232 |
| 4.00%,2/29/28 | | 6,228 | 6,067,678 |
| 4.125%,7/31/28 | | 9,300 | 9,100,195 |
| 4.625%,9/15/26 | | 4,601 | 4,578,714 |
| 5.25%,11/15/28 | | 22,355 | 22,958,410 |
| 5.375%,2/15/31 | | 21,475 | 22,539,522 |
| 6.25%,5/15/30 | | 5,520 | 6,023,269 |
| 6.75%,8/15/26 | | 13,295 | 13,973,253 |
Total U.S. Treasury Obligations
(identified cost $307,081,624) | | | $ 290,046,183 |
| Security | Principal
Amount | Value |
| Financial Intermediaries — 0.0% |
| Alpha Holding S.A., Escrow Certificates(15)(16) | | $6,250,000 | $ 0 |
Total Miscellaneous
(identified cost $0) | | | $ 0 |
| Short-Term Investments — 1.6% |
| Security | Shares | Value |
| Morgan Stanley Institutional Liquidity Funds - Government Portfolio, Institutional Class, 5.27%(17) | | 7,241,977 | $ 7,241,977 |
Total Affiliated Fund
(identified cost $7,241,977) | | | $ 7,241,977 |
| Security | Principal
Amount
(000's omitted) | Value |
| Harley-Davidson Financial Services, Inc., 6.195%(1)(18) | $ | 5,000 | $ 4,958,566 |
15
See Notes to Financial Statements.
Eaton Vance
Total Return Bond Fund
September 30, 2023
Portfolio of Investments — continued
| Security | Principal
Amount
(000's omitted) | Value |
| Jabil, Inc., 6.197%(1)(18) | $ | 5,430 | $ 5,423,512 |
Total Commercial Paper
(identified cost $10,383,462) | | | $ 10,382,078 |
Total Short-Term Investments
(identified cost $17,625,439) | | | $ 17,624,055 |
Total Purchased Call Options — 0.0%(9)
(identified cost $115,525) | | | $ 118,594 |
Total Investments — 110.1%
(identified cost $1,282,723,250) | | | $1,191,923,040 |
| Other Assets, Less Liabilities — (10.1)% | | | $ (109,732,446) |
| Net Assets — 100.0% | | | $1,082,190,594 |
| The percentage shown for each investment category in the Portfolio of Investments is based on net assets. |
| (1) | Security exempt from registration under Rule 144A of the Securities Act of 1933, as amended. These securities may be sold in certain transactions in reliance on an exemption from registration (normally to qualified institutional buyers). At September 30, 2023, the aggregate value of these securities is $465,353,110 or 43.0% of the Fund's net assets. |
| (2) | Principal Amount is denominated in Canadian dollars. |
| (3) | Weighted average fixed-rate coupon that changes/updates monthly. Rate shown is the rate at September 30, 2023. |
| (4) | Step coupon security. Interest rate represents the rate in effect at September 30, 2023. |
| (5) | When-issued security. |
| (6) | Variable rate security. The stated interest rate represents the rate in effect at September 30, 2023. |
| (7) | Inverse floating-rate security whose coupon varies inversely with changes in the interest rate index. The stated interest rate represents the coupon rate in effect at September 30, 2023. |
| (8) | Represents an investment in an issuer that may be deemed to be an affiliate (see Note 10). |
| (9) | Amount is less than 0.05%. |
| (10) | Security converts to variable rate after the indicated fixed-rate coupon period. |
| (11) | Security exempt from registration under Regulation S of the Securities Act of 1933, as amended, which exempts from registration securities offered and sold outside the United States. Security may not be offered or sold in the United States except pursuant to an exemption from, or in a transaction not subject to, the registration requirements of the Securities Act of 1933, as amended. At September 30, 2023, the aggregate value of these securities is $16,765,770 or 1.5% of the Fund's net assets. |
| (12) | Perpetual security with no stated maturity date but may be subject to calls by the issuer. |
| (13) | Issuer is in default with respect to interest and/or principal payments. |
| (14) | TBA (To Be Announced) securities are purchased on a forward commitment basis with an approximate principal amount and maturity date. The actual principal amount and maturity date are determined upon settlement. |
| (15) | For fair value measurement disclosure purposes, security is categorized as Level 3 (see Note 11). |
| (16) | Non-income producing security. |
| (17) | May be deemed to be an affiliated investment company. The rate shown is the annualized seven-day yield as of September 30, 2023. |
| (18) | Rate shown reflects the yield at September 30, 2023. |
| Country Concentration of Portfolio(1) |
| Country | Percentage of
Total Investments | Value |
| United States | 85.9% | $1,024,054,978 |
| Mexico | 2.0 | 23,554,026 |
| Canada | 1.8 | 21,707,347 |
| United Kingdom | 1.5 | 18,227,658 |
| France | 0.9 | 11,278,652 |
| Cayman Islands | 0.9 | 10,763,887 |
| Italy | 0.8 | 10,055,401 |
| Spain | 0.8 | 9,415,706 |
| Ireland | 0.7 | 8,143,336 |
| South Africa | 0.6 | 7,472,320 |
| Bermuda | 0.5 | 6,044,465 |
| Netherlands | 0.5 | 5,408,619 |
| Denmark | 0.4 | 5,191,567 |
| Australia | 0.4 | 4,689,045 |
| Israel | 0.4 | 4,547,912 |
| Uruguay | 0.3 | 3,906,188 |
| Norway | 0.3 | 3,083,647 |
| Switzerland | 0.2 | 2,383,231 |
| Indonesia | 0.2 | 1,873,725 |
| South Korea | 0.2 | 1,865,626 |
| Supranational | 0.2 | 1,809,632 |
| Chile | 0.1 | 1,756,980 |
| Luxembourg | 0.1 | 1,463,309 |
| Peru | 0.1 | 1,182,542 |
| Finland | 0.1 | 1,028,831 |
| Brazil | 0.1 | 895,816 |
| Total Investments | 100.0% | $1,191,804,446 |
| (1) | Depictions do not reflect the Fund’s option positions. |
16
See Notes to Financial Statements.
Eaton Vance
Total Return Bond Fund
September 30, 2023
Portfolio of Investments — continued
| Purchased Call Options (Exchange-Traded) — 0.0%(1) |
| Description | Number of
Contracts | Notional
Amount | Exercise
Price | Expiration
Date | Value |
| U.S. 10-Year Treasury Note Futures 12/2023 | 230 | $24,854,375 | $110.00 | 11/24/23 | $ 118,594 |
| Total Investments | | | | | $118,594 |
| (1) | Amount is less than 0.05%. |
| Forward Foreign Currency Exchange Contracts (OTC) |
| Currency Purchased | Currency Sold | Counterparty | Settlement
Date | Unrealized
Appreciation | Unrealized
(Depreciation) |
| BRL | 14,473,357 | USD | 2,899,310 | State Street Bank and Trust Company | 11/10/23 | $ — | $ (34,779) |
| BRL | 12,300,000 | USD | 2,499,238 | State Street Bank and Trust Company | 11/10/23 | — | (64,853) |
| JPY | 717,000,000 | USD | 5,130,557 | JPMorgan Chase Bank, N.A. | 11/10/23 | — | (303,458) |
| USD | 2,102,377 | CAD | 2,799,001 | Citibank, N.A. | 11/10/23 | 40,554 | — |
| USD | 3,211,947 | CAD | 4,340,530 | State Street Bank and Trust Company | 11/10/23 | 14,590 | — |
| USD | 3,222,475 | EUR | 2,907,464 | JPMorgan Chase Bank, N.A. | 11/10/23 | 143,705 | — |
| | | | | | | $198,849 | $(403,090) |
| Futures Contracts |
| Description | Number of
Contracts | Position | Expiration
Date | Notional
Amount | Value/Unrealized
Appreciation
(Depreciation) |
| Interest Rate Futures | | | | | |
| U.S. 2-Year Treasury Note | 1,298 | Long | 12/29/23 | $263,118,798 | $ (975,983) |
| U.S. 5-Year Treasury Note | 352 | Long | 12/29/23 | 37,086,500 | (239,084) |
| U.S. 10-Year Treasury Note | 92 | Long | 12/19/23 | 9,941,750 | (28,829) |
| U.S. Long Treasury Bond | 109 | Long | 12/19/23 | 12,402,156 | (515,454) |
| U.S. Ultra-Long Treasury Bond | 48 | Long | 12/19/23 | 5,697,000 | (196,220) |
| U.S. Ultra 10-Year Treasury Note | (55) | Short | 12/19/23 | (6,135,938) | 134,854 |
| | | | | | $ (1,820,716) |
| Abbreviations: |
| OTC | – Over-the-counter |
| SOFR | – Secured Overnight Financing Rate |
| TBA | – To Be Announced |
| USTMMR | – U.S. Treasury Money Market Rate |
| Currency Abbreviations: |
| BRL | – Brazilian Real |
| CAD | – Canadian Dollar |
| EUR | – Euro |
| JPY | – Japanese Yen |
| MXN | – Mexican Peso |
| USD | – United States Dollar |
| UYU | – Uruguayan Peso |
17
See Notes to Financial Statements.
Eaton Vance
Total Return Bond Fund
September 30, 2023
Statement of Assets and Liabilities
| | September 30, 2023 |
| Assets | |
| Unaffiliated investments, at value (identified cost $1,258,282,642) | $ 1,169,666,738 |
| Affiliated investments, at value (identified cost $24,440,608) | 22,256,302 |
| Deposits for derivatives collateral — Futures contracts | 2,746,985 |
| Foreign currency, at value (identified cost $1,950) | 1,930 |
| Interest and dividends receivable | 10,703,946 |
| Interest and dividends receivable from affiliated investments | 109,624 |
| Receivable for investments sold | 13,525,148 |
| Receivable for Fund shares sold | 2,174,484 |
| Receivable for variation margin on open futures contracts | 306,774 |
| Receivable for open forward foreign currency exchange contracts | 198,849 |
| Tax reclaims receivable | 40,703 |
| Receivable from affiliates | 177,862 |
| Trustees' deferred compensation plan | 18,379 |
| Prepaid expenses | 4,230 |
| Total assets | $1,221,931,954 |
| Liabilities | |
| Payable for when-issued securities/forward purchase commitments | $ 131,595,511 |
| Payable for Fund shares redeemed | 3,069,634 |
| Payable for open forward foreign currency exchange contracts | 403,090 |
| Distributions payable | 11,995 |
| Due to custodian | 3,849,719 |
| Payable to affiliates: | |
| Investment adviser fee | 397,020 |
| Distribution and service fees | 42,508 |
| Trustees' deferred compensation plan | 18,379 |
| Accrued expenses | 353,504 |
| Total liabilities | $ 139,741,360 |
| Net Assets | $1,082,190,594 |
| Sources of Net Assets | |
| Paid-in capital | $ 1,257,129,980 |
| Accumulated loss | (174,939,386) |
| Net Assets | $1,082,190,594 |
| Class A Shares | |
| Net Assets | $ 86,928,527 |
| Shares Outstanding | 8,842,735 |
Net Asset Value and Redemption Price Per Share
(net assets ÷ shares of beneficial interest outstanding) | $ 9.83 |
Maximum Offering Price Per Share
(100 ÷ 96.75 of net asset value per share) | $ 10.16 |
| Class C Shares | |
| Net Assets | $ 29,457,381 |
| Shares Outstanding | 2,998,212 |
Net Asset Value and Offering Price Per Share*
(net assets ÷ shares of beneficial interest outstanding) | $ 9.82 |
| Class I Shares | |
| Net Assets | $ 965,755,802 |
| Shares Outstanding | 98,321,879 |
Net Asset Value, Offering Price and Redemption Price Per Share
(net assets ÷ shares of beneficial interest outstanding) | $ 9.82 |
18
See Notes to Financial Statements.
Eaton Vance
Total Return Bond Fund
September 30, 2023
Statement of Assets and Liabilities — continued
| | September 30, 2023 |
| Class R6 Shares | |
| Net Assets | $48,884 |
| Shares Outstanding | 4,978 |
Net Asset Value, Offering Price and Redemption Price Per Share
(net assets ÷ shares of beneficial interest outstanding) | $ 9.82 |
| On sales of $100,000 or more, the offering price of Class A shares is reduced. |
| * | Redemption price per share is equal to the net asset value less any applicable contingent deferred sales charge. |
19
See Notes to Financial Statements.
Eaton Vance
Total Return Bond Fund
September 30, 2023
| | Year Ended |
| | September 30, 2023 |
| Investment Income | |
| Dividend income (net of foreign taxes withheld of $37,259) | $ 502,383 |
| Dividend income from affiliated investments | 899,994 |
| Interest and other income | 45,457,717 |
| Interest income from affiliated investments | 1,110,960 |
| Total investment income | $ 47,971,054 |
| Expenses | |
| Investment adviser fee | $ 3,900,401 |
| Distribution and service fees: | |
| Class A | 217,502 |
| Class C | 301,434 |
| Trustees’ fees and expenses | 56,194 |
| Custodian fee | 226,664 |
| Transfer and dividend disbursing agent fees | 764,248 |
| Legal and accounting services | 77,845 |
| Printing and postage | 85,313 |
| Registration fees | 122,655 |
| Miscellaneous | 47,927 |
| Total expenses | $ 5,800,183 |
| Deduct: | |
| Waiver and/or reimbursement of expenses by affiliates | $ 1,055,145 |
| Total expense reductions | $ 1,055,145 |
| Net expenses | $ 4,745,038 |
| Net investment income | $ 43,226,016 |
| Realized and Unrealized Gain (Loss) | |
| Net realized gain (loss): | |
| Investment transactions | $ (55,567,231) |
| Investment transactions - affiliated investments | (2,187,060) |
| Futures contracts | (1,324,951) |
| Swap contracts | (34,725) |
| Foreign currency transactions | (44,013) |
| Forward foreign currency exchange contracts | (443,672) |
| Net realized loss | $(59,601,652) |
| Change in unrealized appreciation (depreciation): | |
| Investments | $ 17,491,598 |
| Investments - affiliated investments | 975,449 |
| Futures contracts | (2,210,407) |
| Foreign currency | (7,716) |
| Forward foreign currency exchange contracts | (335,793) |
| Net change in unrealized appreciation (depreciation) | $ 15,913,131 |
| Net realized and unrealized loss | $(43,688,521) |
| Net decrease in net assets from operations | $ (462,505) |
20
See Notes to Financial Statements.
Eaton Vance
Total Return Bond Fund
September 30, 2023
Statements of Changes in Net Assets
| | Year Ended September 30, |
| | 2023 | 2022 |
| Increase (Decrease) in Net Assets | | |
| From operations: | | |
| Net investment income | $ 43,226,016 | $ 22,335,702 |
| Net realized loss | (59,601,652) | (16,488,780) |
| Net change in unrealized appreciation (depreciation) | 15,913,131 | (115,384,239) |
| Net decrease in net assets from operations | $ (462,505) | $(109,537,317) |
| Distributions to shareholders: | | |
| Class A | $ (4,282,150) | $ (3,691,989) |
| Class C | (1,256,979) | (1,157,380) |
| Class I | (39,402,038) | (23,898,871) |
| Class R6(1) | (713) | — |
| Total distributions to shareholders | $ (44,941,880) | $ (28,748,240) |
| Transactions in shares of beneficial interest: | | |
| Class A | $ 3,949,587 | $ (2,427,026) |
| Class C | 41,155 | (10,600,672) |
| Class I | 483,872,938 | 4,787,852 |
| Class R6(1) | 50,713 | — |
| Net increase (decrease) in net assets from Fund share transactions | $ 487,914,393 | $ (8,239,846) |
| Net increase (decrease) in net assets | $ 442,510,008 | $(146,525,403) |
| Net Assets | | |
| At beginning of year | $ 639,680,586 | $ 786,205,989 |
| At end of year | $1,082,190,594 | $ 639,680,586 |
| (1) | For the period from the commencement of operations, June 30, 2023, to September 30, 2023. |
21
See Notes to Financial Statements.
Eaton Vance
Total Return Bond Fund
September 30, 2023
| | Class A |
| | Year Ended September 30, |
| | 2023 | 2022 | 2021 | 2020 | 2019 |
| Net asset value — Beginning of year | $10.230 | $ 12.340 | $ 11.820 | $ 11.990 | $ 11.570 |
| Income (Loss) From Operations | | | | | |
| Net investment income(1) | $ 0.484 | $ 0.325 | $ 0.330 | $ 0.395 | $ 0.427 |
| Net realized and unrealized gain (loss) | (0.380) | (2.017) | 0.573 | (0.143) | 0.451 |
| Total income (loss) from operations | $ 0.104 | $ (1.692) | $ 0.903 | $ 0.252 | $ 0.878 |
| Less Distributions | | | | | |
| From net investment income | $ (0.504) | $ (0.345) | $ (0.323) | $ (0.413) | $ (0.458) |
| From net realized gain | — | (0.073) | (0.060) | (0.009) | — |
| Total distributions | $ (0.504) | $ (0.418) | $ (0.383) | $ (0.422) | $ (0.458) |
| Net asset value — End of year | $ 9.830 | $10.230 | $ 12.340 | $ 11.820 | $ 11.990 |
| Total Return(2)(3) | 1.03% | (14.10)% | 7.72% | 2.21% | 7.76% |
| Ratios/Supplemental Data | | | | | |
| Net assets, end of year (000’s omitted) | $86,929 | $ 86,430 | $107,380 | $136,688 | $137,889 |
| Ratios (as a percentage of average daily net assets): | | | | | |
| Expenses (3) | 0.74% (4) | 0.74% (4) | 0.74% | 0.74% | 0.74% |
| Net investment income | 4.73% | 2.84% | 2.70% | 3.38% | 3.62% |
| Portfolio Turnover | 190% (5) | 118% (5) | 85% (5) | 89% | 75% |
| (1) | Computed using average shares outstanding. |
| (2) | Returns are historical and are calculated by determining the percentage change in net asset value with all distributions reinvested and do not reflect the effect of sales charges. |
| (3) | The investment adviser reimbursed certain operating expenses (equal to 0.12%, 0.10%, 0.08%, 0.11% and 0.11% of average daily net assets for the years ended September 30, 2023, 2022, 2021, 2020 and 2019, respectively). Absent this reimbursement, total return would be lower. |
| (4) | Includes a reduction by the investment adviser of a portion of its adviser fee due to the Fund’s investment in the Liquidity Fund (equal to less than 0.005% of average daily net assets for the years ended September 30, 2023 and 2022, respectively). |
| (5) | Includes the effect of To-Be-Announced (TBA) transactions. |
22
See Notes to Financial Statements.
Eaton Vance
Total Return Bond Fund
September 30, 2023
Financial Highlights — continued
| | Class C |
| | Year Ended September 30, |
| | 2023 | 2022 | 2021 | 2020 | 2019 |
| Net asset value — Beginning of year | $10.220 | $ 12.330 | $ 11.820 | $ 11.990 | $ 11.560 |
| Income (Loss) From Operations | | | | | |
| Net investment income(1) | $ 0.407 | $ 0.236 | $ 0.238 | $ 0.307 | $ 0.344 |
| Net realized and unrealized gain (loss) | (0.381) | (2.014) | 0.564 | (0.142) | 0.456 |
| Total income (loss) from operations | $ 0.026 | $ (1.778) | $ 0.802 | $ 0.165 | $ 0.800 |
| Less Distributions | | | | | |
| From net investment income | $ (0.426) | $ (0.259) | $ (0.232) | $ (0.326) | $ (0.370) |
| From net realized gain | — | (0.073) | (0.060) | (0.009) | — |
| Total distributions | $ (0.426) | $ (0.332) | $ (0.292) | $ (0.335) | $ (0.370) |
| Net asset value — End of year | $ 9.820 | $10.220 | $12.330 | $11.820 | $11.990 |
| Total Return(2)(3) | 0.17% | (14.67)% | 6.83% | 1.45% | 7.05% |
| Ratios/Supplemental Data | | | | | |
| Net assets, end of year (000’s omitted) | $29,457 | $ 30,639 | $ 48,423 | $ 54,189 | $ 52,001 |
| Ratios (as a percentage of average daily net assets): | | | | | |
| Expenses (3) | 1.49% (4) | 1.49% (4) | 1.49% | 1.49% | 1.49% |
| Net investment income | 3.97% | 2.05% | 1.95% | 2.63% | 2.93% |
| Portfolio Turnover | 190% (5) | 118% (5) | 85% (5) | 89% | 75% |
| (1) | Computed using average shares outstanding. |
| (2) | Returns are historical and are calculated by determining the percentage change in net asset value with all distributions reinvested and do not reflect the effect of sales charges. |
| (3) | The investment adviser reimbursed certain operating expenses (equal to 0.12%, 0.10%, 0.08%, 0.11% and 0.11% of average daily net assets for the years ended September 30, 2023, 2022, 2021, 2020 and 2019, respectively). Absent this reimbursement, total return would be lower. |
| (4) | Includes a reduction by the investment adviser of a portion of its adviser fee due to the Fund’s investment in the Liquidity Fund (equal to less than 0.005% of average daily net assets for the years ended September 30, 2023 and 2022, respectively). |
| (5) | Includes the effect of To-Be-Announced (TBA) transactions. |
23
See Notes to Financial Statements.
Eaton Vance
Total Return Bond Fund
September 30, 2023
Financial Highlights — continued
| | Class I |
| | Year Ended September 30, |
| | 2023 | 2022 | 2021 | 2020 | 2019 |
| Net asset value — Beginning of year | $ 10.220 | $ 12.330 | $ 11.810 | $ 11.990 | $ 11.560 |
| Income (Loss) From Operations | | | | | |
| Net investment income(1) | $ 0.515 | $ 0.353 | $ 0.356 | $ 0.423 | $ 0.457 |
| Net realized and unrealized gain (loss) | (0.386) | (2.016) | 0.578 | (0.152) | 0.460 |
| Total income (loss) from operations | $ 0.129 | $ (1.663) | $ 0.934 | $ 0.271 | $ 0.917 |
| Less Distributions | | | | | |
| From net investment income | $ (0.529) | $ (0.374) | $ (0.354) | $ (0.442) | $ (0.487) |
| From net realized gain | — | (0.073) | (0.060) | (0.009) | — |
| Total distributions | $ (0.529) | $ (0.447) | $ (0.414) | $ (0.451) | $ (0.487) |
| Net asset value — End of year | $ 9.820 | $ 10.220 | $ 12.330 | $ 11.810 | $ 11.990 |
| Total Return(2)(3) | 1.28% | (13.89)% | 8.00% | 2.37% | 8.12% |
| Ratios/Supplemental Data | | | | | |
| Net assets, end of year (000’s omitted) | $965,756 | $522,611 | $630,403 | $531,191 | $622,727 |
| Ratios (as a percentage of average daily net assets): | | | | | |
| Expenses (3) | 0.49% (4) | 0.49% (4) | 0.49% | 0.49% | 0.49% |
| Net investment income | 5.04% | 3.07% | 2.92% | 3.62% | 3.89% |
| Portfolio Turnover | 190% (5) | 118% (5) | 85% (5) | 89% | 75% |
| (1) | Computed using average shares outstanding. |
| (2) | Returns are historical and are calculated by determining the percentage change in net asset value with all distributions reinvested. |
| (3) | The investment adviser reimbursed certain operating expenses (equal to 0.12%, 0.10%, 0.08%, 0.11% and 0.11% of average daily net assets for the years ended September 30, 2023, 2022, 2021, 2020 and 2019, respectively). Absent this reimbursement, total return would be lower. |
| (4) | Includes a reduction by the investment adviser of a portion of its adviser fee due to the Fund’s investment in the Liquidity Fund (equal to less than 0.005% of average daily net assets for the years ended September 30, 2023 and 2022, respectively). |
| (5) | Includes the effect of To-Be-Announced (TBA) transactions. |
24
See Notes to Financial Statements.
Eaton Vance
Total Return Bond Fund
September 30, 2023
Financial Highlights — continued
| | Class R6 |
| | Period Ended
September 30,
2023(1) |
| Net asset value — Beginning of period | $10.190 |
| Income (Loss) From Operations | |
| Net investment income(2) | $ 0.124 |
| Net realized and unrealized loss | (0.349) |
| Total loss from operations | $ (0.225) |
| Less Distributions | |
| From net investment income | $ (0.145) |
| Total distributions | $ (0.145) |
| Net asset value — End of period | $ 9.820 |
| Total Return(3)(4) | (2.23)% (5) |
| Ratios/Supplemental Data | |
| Net assets, end of period (000’s omitted) | $ 49 |
| Ratios (as a percentage of average daily net assets): | |
| Expenses (4) | 0.43% (6)(7) |
| Net investment income | 4.92% (7) |
| Portfolio Turnover | 190% (5)(8)(9) |
| (1) | For the period from the commencement of operations, June 30, 2023, to September 30, 2023. |
| (2) | Computed using average shares outstanding. |
| (3) | Returns are historical and are calculated by determining the percentage change in net asset value with all distributions reinvested. |
| (4) | The investment adviser reimbursed certain operating expenses (equal to 0.12% of average daily net assets for the period ended September 30, 2023). Absent this reimbursement, total return would be lower. |
| (5) | Not annualized. |
| (6) | Includes a reduction by the investment adviser of a portion of its adviser fee due to the Fund’s investment in the Liquidity Fund (equal to less than 0.005% of average daily net assets for the period ended September 30, 2023). |
| (7) | Annualized. |
| (8) | Includes the effect of To-Be-Announced (TBA) transactions. |
| (9) | For the year ended September 30, 2023. |
25
See Notes to Financial Statements.
Eaton Vance
Total Return Bond Fund
September 30, 2023
Notes to Financial Statements
1 Significant Accounting Policies
Eaton Vance Total Return Bond Fund (the Fund) is a diversified series of Eaton Vance Mutual Funds Trust (the Trust). The Trust is a Massachusetts business trust registered under the Investment Company Act of 1940, as amended (the 1940 Act), as an open-end management investment company. The Fund’s investment objective is total return. The Fund offers four classes of shares. Class A shares are generally sold subject to a sales charge imposed at time of purchase. Class C shares are sold at net asset value and are generally subject to a contingent deferred sales charge (see Note 5). Effective November 5, 2020, Class C shares automatically convert to Class A shares eight years after their purchase as described in the Fund’s prospectus. Class I and Class R6
shares are sold at net asset value and are not subject to a sales charge. Each class represents a pro rata interest in the Fund, but votes separately on class-specific matters and (as noted below) is subject to different expenses. Realized and unrealized gains and losses are allocated daily to each class of shares based on the relative net assets of each class to the total net assets of the Fund. Net investment income, other than class-specific expenses, is allocated daily to each class of shares based upon the ratio of the value of each class’s paid shares to the total value of all paid shares. Sub-accounting, recordkeeping and similar administrative fees payable to financial intermediaries, which are a component of transfer and dividend disbursing agent fees on the Statement of Operations, are not allocated to Class R6 shares. Each class of shares differs in its distribution plan and certain other class-specific expenses.
The following is a summary of significant accounting policies of the Fund. The policies are in conformity with accounting principles generally accepted in the United States of America (U.S. GAAP). The Fund is an investment company and follows accounting and reporting guidance in the Financial Accounting Standards Board (FASB) Accounting Standards Codification Topic 946.
A Investment Valuation—The following methodologies are used to determine the market value or fair value of investments.
Debt Obligations. Debt obligations are generally valued on the basis of valuations provided by third party pricing services, as derived from such services’ pricing models. Inputs to the models may include, but are not limited to, reported trades, executable bid and ask prices, broker/dealer quotations, prices or yields of securities with similar characteristics, interest rates, anticipated prepayments, benchmark curves or information pertaining to the issuer, as well as industry and economic events. The pricing services may use a matrix approach, which considers information regarding securities with similar characteristics to determine the valuation for a security. Short-term debt obligations purchased with a remaining maturity of sixty days or less for which a valuation from a third party pricing service is not readily available may be valued at amortized cost, which approximates fair value.
Equity Securities. Equity securities listed on a U.S. securities exchange generally are valued at the last sale or closing price on the day of valuation or, if no sales took place on such date, at the mean between the closing bid and ask prices on the exchange where such securities are principally traded. Equity securities listed on the NASDAQ National Market System are valued at the NASDAQ official closing price. Unlisted or listed securities for which closing sales prices or closing quotations are not available are valued at the mean between the latest available bid and ask prices or, in the case of preferred equity securities that are not listed or traded in the over-the-counter market, by a third party pricing service that uses various techniques that consider factors including, but not limited to, prices or yields of securities with similar characteristics, benchmark yields, broker/dealer quotes, quotes of underlying common stock, issuer spreads, as well as industry and economic events.
Senior Floating-Rate Loans. Interests in senior floating-rate loans (Senior Loans) for which reliable market quotations are readily available are valued generally at the average mean of bid and ask quotations obtained from a third party pricing service.
Derivatives. U.S. exchange-traded options are valued at the mean between the bid and ask prices at valuation time as reported by the Options Price Reporting Authority. Futures contracts are valued at the closing settlement price established by the board of trade or exchange on which they are traded. Forward foreign currency exchange contracts are generally valued at the mean of the average bid and average ask prices that are reported by currency dealers to a third party pricing service at the valuation time. Such third party pricing service valuations are supplied for specific settlement periods and the Fund’s forward foreign currency exchange contracts are valued at an interpolated rate between the closest preceding and subsequent settlement period reported by the third party pricing service. Swaps are normally valued using valuations provided by a third party pricing service. Such pricing service valuations are based on the present value of fixed and projected floating rate cash flows over the term of the swap contract, and in the case of credit default swaps, based on credit spread quotations obtained from broker/dealers and expected default recovery rates determined by the pricing service using proprietary models. Future cash flows on swaps are discounted to their present value using swap rates provided by electronic data services or by broker/dealers.
Foreign Securities and Currencies. Foreign securities and currencies are valued in U.S. dollars, based on foreign currency exchange rate quotations supplied by a third party pricing service. The pricing service uses a proprietary model to determine the exchange rate. Inputs to the model include reported trades and implied bid/ask spreads.
Other. Investments in management investment companies (including money market funds) that do not trade on an exchange are valued at the net asset value as of the close of each business day.
Fair Valuation. In connection with Rule 2a-5 of the 1940 Act, the Trustees have designated the Fund’s investment adviser as its valuation designee. Investments for which valuations or market quotations are not readily available or are deemed unreliable are valued by the investment adviser, as valuation designee, at fair value using methods that most fairly reflect the security’s “fair value”, which is the amount that the Fund might reasonably expect to receive for the security upon its current sale in the ordinary course. Each such determination is based on a consideration of relevant factors, which are likely to vary from one pricing context to another. These factors may include, but are not limited to, the type of security, the existence of any contractual
Eaton Vance
Total Return Bond Fund
September 30, 2023
Notes to Financial Statements — continued
restrictions on the security’s disposition, the price and extent of public trading in similar securities of the issuer or of comparable companies or entities, quotations or relevant information obtained from broker/dealers or other market participants, information obtained from the issuer, analysts, and/or the appropriate stock exchange (for exchange-traded securities), an analysis of the company’s or entity’s financial statements, and an evaluation of the forces that influence the issuer and the market(s) in which the security is purchased and sold.
B Investment Transactions—Investment transactions for financial statement purposes are accounted for on a trade date basis. Realized gains and losses on investments sold are determined on the basis of identified cost.
C Income—Interest income is recorded on the basis of interest accrued, adjusted for amortization of premium or accretion of discount. Fees associated with loan amendments are recognized immediately. Dividend income is recorded on the ex-dividend date for dividends received in cash and/or securities. Withholding taxes on foreign interest have been provided for in accordance with the Fund’s understanding of the applicable countries’ tax rules and rates. Inflation adjustments to the principal amount of inflation-adjusted bonds and notes are reflected as interest income. Deflation adjustments to the principal amount of an inflation-adjusted bond or note are reflected as reductions to interest income to the extent of interest income previously recorded on such bond or note.
D Federal and Other Taxes—The Fund’s policy is to comply with the provisions of the Internal Revenue Code applicable to regulated investment companies and to distribute to shareholders each year substantially all of its net investment income, and all or substantially all of its net realized capital gains. Accordingly, no provision for federal income or excise tax is necessary.
In addition to the requirements of the Internal Revenue Code, the Fund may also be subject to local taxes on the recognition of capital gains in certain countries. In determining the daily net asset value, the Fund estimates the accrual for such taxes, if any, based on the unrealized appreciation on certain portfolio securities and the related tax rates. Taxes attributable to unrealized appreciation are included in the change in unrealized appreciation (depreciation) on investments. Capital gains taxes on securities sold are included in net realized gain (loss) on investments.
As of September 30, 2023, the Fund had no uncertain tax positions that would require financial statement recognition, de-recognition, or disclosure. The Fund files a U.S. federal income tax return annually after its fiscal year-end, which is subject to examination by the Internal Revenue Service for a period of three years from the date of filing.
E Expenses—The majority of expenses of the Trust are directly identifiable to an individual fund. Expenses which are not readily identifiable to a specific fund are allocated taking into consideration, among other things, the nature and type of expense and the relative size of the funds.
F Foreign Currency Translation—Investment valuations, other assets, and liabilities initially expressed in foreign currencies are translated each business day into U.S. dollars based upon current exchange rates. Purchases and sales of foreign investment securities and income and expenses denominated in foreign currencies are translated into U.S. dollars based upon currency exchange rates in effect on the respective dates of such transactions. Recognized gains or losses on investment transactions attributable to changes in foreign currency exchange rates are recorded for financial statement purposes as net realized gains and losses on investments. That portion of unrealized gains and losses on investments that results from fluctuations in foreign currency exchange rates is not separately disclosed.
G Use of Estimates—The preparation of the financial statements in conformity with U.S. GAAP requires management to make estimates and assumptions that affect the reported amounts of assets and liabilities at the date of the financial statements and the reported amounts of income and expense during the reporting period. Actual results could differ from those estimates.
H Indemnifications—Under the Trust’s organizational documents, its officers and Trustees may be indemnified against certain liabilities and expenses arising out of the performance of their duties to the Fund. Under Massachusetts law, if certain conditions prevail, shareholders of a Massachusetts business trust (such as the Trust) could be deemed to have personal liability for the obligations of the Trust. However, the Trust’s Declaration of Trust contains an express disclaimer of liability on the part of Fund shareholders and the By-laws provide that the Trust shall assume, upon request by the shareholder, the defense on behalf of any Fund shareholders. Moreover, the By-laws also provide for indemnification out of Fund property of any shareholder held personally liable solely by reason of being or having been a shareholder for all loss or expense arising from such liability. Additionally, in the normal course of business, the Fund enters into agreements with service providers that may contain indemnification clauses. The Fund’s maximum exposure under these arrangements is unknown as this would involve future claims that may be made against the Fund that have not yet occurred.
I Futures Contracts—Upon entering into a futures contract, the Fund is required to deposit with the broker, either in cash or securities, an amount equal to a certain percentage of the contract amount (initial margin). Subsequent payments, known as variation margin, are made or received by the Fund each business day, depending on the daily fluctuations in the value of the underlying security, and are recorded as unrealized gains or losses by the Fund. Gains (losses) are realized upon the expiration or closing of the futures contracts. Should market conditions change unexpectedly, the Fund may not achieve the anticipated benefits of the futures contracts and may realize a loss. Futures contracts have minimal counterparty risk as they are exchange traded and the clearinghouse for the exchange is substituted as the counterparty, guaranteeing counterparty performance.
J Forward Foreign Currency Exchange Contracts—The Fund may enter into forward foreign currency exchange contracts for the purchase or sale of a specific foreign currency at a fixed price on a future date. The forward foreign currency exchange contracts are adjusted by the daily exchange rate of the
Eaton Vance
Total Return Bond Fund
September 30, 2023
Notes to Financial Statements — continued
underlying currency and any gains or losses are recorded as unrealized until such time as the contracts have been closed. Risks may arise upon entering these contracts from the potential inability of counterparties to meet the terms of their contracts and from movements in the value of a foreign currency relative to the U.S. dollar.
K Purchased Options—Upon the purchase of a call or put option, the premium paid by the Fund is included in the Statement of Assets and Liabilities as an investment. The amount of the investment is subsequently marked-to-market to reflect the current market value of the option purchased, in accordance with the Fund’s policies on investment valuations discussed above. Premiums paid for purchasing options that expire are treated as realized losses.
Premiums paid for purchasing options that are exercised or closed are added to the amounts paid or offset against the proceeds on the underlying investment transaction to determine the realized gain or loss. An option on a futures contract gives the holder the right to enter into a specified futures contract. As the purchaser of an index option, the Fund has the right to receive a cash payment equal to any depreciation in the value of the index below the exercise price of the option (in the case of a put) or equal to any appreciation in the value of the index over the exercise price of the option (in the case of a call) as of the valuation date of the option. The risk associated with purchasing options is limited to the premium originally paid. Purchased options traded over-the-counter involve risk that the issuer or counterparty will fail to perform its contractual obligations.
L Credit Default Swaps—When the Fund is the buyer of a credit default swap contract, the Fund is entitled to receive the par (or other agreed-upon) value of a referenced debt obligation (or basket of debt obligations) from the counterparty to the contract if a credit event by a third party, such as a U.S. or foreign corporate issuer or sovereign issuer, on the debt obligation occurs. In return, the Fund pays the counterparty a periodic stream of payments over the term of the contract provided that no credit event has occurred. If no credit event occurs, the Fund would have spent the stream of payments and received no proceeds from the contract. When the Fund is the seller of a credit default swap contract, it receives the stream of payments, but is obligated to pay to the buyer of the protection an amount up to the notional amount of the swap and in certain instances take delivery of securities of the reference entity upon the occurrence of a credit event, as defined under the terms of that particular swap agreement. Credit events are contract specific but may include bankruptcy, failure to pay, restructuring, obligation acceleration and repudiation/moratorium. If the Fund is a seller of protection and a credit event occurs, the maximum potential amount of future payments that the Fund could be required to make would be an amount equal to the notional amount of the agreement. This potential amount would be partially offset by any recovery value of the respective referenced obligation, or net amount received from the settlement of a buy protection credit default swap agreement entered into by the Fund for the same referenced obligation. As the seller, the Fund may create economic leverage to its portfolio because, in addition to its total net assets, the Fund is subject to investment exposure on the notional amount of the swap. The interest fee paid or received on the swap contract, which is based on a specified interest rate on a fixed notional amount, is accrued daily as a component of unrealized appreciation (depreciation) and is recorded as realized gain upon receipt or realized loss upon payment. The Fund also records an increase or decrease to unrealized appreciation (depreciation) in an amount equal to the daily valuation. For centrally cleared swaps, the daily change in valuation is recorded as a receivable or payable for variation margin and settled in cash with the CCP daily. All upfront payments and receipts, if any, are amortized over the life of the swap contract as realized gains or losses. Those upfront payments or receipts for non-centrally cleared swaps are recorded as other assets or other liabilities, respectively, net of amortization. For financial reporting purposes, unamortized upfront payments or receipts, if any, are netted with unrealized appreciation or depreciation on swap contracts to determine the market value of swaps. These transactions involve certain risks, including the risk that the seller may be unable to fulfill the transaction. In the case of centrally cleared swaps, counterparty risk is minimal due to protections provided by the CCP.
M When-Issued Securities and Delayed Delivery Transactions—The Fund may purchase securities on a delayed delivery, when-issued or forward commitment basis, including TBA (To Be Announced) securities. Payment and delivery may take place after the customary settlement period for that security. At the time the transaction is negotiated, the price of the security that will be delivered is fixed. Securities purchased on a delayed delivery, when-issued or forward commitment basis are marked-to-market daily and begin earning interest on settlement date. Such security purchases are subject to the risk that when delivered they will be worth less than the agreed upon payment price. Losses may also arise if the counterparty does not perform under the contract. A forward purchase commitment may also be closed by entering into an offsetting commitment. If an offsetting commitment is entered into, the Fund will realize a gain or loss on investments based on the price established when the Fund entered into the commitment.
2 Distributions to Shareholders and Income Tax Information
The Fund declares dividends daily to shareholders of record at the time of declaration. Distributions are generally paid monthly. Distributions of realized capital gains are made at least annually. Distributions to shareholders are recorded on the ex-dividend date. Distributions are declared separately for each class of shares. Shareholders may reinvest income and capital gain distributions in additional shares of the same class of the Fund at the net asset value as of the ex-dividend date or, at the election of the shareholder, receive distributions in cash. Distributions to shareholders are determined in accordance with income tax regulations, which may differ from U.S. GAAP. As required by U.S. GAAP, only distributions in excess of tax basis earnings and profits are reported in the financial statements as a return of capital. Permanent differences between book and tax accounting relating to distributions are reclassified to paid-in capital. For tax purposes, distributions from short-term capital gains are considered to be from ordinary income.
Eaton Vance
Total Return Bond Fund
September 30, 2023
Notes to Financial Statements — continued
The tax character of distributions declared for the years ended September 30, 2023 and September 30, 2022 was as follows:
| | Year Ended September 30, |
| | 2023 | 2022 |
| Ordinary income | $44,941,880 | $23,585,557 |
| Long-term capital gains | $ — | $ 5,162,683 |
During the year ended September 30, 2023, accumulated loss was decreased by $390,332 and paid-in capital was decreased by $390,332 due to differences between book and tax accounting. These reclassifications had no effect on the net assets or net asset value per share of the Fund.
As of September 30, 2023, the components of distributable earnings (accumulated loss) on a tax basis were as follows:
| Deferred capital losses | $ (80,395,994) |
| Late year ordinary losses | (795,057) |
| Net unrealized depreciation | (93,736,340) |
| Distributions payable | (11,995) |
| Accumulated loss | $(174,939,386) |
At September 30, 2023, the Fund, for federal income tax purposes, had deferred capital losses of $80,395,994 which would reduce the Fund’s taxable income arising from future net realized gains on investment transactions, if any, to the extent permitted by the Internal Revenue Code, and thus would reduce the amount of distributions to shareholders, which would otherwise be necessary to relieve the Fund of any liability for federal income or excise tax. The deferred capital losses are treated as arising on the first day of the Fund’s next taxable year, can be carried forward for an unlimited period, and retain the same short-term or long-term character as when originally deferred. Of the deferred capital losses at September 30, 2023, $55,894,991 are short-term and $24,501,003 are long-term.
Additionally, at September 30, 2023, the Fund had a late year ordinary loss of $795,057 which it has elected to defer to the following taxable year pursuant to income tax regulations. Late year ordinary losses represent certain specified losses realized in that portion of a taxable year after October 31 that are treated as ordinary for tax purposes plus ordinary losses attributable to that portion of a taxable year after December 31.
The cost and unrealized appreciation (depreciation) of investments, including open derivative contracts, of the Fund at September 30, 2023, as determined on a federal income tax basis, were as follows:
| Aggregate cost | $1,285,533,048 |
| Gross unrealized appreciation | $ 3,875,230 |
| Gross unrealized depreciation | (97,603,832) |
| Net unrealized depreciation | $ (93,728,602) |
Eaton Vance
Total Return Bond Fund
September 30, 2023
Notes to Financial Statements — continued
3 Investment Adviser Fee and Other Transactions with Affiliates
The investment adviser fee is earned by Boston Management and Research (BMR), an indirect, wholly-owned subsidiary of Morgan Stanley, as compensation for investment advisory services rendered to the Fund. The fee is computed at an annual rate as a percentage of average daily net assets as follows and is payable monthly:
| Average Daily Net Assets | Annual Fee Rate |
| Up to $1 billion | 0.450% |
| $1 billion but less than $2.5 billion | 0.425% |
| $2.5 billion but less than $5 billion | 0.410% |
| Over $5 billion | 0.400% |
For the year ended September 30, 2023, the investment adviser fee amounted to $3,900,401 or 0.45% of the Fund’s average daily net assets.
The Fund may invest in a money market fund, the Institutional Class of the Morgan Stanley Institutional Liquidity Funds - Government Portfolio (the “Liquidity Fund”), an open-end management investment company managed by Morgan Stanley Investment Management Inc., a wholly-owned subsidiary of Morgan Stanley. The investment adviser fee paid by the Fund is reduced by an amount equal to its pro rata share of the advisory and administration fees paid by the Fund due to its investment in the Liquidity Fund. For the year ended September 30, 2023, the investment adviser fee paid was reduced by $30,495 relating to the Fund’s investment in the Liquidity Fund.
Eaton Vance Management (EVM), an affiliate of BMR and an indirect, wholly-owned subsidiary of Morgan Stanley, has agreed to reimburse the Fund’s expenses to the extent that total annual operating expenses (relating to ordinary operating expenses only and excluding expenses such as brokerage commissions, acquired fund fees and expenses of unaffiliated funds, borrowing costs, taxes or litigation expenses) exceed 0.74%, 1.49%, 0.49% and 0.43% of the Fund’s average daily net assets for Class A, Class C, Class I and Class R6, respectively. This agreement may be changed or terminated after February 1, 2025. Pursuant to this agreement, EVM was allocated $1,024,650 of the Fund’s operating expenses for the year ended September 30, 2023.
EVM serves as the administrator of the Fund, but receives no compensation. EVM provides sub-transfer agency and related services to the Fund pursuant to a Sub-Transfer Agency Support Services Agreement. For the year ended September 30, 2023, EVM earned $12,300 from the Fund pursuant to such agreement, which is included in transfer and dividend disbursing agent fees on the Statement of Operations. The Fund was informed that Eaton Vance Distributors, Inc. (EVD), an affiliate of EVM and the Fund’s principal underwriter, received $8,700 as its portion of the sales charge on sales of Class A shares for the year ended September 30, 2023. EVD also received distribution and service fees from Class A and Class C shares (see Note 4) and contingent deferred sales charges (see Note 5).
Trustees and officers of the Fund who are members of EVM’s or BMR's organizations receive remuneration for their services to the Fund out of the investment adviser fee. Trustees of the Fund who are not affiliated with the investment adviser may elect to defer receipt of all or a percentage of their annual fees in accordance with the terms of the Trustees Deferred Compensation Plan. Certain officers and Trustees of the Fund are officers of the above organizations.
4 Distribution Plans
The Fund has in effect a distribution plan for Class A shares (Class A Plan) pursuant to Rule 12b-1 under the 1940 Act. Pursuant to the Class A Plan, the Fund pays EVD a distribution and service fee of 0.25% per annum of its average daily net assets attributable to Class A shares for distribution services and facilities provided to the Fund by EVD, as well as for personal services and/or the maintenance of shareholder accounts. Distribution and service fees paid or accrued to EVD for the year ended September 30, 2023 amounted to $217,502 for Class A shares.
The Fund also has in effect a distribution plan for Class C shares (Class C Plan) pursuant to Rule 12b-1 under the 1940 Act. Pursuant to the Class C Plan, the Fund pays EVD amounts equal to 0.75% per annum of its average daily net assets attributable to Class C shares for providing ongoing distribution services and facilities to the Fund. For the year ended September 30, 2023, the Fund paid or accrued to EVD $226,075 for Class C shares.
Pursuant to the Class C Plan, the Fund also makes payments of service fees to EVD, financial intermediaries and other persons in amounts equal to 0.25% per annum of its average daily net assets attributable to that class. Service fees paid or accrued are for personal services and/or the maintenance of shareholder accounts. They are separate and distinct from the sales commissions and distribution fees payable to EVD. Service fees paid or accrued for the year ended September 30, 2023 amounted to $75,359 for Class C shares.
Distribution and service fees are subject to the limitations contained in the Financial Industry Regulatory Authority Rule 2341(d).
Eaton Vance
Total Return Bond Fund
September 30, 2023
Notes to Financial Statements — continued
5 Contingent Deferred Sales Charges
A contingent deferred sales charge (CDSC) of 1% generally is imposed on redemptions of Class C shares made within 12 months of purchase. Class A shares may be subject to a 0.75% CDSC if redeemed within 12 months of purchase (depending on the circumstances of purchase). Generally, the CDSC is based upon the lower of the net asset value at date of redemption or date of purchase. No charge is levied on shares acquired by reinvestment of dividends or capital gain distributions. For the year ended September 30, 2023, the Fund was informed that EVD received approximately $6,000 and $2,000 of CDSCs paid by Class A and Class C shareholders, respectively.
6 Purchases and Sales of Investments
Purchases and sales of investments, other than short-term obligations and including maturities, paydowns, TBA transactions, and principal repayments on Senior Loans, for the year ended September 30, 2023 were as follows:
| | Purchases | Sales |
| Investments (non-U.S. Government) | $ 715,428,818 | $ 439,948,764 |
| U.S. Government and Agency Securities | 1,483,790,431 | 1,274,283,899 |
| | $2,199,219,249 | $1,714,232,663 |
7 Shares of Beneficial Interest
The Fund’s Declaration of Trust permits the Trustees to issue an unlimited number of full and fractional shares of beneficial interest (without par value). Such shares may be issued in a number of different series (such as the Fund) and classes. Transactions in Fund shares, including direct exchanges pursuant to share class conversions for all periods presented, were as follows:
| | Year Ended
September 30, 2023 | | Year Ended
September 30, 2022 |
| | Shares | Amount | | Shares | Amount |
| Class A | | | | | |
| Sales | 2,335,544 | $ 23,857,818 | | 2,661,942 | $ 30,817,187 |
| Issued to shareholders electing to receive payments of distributions in Fund shares | 410,809 | 4,199,476 | | 316,396 | 3,618,999 |
| Redemptions | (2,356,311) | (24,107,707) | | (3,227,438) | (36,863,212) |
| Net increase (decrease) | 390,042 | $ 3,949,587 | | (249,100) | $ (2,427,026) |
| Class C | | | | | |
| Sales | 872,744 | $ 8,980,066 | | 366,358 | $ 4,240,415 |
| Issued to shareholders electing to receive payments of distributions in Fund shares | 122,982 | 1,255,899 | | 100,484 | 1,154,212 |
| Redemptions | (995,642) | (10,194,810) | | (1,395,071) | (15,995,299) |
| Net increase (decrease) | 84 | $ 41,155 | | (928,229) | $ (10,600,672) |
| Class I | | | | | |
| Sales | 72,454,658 | $ 742,501,585 | | 33,888,929 | $ 388,383,476 |
| Issued to shareholders electing to receive payments of distributions in Fund shares | 3,859,269 | 39,351,769 | | 2,083,169 | 23,847,285 |
| Redemptions | (29,144,875) | (297,980,416) | | (35,948,251) | (407,442,909) |
| Net increase | 47,169,052 | $ 483,872,938 | | 23,847 | $ 4,787,852 |
Eaton Vance
Total Return Bond Fund
September 30, 2023
Notes to Financial Statements — continued
| | Year Ended
September 30, 2023 | | Year Ended
September 30, 2022 |
| | Shares | Amount | | Shares | Amount |
| Class R6(1) | | | | | |
| Sales | 4,907 | $ 50,000 | | — | $ — |
| Issued to shareholders electing to receive payments of distributions in Fund shares | 71 | 713 | | — | — |
| Net increase | 4,978 | $ 50,713 | | — | $ — |
| (1) | For the period from the commencement of operations, June 30, 2023, to September 30, 2023. |
8 Financial Instruments
The Fund may trade in financial instruments with off-balance sheet risk in the normal course of its investing activities. These financial instruments may include forward foreign currency exchange contracts, futures contracts and swap contracts and may involve, to a varying degree, elements of risk in excess of the amounts recognized for financial statement purposes. The notional or contractual amounts of these instruments represent the investment the Fund has in particular classes of financial instruments and do not necessarily represent the amounts potentially subject to risk. The measurement of the risks associated with these instruments is meaningful only when all related and offsetting transactions are considered. A summary of obligations under these financial instruments at September 30, 2023 is included in the Portfolio of Investments. At September 30, 2023, the Fund had sufficient cash and/or securities to cover commitments under these contracts.
In the normal course of pursuing its investment objective, the Fund is subject to the following risks:
Credit Risk: The Fund enters into credit default swap contracts to manage certain investment risks and/or to enhance total return or as a substitute for the purchase or sale of securities.
Interest Rate Risk: The Fund enters into interest rate futures contracts and options on futures contracts to seek to hedge against fluctuations in interest rates and/or to change the effective duration of its portfolio.
Foreign Exchange Risk: The Fund engages in forward foreign currency exchange contracts to enhance total return, to seek to hedge against fluctuations in currency exchange rates and/or as a substitute for the purchase or sale of securities or currencies.
The Fund enters into over-the-counter (OTC) derivatives that may contain provisions whereby the counterparty may terminate the contract under certain conditions, including but not limited to a decline in the Fund’s net assets below a certain level over a certain period of time, which would trigger a payment by the Fund for those derivatives in a liability position. At September 30, 2023, the fair value of derivatives with credit-related contingent features in a net liability position was $403,090. At September 30, 2023, there were no assets pledged by the Fund for such liability.
The OTC derivatives in which the Fund invests are subject to the risk that the counterparty to the contract fails to perform its obligations under the contract. To mitigate this risk, the Fund has entered into an International Swaps and Derivatives Association, Inc. Master Agreement (“ISDA Master Agreement”) or similar agreement with its derivative counterparties. An ISDA Master Agreement is a bilateral agreement between the Fund and a counterparty that governs certain OTC derivatives and typically contains, among other things, set-off provisions in the event of a default and/or termination event as defined under the relevant ISDA Master Agreement. Under an ISDA Master Agreement, the Fund may, under certain circumstances, offset with the counterparty certain derivative financial instruments’ payables and/or receivables with collateral held and/or posted and create one single net payment. The provisions of the ISDA Master Agreement typically permit a single net payment in the event of default including the bankruptcy or insolvency of the counterparty. However, bankruptcy or insolvency laws of a particular jurisdiction may impose restrictions on or prohibitions against the right of offset in bankruptcy or insolvency. Certain ISDA Master Agreements allow counterparties to OTC derivatives to terminate derivative contracts prior to maturity in the event the Fund’s net assets decline by a stated percentage or the Fund fails to meet the terms of its ISDA Master Agreements, which would cause the counterparty to accelerate payment by the Fund of any net liability owed to it.
The collateral requirements for derivatives traded under an ISDA Master Agreement are governed by a Credit Support Annex to the ISDA Master Agreement. Collateral requirements are determined at the close of business each day and are typically based on changes in market values for each transaction under an ISDA Master Agreement and netted into one amount for such agreement. Generally, the amount of collateral due from or to a counterparty is subject to a minimum transfer threshold amount before a transfer is required, which may vary by counterparty. Collateral pledged for the benefit of the Fund and/or counterparty is held in segregated accounts by the Fund’s custodian and cannot be sold, re-pledged, assigned or otherwise used while pledged. The portion of such collateral representing cash, if any, is reflected as deposits for derivatives collateral and, in the case of cash pledged by a counterparty for the benefit of the Fund, a corresponding liability on the Statement of Assets and Liabilities. Securities pledged by the Fund as collateral, if any, are identified as such in the Portfolio of Investments.
Eaton Vance
Total Return Bond Fund
September 30, 2023
Notes to Financial Statements — continued
The fair value of open derivative instruments (not considered to be hedging instruments for accounting disclosure purposes) by risk exposure at September 30, 2023 was as follows:
| | | Fair Value |
| Risk | Derivative | Asset Derivative | Liability Derivative |
| Foreign Exchange | Forward foreign currency
exchange contracts | $ 198,849(1) | $ (403,090)(2) |
| Interest Rate | Purchased options | 118,594 (3) | — |
| Interest Rate | Futures contracts | 134,854 (4) | (1,955,570) (4) |
| Total | $452,297 | $(2,358,660) |
| Derivatives not subject to master netting or similar agreements | $253,448 | $(1,955,570) |
| Total Derivatives subject to master netting or similar agreements | $198,849 | $ (403,090) |
| (1) | Statement of Assets and Liabilities location: Receivable for open forward foreign currency exchange contracts. |
| (2) | Statement of Assets and Liabilities location: Payable for open forward foreign currency exchange contracts. |
| (3) | Statement of Assets and Liabilities location: Unaffiliated investments, at value. |
| (4) | Only the current day’s variation margin on open futures contracts is reported within the Statement of Assets and Liabilities as Receivable or Payable for variation margin on open futures contracts, as applicable. |
The Fund's derivative assets and liabilities at fair value by risk, which are reported gross in the Statement of Assets and Liabilities, are presented in the table above. The following tables present the Fund's derivative assets and liabilities by counterparty, net of amounts available for offset under a master netting agreement and net of the related collateral received by the Fund for such assets and pledged by the Fund for such liabilities as of September 30, 2023.
| Counterparty | Derivative
Assets Subject to
Master Netting
Agreement | Derivatives
Available
for Offset | Non-cash
Collateral
Received(a) | Cash
Collateral
Received(a) | Net Amount
of Derivative
Assets(b) |
| Citibank, N.A. | $ 40,554 | $ — | $ — | $ — | $ 40,554 |
| JPMorgan Chase Bank, N.A. | 143,705 | (143,705) | — | — | — |
| State Street Bank and Trust Company | 14,590 | (14,590) | — | — | — |
| | $198,849 | $(158,295) | $ — | $ — | $40,554 |
| Counterparty | Derivative
Liabilities Subject to
Master Netting
Agreement | Derivatives
Available
for Offset | Non-cash
Collateral
Pledged(a) | Cash
Collateral
Pledged(a) | Net Amount
of Derivative
Liabilities(c) |
| JPMorgan Chase Bank, N.A. | $ (303,458) | $ 143,705 | $ — | $ — | $ (159,753) |
| State Street Bank and Trust Company | (99,632) | 14,590 | — | — | (85,042) |
| | $(403,090) | $158,295 | $ — | $ — | $(244,795) |
| (a) | In some instances, the total collateral received and/or pledged may be more than the amount shown due to overcollateralization. |
| (b) | Net amount represents the net amount due from the counterparty in the event of default. |
| (c) | Net amount represents the net amount payable to the counterparty in the event of default. |
Eaton Vance
Total Return Bond Fund
September 30, 2023
Notes to Financial Statements — continued
The effect of derivative instruments (not considered to be hedging instruments for accounting disclosure purposes) on the Statement of Operations by risk exposure for the year ended September 30, 2023 was as follows:
| Statement of Operations Caption | Credit | Foreign
Exchange | Interest
Rate | Total |
| Net realized gain (loss): | | | | |
| Futures contracts | $ — | $ — | $ (1,324,951) | $ (1,324,951) |
| Swap contracts | (34,725) | — | — | (34,725) |
| Forward foreign currency exchange contracts | — | (443,672) | — | (443,672) |
| Total | $(34,725) | $(443,672) | $(1,324,951) | $(1,803,348) |
| Change in unrealized appreciation (depreciation): | | | | |
| Investments | $ — | $ — | $ 3,069 | $ 3,069 |
| Futures contracts | — | — | (2,210,407) | (2,210,407) |
| Forward foreign currency exchange contracts | — | (335,793) | — | (335,793) |
| Total | $ — | $(335,793) | $(2,207,338) | $(2,543,131) |
The average notional cost of futures contracts and average notional amounts of other derivative contracts outstanding during the year ended September 30, 2023, which are indicative of the volume of these derivative types, were approximately as follows:
Futures
Contracts — Long | Futures
Contracts — Short | Forward
Foreign Currency
Exchange Contracts* | Swap
Contracts |
| $101,845,000 | $23,170,000 | $6,604,000 | $492,000 |
| * | The average notional amount for forward foreign currency exchange contracts is based on the absolute value of notional amounts of currency purchased and currency sold. |
The average number of purchased options contracts outstanding during the year ended September 30, 2023, which is indicative of the volume of this derivative type, was 18 contracts.
9 Line of Credit
The Fund participates with other portfolios and funds managed by EVM and its affiliates in a $725 million unsecured revolving line of credit agreement with a group of banks, which is in effect through October 24, 2023. Borrowings are made by the Fund solely for temporary purposes related to redemptions and other short-term cash needs. Interest is charged to the Fund based on its borrowings at an amount above either the Secured Overnight Financing Rate (SOFR) or Federal Funds rate. In addition, a fee computed at an annual rate of 0.15% on the daily unused portion of the line of credit is allocated among the participating portfolios and funds at the end of each quarter. In connection with the renewal of the agreement in October 2022, an arrangement fee totaling $150,000 was incurred that was allocated to the participating portfolios and funds. Because the line of credit is not available exclusively to the Fund, it may be unable to borrow some or all of its requested amounts at any particular time. The Fund did not have any significant borrowings or allocated fees during the year ended September 30, 2023. Effective October 24, 2023, the Fund renewed its line of credit agreement, which expires October 22, 2024. In connection with the renewal, the borrowing limit was decreased to $650 million.
Eaton Vance
Total Return Bond Fund
September 30, 2023
Notes to Financial Statements — continued
10 Affiliated Investments
At September 30, 2023, the value of the Fund's investment in issuers and funds that may be deemed to be affiliated was $22,256,302, which represents 2.1% of the Fund's net assets. Transactions in such investments by the Fund for the year ended September 30, 2023 were as follows:
| Name | Value,
beginning
of period | Purchases | Sales
proceeds | Net
realized
gain (loss) | Change in
unrealized
appreciation
(depreciation) | Value, end
of period | Interest/
Dividend
income | Principal
amount/
Shares, end
of period |
| Commercial Mortgage-Backed Securities | | | | | | | | |
| Morgan Stanley Bank of America Merrill Lynch Trust: | | | | | | | | |
| Series 2016-C29, Class C, 4.878%, 5/15/49 | $3,768,534 | $ — | $ — | $ — | $ (135,115) | $ 3,633,419 | $ 200,998 | $4,198,800 |
| Series 2016-C29, Class D, 3.00%, 5/15/49 | 2,346,956 | — | — | — | (174,071) | 2,189,292 | 107,836 | 3,047,635 |
| Series 2016-C32, Class D, 3.396%, 12/15/49 | 3,705,129 | — | — | — | (433,681) | 3,303,944 | 202,296 | 5,000,000 |
| Morgan Stanley Capital I Trust: | | | | | | | | |
| Series 2016-UBS12, Class D, 3.312%, 12/15/49 | 3,862,789 | — | (3,467,750) | (2,187,060) | 1,759,427 | — | 170,732 | — |
| Series 2019-BPR, Class B, 8.022%, (1 mo. SOFR+2.69%), 5/15/36 | 3,819,553 | — | — | — | (43,898) | 3,787,158 | 291,167 | 3,960,000 |
| Series 2019-BPR, Class C, 8.972%, (1 mo. SOFR+3.642%), 5/15/36 | 1,463,766 | 633,168 | — | — | 2,787 | 2,100,512 | 137,931 | 2,219,000 |
| Short-Term Investments |
| Liquidity Fund | 4,082,231 | 537,775,626 | (534,615,880) | — | — | 7,241,977 | 899,994 | 7,241,977 |
| Total | | | | $(2,187,060) | $ 975,449 | $22,256,302 | $2,010,954 | |
11 Fair Value Measurements
Under generally accepted accounting principles for fair value measurements, a three-tier hierarchy to prioritize the assumptions, referred to as inputs, is used in valuation techniques to measure fair value. The three-tier hierarchy of inputs is summarized in the three broad levels listed below.
| • | Level 1 – quoted prices in active markets for identical investments |
| • | Level 2 – other significant observable inputs (including quoted prices for similar investments, interest rates, prepayment speeds, credit risk, etc.) |
| • | Level 3 – significant unobservable inputs (including a fund's own assumptions in determining the fair value of investments) |
In cases where the inputs used to measure fair value fall in different levels of the fair value hierarchy, the level disclosed is determined based on the lowest level input that is significant to the fair value measurement in its entirety. The inputs or methodology used for valuing securities are not necessarily an indication of the risk associated with investing in those securities.
At September 30, 2023, the hierarchy of inputs used in valuing the Fund's investments and open derivative instruments, which are carried at value, were as follows:
| Asset Description | Level 1 | Level 2 | Level 3* | Total |
| Asset-Backed Securities | $ — | $ 153,585,800 | $ — | $ 153,585,800 |
| Collateralized Mortgage Obligations | — | 56,346,793 | — | 56,346,793 |
| Commercial Mortgage-Backed Securities | — | 109,514,767 | — | 109,514,767 |
| Convertible Bonds | — | 2,567,819 | — | 2,567,819 |
| Corporate Bonds | — | 412,078,728 | — | 412,078,728 |
Eaton Vance
Total Return Bond Fund
September 30, 2023
Notes to Financial Statements — continued
| Asset Description (continued) | Level 1 | Level 2 | Level 3* | Total |
| Preferred Stocks | $ 5,155,101 | $ — | $ — | $ 5,155,101 |
| Sovereign Government Bonds | — | 15,755,673 | — | 15,755,673 |
| U.S. Government Agency Mortgage-Backed Securities | — | 129,129,527 | — | 129,129,527 |
| U.S. Treasury Obligations | — | 290,046,183 | — | 290,046,183 |
| Miscellaneous | — | — | 0 | 0 |
| Short-Term Investments: | | | | |
| Affiliated Fund | 7,241,977 | — | — | 7,241,977 |
| Commercial Paper | — | 10,382,078 | — | 10,382,078 |
| Purchased Call Options | 118,594 | — | — | 118,594 |
| Total Investments | $ 12,515,672 | $ 1,179,407,368 | $ 0 | $ 1,191,923,040 |
| Forward Foreign Currency Exchange Contracts | $ — | $ 198,849 | $ — | $ 198,849 |
| Futures Contracts | 134,854 | — | — | 134,854 |
| Total | $ 12,650,526 | $ 1,179,606,217 | $ 0 | $ 1,192,256,743 |
| Liability Description | | | | |
| Forward Foreign Currency Exchange Contracts | $ — | $ (403,090) | $ — | $ (403,090) |
| Futures Contracts | (1,955,570) | — | — | (1,955,570) |
| Total | $ (1,955,570) | $ (403,090) | $ — | $ (2,358,660) |
| * | None of the unobservable inputs for Level 3 assets, individually or collectively, had a material impact on the Fund. |
Level 3 investments at the beginning and/or end of the period in relation to net assets were not significant and accordingly, a reconciliation of Level 3 assets for the year ended September 30, 2023 is not presented.
12 Risks and Uncertainties
Risks Associated with Foreign Investments
Foreign investments can be adversely affected by political, economic and market developments abroad, including the imposition of economic and other sanctions by the United States or another country. There may be less publicly available information about foreign issuers because they may not be subject to reporting practices, requirements or regulations comparable to those to which United States companies are subject. Foreign markets may be smaller, less liquid and more volatile than the major markets in the United States. Trading in foreign markets typically involves higher expense than trading in the United States. The Fund may have difficulties enforcing its legal or contractual rights in a foreign country. Securities that trade or are denominated in currencies other than the U.S. dollar may be adversely affected by fluctuations in currency exchange rates.
Economic data as reported by sovereign entities may be delayed, inaccurate or fraudulent. In the event of a default by a sovereign entity, there are typically no assets to be seized or cash flows to be attached. Furthermore, the willingness or ability of a sovereign entity to restructure defaulted debt may be limited. Therefore, losses on sovereign defaults may far exceed the losses from the default of a similarly rated U.S. debt issuer.
Eaton Vance
Total Return Bond Fund
September 30, 2023
Report of Independent Registered Public Accounting Firm
To the Trustees of Eaton Vance Mutual Funds Trust and Shareholders of Eaton Vance Total Return Bond Fund:
Opinion on the Financial Statements and Financial Highlights
We have audited the accompanying statement of assets and liabilities of Eaton Vance Total Return Bond Fund (the "Fund") (one of the funds constituting Eaton Vance Mutual Funds Trust), including the portfolio of investments, as of September 30, 2023, the related statement of operations for the year then ended, the statements of changes in net assets for each of the two years in the period then ended, the financial highlights for each of the five years in the period then ended, and the related notes. In our opinion, the financial statements and financial highlights present fairly, in all material respects, the financial position of the Fund as of September 30, 2023, and the results of its operations for the year then ended, the changes in its net assets for each of the two years in the period then ended, and the financial highlights for each of the five years in the period then ended, in conformity with accounting principles generally accepted in the United States of America.
Basis for Opinion
These financial statements and financial highlights are the responsibility of the Fund's management. Our responsibility is to express an opinion on the Fund's financial statements and financial highlights based on our audits. We are a public accounting firm registered with the Public Company Accounting Oversight Board (United States) (PCAOB) and are required to be independent with respect to the Fund in accordance with the U.S. federal securities laws and the applicable rules and regulations of the Securities and Exchange Commission and the PCAOB.
We conducted our audits in accordance with the standards of the PCAOB. Those standards require that we plan and perform the audit to obtain reasonable assurance about whether the financial statements and financial highlights are free of material misstatement, whether due to error or fraud. The Fund is not required to have, nor were we engaged to perform, an audit of its internal control over financial reporting. As part of our audits, we are required to obtain an understanding of internal control over financial reporting but not for the purpose of expressing an opinion on the effectiveness of the Fund’s internal control over financial reporting. Accordingly, we express no such opinion.
Our audits included performing procedures to assess the risks of material misstatement of the financial statements and financial highlights, whether due to error or fraud, and performing procedures that respond to those risks. Such procedures included examining, on a test basis, evidence regarding the amounts and disclosures in the financial statements and financial highlights. Our audits also included evaluating the accounting principles used and significant estimates made by management, as well as evaluating the overall presentation of the financial statements and financial highlights. Our procedures included confirmation of securities and senior loans owned as of September 30, 2023, by correspondence with the custodian, brokers and agent banks; when replies were not received from brokers and agent banks, we performed other auditing procedures. We believe that our audits provide a reasonable basis for our opinion.
/s/ Deloitte & Touche LLP
Boston, Massachusetts
November 20, 2023
We have served as the auditor of one or more Eaton Vance investment companies since 1959.
Eaton Vance
Total Return Bond Fund
September 30, 2023
Federal Tax Information (Unaudited)
The Form 1099-DIV you receive in February 2024 will show the tax status of all distributions paid to your account in calendar year 2023. Shareholders are advised to consult their own tax adviser with respect to the tax consequences of their investment in the Fund. As required by the Internal Revenue Code and/or regulations, shareholders must be notified regarding the status of qualified dividend income for individuals and 163(j) interest dividends.
Qualified Dividend Income. For the fiscal year ended September 30, 2023, the Fund designates approximately $151,613, or up to the maximum amount of such dividends allowable pursuant to the Internal Revenue Code, as qualified dividend income eligible for the reduced tax rate of 15%.
163(j) Interest Dividends. For the fiscal year ended September 30, 2023, the Fund designates 96.46% of distributions from net investment income as a 163(j) interest dividend.
Eaton Vance
Total Return Bond Fund
September 30, 2023
Board of Trustees’ Contract Approval
Overview of the Contract Review Process
The Investment Company Act of 1940, as amended (the “1940 Act”), provides, in substance, that the investment advisory agreement between a fund and its investment adviser will continue in effect from year-to-year only if its continuation is approved on an annual basis by a vote of the fund’s board of trustees, including a majority of the trustees who are not “interested persons” of the fund (“independent trustees”), cast in person at a meeting called for the purpose of considering such approval.
At a meeting held on June 8, 2023, the Boards of Trustees/Directors (collectively, the “Board”) that oversee the registered investment companies advised by Eaton Vance Management or its affiliate, Boston Management and Research (the “Eaton Vance Funds”), including a majority of the independent trustees (the “Independent Trustees”), voted to approve the continuation of existing investment advisory agreements and sub-advisory agreements1 for each of the Eaton Vance Funds for an additional one-year period. The Board relied upon the affirmative recommendation of its Contract Review Committee, which is a committee exclusively comprised of Independent Trustees. Prior to making its recommendation, the Contract Review Committee reviewed information furnished by the adviser and sub-adviser to each of the Eaton Vance Funds (including information specifically requested by the Board) for a series of formal meetings held between April and June 2023, as well as certain additional information provided in response to specific requests from the Independent Trustees as members of the Contract Review Committee. Members of the Contract Review Committee also considered information received at prior meetings of the Board and its committees, to the extent such information was relevant to the Contract Review Committee’s annual evaluation of the investment advisory agreements and sub-advisory agreements.
In connection with its evaluation of the investment advisory agreements and sub-advisory agreements, the Board considered various information relating to the Eaton Vance Funds. This included information applicable to all or groups of Eaton Vance Funds, which is referenced immediately below, and information applicable to the particular Eaton Vance Fund covered by this report (each “Eaton Vance Fund” is referred to below as a “fund”). (For funds that invest through one or more underlying portfolios, references to “each fund” in this section may include information that was considered at the portfolio-level.)
Information about Fees, Performance and Expenses
• A report from an independent data provider comparing advisory and other fees paid by each fund to such fees paid by comparable funds, as identified by the independent data provider (“comparable funds”);
• A report from an independent data provider comparing each fund’s total expense ratio (and its components) to those of comparable funds;
• A report from an independent data provider comparing the investment performance of each fund (including, as relevant, total return data, income data, Sharpe ratios and information ratios) to the investment performance of comparable funds and, as applicable, benchmark indices, over various time periods;
• In certain instances, data regarding investment performance relative to customized groups of peer funds and blended indices identified by the adviser in consultation with the Portfolio Management Committee of the Board (a committee exclusively comprised of Independent Trustees);
• Comparative information concerning the fees charged and services provided by the adviser and sub-adviser to each fund in managing other accounts (which may include other mutual funds, collective investment funds and institutional accounts) using investment strategies and techniques similar to those used in managing such fund(s), if any;
• Profitability analyses with respect to the adviser and sub-adviser to each of the funds;
Information about Portfolio Management and Trading
• Descriptions of the investment management services provided to each fund, as well as each of the funds’ investment strategies and policies;
• The procedures and processes used to determine the value of fund assets, including, when necessary, the determination of “fair value” and actions taken to monitor and test the effectiveness of such procedures and processes;
• Information about the policies and practices of each fund’s adviser and sub-adviser with respect to trading, including their processes for seeking best execution of portfolio transactions;
• Information about the allocation of brokerage transactions and the benefits, if any, received by the adviser and sub-adviser to each fund as a result of brokerage allocation, including, as applicable, information concerning the acquisition of research through client commission arrangements and policies with respect to “soft dollars”;
• Data relating to the portfolio turnover rate of each fund and related information regarding active management in the context of particular strategies;
Information about each Adviser and Sub-adviser
• Reports detailing the financial results and condition of the adviser and sub-adviser to each fund;
• Information regarding the individual investment professionals whose responsibilities include portfolio management and investment research for the funds, and, for portfolio managers and certain other investment professionals, information relating to their responsibilities with respect to managing other mutual funds and investment accounts, as applicable;
1 Not all Eaton Vance Funds have entered into a sub-advisory agreement with a sub-adviser. Accordingly, references to “sub-adviser” or “sub-advisory agreement” in this “Overview” section may not be applicable to the particular Eaton Vance Fund covered by this report.
Eaton Vance
Total Return Bond Fund
September 30, 2023
Board of Trustees’ Contract Approval — continued
• Information regarding the adviser’s and its parent company’s (Morgan Stanley’s) efforts to retain and attract talented investment professionals, including in the context of a competitive marketplace for talent, as well as the ongoing unique environment presented by hybrid, remote and other alternative work arrangements;
• Information regarding the adviser’s compensation methodology for its investment professionals and the incentives and accountability it creates, along with investment professionals’ investments in the fund(s) they manage;
• The Code of Ethics of the adviser and its affiliates and the sub-adviser of each fund, together with information relating to compliance with, and the administration of, such codes;
• Policies and procedures relating to proxy voting, including regular reporting with respect to fund proxy voting activities;
• Information regarding the handling of corporate actions and class actions, as well as information regarding litigation and other regulatory matters;
• Information concerning the resources devoted to compliance efforts undertaken by the adviser and its affiliates and the sub-adviser of each fund, if any, including descriptions of their various compliance programs and their record of compliance;
• Information concerning the business continuity and disaster recovery plans of the adviser and its affiliates and the sub-adviser of each fund, if any;
• A description of Eaton Vance Management’s and Boston Management and Research’s oversight of sub-advisers, including with respect to regulatory and compliance issues, investment management and other matters;
Other Relevant Information
• Information regarding ongoing initiatives to further integrate and harmonize, where applicable, the investment management and other departments of the adviser and its affiliates with the overall investment management infrastructure of Morgan Stanley, in light of Morgan Stanley’s acquisition of Eaton Vance Corp. on March 1, 2021;
• Information concerning the nature, cost and character of the administrative and other non-investment advisory services provided by Eaton Vance Management and its affiliates;
• Information concerning oversight of the relationship with the custodian, subcustodians, fund accountants, and other third-party service providers by the adviser and/or administrator to each of the funds;
• Information concerning efforts to implement policies and procedures with respect to various recently adopted regulations applicable to the funds, including Rule 12d1-4 (the Fund-of-Funds Rule), Rule 18f-4 (the Derivatives Rule) and Rule 2a-5 (the Fair Valuation Rule);
• For an Eaton Vance Fund structured as an exchange-listed closed-end fund, information concerning the benefits of the closed-end fund structure, as well as, where relevant, the closed-end fund’s market prices (including as compared to the closed-end fund’s net asset value (NAV)), trading volume data, continued use of auction preferred shares (where applicable), distribution rates and other relevant matters;
• The risks which the adviser and/or its affiliates incur in connection with the management and operation of the funds, including, among others, litigation, regulatory, entrepreneurial, and other business risks (and the associated costs of such risks); and
• The terms of each investment advisory agreement and sub-advisory agreement.
During the various meetings of the Board and its committees over the course of the year leading up to the June 8, 2023 meeting, the Board received information from portfolio managers and other investment professionals of the advisers and sub-advisers of the funds regarding investment and performance matters, and considered various investment and trading strategies used in pursuing the funds’ investment objectives. The Board also received information regarding risk management techniques employed in connection with the management of the funds. The Board and its committees evaluated issues pertaining to industry and regulatory developments, compliance procedures, fund governance and other issues with respect to the funds, and received and participated in reports and presentations provided by Eaton Vance Management, Boston Management and Research and fund sub-advisers, with respect to such matters. In addition to the formal meetings of the Board and its committees, the Independent Trustees held regular teleconferences to discuss, among other topics, matters relating to the continuation of investment advisory agreements and sub-advisory agreements.
The Contract Review Committee was advised throughout the contract review process by Goodwin Procter LLP, independent legal counsel for the Independent Trustees. The members of the Contract Review Committee, with the advice of such counsel, exercised their own business judgment in determining the material factors to be considered in evaluating each investment advisory agreement and sub-advisory agreement and the weight to be given to each such factor. The conclusions reached with respect to each investment advisory agreement and sub-advisory agreement were based on a comprehensive evaluation of all the information provided and not any single factor. Moreover, each member of the Contract Review Committee may have placed varying emphasis on particular factors in reaching conclusions with respect to each investment advisory agreement and sub-advisory agreement. In evaluating each investment advisory agreement and sub-advisory agreement, including the fee structures and other terms contained in such agreements, the members of the Contract Review Committee were also informed by multiple years of analysis and discussion with the adviser and sub-adviser to each of the Eaton Vance Funds.
Results of the Contract Review Process
Based on its consideration of the foregoing, and such other information it deemed relevant, including the factors and conclusions described below, the Contract Review Committee concluded that the continuation of the investment advisory agreement between Eaton Vane Total Return Bond Fund (the “Fund”) and Boston Management and Research (the “Adviser”), including its fee structure, is in the interests of shareholders and, therefore, recommended to the Board approval of the agreement. Based on the recommendation of the Contract Review Committee, the Board, including a majority of the Independent Trustees, voted to approve continuation of the investment advisory agreement for the Fund.
Eaton Vance
Total Return Bond Fund
September 30, 2023
Board of Trustees’ Contract Approval — continued
Nature, Extent and Quality of Services
In considering whether to approve the investment advisory agreement for the Fund, the Board evaluated the nature, extent and quality of services provided to the Fund by the Adviser.
The Board considered the Adviser’s management capabilities and investment processes in light of the types of investments held by the Fund, including the education, experience and number of investment professionals and other personnel who provide portfolio management, investment research, and similar services to the Fund, including recent changes to such personnel. The Board considered, where relevant, the abilities and experience of the Adviser’s investment professionals in analyzing factors such as credit risk and special considerations relevant to investing in income securities. The Board considered the Adviser’s in-house research capabilities. The Board also took into account the resources dedicated to portfolio management and other services, the compensation methods of the Adviser and other factors, including the reputation and resources of the Adviser to recruit and retain highly qualified research, advisory and supervisory investment professionals. In addition, the Board considered the time and attention devoted to the Eaton Vance Funds, including the Fund, by senior management, as well as the infrastructure, operational capabilities and support staff in place to assist in the portfolio management and operations of the Fund, including the provision of administrative services. The Board also considered the business-related and other risks to which the Adviser or its affiliates may be subject in managing the Fund.
The Board considered the compliance programs of the Adviser and relevant affiliates thereof. The Board considered compliance and reporting matters regarding, among other things, personal trading by investment professionals, disclosure of portfolio holdings, late trading, frequent trading, portfolio valuation, business continuity and the allocation of investment opportunities. The Board also considered the responses of the Adviser and its affiliates to requests in recent years from regulatory authorities, such as the Securities and Exchange Commission and the Financial Industry Regulatory Authority.
The Board considered other administrative services provided or overseen by Eaton Vance Management and its affiliates, including transfer agency and accounting services. The Board evaluated the benefits to shareholders of investing in a fund that is a part of a large fund complex offering exposure to a variety of asset classes and investment disciplines, as well as the ability, in many cases, to exchange an investment among different funds without incurring additional sales charges.
After consideration of the foregoing factors, among others, the Board concluded that the nature, extent and quality of services provided by the Adviser, taken as a whole, are appropriate and consistent with the terms of the investment advisory agreement.
Fund Performance
The Board compared the Fund’s investment performance to that of comparable funds identified by an independent data provider (the peer group), as well as an appropriate benchmark index and a customized peer group of similarly managed funds. The Board’s review included comparative performance data with respect to the Fund for the one-, three-, five and ten-year periods ended December 31, 2022. In this regard, the Board noted that the performance of the Fund was higher than the median performance of the Fund’s peer group and consistent with the median performance of the Fund’s custom peer group for the three-year period. The Board also noted that the performance of the Fund was higher than its benchmark index for the three-year period. The Board concluded that the performance of the Fund was satisfactory.
Management Fees and Expenses
The Board considered contractual fee rates payable by the Fund for advisory and administrative services (referred to collectively as “management fees”). As part of its review, the Board considered the Fund’s management fees and total expense ratio for the one-year period ended December 31, 2022, as compared to those of comparable funds, before and after giving effect to any undertaking to waive fees or reimburse expenses. The Board also considered factors that had an impact on the Fund’s total expense ratio relative to comparable funds.
After considering the foregoing information, and in light of the nature, extent and quality of the services provided by the Adviser, the Board concluded that the management fees charged for advisory and related services are reasonable.
Profitability and “Fall-Out” Benefits
The Board considered the level of profits realized by the Adviser and relevant affiliates thereof in providing investment advisory and administrative services to the Fund and to all Eaton Vance Funds as a group. The Board considered the level of profits realized without regard to marketing support or other payments by the Adviser and its affiliates to third parties in respect of distribution or other services.
The Board concluded that, in light of the foregoing factors and the nature, extent and quality of the services rendered, the profits realized by the Adviser and its affiliates are deemed not to be excessive.
The Board also considered direct or indirect fall-out benefits received by the Adviser and its affiliates in connection with their respective relationships with the Fund, including the benefits of research services that may be available to the Adviser as a result of securities transactions effected for the Fund and other investment advisory clients.
Eaton Vance
Total Return Bond Fund
September 30, 2023
Board of Trustees’ Contract Approval — continued
Economies of Scale
In reviewing management fees and profitability, the Board also considered the extent to which the Adviser and its affiliates, on the one hand, and the Fund, on the other hand, can expect to realize benefits from economies of scale as the assets of the Fund increase. The Board acknowledged the difficulty in accurately measuring the benefits resulting from economies of scale, if any, with respect to the management of any specific fund or group of funds. The Board reviewed data summarizing the increases and decreases in the assets of the Fund and of all Eaton Vance Funds as a group over various time periods, and evaluated the extent to which the total expense ratio of the Fund and the profitability of the Adviser and its affiliates may have been affected by such increases or decreases. Based upon the foregoing, the Board concluded that the Fund currently shares in the benefits from economies of scale, if any, when they are realized by the Adviser. The Board also concluded that the structure of the advisory fee, which includes breakpoints at several asset levels, will allow the Fund to continue to benefit from any economies of scale in the future.
Eaton Vance
Total Return Bond Fund
September 30, 2023
Liquidity Risk Management Program
The Fund has implemented a written liquidity risk management program (Program) and related procedures to manage its liquidity in accordance with Rule 22e-4 under the Investment Company Act of 1940, as amended (Liquidity Rule). The Liquidity Rule defines “liquidity risk” as the risk that a fund could not meet requests to redeem shares issued by the fund without significant dilution of the remaining investors’ interests in the fund. The Fund’s Board of Trustees/Directors has designated the investment adviser to serve as the administrator of the Program and the related procedures. The administrator has established a Liquidity Risk Management Oversight Committee (Committee) to perform the functions necessary to administer the Program. As part of the Program, the administrator is responsible for identifying illiquid investments and categorizing the relative liquidity of the Fund’s investments in accordance with the Liquidity Rule. Under the Program, the administrator assesses, manages, and periodically reviews the Fund’s liquidity risk, and is responsible for making certain reports to the Fund’s Board of Trustees/Directors and the Securities and Exchange Commission (SEC) regarding the liquidity of the Fund’s investments, and to notify the Board of Trustees/Directors and the SEC of certain liquidity events specified in the Liquidity Rule. The liquidity of the Fund’s portfolio investments is determined based on a number of factors including, but not limited to, relevant market, trading and investment-specific considerations under the Program.
At a meeting of the Fund’s Board of Trustees/Directors on June 7, 2023, the Committee provided a written report to the Fund’s Board of Trustees/
Directors pertaining to the operation, adequacy, and effectiveness of implementation of the Program, as well as the operation of the highly liquid investment minimum (if applicable) for the period January 1, 2022 through December 31, 2022 (Review Period). The Program operated effectively during the Review Period, supporting the administrator’s ability to assess, manage and monitor Fund liquidity risk, including during periods of market volatility and net redemptions. During the Review Period, the Fund met redemption requests on a timely basis.
There can be no assurance that the Program will achieve its objectives in the future. Please refer to the Fund’s prospectus for more information regarding the Fund’s exposure to liquidity risk and other principal risks to which an investment in the Fund may be subject.
Eaton Vance
Total Return Bond Fund
September 30, 2023
Management and Organization
Fund Management. The Trustees of Eaton Vance Mutual Funds Trust (the Trust) are responsible for the overall management and supervision of the Trust's affairs. The Board members and officers of the Trust are listed below. Except as indicated, each individual has held the office shown or other offices in the same company for the last five years. Board members hold indefinite terms of office. Each Trustee holds office until his or her successor is elected and qualified, subject to a prior death, resignation, retirement, disqualification or removal. Under the terms of the Fund's current Trustee retirement policy, an Independent Trustee must retire and resign as a Trustee on the earlier of: (i) the first day of July following his or her 74th birthday; or (ii), with limited exception, December 31st of the 20th year in which he or she has served as a Trustee. However, if such retirement and resignation would cause the Fund to be out of compliance with Section 16 of the 1940 Act or any other regulations or guidance of the SEC, then such retirement and resignation will not become effective until such time as action has been taken for the Fund to be in compliance therewith. The “noninterested Trustees” consist of those Trustees who are not “interested persons” of the Trust, as that term is defined under the 1940 Act. The business address of each Board member and officer is Two International Place, Boston, Massachusetts 02110. As used below, “BMR” refers to Boston Management and Research, “EV” refers to EV LLC, “EVM” refers to Eaton Vance Management, “MSIM” refers to Morgan Stanley Investment Management Inc. and “EVD” refers to Eaton Vance Distributors, Inc. EV is the trustee of each of EVM and BMR. Each of EVM, BMR, EVD and EV are indirect, wholly owned subsidiaries of Morgan Stanley. Each officer affiliated with EVM may hold a position with other EVM affiliates that is comparable to his or her position with EVM listed below. Each Trustee oversees 127 funds in the Eaton Vance fund Complex (including both funds and portfolios in a hub and spoke structure).
| Name and Year of Birth | Trust
Position(s) | Length of Service | Principal Occupation(s) and Other Directorships
During Past Five Years and Other Relevant Experience |
| Interested Trustee |
Anchal Pachnanda(1)
1980 | Trustee | Since 2023 | Co-Head of Strategy of MSIM (since 2019). Formerly, Head of Strategy of MSIM (2017-2019). Ms. Pachnanda is an interested person because of her position with MSIM, which is an affiliate of the Trust.
Other Directorships. None |
| Noninterested Trustees |
Alan C. Bowser
1962 | Trustee | Since 2022 | Private investor. Formerly, Chief Diversity Officer, Partner and a member of the Operating Committee, and formerly served as Senior Advisor on Diversity and Inclusion for the firm’s chief executive officer, Co-Head of the Americas Region, and Senior Client Advisor of Bridgewater Associates, an asset management firm (2011- 2023).
Other Directorships. Independent Director of Stout Risius Ross (a middle market professional services advisory firm) (since 2021). |
Mark R. Fetting
1954 | Trustee | Since 2016 | Private investor. Formerly held various positions at Legg Mason, Inc. (investment management firm) (2000-2012), including President, Chief Executive Officer, Director and Chairman (2008-2012), Senior Executive Vice President (2004-2008) and Executive Vice President (2001-2004). Formerly, President of Legg Mason family of funds (2001-2008). Formerly, Division President and Senior Officer of Prudential Financial Group, Inc. and related companies (investment management firm) (1991-2000).
Other Directorships. None. |
Cynthia E. Frost
1961 | Trustee | Since 2014 | Private investor. Formerly, Chief Investment Officer of Brown University (university endowment) (2000-2012). Formerly, Portfolio Strategist for Duke Management Company (university endowment manager) (1995-2000). Formerly, Managing Director, Cambridge Associates (investment consulting company) (1989-1995). Formerly, Consultant, Bain and Company (management consulting firm) (1987-1989). Formerly, Senior Equity Analyst, BA Investment Management Company (1983-1985).
Other Directorships. None. |
George J. Gorman
1952 | Chairperson
of the Board
and Trustee | Since 2021
(Chairperson) and
2014 (Trustee) | Principal at George J. Gorman LLC (consulting firm). Formerly, Senior Partner at Ernst & Young LLP (a registered public accounting firm) (1974-2009).
Other Directorships. None. |
Eaton Vance
Total Return Bond Fund
September 30, 2023
Management and Organization — continued
| Name and Year of Birth | Trust
Position(s) | Length of Service | Principal Occupation(s) and Other Directorships
During Past Five Years and Other Relevant Experience |
| Noninterested Trustees (continued) |
Valerie A. Mosley
1960 | Trustee | Since 2014 | Chairwoman and Chief Executive Officer of Valmo Ventures (a consulting and investment firm). Founder of Upward Wealth, Inc., dba BrightUp, a fintech platform. Formerly, Partner and Senior Vice President, Portfolio Manager and Investment Strategist at Wellington Management Company, LLP (investment management firm) (1992-2012). Formerly, Chief Investment Officer, PG Corbin Asset Management (1990-1992). Formerly worked in institutional corporate bond sales at Kidder Peabody (1986-1990).
Other Directorships. Director of DraftKings, Inc. (digital sports entertainment and gaming company) (since September 2020). Director of Envestnet, Inc. (provider of intelligent systems for wealth management and financial wellness) (since 2018). Formerly, Director of Dynex Capital, Inc. (mortgage REIT) (2013-2020) and Director of Groupon, Inc. (e-commerce provider) (2020-2022). |
Keith Quinton
1958 | Trustee | Since 2018 | Private investor, researcher and lecturer. Formerly, Independent Investment Committee Member at New Hampshire Retirement System (2017-2021). Formerly, Portfolio Manager and Senior Quantitative Analyst at Fidelity Investments (investment management firm) (2001-2014).
Other Directorships. Formerly, Director (2016-2021) and Chairman (2019-2021) of New Hampshire Municipal Bond Bank. |
Marcus L. Smith
1966 | Trustee | Since 2018 | Private investor and independent corporate director. Formerly, Chief Investment Officer, Canada (2012-2017), Chief Investment Officer, Asia (2010-2012), Director of Asian Research (2004-2010) and portfolio manager (2001-2017) at MFS Investment Management (investment management firm).
Other Directorships. Director of First Industrial Realty Trust, Inc. (an industrial REIT) (since 2021). Director of MSCI Inc. (global provider of investment decision support tools) (since 2017). Formerly, Director of DCT Industrial Trust Inc. (logistics real estate company) (2017-2018). |
Susan J. Sutherland
1957 | Trustee | Since 2015 | Private investor. Director of Ascot Group Limited and certain of its subsidiaries (insurance and reinsurance) (since 2017). Formerly, Director of Hagerty Holding Corp. (insurance) (2015-2018) and Montpelier Re Holdings Ltd. (insurance and reinsurance) (2013-2015). Formerly, Associate, Counsel and Partner at Skadden, Arps, Slate, Meagher & Flom LLP (law firm) (1982-2013).
Other Directorships. Director of Kairos Acquisition Corp. (insurance/InsurTech acquisition company) (2021-2023). |
Scott E. Wennerholm
1959 | Trustee | Since 2016 | Private investor. Formerly, Trustee at Wheelock College (postsecondary institution) (2012-2018). Formerly, Consultant at GF Parish Group (executive recruiting firm) (2016-2017). Formerly, Chief Operating Officer and Executive Vice President at BNY Mellon Asset Management (investment management firm) (2005-2011). Formerly, Chief Operating Officer and Chief Financial Officer at Natixis Global Asset Management (investment management firm) (1997-2004). Formerly, Vice President at Fidelity Investments Institutional Services (investment management firm) (1994-1997).
Other Directorships. None. |
Nancy A. Wiser
1967 | Trustee | Since 2022 | Formerly, Executive Vice President and the Global Head of Operations at Wells Fargo Asset Management (2011-2021).
Other Directorships. None. |
| Name and Year of Birth | Trust
Position(s) | Length of Service | Principal Occupation(s)
During Past Five Years |
| Principal Officers who are not Trustees |
Kenneth A. Topping
1966 | President | Since 2023 | Vice President and Chief Administrative Officer of EVM and BMR and Chief Operating Officer for Public Markets at MSIM. Also Vice President of Calvert Research and Management (“CRM”) since 2021. Formerly, Chief Operating Officer for Goldman Sachs Asset Management `Classic' (2009-2020). |
Deidre E. Walsh
1971 | Vice President and
Chief Legal Officer | Since 2009 | Vice President of EVM and BMR. Also Vice President of CRM. |
James F. Kirchner
1967 | Treasurer | Since 2007 | Vice President of EVM and BMR. Also Vice President of CRM. |
Eaton Vance
Total Return Bond Fund
September 30, 2023
Management and Organization — continued
| Name and Year of Birth | Trust
Position(s) | Length of Service | Principal Occupation(s)
During Past Five Years |
| Principal Officers who are not Trustees (continued) |
Nicholas S. Di Lorenzo
1987 | Secretary | Since 2022 | Formerly, associate (2012-2021) and counsel (2022) at Dechert LLP. |
Richard F. Froio
1968 | Chief Compliance
Officer | Since 2017 | Vice President of EVM and BMR since 2017. Formerly, Deputy Chief Compliance Officer (Adviser/Funds) and Chief Compliance Officer (Distribution) at PIMCO (2012-2017) and Managing Director at BlackRock/Barclays Global Investors (2009-2012). |
(1) Ms. Pachnanda began serving as Trustee effective April 1, 2023.
The SAI for the Fund includes additional information about the Trustees and officers of the Fund and can be obtained without charge on Eaton Vance’s website at www.eatonvance.com or by calling 1-800-262-1122.
| FACTS | WHAT DOES EATON VANCE DO WITH YOUR
PERSONAL INFORMATION? |
| Why? | Financial companies choose how they share your personal information. Federal law gives consumers the right to limit some but not all sharing. Federal law also requires us to tell you how we collect, share, and protect your personal information. Please read this notice carefully to understand what we do. |
| |
| What? | The types of personal information we collect and share depend on the product or service you have with us. This information can include:■ Social Security number and income
■ investment experience and risk tolerance
■ checking account number and wire transfer instructions |
| |
| How? | All financial companies need to share customers’ personal information to run their everyday business. In the section below, we list the reasons financial companies can share their customers’ personal information; the reasons Eaton Vance chooses to share; and whether you can limit this sharing. |
Reasons we can share your
personal information | Does Eaton Vance
share? | Can you limit
this sharing? |
| For our everyday business purposes — such as to process your transactions, maintain your account(s), respond to court orders and legal investigations, or report to credit bureaus | Yes | No |
| For our marketing purposes — to offer our products and services to you | Yes | No |
| For joint marketing with other financial companies | No | We don’t share |
| For our investment management affiliates’ everyday business purposes — information about your transactions, experiences, and creditworthiness | Yes | Yes |
| For our affiliates’ everyday business purposes — information about your transactions and experiences | Yes | No |
| For our affiliates’ everyday business purposes — information about your creditworthiness | No | We don’t share |
| For our investment management affiliates to market to you | Yes | Yes |
| For our affiliates to market to you | No | We don’t share |
| For nonaffiliates to market to you | No | We don’t share |
To limit our
sharing | Call toll-free 1-800-262-1122 or email: EVPrivacy@eatonvance.comPlease note:If you are a new customer, we can begin sharing your information 30 days from the date we sent this notice. When you are no longer our customer, we continue to share your information as described in this notice. However, you can contact us at any time to limit our sharing. |
| Questions? | Call toll-free 1-800-262-1122 or email: EVPrivacy@eatonvance.com |
| Privacy Notice — continued | April 2021 |
| Who we are |
| Who is providing this notice? | Eaton Vance Management, Eaton Vance Distributors, Inc., Eaton Vance Trust Company, Eaton Vance Management (International) Limited, Eaton Vance Advisers International Ltd., Eaton Vance Global Advisors Limited, Eaton Vance Management’s Real Estate Investment Group, Boston Management and Research, Calvert Research and Management, Eaton Vance and Calvert Fund Families and our investment advisory affiliates (“Eaton Vance”) (see Investment Management Affiliates definition below) |
| What we do |
How does Eaton Vance
protect my personal
information? | To protect your personal information from unauthorized access and use, we use security measures that comply with federal law. These measures include computer safeguards and secured files and buildings. We have policies governing the proper handling of customer information by personnel and requiring third parties that provide support to adhere to appropriate security standards with respect to such information. |
How does Eaton Vance
collect my personal
information? | We collect your personal information, for example, when you■ open an account or make deposits or withdrawals from your account
■ buy securities from us or make a wire transfer
■ give us your contact informationWe also collect your personal information from others, such as credit bureaus, affiliates, or other companies. |
| Why can’t I limit all sharing? | Federal law gives you the right to limit only■ sharing for affiliates’ everyday business purposes — information about your creditworthiness
■ affiliates from using your information to market to you
■ sharing for nonaffiliates to market to youState laws and individual companies may give you additional rights to limit sharing. See below for more on your rights under state law. |
| Definitions |
Investment Management
Affiliates | Eaton Vance Investment Management Affiliates include registered investment advisers, registered broker- dealers, and registered and unregistered funds. Investment Management Affiliates does not include entities associated with Morgan Stanley Wealth Management, such as Morgan Stanley Smith Barney LLC and Morgan Stanley & Co. |
| Affiliates | Companies related by common ownership or control. They can be financial and nonfinancial companies.■ Our affiliates include companies with a Morgan Stanley name and financial companies such as Morgan Stanley Smith Barney LLC and Morgan Stanley & Co. |
| Nonaffiliates | Companies not related by common ownership or control. They can be financial and nonfinancial companies.■ Eaton Vance does not share with nonaffiliates so they can market to you. |
| Joint marketing | A formal agreement between nonaffiliated financial companies that together market financial products or services to you.■ Eaton Vance doesn’t jointly market. |
| Other important information |
| Vermont: Except as permitted by law, we will not share personal information we collect about Vermont residents with Nonaffiliates unless you provide us with your written consent to share such information.California: Except as permitted by law, we will not share personal information we collect about California residents with Nonaffiliates and we will limit sharing such personal information with our Affiliates to comply with California privacy laws that apply to us. |
Delivery of Shareholder Documents. The Securities and Exchange Commission (SEC) permits funds to deliver only one copy of shareholder documents, including prospectuses, proxy statements and shareholder reports, to fund investors with multiple accounts at the same residential or post office box address. This practice is often called “householding” and it helps eliminate duplicate mailings to shareholders. Eaton Vance, or your financial intermediary, may household the mailing of your documents indefinitely unless you instruct Eaton Vance, or your financial intermediary, otherwise. If you would prefer that your Eaton Vance documents not be householded, please contact Eaton Vance at 1-800-262-1122, or contact your financial intermediary. Your instructions that householding not apply to delivery of your Eaton Vance documents will typically be effective within 30 days of receipt by Eaton Vance or your financial intermediary.
Portfolio Holdings. Each Eaton Vance Fund and its underlying Portfolio(s) (if applicable) files a schedule of portfolio holdings on Part F to Form N-PORT with the SEC. Certain information filed on Form N-PORT may be viewed on the Eaton Vance website at www.eatonvance.com, by calling Eaton Vance at 1-800-262-1122 or in the EDGAR database on the SEC’s website at www.sec.gov.
Proxy Voting. From time to time, funds are required to vote proxies related to the securities held by the funds. The Eaton Vance Funds or their underlying Portfolios (if applicable) vote proxies according to a set of policies and procedures approved by the Funds’ and Portfolios’ Boards. You may obtain a description of these policies and procedures and information on how the Funds or Portfolios voted proxies relating to portfolio securities during the most recent 12-month period ended June 30, without charge, upon request, by calling 1-800-262-1122 and by accessing the SEC’s website at www.sec.gov.
Tailored Shareholder Reports. Effective January 24, 2023, the SEC adopted rule and form amendments to require open-end mutual funds and ETFs to transmit concise and visually engaging streamlined annual and semiannual reports to shareholders that highlight key information. Other information, including financial statements, will no longer appear in a streamlined shareholder report but must be available online, delivered free of charge upon request, and filed on a semiannual basis on Form N-CSR. The rule and form amendments have a compliance date of July 24, 2024. At this time, management is evaluating the impact of these amendments on the shareholder reports for the Eaton Vance Funds.
This Page Intentionally Left Blank
This Page Intentionally Left Blank
This Page Intentionally Left Blank
Investment Adviser
Boston Management and Research
Two International Place
Boston, MA 02110
Administrator
Eaton Vance Management
Two International Place
Boston, MA 02110
Principal Underwriter*
Eaton Vance Distributors, Inc.
Two International Place
Boston, MA 02110
(617) 482-8260
Custodian
State Street Bank and Trust Company
One Congress Street, Suite 1
Boston, MA 02114-2016
Transfer Agent
BNY Mellon Investment Servicing (US) Inc.
Attn: Eaton Vance Funds
P.O. Box 534439
Pittsburgh, PA 15253-4439
(800) 262-1122
Independent Registered Public Accounting Firm
Deloitte & Touche LLP
200 Berkeley Street
Boston, MA 02116-5022
Fund Offices
Two International Place
Boston, MA 02110
* FINRA BrokerCheck. Investors may check the background of their Investment Professional by contacting the Financial Industry Regulatory Authority (FINRA). FINRA BrokerCheck is a free tool to help investors check the professional background of current and former FINRA-registered securities firms and brokers. FINRA BrokerCheck is available by calling 1-800-289-9999 and at www.FINRA.org. The FINRA BrokerCheck brochure describing this program is available to investors at www.FINRA.org.
Eaton Vance
Municipal Income Funds
Annual Report
September 30, 2023
Commodity Futures Trading Commission Registration. The Commodity Futures Trading Commission (“CFTC”) has adopted regulations that subject registered investment companies and advisers to regulation by the CFTC if a fund invests more than a prescribed level of its assets in certain CFTC-regulated instruments (including futures, certain options and swap agreements) or markets itself as providing investment exposure to such instruments. Each investment adviser has claimed an exclusion from the definition of “commodity pool operator” under the Commodity Exchange Act with respect to its management of each Fund. Accordingly, neither the Funds nor the adviser with respect to the operation of the Funds is subject to CFTC regulation. Because of its management of other strategies, each Fund's adviser is registered with the CFTC as a commodity pool operator. Each adviser is also registered as a commodity trading advisor.
Fund shares are not insured by the FDIC and are not deposits or other obligations of, or guaranteed by, any depository institution. Shares are subject to investment risks, including possible loss of principal invested.
This report must be preceded or accompanied by a current summary prospectus or prospectus. Before investing, investors should consider carefully the investment objective, risks, and charges and expenses of a mutual fund. This and other important information is contained in the summary prospectus and prospectus, which can be obtained from a financial intermediary. Prospective investors should read the prospectus carefully before investing. For further information, please call 1-800-262-1122.
Annual Report September 30, 2023
Eaton Vance
Municipal Income Funds
Eaton Vance
Municipal Income Funds
September 30, 2023
Management’s Discussion of Fund Performance†
Economic and Market Conditions
For municipal bond investors, the 12-month period ended September 30, 2023, was a roller-coaster ride. In the opening month of the period, municipal bonds posted negative returns. Municipal mutual funds experienced net outflows as investors reacted to statements by U.S. Federal Reserve (Fed) officials that the central bank was not done with interest rate hikes and fighting inflation remained its top priority.
However, in the final months of 2022, municipal bond performance rebounded. Despite the Fed’s fourth 0.75% rate hike in November, the Bloomberg Municipal Bond Index (the Index), rose 4.68% -- its best monthly performance since 1986. Drivers of the rally included Fed signals that future rate hikes might be smaller, as well as growing investor demand amid lower supplies of new municipal bond issues.
Although the Fed did deliver a smaller 0.50% rate hike in December 2022, it raised expectations of how high rates might go in 2023. The Index -- helped by attractive yields and limited supply -- nonetheless eked out positive performance in December 2022.
In January 2023, municipal bonds delivered a third straight month of positive returns, driven by the ongoing supply-demand imbalance and the return of net inflows into open-end mutual funds. In February, however, the municipal rally stalled as robust economic reports -- including unexpectedly strong job creation in January -- led investors to fear the Fed might keep rates higher for longer than previously expected.
In March 2023, municipal returns turned positive again. The second- and third-largest bank failures in U.S. history triggered a “flight to quality” that drove municipal bonds to their strongest March performance since 2008, despite the Fed announcing its ninth consecutive rate hike that month.
But from April 2023 through period-end, the municipal bond market experienced another sell-off. Although positive technical factors -- most importantly, demand that exceeded municipal bond supply -- produced brief periods of positive performance, the Fed’s 10th and 11th rate hikes in a little over a year -- in May and July 2023 -- overwhelmed positive technical factors and caused municipal rates to rise and bond prices to fall.
In August and September, above-average supply -- reversing the previous favorable supply-demand imbalance -- plus a typical end-of-summer slowdown in coupon reinvestment, helped reduce demand for municipal bonds even more. And while the Fed left rates unchanged at its September 2023 meeting, investors interpreted the Fed’s message to be that rates would stay higher for longer than investors expected just weeks earlier -- adding further fuel to the municipal bond sell-off.
For the period as a whole, the Index returned 2.66% as coupon payments outpaced declining bond prices. While interest rates rose and bond prices fell across the municipal bond yield curve, the largest rate increases occurred at the long and short ends of the yield curve. U.S. Treasurys, meanwhile, underperformed municipal bonds throughout the yield curve during the period.
Fund Performance
For the 12-month period ended September 30, 2023, Eaton Vance AMT-Free Municipal Income Fund (the AMT-Free Fund) Class A shares at net asset value (NAV) underperformed its benchmark, the Bloomberg Municipal Bond Index (the Index), which returned 2.66%; while Eaton Vance National Municipal Income Fund (the National Fund) Class A shares at NAV outperformed the Index.
In pursuing their distinct performance objectives, the AMT-Free Fund and the National Fund normally acquire municipal obligations with maturities of 10 years or more.
Fund managers may attempt to hedge each portfolio against the potential risk of interest rate volatility at the long end of the yield curve by using U.S. Treasury futures and interest rate swaps. In a period when Treasury bonds generally declined in price as yields moved higher, the National Fund’s Treasury-futures hedging strategy contributed to relative returns versus the unhedged Index.
The AMT-Free Fund did not use an interest rate hedge during the period.
Fund-Specific Results
The AMT-Free Fund returned 1.29% for Class A shares at NAV, underperforming the Index, which returned 2.66% during the period.
Detractors from the AMT-Free Fund’s performance versus the Index included security selections in the health care sector, in 4% coupon bonds, and in AAA-rated bonds.
See Endnotes and Additional Disclosures in this report.
Past performance is no guarantee of future results. Returns are historical and are calculated by determining the percentage change in net asset value (NAV) or offering price (as applicable) with all distributions reinvested. Furthermore, returns do not reflect the deduction of taxes that shareholders may have to pay on Fund distributions or upon the redemption of Fund shares. Investment return and principal value will fluctuate so that shares, when redeemed, may be worth more or less than their original cost. Performance for periods less than or equal to one year is cumulative. Performance is for the stated time period only; due to market volatility, current Fund performance may be lower or higher than the quoted return. For performance as of the most recent month-end, please refer to eatonvance.com.
Eaton Vance
Municipal Income Funds
September 30, 2023
Management’s Discussion of Fund Performance† — continued
In contrast, contributors to returns relative to the Index included security selections and an overweight position in Illinois bonds, security selections in the transportation sector, and an overweight position in zero-coupon bonds.
The National Fund returned 3.38% for Class A shares at NAV, outperforming the Index, which returned 2.66% during the period.
In addition to the National Fund’s futures hedging strategy, contributors to performance relative to the Index included security selections and an overweight position in the transportation sector, and security selections in bonds rated BBB and below.
In contrast, detractors from performance versus the Index included underweight positions in New York and California bonds; an underweight position in the leasing sector -- the best-performing sector within the Index during the period --and an out-of-Index allocation to taxable municipal bonds, which generally underperformed tax-exempt municipal bonds during the period.
See Endnotes and Additional Disclosures in this report.
Past performance is no guarantee of future results. Returns are historical and are calculated by determining the percentage change in net asset value (NAV) or offering price (as applicable) with all distributions reinvested. Furthermore, returns do not reflect the deduction of taxes that shareholders may have to pay on Fund distributions or upon the redemption of Fund shares. Investment return and principal value will fluctuate so that shares, when redeemed, may be worth more or less than their original cost. Performance for periods less than or equal to one year is cumulative. Performance is for the stated time period only; due to market volatility, current Fund performance may be lower or higher than the quoted return. For performance as of the most recent month-end, please refer to eatonvance.com.
Eaton Vance
AMT-Free Municipal Income Fund
September 30, 2023
Performance
Portfolio Manager(s) Cynthia J. Clemson and Julie P. Callahan, CFA
| % Average Annual Total Returns1,2 | Class
Inception Date | Performance
Inception Date | One Year | Five Years | Ten Years |
| Class A at NAV | 01/06/1998 | 03/16/1978 | 1.29% | 0.05% | 2.25% |
| Class A with 3.25% Maximum Sales Charge | — | — | (1.99) | (0.61) | 1.91 |
| Class C at NAV | 05/02/2006 | 03/16/1978 | 0.51 | (0.71) | 1.64 |
| Class C with 1% Maximum Deferred Sales Charge | — | — | (0.46) | (0.71) | 1.64 |
| Class I at NAV | 03/16/1978 | 03/16/1978 | 1.49 | 0.31 | 2.50 |
|
| Bloomberg Municipal Bond Index | — | — | 2.66% | 1.05% | 2.29% |
| % Total Annual Operating Expense Ratios3 | Class A | Class C | Class I |
| | 0.86% | 1.61% | 0.61% |
| % Distribution Rates/Yields4 | Class A | Class C | Class I |
| Distribution Rate | 3.97% | 3.20% | 4.22% |
| Taxable-Equivalent Distribution Rate | 6.70 | 5.40 | 7.14 |
| SEC 30-day Yield | 3.58 | 2.94 | 3.96 |
| Taxable-Equivalent SEC 30-day Yield | 6.05 | 4.96 | 6.69 |
| % Total Leverage5 | |
| Residual Interest Bond (RIB) Financing | 3.40% |
Growth of $10,000
This graph shows the change in value of a hypothetical investment of $10,000 in Class A of the Fund for the period indicated. For comparison, the same investment is shown in the indicated index.
| Growth of Investment | Amount Invested | Period Beginning | At NAV | With Maximum Sales Charge |
| Class C | $10,000 | 09/30/2013 | $11,772 | N.A. |
| Class I, at minimum investment | $1,000,000 | 09/30/2013 | $1,280,135 | N.A. |
See Endnotes and Additional Disclosures in this report.
Past performance is no guarantee of future results. Returns are historical and are calculated by determining the percentage change in net asset value (NAV) or offering price (as applicable) with all distributions reinvested. Furthermore, returns do not reflect the deduction of taxes that shareholders may have to pay on Fund distributions or upon the redemption of Fund shares. Investment return and principal value will fluctuate so that shares, when redeemed, may be worth more or less than their original cost. Performance for periods less than or equal to one year is cumulative. Performance is for the stated time period only; due to market volatility, current Fund performance may be lower or higher than the quoted return. For performance as of the most recent month-end, please refer to eatonvance.com.
Eaton Vance
AMT-Free Municipal Income Fund
September 30, 2023
| Credit Quality (% of total investments)1,2 |
Footnotes:
| 1 | For purposes of the Fund’s rating restrictions, ratings are based on Moody’s Investors Service, Inc. (“Moody’s”), S&P Global Ratings (“S&P”) or Fitch Ratings (“Fitch”), as applicable. If securities are rated differently by the ratings agencies, the highest rating is applied. Ratings, which are subject to change, apply to the creditworthiness of the issuers of the underlying securities and not to the Fund or its shares. Credit ratings measure the quality of a bond based on the issuer’s creditworthiness, with ratings ranging from AAA, being the highest, to D, being the lowest based on S&P’s measures. Ratings of BBB or higher by S&P or Fitch (Baa or higher by Moody’s) are considered to be investment-grade quality. Credit ratings are based largely on the ratings agency’s analysis at the time of rating. The rating assigned to any particular security is not necessarily a reflection of the issuer’s current financial condition and does not necessarily reflect its assessment of the volatility of a security’s market value or of the liquidity of an investment in the security. Holdings designated as “Not Rated” (if any) are not rated by the national ratings agencies stated above. |
| 2 | The chart includes the municipal bonds held by a trust that issues residual interest bonds, consistent with the Portfolio of Investments. |
Eaton Vance
National Municipal Income Fund
September 30, 2023
Performance
Portfolio Manager(s) Craig R. Brandon, CFA and Christopher J. Eustance, CFA
| % Average Annual Total Returns1,2 | Class
Inception Date | Performance
Inception Date | One Year | Five Years | Ten Years |
| Class A at NAV | 04/05/1994 | 12/19/1985 | 3.38% | 0.96% | 3.01% |
| Class A with 3.25% Maximum Sales Charge | — | — | 0.07 | 0.30 | 2.66 |
| Class C at NAV | 12/03/1993 | 12/19/1985 | 2.60 | 0.21 | 2.39 |
| Class C with 1% Maximum Deferred Sales Charge | — | — | 1.61 | 0.21 | 2.39 |
| Class I at NAV | 07/01/1999 | 12/19/1985 | 3.64 | 1.21 | 3.25 |
|
| Bloomberg Municipal Bond Index | — | — | 2.66% | 1.05% | 2.29% |
| % Total Annual Operating Expense Ratios3 | Class A | Class C | Class I |
| | 0.67% | 1.42% | 0.42% |
| % Distribution Rates/Yields4 | Class A | Class C | Class I |
| Distribution Rate | 3.99% | 3.22% | 4.25% |
| Taxable-Equivalent Distribution Rate | 6.74 | 5.44 | 7.17 |
| SEC 30-day Yield | 3.83 | 3.19 | 4.22 |
| Taxable-Equivalent SEC 30-day Yield | 6.48 | 5.39 | 7.13 |
| % Total Leverage5 | |
| RIB Financing | 1.47% |
Growth of $10,000
This graph shows the change in value of a hypothetical investment of $10,000 in Class A of the Fund for the period indicated. For comparison, the same investment is shown in the indicated index.
| Growth of Investment | Amount Invested | Period Beginning | At NAV | With Maximum Sales Charge |
| Class C | $10,000 | 09/30/2013 | $12,672 | N.A. |
| Class I, at minimum investment | $1,000,000 | 09/30/2013 | $1,377,254 | N.A. |
See Endnotes and Additional Disclosures in this report.
Past performance is no guarantee of future results. Returns are historical and are calculated by determining the percentage change in net asset value (NAV) or offering price (as applicable) with all distributions reinvested. Furthermore, returns do not reflect the deduction of taxes that shareholders may have to pay on Fund distributions or upon the redemption of Fund shares. Investment return and principal value will fluctuate so that shares, when redeemed, may be worth more or less than their original cost. Performance for periods less than or equal to one year is cumulative. Performance is for the stated time period only; due to market volatility, current Fund performance may be lower or higher than the quoted return. For performance as of the most recent month-end, please refer to eatonvance.com.
Eaton Vance
National Municipal Income Fund
September 30, 2023
| Credit Quality (% of total investments)1,2 |
Footnotes:
| 1 | For purposes of the Fund’s rating restrictions, ratings are based on Moody’s Investors Service, Inc. (“Moody’s”), S&P Global Ratings (“S&P”) or Fitch Ratings (“Fitch”), as applicable. If securities are rated differently by the ratings agencies, the highest rating is applied. Ratings, which are subject to change, apply to the creditworthiness of the issuers of the underlying securities and not to the Fund or its shares. Credit ratings measure the quality of a bond based on the issuer’s creditworthiness, with ratings ranging from AAA, being the highest, to D, being the lowest based on S&P’s measures. Ratings of BBB or higher by S&P or Fitch (Baa or higher by Moody’s) are considered to be investment-grade quality. Credit ratings are based largely on the ratings agency’s analysis at the time of rating. The rating assigned to any particular security is not necessarily a reflection of the issuer’s current financial condition and does not necessarily reflect its assessment of the volatility of a security’s market value or of the liquidity of an investment in the security. Holdings designated as “Not Rated” (if any) are not rated by the national ratings agencies stated above. |
| 2 | The chart includes the municipal bonds held by a trust that issues residual interest bonds, consistent with the Portfolio of Investments. |
Eaton Vance
Municipal Income Funds
September 30, 2023
Endnotes and Additional Disclosures
| † | The views expressed in this report are those of the portfolio manager(s) and are current only through the date stated at the top of this page. These views are subject to change at any time based upon market or other conditions, and Eaton Vance and the Fund(s) disclaim any responsibility to update such views. These views may not be relied upon as investment advice and, because investment decisions are based on many factors, may not be relied upon as an indication of trading intent on behalf of any Eaton Vance fund. This commentary may contain statements that are not historical facts, referred to as “forward-looking statements.” The Fund’s actual future results may differ significantly from those stated in any forward-looking statement, depending on factors such as changes in securities or financial markets or general economic conditions, the volume of sales and purchases of Fund shares, the continuation of investment advisory, administrative and service contracts, and other risks discussed from time to time in the Fund’s filings with the Securities and Exchange Commission. |
| | |
| 1 | Bloomberg Municipal Bond Index is an unmanaged index of municipal bonds traded in the U.S. Unless otherwise stated, index returns do not reflect the effect of any applicable sales charges, commissions, expenses, taxes or leverage, as applicable. It is not possible to invest directly in an index. |
| 2 | Total Returns at NAV do not include applicable sales charges. If sales charges were deducted, the returns would be lower. Total Returns shown with maximum sales charge reflect the stated maximum sales charge. Unless otherwise stated, performance does not reflect the deduction of taxes on Fund distributions or redemptions of Fund shares.Effective November 5, 2020, Class C shares automatically convert to Class A shares eight years after purchase. The average annual total returns listed for Class C reflect conversion to Class A shares after eight years. Prior to November 5, 2020, Class C shares automatically converted to Class A shares ten years after purchase. |
| 3 | Source: Fund prospectus. The expense ratios for the current reporting period can be found in the Financial Highlights section of this report. |
| 4 | The Distribution Rate is based on the Fund’s last regular distribution per share in the period (annualized) divided by the Fund’s NAV at the end of the period. The Fund’s distributions may be comprised of amounts characterized for federal income tax purposes as tax-exempt income, qualified and non-qualified ordinary dividends, capital gains and nondividend distributions, also known as return of capital. The Fund will determine the federal income tax character of distributions paid to a shareholder after the end of the calendar year. This is reported on the IRS form 1099-DIV and provided to the shareholder shortly after each year-end. The Fund’s distributions are determined by the investment adviser based on its current assessment of the Fund’s long-term return potential. As portfolio and market conditions change, the rate of distributions paid by the Fund could change. Taxable-equivalent performance is based on the highest combined federal and state income tax rates, where applicable. Lower tax rates would result in lower tax-equivalent performance. Actual tax rates will vary depending on your income, exemptions and deductions. Rates do not include local taxes. The SEC Yield is a standardized measure based on the estimated yield to maturity of a fund’s investments over a 30-day period and is based on the maximum offer price at the date specified. The SEC Yield is not based on the distributions made by the Fund, which may differ. |
| 5 | Fund employs RIB financing. The leverage created by RIB investments provides an opportunity for increased income but, at the same time, creates special risks (including the likelihood of greater volatility of NAV). The cost of leverage rises and falls with changes in short-term interest rates. See “Floating Rate Notes Issued in Conjunction with Securities Held” in the notes to the financial statements for more information about RIB financing. RIB leverage represents the amount of Floating Rate Notes outstanding at period end as a percentage of Fund net assets plus Floating Rate Notes. |
| | Fund profiles subject to change due to active management. |
| | Additional Information |
| | Yield curve is a graphical representation of the yields offered by bonds of various maturities. The yield curve flattens when long-term interest rates fall and/or short-term interest rates increase, and the yield curve steepens when long-term interest rates increase and/or short-term interest rates fall. |
Eaton Vance
Municipal Income Funds
September 30, 2023
Example
As a Fund shareholder, you incur two types of costs: (1) transaction costs, including sales charges (loads) on purchases; and (2) ongoing costs, including management fees; distribution and/or service fees; and other Fund expenses. This Example is intended to help you understand your ongoing costs (in dollars) of Fund investing and to compare these costs with the ongoing costs of investing in other mutual funds. The Example is based on an investment of $1,000 invested at the beginning of the period and held for the entire period (April 1, 2023 to September 30, 2023).
Actual Expenses
The first section of each table below provides information about actual account values and actual expenses. You may use the information in this section, together with the amount you invested, to estimate the expenses that you paid over the period. Simply divide your account value by $1,000 (for example, an $8,600 account value divided by $1,000 = 8.6), then multiply the result by the number in the first section under the heading entitled “Expenses Paid During Period” to estimate the expenses you paid on your account during this period.
Hypothetical Example for Comparison Purposes
The second section of each table below provides information about hypothetical account values and hypothetical expenses based on the actual Fund expense ratio and an assumed rate of return of 5% per year (before expenses), which is not the actual Fund return. The hypothetical account values and expenses may not be used to estimate the actual ending account balance or expenses you paid for the period. You may use this information to compare the ongoing costs of investing in your Fund and other funds. To do so, compare this 5% hypothetical example with the 5% hypothetical examples that appear in the shareholder reports of the other funds.
Please note that the expenses shown in each table are meant to highlight your ongoing costs only and do not reflect any transactional costs, such as sales charges (loads). Therefore, the second section of each table is useful in comparing ongoing costs only, and will not help you determine the relative total costs of owning different funds. In addition, if these transactional costs were included, your costs would be higher.
Eaton Vance AMT-Free Municipal Income Fund
| | Beginning
Account Value
(4/1/23) | Ending
Account Value
(9/30/23) | Expenses Paid
During Period*
(4/1/23 – 9/30/23) | Annualized
Expense
Ratio |
| Actual | | | | |
| Class A | $1,000.00 | $ 953.00 | $4.75 | 0.97% |
| Class C | $1,000.00 | $ 947.80 | $8.40 | 1.72% |
| Class I | $1,000.00 | $ 954.00 | $3.53 | 0.72% |
| |
| Hypothetical | | | | |
| (5% return per year before expenses) | | | | |
| Class A | $1,000.00 | $1,020.21 | $4.91 | 0.97% |
| Class C | $1,000.00 | $1,016.45 | $8.69 | 1.72% |
| Class I | $1,000.00 | $1,021.46 | $3.65 | 0.72% |
| * | Expenses are equal to the Fund's annualized expense ratio for the indicated Class, multiplied by the average account value over the period, multiplied by 183/365 (to reflect the one-half year period). The Example assumes that the $1,000 was invested at the net asset value per share determined at the close of business on March 31, 2023. |
Eaton Vance
Municipal Income Funds
September 30, 2023
Fund Expenses — continued
Eaton Vance National Municipal Income Fund
| | Beginning
Account Value
(4/1/23) | Ending
Account Value
(9/30/23) | Expenses Paid
During Period*
(4/1/23 – 9/30/23) | Annualized
Expense
Ratio |
| Actual | | | | |
| Class A | $1,000.00 | $ 965.60 | $3.55 | 0.72% |
| Class C | $1,000.00 | $ 962.00 | $7.23 | 1.47% |
| Class I | $1,000.00 | $ 966.80 | $2.37 | 0.48% |
| |
| Hypothetical | | | | |
| (5% return per year before expenses) | | | | |
| Class A | $1,000.00 | $1,021.46 | $3.65 | 0.72% |
| Class C | $1,000.00 | $1,017.70 | $7.44 | 1.47% |
| Class I | $1,000.00 | $1,022.66 | $2.43 | 0.48% |
| * | Expenses are equal to the Fund's annualized expense ratio for the indicated Class, multiplied by the average account value over the period, multiplied by 183/365 (to reflect the one-half year period). The Example assumes that the $1,000 was invested at the net asset value per share determined at the close of business on March 31, 2023. |
Eaton Vance
AMT-Free Municipal Income Fund
September 30, 2023
| Tax-Exempt Mortgage-Backed Securities — 0.4% |
| Security | Principal
Amount
(000's omitted) | Value |
| Housing — 0.4% |
| California Housing Finance Agency, Municipal Certificates, Series 2021-1, Class A, 3.50%, 11/20/35 | $ | 1,016 | $ 891,446 |
Total Tax-Exempt Mortgage-Backed Securities
(identified cost $964,988) | | | $ 891,446 |
| Tax-Exempt Municipal Obligations — 100.6% |
| Security | Principal
Amount
(000's omitted) | Value |
| Education — 3.2% |
| District of Columbia, (KIPP DC), 4.00%, 7/1/44 | $ | 105 | $ 88,482 |
| Florida Development Finance Corp., (River City Science Academy), 4.00%, 7/1/45 | | 25 | 19,409 |
| Georgia Private Colleges and Universities Authority, (Savannah College of Art and Design), 4.00%, 4/1/40 | | 1,400 | 1,289,764 |
| Ohio Higher Educational Facility Commission, (Oberlin College), Green Bonds, 5.00%, 10/1/48 | | 2,000 | 2,040,560 |
| University of California, 5.25%, 5/15/35 | | 3,555 | 3,580,276 |
| | | | $ 7,018,491 |
| Electric Utilities — 5.7% |
| Douglas County Public Utility District No. 1, WA, 3.00%, 9/1/52 | $ | 1,355 | $ 911,698 |
| Georgia Municipal Electric Power Authority, 5.00%, 1/1/39 | | 5,000 | 4,885,350 |
| Seattle, WA, Municipal Light and Power Improvement Revenue, 4.00%, 7/1/47 | | 2,500 | 2,224,375 |
| Utility Debt Securitization Authority, NY: | | | |
| 5.00%, 12/15/33 | | 2,895 | 2,898,300 |
| Green Bonds, 5.00%, 12/15/49 | | 1,500 | 1,566,435 |
| | | | $ 12,486,158 |
| Escrowed/Prerefunded — 3.9% |
| New Jersey Economic Development Authority, (School Facilities Construction), Prerefunded to 12/15/28, 5.00%, 6/15/37 | $ | 3,000 | $ 3,225,990 |
| San Joaquin Hills Transportation Corridor Agency, CA, Prerefunded to 1/15/25, 5.00%, 1/15/34 | | 5,235 | 5,332,476 |
| | | | $ 8,558,466 |
| Security | Principal
Amount
(000's omitted) | Value |
| General Obligations — 19.8% |
| Chicago Board of Education, IL: | | | |
| 5.00%, 12/1/42 | $ | 390 | $ 359,841 |
| 5.00%, 12/1/44 | | 2,000 | 1,836,360 |
| Chicago, IL: | | | |
| 5.00%, 1/1/39 | | 1,400 | 1,397,774 |
| 5.00%, 1/1/44 | | 1,490 | 1,445,717 |
| Del Valle Independent School District, TX, (PSF Guaranteed), 4.00%, 6/15/47 | | 4,000 | 3,502,960 |
| District of Columbia, 4.00%, 2/1/46 | | 3,500 | 3,162,565 |
| Hutto Independent School District, TX, (PSF Guaranteed), 5.00%, 8/1/53 | | 3,000 | 3,104,250 |
| Illinois: | | | |
| 4.00%, 11/1/40 | | 1,000 | 875,280 |
| 5.00%, 5/1/35 | | 2,000 | 1,980,200 |
| 5.50%, 5/1/39 | | 205 | 213,989 |
| 5.50%, 3/1/42 | | 2,300 | 2,401,361 |
| 5.75%, 5/1/45 | | 210 | 219,049 |
| Little Elm Independent School District, TX, (PSF Guaranteed), 5.00%, 8/15/46 | | 4,225 | 4,295,135 |
| New York, NY: | | | |
| 4.00%, 9/1/46 | | 2,000 | 1,763,340 |
| 4.00%, 4/1/50 | | 2,000 | 1,733,520 |
| Northwest Independent School District, TX, (PSF Guaranteed), 4.00%, 2/15/47 | | 3,000 | 2,654,970 |
| Prosper Independent School District, TX, (PSF Guaranteed), 4.00%, 2/15/47 | | 3,500 | 3,107,615 |
| Salem-Keizer School District No. 24J, OR, 0.00%, 6/15/24 | | 1,220 | 1,185,791 |
| Spring Branch Independent School District, TX, (PSF Guaranteed), 4.50%, 2/1/47 | | 8,750 | ��� 8,443,138 |
| | | | $ 43,682,855 |
| Hospital — 10.8% |
| Brevard County Health Facilities Authority, FL, (Health First Obligated Group): | | | |
| 5.00%, 4/1/47 | $ | 2,500 | $ 2,416,075 |
| 5.00%, 4/1/52 | | 2,500 | 2,393,475 |
| California Statewide Communities Development Authority, (Loma Linda University Medical Center), 5.25%, 12/1/34 | | 3,000 | 3,007,410 |
| Colorado Health Facilities Authority, (CommonSpirit Health), 5.25%, 11/1/52 | | 1,000 | 979,830 |
| Delaware Health Facilities Authority, (Beebe Medical Center): | | | |
| 5.00%, 6/1/36 | | 3,730 | 3,757,900 |
| 5.00%, 6/1/37 | | 1,000 | 1,001,230 |
11
See Notes to Financial Statements.
Eaton Vance
AMT-Free Municipal Income Fund
September 30, 2023
Portfolio of Investments — continued
| Security | Principal
Amount
(000's omitted) | Value |
| Hospital (continued) |
| Fairfax County Industrial Development Authority, VA, (Inova Health System), 4.00%, 5/15/48 | $ | 2,035 | $ 1,752,461 |
| New York Dormitory Authority, (Northwell Health Obligated Group), 5.00%, 5/1/52 | | 1,475 | 1,472,227 |
| Ohio Higher Educational Facility Commission, (University Hospitals Health System, Inc.), 4.00%, 1/15/39 | | 2,100 | 1,904,700 |
| Tarrant County Cultural Education Facilities Finance Corp., TX, (Cook Children's Medical Center), 5.25%, 12/1/39(1) | | 5,000 | 5,009,100 |
| | | | $ 23,694,408 |
| Housing — 2.5% |
| Cuyahoga Metropolitan Housing Authority, OH, Social Bonds, 2.00%, 12/1/31 | $ | 1,250 | $ 1,051,563 |
| Massachusetts Housing Finance Agency, (FHLMC), (FNMA), (GNMA), Social Bonds, 4.95%, 12/1/53 | | 2,500 | 2,455,050 |
| Phoenix Industrial Development Authority, AZ, (Downtown Phoenix Student Housing, LLC - Arizona State University): | | | |
| 5.00%, 7/1/37 | | 500 | 499,465 |
| 5.00%, 7/1/42 | | 1,250 | 1,207,112 |
| Texas Student Housing Corp., (University of North Texas), 9.375%, 7/1/06(2) | | 285 | 285,000 |
| | | | $ 5,498,190 |
| Insured - Education — 0.8% |
| Virginia College Building Authority, (Washington and Lee University), (NPFG), 5.25%, 1/1/31 | $ | 1,750 | $ 1,857,940 |
| | | | $ 1,857,940 |
| Insured - Electric Utilities — 1.6% |
| Ohio Municipal Electric Generation Agency, (NPFG), 0.00%, 2/15/29 | $ | 2,865 | $ 2,281,600 |
| Omaha Public Power District, NE, (AGM), 4.00%, 2/1/51 | | 1,375 | 1,199,674 |
| | | | $ 3,481,274 |
| Insured - General Obligations — 2.4% |
| McCamey Independent School District, TX, (AGM), 4.00%, 2/15/53 | $ | 3,500 | $ 2,914,625 |
| McCook, IL: | | | |
| (AGM), 4.00%, 12/1/29 | | 240 | 241,644 |
| (AGM), 4.00%, 12/1/30 | | 200 | 200,894 |
| (AGM), 4.00%, 12/1/33 | | 450 | 450,549 |
| (AGM), 4.00%, 12/1/34 | | 190 | 187,752 |
| Security | Principal
Amount
(000's omitted) | Value |
| Insured - General Obligations (continued) |
| Proviso Township High School District No. 209, IL, (AGM), 4.00%, 12/1/38 | $ | 1,500 | $ 1,379,430 |
| | | | $ 5,374,894 |
| Insured - Lease Revenue/Certificates of Participation — 2.8% |
| Anaheim Public Financing Authority, CA, (Anaheim Public Improvements), (AGM), 0.00%, 9/1/31 | $ | 8,680 | $ 6,154,814 |
| | | | $ 6,154,814 |
| Insured - Other Revenue — 0.5% |
| Hudson Yards Infrastructure Corp., NY, (AGM), 4.00%, 2/15/47 | $ | 1,155 | $ 1,038,045 |
| | | | $ 1,038,045 |
| Insured - Special Tax Revenue — 6.8% |
| Harris County-Houston Sports Authority, TX, (AGM), (NPFG), 0.00%, 11/15/34 | $ | 10,600 | $ 5,867,524 |
| Massachusetts, Dedicated Tax Revenue: | | | |
| (NPFG), 5.50%, 1/1/27 | | 6,000 | 6,333,900 |
| (NPFG), 5.50%, 1/1/30 | | 2,565 | 2,810,470 |
| | | | $ 15,011,894 |
| Insured - Transportation — 6.9% |
| E-470 Public Highway Authority, CO, (NPFG), 0.00%, 9/1/39 | $ | 7,120 | $ 3,160,995 |
| Pennsylvania Turnpike Commission, (AGM), 6.375%, 12/1/38 | | 11,000 | 11,950,950 |
| | | | $ 15,111,945 |
| Insured - Water and Sewer — 0.9% |
| Michigan Finance Authority, (Detroit Water and Sewerage Department): | | | |
| (AGM), 5.00%, 7/1/32 | $ | 655 | $ 658,871 |
| (AGM), 5.00%, 7/1/33 | | 565 | 568,339 |
| (AGM), 5.00%, 7/1/35 | | 280 | 281,350 |
| (AGM), 5.00%, 7/1/37 | | 565 | 566,571 |
| | | | $ 2,075,131 |
| Lease Revenue/Certificates of Participation — 4.7% |
| Maryland Stadium Authority, Built to Learn Revenue, 4.00%, 6/1/52 | $ | 2,550 | $ 2,181,015 |
| New Jersey Economic Development Authority, (Portal North Bridge), 5.25%, 11/1/47 | | 4,000 | 4,144,320 |
12
See Notes to Financial Statements.
Eaton Vance
AMT-Free Municipal Income Fund
September 30, 2023
Portfolio of Investments — continued
| Security | Principal
Amount
(000's omitted) | Value |
| Lease Revenue/Certificates of Participation (continued) |
| New Jersey Transportation Trust Fund Authority, (Transportation Program), 5.00%, 6/15/50 | $ | 2,500 | $ 2,506,375 |
| New Jersey Transportation Trust Fund Authority, (Transportation System), 4.00%, 6/15/36 | | 1,665 | 1,596,618 |
| | | | $ 10,428,328 |
| Other Revenue — 3.1% |
| Black Belt Energy Gas District, AL, (Liq: Royal Bank of Canada), 4.00% to 12/1/31 (Put Date), 6/1/51 | $ | 2,500 | $ 2,358,800 |
| Buckeye Tobacco Settlement Financing Authority, OH, 5.00%, 6/1/55 | | 1,605 | 1,384,585 |
| California Community Choice Financing Authority, Clean Energy Project Revenue, Green Bonds, 5.00% to 8/1/29 (Put Date), 12/1/53 | | 750 | 755,730 |
| Central Falls Detention Facility Corp., RI, 7.25%, 7/15/35(2) | | 1,200 | 216,000 |
| Golden State Tobacco Securitization Corp., CA, 5.00%, 6/1/51 | | 640 | 650,247 |
| Main Street Natural Gas, Inc., GA, Gas Supply Revenue, 5.00% to 12/1/30 (Put Date), 12/1/54 | | 1,500 | 1,486,860 |
| | | | $ 6,852,222 |
| Senior Living/Life Care — 3.3% |
| California Public Finance Authority, (Enso Village), Green Bonds, 2.375%, 11/15/28(3) | $ | 140 | $ 133,056 |
| Manhattan, KS, (Meadowlark Hills), 4.00%, 6/1/46 | | 1,150 | 800,895 |
| National Finance Authority, NH, (The Vista): | | | |
| 5.25%, 7/1/39(3) | | 265 | 230,266 |
| 5.625%, 7/1/46(3) | | 360 | 309,859 |
| 5.75%, 7/1/54(3) | | 775 | 659,184 |
| New Hope Cultural Education Facilities Finance Corp., TX, (The Outlook at Windhaven), 6.75%, 10/1/52 | | 1,000 | 856,850 |
| Pompano Beach, FL, (John Knox Village), 4.00%, 9/1/41 | | 1,270 | 992,264 |
| Saint Louis County Industrial Development Authority, MO, (St. Andrew's Resources for Seniors Obligated Group), 5.00%, 12/1/35 | | 1,700 | 1,555,959 |
| Washington Housing Finance Commission, (Horizon House), 5.00%, 1/1/30(3) | | 1,730 | 1,628,795 |
| Washington Housing Finance Commission, (Transforming Age), 5.00%, 1/1/34(3) | | 245 | 213,466 |
| | | | $ 7,380,594 |
| Special Tax Revenue — 10.2% |
| Connecticut, Special Tax Obligation, (Transportation Infrastructure), 5.25%, 7/1/42 | $ | 2,250 | $ 2,390,963 |
| Dallas Area Rapid Transit, TX, Sales Tax Revenue, 4.00%, 12/1/51 | | 2,500 | 2,143,925 |
| Security | Principal
Amount
(000's omitted) | Value |
| Special Tax Revenue (continued) |
| Massachusetts Bay Transportation Authority, Sales Tax Revenue, 4.00%, 7/1/51 | $ | 1,405 | $ 1,229,516 |
| Metropolitan Pier and Exposition Authority, IL, (McCormick Place Expansion), 4.00%, 6/15/50 | | 5,000 | 4,057,200 |
| New York City Transitional Finance Authority, NY, Future Tax Revenue: | | | |
| 4.00%, 5/1/39 | | 1,000 | 937,030 |
| 4.00%, 5/1/45 | | 2,795 | 2,504,627 |
| 5.00%, 11/1/46(1) | | 2,000 | 2,041,060 |
| New York Dormitory Authority, Personal Income Tax Revenue, 4.00%, 2/15/39 | | 3,000 | 2,815,590 |
| New York Thruway Authority, Personal Income Tax Revenue, 4.00%, 3/15/44 | | 1,000 | 897,000 |
| Puerto Rico Sales Tax Financing Corp.: | | | |
| 0.00%, 7/1/51 | | 4,500 | 839,295 |
| 5.00%, 7/1/58 | | 2,817 | 2,555,244 |
| | | | $ 22,411,450 |
| Transportation — 6.3% |
| Atlanta, GA, Airport Revenue, Green Bonds, 5.00%, 7/1/48 | $ | 2,000 | $ 2,061,660 |
| Charlotte, NC, (Charlotte Douglas International Airport), 5.00%, 7/1/48(1) | | 2,000 | 2,061,660 |
| Dallas and Fort Worth, TX, (Dallas/Fort Worth International Airport): | | | |
| 5.25%, 11/1/30 | | 1,100 | 1,100,946 |
| 5.25%, 11/1/31 | | 1,455 | 1,456,251 |
| Denver City and County, CO, Airport System Revenue, 5.25%, 11/15/53 | | 2,000 | 2,094,820 |
| Metropolitan Transportation Authority, NY, Green Bonds, 4.75%, 11/15/45 | | 225 | 209,813 |
| New Jersey Turnpike Authority, 5.25%, 1/1/52 | | 1,000 | 1,040,150 |
| New York Transportation Development Corp., (Terminal 4 John F. Kennedy International Airport), 4.00%, 12/1/42 | | 2,400 | 2,083,800 |
| South Jersey Transportation Authority, NJ, 4.625%, 11/1/47 | | 1,500 | 1,381,950 |
| Texas Transportation Commission, 0.00%, 8/1/40 | | 1,000 | 387,590 |
| | | | $ 13,878,640 |
| Water and Sewer — 4.4% |
| Austin, TX, Water and Wastewater System Revenue, 5.00%, 11/15/41 | $ | 2,715 | $ 2,823,329 |
| New York City Municipal Water Finance Authority, NY, (Water and Sewer System): | | | |
| 4.00%, 6/15/41 | | 4,500 | 4,164,390 |
| 4.00%, 6/15/51 | | 2,000 | 1,739,160 |
13
See Notes to Financial Statements.
Eaton Vance
AMT-Free Municipal Income Fund
September 30, 2023
Portfolio of Investments — continued
| Security | Principal
Amount
(000's omitted) | Value |
| Water and Sewer (continued) |
| New York City Municipal Water Finance Authority, NY, (Water and Sewer System): (continued) | | | |
| 5.25%, 6/15/52(1) | $ | 1,000 | $ 1,043,900 |
| | | | $ 9,770,779 |
Total Tax-Exempt Municipal Obligations
(identified cost $228,694,776) | | | $ 221,766,518 |
Total Investments — 101.0%
(identified cost $229,659,764) | | | $ 222,657,964 |
| Other Assets, Less Liabilities — (1.0)% | | | $ (2,217,169) |
| Net Assets — 100.0% | | | $ 220,440,795 |
| The percentage shown for each investment category in the Portfolio of Investments is based on net assets. |
| (1) | Security represents the municipal bond held by a trust that issues residual interest bonds (see Note 1H). |
| (2) | Defaulted security. Issuer has defaulted on the payment of interest and/or principal or has filed for bankruptcy. |
| (3) | Security exempt from registration under Rule 144A of the Securities Act of 1933, as amended. These securities may be sold in certain transactions in reliance on an exemption from registration (normally to qualified institutional buyers). At September 30, 2023, the aggregate value of these securities is $3,174,626 or 1.4% of the Fund's net assets. |
| At September 30, 2023, the concentration of the Fund’s investments in the various states and territories, determined as a percentage of net assets, is as follows: |
| Texas | 21.9% |
| New York | 13.1% |
| Others, representing less than 10% individually | 66.0% |
| The Fund invests primarily in debt securities issued by municipalities. The ability of the issuers of the debt securities to meet their obligations may be affected by economic developments in a specific industry or municipality. At September 30, 2023, 22.5% of total investments are backed by bond insurance of various financial institutions and financial guaranty assurance agencies. The aggregate percentage insured by an individual financial institution or financial guaranty assurance agency ranged from 10.0% to 15.1% of total investments. |
| Abbreviations: |
| AGM | – Assured Guaranty Municipal Corp. |
| FHLMC | – Federal Home Loan Mortgage Corp. |
| FNMA | – Federal National Mortgage Association |
| GNMA | – Government National Mortgage Association |
| Liq | – Liquidity Provider |
| NPFG | – National Public Finance Guarantee Corp. |
| PSF | – Permanent School Fund |
14
See Notes to Financial Statements.
Eaton Vance
National Municipal Income Fund
September 30, 2023
| Security | Principal
Amount
(000's omitted) | Value |
| Education — 0.6% |
| Chapman University, 1.867%, 4/1/29 | $ | 5,160 | $ 4,238,593 |
| Grand Canyon University, 4.125%, 10/1/24 | | 20,000 | 19,140,000 |
| | | | $ 23,378,593 |
| Hospital — 0.6% |
| Sutter Health, 5.164%, 8/15/33 | $ | 14,000 | $ 13,449,453 |
| UPMC, 1.803%, 4/15/26 | | 7,650 | 6,910,604 |
| | | | $ 20,360,057 |
Total Corporate Bonds
(identified cost $42,927,237) | | | $ 43,738,650 |
| Tax-Exempt Municipal Obligations — 93.6% |
| Security | Principal
Amount
(000's omitted) | Value |
| Bond Bank — 0.6% |
| New York State Environmental Facilities Corp., (State Revolving Fund), Green Bonds, 5.00%, 9/15/47(1) | $ | 10,000 | $ 10,385,900 |
| Rickenbacker Port Authority, OH, (OASBO Expanded Asset Pooled Financing Program), 5.375%, 1/1/32 | | 9,850 | 10,592,198 |
| | | | $ 20,978,098 |
| Cogeneration — 0.1% |
| Northampton County Industrial Development Authority, PA, (Northampton Generating), (AMT), 5.00%, 12/31/23(2) | $ | 14,652 | $ 2,637,417 |
| | | | $ 2,637,417 |
| Education — 4.9% |
| California Educational Facilities Authority, (Stanford University), Sustainability Bonds, 5.00%, 4/1/51 | $ | 10,000 | $ 10,742,400 |
| Florida Development Finance Corp., (River City Science Academy), 4.00%, 7/1/45 | | 45 | 34,937 |
| Maryland Health and Higher Educational Facilities Authority, (Pooled Loan Program), (LOC: TD Bank, N.A.), 3.80%, 4/1/35(3) | | 2,000 | 2,000,000 |
| Massachusetts Development Finance Agency, (Boston University), 5.00%, 10/1/46 | | 11,855 | 11,988,132 |
| Massachusetts Development Finance Agency, (Harvard University), 4.00%, 7/15/36 | | 7,000 | 7,030,730 |
| Minnesota Higher Education Facilities Authority, (Carleton College), 5.00%, 3/1/48 | | 2,815 | 2,906,009 |
| Security | Principal
Amount
(000's omitted) | Value |
| Education (continued) |
| New York Dormitory Authority, (New York University), 5.00%, 7/1/49 | $ | 14,360 | $ 14,589,329 |
| Pennsylvania Higher Educational Facilities Authority, (University of Pennsylvania), 4.00%, 2/15/43 | | 5,000 | 4,552,000 |
| Pennsylvania State University, 4.00%, 9/1/50 | | 5,920 | 5,207,824 |
| Philadelphia Authority for Industrial Development, PA, (Temple University), 5.00%, 4/1/45 | | 5,000 | 5,004,550 |
| San Antonio Education Facilities Corp., TX, (University of the Incarnate Word), 4.00%, 4/1/54 | | 3,500 | 2,593,185 |
| University of California: | | | |
| 5.25%, 5/15/37 | | 11,000 | 11,056,210 |
| 5.25%, 5/15/38 | | 7,700 | 7,731,878 |
| University of California Medical Center, 5.00%, 5/15/47 | | 28,170 | 29,138,766 |
| University of Massachusetts Building Authority, 5.00%, 11/1/52 | | 20,000 | 20,588,600 |
| University of Oregon, 5.00%, 4/1/50 | | 12,500 | 12,746,250 |
| University of Texas, 4.00%, 7/1/42 | | 4,900 | 4,474,680 |
| University of Utah, 5.00%, 8/1/44 | | 12,240 | 12,487,860 |
| Utah Board of Higher Education, (Dixie State University), 4.00%, 6/1/44 | | 7,645 | 6,744,113 |
| Vermont Educational and Health Buildings Financing Agency, (Middlebury College): | | | |
| 4.00%, 11/1/50 | | 5,000 | 4,398,000 |
| 5.00%, 11/1/52 | | 3,410 | 3,492,079 |
| | | | $ 179,507,532 |
| Electric Utilities — 2.8% |
| Colorado Springs, CO, Utilities System Revenue, (SPA: TD Bank, N.A.), 4.05%, 11/1/37(3) | $ | 9,530 | $ 9,530,000 |
| Douglas County Public Utility District No. 1, WA, 3.00%, 9/1/52 | | 16,020 | 10,778,897 |
| Long Island Power Authority, NY, Electric System Revenue, Green Bonds, 5.00%, 9/1/48 | | 5,000 | 5,137,000 |
| New York Power Authority, Green Bonds, 4.00%, 11/15/50 | | 5,000 | 4,435,850 |
| Omaha Public Power District, NE, 5.00%, 2/1/47 | | 20,000 | 20,621,774 |
| Philadelphia, PA, Gas Works Revenue: | | | |
| (LOC: TD Bank, N.A.), 3.85%, 8/1/31(3) | | 7,700 | 7,700,000 |
| (LOC: TD Bank, N.A.), 3.85%, 8/1/31(3) | | 10,900 | 10,900,000 |
| (LOC: TD Bank, N.A.), 3.85%, 8/1/31(3) | | 4,610 | 4,610,000 |
| Seattle, WA, Municipal Light and Power Improvement Revenue, 4.00%, 7/1/43 | | 8,210 | 7,511,083 |
| South Carolina Public Service Authority, 5.00%, 12/1/46 | | 12,600 | 12,278,574 |
| Utility Debt Securitization Authority, NY, 5.00%, 12/15/33 | | 10,000 | 10,174,500 |
| | | | $ 103,677,678 |
15
See Notes to Financial Statements.
Eaton Vance
National Municipal Income Fund
September 30, 2023
Portfolio of Investments — continued
| Security | Principal
Amount
(000's omitted) | Value |
| Escrowed/Prerefunded — 0.9% |
| Los Angeles Department of Airports, CA, (Los Angeles International Airport), (AMT), Prerefunded 11/15/31, 5.00%, 5/15/46 | $ | 65 | $ 68,958 |
| New Jersey Economic Development Authority, (School Facilities Construction): | | | |
| Prerefunded to 12/15/28, 5.00%, 6/15/34 | | 8,460 | 9,097,292 |
| Prerefunded to 12/15/28, 5.00%, 6/15/35 | | 13,300 | 14,301,889 |
| Southwestern Illinois Development Authority, (Memorial Group, Inc.), Prerefunded to 11/1/23, 7.25%, 11/1/33 | | 9,170 | 9,189,624 |
| | | | $ 32,657,763 |
| General Obligations — 19.0% |
| Alamo Community College District, TX, 4.50%, 8/15/47 | $ | 4,000 | $ 3,909,520 |
| Austin Independent School District, TX, 5.00%, 8/1/48 | | 5,000 | 5,107,550 |
| Bar Harbor, ME, 5.00%, 10/15/41 | | 2,330 | 2,476,883 |
| Beaverton School District No. 48J, OR, 5.00%, 6/15/52 | | 15,000 | 15,334,800 |
| California: | | | |
| 4.00%, 9/1/43 | | 9,000 | 8,617,410 |
| 5.00%, 9/1/36 | | 10,000 | 10,941,500 |
| 5.00%, 9/1/37 | | 10,000 | 10,840,600 |
| 5.00%, 9/1/38 | | 10,000 | 10,783,700 |
| 5.00%, 11/1/42 | | 25,000 | 26,489,000 |
| 5.25%, 9/1/47 | | 10,500 | 11,206,125 |
| Centennial School District No. 28Jt, OR, 5.00%, 6/15/50 | | 10,000 | 10,281,100 |
| Chicago Board of Education, IL: | | | |
| 5.00%, 12/1/30 | | 9,000 | 9,054,000 |
| 5.00%, 12/1/37 | | 2,500 | 2,432,200 |
| 5.00%, 12/1/42 | | 10,405 | 9,600,381 |
| 5.00%, 12/1/44 | | 20,515 | 18,836,463 |
| Chicago, IL: | | | |
| 4.00%, 1/1/35 | | 2,500 | 2,286,350 |
| 5.00%, 1/1/40 | | 1,500 | 1,489,065 |
| 5.00%, 1/1/44 | | 12,350 | 11,982,958 |
| 5.25%, 1/1/38 | | 6,750 | 6,844,500 |
| 5.50%, 1/1/39 | | 5,000 | 5,141,350 |
| Clark County, NV, 5.00%, 5/1/48 | | 19,650 | 19,971,670 |
| Crowley Independent School District, TX, (PSF Guaranteed), 5.00%, 2/1/48 | | 3,000 | 3,115,620 |
| Denton Independent School District, TX, (PSF Guaranteed), 5.00%, 8/15/48 | | 12,545 | 13,148,916 |
| District of Columbia, 4.00%, 2/1/46 | | 17,450 | 15,767,645 |
| Forney Independent School District, TX, (PSF Guaranteed), 5.00%, 8/15/48 | | 5,000 | 5,132,900 |
| Fort Worth Independent School District, TX, (PSF Guaranteed), 5.00%, 2/15/47 | | 7,000 | 7,108,220 |
| Security | Principal
Amount
(000's omitted) | Value |
| General Obligations (continued) |
| Galveston Independent School District, TX, (PSF Guaranteed), 4.00%, 2/1/47 | $ | 16,500 | $ 14,567,355 |
| Hacienda La Puente Unified School District, CA, (Election of 2016), 5.00%, 8/1/47(4) | | 8,265 | 8,551,465 |
| Harris County Flood Control District, TX: | | | |
| Sustainability Bonds, 4.00%, 9/15/48 | | 10,000 | 8,773,400 |
| Sustainability Bonds, 4.25%, 10/1/47 | | 10,940 | 10,159,103 |
| Hays Consolidated Independent School District, TX, (PSF Guaranteed), 5.00%, 2/15/48 | | 10,855 | 11,138,098 |
| Hermiston School District No. 8R, OR: | | | |
| 0.00%, 6/15/42 | | 6,475 | 2,419,708 |
| 0.00%, 6/15/45 | | 4,595 | 1,437,776 |
| Illinois: | | | |
| 4.00%, 7/1/37 | | 15,000 | 13,541,850 |
| 5.00%, 11/1/24 | | 11,295 | 11,388,861 |
| 5.00%, 2/1/27 | | 18,500 | 18,507,215 |
| 5.00%, 2/1/29 | | 15,000 | 15,386,850 |
| 5.00%, 5/1/39 | | 10,000 | 9,616,400 |
| 5.50%, 5/1/39 | | 870 | 908,150 |
| 5.50%, 3/1/42 | | 11,700 | 12,215,619 |
| 5.75%, 5/1/45 | | 890 | 928,350 |
| Klein Independent School District, TX, (PSF Guaranteed), 4.00%, 8/1/48 | | 7,175 | 6,309,695 |
| Massachusetts, 3.00%, 4/1/49 | | 10,000 | 6,941,400 |
| New York, 5.00%, 3/15/40(4) | | 4,865 | 5,192,609 |
| New York, NY: | | | |
| 4.00%, 8/1/38 | | 11,520 | 10,886,170 |
| 4.00%, 9/1/46 | | 10,000 | 8,816,700 |
| 4.00%, 4/1/50 | | 5,000 | 4,333,800 |
| 4.17%, 4/1/42(5) | | 1,700 | 1,700,000 |
| 5.00%, 8/1/47 | | 22,350 | 22,707,823 |
| 5.25%, 5/1/42 | | 3,335 | 3,503,117 |
| 5.25%, 4/1/47 | | 5,000 | 5,208,000 |
| (SPA: Barclays Bank PLC), 4.80%, 10/1/46(5) | | 7,000 | 7,000,000 |
| (SPA: JPMorgan Chase Bank, N.A.), 4.75%, 3/1/40(5) | | 6,095 | 6,095,000 |
| Northwest Independent School District, TX, (PSF Guaranteed), 5.00%, 2/15/48 | | 20,000 | 20,591,600 |
| Norwalk, CT, 4.00%, 8/15/47 | | 10,000 | 8,818,500 |
| Norwood, MA, 4.00%, 9/15/47 | | 11,065 | 9,910,810 |
| Pasadena Independent School District, TX, (PSF Guaranteed): | | | |
| 4.00%, 2/15/52 | | 10,000 | 8,697,400 |
| 5.00%, 2/15/48(4) | | 5,000 | 5,109,050 |
| Prosper Independent School District, TX, (PSF Guaranteed), 4.00%, 2/15/52 | | 8,000 | 6,975,600 |
16
See Notes to Financial Statements.
Eaton Vance
National Municipal Income Fund
September 30, 2023
Portfolio of Investments — continued
| Security | Principal
Amount
(000's omitted) | Value |
| General Obligations (continued) |
| Puerto Rico: | | | |
| 4.00%, 7/1/41 | $ | 7,500 | $ 6,051,600 |
| 5.625%, 7/1/29 | | 10,762 | 11,136,478 |
| 5.75%, 7/1/31 | | 13,891 | 14,533,590 |
| Rice County, MN, 4.00%, 2/1/52 | | 7,170 | 6,223,560 |
| Royse City Independent School District, TX, (PSF Guaranteed), 5.00%, 2/15/48(1) | | 12,000 | 12,389,160 |
| San Antonio Independent School District, TX, (PSF Guaranteed), 5.00%, 8/15/47 | | 10,000 | 10,310,900 |
| San Diego Unified School District, CA, (Election of 2022), Sustainability Bonds, 4.00%, 7/1/53(4) | | 8,500 | 7,793,395 |
| San Luis Coastal Unified School District, CA, (Election of 2022), 4.00%, 8/1/46 | | 11,230 | 10,413,018 |
| Santa Clarita Community College District, CA, (Election of 2016), 5.25%, 8/1/48 | | 10,000 | 10,496,600 |
| Spring Branch Independent School District, TX, (PSF Guaranteed), 4.50%, 2/1/47 | | 8,750 | 8,443,138 |
| Temple Independent School District, TX, (PSF Guaranteed), 4.25%, 2/1/47 | | 13,000 | 11,967,930 |
| Waco Independent School District, TX, (PSF Guaranteed), 4.125%, 8/15/47 | | 6,000 | 5,394,120 |
| Washington: | | | |
| 5.00%, 6/1/40 | | 5,350 | 5,512,052 |
| 5.00%, 6/1/41 | | 5,465 | 5,631,792 |
| 5.00%, 6/1/42 | | 5,950 | 6,101,904 |
| Waxahachie Independent School District, TX, (PSF Guaranteed), 5.00%, 2/15/48 | | 10,000 | 10,303,500 |
| Wisconsin, 4.00%, 5/1/41 | | 7,090 | 6,640,990 |
| Ysleta Independent School District, TX, (PSF Guaranteed): | | | |
| 4.25%, 8/15/56 | | 11,000 | 9,942,790 |
| 5.00%, 8/15/56(1) | | 5,000 | 5,069,650 |
| | | | $ 700,594,067 |
| Hospital — 11.7% |
| Brevard County Health Facilities Authority, FL, (Health First Obligated Group): | | | |
| 5.00%, 4/1/47 | $ | 10,000 | $ 9,664,300 |
| 5.00%, 4/1/52 | | 10,000 | 9,573,900 |
| California Health Facilities Financing Authority, (Cedars-Sinai Health System): | | | |
| 4.00%, 8/15/48 | | 19,305 | 17,333,766 |
| 5.00%, 8/15/51 | | 13,845 | 14,147,790 |
| California Health Facilities Financing Authority, (Cedars-Sinai Medical Center), 4.00%, 8/15/36 | | 10,000 | 9,617,900 |
| Charlotte-Mecklenburg Hospital Authority, NC, (Atrium Health), (SPA: JPMorgan Chase Bank, N.A.), 4.65%, 1/15/48(5) | | 3,500 | 3,500,000 |
| Security | Principal
Amount
(000's omitted) | Value |
| Hospital (continued) |
| Colorado Health Facilities Authority, (AdventHealth Obligated Group): | | | |
| 3.00%, 11/15/51 | $ | 10,000 | $ 6,660,500 |
| 4.00%, 11/15/43 | | 12,145 | 10,949,325 |
| 4.00%, 11/15/50 | | 6,530 | 5,486,180 |
| Colorado Health Facilities Authority, (Adventist Health System/Sunbelt Obligated Group), 4.00%, 11/15/46 | | 9,715 | 8,523,067 |
| Connecticut Health and Educational Facilities Authority, (Trinity Health Corp.), 5.00%, 12/1/41 | | 5,295 | 5,314,697 |
| Fairfax County Industrial Development Authority, VA, (Inova Health System), 4.00%, 5/15/48 | | 13,055 | 11,242,444 |
| Geisinger Authority, PA, (Geisinger Health System): | | | |
| 4.00%, 6/1/41 | | 8,000 | 7,232,080 |
| 4.00%, 2/15/47 | | 9,105 | 7,826,931 |
| Greenville Health System, SC, 5.00%, 5/1/39 | | 2,500 | 2,318,700 |
| Harris County Cultural Education Facilities Finance Corp., TX, (Texas Children's Hospital), 4.00%, 10/1/47 | | 10,805 | 9,384,034 |
| Illinois Finance Authority, (Northwestern Memorial HealthCare), 4.00%, 7/15/47 | | 12,500 | 10,823,375 |
| Illinois Finance Authority, (Presence Health Network), 5.00%, 2/15/26 | | 7,500 | 7,672,200 |
| Indiana Finance Authority, (Franciscan Alliance, Inc.), 5.00%, 11/1/41 | | 5,000 | 5,003,700 |
| Lancaster County Hospital Authority, PA, (Penn State Health), 5.00%, 11/1/46 | | 10,500 | 10,341,765 |
| Lehigh County General Purpose Authority, PA, (Lehigh Valley Health Network), 4.00%, 7/1/49 | | 5,000 | 4,200,750 |
| Maricopa County Industrial Development Authority, AZ, (Banner Health), Series 2019-E, 4.00%, 1/1/45 | | 9,000 | 7,891,920 |
| Maryland Health and Higher Educational Facilities Authority, (MedStar Health), 5.00%, 8/15/42 | | 11,900 | 11,822,055 |
| Massachusetts Development Finance Agency, (Partners HealthCare System), 4.00%, 7/1/41 | | 8,500 | 7,795,690 |
| Massachusetts Health and Educational Facilities Authority, (Partners HealthCare System), (LOC: TD Bank, N.A.), 3.85%, 7/1/40(3) | | 7,060 | 7,060,000 |
| Michigan Finance Authority, (Beaumont Health Credit Group), 5.00%, 11/1/44 | | 22,760 | 22,534,904 |
| Michigan Finance Authority, (Henry Ford Health System), 4.00%, 11/15/50 | | 11,795 | 9,803,650 |
| Michigan Finance Authority, (Trinity Health Credit Group): | | | |
| 4.00%, 12/1/45 | | 10,000 | 8,741,500 |
| 4.00%, 12/1/49 | | 5,645 | 4,788,879 |
| 5.00%, 12/1/41 | | 5,395 | 5,396,565 |
| Minneapolis, MN, (Allina Health System), 4.00%, 11/15/39 | | 6,405 | 5,883,313 |
17
See Notes to Financial Statements.
Eaton Vance
National Municipal Income Fund
September 30, 2023
Portfolio of Investments — continued
| Security | Principal
Amount
(000's omitted) | Value |
| Hospital (continued) |
| Missouri Health and Educational Facilities Authority, (BJC Health System): | | | |
| 4.00%, 1/1/45 | $ | 9,475 | $ 8,419,959 |
| 5.00%, 1/1/44 | | 6,000 | 6,002,640 |
| Missouri Health and Educational Facilities Authority, (Children's Mercy Hospital), 4.00%, 5/15/48 | | 15,475 | 13,004,571 |
| Missouri Health and Educational Facilities Authority, (CoxHealth): | | | |
| 4.00%, 11/15/49 | | 10,750 | 9,108,152 |
| 5.00%, 11/15/38 | | 4,340 | 4,257,453 |
| Missouri Health and Educational Facilities Authority, (SSM Health), 5.00% to 6/1/28 (Put Date), 6/1/39 | | 3,000 | 3,105,240 |
| New Jersey Health Care Facilities Financing Authority, (Virtua Health), (LOC: TD Bank, N.A.), 3.85%, 7/1/43(3) | | 5,000 | 5,000,000 |
| New York Dormitory Authority, (Northwell Health Obligated Group), 5.00%, 5/1/52 | | 11,795 | 11,772,825 |
| Norfolk Economic Development Authority, VA, (Sentara Healthcare), 4.00%, 11/1/48 | | 6,100 | 5,372,941 |
| Oregon Facilities Authority, (Samaritan Health Services), 5.00%, 10/1/35 | | 2,260 | 2,274,351 |
| Oregon Health and Science University, Green Bonds, 4.00%, 7/1/51 | | 4,035 | 3,514,687 |
| Pennsylvania Higher Educational Facilities Authority, (University of Pennsylvania Health System): | | | |
| 4.00%, 8/15/38 | | 2,000 | 1,896,100 |
| 4.00%, 8/15/42 | | 5,010 | 4,559,551 |
| Salem Hospital Facility Authority, OR, (Salem Health), 5.00%, 5/15/44 | | 11,620 | 11,211,673 |
| South Carolina Jobs-Economic Development Authority, (Anmed Health), 4.25%, 2/1/48 | | 6,000 | 5,386,800 |
| South Carolina Jobs-Economic Development Authority, (Bon Secours Mercy Health, Inc.), 4.00%, 12/1/44 | | 5,520 | 4,830,552 |
| South Dakota Health and Educational Facilities Authority, (Sanford Health), 5.00%, 11/1/44 | | 10,000 | 9,685,000 |
| Southcentral Pennsylvania General Authority, (WellSpan Health Obligated Group), 4.00%, 6/1/49 | | 5,000 | 4,234,450 |
| Tampa, FL, (Baycare Obligated Group), 4.00%, 11/15/46 | | 5,715 | 4,935,474 |
| Tarrant County Cultural Education Facilities Finance Corp., TX, (Baylor Scott & White Health), 5.00%, 11/15/45 | | 8,000 | 8,020,800 |
| Utah County, UT, (IHC Health Services, Inc.), 4.00%, 5/15/47 | | 8,565 | 7,469,451 |
| Washington Health Care Facilities Authority, (Seattle Children's Hospital), 4.00%, 10/1/45 | | 5,000 | 4,311,200 |
| Wisconsin Health and Educational Facilities Authority, (Ascension Health Alliance Senior Credit Group), 4.00%, 11/15/43 | | 4,625 | 4,007,331 |
| Security | Principal
Amount
(000's omitted) | Value |
| Hospital (continued) |
| Wisconsin Health and Educational Facilities Authority, (Ascension Senior Credit Group): | | | |
| 4.00%, 11/15/39 | $ | 5,000 | $ 4,582,150 |
| 4.00%, 11/15/46 | | 8,600 | 7,301,228 |
| Wisconsin Health and Educational Facilities Authority, (Children's Hospital of Wisconsin, Inc.), 4.00%, 8/15/42 | | 10,000 | 8,905,400 |
| | | | $ 431,705,859 |
| Housing — 1.9% |
| California Community Housing Agency, (Summit at Sausalito Apartments), 3.00%, 2/1/57(6) | $ | 4,355 | $ 2,676,583 |
| CSCDA Community Improvement Authority, CA, (City of Orange Portfolio), Essential Housing Revenue, Social Bonds, 3.00%, 3/1/57(6) | | 25,275 | 15,769,325 |
| CSCDA Community Improvement Authority, CA, (Pasadena Portfolio), Essential Housing Revenue, Social Bonds, 3.00%, 12/1/56(6) | | 9,930 | 6,162,558 |
| Indiana Finance Authority, (CHF-Tippecanoe, LLC - Student Housing), 5.00%, 6/1/53 | | 2,300 | 2,205,079 |
| Maryland Economic Development Corp., (Morgan State University), Student Housing Revenue: | | | |
| 5.00%, 7/1/56 | | 1,750 | 1,689,747 |
| 5.75%, 7/1/53 | | 2,000 | 2,087,740 |
| Massachusetts Housing Finance Agency, (Mill Road Apartments), 4.53%, (SIFMA + 0.55%), 11/1/23 (Put Date), 11/1/48(7) | | 3,890 | 3,890,000 |
| Missouri Housing Development Commission, SFMR: | | | |
| (FHLMC), (FNMA), (GNMA), 3.30%, 12/1/47 | | 1,395 | 1,243,246 |
| (FHLMC), (FNMA), (GNMA), 3.40%, 11/1/46 | | 2,332 | 2,152,283 |
| New Mexico Mortgage Finance Authority, Single Family Mortgage Program, (FHLMC), (FNMA), (GNMA), 4.45%, 9/1/48 | | 1,490 | 1,353,918 |
| New York City Housing Development Corp., NY, 2.60%, 11/1/46 | | 3,000 | 1,899,570 |
| North Carolina Housing Finance Agency, (FHLMC), (FNMA), (GNMA), Social Bonds, 4.35%, 7/1/43 | | 4,000 | 3,736,000 |
| Pennsylvania Housing Finance Agency, SFMR, Social Bonds, 5.00%, 10/1/50 | | 7,335 | 7,049,522 |
| Texas Student Housing Corp., (University of Northern Texas), 6.85%, 7/1/31(8) | | 10,640 | 10,427,200 |
| Utah State University, 4.00%, 4/1/48 | | 10,875 | 9,233,854 |
| | | | $ 71,576,625 |
| Industrial Development Revenue — 2.5% |
| Montgomery County Industrial Development Authority, PA, (Constellation Energy Generation, LLC), 4.10% to 4/3/28 (Put Date), 4/1/53 | $ | 750 | $ 748,170 |
18
See Notes to Financial Statements.
Eaton Vance
National Municipal Income Fund
September 30, 2023
Portfolio of Investments — continued
| Security | Principal
Amount
(000's omitted) | Value |
| Industrial Development Revenue (continued) |
| New York Transportation Development Corp., (Delta Air Lines, Inc. - LaGuardia Airport Terminals C&D Redevelopment): | | | |
| (AMT), 4.375%, 10/1/45 | $ | 31,500 | $ 27,482,805 |
| (AMT), 5.00%, 10/1/40 | | 41,585 | 39,973,166 |
| Pennsylvania Economic Development Financing Authority, (Republic Services, Inc.), (AMT), 4.10% to 10/16/23 (Put Date), 4/1/49 | | 10,000 | 9,997,700 |
| Rockdale County Development Authority, GA, (Pratt Paper, LLC), (AMT), 4.00%, 1/1/38(6) | | 3,350 | 3,082,067 |
| South Carolina Jobs-Economic Development Authority, (International Paper Co.), (AMT), 4.00% to 4/1/26 (Put Date), 4/1/33 | | 5,000 | 4,956,700 |
| Vermont Economic Development Authority, (Casella Waste Systems, Inc.), (AMT), 4.625% to 4/3/28 (Put Date), 4/1/36(6) | | 475 | 464,165 |
| Warren County, MS, (International Paper Co.), 1.375% to 6/16/25 (Put Date), 5/1/34 | | 4,000 | 3,805,360 |
| | | | $ 90,510,133 |
| Insured - Electric Utilities — 0.2% |
| Brownsville, TX, Utility System Revenue, (BAM), 5.00%, 9/1/51 | $ | 1,195 | $ 1,187,065 |
| Garland, TX, Electric Utility System Revenue, (AGM), 4.25%, 3/1/48 | | 1,750 | 1,570,608 |
| Omaha Public Power District, NE, (AGM), 4.00%, 2/1/51 | | 4,080 | 3,559,759 |
| | | | $ 6,317,432 |
| Insured - Escrowed/Prerefunded — 1.0% |
| North Texas Tollway Authority, (AGC), Prerefunded to 1/1/25, 6.20%, 1/1/42 | $ | 37,070 | $ 38,057,174 |
| | | | $ 38,057,174 |
| Insured - General Obligations — 1.0% |
| Clark County School District, NV, (AGM), 4.25%, 6/15/41 | $ | 5,000 | $ 4,709,400 |
| Ellis County Unified School District No. 489, KS, (AGM), 5.00%, 9/1/47 | | 13,600 | 13,732,192 |
| Lumberton Municipal Utility District, TX, (AGM), 3.00%, 8/15/52 | | 5,045 | 3,194,847 |
| Nassau County, NY, (AGM), 5.00%, 4/1/49 | | 10,335 | 10,624,173 |
| Waller Independent School District, TX, (BAM), 4.00%, 2/15/48 | | 5,835 | 4,884,362 |
| | | | $ 37,144,974 |
| Security | Principal
Amount
(000's omitted) | Value |
| Insured - Hospital — 0.0%(9) |
| California Statewide Communities Development Authority, (Enloe Medical Center), (AGM), 5.25%, 8/15/52 | $ | 800 | $ 833,504 |
| | | | $ 833,504 |
| Insured - Lease Revenue/Certificates of Participation — 0.2% |
| Commonwealth Financing Authority, PA, Tobacco Master Settlement Payment Revenue, (AGM), 4.00%, 6/1/39 | $ | 8,000 | $ 7,260,160 |
| | | | $ 7,260,160 |
| Insured - Other Revenue — 0.0%(9) |
| Hudson Yards Infrastructure Corp., NY, (AGM), 4.00%, 2/15/47 | $ | 1,530 | $ 1,375,072 |
| | | | $ 1,375,072 |
| Insured - Special Tax Revenue — 1.5% |
| Harris County-Houston Sports Authority, TX, (AGM), (NPFG), 0.00%, 11/15/34 | $ | 58,155 | $ 32,191,119 |
| Massachusetts, Dedicated Tax Revenue: | | | |
| (NPFG), 5.50%, 1/1/29 | | 11,000 | 11,953,480 |
| (NPFG), 5.50%, 1/1/30 | | 3,080 | 3,374,756 |
| Metropolitan Pier and Exposition Authority, IL, (McCormick Place), (BAM), 4.00%, 12/15/42 | | 10,440 | 9,101,383 |
| | | | $ 56,620,738 |
| Insured - Transportation — 1.1% |
| E-470 Public Highway Authority, CO, (NPFG), 0.00%, 9/1/37 | $ | 13,335 | $ 6,661,099 |
| Houston, TX, Airport System Revenue, (AGM), (AMT), 5.25%, 7/1/48 | | 12,000 | 12,216,240 |
| Kansas City Industrial Development Authority, MO, (Kansas City International Airport Terminal Modernization), (AGM), (AMT), 5.00%, 3/1/49 | | 10,000 | 9,916,700 |
| Love Field Airport Modernization Corp., TX, (AGM), (AMT), 4.00%, 11/1/37 | | 4,000 | 3,677,800 |
| Metropolitan Transportation Authority, NY, Green Bonds, (AGM), 4.00%, 11/15/48 | | 8,900 | 7,784,652 |
| | | | $ 40,256,491 |
| Insured - Water and Sewer — 0.3% |
| Pittsburg Public Financing Authority, CA, Water Revenue, (AGM), 5.00%, 8/1/52 | $ | 10,000 | $ 10,195,900 |
| | | | $ 10,195,900 |
19
See Notes to Financial Statements.
Eaton Vance
National Municipal Income Fund
September 30, 2023
Portfolio of Investments — continued
| Security | Principal
Amount
(000's omitted) | Value |
| Lease Revenue/Certificates of Participation — 3.7% |
| Battery Park City Authority, NY, Sustainability Bonds, 5.00%, 11/1/48 | $ | 12,000 | $ 12,468,720 |
| California Public Works Board, 5.00%, 9/1/35(4) | | 7,000 | 7,729,540 |
| Colorado, Certificates of Participation, 6.00%, 12/15/40 | | 5,045 | 5,722,443 |
| Hampton Roads Transportation Accountability Commission, VA, 4.00%, 7/1/57 | | 5,000 | 4,379,500 |
| Maryland Stadium Authority, Built to Learn Revenue: | | | |
| 4.00%, 6/1/47 | | 5,595 | 4,859,705 |
| 4.00%, 6/1/52 | | 6,255 | 5,349,902 |
| Michigan Building Authority, 5.00%, 10/15/45 | | 7,160 | 7,212,340 |
| New Jersey Economic Development Authority, (Portal North Bridge), 5.25%, 11/1/47 | | 12,700 | 13,158,216 |
| New Jersey Transportation Trust Fund Authority, (Transportation Program): | | | |
| 4.25%, 6/15/44 | | 3,600 | 3,313,692 |
| 5.00%, 6/15/50 | | 20,500 | 20,552,275 |
| 2019 Series AA, 5.25%, 6/15/43 | | 10,000 | 10,188,600 |
| 2019 Series BB, 4.00%, 6/15/50 | | 17,575 | 14,902,721 |
| 2020 Series AA, 4.00%, 6/15/50 | | 15,000 | 13,056,750 |
| 2022 Series CC, 5.25%, 6/15/43 | | 5,750 | 6,012,545 |
| New Jersey Transportation Trust Fund Authority, (Transportation System), 5.00%, 6/15/38 | | 5,000 | 5,229,450 |
| Virginia College Building Authority, (21st Century College and Equipment Programs), 5.00%, 2/1/34 | | 1,735 | 1,913,722 |
| Virginia Port Authority, 5.00%, 7/1/41 | | 1,690 | 1,802,317 |
| | | | $ 137,852,438 |
| Nursing Home — 0.1% |
| Mississippi Business Finance Corp., (Magnolia Healthcare), 7.99%, 7/1/25 | $ | 2,205 | $ 2,207,271 |
| | | | $ 2,207,271 |
| Other Revenue — 3.3% |
| Black Belt Energy Gas District, AL, 5.25% to 10/1/30 (Put Date), 1/1/54 | $ | 11,250 | $ 11,363,625 |
| Buckeye Tobacco Settlement Financing Authority, OH, 5.00%, 6/1/55 | | 38,960 | 33,609,623 |
| Central Falls Detention Facility Corp., RI, 7.25%, 7/15/35(8) | | 250 | 45,000 |
| Cleveland-Cuyahoga County Port Authority, OH, (Playhouse Square Foundation), 5.25%, 12/1/38 | | 750 | 724,838 |
| Golden State Tobacco Securitization Corp., CA, 5.00%, 6/1/51 | | 4,900 | 4,978,449 |
| Kalispel Tribe of Indians, WA: | | | |
| Series A, 5.25%, 1/1/38(6) | | 1,865 | 1,905,899 |
| Series B, 5.25%, 1/1/38(6) | | 1,000 | 1,021,930 |
| Security | Principal
Amount
(000's omitted) | Value |
| Other Revenue (continued) |
| Main Street Natural Gas, Inc., GA, Gas Supply Revenue: | | | |
| 5.00% to 9/1/30 (Put Date), 9/1/53 | $ | 10,000 | $ 10,110,166 |
| 5.00% to 12/1/30 (Put Date), 12/1/54 | | 17,750 | 17,594,510 |
| 5.00% to 6/1/31 (Put Date), 12/1/53 | | 12,500 | 12,649,875 |
| Minnesota Municipal Gas Agency, (Liq: Royal Bank of Canada), 4.558%, (67% of SOFR + 1.00%), 12/1/52(7) | | 12,500 | 12,231,875 |
| Patriots Energy Group Financing Agency, SC, Gas Supply Revenue, 5.25% to 8/1/31 (Put Date), 10/1/54 | | 4,750 | 4,784,010 |
| Texas Municipal Gas Acquisition and Supply Corp. I, Gas Supply Revenue, 6.25%, 12/15/26 | | 11,645 | 11,890,593 |
| | | | $ 122,910,393 |
| Senior Living/Life Care — 1.3% |
| California Public Finance Authority, (Enso Village): | | | |
| Green Bonds, 2.125%, 11/15/27(6) | $ | 1,155 | $ 1,107,876 |
| Green Bonds, 2.375%, 11/15/28(6) | | 970 | 921,888 |
| Clackamas County Hospital Facility Authority, OR, (Rose Villa): | | | |
| 5.25%, 11/15/50 | | 250 | 217,812 |
| 5.375%, 11/15/55 | | 225 | 196,175 |
| New Hope Cultural Education Facilities Finance Corp., TX, (Longhorn Village), 5.00%, 1/1/47 | | 8,000 | 6,687,600 |
| Palm Beach County Health Facilities Authority, FL, (Green Cay Life Plan Village), 11.50%, 7/1/27(6) | | 5,550 | 6,021,528 |
| Palm Beach County Health Facilities Authority, FL, (Toby & Leon Cooperman Sinai Residences of Boca Raton), 4.25%, 6/1/56 | | 4,440 | 3,035,140 |
| Public Finance Authority, WI, (Searstone CCRC), 3.00%, 6/1/28(6) | | 17,410 | 15,821,512 |
| South Carolina Jobs-Economic Development Authority, (Seafields Kiawah Island Project), 5.25%, 11/15/28 | | 10,000 | 9,845,400 |
| Tarrant County Cultural Education Facilities Finance Corp., TX, (MRC Stevenson Oaks): | | | |
| 6.625%, 11/15/41 | | 730 | 657,204 |
| 6.75%, 11/15/51 | | 3,250 | 2,810,600 |
| 6.875%, 11/15/55 | | 200 | 174,114 |
| | | | $ 47,496,849 |
| Special Tax Revenue — 10.0% |
| Central Puget Sound Regional Transit Authority, WA, Sales and Motor Vehicle Excise Tax Revenue: | | | |
| Green Bonds, 4.00%, 11/1/46 | $ | 11,825 | $ 10,505,685 |
| Green Bonds, 5.00%, 11/1/41 | | 13,840 | 14,029,885 |
| Dallas Area Rapid Transit, TX, Sales Tax Revenue: | | | |
| 3.00%, 12/1/47 | | 7,825 | 5,325,617 |
20
See Notes to Financial Statements.
Eaton Vance
National Municipal Income Fund
September 30, 2023
Portfolio of Investments — continued
| Security | Principal
Amount
(000's omitted) | Value |
| Special Tax Revenue (continued) |
Dallas Area Rapid Transit, TX, Sales Tax Revenue:
(continued) | | | |
| 4.00%, 12/1/51 | $ | 3,820 | $ 3,275,917 |
| District of Columbia, Income Tax Revenue, 5.50%, 7/1/47 | | 10,000 | 10,801,100 |
| Houston, TX, Hotel Occupancy Tax and Special Revenue, 3.00%, 9/1/33 | | 140 | 121,374 |
| Los Angeles County Metropolitan Transportation Authority, CA, Sales Tax Revenue, 5.00%, 7/1/44 | | 15,060 | 16,016,762 |
| Massachusetts Bay Transportation Authority, Sales Tax Revenue: | | | |
| 4.00%, 7/1/48 | | 5,405 | 4,811,477 |
| 4.00%, 7/1/51 | | 12,705 | 11,118,145 |
| 5.00%, 7/1/44 | | 9,500 | 9,518,240 |
| Metropolitan Pier and Exposition Authority, IL, (McCormick Place Expansion): | | | |
| 4.00%, 6/15/50 | | 12,060 | 9,785,966 |
| 5.00%, 6/15/50 | | 2,465 | 2,383,113 |
| 5.00%, 6/15/57 | | 2,000 | 1,916,180 |
| Metropolitan Transportation Authority, NY, (Payroll Mobility Tax Revenue), 5.00%, 5/15/52 | | 8,945 | 9,311,208 |
| Michigan Trunk Line Fund: | | | |
| 4.00%, 11/15/45 | | 9,925 | 8,936,669 |
| 5.00%, 11/15/46 | | 18,000 | 18,592,920 |
| New River Community Development District, FL, (Capital Improvements): | | | |
| 5.00%, 5/1/13(8) | | 230 | 0 |
| 5.35%, 5/1/38(8) | | 80 | 0 |
| 5.75%, 5/1/38 | | 325 | 327,359 |
| New York City Transitional Finance Authority, NY, Future Tax Revenue: | | | |
| 4.00%, 11/1/38 | | 5,000 | 4,734,850 |
| 5.00%, 8/1/38 | | 10,000 | 10,121,300 |
| 5.00%, 11/1/46 | | 1,095 | 1,117,480 |
| 5.00%, 11/1/46(1) | | 13,000 | 13,266,890 |
| 5.00%, 5/1/53 | | 10,000 | 10,131,400 |
| (SPA: JPMorgan Chase Bank, N.A.), 4.75%, 11/1/36(5) | | 7,000 | 7,000,000 |
| (SPA: JPMorgan Chase Bank, N.A.), 4.75%, 8/1/39(5) | | 5,100 | 5,100,000 |
| (SPA: JPMorgan Chase Bank, N.A.), 4.75%, 8/1/42(5) | | 7,300 | 7,300,000 |
| (SPA: JPMorgan Chase Bank, N.A.), 4.75%, 2/1/45(5) | | 3,510 | 3,510,000 |
| New York Dormitory Authority, Personal Income Tax Revenue: | | | |
| 4.00%, 3/15/39 | | 10,000 | 9,385,000 |
| 4.00%, 3/15/40 | | 10,000 | 9,303,500 |
| 4.00%, 2/15/47 | | 15,220 | 13,524,796 |
| New York Dormitory Authority, Sales Tax Revenue: | | | |
| 4.00%, 3/15/43 | | 7,500 | 6,758,625 |
| Security | Principal
Amount
(000's omitted) | Value |
| Special Tax Revenue (continued) |
New York Dormitory Authority, Sales Tax Revenue:
(continued) | | | |
| 4.00%, 3/15/49 | $ | 5,000 | $ 4,327,600 |
| 5.00%, 3/15/35 | | 7,840 | 8,004,248 |
| New York State Urban Development Corp., Personal Income Tax Revenue, 5.00%, 3/15/49 | | 25,000 | 25,417,250 |
| New York State Urban Development Corp., Sales Tax Revenue, 4.00%, 3/15/46 | | 4,950 | 4,402,184 |
| New York Thruway Authority, Personal Income Tax Revenue, 4.00%, 3/15/44 | | 5,000 | 4,485,000 |
| Pennsylvania Turnpike Commission, Oil Franchise Tax Revenue, 4.00%, 12/1/51 | | 5,000 | 4,318,100 |
| Puerto Rico Sales Tax Financing Corp.: | | | |
| 0.00%, 7/1/46 | | 19,385 | 5,021,297 |
| 5.00%, 7/1/58 | | 38,291 | 34,733,000 |
| Southeastern Pennsylvania Transportation Authority, 5.25%, 6/1/47 | | 13,000 | 13,593,320 |
| Southern Hills Plantation I Community Development District, FL: | | | |
| Series A1, 5.80%, 5/1/35 | | 380 | 346,849 |
| Series A2, 5.80%, 5/1/35(8) | | 310 | 202,287 |
| Sterling Hill Community Development District, FL, 6.20%, 5/1/35(8) | | 1,532 | 781,140 |
| Triborough Bridge and Tunnel Authority, NY, 5.00%, 5/15/47 | | 8,240 | 8,406,201 |
| Triborough Bridge and Tunnel Authority, NY, Sales Tax Revenue, 4.00%, 5/15/48 | | 5,000 | 4,442,250 |
| Washington Metropolitan Area Transit Authority, D.C., Sustainability Bonds, 5.25%, 7/15/53 | | 10,000 | 10,493,400 |
| | | | $ 367,005,584 |
| Student Loan — 0.1% |
| New Jersey Higher Education Student Assistance Authority, Series 2015-1A, (AMT), 4.00%, 12/1/28 | $ | 1,840 | $ 1,836,430 |
| | | | $ 1,836,430 |
| Transportation — 21.2% |
| Allegheny County Airport Authority, PA, (Pittsburgh International Airport): | | | |
| (AMT), 4.00%, 1/1/39 | $ | 9,000 | $ 8,012,610 |
| (AMT), 5.00%, 1/1/51 | | 12,775 | 12,540,195 |
| Atlanta, GA, Airport Revenue: | | | |
| Green Bonds, 5.00%, 7/1/44 | | 7,000 | 7,276,640 |
| Green Bonds, (AMT), 5.25%, 7/1/42 | | 6,450 | 6,707,161 |
21
See Notes to Financial Statements.
Eaton Vance
National Municipal Income Fund
September 30, 2023
Portfolio of Investments — continued
| Security | Principal
Amount
(000's omitted) | Value |
| Transportation (continued) |
| Austin, TX, Airport System Revenue, (AMT), 5.00%, 11/15/38 | $ | 6,175 | $ 6,202,911 |
| Charlotte, NC, (Charlotte Douglas International Airport), 5.00%, 7/1/48(1) | | 4,000 | 4,123,320 |
| Chicago, IL, (Midway International Airport): | | | |
| 5.00%, 1/1/41 | | 6,000 | 5,990,940 |
| (AMT), 5.00%, 1/1/34 | | 5,250 | 5,223,908 |
| (AMT), 5.00%, 1/1/41 | | 9,985 | 9,833,927 |
| Chicago, IL, (O'Hare International Airport): | | | |
| 4.00%, 1/1/44 | | 9,500 | 8,552,090 |
| 5.00%, 1/1/36 | | 6,000 | 6,076,380 |
| (AMT), 5.00%, 1/1/34 | | 12,500 | 12,487,375 |
| (AMT), 5.00%, 1/1/47 | | 16,450 | 16,094,680 |
| (AMT), 5.00%, 1/1/53 | | 14,370 | 14,245,556 |
| (AMT), 5.25%, 1/1/53 | | 10,500 | 10,583,055 |
| Dallas and Fort Worth, TX, (Dallas/Fort Worth International Airport): | | | |
| 4.00%, 11/1/45 | | 10,000 | 8,909,700 |
| 5.00%, 11/1/47 | | 3,625 | 3,658,676 |
| 5.25%, 11/1/31 | | 10,395 | 10,403,940 |
| (AMT), 5.25%, 11/1/30 | | 11,015 | 11,019,186 |
| Delaware River Port Authority of Pennsylvania and New Jersey, 5.00%, 1/1/40 | | 5,000 | 5,003,450 |
| Denver City and County, CO, Airport System Revenue: | | | |
| (AMT), 4.00%, 12/1/43 | | 5,000 | 4,369,050 |
| (AMT), 5.00%, 12/1/35 | | 5,000 | 5,083,050 |
| (AMT), 5.00%, 12/1/38 | | 10,000 | 10,016,200 |
| (AMT), 5.00%, 11/15/42 | | 9,575 | 9,655,717 |
| (AMT), 5.00%, 11/15/53 | | 5,835 | 5,783,944 |
| Hawaii, Airports System Revenue: | | | |
| (AMT), 5.00%, 7/1/43 | | 3,900 | 3,837,093 |
| (AMT), 5.00%, 7/1/45 | | 18,575 | 18,508,873 |
| (AMT), 5.00%, 7/1/47 | | 12,500 | 12,461,750 |
| Illinois Toll Highway Authority: | | | |
| 4.00%, 1/1/46 | | 10,185 | 9,033,484 |
| 5.25%, 1/1/43 | | 16,835 | 17,711,935 |
| Indianapolis Local Public Improvement Bond Bank, IN, (Indianapolis Airport Authority): | | | |
| (AMT), 5.25%, 1/1/40 | | 5,000 | 5,143,600 |
| (AMT), 5.25%, 1/1/41 | | 3,255 | 3,337,352 |
| Kansas City Industrial Development Authority, MO, (Kansas City International Airport Terminal Modernization): | | | |
| (AMT), 5.00%, 3/1/38 | | 13,500 | 13,495,950 |
| (AMT), 5.00%, 3/1/46 | | 6,400 | 6,290,688 |
| (AMT), 5.00%, 3/1/54 | | 4,835 | 4,726,454 |
| Security | Principal
Amount
(000's omitted) | Value |
| Transportation (continued) |
| Lee County, FL, Airport Revenue, (AMT), 5.00%, 10/1/46 | $ | 6,775 | $ 6,657,996 |
| Los Angeles Department of Airports, CA, (Los Angeles International Airport): | | | |
| (AMT), 5.00%, 5/15/46 | | 19,935 | 19,883,767 |
| Green Bonds, (AMT), 5.00%, 5/15/47 | | 17,855 | 17,922,849 |
| Massachusetts Port Authority: | | | |
| (AMT), 4.00%, 7/1/46 | | 12,465 | 10,551,249 |
| (AMT), 5.00%, 7/1/43 | | 8,000 | 7,989,120 |
| Massachusetts, (Rail Enhancement and Accelerated Bidge Program), 5.00%, 6/1/47 | | 18,000 | 18,237,960 |
| Massachusetts, (Rail Enhancement Program), Sustainablility Bonds, 5.00%, 6/1/53(1)(4) | | 16,500 | 17,170,395 |
| Metropolitan Nashville Airport Authority, TN: | | | |
| (AMT), 5.00%, 7/1/49 | | 10,500 | 10,307,850 |
| (AMT), 5.25%, 7/1/47 | | 10,750 | 10,936,297 |
| Metropolitan Transportation Authority, NY, Green Bonds, 4.75%, 11/15/45 | | 3,050 | 2,844,125 |
| Metropolitan Washington Airports Authority, D.C.: | | | |
| (LOC: TD Bank, N.A.), 3.90%, 10/1/39(3) | | 7,150 | 7,150,000 |
| (LOC: TD Bank, N.A.), 3.90%, 10/1/40(3) | | 2,690 | 2,690,000 |
| (AMT), 5.00%, 10/1/43 | | 5,200 | 5,115,916 |
| (AMT), 5.00%, 10/1/44 | | 10,500 | 10,503,255 |
| New Jersey Turnpike Authority, 4.50%, 1/1/48 | | 8,000 | 7,705,440 |
| New York Thruway Authority, 4.00%, 1/1/44 | | 10,000 | 8,924,400 |
| New York Transportation Development Corp., (LaGuardia Airport Terminal B Redevelopment): | | | |
| (AMT), 5.00%, 7/1/46 | | 25,865 | 24,618,824 |
| (AMT), 5.25%, 1/1/50 | | 1,180 | 1,158,170 |
| New York Transportation Development Corp., (Terminal 4 John F. Kennedy International Airport), (AMT), 5.00%, 12/1/29 | | 10,000 | 10,258,000 |
| North Texas Tollway Authority: | | | |
| 4.125%, 1/1/39 | | 10,215 | 9,636,627 |
| 5.00%, 1/1/48 | | 10,000 | 9,847,800 |
| Oregon Department of Transportation: | | | |
| 4.00%, 11/15/42 | | 11,730 | 10,875,235 |
| 5.25%, 11/15/47 | | 8,175 | 8,638,686 |
| Pennsylvania Economic Development Financing Authority, (PennDOT Major Bridges Package One), (AMT), 5.75%, 6/30/48 | | 16,090 | 16,815,176 |
| Pennsylvania Turnpike Commission: | | | |
| 5.00%, 12/1/44 | | 4,845 | 4,849,554 |
| 5.00%, 12/1/48 | | 10,000 | 10,253,500 |
| (LOC: TD Bank, N.A.), 3.85%, 12/1/38(3) | | 10,000 | 10,000,000 |
| (LOC: TD Bank, N.A.), 3.85%, 12/1/39(3) | | 8,700 | 8,700,000 |
22
See Notes to Financial Statements.
Eaton Vance
National Municipal Income Fund
September 30, 2023
Portfolio of Investments — continued
| Security | Principal
Amount
(000's omitted) | Value |
| Transportation (continued) |
| Philadelphia, PA, Airport Revenue, (AMT), 5.00%, 7/1/47 | $ | 4,595 | $ 4,512,152 |
| Phoenix Civic Improvement Corp., AZ, Airport Revenue: | | | |
| (AMT), 5.00%, 7/1/42 | | 6,250 | 6,246,812 |
| (AMT), 5.00%, 7/1/49 | | 10,400 | 10,327,304 |
| Port Authority of New York and New Jersey: | | | |
| 5.00%, 9/1/37 | | 6,000 | 6,256,500 |
| (AMT), 5.00%, 7/15/39 | | 5,000 | 5,152,150 |
| (AMT), 5.00%, 12/1/44 | | 4,500 | 4,548,375 |
| Port of Portland, OR, (Portland International Airport): | | | |
| (AMT), 4.00%, 7/1/50 | | 5,000 | 4,200,550 |
| (AMT), 5.00%, 7/1/44 | | 8,000 | 7,985,280 |
| (AMT), 5.00%, 7/1/45 | | 12,260 | 12,275,325 |
| Green Bonds, (AMT), 5.25%, 7/1/43 | | 17,000 | 17,402,050 |
| Port of Seattle, WA: | | | |
| (AMT), 4.00%, 5/1/43 | | 5,000 | 4,340,450 |
| (AMT), 5.00%, 5/1/43 | | 5,500 | 5,425,915 |
| (AMT), 5.00%, 4/1/44 | | 9,870 | 9,817,097 |
| Salt Lake City, UT, (Salt Lake City International Airport): | | | |
| (AMT), 5.00%, 7/1/42 | | 17,330 | 17,052,027 |
| (AMT), 5.00%, 7/1/43 | | 3,165 | 3,113,949 |
| (AMT), 5.00%, 7/1/46 | | 15,975 | 15,847,839 |
| (AMT), 5.00%, 7/1/47 | | 6,500 | 6,382,805 |
| (AMT), 5.25%, 7/1/48 | | 16,260 | 16,371,869 |
| San Francisco City and County Airport Commission, CA, (San Francisco International Airport), (AMT), 5.00%, 5/1/49 | | 5,000 | 4,965,350 |
| Texas Private Activity Bond Surface Transportation Corp., (North Tarrant Express Project), (AMT), 5.50%, 12/31/58 | | 9,940 | 10,136,812 |
| Triborough Bridge and Tunnel Authority, NY, 5.00%, 11/15/41 | | 9,000 | 9,091,170 |
| Virginia Small Business Financing Authority, (95 Express Lanes, LLC), (AMT), 4.00%, 1/1/39 | | 7,220 | 6,528,035 |
| | | | $ 780,622,847 |
| Water and Sewer — 4.2% |
| Austin, TX, Water and Wastewater System Revenue, 5.00%, 11/15/47 | $ | 4,000 | $ 4,095,560 |
| Charleston, SC, Waterworks and Sewer System Revenue, 5.00%, 1/1/49 | | 4,365 | 4,489,926 |
| Corpus Christi, TX, Utility System Revenue, 4.00%, 7/15/48 | | 5,305 | 4,523,308 |
| District of Columbia Water and Sewer Authority, 4.00%, 10/1/51 | | 10,935 | 9,717,935 |
| Eugene, OR, Water Utility System Revenue, 5.00%, 8/1/48 | | 5,440 | 5,630,672 |
| Security | Principal
Amount
(000's omitted) | Value |
| Water and Sewer (continued) |
| Gilbert Water Resources Municipal Property Corp., AZ, Green Bonds, 4.00%, 7/15/47 | $ | 3,000 | $ 2,691,120 |
| Kansas City, MO, Sanitary Sewer System Revenue, 4.00%, 1/1/48 | | 4,000 | 3,508,280 |
| Michigan Finance Authority, (Detroit Water and Sewerage Department), 5.00%, 7/1/33 | | 8,095 | 8,136,365 |
| New York City Municipal Water Finance Authority, NY, (Water and Sewer System): | | | |
| 4.00%, 6/15/49 | | 10,000 | 8,766,500 |
| 5.00%, 6/15/47(1) | | 8,000 | 8,200,080 |
| 5.00%, 6/15/51 | | 5,000 | 5,090,650 |
| 5.25%, 6/15/48(4) | | 13,500 | 14,192,280 |
| (SPA: Barclays Bank PLC), 4.80%, 6/15/53(5) | | 1,600 | 1,600,000 |
| (SPA: JPMorgan Chase Bank, N.A.), 4.75%, 6/15/43(5) | | 5,875 | 5,875,000 |
| (SPA: JPMorgan Chase Bank, N.A.), 4.75%, 6/15/50(5) | | 5,330 | 5,330,000 |
| (SPA: JPMorgan Chase Bank, N.A.), 4.75%, 6/15/50(5) | | 2,085 | 2,085,000 |
| (SPA: State Street Bank & Trust Co.), 4.55%, 6/15/41(5) | | 1,500 | 1,500,000 |
| Philadelphia, PA, Water and Wastewater Revenue, 5.00%, 10/1/43 | | 5,000 | 5,083,750 |
| San Mateo-Foster City Public Financing Authority, CA, (Clean Water Program), 5.00%, 8/1/49 | | 23,445 | 24,262,293 |
| Sarasota County, FL, Utility System Revenue, 5.25%, 10/1/52 | | 15,000 | 15,873,450 |
| Seattle, WA, Water System Revenue, Green Bonds, 5.00%, 9/1/52 | | 8,610 | 8,887,070 |
| Tacoma, WA, Sewer Revenue, 4.00%, 12/1/48 | | 5,190 | 4,517,999 |
| Texas Water Development Board, 4.00%, 10/15/49 | | 2,500 | 2,198,125 |
| | | | $ 156,255,363 |
Total Tax-Exempt Municipal Obligations
(identified cost $3,554,314,044) | | | $3,448,093,792 |
| Taxable Municipal Obligations — 6.8% |
| Security | Principal
Amount
(000's omitted) | Value |
| Cogeneration — 0.0%(9) |
| Northampton County Industrial Development Authority, PA, (Northampton Generating), 5.00%, 12/31/23(2) | $ | 7,517 | $ 1,353,032 |
| | | | $ 1,353,032 |
23
See Notes to Financial Statements.
Eaton Vance
National Municipal Income Fund
September 30, 2023
Portfolio of Investments — continued
| Security | Principal
Amount
(000's omitted) | Value |
| Education — 0.1% |
| San Antonio Education Facilities Corp., TX, (University of the Incarnate Word): | | | |
| 2.65%, 4/1/30 | $ | 1,100 | $ 873,070 |
| 3.15%, 4/1/37 | | 1,750 | 1,221,833 |
| | | | $ 2,094,903 |
| General Obligations — 0.5% |
| Lakeside School District No. 9, AR: | | | |
| 1.65%, 4/1/36 | $ | 1,115 | $ 716,376 |
| 1.90%, 4/1/39 | | 750 | 450,233 |
| Los Angeles Community College District, CA, 1.806%, 8/1/30 | | 15,000 | 12,236,550 |
| Puerto Rico, GO Contingent Value Instrument, 0.00%, 11/1/43 | | 7,122 | 3,703,381 |
| | | | $ 17,106,540 |
| Hospital — 1.1% |
| California Statewide Communities Development Authority, (Loma Linda University Medical Center), 6.00%, 12/1/24 | $ | 34,250 | $ 33,880,785 |
| New Mexico Hospital Equipment Loan Council, (Presbyterian Healthcare Services), (SPA: JPMorgan Chase Bank, N.A.), 5.35%, 8/1/42(5) | | 5,000 | 5,000,000 |
| | | | $ 38,880,785 |
| Housing — 1.5% |
| Maine Housing Authority: | | | |
| (SPA: Barclays Bank PLC), 5.37%, 11/15/52(3) | $ | 27,210 | $ 27,210,000 |
| (SPA: TD Bank, N.A.), 5.37%, 11/15/50(3) | | 7,140 | 7,140,000 |
| North Dakota Housing Finance Agency, (SPA: TD Bank, N.A.), 5.35%, 1/1/47(3) | | 22,000 | 22,000,000 |
| | | | $ 56,350,000 |
| Industrial Development Revenue — 0.1% |
| JobsOhio Beverage System, OH, 4.433%, 1/1/33 | $ | 5,000 | $ 4,813,050 |
| | | | $ 4,813,050 |
| Insured - General Obligations — 0.0%(9) |
| Westland Tax Increment Finance Authority, MI: | | | |
| (AGM), 2.31%, 4/1/33 | $ | 1,165 | $ 898,891 |
| (AGM), 2.41%, 4/1/34 | | 195 | 147,960 |
| | | | $ 1,046,851 |
| Insured - Transportation — 1.3% |
| Alameda Corridor Transportation Authority, CA: | | | |
| (AMBAC), 0.00%, 10/1/26 | $ | 22,500 | $ 19,096,200 |
| Security | Principal
Amount
(000's omitted) | Value |
| Insured - Transportation (continued) |
Alameda Corridor Transportation Authority, CA:
(continued) | | | |
| (AMBAC), 0.00%, 10/1/27 | $ | 34,390 | $ 27,679,479 |
| | | | $ 46,775,679 |
| Lease Revenue/Certificates of Participation — 0.3% |
| New York City Transitional Finance Authority, NY, (Building Aid), 3.23%, 7/15/24 | $ | 10,000 | $ 9,817,200 |
| | | | $ 9,817,200 |
| Other Revenue — 0.6% |
| Golden State Tobacco Securitization Corp., CA, 3.714%, 6/1/41 | $ | 28,000 | $ 19,691,000 |
| Santa Cruz County, CA, Pension Obligation Bonds, 2.291%, 6/1/33 | | 3,000 | 2,232,120 |
| | | | $ 21,923,120 |
| Senior Living/Life Care — 0.0%(9) |
| Montgomery County Industrial Development Authority, PA, (ACTS Retirement-Life Communities, Inc. Obligated Group), 2.45%, 11/15/23 | $ | 1,250 | $ 1,244,463 |
| | | | $ 1,244,463 |
| Transportation — 0.4% |
| Foothill/Eastern Transportation Corridor Agency, CA, 4.094%, 1/15/49 | $ | 20,856 | $ 15,967,145 |
| | | | $ 15,967,145 |
| Water and Sewer — 0.9% |
| Metropolitan Water District of Southern California, (SPA: TD Bank, N.A.), 5.33%, 7/1/37(3) | $ | 33,350 | $ 33,350,000 |
| | | | $ 33,350,000 |
Total Taxable Municipal Obligations
(identified cost $269,298,280) | | | $ 250,722,768 |
Total Investments — 101.6%
(identified cost $3,866,539,561) | | | $3,742,555,210 |
| Other Assets, Less Liabilities — (1.6)% | | | $ (59,424,425) |
| Net Assets — 100.0% | | | $3,683,130,785 |
24
See Notes to Financial Statements.
Eaton Vance
National Municipal Income Fund
September 30, 2023
Portfolio of Investments — continued
| The percentage shown for each investment category in the Portfolio of Investments is based on net assets. |
| (1) | Security represents the municipal bond held by a trust that issues residual interest bonds (see Note 1H). |
| (2) | Represents a payment-in-kind security which may pay interest in additional principal at the issuer’s discretion. |
| (3) | Variable rate demand obligation that may be tendered at par on any day for payment the lesser of 5 business days or 7 calendar days. The stated interest rate, which generally resets weekly, is determined by the remarketing agent and represents the rate in effect at September 30, 2023. |
| (4) | When-issued security. |
| (5) | Variable rate demand obligation that may be tendered at par on any day for payment the same or next business day. The stated interest rate, which generally resets daily, is determined by the remarketing agent and represents the rate in effect at September 30, 2023. |
| (6) | Security exempt from registration under Rule 144A of the Securities Act of 1933, as amended. These securities may be sold in certain transactions in reliance on an exemption from registration (normally to qualified institutional buyers). At September 30, 2023, the aggregate value of these securities is $54,955,331 or 1.5% of the Fund's net assets. |
| (7) | Floating rate security. The stated interest rate represents the rate in effect at September 30, 2023. |
| (8) | Defaulted security. Issuer has defaulted on the payment of interest and/or principal or has filed for bankruptcy. |
| (9) | Amount is less than 0.05%. |
| At September 30, 2023, the concentration of the Fund’s investments in the various states and territories, determined as a percentage of net assets, is as follows: |
| New York | 14.5% |
| California | 13.9% |
| Texas | 12.3% |
| Others, representing less than 10% individually | 59.7% |
| The Fund invests primarily in debt securities issued by municipalities. The ability of the issuers of the debt securities to meet their obligations may be affected by economic developments in a specific industry or municipality. At September 30, 2023, 6.6% of total investments are backed by bond insurance of various financial institutions and financial guaranty assurance agencies. The aggregate percentage insured by an individual financial institution or financial guaranty assurance agency ranged from 0.4% to 3.3% of total investments. |
| Futures Contracts |
| Description | Number of
Contracts | Position | Expiration
Date | Notional
Amount | Value/Unrealized
Appreciation
(Depreciation) |
| Interest Rate Futures | | | | | |
| U.S. Long Treasury Bond | (925) | Short | 12/19/23 | $(105,247,656) | $ 4,363,160 |
| | | | | | $4,363,160 |
| Abbreviations: |
| AGC | – Assured Guaranty Corp. |
| AGM | – Assured Guaranty Municipal Corp. |
| AMBAC | – AMBAC Financial Group, Inc. |
| AMT | – Interest earned from these securities may be considered a tax preference item for purposes of the Federal Alternative Minimum Tax. |
| BAM | – Build America Mutual Assurance Co. |
| FHLMC | – Federal Home Loan Mortgage Corp. |
| FNMA | – Federal National Mortgage Association |
| GNMA | – Government National Mortgage Association |
| Liq | – Liquidity Provider |
| LOC | – Letter of Credit |
| NPFG | – National Public Finance Guarantee Corp. |
| PSF | – Permanent School Fund |
| SFMR | – Single Family Mortgage Revenue |
| SIFMA | – Securities Industry and Financial Markets Association Municipal Swap Index |
| SOFR | – Secured Overnight Financing Rate |
| |
| SPA | – Standby Bond Purchase Agreement |
25
See Notes to Financial Statements.
Eaton Vance
Municipal Income Funds
September 30, 2023
Statements of Assets and Liabilities
| | September 30, 2023 |
| | AMT-Free Fund | National Fund |
| Assets | | |
| Investments: | | |
| Identified cost | $ 229,659,764 | $ 3,866,539,561 |
| Unrealized depreciation | (7,001,800) | (123,984,351) |
| Investments, at value | $222,657,964 | $3,742,555,210 |
| Cash | $ 2,173,356 | $ 5,953,812 |
| Deposits for derivatives collateral — futures contracts | — | 4,053,599 |
| Interest receivable | 2,974,366 | 46,991,028 |
| Receivable for investments sold | 1,100,000 | 65,572,706 |
| Receivable for Fund shares sold | 82,064 | 18,051,327 |
| Trustees' deferred compensation plan | 95,316 | 394,044 |
| Due from broker for floating rate notes issued | — | 22,800,000 |
| Total assets | $229,083,066 | $3,906,371,726 |
| Liabilities | | |
| Payable for floating rate notes issued | $ 7,749,960 | $ 54,807,640 |
| Due to broker for floating rate notes redeemed | — | 28,000,000 |
| Payable for investments purchased | — | 48,844,717 |
| Payable for when-issued securities | — | 66,060,572 |
| Payable for Fund shares redeemed | 377,326 | 20,420,745 |
| Payable for variation margin on open futures contracts | — | 260,156 |
| Distributions payable | 106,828 | 2,161,527 |
| Payable to affiliates: | | |
| Investment adviser fee | 81,650 | 1,023,581 |
| Distribution and service fees | 24,057 | 276,175 |
| Trustees' deferred compensation plan | 95,316 | 394,044 |
| Interest expense and fees payable | 88,917 | 294,951 |
| Accrued expenses | 118,217 | 696,833 |
| Total liabilities | $ 8,642,271 | $ 223,240,941 |
| Net Assets | $220,440,795 | $3,683,130,785 |
| Sources of Net Assets | | |
| Paid-in capital | $ 277,223,751 | $ 4,231,258,722 |
| Accumulated loss | (56,782,956) | (548,127,937) |
| Net Assets | $220,440,795 | $3,683,130,785 |
| Class A Shares | | |
| Net Assets | $ 100,834,733 | $ 1,126,345,458 |
| Shares Outstanding | 13,230,691 | 128,746,049 |
Net Asset Value and Redemption Price Per Share
(net assets ÷ shares of beneficial interest outstanding) | $ 7.62 | $ 8.75 |
Maximum Offering Price Per Share
(100 ÷ 96.75 of net asset value per share) | $ 7.88 | $ 9.04 |
| Class C Shares | | |
| Net Assets | $ 3,257,739 | $ 45,669,945 |
| Shares Outstanding | 429,951 | 5,220,791 |
Net Asset Value and Offering Price Per Share*
(net assets ÷ shares of beneficial interest outstanding) | $ 7.58 | $ 8.75 |
26
See Notes to Financial Statements.
Eaton Vance
Municipal Income Funds
September 30, 2023
Statements of Assets and Liabilities — continued
| | September 30, 2023 |
| | AMT-Free Fund | National Fund |
| Class I Shares | | |
| Net Assets | $116,348,323 | $2,511,115,382 |
| Shares Outstanding | 13,980,543 | 287,080,214 |
Net Asset Value, Offering Price and Redemption Price Per Share
(net assets ÷ shares of beneficial interest outstanding) | $ 8.32 | $ 8.75 |
| On sales of $100,000 or more, the offering price of Class A shares is reduced. |
| * | Redemption price per share is equal to the net asset value less any applicable contingent deferred sales charge. |
27
See Notes to Financial Statements.
Eaton Vance
Municipal Income Funds
September 30, 2023
| | Year Ended September 30, 2023 |
| | AMT-Free Fund | National Fund |
| Investment Income | | |
| Interest income | $ 10,893,239 | $ 154,300,868 |
| Total investment income | $10,893,239 | $154,300,868 |
| Expenses | | |
| Investment adviser fee | $ 1,039,448 | $ 11,505,693 |
| Distribution and service fees: | | |
| Class A | 280,721 | 2,951,633 |
| Class C | 42,355 | 522,765 |
| Trustees’ fees and expenses | 16,255 | 108,500 |
| Custodian fee | 57,614 | 621,253 |
| Transfer and dividend disbursing agent fees | 89,809 | 1,438,663 |
| Legal and accounting services | 71,599 | 199,852 |
| Printing and postage | 10,935 | 143,922 |
| Registration fees | 77,293 | 305,021 |
| Interest expense and fees | 409,003 | 2,673,804 |
| Miscellaneous | 43,944 | 191,824 |
| Total expenses | $ 2,138,976 | $ 20,662,930 |
| Net investment income | $ 8,754,263 | $133,637,938 |
| Realized and Unrealized Gain (Loss) | | |
| Net realized gain (loss): | | |
| Investment transactions | $ (5,868,207) | $ (67,945,101) |
| Futures contracts | — | 18,630,246 |
| Net realized loss | $ (5,868,207) | $ (49,314,855) |
| Change in unrealized appreciation (depreciation): | | |
| Investments | $ 1,277,150 | $ 10,167,551 |
| Futures contracts | — | (5,724,409) |
| Net change in unrealized appreciation (depreciation) | $ 1,277,150 | $ 4,443,142 |
| Net realized and unrealized loss | $ (4,591,057) | $ (44,871,713) |
| Net increase in net assets from operations | $ 4,163,206 | $ 88,766,225 |
28
See Notes to Financial Statements.
Eaton Vance
Municipal Income Funds
September 30, 2023
Statements of Changes in Net Assets
| | Year Ended September 30, 2023 |
| | AMT-Free Fund | National Fund |
| Increase (Decrease) in Net Assets | | |
| From operations: | | |
| Net investment income | $ 8,754,263 | $ 133,637,938 |
| Net realized loss | (5,868,207) | (49,314,855) |
| Net change in unrealized appreciation (depreciation) | 1,277,150 | 4,443,142 |
| Net increase in net assets from operations | $ 4,163,206 | $ 88,766,225 |
| Distributions to shareholders: | | |
| Class A | $ (3,899,645) | $ (43,200,549) |
| Class C | (114,999) | (1,519,512) |
| Class I | (4,682,937) | (86,466,621) |
| Total distributions to shareholders | $ (8,697,581) | $ (131,186,682) |
| Transactions in shares of beneficial interest: | | |
| Class A | $ (11,277,440) | $ (49,788,169) |
| Class C | (1,635,102) | (10,052,301) |
| Class I | (418,520) | 658,700,475 |
| Net increase (decrease) in net assets from Fund share transactions | $ (13,331,062) | $ 598,860,005 |
| Net increase (decrease) in net assets | $ (17,865,437) | $ 556,439,548 |
| Net Assets | | |
| At beginning of year | $ 238,306,232 | $ 3,126,691,237 |
| At end of year | $220,440,795 | $3,683,130,785 |
29
See Notes to Financial Statements.
Eaton Vance
Municipal Income Funds
September 30, 2023
Statements of Changes in Net Assets — continued
| | Year Ended September 30, 2022 |
| | AMT-Free Fund | National Fund |
| Increase (Decrease) in Net Assets | | |
| From operations: | | |
| Net investment income | $ 8,148,480 | $ 87,317,787 |
| Net realized loss | (18,029,404) | (232,773,288) |
| Net change in unrealized appreciation (depreciation) | (33,643,392) | (323,814,828) |
| Net decrease in net assets from operations | $ (43,524,316) | $ (469,270,329) |
| Distributions to shareholders: | | |
| Class A | $ (3,726,887) | $ (34,992,231) |
| Class C | (137,551) | (1,325,303) |
| Class I | (4,457,845) | (58,955,993) |
| Total distributions to shareholders | $ (8,322,283) | $ (95,273,527) |
| Transactions in shares of beneficial interest: | | |
| Class A | $ (20,210,316) | $ (162,612,967) |
| Class C | (2,892,659) | (27,668,849) |
| Class I | (37,743,092) | (118,929,047) |
| Net decrease in net assets from Fund share transactions | $ (60,846,067) | $ (309,210,863) |
| Net decrease in net assets | $(112,692,666) | $ (873,754,719) |
| Net Assets | | |
| At beginning of year | $ 350,998,898 | $ 4,000,445,956 |
| At end of year | $ 238,306,232 | $3,126,691,237 |
30
See Notes to Financial Statements.
Eaton Vance
Municipal Income Funds
September 30, 2023
| | AMT-Free Fund — Class A |
| | Year Ended September 30, |
| | 2023 | 2022 | 2021 | 2020 | 2019 |
| Net asset value — Beginning of year | $ 7.790 | $ 9.290 | $ 9.250 | $ 9.250 | $ 8.870 |
| Income (Loss) From Operations | | | | | |
| Net investment income(1) | $ 0.280 | $ 0.227 | $ 0.236 | $ 0.274 | $ 0.317 |
| Net realized and unrealized gain (loss) | (0.171) | (1.495) | 0.053 | 0.011 (2) | 0.381 |
| Total income (loss) from operations | $ 0.109 | $ (1.268) | $ 0.289 | $ 0.285 | $ 0.698 |
| Less Distributions | | | | | |
| From net investment income | $ (0.279) | $ (0.232) | $ (0.249) | $ (0.285) | $ (0.318) |
| Total distributions | $ (0.279) | $ (0.232) | $ (0.249) | $ (0.285) | $ (0.318) |
| Net asset value — End of year | $ 7.620 | $ 7.790 | $ 9.290 | $ 9.250 | $ 9.250 |
| Total Return(3) | 1.29% | (13.85)% | 3.14% | 3.12% | 8.02% |
| Ratios/Supplemental Data | | | | | |
| Net assets, end of year (000’s omitted) | $100,835 | $113,933 | $157,981 | $158,729 | $150,853 |
| Ratios (as a percentage of average daily net assets): | | | | | |
| Expenses excluding interest and fees | 0.83% | 0.79% | 0.76% | 0.78% | 0.81% |
| Interest and fee expense(4) | 0.17% | 0.07% | 0.04% | 0.14% | 0.23% |
| Total expenses | 1.00% | 0.86% | 0.80% | 0.92% | 1.04% |
| Net investment income | 3.50% | 2.61% | 2.53% | 2.97% | 3.51% |
| Portfolio Turnover | 53% | 60% | 32% | 58% | 33% |
| (1) | Computed using average shares outstanding. |
| (2) | The per share amount is not in accord with the net realized and unrealized gain (loss) for the period because of the timing of Fund share transactions and the amount of the per share realized and unrealized gains and losses at such time. |
| (3) | Returns are historical and are calculated by determining the percentage change in net asset value with all distributions reinvested and do not reflect the effect of sales charges. |
| (4) | Interest and fee expense relates to the liability for floating rate notes issued in conjunction with residual interest bond transactions (see Note 1H). |
31
See Notes to Financial Statements.
Eaton Vance
Municipal Income Funds
September 30, 2023
Financial Highlights — continued
| | AMT-Free Fund — Class C |
| | Year Ended September 30, |
| | 2023 | 2022 | 2021 | 2020 | 2019 |
| Net asset value — Beginning of year | $ 7.740 | $ 9.240 | $ 9.200 | $ 9.200 | $ 8.820 |
| Income (Loss) From Operations | | | | | |
| Net investment income(1) | $ 0.219 | $ 0.159 | $ 0.167 | $ 0.204 | $ 0.249 |
| Net realized and unrealized gain (loss) | (0.162) | (1.493) | 0.051 | 0.011 (2) | 0.380 |
| Total income (loss) from operations | $ 0.057 | $(1.334) | $ 0.218 | $ 0.215 | $ 0.629 |
| Less Distributions | | | | | |
| From net investment income | $ (0.217) | $ (0.166) | $ (0.178) | $ (0.215) | $ (0.249) |
| Total distributions | $(0.217) | $(0.166) | $(0.178) | $ (0.215) | $ (0.249) |
| Net asset value — End of year | $ 7.580 | $ 7.740 | $ 9.240 | $ 9.200 | $ 9.200 |
| Total Return(3) | 0.51% | (14.59)% | 2.38% | 2.36% | 7.24% |
| Ratios/Supplemental Data | | | | | |
| Net assets, end of year (000’s omitted) | $ 3,258 | $ 4,906 | $ 9,017 | $15,094 | $19,715 |
| Ratios (as a percentage of average daily net assets): | | | | | |
| Expenses excluding interest and fees | 1.58% | 1.54% | 1.51% | 1.53% | 1.56% |
| Interest and fee expense(4) | 0.17% | 0.07% | 0.04% | 0.14% | 0.23% |
| Total expenses | 1.75% | 1.61% | 1.55% | 1.67% | 1.79% |
| Net investment income | 2.74% | 1.83% | 1.80% | 2.23% | 2.78% |
| Portfolio Turnover | 53% | 60% | 32% | 58% | 33% |
| (1) | Computed using average shares outstanding. |
| (2) | The per share amount is not in accord with the net realized and unrealized gain (loss) for the period because of the timing of Fund share transactions and the amount of the per share realized and unrealized gains and losses at such time. |
| (3) | Returns are historical and are calculated by determining the percentage change in net asset value with all distributions reinvested and do not reflect the effect of sales charges. |
| (4) | Interest and fee expense relates to the liability for floating rate notes issued in conjunction with residual interest bond transactions (see Note 1H). |
32
See Notes to Financial Statements.
Eaton Vance
Municipal Income Funds
September 30, 2023
Financial Highlights — continued
| | AMT-Free Fund — Class I |
| | Year Ended September 30, |
| | 2023 | 2022 | 2021 | 2020 | 2019 |
| Net asset value — Beginning of year | $ 8.500 | $ 10.150 | $ 10.110 | $ 10.100 | $ 9.680 |
| Income (Loss) From Operations | | | | | |
| Net investment income(1) | $ 0.328 | $ 0.271 | $ 0.283 | $ 0.323 | $ 0.370 |
| Net realized and unrealized gain (loss) | (0.182) | (1.644) | 0.055 | 0.023 (2) | 0.422 |
| Total income (loss) from operations | $ 0.146 | $ (1.373) | $ 0.338 | $ 0.346 | $ 0.792 |
| Less Distributions | | | | | |
| From net investment income | $ (0.326) | $ (0.277) | $ (0.298) | $ (0.336) | $ (0.372) |
| Total distributions | $ (0.326) | $ (0.277) | $ (0.298) | $ (0.336) | $ (0.372) |
| Net asset value — End of year | $ 8.320 | $ 8.500 | $ 10.150 | $ 10.110 | $ 10.100 |
| Total Return(3) | 1.49% | (13.64)% | 3.36% | 3.48% | 8.34% |
| Ratios/Supplemental Data | | | | | |
| Net assets, end of year (000’s omitted) | $116,348 | $119,467 | $184,002 | $168,113 | $145,788 |
| Ratios (as a percentage of average daily net assets): | | | | | |
| Expenses excluding interest and fees | 0.58% | 0.54% | 0.51% | 0.53% | 0.56% |
| Interest and fee expense(4) | 0.17% | 0.07% | 0.04% | 0.14% | 0.23% |
| Total expenses | 0.75% | 0.61% | 0.55% | 0.67% | 0.79% |
| Net investment income | 3.75% | 2.84% | 2.77% | 3.21% | 3.76% |
| Portfolio Turnover | 53% | 60% | 32% | 58% | 33% |
| (1) | Computed using average shares outstanding. |
| (2) | The per share amount is not in accord with the net realized and unrealized gain (loss) for the period because of the timing of Fund share transactions and the amount of the per share realized and unrealized gains and losses at such time. |
| (3) | Returns are historical and are calculated by determining the percentage change in net asset value with all distributions reinvested. |
| (4) | Interest and fee expense relates to the liability for floating rate notes issued in conjunction with residual interest bond transactions (see Note 1H). |
33
See Notes to Financial Statements.
Eaton Vance
Municipal Income Funds
September 30, 2023
Financial Highlights — continued
| | National Fund — Class A |
| | Year Ended September 30, |
| | 2023 | 2022 | 2021 | 2020 | 2019 |
| Net asset value — Beginning of year | $ 8.780 | $ 10.310 | $ 10.240 | $ 10.140 | $ 9.650 |
| Income (Loss) From Operations | | | | | |
| Net investment income(1) | $ 0.340 | $ 0.224 | $ 0.223 | $ 0.265 | $ 0.322 |
| Net realized and unrealized gain (loss) | (0.037) | (1.507) | 0.082 | 0.119 | 0.491 |
| Total income (loss) from operations | $ 0.303 | $ (1.283) | $ 0.305 | $ 0.384 | $ 0.813 |
| Less Distributions | | | | | |
| From net investment income | $ (0.333) | $ (0.247) | $ (0.235) | $ (0.284) | $ (0.323) |
| Total distributions | $ (0.333) | $ (0.247) | $ (0.235) | $ (0.284) | $ (0.323) |
| Net asset value — End of year | $ 8.750 | $ 8.780 | $ 10.310 | $ 10.240 | $ 10.140 |
| Total Return(2) | 3.38% | (12.62)% | 2.99% | 3.84% | 8.57% |
| Ratios/Supplemental Data | | | | | |
| Net assets, end of year (000’s omitted) | $1,126,345 | $1,179,909 | $1,558,418 | $1,620,505 | $1,605,407 |
| Ratios (as a percentage of average daily net assets): | | | | | |
| Expenses excluding interest and fees | 0.67% | 0.64% | 0.61% | 0.64% | 0.68% |
| Interest and fee expense(3) | 0.08% | 0.03% | 0.02% | 0.05% | 0.12% |
| Total expenses | 0.75% | 0.67% | 0.63% | 0.69% | 0.80% |
| Net investment income | 3.73% | 2.30% | 2.15% | 2.61% | 3.26% |
| Portfolio Turnover | 86% | 151% | 56% | 105% | 89% |
| (1) | Computed using average shares outstanding. |
| (2) | Returns are historical and are calculated by determining the percentage change in net asset value with all distributions reinvested and do not reflect the effect of sales charges. |
| (3) | Interest and fee expense relates to the liability for floating rate notes issued in conjunction with residual interest bond transactions (see Note 1H). |
34
See Notes to Financial Statements.
Eaton Vance
Municipal Income Funds
September 30, 2023
Financial Highlights — continued
| | National Fund — Class C |
| | Year Ended September 30, |
| | 2023 | 2022 | 2021 | 2020 | 2019 |
| Net asset value — Beginning of year | $ 8.780 | $10.310 | $ 10.240 | $ 10.140 | $ 9.650 |
| Income (Loss) From Operations | | | | | |
| Net investment income(1) | $ 0.271 | $ 0.148 | $ 0.146 | $ 0.190 | $ 0.252 |
| Net realized and unrealized gain (loss) | (0.036) | (1.504) | 0.081 | 0.119 | 0.488 |
| Total income (loss) from operations | $ 0.235 | $ (1.356) | $ 0.227 | $ 0.309 | $ 0.740 |
| Less Distributions | | | | | |
| From net investment income | $ (0.265) | $ (0.174) | $ (0.157) | $ (0.209) | $ (0.250) |
| Total distributions | $ (0.265) | $ (0.174) | $ (0.157) | $ (0.209) | $ (0.250) |
| Net asset value — End of year | $ 8.750 | $ 8.780 | $10.310 | $ 10.240 | $ 10.140 |
| Total Return(2) | 2.60% | (13.28)% | 2.22% | 3.08% | 7.77% |
| Ratios/Supplemental Data | | | | | |
| Net assets, end of year (000’s omitted) | $45,670 | $55,558 | $ 94,851 | $131,330 | $172,417 |
| Ratios (as a percentage of average daily net assets): | | | | | |
| Expenses excluding interest and fees | 1.42% | 1.39% | 1.36% | 1.39% | 1.43% |
| Interest and fee expense(3) | 0.08% | 0.03% | 0.02% | 0.05% | 0.12% |
| Total expenses | 1.50% | 1.42% | 1.38% | 1.44% | 1.55% |
| Net investment income | 2.98% | 1.52% | 1.41% | 1.87% | 2.57% |
| Portfolio Turnover | 86% | 151% | 56% | 105% | 89% |
| (1) | Computed using average shares outstanding. |
| (2) | Returns are historical and are calculated by determining the percentage change in net asset value with all distributions reinvested and do not reflect the effect of sales charges. |
| (3) | Interest and fee expense relates to the liability for floating rate notes issued in conjunction with residual interest bond transactions (see Note 1H). |
35
See Notes to Financial Statements.
Eaton Vance
Municipal Income Funds
September 30, 2023
Financial Highlights — continued
| | National Fund — Class I |
| | Year Ended September 30, |
| | 2023 | 2022 | 2021 | 2020 | 2019 |
| Net asset value — Beginning of year | $ 8.780 | $ 10.310 | $ 10.240 | $ 10.140 | $ 9.650 |
| Income (Loss) From Operations | | | | | |
| Net investment income(1) | $ 0.363 | $ 0.248 | $ 0.248 | $ 0.289 | $ 0.341 |
| Net realized and unrealized gain (loss) | (0.037) | (1.507) | 0.082 | 0.120 | 0.495 |
| Total income (loss) from operations | $ 0.326 | $ (1.259) | $ 0.330 | $ 0.409 | $ 0.836 |
| Less Distributions | | | | | |
| From net investment income | $ (0.356) | $ (0.271) | $ (0.260) | $ (0.309) | $ (0.346) |
| Total distributions | $ (0.356) | $ (0.271) | $ (0.260) | $ (0.309) | $ (0.346) |
| Net asset value — End of year | $ 8.750 | $ 8.780 | $ 10.310 | $ 10.240 | $ 10.140 |
| Total Return(2) | 3.64% | (12.40)% | 3.24% | 4.10% | 8.83% |
| Ratios/Supplemental Data | | | | | |
| Net assets, end of year (000’s omitted) | $2,511,115 | $1,891,224 | $2,347,177 | $1,797,038 | $1,348,563 |
| Ratios (as a percentage of average daily net assets): | | | | | |
| Expenses excluding interest and fees | 0.42% | 0.39% | 0.36% | 0.39% | 0.43% |
| Interest and fee expense(3) | 0.08% | 0.03% | 0.02% | 0.05% | 0.12% |
| Total expenses | 0.50% | 0.42% | 0.38% | 0.44% | 0.55% |
| Net investment income | 3.98% | 2.55% | 2.39% | 2.85% | 3.45% |
| Portfolio Turnover | 86% | 151% | 56% | 105% | 89% |
| (1) | Computed using average shares outstanding. |
| (2) | Returns are historical and are calculated by determining the percentage change in net asset value with all distributions reinvested. |
| (3) | Interest and fee expense relates to the liability for floating rate notes issued in conjunction with residual interest bond transactions (see Note 1H). |
36
See Notes to Financial Statements.
Eaton Vance
Municipal Income Funds
September 30, 2023
Notes to Financial Statements
1 Significant Accounting Policies
Eaton Vance AMT-Free Municipal Income Fund (AMT-Free Fund) and Eaton Vance National Municipal Income Fund (National Fund) (each individually referred to as the Fund, and collectively, the Funds) are a diversified series of Eaton Vance Mutual Funds Trust and Eaton Vance Municipals Trust, respectively (collectively, the Trusts). The Trusts are Massachusetts business trusts registered under the Investment Company Act of 1940, as amended (the 1940 Act), as open-end management investment companies. Each Fund’s investment objective is to provide current income exempt from regular federal income tax. The Funds offer three classes of shares. Class A shares are generally sold subject to a sales charge imposed at time of purchase. Class C shares are sold at net asset value and are generally subject to a contingent deferred sales charge (see Note 5). Effective November 5, 2020, Class C shares automatically convert to Class A shares eight years after their purchase as described in the Funds’ prospectus. Class I shares are sold at net asset value and are not subject to a sales charge. Each class represents a pro rata interest in the Fund, but votes separately on class-specific matters and (as noted below) is subject to different expenses. Realized and unrealized gains and losses are allocated daily to each class of shares based on the relative net assets of each class to the total net assets of the Fund. Net investment income, other than class-specific expenses, is allocated daily to each class of shares based upon the ratio of the value of each class’s paid shares to the total value of all paid shares. Each class of shares differs in its distribution plan and certain other class-specific expenses.
The following is a summary of significant accounting policies of the Funds. The policies are in conformity with accounting principles generally accepted in the United States of America (U.S. GAAP). Each Fund is an investment company and follows accounting and reporting guidance in the Financial Accounting Standards Board (FASB) Accounting Standards Codification Topic 946.
A Investment Valuation—The following methodologies are used to determine the market value or fair value of investments.
Debt Obligations. Debt obligations are generally valued on the basis of valuations provided by third party pricing services, as derived from such services’ pricing models. Inputs to the models may include, but are not limited to, reported trades, executable bid and ask prices, broker/dealer quotations, prices or yields of securities with similar characteristics, interest rates, anticipated prepayments, benchmark curves or information pertaining to the issuer, as well as industry and economic events. The pricing services may use a matrix approach, which considers information regarding securities with similar characteristics to determine the valuation for a security. Short-term debt obligations purchased with a remaining maturity of sixty days or less for which a valuation from a third party pricing service is not readily available may be valued at amortized cost, which approximates fair value.
Derivatives. Futures contracts are valued at the closing settlement price established by the board of trade or exchange on which they are traded.
Fair Valuation. In connection with Rule 2a-5 of the 1940 Act, the Trustees have designated a Fund’s investment adviser as its valuation designee. Investments for which valuations or market quotations are not readily available or are deemed unreliable are valued by the investment adviser, as valuation designee, at fair value using methods that most fairly reflect the security’s “fair value”, which is the amount that a Fund might reasonably expect to receive for the security upon its current sale in the ordinary course. Each such determination is based on a consideration of relevant factors, which are likely to vary from one pricing context to another. These factors may include, but are not limited to, the type of security, the existence of any contractual restrictions on the security’s disposition, the price and extent of public trading in similar securities of the issuer or of comparable companies or entities, quotations or relevant information obtained from broker/dealers or other market participants, information obtained from the issuer, analysts, and/or the appropriate stock exchange (for exchange-traded securities), an analysis of the company’s or entity’s financial statements, and an evaluation of the forces that influence the issuer and the market(s) in which the security is purchased and sold.
B Investment Transactions and Related Income—Investment transactions for financial statement purposes are accounted for on a trade date basis. Realized gains and losses on investments sold are determined on the basis of identified cost. Interest income is recorded on the basis of interest accrued, adjusted for amortization of premium or accretion of discount.
C Federal Taxes—Each Fund’s policy is to comply with the provisions of the Internal Revenue Code applicable to regulated investment companies and to distribute to shareholders each year substantially all of its taxable, if any, and tax-exempt net investment income, and all or substantially all of its net realized capital gains. Accordingly, no provision for federal income or excise tax is necessary. Each Fund intends to satisfy conditions which will enable it to designate distributions from the interest income generated by its investments in non-taxable municipal securities, which are exempt from regular federal income tax when received by each Fund, as exempt-interest dividends. For National Fund, the portion of such interest, if any, earned on private activity bonds issued after August 7, 1986, may be considered a tax preference item to shareholders.
As of September 30, 2023, the Funds had no uncertain tax positions that would require financial statement recognition, de-recognition, or disclosure. Each Fund files a U.S. federal income tax return annually after its fiscal year-end, which is subject to examination by the Internal Revenue Service for a period of three years from the date of filing.
D Expenses—The majority of expenses of the Trusts are directly identifiable to an individual fund. Expenses which are not readily identifiable to a specific fund are allocated taking into consideration, among other things, the nature and type of expense and the relative size of the funds.
E Legal Fees—Legal fees and other related expenses incurred as part of negotiations of the terms and requirement of capital infusions, or that are expected to result in the restructuring of, or a plan of reorganization for, an investment are recorded as realized losses. Ongoing expenditures to protect or enhance an investment are treated as operating expenses.
Eaton Vance
Municipal Income Funds
September 30, 2023
Notes to Financial Statements — continued
F Use of Estimates—The preparation of the financial statements in conformity with U.S. GAAP requires management to make estimates and assumptions that affect the reported amounts of assets and liabilities at the date of the financial statements and the reported amounts of income and expense during the reporting period. Actual results could differ from those estimates.
G Indemnifications—Under each Trust’s organizational documents, its officers and Trustees may be indemnified against certain liabilities and expenses arising out of the performance of their duties to the Funds. Under Massachusetts law, if certain conditions prevail, shareholders of a Massachusetts business trust (such as a Trust) could be deemed to have personal liability for the obligations of the Trust. However, each Trust’s Declaration of Trust contains an express disclaimer of liability on the part of Fund shareholders and the By-laws provide that the Trust shall assume, upon request by the shareholder, the defense on behalf of any Fund shareholders. Moreover, the By-laws also provide for indemnification out of Fund property of any shareholder held personally liable solely by reason of being or having been a shareholder for all loss or expense arising from such liability. Additionally, in the normal course of business, each Fund enters into agreements with service providers that may contain indemnification clauses. Each Fund’s maximum exposure under these arrangements is unknown as this would involve future claims that may be made against each Fund that have not yet occurred.
H Floating Rate Notes Issued in Conjunction with Securities Held—The Funds may invest in residual interest bonds, also referred to as inverse floating rate securities, whereby a Fund may sell a variable or fixed rate bond for cash to a Special-Purpose Vehicle (the SPV), (which is generally organized as a trust), while at the same time, buying a residual interest in the assets and cash flows of the SPV. The bond is deposited into the SPV with the same CUSIP number as the bond sold to the SPV by the Fund, and which may have been, but is not required to be, the bond purchased from the Fund (the Bond). The SPV also issues floating rate notes (Floating Rate Notes) which are sold to third-parties. The residual interest bond held by a Fund gives the Fund the right (1) to cause the holders of the Floating Rate Notes to generally tender their notes at par, and (2) to have the Bond held by the SPV transferred to the Fund, thereby terminating the SPV. Should the Fund exercise such right, it would generally pay the SPV the par amount due on the Floating Rate Notes and exchange the residual interest bond for the underlying Bond. Pursuant to generally accepted accounting principles for transfers and servicing of financial assets and extinguishment of liabilities, the Funds account for the transaction described above as a secured borrowing by including the Bond in their Portfolio of Investments and the Floating Rate Notes as a liability under the caption “Payable for floating rate notes issued” in their Statement of Assets and Liabilities. The Floating Rate Notes have interest rates that generally reset weekly and their holders have the option to tender their notes to the SPV for redemption at par at each reset date. Accordingly, the fair value of the payable for floating rate notes issued approximates its carrying value. If measured at fair value, the payable for floating rate notes would have been considered as Level 2 in the fair value hierarchy (see Note 10) at September 30, 2023. Interest expense related to a Fund’s liability with respect to Floating Rate Notes is recorded as incurred. The SPV may be terminated by the Fund, as noted above, or by the occurrence of certain termination events as defined in the trust agreement, such as a downgrade in the credit quality of the underlying Bond, bankruptcy of or payment failure by the issuer of the underlying Bond, the inability to remarket Floating Rate Notes that have been tendered due to insufficient buyers in the market, or the failure by the SPV to obtain renewal of the liquidity agreement under which liquidity support is provided for the Floating Rate Notes up to one year. At September 30, 2023, the amounts of the Funds’ Floating Rate Notes and related interest rates and collateral were as follows:
| | AMT-Free
Fund | National
Fund |
| Floating Rate Notes Outstanding | $ 7,749,960 | $54,807,640 |
| Interest Rate or Range of Interest Rates (%) | 4.01 - 4.02 | 4.01 - 4.02 |
| Collateral for Floating Rate Notes Outstanding | $10,155,720 | $70,404,755 |
For the year ended September 30, 2023, the Funds’ average settled Floating Rate Notes outstanding and the average interest rate including fees were as follows:
| | AMT-Free
Fund | National
Fund |
| Average Floating Rate Notes Outstanding | $11,370,986 | $75,813,973 |
| Average Interest Rate | 3.60% | 3.53% |
In certain circumstances, the Funds may enter into shortfall and forbearance agreements with brokers by which a Fund agrees to reimburse the broker for the difference between the liquidation value of the Bond held by the SPV and the liquidation value of the Floating Rate Notes, as well as any shortfalls in interest cash flows. The Funds had no shortfalls as of September 30, 2023.
The Funds may also purchase residual interest bonds in a secondary market transaction without first owning the underlying bond. Such transactions are not required to be treated as secured borrowings. Shortfall agreements, if any, related to residual interest bonds purchased in a secondary market transaction are disclosed in the Portfolio of Investments.
Eaton Vance
Municipal Income Funds
September 30, 2023
Notes to Financial Statements — continued
The Funds’ investment policies and restrictions expressly permit investments in residual interest bonds. Such bonds typically offer the potential for yields exceeding the yields available on fixed rate bonds with comparable credit quality and maturity. These securities tend to underperform the market for fixed rate bonds in a rising long-term interest rate environment, but tend to outperform the market for fixed rate bonds when long-term interest rates decline. The value and income of residual interest bonds are generally more volatile than that of a fixed rate bond. The Funds’ investment policies do not allow the Funds to borrow money except as permitted by the 1940 Act. Effective August 19, 2022, the Funds began operating under Rule 18f-4 under the 1940 Act, which, among other things, governs the use of derivative investments and certain financing transactions by registered investment companies. As of the date of this report, consistent with Rule 18f-4, the Funds have elected to treat their investments in residual interest bonds, along with similar financing transactions, as derivatives transactions subject to the Funds' value-at-risk (VaR)-based limits on leverage risk. The Funds may change this election (and elect to treat these investments and other similar financing transactions like bank borrowings subject to the asset coverage requirements of Section 18 of the 1940 Act) at any time. Residual interest bonds held by the Funds are securities exempt from registration under Rule 144A of the Securities Act of 1933.
I Futures Contracts—Upon entering into a futures contract, a Fund is required to deposit with the broker, either in cash or securities, an amount equal to a certain percentage of the contract amount (initial margin). Subsequent payments, known as variation margin, are made or received by the Fund each business day, depending on the daily fluctuations in the value of the underlying security, and are recorded as unrealized gains or losses by the Fund. Gains (losses) are realized upon the expiration or closing of the futures contracts. Should market conditions change unexpectedly, the Fund may not achieve the anticipated benefits of the futures contracts and may realize a loss. Futures contracts have minimal counterparty risk as they are exchange traded and the clearinghouse for the exchange is substituted as the counterparty, guaranteeing counterparty performance.
J When-Issued Securities and Delayed Delivery Transactions—The Funds may purchase securities on a delayed delivery or when-issued basis. Payment and delivery may take place after the customary settlement period for that security. At the time the transaction is negotiated, the price of the security that will be delivered is fixed. The Funds maintain cash and/or security positions for these commitments such that sufficient liquid assets will be available to make payments upon settlement. Securities purchased on a delayed delivery or when-issued basis are marked-to-market daily and begin earning interest on settlement date. Such security purchases are subject to the risk that when delivered they will be worth less than the agreed upon payment price. Losses may also arise if the counterparty does not perform under the contract.
2 Distributions to Shareholders and Income Tax Information
The net investment income of each Fund is determined daily and substantially all of the net investment income so determined is declared as a dividend to shareholders of record at the time of declaration. Distributions are declared separately for each class of shares. Distributions are paid monthly. Distributions of realized capital gains are made at least annually. Shareholders may reinvest income and capital gain distributions in additional shares of the same class of a Fund at the net asset value as of the reinvestment date or, at the election of the shareholder, receive distributions in cash. Distributions to shareholders are determined in accordance with income tax regulations, which may differ from U.S. GAAP. As required by U.S. GAAP, only distributions in excess of tax basis earnings and profits are reported in the financial statements as a return of capital. Permanent differences between book and tax accounting relating to distributions are reclassified to paid-in capital. For tax purposes, distributions from short-term capital gains are considered to be from ordinary income.
The tax character of distributions declared for the years ended September 30, 2023 and September 30, 2022 was as follows:
| | AMT-Free
Fund | | National
Fund |
| | Year Ended September 30, | | Year Ended September 30, |
| | 2023 | 2022 | | 2023 | 2022 |
| Tax-exempt income | $8,697,559 | $8,322,283 | | $121,388,863 | $87,321,107 |
| Ordinary income | $ 22 | $ — | | $ 9,797,819 | $ 7,952,420 |
Eaton Vance
Municipal Income Funds
September 30, 2023
Notes to Financial Statements — continued
As of September 30, 2023, the components of distributable earnings (accumulated loss) on a tax basis were as follows:
| | AMT-Free
Fund | National
Fund |
| Undistributed tax-exempt income | $ 733,055 | $ 2,377,573 |
| Deferred capital losses | (50,463,234) | (418,278,332) |
| Net unrealized depreciation | (6,945,949) | (130,065,651) |
| Distributions payable | (106,828) | (2,161,527) |
| Accumulated loss | $(56,782,956) | $(548,127,937) |
At September 30, 2023, the following Funds, for federal income tax purposes, had deferred capital losses which would reduce the respective Fund’s taxable income arising from future net realized gains on investment transactions, if any, to the extent permitted by the Internal Revenue Code, and thus would reduce the amount of distributions to shareholders, which would otherwise be necessary to relieve the Funds of any liability for federal income or excise tax. The deferred capital losses are treated as arising on the first day of a Fund’s next taxable year and retain the same short-term or long-term character as when originally deferred. The amounts of the deferred capital losses are as follows:
| | AMT-Free
Fund | National
Fund |
| Deferred capital losses: | | |
| Short-term | $26,756,879 | $294,364,229 |
| Long-term | $23,706,355 | $123,914,103 |
The cost and unrealized appreciation (depreciation) of investments, including open derivative contracts, of each Fund at September 30, 2023, as determined on a federal income tax basis, were as follows:
| | AMT-Free
Fund | National
Fund |
| Aggregate cost | $ 221,853,953 | $3,817,813,221 |
| Gross unrealized appreciation | $ 3,474,662 | $ 20,837,754 |
| Gross unrealized depreciation | (10,420,611) | (150,903,405) |
| Net unrealized depreciation | $ (6,945,949) | $ (130,065,651) |
Eaton Vance
Municipal Income Funds
September 30, 2023
Notes to Financial Statements — continued
3 Investment Adviser Fee and Other Transactions with Affiliates
The investment adviser fee is earned by Eaton Vance Management (EVM), an indirect, wholly-owned subsidiary of Morgan Stanley, for AMT-Free Fund and Boston Management and Research (BMR), an affiliate of EVM, for National Fund as compensation for management and investment advisory services rendered to each Fund. The investment adviser fee is based upon a percentage of total daily net assets plus a percentage of total daily gross income (i.e., income other than gains from the sale of securities) as follows and is payable monthly:
| Total Daily Net Assets | Annual Asset
Rate | Daily Income
Rate |
| Up to $500 million | 0.300% | 3.000% |
| $500 million but less than $1 billion | 0.275% | 2.750% |
| $1 billion but less than $1.5 billion | 0.250% | 2.500% |
| $1.5 billion but less than $2 billion | 0.225% | 2.250% |
| $2 billion but less than $3 billion | 0.200% | 2.000% |
| $3 billion and over | 0.175% | 1.750% |
For the year ended September 30, 2023, investment adviser fees incurred by the Funds and the effective annual rates, as a percentage of average daily net assets, were as follows:
| | AMT-Free
Fund | National
Fund |
| Investment Adviser Fee | $1,039,448 | $11,505,693 |
| Effective Annual Rate | 0.43% | 0.33% |
EVM serves as the administrator of each Fund, but receives no compensation.
EVM provides sub-transfer agency and related services to the Funds pursuant to a Sub-Transfer Agency Support Services Agreement. Eaton Vance Distributors, Inc. (EVD), an affiliate of EVM and the Funds’ principal underwriter, received a portion of the sales charge on sales of Class A shares of the Funds. Morgan Stanley affiliated broker-dealers, which may be deemed to be affiliates of BMR, EVM and EVD, also received a portion of the sales charge on sales of Class A shares. EVD also received distribution and service fees from Class A and Class C shares (see Note 4) and contingent deferred sales charges (see Note 5). Sub-transfer agent fees earned by EVM, which are included in transfer and dividend disbursing agent fees on the Statements of Operations, and Class A sales charges that the Funds were informed were received by EVD and Morgan Stanley affiliated broker-dealers for the year ended September 30, 2023 were as follows:
| | AMT-Free
Fund | National
Fund |
| EVM's Sub-Transfer Agent Fees | $13,377 | $189,989 |
| EVD's Class A Sales Charges | $ 1,218 | $ 50,332 |
| Morgan Stanley affiliated broker-dealers’ Class A Sales Charges | $ — | $ 20,268 |
Trustees and officers of the Funds who are members of EVM’s or BMR’s organizations receive remuneration for their services to the Funds out of the investment adviser fee. Trustees of the Funds who are not affiliated with the investment advisers may elect to defer receipt of all or a percentage of their annual fees in accordance with the terms of the Trustees Deferred Compensation Plan. Certain officers and Trustees of the Funds are officers of the above organizations.
Eaton Vance
Municipal Income Funds
September 30, 2023
Notes to Financial Statements — continued
4 Distribution Plans
Each Fund has in effect a distribution plan for Class A shares (Class A Plan) pursuant to Rule 12b-1 under the 1940 Act. Pursuant to the Class A Plan, each Fund pays EVD a distribution and service fee of 0.25% per annum of its average daily net assets attributable to Class A shares for distribution services and facilities provided to each Fund by EVD, as well as for personal services and/or the maintenance of shareholder accounts. Distribution and service fees paid or accrued to EVD for the year ended September 30, 2023 for Class A shares amounted to the following:
| | AMT-Free
Fund | National
Fund |
| Class A Distribution and Service Fees | $280,721 | $2,951,633 |
Each Fund also has in effect a distribution plan for Class C shares (Class C Plan) pursuant to Rule 12b-1 under the 1940 Act. Pursuant to the Class C Plan, each Fund pays EVD amounts equal to 0.75% per annum of its average daily net assets attributable to Class C shares for providing ongoing distribution services and facilities to the respective Fund. For the year ended September 30, 2023, the Funds paid or accrued to EVD the following distribution fees:
| | AMT-Free
Fund | National
Fund |
| Class C Distribution Fees | $31,766 | $392,074 |
The Class C Plan also authorizes each Fund to make payments of service fees to EVD, financial intermediaries and other persons in amounts equal to 0.25% per annum of the average daily net assets attributable to Class C shares. Service fees paid or accrued are for personal services and/or the maintenance of shareholder accounts. They are separate and distinct from the Class C sales commissions and distribution fees payable to EVD. Service fees paid or accrued for the year ended September 30, 2023 amounted to the following:
| | AMT-Free
Fund | National
Fund |
| Class C Service Fees | $10,589 | $130,691 |
Distribution and service fees are subject to the limitations contained in the Financial Industry Regulatory Authority Rule 2341(d).
5 Contingent Deferred Sales Charges
A contingent deferred sales charge (CDSC) of 1% generally is imposed on redemptions of Class C shares made within 12 months of purchase. Class A shares may be subject to a 0.75% CDSC if redeemed within 12 months of purchase (depending on the circumstances of purchase). Generally, the CDSC is based upon the lower of the net asset value at date of redemption or date of purchase. No charge is levied on shares acquired by reinvestment of dividends or capital gain distributions. For the year ended September 30, 2023, the Funds were informed that EVD received approximately the following amounts of CDSCs paid by Class A and Class C shareholders:
| | AMT-Free
Fund | National
Fund |
| Class A | $ 200 | $13,000 |
| Class C | $ — | $ 3,000 |
Eaton Vance
Municipal Income Funds
September 30, 2023
Notes to Financial Statements — continued
6 Purchases and Sales of Investments
Purchases and sales of investments, other than short-term obligations and including maturities, for the year ended September 30, 2023 were as follows:
| | AMT-Free
Fund | National
Fund |
| Purchases | $130,144,878 | $3,612,006,781 |
| Sales | $145,436,771 | $2,957,270,833 |
7 Shares of Beneficial Interest
Each Fund’s Declaration of Trust permits the Trustees to issue an unlimited number of full and fractional shares of beneficial interest (without par value). Such shares may be issued in a number of different series (such as the Funds) and classes. Transactions in Fund shares, including direct exchanges pursuant to share class conversions for all periods presented, were as follows:
| AMT-Free Fund | | | |
| | | Year Ended
September 30, 2023 | | Year Ended
September 30, 2022 |
| | | Shares | Amount | Shares | Amount |
| Class A | | | | | |
| Sales | | 1,888,917 | $ 14,993,570 | 1,383,193 | $ 11,828,411 |
| Issued to shareholders electing to receive payments of distributions in Fund shares | | 412,323 | 3,293,503 | 360,010 | 3,096,193 |
| Redemptions | | (3,699,939) | (29,564,513) | (4,119,650) | (35,134,920) |
| Net decrease | | (1,398,699) | $(11,277,440) | (2,376,447) | $(20,210,316) |
| Class C | | | | | |
| Sales | | 132,801 | $ 1,060,779 | 35,647 | $ 317,123 |
| Issued to shareholders electing to receive payments of distributions in Fund shares | | 13,573 | 107,806 | 15,751 | 134,955 |
| Redemptions | | (350,028) | (2,803,687) | (393,912) | (3,344,737) |
| Net decrease | | (203,654) | $ (1,635,102) | (342,514) | $ (2,892,659) |
| Class I | | | | | |
| Sales | | 7,686,554 | $ 67,351,799 | 5,504,437 | $ 51,653,218 |
| Issued to shareholders electing to receive payments of distributions in Fund shares | | 462,122 | 4,032,283 | 410,806 | 3,874,689 |
| Redemptions | | (8,214,826) | (71,802,602) | (10,004,257) | (93,270,999) |
| Net decrease | | (66,150) | $ (418,520) | (4,089,014) | $(37,743,092) |
Eaton Vance
Municipal Income Funds
September 30, 2023
Notes to Financial Statements — continued
| National Fund | | | |
| | | Year Ended
September 30, 2023 | | Year Ended
September 30, 2022 |
| | | Shares | Amount | Shares | Amount |
| Class A | | | | | |
| Sales | | 17,509,254 | $ 159,744,009 | 10,084,810 | $ 96,476,496 |
| Issued to shareholders electing to receive payments of distributions in Fund shares | | 4,046,834 | 36,759,694 | 3,099,907 | 29,725,930 |
| Redemptions | | (27,121,465) | (246,291,872) | (29,993,424) | (288,815,393) |
| Net decrease | | (5,565,377) | $ (49,788,169) | (16,808,707) | $ (162,612,967) |
| Class C | | | | | |
| Sales | | 1,180,431 | $ 10,743,048 | 590,143 | $ 5,726,338 |
| Issued to shareholders electing to receive payments of distributions in Fund shares | | 151,181 | 1,373,270 | 124,890 | 1,197,694 |
| Redemptions | | (2,435,564) | (22,168,619) | (3,588,913) | (34,592,881) |
| Net decrease | | (1,103,952) | $ (10,052,301) | (2,873,880) | $ (27,668,849) |
| Class I | | | | | |
| Sales | | 195,677,015 | $ 1,778,704,708 | 138,884,926 | $ 1,320,089,504 |
| Issued to shareholders electing to receive payments of distributions in Fund shares | | 7,485,180 | 67,982,627 | 4,908,694 | 47,139,306 |
| Redemptions | | (131,390,441) | (1,187,986,860) | (156,108,342) | (1,486,157,857) |
| Net increase (decrease) | | 71,771,754 | $ 658,700,475 | (12,314,722) | $ (118,929,047) |
8 Financial Instruments
The Funds may trade in financial instruments with off-balance sheet risk in the normal course of their investing activities. These financial instruments may include futures contracts and may involve, to a varying degree, elements of risk in excess of the amounts recognized for financial statement purposes. The notional or contractual amounts of these instruments represent the investment a Fund has in particular classes of financial instruments and do not necessarily represent the amounts potentially subject to risk. The measurement of the risks associated with these instruments is meaningful only when all related and offsetting transactions are considered. A summary of obligations under these financial instruments at September 30, 2023 is included in the Portfolio of Investments. At September 30, 2023, National Fund had sufficient cash and/or securities to cover commitments under these contracts.
Each Fund is subject to interest rate risk in the normal course of pursuing its investment objective. Because the Funds hold fixed-rate bonds, the value of these bonds may decrease if interest rates rise. During the year ended September 30, 2023, National Fund entered into U.S. Treasury futures contracts to hedge against changes in interest rates.
The fair value of open derivative instruments (not considered to be hedging instruments for accounting disclosure purposes) and whose primary underlying risk exposure is interest rate risk at September 30, 2023 was as follows:
| | National
Fund |
| Asset Derivatives | |
| Futures contracts | $4,363,160 (1) |
| (1) | Only the current day’s variation margin on open futures contracts is reported within the Statement of Assets and Liabilities as Receivable or Payable for variation margin on open futures contracts, as applicable. |
Eaton Vance
Municipal Income Funds
September 30, 2023
Notes to Financial Statements — continued
The effect of derivative instruments (not considered to be hedging instruments for accounting disclosure purposes) on the Statement of Operations and whose primary underlying risk exposure is interest rate risk for the year ended September 30, 2023 was as follows:
| | National
Fund |
| Realized Gain (Loss) on Derivatives Recognized in Income | $18,630,246 (1) |
| Change in Unrealized Appreciation (Depreciation) on Derivatives Recognized in Income | $ (5,724,409)(2) |
| (1) | Statement of Operations location: Net realized gain (loss): Futures contracts. |
| (2) | Statement of Operations location: Change in unrealized appreciation (depreciation): Futures contracts. |
The average notional cost of futures contracts outstanding during the year ended September 30, 2023, which is indicative of the volume of this derivative type, was approximately as follows:
| | National
Fund |
| Average Notional Cost: | |
| Futures Contracts — Short | $117,488,000 |
9 Line of Credit
The Funds participate with other portfolios and funds managed by EVM and its affiliates in a $725 million unsecured revolving line of credit agreement with a group of banks, which is in effect through October 24, 2023. Borrowings are made by the Funds solely for temporary purposes related to redemptions and other short-term cash needs. Interest is charged to each Fund based on its borrowings at an amount above either the Secured Overnight Financing Rate (SOFR) or Federal Funds rate. In addition, a fee computed at an annual rate of 0.15% on the daily unused portion of the line of credit is allocated among the participating portfolios and funds at the end of each quarter. In connection with the renewal of the agreement in October 2022, an arrangement fee totaling $150,000 was incurred that was allocated to the participating portfolios and funds. Because the line of credit is not available exclusively to the Funds, a Fund may be unable to borrow some or all of its requested amounts at any particular time. The Funds did not have any significant borrowings or allocated fees during the year ended September 30, 2023. Effective October 24, 2023, the Funds renewed their line of credit agreement, which expires October 22, 2024. In connection with the renewal, the borrowing limit was decreased to $650 million.
10 Fair Value Measurements
Under generally accepted accounting principles for fair value measurements, a three-tier hierarchy to prioritize the assumptions, referred to as inputs, is used in valuation techniques to measure fair value. The three-tier hierarchy of inputs is summarized in the three broad levels listed below.
| • | Level 1 – quoted prices in active markets for identical investments |
| • | Level 2 – other significant observable inputs (including quoted prices for similar investments, interest rates, prepayment speeds, credit risk, etc.) |
| • | Level 3 – significant unobservable inputs (including a fund's own assumptions in determining the fair value of investments) |
In cases where the inputs used to measure fair value fall in different levels of the fair value hierarchy, the level disclosed is determined based on the lowest level input that is significant to the fair value measurement in its entirety. The inputs or methodology used for valuing securities are not necessarily an indication of the risk associated with investing in those securities.
Eaton Vance
Municipal Income Funds
September 30, 2023
Notes to Financial Statements — continued
At September 30, 2023, the hierarchy of inputs used in valuing the Funds' investments and open derivative instruments, which are carried at value, were as follows:
| AMT-Free Fund | | | | |
| Asset Description | Level 1 | Level 2 | Level 3 | Total |
| Tax-Exempt Mortgage-Backed Securities | $ — | $ 891,446 | $ — | $ 891,446 |
| Tax-Exempt Municipal Obligations | — | 221,766,518 | — | 221,766,518 |
| Total Investments | $ — | $ 222,657,964 | $ — | $ 222,657,964 |
| National Fund | | | | |
| Asset Description | Level 1 | Level 2 | Level 3 | Total |
| Corporate Bonds | $ — | $ 43,738,650 | $ — | $ 43,738,650 |
| Tax-Exempt Municipal Obligations | — | 3,448,093,792 | — | 3,448,093,792 |
| Taxable Municipal Obligations | — | 250,722,768 | — | 250,722,768 |
| Total Investments | $ — | $ 3,742,555,210 | $ — | $3,742,555,210 |
| Futures Contracts | $ 4,363,160 | $ — | $ — | $ 4,363,160 |
| Total | $ 4,363,160 | $ 3,742,555,210 | $ — | $3,746,918,370 |
Eaton Vance
AMT-Free Municipal Income Fund
September 30, 2023
Report of Independent Registered Public Accounting Firm
To the Trustees of Eaton Vance Mutual Funds Trust and Shareholders of Eaton Vance AMT-Free Municipal Income Fund:
Opinion on the Financial Statements and Financial Highlights
We have audited the accompanying statement of assets and liabilities of Eaton Vance AMT-Free Municipal Income Fund (the "Fund") (one of the funds constituting Eaton Vance Mutual Funds Trust), including the portfolio of investments, as of September 30, 2023, the related statement of operations for the year then ended, the statements of changes in net assets for each of the two years in the period then ended, the financial highlights for each of the five years in the period then ended, and the related notes. In our opinion, the financial statements and financial highlights present fairly, in all material respects, the financial position of the Fund as of September 30, 2023, and the results of its operations for the year then ended, the changes in its net assets for each of the two years in the period then ended, and the financial highlights for each of the five years in the period then ended, in conformity with accounting principles generally accepted in the United States of America.
Basis for Opinion
These financial statements and financial highlights are the responsibility of the Fund's management. Our responsibility is to express an opinion on the Fund's financial statements and financial highlights based on our audits. We are a public accounting firm registered with the Public Company Accounting Oversight Board (United States) (PCAOB) and are required to be independent with respect to the Fund in accordance with the U.S. federal securities laws and the applicable rules and regulations of the Securities and Exchange Commission and the PCAOB.
We conducted our audits in accordance with the standards of the PCAOB. Those standards require that we plan and perform the audit to obtain reasonable assurance about whether the financial statements and financial highlights are free of material misstatement, whether due to error or fraud. The Fund is not required to have, nor were we engaged to perform, an audit of its internal control over financial reporting. As part of our audits, we are required to obtain an understanding of internal control over financial reporting but not for the purpose of expressing an opinion on the effectiveness of the Fund’s internal control over financial reporting. Accordingly, we express no such opinion.
Our audits included performing procedures to assess the risks of material misstatement of the financial statements and financial highlights, whether due to error or fraud, and performing procedures that respond to those risks. Such procedures included examining, on a test basis, evidence regarding the amounts and disclosures in the financial statements and financial highlights. Our audits also included evaluating the accounting principles used and significant estimates made by management, as well as evaluating the overall presentation of the financial statements and financial highlights. Our procedures included confirmation of securities owned as of September 30, 2023, by correspondence with the custodian and brokers; when replies were not received from brokers, we performed other auditing procedures. We believe that our audits provide a reasonable basis for our opinion.
/s/ Deloitte & Touche LLP
Boston, Massachusetts
November 20, 2023
We have served as the auditor of one or more Eaton Vance investment companies since 1959.
Eaton Vance
National Municipal Income Fund
September 30, 2023
Report of Independent Registered Public Accounting Firm
To the Trustees of Eaton Vance Municipals Trust and Shareholders of Eaton Vance National Municipal Income Fund:
Opinion on the Financial Statements and Financial Highlights
We have audited the accompanying statement of assets and liabilities of Eaton Vance National Municipal Income Fund (the "Fund") (one of the funds constituting Eaton Vance Municipals Trust), including the portfolio of investments, as of September 30, 2023, the related statement of operations for the year then ended, the statements of changes in net assets for each of the two years in the period then ended, the financial highlights for each of the five years in the period then ended, and the related notes. In our opinion, the financial statements and financial highlights present fairly, in all material respects, the financial position of the Fund as of September 30, 2023, and the results of its operations for the year then ended, the changes in its net assets for each of the two years in the period then ended, and the financial highlights for each of the five years in the period then ended, in conformity with accounting principles generally accepted in the United States of America.
Basis for Opinion
These financial statements and financial highlights are the responsibility of the Fund's management. Our responsibility is to express an opinion on the Fund's financial statements and financial highlights based on our audits. We are a public accounting firm registered with the Public Company Accounting Oversight Board (United States) (PCAOB) and are required to be independent with respect to the Fund in accordance with the U.S. federal securities laws and the applicable rules and regulations of the Securities and Exchange Commission and the PCAOB.
We conducted our audits in accordance with the standards of the PCAOB. Those standards require that we plan and perform the audit to obtain reasonable assurance about whether the financial statements and financial highlights are free of material misstatement, whether due to error or fraud. The Fund is not required to have, nor were we engaged to perform, an audit of its internal control over financial reporting. As part of our audits, we are required to obtain an understanding of internal control over financial reporting but not for the purpose of expressing an opinion on the effectiveness of the Fund’s internal control over financial reporting. Accordingly, we express no such opinion.
Our audits included performing procedures to assess the risks of material misstatement of the financial statements and financial highlights, whether due to error or fraud, and performing procedures that respond to those risks. Such procedures included examining, on a test basis, evidence regarding the amounts and disclosures in the financial statements and financial highlights. Our audits also included evaluating the accounting principles used and significant estimates made by management, as well as evaluating the overall presentation of the financial statements and financial highlights. Our procedures included confirmation of securities owned as of September 30, 2023, by correspondence with the custodian and brokers; when replies were not received from brokers, we performed other auditing procedures. We believe that our audits provide a reasonable basis for our opinion.
/s/ Deloitte & Touche LLP
Boston, Massachusetts
November 20, 2023
We have served as the auditor of one or more Eaton Vance investment companies since 1959.
Eaton Vance
Municipal Income Funds
September 30, 2023
Federal Tax Information (Unaudited)
The Form 1099-DIV you receive in February 2024 will show the tax status of all distributions paid to your account in calendar year 2023. Shareholders are advised to consult their own tax adviser with respect to the tax consequences of their investment in the Funds. As required by the Internal Revenue Code and/or regulations, shareholders must be notified regarding the status of exempt-interest dividends.
Exempt-Interest Dividends. For the fiscal year ended September 30, 2023, the Funds designate the following percentages of distributions from net investment income as exempt-interest dividends:
| AMT-Free Municipal Income Fund | 100.00% |
| National Municipal Income Fund | 92.53% |
Eaton Vance
Municipal Income Funds
September 30, 2023
Board of Trustees’ Contract Approval
Overview of the Contract Review Process
The Investment Company Act of 1940, as amended (the “1940 Act”), provides, in substance, that the investment advisory agreement between a fund and its investment adviser will continue in effect from year-to-year only if its continuation is approved on an annual basis by a vote of the fund’s board of trustees, including a majority of the trustees who are not “interested persons” of the fund (“independent trustees”), cast in person at a meeting called for the purpose of considering such approval.
At a meeting held on June 8, 2023, the Boards of Trustees/Directors (collectively, the “Board”) that oversee the registered investment companies advised by Eaton Vance Management or its affiliate, Boston Management and Research (the “Eaton Vance Funds”), including a majority of the independent trustees (the “Independent Trustees”), voted to approve the continuation of existing investment advisory agreements and sub-advisory agreements1 for each of the Eaton Vance Funds for an additional one-year period. The Board relied upon the affirmative recommendation of its Contract Review Committee, which is a committee exclusively comprised of Independent Trustees. Prior to making its recommendation, the Contract Review Committee reviewed information furnished by the adviser and sub-adviser to each of the Eaton Vance Funds (including information specifically requested by the Board) for a series of formal meetings held between April and June 2023, as well as certain additional information provided in response to specific requests from the Independent Trustees as members of the Contract Review Committee. Members of the Contract Review Committee also considered information received at prior meetings of the Board and its committees, to the extent such information was relevant to the Contract Review Committee’s annual evaluation of the investment advisory agreements and sub-advisory agreements.
In connection with its evaluation of the investment advisory agreements and sub-advisory agreements, the Board considered various information relating to the Eaton Vance Funds. This included information applicable to all or groups of Eaton Vance Funds, which is referenced immediately below, and information applicable to the particular Eaton Vance Fund covered by this report (each “Eaton Vance Fund” is referred to below as a “fund”). (For funds that invest through one or more underlying portfolios, references to “each fund” in this section may include information that was considered at the portfolio-level.)
Information about Fees, Performance and Expenses
• A report from an independent data provider comparing advisory and other fees paid by each fund to such fees paid by comparable funds, as identified by the independent data provider (“comparable funds”);
• A report from an independent data provider comparing each fund’s total expense ratio (and its components) to those of comparable funds;
• A report from an independent data provider comparing the investment performance of each fund (including, as relevant, total return data, income data, Sharpe ratios and information ratios) to the investment performance of comparable funds and, as applicable, benchmark indices, over various time periods;
• In certain instances, data regarding investment performance relative to customized groups of peer funds and blended indices identified by the adviser in consultation with the Portfolio Management Committee of the Board (a committee exclusively comprised of Independent Trustees);
• Comparative information concerning the fees charged and services provided by the adviser and sub-adviser to each fund in managing other accounts (which may include other mutual funds, collective investment funds and institutional accounts) using investment strategies and techniques similar to those used in managing such fund(s), if any;
• Profitability analyses with respect to the adviser and sub-adviser to each of the funds;
Information about Portfolio Management and Trading
• Descriptions of the investment management services provided to each fund, as well as each of the funds’ investment strategies and policies;
• The procedures and processes used to determine the value of fund assets, including, when necessary, the determination of “fair value” and actions taken to monitor and test the effectiveness of such procedures and processes;
• Information about the policies and practices of each fund’s adviser and sub-adviser with respect to trading, including their processes for seeking best execution of portfolio transactions;
• Information about the allocation of brokerage transactions and the benefits, if any, received by the adviser and sub-adviser to each fund as a result of brokerage allocation, including, as applicable, information concerning the acquisition of research through client commission arrangements and policies with respect to “soft dollars”;
• Data relating to the portfolio turnover rate of each fund and related information regarding active management in the context of particular strategies;
Information about each Adviser and Sub-adviser
• Reports detailing the financial results and condition of the adviser and sub-adviser to each fund;
• Information regarding the individual investment professionals whose responsibilities include portfolio management and investment research for the funds, and, for portfolio managers and certain other investment professionals, information relating to their responsibilities with respect to managing other mutual funds and investment accounts, as applicable;
1 Not all Eaton Vance Funds have entered into a sub-advisory agreement with a sub-adviser. Accordingly, references to “sub-adviser” or “sub-advisory agreement” in this “Overview” section may not be applicable to the particular Eaton Vance Fund covered by this report.
Eaton Vance
Municipal Income Funds
September 30, 2023
Board of Trustees’ Contract Approval — continued
• Information regarding the adviser’s and its parent company’s (Morgan Stanley’s) efforts to retain and attract talented investment professionals, including in the context of a competitive marketplace for talent, as well as the ongoing unique environment presented by hybrid, remote and other alternative work arrangements;
• Information regarding the adviser’s compensation methodology for its investment professionals and the incentives and accountability it creates, along with investment professionals’ investments in the fund(s) they manage;
• The Code of Ethics of the adviser and its affiliates and the sub-adviser of each fund, together with information relating to compliance with, and the administration of, such codes;
• Policies and procedures relating to proxy voting, including regular reporting with respect to fund proxy voting activities;
• Information regarding the handling of corporate actions and class actions, as well as information regarding litigation and other regulatory matters;
• Information concerning the resources devoted to compliance efforts undertaken by the adviser and its affiliates and the sub-adviser of each fund, if any, including descriptions of their various compliance programs and their record of compliance;
• Information concerning the business continuity and disaster recovery plans of the adviser and its affiliates and the sub-adviser of each fund, if any;
• A description of Eaton Vance Management’s and Boston Management and Research’s oversight of sub-advisers, including with respect to regulatory and compliance issues, investment management and other matters;
Other Relevant Information
• Information regarding ongoing initiatives to further integrate and harmonize, where applicable, the investment management and other departments of the adviser and its affiliates with the overall investment management infrastructure of Morgan Stanley, in light of Morgan Stanley’s acquisition of Eaton Vance Corp. on March 1, 2021;
• Information concerning the nature, cost and character of the administrative and other non-investment advisory services provided by Eaton Vance Management and its affiliates;
• Information concerning oversight of the relationship with the custodian, subcustodians, fund accountants, and other third-party service providers by the adviser and/or administrator to each of the funds;
• Information concerning efforts to implement policies and procedures with respect to various recently adopted regulations applicable to the funds, including Rule 12d1-4 (the Fund-of-Funds Rule), Rule 18f-4 (the Derivatives Rule) and Rule 2a-5 (the Fair Valuation Rule);
• For an Eaton Vance Fund structured as an exchange-listed closed-end fund, information concerning the benefits of the closed-end fund structure, as well as, where relevant, the closed-end fund’s market prices (including as compared to the closed-end fund’s net asset value (NAV)), trading volume data, continued use of auction preferred shares (where applicable), distribution rates and other relevant matters;
• The risks which the adviser and/or its affiliates incur in connection with the management and operation of the funds, including, among others, litigation, regulatory, entrepreneurial, and other business risks (and the associated costs of such risks); and
• The terms of each investment advisory agreement and sub-advisory agreement.
During the various meetings of the Board and its committees over the course of the year leading up to the June 8, 2023 meeting, the Board received information from portfolio managers and other investment professionals of the advisers and sub-advisers of the funds regarding investment and performance matters, and considered various investment and trading strategies used in pursuing the funds’ investment objectives. The Board also received information regarding risk management techniques employed in connection with the management of the funds. The Board and its committees evaluated issues pertaining to industry and regulatory developments, compliance procedures, fund governance and other issues with respect to the funds, and received and participated in reports and presentations provided by Eaton Vance Management, Boston Management and Research and fund sub-advisers, with respect to such matters. In addition to the formal meetings of the Board and its committees, the Independent Trustees held regular teleconferences to discuss, among other topics, matters relating to the continuation of investment advisory agreements and sub-advisory agreements.
The Contract Review Committee was advised throughout the contract review process by Goodwin Procter LLP, independent legal counsel for the Independent Trustees. The members of the Contract Review Committee, with the advice of such counsel, exercised their own business judgment in determining the material factors to be considered in evaluating each investment advisory agreement and sub-advisory agreement and the weight to be given to each such factor. The conclusions reached with respect to each investment advisory agreement and sub-advisory agreement were based on a comprehensive evaluation of all the information provided and not any single factor. Moreover, each member of the Contract Review Committee may have placed varying emphasis on particular factors in reaching conclusions with respect to each investment advisory agreement and sub-advisory agreement. In evaluating each investment advisory agreement and sub-advisory agreement, including the fee structures and other terms contained in such agreements, the members of the Contract Review Committee were also informed by multiple years of analysis and discussion with the adviser and sub-adviser to each of the Eaton Vance Funds.
Results of the Contract Review Process
Based on its consideration of the foregoing, and such other information it deemed relevant, including the factors and conclusions described below, the Contract Review Committee concluded that (i) the continuation of the investment advisory agreement between Eaton Vance AMT-Free Municipal Income Fund (the “AMT-Free Muni Income Fund”) and Eaton Vance Management (“EVM”) and (ii) the continuation of the investment advisory agreement between Eaton Vance National Municipal Income Fund (the “National Muni Income Fund”, together with the AMT-Free Muni Income Fund, the “Funds” and each, a “Fund”) and Boston Management and Research (“BMR”) (EVM, with respect to the AMT-Free Muni Income Fund, and BMR, with respect to the National
Eaton Vance
Municipal Income Funds
September 30, 2023
Board of Trustees’ Contract Approval — continued
Muni Income Fund, are each referred to herein as the “Adviser”), including their respective fee structures, are in the interests of shareholders and, therefore, recommended to the Board approval of each agreement. Based on the recommendation of the Contract Review Committee, the Board, including a majority of the Independent Trustees, voted to approve continuation of the investment advisory agreement for each Fund.
Nature, Extent and Quality of Services
In considering whether to approve the investment advisory agreement for each Fund, the Board evaluated the nature, extent and quality of services provided to the Funds by the applicable Adviser.
The Board considered each Adviser’s management capabilities and investment processes in light of the types of investments held by each Fund, respectively, including the education, experience and number of investment professionals and other personnel who provide portfolio management, investment research, and similar services to the Funds. In particular, the Board considered, where relevant, the abilities and experience of each Adviser’s investment professionals in analyzing factors such as credit risk, tax efficiency, and special considerations relevant to investing in municipal obligations. The Board considered each Adviser’s municipal bond team, which includes investment professionals and credit specialists who provide services to the applicable Fund. The Board also took into account the resources dedicated to portfolio management and other services, the compensation methods of each Adviser and other factors, including the reputation and resources of the Adviser to recruit and retain highly qualified research, advisory and supervisory investment professionals. In addition, the Board considered the time and attention devoted to the Eaton Vance Funds, including each Fund, by senior management, as well as the infrastructure, operational capabilities and support staff in place to assist in the portfolio management and operations of the Funds, including the provision of administrative services. The Board also considered the business-related and other risks to which the Advisers or its affiliates may be subject in managing the Funds.
The Board considered the compliance programs of each Adviser and relevant affiliates thereof. The Board considered compliance and reporting matters regarding, among other things, personal trading by investment professionals, disclosure of portfolio holdings, late trading, frequent trading, portfolio valuation, business continuity and the allocation of investment opportunities. The Board also considered the responses of each Adviser and its affiliates to requests in recent years from regulatory authorities, such as the Securities and Exchange Commission and the Financial Industry Regulatory Authority.
The Board considered other administrative services provided or overseen by Eaton Vance Management and its affiliates, including transfer agency and accounting services. The Board evaluated the benefits to shareholders of investing in a fund that is a part of a large fund complex offering exposure to a variety of asset classes and investment disciplines, as well as the ability, in many cases, to exchange an investment among different funds without incurring additional sales charges.
After consideration of the foregoing factors, among others, the Board concluded that the nature, extent and quality of services provided by each Adviser, taken as a whole, are appropriate and consistent with the terms of the applicable investment advisory agreement.
Fund Performance
The Board compared each Fund’s investment performance to that of comparable funds identified by an independent data provider (the peer group), as well as an appropriate benchmark index, and assessed each Fund’s performance on the basis of total return and current income return. The Board’s review included comparative performance data with respect to each Fund for the one-, three-, five- and ten-year periods ended September 30, 2022.
In this regard, the Board noted each Fund’s performance relative to its peer group and benchmark index for the three-year period, as follows:
| | Performance Relative to: |
| Fund | Median of
Peer Group | Benchmark
Index |
| Eaton Vance AMT-Free Municipal Income Fund | Lower | Lower |
| Eaton Vance National Municipal Income Fund | Higher | Lower |
The Board considered, among other things, each Adviser’s efforts to generate competitive levels of tax-exempt current income over time through investments that, relative to comparable funds, focus on higher quality municipal bonds with longer maturities. With respect to the Eaton Vance AMT-Free Municipal Income Fund, the Board also considered that, in response to inquiries from the Contract Review Committee, the Fund’s underperformance relative to its benchmark was largely attributed to overweight allocations to longer duration securities, which underperformed during the final year of the three-year period. The Board also noted that the income return of the Fund was higher than the median income return of the Fund’s peer group for the three-year period. On the basis of the foregoing and other relevant information provided by the Adviser in response to inquiries from the Contract Review Committee, the Board determined to continue to monitor the performance of the Fund. With respect to the Eaton Vance National Municipal Income Fund, the Board concluded that the performance of the Fund was satisfactory.
Eaton Vance
Municipal Income Funds
September 30, 2023
Board of Trustees’ Contract Approval — continued
Management Fees and Expenses
The Board considered contractual fee rates payable by each Fund for advisory and administrative services (referred to collectively as “management fees”). As part of its review, the Board considered each Fund’s management fees and total expense ratio for the one-year period ended December 31, 2022, as compared to those of comparable funds, before and after giving effect to any undertaking to waive fees or reimburse expenses. The Board also considered factors that had an impact on each Fund’s total expense ratio relative to comparable funds.
After considering the foregoing information, and in light of the nature, extent and quality of the services provided by each Adviser, the Board concluded that the management fees charged for advisory and related services are reasonable.
Profitability and “Fall-Out” Benefits
The Board considered the level of profits realized by each Adviser and relevant affiliates thereof in providing investment advisory and administrative services to each Fund and to all Eaton Vance Funds as a group. The Board considered the level of profits realized without regard to marketing support or other payments by each Adviser and its affiliates to third parties in respect of distribution or other services.
The Board concluded that, in light of the foregoing factors and the nature, extent and quality of the services rendered, the profits realized by each Adviser and its affiliates are deemed not to be excessive.
The Board also considered direct or indirect fall-out benefits received by each Adviser and its affiliates in connection with their respective relationships with the Funds, including the benefits of research services that may be available to each Adviser as a result of securities transactions effected for the Funds and other investment advisory clients.
Economies of Scale
In reviewing management fees and profitability, the Board also considered the extent to which the applicable Adviser and its affiliates, on the one hand, and each Fund, on the other hand, can expect to realize benefits from economies of scale as the assets of each Fund increase. The Board acknowledged the difficulty in accurately measuring the benefits resulting from economies of scale, if any, with respect to the management of any specific fund or group of funds. The Board reviewed data summarizing the increases and decreases in the assets of each Fund and of all Eaton Vance Funds as a group over various time periods, and evaluated the extent to which the total expense ratio of each Fund and the profitability of each Adviser and its affiliates may have been affected by such increases or decreases. Based upon the foregoing, the Board concluded that each Fund currently shares in the benefits from economies of scale, if any, when they are realized by the Adviser. The Board also concluded that the structure of each advisory fee, which includes breakpoints at several asset levels, will allow each Fund to continue to benefit from any economies of scale in the future.
Eaton Vance
Municipal Income Funds
September 30, 2023
Liquidity Risk Management Program
Each Fund has implemented a written liquidity risk management program (Program) and related procedures to manage its liquidity in accordance with Rule 22e-4 under the Investment Company Act of 1940, as amended (Liquidity Rule). The Liquidity Rule defines “liquidity risk” as the risk that a fund could not meet requests to redeem shares issued by the fund without significant dilution of the remaining investors’ interests in the fund. Each Fund’s Board of Trustees/Directors has designated the investment adviser to serve as the administrator of the Program and the related procedures. The administrator has established a Liquidity Risk Management Oversight Committee (Committee) to perform the functions necessary to administer the Program. As part of the Program, the administrator is responsible for identifying illiquid investments and categorizing the relative liquidity of each Fund’s investments in accordance with the Liquidity Rule. Under the Program, the administrator assesses, manages, and periodically reviews each Fund’s liquidity risk, and is responsible for making certain reports to the Fund’s Board of Trustees/Directors and the Securities and Exchange Commission (SEC) regarding the liquidity of the Fund’s investments, and to notify the Board of Trustees/Directors and the SEC of certain liquidity events specified in the Liquidity Rule. The liquidity of each Fund’s portfolio investments is determined based on a number of factors including, but not limited to, relevant market, trading and investment-specific considerations under the Program.
At a meeting of each Fund’s Board of Trustees/Directors on June 7, 2023, the Committee provided a written report to the Fund’s Board of Trustees/
Directors pertaining to the operation, adequacy, and effectiveness of implementation of the Program, as well as the operation of the highly liquid investment minimum (if applicable) for the period January 1, 2022 through December 31, 2022 (Review Period). The Program operated effectively during the Review Period, supporting the administrator’s ability to assess, manage and monitor Fund liquidity risk, including during periods of market volatility and net redemptions. During the Review Period, each Fund met redemption requests on a timely basis.
There can be no assurance that the Program will achieve its objectives in the future. Please refer to each Fund’s prospectus for more information regarding the Fund’s exposure to liquidity risk and other principal risks to which an investment in the Fund may be subject.
Eaton Vance
Municipal Income Funds
September 30, 2023
Management and Organization
Fund Management. The Trustees of Eaton Vance Municipals Trust and Eaton Vance Mutual Funds Trust (collectively, the Trusts) are responsible for the overall management and supervision of the Trust's affairs. The Board members and officers of the Trust are listed below. Except as indicated, each individual has held the office shown or other offices in the same company for the last five years. Board members hold indefinite terms of office. Each Trustee holds office until his or her successor is elected and qualified, subject to a prior death, resignation, retirement, disqualification or removal. Under the terms of the Fund's current Trustee retirement policy, an Independent Trustee must retire and resign as a Trustee on the earlier of: (i) the first day of July following his or her 74th birthday; or (ii), with limited exception, December 31st of the 20th year in which he or she has served as a Trustee. However, if such retirement and resignation would cause the Funds to be out of compliance with Section 16 of the 1940 Act or any other regulations or guidance of the SEC, then such retirement and resignation will not become effective until such time as action has been taken for the Funds to be in compliance therewith. The “noninterested Trustees” consist of those Trustees who are not “interested persons” of the Trusts, as that term is defined under the 1940 Act. The business address of each Board member and officer is Two International Place, Boston, Massachusetts 02110. As used below, “BMR” refers to Boston Management and Research, “EV” refers to EV LLC, “EVM” refers to Eaton Vance Management, “MSIM” refers to Morgan Stanley Investment Management Inc. and “EVD” refers to Eaton Vance Distributors, Inc. EV is the trustee of each of EVM and BMR. Each of EVM, BMR, EVD and EV are indirect, wholly owned subsidiaries of Morgan Stanley. Each officer affiliated with EVM may hold a position with other EVM affiliates that is comparable to his or her position with EVM listed below. Each Trustee oversees 127 funds in the Eaton Vance fund complex (including both funds and portfolios in a hub and spoke structure).
| Name and Year of Birth | Trust
Position(s) | Length of Service | Principal Occupation(s) and Other Directorships
During Past Five Years and Other Relevant Experience |
| Interested Trustee |
Anchal Pachnanda(1)
1980 | Trustee | Since 2023 | Co-Head of Strategy of MSIM (since 2019). Formerly, Head of Strategy of MSIM (2017-2019). Ms. Pachnanda is an interested person because of her position with MSIM, which is an affiliate of the Trusts.
Other Directorships. None. |
| Noninterested Trustees |
Alan C. Bowser
1962 | Trustee | Since 2022 | Private investor. Formerly, Chief Diversity Officer, Partner and a member of the Operating Committee, and formerly served as Senior Advisor on Diversity and Inclusion for the firm’s chief executive officer, Co-Head of the Americas Region, and Senior Client Advisor of Bridgewater Associates, an asset management firm (2011- 2023).
Other Directorships. Independent Director of Stout Risius Ross (a middle market professional services advisory firm) (since 2021). |
Mark R. Fetting
1954 | Trustee | Since 2016 | Private investor. Formerly held various positions at Legg Mason, Inc. (investment management firm) (2000-2012), including President, Chief Executive Officer, Director and Chairman (2008-2012), Senior Executive Vice President (2004-2008) and Executive Vice President (2001-2004). Formerly, President of Legg Mason family of funds (2001-2008). Formerly, Division President and Senior Officer of Prudential Financial Group, Inc. and related companies (investment management firm) (1991-2000).
Other Directorships. None. |
Cynthia E. Frost
1961 | Trustee | Since 2014 | Private investor. Formerly, Chief Investment Officer of Brown University (university endowment) (2000-2012). Formerly, Portfolio Strategist for Duke Management Company (university endowment manager) (1995-2000). Formerly, Managing Director, Cambridge Associates (investment consulting company) (1989-1995). Formerly, Consultant, Bain and Company (management consulting firm) (1987-1989). Formerly, Senior Equity Analyst, BA Investment Management Company (1983-1985).
Other Directorships. None. |
George J. Gorman
1952 | Chairperson
of the Board
and Trustee | Since 2021
(Chairperson) and
2014 (Trustee) | Principal at George J. Gorman LLC (consulting firm). Formerly, Senior Partner at Ernst & Young LLP (a registered public accounting firm) (1974-2009).
Other Directorships. None. |
Eaton Vance
Municipal Income Funds
September 30, 2023
Management and Organization — continued
| Name and Year of Birth | Trust
Position(s) | Length of Service | Principal Occupation(s) and Other Directorships
During Past Five Years and Other Relevant Experience |
| Noninterested Trustees (continued) |
Valerie A. Mosley
1960 | Trustee | Since 2014 | Chairwoman and Chief Executive Officer of Valmo Ventures (a consulting and investment firm). Founder of Upward Wealth, Inc., dba BrightUp, a fintech platform. Formerly, Partner and Senior Vice President, Portfolio Manager and Investment Strategist at Wellington Management Company, LLP (investment management firm) (1992-2012). Formerly, Chief Investment Officer, PG Corbin Asset Management (1990-1992). Formerly worked in institutional corporate bond sales at Kidder Peabody (1986-1990).
Other Directorships. Director of DraftKings, Inc. (digital sports entertainment and gaming company) (since September 2020). Director of Envestnet, Inc. (provider of intelligent systems for wealth management and financial wellness) (since 2018). Formerly, Director of Dynex Capital, Inc. (mortgage REIT) (2013-2020) and Director of Groupon, Inc. (e-commerce provider) (2020-2022). |
Keith Quinton
1958 | Trustee | Since 2018 | Private investor, researcher and lecturer. Formerly, Independent Investment Committee Member at New Hampshire Retirement System (2017-2021). Formerly, Portfolio Manager and Senior Quantitative Analyst at Fidelity Investments (investment management firm) (2001-2014).
Other Directorships. Formerly, Director (2016-2021) and Chairman (2019-2021) of New Hampshire Municipal Bond Bank. |
Marcus L. Smith
1966 | Trustee | Since 2018 | Private investor and independent corporate director. Formerly, Chief Investment Officer, Canada (2012-2017), Chief Investment Officer, Asia (2010-2012), Director of Asian Research (2004-2010) and portfolio manager (2001-2017) at MFS Investment Management (investment management firm).
Other Directorships. Director of First Industrial Realty Trust, Inc. (an industrial REIT) (since 2021). Director of MSCI Inc. (global provider of investment decision support tools) (since 2017). Formerly, Director of DCT Industrial Trust Inc. (logistics real estate company) (2017-2018). |
Susan J. Sutherland
1957 | Trustee | Since 2015 | Private investor. Director of Ascot Group Limited and certain of its subsidiaries (insurance and reinsurance) (since 2017). Formerly, Director of Hagerty Holding Corp. (insurance) (2015-2018) and Montpelier Re Holdings Ltd. (insurance and reinsurance) (2013-2015). Formerly, Associate, Counsel and Partner at Skadden, Arps, Slate, Meagher & Flom LLP (law firm) (1982-2013).
Other Directorships. Formerly, Director of Kairos Acquisition Corp. (insurance/InsurTech acquisition company) (2021-2023). |
Scott E. Wennerholm
1959 | Trustee | Since 2016 | Private investor. Formerly, Trustee at Wheelock College (postsecondary institution) (2012-2018). Formerly, Consultant at GF Parish Group (executive recruiting firm) (2016-2017). Formerly, Chief Operating Officer and Executive Vice President at BNY Mellon Asset Management (investment management firm) (2005-2011). Formerly, Chief Operating Officer and Chief Financial Officer at Natixis Global Asset Management (investment management firm) (1997-2004). Formerly, Vice President at Fidelity Investments Institutional Services (investment management firm) (1994-1997).
Other Directorships. None. |
Nancy A. Wiser
1967 | Trustee | Since 2022 | Formerly, Executive Vice President and the Global Head of Operations at Wells Fargo Asset Management (2011-2021).
Other Directorships. None. |
| Name and Year of Birth | Trust
Position(s) | Length of Service | Principal Occupation(s)
During Past Five Years |
| Principal Officers who are not Trustees |
Kenneth A. Topping
1966 | President | Since 2023 | Vice President and Chief Administrative Officer of EVM and BMR and Chief Operating Officer for Public Markets at MSIM. Also Vice President of Calvert Research and Management (“CRM”) since 2021. Formerly, Chief Operating Officer for Goldman Sachs Asset Management ‘Classic’ (2009-2020). |
Deidre E. Walsh
1971 | Vice President and
Chief Legal Officer | Since 2009 | Vice President of EVM and BMR. Also Vice President of CRM. |
James F. Kirchner
1967 | Treasurer | Since 2007 | Vice President of EVM and BMR. Also Vice President of CRM. |
Eaton Vance
Municipal Income Funds
September 30, 2023
Management and Organization — continued
| Name and Year of Birth | Trust
Position(s) | Length of Service | Principal Occupation(s)
During Past Five Years |
| Principal Officers who are not Trustees (continued) |
Nicholas S. Di Lorenzo
1987 | Secretary | Since 2022 | Formerly, associate (2012-2021) and counsel (2022) at Dechert LLP. |
Richard F. Froio
1968 | Chief Compliance
Officer | Since 2017 | Vice President of EVM and BMR since 2017. Formerly, Deputy Chief Compliance Officer (Adviser/Funds) and Chief Compliance Officer (Distribution) at PIMCO (2012-2017) and Managing Director at BlackRock/Barclays Global Investors (2009-2012). |
(1) Ms. Pachnanda began serving as Trustee effective April 1, 2023.
The SAI for the Funds includes additional information about the Trustees and officers of the Funds and can be obtained without charge on Eaton Vance’s website at www.eatonvance.com or by calling 1-800-262-1122.
| FACTS | WHAT DOES EATON VANCE DO WITH YOUR
PERSONAL INFORMATION? |
| Why? | Financial companies choose how they share your personal information. Federal law gives consumers the right to limit some but not all sharing. Federal law also requires us to tell you how we collect, share, and protect your personal information. Please read this notice carefully to understand what we do. |
| |
| What? | The types of personal information we collect and share depend on the product or service you have with us. This information can include:■ Social Security number and income
■ investment experience and risk tolerance
■ checking account number and wire transfer instructions |
| |
| How? | All financial companies need to share customers’ personal information to run their everyday business. In the section below, we list the reasons financial companies can share their customers’ personal information; the reasons Eaton Vance chooses to share; and whether you can limit this sharing. |
Reasons we can share your
personal information | Does Eaton Vance
share? | Can you limit
this sharing? |
| For our everyday business purposes — such as to process your transactions, maintain your account(s), respond to court orders and legal investigations, or report to credit bureaus | Yes | No |
| For our marketing purposes — to offer our products and services to you | Yes | No |
| For joint marketing with other financial companies | No | We don’t share |
| For our investment management affiliates’ everyday business purposes — information about your transactions, experiences, and creditworthiness | Yes | Yes |
| For our affiliates’ everyday business purposes — information about your transactions and experiences | Yes | No |
| For our affiliates’ everyday business purposes — information about your creditworthiness | No | We don’t share |
| For our investment management affiliates to market to you | Yes | Yes |
| For our affiliates to market to you | No | We don’t share |
| For nonaffiliates to market to you | No | We don’t share |
To limit our
sharing | Call toll-free 1-800-262-1122 or email: EVPrivacy@eatonvance.comPlease note:If you are a new customer, we can begin sharing your information 30 days from the date we sent this notice. When you are no longer our customer, we continue to share your information as described in this notice. However, you can contact us at any time to limit our sharing. |
| Questions? | Call toll-free 1-800-262-1122 or email: EVPrivacy@eatonvance.com |
| Privacy Notice — continued | April 2021 |
| Who we are |
| Who is providing this notice? | Eaton Vance Management, Eaton Vance Distributors, Inc., Eaton Vance Trust Company, Eaton Vance Management (International) Limited, Eaton Vance Advisers International Ltd., Eaton Vance Global Advisors Limited, Eaton Vance Management’s Real Estate Investment Group, Boston Management and Research, Calvert Research and Management, Eaton Vance and Calvert Fund Families and our investment advisory affiliates (“Eaton Vance”) (see Investment Management Affiliates definition below) |
| What we do |
How does Eaton Vance
protect my personal
information? | To protect your personal information from unauthorized access and use, we use security measures that comply with federal law. These measures include computer safeguards and secured files and buildings. We have policies governing the proper handling of customer information by personnel and requiring third parties that provide support to adhere to appropriate security standards with respect to such information. |
How does Eaton Vance
collect my personal
information? | We collect your personal information, for example, when you■ open an account or make deposits or withdrawals from your account
■ buy securities from us or make a wire transfer
■ give us your contact informationWe also collect your personal information from others, such as credit bureaus, affiliates, or other companies. |
| Why can’t I limit all sharing? | Federal law gives you the right to limit only■ sharing for affiliates’ everyday business purposes — information about your creditworthiness
■ affiliates from using your information to market to you
■ sharing for nonaffiliates to market to youState laws and individual companies may give you additional rights to limit sharing. See below for more on your rights under state law. |
| Definitions |
Investment Management
Affiliates | Eaton Vance Investment Management Affiliates include registered investment advisers, registered broker- dealers, and registered and unregistered funds. Investment Management Affiliates does not include entities associated with Morgan Stanley Wealth Management, such as Morgan Stanley Smith Barney LLC and Morgan Stanley & Co. |
| Affiliates | Companies related by common ownership or control. They can be financial and nonfinancial companies.■ Our affiliates include companies with a Morgan Stanley name and financial companies such as Morgan Stanley Smith Barney LLC and Morgan Stanley & Co. |
| Nonaffiliates | Companies not related by common ownership or control. They can be financial and nonfinancial companies.■ Eaton Vance does not share with nonaffiliates so they can market to you. |
| Joint marketing | A formal agreement between nonaffiliated financial companies that together market financial products or services to you.■ Eaton Vance doesn’t jointly market. |
| Other important information |
| Vermont: Except as permitted by law, we will not share personal information we collect about Vermont residents with Nonaffiliates unless you provide us with your written consent to share such information.California: Except as permitted by law, we will not share personal information we collect about California residents with Nonaffiliates and we will limit sharing such personal information with our Affiliates to comply with California privacy laws that apply to us. |
Delivery of Shareholder Documents. The Securities and Exchange Commission (SEC) permits funds to deliver only one copy of shareholder documents, including prospectuses, proxy statements and shareholder reports, to fund investors with multiple accounts at the same residential or post office box address. This practice is often called “householding” and it helps eliminate duplicate mailings to shareholders. Eaton Vance, or your financial intermediary, may household the mailing of your documents indefinitely unless you instruct Eaton Vance, or your financial intermediary, otherwise. If you would prefer that your Eaton Vance documents not be householded, please contact Eaton Vance at 1-800-262-1122, or contact your financial intermediary. Your instructions that householding not apply to delivery of your Eaton Vance documents will typically be effective within 30 days of receipt by Eaton Vance or your financial intermediary.
Portfolio Holdings. Each Eaton Vance Fund and its underlying Portfolio(s) (if applicable) files a schedule of portfolio holdings on Part F to Form N-PORT with the SEC. Certain information filed on Form N-PORT may be viewed on the Eaton Vance website at www.eatonvance.com, by calling Eaton Vance at 1-800-262-1122 or in the EDGAR database on the SEC’s website at www.sec.gov.
Proxy Voting. From time to time, funds are required to vote proxies related to the securities held by the funds. The Eaton Vance Funds or their underlying Portfolios (if applicable) vote proxies according to a set of policies and procedures approved by the Funds’ and Portfolios’ Boards. You may obtain a description of these policies and procedures and information on how the Funds or Portfolios voted proxies relating to portfolio securities during the most recent 12-month period ended June 30, without charge, upon request, by calling 1-800-262-1122 and by accessing the SEC’s website at www.sec.gov.
Tailored Shareholder Reports. Effective January 24, 2023, the SEC adopted rule and form amendments to require open-end mutual funds and ETFs to transmit concise and visually engaging streamlined annual and semiannual reports to shareholders that highlight key information. Other information, including financial statements, will no longer appear in a streamlined shareholder report but must be available online, delivered free of charge upon request, and filed on a semiannual basis on Form N-CSR. The rule and form amendments have a compliance date of July 24, 2024. At this time, management is evaluating the impact of these amendments on the shareholder reports for the Eaton Vance Funds.
Investment Advisers
AMT-Free Municipal Income Fund
Eaton Vance Management
Two International Place
Boston, MA 02110
National Municipal Income Fund
Boston Management and Research
Two International Place
Boston, MA 02110
Administrator
Eaton Vance Management
Two International Place
Boston, MA 02110
Principal Underwriter*
Eaton Vance Distributors, Inc.
Two International Place
Boston, MA 02110
(617) 482-8260
Custodian
State Street Bank and Trust Company
One Congress Street, Suite 1
Boston, MA 02114-2016
Transfer Agent
BNY Mellon Investment Servicing (US) Inc.
Attn: Eaton Vance Funds
P.O. Box 534439
Pittsburgh, PA 15253-4439
(800) 262-1122
Independent Registered Public Accounting Firm
Deloitte & Touche LLP
200 Berkeley Street
Boston, MA 02116-5022
Fund Offices
Two International Place
Boston, MA 02110
* FINRA BrokerCheck. Investors may check the background of their Investment Professional by contacting the Financial Industry Regulatory Authority (FINRA). FINRA BrokerCheck is a free tool to help investors check the professional background of current and former FINRA-registered securities firms and brokers. FINRA BrokerCheck is available by calling 1-800-289-9999 and at www.FINRA.org. The FINRA BrokerCheck brochure describing this program is available to investors at www.FINRA.org.
Item 2. Code of Ethics
The registrant (sometimes referred to as the “Fund”) has adopted a code of ethics applicable to its Principal Executive Officer, Principal Financial Officer and Principal Accounting Officer. The registrant undertakes to provide a copy of such code of ethics to any person upon request, without charge, by calling 1-800-262-1122. The registrant has not amended the code of ethics as described in Form N-CSR during the period covered by this report. The registrant has not granted any waiver, including an implicit waiver, from a provision of the code of ethics as described in Form N-CSR during the period covered by this report.
Item 3. Audit Committee Financial Expert
The registrant’s Board of Trustees (the “Board”) has designated George J. Gorman and Scott E. Wennerholm, each an independent trustee, as audit committee financial experts. Mr. Gorman is a certified public accountant who is the Principal at George J. Gorman LLC (a consulting firm). Previously, Mr. Gorman served in various capacities at Ernst & Young LLP (a registered public accounting firm), including as Senior Partner. Mr.
Gorman also has experience serving as an independent trustee and audit committee financial expert of other mutual fund complexes. Mr. Wennerholm is a private investor. Previously, Mr. Wennerholm served as a Trustee at Wheelock College (postsecondary institution), as a Consultant at GF Parish Group (executive recruiting firm), Chief Operating Officer and Executive Vice President at BNY Mellon Asset Management (investment management firm), Chief Operating Officer and Chief Financial Officer at Natixis Global Asset Management (investment management firm), and Vice President at Fidelity Investments Institutional Services (investment management firm).
Item 4. Principal Accountant Fees and Services
Eaton Vance AMT-Free Municipal Income Fund and Eaton Vance Total Return Bond Fund (the “Fund(s)”) are series of Eaton Vance Mutual Funds Trust (the “Trust”), a Massachusetts business trust, which, including the Funds, contains a total of 31 series (the “Series”). The Trust is registered under the Investment Company Act of 1940 as an open-end management investment company. This Form N-CSR relates to the Funds’ annual reports.
(a)-(d)
The following tables present the aggregate fees billed to each Fund for the Funds’ fiscal years ended September 30, 2022 and September 30, 2023 by the Funds’ principal accountant, Deloitte and Touche LLP (“D&T”), for professional services rendered for the audit of the Funds’ annual financial statements and fees billed for other services rendered by D&T during those periods.
Eaton Vance AMT-Free Municipal Income Fund
| | | | | | | | |
Fiscal Years Ended | | 9/30/22 | | | 9/30/23 | |
Audit Fees | | $ | 55,550 | | | $ | 56,000 | |
Audit-Related Fees(1) | | $ | 0 | | | $ | 0 | |
Tax Fees(2) | | $ | 350 | | | $ | 0 | |
All Other Fees(3) | | $ | 0 | | | $ | 0 | |
| | | | | | | | |
Total | | $ | 55,900 | | | $ | 56,000 | |
| | | | | | | | |
Eaton Vance Total Return Bond Fund
| | | | | | | | |
Fiscal Years Ended | | 9/30/22 | | | 9/30/23 | |
Audit Fees | | $ | 48,650 | | | $ | 61,600 | |
Audit-Related Fees(1) | | $ | 0 | | | $ | 0 | |
Tax Fees(2) | | $ | 4,650 | | | $ | 0 | |
All Other Fees(3) | | $ | 0 | | | $ | 0 | |
| | | | | | | | |
Total | | $ | 53,300 | | | $ | 61,600 | |
| | | | | | | | |
| (1) | Audit-related fees consist of the aggregate fees billed for assurance and related services that are reasonably related to the performance of the audit of the registrant’s financial statements and are not reported under the category of audit fees. |
| (2) | Tax fees consist of the aggregate fees billed for professional services rendered by the principal accountant relating to tax compliance, tax advice, and tax planning and specifically include fees for tax return preparation and other related tax compliance/planning matters. |
| (3) | All other fees consist of the aggregate fees billed for products and services provided by the principal accountant other than audit, audit-related, and tax services. |
The various Series comprising the Trust have differing fiscal year ends (January 31, February 28, September 30, October 31, November 30, or December 31). The following table presents the aggregate audit, audit-related, tax, and other fees billed to all of the Series in the Trust by D&T for the last two fiscal years of each Series.
| | | | | | | | | | | | | | | | | | | | | | | | | | | | | | | | | | | | | | | | | | | | | | | | |
Fiscal Years
Ended | | 10/31/21 | | | 11/30/21 | | | 12/31/21 | | | 1/31/22 | | | 2/28/22 | | | 9/30/22 | | | 10/31/22 | | | 11/30/22 | | | 12/31/22 | | | 1/31/23 | | | 2/28/23 | | | 9/30/23 | |
Audit Fees | | $ | 729,872 | | | $ | 37,050 | | | $ | 111,700 | | | $ | 198,900 | | | $ | 24,050 | | | $ | 104,200 | | | $ | 816,633 | | | $ | 41,150 | | | $ | 130,600 | | | $ | 172,250 | | | $ | 27,150 | | | $ | 117,600 | |
Audit-Related Fees(1) | | $ | 0 | | | $ | 0 | | | $ | 0 | | | $ | 0 | | | $ | 0 | | | $ | 0 | | | $ | 0 | | | $ | 0 | | | $ | 0 | | | $ | 0 | | | $ | 0 | | | $ | 0 | |
Tax Fees(2) | | $ | 271,569 | | | $ | 13,000 | | | $ | 61,738 | | | $ | 78,353 | | | $ | 8,478 | | | $ | 5,000 | | | $ | 44,100 | | | $ | 0 | | | $ | 16,150 | | | $ | 14,695 | | | $ | 1,650 | | | $ | 0 | |
All Other Fees(3) | | $ | 0 | | | $ | 0 | | | $ | 0 | | | $ | 0 | | | $ | 0 | | | $ | 0 | | | $ | 0 | | | $ | 0 | | | $ | 0 | | | $ | 0 | | | $ | 0 | | | $ | 0 | |
| | | | | | | | | | | | | | | | | | | | | | | | | | | | | | | | | | | | | | | | | | | | | | | | |
Total | | $ | 1,001,441 | | | $ | 50,050 | | | $ | 173,438 | | | $ | 277,253 | | | $ | 32,528 | | | $ | 109,200 | | | $ | 860,733 | | | $ | 41,150 | | | $ | 146,750 | | | $ | 186,945 | | | $ | 28,800 | | | $ | 117,600 | |
| | | | | | | | | | | | | | | | | | | | | | | | | | | | | | | | | | | | | | | | | | | | | | | | |
| (1) | Audit-related fees consist of the aggregate fees billed for assurance and related services that are reasonably related to the performance of the audit of the registrant’s financial statements and are not reported under the category of audit fees. |
| (2) | Tax fees consist of the aggregate fees billed for professional services rendered by the principal accountant relating to tax compliance, tax advice, and tax planning and specifically include fees for tax return preparation and other related tax compliance/planning matters. |
| (3) | All other fees consist of the aggregate fees billed for products and services provided by the principal accountant other than audit, audit-related, and tax services. |
(e)(1) The registrant’s audit committee has adopted policies and procedures relating to the pre-approval of services provided by the registrant’s principal accountant (the “Pre-Approval Policies”). The Pre-Approval Policies establish a framework intended to assist the audit committee in the proper discharge of its pre-approval responsibilities. As a general matter, the Pre-Approval Policies (i) specify certain types of audit, audit-related, tax, and other services determined to be pre-approved by the audit committee; and (ii) delineate specific procedures governing the mechanics of the pre-approval process, including the approval and monitoring of audit and non-audit service fees. Unless a service is specifically pre-approved under the Pre-Approval Policies, it must be separately pre-approved by the audit committee.
The Pre-Approval Policies and the types of audit and non-audit services pre-approved therein must be reviewed and ratified by the registrant’s audit committee at least annually. The registrant’s audit committee maintains full responsibility for the appointment, compensation, and oversight of the work of the registrant’s principal accountant.
(e)(2) No services described in paragraphs (b)-(d) above were approved by the registrant’s audit committee pursuant to the “de minimis exception” set forth in Rule 2-01(c)(7)(i)(C) of Regulation S-X.
(f) Not applicable.
(g) The following table presents (i) the aggregate non-audit fees (i.e., fees for audit-related, tax, and other services) billed for services rendered to all of the Series in the Trust by D&T for the last two fiscal years of each Series; and (ii) the aggregate non-audit fees (i.e., fees for audit-related, tax, and other services) billed to the Eaton Vance organization by D&T for the last two fiscal years of each Series.
| | | | | | | | | | | | | | | | | | | | | | | | | | | | | | | | | | | | | | | | | | | | | | | | |
Fiscal Years
Ended | | 10/31/21 | | | 11/30/21 | | | 12/31/21 | | | 1/31/22 | | | 2/28/22 | | | 9/30/22 | | | 10/31/22 | | | 11/30/22 | | | 12/31/22 | | | 1/31/23 | | | 2/28/23 | | | 9/30/23 | |
Registrant(1) | | $ | 271,569 | | | $ | 13,000 | | | $ | 61,738 | | | $ | 78,353 | | | $ | 8,478 | | | $ | 5,000 | | | $ | 44,100 | | | $ | 0 | | | $ | 16,150 | | | $ | 14,695 | | | $ | 1,650 | | | $ | 0 | |
Eaton Vance(2) | | $ | 51,800 | | | $ | 51,800 | | | $ | 51,800 | | | $ | 51,800 | | | $ | 51,800 | | | $ | 52,836 | | | $ | 52,836 | | | $ | 52,836 | | | $ | 52,836 | | | $ | 52,836 | | | $ | 52,836 | | | $ | 52,836 | |
| (1) | Includes all of the Series of the Trust. During the fiscal years reported above, certain of the Funds were “feeder” funds in a “master-feeder” fund structure or funds of funds. |
| (2) | Various subsidiaries of Morgan Stanley act in either an investment advisory and/or service provider capacity with respect to the Series and/or their respective “master” funds (if applicable). |
(h) The registrant’s audit committee has considered whether the provision by the registrant’s principal accountant of non-audit services to the registrant’s investment adviser and any entity controlling, controlled by, or under common control with the adviser that provides ongoing services to the registrant that were not pre-approved pursuant to Rule 2-01(c)(7)(ii) of Regulation S-X is compatible with maintaining the principal accountant’s independence.
(i) Not applicable.
(j) Not applicable.
Item 5. Audit Committee of Listed Registrants
Not applicable.
Item 6. Schedule of Investments
Please see schedule of investments contained in the Report to Stockholders included under Item 1 of this Form N-CSR.
Item 7. Disclosure of Proxy Voting Policies and Procedures for Closed-End Management Investment Companies
Not applicable.
Item 8. Portfolio Managers of Closed-End Management Investment Companies
Not applicable.
Item 9. Purchases of Equity Securities by Closed-End Management Investment Company and Affiliated Purchasers
Not applicable.
Item 10. Submission of Matters to a Vote of Security Holders
No material changes.
Item 11. Controls and Procedures
(a) It is the conclusion of the registrant’s principal executive officer and principal financial officer that the effectiveness of the registrant’s current disclosure controls and procedures (such disclosure controls and procedures having been evaluated within 90 days of the date of this filing) provide reasonable assurance that the information required to be disclosed by the registrant has been recorded, processed, summarized and reported within the time period specified in the Commission’s rules and forms and that the information required to be disclosed by the registrant has been accumulated and communicated to the registrant’s principal executive officer and principal financial officer in order to allow timely decisions regarding required disclosure.
(b) There have been no changes in the registrant’s internal controls over financial reporting during the period covered by this report that has materially affected, or is reasonably likely to materially affect, the registrant’s internal control over financial reporting.
Item 12. Disclosure of Securities Lending Activities for Closed-End Management Investment Companies
Not applicable.
Item 13. Exhibits
Signatures
Pursuant to the requirements of the Securities Exchange Act of 1934 and the Investment Company Act of 1940, the registrant has duly caused this report to be signed on its behalf by the undersigned, thereunto duly authorized.
| | |
| Eaton Vance Mutual Funds Trust |
| |
| By: | | /s/ Kenneth A. Topping |
| | Kenneth A. Topping |
| | President |
Date: November 21, 2023
Pursuant to the requirements of the Securities Exchange Act of 1934 and the Investment Company Act of 1940, this report has been signed below by the following persons on behalf of the registrant and in the capacities and on the dates indicated.
| | |
| By: | | /s/ James F. Kirchner |
| | James F. Kirchner |
| | Treasurer |
Date: November 21, 2023
| | |
| By: | | /s/ Kenneth A. Topping |
| | Kenneth A. Topping |
| | President |
Date: November 21, 2023